TRITA-LWR.LIC 2041 ISSN 1650-8629 ISRN KTH/LWR/LIC 2041-SE ISBN 978-91-7415-018-6 DEVELOPMENT OF DECISION SUPPORT TOOLS FOR URBAN WATER SUPPLY MANAGEMENT IN UGANDA Frank Kizito June 2008

Welcome message from author
This document is posted to help you gain knowledge. Please leave a comment to let me know what you think about it! Share it to your friends and learn new things together.
Transcript

TRITA-LWR.LIC 2041 ISSN 1650-8629 ISRN KTH/LWR/LIC 2041-SE ISBN 978-91-7415-018-6
DEVELOPMENT OF DECISION SUPPORT
TOOLS FOR URBAN WATER SUPPLY
MANAGEMENT IN UGANDA
Frank Kizito
June 2008

Frank Kizito TRITA-LWR.LIC 2041
ii
© Frank Kizito 2008 Licentiate Thesis Department of Land and Water Resources Engineering Royal Institute of Technology (KTH) SE-100 44 STOCKHOLM, Sweden

Development of Decision Support Tools for Urban Water Supply Management in Uganda
iii
iii
DEDICATION
To Liz, Jerry, and all the Js.

Frank Kizito TRITA-LWR.LIC 2041
iv

Development of Decision Support Tools for Urban Water Supply Management in Uganda
v
v
ACKNOWLEDGMENTS
This work has been carried out as part of a broader research collaboration programme between the Faculty of Technology, Makerere University in Uganda and the Royal Institute of Technology (KTH) Sweden, within the framework of the Sida/SAREC funded project: “Sustainable Techno-logical Development in the Lake Victoria Basin”. Funding support from Sida/SAREC is grate-fully acknowledged. I would like to thank my supervisors, Assoc. Prof. Gaddi Ngirane-Katashaya of Makerere Uni-versity and Prof. Roger Thunvik of KTH, for your constant support, instruction, guidance and facilitation throughout the duration of this study. It has been a real pleasure interacting and work-ing with you on this project, and I have had a lot to learn from you through it. I am also grateful to Assoc. Prof. Jackson Mwakali, the outgoing head of the Civil Engineering department, and to all my colleagues in the Civil Engineering department at Makerere University, for your support and encouragement along the way. I would also like to thank Sharon and Irene for contributing to this study through your Masters Research activities. Thanks go to the management and staff of National Water and Sewerage Corporation (NWSC) in general, and Kampala Water (KW) in particular, for support over the years and for providing the perfect setting for the work reported in this thesis. Particular thanks go to Eng. Charles Odonga for encouraging me at the start, and to Eng. Harrison Mutikanga for your commitment to doing things “the engineering way”. Thumbs up to the GIS team (Gilbert, Paula, Margaret, John, Jeff and Feriha) for your input. To all the members of “T-Cube” – Sharon, Grace, Gordon, Darius, Feriha, Zainab, Janet, Marga-ret, Alex, Gilbert, and Ndugu Stephen – thank you for the animated discussions and fruitful actions. Those were memorable days! A number of PhD students at KTH (Jenny, Andrew, Patricia, Hans, Annika and Oswaldo) have reviewed various parts of this thesis and made very helpful comments. My thanks go to you all for the constructive reviews that have gone into making this thesis what it is. Paper II and Paper III have also benefited from comments from anonymous reviewers, and these too are acknowl-edged. I would also like to thank, in a special way, all those that have made my stay in Sweden over the years both pleasant and memorable. I am particularly grateful to friends at Credo and at Imman-uel International who have provided companionship and encouragement week after week. My heartfelt thanks go to Harry, Andrew and Jenny for putting me up when I needed a place to stay. To my wife Liz and son Jerry: Thank you for being so understanding and supportive all the times I was absent, physically or emotionally. You have been my greatest fans! The Makerere marrieds’ group and Team 5 of FCA have done a great job of standing in the gap. I also thank my wider family in Suubi – John, Ruth, Wilbur, Daniel, Elijah, Fred, Peter, Paul, Mama Annette and Mama Lois. Hopefully I will be more available for you after this. Thank you, Mama Kololo, for keeping me constantly in your thoughts and prayers, and for your support in enabling the geostatistics work to proceed. Finally, I am deeply grateful to God for life, and for making all this possible.

Frank Kizito TRITA-LWR.LIC 2041
vi

Development of Decision Support Tools for Urban Water Supply Management in Uganda
vii
vii
TABLE OF CONTENTS ACKNOWLEDGMENTS........................................................................................................................................ v TABLE OF CONTENTS ...................................................................................................................................... vii LIST OF PAPERS ................................................................................................................................................... ix ABSTRACT ............................................................................................................................................................... 1 INTRODUCTION................................................................................................................................................... 1
Research Objectives ............................................................................................................................................... 2 Organisation of the Thesis ..................................................................................................................................... 3
BACKGROUND ....................................................................................................................................................... 3 The Classical Decision-making Paradigm............................................................................................................... 3 Decision Support Systems...................................................................................................................................... 5 “Hard” and “Soft” DSS ......................................................................................................................................... 5 Challenges of Implementing DSS in Organizations ............................................................................................... 6 The role of Action Research in DSS Development................................................................................................ 8 DSS and Visualization............................................................................................................................................ 8 Geostatistical Analysis and Spatial Prediction ........................................................................................................ 9 The Rationale for DSS development in Uganda .................................................................................................. 11
METHODS ............................................................................................................................................................. 11 Functional Setup of the Organization .................................................................................................................. 11 Description of Case Studies ................................................................................................................................. 13
Case 1: Water distribution bottlenecks ...................................................................................................................... 13 Case 2: Non-Revenue Water management.................................................................................................................. 14 Case 3: Territorial management of customer accounts.................................................................................................... 14 Case 4: Budget implementation monitoring and control ................................................................................................. 15 Case 5: Investigating stagnation in monthly water sales ................................................................................................. 16
Participatory Discussions and Brainstorming Sessions......................................................................................... 17 Development of Prototype Data Management Tools .......................................................................................... 18 Development and Application of Geovisualization Tools ................................................................................... 20 Performance of Spatial and Geostatistical Analyses ............................................................................................. 21
RESULTS ................................................................................................................................................................ 21 Outcomes of Participatory Problem Analyses...................................................................................................... 21 Data Management Applications ........................................................................................................................... 21 Geovisualization Tools ........................................................................................................................................ 22 Results of Geostatistical Analyses ........................................................................................................................ 22
DISCUSSION AND CONCLUSIONS ................................................................................................................ 25 Participation in Problem Structuring.................................................................................................................... 25 Challenges of User Adoption of Data Management Tools .................................................................................. 25 Roles and Benefits of Geovisualization Tools...................................................................................................... 25 Benefits and Shortcomings of Geostatistical Analyses ......................................................................................... 29 Overall Reflections from the Study ...................................................................................................................... 29 Summary and Future Perspectives ....................................................................................................................... 32
REFERENCES....................................................................................................................................................... 34

Frank Kizito TRITA-LWR.LIC 2041
viii

Development of Decision Support Tools for Urban Water Supply Management in Uganda
ix
ix
LIST OF PAPERS
This thesis is based on four papers (appended), which are referred to throughout the text by their Roman numerals:
I. Kizito, F., Ngirane-Katashaya, G., & Thunvik, R. Bridging the gap between academic re-search and technological practice: Roles, benefits and pitfalls of action research in informa-tion systems development. Manuscript.
II. Kizito, F., Mutikanga, H., Ngirane-Katashaya, G., & Thunvik, R. Development of decision
support tools for decentralised urban water supply management in Uganda: An action re-search approach. Submitted November 2007 to Computers, Environment and Urban Systems.
III. Kizito, F., Ngirane-Katashaya, G., & Thunvik, R. (2008). Using geovisualisation to support
participatory problem structuring and decision making for an urban water utility in Uganda. Applied GIS, 4(2), 1-33.
IV. Kizito, F., Ngirane-Katashaya, G., & Thunvik, R. Exploring “commercial” water losses in an
urban water supply system in Uganda: A geostatistical modeling approach. Submitted May 2008 to Applied Spatial Analysis and Policy.

Frank Kizito TRITA-LWR.LIC 2041
x

Development of Decision Support Tools for Urban Water Supply Management in Uganda
1
ABSTRACT In this study, five real-life problem situations were used to explore the challenges of developing and implementing decision support tools for management of an urban water utility in Uganda. The study sought to explore how the degree of adoption of formal decision support tools in practice, generally perceived to be low, could be improved. In the study, an Action Research (AR) approach was used. AR is an inquiry process that involves partnership between researchers and practitioners for the purpose of addressing a real-life problem issue, while simultaneously gener-ating scientific knowledge. Unlike other research methods where the researcher seeks to study organizational phenomena but not to change them, the action researcher attempts to create or-ganizational change and simultaneously to study the process. It is recognized that AR methods provide a potential avenue to improve the practical relevance of Information Systems (IS) re-search. The five cases that were considered in the study involved participatory problem structuring to address water distribution bottlenecks; identification of Non-Revenue Water (NRW) reduction strategies; facilitation of decentralized management of customer accounts; monitoring and con-trol of procurements and expenditure; and geospatial investigation of declining water sales. Dur-ing the study, participation in problem identification was achieved through discussions and brain-storming sessions bringing together top and middle managers within the organization. A number of prototype decision support tools were developed and implemented. Maps and other geovisu-alization tools were also used to inform and enhance the processes of collective problem identifi-cation and structuring. Results of the study emphasized the need for proper problem structuring prior to the formula-tion of actions; the challenge of moving from planning to action; the importance of user in-volvement in the development of tools; and the need to manage IS implementation as part of a holistic, organization-wide change process. The challenges of embedding formal decision support within existing work systems in organizations were highlighted, and recommendations were made on how best to achieve this. The AR approach was found to be useful in bridging the gap be-tween academic research and technological practice, thus supporting the development of IS with immediate and practical benefits to organizations.
Key words: Decision support systems; Participatory decision-making; Geovisualization; Non-revenue water; Geostatistics; Action research
INTRODUCTION
In broad terms, Decision Support Systems (DSS) may be described as tools that an organization utilizes to support and enhance its decision making activities (Bhatt & Zav-ery, 2002). These tools often consist of com-puter applications that accept input of a large amount of data; assist in categorizing and organizing the data in a manner that enables retrieval in different forms; convert the data into meaningful comparisons, graphs and trends that can enhance decision making; and assist in monitoring and tracking perform-ance based on the organization’s goals and objectives. A survey of literature on the state-of-the-art of DSS reveals five aspects that provide a
background basis and justification for this study. First, although studies have shown that DSS offer many benefits, they have not been widely taken up in practice (Lu et al., 2001; Westmacott, 2001; Lawrence et al., 2002). A number of reasons have been advanced for this. These include the lack of user involve-ment in the development of tools; the tech-nocratic and/or “black-box” nature of some tools; the proprietary nature and cost of acquisition and maintenance of tools; inap-propriateness and irrelevance to “real” deci-sion contexts; a mismatch between tools and problem solving styles; a low degree of per-ceived usefulness and user-friendliness; mis-trust of DSS outputs due to a lack of under-standing of the underlying theories and

Frank Kizito TRITA-LWR.LIC 2041
2
processes; and a lack of field testing during the development of tools. Second, DSS development was in the past dominated by a techno-centric viewpoint (Pereira & Quintana, 2002; Alter, 2004; Ek-bia, 2004), but there is a growing school of thought that views DSS, not simply as tech-nological tools, but rather as any context or platform for helping decision-makers to access the necessary information for a useful debate to take place. This represents a shift in focus from computerized DSS artifacts to a more holistic view of decision support in general; that is, the use of any plausible com-puterized or non-computerized means for improving decision-making in an organiza-tion. Third, regardless of whether DSS capabilities emphasize better data availability, analysis, modelling, communication or coordination, these capabilities have little or no impact until they are adopted and incorporated into work systems within organizations (Alter, 2004). Genuinely successful applications of DSS need to reflect the workflow of users and remain compatible to the users’ working environment (Smart & Whiting, 2001). To achieve this calls for application of a “contex-tual design” methodology - one that involves the gathering of information about users’ needs through a process of observing and working with users in their environment, within the context of their day-to-day activi-ties, and using this information in the DSS design process. Fourth, the classical decision-making para-digm recognises three distinct stages of a decision-making process: problem identifica-tion (Intelligence), development of alternative solutions (Design), and selection among alternatives (Choice). A lot of research has gone into developing formal evaluation methodologies to support the choice phase, and a plethora of these exist. Likewise, many different models and modelling tools have been developed in support of the design phase. However, comparatively little re-search has focused on problem identification and structuring in the past (Sharifi et al., 2004), and yet it is evident that gaining a correct understanding of a problem situation
from the outset is key to its effective solu-tion. Finally, it has been noted (Rasmussen, 2004; Brugher & Bowen, 2005; Styhre & Sundgren, 2005) that there are shortfalls in the tradi-tional approaches to research in the techno-logical sciences, with respect to their failure to effectively impact on practice and to sup-port joint learning between academicians and practitioners. Action Research (AR), which involves partnership between academicians and practitioners for the purpose of resolving real-life problem situations within the practi-tioners’ social context, has been advocated as a suitable way of bridging this gap. Unlike other research methods where the researcher seeks to study organizational phenomena but not to change them, the action researcher attempts to create organizational change and simultaneously to study the process. In so doing, the researcher participates in joint knowledge production with the practitioners on an experimental basis. This thesis describes a study in which an AR approach was used to explore how the degree of adoption of DSS in practice, generally perceived to be low, could be improved. In the study emphasis was placed, not on the creation of technical DSS artifacts, but rather on the promotion of formal participatory problem structuring and decision-making processes within an organization, and the provision of support for these processes through appropriate computerized tools. The study sought to uncover the challenges of embedding decision support tools within existing work systems in organizations, and to identify how best to provide formal deci-sion support as an enabling framework for organizational development.
Research Objectives Being an action-oriented research undertak-ing, the overall objective of the study was to achieve improvement in decision-making within a real-life organization through devel-opment and implementation of appropriate decision support tools. The specific objec-tives were: • To elicit first-hand, through practical
experience in a real-life organizational

Development of Decision Support Tools for Urban Water Supply Management in Uganda
3
setting, what the causes were for the per-ceived low rate of adoption of DSS in practice;
• To propose practical ways in which the identified shortfalls could be overcome, with a view to achieving the effective embedding of holistic decision support mechanisms within the organization’s work systems;
• Using the knowledge gained, to develop and prototype simple computerized tools to support decision-making within the organization;
• To identify, study and further develop specific aspects of these decision support tools targeting enhancement of the prob-lem identification phase of the decision-making process.
Organisation of the Thesis The thesis is based on four papers. Paper I, which largely contains findings of a literature survey, explores the theoretical and philoso-phical basis for the research approach em-ployed in the study, namely Action Research (AR). It presents a case for the benefits of using AR in Information Systems develop-ment, and highlights some challenges inher-ent in this approach that are of particular relevance to the overall study objective. Pa-per II describes four case studies in which an AR approach was used to develop computer-ized tools to support various aspects of de-centralized management of an urban water utility in Uganda. Each of the case studies has its own unique lessons to contribute to the understanding of the DSS development process as a whole. Paper III focuses on the first of these four case studies. In particular, this paper studies the role and benefits of geovisualization in facilitating problem structuring and decision-making in the face of problems of a spatial nature. In Paper IV, a fifth case study involv-ing the application of geostatistical modelling and spatial inference to water loss manage-ment is described. Here, again, the focus is on enhancing problem identification. The rest of the thesis is structured as follows: First, an overview of the theoretical back-ground and state of the art of decision sup-
port in general is given, forming a justifica-tion for the study as a whole. Some background theory on the specific methods applied in the study is also presented. This is followed by an account of the methods that were used. Thereafter, the results of the various activities are presented and discussed. The thesis concludes with a summary of lessons learnt and future perspectives derived from the study.
BACKGROUND
This section presents the concept of decision support and how it relates to organizational decision-making. It outlines the nature and evolution of DSS, the factors determining their successful implementation within an organization, and the possible contribution of Action Research (AR) to this process. It also discusses the important role of visualization in enhancing the usefulness of DSS, and the application of tools such as geostatistics for spatial analysis and prediction. Finally, the rationale for DSS development in Uganda is outlined.
The Classical Decision-making Paradigm Decision-making is the process of generating and evaluating alternatives and choosing a course of action in order to solve a decision problem. According to Ackoff (1981), a decision problem is said to exist where an individual or group perceives a difference between a present state and a desired state, and where: • The individual or group has alternative
courses of action available; • The choice of action can have a signifi-
cant effect, that is, not all the actions will yield the same outcome;
• The individual or group is uncertain a priori as to which alternative should be se-lected.
Problems can either be resolved, solved or dissolved (ibid.) Resolving a problem in-volves selecting a course of action that yields an outcome that is good enough, or “satis-fices” (satisfies and suffices). It is a qualita-tively oriented, “clinical” approach rooted in common sense and subjectivity. Most man-

Frank Kizito TRITA-LWR.LIC 2041
4
agers are problem resolvers, citing a lack of information and time to do otherwise (ibid.). Solving a problem, on the other hand, in-volves selecting a course of action that is believed to yield the best possible, or most optimal, outcome. Mainly employing scien-tific tools, techniques and methods, this is a “research” approach that is preferred by technologically oriented managers whose organizational objective is growth rather than mere survival (ibid.). Dissolving a problem involves changing the nature and environment of the entity in which the problem is embedded so as to remove the problem. Considered a “design” approach, it aims at changing the characteris-tics of the larger system into a state in which the problem cannot or does not arise. The designer makes use of the methods, tech-niques and tools of both the clinician and the researcher, but he uses them synthetically rather than analytically. This approach is used by managers whose principle organizational goal is development and not just growth or survival (ibid.). Based on earlier work by Simon (1960), Sharifi et al. (2004) propose a framework for a systematic approach to decision-making (Fig.1), consisting of three phases namely
Intelligence, Design (here, the term “design” is used in a slightly different context from the one earlier presented), and Choice. In Fig.1, “evidence” refers to the total set of data and information that the decision maker has at his disposal, including the skills necessary to handle this information. It may consist of facts, values, knowledge or experience, and is a key resource at all stages of the decision-making process. A major part of decision support is the collection, evaluation, organi-sation and translation of this data into forms suitable for analysis. Not all decision-making styles or decision problems are directly supported by the framework in Fig. 1. Problem-resolving, for example, would typically not involve the formal stages shown, while problem-solving and problem-dissolving would. Decision problems themselves are classified into three types (Mintzberg et al., 1976; Sharifi et al., 2004 based on Sol, 1982): i) Unstructured problems: For these, none
of the phases of decision-making can be formalized, and no pre-established pro-cedures exist. These types of problems are difficult to support with models and computers.
Fig. 1. Framework for a systematic ap-proach to decision making (Sharifi et al. 2004, based on Simon 1960).

Development of Decision Support Tools for Urban Water Supply Management in Uganda
5
ii) Well-structured problems: Here, all phases of decision-making can be formal-ized, and it is possible to develop stan-dard operating procedures for addressing the problems. The decision-making proc-ess can easily be delegated or even auto-mated.
iii) Ill-structured problems: These are some-where intermediate between the above two types. The main challenge here is to find structure in problems that seem to have no structure, and this is where deci-sion support systems play a crucial role.
Decision Support Systems Several definitions of Decision Support Sys-tems (DSS), relating to various contexts, exist in the literature. A few that are of direct relevance to this thesis are presented here. The oldest of these is by Sprague (1986), cited by Pereira & Quintana (2002), who defines a DSS as “a class of information system that draws on transaction processing systems and interacts with other parts of the overall information system to support the decision-making activities of managers and other knowledge workers in the organiza-tion”. Bhatt & Zavery (2002) describe a DSS as computer software that facilitates and accepts inputs of a large number of facts and methods and converts them into meaningful comparisons that can enhance a decision-maker’s decision-making abilities. In general, it may be said that DSS provide support to “management activities”. These include (Gelderman, 2002; Shim et al., 2002): • Strategic planning - executive decisions
regarding overall mission and goals; • Management control - middle manage-
ment guiding the organization to achiev-ing its goals;
• Operational control - first line supervi-sors directing specific tasks.
A number of authors (Courtney, 2001; Shim et al., 2002; Chen & Lee, 2003; Ekbia, 2004; Tian et al., 2007) present a history of the evolution of DSS in the organizational con-text. Until the 1960s the major information systems in existence were transaction proc-essing systems for operation level manage-ment. Then the concept of Management
Information Systems (MIS) was conceived, focused on providing middle-level manage-ment with predefined managerial reports for tactical decision-making. By the 1970s, however, it became apparent that the information provided by MIS was not adequately supporting the decision-making needs of top management, and as a result, the concept of DSS was born. This too had its own challenges. By the 1980s, it was evident that most corporate executives did not directly use the analytical capabilities of the then largely model-based DSS, so the concept of executive information systems (EIS) was developed. EIS are a form of DSS designed to provide executives with information on critical busi-ness success factors in a timely and user-friendly manner. They focus on supporting executives in problem and opportunity rec-ognition and diagnosis, rather than providing support for the evaluation and choice phases of the decision-making process. The mid-1990s also saw the rise of web-based DSS as an active research field. Shim et al. (2002) point out that since the beginning of the 21st century the Web is the main centre of activity in developing and delivering DSS services. Web-based DSS have reduced tech-nological barriers and made it easier and less costly to make decision-relevant information available to managers and other users in geographically distributed locations.
“Hard” and “Soft” DSS Early DSS were aimed at decision makers understood as experts, who were many times assumed to be computer and systems literate (Pereira & Quintana, 2002). These were highly technocratic systems which did not explicitly take into account the social context in which decisions were taking place. Instead, they deployed mainly quantitative scientific information and required skilled users to undertake the analysis. However, as Ekbia (2004) postulates, “An overview of the de-velopment of DSS reveals the dominance of a techno-centric view that portrays technol-ogy as the panacea and silver bullet to all social and organizational problems. Challeng-ing this view might be the key to our under-

Frank Kizito TRITA-LWR.LIC 2041
6
standing of the shortcomings of current DSS and a first step toward an alternative frame-work”. The alternative school of thought views DSS, not as technological tools, but rather as any context or platform for helping all those involved in decision-making processes to access the necessary information for a useful debate to take place. Pereira & Quintana (2002) portray this way of thinking as repre-senting a passage from DSS to TIDDD - Tools to Inform Debates, Dialogues & De-liberations. Viewing decision support more holistically (here referred to as a “soft DSS” outlook) rather than focusing on technologi-cal tools (“hard DSS”) expands the landscape to include decision improvement interven-tions and strategies that might or might not involve a technical computer artifact (Alter, 2004). The DSS concept is thus a wide-ranging one. Fig. 2 is an attempt to illustrate the spectrum of possibilities for this concept, ranging from the techno-centric view mentioned above; through formal and/or informal group dis-cussions with or without computer aids; to the intriguing notion that “the cup of coffee that a decision maker drinks can be consid-ered to be a decision support system” (Boer-boom, 2006).
Challenges of Implementing DSS in Or-ganizations Considerations to be made for successful DSS implementation in an organization in-clude (Westmacott, 2001):
• Involvement of the end-users in the development of the DSS;
• Designing the DSS for the end-users’ needs rather than the needs perceived by the developer;
• A flexible, adaptable and updateable system;
• An easy-to-use interface, requiring limited time to learn how to use the system;
• Visual display of results. Other factors to be considered are system quality, information quality and information presentation (Bharati & Chaudhury, 2004). System quality includes ease of use, conven-ience of access, and system reliability. Infor-mation quality covers information relevance, accuracy, completeness, and timeliness, while information presentation relates to graphics, colour, presentation style and navigational efficiency. However, it has been argued (Carlsson & Turban, 2002) that, in implementing DSS in an organization, the key problems never appear to be technology-related, but rather are “people problems”, namely: • People have cognitive constraints in
adopting computerized systems; • People do not understand the support
that these systems offer and disregard it in favour of past experience and tradi-tions;
• People cannot handle large amounts of information and knowledge;
• People are frustrated by theories, tech-niques or procedures they do not under-stand;
• People believe they get more support by talking to other people (even if their knowledge is limited).
The cognitive aspect of decision support has not been adequately researched, although it has long been recognized as an important consideration in DSS design (Chen & Lee, 2003). The cognitive differences between lower and higher level management suggest that executive support should be somewhat different from lower level management sup-port. Executives do not usually make major decisions by choosing from a set of prede-termined alternatives, but rather, rely heavily
What What isis a Decision Support System??a Decision Support System??
Is it this Is it this ……
or this or this ……
or perhaps, this?or perhaps, this?
Fig. 2. An illustration of the spectrum of “decision support” possibilities.
Development of Decision Support Tools for Urban Water Supply Management in Uganda
7
on their intuition and seldom think in ways that one might normally view as ‘‘rational’’ (ibid.). Thus, while DSS tend to be used by front-line employees and middle management, decision-making at executive level has often been done without any decision support (Mysiak, 2003). However, because more senior executives are becoming comfortable with Information Technology (IT), the road-blocks of the 1980s and 1990s for using IT in executive decision-making are being re-moved. In fact, IT is now viewed as a strate-gic tool that is central to the pursuit of com-petitive advantage, and DSS technologies are predicted to become more accepted through-out organizations, from front desks to execu-tive boardrooms (Shim et al., 2002). The classical concepts of ‘perceived useful-ness’ and ‘perceived ease of use’ of Informa-tion Systems (IS), as introduced by Keil et al. (1995), are investigated by Westmacott (2001). Perceived usefulness is the degree to which a person believes that using a particu-lar system would enhance his job perform-ance, while perceived ease of use is the de-gree to which a person believes that using a particular system would be free from effort. Both Westmacott (2001) and Lu et al. (2001) concur that there is a strong positive relation-ship between perceived usefulness and user willingness to adopt systems, while perceived ease of use is not as influential in determining user adoption. However, perception of ease of use can help in perceiving the system as useful, thereby facilitating the preference and willingness to use the DSS. Once accepted by users, the reliability of a DSS can be measured with actual usage over time. Usage itself is an indirect measure of the users’ judgment of the value of a system (Gelderman, 2002). However, judging whether a DSS has been successful or not is difficult, and sometimes cannot even be based on whether the DSS is used by the intended users (Mysiak et al., 2005). Users may have poor introspection or (if they are not experienced in using a DSS) may not recognise good advice and may dislike being corrected by a computer system. Problems with DSS acceptance may simply be related
to general problems faced by information technologies, such as a lack of sufficient data, or to the natural gap between humans’ men-tal information processing capabilities and the computational approach that underlies traditional DSS. There are also ethical factors at play in the design and use of DSS in organizations. There is no such thing as an ‘‘ethically neu-tral’’ DSS (Chae et al., 2005). Any informa-tion system inevitably contains the values and ethical suppositions of the designer, and designing an information system is a moral problem because it puts one party (the sys-tem designer) in the position of imposing a certain order on the behaviour of another (the user). Furthermore, DSS manipulate information. Information provides a source of power to those who give, take, or orches-trate its transfer. Paradoxically, while infor-mation may give decision-makers great power to accomplish their goals, it may simultane-ously make those same decision-makers more dependent on that information for continued survival. Other ethical considerations relate to the motive with which a DSS might be promoted by executives in an organization, especially if the DSS implementation is part of an overall change process within the organization. Rea-sons such as “increased user autonomy” may in truth be a guise for increased managerial control and surveillance; likewise, “organiza-tional learning and employee empowerment” may be rhetoric disguising the fact that change is undertaken primarily for economic motives (Howcroft & Wilson, 2003). In this respect, even the popular concept of end-user involvement in systems development is suspect. Possible contradictions in the prac-tice of this may include the following (ibid.): • Involvement is limited to those who
participate in decisions to initiate change; for the rest their involvement is more strictly defined as agreeing and following;
• Disagreement or protest is not involve-ment, but rather, it is regarded as resis-tance and tends to be associated with lack of understanding;

Frank Kizito TRITA-LWR.LIC 2041
8
• Involvement is the taking of sides: one is either ‘with’ (included) or ‘against’ (ex-cluded) the proponents of the system.
Research into the effects of end-user partici-pation on the eventual success of information systems has thus shown mixed results. This fact notwithstanding, the rationale for end-user participation in system design can be summarized as follows (ibid.): • End-users are better qualified to deter-
mine how to improve their work and their working life;
• End-users’ perceptions and feelings about technology are as important as technical specifications;
• Information technologies are relevant only to the extent to which they fit into workplace practices.
The role of Action Research in DSS De-velopment One problem facing the adoption of decision support tools for real world applications is that the overwhelming majority of DSS are developed in academic environments, which implies limited scope for organizations to continue customizing the systems and adapt-ing them to changing conditions once the corresponding research project has been completed (Mysiak, 2003). Under these con-ditions, the risk of DSS failing to address real world problems is high, despite undeniable benefits stemming from their usage. Instead, a contextual design strategy would be more appropriate (Smart & Whiting, 2001). In contextual design, the designer works with users in the context of their own work envi-ronment. This approach forces designers into the users’ world, and also allows users to participate in design activities. Information Systems (IS) researchers advo-cate the use of Action Research (AR) as an appropriate means of undertaking work in the field of IS development (West & Stans-field, 2001; Baskerville & Myers, 2004; Melin & Axelsson, 2007). AR is an inquiry process that involves partnership between researchers and practitioners for the purpose of address-ing a real life problem issue, while simultane-ously generating scientific knowledge (Styhre & Sundgren, 2005). In AR, the research takes
place in real-world situations, and aims to solve real problems. What separates this type of research from general professional prac-tice, consultancy, or daily problem-solving is the emphasis on “scientific” study; the re-searcher studies the problem systematically and ensures that the action or intervention is informed by theoretical considerations (O’Brien, 2001). The AR approach is de-scribed in detail in Paper I. With such a situated approach, the DSS development process plays a role in enhanc-ing organizational learning. There are two types of learning in organizations (Bhatt & Zavery, 2002): single-loop learning (problem-solving) and double-loop learning (critical reflection leading to further learning). While the former maintains the organization, it is the latter that redefines an organization, enabling it to adapt and thrive in dynamic environments. By its nature, AR is an itera-tive process, with action and critical reflec-tion taking place in turn; this makes it suit-able for application in situations and processes where organizational development is the principle goal. AR can also be compared with action learn-ing, a process in which a group of people come together regularly to help each other learn from their experiences (Dick, 1997). This could take place within an organization or across different organizations. Both action learning and action research are intended to improve practice; action research intends to introduce some change, while action learning uses some intended change as a vehicle for learning through reflection. In each, action both informs reflection and is informed by it. The reflection produces the learning (in ac-tion learning) or research (in action research). Subsequently in both, the action is changed as a result of the learning or research, and this in turn leads to more learning or re-search.
DSS and Visualization The true utility of a DSS is measured in part by the comfort level of those who use it (Westphal et al., 2003). Often, DSS user interfaces are dominated by the presentation of information via character and numerical
Development of Decision Support Tools for Urban Water Supply Management in Uganda
9
formats, and are thus considered an area of pursuit for those who have a propensity for numbers and enjoy mathematical equations. Unfortunately, many of the individuals who stand to benefit the most from DSS, such as CEOs, politicians and administrators, lack this mathematically oriented mindset (Li et al., 2001). In general, interpretation of data is much more intuitive if the results from a DSS are translated into charts, maps and other graphical displays, because visualization ex-ploits the natural human ability to quickly recognize and understand visual patterns. As Nyerges et al. (1997) observes, “Reducing the complexity of issues through appropriate management, analysis and visualization of information might lead to better decisions, because the task of making the decisions is simplified”. Visual representations can serve as powerful “vehicles of thinking” that help the process of extracting useful information from complex or voluminous data sets (ibid.). In some situations, problems may be known but not adequately communicated to, or perceived by, the stakeholders who should decide on appropriate courses of action (Ba-cic, 2006). Visualization facilitates the presen-tation of problems and remedies in a manner that makes them easily justifiable before policy-makers and the lay public. It is com-monly said that a picture speaks a thousand words; issues that may not be easy for lay persons to understand may be made plain through visualization, thus making it possible for involvement of a wide range of stake-holders in the decision-making process. However, there is need for some degree of caution here. Human beings are so visually oriented that visualization techniques some-times have unwarranted authenticity (Bunnel & Boyland, 2003). A major problem with DSS is the tendency for users to accept rather than interpret outputs, and yet, as visualiza-tion techniques grow more sophisticated, ‘what you see is not always what you get’, to reword a common phrase. When dealing with data of a spatial nature, a form of visualization referred to as geovisu-alization comes into play. Geovisualization, which has been described as “making data visible” (Kraak, 2003), involves the use of
visual geospatial displays to explore data, and through that exploration to generate hy-potheses, develop solutions and construct knowledge. In this respect, the visualization process is considered to be the translation or conversion of geospatial data from a database into graphics by applying appropriate carto-graphic methods and techniques (Ogao, 2002). Spatial data by its nature can be visual-ized on a map, since each observation has coordinates in geographic space. However, visualization is not limited to enabling the process of seeing patterns and relationships in geospatial data, but also includes manipu-lating the data to derive new useful informa-tion. There are three possible modes or strategies of map usage (ibid.): • Presentational – the map is simply used
to present facts to the user; • Confirmative – the map is used in a goal-
oriented examination of hypotheses, aimed at confirming or rejecting a given hypothesis;
• Exploratory – the map is used in an in-teractive, undirected search for patterns and trends, with the aim of coming up with hypotheses about the data.
Thus, the concept of information visualiza-tion is not limited to the graphical display of data, but encompasses a much broader spec-trum including the design of appropriate graphical interfaces used to input and access that data, the creation of standard and novel data presentation formats, and the use of analytical tools yielding outputs of a visual nature. An example of one such tool is geo-statistical analysis.
Geostatistical Analysis and Spatial Pre-diction Geostatistics is a form of statistical analysis in which every observation or sample point in a dataset has both known location (coordi-nates) in geographic space and attribute value(s) in feature space (Rossiter, 2008). The most common application of geostatistics is the prediction of some attribute at an un-sampled point, based on some set of sampled points. This involves understanding a process and making predictions based on this under-standing.

Frank Kizito TRITA-LWR.LIC 2041
10
Data often exhibits spatial structure or trends, and geostatistical analysis attempts to uncover and take these spatial dependencies into account. Some mechanisms for explor-ing the structure of spatial data include: i) Distribution plots – These are scatter
plots used to explore the distribution in geographic space of sample points.
ii) Post plots – These are the same as distri-bution plots, except that in addition to geographic space distribution, they depict the relative value of each point in its fea-ture space by some graphic element, such as size or colour of symbols.
iii) Quantile plots – A quantile is a defined range, often expressed in terms of per-centages, of the cumulative empirical fea-ture space distribution of a variable. Quantile plots are post plots where one quantile is represented in a contrasting size or colour to illustrate how that par-ticular quantile is distributed in geo-graphic space.
Post plots and quantile plots are useful for identifying regional trends (where the feature space value of a variable changes systemati-cally with its geographic space coordinates) as well as local spatial dependence (depicted by the clustering in geographic space of points with similar attribute values). Regional trends can be further visualized by fitting an empiri-cal model to the set of sample points (ex-pressing the attribute as a function of its coordinates), applying this fitted model over a regular grid of points, and displaying the result as a map or trend surface. Local spatial dependence, on the other hand, can be evalu-ated and visualized using variogram models. Variogram analysis is used to explore whether points that are “close by” in geo-graphic space are also “close by” in feature space. Any two points within the dataset constitute a point-pair. The vector consisting of the distance and direction between the two points in a point-pair is called the separation vector for the point-pair. In practice, except for gridded data, there are rarely many point-pairs with the same separation vectors, and so bins, consisting of ranges of these separa-tion vectors, are set up. In addition, for each point-pair, a semivariance is calculated as half
the squared difference between the attribute values of the two points. If the attribute values for the two points are similar, the semivariance will be small. Knowing the separation distance (the dis-tance between the two points in geographic space) and semivariance (a measure of the difference between the two points in feature space), it is possible to investigate whether the two measures are related, which would be evidence of local spatial dependence. Plotting the average semivariance against the average separation distance or lag for each bin yields an “empirical variogram” or “semivariogram” for the dataset. In applied geostatistics, the empirical variogram is used as a first estimate for, or “fitted” with, an appropriate theoretical model, essentially consisting of a spatial co-variance function. Several such theoretical models exist (linear, spherical, circular, pen-taspherical, exponential, Gaussian, etc). The result is a variogram model, expressing semivariance as a function of separation vectors. It is then possible to use the fitted variogram model for spatial interpolation processes such as kriging. Kriging is an optimal interpolation process that employs a variogram model to generate a “best linear unbiased estimate” at each of a set of specified locations, using known values from sample points. It is a weighted-moving-average interpolation method where the set of weights assigned to samples minimizes the estimation variance, which is computed as a function of the variogram model and loca-tions of the samples relative to each other and to the point being estimated. Part of the reason for using a fitted variogram model is that the kriging algorithm may require access to semivariance values for separation dis-tances other than those used in the empirical variogram. The variogram model permits computation of the semivariance between any point-pair, separated by any vector. The most common form of kriging is called Ordinary Kriging (OK). In OK, the expected value (mean) of the population is unknown, and must be estimated from the sample. If the mean is known, the process is referred to as Simple Kriging (SK). Block Kriging (BK)

Development of Decision Support Tools for Urban Water Supply Management in Uganda
11
is similar to OK, except that predictions of average values are made for blocks of some defined size, and not at points. Other forms of kriging include Universal Kriging (UK), used where regional trends exist; Kriging with External Drift (KED), which involves feature-space covariables; and Regression Kriging (RK), which models trend and the kriging residuals separately (Rossiter, 2008).
The Rationale for DSS development in Uganda A study was carried out to appraise the need for development of DSS for Water Resources Management (WRM) in Uganda (Ngirane-Katashaya et al., 2006). Findings showed that, in spite of rapidly advancing computer tech-nology and the proliferation of software for decision support globally, relatively few DSS had been developed, implemented, and evaluated in the field of WRM in Uganda. Examples of those encountered included the Lake Victoria Decision Support System (LVDSS) and the Nile Decision Support Tool (Nile DST). These were basin-scale tools that focused on management of the water resources for the respective basins (Lake Victoria and the Nile River) as a whole. The study concluded that there was room for applied research in developing additional practical tools to underpin and support sus-tainable development and management of the country’s water resources. By building DSS, many needs of policy-makers and resource managers in the water sector would be met, such as the provision of mapping capability for land and water resources, establishment of a common digital database for informa-tion, creation of a suite of spatial analysis tools, development of predictive models, and provision of a basis for evaluation of man-agement alternatives. Some considerations that were identified as being important in developing DSS appropri-ate for the local Ugandan conditions were: • Use of an open, modular architecture,
allowing for ease of upgrade of compo-nent modules as well as addition of new modules in response to changing needs with time;
• Provision of user interfaces that allow easy interaction, are simple enough to be used directly and mastered by local deci-sion makers without the constant support of computer analysts, and present out-puts in formats that are easy to interpret;
• A cost-effective development and de-ployment process, demanding minimum hardware, software and licensing costs. This would necessitate the identification, adoption and adaptation of suitable exist-ing tools, models and routines, with par-ticular emphasis on the usage of non-proprietary, inexpensive or widely avail-able industry-standard software tools.
METHODS
This section begins with a description of the functional setup of the organization within which the study was undertaken. In the study, five problem cases were used to ex-plore different aspects of the establishment of formal decision support processes within the organization. A brief description of each problem case is given. The activities carried out during the various case studies are then summarized. These activities are categorized into participatory discussions and brain-storming sessions; development of prototype data management tools; development and application of geovisualization tools; and performance of spatial and geostatistical analyses. A more detailed account of the activities carried out is found in Paper II, Paper III and Paper IV.
Functional Setup of the Organization The National Water and Sewerage Corpora-tion (NWSC) is a public utility owned by the Government of Uganda (GoU). NWSC is mandated to provide water supply and sew-erage services in 22 urban centres in Uganda, of which Kampala, the capital city, is the largest (Fig. 3). Established in 1972, NWSC’s legal position was further strengthened by the enactment of the NWSC Statute No. 7 of 1995 and the NWSC Act of 2000. Through these legal frameworks, the powers and struc-ture of NWSC were revised to enable the corporation to operate autonomously on a

Frank Kizito TRITA-LWR.LIC 2041
12
MASINDI
HOIMA
MUBENDE
MUKONO
LUGAZI MALABA
IGANGA
Fig. 3. Map of Uganda showing towns served by NWSC, including Kampala. (Source: KW GIS office)
Fig. 4. The KW supply service area, zoned into Branches. Inset is Branch 5, showing the eight Territories within the Branch. (Source: KW GIS office)

Development of Decision Support Tools for Urban Water Supply Management in Uganda
13
commercially and financially viable basis, with its overall management founded on a performance contract between itself and the GoU (NWSC GoU, 2003). In 2004, as a means of operationalizing the GoU contract and as one of several Perform-ance Improvement Programmes (PIPs), NWSC introduced a novel concept called Internally Delegated Area Management Con-tracts (IDAMCs). The IDAMCs involve the corporation’s head office entering into two-year, performance-based management con-tracts with teams of key staff in each of its 22 towns of operation. Each team of key staff, referred to as the Operator for the respective town, is selected out of staff from NWSC as a whole through a competitive bidding proc-ess. The Operator is granted autonomy and responsibility for a number of activities, including network operation and mainte-nance, network expansion and intensification, new connection implementation, billing of customers, revenue collection, procurement of works, supplies and services, and human resource management. In the case of Kampala, owing to the size of the city and the scope of operations, man-agement has been further decentralized to nine geographical administrative units re-ferred to as Branches (Fig. 4), through Branch Performance Contracts (BPCs)
signed between the Operator (Kampala Wa-ter, or KW) and the respective Branch Man-agers (who are also selected through an inter-nal competitive bidding process). The Branches, in turn, are further subdivided into smaller geographical units, called Territories. This study was undertaken within KW, and sought to develop tools to support the de-centralized management setup described above (Fig 5).
Description of Case Studies In Paper I, it is emphasized that an Action Research (AR) study needs to address real-life problem situations in order for it to have an immediate impact on practice and to pro-mote joint learning between academicians and practitioners. In this study, five real-life problems were used as case studies. The five cases are introduced below.
Case 1: Water distribution bottlenecks The Kampala piped water network was ex-periencing structural and hydraulic problems, manifesting in chronic low pressures and supply intermittence in parts of the city, frequent occurrences of leaks and bursts, and water transmission bottlenecks. Of particular concern was the transmission and distribu-tion network for the Naguru water storage tank, a 4,000 cubic meter tank supplying the
Fig. 5. The functionally decentralized setup of the organization.

Frank Kizito TRITA-LWR.LIC 2041
14
north-eastern part of the city (Fig. 6). This part of the city required special attention because it was experiencing supply insuffi-ciencies in several locations, and had regis-tered a significant number of complaints from customers relating to water supply anomalies. For a long time, it was not clear what the underlying causes of the problem were, nor how best to go about solving it. More often than not, a reactive, “fire-fighting” approach had been to try and mitigate the effects of the problem through short-term actions. These actions often took the form of uncoordinated field activities carried out by a number of different technical teams, usually without prior comprehensive planning or analysis. The positive effects of these adhoc interven-tions were not readily apparent. In recognition of the pressing need, the KW management set out to identify and imple-ment more lasting measures to remedy the situation. As part of this process, it was found necessary to bring key players together in brainstorming sessions to develop a com-mon understanding of the nature and causes of the problem, and formulate appropriate courses of action.
Case 2: Non-Revenue Water management In a water supply utility, Non-Revenue Water (NRW) is calculated as the difference be-
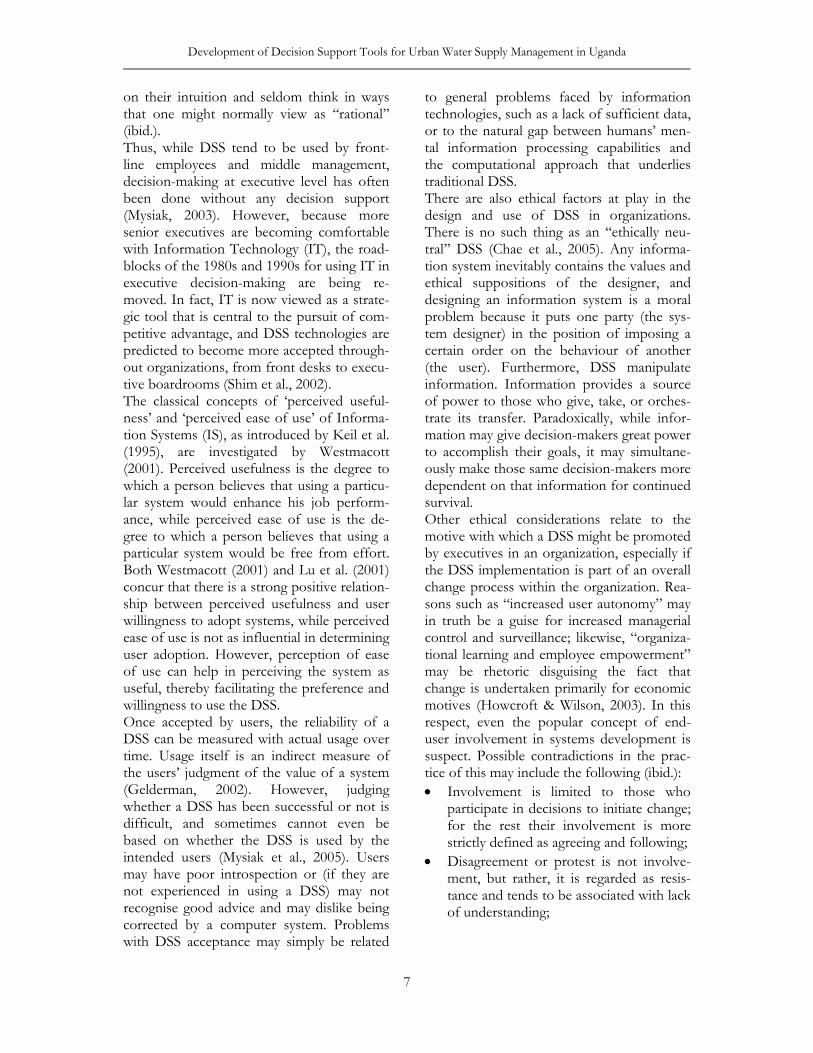
tween the volume of water produced and the volume of water sold, expressed as a percent-age of the volume of water produced. The KW contractual performance target for the period July 2006 to June 2008 was to reduce monthly NRW levels from 37.8% to 26%. However, six months into the contract pe-riod, monthly NRW figures had instead taken an upward trend (Fig. 7). In a bid to reverse this undesirable trend of events, the KW management set out to iden-tify the root causes of the persistently high NRW levels and develop strategies to address them. The goal was to draw up and imple-ment an Action Plan for NRW reduction, leading to a return of NRW to acceptable levels.
Case 3: Territorial management of customer accounts “Territorial management” is a concept that was introduced by one of the utility’s execu-tives following a benchmarking visit to an Asian water utility. Simply put, it involves sub-division of the area of operation of the utility into geographical units small enough for a designated individual, the Territorial Manager (TM), to gain a personal knowledge of, and greater contact with, the customers within his jurisdiction. This closer focus should, in principle, enable the TM to better control aspects of water sales and revenue
Fig. 6. The Naguru water storage tank. (Photo by Roger Thunvik)
Development of Decision Support Tools for Urban Water Supply Management in Uganda
15
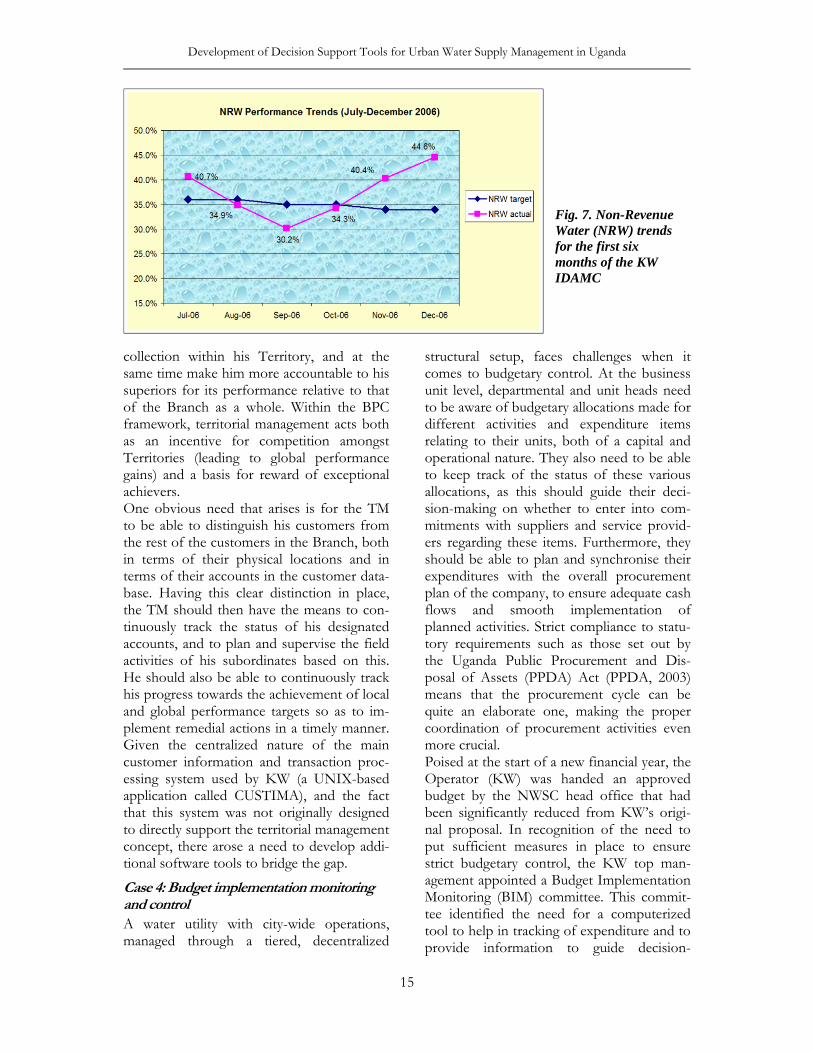
collection within his Territory, and at the same time make him more accountable to his superiors for its performance relative to that of the Branch as a whole. Within the BPC framework, territorial management acts both as an incentive for competition amongst Territories (leading to global performance gains) and a basis for reward of exceptional achievers. One obvious need that arises is for the TM to be able to distinguish his customers from the rest of the customers in the Branch, both in terms of their physical locations and in terms of their accounts in the customer data-base. Having this clear distinction in place, the TM should then have the means to con-tinuously track the status of his designated accounts, and to plan and supervise the field activities of his subordinates based on this. He should also be able to continuously track his progress towards the achievement of local and global performance targets so as to im-plement remedial actions in a timely manner. Given the centralized nature of the main customer information and transaction proc-essing system used by KW (a UNIX-based application called CUSTIMA), and the fact that this system was not originally designed to directly support the territorial management concept, there arose a need to develop addi-tional software tools to bridge the gap.
Case 4: Budget implementation monitoring and control A water utility with city-wide operations, managed through a tiered, decentralized
structural setup, faces challenges when it comes to budgetary control. At the business unit level, departmental and unit heads need to be aware of budgetary allocations made for different activities and expenditure items relating to their units, both of a capital and operational nature. They also need to be able to keep track of the status of these various allocations, as this should guide their deci-sion-making on whether to enter into com-mitments with suppliers and service provid-ers regarding these items. Furthermore, they should be able to plan and synchronise their expenditures with the overall procurement plan of the company, to ensure adequate cash flows and smooth implementation of planned activities. Strict compliance to statu-tory requirements such as those set out by the Uganda Public Procurement and Dis-posal of Assets (PPDA) Act (PPDA, 2003) means that the procurement cycle can be quite an elaborate one, making the proper coordination of procurement activities even more crucial. Poised at the start of a new financial year, the Operator (KW) was handed an approved budget by the NWSC head office that had been significantly reduced from KW’s origi-nal proposal. In recognition of the need to put sufficient measures in place to ensure strict budgetary control, the KW top man-agement appointed a Budget Implementation Monitoring (BIM) committee. This commit-tee identified the need for a computerized tool to help in tracking of expenditure and to provide information to guide decision-
Fig. 7. Non-Revenue Water (NRW) trends for the first six months of the KW IDAMC

Frank Kizito TRITA-LWR.LIC 2041
16
making at various stages of the procurement cycle.
Case 5: Investigating stagnation in monthly water sales KW had experienced rapid growth in its customer base following the introduction towards the end of 2004 of a new policy of providing customers with connection materi-als and labour free of charge, which was followed by decentralization of management activities to the Branches in March 2005 (KW, 2005) As a result of the new connec-tion policy, the number of customer connec-tions increased dramatically from 57,000 in January 2004 to 101,000 by the end of 2007. However, despite this growth in the cus-tomer base, monthly water sales volumes had remained stagnant. An analysis of monthly billing records revealed that there had actually been a net decline in average monthly water sales per connection in the study area over a period of seven years (Fig. 8). As earlier defined in Case 2, the total volume of water sold per month represents the dif-ference between the volume of water pro-duced and Non-Revenue Water (NRW) losses within the month. There are three major components of NRW (Fig. 9), namely unbilled authorised consumption (due to mains flushing, reservoir cleaning, sewer jetting, and fire fighting); apparent or com-mercial losses (due to metering and billing inaccuracies and water theft); and real or physical losses (due to leaks and bursts). In
KW, there was no effective system in place to accurately establish the fractions of NRW attributable to each component and to pin-point the causes of these losses. Whereas efforts were being made to establish District Metering Areas (DMAs) as a means of ena-bling the performance of water audits for different parts of the system, these efforts were complicated by the nature of the piped water reticulation. Having been established in a rather haphazard manner over the years, the pipe network consisted of numerous water mains belonging to different supply sub-systems, criss-crossing and inter-connected with each other, thus making it very difficult to isolate sections of the net-work for analysis. Furthermore, the administrative units (Branches) themselves were not established based on network hydraulic zoning. This made it impossible to hold individual Branches responsible for accounting for water losses occurring within their bounda-ries, as the global water losses were difficult to apportion and attribute to the individual Branches. There was thus a need to develop software tools to facilitate the analysis and localization of water losses within the supply system, and in particular the “apparent” or “commercial” water loss fraction, which had hitherto been the most difficult to pinpoint. The findings from such analyses would en-able KW to understand and address the un-derlying causes for the stagnation in monthly volumes of water sold.
Historical Average Water Sales (m3/conn)
0
10
20
30
40
50
60
Jan-0
1
Apr-01
Jul-0
1
Oct-01
Jan-0
2
Apr-02
Jul-0
2
Oct-02
Jan-0
3
Apr-03
Jul-0
3
Oct-03
Jan-0
4
Apr-04
Jul-0
4
Oct-04
Jan-0
5
Apr-05
Jul-0
5
Oct-05
Jan-0
6
Apr-06
Jul-0
6
Oct-06
Jan-0
7
Apr-07
Jul-0
7
Oct-07
Month
Wat
er s
ales
(m3/
conn
)
Average Water Sales (m3/conn)
Fig. 8: Average monthly water sales per connection, for a period of seven years.

Development of Decision Support Tools for Urban Water Supply Management in Uganda
17
Paper II presents an overview of the first four problem cases and how they were ad-dressed; Paper III focuses on Case 1 in greater detail; while Paper IV deals with Case 5. Case 1, Case 2 and Case 4 involved a number of participatory activities, bringing together different players within the or-ganization, and these activities are outlined in the next section. The other two cases did not involve as much participation, having largely been carried out by the researcher alone. In terms of the geographical areas considered in the different cases: Case 2, Case 3 and Case 4 dealt with KW as a whole, while for Case 1 and Case 5 a single Branch was se-lected for study, namely Branch 5 or Ntinda Branch (Fig. 4). The reasons for selecting this Branch were threefold: i) It was planned that this Branch act as a
pilot for development of decision sup-port tools that would later be rolled out to the rest of the Branches;
ii) It was anticipated that the individual decision support tools developed would eventually be integrated into a single deci-sion support system – hence the need to have them developed within the same geographical context;
iii) This Branch had experienced a number of challenges in the recent past with re-spect to water supply, as described in Case 1, and therefore activities here were of immediate relevance and practical benefit to the Branch and to KW as a whole.
Participatory Discussions and Brain-storming Sessions As mentioned in the previous section, a number of participatory activities were car-ried out. In Case 1, the focus was on facilitat-ing collective problem structuring. One of the water distribution sub-systems (the Na-guru sub-system, shown in Fig. 4, which serves the bulk of Branch 5) had experienced chronic problems with sustaining water sup-ply service levels. Parts of the area served by this sub-system were experiencing intermit-tent or no supply, and customer complaints within the area as a whole had soared. It was thus considered necessary to urgently identify and address the underlying causes of the problem. To achieve participation, the researcher es-tablished a new discussion forum in the company. Called the Technical Think Tank (T-Cube), this forum brought together engi-neers and technical staff of KW. Fortnightly meetings were held, and during these meet-ings a number of issues were identified, ac-tions formulated, and tasks implemented. Details of the activities of T-Cube are con-tained in Paper III. For Case 2, the focus shifted to water loss management. KW had been experiencing high levels of NRW, defined as the difference between water produced and water sold. In an effort to address the situation, the re-searcher coordinated the formulation of an Action Plan for NRW reduction. For this,
SYSTEM INPUT VOLUME
Authorised
Consumption
Water Losses
Billed Authorised Consumption
Unbilled Authorised
Consumption
Apparent (Commercial)
Losses
Real (Physical) Losses
Billed Metered Consumption
Billed Unmetered Consumption
Unbilled Metered Consumption
Unbilled Unmetered Consumption
Unauthorised use (Theft)
Metering Inaccuracies
Leaks
Bursts
RE
VE
NU
E
WA
TE
R
NO
N-R
EV
ENU
E
WA
TE
R Fig. 9. The IWA ‘best
practice’ standard water balance (adapted from Lam-bert, 2003)

Frank Kizito TRITA-LWR.LIC 2041
18
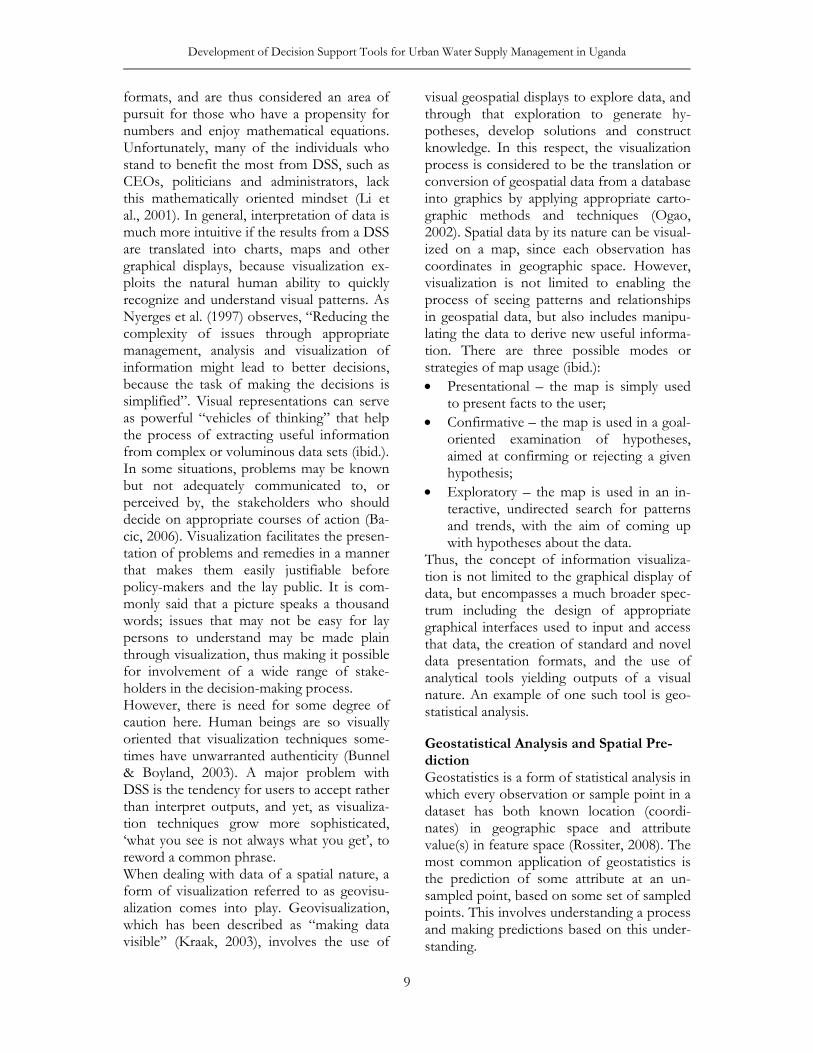
two brainstorming workshops were organ-ised. These workshops involved the partici-pation of both technical and commercial managers from all departments and Branches of KW. Prior to the first workshop, the researcher put together a small team of staff from vari-ous departments to collect historical data related to activities with a potential impact on NRW. The tasks assigned to members of this planning team are shown in Table 1. The data was analyzed and synthesized into a Power-Point presentation that the researcher made to participants at the start of the first work-shop, as a way of informing and guiding the discussions that ensued. During this work-shop, four smaller discussion groups were formed to map out strategies for various aspects of the water loss management proc-ess, namely: reduction of physical losses; reduction of commercial losses; control of unbilled authorised consumption; and regula-tion of system input volumes. Following the first workshop, the researcher and his planning team met a number of times to synthesize the identified strategies and draft an Action Plan indicating specific activi-ties, timelines and responsibility allocations. The researcher presented this Action Plan to the KW top and middle managers at the second workshop, where it was adopted for implementation. In further support of the Action Plan implementation, the researcher developed an integrated set of computerized tools, as described in the next section. In Case 4, the task was to institute mecha-nisms for monitoring of budgetary compli-ance, in the face of a significantly reduced budget. The researcher was co-opted to the BIM committee and was asked to develop a computerized tool to track procurements and expenditure within the company. The BIM committee consisted of departmental heads responsible for finance, accounts, procurement, develop-ment, monitoring and evaluation. At its first sitting, the committee spent close to a whole day reviewing the entire procurement process for expenditure items of both capital (CAPEX) and operational (OPEX) nature, and identifying in great detail the actors,
activity centres, actions and information needs at each point. During this discussion, a number of necessary modifications to exist-ing practices and procedures were identified and agreed upon. The result was a compre-hensive needs assessment and high-level specification for the proposed computerized budget tracking tool, which formed the blue-print for the tool that was later developed.
Development of Prototype Data Man-agement Tools In this section, three custom data manage-ment applications are described. These appli-cations were developed by the researcher using the Microsoft Jet database engine and Visual Basic for Applications (VBA). The choice of developer tools was based on the wide availability of these tools, being part of the Microsoft Office suite of products in common usage in KW. There were thus no additional software and licensing costs in-volved in the development and deployment of the applications. The second consideration was that these developer tools were easy to work with and yet provided a means of creat-ing simple, user-friendly point-and-click graphical interfaces for the applications that were developed. The first application was designed to facilitate NRW management and control (Case 2). It consisted of an integrated set of modules to capture data relating to day-to-day technical and commercial operations at Branch level throughout KW, and in particular those considered to have an impact on NRW (re-pair of leaks and bursts; mains flushing; new connection implementation; illegal connec-tions; stolen and vandalised fittings; handling of customer complaints; meter servicing). These were collectively grouped into a Qual-ity of Service (QOS) module. Also included in the application were mod-ules for tracking water production at the treatment plants, water storage in various reservoirs and tanks located throughout the city, water pumpage at various booster sta-tions, and bulk water transmission to differ-ent flow sub-systems. A module was also established to maintain records on the physi-cal network infrastructure (pipe lengths,
Development of Decision Support Tools for Urban Water Supply Management in Uganda
19
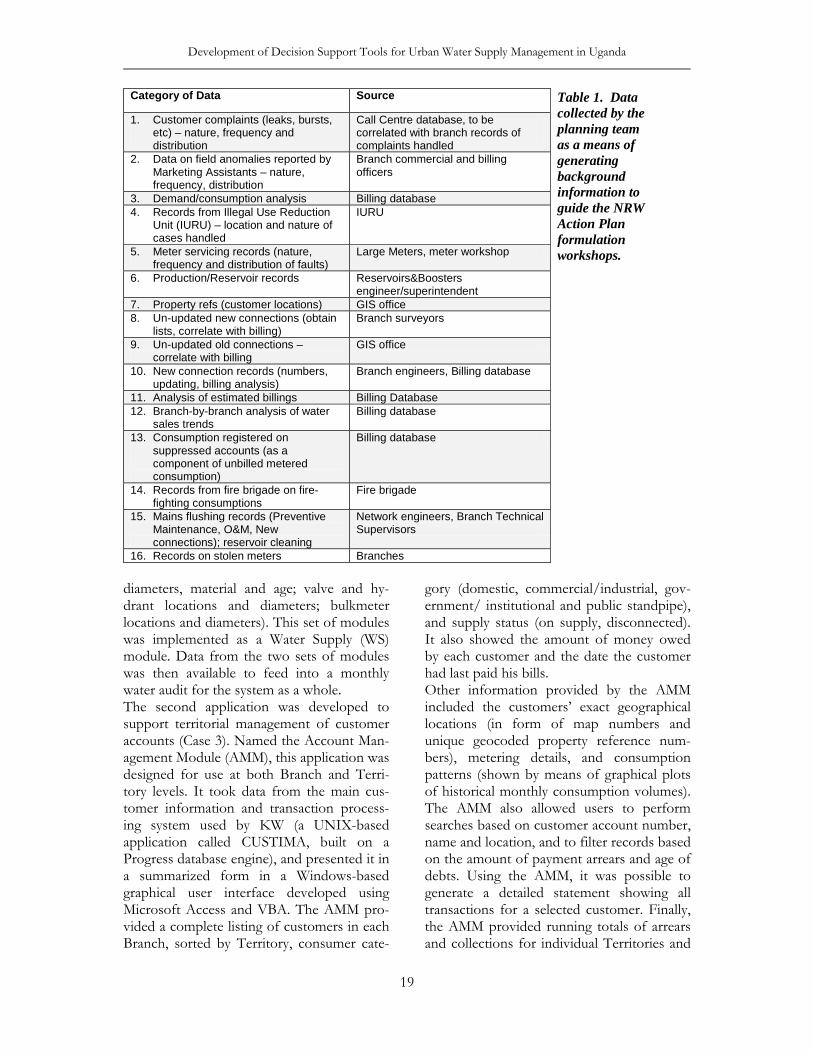
diameters, material and age; valve and hy-drant locations and diameters; bulkmeter locations and diameters). This set of modules was implemented as a Water Supply (WS) module. Data from the two sets of modules was then available to feed into a monthly water audit for the system as a whole. The second application was developed to support territorial management of customer accounts (Case 3). Named the Account Man-agement Module (AMM), this application was designed for use at both Branch and Terri-tory levels. It took data from the main cus-tomer information and transaction process-ing system used by KW (a UNIX-based application called CUSTIMA, built on a Progress database engine), and presented it in a summarized form in a Windows-based graphical user interface developed using Microsoft Access and VBA. The AMM pro-vided a complete listing of customers in each Branch, sorted by Territory, consumer cate-
gory (domestic, commercial/industrial, gov-ernment/ institutional and public standpipe), and supply status (on supply, disconnected). It also showed the amount of money owed by each customer and the date the customer had last paid his bills. Other information provided by the AMM included the customers’ exact geographical locations (in form of map numbers and unique geocoded property reference num-bers), metering details, and consumption patterns (shown by means of graphical plots of historical monthly consumption volumes). The AMM also allowed users to perform searches based on customer account number, name and location, and to filter records based on the amount of payment arrears and age of debts. Using the AMM, it was possible to generate a detailed statement showing all transactions for a selected customer. Finally, the AMM provided running totals of arrears and collections for individual Territories and
Category of Data Source
1. Customer complaints (leaks, bursts, etc) – nature, frequency and distribution
Call Centre database, to be correlated with branch records of complaints handled
2. Data on field anomalies reported by Marketing Assistants – nature, frequency, distribution
Branch commercial and billing officers
3. Demand/consumption analysis Billing database 4. Records from Illegal Use Reduction
Unit (IURU) – location and nature of cases handled
IURU
5. Meter servicing records (nature, frequency and distribution of faults)
Large Meters, meter workshop
6. Production/Reservoir records Reservoirs&Boosters engineer/superintendent
7. Property refs (customer locations) GIS office 8. Un-updated new connections (obtain
lists, correlate with billing) Branch surveyors
9. Un-updated old connections – correlate with billing
GIS office
10. New connection records (numbers, updating, billing analysis)
Branch engineers, Billing database
11. Analysis of estimated billings Billing Database 12. Branch-by-branch analysis of water
sales trends Billing database
13. Consumption registered on suppressed accounts (as a component of unbilled metered consumption)
Billing database
14. Records from fire brigade on fire-fighting consumptions
Fire brigade
15. Mains flushing records (Preventive Maintenance, O&M, New connections); reservoir cleaning
Network engineers, Branch Technical Supervisors
16. Records on stolen meters Branches
Table 1. Data collected by the planning team as a means of generating background information to guide the NRW Action Plan formulation workshops.

Frank Kizito TRITA-LWR.LIC 2041
20
for the Branch as a whole, compared against contractual performance targets set for the month. The third application was developed to assist in tracking procurements and expenditure of both capital (CAPEX) and operational (OPEX) nature in KW (Case 4). Named the Budget Tracker (BT), this application had a database containing all items within the com-pany’s approved CAPEX and OPEX budgets for the entire financial year, coded by end-user department or business unit. It was designed to track cumulative commitments made against each budget item, and to pre-vent over-commitment or “bursting” of budget votes. It contained modules for cap-turing purchase requisitions made by user departments, purchase orders issued to sup-pliers, deliveries and invoices from suppliers, and payments made to suppliers. It also cap-tured and kept track of direct cash expendi-ture, cash advances and accountabilities. Status reports on the total commitments and expenditure per budget item and for each business unit could also be generated. Apart from the AMM, all the above applica-tions were developed in consultation with the prospective end-users at various stages. The consultations were in form of discussions with individual users and periodic presenta-tions of work-in-progress to groups of users, from which feedback was obtained and in-corporated into the system designs. The researcher also relied on first-hand observa-tion of the way in which different tasks were carried out by the prospective end-users in executing their day-to-day activities. For the AMM, however, the researcher mostly used his own judgment to decide which modules and functionality to build into the applica-tion. In terms of deployment, the QOS and AMM modules were installed on computers at the nine different Branches, the WS module was installed in the Water Supply and GIS de-partments, and the BT was installed on a server at the KW head office and made avail-able to various departmental heads and to first-line staff in the finance and procurement departments. However, as described in Paper II, subsequent adoption and usage of some
of these applications faced a number of chal-lenges which are summarized in the Discus-sion section of this thesis.
Development and Application of Geo-visualization Tools In Case 1, as a way of providing further sup-port for participatory problem structuring, a number of maps were generated from data available for the study area. These maps were used to inform and guide the discussions that took place during the T-Cube sessions earlier described. The maps showed: • the location and density of customer
connections within the study area; • the location, nature and frequency of
customer complaints (leaks, bursts, no-water and low-pressure cases);
• the distribution of water demand in the area, based on historical consumption;
• the constraints of supplying water by gravity from different storage tanks and flow sub-systems.
Paper III describes the map generation proc-ess in detail. The maps were produced using ArcGIS, an industry-standard GIS software application from ESRI. Sources of data for the map layers included: • Topographic basemaps in AutoCAD
Drawing Interchange Format (DXF), originally obtained by KW from the Sur-vey and Mapping department of the gov-ernment Ministry of Lands;
• Customer records extracted from the customer information and transaction processing system (CUSTIMA) and geo-coded by means of unique property ref-erence identifiers;
• Historical records of monthly metered consumption volumes for each customer, extracted from CUSTIMA and going back a period of six years;
• Customer complaints extracted from the Call Centre database (a custom Microsoft Access database used to log and route calls received on the company’s 24-hour helpline), going back a period of eighteen months;
• Elevation data, contained in the topog-raphic basemaps and consisting of a layer

Development of Decision Support Tools for Urban Water Supply Management in Uganda
21
of 3D contours at a contour interval of 10m.
The Naguru flow sub-system is predomi-nantly gravity-driven, and therefore pressures at different locations within the system de-pend on the ground elevations at those loca-tions relative to that of the Naguru storage tank. To further assist in visualizing the to-pography of the study area (thereby gaining a better understanding of the system hydrau-lics), a Digital Landscape Model (DLM) of the study area was created. The DLM was built using ESRI’s 3D Analyst. Paper III details the process of constructing the DLM. Using ESRI’s ArcScene, it was then possible for the T-Cube members to view and interac-tively explore the terrain from different an-gles and at different zoom magnifications.
Performance of Spatial and Geostatistical Analyses In Case 5, a geostatistical analysis was carried out for Branch 5. The purpose of the analysis was to find out whether any spatial correla-tions existed between declining water sales in the Branch and reported field anomalies such as aged and defective water meters, water supply intermittence, leaks and bursts, illegal consumption, and disconnected and esti-mated accounts. The geostatistical analysis was carried out using R, an open-source statistical computing and graphics software environment, and Tinn-R, a graphical user environment and code editor for R. In the analysis, an empirical variogram was generated using water sales volumes for a random set of customers selected within the Branch, for a selected month (December 2003). The empirical variogram was subse-quently fitted with a spherical theoretical variogram model. The resultant fitted model was used to generate a continuous raster map of predicted monthly water sales volumes throughout the Branch, using the optimal interpolation process of ordinary kriging (OK). This map of predicted volumes was then compared with another map generated using the same fitted variogram model and water sales volumes for the same set of cus-tomers for December 2007. A difference map was produced, highlighting locations
where significant drops in water sales had occurred between the two periods. Subsequently, distribution plots were made of the locations of the various reported field irregularities. The distribution plots were overlaid on the difference map earlier gener-ated, and the resultant set of layered maps was studied to identify any spatial correla-tions between the field anomalies and per-ceived drops in water sales volumes. A detailed account of the geostatistical analy-ses that were carried out is found in Paper IV.
RESULTS
In this section, the results of the various activities carried out during the study are presented. These include the outcomes of the participatory problem identification and brainstorming sessions; the prototype data management applications that were devel-oped; the maps and geovisualization tools that were produced; and the results of the geostatistical analyses.
Outcomes of Participatory Problem Analyses One output of the first T-Cube discussion session in Case 1 was the identification and clustering of technical problems facing KW as a whole (Table 2). Subsequent T-Cube sessions identified and carried out a number of investigative actions to try and understand the problems that were being experienced in the Naguru sub-system and propose appro-priate remedies. These actions are tabulated in Paper III. In Case 2, a detailed and comprehensive Action Plan for NRW reduction was drawn up, consisting of issues to be addressed, strategies for addressing these issues, specific actions to be implemented under each strat-egy, actors, and timelines. Table 3 contains an extract from the Action Plan that was formu-lated. An implementation schedule was also drawn up (Fig. 10).
Data Management Applications The prototype data management applications that were developed in Case 2, Case 3 and Case 4 (the WS, QOS, AMM, and BT mod-

Frank Kizito TRITA-LWR.LIC 2041
22
ules) are illustrated in Fig. 11, 12, 13 and 14 respectively.
Geovisualization Tools The four maps that were produced in Case 1 are shown in Fig. 15. They included: • A dot map showing location and spread
of service connections; • A proportional symbol and graduated
colour map of average water consump-tion;
• A nominal point map showing nature and distribution of customer complaints;
• A graduated hue elevation difference map depicting areas that could be supplied by gravity from the various storage tanks.
The Digital Landscape Model (DLM) of the study area that was produced is shown in Fig. 16.
Results of Geostatistical Analyses In Case 5, an empirical variogram was gener-ated from historical water sales volumes, and subsequently fitted with a spherical theoreti-cal model. The fitted model was used to generate raster maps of predicted water sales volumes for December 2003 and December 2007 (Fig. 17). These raster maps of pre-dicted water sales volumes were used to generate a difference map (Fig 18). Distribu-tion plots of reported field irregularities were subsequently overlaid on the difference map (Fig 19).
Cluster 1
• Lack of motivation of technical staff.
• Emphasis on commercial activities at the expense of technical ones.
Cluster 2
• Water supply imbalance (failure to supply water).
• Transmission and distribution bottlenecks (dry zones, booster requirements, wrongly sized pipes, aged pipes etc).
• Uncoordinated “troop” movements.
• Inadequate documentation of the network.
• Insufficient storage.
Cluster 3
• Lack of a formal meter management framework.
• Insufficient network fixtures.
• Faulty network fittings (inaccuracy of bulkmeters, inaccessible valves and washouts, etc).
• Competence and training of technical staff (map reading etc).
Cluster 4
• Poor planning of network infrastructure.
• Lack of feasibility analyses prior to implementing new connections.
Cluster 5
• Lack of coordination between KW and road contractors & other utilities.
Cluster 6
• Bureaucratic bottlenecks in accessing materials requisitioned for.
• Limited availability of transport for emergency work.
Cluster 7
• Insufficient sewerage infrastructure.
Table 2. Clustering of technical problem issues facing the KW network, as identified by members of T-Cube.

Development of Decision Support Tools for Urban Water Supply Management in Uganda
23
Table 3. Extract from NRW Reduction Action Plan. (BE= Branch Engineer; DMEM=Development, Monitoring and Evaluation Manager; OMM=Operation and Maintenance Manager; NE=Network Engineer
CATEGORY ISSUE STRATEGY ACTION BY WHO BY WHEN (A) PHYSICAL LOSSES
Aged pipes in the network Poor quality materials. Pipes cut during civil works e.g. road works, drainage construction.
Replace affected sections of the network. Replace sections in the network with identified poor quality pipes and fittings. Blacklist particular types of materials and suppliers. Ensure proper coordination with other service providers. Install marker posts and plates on all network fixtures.
Extract detailed list of affected sections (pipe size, material, length, age) from branch business plans Compile lists of additional problematic pipes/sections Prioritise based on age, frequency of leaks and bursts, size of pipe Prepare BOQ’s for replacement works Identify and reallocate funds from network rationalisation, network intensification or extension votes Procurement of materials and fittings Implementation of replacement works Comb the network and replace poor quality fittings causing problems to the network. Set up a system for routine reporting and follow-up of problematic pipes Compile list of poor quality materials and fittings to be submitted to Procurement Dept. Set up a system for routine reporting and follow-up of suspicious activities that could result in pipe damage. Liaise with stakeholders like KCC, MOW etc, to obtain information on planned works. Identify valves, fire hydrants, washouts, and air valves without marker posts and plates.
BEs BEs BEs BEs DMEM DMEM DMEM BEs OMM, BEs OMM, NEs OMM, NEs OMM NEs
Immediate Immediate Immediate Immediate Short term Short term Short term Immediate Long term Short term Immediate Continuous Immediate

Frank Kizito TRITA-LWR.LIC 2041
24
Q3 Q4 Q1 Q2 Q3 Q4 Q1 Q2
Rehabilitation of problematic sections of the network infrastructureIdentification and replacement of aged pipes and fittingsRelocation of exposed pipes and pipes prone to damage by traffic
Reduction of pipe damage due to civil works activities by other utilities and service providersImprovement of coordination of works and information flow with other utilitiesImproved marking of locations of pipes and fittings (concrete markers for pipes, marker posts and plates for fittings)
Improvement of workmanship in pipe laying, new connection implementation and O&M activitiesProvide periodic refresher training for field staffInstitute stringent mechanisms for works certification and job implemention quality control
Reduction of vandalism of network fixturesEngraving of fixturesConstruction of protective lockable chambersPublic awareness and sensitisation campaigns
Pressure ManagementProcure services for a pressure management studyImplement pressure management controls in affected areas
Proactive leak detectionCarry out a proactive leak detection campaign covering all branchesInstitute leak search reconnaissance teams in branches
Meter ManagementProcure services for a meter management study and establish an effective meter management frameworkReplace aged metersConduct a meter resizing campaign
Illegal consumptionInstitute mechanism for routine verification of supply status of suppressed accountsInstitute mechanism for regular audit of meter readingsStrengthen and streamline activities of Illegal Use Reduction Unit, particularly with respect to proactive illegal use detectionMinimise fire hydrant abuse, through construction of lockable chambers and metering of fire hydrants
Mains FlushingIntroduce and enforce rationalised schedules for planned periodic mains flushing and reservoir cleaningIntroduce sufficient isolation/sectional valves in network to prevent emptying of large portions of it during repairs
Fire Hydrant DrawoffsIdentify critical hydrants for Police access and monitor their usageMeter all flush guns of field teams and monitor/control excessive flushing
BulkmeteringEffectively meter all transmission mains and reservoir outletsRepair/replace faulty bulkmeters within the distribution networkPerform district water audits, starting with small pilot districts based on existing bulkmeters
Production managementRepair/replace all faulty level indicators at reservoirsEstablish/harmonise pumpage schedules both at the treatment works and at booster stationsProcure services for a Demand Management study, and use the results as a basis for control of production levels
(A) REDUCTION OF PHYSICAL LOSSES
(B) REDUCTION OF COMMERCIAL LOSSES
(C) REDUCTION OF UNBILLED AUTHORISED CONSUMPTION
(D) IMPROVED DETERMINATION/CONTROL OF SYSTEM INPUT VOLUMES
NRW Reduction Action Plan Implementation Schedule (July 2006 to June 2008)2006 2007 2008Action Plan Item
Fig. 10. Implementation Schedule for NRW Reduction Action Plan

Development of Decision Support Tools for Urban Water Supply Management in Uganda
25
DISCUSSION AND CONCLUSIONS This section discusses the results presented above with respect to the level of achieve-ment of participation in problem structuring; the challenges of getting the prototype data management tools adopted by the prospec-tive end-users; the role played by the geo-visualization tools; and the potential benefits of the geostatistical analyses carried out. Thereafter, a summary of the reflections from the study as a whole is presented. The section concludes with recommendations of possible future work stemming from this study.
Participation in Problem Structuring Paper III reports that the establishment of T-Cube resulted in the promotion of a culture of participatory problem analysis, especially among the middle-management staff of KW. However, it is also noted in Paper II and Paper III that T-Cube did not gain wide membership among the top decision makers within the organization, who continued to apply a more intuitive and spontaneous deci-sion-making approach, pressed by the ur-gency with which the specific problem situa-tion needed to be addressed. The brainstorming workshops for NRW control, however, enjoyed the participation of a wider spectrum of managers and decision makers, leading to the formulation of a comprehen-sive Action Plan (Table 3 and Fig. 10). In this particular case, though, as reported in Paper III, the greatest challenge turned out to be in implementing the formulated strategies and actions; that is, in moving from planning to action.
Challenges of User Adoption of Data Management Tools A number of prototype data management applications were developed and deployed (Fig. 11, 12, 13 and 14), as described in the Methods section. However, despite the po-tential benefits that these tools offered, it was not easy to get the intended users to adopt and integrate them into their everyday work practices. Paper III discusses the reasons for this. They ranged from a natural aversion to computer technology, to perceptions of
increased data capture workloads and exces-sive managerial control resulting from adop-tion of these tools. In the case of the AMM (Fig. 13), a lack of end-user participation in the system development process resulted in a case of “iceberg subjects” (a term described in Paper I as a situation where the real possi-bilities for improvement are not understood by the intended beneficiaries).
Roles and Benefits of Geovisualization Tools In Case 1 (Paper III), four maps were pro-duced (Fig. 15). The first of these was a dot map of the locations of customer connec-tions in the study area, which served to pro-vide a spatial overview of the extent and density of water supply coverage in the area. The second map was a graduated colour map derived from historical monthly water con-sumption volumes. It served to give a picture of how water consumption (and implicitly, water demand) varied throughout the area. The third map was a nominal point map showing the types, locations and frequency of customer complaints relating to the study area that had been logged in the company’s Call Centre database in the previous eighteen months. It served to highlight which specific types of problems were being experienced in different parts of the network, and to pin-point the locations of physical weaknesses in the pipe infrastructure. The fourth map, which was made up of three different map layers superimposed on each other, was a graduated hue map depicting elevations within the study area relative to ground eleva-tions at three different storage tanks. With this map, it was clear which areas could or could not be supplied from which storage tanks by gravity flow alone. In addition to the four maps, a Digital Land-scape Model (DLM) of the study area was created, providing an interactive tool for navigating through a virtual model of the study area in three dimensions (Fig. 16). This acted as a further means of visualizing and understanding the interplay between the terrain in the study area and the physical layout and hydraulic behavior of the piped water infrastructure.

Frank Kizito TRITA-LWR.LIC 2041
26
Fig. 11. The Water Supply (WS) module, showing data analysis screen for system input vol-umes.
Fig. 12. The Quality of Service (QOS) module, showing job card for tracking physical water losses.

Development of Decision Support Tools for Urban Water Supply Management in Uganda
27
Fig. 13. One of several user interface screens implemented in the Account Management Mod-ule (AMM); this particular screen is used to track the status of arrears on active customer accounts.
Fig. 14. The Budget Tracker (BT) module, showing data input screen for payments to suppli-ers.

Frank Kizito TRITA-LWR.LIC 2041
28
Fig. 15. Maps that were produced and used during the T-Cube discussions.

Development of Decision Support Tools for Urban Water Supply Management in Uganda
29
The four maps and the DLM proved to be useful tools in enhancing the debates that occurred during the T-Cube sessions, and enabled a better understanding of the under-lying causes of the problem situation faced in the area.
Benefits and Shortcomings of Geostatis-tical Analyses In Case 5 (Paper IV), a further geospatial analysis was carried out, this time using geo-statistical modelling. Here, a novel approach was used, which involved generating a con-tinuous spatial map of water losses (Fig. 18), and overlaying this map with various field evidences of irregularities (Fig. 19). The com-bination of feature space and geographic space analyses served to make plain the rela-tive contributions of these field irregularities to the perceived declines in water sales, and to highlight spatial trends within these fac-tors. In addition to the maps that were gener-ated, graphs of historical consumption and new connection data for the area also visually highlighted the problems faced in the area. Futhermore, a geostatistical analysis tool was established for the study area, in form of scripts of R code (Appendix 3 of Paper IV).
It would be possible to adapt and apply this tool in similar analyses for other Branches within KW. However, it was acknowledged that the geo-statistical analyses carried out in the study were not exhaustive, and there was room for further work in this area. It was noted that there were few empirical studies of this kind reported in the literature, and so this study would create awareness and open up avenues for future work.
Overall Reflections from the Study In conformity with the Action Research (AR) approach described in Paper I, Paper III presents some reflections derived from the study as a whole, coming out of the experi-ences of the first four case studies. These reflections are summarized as follows: • DSS needs differ at different manage-
ment levels within an organization. For example, lengthy debates and detailed analyses are perhaps not the best answer at the executive decision-making level, nor in the face of operational crises that require urgent attention.
Fig. 16. A portion of the Digital Landscape Model (DLM) of the study area.

Frank Kizito TRITA-LWR.LIC 2041
30
Fig. 17. Kriging predictions derived from the Dec 2003 and Dec 2007 water sales volumes respectively, for the selected set of customers.
Fig. 18: Difference map, highlighting locations where water sales for Dec 2003 and Dec 2007 differed.

Development of Decision Support Tools for Urban Water Supply Management in Uganda
31
Fig. 19. The spatial map of differences in water sales volumes, overlaid with vari-ous field anomalies recorded in December 2007.
Frank Kizito TRITA-LWR.LIC 2041
32
• In applying decision support theory to practice, a good degree of flexibility in adapting theoretical procedures to actual situations is called for.
• The transition from planning to action is a very real challenge in the practical world of decision-making.
• When deploying DSS to prospective users, the timing matters.
• DSS should be developed from the bot-tom up, starting with users’ needs as per-ceived by themselves, rather than being handed down to users as finished prod-ucts by the systems developer.
• It is necessary to closely study the exist-ing work practices and workflow proc-esses in the organization, and to tailor DSS so that they map naturally into these processes.
• Proactiveness on the part of the propo-nents and eventual custodians of the DSS goes a long way in ensuring effective de-velopment and implementation of tools.
• There is room for expansion of the scope of DSS tools to provide computerized support covering the wide spectrum of management activities within organiza-tions.
• In providing support for decision-making, there is a need to focus on broader aspects than the computerized tools themselves, the challenge being to attain the right balance in emphasis be-tween the technological tools and the ac-tivities and processes that they support.
• Successful DSS implementation in an organization often involves implementing change processes within the organization, and managing this change requires sup-port and commitment at all levels within the organization.
• A commitment to systemic practices on the part of the organization would go a long way in making DSS the practical, useful every-day tools for organizational performance improvement that they have the potential to be.
Summary and Future Perspectives This thesis has been based on four papers. Paper I highlighted the shortfalls of tradi-tional approaches to research in the techno-logical sciences, with respect to their failure to effectively impact on practice and to sup-port joint learning between academicians and practitioners. In the paper, Action Research (AR) was proposed as a suitable way of bridging this gap. The AR approach was considered necessary for the development of appropriate and sustainable technologies and technological practices in the developing world, particularly in the field of Information Systems development. In Paper II, an AR approach was used to explore the challenges inherent in decision support systems development in an urban water utility in Uganda. Using case studies, three aspects of interest were highlighted: the need for proper problem identification prior to formulation of actions; the challenges of moving from planning to action; and the importance of end-user involvement in the development of decision support tools. The necessity of a holistic outlook, going beyond a focus on technological tools, was under-scored. In Paper III, the role of geovisualization in enhancing problem identification was ex-plored. Geovisualization was demonstrated to be useful in “making data visible” and supporting decision-making in an urban water supply management context. Further-more, the establishment of a discussion fo-rum for participatory problem analysis was found to be beneficial in promoting struc-tured decision-making within the company. Paper IV explored some useful geospatial and geostatistical analysis tools for problem identification and statistical inference. It was noted that reported empirical studies involv-ing the application of geostatistics to water loss management within urban water supply systems were few, and therefore it was hoped that this study would prompt further research into this specific application area in the fu-ture.
Development of Decision Support Tools for Urban Water Supply Management in Uganda
33
Through the case studies, a number of in-sights were gained into how best to ensure successful DSS implementation in an organi-zation. As a further outcome of the study, a number of prototype decision support tools were developed. Future work will involve the creation of an integration framework for the different tools. It is anticipated that this inte-gration framework will be built on a Web platform, given the geographically dispersed nature of management activities within the study area. Furthermore, owing to the geospatial nature of urban water supply operations, GIS will continue to play a leading role in the integra-tion framework to be developed. The out-come will be an integrated Spatial Decision Support System, supporting various aspects of decentralized management of water supply operations, thereby consolidating the achievement of the overall research objective, namely improved organizational decision-making through provision of decision sup-port tools. Looking beyond the technology, it is hoped that this thesis work has created awareness on the need to apply a more structured and rigorous approach to decision-making within
the organization, going beyond “fire-fighting” or problem-resolving to identifica-tion of the best possible solutions to prob-lems encountered, and perhaps even to ad-justment of systems and processes to ensure that problems do not arise in the first place. This shift from a clinical to a more research and design orientation will be key to ensuring that the organization not only survives, but continues to grow and develop. This study has been carried out within the framework of a broader research collabora-tion programme, whose overarching theme is “Sustainable Technological Development in the Lake Victoria Basin”. The study is part of an academic PhD research project. This fact notwithstanding, both the aim and context of the study have justified the usage of a hands-on, action-oriented research approach. This kind of approach holds the promise of deliv-ering tangible results that are of practical benefit to a developing nation like Uganda, as she strives “to take all practical measures to promote a good water management system at all levels” (Constitution of Uganda, 1995).
Frank Kizito TRITA-LWR.LIC 2041
34
REFERENCES
Ackoff, R.L. (1981). The art and science of mess management. Interfaces, 2(1), Institute of Man-agement Sciences, University of Pennsylvania.
Alter, S. (2004). A work system view of DSS in its fourth decade. Decision Support Systems, 38, 319–327.
Bacic, I.L.Z., Rossiter, D.G. & Bregt, A.K. (2006). Using spatial information to improve collec-tive understanding of shared environmental problems at watershed level. Landscape and Urban Planning, 77, 54-66.
Baskerville, R. & Myers, M.D. (2004). Special issue on action research in information systems: Making IS research relevant to practice-Foreword. MIS Quarterly, 28, 329-335.
Bharati, P. & Chaudhury, A. (2004). An empirical investigation of decision-making satisfaction in web-based decision support systems. Decision Support Systems, 37, 187-197.
Bhatt, G.D. & Zavery, J. (2002). The enabling role of decision support systems in organizational learning. Decision Support Systems, 32, 297-309.
Boerboom, L. (2006). Unpublished lecture material, Spatial Decision Support Systems (SDSS) distance learning course, International Institute for Geo-information Science and Earth Observation (ITC), Enschede, The Netherlands.
Brugher, C.M. & Bowen, K. (2005). Decision research using cognitive structures. Journal of Sys-temic Practice and Action Research, 18, 67-88.
Bunnel, F.L. & Boyland, M. (2003). Decision support systems: It’s the question not the model. Journal for Nature Conservation, 10, 269-279.
Carlsson, C. & Turban, E. (2002). DSS: directions for the next decade. Decision Support Systems, 33, 105-110.
Chae, B., Paradice, D., Courtney, J.F. & Cagle, C.J. (2005). Incorporating an ethical perspective into problem formulation: Implications for decision support systems design. Decision Sup-port Systems, 40, 197-212.
Chen, J.Q. & Lee, S.M. (2003). An exploratory cognitive DSS for strategic decision-making. Deci-sion Support Systems, 36, 147-160.
Constitution of the Republic of Uganda, 1995; Objective XXI. Available online at http://www.ugandaonlinelawlibrary.com/files/constitution/constitution_1995.pdf. (Accessed: April 2008).
Courtney, J.F. (2001). Decision-making and knowledge management in inquiring organizations: toward a new decision-making paradigm for DSS. Decision Support Systems, 31, 17-38.
Dick, B. (1997). Action learning and action research. [On line]. Available at http://www.scu.edu.au/schools/gcm/ar/arp/actlearn.html (Accessed: November 2007)
Ekbia, H.R. (2004). Rethinking DSS: Lessons learnt from Ecosystem Management. Whitepaper, Desert Tortoise Project, The Redlands Institute, University of Redlands, California,
Gelderman, M. (2002). Task difficulty, task variability and satisfaction with management support systems. Journal of Information and Management, 39, 593-604.
Howcroft, D. & Wilson, M. (2003). Paradoxes of participatory practices: The Janus role of the systems developer. Journal of Information and Organization, 13, 1-24.
Karungi, S. (2006). Assessment of various multi-criteria decision analysis techniques for use in a decision sup-port system: Case study of a leaking water pipe. Unpublished MSc. dissertation, Makerere Uni-versity, Uganda.
Keil, M., Beranek, P.M. & Konsynski, B.R. (1995). Usefulness and ease of use: Field study evi-dence regarding task considerations. Decision Support Systems, 13, 75-91.
Kraak, M. (2003). Geovisualisation illustrated. ISPRS Journal of Photogrammetry & Remote Sensing, 57, 390-399.
KW (2005). Kampala Water (KW) monthly and quarterly reports for the year 2005, taken from the company’s electronic archive of records.

Development of Decision Support Tools for Urban Water Supply Management in Uganda
35
Lambert, A. (2003). Assessing non-revenue water and its components: a practical approach. Article in IWA Water21 Magazine, August 2003.
Lawrence, M., Goodwin, P. & Fildes, R. (2002). Influence of user participation on DSS use and decision accuracy. OMEGA, 30, 381-392.
Li, T., Feng, S. & Li, L. (2001). Information visualization for intelligent decision support systems. Journal of Knowledge-Based Systems, 14, 259-262.
Lu, H., Yu, H. & Lu, S. (2001). The effects of cognitive style and model type on DSS acceptance: An empirical study. European Journal of Operational Research, 131, 649-663.
Melin, U. & Axelsson, K. (2007). Action in action research – illustrations of what, who, why, where and when from an e-government project. In M.A. Wimmer, H.J. Scholl, and A. Grönlund (Eds.), EGOV2007, LNCS 4656 (pp. 44-45). Berlin Heidelberg: Springer-Verlag.
Mintzberg, H., Raisinghani, D. & Theoret, A. (1976). The structure of “unstructured” decision processes. Administrative Science Quarterly, 21(2), 246-275.
Mysiak, J. (2003). Development of transferable multicriteria decision tools for water resources management. Leipzig, Germany, UFZ Centre for Environmental Research. Accessible online at www.mariecurie.org/annals/volume3/mysiak.pdf (Accessed: February 2006).
Mysiak, J., Giupponi, C. & Rosato, P. (2005). Towards the development of a decision support system for water resource management. Journal of Environmental Modelling & Software, 20, 203-214.
Ngirane-Katashaya, G., Kizito, F. & Thunvik, R. (2006). Decision support systems for water resources management in Uganda: The need. Proceedings of the 32nd WEDC Interna-tional Conference, Colombo, Sri Lanka, November 2006.
NWSC-GoU (2003). Performance contract between the government of the Republic of Uganda and National Watee and Sewerage Corporation, October 2003. Available online at http://www.nwsc.co.ug/uploads/PDdownloads/ (Accessed May 2008).
Nyerges, T.L., Montejano, R., Oshiro, C., & Dadswell, M. (1997). Group-based geographic in-formation systems for transportation improvement site selection. Transportation Research, 5(6), 349-369.
O’Brien, R. (2001). Um exame da abordagem metodológica da pesquisa ação [An Overview of the Methodological Approach of Action Research]. In R. Richardson (Ed.), Teoria e Prática da Pesquisa Ação [Theory and Practice of Action Research]. João Pessoa, Brazil: Universi-dade Federal da Paraíba. (English version accesible online at http://www.web.ca/~robrien /papers/arfinal.html)
Ogao, P.J. (2002). Exploratory visualization of temporal geospatial data using animation. ITC Publication, Febodruk BV, Enschede, 158p.
Pereira, A.G. & Quintana, S.C. (2002). From Technocratic to Participatory Decision Support Systems: Responding to the New Governance Initiatives. Journal of Geographic Information and Decision Analysis, 6, 95-107.
PPDA (2003). The public procurement and disposal of public assets act, 2003. Entebbe: UPPC. Accessible online at http://www.ppda.go.ug/
Rasmussen, L.B. (2004). Action research—Scandinavian experiences. AI & Soc, 18, 21–43. Rossiter, D.G. (2008). Applied Geostatistics. Course Notes, Geostatistics and Open-Source Sta-
tistical Computing, International Institute for Geo-information Science & Earth Observa-tion (ITC), Enschede (NL).
Sharifi, A., van Herwijnen, M. & van den Toorn, W. (2004). Spatial decision support systems: theory and practice. Lecture Material, SDSS distance learning course, International Institute for Geo-information Science and Earth Observation (ITC), Enschede, The Netherlands. Book to be published by ISPRS WG II/IV in 2007.
Shim, J.P., Warkentin, M., Courtney, J.F., Power, D.J., Sharda, R. & Carlsson, C. (2002). Past, present, and future of decision support technology. Decision Support Systems, 33, 111-126.

Frank Kizito TRITA-LWR.LIC 2041
36
Simon, H. A. (1960). The new science of management decision (Vol. 3). New York: Harper. Smart, K.L. & Whiting, M.E. (2001). Designing systems that support learning and use: a cus-
tomer-centered approach. Journal of Information and Management, 39, 177-190. Sol, H. G. (1982). Simulation in information systems development. Doctoral dissertation, University of
Groningen, Groningen, The Netherlands. Sprague, R. (1986). A framework for the development of decision support systems. In Ralph
Sprague and Hugh Watson (Eds.), Decision support systems: putting theory into practice (pp. 7-32). London: Prentice-Hall.
Styhre, A. & Sundgren, M. (2005). Action research as experimentation. Journal of Systemic Practice and Action Research, 18, 53-65.
Tian, J., Wang, Y., Li, H., Li, L. & Wang, K. (2007). DSS development and applications in China. Decision Support Systems, 42, 2060-2077.
West, D. & Stansfield, M.H. (2001). Structuring action and reflection in information systems action research studies using Checkland’s FMA model. Journal of Systemic Practice and Action Research, 14, 251-281.
Westmacott, S. (2001). Developing decision support systems for integrated coastal management in the tropics: Is the ICM decision-making environment too complex for the develop-ment of a useable and useful DSS? Journal of Environmental Management, 62, 55-74.
Westphal, K.S., Vogel, R.M., Kirshen, P. & Chapra, S.C. (2003). Decision support system for adaptive water supply management. Journal of Water Resources Planning and Management, 129(3), 165-177.
Software References: AutoCAD website: http://www.autodesk.com ESRI ArcGIS website: http://www.esri.com/software/arcgis/index.html Microsoft Office website: http://office.microsoft.com Progress website: http://www.progress.com R Project for Statistical Computing website: http://www.r-project.org Tinn-R website: http://sourceforge.net/projects/tinn-r
Related Documents