Frailty Capacity Modelling in West Lothian Neil Pettinger / 21 April 2015

Frailty Capacity Modelling in West Lothian Neil Pettinger / 21 April 2015.
Dec 27, 2015
Welcome message from author
This document is posted to help you gain knowledge. Please leave a comment to let me know what you think about it! Share it to your friends and learn new things together.
Transcript

Frailty Capacity Modelling in West Lothian
Neil Pettinger / 21 April 2015


A&E

AssessmentA&E

WardsAssessmentA&E

HomecareWardsAssessmentA&E

How many?
HomecareWardsAssessmentA&E

Howlong?
How many?
HomecareWardsAssessmentA&E

Howfull?
Howlong?
How many?
HomecareWardsAssessmentA&E
Howfull?
Howlong?
How many?
HomecareWardsAssessmentA&E
St John’s Hospital / MEDICAL UNSCHEDULED CARE PATHWAYS
Howfull?
Howlong?
How many?
HomecareWardsAssessmentA&E
St John’s Hospital / MEDICAL UNSCHEDULED CARE PATHWAYS
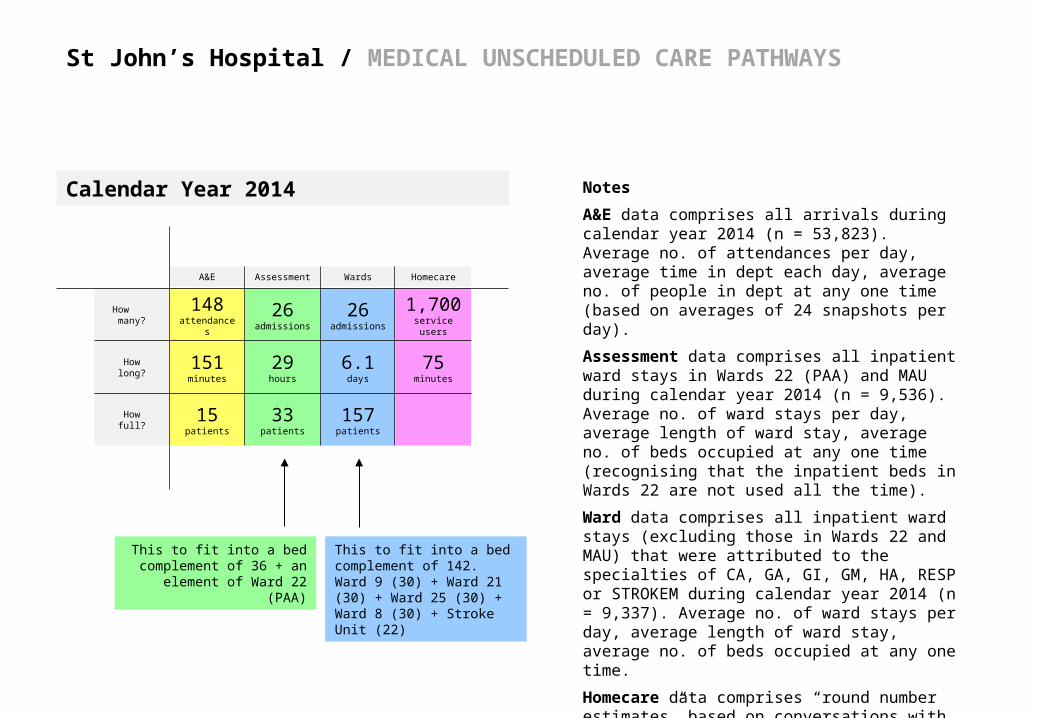
Calendar Year 2014
Howfull?
Howlong?
How many?
HomecareWardsAssessmentA&E
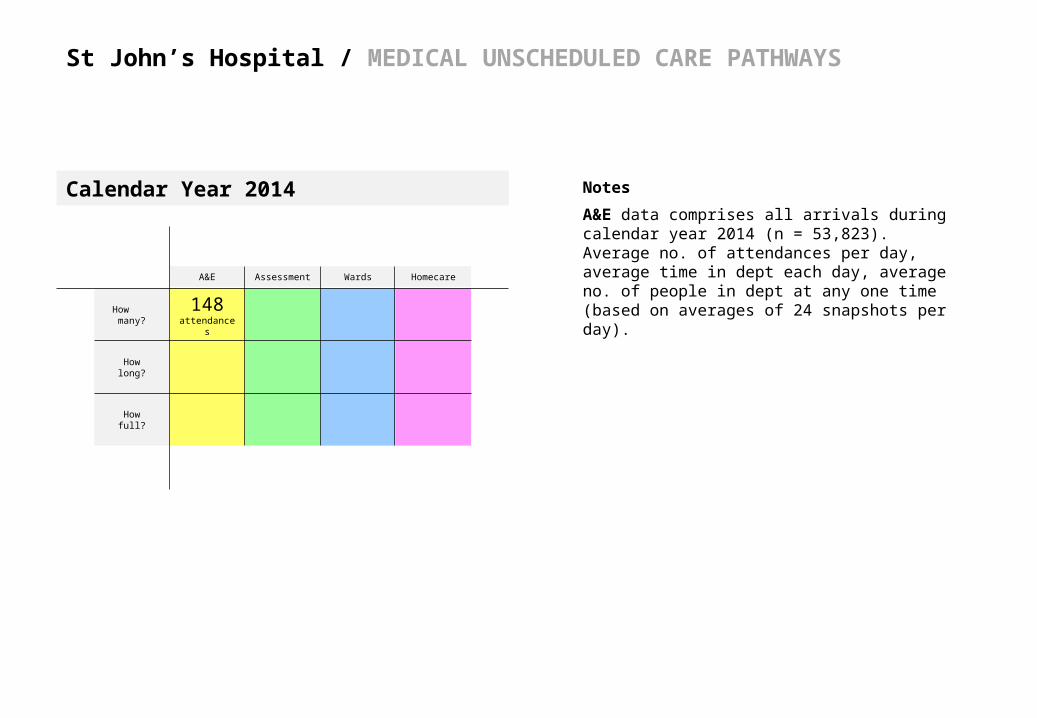
148attendances
St John’s Hospital / MEDICAL UNSCHEDULED CARE PATHWAYS
Calendar Year 2014 Notes
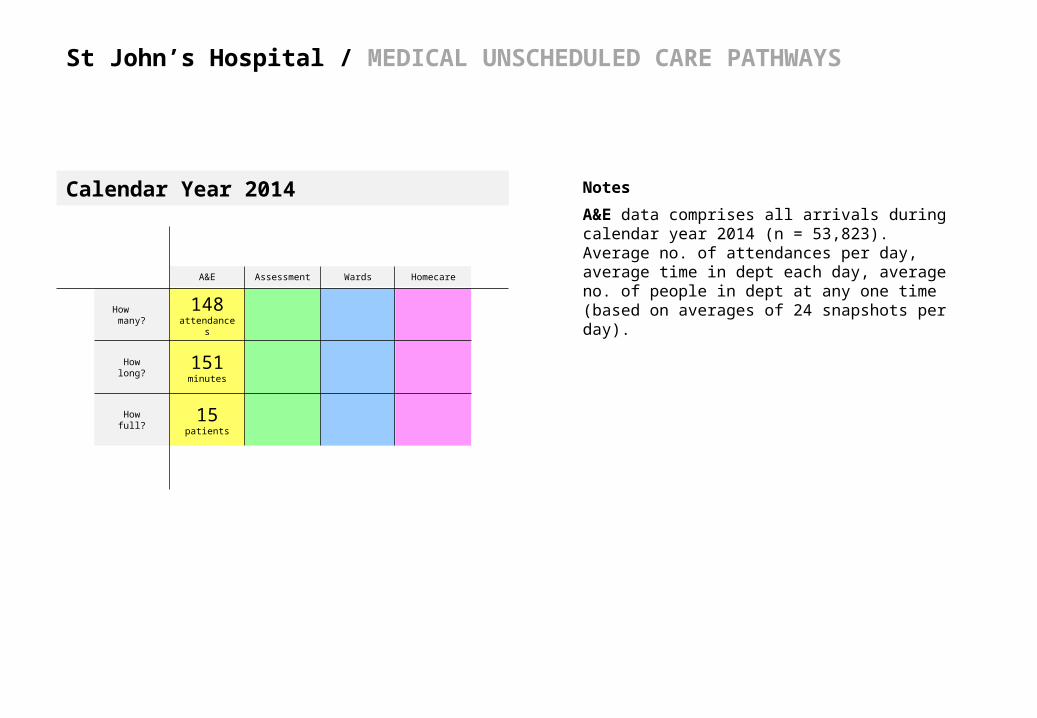
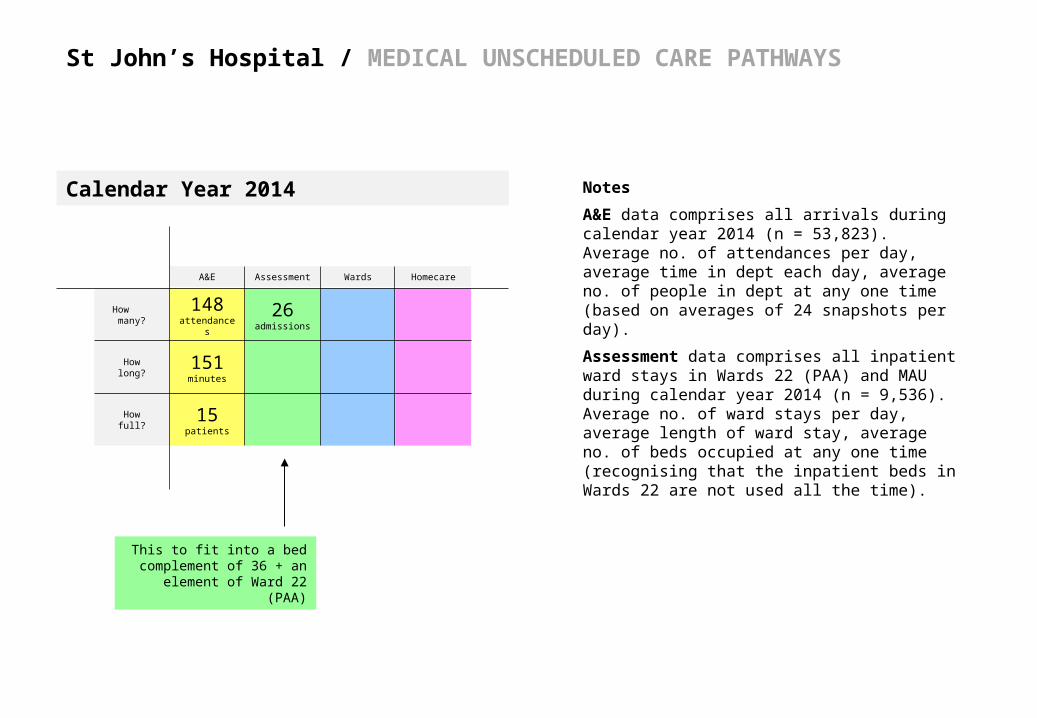
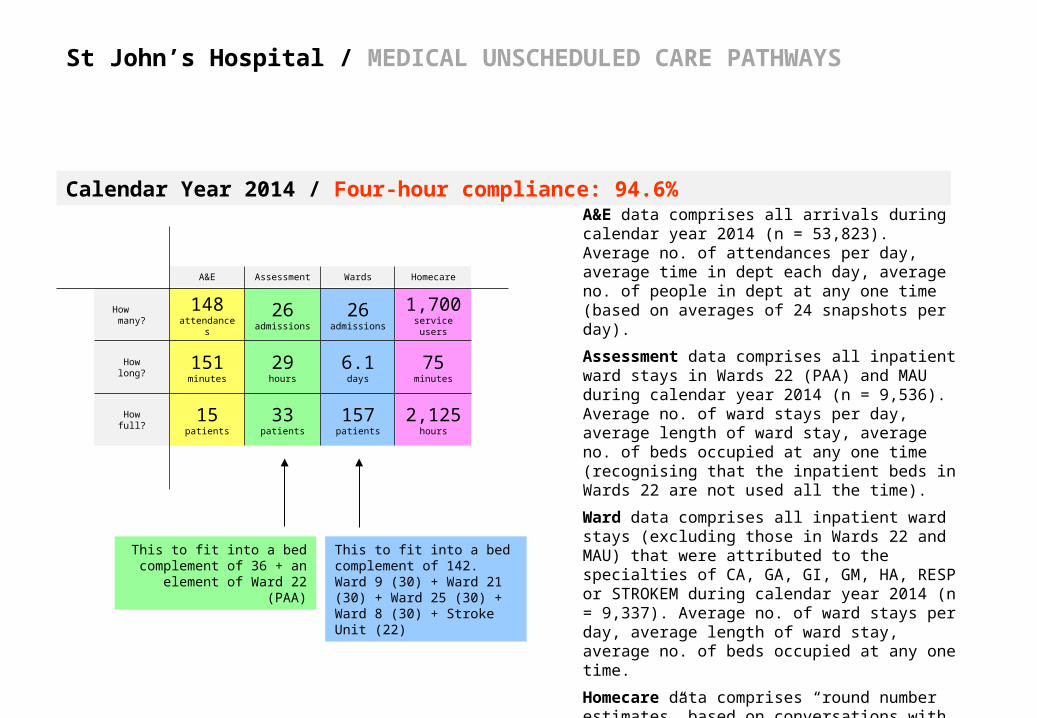
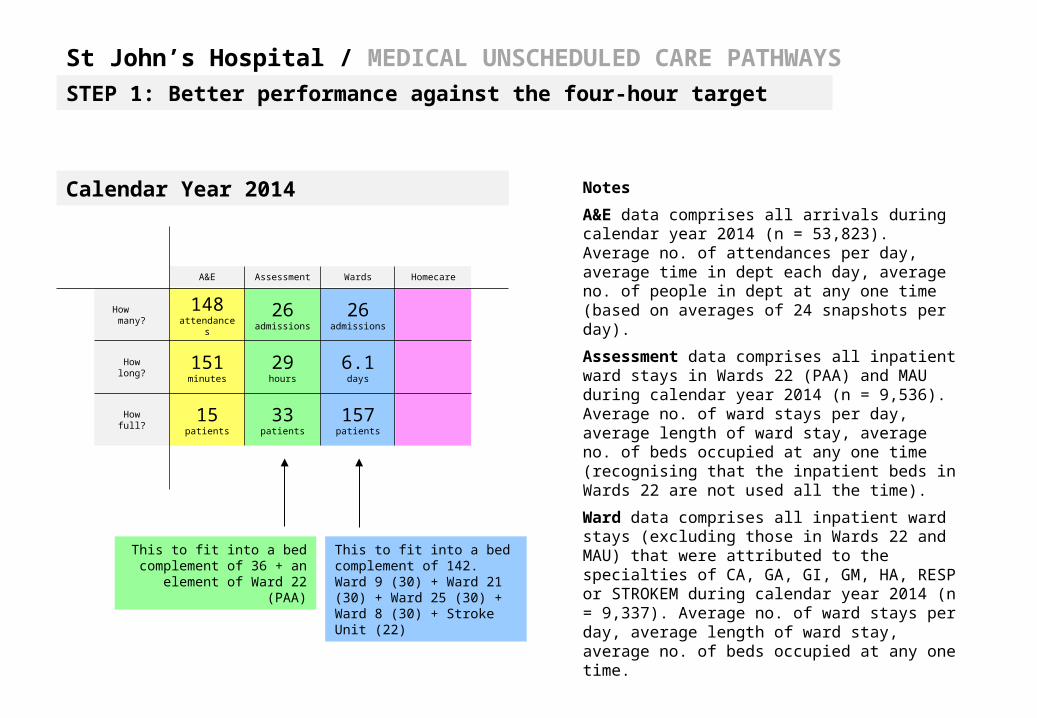
A&E data comprises all arrivals during calendar year 2014 (n = 53,823). Average no. of attendances per day, average time in dept each day, average no. of people in dept at any one time (based on averages of 24 snapshots per day).

Howfull?
Howlong?
How many?
HomecareWardsAssessmentA&E
151minutes
148attendances
St John’s Hospital / MEDICAL UNSCHEDULED CARE PATHWAYS
Calendar Year 2014 Notes
A&E data comprises all arrivals during calendar year 2014 (n = 53,823). Average no. of attendances per day, average time in dept each day, average no. of people in dept at any one time (based on averages of 24 snapshots per day).
Howfull?
Howlong?
How many?
HomecareWardsAssessmentA&E
15patients
151minutes
26admissions
148attendances
St John’s Hospital / MEDICAL UNSCHEDULED CARE PATHWAYS
Calendar Year 2014 Notes
A&E data comprises all arrivals during calendar year 2014 (n = 53,823). Average no. of attendances per day, average time in dept each day, average no. of people in dept at any one time (based on averages of 24 snapshots per day).
Assessment data comprises all inpatient ward stays in Wards 22 (PAA) and MAU during calendar year 2014 (n = 9,536). Average no. of ward stays per day, average length of ward stay, average no. of beds occupied at any one time (recognising that the inpatient beds in Wards 22 are not used all the time).
This to fit into a bed complement of 36 + an
element of Ward 22 (PAA)
Howfull?
Howlong?
How many?
HomecareWardsAssessmentA&E
15patients
151minutes
26admissions
148attendances
29hours
St John’s Hospital / MEDICAL UNSCHEDULED CARE PATHWAYS
Calendar Year 2014 Notes
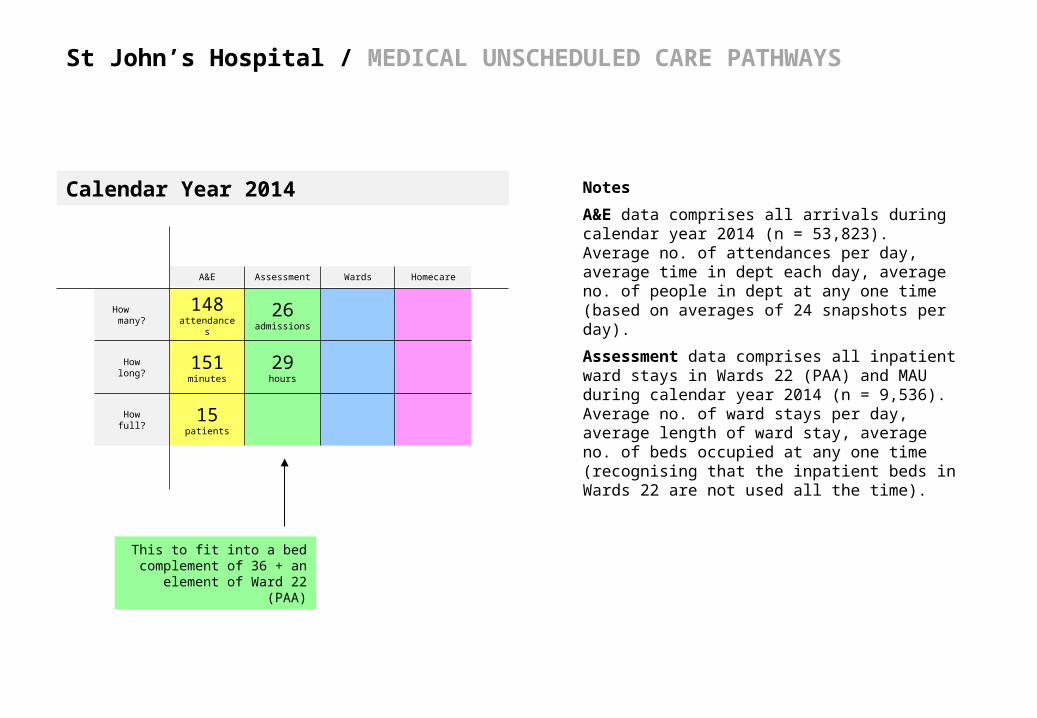
A&E data comprises all arrivals during calendar year 2014 (n = 53,823). Average no. of attendances per day, average time in dept each day, average no. of people in dept at any one time (based on averages of 24 snapshots per day).
Assessment data comprises all inpatient ward stays in Wards 22 (PAA) and MAU during calendar year 2014 (n = 9,536). Average no. of ward stays per day, average length of ward stay, average no. of beds occupied at any one time (recognising that the inpatient beds in Wards 22 are not used all the time).
This to fit into a bed complement of 36 + an
element of Ward 22 (PAA)
Howfull?
Howlong?
How many?
HomecareWardsAssessmentA&E
15patients
151minutes
26admissions
148attendances
29hours
33patients
St John’s Hospital / MEDICAL UNSCHEDULED CARE PATHWAYS
Calendar Year 2014 Notes
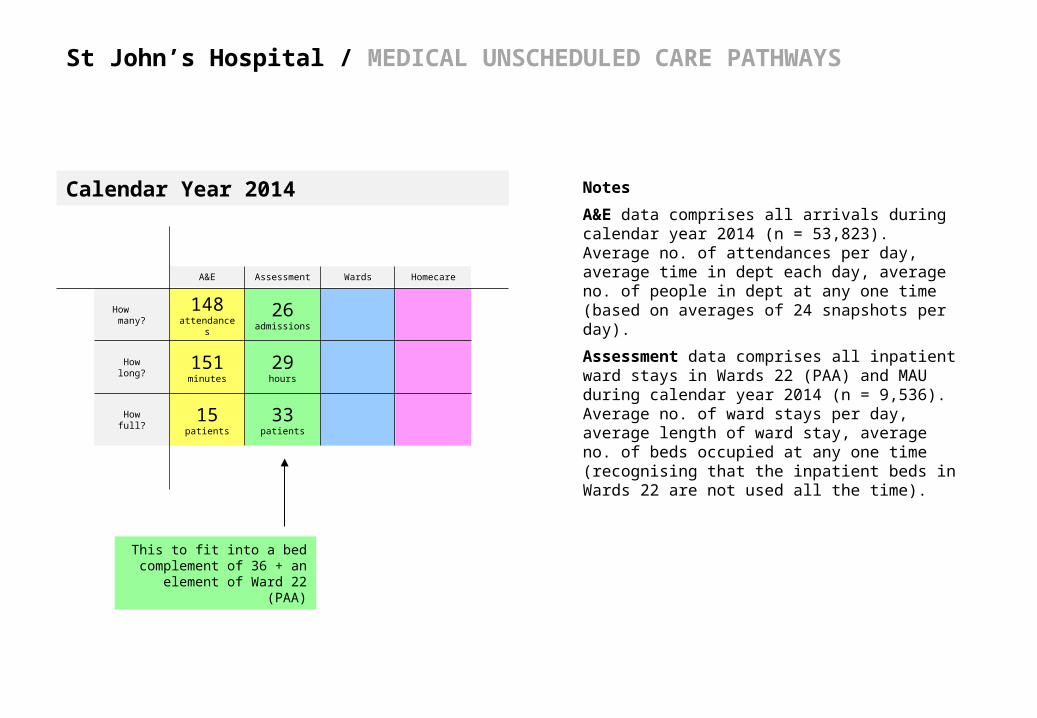
A&E data comprises all arrivals during calendar year 2014 (n = 53,823). Average no. of attendances per day, average time in dept each day, average no. of people in dept at any one time (based on averages of 24 snapshots per day).
Assessment data comprises all inpatient ward stays in Wards 22 (PAA) and MAU during calendar year 2014 (n = 9,536). Average no. of ward stays per day, average length of ward stay, average no. of beds occupied at any one time (recognising that the inpatient beds in Wards 22 are not used all the time).
This to fit into a bed complement of 36 + an
element of Ward 22 (PAA)
Howfull?
Howlong?
How many?
HomecareWardsAssessmentA&E
15patients
151minutes
26admissions
26admissions
148attendances
29hours
33patients
St John’s Hospital / MEDICAL UNSCHEDULED CARE PATHWAYS
Calendar Year 2014 Notes
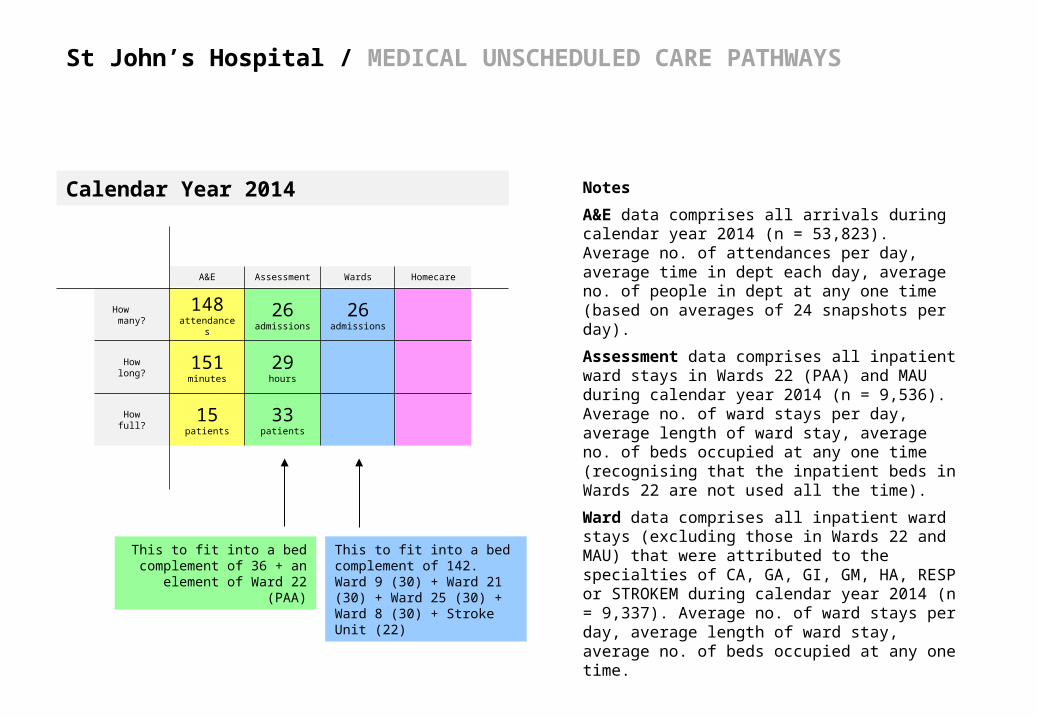
A&E data comprises all arrivals during calendar year 2014 (n = 53,823). Average no. of attendances per day, average time in dept each day, average no. of people in dept at any one time (based on averages of 24 snapshots per day).
Assessment data comprises all inpatient ward stays in Wards 22 (PAA) and MAU during calendar year 2014 (n = 9,536). Average no. of ward stays per day, average length of ward stay, average no. of beds occupied at any one time (recognising that the inpatient beds in Wards 22 are not used all the time).
Ward data comprises all inpatient ward stays (excluding those in Wards 22 and MAU) that were attributed to the specialties of CA, GA, GI, GM, HA, RESP or STROKEM during calendar year 2014 (n = 9,337). Average no. of ward stays per day, average length of ward stay, average no. of beds occupied at any one time.This to fit into a bed
complement of 36 + an element of Ward 22 (PAA)
This to fit into a bed complement of 142. Ward 9 (30) + Ward 21 (30) + Ward 25 (30) + Ward 8 (30) + Stroke Unit (22)

Howfull?
Howlong?
How many?
HomecareWardsAssessmentA&E
15patients
151minutes
26admissions
26admissions
148attendances
6.1days
29hours
33patients
St John’s Hospital / MEDICAL UNSCHEDULED CARE PATHWAYS
Calendar Year 2014 Notes
A&E data comprises all arrivals during calendar year 2014 (n = 53,823). Average no. of attendances per day, average time in dept each day, average no. of people in dept at any one time (based on averages of 24 snapshots per day).
Assessment data comprises all inpatient ward stays in Wards 22 (PAA) and MAU during calendar year 2014 (n = 9,536). Average no. of ward stays per day, average length of ward stay, average no. of beds occupied at any one time (recognising that the inpatient beds in Wards 22 are not used all the time).
Ward data comprises all inpatient ward stays (excluding those in Wards 22 and MAU) that were attributed to the specialties of CA, GA, GI, GM, HA, RESP or STROKEM during calendar year 2014 (n = 9,337). Average no. of ward stays per day, average length of ward stay, average no. of beds occupied at any one time.This to fit into a bed
complement of 36 + an element of Ward 22 (PAA)
This to fit into a bed complement of 142. Ward 9 (30) + Ward 21 (30) + Ward 25 (30) + Ward 8 (30) + Stroke Unit (22)

Howfull?
Howlong?
How many?
HomecareWardsAssessmentA&E
15patients
151minutes
26admissions
26admissions
148attendances
6.1days
29hours
157patients
33patients
St John’s Hospital / MEDICAL UNSCHEDULED CARE PATHWAYS
Calendar Year 2014 Notes
A&E data comprises all arrivals during calendar year 2014 (n = 53,823). Average no. of attendances per day, average time in dept each day, average no. of people in dept at any one time (based on averages of 24 snapshots per day).
Assessment data comprises all inpatient ward stays in Wards 22 (PAA) and MAU during calendar year 2014 (n = 9,536). Average no. of ward stays per day, average length of ward stay, average no. of beds occupied at any one time (recognising that the inpatient beds in Wards 22 are not used all the time).
Ward data comprises all inpatient ward stays (excluding those in Wards 22 and MAU) that were attributed to the specialties of CA, GA, GI, GM, HA, RESP or STROKEM during calendar year 2014 (n = 9,337). Average no. of ward stays per day, average length of ward stay, average no. of beds occupied at any one time.This to fit into a bed
complement of 36 + an element of Ward 22 (PAA)
This to fit into a bed complement of 142. Ward 9 (30) + Ward 21 (30) + Ward 25 (30) + Ward 8 (30) + Stroke Unit (22)

St John’s Hospital / MEDICAL UNSCHEDULED CARE PATHWAYS
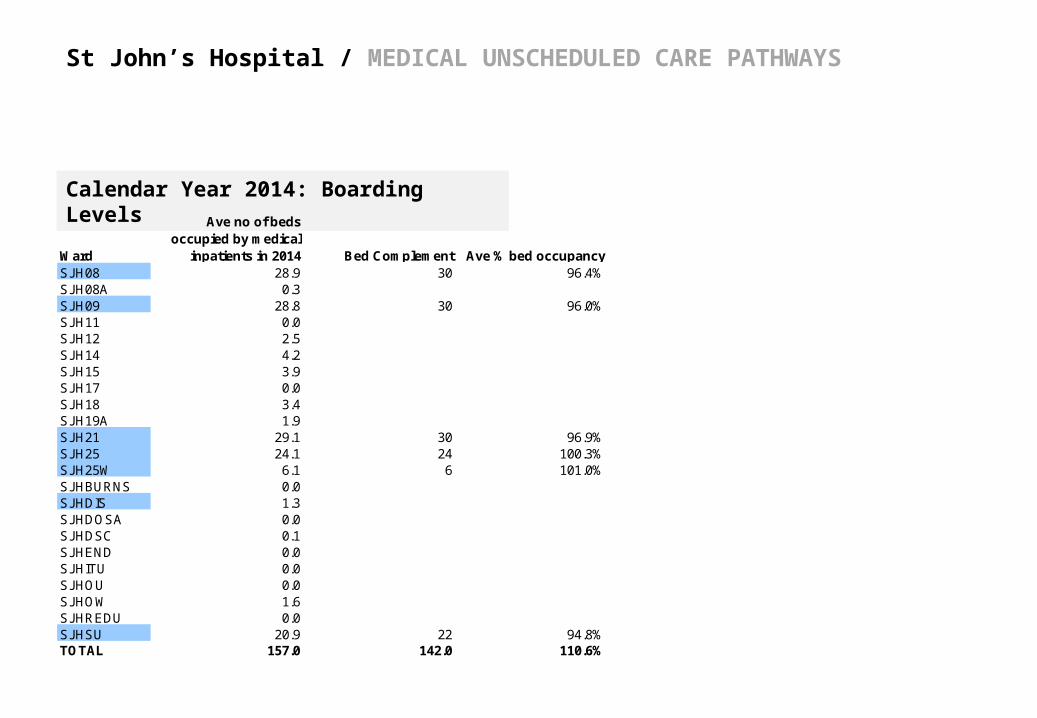
Calendar Year 2014: Boarding Levels
Ward
Ave no of beds occupied by medical
inpatients in 2014 Bed Complement Ave % bed occupancySJH08 28.9 30 96.4%SJH08A 0.3SJH09 28.8 30 96.0%SJH11 0.0SJH12 2.5SJH14 4.2SJH15 3.9SJH17 0.0SJH18 3.4SJH19A 1.9SJH21 29.1 30 96.9%SJH25 24.1 24 100.3%SJH25W 6.1 6 101.0%SJHBURNS 0.0SJHDIS 1.3SJHDOSA 0.0SJHDSC 0.1SJHEND 0.0SJHITU 0.0SJHOU 0.0SJHOW 1.6SJHREDU 0.0SJHSU 20.9 22 94.8%TOTAL 157.0 142.0 110.6%

Howfull?
Howlong?
How many?
HomecareWardsAssessmentA&E
15patients
151minutes
1,700service users
26admissions
26admissions
148attendances
6.1days
29hours
157patients
33patients
St John’s Hospital / MEDICAL UNSCHEDULED CARE PATHWAYS
Calendar Year 2014 Notes
A&E data comprises all arrivals during calendar year 2014 (n = 53,823). Average no. of attendances per day, average time in dept each day, average no. of people in dept at any one time (based on averages of 24 snapshots per day).
Assessment data comprises all inpatient ward stays in Wards 22 (PAA) and MAU during calendar year 2014 (n = 9,536). Average no. of ward stays per day, average length of ward stay, average no. of beds occupied at any one time (recognising that the inpatient beds in Wards 22 are not used all the time).
Ward data comprises all inpatient ward stays (excluding those in Wards 22 and MAU) that were attributed to the specialties of CA, GA, GI, GM, HA, RESP or STROKEM during calendar year 2014 (n = 9,337). Average no. of ward stays per day, average length of ward stay, average no. of beds occupied at any one time.
Homecare data comprises “round number estimates” based on conversations with Yvonne Lawton and Rachel MacKay.
This to fit into a bed complement of 36 + an
element of Ward 22 (PAA)
This to fit into a bed complement of 142. Ward 9 (30) + Ward 21 (30) + Ward 25 (30) + Ward 8 (30) + Stroke Unit (22)
Howfull?
Howlong?
How many?
HomecareWardsAssessmentA&E
15patients
151minutes
1,700service users
26admissions
26admissions
148attendances
6.1days
29hours
75minutes
157patients
33patients
St John’s Hospital / MEDICAL UNSCHEDULED CARE PATHWAYS
Calendar Year 2014 Notes
A&E data comprises all arrivals during calendar year 2014 (n = 53,823). Average no. of attendances per day, average time in dept each day, average no. of people in dept at any one time (based on averages of 24 snapshots per day).
Assessment data comprises all inpatient ward stays in Wards 22 (PAA) and MAU during calendar year 2014 (n = 9,536). Average no. of ward stays per day, average length of ward stay, average no. of beds occupied at any one time (recognising that the inpatient beds in Wards 22 are not used all the time).
Ward data comprises all inpatient ward stays (excluding those in Wards 22 and MAU) that were attributed to the specialties of CA, GA, GI, GM, HA, RESP or STROKEM during calendar year 2014 (n = 9,337). Average no. of ward stays per day, average length of ward stay, average no. of beds occupied at any one time.
Homecare data comprises “round number estimates” based on conversations with Yvonne Lawton and Rachel MacKay.
This to fit into a bed complement of 36 + an
element of Ward 22 (PAA)
This to fit into a bed complement of 142. Ward 9 (30) + Ward 21 (30) + Ward 25 (30) + Ward 8 (30) + Stroke Unit (22)

Howfull?
Howlong?
How many?
HomecareWardsAssessmentA&E
15patients
151minutes
1,700service users
26admissions
26admissions
148attendances
6.1days
29hours
75minutes
157patients
33patients
2,125hours
St John’s Hospital / MEDICAL UNSCHEDULED CARE PATHWAYS
Calendar Year 2014 Notes
A&E data comprises all arrivals during calendar year 2014 (n = 53,823). Average no. of attendances per day, average time in dept each day, average no. of people in dept at any one time (based on averages of 24 snapshots per day).
Assessment data comprises all inpatient ward stays in Wards 22 (PAA) and MAU during calendar year 2014 (n = 9,536). Average no. of ward stays per day, average length of ward stay, average no. of beds occupied at any one time (recognising that the inpatient beds in Wards 22 are not used all the time).
Ward data comprises all inpatient ward stays (excluding those in Wards 22 and MAU) that were attributed to the specialties of CA, GA, GI, GM, HA, RESP or STROKEM during calendar year 2014 (n = 9,337). Average no. of ward stays per day, average length of ward stay, average no. of beds occupied at any one time.
Homecare data comprises “round number estimates” based on conversations with Yvonne Lawton and Rachel MacKay.
This to fit into a bed complement of 36 + an
element of Ward 22 (PAA)
This to fit into a bed complement of 142. Ward 9 (30) + Ward 21 (30) + Ward 25 (30) + Ward 8 (30) + Stroke Unit (22)
Howfull?
Howlong?
How many?
HomecareWardsAssessmentA&E
15patients
151minutes
1,700service users
26admissions
26admissions
148attendances
6.1days
29hours
75minutes
157patients
33patients
2,125hours
St John’s Hospital / MEDICAL UNSCHEDULED CARE PATHWAYS
Notes
A&E data comprises all arrivals during calendar year 2014 (n = 53,823). Average no. of attendances per day, average time in dept each day, average no. of people in dept at any one time (based on averages of 24 snapshots per day).
Assessment data comprises all inpatient ward stays in Wards 22 (PAA) and MAU during calendar year 2014 (n = 9,536). Average no. of ward stays per day, average length of ward stay, average no. of beds occupied at any one time (recognising that the inpatient beds in Wards 22 are not used all the time).
Ward data comprises all inpatient ward stays (excluding those in Wards 22 and MAU) that were attributed to the specialties of CA, GA, GI, GM, HA, RESP or STROKEM during calendar year 2014 (n = 9,337). Average no. of ward stays per day, average length of ward stay, average no. of beds occupied at any one time.
Homecare data comprises “round number estimates” based on conversations with Yvonne Lawton and Rachel MacKay.
This to fit into a bed complement of 36 + an
element of Ward 22 (PAA)
This to fit into a bed complement of 142. Ward 9 (30) + Ward 21 (30) + Ward 25 (30) + Ward 8 (30) + Stroke Unit (22)
Calendar Year 2014 / Four-hour compliance: 94.6%
St John’s Hospital / MEDICAL UNSCHEDULED CARE PATHWAYS
Calendar Year 2014: Boarding Levels
Ward
Ave no of beds occupied by medical
inpatients in 2014 Bed Complement Ave % bed occupancySJH08 28.9 30 96.4%SJH08A 0.3SJH09 28.8 30 96.0%SJH11 0.0SJH12 2.5SJH14 4.2SJH15 3.9SJH17 0.0SJH18 3.4SJH19A 1.9SJH21 29.1 30 96.9%SJH25 24.1 24 100.3%SJH25W 6.1 6 101.0%SJHBURNS 0.0SJHDIS 1.3SJHDOSA 0.0SJHDSC 0.1SJHEND 0.0SJHITU 0.0SJHOU 0.0SJHOW 1.6SJHREDU 0.0SJHSU 20.9 22 94.8%TOTAL 157.0 142.0 110.6%
Howfull?
Howlong?
How many?
Post AcuteWardsAssessmentA&E
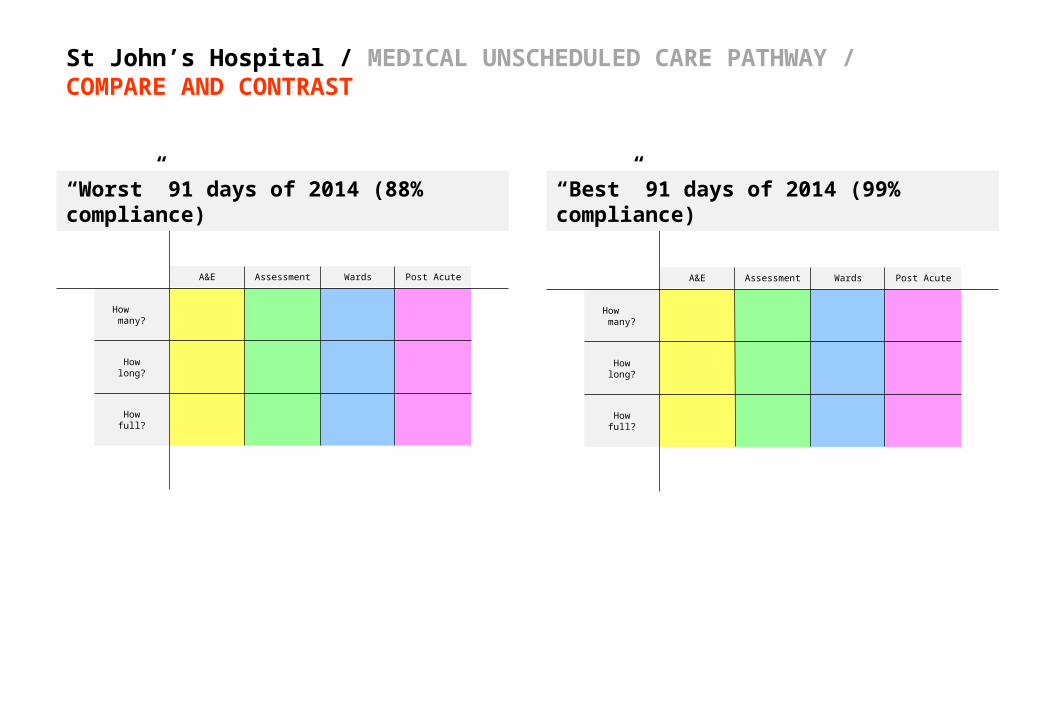
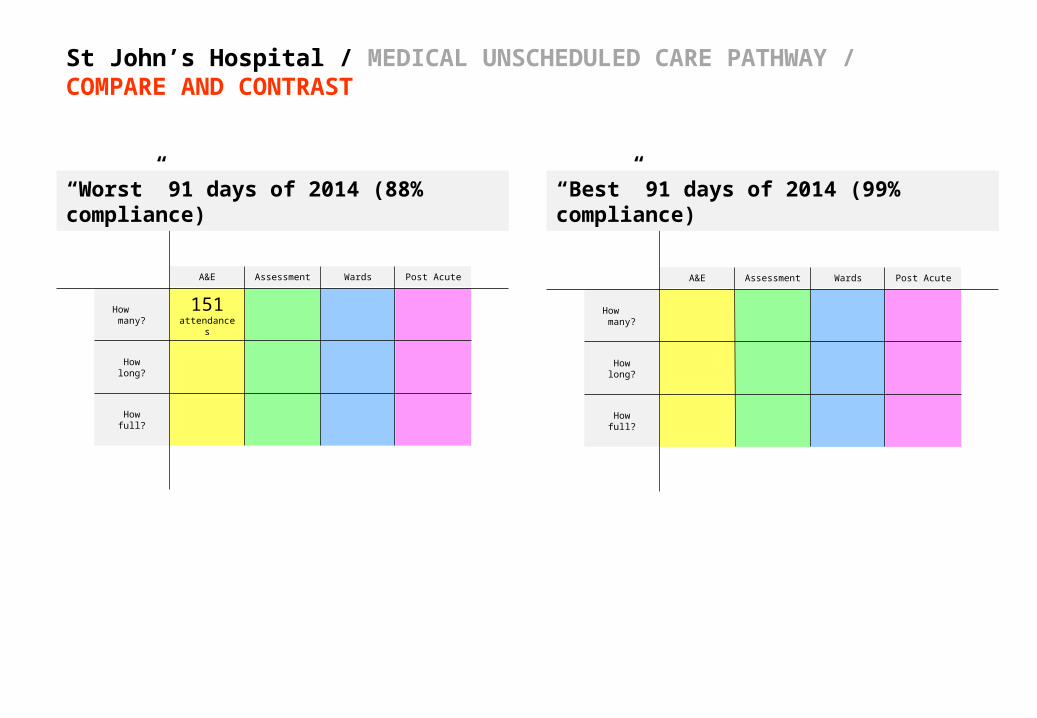
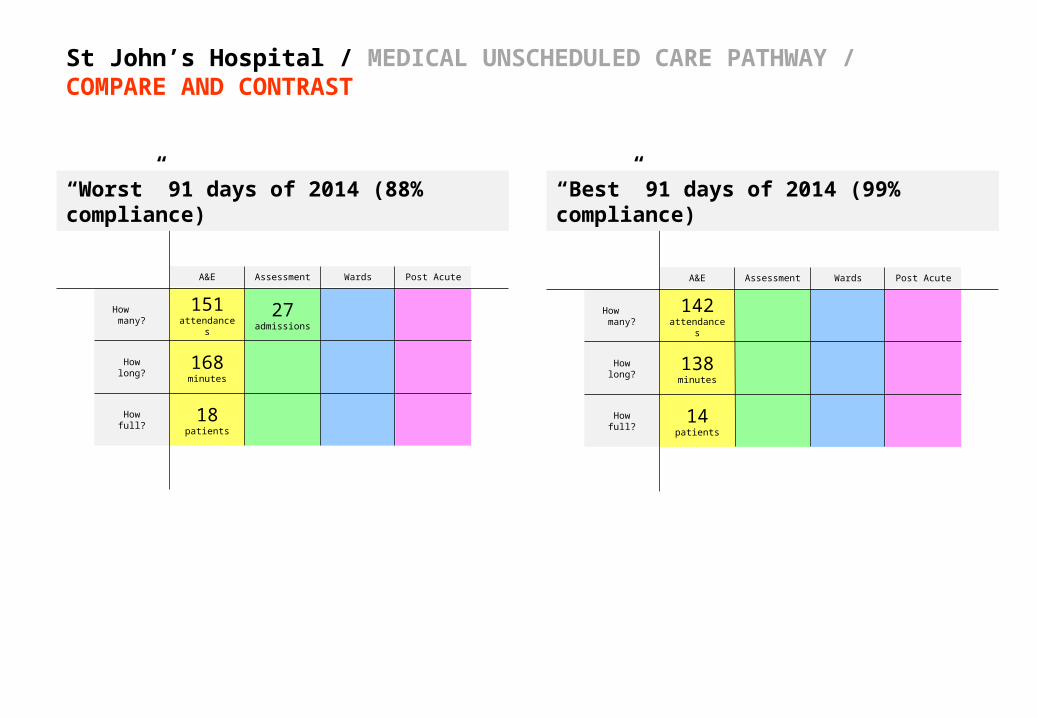
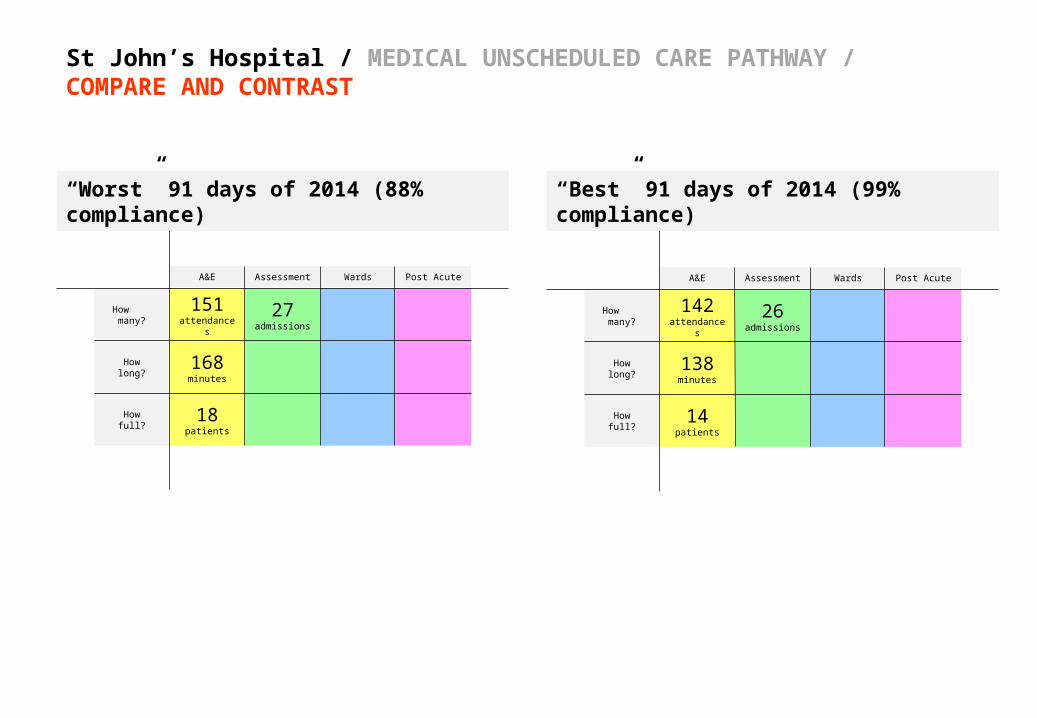
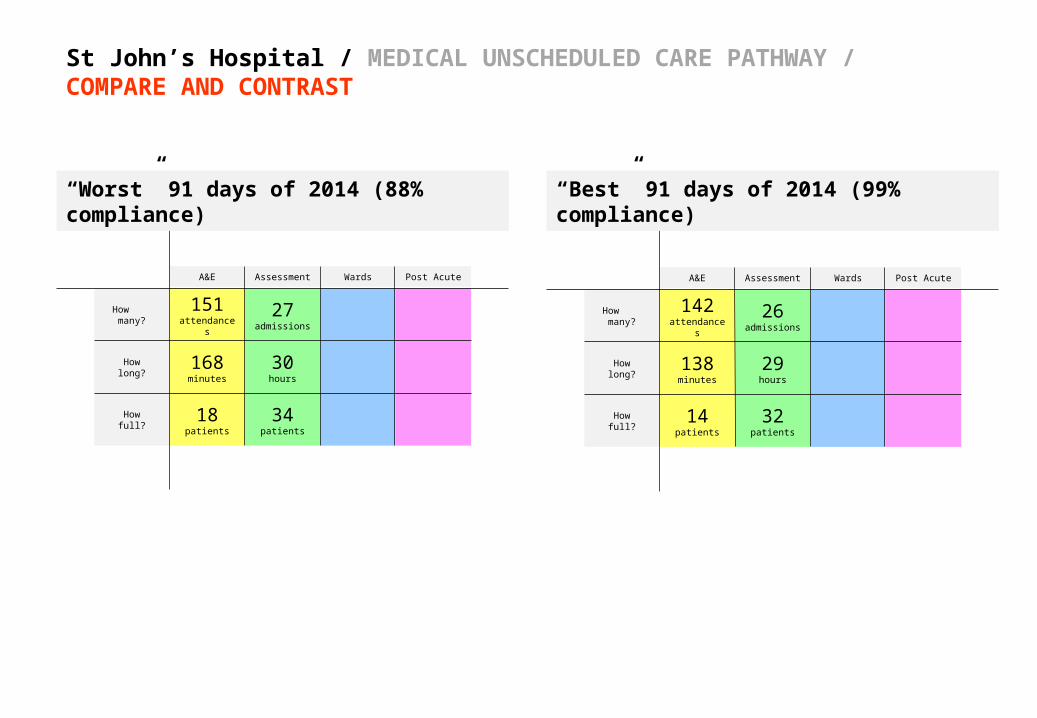
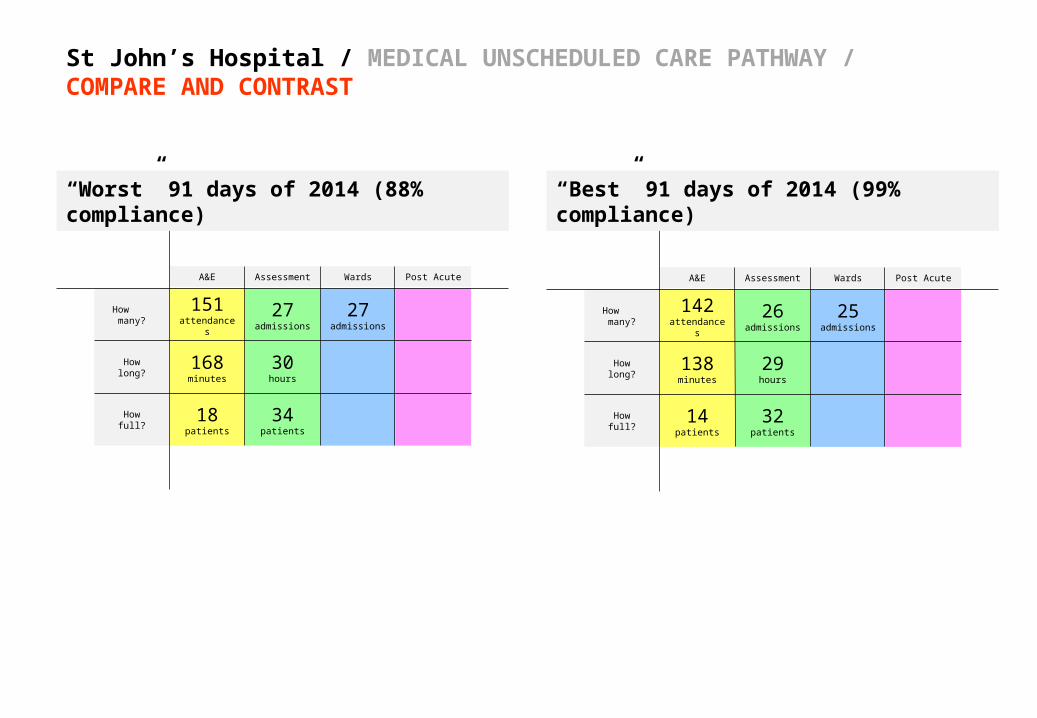
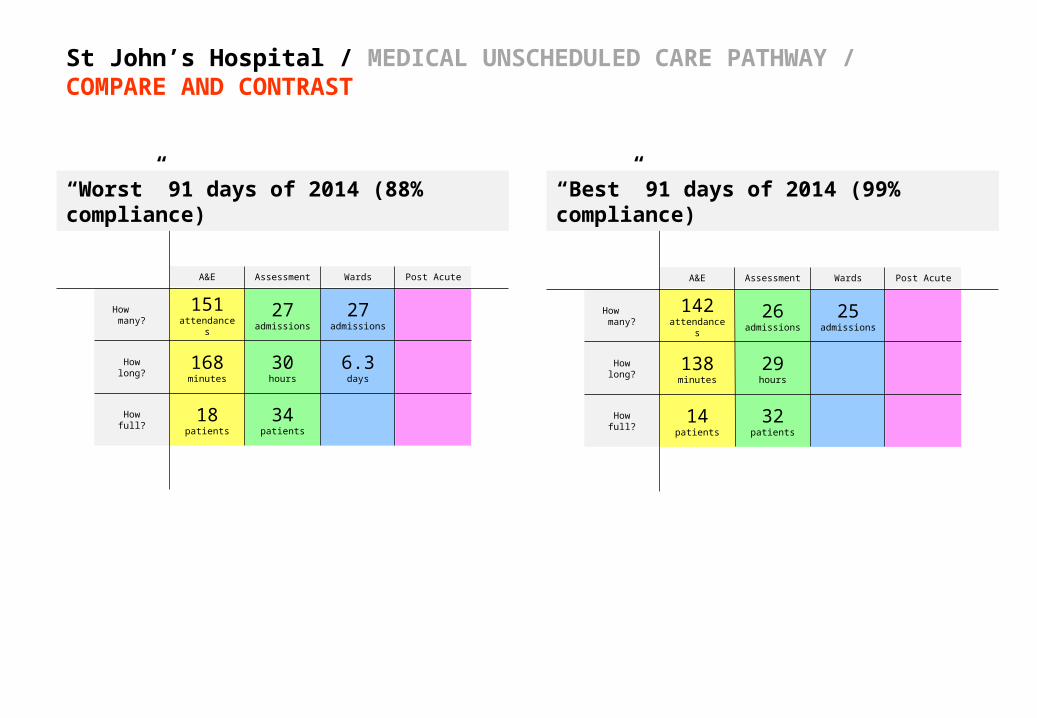
St John’s Hospital / MEDICAL UNSCHEDULED CARE PATHWAY / COMPARE AND CONTRAST
Howfull?
Howlong?
How many?
Post AcuteWardsAssessmentA&E
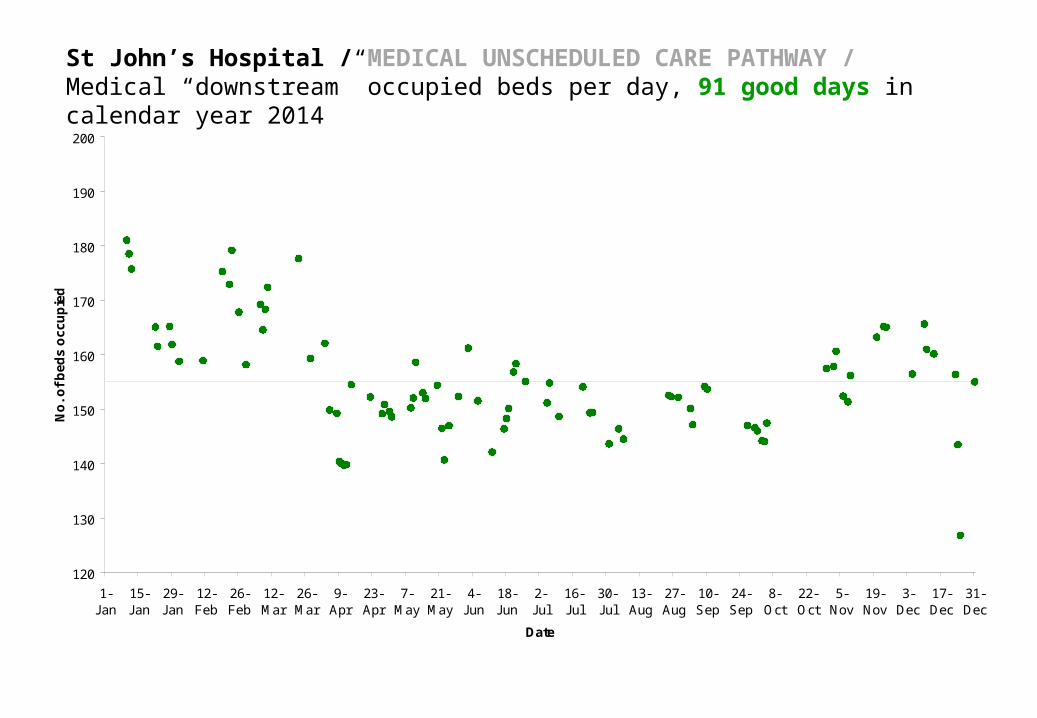
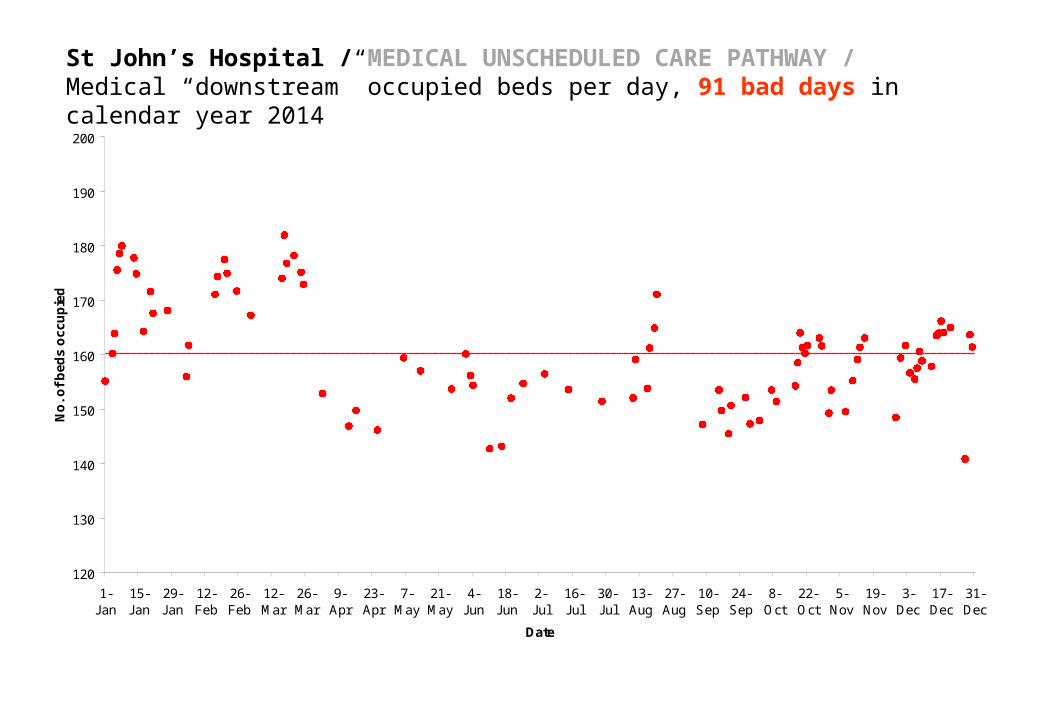
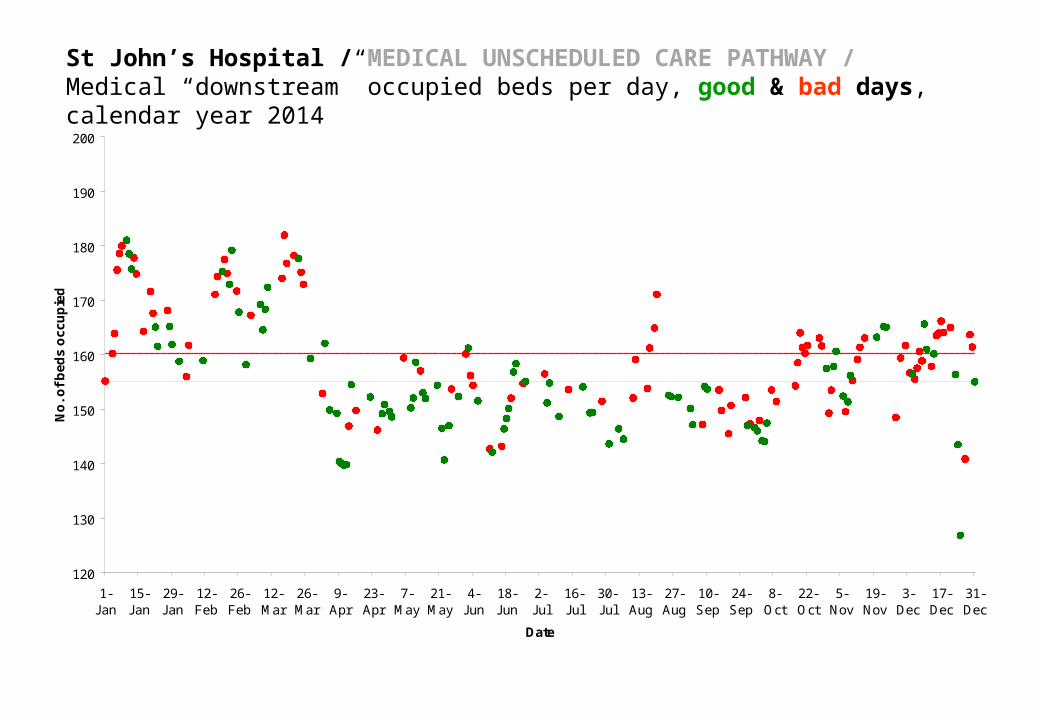
“Worst” 91 days of 2014 (88% compliance) “Best” 91 days of 2014 (99% compliance)
Howfull?
Howlong?
How many?
Post AcuteWardsAssessmentA&E
151attendances
St John’s Hospital / MEDICAL UNSCHEDULED CARE PATHWAY / COMPARE AND CONTRAST
Howfull?
Howlong?
How many?
Post AcuteWardsAssessmentA&E
“Worst” 91 days of 2014 (88% compliance) “Best” 91 days of 2014 (99% compliance)
Howfull?
Howlong?
How many?
Post AcuteWardsAssessmentA&E
151attendances
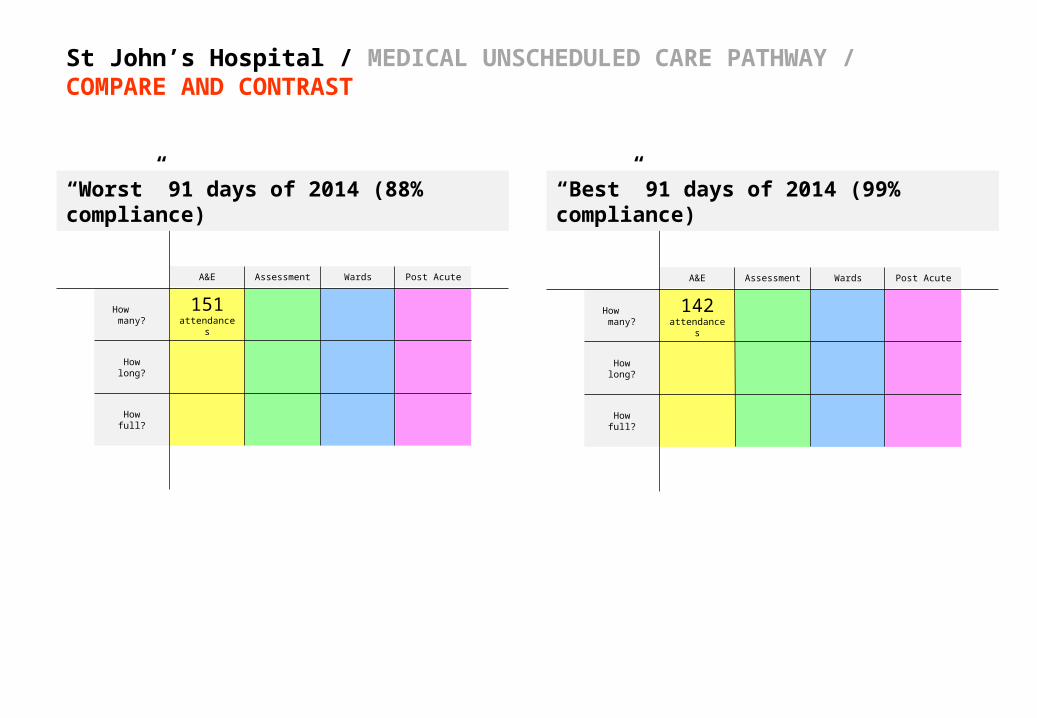
St John’s Hospital / MEDICAL UNSCHEDULED CARE PATHWAY / COMPARE AND CONTRAST
Howfull?
Howlong?
How many?
Post AcuteWardsAssessmentA&E
142attendances
“Worst” 91 days of 2014 (88% compliance) “Best” 91 days of 2014 (99% compliance)
Howfull?
Howlong?
How many?
Post AcuteWardsAssessmentA&E
168minutes
151attendances
St John’s Hospital / MEDICAL UNSCHEDULED CARE PATHWAY / COMPARE AND CONTRAST
Howfull?
Howlong?
How many?
Post AcuteWardsAssessmentA&E
142attendances
“Worst” 91 days of 2014 (88% compliance) “Best” 91 days of 2014 (99% compliance)

Howfull?
Howlong?
How many?
Post AcuteWardsAssessmentA&E
168minutes
151attendances
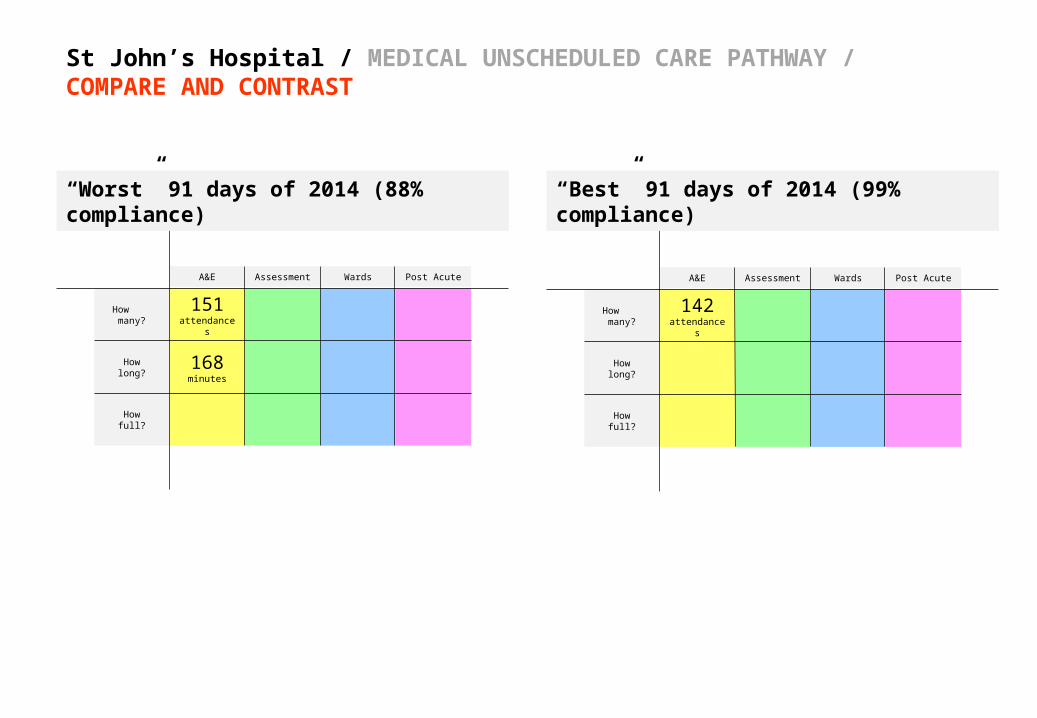
St John’s Hospital / MEDICAL UNSCHEDULED CARE PATHWAY / COMPARE AND CONTRAST
Howfull?
Howlong?
How many?
Post AcuteWardsAssessmentA&E
138minutes
142attendances
“Worst” 91 days of 2014 (88% compliance) “Best” 91 days of 2014 (99% compliance)
Howfull?
Howlong?
How many?
Post AcuteWardsAssessmentA&E
18patients
168minutes
151attendances
St John’s Hospital / MEDICAL UNSCHEDULED CARE PATHWAY / COMPARE AND CONTRAST
Howfull?
Howlong?
How many?
Post AcuteWardsAssessmentA&E
138minutes
142attendances
“Worst” 91 days of 2014 (88% compliance) “Best” 91 days of 2014 (99% compliance)

Howfull?
Howlong?
How many?
Post AcuteWardsAssessmentA&E
18patients
168minutes
151attendances
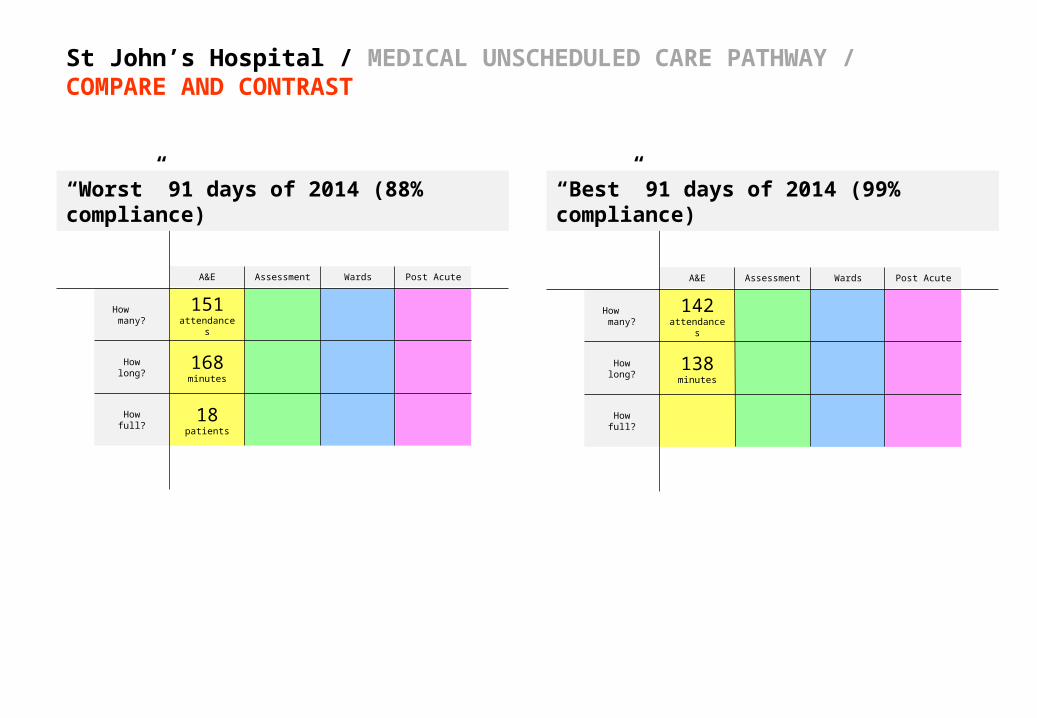
St John’s Hospital / MEDICAL UNSCHEDULED CARE PATHWAY / COMPARE AND CONTRAST
Howfull?
Howlong?
How many?
Post AcuteWardsAssessmentA&E
14patients
138minutes
142attendances
“Worst” 91 days of 2014 (88% compliance) “Best” 91 days of 2014 (99% compliance)
Howfull?
Howlong?
How many?
Post AcuteWardsAssessmentA&E
18patients
168minutes
27admissions
151attendances
St John’s Hospital / MEDICAL UNSCHEDULED CARE PATHWAY / COMPARE AND CONTRAST
Howfull?
Howlong?
How many?
Post AcuteWardsAssessmentA&E
14patients
138minutes
26admissions
142attendances
“Worst” 91 days of 2014 (88% compliance) “Best” 91 days of 2014 (99% compliance)

Howfull?
Howlong?
How many?
Post AcuteWardsAssessmentA&E
18patients
168minutes
27admissions
151attendances
30hours
St John’s Hospital / MEDICAL UNSCHEDULED CARE PATHWAY / COMPARE AND CONTRAST
Howfull?
Howlong?
How many?
Post AcuteWardsAssessmentA&E
14patients
138minutes
26admissions
142attendances
29hours
“Worst” 91 days of 2014 (88% compliance) “Best” 91 days of 2014 (99% compliance)

Howfull?
Howlong?
How many?
Post AcuteWardsAssessmentA&E
18patients
168minutes
27admissions
151attendances
30hours
34patients
St John’s Hospital / MEDICAL UNSCHEDULED CARE PATHWAY / COMPARE AND CONTRAST
Howfull?
Howlong?
How many?
Post AcuteWardsAssessmentA&E
14patients
138minutes
26admissions
142attendances
29hours
“Worst” 91 days of 2014 (88% compliance) “Best” 91 days of 2014 (99% compliance)
Howfull?
Howlong?
How many?
Post AcuteWardsAssessmentA&E
18patients
168minutes
27admissions
151attendances
30hours
34patients
St John’s Hospital / MEDICAL UNSCHEDULED CARE PATHWAY / COMPARE AND CONTRAST
Howfull?
Howlong?
How many?
Post AcuteWardsAssessmentA&E
14patients
138minutes
26admissions
142attendances
29hours
32patients
“Worst” 91 days of 2014 (88% compliance) “Best” 91 days of 2014 (99% compliance)

Howfull?
Howlong?
How many?
Post AcuteWardsAssessmentA&E
18patients
168minutes
27admissions
27admissions
151attendances
30hours
34patients
St John’s Hospital / MEDICAL UNSCHEDULED CARE PATHWAY / COMPARE AND CONTRAST
Howfull?
Howlong?
How many?
Post AcuteWardsAssessmentA&E
14patients
138minutes
26admissions
142attendances
29hours
32patients
“Worst” 91 days of 2014 (88% compliance) “Best” 91 days of 2014 (99% compliance)
Howfull?
Howlong?
How many?
Post AcuteWardsAssessmentA&E
18patients
168minutes
27admissions
27admissions
151attendances
30hours
34patients
St John’s Hospital / MEDICAL UNSCHEDULED CARE PATHWAY / COMPARE AND CONTRAST
Howfull?
Howlong?
How many?
Post AcuteWardsAssessmentA&E
14patients
138minutes
25admissions
26admissions
142attendances
29hours
32patients
“Worst” 91 days of 2014 (88% compliance) “Best” 91 days of 2014 (99% compliance)
Howfull?
Howlong?
How many?
Post AcuteWardsAssessmentA&E
18patients
168minutes
27admissions
27admissions
151attendances
6.3days
30hours
34patients
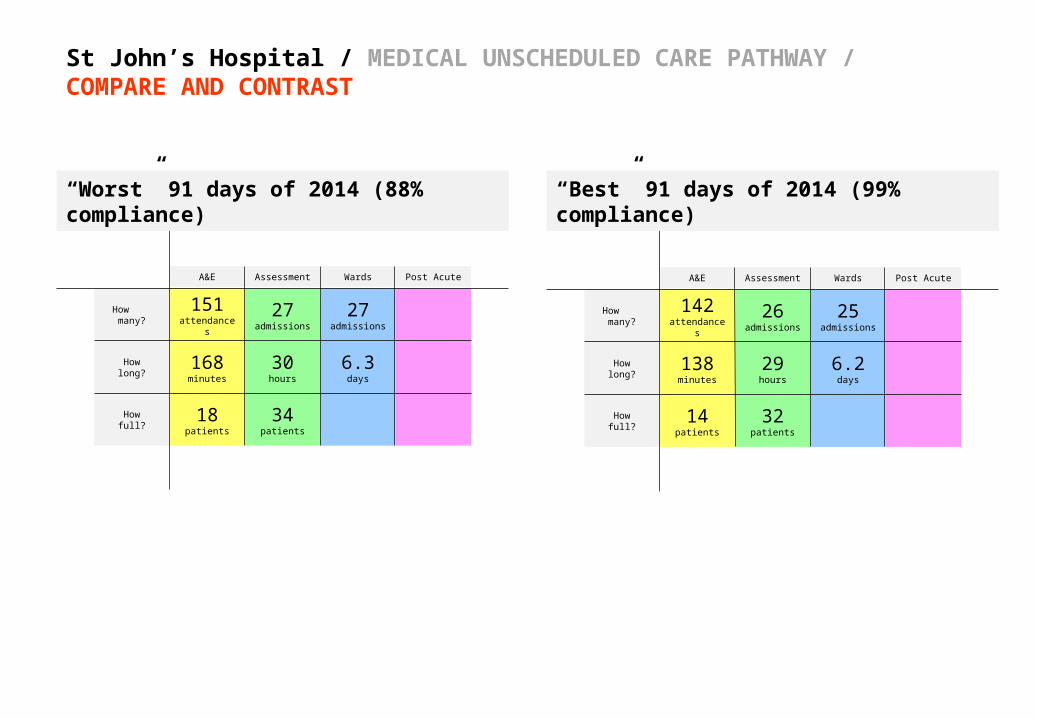
St John’s Hospital / MEDICAL UNSCHEDULED CARE PATHWAY / COMPARE AND CONTRAST
Howfull?
Howlong?
How many?
Post AcuteWardsAssessmentA&E
14patients
138minutes
25admissions
26admissions
142attendances
6.2days
29hours
32patients
“Worst” 91 days of 2014 (88% compliance) “Best” 91 days of 2014 (99% compliance)
Howfull?
Howlong?
How many?
Post AcuteWardsAssessmentA&E
18patients
168minutes
27admissions
27admissions
151attendances
6.3days
30hours
160patients
34patients
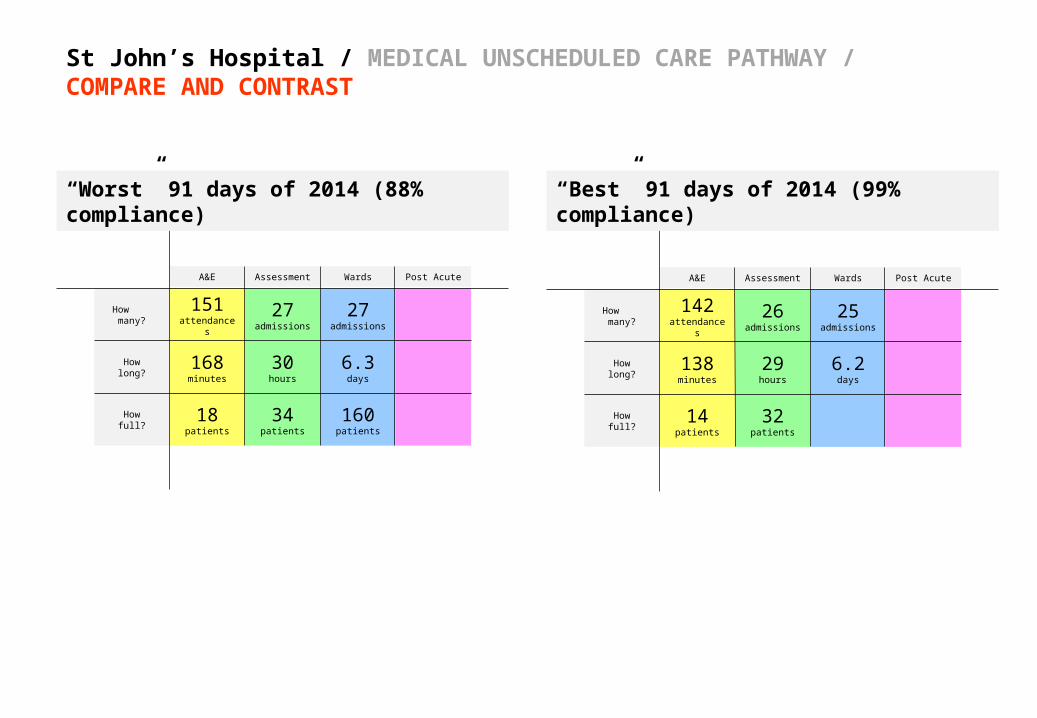
St John’s Hospital / MEDICAL UNSCHEDULED CARE PATHWAY / COMPARE AND CONTRAST
Howfull?
Howlong?
How many?
Post AcuteWardsAssessmentA&E
14patients
138minutes
25admissions
26admissions
142attendances
6.2days
29hours
32patients
“Worst” 91 days of 2014 (88% compliance) “Best” 91 days of 2014 (99% compliance)
Howfull?
Howlong?
How many?
Post AcuteWardsAssessmentA&E
18patients
168minutes
27admissions
27admissions
151attendances
6.3days
30hours
160patients
34patients
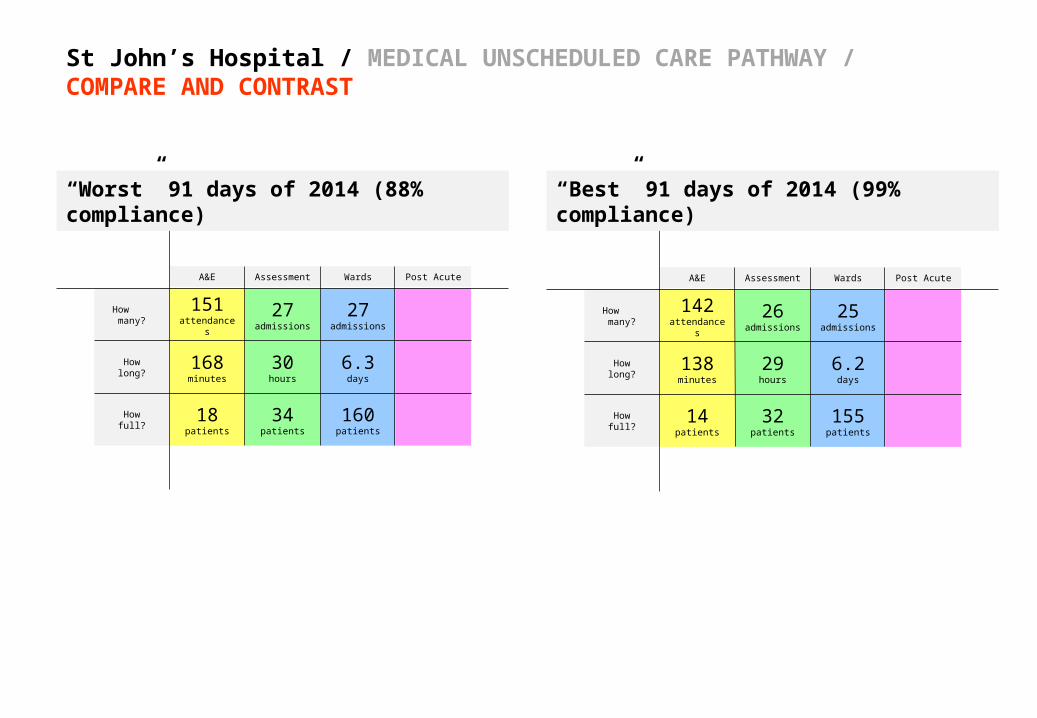
St John’s Hospital / MEDICAL UNSCHEDULED CARE PATHWAY / COMPARE AND CONTRAST
Howfull?
Howlong?
How many?
Post AcuteWardsAssessmentA&E
14patients
138minutes
25admissions
26admissions
142attendances
6.2days
29hours
155patients
32patients
“Worst” 91 days of 2014 (88% compliance) “Best” 91 days of 2014 (99% compliance)
NHS LOTHIAN | ST JOHN'S HOSPITAL | CALENDAR YEAR 2014
120
130
140
150
160
170
180
190
200
1-Jan
15-Jan
29-Jan
12-Feb
26-Feb
12-Mar
26-Mar
9-Apr
23-Apr
7-May
21-May
4-Jun
18-Jun
2-Jul
16-Jul
30-Jul
13-Aug
27-Aug
10-Sep
24-Sep
8-Oct
22-Oct
5-Nov
19-Nov
3-Dec
17-Dec
31-Dec
Date
No
. of
bed
s o
ccu
pie
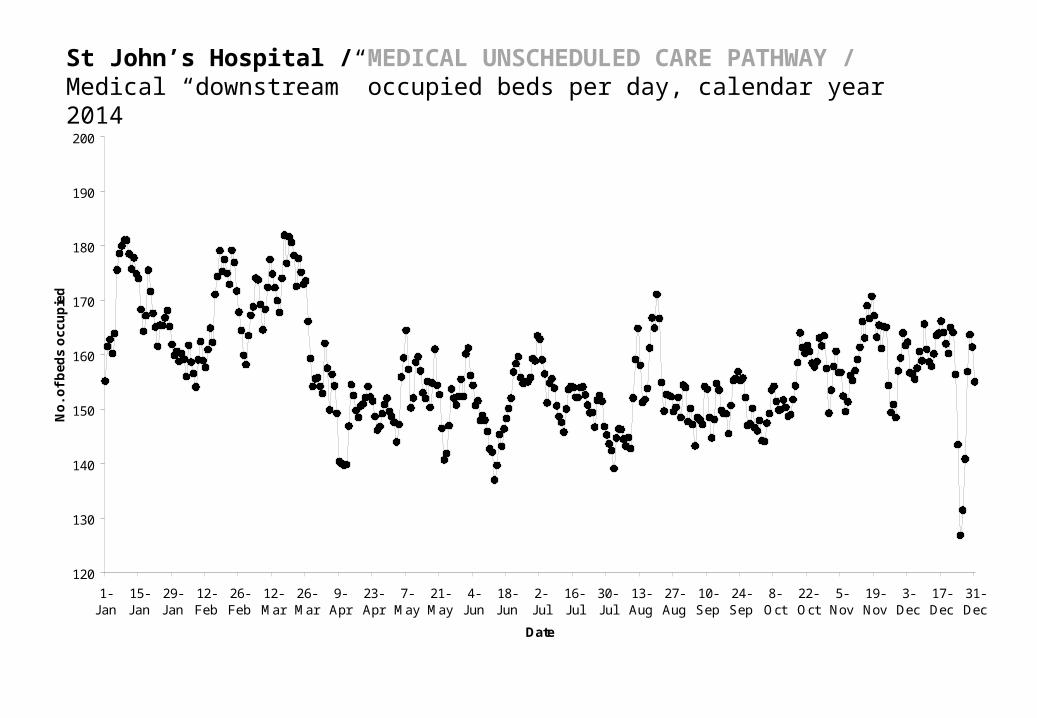
dSt John’s Hospital / MEDICAL UNSCHEDULED CARE PATHWAY / Medical “downstream” occupied beds per day, calendar year 2014
NHS LOTHIAN | ST JOHN'S HOSPITAL | CALENDAR YEAR 2014
120
130
140
150
160
170
180
190
200
1-Jan
15-Jan
29-Jan
12-Feb
26-Feb
12-Mar
26-Mar
9-Apr
23-Apr
7-May
21-May
4-Jun
18-Jun
2-Jul
16-Jul
30-Jul
13-Aug
27-Aug
10-Sep
24-Sep
8-Oct
22-Oct
5-Nov
19-Nov
3-Dec
17-Dec
31-Dec
Date
No
. of
bed
s o
ccu
pie
dSt John’s Hospital / MEDICAL UNSCHEDULED CARE PATHWAY / Medical “downstream” occupied beds per day, 91 good days in calendar year 2014
NHS LOTHIAN | ST JOHN'S HOSPITAL | CALENDAR YEAR 2014
120
130
140
150
160
170
180
190
200
1-Jan
15-Jan
29-Jan
12-Feb
26-Feb
12-Mar
26-Mar
9-Apr
23-Apr
7-May
21-May
4-Jun
18-Jun
2-Jul
16-Jul
30-Jul
13-Aug
27-Aug
10-Sep
24-Sep
8-Oct
22-Oct
5-Nov
19-Nov
3-Dec
17-Dec
31-Dec
Date
No
. of
bed
s o
ccu
pie
dSt John’s Hospital / MEDICAL UNSCHEDULED CARE PATHWAY / Medical “downstream” occupied beds per day, 91 bad days in calendar year 2014
NHS LOTHIAN | ST JOHN'S HOSPITAL | CALENDAR YEAR 2014
120
130
140
150
160
170
180
190
200
1-Jan
15-Jan
29-Jan
12-Feb
26-Feb
12-Mar
26-Mar
9-Apr
23-Apr
7-May
21-May
4-Jun
18-Jun
2-Jul
16-Jul
30-Jul
13-Aug
27-Aug
10-Sep
24-Sep
8-Oct
22-Oct
5-Nov
19-Nov
3-Dec
17-Dec
31-Dec
Date
No
. of
bed
s o
ccu
pie
dSt John’s Hospital / MEDICAL UNSCHEDULED CARE PATHWAY / Medical “downstream” occupied beds per day, good & bad days, calendar year 2014
Howfull?
Howlong?
How many?
HomecareWardsAssessmentA&E
155patients
St John’s Hospital / MEDICAL UNSCHEDULED CARE PATHWAYS
Calendar Year 2014 Notes
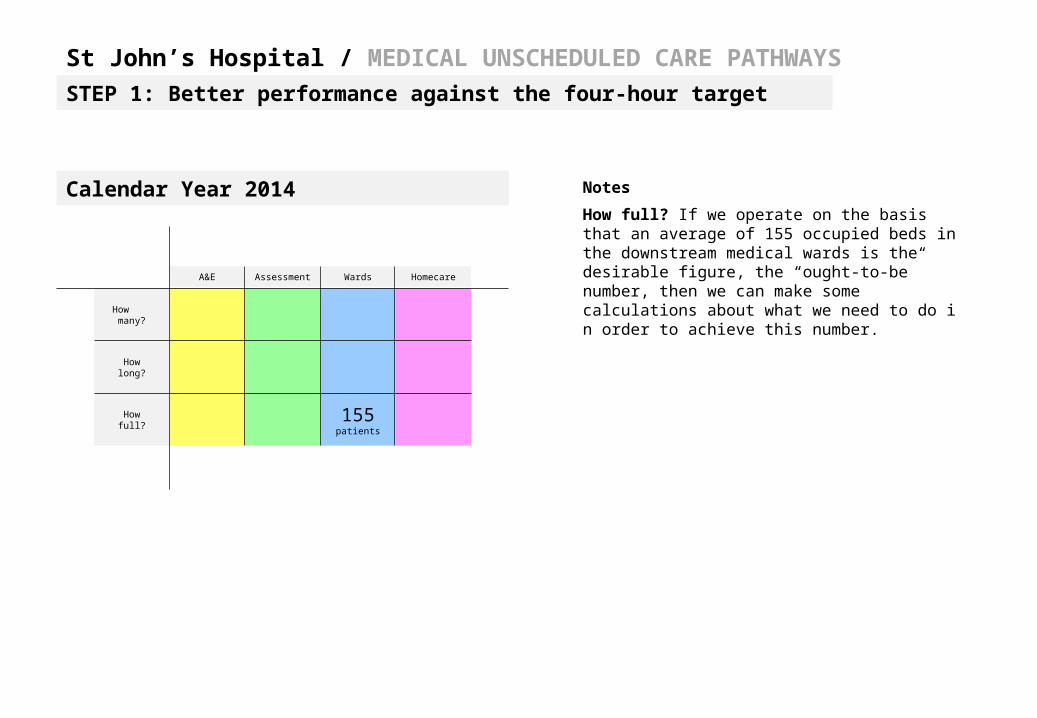
How full? If we operate on the basis that an average of 155 occupied beds in the downstream medical wards is the desirable figure, the “ought-to-be” number, then we can make some calculations about what we need to do i n order to achieve this number.
STEP 1: Better performance against the four-hour target
Howfull?
Howlong?
How many?
HomecareWardsAssessmentA&E
26admissions
155patients
St John’s Hospital / MEDICAL UNSCHEDULED CARE PATHWAYS
Calendar Year 2014 Notes
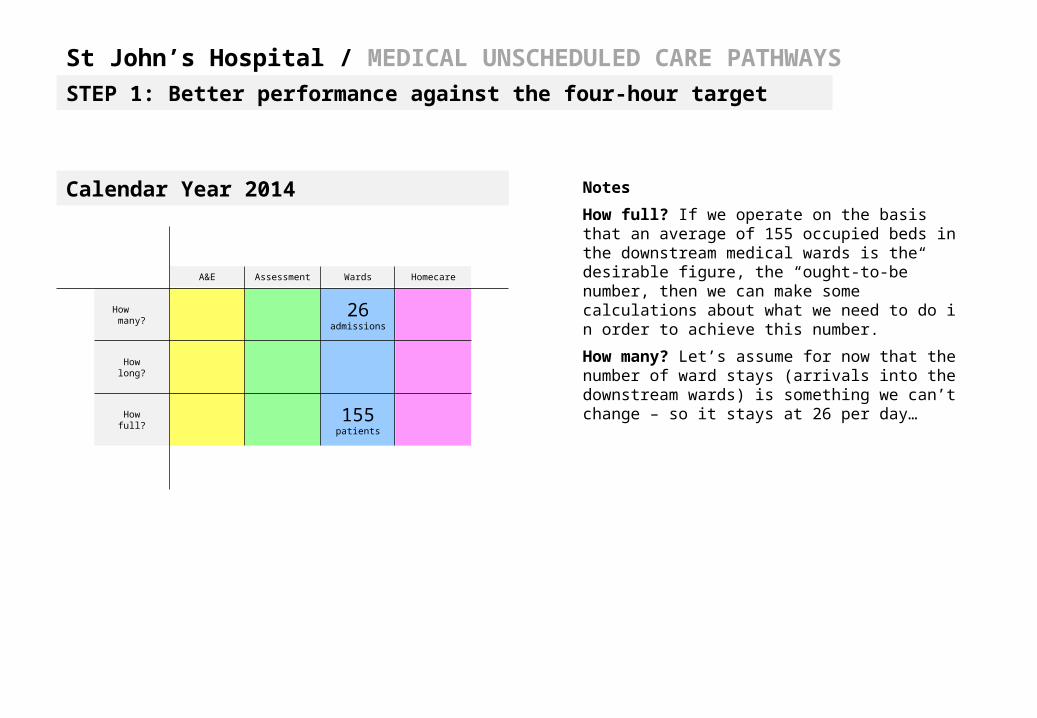
How full? If we operate on the basis that an average of 155 occupied beds in the downstream medical wards is the desirable figure, the “ought-to-be” number, then we can make some calculations about what we need to do i n order to achieve this number.
How many? Let’s assume for now that the number of ward stays (arrivals into the downstream wards) is something we can’t change – so it stays at 26 per day…
STEP 1: Better performance against the four-hour target
Howfull?
Howlong?
How many?
HomecareWardsAssessmentA&E
26admissions
6.0days
155patients
St John’s Hospital / MEDICAL UNSCHEDULED CARE PATHWAYS
Calendar Year 2014 Notes
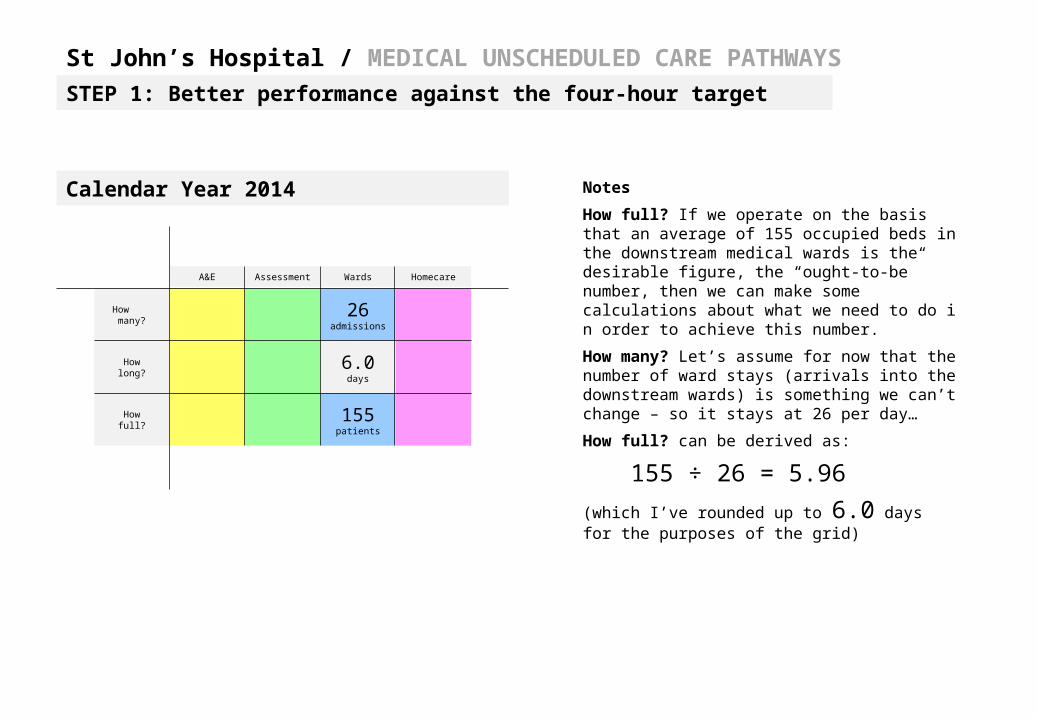
How full? If we operate on the basis that an average of 155 occupied beds in the downstream medical wards is the desirable figure, the “ought-to-be” number, then we can make some calculations about what we need to do i n order to achieve this number.
How many? Let’s assume for now that the number of ward stays (arrivals into the downstream wards) is something we can’t change – so it stays at 26 per day…
How full? can be derived as:
155 ÷ 26 = 5.96
(which I’ve rounded up to 6.0 days for the purposes of the grid)
STEP 1: Better performance against the four-hour target
Howfull?
Howlong?
How many?
HomecareWardsAssessmentA&E
26admissions
6.0days
155patients
St John’s Hospital / MEDICAL UNSCHEDULED CARE PATHWAYS
Calendar Year 2014 Notes
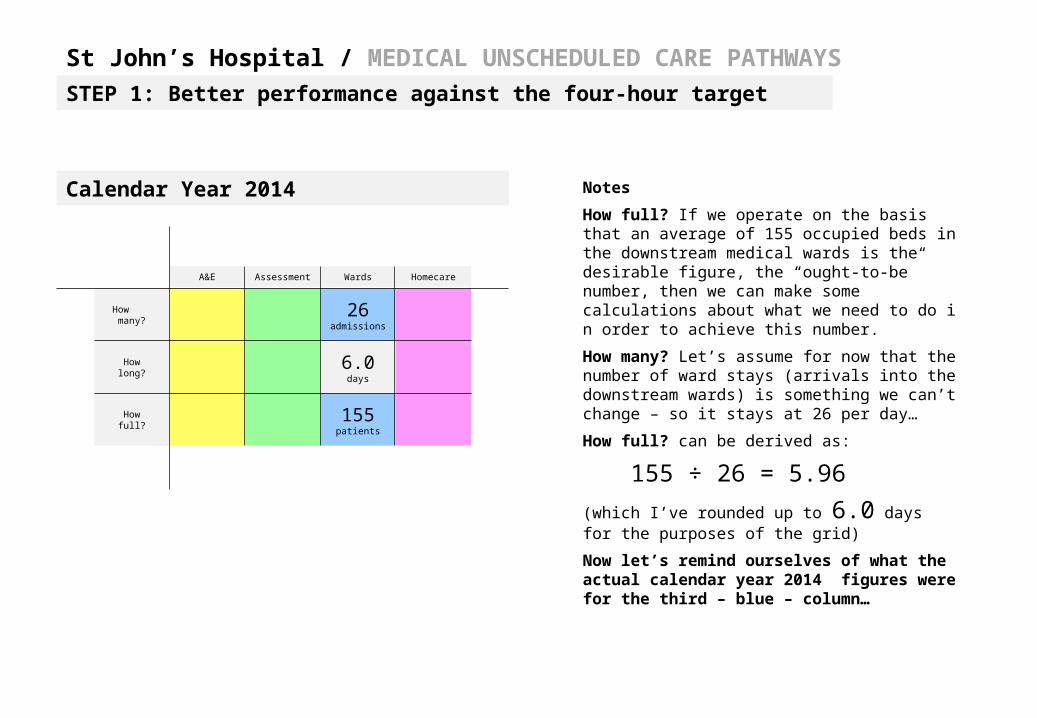
How full? If we operate on the basis that an average of 155 occupied beds in the downstream medical wards is the desirable figure, the “ought-to-be” number, then we can make some calculations about what we need to do i n order to achieve this number.
How many? Let’s assume for now that the number of ward stays (arrivals into the downstream wards) is something we can’t change – so it stays at 26 per day…
How full? can be derived as:
155 ÷ 26 = 5.96
(which I’ve rounded up to 6.0 days for the purposes of the grid)
Now let’s remind ourselves of what the actual calendar year 2014 figures were for the third – blue – column…
STEP 1: Better performance against the four-hour target
Howfull?
Howlong?
How many?
HomecareWardsAssessmentA&E
15patients
151minutes
26admissions
26admissions
148attendances
6.1days
29hours
157patients
33patients
St John’s Hospital / MEDICAL UNSCHEDULED CARE PATHWAYS
Calendar Year 2014 Notes
A&E data comprises all arrivals during calendar year 2014 (n = 53,823). Average no. of attendances per day, average time in dept each day, average no. of people in dept at any one time (based on averages of 24 snapshots per day).
Assessment data comprises all inpatient ward stays in Wards 22 (PAA) and MAU during calendar year 2014 (n = 9,536). Average no. of ward stays per day, average length of ward stay, average no. of beds occupied at any one time (recognising that the inpatient beds in Wards 22 are not used all the time).
Ward data comprises all inpatient ward stays (excluding those in Wards 22 and MAU) that were attributed to the specialties of CA, GA, GI, GM, HA, RESP or STROKEM during calendar year 2014 (n = 9,337). Average no. of ward stays per day, average length of ward stay, average no. of beds occupied at any one time.This to fit into a bed
complement of 36 + an element of Ward 22 (PAA)
This to fit into a bed complement of 142. Ward 9 (30) + Ward 21 (30) + Ward 25 (30) + Ward 8 (30) + Stroke Unit (22)
STEP 1: Better performance against the four-hour target
Howfull?
Howlong?
How many?
HomecareWardsAssessmentA&E
26admissions
6.0days
155patients
St John’s Hospital / MEDICAL UNSCHEDULED CARE PATHWAYS
Calendar Year 2014 Notes
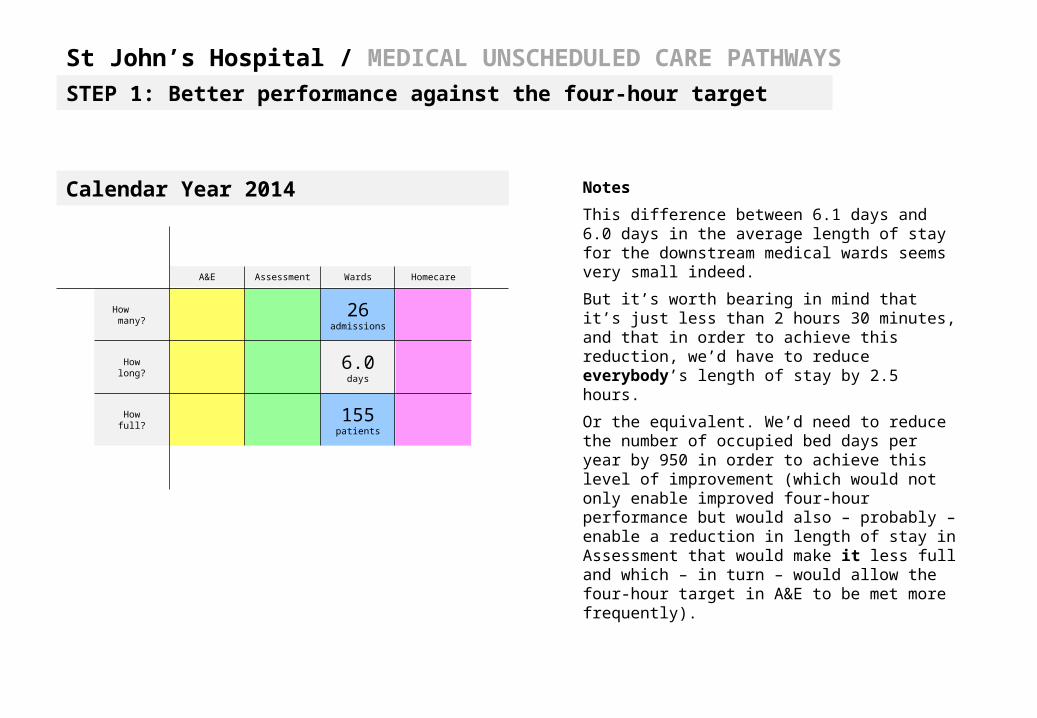
This difference between 6.1 days and 6.0 days in the average length of stay for the downstream medical wards seems very small indeed.
But it’s worth bearing in mind that it’s just less than 2 hours 30 minutes, and that in order to achieve this reduction, we’d have to reduce everybody’s length of stay by 2.5 hours.
Or the equivalent. We’d need to reduce the number of occupied bed days per year by 950 in order to achieve this level of improvement (which would not only enable improved four-hour performance but would also – probably – enable a reduction in length of stay in Assessment that would make it less full and which – in turn – would allow the four-hour target in A&E to be met more frequently).
STEP 1: Better performance against the four-hour target
Howfull?
Howlong?
How many?
HomecareWardsAssessmentA&E
26admissions
6.0days
155patients
St John’s Hospital / MEDICAL UNSCHEDULED CARE PATHWAYS
Calendar Year 2014 Notes
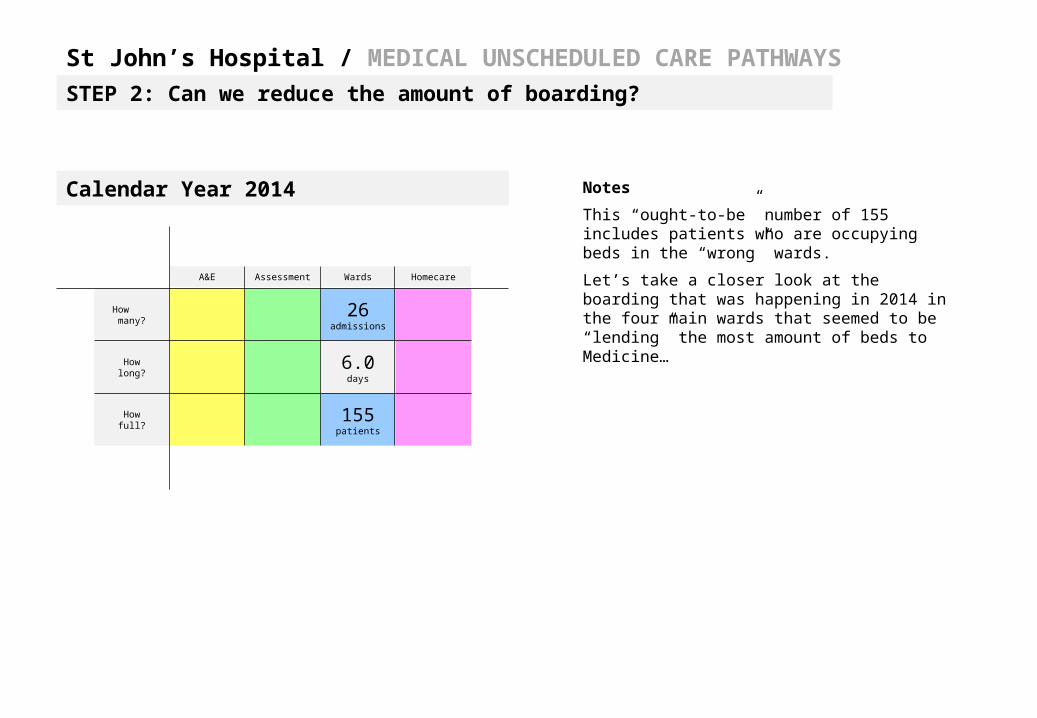
This “ought-to-be” number of 155 includes patients who are occupying beds in the “wrong” wards.
Let’s take a closer look at the boarding that was happening in 2014 in the four main wards that seemed to be “lending” the most amount of beds to Medicine…
STEP 2: Can we reduce the amount of boarding?
St John’s Hospital / MEDICAL UNSCHEDULED CARE PATHWAYS
Calendar Year 2014 Notes
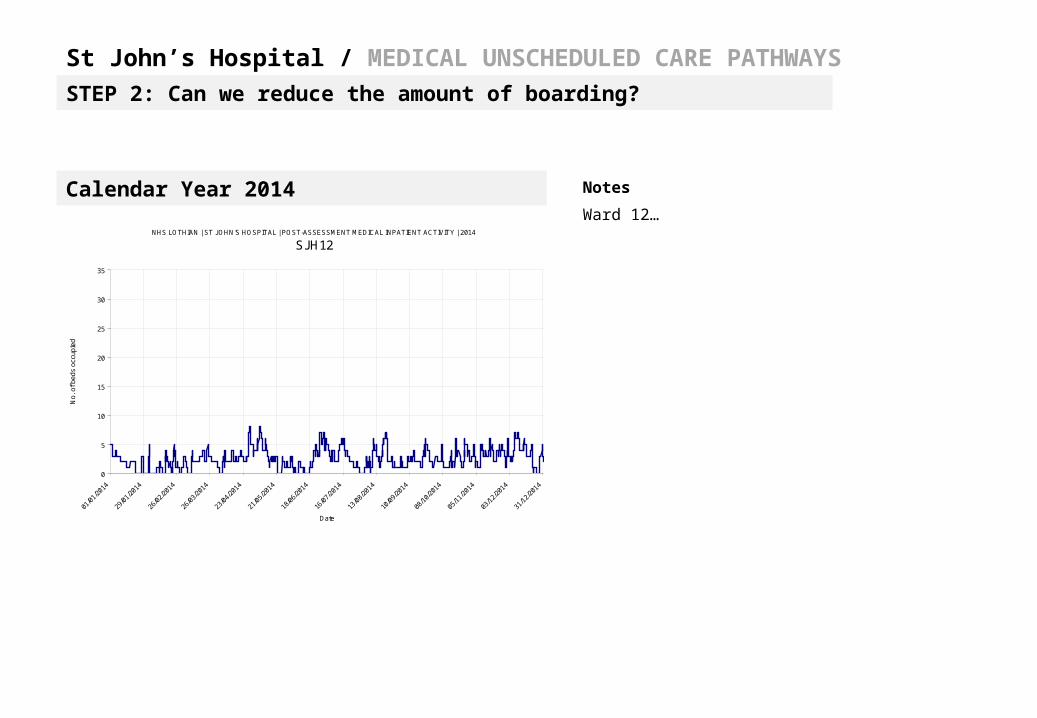
Ward 12…
STEP 2: Can we reduce the amount of boarding?
NHS LOTHIAN | ST JOHN'S HOSPITAL | POST-ASSESSMENT MEDICAL INPATIENT ACTIVITY | 2014
SJH12
0
5
10
15
20
25
30
35
01/0
1/20
14
29/0
1/20
14
26/0
2/20
14
26/0
3/20
14
23/0
4/20
14
21/0
5/20
14
18/0
6/20
14
16/0
7/20
14
13/0
8/20
14
10/0
9/20
14
08/1
0/20
14
05/1
1/20
14
03/1
2/20
14
31/1
2/20
14
Date
No.
of b
eds
occu
pied
St John’s Hospital / MEDICAL UNSCHEDULED CARE PATHWAYS
Calendar Year 2014 Notes
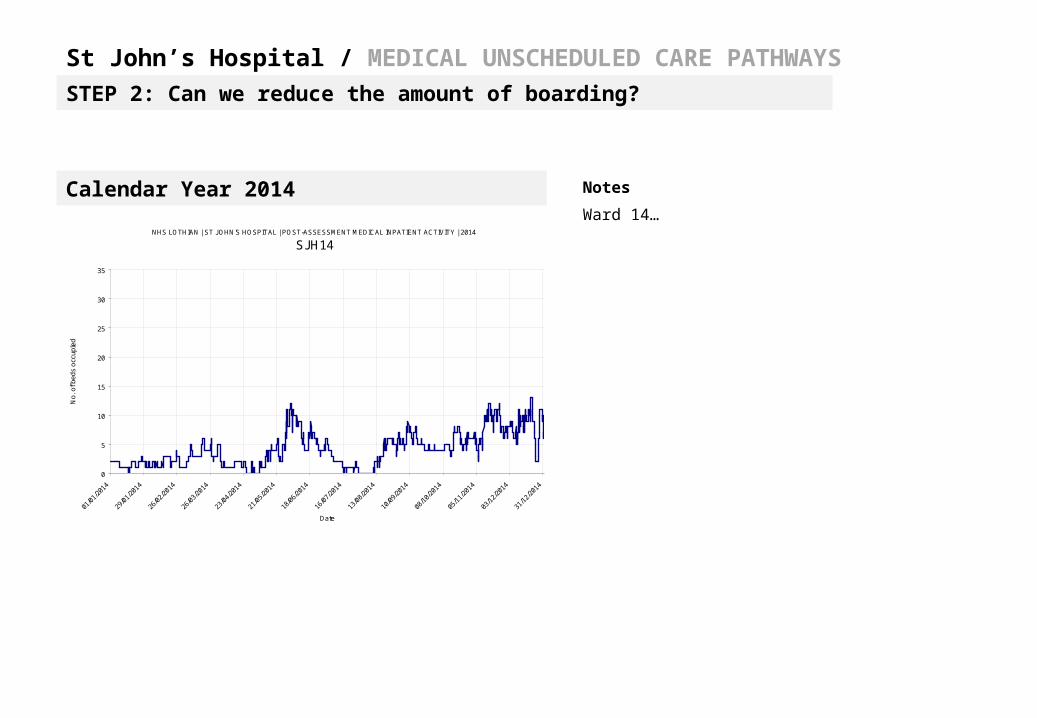
Ward 14…
STEP 2: Can we reduce the amount of boarding?
NHS LOTHIAN | ST JOHN'S HOSPITAL | POST-ASSESSMENT MEDICAL INPATIENT ACTIVITY | 2014
SJH14
0
5
10
15
20
25
30
35
01/0
1/20
14
29/0
1/20
14
26/0
2/20
14
26/0
3/20
14
23/0
4/20
14
21/0
5/20
14
18/0
6/20
14
16/0
7/20
14
13/0
8/20
14
10/0
9/20
14
08/1
0/20
14
05/1
1/20
14
03/1
2/20
14
31/1
2/20
14
Date
No
. o
f b
ed
s o
ccu
pie
d
St John’s Hospital / MEDICAL UNSCHEDULED CARE PATHWAYS
Calendar Year 2014 Notes
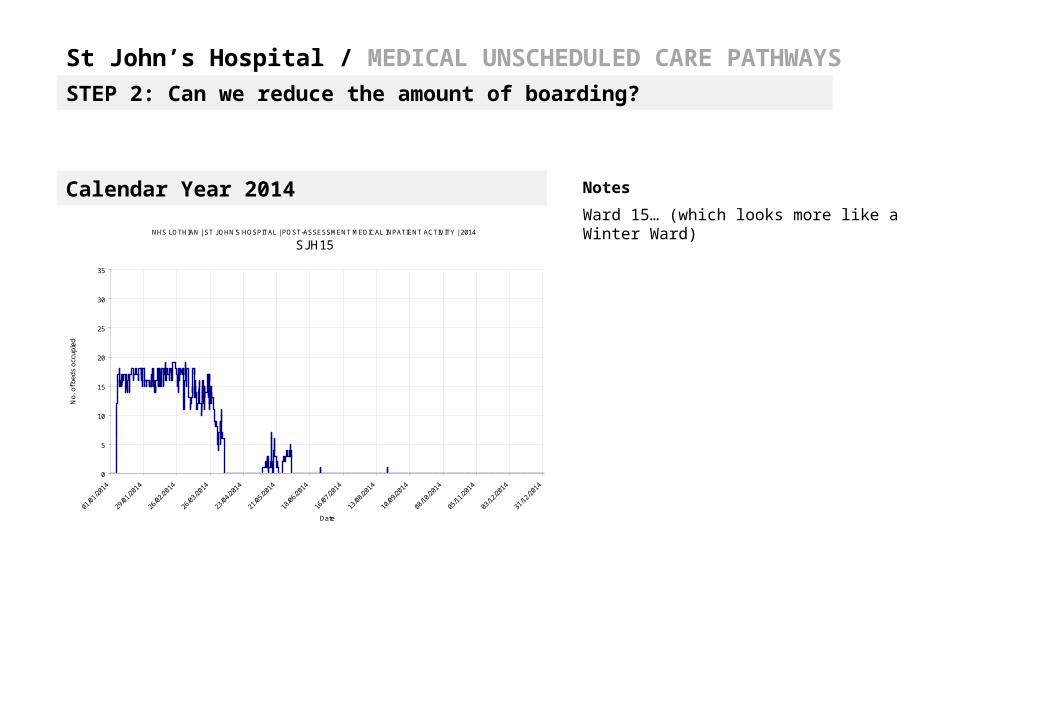
Ward 15… (which looks more like a Winter Ward)
STEP 2: Can we reduce the amount of boarding?
NHS LOTHIAN | ST JOHN'S HOSPITAL | POST-ASSESSMENT MEDICAL INPATIENT ACTIVITY | 2014
SJH15
0
5
10
15
20
25
30
35
01/0
1/20
14
29/0
1/20
14
26/0
2/20
14
26/0
3/20
14
23/0
4/20
14
21/0
5/20
14
18/0
6/20
14
16/0
7/20
14
13/0
8/20
14
10/0
9/20
14
08/1
0/20
14
05/1
1/20
14
03/1
2/20
14
31/1
2/20
14
Date
No
. o
f b
ed
s o
ccu
pie
d
St John’s Hospital / MEDICAL UNSCHEDULED CARE PATHWAYS
Calendar Year 2014 Notes
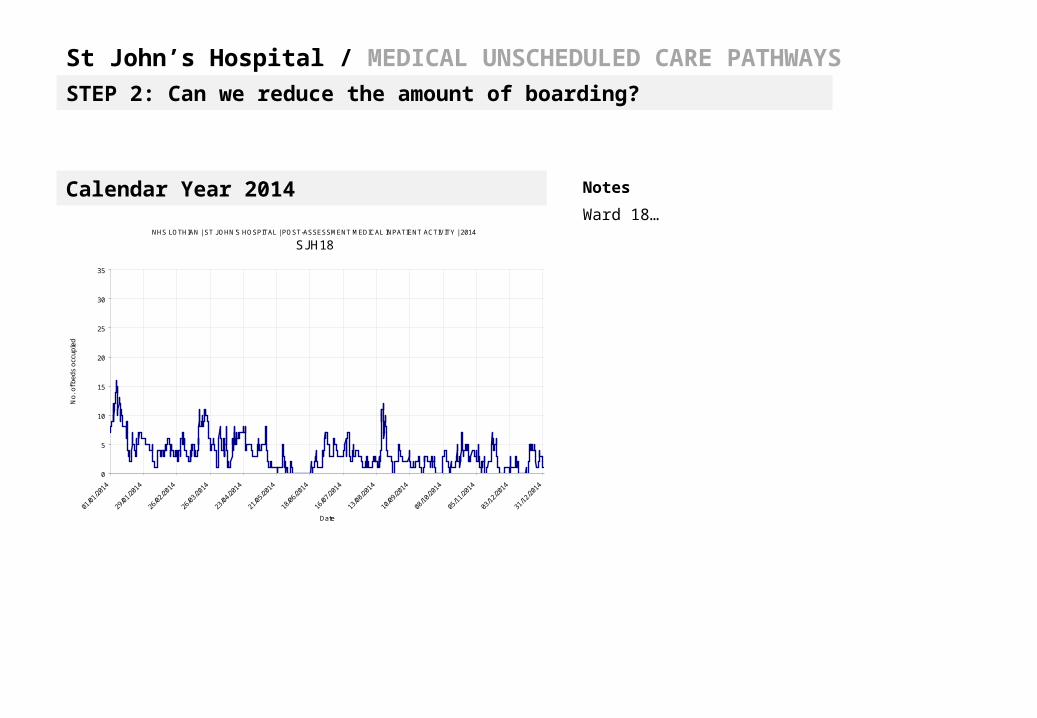
Ward 18…
STEP 2: Can we reduce the amount of boarding?
NHS LOTHIAN | ST JOHN'S HOSPITAL | POST-ASSESSMENT MEDICAL INPATIENT ACTIVITY | 2014
SJH18
0
5
10
15
20
25
30
35
01/0
1/20
14
29/0
1/20
14
26/0
2/20
14
26/0
3/20
14
23/0
4/20
14
21/0
5/20
14
18/0
6/20
14
16/0
7/20
14
13/0
8/20
14
10/0
9/20
14
08/1
0/20
14
05/1
1/20
14
03/1
2/20
14
31/1
2/20
14
Date
No
. o
f b
ed
s o
ccu
pie
d
Howfull?
Howlong?
How many?
HomecareWardsAssessmentA&E
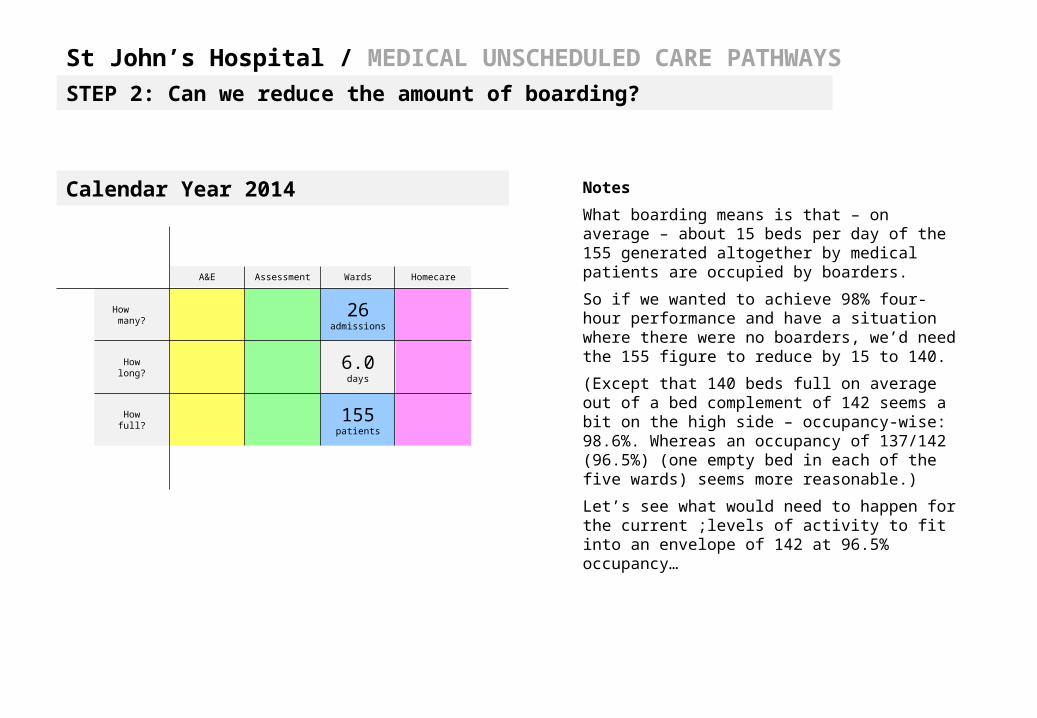
26admissions
6.0days
155patients
St John’s Hospital / MEDICAL UNSCHEDULED CARE PATHWAYS
Calendar Year 2014 Notes
What boarding means is that – on average – about 15 beds per day of the 155 generated altogether by medical patients are occupied by boarders.
So if we wanted to achieve 98% four-hour performance and have a situation where there were no boarders, we’d need the 155 figure to reduce by 15 to 140.
(Except that 140 beds full on average out of a bed complement of 142 seems a bit on the high side – occupancy-wise: 98.6%. Whereas an occupancy of 137/142 (96.5%) (one empty bed in each of the five wards) seems more reasonable.)
Let’s see what would need to happen for the current ;levels of activity to fit into an envelope of 142 at 96.5% occupancy…
STEP 2: Can we reduce the amount of boarding?
Howfull?
Howlong?
How many?
HomecareWardsAssessmentA&E
26admissions
5.3days
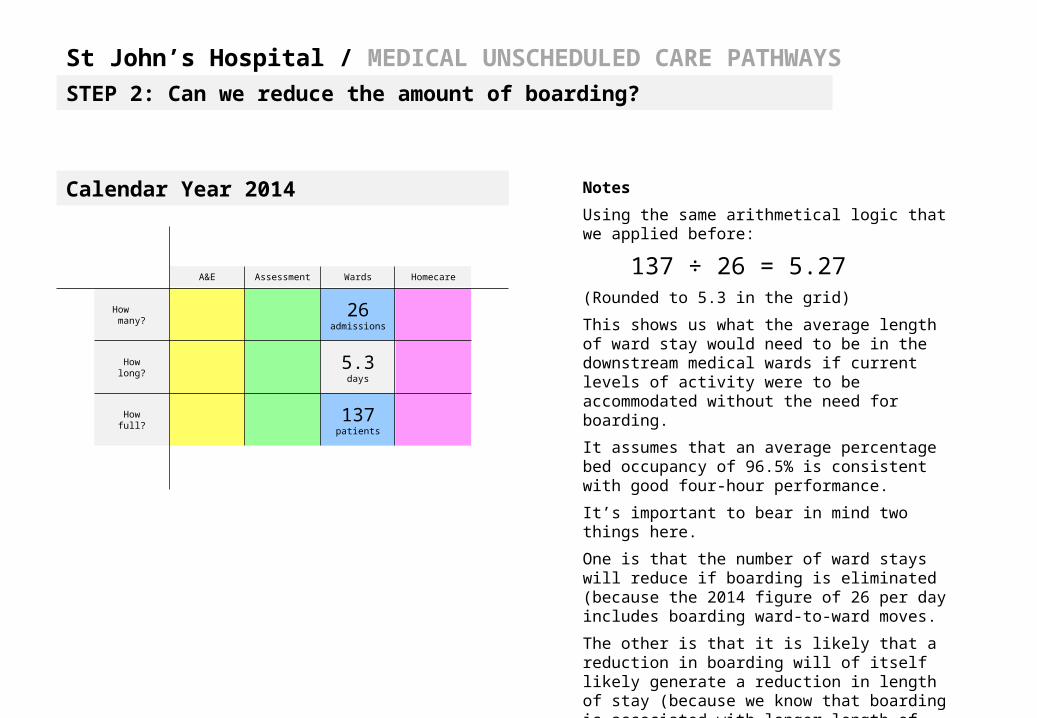
137patients
St John’s Hospital / MEDICAL UNSCHEDULED CARE PATHWAYS
Calendar Year 2014 Notes
Using the same arithmetical logic that we applied before:
137 ÷ 26 = 5.27(Rounded to 5.3 in the grid)
This shows us what the average length of ward stay would need to be in the downstream medical wards if current levels of activity were to be accommodated without the need for boarding.
It assumes that an average percentage bed occupancy of 96.5% is consistent with good four-hour performance.
It’s important to bear in mind two things here.
One is that the number of ward stays will reduce if boarding is eliminated (because the 2014 figure of 26 per day includes boarding ward-to-ward moves.
The other is that it is likely that a reduction in boarding will of itself likely generate a reduction in length of stay (because we know that boarding is associated with longer length of stay)
STEP 2: Can we reduce the amount of boarding?
Related Documents