Fractionalization ∗ Alberto Alesina Harvard University and NBER Arnaud Devleeschauwer Harvard University and Free University of Brussels William Easterly Institute for International Economics and Center for Global Development Sergio Kurlat World Bank Romain Wacziarg Stanford University and NBER December 2002 Abstract We provide new measures of ethnic, linguistic and religious frac- tionalization for about 190 countries. These measures are more com- prehensive than those previously used in the economics literature and we compare our new variables with those previously used. We also revisit the question of the effects of ethnic, linguistic and religious frac- tionalization on quality of institutions and growth. We partly confirm and partly modify previous results. The patterns of cross-correlations between potential explanatory variables and their different degree of endogeneity makes it hard to make unqualified statements about com- peting explanations for economic growth and the quality of govern- ment. ∗ Alesina: Department of Economics, Harvard University, Cambridge, MA 02138, [email protected]. Devleeschauwer: Department of Economics, Harvard University, Cambridge, MA 02138, [email protected]. Easterly: Institute for In- ternational Economics and Center for Global Development, 1750 Massachusetts Avenue, NW, Washington, DC 20036, [email protected]. Kurlat: The World Bank, 1818 H Street, N.W., Washington, DC 20433, [email protected]. Wacziarg (corresponding au- thor): Stanford Graduate School of Business, 518 Memorial Way, Stanford CA 94305, [email protected]. Devleeschauwer is a FNRS - Bernheim Research Fellow. We thank Francesco Caselli and Jim Fearon for useful discussions. All errors remain ours.

Welcome message from author
This document is posted to help you gain knowledge. Please leave a comment to let me know what you think about it! Share it to your friends and learn new things together.
Transcript
Fractionalization∗
Alberto AlesinaHarvard University
and NBER
Arnaud DevleeschauwerHarvard University
and Free University of Brussels
William EasterlyInstitute for
International Economicsand Center for Global
Development
Sergio KurlatWorld Bank
Romain WacziargStanford University
and NBER
December 2002
Abstract
We provide new measures of ethnic, linguistic and religious frac-tionalization for about 190 countries. These measures are more com-prehensive than those previously used in the economics literature andwe compare our new variables with those previously used. We alsorevisit the question of the effects of ethnic, linguistic and religious frac-tionalization on quality of institutions and growth. We partly confirmand partly modify previous results. The patterns of cross-correlationsbetween potential explanatory variables and their different degree ofendogeneity makes it hard to make unqualified statements about com-peting explanations for economic growth and the quality of govern-ment.
∗Alesina: Department of Economics, Harvard University, Cambridge, MA 02138,[email protected]. Devleeschauwer: Department of Economics, HarvardUniversity, Cambridge, MA 02138, [email protected]. Easterly: Institute for In-ternational Economics and Center for Global Development, 1750 Massachusetts Avenue,NW, Washington, DC 20036, [email protected]. Kurlat: The World Bank, 1818 H Street,N.W., Washington, DC 20433, [email protected]. Wacziarg (corresponding au-thor): Stanford Graduate School of Business, 518 Memorial Way, Stanford CA 94305,[email protected]. Devleeschauwer is a FNRS - Bernheim Research Fellow. Wethank Francesco Caselli and Jim Fearon for useful discussions. All errors remain ours.
1 Introduction
Ethnic conflict is an important determinant of the political economy of manynations and localities. Many believe that it leads to political instability, poorquality of institutions, badly designed of economic policy and disappointingeconomic performance.
In a cross-country setting, Easterly and Levine (1997) have shown thatper capita GDP growth is inversely related to ethnolinguistic fractionaliza-tion in a large sample of countries. In particular, they argued that much ofAfrica’s growth failure is due to ethnic conflict, partly as a result of absurdborders left by former colonizers.1 As a result of that paper, a measureof ethnic fractionalization has become a “standard” control in regressionsexplaining cross-national differences in economic success.2
A related literature, early examples being Canning and Fay (1993) andMauro (1995), has discussed the impact of ethnic fragmentation on govern-ment activities and quality of institutions. La Porta et al. (1999), in a broadempirical study of the determinants of the quality of government, suggestthat ethnic fractionalization matters, even though variables related to legalorigins may be more important. A large literature on US localities show thatin more ethnically fragmented communities, public goods provision is lessefficient, participation in social activities and trust is lower, and economicsuccess, measured by growth of city size, is inferior.3 Evidence that trustdoes not travel well across racial lines is also supported by experimentalevidence.4
Another related literature, Esteban and Ray (1994) on the theoreticalside and Garcia-Montalvo and Reynal-Querol (2002) on the empirical side,discuss which are the best measures of heterogeneity. The traditional mea-sure of ethnic fractionalization is given by the probability that two randomly
1For a discussion of the political economy of borders, country size and heterogeneityof populations see Alesina and Spolaore (2002). Note hovewer that ethnic conflict was aconstant in African history even before colonization, as pointed out by Herbst (2000).
2See for example the general growth empirics exercises of Brock and Durlauf (2001),and Doppelhofer, Miller, and Sala-i-Martin (2000).
3A partial list of papers in this area include Alesina Baqir and Easterly (1999), Alesinaand La Ferrara (2000), Alesina and La Ferrara (2002), Lutmer (2001), Goldin and Katz(1999) and Costa and Khan (2002). Another line of research has explored the effects ofethnic diversity on civil wars, suggesting that fractionalization does not help predict theincidence of domestic violent conflict once poverty and income levels are controlled for(see Fearon and Lattin (2000)).
4See Glaeser et al. (2000).
1

drawn individuals from the population belong to two different groups. Itstheoretical maximum is reached (at the value of 1) when each person be-longs to a different group. In contrast, simple measures of polarization reachtheir maximum when two equally sized groups face each other. We use bothmeasures of fractionalization and of polarization in our empirical work, anddiscuss how results differ across the two sets of indices.
While existing measure of racial (or ethnic) fragmentation for the USare reasonably well-accepted, since they are based upon detailed and reli-able census data, cross-country measures have been widely debated. Easterlyand Levine (1997) use indices based on ethnolinguistic classification providedby sources from the former Soviet Union, the Atlas Narodov Mira of 1964.These data rely largely on linguistic distinctions, which may obscure otheraspect of ethnicity like racial origin, skin color, etc. Interestingly, studieswithin the United States do not look at language in the racial classification.If they did, blacks and whites would be classified in the same group. Aswe discuss below, this example shows that although useful, language is notthe only way to look at ethnicity.5 In Latin America several countries arerelatively homogeneous in terms of language spoken, often the one of for-mer colonizers, but much less so if skin color or racial origin is taken intoaccount. The World Bank estimates that the percentage of Afro-Latinos inLatin America is higher than the percentage of African-Americans in theUnited States. Peoples of indigenous or mestizo background also form alarge percentage of the population in most Latin American countries.
Another difficulty in measuring heterogeneity is that ethnic classifica-tions are not set in stone, and are more complex than can be summarizedby simple measures. For example, the Oromo in Ethiopia are split into fivedifferent groups as a result of regional migrations and intermixing with othergroups, suggesting that fractionalization evolves endogenously as a functionof migration and intergroup mixing. The infamous Hutu-Tutsi divide inBurundi was thought by some to have been greatly accentuated (some evensay created) by the Belgian colonizers, suggesting that fractionalization mayalso be endogenous because the definition of groups can shift over time. Peo-ple of African origin do not have as clear a dividing line from the rest ofthe population in many Latin American countries as they do in the US,suggesting that ethnic differences may not be sufficient to fully characterizethe degree of heterogeneity. Hence, ethnic classifications are fraught with
5Racial classification follows the census which divides American in five groups: White,Blacks, America Indians, Pacific islanders, and Hispanics. As for ethnicity country oforigin like Ireland, Italy, Japan etc. is also available.
2

ambiguities, as we discuss in depth below. Having mentioned this importantcaveat, our measures of ethnic, linguistic and religious heterogeneity capturedistinctions that may still matter enormously for economic outcomes.
This paper seeks to achieve four goals. Firstly, we provide a new measureof ethnic fragmentation based on a boarder classification of groups, takinginto account not only language but also other cleavages such as racial char-acteristics. We provide this measure for many more countries (almost twiceas many) than those normally used in the literature, using different sources,and we discuss in detail similarities and differences between our measureand previous ones. We construct three new indices, one based on a broadmeasure of ethnicity, one based strictly on language and one based on reli-gion.
Secondly, we show that indices of fractionalization constructed usingmeasures of ethnicity, language or religion lead to substantially different re-sults when they are entered in regressions to explain growth and governmentquality.
Thirdly, using our new measures we reexamine the evidence on the effectsof ethnic fragmentation on two general areas: economic growth and thequality of institutions and policy. We reach interesting results:
a) On economic growth, we broadly confirm the results by Easterly andLevine (1997). In fact the negative effect of ethnic fragmentation on growthis reinforced with the new data, and we are able to highlight the differencesbetween ethnic, linguistic and religious fractionalization.
b) On quality of government and policies we make some progress over LaPorta et al. (1999). They argued that both legal origin, distance from theequator and ethnolinguistic fractionalization explain the quality of govern-ment. In their results, legal origin variables tend to be stronger than ethno-linguistic fractionalization. We argue that results on this point are sensitiveto the specification, and one can easily produce reasonable specifications inwhich ethnic fragmentation “dominates” legal origin. We do not intend toargue that ethnic fractionalization “beats” legal origin, but more modestlythat the pattern of correlation between independent variables makes it veryhard to resolve this horse race. Most likely both set of variables are impor-tant, and we discuss carefully the patterns of cross-correlation between thesevariables and the potential channels linking fractionalization to governmentquality.
c) Ethnic fractionalization is also closely correlated with GDP per capitaand geographic variables, like latitude. More ethnic fragmentation is more
3
common in poorer countries which are closer to the equator. This com-plicate even more the task of apportioning precisely the weight of ethnicfragmentation to policy variables, the quality of government and growth.Thus the pattern of cross-correlations between explanatory variables cannotbe ignored when drawing conclusions on these issues. As is well known,in many cases the results of cross-country regressions are sensitive to theeconometric specification, and this case is no exception. Useful lessons canbe learned from this sensitivity, however, as it may inform us as to thechannels whereby fractionalization operated to depress growth or reducethe quality of government.
d) While ethnic and linguistic fractionalization are associated with neg-ative outcomes in terms of quality of government, religious fractionalizationis not; in fact, if anything, this measure displays a positive correlation withmeasures of good governance. This is because measured religious fractional-ization tends to be higher in more tolerant and free societies, like the UnitedStates, which in fact displays one the of the highest level of religious fraction-alization. This result has no bearing, however, on the question of whethercertain religious denominations are correlated with better politico-economicoutcomes, an issue recently explored by Barro and McLeary (2002).
Finally we explore which indicator of fractionalization is more correlatedwith variables of interest. We conclude that the measure of fractionalization,traditionally used in the literature perform a bit better than the measure ofpolarization proposed by Garcia-Montalvo and Reynal-Querol (2002).
The paper is organized as follows. In Section 2, we present our newdata and new indices of ethnic fractionalization and polarization. In Section3, we present evidence on the relationship between fractionalization andgrowth in a broad cross-section of countries. In Section 4, we examinehow fractionalization relates to the quality of government and institutions.Section 5 summarizes our results using measures of polarization. Section6 discusses the impact of ethnic fractionalization on economic variables inindividual countries. The last section concludes.
4

2 New Measures of Fractionalization6
2.1 Data sources and measurement issues
Our main goal in gathering data on fractionalization to clearly distinguishbetween ethnic, religious and linguistic heterogeneity. Ethnic and linguisticdifferences were previously lumped together as part of an “ethnolinguistic”fractionalization variable. The data most frequently used in the literaturewas compiled in the Soviet Union in the early 1960s on the basis of pri-mary country sources, and published in the Atlas Narodov Mira in 1964.The ethnolinguistic fractionalization variable (often referred to as ELF) wascomputed as one minus the Herfindahl index of ethnolinguistic group shares,and reflected the probability that two randomly selected individuals from apopulation belonged to different groups.7 We use the same formula, appliedto different underlying data, to compute our measures of fractionalization:
FRACTj = 1−NXi=1
s2ij (1)
where sij is the share of group i (i = 1...N) in country j.
A major obstacle to distinguishing between ethnic and linguistic vari-ables is that language is part of the criterion used by ethnologists and an-thropologists to define the concept of ethnicity. This is true, for example,in Africa, where racial or physical criteria are seldom used to define ethnicgroups. This is not the case, however, in Latin America, where characteris-tics typically used to distinguish between ethnic groups are racial in nature.To our knowledge, no measures of racial fragmentation exist for a broadcross-section of countries, largely because the underlying data on group sizeis missing for most countries. Moreover, the gathering of such data would befraught with conceptual problems, such as the definition of the physiologicalcharacteristics that distinguish races.
One feasible improvement over existing measures, however, is to compilea separate variable for linguistic fractionalization in isolation of any racialof physical characteristics. Our variable “language”, is based exclusively ondata from Encyclopedia Britannica, 2001, which reports the shares of lan-guages spoken as “mother tongues”, generally based on national census data.
6See http://www.stanford.edu/~wacziarg/papersum.html for our new dataset and re-lated documentation.
7For the purpose of cross-country regressions, ELF was used, among many others, inMauro (1995), Canning and Fay (1993) and Easterly and Levine (1997).
5
Other possible sources for language data include the CIA World Factbook(which, however, only lists the shares of each language for a few countries)and the Ethnologue project, which lists approximately 6,800 languages.8
Fractionalization measures constructed from these sources are closely re-lated, as they are based on very similar country source data.9 Our dataincludes 1055 major linguistic groups for 201 countries or dependencies.
We also compute a separate variable for religious fractionalization (“re-ligion”), based on data from the Encyclopedia Britannica, 2001. The dis-tinctions in this data are perhaps less controversial and subject to arbitrarydefinitions than the data on linguistic and ethnic fractionalization, sincethe boundaries of religions are more clear and definitions consistent acrosscountries. Our data cover 294 different religions in 215 countries and depen-dencies.
Finally, the main variable we focus on is a measure of ethnic fractionaliza-tion, “ethnicity”. As suggested above, the definition of ethnicity involves acombination of racial and linguistic characteristics. For example, our data onBolivia involves the following groups: Blancos (10.13%) , Aymara (30.38%),Quechua (30.38%), Mestizos (25.32%) and others groups (indigenous andAfro, 3.80%). This, like the data for most of the rest of Latin America andthe Caribbean, is based on racial distinctions rather than linguistic distinc-tions. In fact, our language data for Bolivia looks very different: Aymara3.24%, Guarani 0.12%, Quechua 8.15%, Spanish 87.65%, Other 0.84%.
In contrast, the ethnicity data for some European countries such as Bel-gium, Luxembourg and Switzerland largely reflects languages (for exam-ple, the “ethnicity” we have identified in Switzerland include: German 65%,French 18%, Italian 10%, other Swiss 6% and Romansch 1%). The sameholds for much of Sub-Saharan Africa. These classifications reflect the judg-ment of ethnologists and anthropologists on the appropriate definition ofethnicity, which to our knowledge remains a rather vague and amorphousconcept. It would be wrong to interpret our ethnicity variable as reflect-ing racial characteristics alone, but it does reflect these characteristics to agreater extent than our language variable, and it should thus be expectedto bear a different relationship to economic variables.
An important goal of our collection of ethnicity data was to obtain data
8http://www.ethnologue.com/9However, the Ethnologue data is much more disaggregated than the Encyclopedia
Britannica data that we use, as relatively similar dialects are classified there as differentlanguages.
6

on various ethnic groups that was as disaggregated as we could find. Thisrequired the use of multiple sources of data, which we painstakingly checkedagainst each other for consistency. The primary source was the EncyclopediaBritannica (2001), which was the source of our data in 124 of 190 countries.This was completed with data from the CIA (2000) for 25 countries, Levinson(1998) for 23 cases and Minority Rights Group International (1997) for 13cases. For France, Israel, the United States and New Zealand, we directlyconsulted the national censuses of these countries to come up with ethnicitydata as disaggregated as available. The rule we followed for data collectionwas as follows: if two or more sources for the index of ethnic fractionalizationwere identical to the third decimal point, we used these sources (this wasgenerally recorded as data sourced from the Encyclopedia Britannica). Ifsources diverged in such a way that the index of fractionalization differed tothe second decimal point, we used the source where reported ethnic groupscovered the greatest share of the total population. If this was 100% in morethan one sources, we used the source with the most disaggregated data (i.e.the greatest number of reported ethnic groups). In the end, our ethnicityvariable covers approximately 650 distinct ethnic groups in 190 countries.
One last issue to contend with is that of changes in the ethnic fraction-alization index through time, which also raises the issue of its endogeneity.This is important because our data is from recent sources (generally theearly to mid-1990s). If there were major shifts in ethnic composition, usingdata from the end of our period to explain variables for the 1960-1995 periodcould lead to endogeneity bias.
Shifts in ethnic composition could stem from changes in the shares of eachgroup or from changes in the definition of the various ethnic groups. Ethnicfractionalization indices are generally taken as exogenous in cross-countryregressions, based on the fact that group shares are sufficiently stable thatchanges only have a minor impact on fractionalization measures. This seemsa reasonable assumption at the 30 year horizon of the typical cross-countryregression, even though this assumption may be less tenable for a muchlonger horizon. Think for instance of different fertility rates across ethnicgroups.
Another problem could occur if the definitions of ethnic groups changedthrough time, as a function of economic or political variables. The possi-bility of such changes in definitions has been pointed out by the “reflexive”school in ethnology and sociology. According to the reflexive theory of eth-nicity and nationality, the boundaries of ethnic groups are changing because
7

individual’s self-identification to groups can change as a result of social, eco-nomic or political forces, and ethnicity is therefore endogenous, especially atlong horizons.10 One recent example of this phenomenon is Somalia: priorto the 1991 civil war, this country appeared relatively homogeneous (85%Somalis), but during and after the civil war “clans” became the dominantdimension of ethnic cleavage. In other words, a political event led to the cre-ation of a new dimension of ethnic cleavage, and self-identification to groupsnow reflect preexisting clans rather than the Somali “ethnicity”.11
In general, it does not matter for our purposes whether ethnic differ-ences reflect physical attributes of groups (skin color, facial features) orlong-lasting social conventions (language, marriage within the group, cul-tural norms) or simple social definition (self-identification, identification byoutsiders). When people persistently identify with a particular group, theyform potential interest groups that can be manipulated by political leaders,who often choose to mobilize some coalition of ethnic groups (“us”) to theexclusion of others (“them”). Politicians can also mobilize support by sin-gling out some groups for persecution, where hatred of the minority groupis complementary to some policy the politician wishes to pursue (Glaeser(2002)).
The bottom line is that while we recognize that ethnic fractionalizationcould to some extent be endogenous, and that the previous literature hasprobably underplayed this point, we do not believe this is a very seriousproblem at the horizon of 20 to 30 years which characterizes our cross-country work. While the example of Somalia is interesting, in our sampleperiod such examples are rare and ethnic fractionalization displays tremen-dous time persistence. More serious is the problem of endogeneity of thereligious fragmentation variable. Repressive regimes, especially those witha religious bend, may make it difficult for individuals to be “counted” asmembers of the non officially sanctioned religion. This phenomenon couldintroduce a spurious correlation between (lack of) political freedom and re-ligious fragmentation.
10See Hammersley and Atkinson (1995) for a survey of these concepts. The reflexiveschool of thought, which seems to be associated with the postmodern tradition in sociology,is generally contrasted with the “primordialist” school, identified for example with CliffordGeetz (1973), which seems to be associated with evolutionist theories.11Mozzafar and Scarrit (1999) report data on ethnicity at three distinct levels of “self-
reference” for Africa. We use their clan data for Somalia, since the rest of their dataset issufficiently close to our other sources.
8
2.2 Comparison with existing measures
We now compare our measures of linguistic, ethnic and religious fraction-alization with the index of ethnolinguistic fractionalization based on theSoviet data usually used in the literature. Firstly, our indices are availablefor many more countries, between 190 and 215 compared to 112 for theSoviet index. Table 2 shows the pairwise correlations between these fourindices, computed, obviously, on the intersection of our sample and the So-viet sample. The Soviet sample is, with very few exceptions, a subsample ofour own. Not surprisingly, the correlation between our ethnic and linguis-tic index and the Soviet index are fairly high (0.76 and 0.88, respectively).Instead, the religious fractionalization index bears a much lower correlationwith the other three indices.
Our data gathering effort can also be related to recent attempts by otherscholars to gather cross-country ethnic heterogeneity data. Annett (2001)presents an index of ethnolinguistic fractionalization closely related concep-tually to the Soviet data, using exclusively data published in the WorldChristian Encyclopedia (Barrett, 1982), a source distinct from our own. Healso presents data on religious fractionalization, but does not attempt toisolate linguistic fractionalization like we do. His data cover 150 countries(compared to 190 for our ethnicity variable and 215 for our religion vari-able). Perhaps reassuringly given the different sources, for the overlappingsample of countries the correlation between his ethnolinguistic fractionaliza-tion variable and ours ethnicity variable is 88.85% The correlation betweenhis religious fractionalization variable and our own is 83.66%.
Even more recently, Fearon (2002) has gathered detailed data on eth-nic groups for 160 countries, from sources that sometimes overlap with ours(he does not present data for religious and linguistic fractionalization). Hisdata is slighly less disaggregated than ours (each country displays on av-erage 5.11 groups in his dataset, versus 5.55 in ours), partly because herestricts attention to groups making up more than 1% of the population.These small differences do not greatly impact our respective measures offractionalization: as Fearon reports (2002, p. 3), referring to our dataset,“the descriptive statistics for their ethnic measure look broadly similar tothose for the measure constructed here”.
Table 3 highlights differences across regions amongst our three indicesand ELF. With the exception of East and South East Asia, our ethnic frac-tionalization index show more fractionalization than the Soviet index. Giventhe way it is constructed, this is not surprising. Particularly interesting is
9

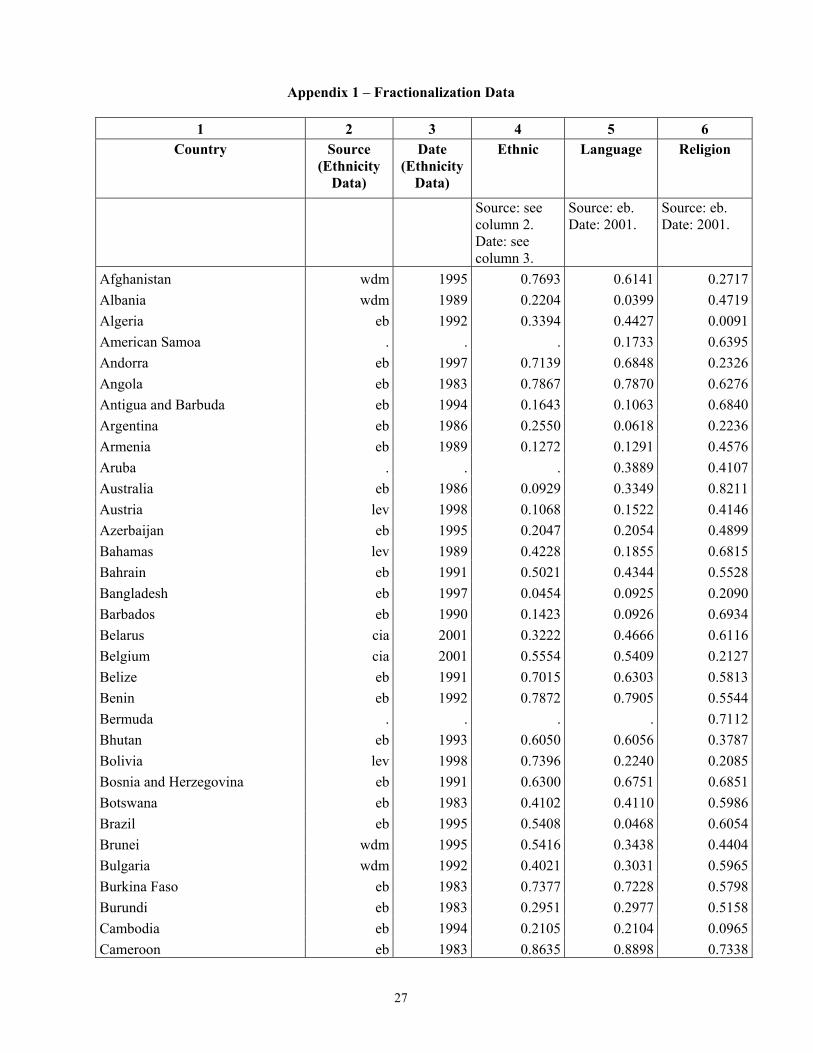
the case of Latin America, were our ethnic fractionalization index is on aver-age much higher than ELF. This is because, in this region, many ethnicallydiverse groups (as captured by skin color), often speak the same language asformer European colonizers, Spanish, English or Portuguese. So a classifica-tion based purely on language shows a much lower degree of fractionalizationthan one that includes racial characteristics. In fact our linguistic fraction-alization index leads to an average of 0.16 versus an average of 0.42 for theethnicity index. The Soviet index is closer to our linguistic index. Note howSub-Saharan Africa displays the highest index of fractionalization in everysingle column. Appendix 1 displays these figures country by country.
Restricting our attention to countries with more than one million inhabi-tants, according to our data the most ethnically diverse country in the worldis Uganda, with a fractionalization index of 0.93. The 13 most ethnicallydiverse countries are all in Sub-Saharan Africa, followed by Yugoslavia andthen 7 more Sub-Saharan African countries. The least ethnically fractional-ized countries are South Korea, Japan and North Korea. Turning to linguis-tic fractionalization, the most diverse countries are again 18 Sub-SaharanAfrican countries (note that the definition of ethnicity there largely overlapswith linguistic distinctions). They are followed by India, with a linguisticfractionalization index of 0.81. The least diverse countries are South Koreaand North Korea, followed by Yemen. Finally, turning to religious fraction-alization, the most diverse countries are South Africa, the United Statesand Australia, and the least diverse Yemen, Somalia, Morocco, Turkey andAlgeria.
3 Fractionalization and Growth
In this section we revisit the question of the relationship between fractional-ization and long-run growth. For the sake of comparison, we closely followthe specification of Easterly and Levine (1997). We begin in Table 4 byshowing the correlation between several economic variables of interest andour three measures of fractionalization: ethnic, linguistic and religious. Ourethnic variable is highly negatively correlated with GDP per capita growth,schooling and telephones per capita. These correlations are slightly lower forthe linguistic measure. The measure of religious fractionalization does notseem to bear any pattern of correlations with the above mentioned variables.
Table 5 is organized exactly in the same way as Easterly and Levine’s(1997) Table 4. This table shows that our measure of ethnic fractionaliza-tion is inversely related to per capita growth, as shown in Column 1. The
10
next three columns show that as one controls for more and more variables,the effect of fractionalization vanishes. The point is that variables suchas schooling, telephones per worker, etc., can be understood as channelsthrough which the ethnic fractionalization variable affects growth. Table6 highlights this by reproducing Table 6 of Easterly and Levine (1997).It shows that ethnic fractionalization is strongly negatively correlated withschooling, financial depth, fiscal surplus, and the log of telephones per worker(these results are the same as in Easterly and Levine except for the fiscalsurplus, where Easterly and Levine did not find a significant association).This negative effect of racial fractionalization on infrastructure and produc-tive public goods will be discussed in more detail in the next section. Sinceethnic fractionalization affects variables that in turn affect growth, there is areduced form relationship between these variables and growth. The partialassociation between growth and fractionalization vanishes once we controlfor the intermediating variables.
In terms of economic magnitudes, the results in Table 5 suggest thatgoing from complete ethnic homogeneity (an index of 0) to complete het-erogeneity (an index of 1) depresses annual growth by 1.9 percentage points(column 1). In other words, up to 1.77 percentage points of the differencein annual growth between South Korea and Uganda can be explained bydifferent degrees of ethnic fractionalization. This effect is reduced as wecontrol for variables that can be interpreted as channels through which eth-nic fractionalization affects growth.
In Tables 7 and 9 we rerun the same regressions as in Table 5, but usingreligious fractionalization and linguistic fractionalization. While linguisticfractionalization is strongly inversely related to growth, religious fractional-ization is not. In fact, as Table 4 already showed religious fractionalizationdoes not seem to be correlated with any of the other right-hand side variable.Instead linguistic fractionalization is, especially with telephones per workersand schooling, a result which is confirmed in Tables 8 and 10 and in thenext section. Overall our results are quite similar to those of Easterly andLevine (1997), perhaps even a little stronger when using our new measureof linguistic fractionalization.
The differences in the results between religious and linguistic and ethnicfractionalization are quite suggestive. Religious affiliation is the most en-dogenous of the three variables. Religions can be banned and individual canrelatively easily “hide” their religious affiliation to avoid repression. Indi-viduals and families can change from one religion to another far more easilythan they can change race (!) or language. In a sense, a higher observed
11
measure of religious fractionalization can be a sign of a more tolerant anddemocratic form of government. In a more repressive regime, you can hideyour religion or conform to the state-imposed religion, but hiding your racialorigin, especially if it relates to skin color, is much more difficult. Short ofgenocide, it is difficult to change the ethnic composition of a country. Asearly as 1830, Tocqueville had noted this problem with reference to slaveryin America. He wrote that “there is a natural prejudice that prompts mento despise whoever has been their inferior long after he has become theirequal... But amongst the ancients this secondary consequence of slaveryhad a natural limit; for the freedman bore so entire a resemblance to thoseborn free that it soon became impossible to distinguish him from them”. Inthe United States, instead, skin color differences between blacks and whitesmakes assimilation more difficult. In other words, skin color becomes animportant focal point to characterize lasting differences and perceptions, asalso argued by Caselli and Coleman (2002).
4 Fractionalization and Government Quality
One of the reasons why ethnic fractionalization may negatively influenceeconomic success in terms of growth and level of income has to do with thepotentially negative effects of ethnic conflict on the quality of policy andof institutions. In a sweeping empirical study La Porta et al. (1999) haveinvestigated the determinants of the quality of government and of policyoutcomes looking and a large number of indicators of policy. They con-cluded that a country’s legal origins are an important determinant of thesevariables, while the ethnic fractionalization variable (the same as used byEasterly and Levine (1997)) bore a reduced form relationship with govern-ment quality. However, fractionalization was typically not significant aftercontrolling for the level of GDP per capita (which however could be endoge-nous) and latitude.
Table 11 reports a matrix of correlation between all the variables used aspotential explanation of the quality of government. Note that our measuresof linguistic and ethnic fractionalization are highly correlated with latitudeand GDP per capita. Therefore it is quite difficult to disentangle the inde-pendent effect of these three variables on the quality of government. WhileGDP per capita is very likely to be endogenous to the left-hand side vari-ables, so that it is unclear whether one should control for it or not, the othertwo variables are less endogenous. Also, ethnic fractionalization and latitudeare less obviously linked by causal relationships than the same two variables
12
are with income. The correlation between latitude and ethnic fractionaliza-tion is quite high, about 0.4. This makes it hard to disentangle the effectof one variable from the other and the result in this type of cross-sectionalregressions will depend on the specification. On a priori grounds, while onecan think of several reasons why ethnic conflict may affect policy outcomesand institutions, the relationship between latitude and, say, the regulationof economic activity or the protection of property rights seems much lessobvious.
The measure of religious fragmentation displays a much lower level of cor-relation with GDP per capita; in fact this correlation is basically zero. Ourethnic fractionalization variable displays a positive correlation (0.2) with thedummy variables for French legal origins, which according to La Porta et al.(1999) is associated with poor quality of government. This does not help inseparating the effects of legal origins from those of fractionalization.
In Tables 12a-h we run a set of regressions along the lines of La Porta etal. (1999). These tables are organized as follows. Let us begin with Table12a. For each left-hand side variable, we present three regressions. Thefirst one reproduces exactly the full specification of La Porta et al. (1999),i.e. their specification which include the largest number of independentvariables, that is legal origins, religious variables, latitude, etc. To thesevariables we have added our measure of ethnic fractionalization. Column2 present a minimalist specification, which includes only country size andregional dummies. The third column adds to this specification income percapita and legal origins variables. For brevity we do not report another col-umn including also the religious variables, but the results (available uponrequest) are similar to those of column 3. Note that the omitted legal originsvariable is the British one. Tables 12b-h have the same structure, with differ-ent dependent variables. Tables 13a-h and 14a-h replicate these regressionswith, respectively, the measures of linguistic and religious fractionalization.Several observations are in order.
1) Our index of ethnic fractionalization is significant in the “minimal-ist” regression, Column 2, for corruption, bureaucratic delays, infrastructurequality, infant mortality, illiteracy, and school attainment. It is significantor nearly significant in Column 3 that controls for GDP per capita for cor-ruption, infant mortality, and illiteracy. The sign of the coefficient alwaysimplies that more fractionalization leads to a lower quality of government.This index is also negatively associated with the share of transfers over GDP,a result consistent with those obtained by Alesina, Glaeser and Sacerdote(2001) on a much smaller sample of countries, and by Alesina and Wacziarg
13

(1998) on a large sample of countries but with different data on govern-ment spending.12 It seems that governments have a much more difficulttask achieving consensus for redistribution to the needy in a fractionalizedsociety.
2) The democracy index is inversely related to ethnic fractionalization(when latitude is not controlled for). This result is consistent with theoryand evidence presented in Aghion, Alesina and Trebbi (2002). The idea isthat in more fragmented societies a group imposes restrictions on politicalliberty to impose control on the other groups. In more homogeneous soci-eties, it is easier to rule more democratically since conflicts are less intense.13
3) Overall the index of linguistic fractionalization seems to work lesswell than the index based on ethnicity, in the sense of leading to coefficientsthat are less robust to changes of specification and more often statisticallyinsignificant.
4) The index of religious fractionalization bears a positive relationshipto controlling corruption, preventing bureaucratic delays, tax compliance,transfers, infrastructure quality, lower infant mortality, lower illiteracy, schoolattainment, democracy, and political rights. Note that this result holds re-gardless of whether the size of various religious denominations is held con-stant in the regressions or not. Our interpretation is that observed religiousfragmentation is larger in more tolerant countries.
5) The index of ethnic fractionalization loses statistical significance inmany of the regressions with the full specification used by of La Porta et al.(1999). This is because these regressions include latitude and, as we arguedabove, this variable is highly correlated with ethnic fractionalization. Theethnic fractionalization variable remains significant at standard levels evenafter controlling for latitude in the case of infant mortality, and the share ofstate-owned enterprises. In virtually all other cases the ethnic fractionaliza-tion variable retains the “expected” sign but it is not statistically differentfrom zero at standard levels of confidence. This reflects the difficulty in dis-entangling the effects of latitude, per capita income (which again may notbelong in the regression due to endogeneity), and fractionalization.
12These papers questioned Rodrik’s view (1998) that the size of government is drivenby openness in the economy, an issue that we do not explore here.13These authors present additional evidence precisely on this point using the same data
on ethnic fractionalization collected for the present paper. This is consistent with thefact that relatively homogeneous settler colonies like the US, Canada, New Zealand andAustralia had an easier time establishing democracy after independence than the moreethnically diverse former colonies in Latin America and Africa.
14
6) In many regressions neither latitude nor ethnic fractionalization aresignificant but they both tend to be when introduced alone. The table doesnot show the case in which latitude is entered without ethnic fractionaliza-tion, but these results are available upon request.
7) Not surprisingly, since we are using the same data, we confirm resultsin La Porta and al. (1999) on legal origins. French and Socialist legal originsseem to be negatively associated with measures of quality of government.
The bottom line is that the evaluation of the effect of ethnic fragmen-tation on quality of government depends on whether one believes that lati-tude belongs in the regression or not. If one believes that geography is theleading explanation of corruption, tax compliance, democracy, freedom etc.then one could find confirmation of these priors in these results. If, insteadone believes that conflicts amongst groups brings about more difficult andinefficient policymaking and that ethnic fractionalization happens to be cor-related with latitude (or constitutes a channel or explanation through whichthe latitude variable operates), then one can find support for this set ofpriors in our results as well.
5 Polarization
Our measures of fractionalization, while the most widespread in the liter-ature, are not the only measures of ethnic, religious and linguistic hetero-geneity available. In particular, scholars have recently started to calculateand use measures of polarization, rather than fractionalization.14 Holdingthe “distance” between groups constant, polarization is typically maximizedwhen there are two groups of equal size, whereas fractionalization increaseswhen there are many small groups. Additionally, the degree of polarizationshould increase as the distance between groups increases. When it comesto ethnic, linguistic and religious groups, however, the concept of distanceis hard to capture with simple measures, so that researchers have implicitlyassumed that the distance between groups is constant across group pairs.15
14See for instance Garcia-Montalvo and Reynal-Querol (2002).15A recent effort to generate an index of “cultural distance” appears in Fearon (2002).
He noticed that linguists classify languages in trees - two languages on the same branchof a linguistic tree are “closer” to each other than two languages on a different branch.Linguistic trees can therefore be used to approximate the distance between linguisticgroups. Efforts to similarly measure the distance between ethnic groups and religionsshould be at the forefront of the data gathering effort in fractionalization research. Weare not aware of such attempts.
15
Whether societal conflict is the result of fractionalization or polarizationis largely an unresolved question in theory, calling for empirical work. Thediscussion of whether a country with many relatively small groups is moreor less stable than one with only two equally sized groups is an old one,and goes back at least to Madison in the Federalist Papers of 1788 (nos. 10and 11 see Hamilton et al., 1911). Without much of a stretch of Madison’sviews, one can argue that a polarization measure is, according to him, theappropriate concept to capture heterogeneity. In what follows, we extendour estimates of the effects of ethnic, religious and linguistic heterogeneityon growth and government quality using measures of polarization.
Esteban and Ray (1994) develop a theory of polarization and axiomat-ically derive a measure of income polarization with “desirable” features.16
They show that a desirable measure of polarization must take the form:
P (s, y) = KnXi=1
nXj=1
s1+αi sj |yi − yj | (2)
where K is a constant, α is a constant between 0 and ' 1.6, and yi is theincome of group i = 1...n (polarization here is defined with respect to income- it is presumed there is no within group variation in income). This definesa fairly narrow class of measures, since the only degrees of freedom are K(a scaling factor) and α. In order to compute this measure for ethnicallydefined groups we need a measure of the distance between groups (the analogof |yi − yj | in equation (2)). Lacking such a measure, the empirical literaturehas had to assume that the distance between every group is the same.17
We have repeated all the previous estimations using the measure of po-larization based on (2) rather than fractionalization. For brevity we do notreport all the results, which are available upon request. We set K = 1 andconsidered three values of α - the two extreme values 0 and 1.6, and an inter-
16The axioms imposed on polarization measures are the analogs of the Dalton Axiomfor the measurement of inequality. See also Duclos, Esteban and Ray (2002) for a gener-alization.17Garcia-Montalvo and Reynal-Querol (2002) use the following specification:
POLi = 1−nXi=1
µ0.5− si0.5
¶2si
They show that this index can be derived from a model of lobbying. Note that this indexreaches a maximum of 1 when there are two equally sized groups in the country.
16

mediate value of 0.8.18 In a context where we have to assume that |yi − yj |is constant for all i 6= j, it is easy to show that a value of α = 0 leads to ameasure that is perfectly correlated with the fractionalization measure pre-sented earlier if and only if every group in a country’s population is observed(so that the sum of observed group shares equals 1).19
A summary of our results is as follows:
1). The polarization indices, especially when computed with an α aroundthe middle of the feasible range (i.e. around 0.8), are highly correlatedwith the fractionalization measures. This is due to the assumption of equaldistance between all groups within a given country, an assumption requiredby our lack of data on those distances.
2). We find that polarization indices with α equal to 0.8 perform rel-atively better than those with an extreme value of 1.6. Thus the indexof polarization that works better is the one that is most correlated withfractionalization.
3). In the growth regressions, the results seems substantially weakerusing the polarization index. When both indices are used together, thefragmentation index typically remains significant and the polarization indexis not.
4). In the quality of government regressions the index of ethnic fraction-alization works slightly better than the corresponding index of polarization.In these regressions, because of the high correlation between the two indices,when they are used together the results are generally not easily interpretable.
5). We obtain poor results using linguistic polarization in the quality ofgovernment regressions whatever the value of α.
6). As for the fractionalization index, religious polarization is associatedwith better performances in the areas of regulation, red tape, corruption,tax compliance, transfers and political rights, especially when α has an in-termediate value of 0.8. Higher religious polarization is also associated withbetter public goods, lower infant mortality and illiteracy rates, higher levelsof schooling and better infrastructure.
18Esteban and Ray (1994) do not point to which value was “better” to capture po-larization - all values of α in the specified range satisfy the properties that the class ofpolarization measures should satisfy. There is therefore no a priori reason to prefer onevalue over the other.19Thus, in practice a measure based on α = 0 does not add anything to our earlier
results, so we abstain from commenting on the corresponding results.
17

The bottom line is that the measure of polarization produces similar butslightly worse results than the result with fractionalization when we choosea parameter value for α that makes the correlation between the two indiceshigh. When the choose of parameter values makes the polarization indexless correlated with fractionalization, the latter is a better predictor of ouroutcome variables.
Garcia-Montalvo and Reynal-Querol (2002) show that their index of po-larization predicts civil wars better than fractionalization. Their results andours are not contradictory. It may very well be the case that a civil waris more likely when two large equally size group face each other than whenmany small groups are present. A war is also more likely when the twogroups are roughly of equal size than when one is clearly predominant sincein that case the dominant one can more easily repress the other one andavoid war. However, the quality of policy may be specially bad when manygroups fight over public resources.
6 The effects of ethnic conflict: A few examples
A cross-country statistical exercise is a crude way to summarize complexpolitical and economic histories of countries and their constituent ethnicgroups. A promising direction for future research would be for economiststo do more case histories of development, economic policy, and governmentquality in ethnically diverse places, of the kind that the political scienceliterature does.
In this sections we briefly examine some individual data points to illus-trate salient ethnic divisions as well as the complex history that lies behindour cross-section associations. Nigeria has among the highest ethnic andlinguistic diversity in the entire sample, and was also ranked as highly di-verse by Easterly and Levine (1997). Maier (2000) makes clear it would behard to find a better example of institutional and policy failure leading tounderdevelopment. Nigeria has produced $280 billion in oil revenues sincethe discovery of reserves in the late 1950s, but the average Nigerian is nofurther out of poverty today than 4 decades ago. Such egregious failures asthe $8 billion state-owned Ajaokuta steel complex, which has yet to producea bar of steel, give a hint of the breakdown of state institutions. The stan-dard account of Nigeria’s ethnic conflict pits the Muslim North versus theChristian South, but this is a simplification. Firstly, the Christian Southis divided between the Yoruba and Igbo. Secondly, there are substantialSouthern minority groups living in Northern cities, a situation that has led
18

to recurrent communal violence. Thirdly, fractious ethnic groups in the cen-ter of the country and in the oil-rich Niger delta keep small-scale conflictgoing even out of the limelight of the Hausa/Yoruba/Igbo three-way eth-nic war. Table 15 shows that Nigeria has had disastrous economic policies(high black market premiums), poor infrastructure (virtually no telephonedensity) and high corruption.
Ethiopia also has very high ethnic and linguistic diversity (according toboth new and old measures), and ethnic conflict has been at the center ofEthiopian history for centuries. Ethiopia has had one of the lowest growthrates in the world over the past half-century and as a result remains oneof the least developed nations in the world. It has known various typesof regimes, from monarchy to Marxist-Leninist to reformist, but growthhas been mediocre to poor under all of them. Political/ethnic conflict anddisastrous institutions have partly caused and certainly magnified the effectsof major disasters such as famine, AIDS, civil war, and international war,and these disasters have absorbed a high share of the government’s paltryaid and tax revenues.
The current government is dominated by the Tigray Peoples’s Libera-tion Front, representing an ethnic group making up only 6 percent of thepopulation. The latter is alleged to own a large number of agricultural,industrial and financial businesses under the umbrella of the EndowmentFund for the Rehabilitation of Tigray.20 The current government is at-tempting to prevent ethnic conflicts by decentralizing power to ethnicallydefined regions, including the promotion of local languages. However, thisstrategy remains deeply controversial. At one extreme, some observers seeit as a ploy by the Tigrayan ruling elite to divide the potential oppositionalong ethnic lines, as well as to undercut the national government bureau-cracy. The rulers are alleged to have co-opted participants from other ethnicgroups rather than allowed representative organizations to emerge. Thereare also accusations of a second level of oppression, this time by the dom-inant majority group in each region oppressing the regional minorities (onsome accounts, there are over 80 ethnic groups in Ethiopia, but only 9 re-gions). Some Ethiopians decry the threat to the unity and identity of thecountry and the “ethnicization” of politics. Of course, ethnicization is farfrom new, given the long-standing Amhara dominance of the state, and its“colonization” of other “nationalities”. Some see the current government assimply substituting Tigray dominance for Amhara dominance (see Tronvoll(2000)).20Abegaz (2001), p. 207.
19
More charitable observers see government policy as an honest attemptto address the ethnic divisions that have bedeviled Ethiopia for much of itshistory (today there continues to be an armed insurgency by the Oromo Lib-eration Front).21 These observers see the current government as respondingto this history of domination by the Amhara by granting autonomy to the“nationalities.”
Botswana is an interesting exception to the poor economic outcomesand low quality government in most of Africa. The table shows it hadhigh growth, a low black market premium, a government surplus, and lowcorruption. While we do not mean to give a monocausal explanation for thissuccess, it is notable that it has relatively low ethnic diversity for Africa.Acemoglu, Johnson, and Robinson (2001) describe how the Tswana tribeshad a long history of cooperation amongst themselves before independence,as well as generally inclusive institutions since.
Ethiopia and Nigeria were already highly diverse relative to Botswanain the old Easterly and Levine (1997) dataset. Even more interesting isthe much higher degree of ethnic diversity in some Latin American andCaribbean countries according to our new ethnic fractionalization measure.Among the poorest, most institutionally underdeveloped, and most conflict-ridden societies in this region are Bolivia, Ecuador, and Guyana. All ofthese score lower on linguistic fractionalization (and hence did not show upas very ethnically diverse in Easterly and Levine (1997)) than on ethnicfractionalization, because of racial differences. A Latin American successstory, Chile, continues to show up as relatively homogeneous.
To take Bolivia as an example, whites (about 10 percent of the popula-tion) dominated the governments of Bolivia with systematic exploitation ofmestizos, Aymara, and Quechua peoples from colonial times to 1952 (Klein(1992)). Six percent of landowners owned 92 percent of the land in 1950.There were feudal anachronisms such as an obligation for Indian tenants tospend part of their time as unpaid servants in the landowner’s household.A literacy requirement prevented the majority of the population from vot-ing. The Indians successfully revolted in 1952, redistributed land towardsthe peasants, and abolished the more obvious exclusionary laws. However,whites continued to dominate politics and economics. Political instabilityremained endemic after 1952, with frequent military coups overthrowingdemocratic regimes. Democracy has been restored since 1982, but racialconflict continues. When one of the authors visited Bolivia in early 2002,
21See Marcus 1994 on the complicated history of ethnic groups in Ethiopia.
20
Indian activists were blockading the main roads surrounding La Paz to artic-ulate various grievances. A meeting of the leaders of the 1952 revolutionaryparty was conspicuous for its lack of Indian representation. Anecdotally, itappeared that racist sentiments towards the Indians still existed amongstthe white elite. Bolivia still has poor growth, high corruption, poor socialservice delivery, and predatory police and judges.
Guyana shows up as ethnically diverse in our data because of its racialbreakdown between Africans, East Indians, Europeans, and others. TheAfro-Guyanese and Indo-Guyanese are the predominant groups and are al-most numerically equal. Since they have mobilized politically along ethniclines (supporting two different parties since before independence), any con-sensus for development has been torn apart by competition for rents betweenthe two groups.22 As Table 15 shows, Guyana is rated as one of the mostcorrupt countries in the world, has followed distortionary economic policies,and has had very poor growth outcomes.
Chile, in contrast, is a well known Latin American success story. Ithas pursued free market reforms since the 1970s under first military andlater democratically elected governments. Although it did have politicaland economic gyrations under Allende in the early 1970s and then a debtcrisis and severe political repression under Pinochet in the early 1980s, thelast twenty years have shown a high degree of political and economic sta-bility and sustained growth. By the 1980s, Chile had also achieved a highlevel of schooling and infrastructure (Table 15). There are certainly manycauses explaining why reforms were made possible, in particular the author-itarian and repressive nature of the Pinochet regime, which made it easierto eliminate opposition to reform. After the period of repression a con-siderable amount of consensus emerged on policy. Many other developingcountries experienced bloody coups, and did not evolve into peaceful andrapidly growing economies. The difference in Chile was probably due to itshigher level of homogeneity. In fact, after Pinochet’s departure from powerthe new democratic regime showed remarkable stability by Latin Ameri-can standards. The relative ethnic homogeneity of the society may havemade achieving support for reform and economic development easier thanin Bolivia or Guyana.
22See Library of Congress (1994).
21
7 Conclusion
The question of what makes different countries more or less successful eco-nomically and what explains the quality of their policies is one of the mostfascinating that economists can ask, but it is also one of the most difficult toanswer. Different authors have their own “favorite” explanatory variables:from purely “economic” ones, to geographic ones, to legal ones, to politi-cal, cultural, religious and historical ones. In this paper we have consideredclosely one such set of variables: measures of ethnic, linguistic and religiousfractionalization.
Dealing with this type of variables raises two problems. One is a measure-ment: how to measure ethnicity is a delicate and difficult matter. Secondly,the patterns of correlations between potential explanatory factors makes itdifficult to unambiguously answer the question of why certain countries havebetter policies than others. In this paper we have made some progress onboth fronts. Firstly, on the measurement issue we provided a new set offractionalization variables for a much larger sample of countries than wasavailable before, and we put much effort into solving classification issues us-ing consistent criteria across countries. Secondly, using these new variableswe revisited empirical issues concerning the determinants of growth and ofquality of policies and institutions. We concluded that ethnic and linguis-tic fractionalization variables, more so than religious ones, are likely to beimportant determinants of economic success, both in terms of output (GDPgrowth), the quality of policies (such as the literacy rate, infant mortalityetc.) and the quality of institutions (measured by the extent of corruption,political freedom, etc.). However, it is difficult to evaluate precisely thesize of these effects because of the strong correlation of ethnolinguistic frac-tionalization variables with other potential explanatory variables, especiallygeographical ones. In the end one has to use theory and priors to interpretour partial correlations.
References
[1] Abegaz, B. (2001), “Ethiopia” in Devarajan, S., D. Dollar, and T.Holmgren, eds. Aid and Reform in Africa, World Bank.
[2] Acemoglu D. , S. Johnson, and J. Robinson (2001), “The Colonial Ori-gins of Comparative Development” American Economic Review, vol.91, no. 5, December, 1369-1401.
22
[3] Acemoglu D. , S. Johnson, and J. Robinson (2001), “An African SuccessStory: Botswana”, in D. Rodrik, ed., Analytical Country Narratives ofEconomic Growth, forthcoming.
[4] Aghion P., Alesina A. and F. Trebbi (2002), “Endogenous PoliticalInstitutions” unpublished, Harvard University.
[5] Alesina A., R. Baqir and W. Easterly (1999), “Public Goods and EthnicDivisions” Quarterly Journal of Economics, vol. 114, no. 4, November,pp. 1243-1284.
[6] Alesina A. and E. La Ferrara (2000), “Participation in HeterogeneousCommunities”, Quarterly Journal of Economics, vol. 115, no. 3, Au-gust, pp. 847-904.
[7] Alesina A. and E. La Ferrara (2002), “Who Trusts Others?” Journal ofPublic Economics, vol. 85, August, pp. 207-34.
[8] Alesina A. E. Glaeser and B. Sacerdote (2001), “Why Doesn’t the USHave a European Style Welfare State?” Brookings Papers on EconomicActivity, Fall.
[9] Alesina A. and R. Wacziarg (1998), “Openness, Country Size and Gov-ernment”, Journal of Public Economics, vol. 69, no. 3, September, p.305-321.
[10] Annett, Anthony (2001), “Social Fractionalization, Political Instability,and the Size of Government”, IMF Staff Papers, vol. 48, no. 3, pp. 561-592.
[11] Atlas Narodov Mira, Moscow: Miklukho-Maklai Ethnological Instituteat the Department of Geodesy and Cartography of the State GeologicalCommittee of the Soviet Union, 1964.
[12] Barro R. and R. McLeary (2002), “Religion and Political Economy inan International Panel”, NBER Working Paper No. 8931, May.
[13] Barrett, David B. (1982), World Christian Encyclopedia, New York:Oxford University Press.
[14] Brock, S. and S. Durlauf (2001), “Growth Empirics and Reality”,WorldBank Economic Review, vol. 15, No. 2, pp. 229-272.
23

[15] Canning, D. and M. Fay (1993), “The Effects of Transportation Net-works on Economic Growth” Columbia University Working Paper.
[16] Caselli, F. and J. Coleman (2002), “On the Theory of Ethnic Conflict”,unpublished, Harvard University.
[17] Costa, D. and Kahn, M. (2002), “Understanding the Decline in SocialCapital, 1952-1998”, Kyklos, forthcoming.
[18] Doppelhofer, G., R. Miller and X. Sala-i-Martin (2000), “Determinantsof Long-Term Growth: A Bayesian Averaging of Classical Estimates(BACE) Approach”, NBER Working Paper No. 7750, June.
[19] Duclos, J-Y., J. Esteban and D. Ray, (2002), “Polarization: Concepts,Measurement, Estimation”, unpublished, New York University, May.
[20] Easterly W. and R. Levine (1997), “Africa’s Growth Tragedy: Policiesand Ethnic Divisions”, Quarterly Journal of Economics, vol. 111, no.4, November, pp. 1203-1250.
[21] Esteban, J. and Ray, D. (1994), “On the Measurement of Polarization”,Econometrica, vol. 62, no. 4, pp. 819—851.
[22] Fearon, J. and D. Laitin (2000), “Ethnicity, Insurgency and Civil War”,unpublished, Stanford University, August (forthcoming, American Po-litical Science Review).
[23] Fearon, J. (2002), Ethnic Structure and Cultural Diversity around theWorld: A Cross-National Data Set on Ethnic Groups, unpublished,Stanford University, August.
[24] Glaeser, E.(2002), “The Political Economy of Hatred”, unpublished,Harvard University, June.
[25] Glaeser, E. L., D. Laibson, J. A. Scheinkman and C. L. Soutter (2000),“Measuring Trust”, Quarterly Journal of Economics, vol. 65, August,pp. 811-846.
[26] Glaeser E. and A. Shleifer (2002), “Legal Origins”, Quarterly Journalof Economics, forthcoming.
24

[27] Goldin, C. and L. F. Katz (1999), “Human Capital and Social Capital:The Rise of Secondary Schooling in America, 1910-1940”, Journal ofInterdisciplinary History, vol. 29, no. 4, pp. 683-723.
[28] Hamilton J., J. Madison and J. Jay (1911), The Federalist. Everyman,London (first published in 1788)
[29] Hammersley, M. and P. Atkinson (1995), Ethnography: Principles inPractice (2nd edition), Routledge.
[30] Klein, H. (1992), Bolivia: the Evolution of a Multi-Ethnic Society, 2ndEdition, Oxford: Oxford University Press.
[31] La Porta R., F. Lopez de Silanes, A. Shleifer and R. Vishny (1999),“The Quality of Government”, Journal of Law, Economics and Orga-nization, vol. 15, no. 1, March, pp. 222-279.
[32] Levinson D. (1998) Ethnic Groups Worldwide, A Ready ReferenceHandbook, Phoenix: Oryx Press.
[33] Luttmer, Erzo F.P. (2001), “Group Loyalty and the Taste for Redistri-bution”, Journal of Political Economy, vol. 109 no. 3, June.
[34] Marcus, H. (1994), A History of Ethiopia, Berkeley: University of Cal-ifornia Press.
[35] Maier, K. (2000), This House Has Fallen: Midnight in Nigeria, NewYork: Public Affairs.
[36] Mauro P. (1995), “Corruption and Growth” Quarterly Journal of Eco-nomics, vol. 110, no. 3, August, pp. 681-712.
[37] Minority Rights Group International (1997), World Directory of Mi-norities, London: Minority Rights Group International.
[38] Garcia-Montalvo, José and Marta Reynal-Querol (2002), “Why EthnicFractionalization? Polarization, Ethnic Conflict and Growth”, unpub-lished, Universitat Pompeu Fabra, September.
[39] INSEE (2000), Recensement de la population 1999.
25
[40] Israel Central Bureau of Statistics (2001), 1995 Census of Populationand Housing, (available on-line).
[41] Rodrik D. (1998), “Why Do More Open Economies Have Bigger Gov-ernments?” Journal of Political Economy, vol. 106, no. 5, October, pp.997-1032.
[42] Scarrit J. and S. Mozaffar (1999), “The Specification of Ethnic Cleav-ages and Ethnopolitical Groups for the Analysis of Democratic Compe-tition in Contemporary Africa”, Nationalism and Ethnic Politics, vol.5, no.1, Spring, pp. 82-117.
[43] Statistics New Zealand (2001), 1996 Census (available on-line).
[44] Tronvoll, K. (2000), Ethiopia: A New Start? Minority Rights GroupInternational Report.
[45] United States Census Bureau (2001), 2000 Census (available on-line).
26
27
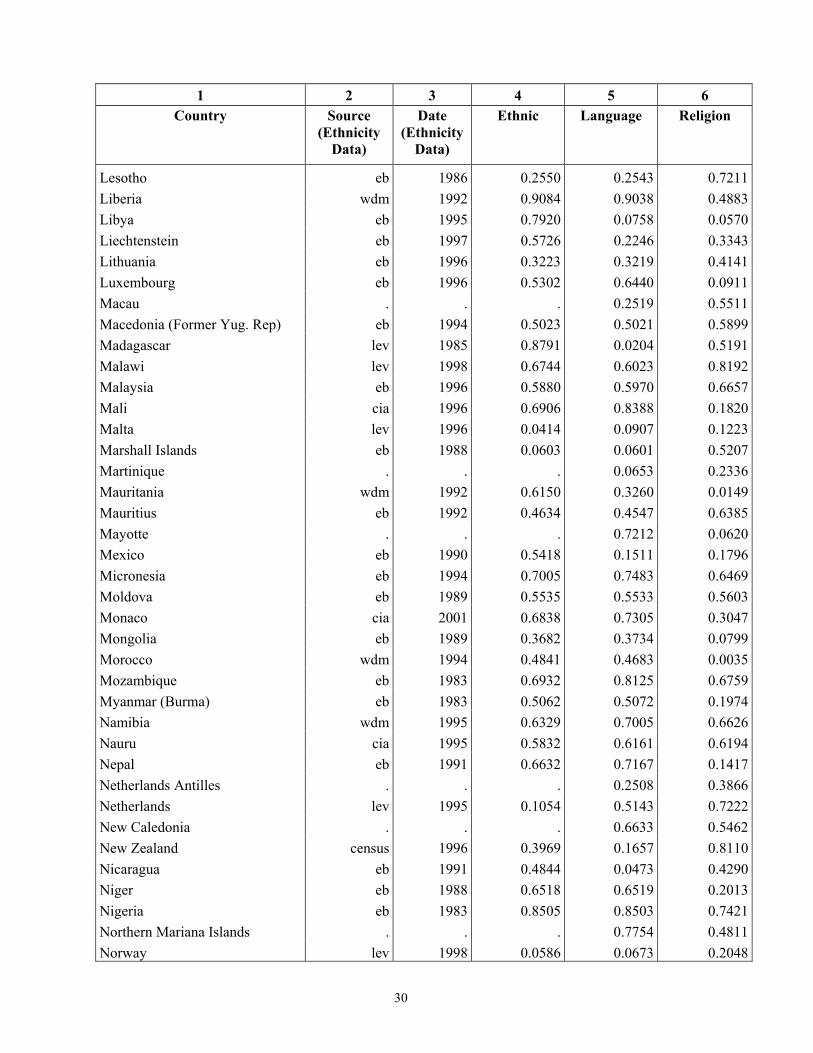
Appendix 1 – Fractionalization Data
1 2 3 4 5 6 Country Source
(Ethnicity Data)
Date (Ethnicity
Data)
Ethnic Language Religion
Source: see column 2. Date: see column 3.
Source: eb. Date: 2001.
Source: eb. Date: 2001.
Afghanistan wdm 1995 0.7693 0.6141 0.2717Albania wdm 1989 0.2204 0.0399 0.4719Algeria eb 1992 0.3394 0.4427 0.0091American Samoa . . . 0.1733 0.6395Andorra eb 1997 0.7139 0.6848 0.2326Angola eb 1983 0.7867 0.7870 0.6276Antigua and Barbuda eb 1994 0.1643 0.1063 0.6840Argentina eb 1986 0.2550 0.0618 0.2236Armenia eb 1989 0.1272 0.1291 0.4576Aruba . . . 0.3889 0.4107Australia eb 1986 0.0929 0.3349 0.8211Austria lev 1998 0.1068 0.1522 0.4146Azerbaijan eb 1995 0.2047 0.2054 0.4899Bahamas lev 1989 0.4228 0.1855 0.6815Bahrain eb 1991 0.5021 0.4344 0.5528Bangladesh eb 1997 0.0454 0.0925 0.2090Barbados eb 1990 0.1423 0.0926 0.6934Belarus cia 2001 0.3222 0.4666 0.6116Belgium cia 2001 0.5554 0.5409 0.2127Belize eb 1991 0.7015 0.6303 0.5813Benin eb 1992 0.7872 0.7905 0.5544Bermuda . . . . 0.7112Bhutan eb 1993 0.6050 0.6056 0.3787Bolivia lev 1998 0.7396 0.2240 0.2085Bosnia and Herzegovina eb 1991 0.6300 0.6751 0.6851Botswana eb 1983 0.4102 0.4110 0.5986Brazil eb 1995 0.5408 0.0468 0.6054Brunei wdm 1995 0.5416 0.3438 0.4404Bulgaria wdm 1992 0.4021 0.3031 0.5965Burkina Faso eb 1983 0.7377 0.7228 0.5798Burundi eb 1983 0.2951 0.2977 0.5158Cambodia eb 1994 0.2105 0.2104 0.0965Cameroon eb 1983 0.8635 0.8898 0.7338

28
1 2 3 4 5 6 Country Source
(Ethnicity Data)
Date (Ethnicity
Data)
Ethnic Language Religion
Canada eb 1991 0.7124 0.5772 0.6958Cape Verde eb 1986 0.4174 . 0.0766Central African Republic eb 1988 0.8295 0.8334 0.7916Chad eb 1993 0.8620 0.8635 0.6411Chile eb 1992 0.1861 0.1871 0.3841China eb 1990 0.1538 0.1327 0.6643Colombia eb 1985 0.6014 0.0193 0.1478Comoros eb 1995 0.0000 0.0103 0.0137Congo, Dem. Rep. (Zaire) eb 1983 0.8747 0.8705 0.7021Congo eb 1983 0.8747 0.6871 0.6642Costa Rica eb 1993 0.2368 0.0489 0.2410Cote d'Ivoire lev 1998 0.8204 0.7842 0.7551Croatia eb 1991 0.3690 0.0763 0.4447Cuba eb 1994 0.5908 . 0.5059Cyprus eb 1992 0.0939 0.3962 0.3962Czech Republic eb 1991 0.3222 0.3233 0.6591Denmark eb 1996 0.0819 0.1049 0.2333Djibouti eb 1983 0.7962 0.6558 0.0435Dominica eb 1991 0.2003 . 0.4628Dominican Republic eb 1993 0.4294 0.0395 0.3118East Timor . . . 0.5261 0.4254Ecuador eb 1989 0.6550 0.1308 0.1417Egypt lev 1998 0.1836 0.0237 0.1979El Salvador eb 1993 0.1978 . 0.3559Equatorial Guinea lev 1998 0.3467 0.3220 0.1195Eritrea lev 1998 0.6524 0.6530 0.4253Estonia eb 1994 0.5062 0.4944 0.4985Ethiopia eb 1983 0.7235 0.8073 0.6249Faroe Islands . . . . 0.3147Fiji eb 1996 0.5479 0.5479 0.5682Finland cia 2001 0.1315 0.1412 0.2531France census 1999 0.1032 0.1221 0.4029French Guiana . . . 0.1154 0.4959French Polynesia . . . 0.6078 0.5813Gabon eb 1983 0.7690 0.7821 0.6674Gambia, The eb 1993 0.7864 0.8076 0.0970Gaza Strip . . . 0.0104 0.0342Georgia eb 1989 0.4923 0.4749 0.6543

29
1 2 3 4 5 6 Country Source
(Ethnicity Data)
Date (Ethnicity
Data)
Ethnic Language Religion
Germany eb 1997 0.1682 0.1642 0.6571Ghana eb 1983 0.6733 0.6731 0.7987Greece lev 1998 0.1576 0.0300 0.1530Greenland . . . 0.2188 0.4592Grenada eb 1991 0.2661 . 0.5898Guadeloupe . . . 0.0933 0.3069Guam . . . 0.7320 0.4082Guatemala cia 2001 0.5122 0.4586 0.3753Guinea eb 1990 0.7389 0.7725 0.2649Guinea-Bissau eb 1979 0.8082 0.8141 0.6128Guyana eb 1993 0.6195 0.0688 0.7876Haiti eb 1993 0.0950 . 0.4704Honduras eb 1987 0.1867 0.0553 0.2357Hong Kong wdm 1994 0.0620 0.2128 0.4191Hungary eb 1993 0.1522 0.0297 0.5244Iceland eb 1995 0.0798 0.0820 0.1913India eb 2000 0.4182 0.8069 0.3260Indonesia eb 1990 0.7351 0.7680 0.2340Iran eb 1995 0.6684 0.7462 0.1152Iraq eb 1983 0.3689 0.3694 0.4844Ireland eb 1995 0.1206 0.0312 0.1550Isle of Man . . . . 0.4729Israel census 1995 0.3436 0.5525 0.3469Italy eb 1983 0.1145 0.1147 0.3027Jamaica eb 1982 0.4129 0.1098 0.6160Japan cia 1999 0.0119 0.0178 0.5406Jersey . . . . 0.5479Jordan wdm 1993 0.5926 0.0396 0.0659Kazakhstan cia 1999 0.6171 0.6621 0.5898Kenya cia 2001 0.8588 0.8860 0.7765Kiribati eb 1990 0.0511 0.0237 0.5541Korea, North eb 1995 0.0392 0.0028 0.4891Korea, South eb 1990 0.0020 0.0021 0.6604Kyrgyzstan cia 2001 0.6752 0.5949 0.4470Kuwait cia 2001 0.6604 0.3444 0.6745Lao People's Dem Rep eb 1983 0.5139 0.6382 0.5453Latvia eb 1996 0.5867 0.5795 0.5556Lebanon eb 1996 0.1314 0.1312 0.7886
30
1 2 3 4 5 6 Country Source
(Ethnicity Data)
Date (Ethnicity
Data)
Ethnic Language Religion
Lesotho eb 1986 0.2550 0.2543 0.7211Liberia wdm 1992 0.9084 0.9038 0.4883Libya eb 1995 0.7920 0.0758 0.0570Liechtenstein eb 1997 0.5726 0.2246 0.3343Lithuania eb 1996 0.3223 0.3219 0.4141Luxembourg eb 1996 0.5302 0.6440 0.0911Macau . . . 0.2519 0.5511Macedonia (Former Yug. Rep) eb 1994 0.5023 0.5021 0.5899Madagascar lev 1985 0.8791 0.0204 0.5191Malawi lev 1998 0.6744 0.6023 0.8192Malaysia eb 1996 0.5880 0.5970 0.6657Mali cia 1996 0.6906 0.8388 0.1820Malta lev 1996 0.0414 0.0907 0.1223Marshall Islands eb 1988 0.0603 0.0601 0.5207Martinique . . . 0.0653 0.2336Mauritania wdm 1992 0.6150 0.3260 0.0149Mauritius eb 1992 0.4634 0.4547 0.6385Mayotte . . . 0.7212 0.0620Mexico eb 1990 0.5418 0.1511 0.1796Micronesia eb 1994 0.7005 0.7483 0.6469Moldova eb 1989 0.5535 0.5533 0.5603Monaco cia 2001 0.6838 0.7305 0.3047Mongolia eb 1989 0.3682 0.3734 0.0799Morocco wdm 1994 0.4841 0.4683 0.0035Mozambique eb 1983 0.6932 0.8125 0.6759Myanmar (Burma) eb 1983 0.5062 0.5072 0.1974Namibia wdm 1995 0.6329 0.7005 0.6626Nauru cia 1995 0.5832 0.6161 0.6194Nepal eb 1991 0.6632 0.7167 0.1417Netherlands Antilles . . . 0.2508 0.3866Netherlands lev 1995 0.1054 0.5143 0.7222New Caledonia . . . 0.6633 0.5462New Zealand census 1996 0.3969 0.1657 0.8110Nicaragua eb 1991 0.4844 0.0473 0.4290Niger eb 1988 0.6518 0.6519 0.2013Nigeria eb 1983 0.8505 0.8503 0.7421Northern Mariana Islands . . . 0.7754 0.4811Norway lev 1998 0.0586 0.0673 0.2048

31
1 2 3 4 5 6 Country Source
(Ethnicity Data)
Date (Ethnicity
Data)
Ethnic Language Religion
Oman eb 1993 0.4373 0.3567 0.4322Pakistan wdm 1995 0.7098 0.7190 0.3848Palau cia 2000 0.4312 0.3157 0.7147Panama eb 1992 0.5528 0.3873 0.3338Papua New Guinea eb 1993 0.2718 0.3526 0.5523Paraguay lev 1998 0.1689 0.5975 0.2123Peru eb 1981 0.6566 0.3358 0.1988Philippines lev 1998 0.2385 0.8360 0.3056Poland lev 1998 0.1183 0.0468 0.1712Portugal lev 1998 0.0468 0.0198 0.1438Puerto Rico . . . 0.0352 0.4952Qatar cia 2001 0.7456 0.4800 0.0950Reunion . . . 0.1578 0.1952Romania lev 1998 0.3069 0.1723 0.2373Russian Federation eb 1997 0.2452 0.2485 0.4398Rwanda eb 1996 0.3238 . 0.5066Saint Lucia eb 1990 0.1769 0.3169 0.3320Saint Vincent and Grenadines eb 1995 0.3066 0.0175 0.7028Western Samoa eb 1995 0.1376 0.0111 0.7871San Marino eb 1997 0.2927 . 0.1975Sao Tome and Principe . . . 0.2322 0.1866Saudi Arabia eb 1995 0.1800 0.0949 0.1270Senegal eb 1988 0.6939 0.6961 0.1497Serbia/Montenegro (Yugoslavia) eb 1991 0.5736 . .Seychelles eb 1983 0.2025 0.1606 0.2323Sierra Leone wdm 1993 0.8191 0.7634 0.5395Singapore cia 2001 0.3857 0.3835 0.6561Slovak Republic eb 1996 0.2539 0.2551 0.5655Slovenia cia 1991 0.2216 0.2201 0.2868Solomon Islands eb 1986 0.1110 0.5254 0.6708Somalia sm 1999 0.8117 0.0326 0.0028South Africa lev 1998 0.7517 0.8652 0.8603Spain eb 1991 0.4165 0.4132 0.4514Sri Lanka cia 2001 0.4150 0.4645 0.4853St Kitts & Nevis lev 1998 0.1842 . 0.6614Sudan eb 1983 0.7147 0.7190 0.4307Suriname cia 2001 0.7332 0.3310 0.7910Swaziland cia 2001 0.0582 0.1722 0.4444
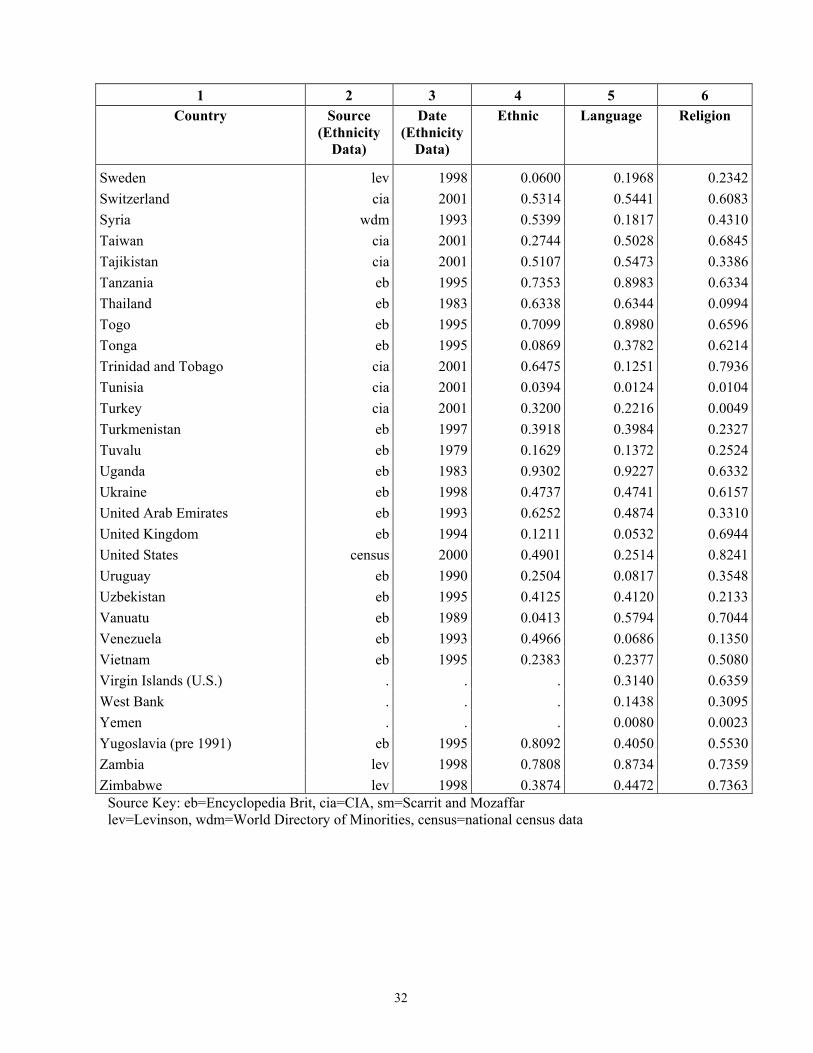
32
1 2 3 4 5 6 Country Source
(Ethnicity Data)
Date (Ethnicity
Data)
Ethnic Language Religion
Sweden lev 1998 0.0600 0.1968 0.2342Switzerland cia 2001 0.5314 0.5441 0.6083Syria wdm 1993 0.5399 0.1817 0.4310Taiwan cia 2001 0.2744 0.5028 0.6845Tajikistan cia 2001 0.5107 0.5473 0.3386Tanzania eb 1995 0.7353 0.8983 0.6334Thailand eb 1983 0.6338 0.6344 0.0994Togo eb 1995 0.7099 0.8980 0.6596Tonga eb 1995 0.0869 0.3782 0.6214Trinidad and Tobago cia 2001 0.6475 0.1251 0.7936Tunisia cia 2001 0.0394 0.0124 0.0104Turkey cia 2001 0.3200 0.2216 0.0049Turkmenistan eb 1997 0.3918 0.3984 0.2327Tuvalu eb 1979 0.1629 0.1372 0.2524Uganda eb 1983 0.9302 0.9227 0.6332Ukraine eb 1998 0.4737 0.4741 0.6157United Arab Emirates eb 1993 0.6252 0.4874 0.3310United Kingdom eb 1994 0.1211 0.0532 0.6944United States census 2000 0.4901 0.2514 0.8241Uruguay eb 1990 0.2504 0.0817 0.3548Uzbekistan eb 1995 0.4125 0.4120 0.2133Vanuatu eb 1989 0.0413 0.5794 0.7044Venezuela eb 1993 0.4966 0.0686 0.1350Vietnam eb 1995 0.2383 0.2377 0.5080Virgin Islands (U.S.) . . . 0.3140 0.6359West Bank . . . 0.1438 0.3095Yemen . . . 0.0080 0.0023Yugoslavia (pre 1991) eb 1995 0.8092 0.4050 0.5530Zambia lev 1998 0.7808 0.8734 0.7359Zimbabwe lev 1998 0.3874 0.4472 0.7363
Source Key: eb=Encyclopedia Brit, cia=CIA, sm=Scarrit and Mozaffar lev=Levinson, wdm=World Directory of Minorities, census=national census data
33
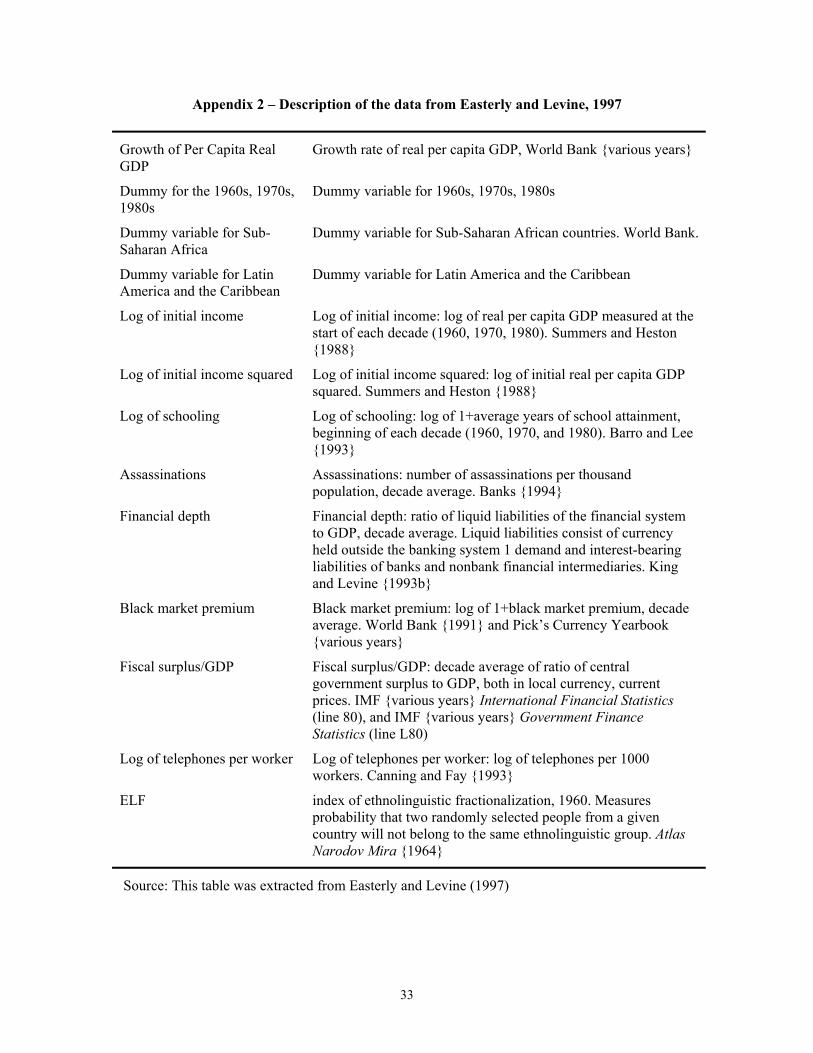
Appendix 2 – Description of the data from Easterly and Levine, 1997
Growth of Per Capita Real GDP
Growth rate of real per capita GDP, World Bank {various years}
Dummy for the 1960s, 1970s, 1980s
Dummy variable for 1960s, 1970s, 1980s
Dummy variable for Sub-Saharan Africa
Dummy variable for Sub-Saharan African countries. World Bank.
Dummy variable for Latin America and the Caribbean
Dummy variable for Latin America and the Caribbean
Log of initial income Log of initial income: log of real per capita GDP measured at the start of each decade (1960, 1970, 1980). Summers and Heston {1988}
Log of initial income squared Log of initial income squared: log of initial real per capita GDP squared. Summers and Heston {1988}
Log of schooling Log of schooling: log of 1+average years of school attainment, beginning of each decade (1960, 1970, and 1980). Barro and Lee {1993}
Assassinations Assassinations: number of assassinations per thousand population, decade average. Banks {1994}
Financial depth Financial depth: ratio of liquid liabilities of the financial system to GDP, decade average. Liquid liabilities consist of currency held outside the banking system 1 demand and interest-bearing liabilities of banks and nonbank financial intermediaries. King and Levine {1993b}
Black market premium Black market premium: log of 1+black market premium, decade average. World Bank {1991} and Pick’s Currency Yearbook {various years}
Fiscal surplus/GDP Fiscal surplus/GDP: decade average of ratio of central government surplus to GDP, both in local currency, current prices. IMF {various years} International Financial Statistics (line 80), and IMF {various years} Government Finance Statistics (line L80)
Log of telephones per worker Log of telephones per worker: log of telephones per 1000 workers. Canning and Fay {1993}
ELF index of ethnolinguistic fractionalization, 1960. Measures probability that two randomly selected people from a given country will not belong to the same ethnolinguistic group. Atlas Narodov Mira {1964}
Source: This table was extracted from Easterly and Levine (1997)
34
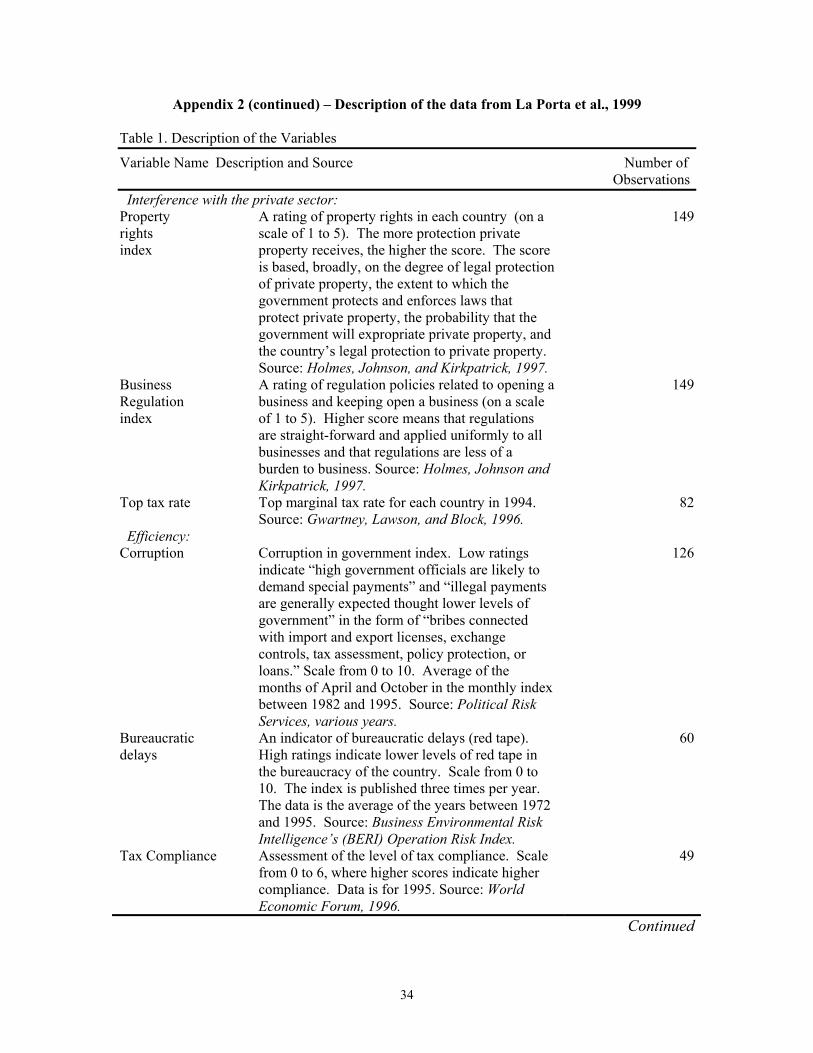
Appendix 2 (continued) – Description of the data from La Porta et al., 1999 Table 1. Description of the Variables
Variable Name Description and Source Number of Observations Interference with the private sector: Property rights index
A rating of property rights in each country (on a scale of 1 to 5). The more protection private property receives, the higher the score. The score is based, broadly, on the degree of legal protection of private property, the extent to which the government protects and enforces laws that protect private property, the probability that the government will expropriate private property, and the country’s legal protection to private property. Source: Holmes, Johnson, and Kirkpatrick, 1997.
149
Business Regulation index
A rating of regulation policies related to opening a business and keeping open a business (on a scale of 1 to 5). Higher score means that regulations are straight-forward and applied uniformly to all businesses and that regulations are less of a burden to business. Source: Holmes, Johnson and Kirkpatrick, 1997.
149
Top tax rate Top marginal tax rate for each country in 1994. Source: Gwartney, Lawson, and Block, 1996.
82
Efficiency: Corruption Corruption in government index. Low ratings
indicate “high government officials are likely to demand special payments” and “illegal payments are generally expected thought lower levels of government” in the form of “bribes connected with import and export licenses, exchange controls, tax assessment, policy protection, or loans.” Scale from 0 to 10. Average of the months of April and October in the monthly index between 1982 and 1995. Source: Political Risk Services, various years.
126
Bureaucratic delays
An indicator of bureaucratic delays (red tape). High ratings indicate lower levels of red tape in the bureaucracy of the country. Scale from 0 to 10. The index is published three times per year. The data is the average of the years between 1972 and 1995. Source: Business Environmental Risk Intelligence’s (BERI) Operation Risk Index.
60
Tax Compliance Assessment of the level of tax compliance. Scale from 0 to 6, where higher scores indicate higher compliance. Data is for 1995. Source: World Economic Forum, 1996.
49
Continued
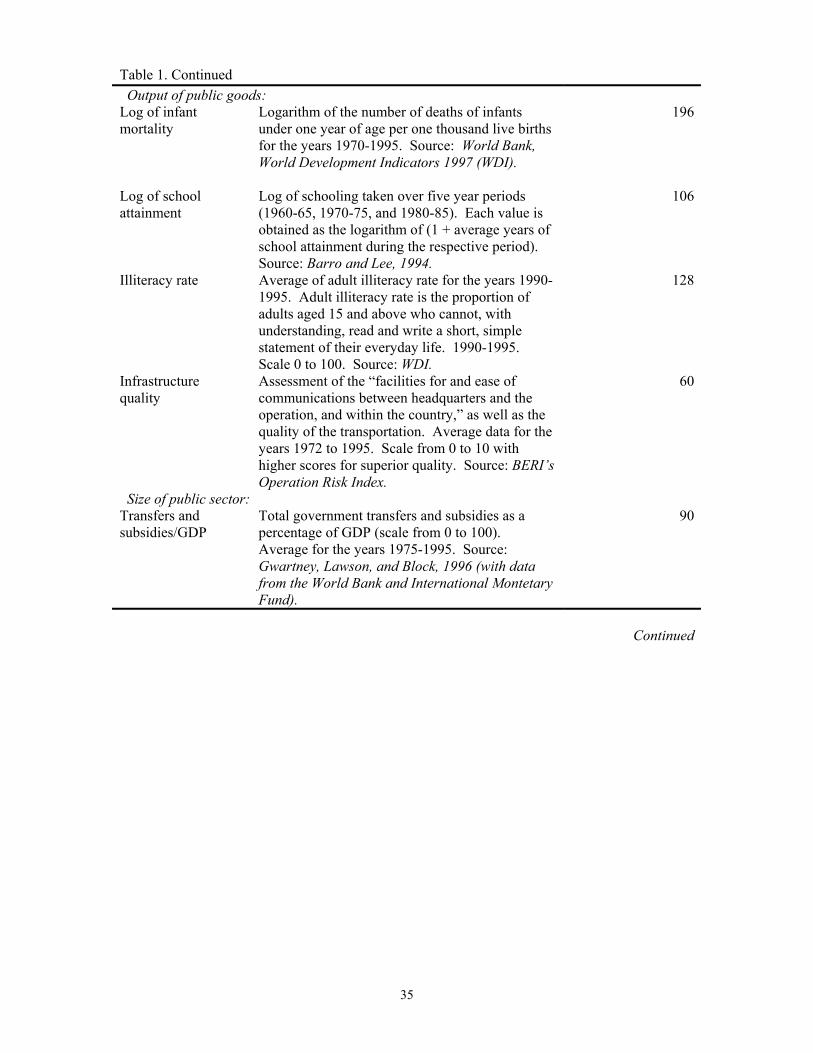
35
Table 1. Continued Output of public goods: Log of infant mortality
Logarithm of the number of deaths of infants under one year of age per one thousand live births for the years 1970-1995. Source: World Bank, World Development Indicators 1997 (WDI).
196
Log of school attainment
Log of schooling taken over five year periods (1960-65, 1970-75, and 1980-85). Each value is obtained as the logarithm of (1 + average years of school attainment during the respective period). Source: Barro and Lee, 1994.
106
Illiteracy rate Average of adult illiteracy rate for the years 1990-1995. Adult illiteracy rate is the proportion of adults aged 15 and above who cannot, with understanding, read and write a short, simple statement of their everyday life. 1990-1995. Scale 0 to 100. Source: WDI.
128
Infrastructure quality
Assessment of the “facilities for and ease of communications between headquarters and the operation, and within the country,” as well as the quality of the transportation. Average data for the years 1972 to 1995. Scale from 0 to 10 with higher scores for superior quality. Source: BERI’s Operation Risk Index.
60
Size of public sector: Transfers and subsidies/GDP
Total government transfers and subsidies as a percentage of GDP (scale from 0 to 100). Average for the years 1975-1995. Source: Gwartney, Lawson, and Block, 1996 (with data from the World Bank and International Montetary Fund).
90
Continued
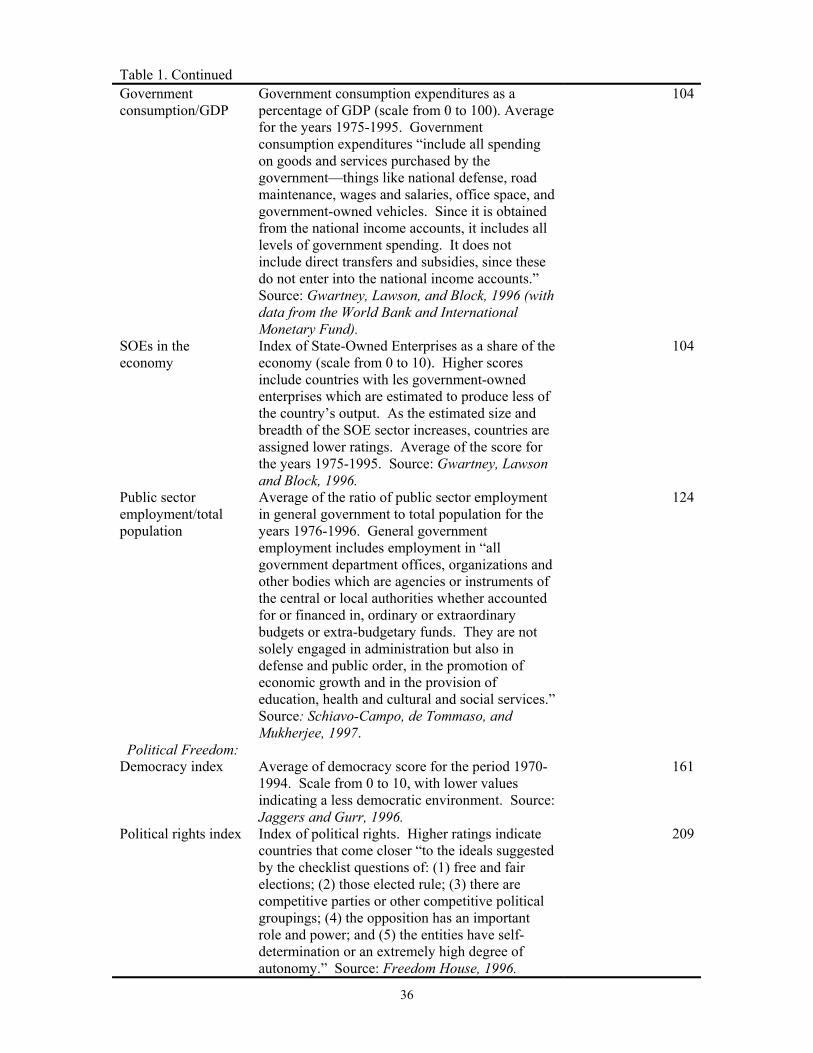
36
Table 1. Continued Government consumption/GDP
Government consumption expenditures as a percentage of GDP (scale from 0 to 100). Average for the years 1975-1995. Government consumption expenditures “include all spending on goods and services purchased by the government—things like national defense, road maintenance, wages and salaries, office space, and government-owned vehicles. Since it is obtained from the national income accounts, it includes all levels of government spending. It does not include direct transfers and subsidies, since these do not enter into the national income accounts.” Source: Gwartney, Lawson, and Block, 1996 (with data from the World Bank and International Monetary Fund).
104
SOEs in the economy
Index of State-Owned Enterprises as a share of the economy (scale from 0 to 10). Higher scores include countries with les government-owned enterprises which are estimated to produce less of the country’s output. As the estimated size and breadth of the SOE sector increases, countries are assigned lower ratings. Average of the score for the years 1975-1995. Source: Gwartney, Lawson and Block, 1996.
104
Public sector employment/total population
Average of the ratio of public sector employment in general government to total population for the years 1976-1996. General government employment includes employment in “all government department offices, organizations and other bodies which are agencies or instruments of the central or local authorities whether accounted for or financed in, ordinary or extraordinary budgets or extra-budgetary funds. They are not solely engaged in administration but also in defense and public order, in the promotion of economic growth and in the provision of education, health and cultural and social services.” Source: Schiavo-Campo, de Tommaso, and Mukherjee, 1997.
124
Political Freedom: Democracy index Average of democracy score for the period 1970-
1994. Scale from 0 to 10, with lower values indicating a less democratic environment. Source: Jaggers and Gurr, 1996.
161
Political rights index Index of political rights. Higher ratings indicate countries that come closer “to the ideals suggested by the checklist questions of: (1) free and fair elections; (2) those elected rule; (3) there are competitive parties or other competitive political groupings; (4) the opposition has an important role and power; and (5) the entities have self-determination or an extremely high degree of autonomy.” Source: Freedom House, 1996.
209
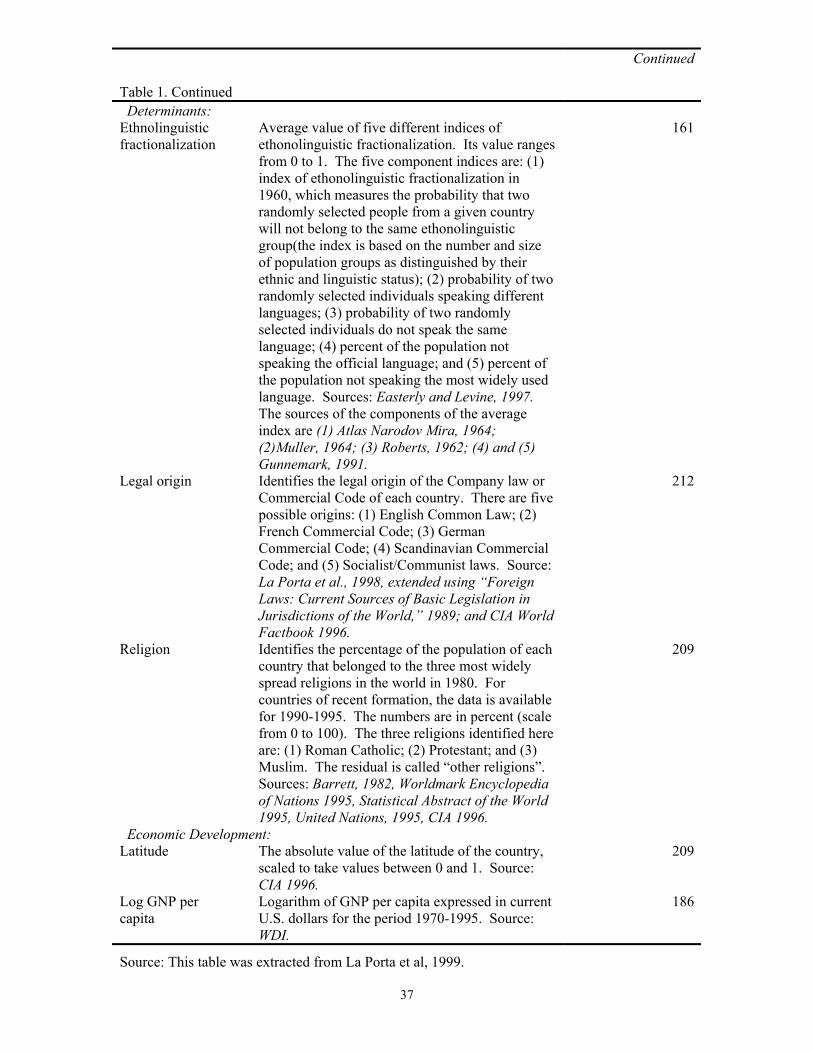
37
Continued
Table 1. Continued Determinants: Ethnolinguistic fractionalization
Average value of five different indices of ethonolinguistic fractionalization. Its value ranges from 0 to 1. The five component indices are: (1) index of ethonolinguistic fractionalization in 1960, which measures the probability that two randomly selected people from a given country will not belong to the same ethonolinguistic group(the index is based on the number and size of population groups as distinguished by their ethnic and linguistic status); (2) probability of two randomly selected individuals speaking different languages; (3) probability of two randomly selected individuals do not speak the same language; (4) percent of the population not speaking the official language; and (5) percent of the population not speaking the most widely used language. Sources: Easterly and Levine, 1997. The sources of the components of the average index are (1) Atlas Narodov Mira, 1964; (2)Muller, 1964; (3) Roberts, 1962; (4) and (5) Gunnemark, 1991.
161
Legal origin Identifies the legal origin of the Company law or Commercial Code of each country. There are five possible origins: (1) English Common Law; (2) French Commercial Code; (3) German Commercial Code; (4) Scandinavian Commercial Code; and (5) Socialist/Communist laws. Source: La Porta et al., 1998, extended using “Foreign Laws: Current Sources of Basic Legislation in Jurisdictions of the World,” 1989; and CIA World Factbook 1996.
212
Religion Identifies the percentage of the population of each country that belonged to the three most widely spread religions in the world in 1980. For countries of recent formation, the data is available for 1990-1995. The numbers are in percent (scale from 0 to 100). The three religions identified here are: (1) Roman Catholic; (2) Protestant; and (3) Muslim. The residual is called “other religions”. Sources: Barrett, 1982, Worldmark Encyclopedia of Nations 1995, Statistical Abstract of the World 1995, United Nations, 1995, CIA 1996.
209
Economic Development: Latitude The absolute value of the latitude of the country,
scaled to take values between 0 and 1. Source: CIA 1996.
209
Log GNP per capita
Logarithm of GNP per capita expressed in current U.S. dollars for the period 1970-1995. Source: WDI.
186
Source: This table was extracted from La Porta et al, 1999.

38
Table 1 – Sample Means of the Fractionalization Measures
Variable # of Observations Sample Mean Religion 198 0.439Ethnic 180 0.435Language 185 0.385ELF 112 0.418
Table 2 - Pairwise Correlations of the Fractionalization Measures
Religion Ethnic Language ELF Religion 1 (198) Ethnic 0.142 1 (180) (180) Language 0.269 0.697 1 (185) (171) (185) ELF 0.372 0.759 0.878 1 (111) (110) (108) (112) Number of observations in parentheses
Table 3 – Sample Means by Region
Sample restricted to countries available in
Soviet Data Unrestricted Sample
ELF ethnic language religion ethnic language religion
Latin America and Carribean 0.265 0.418 0.159 0.367 0.405 0.179 0.442 (23) (23) (21) (23) (33) (32) (40) Subsaharan Africa 0.651 0.711 0.689 0.560 0.658 0.625 0.496 (38) (38) (37) (38) (47) (47) (49) Eastern and Central Europe 0.315 0.319 0.348 0.512 0.366 0.320 0.491 (2) (2) (2) (2) (20) (20) (20) Western and Southern Europe 0.147 0.170 0.198 0.285 0.177 0.196 0.311 (17) (16) (16) (16) (18) (17) (20) Middle East 0.244 0.431 0.304 0.294 0.453 0.330 0.346 (9) (8) (9) (9) (13) (14) (14) East and South East Asia 0.462 0.365 0.460 0.460 0.306 0.353 0.457 (10) (10) (10) (10) (16) (17) (17) Number of observations in parentheses

39
Table 4 – Correlations between Fractionalization, Growth and its Determinants
ethnic language religion growth rgdpch60 bmp assas human Language 0.697 1 (171) (185) Religion 0.142 0.269 1 (180) (185) (198) Growth -0.471 -0.305 -0.103 1 (119) (115) (119) (120) Log Initial Income 1960 -0.330 -0.293 0.049 0.137 1 (118) (114) (118) (119) (119) Black Market Premium 0.102 0.096 -0.041 -0.260 -0.277 1 (96) (93) (96) (91) (91) (97) Assasinations -0.110 -0.027 -0.080 -0.079 -0.003 -0.012 1 (90) (89) (91) (87) (87) (79) (92) Schooling -0.459 -0.387 0.122 0.328 0.816 -0.225 -0.117 1 (97) (94) (97) (91) (90) (81) (71) (98) Phones per capita -0.356 -0.248 0.084 0.337 0.895 -0.271 -0.080 0.828 (133) (128) (134) (119) (118) (96) (91) (97) Number of observations in parentheses

40
Table 5 - Ethnic Diversity and Long-Run Growth (Dependent variable is growth of per capita real GDP)
Variable (1) (2) (3) (4)
Dummy for the 1960s -0.086 (-0.99)
-0.109 (-1.24)
-0.222 (-2.22)
-0.259 (-2.47)
Dummy for the 1970s -0.089 (-1.02)
-0.111 (-1.27)
-0.218 (-2.19)
-0.253 (-2.42)
Dummy for the 1980s -0.109 (-1.25)
-0.131 (-1.50)
-0.236 (-2.36)
-0.269 (-2.57)
Dummy variable for Sub-Saharan Africa
-0.008 (-1.70)
-0.009 (-1.99)
-0.011 (-2.05)
-0.015 (-2.76)
Dummy variable for Latin America and the Caribbean
-0.018 (-4.87)
-0.017 (-4.54)
-0.013 (-3.55)
-0.015 (-4.01)
Log of initial income 0.035 (1.55)
0.041 (1.84)
0.073 (2.85)
0.088 (3.34)
Log of initial income squared -0.003 (-1.77)
-0.003 (-2.09)
-0.005 (-3.24)
-0.007 (-4.06)
Log of schooling 0.013 (3.06)
0.013 (3.16)
0.013 (3.03)
0.009 (1.84)
Assassinations -24.728 (-2.42)
-17.654 (-1.86)
-22.55 (-2.46)
Financial depth 0.017 (2.89)
0.013 (2.12)
Black market premium -0.020 (-4.14)
-0.020 (-4.14)
Fiscal surplus/GDP 0.101 (3.06)
0.163 (4.26)
Log of telephones per worker 0.007 (2.52)
Ethnic -0.019(-2.97)
-0.018(-2.84)
-0.009 (-1.41)
-0.005(-0.68)
No. of observations 82; 88; 94 77; 87; 93 44; 71; 74 40; 69; 66
R2 .25; .22; .36 .24; .22; .38 .39; .45; .52 .39; .51; .58
(t-statistics are in parentheses) Estimated using Seemingly Unrelated Regressions: a separate regression for each 10 year period. See the Data Appendix for definitions and sources.

41
Table 6 – Ethnicity as a Determinant of Economic Indicators
Dependent Variable
C
ETHNIC
R2
Number of observations
Log of schooling 1.963 (26.85)
-1.394 (-9.83)
0.19; 0.23; 0.17 94 ; 95 ; 102
Assassinations 9.79E-06 (1.07)
6.47E-06 (0.38)
-0.01; -0.06; -0.02 99; 109; 109
Financial depth 0.465 (12.42)
-0.353 (-5.03)
0.22; 0.12; 0.03 95; 103; 106
Black market premium 0.178 (3.61)
0.104 (1.12)
-0.01; 0.02; -0.03 105; 119; 120
Fiscal surplus/GDP -0.022 (-4.42)
-0.020 (-2.13)
-0.08; -0.01; -0.06 56; 94; 100
Log of telephones per worker
4.982 (20.72)
-3.909 (-9.29)
0.26; 0.31; 0.13 98; 105; 95
(t-statistics are in parentheses) Equations estimated using Seemingly Unrelated Regression procedures.

42
Table 7 - Language Diversity and Long-Run Growth (dependent variable is growth of per capita real GDP)
Variable (1) (2) (3) (4)
Dummy for the 1960s -0.056 (-0.63)
-0.070 (-0.77)
-0.166 (-1.60)
-0.226 (-2.13)
Dummy for the 1970s -0.058 (-0.66)
-0.072 (-0.80)
-0.162 (-1.57)
-0.219 (-2.07)
Dummy for the 1980s -0.077 (-0.87)
-0.091 (-1.00)
-0.177 (-1.72)
-0.235 (-2.22)
Dummy variable for Sub-Saharan Africa
-0.009 (-1.81)
-0.010 (-2.09)
-0.011 (-2.20)
-0.014 (-2.53)
Dummy variable for Latin America and the Caribbean
-0.023 (-6.02)
-0.022 (-5.78)
-0.018 (-4.69)
-0.019 (-4.67)
Log of initial income 0.030 (1.29)
0.034 (1.45)
0.062 (2.36)
0.080 (3.03)
Log of initial income squared -0.002 (-1.58)
-0.003 (-1.75)
-0.005 (-2.81)
-0.006 (-3.75)
Log of schooling 0.012 (2.93)
0.012 (2.92)
0.011 (2.65)
0.010 (2.19)
Assassinations -18.254 (-1.30)
-10.126 (-0.76)
-16.068 (-1.23)
Financial depth 0.015 (2.57)
0.012 (1.98)
Black market premium -0.023 (-4.64)
-0.020 (-4.16)
Fiscal surplus/GDP 0.088 (2.68)
0.162 (4.26)
Log of telephones per worker 0.005 (1.99)
LANGUAGE -0.025(-3.73)
-0.024(-3.59)
-0.020 (-3.03)
-0.013(-1.85)
No. of observations 80; 86; 92 75; 85; 91 43; 69; 73 39; 68; 65
R2 0.24; 0.26; 0.30
0.23; 0.26; 0.31
0.42; 0.48; 0.49
0.42; 0.53; 0.57
(t-statistics are in parentheses.) Estimated using Seemingly Unrelated Regressions: a separate regression for each period. See the Data Appendix for definitions and sources.
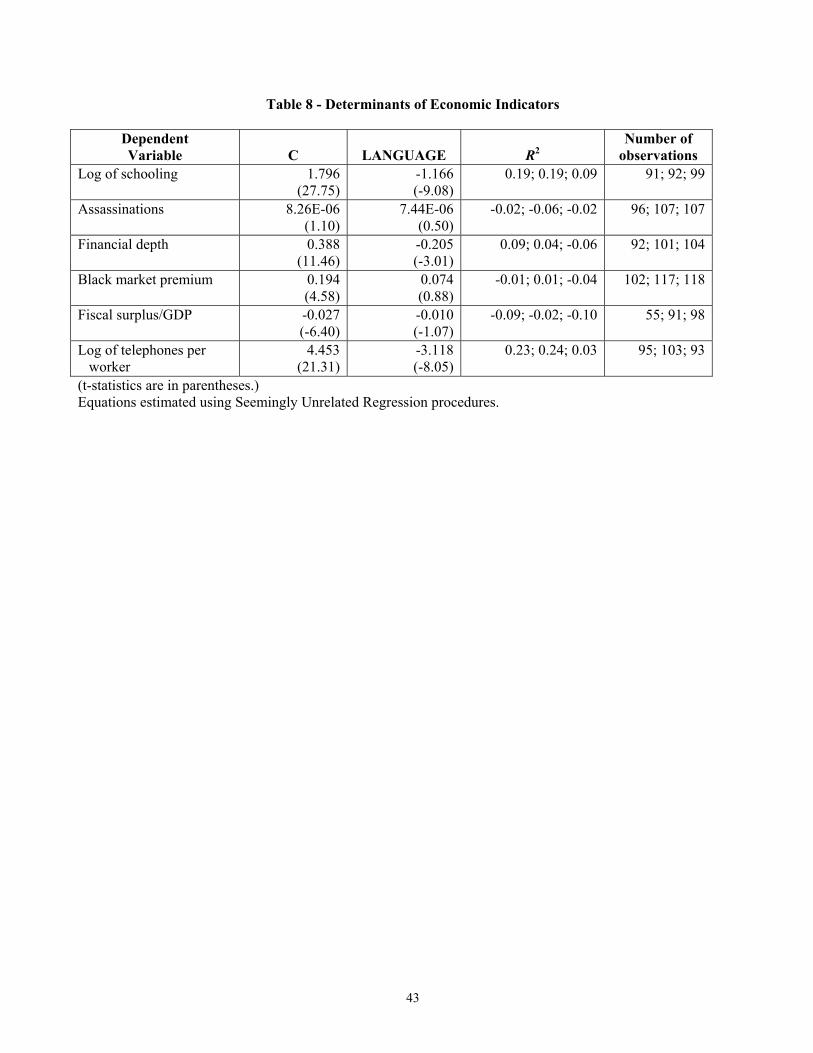
43
Table 8 - Determinants of Economic Indicators
Dependent Variable
C
LANGUAGE
R2
Number of observations
Log of schooling 1.796 (27.75)
-1.166 (-9.08)
0.19; 0.19; 0.09 91; 92; 99
Assassinations 8.26E-06 (1.10)
7.44E-06 (0.50)
-0.02; -0.06; -0.02 96; 107; 107
Financial depth 0.388 (11.46)
-0.205 (-3.01)
0.09; 0.04; -0.06 92; 101; 104
Black market premium 0.194 (4.58)
0.074 (0.88)
-0.01; 0.01; -0.04 102; 117; 118
Fiscal surplus/GDP -0.027 (-6.40)
-0.010 (-1.07)
-0.09; -0.02; -0.10 55; 91; 98
Log of telephones per worker
4.453 (21.31)
-3.118 (-8.05)
0.23; 0.24; 0.03 95; 103; 93
(t-statistics are in parentheses.) Equations estimated using Seemingly Unrelated Regression procedures.
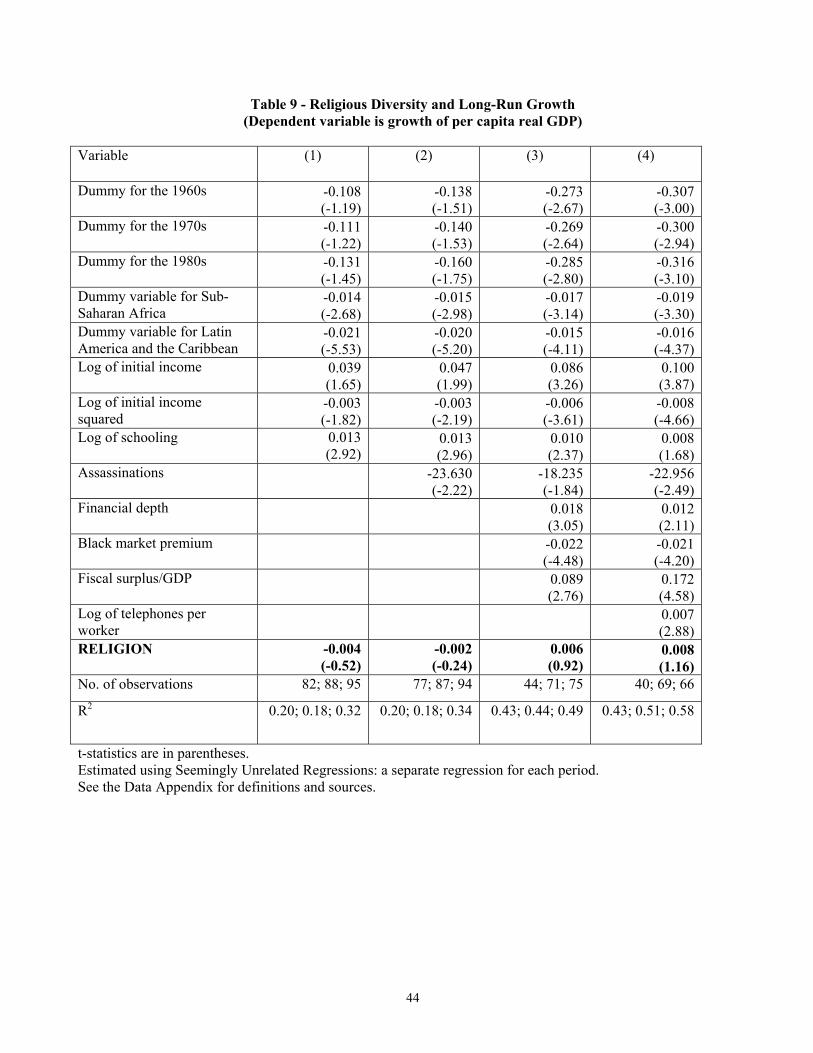
44
Table 9 - Religious Diversity and Long-Run Growth (Dependent variable is growth of per capita real GDP)
Variable (1) (2) (3) (4)
Dummy for the 1960s -0.108 (-1.19)
-0.138 (-1.51)
-0.273 (-2.67)
-0.307 (-3.00)
Dummy for the 1970s -0.111 (-1.22)
-0.140 (-1.53)
-0.269 (-2.64)
-0.300 (-2.94)
Dummy for the 1980s -0.131 (-1.45)
-0.160 (-1.75)
-0.285 (-2.80)
-0.316 (-3.10)
Dummy variable for Sub-Saharan Africa
-0.014 (-2.68)
-0.015 (-2.98)
-0.017 (-3.14)
-0.019 (-3.30)
Dummy variable for Latin America and the Caribbean
-0.021 (-5.53)
-0.020 (-5.20)
-0.015 (-4.11)
-0.016 (-4.37)
Log of initial income 0.039 (1.65)
0.047 (1.99)
0.086 (3.26)
0.100 (3.87)
Log of initial income squared
-0.003 (-1.82)
-0.003 (-2.19)
-0.006 (-3.61)
-0.008 (-4.66)
Log of schooling 0.013 (2.92)
0.013 (2.96)
0.010 (2.37)
0.008 (1.68)
Assassinations -23.630 (-2.22)
-18.235 (-1.84)
-22.956 (-2.49)
Financial depth 0.018 (3.05)
0.012 (2.11)
Black market premium -0.022 (-4.48)
-0.021 (-4.20)
Fiscal surplus/GDP 0.089 (2.76)
0.172 (4.58)
Log of telephones per worker
0.007 (2.88)
RELIGION -0.004(-0.52)
-0.002(-0.24)
0.006 (0.92)
0.008(1.16)
No. of observations 82; 88; 95 77; 87; 94 44; 71; 75 40; 69; 66
R2 0.20; 0.18; 0.32 0.20; 0.18; 0.34 0.43; 0.44; 0.49 0.43; 0.51; 0.58
t-statistics are in parentheses. Estimated using Seemingly Unrelated Regressions: a separate regression for each period. See the Data Appendix for definitions and sources.

45
Table 10 – Religion as a Determinant of Economic Indicators
Dependent Variable
C
RELIGION
R2
Number of observations
Log of schooling 1.160 (11.99)
0.358 (1.91)
0.01; -0.01; -0.14 94; 95; 103
Assassinations 1.77E-05 (1.93)
-1.13E-05 (-0.61)
-0.01; -0.06; -0.02 99; 110; 110
Financial depth 0.292 (7.06)
0.012 (0.15)
-0.01; -0.04; -0.17 95; 104; 107
Black market premium 0.222 (4.29)
0.004 (0.04)
-0.01; 0.00; -0.05 105; 120; 121
Fiscal surplus/GDP -0.027 (-5.25)
-0.008 (-0.78)
-0.14; -0.02; -0.08 56; 95; 101
Log of telephones per worker
2.759 (9.77)
0.321 (0.59)
0.00; -0.12; -0.45 98; 105; 95
t-statistics are in parentheses. Equations estimated using Seemingly Unrelated Regression procedures. Table 11 – Correlations of Fractionalization Measures and the Determinants of the Quality of Government
log gnp
pc latitude leg_or uk leg_or soc leg_or frleg_or
ger leg_or scan ethnic language
Latitude 0.5314 (185) leg_or uk -0.0960 -0.2758 (184) (205) leg_or soc -0.0193 0.4426 -0.3223 (184) (205) (212) leg_or fr -0.1651 -0.2429 -0.6345 -0.3894 (184) (205) (212) (212) leg_or ger 0.2687 0.1745 -0.1339 -0.0822 -0.1618 (184) (205) (212) (212) (212) leg_or scan 0.2817 0.3382 -0.1126 -0.0691 -0.1361 -0.0287 (184) (205) (212) (212) (212) (212) ethnic -0.3929 -0.3816 0.0144 -0.1104 0.2085 -0.1561 -0.2324 (173) (183) (185) (185) (185) (185) (185) language -0.3639 -0.2679 0.1483 -0.0741 0.0140 -0.1157 -0.1629 0.6981 (174) (193) (191) (191) (191) (191) (191) (176) religion 0.0269 -0.1138 0.3632 0.0433 -0.3656 0.1012 -0.1481 0.1520 0.2718 (183) (205) (204) (204) (204) (204) (204) (185) (195)
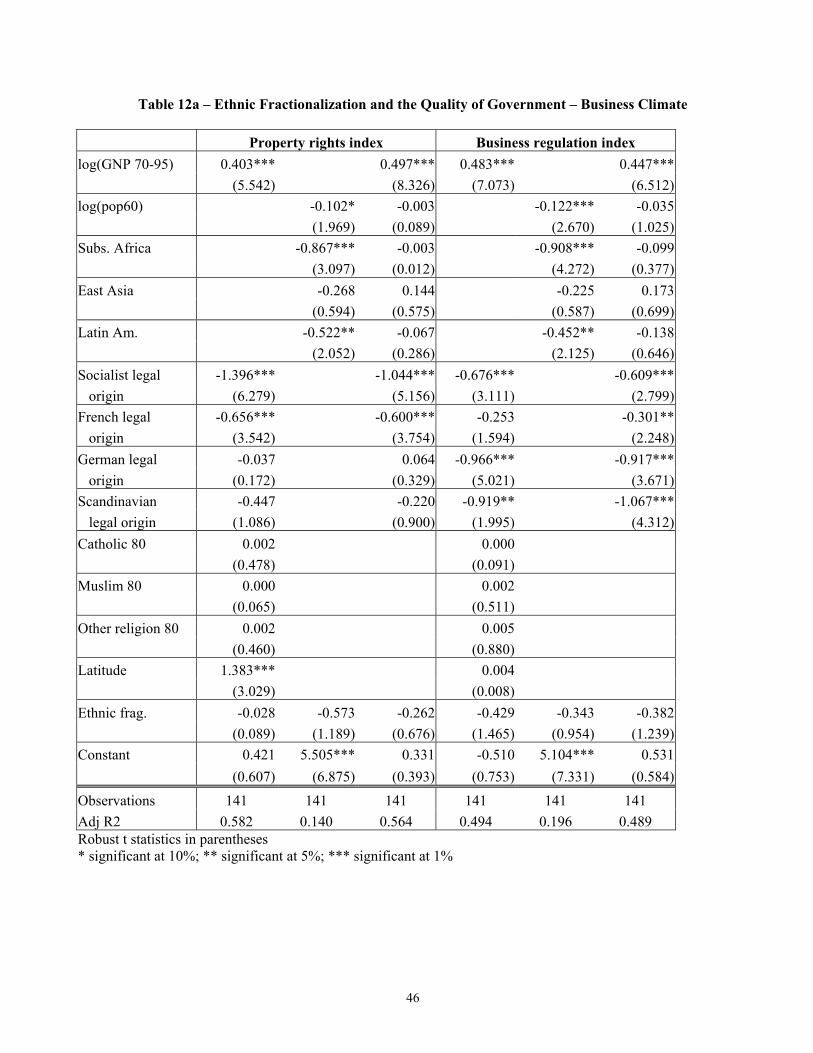
46
Table 12a – Ethnic Fractionalization and the Quality of Government – Business Climate
Property rights index Business regulation index log(GNP 70-95) 0.403*** 0.497*** 0.483*** 0.447*** (5.542) (8.326) (7.073) (6.512)log(pop60) -0.102* -0.003 -0.122*** -0.035 (1.969) (0.089) (2.670) (1.025)Subs. Africa -0.867*** -0.003 -0.908*** -0.099 (3.097) (0.012) (4.272) (0.377)East Asia -0.268 0.144 -0.225 0.173 (0.594) (0.575) (0.587) (0.699)Latin Am. -0.522** -0.067 -0.452** -0.138 (2.052) (0.286) (2.125) (0.646)Socialist legal -1.396*** -1.044*** -0.676*** -0.609*** origin (6.279) (5.156) (3.111) (2.799)French legal -0.656*** -0.600*** -0.253 -0.301** origin (3.542) (3.754) (1.594) (2.248)German legal -0.037 0.064 -0.966*** -0.917*** origin (0.172) (0.329) (5.021) (3.671)Scandinavian -0.447 -0.220 -0.919** -1.067*** legal origin (1.086) (0.900) (1.995) (4.312)Catholic 80 0.002 0.000 (0.478) (0.091) Muslim 80 0.000 0.002 (0.065) (0.511) Other religion 80 0.002 0.005 (0.460) (0.880) Latitude 1.383*** 0.004 (3.029) (0.008) Ethnic frag. -0.028 -0.573 -0.262 -0.429 -0.343 -0.382 (0.089) (1.189) (0.676) (1.465) (0.954) (1.239)Constant 0.421 5.505*** 0.331 -0.510 5.104*** 0.531 (0.607) (6.875) (0.393) (0.753) (7.331) (0.584)Observations 141 141 141 141 141 141 Adj R2 0.582 0.140 0.564 0.494 0.196 0.489 Robust t statistics in parentheses * significant at 10%; ** significant at 5%; *** significant at 1%
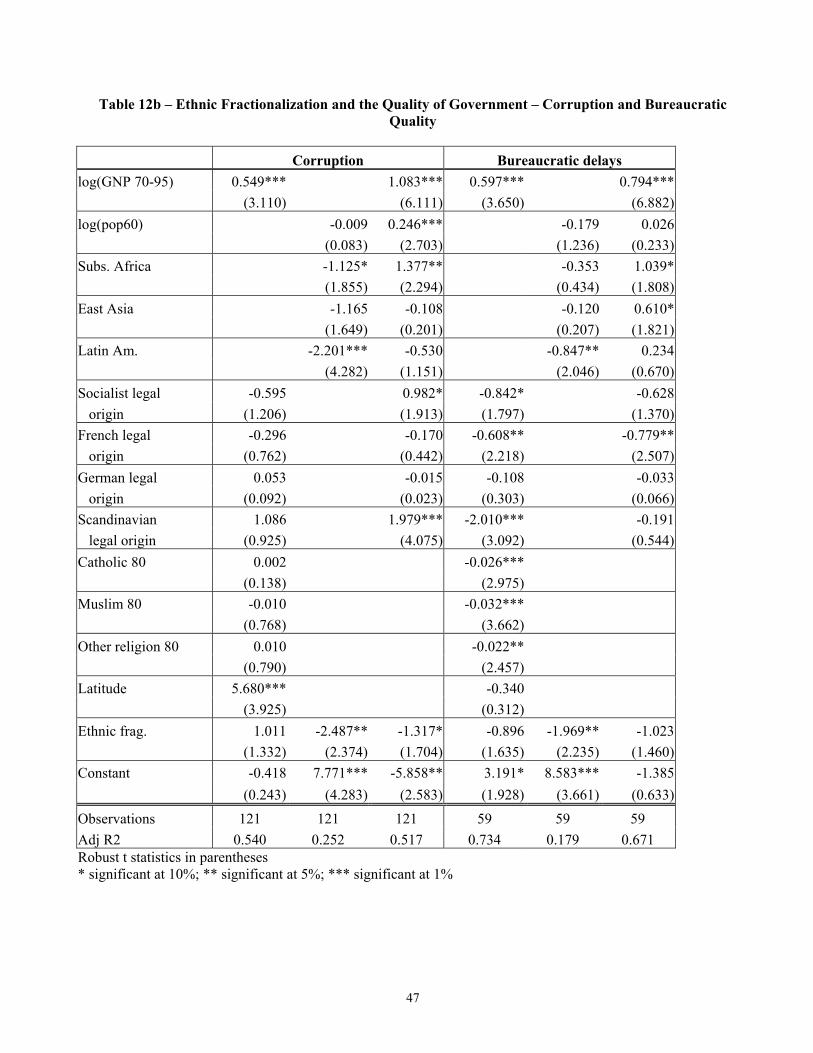
47
Table 12b – Ethnic Fractionalization and the Quality of Government – Corruption and Bureaucratic Quality
Corruption Bureaucratic delays log(GNP 70-95) 0.549*** 1.083*** 0.597*** 0.794*** (3.110) (6.111) (3.650) (6.882)log(pop60) -0.009 0.246*** -0.179 0.026 (0.083) (2.703) (1.236) (0.233)Subs. Africa -1.125* 1.377** -0.353 1.039* (1.855) (2.294) (0.434) (1.808)East Asia -1.165 -0.108 -0.120 0.610* (1.649) (0.201) (0.207) (1.821)Latin Am. -2.201*** -0.530 -0.847** 0.234 (4.282) (1.151) (2.046) (0.670)Socialist legal -0.595 0.982* -0.842* -0.628 origin (1.206) (1.913) (1.797) (1.370)French legal -0.296 -0.170 -0.608** -0.779** origin (0.762) (0.442) (2.218) (2.507)German legal 0.053 -0.015 -0.108 -0.033 origin (0.092) (0.023) (0.303) (0.066)Scandinavian 1.086 1.979*** -2.010*** -0.191 legal origin (0.925) (4.075) (3.092) (0.544)Catholic 80 0.002 -0.026*** (0.138) (2.975) Muslim 80 -0.010 -0.032*** (0.768) (3.662) Other religion 80 0.010 -0.022** (0.790) (2.457) Latitude 5.680*** -0.340 (3.925) (0.312) Ethnic frag. 1.011 -2.487** -1.317* -0.896 -1.969** -1.023 (1.332) (2.374) (1.704) (1.635) (2.235) (1.460)Constant -0.418 7.771*** -5.858** 3.191* 8.583*** -1.385 (0.243) (4.283) (2.583) (1.928) (3.661) (0.633)Observations 121 121 121 59 59 59 Adj R2 0.540 0.252 0.517 0.734 0.179 0.671 Robust t statistics in parentheses * significant at 10%; ** significant at 5%; *** significant at 1%

48
Table 12c – Ethnic Fractionalization and the Quality of Government – Taxation Tax compliance Top marginal tax rate log(GNP 70-95) 0.515*** 0.218 1.953 1.755 (4.009) (1.342) (1.140) (1.624)log(pop60) -0.151* -0.099 0.696 0.717 (1.717) (1.153) (0.830) (0.799)Subs. Africa -1.447** -1.055** -2.814 0.436 (2.682) (2.297) (0.632) (0.085)East Asia 0.258 0.117 -12.463*** -9.295*** (0.684) (0.352) (4.447) (2.898)Latin Am. -0.716* 0.013 -16.816*** -16.052*** (1.743) (0.029) (4.990) (4.496)Socialist legal -0.877** -1.448*** 9.629* 6.092* origin (2.304) (3.154) (1.925) (1.668)French legal -1.020*** -1.273*** 7.443* 6.461** origin (4.339) (3.916) (1.743) (2.493)German legal -0.563** -0.521 6.222 5.798 origin (2.083) (1.665) (1.026) (0.968)Scandinavian -1.083* -1.091*** 7.015 12.153** legal origin (1.800) (2.930) (0.841) (2.367)Catholic 80 -0.006 -0.115 (0.824) (1.045) Muslim 80 0.006 0.007 (0.661) (0.074) Other religion 80 -0.003 -0.012 (0.370) (0.103) Latitude -1.216* 18.991 (1.753) (1.454) Ethnic frag. -0.585 -0.024 -0.342 10.369 -3.155 3.260 (1.049) (0.038) (0.606) (1.495) (0.509) (0.445)Constant 0.506 5.756*** 3.931 16.895 38.014*** 15.877 (0.330) (4.001) (1.618) (1.143) (2.836) (0.925)Observations 49 49 49 82 82 82 Adj R2 0.530 0.127 0.507 0.202 0.360 0.414 Robust t statistics in parentheses * significant at 10%; ** significant at 5%; *** significant at 1%

49
Table 12d – Ethnic Fractionalization and the Quality of Government – Size of the Public Sector SOEs in the economy Public sector empl. / total pop. log(GNP 70-95) 0.369 0.374* 1.392*** 1.186*** (1.493) (1.809) (5.345) (6.269)log(pop60) -0.336** -0.351** -0.383** -0.180* (2.155) (2.394) (2.250) (1.901)Subs. Africa 0.268 0.505 -4.360*** -1.077* (0.421) (0.797) (6.666) (1.783)East Asia 1.917*** 1.435** -3.381*** -1.365* (2.759) (2.052) (5.793) (1.842)Latin Am. 1.460*** 1.351** -2.974*** -0.532 (2.768) (2.254) (4.213) (0.908)Socialist legal -3.127*** -2.940*** 2.486*** 2.370*** origin (3.168) (3.477) (3.600) (4.059)French legal -0.032 -0.185 -0.544 -0.557 origin (0.054) (0.380) (1.360) (1.653)German legal 0.073 0.314 -2.471** -1.909** origin (0.068) (0.248) (2.558) (2.017)Scandinavian -2.189 -1.872** 6.770*** 6.875*** legal origin (1.599) (2.036) (4.565) (5.695)Catholic 80 -0.009 0.000 (0.528) (0.040) Muslim 80 -0.015 0.008 (0.957) (0.859) Other religion 80 -0.013 0.003 (0.750) (0.243) Latitude -2.194 0.512 (1.114) (0.252) Ethnic frag. -1.815* -1.539 -1.480 0.017 -1.367 0.422 (1.778) (1.562) (1.517) (0.021) (1.019) (0.477)Constant 4.440* 9.780*** 7.587** -6.594*** 12.829*** -1.628 (1.926) (4.075) (2.438) (3.210) (4.379) (0.711)Observations 103 103 103 116 116 116 Adj R2 0.144 0.155 0.264 0.709 0.385 0.721 Robust t statistics in parentheses * significant at 10%; ** significant at 5%; *** significant at 1%

50
Table 12e – Ethnic Fractionalization and the Quality of Government – Size of Government Government consumption / GDP Transfers and subsidies / GDP log(GNP 70-95) 1.162** 1.139*** 1.540*** 2.797*** (2.192) (2.897) (3.048) (4.858)log(pop60) -1.329*** -1.073*** 0.272 0.593* (4.627) (3.522) (0.712) (1.827)Subs. Africa -4.309*** -2.098 -9.100*** -2.368 (2.860) (1.214) (4.524) (1.242)East Asia -5.465*** -4.847*** -12.682*** -9.004*** (4.074) (3.005) (8.679) (5.536)Latin Am. -5.823*** -4.268*** -8.823*** -4.229*** (4.841) (3.477) (5.572) (2.819)Socialist legal -1.061 -1.677 6.141** 8.515*** origin (0.356) (0.616) (2.022) (3.230)French legal -0.642 -0.736 0.360 0.199 origin (0.587) (0.802) (0.291) (0.185)German legal -3.105 -1.324 -3.609 -2.760 origin (1.519) (0.594) (1.530) (1.172)Scandinavian -0.033 2.287 -0.639 2.168 legal origin (0.011) (0.859) (0.142) (0.770)Catholic 80 -0.047 0.021 (1.489) (0.466) Muslim 80 -0.017 -0.014 (0.530) (0.357) Other religion 80 -0.043 0.015 (1.141) (0.347) Latitude 5.152 24.083*** (1.428) (5.337) Ethnic frag. 2.935 1.323 2.790 -0.498 -7.360** -4.984* (1.521) (0.663) (1.471) (0.179) (2.502) (1.981)Constant 7.661 38.025*** 24.490*** -10.744* 13.291** -17.250** (1.469) (7.954) (3.962) (1.852) (2.192) (2.311)Observations 103 103 103 89 89 89 Adj R2 0.194 0.250 0.310 0.694 0.598 0.724 Robust t statistics in parentheses * significant at 10%; ** significant at 5%; *** significant at 1%

51
Table 12f – Ethnic Fractionalization and the Quality of Government – Public Goods Infrastructure quality Log infant mortality log(GNP 70-95) 0.744*** 1.038*** -0.431*** -0.479*** (4.760) (8.534) (12.561) (12.714)log(pop60) -0.126 0.175* 0.036 -0.034* (0.628) (1.694) (1.268) (1.837)Subs. Africa -0.906 0.797 1.108*** -0.008 (0.913) (1.306) (7.698) (0.058)East Asia -0.922 -0.001 0.622*** -0.026 (1.228) (0.003) (2.831) (0.191)Latin Am. -1.324** -0.150 0.484*** -0.179* (2.579) (0.375) (3.833) (1.698)Socialist legal -1.949*** -1.555*** -0.146 -0.403*** origin (3.985) (3.079) (1.265) (3.461)French legal -0.543** -0.762** 0.211** 0.197** origin (2.079) (2.267) (2.594) (2.458)German legal 0.040 0.256 0.036 -0.056 origin (0.081) (0.539) (0.249) (0.339)Scandinavian -2.684*** -0.059 -0.452** -0.405*** legal origin (3.506) (0.178) (2.245) (3.062)Catholic 80 -0.032*** -0.005** (3.740) (2.270) Muslim 80 -0.038*** 0.001 (4.396) (0.404) Other religion 80 -0.026*** -0.005** (2.954) (2.283) Latitude 1.184 -0.734** (1.286) (2.489) Ethnic frag. -0.623 -2.019* -0.726 0.442*** 1.075*** 0.665*** (1.131) (1.704) (0.924) (3.436) (4.065) (3.966)Constant 2.808* 8.810*** -4.810** 7.160*** 2.315*** 7.498*** (1.766) (2.749) (2.267) (23.588) (5.252) (17.237)Observations 59 59 59 166 166 166 Adj R2 0.828 0.169 0.775 0.842 0.481 0.806 Robust t statistics in parentheses * significant at 10%; ** significant at 5%; *** significant at 1%
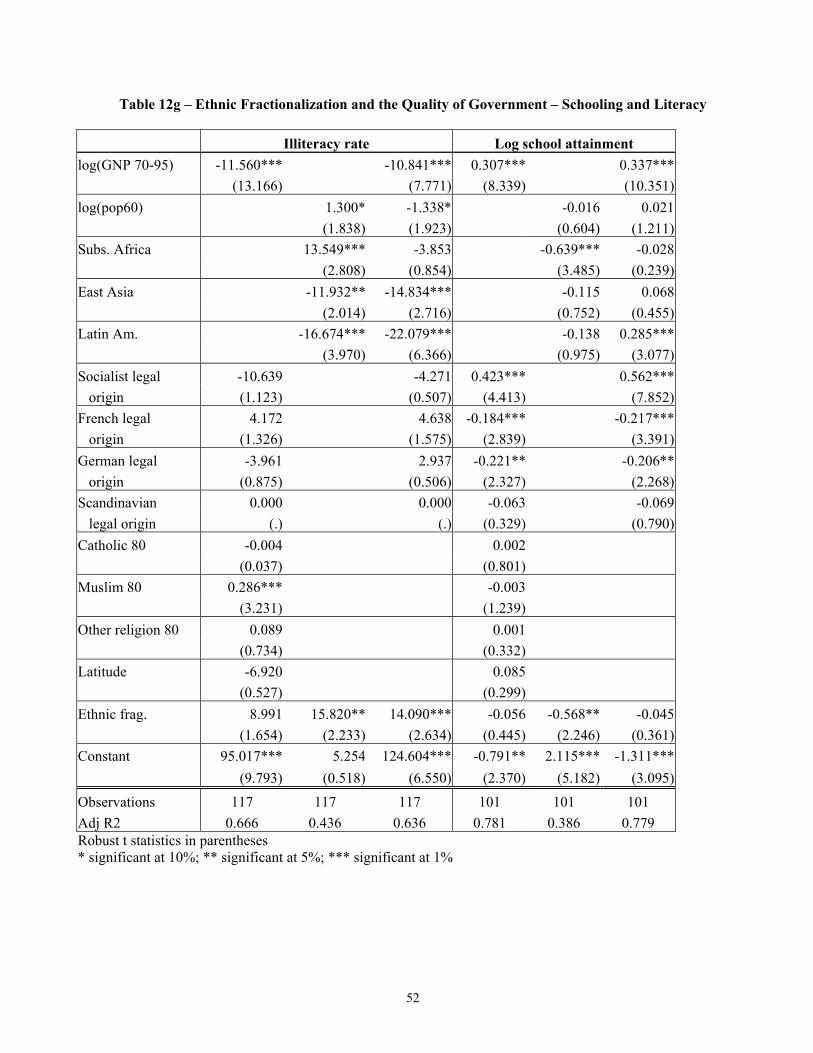
52
Table 12g – Ethnic Fractionalization and the Quality of Government – Schooling and Literacy Illiteracy rate Log school attainment log(GNP 70-95) -11.560*** -10.841*** 0.307*** 0.337*** (13.166) (7.771) (8.339) (10.351)log(pop60) 1.300* -1.338* -0.016 0.021 (1.838) (1.923) (0.604) (1.211)Subs. Africa 13.549*** -3.853 -0.639*** -0.028 (2.808) (0.854) (3.485) (0.239)East Asia -11.932** -14.834*** -0.115 0.068 (2.014) (2.716) (0.752) (0.455)Latin Am. -16.674*** -22.079*** -0.138 0.285*** (3.970) (6.366) (0.975) (3.077)Socialist legal -10.639 -4.271 0.423*** 0.562*** origin (1.123) (0.507) (4.413) (7.852)French legal 4.172 4.638 -0.184*** -0.217*** origin (1.326) (1.575) (2.839) (3.391)German legal -3.961 2.937 -0.221** -0.206** origin (0.875) (0.506) (2.327) (2.268)Scandinavian 0.000 0.000 -0.063 -0.069 legal origin (.) (.) (0.329) (0.790)Catholic 80 -0.004 0.002 (0.037) (0.801) Muslim 80 0.286*** -0.003 (3.231) (1.239) Other religion 80 0.089 0.001 (0.734) (0.332) Latitude -6.920 0.085 (0.527) (0.299) Ethnic frag. 8.991 15.820** 14.090*** -0.056 -0.568** -0.045 (1.654) (2.233) (2.634) (0.445) (2.246) (0.361)Constant 95.017*** 5.254 124.604*** -0.791** 2.115*** -1.311*** (9.793) (0.518) (6.550) (2.370) (5.182) (3.095)Observations 117 117 117 101 101 101 Adj R2 0.666 0.436 0.636 0.781 0.386 0.779 Robust t statistics in parentheses * significant at 10%; ** significant at 5%; *** significant at 1%
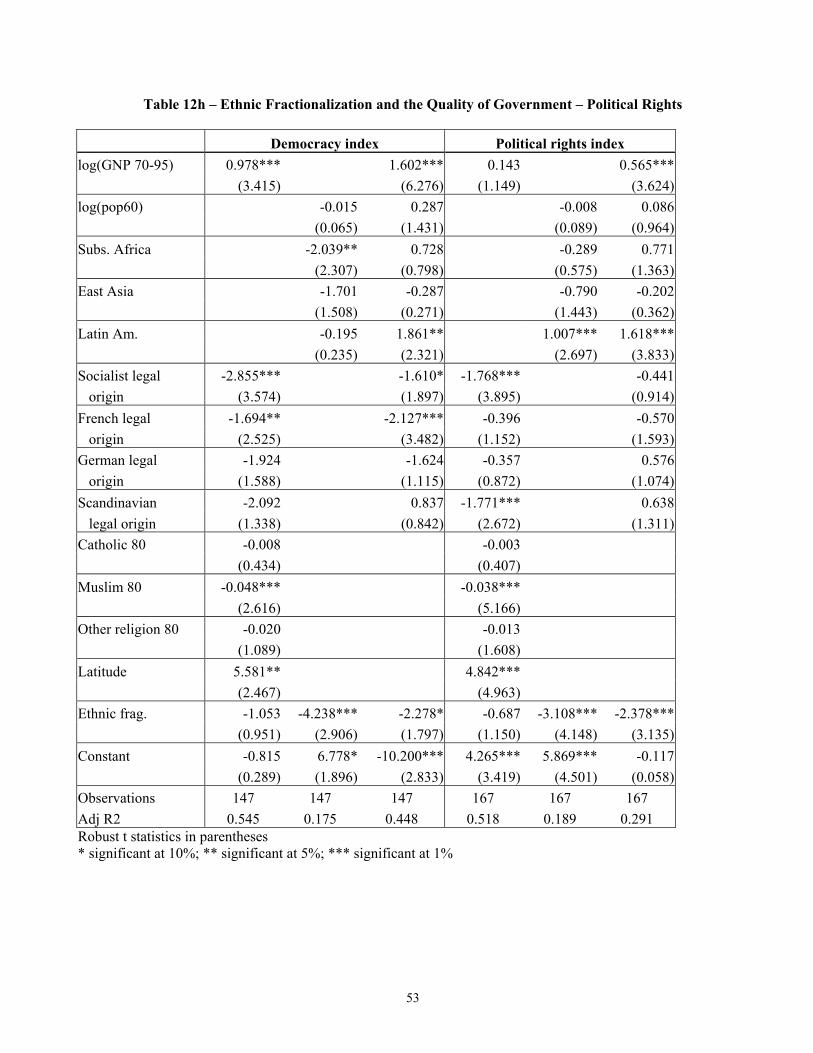
53
Table 12h – Ethnic Fractionalization and the Quality of Government – Political Rights Democracy index Political rights index log(GNP 70-95) 0.978*** 1.602*** 0.143 0.565*** (3.415) (6.276) (1.149) (3.624)log(pop60) -0.015 0.287 -0.008 0.086 (0.065) (1.431) (0.089) (0.964)Subs. Africa -2.039** 0.728 -0.289 0.771 (2.307) (0.798) (0.575) (1.363)East Asia -1.701 -0.287 -0.790 -0.202 (1.508) (0.271) (1.443) (0.362)Latin Am. -0.195 1.861** 1.007*** 1.618*** (0.235) (2.321) (2.697) (3.833)Socialist legal -2.855*** -1.610* -1.768*** -0.441 origin (3.574) (1.897) (3.895) (0.914)French legal -1.694** -2.127*** -0.396 -0.570 origin (2.525) (3.482) (1.152) (1.593)German legal -1.924 -1.624 -0.357 0.576 origin (1.588) (1.115) (0.872) (1.074)Scandinavian -2.092 0.837 -1.771*** 0.638 legal origin (1.338) (0.842) (2.672) (1.311)Catholic 80 -0.008 -0.003 (0.434) (0.407) Muslim 80 -0.048*** -0.038*** (2.616) (5.166) Other religion 80 -0.020 -0.013 (1.089) (1.608) Latitude 5.581** 4.842*** (2.467) (4.963) Ethnic frag. -1.053 -4.238*** -2.278* -0.687 -3.108*** -2.378*** (0.951) (2.906) (1.797) (1.150) (4.148) (3.135)Constant -0.815 6.778* -10.200*** 4.265*** 5.869*** -0.117 (0.289) (1.896) (2.833) (3.419) (4.501) (0.058)Observations 147 147 147 167 167 167 Adj R2 0.545 0.175 0.448 0.518 0.189 0.291 Robust t statistics in parentheses * significant at 10%; ** significant at 5%; *** significant at 1%
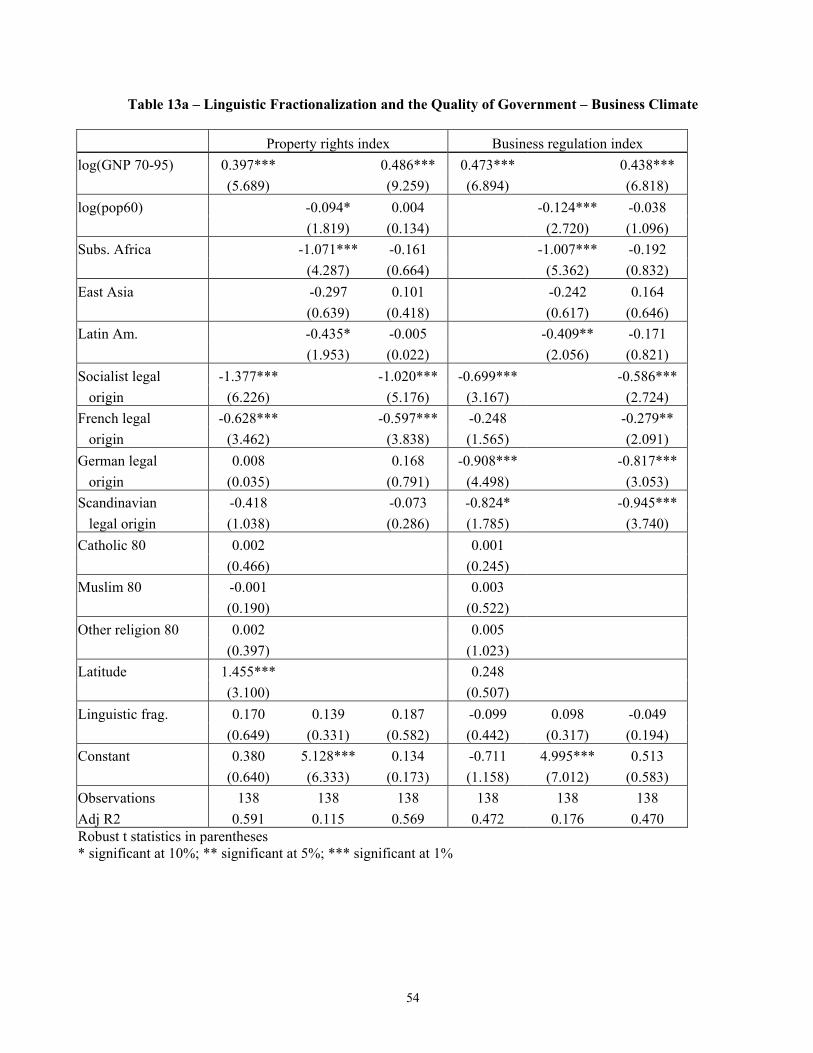
54
Table 13a – Linguistic Fractionalization and the Quality of Government – Business Climate
Property rights index Business regulation index log(GNP 70-95) 0.397*** 0.486*** 0.473*** 0.438*** (5.689) (9.259) (6.894) (6.818) log(pop60) -0.094* 0.004 -0.124*** -0.038 (1.819) (0.134) (2.720) (1.096) Subs. Africa -1.071*** -0.161 -1.007*** -0.192 (4.287) (0.664) (5.362) (0.832) East Asia -0.297 0.101 -0.242 0.164 (0.639) (0.418) (0.617) (0.646) Latin Am. -0.435* -0.005 -0.409** -0.171 (1.953) (0.022) (2.056) (0.821) Socialist legal -1.377*** -1.020*** -0.699*** -0.586*** origin (6.226) (5.176) (3.167) (2.724) French legal -0.628*** -0.597*** -0.248 -0.279** origin (3.462) (3.838) (1.565) (2.091) German legal 0.008 0.168 -0.908*** -0.817*** origin (0.035) (0.791) (4.498) (3.053) Scandinavian -0.418 -0.073 -0.824* -0.945*** legal origin (1.038) (0.286) (1.785) (3.740) Catholic 80 0.002 0.001 (0.466) (0.245) Muslim 80 -0.001 0.003 (0.190) (0.522) Other religion 80 0.002 0.005 (0.397) (1.023) Latitude 1.455*** 0.248 (3.100) (0.507) Linguistic frag. 0.170 0.139 0.187 -0.099 0.098 -0.049 (0.649) (0.331) (0.582) (0.442) (0.317) (0.194) Constant 0.380 5.128*** 0.134 -0.711 4.995*** 0.513 (0.640) (6.333) (0.173) (1.158) (7.012) (0.583) Observations 138 138 138 138 138 138 Adj R2 0.591 0.115 0.569 0.472 0.176 0.470 Robust t statistics in parentheses * significant at 10%; ** significant at 5%; *** significant at 1%

55
Table 13b – Linguistic Fractionalization and the Quality of Government – Corruption and Bureaucratic Quality
Corruption Bureaucratic delays log(GNP 70-95) 0.468** 1.012*** 0.664*** 0.879*** (2.538) (5.481) (3.725) (7.399) log(pop60) 0.037 0.261*** -0.174 0.062 (0.325) (2.754) (1.106) (0.516) Subs. Africa -1.248** 1.350** -0.849 0.431 (2.169) (2.292) (0.904) (0.701) East Asia -0.893 0.033 -0.180 0.571 (1.263) (0.060) (0.286) (1.631) Latin Am. -2.539*** -0.983** -1.420*** 0.187 (5.727) (2.079) (4.296) (0.520) Socialist legal -0.596 0.710 -0.778 -0.425 origin (1.151) (1.309) (1.574) (0.840) French legal -0.185 -0.147 -0.581** -0.737** origin (0.464) (0.377) (2.039) (2.336) German legal 0.073 0.010 0.022 0.115 origin (0.117) (0.014) (0.073) (0.292) Scandinavian 0.778 2.039*** -1.426** 0.099 legal origin (0.648) (4.349) (2.122) (0.279) Catholic 80 -0.003 -0.019** (0.201) (2.057) Muslim 80 -0.013 -0.027*** (0.946) (2.903) Other religion 80 0.004 -0.014 (0.319) (1.587) Latitude 5.073*** 0.234 (3.699) (0.225) Linguistic frag. 0.016 -2.082** -1.760** 0.085 -0.707 0.261 (0.024) (2.387) (2.595) (0.177) (0.777) (0.398) Constant 1.229 6.842*** -5.351** 1.404 8.147*** -3.162 (0.673) (3.876) (2.322) (0.803) (3.109) (1.310) Observations 120 120 120 58 58 58 Adj R2 0.511 0.233 0.501 0.727 0.092 0.666 Robust t statistics in parentheses * significant at 10%; ** significant at 5%; *** significant at 1%
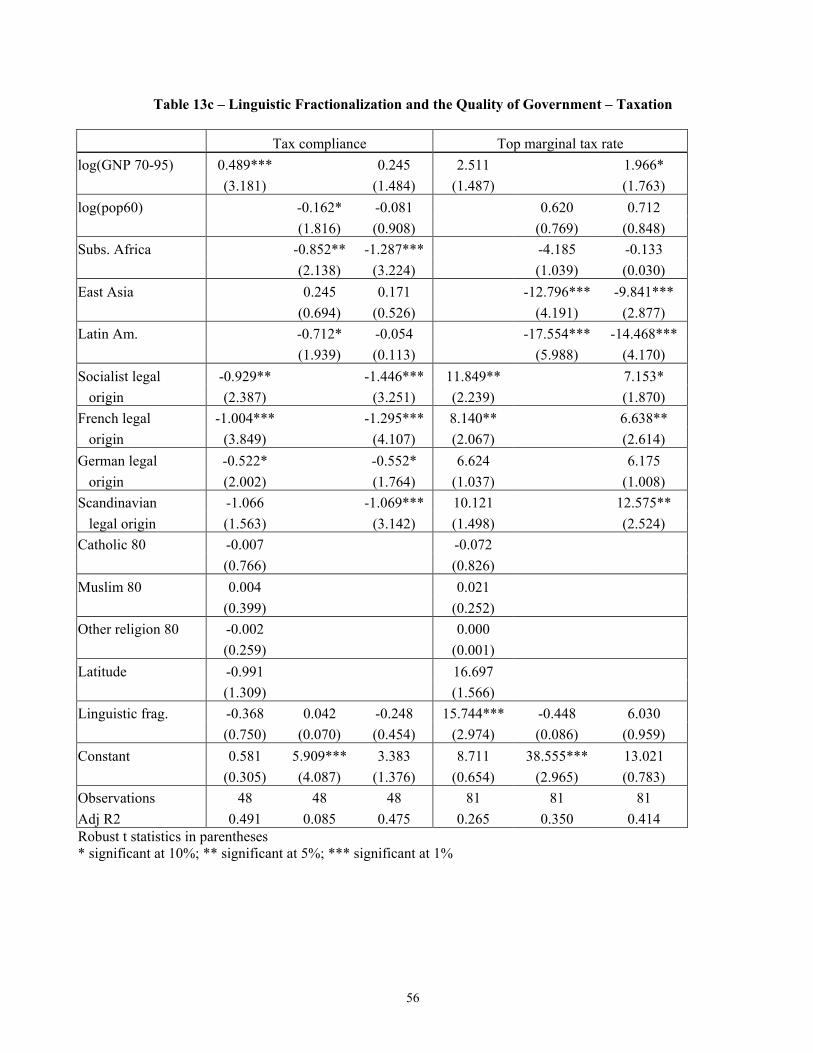
56
Table 13c – Linguistic Fractionalization and the Quality of Government – Taxation Tax compliance Top marginal tax rate log(GNP 70-95) 0.489*** 0.245 2.511 1.966* (3.181) (1.484) (1.487) (1.763) log(pop60) -0.162* -0.081 0.620 0.712 (1.816) (0.908) (0.769) (0.848) Subs. Africa -0.852** -1.287*** -4.185 -0.133 (2.138) (3.224) (1.039) (0.030) East Asia 0.245 0.171 -12.796*** -9.841*** (0.694) (0.526) (4.191) (2.877) Latin Am. -0.712* -0.054 -17.554*** -14.468*** (1.939) (0.113) (5.988) (4.170) Socialist legal -0.929** -1.446*** 11.849** 7.153* origin (2.387) (3.251) (2.239) (1.870) French legal -1.004*** -1.295*** 8.140** 6.638** origin (3.849) (4.107) (2.067) (2.614) German legal -0.522* -0.552* 6.624 6.175 origin (2.002) (1.764) (1.037) (1.008) Scandinavian -1.066 -1.069*** 10.121 12.575** legal origin (1.563) (3.142) (1.498) (2.524) Catholic 80 -0.007 -0.072 (0.766) (0.826) Muslim 80 0.004 0.021 (0.399) (0.252) Other religion 80 -0.002 0.000 (0.259) (0.001) Latitude -0.991 16.697 (1.309) (1.566) Linguistic frag. -0.368 0.042 -0.248 15.744*** -0.448 6.030 (0.750) (0.070) (0.454) (2.974) (0.086) (0.959) Constant 0.581 5.909*** 3.383 8.711 38.555*** 13.021 (0.305) (4.087) (1.376) (0.654) (2.965) (0.783) Observations 48 48 48 81 81 81 Adj R2 0.491 0.085 0.475 0.265 0.350 0.414 Robust t statistics in parentheses * significant at 10%; ** significant at 5%; *** significant at 1%

57
Table 13d – Linguistic Fractionalization and the Quality of Government – Size of the Public Sector SOEs in the economy Public sector employment / total pop. log(GNP 70-95) 0.459* 0.458** 1.372*** 1.135*** (1.775) (2.164) (5.279) (6.345) log(pop60) -0.361** -0.357** -0.380** -0.181* (2.327) (2.531) (2.262) (1.819) Subs. Africa -0.532 0.002 -4.765*** -1.312** (0.917) (0.003) (7.897) (2.243) East Asia 1.733** 1.344* -3.432*** -1.527** (2.304) (1.809) (5.802) (2.112) Latin Am. 1.068** 1.079* -3.027*** -0.449 (2.009) (1.708) (3.924) (0.740) Socialist legal -3.237*** -2.828*** 2.488*** 2.303*** origin (3.292) (3.338) (3.636) (3.942) French legal -0.096 -0.189 -0.532 -0.526 origin (0.162) (0.387) (1.336) (1.460) German legal 0.120 0.445 -2.483** -1.852* origin (0.115) (0.363) (2.504) (1.905) Scandinavian -1.869 -1.661* 6.603*** 6.896*** legal origin (1.374) (1.830) (4.366) (5.665) Catholic 80 -0.005 -0.004 (0.274) (0.344) Muslim 80 -0.010 0.008 (0.598) (0.796) Other religion 80 -0.006 0.001 (0.337) (0.069) Latitude -1.243 0.308 (0.649) (0.154) Linguistic frag. -0.702 0.044 -0.020 -0.452 -0.206 0.485 (0.858) (0.049) (0.023) (0.780) (0.205) (0.665) Constant 2.473 9.744*** 6.532** -6.015*** 12.355*** -1.161 (1.050) (4.062) (2.181) (3.099) (4.291) (0.523) Observations 100 100 100 115 115 115 Adj R2 0.129 0.123 0.248 0.709 0.369 0.720 Robust t statistics in parentheses * significant at 10%; ** significant at 5%; *** significant at 1%

58
Table 13e – Linguistic Fractionalization and the Quality of Government – Size of the Government Government consumption / GDP Transfers and subsidies / GDP log(GNP 70-95) 1.143* 1.093** 1.665*** 2.964*** (1.950) (2.528) (3.044) (4.827) log(pop60) -1.305*** -1.042*** 0.232 0.571* (4.328) (3.259) (0.670) (1.739) Subs. Africa -3.794** -1.397 -9.695*** -2.943 (2.370) (0.834) (4.950) (1.654) East Asia -5.338*** -4.767*** -12.196*** -8.804*** (3.626) (2.697) (8.059) (5.478) Latin Am. -5.420*** -3.791*** -10.530*** -5.317*** (4.600) (3.026) (7.281) (3.586) Socialist legal -0.969 -1.875 6.217** 8.403*** origin (0.325) (0.679) (2.053) (3.184) French legal -0.766 -0.911 0.257 0.194 origin (0.681) (1.009) (0.203) (0.176) German legal -3.450* -1.739 -3.636 -2.628 origin (1.723) (0.814) (1.552) (1.131) Scandinavian -0.929 1.774 -0.132 2.438 legal origin (0.292) (0.679) (0.030) (0.860) Catholic 80 -0.055 0.029 (1.645) (0.667) Muslim 80 -0.022 -0.006 (0.663) (0.163) Other religion 80 -0.054 0.021 (1.380) (0.524) Latitude 3.830 24.207*** (1.154) (6.069) Linguistic frag. 1.053 0.101 0.672 0.249 -6.048** -2.949 (0.596) (0.049) (0.335) (0.117) (2.203) (1.334) Constant 9.865* 37.969*** 25.142*** -12.660** 13.632** -18.857** (1.703) (7.706) (3.752) (2.248) (2.366) (2.336) Observations 100 100 100 86 86 86 Adj R2 0.181 0.240 0.291 0.691 0.586 0.718 Robust t statistics in parentheses * significant at 10%; ** significant at 5%; *** significant at 1%
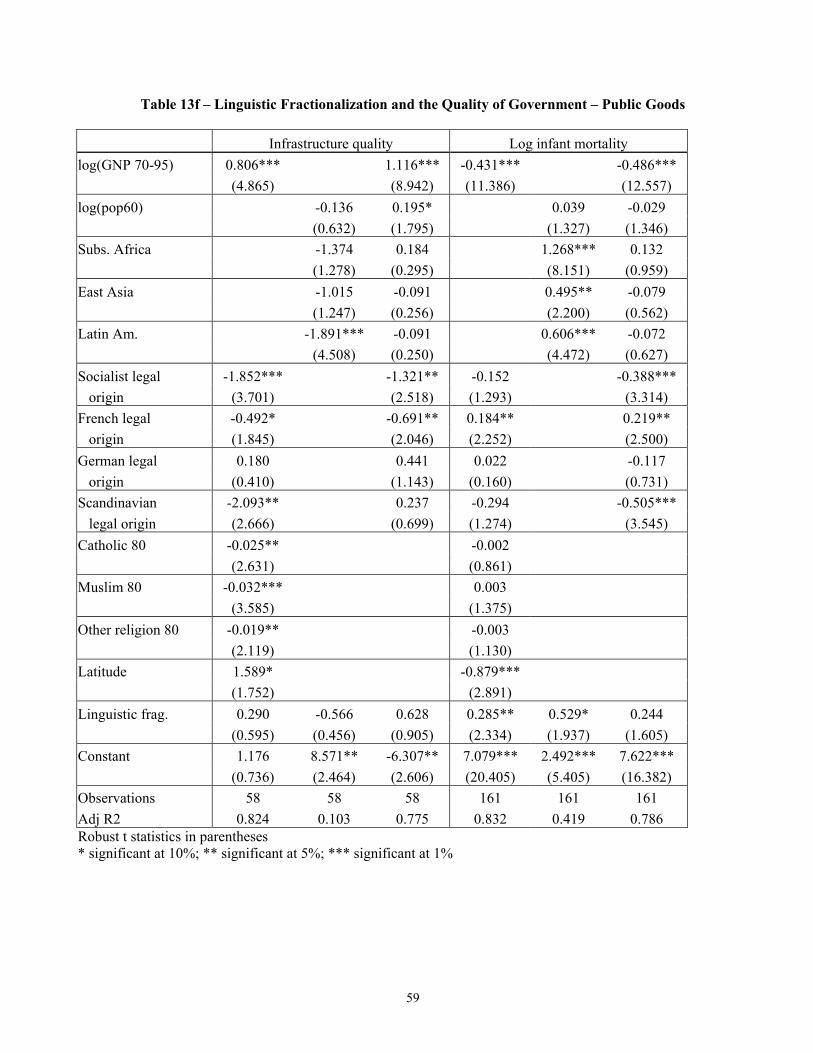
59
Table 13f – Linguistic Fractionalization and the Quality of Government – Public Goods Infrastructure quality Log infant mortality log(GNP 70-95) 0.806*** 1.116*** -0.431*** -0.486*** (4.865) (8.942) (11.386) (12.557) log(pop60) -0.136 0.195* 0.039 -0.029 (0.632) (1.795) (1.327) (1.346) Subs. Africa -1.374 0.184 1.268*** 0.132 (1.278) (0.295) (8.151) (0.959) East Asia -1.015 -0.091 0.495** -0.079 (1.247) (0.256) (2.200) (0.562) Latin Am. -1.891*** -0.091 0.606*** -0.072 (4.508) (0.250) (4.472) (0.627) Socialist legal -1.852*** -1.321** -0.152 -0.388*** origin (3.701) (2.518) (1.293) (3.314) French legal -0.492* -0.691** 0.184** 0.219** origin (1.845) (2.046) (2.252) (2.500) German legal 0.180 0.441 0.022 -0.117 origin (0.410) (1.143) (0.160) (0.731) Scandinavian -2.093** 0.237 -0.294 -0.505*** legal origin (2.666) (0.699) (1.274) (3.545) Catholic 80 -0.025** -0.002 (2.631) (0.861) Muslim 80 -0.032*** 0.003 (3.585) (1.375) Other religion 80 -0.019** -0.003 (2.119) (1.130) Latitude 1.589* -0.879*** (1.752) (2.891) Linguistic frag. 0.290 -0.566 0.628 0.285** 0.529* 0.244 (0.595) (0.456) (0.905) (2.334) (1.937) (1.605) Constant 1.176 8.571** -6.307** 7.079*** 2.492*** 7.622*** (0.736) (2.464) (2.606) (20.405) (5.405) (16.382) Observations 58 58 58 161 161 161 Adj R2 0.824 0.103 0.775 0.832 0.419 0.786 Robust t statistics in parentheses * significant at 10%; ** significant at 5%; *** significant at 1%
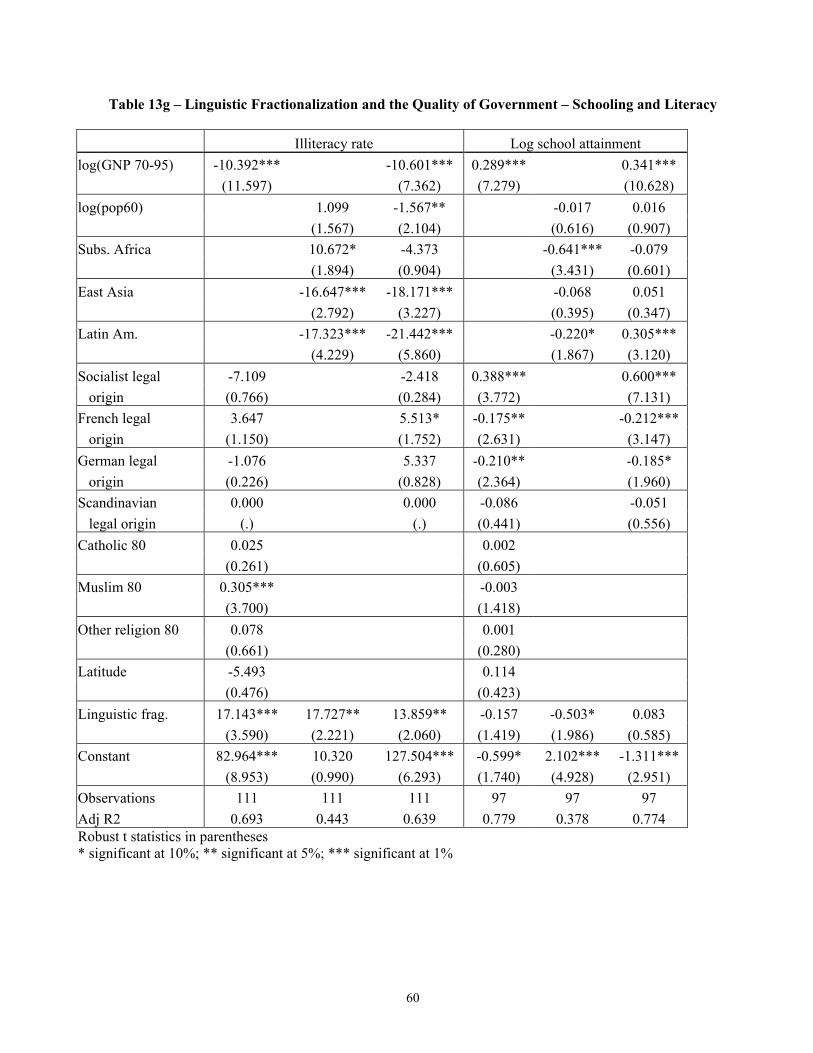
60
Table 13g – Linguistic Fractionalization and the Quality of Government – Schooling and Literacy Illiteracy rate Log school attainment log(GNP 70-95) -10.392*** -10.601*** 0.289*** 0.341*** (11.597) (7.362) (7.279) (10.628) log(pop60) 1.099 -1.567** -0.017 0.016 (1.567) (2.104) (0.616) (0.907) Subs. Africa 10.672* -4.373 -0.641*** -0.079 (1.894) (0.904) (3.431) (0.601) East Asia -16.647*** -18.171*** -0.068 0.051 (2.792) (3.227) (0.395) (0.347) Latin Am. -17.323*** -21.442*** -0.220* 0.305*** (4.229) (5.860) (1.867) (3.120) Socialist legal -7.109 -2.418 0.388*** 0.600*** origin (0.766) (0.284) (3.772) (7.131) French legal 3.647 5.513* -0.175** -0.212*** origin (1.150) (1.752) (2.631) (3.147) German legal -1.076 5.337 -0.210** -0.185* origin (0.226) (0.828) (2.364) (1.960) Scandinavian 0.000 0.000 -0.086 -0.051 legal origin (.) (.) (0.441) (0.556) Catholic 80 0.025 0.002 (0.261) (0.605) Muslim 80 0.305*** -0.003 (3.700) (1.418) Other religion 80 0.078 0.001 (0.661) (0.280) Latitude -5.493 0.114 (0.476) (0.423) Linguistic frag. 17.143*** 17.727** 13.859** -0.157 -0.503* 0.083 (3.590) (2.221) (2.060) (1.419) (1.986) (0.585) Constant 82.964*** 10.320 127.504*** -0.599* 2.102*** -1.311*** (8.953) (0.990) (6.293) (1.740) (4.928) (2.951) Observations 111 111 111 97 97 97 Adj R2 0.693 0.443 0.639 0.779 0.378 0.774 Robust t statistics in parentheses * significant at 10%; ** significant at 5%; *** significant at 1%

61
Table 13h – Linguistic Fractionalization and the Quality of Government – Political Rights Democracy index Political rights index log(GNP 70-95) 0.937*** 1.645*** 0.080 0.567*** (3.240) (6.488) (0.670) (3.542) log(pop60) 0.028 0.313 -0.011 0.082 (0.119) (1.514) (0.111) (0.848) Subs. Africa -2.932*** 0.188 -0.904* 0.210 (3.427) (0.209) (1.801) (0.376) East Asia -1.619 -0.308 -0.506 -0.037 (1.448) (0.281) (0.819) (0.063) Latin Am. -0.503 1.764** 0.623 1.338*** (0.604) (2.153) (1.636) (3.018) Socialist legal -2.924*** -1.503* -1.770*** -0.490 origin (3.593) (1.789) (3.848) (1.000) French legal -1.682** -2.145*** -0.239 -0.636* origin (2.473) (3.397) (0.695) (1.667) German legal -1.787 -1.252 -0.247 0.856 origin (1.509) (0.873) (0.607) (1.633) Scandinavian -2.019 1.455 -1.969*** 1.095** legal origin (1.330) (1.458) (3.075) (2.088) Catholic 80 -0.008 -0.008 (0.436) (1.098) Muslim 80 -0.049** -0.042*** (2.575) (5.912) Other religion 80 -0.020 -0.016** (1.068) (2.068) Latitude 6.094*** 5.102*** (2.737) (5.405) Linguistic frag. -0.681 -1.256 -0.162 -0.873* -1.247* -0.715 (0.791) (0.962) (0.159) (1.857) (1.673) (1.003) Constant -0.858 4.981 -11.783*** 4.953*** 5.237*** -0.649 (0.317) (1.344) (3.317) (4.447) (3.538) (0.308) Observations 145 145 145 162 162 162 Adj R2 0.543 0.119 0.432 0.529 0.101 0.235 Robust t statistics in parentheses * significant at 10%; ** significant at 5%; *** significant at 1%
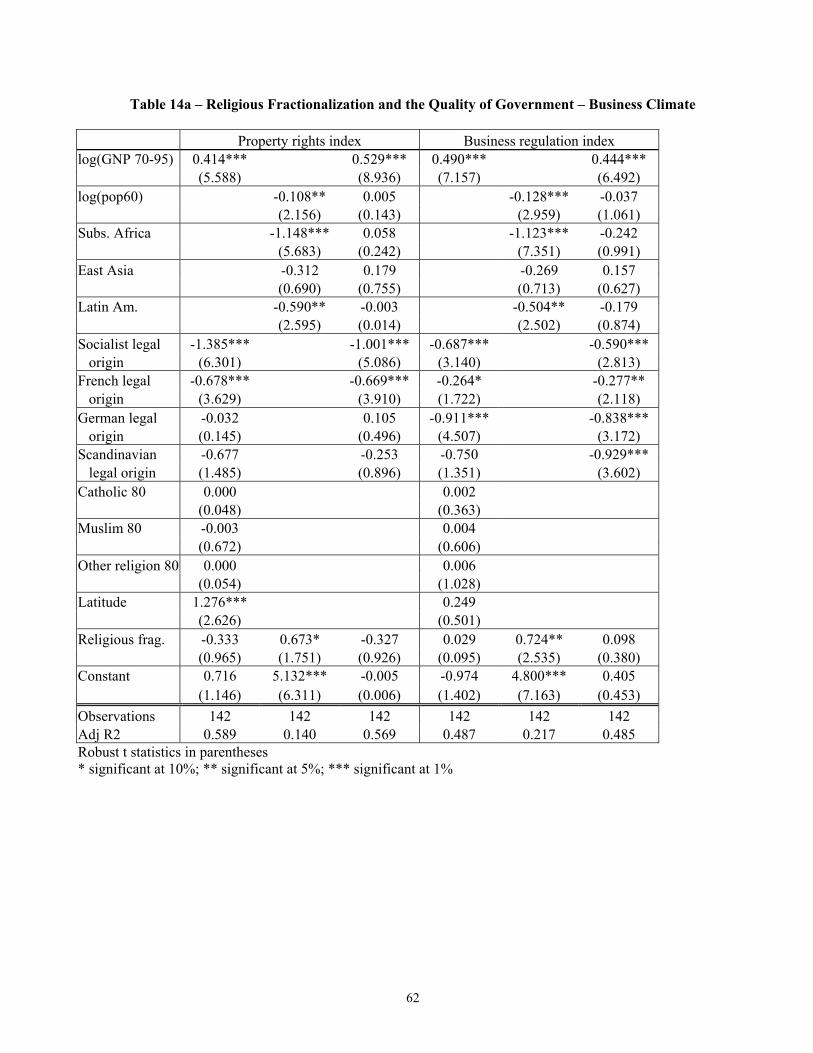
62
Table 14a – Religious Fractionalization and the Quality of Government – Business Climate
Property rights index Business regulation index log(GNP 70-95) 0.414*** 0.529*** 0.490*** 0.444*** (5.588) (8.936) (7.157) (6.492) log(pop60) -0.108** 0.005 -0.128*** -0.037 (2.156) (0.143) (2.959) (1.061) Subs. Africa -1.148*** 0.058 -1.123*** -0.242 (5.683) (0.242) (7.351) (0.991) East Asia -0.312 0.179 -0.269 0.157 (0.690) (0.755) (0.713) (0.627) Latin Am. -0.590** -0.003 -0.504** -0.179 (2.595) (0.014) (2.502) (0.874) Socialist legal -1.385*** -1.001*** -0.687*** -0.590*** origin (6.301) (5.086) (3.140) (2.813) French legal -0.678*** -0.669*** -0.264* -0.277** origin (3.629) (3.910) (1.722) (2.118) German legal -0.032 0.105 -0.911*** -0.838*** origin (0.145) (0.496) (4.507) (3.172) Scandinavian -0.677 -0.253 -0.750 -0.929*** legal origin (1.485) (0.896) (1.351) (3.602) Catholic 80 0.000 0.002 (0.048) (0.363) Muslim 80 -0.003 0.004 (0.672) (0.606) Other religion 80 0.000 0.006 (0.054) (1.028) Latitude 1.276*** 0.249 (2.626) (0.501) Religious frag. -0.333 0.673* -0.327 0.029 0.724** 0.098 (0.965) (1.751) (0.926) (0.095) (2.535) (0.380) Constant 0.716 5.132*** -0.005 -0.974 4.800*** 0.405 (1.146) (6.311) (0.006) (1.402) (7.163) (0.453) Observations 142 142 142 142 142 142 Adj R2 0.589 0.140 0.569 0.487 0.217 0.485 Robust t statistics in parentheses * significant at 10%; ** significant at 5%; *** significant at 1%
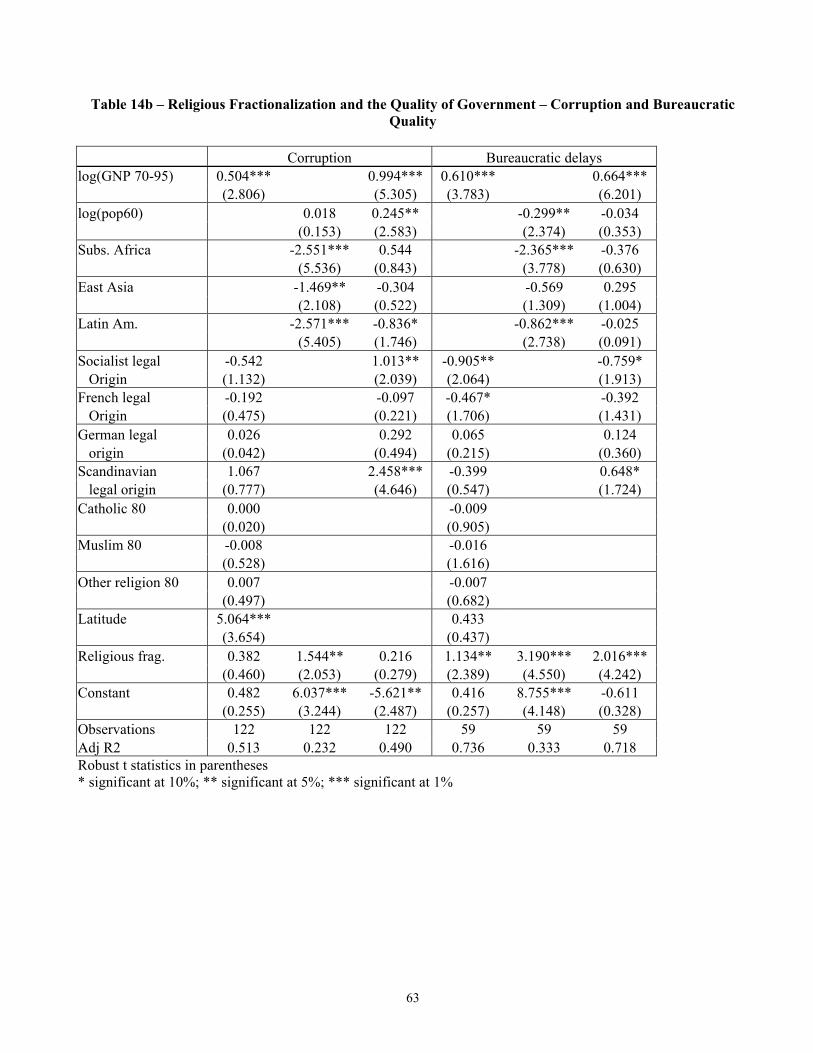
63
Table 14b – Religious Fractionalization and the Quality of Government – Corruption and Bureaucratic Quality
Corruption Bureaucratic delays log(GNP 70-95) 0.504*** 0.994*** 0.610*** 0.664*** (2.806) (5.305) (3.783) (6.201) log(pop60) 0.018 0.245** -0.299** -0.034 (0.153) (2.583) (2.374) (0.353) Subs. Africa -2.551*** 0.544 -2.365*** -0.376 (5.536) (0.843) (3.778) (0.630) East Asia -1.469** -0.304 -0.569 0.295 (2.108) (0.522) (1.309) (1.004) Latin Am. -2.571*** -0.836* -0.862*** -0.025 (5.405) (1.746) (2.738) (0.091) Socialist legal -0.542 1.013** -0.905** -0.759* Origin (1.132) (2.039) (2.064) (1.913) French legal -0.192 -0.097 -0.467* -0.392 Origin (0.475) (0.221) (1.706) (1.431) German legal 0.026 0.292 0.065 0.124 origin (0.042) (0.494) (0.215) (0.360) Scandinavian 1.067 2.458*** -0.399 0.648* legal origin (0.777) (4.646) (0.547) (1.724) Catholic 80 0.000 -0.009 (0.020) (0.905) Muslim 80 -0.008 -0.016 (0.528) (1.616) Other religion 80 0.007 -0.007 (0.497) (0.682) Latitude 5.064*** 0.433 (3.654) (0.437) Religious frag. 0.382 1.544** 0.216 1.134** 3.190*** 2.016*** (0.460) (2.053) (0.279) (2.389) (4.550) (4.242) Constant 0.482 6.037*** -5.621** 0.416 8.755*** -0.611 (0.255) (3.244) (2.487) (0.257) (4.148) (0.328) Observations 122 122 122 59 59 59 Adj R2 0.513 0.232 0.490 0.736 0.333 0.718 Robust t statistics in parentheses * significant at 10%; ** significant at 5%; *** significant at 1%

64
Table 14c – Religious Fractionalization and the Quality of Government – Taxation Tax compliance Top marginal tax rate log(GNP 70-95) 0.494*** 0.086 1.232 1.213 (3.457) (0.510) (0.728) (1.065) log(pop60) -0.249*** -0.163* 0.609 0.723 (3.426) (1.875) (0.781) (0.845) Subs. Africa -2.159*** -1.840*** -3.885 -0.605 (6.730) (3.550) (1.075) (0.131) East Asia 0.108 -0.058 -12.744*** -9.543*** (0.347) (0.181) (4.982) (3.104) Latin Am. -0.384 -0.142 -17.624*** -16.372*** (1.225) (0.373) (6.146) (5.074) Socialist legal -0.899** -1.474*** 9.234 5.740 origin (2.236) (3.648) (1.573) (1.490) French legal -0.921*** -0.936*** 8.917* 7.428** origin (3.914) (3.142) (1.907) (2.572) German legal -0.469* -0.402 5.023 5.425 origin (1.759) (1.370) (0.958) (1.037) Scandinavian -0.231 -0.576 17.275* 13.240** legal origin (0.268) (1.465) (1.857) (2.500) Catholic 80 0.002 -0.011 (0.203) (0.098) Muslim 80 0.014 0.141 (1.273) (1.232) Other religion 80 0.005 0.062 (0.520) (0.499) Latitude -0.724 18.309 (0.884) (1.402) Religious frag. 0.634 2.288*** 1.387*** 16.736** -1.754 4.674 (0.919) (5.119) (2.862) (2.248) (0.392) (0.884) Constant -0.752 6.437*** 5.284** 10.124 39.302*** 19.067 (0.510) (5.451) (2.243) (0.638) (3.019) (1.035) Observations 49 49 49 82 82 82 Adj R2 0.526 0.410 0.562 0.223 0.358 0.415 Robust t statistics in parentheses * significant at 10%; ** significant at 5%; *** significant at 1%

65
Table 14d – Religious Fractionalization and the Quality of Government – Size of Public Sector SOEs in the economy Public sector employment / total pop. log(GNP 70-95) 0.434* 0.378* 1.367*** 1.095*** (1.663) (1.750) (5.438) (5.799) log(pop60) -0.375** -0.376*** -0.388** -0.191* (2.547) (2.679) (2.306) (1.898) Subs. Africa -0.716 -0.198 -5.152*** -1.301* (1.328) (0.287) (9.675) (1.915) East Asia 1.611** 1.284* -3.546*** -1.467** (2.200) (1.705) (5.948) (1.989) Latin Am. 1.192** 1.113* -3.126*** -0.669 (2.323) (1.921) (4.439) (1.106) Socialist legal -3.149*** -2.796*** 2.474*** 2.288*** origin (3.282) (3.461) (3.619) (3.942) French legal -0.053 -0.020 -0.445 -0.412 origin (0.089) (0.040) (1.136) (1.114) German legal 0.301 0.581 -2.418** -1.921** origin (0.288) (0.477) (2.520) (2.086) Scandinavian -1.978 -1.419 7.334*** 7.027*** legal origin (1.152) (1.481) (4.501) (5.806) Catholic 80 -0.005 0.005 (0.253) (0.357) Muslim 80 -0.015 0.015 (0.706) (1.141) Other religion 80 -0.009 0.006 (0.464) (0.493) Latitude -1.167 0.765 (0.634) (0.387) Religious frag. -0.642 1.091 0.378 0.813 1.731 0.643 (0.559) (1.134) (0.392) (0.776) (1.609) (0.723) Constant 2.850 9.586*** 7.261** -7.312*** 11.702*** -0.843 (1.099) (4.114) (2.486) (3.349) (4.182) (0.362) Observations 103 103 103 117 117 117 Adj R2 0.118 0.146 0.246 0.709 0.385 0.720 Robust t statistics in parentheses * significant at 10%; ** significant at 5%; *** significant at 1%

66
Table 14e – Religious Fractionalization and the Quality of Government – Size of Government Government consumption / GDP Transfers and subsidies / GDP log(GNP 70-95) 0.956* 0.847* 1.437*** 2.556*** (1.695) (1.733) (2.930) (4.356) log(pop60) -1.328*** -1.062*** 0.052 0.425 (4.855) (3.501) (0.135) (1.293) Subs. Africa -4.569*** -2.254 -14.202*** -6.165*** (3.801) (1.270) (10.884) (3.132) East Asia -5.738*** -4.907*** -14.413*** -9.871*** (4.375) (3.006) (12.385) (7.160) Latin Am. -5.560*** -4.345*** -10.293*** -5.731*** (4.981) (3.674) (7.442) (4.158) Socialist legal -1.416 -2.036 6.295** 9.379*** origin (0.525) (0.770) (2.152) (3.782) French legal -0.319 -0.348 1.007 1.655 Origin (0.268) (0.291) (0.797) (1.345) German legal -3.596* -1.785 -3.707 -1.771 Origin (1.826) (0.882) (1.491) (0.756) Scandinavian 3.627 2.590 6.071 4.728 legal origin (0.971) (0.891) (1.411) (1.567) Catholic 80 -0.008 0.095** (0.222) (2.156) Muslim 80 0.032 0.066 (0.865) (1.547) Other religion 80 -0.013 0.077* (0.353) (1.883) Latitude 5.506 27.330*** (1.615) (6.671) Religious frag. 5.535** 3.505** 2.567 7.255*** 6.020** 4.425 (2.109) (2.202) (1.067) (2.962) (2.417) (1.616) Constant 4.440 37.124*** 26.477*** -20.971*** 12.839** -16.436** (0.949) (7.727) (4.096) (4.164) (2.066) (2.142) Observations 103 103 103 89 89 89 Adj R2 0.210 0.272 0.306 0.713 0.591 0.717 Robust t statistics in parentheses * significant at 10%; ** significant at 5%; *** significant at 1%
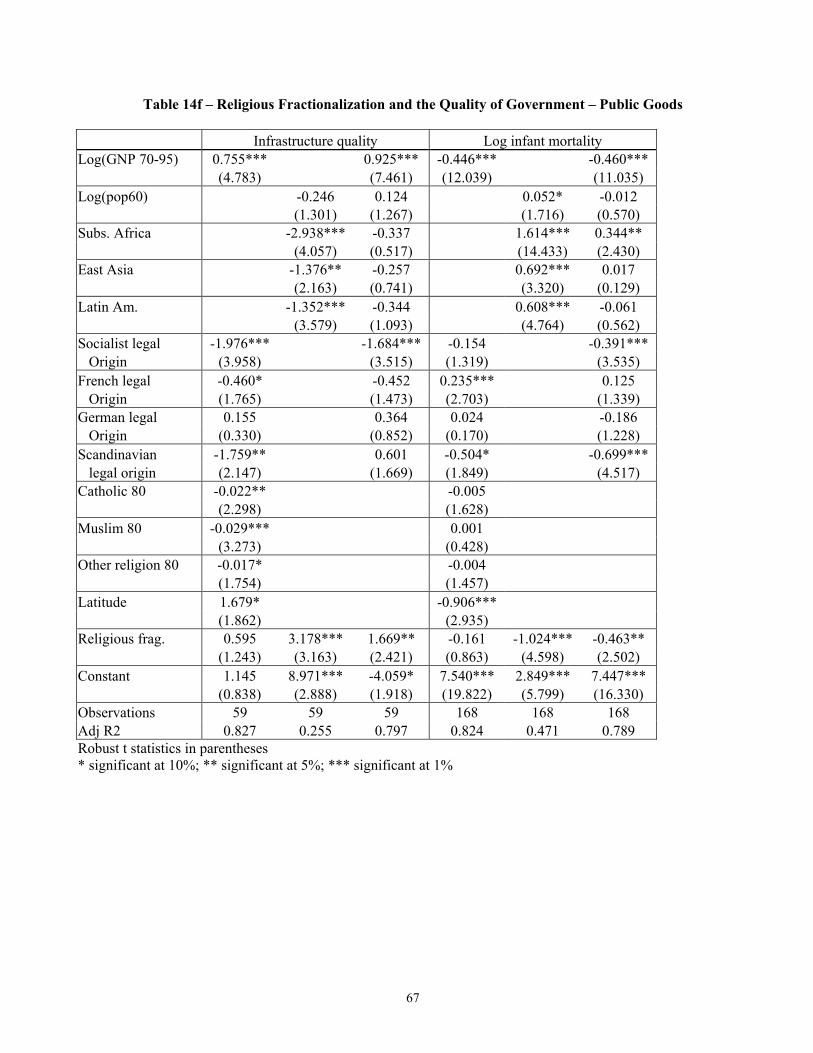
67
Table 14f – Religious Fractionalization and the Quality of Government – Public Goods Infrastructure quality Log infant mortality Log(GNP 70-95) 0.755*** 0.925*** -0.446*** -0.460*** (4.783) (7.461) (12.039) (11.035) Log(pop60) -0.246 0.124 0.052* -0.012 (1.301) (1.267) (1.716) (0.570) Subs. Africa -2.938*** -0.337 1.614*** 0.344** (4.057) (0.517) (14.433) (2.430) East Asia -1.376** -0.257 0.692*** 0.017 (2.163) (0.741) (3.320) (0.129) Latin Am. -1.352*** -0.344 0.608*** -0.061 (3.579) (1.093) (4.764) (0.562) Socialist legal -1.976*** -1.684*** -0.154 -0.391*** Origin (3.958) (3.515) (1.319) (3.535) French legal -0.460* -0.452 0.235*** 0.125 Origin (1.765) (1.473) (2.703) (1.339) German legal 0.155 0.364 0.024 -0.186 Origin (0.330) (0.852) (0.170) (1.228) Scandinavian -1.759** 0.601 -0.504* -0.699*** legal origin (2.147) (1.669) (1.849) (4.517) Catholic 80 -0.022** -0.005 (2.298) (1.628) Muslim 80 -0.029*** 0.001 (3.273) (0.428) Other religion 80 -0.017* -0.004 (1.754) (1.457) Latitude 1.679* -0.906*** (1.862) (2.935) Religious frag. 0.595 3.178*** 1.669** -0.161 -1.024*** -0.463** (1.243) (3.163) (2.421) (0.863) (4.598) (2.502) Constant 1.145 8.971*** -4.059* 7.540*** 2.849*** 7.447*** (0.838) (2.888) (1.918) (19.822) (5.799) (16.330) Observations 59 59 59 168 168 168 Adj R2 0.827 0.255 0.797 0.824 0.471 0.789 Robust t statistics in parentheses * significant at 10%; ** significant at 5%; *** significant at 1%

68
Table 14g – Religious Fractionalization and the Quality of Government – Schooling and Literacy Illiteracy rate Log school attainment log(GNP 70-95) -11.860*** -10.503*** 0.310*** 0.320*** (13.422) (7.629) (8.366) (10.083) log(pop60) 1.170 -1.102 -0.044* 0.013 (1.571) (1.503) (1.789) (0.755) Subs. Africa 22.560*** 4.432 -1.085*** -0.159 (4.958) (0.872) (10.468) (1.313) East Asia -9.595 -13.504** -0.289* 0.035 (1.570) (2.457) (1.902) (0.238) Latin Am. -14.304*** -19.487*** -0.269** 0.231** (3.333) (5.345) (2.321) (2.483) Socialist legal -12.792 -6.017 0.430*** 0.611*** Origin (1.271) (0.740) (4.471) (8.131) French legal 5.094 1.639 -0.182*** -0.142** Origin (1.605) (0.539) (2.717) (2.113) German legal -6.957 -0.354 -0.226** -0.201** Origin (1.585) (0.067) (2.331) (2.325) Scandinavian 0.000 0.000 0.015 0.040 Legal origin (.) (.) (0.057) (0.412) Catholic 80 0.020 0.003 (0.196) (0.959) Muslim 80 0.337*** -0.002 (3.520) (0.596) Other religion 80 0.126 0.002 (1.057) (0.551) Latitude -13.640 0.132 (1.124) (0.510) Religious frag. 4.020 -23.794*** -17.174*** 0.083 0.854*** 0.336** (0.567) (4.084) (2.989) (0.426) (4.696) (2.397) Constant 97.357*** 21.364* 131.201*** -0.962** 2.097*** -1.220*** (8.864) (1.829) (7.185) (2.226) (5.041) (3.000) Observations 118 118 118 101 101 101 Adj R2 0.664 0.463 0.647 0.781 0.449 0.791 Robust t statistics in parentheses * significant at 10%; ** significant at 5%; *** significant at 1%

69
Table 14h – Religious Fractionalization and the Quality of Government – Political Rights Democracy index Political rights index log(GNP 70-95) 1.052*** 1.631*** 0.169 0.524*** (3.804) (5.994) (1.370) (3.107) log(pop60) -0.013 0.306 -0.055 0.028 (0.054) (1.482) (0.614) (0.297) Subs. Africa -4.024*** 0.063 -1.631*** -0.314 (5.628) (0.066) (3.871) (0.524) East Asia -2.071** -0.353 -0.917 -0.266 (1.990) (0.340) (1.573) (0.463) Latin Am. -0.391 1.799** 0.666* 1.308*** (0.488) (2.210) (1.830) (2.967) Socialist legal -2.748*** -1.498* -1.731*** -0.441 origin (3.456) (1.811) (3.791) (0.898) French legal -1.796*** -2.089*** -0.451 -0.368 origin (2.704) (2.886) (1.281) (0.883) German legal -1.651 -1.218 -0.263 1.047** origin (1.458) (0.878) (0.592) (2.194) Scandinavian -3.622** 1.567 -2.225*** 1.599*** legal origin (2.195) (1.382) (2.836) (2.727) Catholic 80 -0.025 -0.009 (1.305) (0.954) Muslim 80 -0.067*** -0.045*** (3.448) (5.013) Other religion 80 -0.032* -0.018** (1.737) (2.100) Latitude 5.254** 4.895*** (2.410) (4.936) Religious frag. -2.688** 3.172** 0.233 -0.690 1.907*** 1.226 (2.101) (2.331) (0.163) (1.004) (2.754) (1.480) Constant 0.864 4.007 -11.730*** 4.570*** 4.814*** -0.291 (0.311) (1.047) (3.270) (3.675) (3.140) (0.144) Observations 148 148 148 169 169 169 Adj R2 0.559 0.150 0.438 0.516 0.133 0.251 Robust t statistics in parentheses * significant at 10%; ** significant at 5%; *** significant at 1%

70
Table 15 – Country Examples of Ethnic Fractionalization, Growth and Government Quality
Country
Average growth in 1980s
Average black market premium in 1980s
Average Years of Schooling of Labor Force, 1980s
Telephone lines per 1000 workers, 1980s
Government Balance to GDP, 1980s
Corruption (0 to 10) Higher means less corruption
Ethnic fractio-nalization
Africa Botswana 7.0% 16% 3.3 27 11.2% 6.5 0.410Ethiopia 0.0% 76% 4 -7.1% 4.3 0.724Nigeria -3.3% 76% 2 0.3% 3.0 0.851Latin America Bolivia -3.3% 39% 5.0 46 -14.4% 2.8 0.74Chile 1.9% 16% 7.0 84 -0.2% 5.3 0.19Guyana -2.4% 131% 5.6 -39.7% 2.0 0.62
Related Documents