FRACTION SYMBOLS AND THEIR RELATION TO CONCEPTUAL FRACTION KNOWLEDGE FOR STUDENTS IN GRADES 4 AND 6 By Heather Douglas A thesis submitted to the Faculty of Graduate and Postdoctoral Affairs in partial fulfillment of the requirements for the degree of Doctor of Philosophy in Cognitive Science Carleton University Ottawa, Ontario © 2020 Heather Douglas

Welcome message from author
This document is posted to help you gain knowledge. Please leave a comment to let me know what you think about it! Share it to your friends and learn new things together.
Transcript
FRACTION SYMBOLS AND THEIR RELATION TO CONCEPTUAL FRACTION KNOWLEDGE FOR STUDENTS IN GRADES 4 AND 6
By
Heather Douglas
A thesis submitted to the Faculty of Graduate and Postdoctoral Affairs in partial fulfillment of the requirements for the degree of Doctor of Philosophy
in
Cognitive Science
Carleton University Ottawa, Ontario
© 2020 Heather Douglas
ii
Abstract
How do students make sense of fractions? Formal fraction knowledge begins when students start
mapping fractions shown visually (e.g., area models), with symbols (e.g., ¾) and with words
(e.g., three-quarters). Students were recruited from three schools that service rural and small-
town communities. Participating students in grade 4 (N=64) and grade 6 (N = 66) completed
measures of cognition, language, and three novel measures developed for this study:
mathematical vocabulary, orthography (i.e., the conventions for writing symbolic math), and
fraction mapping. Five months later, their conceptual fraction skills (i.e., mapping, word
problems and number line) were measured. I used two analytical approaches to examine the role
of fraction mapping as students acquire conceptual fraction knowledge.
In Study 1 (Chapters 4 and 5), I tested a path model in which mathematical vocabulary
and orthography predicted fraction mapping, and fraction mapping predicted conceptual fraction
skills. The model was largely supported for both grade 4 and grade 6. Moreover, mathematical
vocabulary also predicted conceptual fraction skills for sixth graders. Thus, once students have
sufficient knowledge of fraction mappings, other skills such as mathematical vocabulary may
contribute more strongly to students’ knowledge of fraction concepts.
In Study 2 (Chapter 6), I used latent profile analysis to group students based on their
fraction number line estimation. Three groups emerged. Relational estimators had the most
advanced fraction concepts because they viewed the fraction as a unit. Compared to the other
groups, relational estimators were more likely to be in sixth grade, have better mapping skills
and more accurate whole number line estimation. Whole-component and denominator
estimators, respectively, interpreted the fraction based on the magnitudes of both components
(i.e., the numerator and denominator) or just the denominator. Only fraction mapping skills
iii
differentiated whole-component estimators from denominator estimators. Thus, students’
knowledge of fraction mappings is a precursor to interpreting fractions as units rather than as
composites, and therefore necessary for successfully placing those fractions on a number line.
In summary, this research shows that students who struggle to acquire fraction concepts
in grades 4 and 6 have not mastered fraction mappings. Knowing how fraction symbols are
connected to magnitude is foundational knowledge for fraction learning.
iv
Acknowledgements
First and foremost I would like to thank Dr. Jo-Anne Lefevre. She has been an amazing
role model, mentor and inspiration. Like all good teachers Jo-Anne knows when to gently push
and when to step back and let things simmer. Her high expectations and attention to detail made
me persevere and accomplish more than I thought possible.
Thanks also go out to my thesis committee members, Dr. Deepthi Kamawar and Dr.
Kasia Muldner. Both these women provided me with constructive advice and positive energy.
Thank you to Dr. Sarah Powell and Dr. Tracey Lauriault who took the time to review my thesis
and ask probing questions that led me to think more deeply about my work. Thank you also to
Dr. Rebecca Merkley for insights into educational research, stimulating discussions and ongoing
support.
Special thanks to Dr. Chang Xu and Sabrina Di Lonardo Burr who are my stats support
team, my cheerleaders, my brilliant colleagues and my friends. I’d also like to share a heartfelt
thank you with the many members of the Math Lab who discussed the research and also
collected and entered data: Stephanie Hadden, Hafsa Hasan, Brianna Herdman, Sanda Oancea,
Anna Pogrebniak, Emilie Roy, Charlene Song, Jill Turner and Renee Whittaker. Of course, this
work would not have been possible without the principals, teachers, parents and children who
agreed to be part of this study. Thank you.
Finally, my family all had a part in making this journey a success. Amelia made me laugh
when I was frustrated. Stuart was more hands-on, developing apps and helping me trouble shoot
technical issues. Jilly made sure I was eating well and exercising. Zoe participated by delivering
toys to me when I spent too long at the computer. And most importantly, Ian was and is my
superstar and number one support. Thanks honey!
v
Table of Contents
Abstract ........................................................................................................................................... ii
Acknowledgements ........................................................................................................................ iv
Table of Contents ............................................................................................................................ v
List of Tables ................................................................................................................................. ix
List of Illustrations .......................................................................................................................... x
List of Appendices ......................................................................................................................... xi
CHAPTER 1: INTRODUCTION ................................................................................................. 12
Theories of Fraction Development ........................................................................................... 12
The Transition from Informal to Formal Fraction Knowledge ................................................. 18
Early Fraction Concepts ........................................................................................................ 18
Growth in Formal Fraction Knowledge .................................................................................... 23
Advanced Fraction Concepts ................................................................................................ 23
The Current Dissertation ........................................................................................................... 24
CHAPTER 2: LITERATURE REVIEW ...................................................................................... 26
Fraction Concepts ..................................................................................................................... 27
Language and Fractions ............................................................................................................ 30
Covariates of Fraction Skills ..................................................................................................... 44
Quantity/Arithmetic Knowledge and Fractions .................................................................... 44
Attention/Working Memory and Fractions ........................................................................... 46
vi
The Current Research ............................................................................................................... 48
Hypotheses and Research Questions .................................................................................... 48
CHAPTER 3: METHODS ............................................................................................................ 52
Recruitment ............................................................................................................................... 52
Participants ................................................................................................................................ 53
Procedure .................................................................................................................................. 53
Measures ................................................................................................................................... 53
Whole Number Skills ............................................................................................................ 55
Attention and Working Memory ........................................................................................... 56
Language Skills ..................................................................................................................... 58
Fraction Skills ....................................................................................................................... 60
Analysis Plan ............................................................................................................................ 65
CHAPTER 4: INDIVIDUAL DIFFERENCES IN FRACTION KNOWLEDGE PART 1 ......... 66
Descriptive Statistics ................................................................................................................. 66
Whole Number Skills ............................................................................................................ 68
Math Language Skills ........................................................................................................... 68
Fraction Skills ....................................................................................................................... 69
Correlations ............................................................................................................................... 74
Fraction Skills and Language................................................................................................ 74
Covariates of Fraction Skills ................................................................................................. 78
Chapter Summary ..................................................................................................................... 80
CHAPTER 5: INDIVIDUAL DIFFERENCES IN FRACTION KNOWLEDGE PART 2 ......... 81
vii
Model Testing ........................................................................................................................... 84
Fraction Skills ....................................................................................................................... 84
Chapter Summary ..................................................................................................................... 92
CHAPTER 6: PROFILES OF FRACTION NUMBER LINE STRATEGIES ............................ 94
Number Line Estimation Strategies .......................................................................................... 96
Appropriate Fraction Number Line Strategies ...................................................................... 96
Number Line Strategies based on Misconceptions ............................................................... 98
Skills that Relate to Successful Strategy Use ......................................................................... 100
Knowledge of Fraction Symbols ........................................................................................ 100
Number Line Knowledge .................................................................................................... 101
Whole Number Arithmetic ................................................................................................. 101
Current “Study” ...................................................................................................................... 102
Method .................................................................................................................................... 103
Measures ............................................................................................................................. 103
Results ..................................................................................................................................... 106
Descriptives......................................................................................................................... 106
Latent Profile Analysis ....................................................................................................... 109
Discussion ............................................................................................................................... 121
Predictors of Fraction Number Line Performance .............................................................. 124
Limitations and Future Research ........................................................................................ 126
Educational Implications .................................................................................................... 127
CHAPTER 7: GENERAL DISCUSSION ................................................................................. 129
Individual Differences in Fraction Knowledge ....................................................................... 133
viii
Hypotheses 1 and 2. ............................................................................................................ 134
Hypothesis 3: Mathematical Vocabulary and Fraction Development ................................ 136
Hypothesis 4: Fraction Mapping and Fraction Development ............................................. 136
Profiles of Fraction Number Line Skills ................................................................................. 137
Theoretical Implications ......................................................................................................... 139
Limitations and Future Research ............................................................................................ 141
Practical Implications.............................................................................................................. 144
REFERENCES ........................................................................................................................... 147
APPENDICES ............................................................................................................................ 177
ix
List of Tables
Table 3.1 ....................................................................................................................................... 54
Table 3.2 ....................................................................................................................................... 62
Table 3.3 ....................................................................................................................................... 63
Table 4.1 ....................................................................................................................................... 67
Table 4.2 ....................................................................................................................................... 74
Table 4.3 ....................................................................................................................................... 75
Table 4.4 ....................................................................................................................................... 79
Table 6.1 ..................................................................................................................................... 105
Table 6.2 ..................................................................................................................................... 107
Table 6.3 ..................................................................................................................................... 108
Table 6.4 ..................................................................................................................................... 109
Table 6.5 ..................................................................................................................................... 111
Table 6.6 ..................................................................................................................................... 115
Table 6.7 ..................................................................................................................................... 121
x
List of Illustrations
Figure 1.1 ...................................................................................................................................... 17
Figure 1.2 ...................................................................................................................................... 22
Figure 2.1 ...................................................................................................................................... 50
Figure 3.1 ...................................................................................................................................... 59
Figure 3.2 ...................................................................................................................................... 60
Figure 3.3 ...................................................................................................................................... 63
Figure 4.1 ...................................................................................................................................... 70
Figure 5.1 ...................................................................................................................................... 83
Figure 5.2 ...................................................................................................................................... 86
Figure 5.3 ...................................................................................................................................... 89
Figure 5.4 ...................................................................................................................................... 91
Figure 6.1 ...................................................................................................................................... 95
Figure 6.2 .................................................................................................................................... 104
Figure 6.3 .................................................................................................................................... 112
Figure 7.1 .................................................................................................................................... 131
Figure 7.2 .................................................................................................................................... 133
Figure 7.3 .................................................................................................................................... 138
Figure 7.4 .................................................................................................................................... 145
xi
List of Appendices
Appendix A ................................................................................................................................. 177
Appendix B ................................................................................................................................. 180
Appendix C ................................................................................................................................. 189
Appendix D ................................................................................................................................. 193
Appendix E ................................................................................................................................. 199
Appendix F.................................................................................................................................. 205
12
CHAPTER 1: INTRODUCTION
Many children and adults experience difficulty with fractions (Brizuela, 2006; Hecht et
al., 2007). These difficulties start in elementary school and persist into high school and beyond
(Siegler & Lortie-Forgues, 2017; Siegler & Pyke, 2013). Educators are concerned about
students’ difficulties with fractions because fraction knowledge is a foundation for later success
in algebra and for more advanced math learning (Booth & Newton, 2012; Hurst & Cordes,
2018a; Siegler et al., 2012). Moreover, people need fraction knowledge to successfully
participate in STEM fields (i.e., science, technology, engineering and mathematics; Hansen et
al., 2017). Thus, fractions are important, but why are fractions often difficult? To understand
why people experience difficulty with fractions, it is important to understand how they acquire
formal fraction knowledge and how that knowledge changes over time. In this dissertation, I
examined students’ developing fraction knowledge by considering the most basic element of
formal fraction knowledge – the fraction symbol. I proposed and tested a model in which the
fraction symbol is placed at the centre of fraction learning and provide evidence in favour of this
model. More specifically, the goals of this dissertation were to determine which skills support
students’ ability to map the fraction symbol to its referent and how students’ knowledge of
fraction mapping supports the development of other fraction skills.
Theories of Fraction Development
Fractions are complex, in part, because they represent rational numbers and thus have
features that are different than those of whole numbers. These differences are commonly cited as
a source of fraction errors (McMullen et al., 2018; Ni & Zhou, 2005; Vamvakoussi &
Vosniadou, 2004). For example, students may incorrectly reason that 29 is greater than 1
2 because
2 is greater than 1 and 9 is greater than 2; they are focusing on the whole number components of
13
the fraction rather than on the relation between those components (Fazio et al., 2016; Mazzocco
& Devlin, 2008). As such, the dominant theories of fraction development focus on how students
transition from reasoning about integers to reasoning about fractions. There are two views on this
transition; one describes a discontinuous transition whereas the other describes a continuous
transition.
The discontinuous view of fraction learning is focused on conceptual change. According
to this view, whole number knowledge interferes with fraction learning and thus children need to
restructure their concept of numbers to accommodate the concept of fractions (Ni & Zhou, 2005;
Van Hoof et al., 2017). Proponents of the view that conceptual change is the mechanism for
fraction learning argue that whole number concepts interfere with fraction learning. Many whole
number concepts do not generalize to fractions, leading to a whole number bias (Ni & Zhou,
2005). For example, magnitude representations are different between whole numbers and
fractions -- small integers represent small quantities whereas fraction magnitude depends on the
relation between integers (Kainulainen et al., 2017; Van Hoof et al., 2017). Moreover, the
counting successor function (i.e., n + 1 is the next number in a count sequence) does not apply to
fractions -- there are an infinite number of fractions between any two fractions; McMullen et al.,
2015; Van Hoof et al., 2017). The whole number bias leads to errors when children reason about
fraction magnitudes (Fazio et al., 2016; Kainulainen et al., 2017; Mazzocco & Devlin, 2008). In
summary, according to conceptual change, children need to overcome their whole number bias to
learn and fraction concepts.
In contrast, continuous views of fraction learning are focused on the conceptual
similarities between fractions and whole numbers (Sophian, 2017). On this view, fraction
knowledge develops as an extension of whole number knowledge (Dewolf & Vosniadou, 2015;
14
Obersteiner et al., 2019; Siegler et al., 2013; Sophian, 2017; Steffe & Olive, 2010; Vamvakoussi
& Vosniadou, 2004). There are two theories that describe fraction learning as continuous. First,
according to the integrated theory of numerical development proposed by Siegler and colleagues,
fraction knowledge develops as students adapt their knowledge of whole number magnitude to
accommodate fractions (Siegler et al., 2011; Siegler & Braithwaite, 2017; Siegler & Lortie-
Forgues, 2017). On this view, learning that fractions, like whole numbers, “have magnitudes that
can be ordered and assigned a specific location on a number line” is integral for students’
developing fraction skills (Siegler, 2016; Siegler et al., 2011, p. 274, 2013).
The second theory of continuous learning is the reorganization hypothesis (Steffe, 2002;
Steffe & Olive, 2010) which posits that fraction knowledge emerges as students adapt their
integer counting scheme to accommodate fractions. According to this view, unit fractions are the
concept that unifies whole number and fraction knowledge, that is, recognizing that unit
fractions, like whole numbers can be used to count (e.g., 35 is 3 instances of 1
5; Sophian, 2017). In
summary, theories that support fraction learning as an extension of whole number knowledge
have different perspectives on the critical knowledge that links whole numbers to fractions. The
integrated theory is focused on how higher-level skills, specifically number line estimation
develops whereas the reorganization hypothesis is focused on how lower-level skills, specifically
counting, is integrated into fraction concepts. Nevertheless, both of these views implicate whole
number knowledge as the foundation of rational number understanding.
Conceptual change and conceptual integration are not mutually exclusive views. For
example, Siegler and colleagues (Siegler et al., 2011; Siegler & Braithwaite, 2017; Siegler &
Lortie-Forgues, 2017) argue that children need to recognize both the similarities and differences
between whole numbers and fractions. Further, fraction errors based on inappropriate application
15
of whole-number reasoning may reflect an intuitive response (Obersteiner et al., 2013) whereby
children use what they know about existing concepts to explain new concepts. Thus, it has been
argued that if students are made aware of the conceptual differences between whole numbers and
fractions (Obersteiner et al., 2013; Vamvakoussi et al., 2012), then they can successfully build on
their existing whole number knowledge. Accordingly, whole number knowledge can be seen as a
foundation for fraction learning as opposed to an obstacle (Sophian, 2017).
But what whole number knowledge is foundational? To answer this question, first
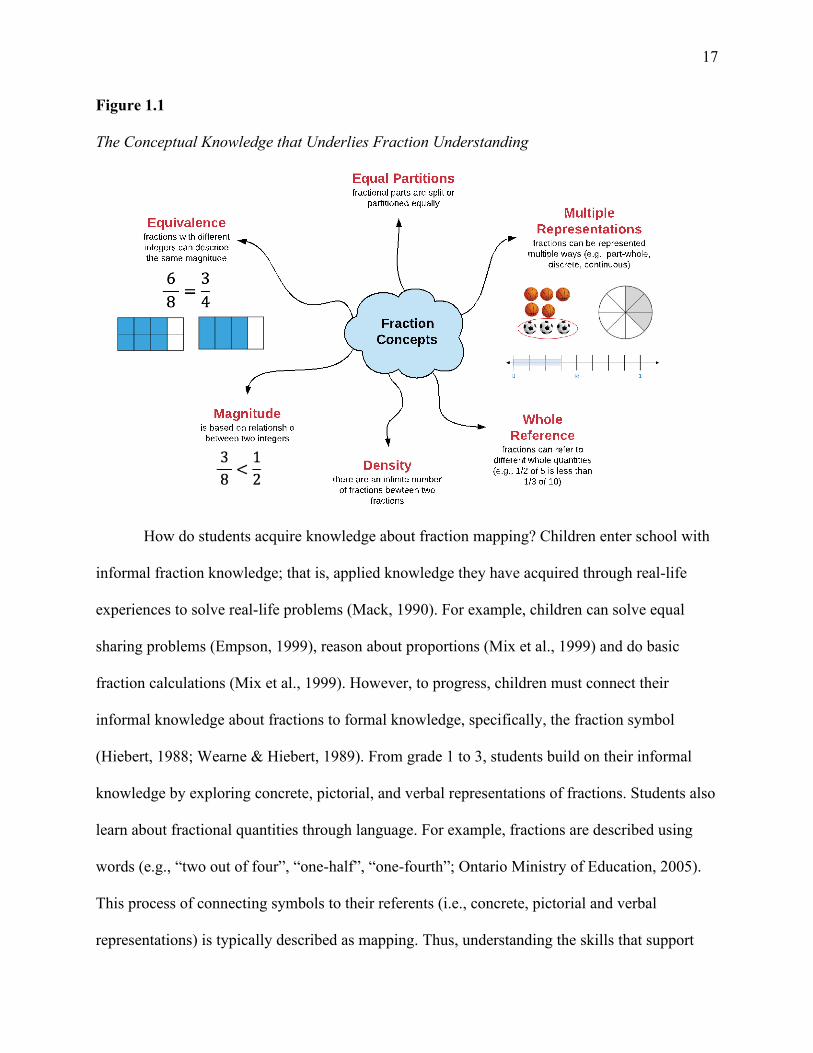
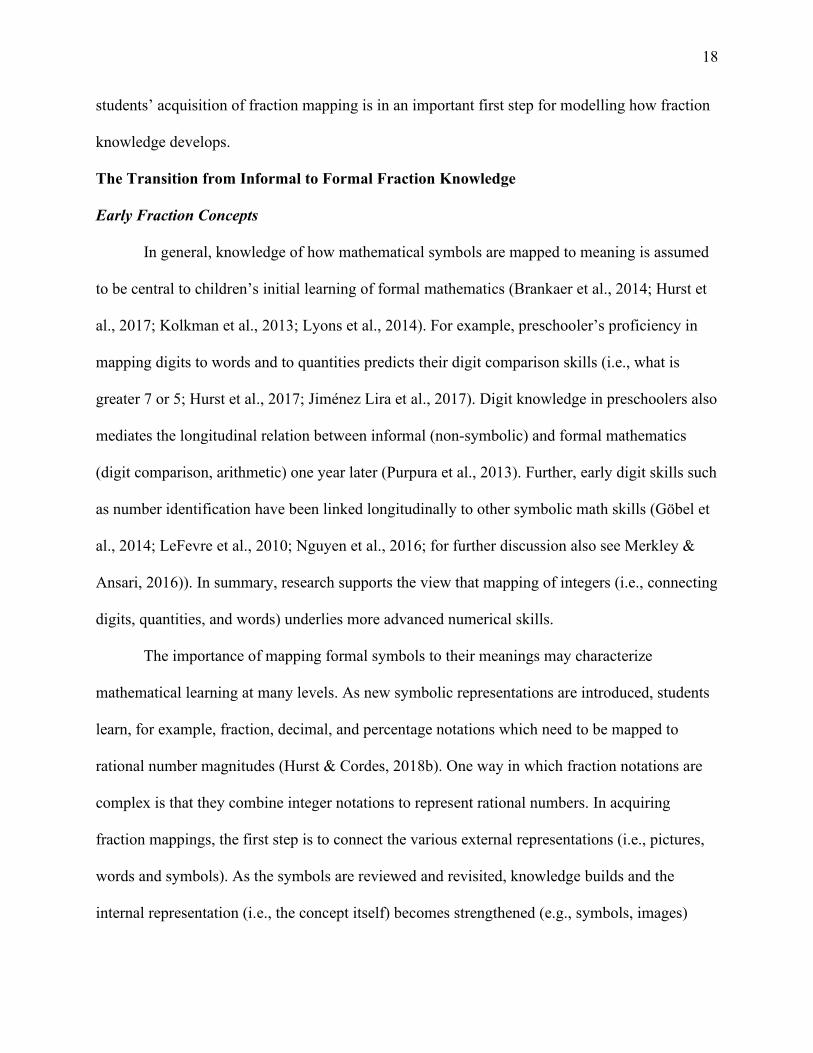
consider the conceptual knowledge that underlies fraction understanding. As illustrated in Figure
1.1, six fraction concepts have been identified: multiple representations, equal partitions,
magnitude, equivalence, density, and whole reference.
(i) Fractions have multiple representations - they can be represented as part of a
whole, a ratio, an operator, a quotient or a measure on a number line (Behr et al.,
1983; Brousseau et al., 2004; Charalambous & Pitta-Pantazi, 2007). Thus, to be
successful with fractions, children need to recognize for example, that 3 out of 8
balls is represented by the same fraction (i.e., 38 ) as is 3 out of 8 slices of pizza or
3 out of 8 sections on a 0-1 number line (see Figure 1.1)
(ii) The fraction represents equal partitions; that is, each slice of pizza from the last
example has to be the same size (i.e., 18 ).
(iii) Now, magnitude – fractions can be ordered. For any two fractions it is possible to
compare their magnitudes, say which is greater 12
> 38.
16
(iv) unless of course the fractions are equivalent. Unlike whole numbers, fractions
with different integers can represent the same magnitude, 34 for example represents
the same magnitude as 68 as shown in Figure 1.1.
Now, consider the conceptual knowledge involved in successfully placing fractions on a
number line with zero on the left endpoint and 1 on right endpoint. This is a complex activity
that potentially captures multiple fraction concepts. Most critically, students need to understand
fraction representations, that is, what the fraction symbol stands for. They also need to reason
about fraction magnitude sufficiently well to understand if the fraction is closer to 0 or closer to
1. Moreover, children need to understand and apply the concept of equal partitioning to estimate
proportionally where to place the fraction (Barth & Paladino, 2011). Finally, students may need
to recognize fraction equivalence if they are placing more than one fraction (34 and 6
8 for example)
on the same number line. In essence, number line estimation reflects advanced fraction
knowledge but recognizing what the fraction symbol represents is at the core. Knowledge of
fraction representations is necessary for more advanced fraction skills such as placing fractions
on the number line, comparing fraction magnitudes, and understanding fraction equivalence.
Thus, I argue that knowledge of fraction representations is foundational for acquiring fraction
skills. Moreover, this knowledge is operationalized by fraction mapping skills.
17
Figure 1.1
The Conceptual Knowledge that Underlies Fraction Understanding
How do students acquire knowledge about fraction mapping? Children enter school with
informal fraction knowledge; that is, applied knowledge they have acquired through real-life
experiences to solve real-life problems (Mack, 1990). For example, children can solve equal
sharing problems (Empson, 1999), reason about proportions (Mix et al., 1999) and do basic
fraction calculations (Mix et al., 1999). However, to progress, children must connect their
informal knowledge about fractions to formal knowledge, specifically, the fraction symbol
(Hiebert, 1988; Wearne & Hiebert, 1989). From grade 1 to 3, students build on their informal
knowledge by exploring concrete, pictorial, and verbal representations of fractions. Students also
learn about fractional quantities through language. For example, fractions are described using
words (e.g., “two out of four”, “one-half”, “one-fourth”; Ontario Ministry of Education, 2005).
This process of connecting symbols to their referents (i.e., concrete, pictorial and verbal
representations) is typically described as mapping. Thus, understanding the skills that support
18
students’ acquisition of fraction mapping is in an important first step for modelling how fraction
knowledge develops.
The Transition from Informal to Formal Fraction Knowledge
Early Fraction Concepts
In general, knowledge of how mathematical symbols are mapped to meaning is assumed
to be central to children’s initial learning of formal mathematics (Brankaer et al., 2014; Hurst et
al., 2017; Kolkman et al., 2013; Lyons et al., 2014). For example, preschooler’s proficiency in
mapping digits to words and to quantities predicts their digit comparison skills (i.e., what is
greater 7 or 5; Hurst et al., 2017; Jiménez Lira et al., 2017). Digit knowledge in preschoolers also
mediates the longitudinal relation between informal (non-symbolic) and formal mathematics
(digit comparison, arithmetic) one year later (Purpura et al., 2013). Further, early digit skills such
as number identification have been linked longitudinally to other symbolic math skills (Göbel et
al., 2014; LeFevre et al., 2010; Nguyen et al., 2016; for further discussion also see Merkley &
Ansari, 2016)). In summary, research supports the view that mapping of integers (i.e., connecting
digits, quantities, and words) underlies more advanced numerical skills.
The importance of mapping formal symbols to their meanings may characterize
mathematical learning at many levels. As new symbolic representations are introduced, students
learn, for example, fraction, decimal, and percentage notations which need to be mapped to
rational number magnitudes (Hurst & Cordes, 2018b). One way in which fraction notations are
complex is that they combine integer notations to represent rational numbers. In acquiring
fraction mappings, the first step is to connect the various external representations (i.e., pictures,
words and symbols). As the symbols are reviewed and revisited, knowledge builds and the
internal representation (i.e., the concept itself) becomes strengthened (e.g., symbols, images)
19
(Hiebert, 1988; Osana & Pitsolantis, 2013). Thus, once children understand how the two integers
in a fraction symbol represent the magnitude (e.g., that 3 out of 4 pieces is three-quarters of a
whole) they can start to compare fractions (e.g., recognize that 34 is greater than 2
3 ), recognize that
34 is located between 1
2 and 1 on a number line and generally, develop a broader understanding of
fraction magnitudes. What skills do students need and use to help them master this complex
process? Insights from the literature on integer mappings can inform our understanding of the
fraction mapping process.
One way in which children connect meaning to number symbols is through spoken
language (Hurst et al., 2017; Jiménez Lira et al., 2017). Spoken language is often used in the
informal learning experiences that provide foundational knowledge for children’s mathematical
learning. For example, when children understand cardinality (i.e., that the last word of a count
sequence represents the quantity of the counted set), they can directly link number words to
quantities. They also learn to associate number words to written symbols. Eventually, these
mappings extend to direct relations between symbols and their meanings, as when children can
do number comparison tasks (e.g., which is greater, 4 or 7?) by accessing stored associations
directly.
Similarly, spoken language is important as students begin to connect meaning to fraction
symbols. Teachers use general vocabulary and math-specific vocabulary to explain fractional
quantities. For example, when mapping the symbol 34 to an image showing a circle with 3 of 4
sections coloured, teachers may describe the images generally as “3 out of 4 equal portions of the
circle.” They may also use math-specific terms such as numerator and denominator. These
fraction words may help students correctly write the fraction as 34 versus 4
3 . Notably, in research
on fractions, measures of domain-general spoken language skills (e.g., receptive vocabulary) are
20
often used to index individual differences in language that are relevant to mathematics (Bailey et
al., 2017; Hansen et al., 2017; Rinne et al., 2017; Ye et al., 2016). However, other researchers
have argued that math-specific language skills are more important than general language skills
for understanding mathematical development (e.g., Hornburg et al., 2018; Powell et al., 2017;
Purpura & Napoli, 2015). General vocabulary skills may support mathematical learning for a
variety of reasons, however, math-specific language skills have been shown to mediate the
relations between general vocabulary skills and digit knowledge in children aged 3 to 5 (Purpura
et al., 2017; Toll & Van Luit, 2014) and word problem solving amongst second graders (Xu et
al., in review). Thus, students with better math vocabulary may develop better fraction mapping
skills or acquire those skills more easily.
Written language skills also may be important as students learn the rules and conventions
for writing fraction symbols and begin to connect meaning to fraction symbols. In particular,
students need to distinguish between the numerator and denominator and to recognize how to
notate the fraction bar (i.e., 23 and 2 3� are conventional whereas 2\3 is not.). Consider the
challenges inherent in mathematical symbolism: different symbols can represent the same
concept (e.g. division; 23
, 2 ÷ 3, 3)2 ), the same symbol can have different meanings (e.g., −;
opposite, minus or negative), symbols may be implicit (e.g., 3 ½ means 3 + ½ whereas 3x means
3 × x) and the placement of symbols can change their meaning (e.g., 3x, x3) (Rubenstein &
Thompson, 2001). Understanding how mathematics text is organized can help students focus on
pertinent information for problem solving. Specifically, decoding math symbols, recognizing
how symbols are ordered, and knowledge of the patterns for writing math text presumably all
influence how students and adults attend to and understand mathematical text (Crooks & Alibali,
21
2013; McNeil & Alibali, 2005; Thomas et al., 2015). Thus, familiarity with the rules and
conventions for writing mathematical text may be important for understanding fraction symbols.
Mathematical orthography knowledge is defined as the ability to recognize conventional
mathematical symbols and know the rules for combining those symbols (Douglas et al., in press;
Headley, 2016). Mathematical orthography has been linked to math achievement in adults and
students. Specifically, performance on a measure of math orthography was related to general
math achievement amongst seventh and eighth graders (Headley, 2016), fraction procedures in
adults (Douglas et al., in press), and arithmetic and word problem solving amongst students in
grades 2 and 3 (Xu et al., in review). However, researchers studying students’ fraction learning
have not considered the role that individual differences in students’ knowledge of mathematical
orthography may play in fraction learning. On the assumption mathematical orthography is
important for understanding fraction symbols, I propose that students with better mathematical
orthography knowledge in general will also have better mapping skills.
Do math-specific language skills (i.e., knowledge of math vocabulary and orthography)
support students’ ability to connect informal fraction knowledge to fraction symbols? Previous
research into the relations between language skills and math learning has been focused on
general vocabulary (Fuchs et al., 2006; Hansen et al., 2017; LeFevre et al., 2010; Vukovic et al.,
2014). When math-specific vocabulary has been assessed, the focus has been predominately with
preschool children (Hornburg et al., 2018; Purpura & Reid, 2016). Further, in the handful of
studies that have considered mathematical orthography, the focus has been on either pre-algebra
symbols (Douglas et al., in press; Headley, 2016) on integer mathematics (Xu et al. , in review),
or on the meaning and use of the symbols (Powell & Fluhler, 2018). I address this gap in the
literature by assessing the relations among math vocabulary, mathematical orthography, and
22
fraction mapping. Specifically, I modelled the relations amongst mapping and other fraction
skills for novice fraction learners (grade 4) and for more experienced fraction learners (grade 6)
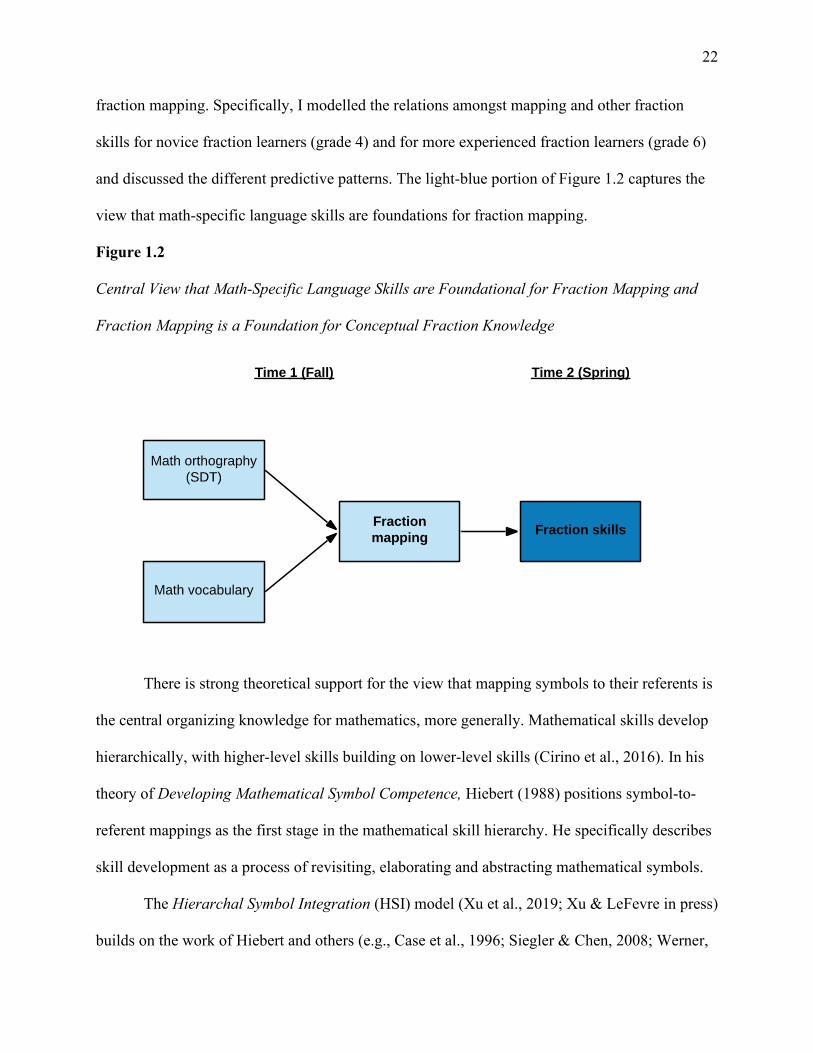
and discussed the different predictive patterns. The light-blue portion of Figure 1.2 captures the
view that math-specific language skills are foundations for fraction mapping.
Figure 1.2
Central View that Math-Specific Language Skills are Foundational for Fraction Mapping and
Fraction Mapping is a Foundation for Conceptual Fraction Knowledge
There is strong theoretical support for the view that mapping symbols to their referents is
the central organizing knowledge for mathematics, more generally. Mathematical skills develop
hierarchically, with higher-level skills building on lower-level skills (Cirino et al., 2016). In his
theory of Developing Mathematical Symbol Competence, Hiebert (1988) positions symbol-to-
referent mappings as the first stage in the mathematical skill hierarchy. He specifically describes
skill development as a process of revisiting, elaborating and abstracting mathematical symbols.
The Hierarchal Symbol Integration (HSI) model (Xu et al., 2019; Xu & LeFevre in press)
builds on the work of Hiebert and others (e.g., Case et al., 1996; Siegler & Chen, 2008; Werner,
23
1957) by describing mathematical knowledge as an increasingly integrated hierarchy of symbol
associations. In terms of whole numbers, as mathematical skills increase, less advanced digit
knowledge (e.g., understanding the cardinality and ordinality of digits) becomes integrated with
more advanced symbol knowledge (e.g., understanding how addition and multiplication symbols
describe operations; Xu et al., 2019). In the present research, I considered the fraction symbol the
lowest indicator of formal fraction knowledge. I thus, tested a model of fraction development,
positioning fraction mapping skills as a predictor of more advanced indicators of fraction
knowledge. Specifically, I modelled the relations for novice fraction learners (grade 4) and more
advanced fraction learners (grade 6). The view that fraction mapping is foundational symbol
knowledge for developing fraction skills is captured in Figure 1.2.
Growth in Formal Fraction Knowledge
Advanced Fraction Concepts
Conceptual knowledge has been defined as “knowledge of concepts, which are abstract
and general principles” and knowledge that is rich in connections (Rittle-Johnson et al., 2015, p.
588; Rittle-Johnson & Schneider, 2014). Conceptual fraction knowledge is the underlying
knowledge that supports students as they compare and order fractions, recognize equivalent
fractions, place fractions on a number line, estimate fraction sums, shade shapes and map
symbols to visual representations (Hallett et al., 2012; Hansen et al., 2015; Hecht & Vagi, 2010;
Jordan et al., 2013; Vukovic et al., 2014; Ye et al., 2016). In contrast, procedural fraction
knowledge is described as the ability to execute action sequences (i.e., procedures) to solve
problems (Rittle-Johnson & Schneider, 2014). Procedural assessments thus, involve familiar
problem types and include tasks children have been taught (Hallett et al., 2010; Rittle-Johnson &
Schneider, 2014). For example, procedural fraction knowledge supports students as they do
24
fraction arithmetic (Bailey et al., 2015; Hallett et al., 2010, 2012; Hecht & Vagi, 2010; Jordan et
al., 2013) and apply known procedures to find equivalent fractions and convert between fractions
and decimals. Both conceptual and procedural skills are necessary for people to use fractions in
meaningful and correct ways (e.g., Rittle-Johnson & Schneider, 2014).
Once students can link the symbol to its referent, they can interpret the fraction symbol in
terms of magnitude. Skills that tap into fraction magnitude knowledge include fraction
comparisons (e.g., What is greater 12 or 1
3?) and ordering fraction magnitudes (e.g., Place these
fractions in order from smallest to largest 12, 13, and 2
5). Importantly, knowledge of fraction
magnitude is integral to successfully estimate the position of fractions on a fraction number line
(Siegler et al., 2011; Torbeyns et al., 2015). Further, performance on the fraction number line is
correlated with a range of other fraction skills (Bailey et al., 2017; Hecht et al., 2003; Siegler &
Pyke, 2013) and overall math achievement (Resnick et al., 2016; Rodrigues et al., 2019;
Schneider et al., 2018; Siegler et al., 2011). Thus, understanding the strategies students use to
estimate fractions on the number line can provide insights into how students reason about
fractional magnitude.
The Current Dissertation
In this dissertation I conducted a short-term longitudinal study to test the hypothesis that
fraction mapping is the central organizing knowledge necessary for fraction learning. According
to this view, fraction mapping skills are a necessary precursor for more advanced fraction
knowledge. I predicted that students’ math-specific language skills, specifically their math
vocabulary and math orthography, would directly support their fraction mapping, and that
fraction mapping, in turn, would directly support the development of conceptual knowledge
about fractions. In particular, I assessed the relations amongst math language skills and fraction
25
mapping concurrently and fraction mapping and fraction outcomes longitudinally and then
compared the patterns of relations for students in grade 4 and grade 6.
I developed three novel assessments for this research. First, the mathematical vocabulary
task is a receptive vocabulary measure that covers a broad range of the math terms teachers use
in the classroom. Second, the symbol decision task for math (SDT-Math), implemented as an
iPad app, was designed to test students’ ability to distinguish between conventional and non-
conventional combinations of mathematical symbols. The SDT-Math operationalizes students’
knowledge of mathematical orthography. Third, the fraction mapping task, implemented as an
iPad app, requires students match fraction symbols with their verbal and visual referents. Task
development is described in Chapter 2 and details on task validation are included in Appendices
B, C and D. I have also provided access to these tasks for the broader community and thus, they
can be used to support further research on the development of children’s mathematical cognition.
This dissertation is organized as follows. In Chapter 2, I provide an overview of the
literature on how students acquire fraction knowledge. In Chapter 3, I examine the reliability and
validity of the measures used and describe the research methodology. In Chapters 4 and 5, I
present the findings of Study 1 where the goal was to test a model that describes the skills that
support fraction mapping and shows the relation between fraction mapping and developing
fraction skills. In Chapter 6, I present Study 2, where the goal was to explore strategy use on a
fraction number line to better understand how students reason about fractions and the magnitudes
they represent. Finally, in Chapter 7 I provide an overview of the results and discuss the
implications for theories of fraction learning and applications to fraction instruction.
26
CHAPTER 2: LITERATURE REVIEW
In this chapter, I provide an overview of the literature on students’ fraction learning.
First, I discuss fraction concepts and the research that describes the cognitive predictors of
conceptual fraction skills. Second, I examine the links between math-specific language skills
(i.e., mathematical vocabulary and orthography) and fraction learning. I then describe the
cognitive covariates (i.e., whole number knowledge and working memory) that are related to
fraction learning. Finally, I integrate the research and present a model that depicts the pattern of
relations amongst the predictors of fraction skills (i.e., math-specific language skills, fraction
mapping) for students in grade 4 and grade 6. Importantly, this model positions fraction mapping
as the central organizing knowledge necessary for fraction development.
Important Definitions
Before beginning this chapter I provide a set of definitions. The first two have been
adapted from Holloway and Ansari (2015). I will use these terms throughout the remainder of the
thesis.
1. I describe two uses of the word representation. The term mental representation
captures the semantic knowledge associated with the fraction and this information is held
in the mind. The term expressed representation refers to how the mental representation
is communicated thus it includes visual images, mathematical symbols, and lexical (oral
or written) representations. When I use the term representation, I am typically referring to
the expressed representation.
2. Referent is the information represented by a symbol. Thus, fraction symbols are
associated with semantic referents (i.e., the quantitative meaning; most often symbolized
27
as a visually expressed representation) and lexical referents (i.e., the written or spoken
name of the fraction).
3. Mapping describes the connection between expressed representations. For example, the
word three-fifths maps onto the fraction symbol 35.
Formal fraction learning begins when students are taught to connect the fraction symbol
to its semantic (i.e., visual) and lexical (i.e., spoken) referents. Although students may have some
exposure to fraction symbols outside of school, in Ontario, teaching of fractions symbols starts
formally in grade 4 when students are approximately 7 years old (Ontario Ministry of Education,
2005). By grade 6, Ontario students are approximately 9 years old and they have been working
with fraction symbols for two years. Students begin to develop competence with symbols as they
construct connections or mappings between the symbol and its referents (Hiebert, 1988). Despite
the importance of symbol knowledge, researchers have not fully outlined the skills students need
to help them map fraction symbols to their referents or how this knowledge supports fraction
learning. In this chapter I present empirical support for a model of fraction learning that positions
fraction mapping as the key organizing knowledge for understanding fraction concepts.
Importantly, math-specific language skills are included in the model as an important yet untested
predictor of fraction learning.
Fraction Concepts
There are many definitions of conceptual knowledge. Rittle-Johnson and colleagues
describe conceptual knowledge as “knowledge of concepts, which are abstract and general
principles” (Rittle-Johnson et al., 2015, p. 588) and knowledge that has a “richness of
connections…that increases with expertise” (Rittle-Johnson & Schneider, 2014, p. 1119). In
contrast, procedural knowledge has been defined as “the ability to execute action sequences (i.e.,
28
procedures) to solve problems” (Rittle-Johnson & Schneider, 2014). There is strong evidence
that learning concepts and procedures is iterative, one type of knowledge supports learning the
other type of knowledge (Rittle-Johnson et al., 2015; Rittle-Johnson & Alibali, 1999; Rittle-
Johnson & Schneider, 2014; Schneider & Stern, 2010).
Fraction skills have been classified as either predominantly conceptual or predominantly
procedural (Hallett et al., 2010, 2012). Examples of conceptual fraction skills include shading
fraction figures to indicate quantity, comparing fraction quantities, identifying equivalent
fractions, and placing fractions on a number line (Bailey et al., 2015; Hallett et al., 2010, 2012;
Jordan et al., 2013). In contrast, procedural skills include tasks “judged to be easily solved by
applying an algorithm or procedure taught in school” (Hallett et al., 2010, p. 398). Examples of
procedural skills include fraction arithmetic, creating equivalent fractions, and converting
fractions to decimals and percentages (Bailey et al., 2015; Hallett et al., 2010, 2012; Jordan et al.,
2013). However, because procedures refer to taught algorithms, skill classification may differ
based on a student’s experiences. For example, fraction addition would be classified as
predominantly conceptual if it had not been taught whereas it would be classified predominantly
procedural if it had been taught and practiced. A review of curriculum expectations thus can help
researchers distinguish between conceptual and procedural skills.
Fraction instruction in Ontario begins with a focus on fraction concepts (Ontario Ministry
of Education, 2005). In fourth grade, students learn to map concrete and verbal fraction
representations to the fraction symbol, they compare fraction quantities and describe equivalent
fractions using concrete materials and drawings. Students in fourth grade do not use procedures
to solve fraction problems. Although sixth grade students continue to use concrete materials and
drawings to order and compare fractions, they also begin to use procedures to solve fraction
29
problems. These procedures include converting between fractions and decimals, converting
between improper fractions and mixed numbers and finding equivalent fractions. Fraction
arithmetic operations are not formally introduced until grade 7 (Ontario Ministry of Education,
2005)1. Researchers studying fraction development often describe learning in terms of both
procedural and conceptual skill. However, because early fraction learning in Ontario is primarily
centred on concepts, the focus of this dissertation is on the development of conceptual
knowledge of fractions.
Developing fraction skills involves learning challenging new concepts. One of the most
challenging concepts is understanding fraction magnitude (Dewolf & Vosniadou, 2015; Siegler
et al., 2011; Steffe & Olive, 2010; Vamvakoussi & Vosniadou, 2004). For example, students
often struggle to see the fraction as a unit rather than as two independent integers (Rinne et al.,
2017). Students also need to distinguish the multiple ways fractions can be interpreted, such as
part of a whole, a ratio, an operator, a quotient, or a measure on a number line (Behr et al., 1983;
Brousseau et al., 2004; Charalambous & Pitta-Pantazi, 2007). Understanding these challenging
concepts does not happen quickly. Thus, comparing the skills needed to learn fraction concepts
amongst early fraction learners (grade 4) compared to more experienced fraction learners (grade
6) can provide insights into how students’ conceptual fraction knowledge develops.
Researchers have developed a variety of tasks to assess conceptual fraction knowledge.
These tasks have included fraction mapping (Hecht & Vagi, 2010; Jordan et al., 2013),
estimating the position of a fraction on a number line (Bailey et al., 2017; Siegler & Pyke, 2013),
comparing fraction magnitudes (i.e., what fraction is greater ½ or 1/4 ?) (Hecht & Vagi, 2010;
Siegler & Pyke, 2013) and identifying equivalent fraction images (e.g., what picture shows ¾ =
1 Notably however, this is changing; in the 2020/2021Ontario math curriculum children will begin learning fraction arithmetic operations in grade 5.
30
6/8?; Jordan et al., 2013). Often, several tasks are combined into a broad measure of concept
knowledge (Hallett et al., 2010, 2012; Hecht et al., 2012; Hecht & Vagi, 2010). This general
approach precludes a more nuanced analysis of the development the different aspects of
conceptual fraction knowledge (e.g., multiple representations versus magnitude). However,
because fraction learning is built on existing skills, I review the research on cognitive skills that
support fraction concept knowledge to provide insights into the skills that support fraction
mapping.
Language and Fractions
Students learn about mathematics using many different cognitive skills. However,
because spoken and written language are used to communicate mathematical ideas and define
mathematical terminology, there are multiple possible relations between math and language
(Cirino, 2011; Gjicali et al., 2019; Kleemans et al., 2014; Vukovic & Lesaux, 2013). Oral
language skills relevant to learning mathematics include vocabulary, phonological awareness,
oral comprehension, receptive syntax, grammar, rapid automatic naming, and sentence
comprehension (Chow & Ekholm, 2019; Chow & Jacobs, 2016; Peng et al., 2020). Written
language skills that support math learning may include print knowledge such as letter
identification, word discrimination (Purpura et al., 2011; Purpura & Napoli, 2015; X. Zhang et
al., 2014), and lexical orthography (X. Zhang & Lin, 2015). In studies of mathematical learning,
there has been greater emphasis on the role of oral language skills. Thus, considering the role of
both oral language and written language skills in fraction learning may provide a more complete
analysis of developing fraction skills.
31
General Vocabulary Skills
The Pathways to Mathematics Model describes three cognitive precursor skills (language,
quantity knowledge, and attention/working memory) that contribute to math learning (LeFevre et
al., 2010; Sowinski et al., 2015). The language path (indexed with receptive vocabulary and
phonological awareness) consistently predicted individual differences in performance for a range
of mathematical outcomes measured two years later (LeFevre et al., 2010; Sowinski et al., 2015).
Consistent with the model, general vocabulary skills are linked to number skills (i.e., number line
and arithmetic; Sowinski et al., 2015), word-problem solving skills (Fuchs et al., 2006; LeFevre
et al., 2010; Méndez et al., 2019) and knowledge of fraction concepts (Hansen et al., 2017;
Vukovic et al., 2014). Thus, general language skills and vocabulary in particular are important
skills students may use as they attempt to develop an understanding of fractions and the
quantities they represent.
Evidence on the relation between vocabulary and fraction concepts comes from research
on fraction naming. Educators recommend describing the fractional parts with precise words
such as numerator and denominator and describing the fractional unit with one label (i.e., “three-
fourths”) because imprecise language such as describing the fraction ¾ as “3 over 4” or
describing 3 as the “top number” can reinforce the misconception that the fraction is two distinct
numbers (Hughes et al., 2016; Powell et al., 2019). Moreover, research has suggested that
congruent fraction labels support improved fraction mapping (Hurst & Cordes, 2019; Mix &
Paik, 2008). Specifically, when the fraction quantity ¾ was labelled with one word (“blick”)
compared to a numerator-focused label (“3 blicks”) or a structural label (“three-out-of-four
blicks”), students aged 6 to 7 years were better able to recognize images showing equivalent
proportions. Support for congruent naming as a useful teaching tool was also observed in a study
32
of first and second graders’ fraction mapping skills (Mix & Paik, 2008). Mix and Paik (2008)
demonstrated that teaching transparent labels for fraction symbols (i.e., 34 means “of four parts
three”) improved students’ performance on a task of mapping symbols to images. They
concluded that imprecise language hinders conceptual fraction understanding whereas precise
naming supports conceptual fraction understanding.
Additional support that general vocabulary skills are related to students’ knowledge of
fraction concepts come from longitudinal research (Hansen et al., 2017; Vukovic et al., 2014).
Hansen et al. (2017) used latent growth analysis to identify patterns of growth in fraction concept
knowledge as students progressed from grade 3 to grade 6. They compared students who started
with low skills and made minimal progress (low growth) to students who started low but showed
improvement (some growth). Students with weak vocabulary skills were 1.8 times more likely to
be in the low-growth class compared to the some-growth class, supporting the view that
language skills are important for developing concept knowledge.
Similarly, Vukovic et al. (2014) found that students’ vocabulary and listening recall
skills, measured in grade one, predicted their knowledge of fraction concepts three years later.
Interestingly, the predictive path between language and fraction concepts was indirect through
whole number skills (i.e., number line estimation and arithmetic measured in grade 2) which
suggests that general vocabulary may be important for learning fraction concepts because
vocabulary skills support earlier number knowledge. Thus, general vocabulary skills are
important for developing knowledge of fraction concepts.
Math-Specific Language Skills
Conceptual knowledge of mathematics, including fractions, is built through three forms
of mathematical communication: (i) oral and written mathematical vocabulary, (ii) mathematical
33
symbols, and (iii) visual representations (O’Halloran, 2015; Schleppegrell, 2007). On this view,
students’ ability to map fraction symbols to their lexical (oral and written) and visual
representations should be related to their knowledge of fraction concepts. Moreover,
mathematical vocabulary, students’ knowledge of mathematical symbols, and knowledge of
fraction representations should be related to growth in their knowledge of fraction concepts.
Mathematical Vocabulary. Mathematical vocabulary refers to the lexicon of oral and
written “words or phrases that express mathematical concepts or procedures” (Hebert & Powell,
2016, p. 1515). There is considerable support for the view that mathematical vocabulary is a
mediating factor in the relations between general language skills and math learning. For
preschool and kindergarten students, mathematical vocabulary knowledge is related to early
number skills (Hornburg et al., 2018; Purpura & Reid, 2016; Toll & Van Luit, 2014), mediates
relations between vocabulary and early number skills (Purpura & Reid, 2016; Toll & Van Luit,
2014), and accounts for growth in early number skills (Toll & Van Luit, 2014). Similarly, with
school-aged students, mathematical vocabulary knowledge is related to number skills for first
through fifth graders (Peng & Lin, 2019; Powell et al., 2017; Powell & Nelson, 2017) and
mediates some of the relation between vocabulary and word problem solving for second, third
and fifth graders (Xu et al. , in review; Peng & Lin, 2019). Thus, these findings suggest that
fraction learning will also be related to students’ general and math-specific vocabulary
knowledge. However, the relation between mathematical vocabulary and fraction skills has not
been tested.
The relation between math vocabulary and math learning may change with developing
expertise. Some researchers have suggested that during elementary school, students’ math-
specific language skills become more predictive of math performance than their general
34
language skills (Powell et al., 2017; Purpura & Reid, 2016; Toll & Van Luit, 2014). For
example, Powell et al. (2017) compared the extent to which general vocabulary and arithmetic
predicted mathematical vocabulary for third and fifth graders. As mathematical vocabulary skills
increased, the predictive power of general vocabulary decreased; the reliance on general
language skills decreased with age. Extending these findings to fraction skills, the relation
between mathematical vocabulary and fraction skills may be stronger for more experienced
fraction learners.
Measuring Mathematical Vocabulary. Mathematical vocabulary skills have been
measured extensively in preschool children. In an early study, Toll and Van Luit (2014) assessed
math vocabulary using a subset of 22 math-related words that were part of an existing measure of
general receptive vocabulary. In this test, children were asked to select a picture that showed a
given math word. The math word was included as part of a sentence and was either a quantitative
word (half, more, equal) or a spatial word (behind, between, opposite). One potential limitation
of this task was that the math words were limited to what was available as part of an existing
assessment of general vocabulary.
The Preschool Assessment of the Language of Mathematics (PALM; Purpura & Logan,
2015) was designed to assess children’s knowledge of quantitative and spatial math words.
However, because the PALM was developed specifically to assess mathematical vocabulary, the
terms were chosen from preschool curriculum documents. Item response theory was used to
ensure that the chosen words discriminated a range of skill levels; thus, the measure was well-
suited to assess preschool mathematical vocabulary. Like the Toll and Van Luit measure, the 16-
item PALM assessed receptive vocabulary with the exception of one quantitative item which
measures expressive vocabulary. The PALM measure has been used extensively to assess
35
mathematical vocabulary in preschool-aged children (e.g., Hornburg et al., 2018; Kung et al.,
2019; Purpura & Reid, 2016; Schmitt et al., 2019).
Current measures of mathematical vocabulary skills amongst school-aged children
typically tap into knowledge of multiple math domains and test both receptive and expressive
math vocabulary. Powell and colleagues have developed math vocabulary assessments for
students in grades 1 through 8 (Hughes et al., 2020; Powell et al., 2017; Powell & Nelson, 2017).
In each assessment, math words were selected based on curriculum documents and math
textbooks. Notably, for the grade 7 and 8 measure, teachers also ranked word importance to
provide further validation of word choice (Hughes et al., 2020). All measures were pencil-and-
paper tests administered in the classroom. The Grade 1 assessment included 64 math terms and
three levels of response: recall, comprehension and application (Powell & Nelson, 2017).
Similarly, the Grade 3 and 5 assessment included 133 terms and multiple question types
(multiple choice, word/definition matching, short answer etc.) (Forsyth & Powell, 2017; Powell
et al., 2017). Finally, the Grade 7 and 8 measure included 57 items and one question type; all
questions were multiple choice and students were expected to choose the answer that best
defined the math word. Powell and colleagues’ measures have been used extensively to assess
mathematical vocabulary in school-aged children (Powell et al., 2020). In several studies, these
measures have shown good internal reliability and validity, in the sense that they been used in
studies with different groups of students (e.g., students with learning disabilities and English
language learners) (Forsyth & Powell, 2017; Powell et al., 2020), with different math measures
(e.g., arithmetic, equation solving and word problems) and have been similarly related to general
vocabulary (r=.61 to .70) across studies.
36
The existing math vocabulary tools have both strengths and weaknesses. There are
several strengths. First, curriculum documents and (where applicable) math textbooks were
referenced when selecting target words for the PALM and Powell assessments; teacher input was
also used in the Hughes et al. (2020) assessment. Second, item response theory was used to
narrow word-choice and ensure word-choice captured a range of skill levels in the PALM and in
Powell and colleagues’ grades 7 and 8 test (Hughes et al., 2020). Third, words from multiple
math domains were included in Powell and Hughes’ assessments, thus providing a broad
assessment of math vocabulary. However, these measures also have some limitations. First, the
target age group was limited in the PALM assessment. Second, test administration for the grade
1 to 5 Powell assessments was long (30 minutes) and involved pencil and paper responses
needing post-test coding. Third, different kinds of questions were used in the Powell tests.
Although this approach provides useful details for educators, different question types makes
comparisons across questions difficult (i.e., word/definition matching may be easier than short
answer questions). Finally, I was unable to use any of these measures because there was no
version suitable for students in grades 4 and 6.
I developed a new measure of math vocabulary for students in grades 4 and 6, attempting
to capitalize on the strengths of the prior measures. Task development is described in detail in
Appendix B. Briefly, curriculum documents and math textbooks were referenced to select math
words from multiple domains. Item response theory was applied to ensure word choice
discriminated across a range of skill levels. Further, the task was modelled on an extremely well
known measure of general receptive vocabulary, the Peabody Picture Vocabulary Test (PPVT;
Dunn & Dunn, 2007). In short, this measure of mathematical vocabulary task is quick to
37
administer, all questions were structured the same, it shows good internal reliability, and has
good face and construct validity as shown in Appendix B.
Mathematical Orthography. Written mathematical symbols are the main text-based
tools used to communicate mathematical concepts. Skemp (1982) distinguishes between two
levels of written mathematical language: the surface structure of symbolic text (i.e., the physical
characteristics and syntax), which I will refer to as mathematical orthography, and deep
structures of the symbols (i.e., semantic characteristics). Mathematical orthography includes
rules about the material symbol (i.e., what it looks like, size, spatial register) and the symbol
syntax (i.e., how symbols are written in mathematical strings) (Bardini et al., 2015; O’Halloran,
2005; Quinnell & Carter, 2013; Rubenstein & Thompson, 2001). The term mathematical
orthography is borrowed from literacy research – the word orthography is derived from the
Greek roots orthos, meaning correct, and graphein, meaning to write. Hence, mathematical
orthography means correctly writing mathematical text. For example, it is conventional to write
subtraction strings with the minus sign spatially centred after the minuend (i.e., 7 − 5) rather than
at the bottom of the spatial register (i.e., 7 _ 5) or preceding the minuend (i.e., − 7 5). Similarly,
it is conventional to write mixed fractions with the whole number preceding the fraction (i.e., 3
½ vs. ½ 3). In summary, mathematical orthography refers to the body of knowledge of
mathematical symbols and the conventions for combining those symbols into expressions and
equations (Douglas et al., in press; Headley, 2016).
Evidence that mathematical orthography supports math learning comes from research on
students’ symbol knowledge. Powell and Fluhler (2018) developed the Mathematics Symbol
Measure to assess students’ understanding of the symbols used in the elementary grades,
Specifically they tested students in grades 1, 3 and 5 by measuring their understanding of 23
38
common symbols (e.g., =, >, %, $ ). Students completed a written test where they were asked to
name, use and define each symbol. Across grades, students’ symbol knowledge predicted their
arithmetic skills. Although symbol orthography was not explicitly part of the Mathematics
Symbol Measure, students needed an understanding of orthography to correctly use the symbols.
For example, writing 3.00$ is an incorrect use of the $ sign, whereas writing $3.00 is correct.
The finding that symbol knowledge was a significant predictor of arithmetic across grades 1, 3
and 5 supports the view that orthography is related to math skills.
Evidence that mathematical orthography supports math learning also comes from
research focused on single symbols, specifically, the equal sign (=) and the negative symbol (-).
Students in elementary and middle school often interpret the equal sign as an operator that means
“put the answer here” (Crooks & Alibali, 2014; Powell & Fuchs, 2010; Rittle-Johnson & Alibali,
1999). Thus, students may judge equations such as 3 + 5 = 2 + 6, as incorrect or meaningless
(Li, 2008; Steinberg et al., 1991) and subsequently struggle to solve equations with missing
numbers (Powell & Fuchs, 2010; Sherman & Bisanz, 2009). Interestingly, drawing attention to
the orthographic features related to the equal sign – that is, identifying sides of an equation,
noticing the location of the equal sign, and recognizing the order of the mathematical symbols in
an equation – resulted in improved performance solving equations (Alibali et al., 2018; McNeil
et al., 2011). These findings support the view that knowledge of mathematical orthography is
related to mathematical skills.
Students have difficulty interpreting the orthography of the negative symbol (Herscovics
& Linchevski, 1994; Vlassis, 2008). Middle school students for example, made errors solving
equations with adjacent minus/negative symbols (e.g., 5 − (−1)) (Vlassis, 2008) and solving
algebraic equations where the negative symbol came before the variable such as 12 − x = 5;
39
solve for x. A common error was incorrectly writing 12 = 5 – x or x = 5 – 12 (Herscovics &
Linchevski, 1994; Vlassis, 2008). However, because the students in these studies had
demonstrated a conceptual understanding of the negative symbol, their errors reflected poor
understanding of the conventions for notating the negative symbol. These findings provide
further support for a link between mathematical orthography and mathematical skills.
Perceptual differences among of fraction symbols may be one way in which
mathematical orthography is related to students’ developing fraction skills. For example, there
are multiple ways to notate fractions (i.e., 23, 2 3� , 2 3⁄ ) and the fraction bar can have multiple
meanings (the slash as a date 2/3/2020 or unit m/s; Quinnell & Carter, 2013; Rubenstein &
Thompson, 2001). Thus, students who are more attentive to the perceptual cues associated with
fraction conventions (i.e., the orthography) may also have a better understanding of fraction
symbols. This view is supported by research showing that attention to perceptual cues in
equations is related to equation solving (Hoch & Dreyfus, 2004; Landy et al., 2014; Landy &
Goldstone, 2007; Papadopoulos & Gunnarsson, 2020). For example, the equation 3 + 5 × 4 can
also be written 3 + (5 × 4). The brackets are unnecessary, but they helped second and third
graders attend to the order of operations and successfully solve the equations (Marchini &
Papadopoulos, 2011, as cited in Papadopoulos & Gunnarsson, 2020). Similarly, narrowly
spacing precedent operations within equations, for example, 3 + 5×4 versus 3 + 5 × 4, helped
students attend to the order of operations and thus better discriminate between the correct (i.e.,
23) and incorrect (i.e., 32) solutions (Landy & Goldstone, 2007). Finally, attending to the
orthographic features of the equal sign was positively related to equation solving (Alibali et al.,
2018; McNeil et al., 2011). Therefore, I predicted that students who are better able to attend to
40
the orthographic features of fraction symbols, as evidenced by their knowledge of mathematical
orthography, will be more successful fraction learners.
Is the relation between mathematical orthography and fraction skills stable over
development? Findings are mixed. Research with the Symbol Knowledge Measure indicates that
the relation between symbol knowledge and math skills changes over development. In their
report that described developing and validating the Symbol Knowledge Measure (SKM), Powell
and Fluhler (2018), found that symbol knowledge accounted for more variance in arithmetic
skills amongst younger students compared to older students (i.e., grade 1 compared to grade 3,
grade 3 compared to grade 5).. In contrast, research with the Symbol Decision Task (SDT-Math)
indicates that the relation between symbol knowledge (orthography specifically) and math skills
is stable over development. Performance on the SDT-Math was related to general math skills for
students in grades 7 and 8 (Headley, 2016), accounted for unique variance (after controlling for
cognitive and number skills) in fraction and algebra arithmetic for adults (Douglas et al., in
press) and was related to arithmetic skills and accounted for unique variance in word problem
solving for students in grades 2 and 3 (Xu et al,. in review). The SKM, by design is tapping into
both the surface structures (i.e., appearance, syntax; students write symbol expressions) and the
deep structures (i.e., semantics; students describe what the symbol means) of symbols knowledge
(Skemp, 1982). Moreover, because the SKM is a written test, other skills such as reading and
writing may account for some of the symbol knowledge and arithmetic relations – particularly
for the younger students (e.g., Grimm, 2008). Thus, task differences between the SKM and the
SDT may account for mixed findings across grades. In summary, because the SDT is a more
direct measure of orthography than the SKM, I am basing my hypothesis on the previous work
with SDT. Extending the findings from work with the SDT task to fraction skills, I predict the
41
relation between mathematical orthography and fraction mapping will be similar for students in
grades 4 and 6.
Measuring Mathematical Orthography. To assess students’ mathematical orthography,
I developed a measure that assessed students’ ability to discriminate between well-formed
mathematical text (e.g., 7 −5) and poorly formed mathematical text (e.g., 7 _ 5). This measure is
called the symbol decision task for math (i.e., SDT-Math). Task validation is described in
Appendix C. The SDT-Math is based on a similar symbol decision task that was focused on
knowledge of pre-algebra symbols and was used in research with adults and youth (Douglas et
al., in press; Headley, 2016). Task validity of the original SDT-Math task was supported by the
finding that grade 7 and 8 students with higher mathematical orthography scores performed
better on standardized math assessments than students with lower mathematical orthography
scores (Headley, 2016). Similarly, adults with higher mathematical orthography scores
performed better on measures of algebraic and fraction computations than those with lower
scores (Douglas et al., in press). Finally, students in grades 2 and 3 who had higher scores on a
similar mathematical orthography measure performed better on measures of arithmetic and
word-problem solving than students with lower mathematical orthography scores (Xu et al., in
review). Together, these findings show that a relation between mathematical orthography and
math skills can be captured with the SDT-Math.
In summary, I propose that mathematical vocabulary and mathematical orthography are
key skills that help students develop their understanding of fraction symbols. For example,
knowing the term equal may help students understand that 2 3� represents two out of three equal
portions. Further, recognizing the conventions for writing the fraction bar may help students
distinguish between 2 3� and 3 2� . Importantly, the relations between math vocabulary,
42
mathematical orthography, and knowledge of fraction symbols have not been tested. Thus, I
developed measures of mathematical language skills (mathematical vocabulary and orthography)
and fraction symbol knowledge and tested a set of hypotheses about the contributions of math-
specific language skills to fraction learning.
Visual Representations. The terms used to describe visual fraction representations can
overlap and the definitions are not always used consistently. To clarify, the term part-whole
fraction construct has been defined as partitioning of both continuous and discrete quantities; “a
continuous quantity is partitioned into equal size [parts] (e.g., dividing a cake into equal parts),
and partitioning would be the same with a set of discrete objects (e.g., distributing the same
amount of sweets among a group of children)” (Gabriel et al., 2013, p. 2). Thus, to describe the
visual representations, it is necessary for researchers to distinguish between fractions of
continuous versus discrete quantities. Visual representations of continuous quantities have been
referred to as area models (e.g., Fuchs et al., 2017; Roesslein & Codding, 2019), discretized
models (Begolli et al., 2020) continuous models (Newstead & Murray, 1998) and part-whole
models (Misquitta, 2011). The area model label is limited because it precludes representations of
linear or volumetric quantities. The discretized model label is a new term and thus not well
recognized. Finally, the continuous model label is limited because it conflicts with terminology
used to identify non-partitioned quantities.
To avoid confusion, I have included definitions of the various representations. These
terms will be used throughout the dissertation. (i) Part-whole fraction representations depict the
proportion of area or volume - typically partitioned and shaded - in a whole shape. For example a
circle showing 3 out of 4 sections shaded or a beaker that is filled to the 3rd of 4 tick marks both
refer to the fraction 34 . Discrete fraction representations depict the proportion of separated
43
objects in a group. For example, a picture showing 3 hats as part of a set of 4 hats, refers to the
fraction 34 . Notably both discrete and part-whole fraction representations are examples of the
part-whole fraction construct. (iii) Continuous fraction representations by contrast depict the
area or volume of a shape or distance on a line where there are no partitions. A beaker partially
filled with no partitioned tick marks or a spot marked on number line with no other partitioned
tick marks are examples of continuous fraction representations.
Some visual fraction representations are more difficult for students to name than others
(Behr et al., 1983; Brousseau et al., 2004; Charalambous & Pitta-Pantazi, 2007). For example,
students aged 7 to 12 were more successful identifying equivalent fractions when they compared
part-whole representations (i.e., 3 out of 4 sections of a rectangle coloured) than comparing
discrete representations (i.e., 3 out of 4 balls) (Begolli et al., 2020). Students in fourth and fifth
grade were more successful mapping visual representations of unit fractions presented as part-
whole area models (rectangles and circles) than those presented as continuous number line
models (Tunç-Pekkan, 2015). Further, an over-reliance on circle representations has been
identified as a limiting factor in students’ developing fraction knowledge (Yearley & Bruce,
2014). The finding that students have better understanding of some fraction representations
compared to others suggests that researchers may learn more about how fraction skills evolve by
studying students’ fraction mapping skills.
There is also empirical support for the proposal that students’ knowledge of visual
fraction representations, and thus their fraction mapping skill, is related to their conceptual
fraction knowledge. For example, students who experience difficulty correctly identifying visual
representations of the part-whole construct also experience difficulty with more advanced
fractional thinking such as comparing symbolic fraction magnitudes (i.e., what is greater 25 or 3
7 )
44
(Lewis, 2016; Mazzocco et al., 2013) and placing fractions on a number line (Tunç-Pekkan,
2015). The findings that basic knowledge of part-whole fraction representations is linked to
fraction comparison and number line estimation skills supports the view that fraction mapping
skills are related to knowledge of fraction concepts.
Covariates of Fraction Skills
The Pathways Model provides a framework to organize the general cognitive skills that
are related to individual differences in mathematics generally (LeFevre et al., 2010; Sowinski et
al., 2015; Träff et al., 2018) and fraction knowledge specifically (Vukovic et al., 2014).
Reviewing the literature on fraction development, I examined the cognitive predictors of
conceptual fraction skills in terms of three precursor pathways: language, number/quantity
knowledge, and attention/working memory.
Quantity/Arithmetic Knowledge and Fractions
A range of measures have been used to assess early number skills in math learning. The
Pathways Model described math development from preschool to grade 2 (LeFevre et al., 2010).
In this first model, quantity knowledge was captured with a preschool subitizing task, that is
children enumerated dot quantities between 1 and 3. The quantitative pathway was then refined
to extend the model to students in grade 3 (Sowinski et al., 2015). Quantity knowledge thus
reflected a broader range of number skills, that is, counting, subitizing, and digit comparison.
Cardinal skills, as measured by digit comparison, are consistently correlated with students’
arithmetic skills (for a review see: Schneider et al., 2017). Ordinal skills (i.e., Is 2 4 3 in
increasing order?) are even stronger predictors of arithmetic performance, especially for older
students and adults (Lyons et al., 2016; Lyons & Beilock, 2011; Xu et al., 2019). However, there
45
is limited research examining the relations between these basic number skills and fraction
concepts (Gilmore et al., 2018).
On the assumption that there is a hierarchy of number skills (Cirino et al., 2016; Hiebert,
1988; Xu et al., 2019), digit skills such as digit comparison and simple arithmetic should be
related to fraction learning. This view is supported through longitudinal research. For example,
following students from grade 1 to grade 4, Vukovic et al., (2014) found that students’ addition
skills in grade 1 predicted their more advanced arithmetic skills in grade 2 which in turn
predicted their knowledge of fraction concepts in grade 4. Hansen et al., (2017) found a similar
longitudinal relation with older students whereby students’ addition skills in grade 3 predicted
and their knowledge of fraction concepts in grade 6. Concurrent research also supports a link
between digit skills and fraction learning. For example, number comparison skills in sixth grade
predicted students’ performance on a combined measure of fraction procedures and concepts
concurrently through double-digit arithmetic (Cirino et al., 2016). Further, addition fluency
(Hansen et al., 2017) and combined addition and multiplication fluency (Hansen et al., 2015;
Hecht et al., 2003; Hecht & Vagi, 2010) directly predicted fraction concepts and fraction
arithmetic concurrently for students in grade 5 (Hecht et al., 2003). Together, these findings
suggest that basic number knowledge forms a foundation for arithmetic skills which in turn
support developing fraction concepts. Thus, to model the skills that support knowledge of
fraction concepts, whole number arithmetic will be used to characterize the quantitative pathway.
Using the view that fraction mapping is the critical organizing knowledge for fraction
learning, there is a need to clarify the skill hierarchy among arithmetic, fraction mapping, and
more advanced fraction concepts (Cirino et al., 2016, p. 112). The hierarchical symbol
integration (HSI) model was developed to describe the skill hierarchy for whole number relations
46
(Xu et al., 2019). The HSI describes whole number knowledge as an integrated network of
increasingly complex symbol-symbol associations. The hierarchy is built from cardinal
associations (What is greater 7 or 4?), ordinal associations (Are these numbers in increasing
order 1 5 3?), and arithmetic associations. The model refers to integration, because associations
that are learned earlier (e.g., that 3 4 have a particular ordinal relation to 5) have to be available
in counting tasks whereas addition relations, learned later (e.g., 3 + 4 = 7), need to be accessible
in arithmetic tasks. Extending the HSI model to describe fraction skills, students must first learn
to link the fraction symbol to the quantity it represents in order to compare and add fractions.
Thus, I predict that fraction mapping knowledge will support more advanced knowledge of
fraction concepts such as comparing fraction magnitudes and placing fractions on a number line.
Attention/Working Memory and Fractions
There is some evidence that attention and working memory predict fraction learning
(Bailey et al., 2014; Hansen et al., 2015; Hecht & Vagi, 2010; Jordan et al., 2013; Vukovic et al.,
2014; see also Peng et al., 2016 for a review). I am using the Baddeley and Hitch multi-
component model of working memory (WM) (Baddeley, 2000) as a theoretical framework to
describe the general cognitive processes related to fraction learning. According to this model,
working memory is made up of the central executive, the phonological loop, the visual-spatial
sketchpad and the episodic buffer. The central executive coordinates and updates information
from the phonological loop and visual-spatial sketchpad. The phonological loop is responsible
for temporary storage of verbal information and the visual-spatial sketchpad is responsible for
temporary storage of both visual and spatial information (Baddeley, 2003). Verbal working
memory draws on the phonological loop and central executive resources whereas spatial working
47
memory draws on the visual-spatial sketchpad and central executive resources. Finally, the
episodic buffer is where the information is simultaneously maintained and manipulated.
Working memory and attention may be important for fraction learning because doing
fraction tasks such as arithmetic, comparing magnitudes and placing fractions on a number line
entails attending to two sources of information – the numerator and the denominator (Peng et al.,
2016). Studies on working memory and fractions, however, often include only one working
memory domain. Verbal working memory has been included in multiple studies of fraction skills
(Bailey et al., 2014, 2017; Hansen et al., 2017; Hecht et al., 2003; Hecht & Vagi, 2010; Ye et al.,
2016). It is moderately correlated with fraction concepts (Peng et al., 2016) and may predict
fraction concepts indirectly through shared whole-number knowledge (Hecht et al., 2003; Hecht
& Vagi, 2010). Spatial working memory by contrast, has been included in few studies of fraction
skills (Cirino et al., 2016) but was found to be related to fraction learning indirectly through
arithmetic skills (Cirino et al., 2016).
Findings on working memory and fraction performance are mixed. For example, for
students from fourth to sixth grade, Hansen et al. (2017) found that verbal working memory did
not influence growth in fraction concepts. Comparing the influence of working memory on
fraction learning, Fuchs et al. (2014) found that students with poor verbal working memory skills
(operationalized by sentence listening recall) learned fractions better with conceptual activities
whereas students with better working memory skills learned fractions better with procedural
activities. Finally, Peng et al. (2106) suggest that there are too few studies to characterize the role
of the various working memory components with different fraction outcomes. Thus, in the
current study, I included measures of both verbal and visual-spatial working memory.
48
The Current Research
The primary goal of this dissertation was to examine students’ developing fraction
knowledge to test a model in which fraction mapping skills are the central organizing feature for
developing conceptual fraction knowledge. Importantly, math-specific language is a necessary
skill that supports connecting fraction symbols and fraction representations. Students in grades 4
and 6 were compared because previous research has shown that this is a critical time period for
students to consolidate their fraction knowledge (Barbieri et al., 2019; Hansen et al., 2017;
Jordan et al., 2017). In addition, the students in the present research were first taught fraction
symbols in grade 4; by grade 6, students were expected to have had a reasonable amount of
practice using fraction symbols and thus their fraction knowledge should be more advanced.
Three novel tasks were specifically developed for this thesis. The new tasks included two
measures of math-specific language skills: mathematical vocabulary and mathematical
orthography. By testing aspects of verbal (vocabulary) and written (orthography) math language
skills I was able to analyse the effect of math language in general and to explore in detail
individual differences in fraction-related language. The fraction mapping task was a novel iPad
app developed to allow students to show how to accurately they could connect the three forms of
mathematical discourse: visual representations, symbols, and words. To control for any effect of
representation type, the mapping task included an equal number of part-whole models (e.g., area
and volume representations) and discrete models (Begolli et al., 2020; Bruce et al., 2013; Hebert
& Powell, 2016; Rau & Matthews, 2017).
Hypotheses and Research Questions
In Chapter 5, I tested the following hypotheses. Based on the assumptions that (a)
knowledge becomes more domain-specific with developing expertise (Powell et al., 2017) and
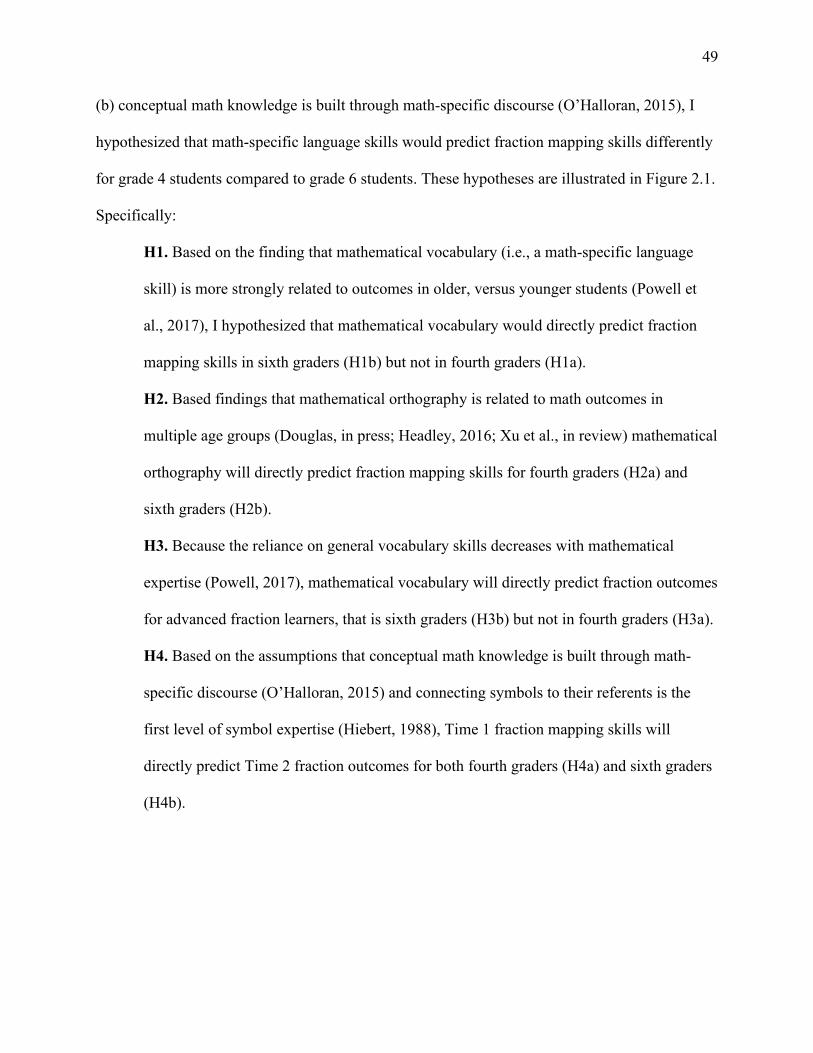
49
(b) conceptual math knowledge is built through math-specific discourse (O’Halloran, 2015), I
hypothesized that math-specific language skills would predict fraction mapping skills differently
for grade 4 students compared to grade 6 students. These hypotheses are illustrated in Figure 2.1.
Specifically:
H1. Based on the finding that mathematical vocabulary (i.e., a math-specific language
skill) is more strongly related to outcomes in older, versus younger students (Powell et
al., 2017), I hypothesized that mathematical vocabulary would directly predict fraction
mapping skills in sixth graders (H1b) but not in fourth graders (H1a).
H2. Based findings that mathematical orthography is related to math outcomes in
multiple age groups (Douglas, in press; Headley, 2016; Xu et al., in review) mathematical
orthography will directly predict fraction mapping skills for fourth graders (H2a) and
sixth graders (H2b).
H3. Because the reliance on general vocabulary skills decreases with mathematical
expertise (Powell, 2017), mathematical vocabulary will directly predict fraction outcomes
for advanced fraction learners, that is sixth graders (H3b) but not in fourth graders (H3a).
H4. Based on the assumptions that conceptual math knowledge is built through math-
specific discourse (O’Halloran, 2015) and connecting symbols to their referents is the
first level of symbol expertise (Hiebert, 1988), Time 1 fraction mapping skills will
directly predict Time 2 fraction outcomes for both fourth graders (H4a) and sixth graders
(H4b).
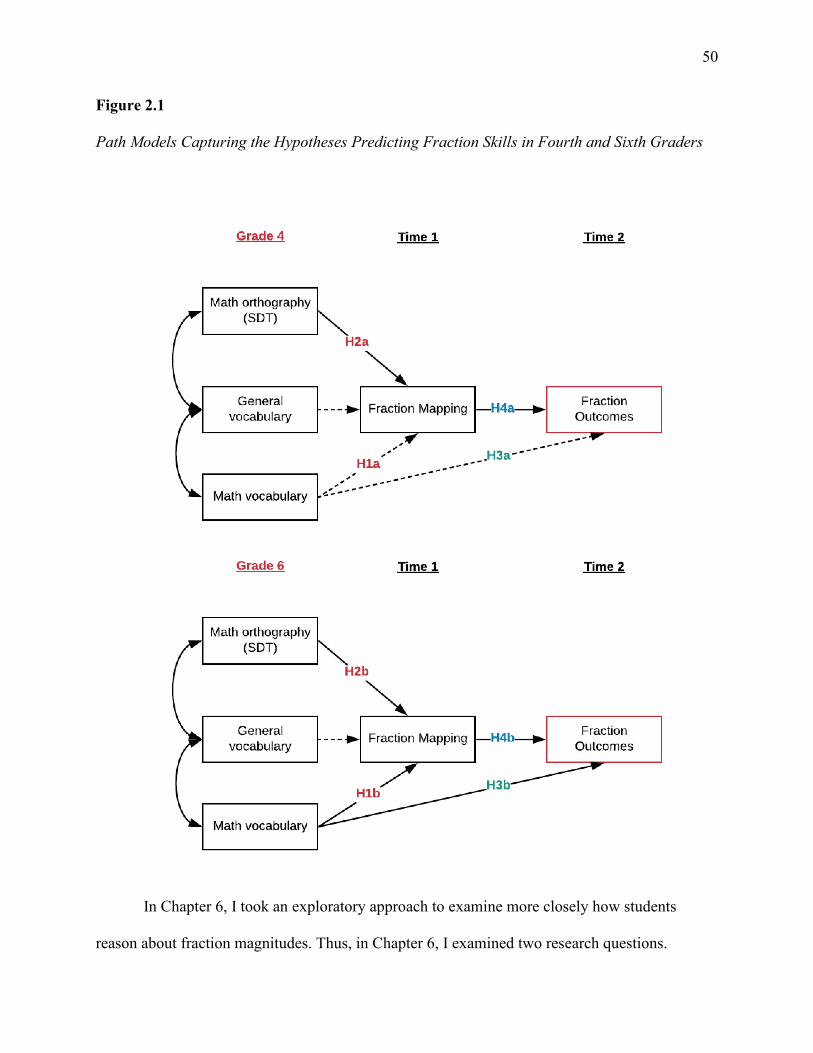
50
Figure 2.1
Path Models Capturing the Hypotheses Predicting Fraction Skills in Fourth and Sixth Graders
In Chapter 6, I took an exploratory approach to examine more closely how students
reason about fraction magnitudes. Thus, in Chapter 6, I examined two research questions.
51
Q1. What strategies do students use to estimate fractions on a number line?
Q2. What skills differentiate students based on their fraction estimation profiles?
The main goal of this dissertation was to characterize the skills that support students’
ability to map the fraction symbol to its referent and to describe how individual differences in
students’ knowledge of fraction mapping relates to their developing fraction skills. Thus, in
Study 1, the concurrent and longitudinal relations between math-specific language skills, fraction
mapping and subsequent fraction knowledge were modelled, and patterns of relations were
compared between fourth and sixth graders. In Study 2, to better understand how students reason
about fractional quantities, performance of the fraction number line was examined in greater
detail. Supporting literature for the fraction number line study is reviewed in Chapter 6, which
was written as a free-standing paper.
52
CHAPTER 3: METHODS
In this thesis, I proposed and tested a model in which fraction mapping skills are the
central organizing element for developing fraction skills. I assumed that math-specific language
skills support fraction mapping. To compare the relations between math-specific language skills,
fraction mapping and developing fraction knowledge, students in grades 4 and 6 completed a
battery of assessments. Known predictors (cognitive, numeric and linguistic) of fraction skills
were assessed and students were tested at two time points, Fall 2018 and Spring 2019. The study
was correlational and longitudinal over approximately five months. Students’ cognitive skills and
fraction mapping were assessed in the fall; in the Spring, fraction mapping was measured again,
as were several different fraction outcomes. The project was designed to address the following
research questions:
1. What cognitive skills support students’ ability to map the fraction symbol to its referent?
2. How does students’ knowledge of fraction mapping support their developing fraction
skills?
Recruitment
The study was approved by the Carleton University and Research Ethics Board (file
#108058) and subsequently, the research steering committee of an Ontario school board. As per
board protocol, the board sent out study information to schools in the study catchment area.
Interested principals then contacted the board and I set up information meetings with these
principals and their teachers. After meeting with the teachers, those who wanted students in their
classes to participate sent home information letters. Parents provided written consent allowing
their child to participate. Ten teachers with 12 classes of students agreed to participate and thus
approximately 250 students received the letter and consent forms.
53
Participants
One hundred and thirty-two students from grade 4 (N=65, 31 boys, Mage= 113 months)
and grade 6 (N= 66, 38 boys, Mage= 137 months) were recruited from three schools serving
Kindergarten to grade 6 students. Of these students, one student was excluded from the study
because this student did not complete the second wave of testing and one student chose not to
participate. All parents reported English as the home language and parents were well educated;
66% of fathers and 84% of mothers were college or university graduates. The schools are in
areas that serve both town and rural students. No information about the specific situation of
individual students was collected.
Procedure
Students participated in three testing sessions. The first two sessions were in November
2018 (TIME 1) and the final session was in April 2019 (Time 2). Each session lasted
approximately 25 minutes. Prior to each testing session, we described the testing protocol to
students and the students gave oral assent. All students were tested individually at their school by
a research assistant (RA) who was previously trained by the lead researcher. Researcher training
included a practice session (2 to 3 hours) where the RA practiced the testing and scoring
procedures and was instructed on working with children. Two to four students were tested at a
time, depending on the availability of RAs. Testing took place in a quiet area at the school such
as the library or an empty classroom. The lead researcher was present during all testing times and
thus, could observe and respond to any questions or concerns raised by the RAs.
Measures
The test battery and timing are shown in Table 3.1. Additional measures that are not part
of the current analyses are described in Appendix A.
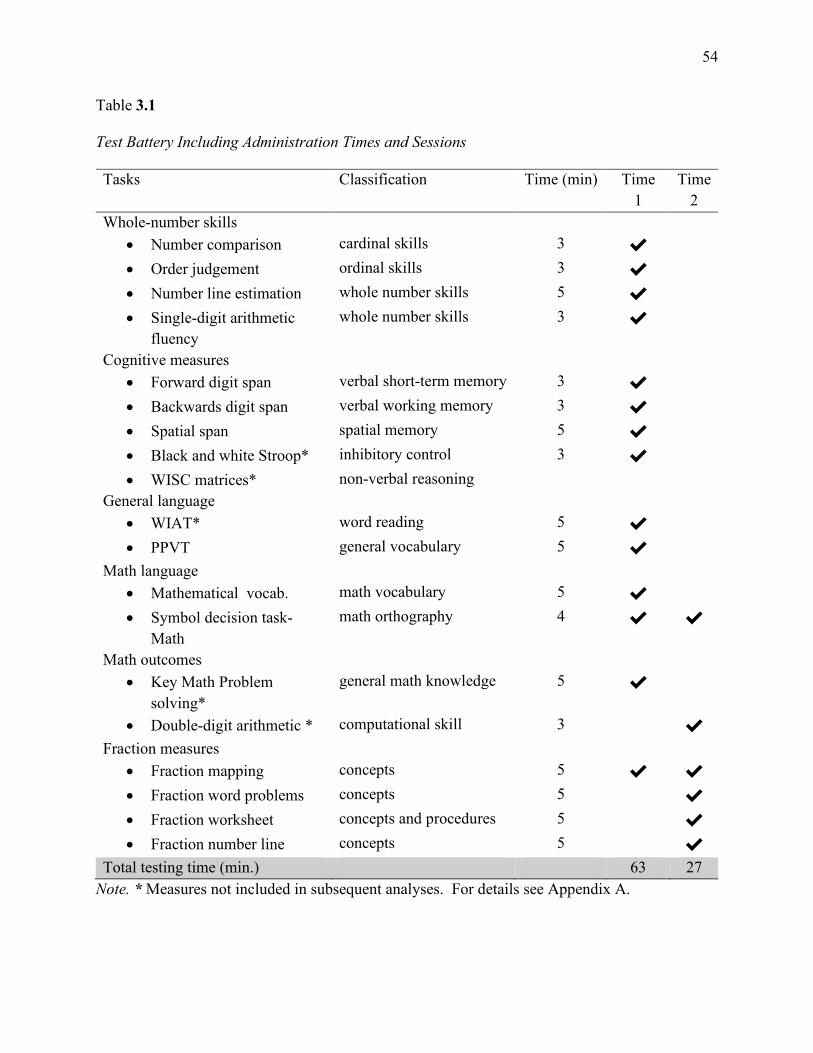
54
Table 3.1
Test Battery Including Administration Times and Sessions
Tasks Classification Time (min) Time 1
Time 2
Whole-number skills • Number comparison cardinal skills 3 ✔ • Order judgement ordinal skills 3 ✔ • Number line estimation whole number skills 5 ✔ • Single-digit arithmetic
fluency whole number skills 3 ✔
Cognitive measures • Forward digit span verbal short-term memory 3 ✔ • Backwards digit span verbal working memory 3 ✔ • Spatial span spatial memory 5 ✔ • Black and white Stroop* inhibitory control 3 ✔ • WISC matrices* non-verbal reasoning
General language • WIAT* word reading 5 ✔ • PPVT general vocabulary 5 ✔
Math language • Mathematical vocab. math vocabulary 5 ✔ • Symbol decision task-
Math math orthography 4 ✔ ✔
Math outcomes • Key Math Problem
solving* general math knowledge 5 ✔
• Double-digit arithmetic * computational skill 3 ✔ Fraction measures
• Fraction mapping concepts 5 ✔ ✔ • Fraction word problems concepts 5 ✔ • Fraction worksheet concepts and procedures 5 ✔ • Fraction number line concepts 5 ✔
Total testing time (min.) 63 27 Note. * Measures not included in subsequent analyses. For details see Appendix A.
55
Whole Number Skills
Students completed four tasks designed to assess their basic whole number knowledge.
Symbolic Number Comparison Task. Students see two single-digit numbers on an iPad
and tap the larger number as fast as possible (e.g., What is larger 7 or 9?) (Big Number;
https://carleton.ca/cacr/math-lab/apps/bigger-number-app/). There are 26 trials, and the ratio and
the distance between the two numbers is manipulated (Bugden & Ansari, 2011). Each ratio is
repeated once in random order, and each number is counterbalanced for the side of presentation.
Scoring is the linear integration of speed and accuracy score (LISAS) calculated using the
equation:
LISAS = RT + SD𝑅𝑅𝑅𝑅SD𝑃𝑃𝑃𝑃
× PE
where RT is mean response time, SD is the standard deviation and PE is the participant’s
proportion of errors (Vandierendonck, 2017). Thus, the final score was an adjusted response time
that was corrected to reflect potentially trade-offs between accuracy and response times.
Reliability based on response times for all trials was high (Cronbach’s α = .82).
Number Order Judgement. In this iPad app, students see three digits (e.g., 1 2 3) and
press a checkmark if the digits are correctly ordered or press an x if the digits are unordered.
Stimuli include single digits from 1 to 9. Stimuli are balanced between ordered sequences, non-
ordered sequences, counting sequences (e.g., 5 6 7, 6 5 7) and non-counting sequences (2 4 8, 8 2
4). There are 24 sequences. Scoring was calculated using the linear integration of speed and
accuracy score (LISAS). Reliability based on response times for all trials was high (Cronbach’s α
= .92).
Number line Estimation. Students estimate the position of a target number on a 0-1000
number line (Hume & Hume, 2014). To eliminate potential ceiling effects, the number line range
56
was 0-1000. Scoring was the percent of absolute error (PAE) between the placement of each
number compared to the actual location of that number. PAE was calculated by taking 100*
(|target –estimate|)/1000. Reliability comparing percent absolute error for each item was high
(Cronbach’s α = .92).
Arithmetic Fluency. In this paper and pencil task, students are given one minute to
complete one sheet of addition questions (sums to 18), one minute to complete one sheet of
subtraction questions (inverse of addition questions) and one minute to complete one sheet of
single-digit multiplication questions (2,3,4, and 5 times tables up to 10 and the 6,7,8, and 9 times
tables to 5). There are 60 problems per page, arranged in 3 columns. Total score was the number
of correct responses. Reliability comparing totals for each operation/question sheet was high
(Cronbach’s α = .87).
Attention and Working Memory
All tasks have been used in previous studies and are part of an ongoing study exploring
math and language. Spans were combined to create an attention and working memory factor
score (see Chapter 4).
Forward Digit Span. This task is part of the WISC-V test battery (Wechsler, 2014).
Students hear a series of pre-recorded numbers and repeat the numbers back to the experimenter
in the same order they were heard. For example, if trial 1 of the 3-digit span is “3-5-7”, the
student repeats “3-5-7”. There are two trials for each digit span and digit spans were pre-
recorded to ensure stimuli are consistent. Students started at a digit span of two numbers. Testing
was discontinued after both trials for a given span length were repeated incorrectly. Scoring was
the total number of correct trials. Reliability comparing sub-scores for first trials to sub-scores
for second trails was acceptable (Cronbach’s 𝛼𝛼 = 0.69)
57
Backwards Digit Span. This task is part of the WISC-V test battery (Wechsler, 2014).
On each trial of this task, students hear a sequence of pre-recorded numbers and respond by
repeating the numbers in reverse order. For example, if they hear “2-7-9” the student should
answer “9-7-2”. There are two practice trials (span length of 2) followed by two trials for every
span length (i.e., 3, 4, 5, 6, and 7). Students started at a digit span of 2. Testing was discontinued
when the student responded incorrectly on both trials for a given span length are repeated
incorrectly. Scoring was the total number of correct trials. Reliability comparing sub-scores for
first trials to sub-scores for second trails was good (Cronbach’s 𝛼𝛼 = 0.77)
Spatial Span. In the PathSpan iPad app (Hume & Hume, 2014), nine green dots are
shown on the iPad screen. Dots light up one by one in a sequence. Sequence length starts with a
span of two dots and increases every three trials (i.e., span lengths of 2, 3, 4, 5, 6, …). For each
trial, students were asked to touch the dots in the same order in which they lit up. At the
beginning of the task, the experimenter demonstrated a practice trial. During the practice trial,
students were asked to watch and remember a sequence of two locations. Then, students were
given three more trials of sequences of two locations without any feedback. If they correctly
reproduced at least one of those sequences, then the task proceeded to the next level (i.e., three
trials with sequences of three locations). However, if students made errors on all three sequences
for a span, the task was terminated. This task has been used extensively to index visual-spatial
working memory processes in children (Astle et al., 2013; LeFevre et al., 2010; Xu & LeFevre,
2016). The score of the spatial span task was the total number of sequences completed correctly.
Reliability comparing sub-scores for first trials to sub-scores for second and third trials was
acceptable (Cronbach’s 𝛼𝛼 = 0.78).
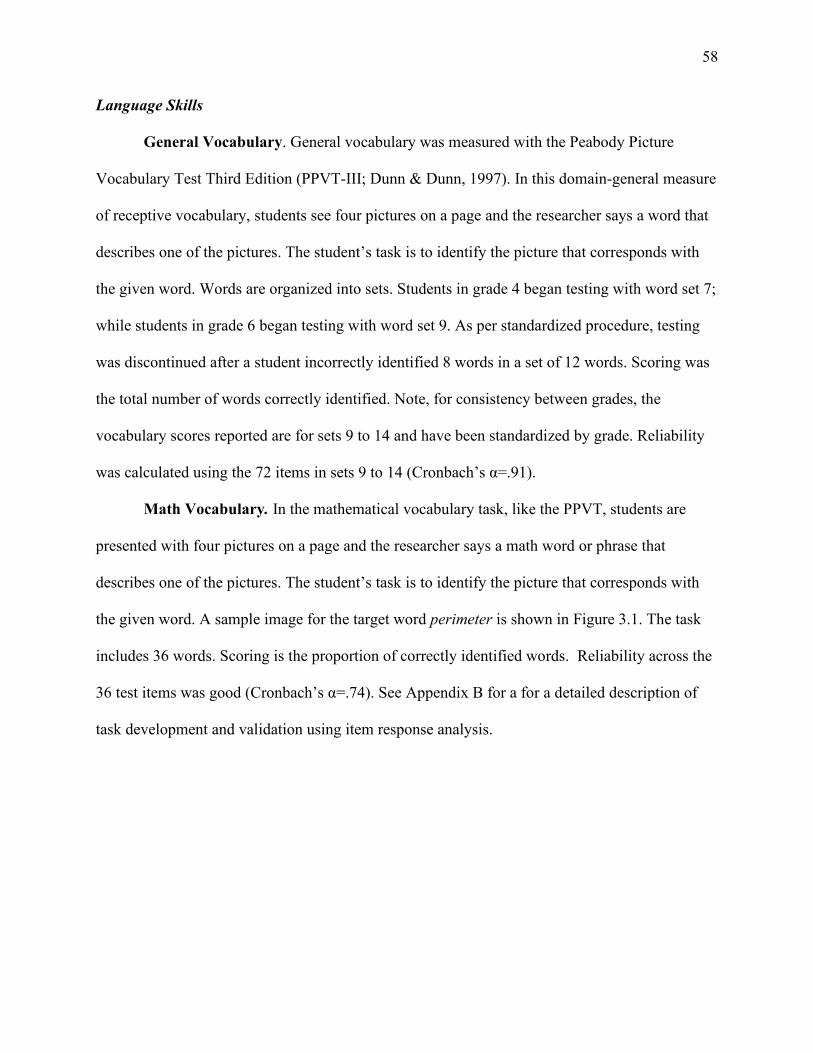
58
Language Skills
General Vocabulary. General vocabulary was measured with the Peabody Picture
Vocabulary Test Third Edition (PPVT-III; Dunn & Dunn, 1997). In this domain-general measure
of receptive vocabulary, students see four pictures on a page and the researcher says a word that
describes one of the pictures. The student’s task is to identify the picture that corresponds with
the given word. Words are organized into sets. Students in grade 4 began testing with word set 7;
while students in grade 6 began testing with word set 9. As per standardized procedure, testing
was discontinued after a student incorrectly identified 8 words in a set of 12 words. Scoring was
the total number of words correctly identified. Note, for consistency between grades, the
vocabulary scores reported are for sets 9 to 14 and have been standardized by grade. Reliability
was calculated using the 72 items in sets 9 to 14 (Cronbach’s α=.91).
Math Vocabulary. In the mathematical vocabulary task, like the PPVT, students are
presented with four pictures on a page and the researcher says a math word or phrase that
describes one of the pictures. The student’s task is to identify the picture that corresponds with
the given word. A sample image for the target word perimeter is shown in Figure 3.1. The task
includes 36 words. Scoring is the proportion of correctly identified words. Reliability across the
36 test items was good (Cronbach’s α=.74). See Appendix B for a for a detailed description of
task development and validation using item response analysis.
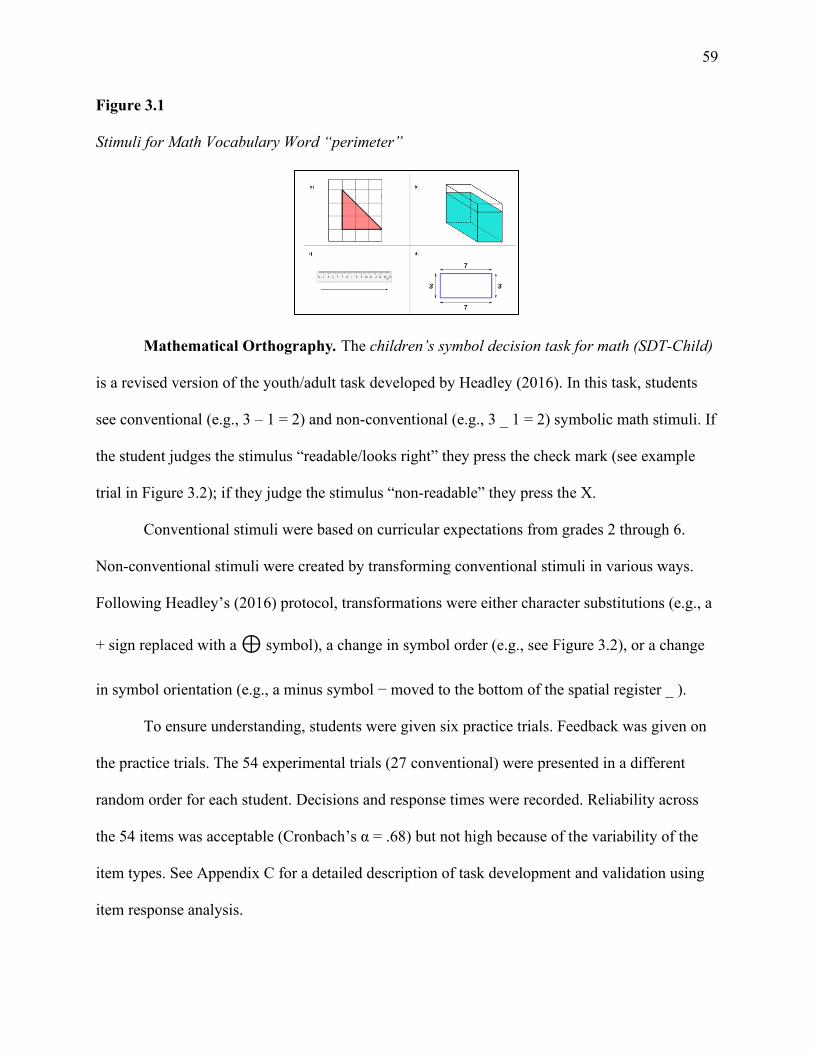
59
Figure 3.1
Stimuli for Math Vocabulary Word “perimeter”
Mathematical Orthography. The children’s symbol decision task for math (SDT-Child)
is a revised version of the youth/adult task developed by Headley (2016). In this task, students
see conventional (e.g., 3 – 1 = 2) and non-conventional (e.g., 3 _ 1 = 2) symbolic math stimuli. If
the student judges the stimulus “readable/looks right” they press the check mark (see example
trial in Figure 3.2); if they judge the stimulus “non-readable” they press the X.
Conventional stimuli were based on curricular expectations from grades 2 through 6.
Non-conventional stimuli were created by transforming conventional stimuli in various ways.
Following Headley’s (2016) protocol, transformations were either character substitutions (e.g., a
+ sign replaced with a ⊕ symbol), a change in symbol order (e.g., see Figure 3.2), or a change
in symbol orientation (e.g., a minus symbol − moved to the bottom of the spatial register _ ).
To ensure understanding, students were given six practice trials. Feedback was given on
the practice trials. The 54 experimental trials (27 conventional) were presented in a different
random order for each student. Decisions and response times were recorded. Reliability across
the 54 items was acceptable (Cronbach’s α = .68) but not high because of the variability of the
item types. See Appendix C for a detailed description of task development and validation using
item response analysis.
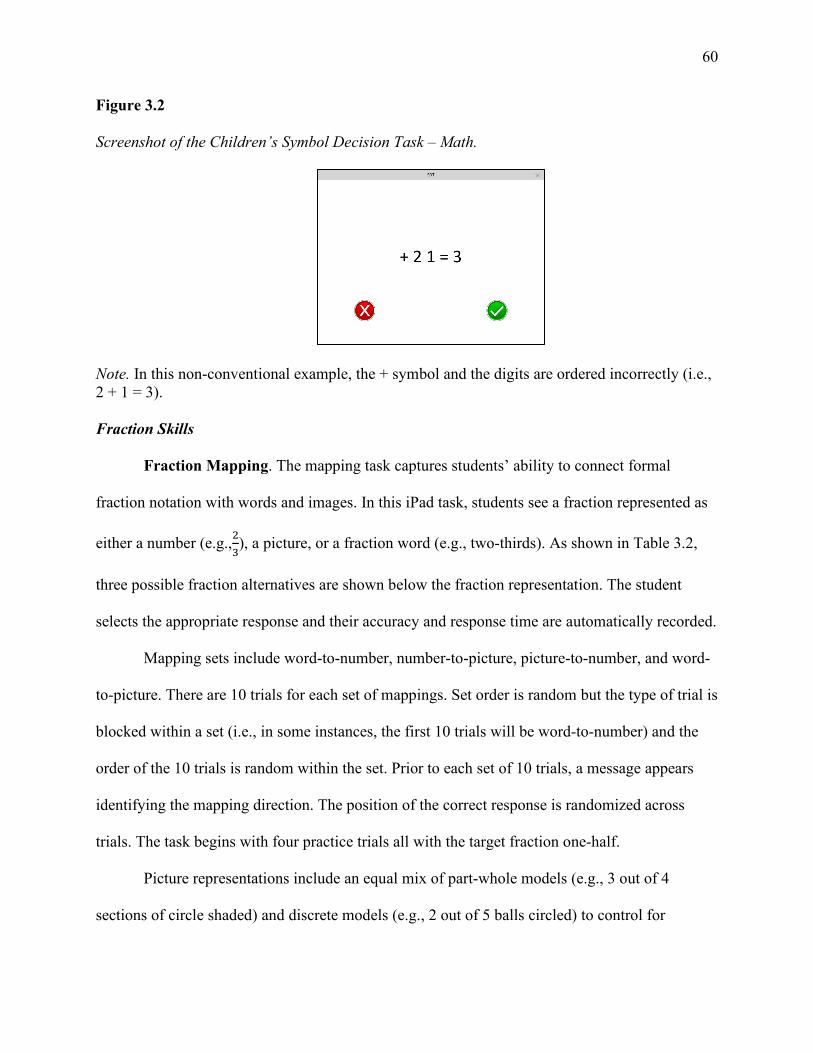
60
Figure 3.2
Screenshot of the Children’s Symbol Decision Task – Math.
Note. In this non-conventional example, the + symbol and the digits are ordered incorrectly (i.e., 2 + 1 = 3). Fraction Skills
Fraction Mapping. The mapping task captures students’ ability to connect formal
fraction notation with words and images. In this iPad task, students see a fraction represented as
either a number (e.g.,23), a picture, or a fraction word (e.g., two-thirds). As shown in Table 3.2,
three possible fraction alternatives are shown below the fraction representation. The student
selects the appropriate response and their accuracy and response time are automatically recorded.
Mapping sets include word-to-number, number-to-picture, picture-to-number, and word-
to-picture. There are 10 trials for each set of mappings. Set order is random but the type of trial is
blocked within a set (i.e., in some instances, the first 10 trials will be word-to-number) and the
order of the 10 trials is random within the set. Prior to each set of 10 trials, a message appears
identifying the mapping direction. The position of the correct response is randomized across
trials. The task begins with four practice trials all with the target fraction one-half.
Picture representations include an equal mix of part-whole models (e.g., 3 out of 4
sections of circle shaded) and discrete models (e.g., 2 out of 5 balls circled) to control for
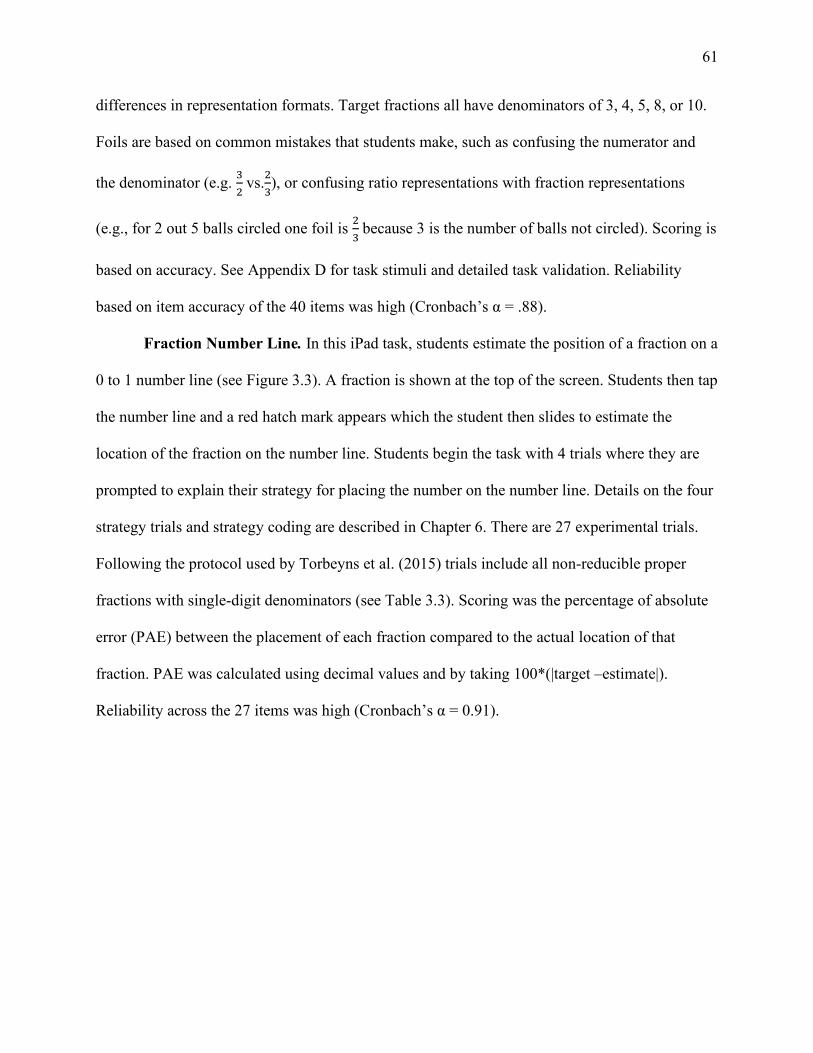
61
differences in representation formats. Target fractions all have denominators of 3, 4, 5, 8, or 10.
Foils are based on common mistakes that students make, such as confusing the numerator and
the denominator (e.g. 32 vs.2
3), or confusing ratio representations with fraction representations
(e.g., for 2 out 5 balls circled one foil is 23 because 3 is the number of balls not circled). Scoring is
based on accuracy. See Appendix D for task stimuli and detailed task validation. Reliability
based on item accuracy of the 40 items was high (Cronbach’s α = .88).
Fraction Number Line. In this iPad task, students estimate the position of a fraction on a
0 to 1 number line (see Figure 3.3). A fraction is shown at the top of the screen. Students then tap
the number line and a red hatch mark appears which the student then slides to estimate the
location of the fraction on the number line. Students begin the task with 4 trials where they are
prompted to explain their strategy for placing the number on the number line. Details on the four
strategy trials and strategy coding are described in Chapter 6. There are 27 experimental trials.
Following the protocol used by Torbeyns et al. (2015) trials include all non-reducible proper
fractions with single-digit denominators (see Table 3.3). Scoring was the percentage of absolute
error (PAE) between the placement of each fraction compared to the actual location of that
fraction. PAE was calculated using decimal values and by taking 100*(|target –estimate|).
Reliability across the 27 items was high (Cronbach’s α = 0.91).
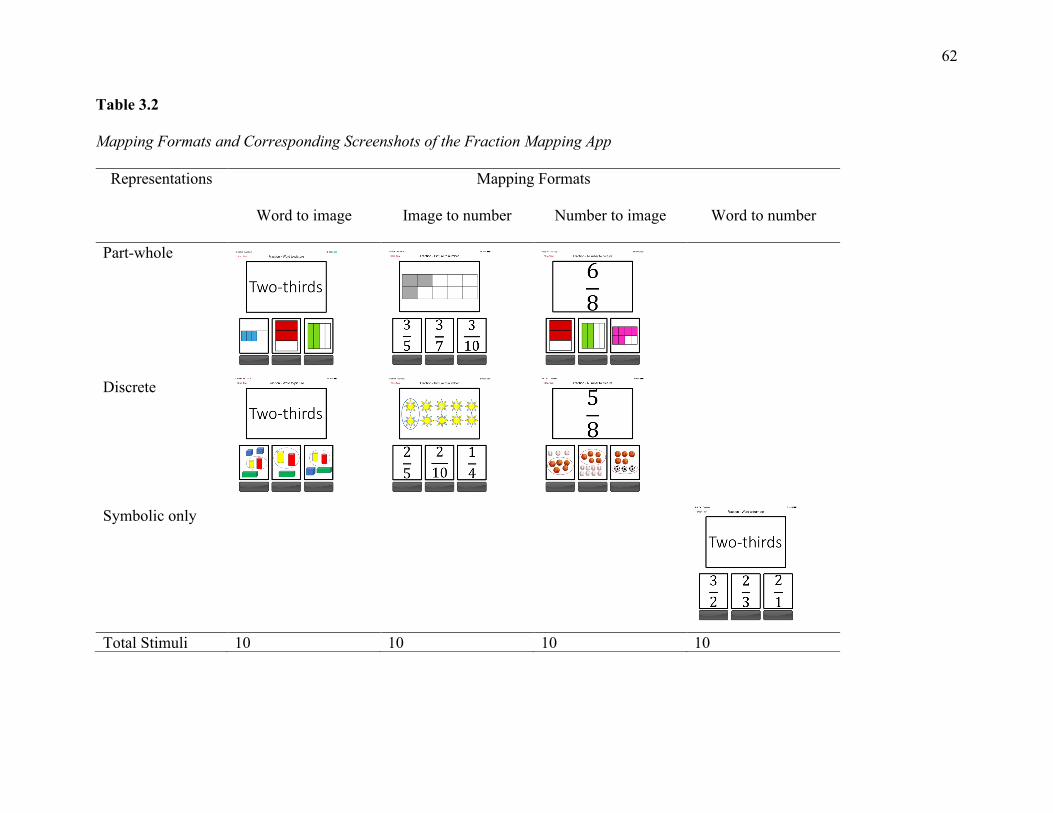
62
Table 3.2
Mapping Formats and Corresponding Screenshots of the Fraction Mapping App
Representations Mapping Formats
Word to image Image to number Number to image Word to number
Part-whole
Discrete
Symbolic only
Total Stimuli 10 10 10 10
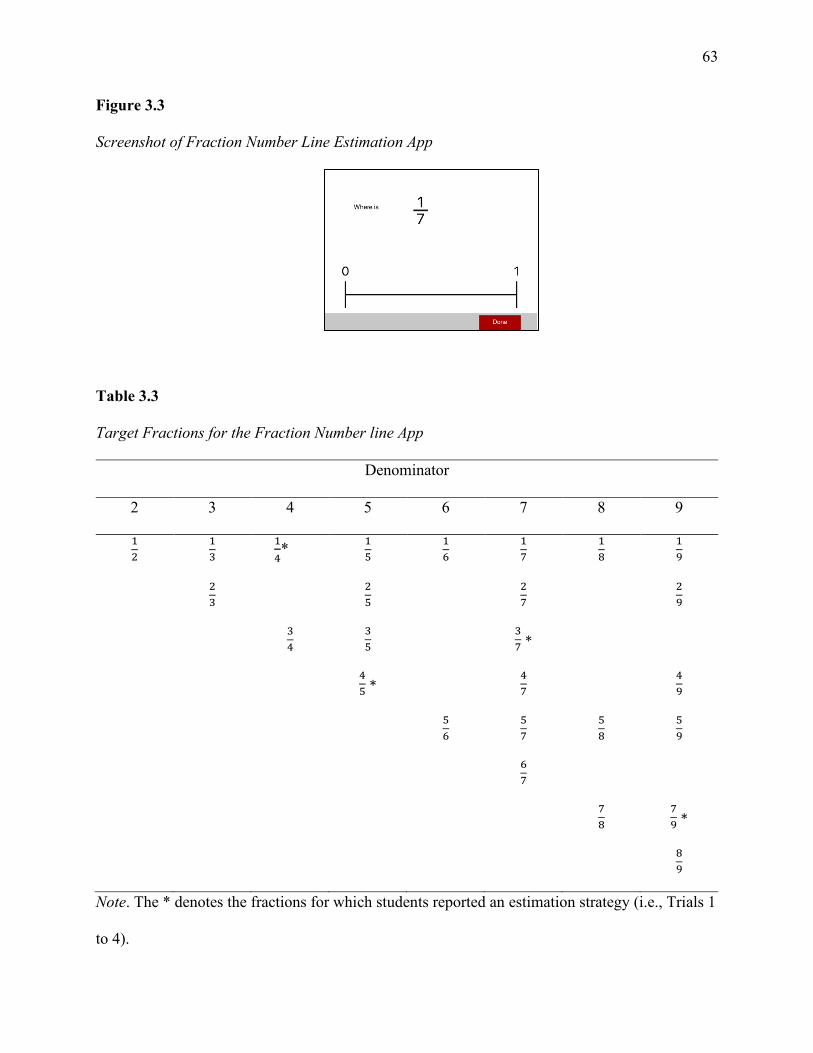
63
Figure 3.3
Screenshot of Fraction Number Line Estimation App
Table 3.3
Target Fractions for the Fraction Number line App
Denominator
2 3 4 5 6 7 8 9
12
13
14* 1
5 16
17
18
19
23
25
27
29
34
35
37 ∗
45 ∗ 4
7 4
9
56
57
58
59
67
78
79 ∗
89
Note. The * denotes the fractions for which students reported an estimation strategy (i.e., Trials 1
to 4).
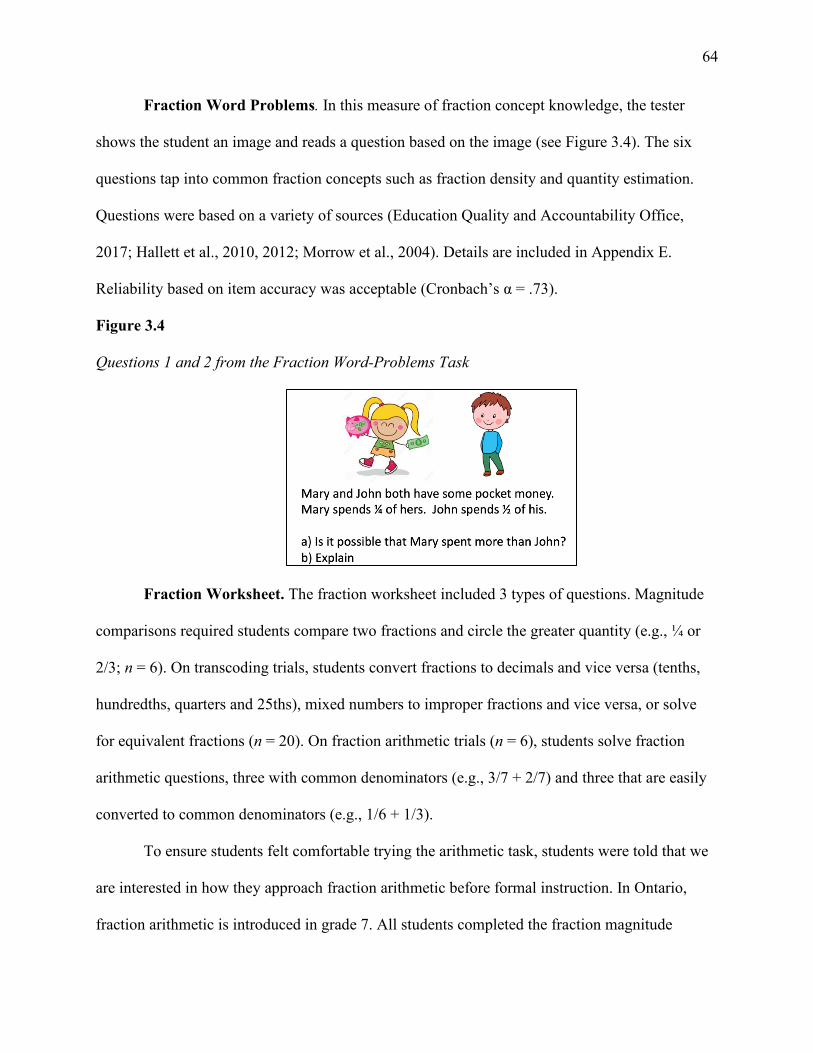
64
Fraction Word Problems. In this measure of fraction concept knowledge, the tester
shows the student an image and reads a question based on the image (see Figure 3.4). The six
questions tap into common fraction concepts such as fraction density and quantity estimation.
Questions were based on a variety of sources (Education Quality and Accountability Office,
2017; Hallett et al., 2010, 2012; Morrow et al., 2004). Details are included in Appendix E.
Reliability based on item accuracy was acceptable (Cronbach’s α = .73).
Figure 3.4
Questions 1 and 2 from the Fraction Word-Problems Task
Fraction Worksheet. The fraction worksheet included 3 types of questions. Magnitude
comparisons required students compare two fractions and circle the greater quantity (e.g., ¼ or
2/3; n = 6). On transcoding trials, students convert fractions to decimals and vice versa (tenths,
hundredths, quarters and 25ths), mixed numbers to improper fractions and vice versa, or solve
for equivalent fractions (n = 20). On fraction arithmetic trials (n = 6), students solve fraction
arithmetic questions, three with common denominators (e.g., 3/7 + 2/7) and three that are easily
converted to common denominators (e.g., 1/6 + 1/3).
To ensure students felt comfortable trying the arithmetic task, students were told that we
are interested in how they approach fraction arithmetic before formal instruction. In Ontario,
fraction arithmetic is introduced in grade 7. All students completed the fraction magnitude
65
comparison and the fraction arithmetic tasks. For each type of transcoding task, students were
shown a practice problem. If they were unfamiliar with the task (some items were only in the
grade 6 curriculum) they were given the option to “try it” or “skip it”. Where feasible, questions
have been taken from Ontario text books (e.g., Math Makes Sense), curricular support
documents (e.g., Jump Math Student Workbooks), standardized test booklets (i.e., Educational
Quality and Accountability Office of Ontario; www.EQAO.com ) and previously used fraction
assessment tasks (Hallett et al., 2010, 2012). Reliability on fraction arithmetic was high
(Cronbach’s α = .91). Reliability across the two transcoding tasks, equivalent fractions and
number comparison scales was also high (Cronbach’s α = .83). The complete set of questions is
included in Appendix E.
Analysis Plan
The data was analysed in two “studies”. In Study 1 (Chapter 4), I examined the
descriptives and scoring distributions by grade for each applicable measure. Based on these
findings, I confirmed which measures could be compared across grades and thus included in the
hypothesis testing. Next, I compared the patterns of correlations by grade identifying any
unexpected patterns. Based on the patterns of correlations, subsequent model specifications were
confirmed. Finally, I used multi-group path analysis with MPlus Version 8 (Muthen & Muthen,
1988-2019) to test the patterns of relations captured by the hypotheses (see Chapter 5).
In Study 2 (Chapter 6), performance of the fraction number line task was explored in
greater detail. Latent profile analysis was used to group students based on their item-by-item
estimation accuracy. Subsequently, multinomial logistic regression was used to determine which
skills differentiated the more-skilled from the less-skilled fraction estimators.
66
CHAPTER 4: INDIVIDUAL DIFFERENCES IN FRACTION KNOWLEDGE PART 1
I begin this chapter by first comparing task performance by grade thus confirming that
students in grade 6 outperformed students in grade 4 on cognitive skills, number skills, and
language skills (see Table 4.1), and that grade 6 students had more advanced fraction knowledge
than grade 4 students. Second, I reviewed the scoring distributions and identified tasks at floor or
ceiling levels. Finally, I compared the correlational patterns by grade to provide support for
either constraining (i.e., estimating paths to be similar across grades) or freely estimating (i.e.,
assuming paths to be different across grades) the predicted model pathways. Based on the
correlational analyses, details of the model testing were specified. The models were tested in
Chapter 5.
Descriptive Statistics
Task performance is reported for all outcomes in Table 4.1. Students in grade 6
outperformed students in grade 4 on most tasks with only two exceptions. For digit span forward,
the difference was not significant, p = .06. For fraction addition, the difference was not
significant, p = .59. Notably, neither group of students had been taught fraction arithmetic and
thus scores were at floor for both groups (the median score was 0 for both groups of students).
The fraction arithmetic task was therefore excluded from model development and testing.
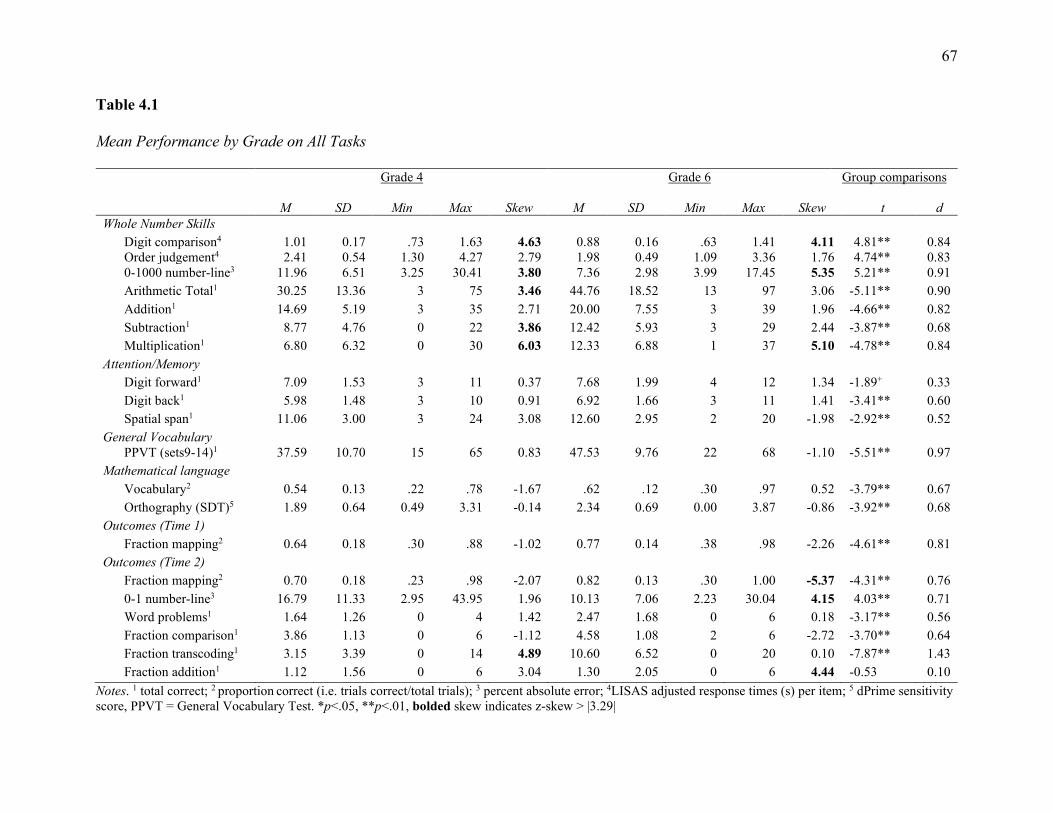
67
Table 4.1
Mean Performance by Grade on All Tasks
Grade 4 Grade 6 Group comparisons
M SD Min Max Skew M SD Min Max Skew t d Whole Number Skills
Digit comparison4 1.01 0.17 .73 1.63 4.63 0.88 0.16 .63 1.41 4.11 4.81** 0.84 Order judgement4 2.41 0.54 1.30 4.27 2.79 1.98 0.49 1.09 3.36 1.76 4.74** 0.83 0-1000 number-line3 11.96 6.51 3.25 30.41 3.80 7.36 2.98 3.99 17.45 5.35 5.21** 0.91 Arithmetic Total1 30.25 13.36 3 75 3.46 44.76 18.52 13 97 3.06 -5.11** 0.90 Addition1 14.69 5.19 3 35 2.71 20.00 7.55 3 39 1.96 -4.66** 0.82 Subtraction1 8.77 4.76 0 22 3.86 12.42 5.93 3 29 2.44 -3.87** 0.68 Multiplication1 6.80 6.32 0 30 6.03 12.33 6.88 1 37 5.10 -4.78** 0.84
Attention/Memory Digit forward1 7.09 1.53 3 11 0.37 7.68 1.99 4 12 1.34 -1.89+ 0.33 Digit back1 5.98 1.48 3 10 0.91 6.92 1.66 3 11 1.41 -3.41** 0.60 Spatial span1 11.06 3.00 3 24 3.08 12.60 2.95 2 20 -1.98 -2.92** 0.52
General Vocabulary PPVT (sets9-14)1 37.59 10.70 15 65 0.83 47.53 9.76 22 68 -1.10 -5.51** 0.97
Mathematical language Vocabulary2 0.54 0.13 .22 .78 -1.67 .62 .12 .30 .97 0.52 -3.79** 0.67 Orthography (SDT)5 1.89 0.64 0.49 3.31 -0.14 2.34 0.69 0.00 3.87 -0.86 -3.92** 0.68
Outcomes (Time 1) Fraction mapping2 0.64 0.18 .30 .88 -1.02 0.77 0.14 .38 .98 -2.26 -4.61** 0.81
Outcomes (Time 2) Fraction mapping2 0.70 0.18 .23 .98 -2.07 0.82 0.13 .30 1.00 -5.37 -4.31** 0.76 0-1 number-line3 16.79 11.33 2.95 43.95 1.96 10.13 7.06 2.23 30.04 4.15 4.03** 0.71 Word problems1 1.64 1.26 0 4 1.42 2.47 1.68 0 6 0.18 -3.17** 0.56 Fraction comparison1 3.86 1.13 0 6 -1.12 4.58 1.08 2 6 -2.72 -3.70** 0.64 Fraction transcoding1 3.15 3.39 0 14 4.89 10.60 6.52 0 20 0.10 -7.87** 1.43 Fraction addition1 1.12 1.56 0 6 3.04 1.30 2.05 0 6 4.44 -0.53 0.10
Notes. 1 total correct; 2 proportion correct (i.e. trials correct/total trials); 3 percent absolute error; 4LISAS adjusted response times (s) per item; 5 dPrime sensitivity score, PPVT = General Vocabulary Test. *p<.05, **p<.01, bolded skew indicates z-skew > |3.29|
68
Most of the measures were normally distributed. The fraction tasks were novel for grade
4 students and thus their performance was poor on some measures. Comparing differences in
scoring distributions between grades helped inform the decision on which fraction tasks to
include in subsequent analyses by grade.
Whole Number Skills
The whole number skill measures included number comparison, number ordering,
arithmetic, and the 0-1000 number line (also called the integer number line). Arithmetic fluency
was a combined score of single-digit addition, subtraction and multiplication. All sub-scores are
included in Table 4.1. Although performance was somewhat skewed on the combined fluency
measure for fourth graders, the median performance was very near the mean (Med = 28.00,
M=30.25), and included a wide range of scores, thus ,the combined fluency measure was used in
subsequent analyses. Performance on the number line task was skewed for both groups of
students which is typical in number line estimation because there is an absolute floor for this task
(i.e., minimum of zero).
Math Language Skills
Mathematical Vocabulary. Performance was normally distributed, and details of item-
based responses are described in the technical report in Appendix B.
Mathematical Orthography. There was one extreme outlier scoring more than 3
standard deviations (SD) below the mean which prompted me to inspect this student’s
performance more closely. This student correctly classified 78% of the conventional stimuli yet
only 22% of the unconventional stimuli indicating a response bias; the student pressed “yes”
78% of the time. To minimize the influence of this outlier, the outlier score was made less
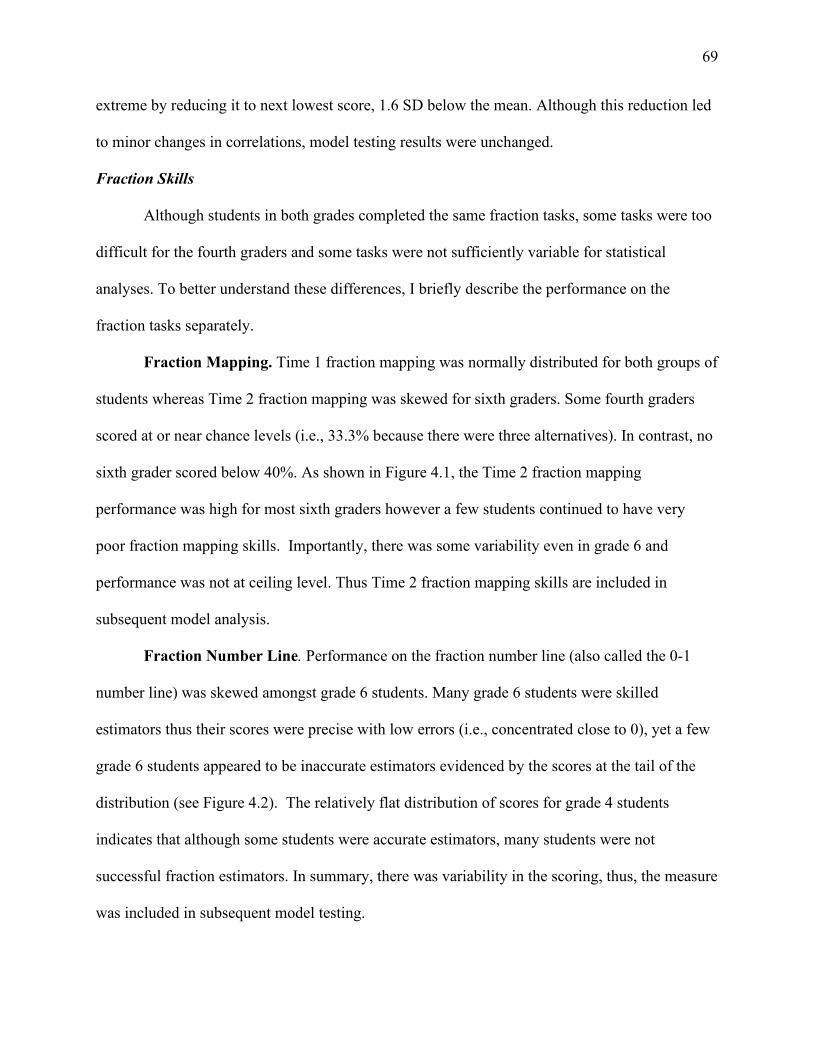
69
extreme by reducing it to next lowest score, 1.6 SD below the mean. Although this reduction led
to minor changes in correlations, model testing results were unchanged.
Fraction Skills
Although students in both grades completed the same fraction tasks, some tasks were too
difficult for the fourth graders and some tasks were not sufficiently variable for statistical
analyses. To better understand these differences, I briefly describe the performance on the
fraction tasks separately.
Fraction Mapping. Time 1 fraction mapping was normally distributed for both groups of
students whereas Time 2 fraction mapping was skewed for sixth graders. Some fourth graders
scored at or near chance levels (i.e., 33.3% because there were three alternatives). In contrast, no
sixth grader scored below 40%. As shown in Figure 4.1, the Time 2 fraction mapping
performance was high for most sixth graders however a few students continued to have very
poor fraction mapping skills. Importantly, there was some variability even in grade 6 and
performance was not at ceiling level. Thus Time 2 fraction mapping skills are included in
subsequent model analysis.
Fraction Number Line. Performance on the fraction number line (also called the 0-1
number line) was skewed amongst grade 6 students. Many grade 6 students were skilled
estimators thus their scores were precise with low errors (i.e., concentrated close to 0), yet a few
grade 6 students appeared to be inaccurate estimators evidenced by the scores at the tail of the
distribution (see Figure 4.2). The relatively flat distribution of scores for grade 4 students
indicates that although some students were accurate estimators, many students were not
successful fraction estimators. In summary, there was variability in the scoring, thus, the measure
was included in subsequent model testing.
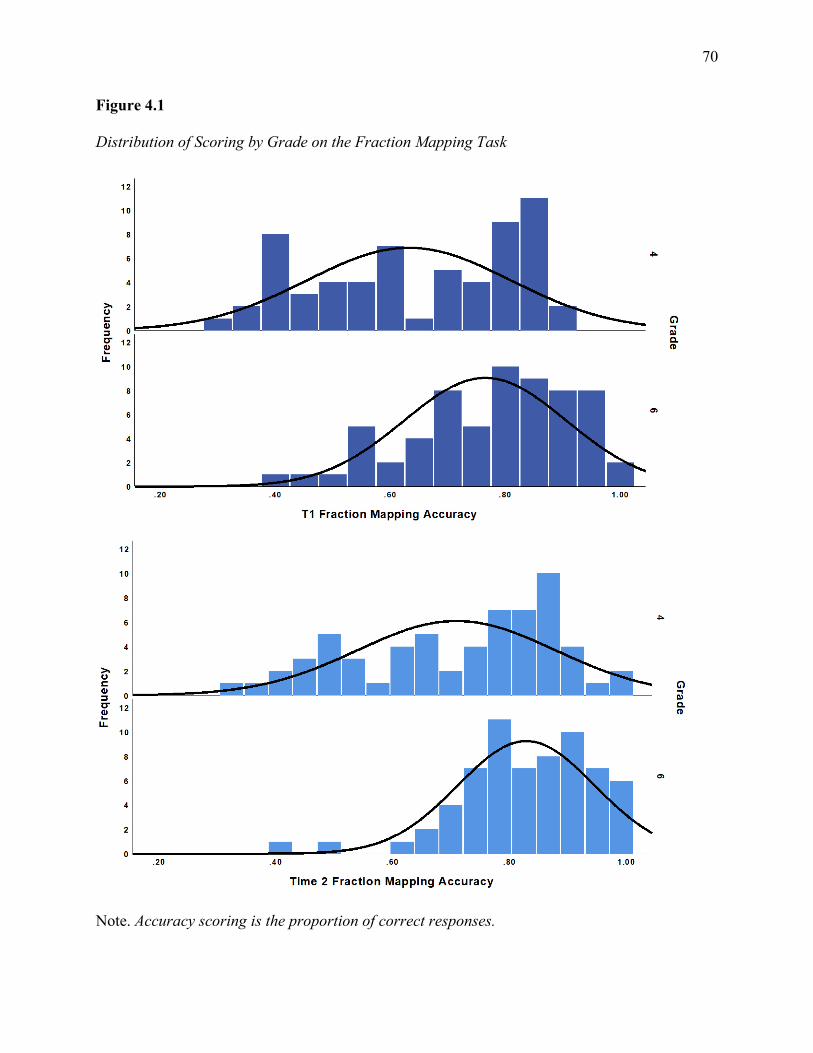
70
Figure 4.1
Distribution of Scoring by Grade on the Fraction Mapping Task
Note. Accuracy scoring is the proportion of correct responses.
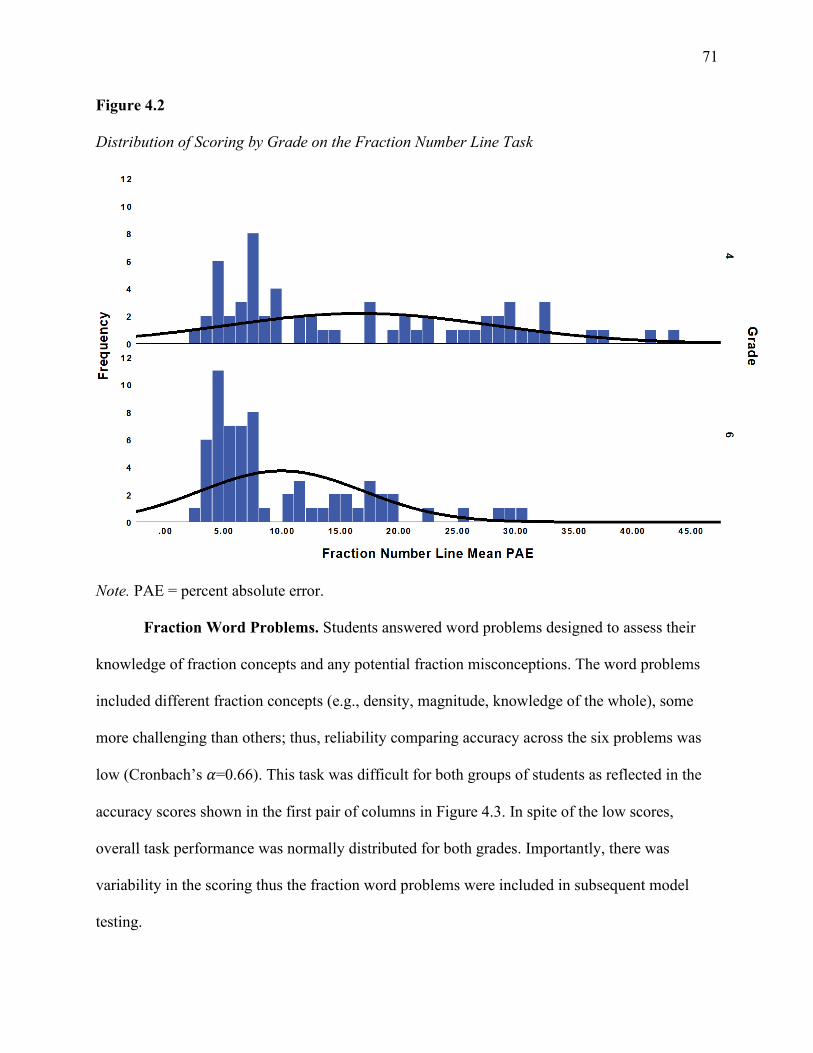
71
Figure 4.2
Distribution of Scoring by Grade on the Fraction Number Line Task
Note. PAE = percent absolute error.
Fraction Word Problems. Students answered word problems designed to assess their
knowledge of fraction concepts and any potential fraction misconceptions. The word problems
included different fraction concepts (e.g., density, magnitude, knowledge of the whole), some
more challenging than others; thus, reliability comparing accuracy across the six problems was
low (Cronbach’s 𝛼𝛼=0.66). This task was difficult for both groups of students as reflected in the
accuracy scores shown in the first pair of columns in Figure 4.3. In spite of the low scores,
overall task performance was normally distributed for both grades. Importantly, there was
variability in the scoring thus the fraction word problems were included in subsequent model
testing.
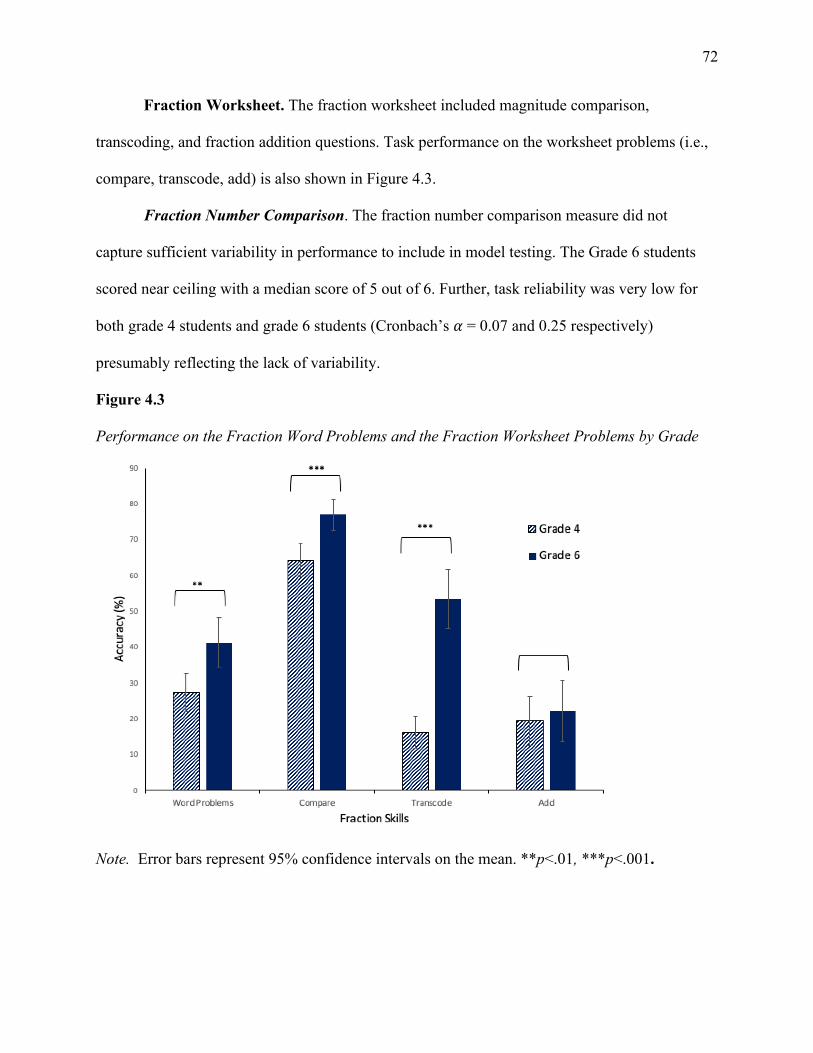
72
Fraction Worksheet. The fraction worksheet included magnitude comparison,
transcoding, and fraction addition questions. Task performance on the worksheet problems (i.e.,
compare, transcode, add) is also shown in Figure 4.3.
Fraction Number Comparison. The fraction number comparison measure did not
capture sufficient variability in performance to include in model testing. The Grade 6 students
scored near ceiling with a median score of 5 out of 6. Further, task reliability was very low for
both grade 4 students and grade 6 students (Cronbach’s 𝛼𝛼 = 0.07 and 0.25 respectively)
presumably reflecting the lack of variability.
Figure 4.3
Performance on the Fraction Word Problems and the Fraction Worksheet Problems by Grade
Note. Error bars represent 95% confidence intervals on the mean. **p<.01, ***p<.001.
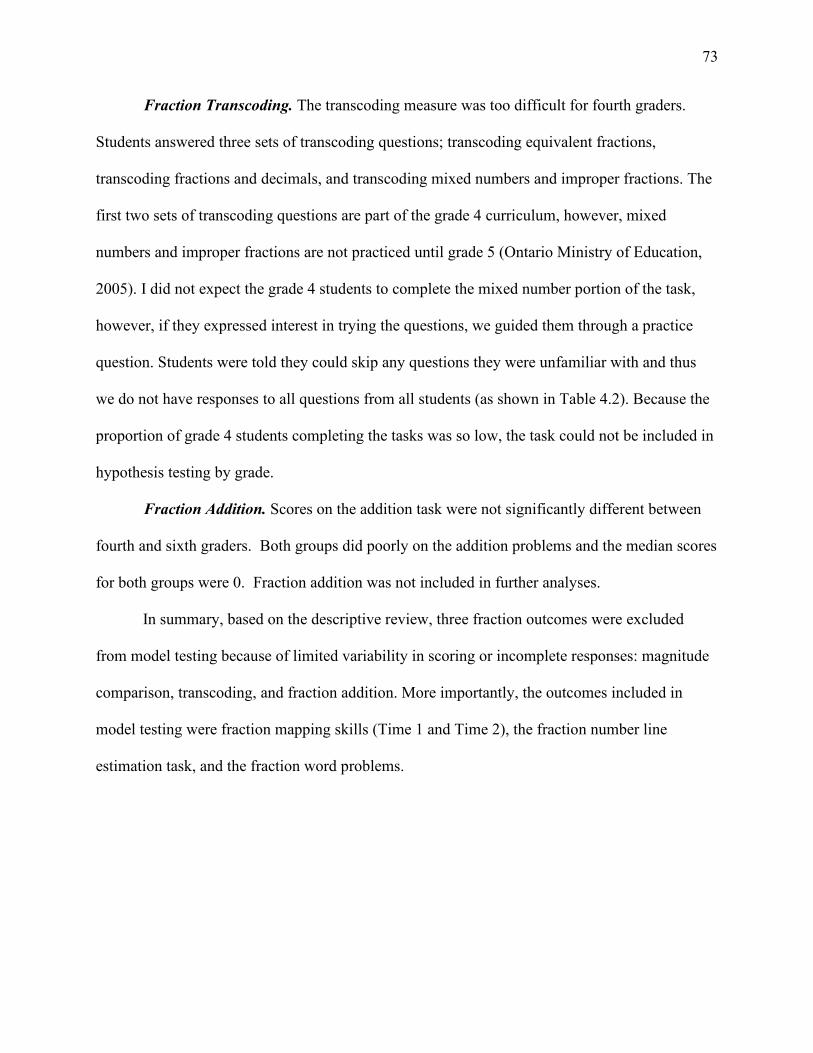
73
Fraction Transcoding. The transcoding measure was too difficult for fourth graders.
Students answered three sets of transcoding questions; transcoding equivalent fractions,
transcoding fractions and decimals, and transcoding mixed numbers and improper fractions. The
first two sets of transcoding questions are part of the grade 4 curriculum, however, mixed
numbers and improper fractions are not practiced until grade 5 (Ontario Ministry of Education,
2005). I did not expect the grade 4 students to complete the mixed number portion of the task,
however, if they expressed interest in trying the questions, we guided them through a practice
question. Students were told they could skip any questions they were unfamiliar with and thus
we do not have responses to all questions from all students (as shown in Table 4.2). Because the
proportion of grade 4 students completing the tasks was so low, the task could not be included in
hypothesis testing by grade.
Fraction Addition. Scores on the addition task were not significantly different between
fourth and sixth graders. Both groups did poorly on the addition problems and the median scores
for both groups were 0. Fraction addition was not included in further analyses.
In summary, based on the descriptive review, three fraction outcomes were excluded
from model testing because of limited variability in scoring or incomplete responses: magnitude
comparison, transcoding, and fraction addition. More importantly, the outcomes included in
model testing were fraction mapping skills (Time 1 and Time 2), the fraction number line
estimation task, and the fraction word problems.
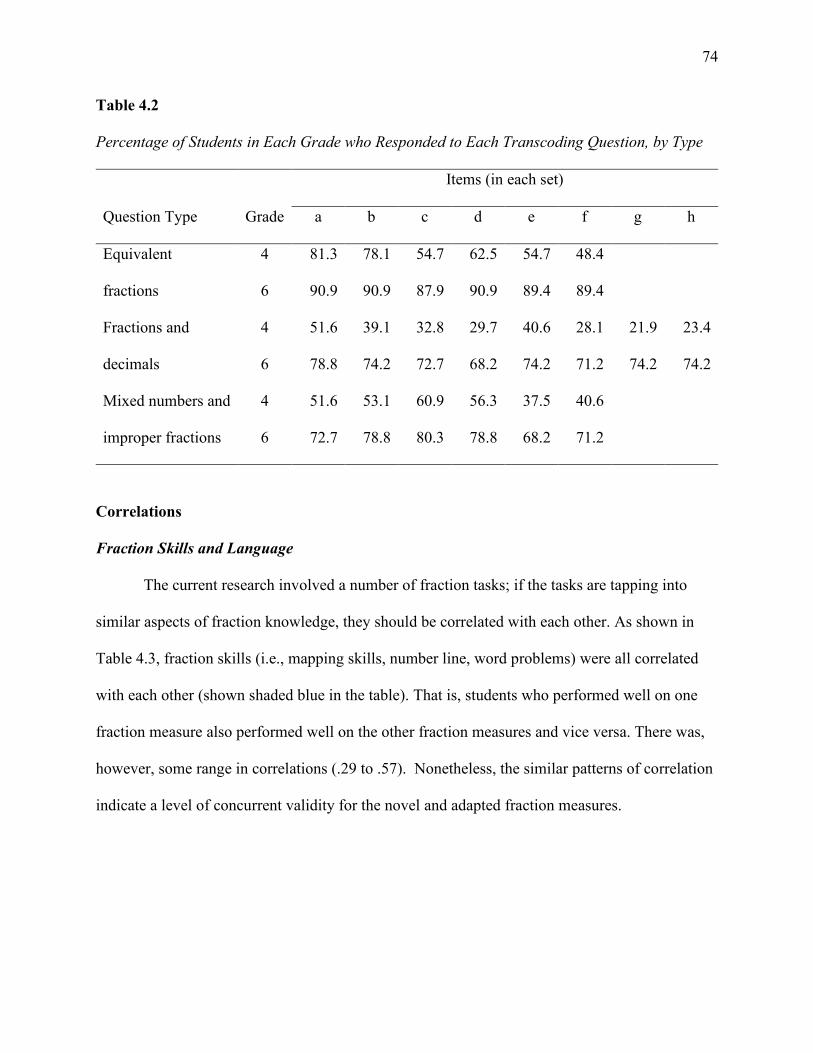
74
Table 4.2
Percentage of Students in Each Grade who Responded to Each Transcoding Question, by Type
Items (in each set)
Question Type Grade a b c d e f g h
Equivalent
fractions
4 81.3 78.1 54.7 62.5 54.7 48.4
6 90.9 90.9 87.9 90.9 89.4 89.4
Fractions and
decimals
4 51.6 39.1 32.8 29.7 40.6 28.1 21.9 23.4
6 78.8 74.2 72.7 68.2 74.2 71.2 74.2 74.2
Mixed numbers and
improper fractions
4 51.6 53.1 60.9 56.3 37.5 40.6
6 72.7 78.8 80.3 78.8 68.2 71.2
Correlations
Fraction Skills and Language
The current research involved a number of fraction tasks; if the tasks are tapping into
similar aspects of fraction knowledge, they should be correlated with each other. As shown in
Table 4.3, fraction skills (i.e., mapping skills, number line, word problems) were all correlated
with each other (shown shaded blue in the table). That is, students who performed well on one
fraction measure also performed well on the other fraction measures and vice versa. There was,
however, some range in correlations (.29 to .57). Nonetheless, the similar patterns of correlation
indicate a level of concurrent validity for the novel and adapted fraction measures.
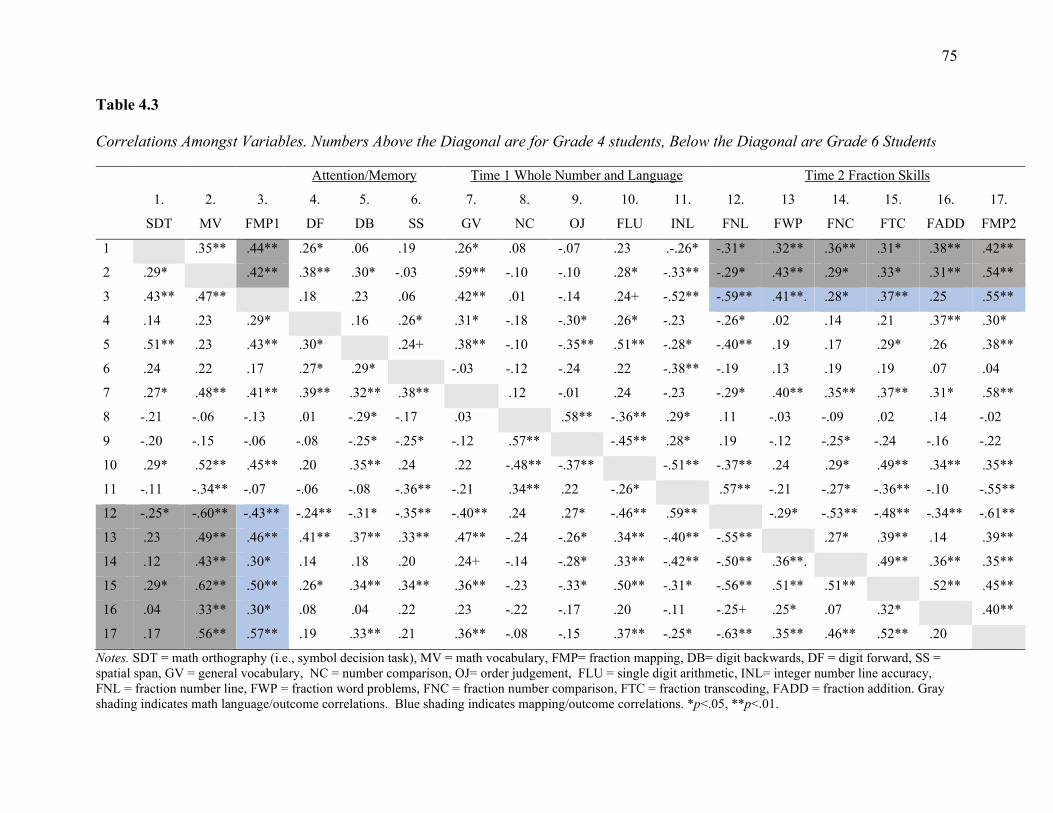
75
Table 4.3
Correlations Amongst Variables. Numbers Above the Diagonal are for Grade 4 students, Below the Diagonal are Grade 6 Students
Attention/Memory Time 1 Whole Number and Language Time 2 Fraction Skills
1.
SDT
2.
MV
3.
FMP1
4.
DF
5.
DB
6.
SS
7.
GV
8.
NC
9.
OJ
10.
FLU
11.
INL
12.
FNL
13
FWP
14.
FNC
15.
FTC
16.
FADD
17.
FMP2
1 .35** .44** .26* .06 .19 .26* .08 -.07 .23 .-.26* -.31* .32** .36** .31* .38** .42**
2 .29* .42** .38** .30* -.03 .59** -.10 -.10 .28* -.33** -.29* .43** .29* .33* .31** .54**
3 .43** .47** .18 .23 .06 .42** .01 -.14 .24+ -.52** -.59** .41**. .28* .37** .25 .55**
4 .14 .23 .29* .16 .26* .31* -.18 -.30* .26* -.23 -.26* .02 .14 .21 .37** .30*
5 .51** .23 .43** .30* .24+ .38** -.10 -.35** .51** -.28* -.40** .19 .17 .29* .26 .38**
6 .24 .22 .17 .27* .29* -.03 -.12 -.24 .22 -.38** -.19 .13 .19 .19 .07 .04
7 .27* .48** .41** .39** .32** .38** .12 -.01 .24 -.23 -.29* .40** .35** .37** .31* .58**
8 -.21 -.06 -.13 .01 -.29* -.17 .03 .58** -.36** .29* .11 -.03 -.09 .02 .14 -.02
9 -.20 -.15 -.06 -.08 -.25* -.25* -.12 .57** -.45** .28* .19 -.12 -.25* -.24 -.16 -.22
10 .29* .52** .45** .20 .35** .24 .22 -.48** -.37** -.51** -.37** .24 .29* .49** .34** .35**
11 -.11 -.34** -.07 -.06 -.08 -.36** -.21 .34** .22 -.26* .57** -.21 -.27* -.36** -.10 -.55**
12 -.25* -.60** -.43** -.24** -.31* -.35** -.40** .24 .27* -.46** .59** -.29* -.53** -.48** -.34** -.61**
13 .23 .49** .46** .41** .37** .33** .47** -.24 -.26* .34** -.40** -.55** .27* .39** .14 .39**
14 .12 .43** .30* .14 .18 .20 .24+ -.14 -.28* .33** -.42** -.50** .36**. .49** .36** .35**
15 .29* .62** .50** .26* .34** .34** .36** -.23 -.33* .50** -.31* -.56** .51** .51** .52** .45**
16 .04 .33** .30* .08 .04 .22 .23 -.22 -.17 .20 -.11 -.25+ .25* .07 .32* .40**
17 .17 .56** .57** .19 .33** .21 .36** -.08 -.15 .37** -.25* -.63** .35** .46** .52** .20
Notes. SDT = math orthography (i.e., symbol decision task), MV = math vocabulary, FMP= fraction mapping, DB= digit backwards, DF = digit forward, SS = spatial span, GV = general vocabulary, NC = number comparison, OJ= order judgement, FLU = single digit arithmetic, INL= integer number line accuracy, FNL = fraction number line, FWP = fraction word problems, FNC = fraction number comparison, FTC = fraction transcoding, FADD = fraction addition. Gray shading indicates math language/outcome correlations. Blue shading indicates mapping/outcome correlations. *p<.05, **p<.01.
76
Math Language. Across grades, math language skills (mathematical orthography and
math vocabulary), fraction mapping, and fraction outcomes were highly correlated (see Table
4.3). As expected, students with better fraction mapping skills at Time 1 also had stronger
fraction skills at Time 2. Moreover, students with stronger math language skills were more likely
to have better fraction mapping skills both concurrently and five months later. These findings
support the view that math language skills and fraction mapping skills are relevant to consider
when assessing fraction development.
Reviewing the correlations, I compared the differences in patterns of relations between
math language skills and fraction outcomes across grades (shaded in dark grey in Table 4.3). I
hypothesized that math language skills (vocabulary and orthography) would relate differently to
fraction mapping for fourth and sixth grade students. For students in grade 4, performance on
both of the math language tasks was positively related to their Time 1 and Time 2 fraction
mapping skills, whereas for students in grade 6, performance on both of the math language tasks
was positively related to their Time 1 fraction mapping skills but orthography was not related to
Time 2 fraction mapping performance.
I also hypothesized that math language skills would relate differently to fraction
outcomes for fourth and sixth grade students. These correlations are shown highlighted in gray in
Table 4.3. These predictions were supported. For students in grade 4, performance on both of the
math language tasks was moderately related to their fraction outcomes, with correlations ranging
from .29 to .43. For students in grade 6, mathematical vocabulary was related to all of the
fraction outcomes with correlations ranging from .33 to -.60. Orthography, however, was not
significantly correlated with fraction word problems for sixth grade students. To summarize, the
correlational patterns between math language skills and fraction outcomes suggest that the
77
relations between math language skills and fraction skills change as students gain more
knowledge. Accordingly, to test my hypothesis related to the differences in relations between
mathematical vocabulary, mathematical orthography and fraction skills, the paths will be freely
estimated across grades.
I hypothesized that fraction mapping skills would predict fraction outcomes for both
fourth and sixth grade students. Providing support for this view, patterns of correlation between
Time 1 fraction mapping skills and the target fraction outcomes (fraction number line, fraction
word problems and fraction mapping) were similar across grades. Further, the correlations were
strong at 0.59, 0.41 and 0.55 respectively for the fourth graders and 0.45, 0.46 and 0.56 for the
sixth graders (see Table 4.3). To test the hypothesis that fraction mapping skills directly predict
fraction outcomes, the relations between fraction mapping and subsequent fraction outcomes will
be freely estimated across grades.
General Vocabulary. The relations between general vocabulary and both math language
skills, and between general vocabulary and fraction outcomes were similar across grades.
Students with a stronger general vocabulary scored better on mathematical vocabulary and
mathematical orthography, they were more skilled matching fraction pictures, numbers and
words, and performed better on the fraction number line and solved more fraction word problems
correctly than students with weaker general vocabulary. Because I am interested in seeing how
math language skills, general vocabulary, and fraction mapping are related, the concurrent path
(i.e., general vocabulary predicting Time 1 fraction mapping) will be freely estimated in the path
models.
78
Covariates of Fraction Skills
Working Memory. The patterns of correlation between each working memory variable
and each fraction outcome is similar. Thus, the three span tasks (i.e., digit forward, digit
backward, and spatial span) were reduced to create a composite working memory variable. The
reduction was done by grade. For the grade 6 students, the working memory factor accounted for
52.4% of the variance in working memory measures (digit forward, digit back and spatial span)
and factor loadings were 0.72, 0.73, and 0.71 respectively. For the grade 4 students, the working
memory factor accounted for 48.3% of the variance in working memory measures and factor
loadings were 0.68, 0.65, and 0.75 respectively. The correlations for the working memory factor
and fraction skills are shown in Table 4.4.
The patterns of correlations between the working memory factor score and fraction skills
are similar between grades with the exception of the correlations between working memory and
word problems which were significantly correlated for sixth graders but not for fourth graders
(see Table 4.4). In summary, the relation between working memory and the fraction outcomes is
mostly similar by grade thus can be constrained to be equal in model testing. However, when
modelling the path between working memory and the concept problems, the path will be freely
estimated by grade.
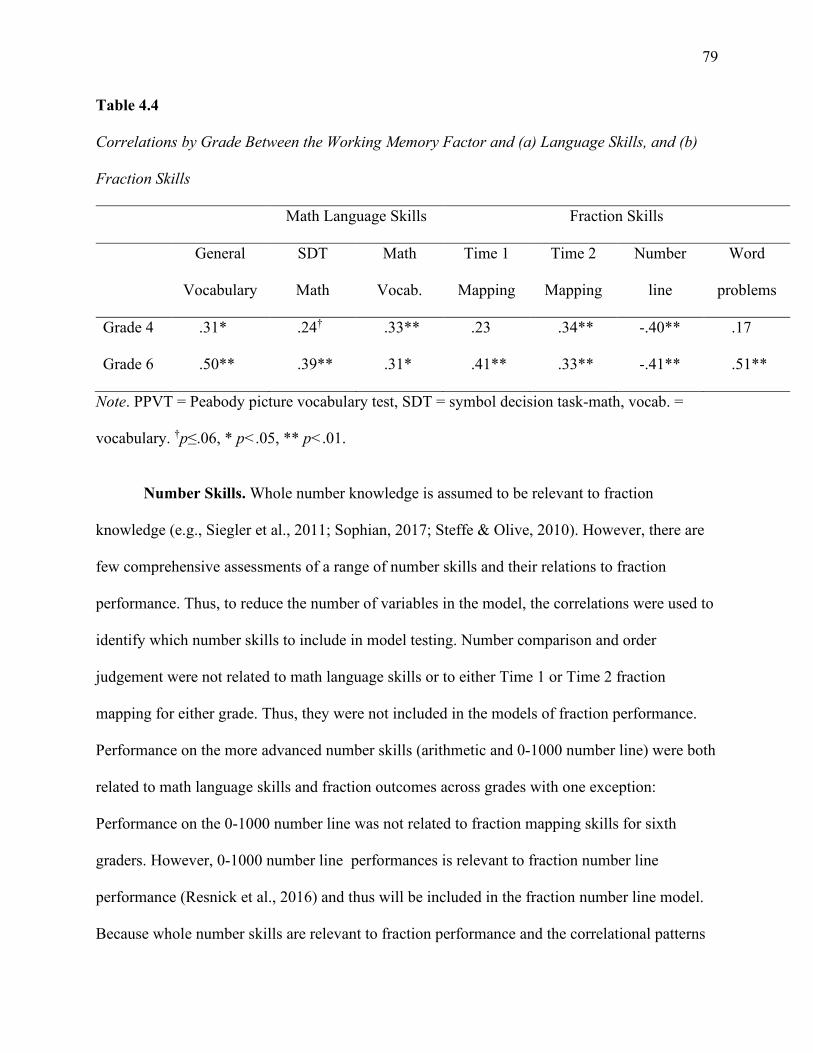
79
Table 4.4
Correlations by Grade Between the Working Memory Factor and (a) Language Skills, and (b)
Fraction Skills
Math Language Skills Fraction Skills
General
Vocabulary
SDT
Math
Math
Vocab.
Time 1
Mapping
Time 2
Mapping
Number
line
Word
problems
Grade 4 .31* .24† .33** .23 .34** -.40** .17
Grade 6 .50** .39** .31* .41** .33** -.41** .51**
Note. PPVT = Peabody picture vocabulary test, SDT = symbol decision task-math, vocab. =
vocabulary. †p≤.06, * p<.05, ** p<.01.
Number Skills. Whole number knowledge is assumed to be relevant to fraction
knowledge (e.g., Siegler et al., 2011; Sophian, 2017; Steffe & Olive, 2010). However, there are
few comprehensive assessments of a range of number skills and their relations to fraction
performance. Thus, to reduce the number of variables in the model, the correlations were used to
identify which number skills to include in model testing. Number comparison and order
judgement were not related to math language skills or to either Time 1 or Time 2 fraction
mapping for either grade. Thus, they were not included in the models of fraction performance.
Performance on the more advanced number skills (arithmetic and 0-1000 number line) were both
related to math language skills and fraction outcomes across grades with one exception:
Performance on the 0-1000 number line was not related to fraction mapping skills for sixth
graders. However, 0-1000 number line performances is relevant to fraction number line
performance (Resnick et al., 2016) and thus will be included in the fraction number line model.
Because whole number skills are relevant to fraction performance and the correlational patterns
80
between arithmetic and fraction outcomes were similar between grades, the arithmetic and
fraction outcome paths will be constrained across grades.
Chapter Summary
In summary, based on the descriptive analyses, variables were selected for hypothesis
testing and, based on the correlational analyses, decisions about the path analyses were made
prior to the actual analyses. In essence, because the sample size is moderate for these multi-
group path analyses, decisions were made to reduce the total number of different paths that were
tested.
First, model testing will involve three Time 2 fraction outcomes: fraction mapping,
fraction number line estimation, and fraction word problems. By also including Time 1 fraction
mapping, the results will test for growth in fraction mapping skills (i.e., Time 2 fraction
mapping, controlling for Time 1 fraction mapping). Second, general vocabulary, working
memory, and number skills (arithmetic fluency and where applicable 0-1000 number line) will
be included in the models because they are skills that, according to the literature, are relevant to
fraction knowledge. Notably, because correlations between the working memory and number
skills were similar across grades, the paths related to these variables will be constrained to be
equal across grades with one exception. Working memory skills will be freely estimated in the
model predicting fraction word problems. Third, to test the hypothesis that the relations between
math language skills and fraction knowledge differ with expertise, the relations among
mathematical vocabulary, mathematical orthography, and the fraction outcomes will be freely
estimated across grade. Finally, to test the hypothesis that Time 1 fraction mapping skills predict
all fraction outcomes, the path from Time 1 fraction mapping skills to the fraction outcomes will
be freely estimated across grade.
81
CHAPTER 5: INDIVIDUAL DIFFERENCES IN FRACTION KNOWLEDGE PART 2
In this Chapter I describe and compare sources of individual differences in fraction skills
amongst novice (grade 4 students) and more experienced (grade 6 students) fraction learners.
Specifically, I focus on fraction mapping skills and the influence of math-specific language skills
on students’ developing knowledge of fraction concepts. Students’ cognitive skills (receptive
vocabulary, working memory), math-specific language skills (mathematical vocabulary and
orthography), number skills (arithmetic, 0-1000 number line) and fraction mapping skills were
measured in the first round of testing. Five months later, students completed a battery of fraction
assessments (fraction mapping, fraction word problems, and fraction number line).
The analyses were organized to address multiple hypotheses as outlined in Chapter 2 (see
page 38) and illustrated in Figure 5.1. First, I proposed that after accounting for general language
skills, math-specific language skills (i.e., mathematical vocabulary and mathematical
orthography) would predict Time 1 fraction mapping skills for students in both grades.
Specifically, based on the finding that mathematical vocabulary (i.e., a math-specific language
skill) is more strongly related to outcomes in older, versus younger students (Powell et al., 2017),
I hypothesized that mathematical vocabulary would directly predict fraction mapping skills in
sixth graders (H1b) but not in fourth graders (H1a).
Hypothesis 2 was that, after accounting for general vocabulary, mathematical
orthography would directly predict fraction mapping skills for both groups of students.
Specifically, based on the findings that mathematical orthography is related to math outcomes in
multiple age groups (Douglas et al., in press; Headley et al., 2016; Xu et al., in review),
mathematical orthography will directly predict fraction mapping skills for fourth graders (H2a)
and sixth graders (H2b).
82
Hypothesis 3 was that, because the reliance on general vocabulary skills decreases with
mathematical expertise (Powell, 2017), mathematical vocabulary will directly predict fraction
outcomes for advanced fraction learners, sixth graders (H3b) but not in fourth graders (H3a).
Finally, based on the assumptions that conceptual math knowledge is built through math-
specific discourse (O’Halloran, 2015), and that connecting symbols to their referents is the first
level of symbol expertise (Hiebert, 1988), I hypothesized that Time 1 fraction mapping skills
would directly predict Time 2 fraction outcomes for both fourth graders (H4a) and sixth graders
(H4b).
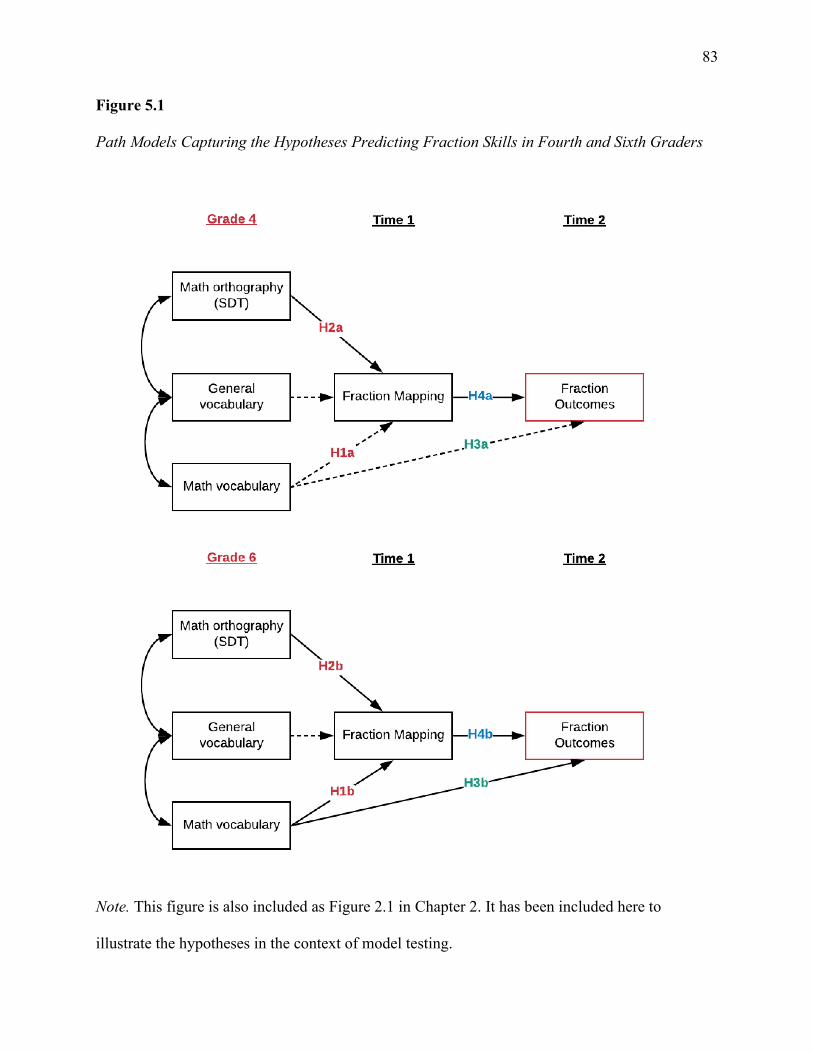
83
Figure 5.1
Path Models Capturing the Hypotheses Predicting Fraction Skills in Fourth and Sixth Graders
Note. This figure is also included as Figure 2.1 in Chapter 2. It has been included here to
illustrate the hypotheses in the context of model testing.
84
Model Testing
I used multi-group path analysis with MPlus Version 8 (Muthen & Muthen, 1988-2019),
to test the four hypotheses that are captured in Figure 5.1. In the current research, the
mathematical vocabulary measure and the symbol decision task for math (SDT-Math) are
assumed to capture students’ verbal and written math language skills. Thus, to address
Hypotheses 1 and 2, I tested whether these two measures of math-specific language skills would
be related differently to fraction mapping for novice fraction learners (grade 4 students) and
more experienced fraction learners (grade 6 students). These hypotheses are captured in the
“Time 1” portion of the path models. To address Hypotheses 3 and 4, I tested the relations
predicting the fraction outcomes that are captured in the “Time 2” portion of the models.
Each fraction outcome was modelled separately. In general, 1) the paths involving
number skills and working memory were constrained to be equal across groups unless otherwise
noted and 2) the path coefficients of interest were estimated independently for each group. The
differences in predictive paths are described for each outcome. A Wald test of parameter
constraints was also used as a supplementary test to compare whether the path coefficients
differed statistically by grade. However, the Wald test may lack sufficient power to detect a
significant effect if a) the difference in path strength is small, and b) the sample size is small
(Kline, 2016). For this reason, the Wald test is referred to but not necessarily discussed.
Fraction Skills
Fraction Mapping. The model describing the relations between general vocabulary,
math language skills, fraction mapping and growth in fraction mapping skills is shown in Figure
5.2. To simplify the model diagram, the covariate paths amongst number skills, working memory
and the Time 1 measures are not shown. The predictive paths from orthography, math
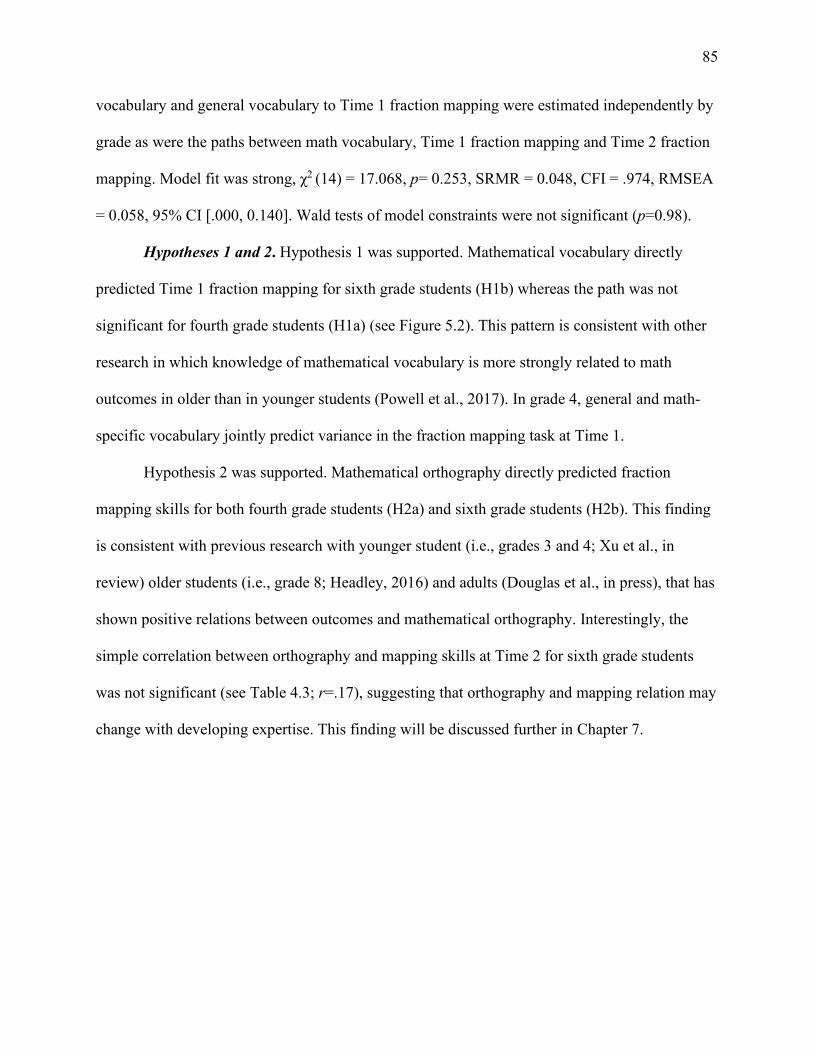
85
vocabulary and general vocabulary to Time 1 fraction mapping were estimated independently by
grade as were the paths between math vocabulary, Time 1 fraction mapping and Time 2 fraction
mapping. Model fit was strong, χ2 (14) = 17.068, p= 0.253, SRMR = 0.048, CFI = .974, RMSEA
= 0.058, 95% CI [.000, 0.140]. Wald tests of model constraints were not significant (p=0.98).
Hypotheses 1 and 2. Hypothesis 1 was supported. Mathematical vocabulary directly
predicted Time 1 fraction mapping for sixth grade students (H1b) whereas the path was not
significant for fourth grade students (H1a) (see Figure 5.2). This pattern is consistent with other
research in which knowledge of mathematical vocabulary is more strongly related to math
outcomes in older than in younger students (Powell et al., 2017). In grade 4, general and math-
specific vocabulary jointly predict variance in the fraction mapping task at Time 1.
Hypothesis 2 was supported. Mathematical orthography directly predicted fraction
mapping skills for both fourth grade students (H2a) and sixth grade students (H2b). This finding
is consistent with previous research with younger student (i.e., grades 3 and 4; Xu et al., in
review) older students (i.e., grade 8; Headley, 2016) and adults (Douglas et al., in press), that has
shown positive relations between outcomes and mathematical orthography. Interestingly, the
simple correlation between orthography and mapping skills at Time 2 for sixth grade students
was not significant (see Table 4.3; r=.17), suggesting that orthography and mapping relation may
change with developing expertise. This finding will be discussed further in Chapter 7.
86
Figure 5.2
Path Model Predicting Growth in Fraction Mapping Skills in a) Grade 4 and b) Grade 6
a) Grade 4
b) Grade 6
Notes. Values shown are the standardized coefficients. *p<.05, **p<.01, ***p<.001. Dotted lines
indicate non-significant paths and faded font indicates paths unrelated to hypotheses.
87
Hypotheses 3 and 4. The relations predicting growth in fraction mapping were
comparable between grades. Hypothesis 3 was partially supported in that mathematical
vocabulary directly predicted growth in fraction mapping skills for sixth graders (H3b).
However, I had predicted that mathematical vocabulary would be less strongly related to fraction
outcomes in fourth graders (H3a) compared to sixth graders - the relations were comparable. The
pattern of modelled relations was the same across grades. Not surprisingly, Hypothesis 4 was
supported: Mapping skills at Time 1 directly predicted growth in fraction mapping skills for both
groups of students. In summary, growth in fraction mapping skills were similarly predicted for
students in both fourth and sixth grades.
Fraction word problems. The fraction concepts task was an oral assessment of students’
conceptual fraction knowledge and included questions on fraction density, equal partitioning,
and part-whole relations. For the fraction concept model the relation between working memory
and fraction word problems was freely estimated across grades because the correlations were
different between grades (0.17 and 0.51 respectively).
The model predicting fraction concepts is shown in Figure 5.3. As with the previous
model, for ease of understanding, the illustrated model has been simplified such that covariate
paths are not shown and the predictive paths from arithmetic and working memory are in faded
font. Model fit was excellent, χ2 (13) = 11.477, p= 0.571, SRMR = 0.042, CFI = 1.000, RMSEA
= 0.000, 95% CI [.000, 0.110].
Hypothesis 3. The path analysis provided full support for Hypothesis 3. After controlling
for vocabulary, working memory and arithmetic skills, mathematical vocabulary directly
predicted knowledge of fraction concepts for sixth graders (H3b) as hypothesized. For fourth
graders, although the direct math vocabulary/fraction concepts path was not significant (H3a) the
88
path coefficients were comparable. Further, the combined effect of math vocabulary directly and
indirectly through fraction mapping was significant for both fourth and sixth graders (𝛽𝛽 =.271,
p=.027; 𝛽𝛽 =.280, p=.014 respectively). These findings suggest that math vocabulary skills are
important for both more and less experienced fraction learners when the outcome has a strong
verbal component.
Hypothesis 4. Hypothesis 4 was supported, mapping skills at Time 1 directly predicted
fraction concepts for both fourth and sixth graders; however, the relation was not significant for
sixth graders. A Wald test of parameter constraints suggests the fraction mapping and fraction
concepts relation was not statistically different between fourth and sixth graders, WT(1) = 0.24,
p=.62. However, as stated previously, with the small sample size the Wald test may be
underpowered to distinguish significant differences (Kline, 2016).
One interesting observation is that the models accounted for more variance in fraction
concepts for sixth graders compared to fourth graders (see Figure 5.3, R2 = .414 versus .251).
This finding suggests that other skills, not included in testing may be implicated in fourth graders
performance. Further, working memory predicted fraction concepts for sixth graders but not for
fourth graders. Together these findings indicate that the fraction concepts task was more
cognitively demanding for sixth graders presumably because they had sufficient skills to tackle
the more difficult questions. In summary, mathematical vocabulary supported oral fraction
concept skills directly for sixth graders and indirectly for both fourth and sixth graders whereas
fraction mapping skills were more strongly implicated in fraction concepts for fourth graders
compared to sixth graders.
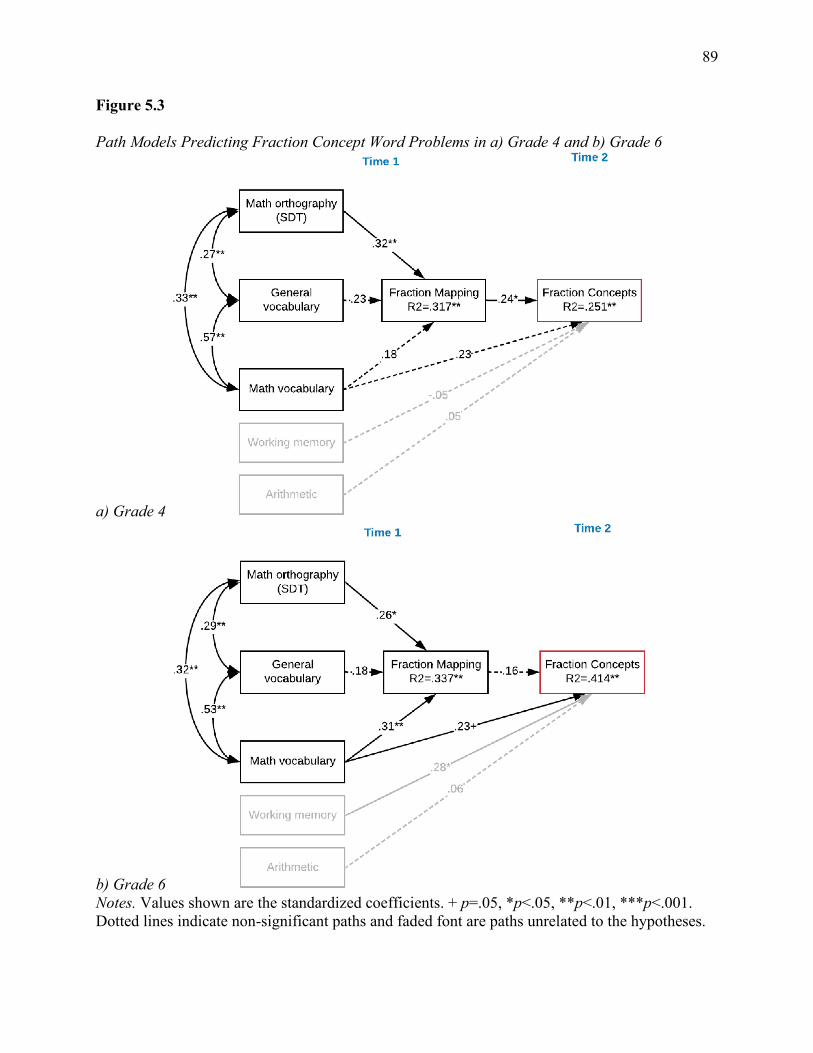
89
Figure 5.3
Path Models Predicting Fraction Concept Word Problems in a) Grade 4 and b) Grade 6
a) Grade 4
b) Grade 6 Notes. Values shown are the standardized coefficients. + p=.05, *p<.05, **p<.01, ***p<.001. Dotted lines indicate non-significant paths and faded font are paths unrelated to the hypotheses.
90
Fraction Number Line. In the fraction number line task, students estimated the position
of target fractions on a horizontal line that ranged from 0 on the left to 1 on the right. To control
for number skills, whole number line estimation was included in the model. There were two
reasons for this choice: (1) the two number line measures were strongly correlated for fourth and
sixth graders (0.57 and 0.59 respectively), and (2) whole number line estimation has been shown
to predict growth in fraction number skills (Resnick et al., 2016). The path models predicting
fraction number line are shown in Figure 5.4. Model fit was acceptable χ2 (13) = 21.539, p=
0.063, SRMR = 0.058, CFI = .941, RMSEA = 0.101, 95% CI [.000, 0.173]. The Wald test of
parameter constraints indicated that the predicative paths from math vocabulary and fraction
mapping to fraction number line were significantly different for grade 4 students compared to
grade 6 students WT (2) = 7.27, p=.026.
Hypothesis 3. After accounting for domain-general cognitive skills and number skills,
mathematical vocabulary directly predicted fraction number line for sixth graders but not for
fourth graders. Hypothesis 3 was supported.
Hypothesis 4. Hypothesis 4 was supported. Fraction mapping skills directly predicted
fraction number line for both fourth and sixth graders. The strength of relation was, however,
weaker for sixth graders as shown in Figure 5.4.
.
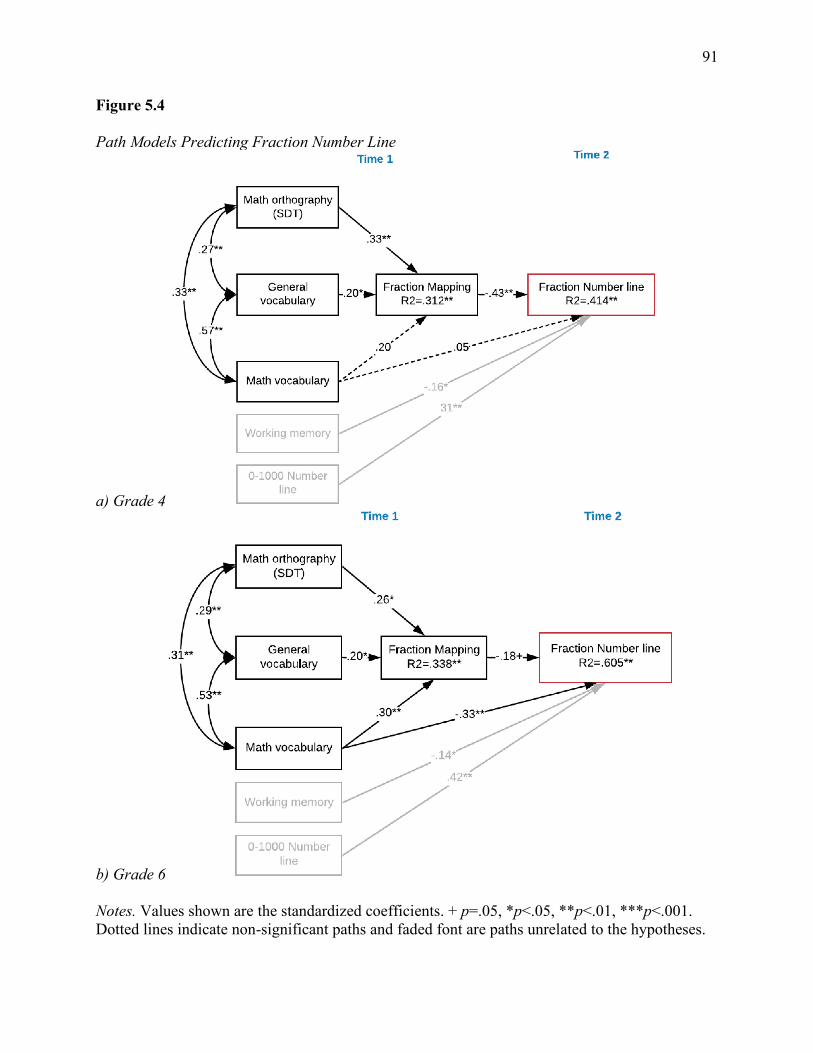
91
Figure 5.4
Path Models Predicting Fraction Number Line
a) Grade 4
b) Grade 6
Notes. Values shown are the standardized coefficients. + p=.05, *p<.05, **p<.01, ***p<.001. Dotted lines indicate non-significant paths and faded font are paths unrelated to the hypotheses.
92
Chapter Summary
In this chapter I tested four hypotheses using path analysis. The first two hypotheses
related to the math-specific language skills that support students’ concurrent knowledge of
fraction mapping. Hypotheses 1 and Hypothesis 2 were supported. After controlling for general
vocabulary, mathematical vocabulary skills directly predicted fraction mapping skills in sixth
graders (H1) and mathematical orthography directly predicted fraction mapping skills in fourth
graders and sixth graders (H2). These findings confirm that math-specific language skills
account for individual differences in students’ accuracy mapping visual fraction representations
to abstract fraction symbols.
The last two hypotheses described the Time 2 (5 months later) relations between fraction
mapping and mathematical vocabulary and students’ developing knowledge of fraction concepts.
Developing knowledge of fraction concepts was assessed with three measures: Time 2 fraction
mapping skills, word problems that tapped into knowledge of fraction concepts and fraction
number line estimation.
In support of Hypothesis 3, mathematical vocabulary directly predicted all fraction
outcomes for sixth graders. Notably, mathematical vocabulary skills also predicted growth in
fraction mapping and was the combined effect of mathematical vocabulary (direct and indirect
through mapping skills) was significant for fourth graders. Thus, although I predicted
mathematical vocabulary would be strongly linked to all fraction outcomes for sixth graders,
math vocabulary also accounted for individual differences in the outcomes that had a strong
language component for fourth graders. Together, the findings indicate that mathematical
vocabulary skills account for individual differences in developing fraction knowledge differently
for fourth and sixth graders. For less experienced learners (fourth graders), mathematical
93
vocabulary was implicated in fraction outcomes with a strong verbal component whereas for
more experienced learners (sixth graders), mathematical vocabulary was directly implicated in
all fraction outcomes.
Supporting Hypothesis 4, Time 1 fraction mapping skills predicted all outcomes amongst
fourth graders. However, for sixth graders performance on the fraction concept word problems
was not predicted by fraction mapping. Interestingly, the strength of the relation between fraction
mapping and the fraction number line task was weaker for sixth grade students than fourth grade
students. These findings suggest that although fraction mapping skills are central for developing
knowledge of fraction concepts, the relation may differ for more advanced fraction learners. That
is, once students have sufficient fraction mapping skills, other skills such as number knowledge,
may contribute more strongly to their developing fraction knowledge. In summary, the
concurrent and longitudinal findings support the view that fraction mapping skills are the central
organizing knowledge for fraction learning and math-specific language skills are a key piece in
the fraction learning puzzle.
94
CHAPTER 6: PROFILES OF FRACTION NUMBER LINE STRATEGIES
Students often experience difficulty making sense of fractions. Consider Jordan, a
fictional grade 4 student who is just learning about fractions. When asked if 13 is greater than 1
2,
Jordan said “yes, 3 is greater than 2 so 13 has to be greater than 1
2.” Jordan has a misconception
that a greater denominator means a greater fraction. Fraction number lines have been
recommended as teaching tools to help minimize fraction misconceptions like Jordan’s because
they may help students to understand relative fraction magnitudes (e.g., Bruce et al., 2013;
Common Core State Standards Initiative, 2010; Gersten et al., 2017; Ontario Ministry of
Education, 2005; Siegler et al., 2010; Torbeyns et al., 2015). However, focused research on the
relations between developing fraction knowledge and students’ performance placing fractions on
number lines is scarce. In the previous chapter, I examined the influence of math-specific
language skills and fraction mapping on an averaged measure of fraction number line accuracy.
In the present chapter, I extended the findings from Chapter 5 by (1) analysing in detail students’
patterns of fraction estimation and (2) identifying the prerequisite number and fraction skills that
differentiated students based on their patterns of fraction estimation. Results of these analyses
can provide educators with insights into how students reason about fraction magnitude and
knowledge of the skills that differentiate students like Jordan from more successful fraction
learners,
Number lines are two-dimensional, horizontal lines with labelled reference points on
either end; typically 0 is at the left endpoint and a multiple of 10 (e.g., 10, 100, 1000) is at the
right endpoint (Siegler & Opfer, 2003) (see Figure 6.1a). In the fraction number line task, 0 is at
the left endpoint and 1, 2, or 5 is at the right endpoint (see Figure 6.1b; Hansen et al., 2015;
Resnick et al., 2016; Rodrigues et al., 2019; Ye et al., 2016). Students can be asked to estimate
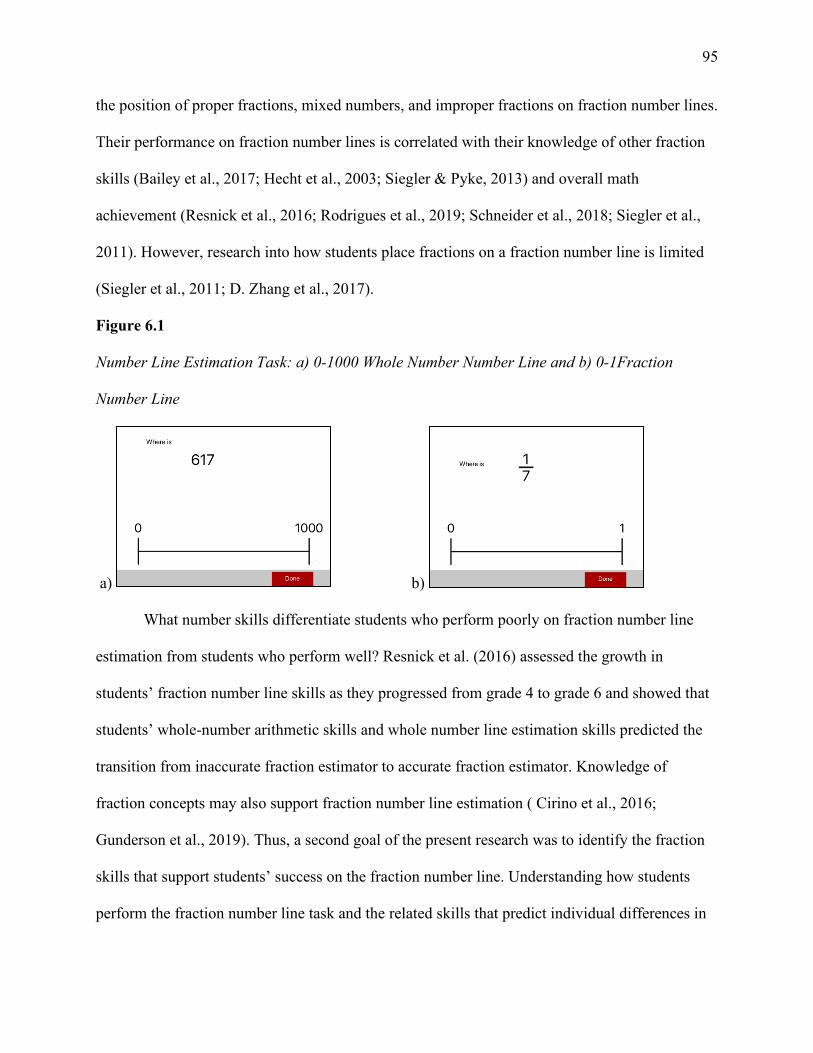
95
the position of proper fractions, mixed numbers, and improper fractions on fraction number lines.
Their performance on fraction number lines is correlated with their knowledge of other fraction
skills (Bailey et al., 2017; Hecht et al., 2003; Siegler & Pyke, 2013) and overall math
achievement (Resnick et al., 2016; Rodrigues et al., 2019; Schneider et al., 2018; Siegler et al.,
2011). However, research into how students place fractions on a fraction number line is limited
(Siegler et al., 2011; D. Zhang et al., 2017).
Figure 6.1
Number Line Estimation Task: a) 0-1000 Whole Number Number Line and b) 0-1Fraction
Number Line
a) b)
What number skills differentiate students who perform poorly on fraction number line
estimation from students who perform well? Resnick et al. (2016) assessed the growth in
students’ fraction number line skills as they progressed from grade 4 to grade 6 and showed that
students’ whole-number arithmetic skills and whole number line estimation skills predicted the
transition from inaccurate fraction estimator to accurate fraction estimator. Knowledge of
fraction concepts may also support fraction number line estimation ( Cirino et al., 2016;
Gunderson et al., 2019). Thus, a second goal of the present research was to identify the fraction
skills that support students’ success on the fraction number line. Understanding how students
perform the fraction number line task and the related skills that predict individual differences in
96
performance will help researchers develop better theories of fraction skills and support
recommendations for how teachers can use fraction number lines in classrooms.
Number Line Estimation Strategies
Estimation strategies tell us how students approach the number line task; students’
accuracy on the number line task reveals whether those estimation strategies are successful. For
example, when they are asked to place whole numbers on number lines, older students and adults
rely on both implicit (e.g., the midpoint) and explicit reference points (e.g., labelled endpoints) to
guide their number line estimates (Ashcraft & Moore, 2012; Barth & Paladino, 2011; Di Lonardo
et al., 2019; Slusser & Barth, 2017). Notably, when students rely on implicit reference points
they also use proportional reasoning skills (e.g., 45 is a little smaller than 50 so it should be
placed just to the left of the midpoint on a 0-100 number line) (Ashcraft & Moore, 2012; Barth &
Paladino, 2011; Newman & Berger, 1984; Peeters et al., 2016; Schneider et al., 2018). Notably,
when estimation errors are graphed, grade 3 students who use the midpoint to anchor their
proportional reasoning strategy show an “M”-shaped pattern in which the most accurate
estimates occurred around the midpoint and endpoints (Ashcraft & Moore, 2012). Adults also
use the midpoint as a reference but are more accurate for target numbers further away from
reference points, resulting in a flattened “M”-shaped pattern (Di Lonardo et al., 2020; Luwel et
al., 2018). In summary, patterns of estimation ‘error’ have been used successfully to describe the
strategies used by students and adults to place whole numbers on number lines.
Appropriate Fraction Number Line Strategies
What estimation strategies do students use to successfully place fractions on a number
line? In the one paper that systematically described appropriate estimation strategies, Siegler et
al. (2011) identified two strategies, segmentation and numerical transformation. According to
97
Siegler et al., the segmentation strategy involves solvers generating internal landmarks on the
number line to help locate target fractions. This description is very similar to the proportional
strategy based on implicit reference points used with whole numbers (Barth & Paladino, 2011;
Slusser & Barth, 2017). Segmentation examples included dividing the number line into equal
sections based on common fractions such as halves and quarters, or defining segments based on
the denominator (e.g., dividing the number line into seven segments to place 47) (Siegler et al.,
2011).
The numerical transformation strategy as defined by Siegler et al. (2011) involves
changing the fraction into a more convenient number through rounding, reducing, or converting
the fraction to a decimal or percentage (e.g., a student might “round” 49 to 1
2 and place it
accordingly). The transformation strategy could also be used on whole number lines, for
example, to place 7,231 on a 0-10000 number line, participants might round the number to 7,500
because it is a more familiar proportion. Students in grade 8 reported using a transformation
strategy more frequently than those in grade 6 indicating that strategy selection changes as
students’ fraction skills develop (Braithwaite & Siegler, 2018; Liu, 2018; Siegler et al., 2011).
Using only two strategies may be insufficient to describe how students place fractions on
a number line. Thus, a more fine-grained description than transformation and segmentation may
better capture differences in how students’ fraction knowledge is used on the number line task.
Transformation strategies include rounding and converting (Siegler et al., 2011), however
rounding 49 to 1
2 is a different strategy than converting 4
9 to 44%; rounding can involve less precise
use of reference points. Similarly segmenting 45 into 5 equal portions is a different strategy than
using an endpoint reference, for example, noting that 45 is close to one. I suggest including
98
reference points - explicit endpoints and implicit midpoints - in the list of estimation strategies
for a more detailed analysis of how students estimate fractions.
Number Line Strategies based on Misconceptions
Students who have weak fraction knowledge may use strategies for placing fractions on
number lines that are based on their misconceptions. Zhang et al. (2017) examined grade 6 and 8
students’ flawed fraction estimation strategies. They found that some students estimated fraction
magnitudes based on the whole number magnitudes of either the numerator or the denominator,
thus incorrectly extending whole-number properties to fractions and showing a whole number
bias (Braithwaite & Siegler, 2018; Dewolf & Vosniadou, 2015; Ni & Zhou, 2005; Stafylidou &
Vosniadou, 2004; Van Dooren et al., 2015). For example, students using numerator-based
estimations erroneously stated that a fraction with a numerator greater than 1, such as 24, could not
be placed on a 0-1 number line because 2 (i.e., the numerator) is greater than the endpoint
(Zhang et al., 2017), or incorrectly segmented the number line based on the magnitude of the
numerator (Deringöl, 2019). Similarly, students using denominator-based estimations
erroneously placed fractions with large denominators, such as 49 , near the endpoint 1 because 9 is
a large number (Braithwaite & Siegler, 2018). These flawed strategies occurred because students
relied on the magnitude of the numerator or denominators and failed to consider a fraction as a
whole entity. These faulty strategies provide insights into the weaknesses in students’ fraction
knowledge.
Even when students use both numerator and denominator magnitudes, they may still
make errors on placing fractions on number lines. Braithwaite and Siegler (2018) examined
developmental changes in the whole number bias by asking students in grades 4 through 8 to
estimate the position of equivalent fractions (e.g., 812 , 2
3) on a number line. Compared to eighth
99
graders, fourth graders relied more on the magnitudes of both whole number components in
comparison to the relation between components when placing fractions. That is, fourth graders
placed large component fractions (e.g., 812) closer to 1 than equivalent small component fractions
(e.g., 23). These students were possibly influenced by an endpoint strategy; thinking large
component fractions are closer to the endpoint than smaller component fractions. Thus, whole-
component estimations can negatively influence students’ estimation accuracy and this effect is
more pronounced in younger students who are less experienced with fractions (Braithwaite &
Siegler, 2018).
To effectively identify fraction misconceptions within the number line task, performance
on individual trials must be considered. However, item-based performance is usually not
described in fraction number line studies (e.g., Siegler et al., 2011; Zhang et al., 2017). Even
when item-based data is available, group means rather than individual patterns of performance
are typically reported and thus, the relation between strategy selection and performance cannot
be inferred (e.g., Resnick et al., 2016). How would item-based performance inform our
understanding of fraction estimation? Consider the fractions 19 and 8
9. These fractions have large
denominators. If students estimate the position of the fraction based primarily on the magnitude
of the denominator, their accuracy placing 19 would be low but their accuracy placing 8
9 would be
high (Resnick et al., 2016). Similarly, if students consider the magnitudes of both the numerator
and denominator, they might place 23 nearer to the lower endpoint because the numerator and
denominator are small numbers (Braithwaite & Siegler, 2018) whereas they may place 8/12
nearer to the upper endpoint because 8 and 12 are relatively larger numbers. Alternately, a
student might place 23 close to the upper endpoint because there is only a gap of one unit between
100
2 and 3 (Deringöl, 2019; Pearn & Stephens, 2004). By examining performance on individual
trials, estimation patterns can be observed and thus allow researchers to draw inferences about
students’ fraction misconceptions.
In summary, fraction misconceptions may influence estimation patterns in multiple ways,
but few attempts have been made to categorize patterns of performance. Students use a number
of strategies on fraction number line tasks, such as dividing the number line into segments,
transforming the fraction into a more convenient format (e.g., decimal, percent, equivalent
fraction), and using endpoints and midpoint references to place estimates. The effectiveness of
these strategies is influenced by the knowledge and experience of the student.
Skills that Relate to Successful Strategy Use
Knowledge of Fraction Symbols
In addition to effective strategies, students need an understanding of fraction symbols to
successfully estimate the position of fractions on a number line. Presumably, if students do not
understand how the fraction symbol maps to its quantitative referent, placing the fraction on a
number line will be challenging. The knowledge of how whole numbers map to quantities is a
foundational numeracy skill that predicts more advanced mathematical skills (Brankaer et al.,
2014; Jiménez Lira et al., 2017; Lyons & Ansari, 2015; Salminen et al., 2018). Thus, it is
reasonable to assume – and indeed, it was shown in Chapter 5 - that the ability to map fraction
symbols to quantities would be a foundational skill for the fraction number line. However,
fraction mapping is typically included in general measures of fraction concept knowledge (e.g.,
Hallett et al., 2010, 2012; Hansen et al., 2017; Hecht et al., 2003; Rodrigues et al., 2019) and
thus has not been explicitly assessed as a predictor of more advanced fraction skills such as
fraction number line estimation.
101
Number Line Knowledge
In addition to understanding fraction symbols, students need conceptual understanding of
number lines to make accurate estimates (Resnick et al., 2016). Students with conceptual
knowledge of the number line know that numbers can be represented in a proportionally-spaced
ordered sequence along a line with one number on the left and a larger number on the right
(Siegler & Opfer, 2003). Skill at estimating the position of whole-numbers on a number line are
related concurrently (Bailey et al., 2014) and longitudinally to performance on fraction number
lines (Resnick et al., 2016). Resnick et al. (2016) followed students’ fraction estimation skills
from fourth to sixth grade during which time, students completed two fraction number line tasks
(0-1 and 0-2) at five time points. Latent transition analysis was used to classify students based on
their mean estimation accuracy (as opposed to item accuracy) on each number line task. Three
performance profiles emerged: (a) students who started accurately and ended accurately, (b)
students who started inaccurately and ended accurately, and (c) students who started inaccurately
and ended inaccurately. Resnick et al. found that after controlling for in-class attention and
reading fluency, whole number estimation (i.e., 0-1000 number line) and multiplication fluency
skills predicted the transition from inaccurate estimator to accurate estimator. Thus, whole-
number-line knowledge supports skilled performance on the fraction number line task.
Whole Number Arithmetic
The numerical transformation strategy described earlier requires that solvers use
arithmetic skills. For example, to change 45 to a percentage entails dividing (4 ÷ 5 = 0.8) and
multiplying (0.8 × 100 = 80%). Multiplication fluency is related longitudinally to accurate
fraction number line estimation (Resnick et al., 2016) and measures of arithmetic calculation are
related both concurrently (Namkung & Fuchs, 2016) and longitudinally (Ye et al., 2016) to
102
measures of fraction concept knowledge that include fraction number line estimation. These
findings indicate that arithmetic fluency is related to accurate placement of fractions on number
lines. Presumably, because transformation algorithms are not taught until grade 5 (Ontario
Ministry of Education, 2005) and transformation strategies are used more by older than younger
students (Siegler et al., 2011), arithmetic skills may relate more strongly to fraction number line
performance amongst students in higher grades.
Current “Study”
The goal of the current chapter was to explore strategy use on fraction number line to
better understand how students reason about fractions and the quantities they represent. As well,
I also examined the skills that differentiated students based on their strategy selection and
implementation.
First, latent profile analysis was used to classify students into different profiles based on
their estimation accuracy on all fraction number line trials. This methodology has been used
successfully to analyze number line estimation of whole numbers in children from preschool up
to grade 2 (Bouwmeester & Verkoeijen, 2012; Xu, 2019; Xu et al., under review). In the present
study, students estimated the position of 27 target fractions on a 0-1 number line. The percent
absolute error (PAE) between the target fractions and the students’ estimates were used as
indicators of the students’ number line estimation profiles (Xu, 2019). The number of estimation
profiles was determined by comparing the fit statistics of the latent models and referencing
theoretical support for the profiles. Students’ oral strategy reports were used to validate the
estimation profiles (Xu, 2019) and provide additional insights into fraction estimation strategies
103
(Siegler et al., 2011; D. Zhang et al., 2017). Because this study is the first to assess estimation
patterns for the fraction number line, our approach was exploratory.2
Next, multinomial logistic regression was used to link profile assignment with students’
Time 1 math skills. The goal was to identify the skills that differentiate the groups defined in the
latent profile analysis. Weak fraction mapping skills were expected to be associated with the
least successful estimation patterns on the assumption that these students were still developing
their conceptual understanding of the magnitudes represented by the fraction symbol. In contrast,
better whole number estimation and arithmetic skills were expected to predict membership in
more skilled profiles.
Method
Participants, procedures and measures are described in Chapter 3. Methodological details
applicable to the current analyses are described below.
Measures
Fraction Number Line Estimation. In this iPad task, students estimated the position of
a fraction on a 0-1 number line (see Figure 6.2). In the app, the student sees a numeric fraction at
the top of the screen. The student is instructed to “place” the fraction on the number line by
touching the number line and moving the red cursor to where they think the fraction should be
located. When the student is happy with their estimate, they tap done and the next trial begins.
Students began the task with four trials where they were prompted to explain their estimation
strategy. These four trials ( 14
, 37
, 45
, 79 ) were presented in order at the beginning of the task and
were chosen to allow a range of possible strategies. For example, students may use a midpoint
2 Resnick et al. (2016) used latent profile analysis, however, their profiles were based on mean accuracy for two fraction number lines as opposed to individual item accuracy.
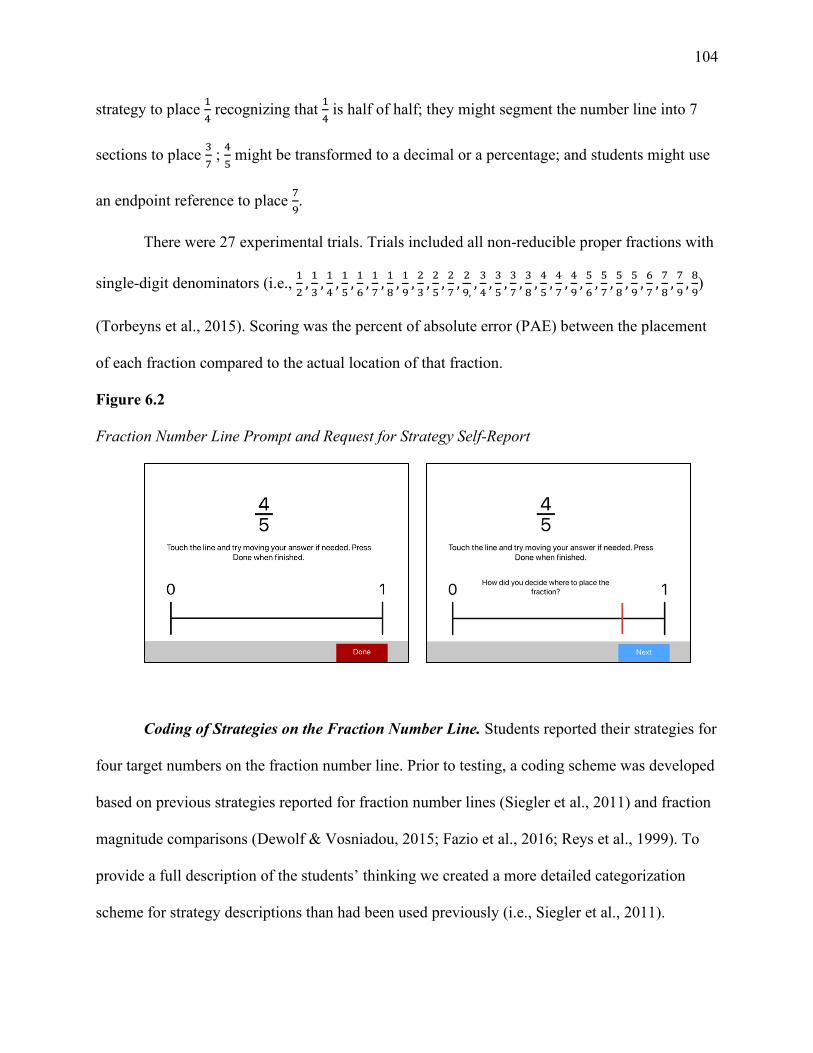
104
strategy to place 14 recognizing that 1
4 is half of half; they might segment the number line into 7
sections to place 37 ; 45 might be transformed to a decimal or a percentage; and students might use
an endpoint reference to place 79.
There were 27 experimental trials. Trials included all non-reducible proper fractions with
single-digit denominators (i.e., 12
, 13
, 14
, 15
, 16
, 17
, 18
, 19
, 23
, 25
, 27
, 29,
, 34
, 35
, 37
, 38
, 45
, 47
, 49
, 56
, 57
, 58
, 59
, 67
, 78
, 79
, 89)
(Torbeyns et al., 2015). Scoring was the percent of absolute error (PAE) between the placement
of each fraction compared to the actual location of that fraction.
Figure 6.2
Fraction Number Line Prompt and Request for Strategy Self-Report
Coding of Strategies on the Fraction Number Line. Students reported their strategies for
four target numbers on the fraction number line. Prior to testing, a coding scheme was developed
based on previous strategies reported for fraction number lines (Siegler et al., 2011) and fraction
magnitude comparisons (Dewolf & Vosniadou, 2015; Fazio et al., 2016; Reys et al., 1999). To
provide a full description of the students’ thinking we created a more detailed categorization
scheme for strategy descriptions than had been used previously (i.e., Siegler et al., 2011).
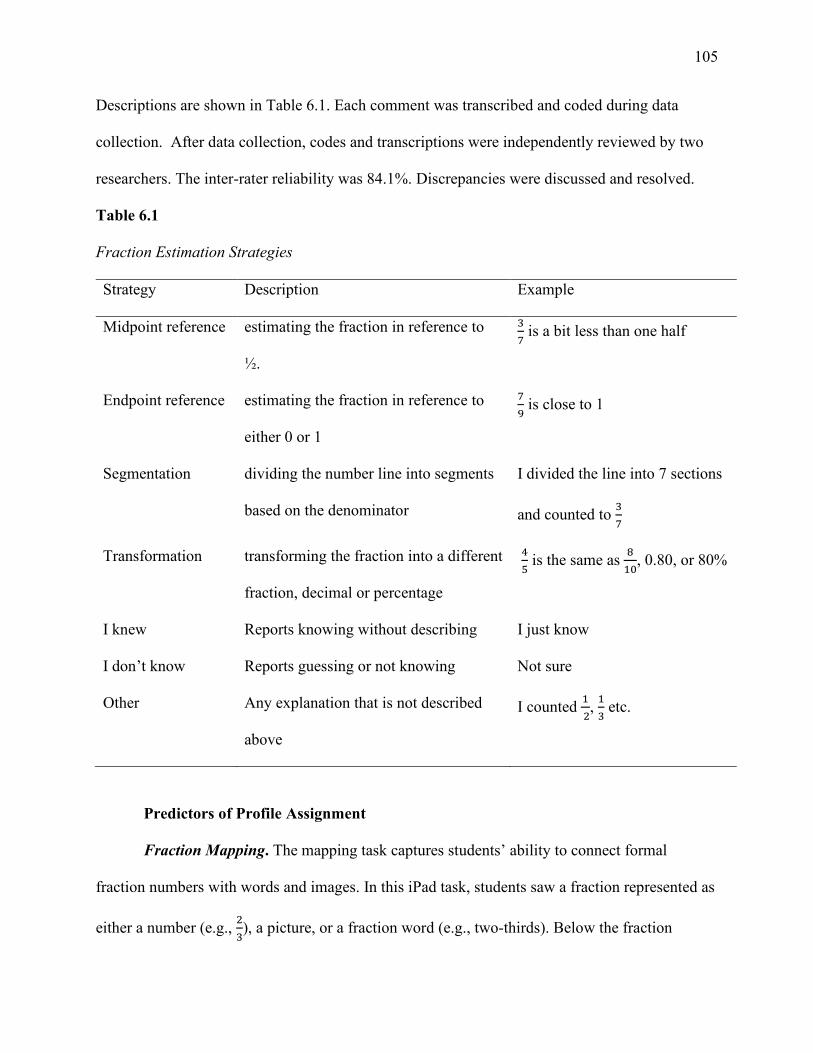
105
Descriptions are shown in Table 6.1. Each comment was transcribed and coded during data
collection. After data collection, codes and transcriptions were independently reviewed by two
researchers. The inter-rater reliability was 84.1%. Discrepancies were discussed and resolved.
Table 6.1
Fraction Estimation Strategies
Strategy Description Example
Midpoint reference estimating the fraction in reference to
½.
37 is a bit less than one half
Endpoint reference estimating the fraction in reference to
either 0 or 1
79 is close to 1
Segmentation dividing the number line into segments
based on the denominator
I divided the line into 7 sections
and counted to 37
Transformation transforming the fraction into a different
fraction, decimal or percentage
45 is the same as 8
10, 0.80, or 80%
I knew Reports knowing without describing I just know
I don’t know Reports guessing or not knowing Not sure
Other Any explanation that is not described
above
I counted 1 2
, 13 etc.
Predictors of Profile Assignment
Fraction Mapping. The mapping task captures students’ ability to connect formal
fraction numbers with words and images. In this iPad task, students saw a fraction represented as
either a number (e.g., 23), a picture, or a fraction word (e.g., two-thirds). Below the fraction
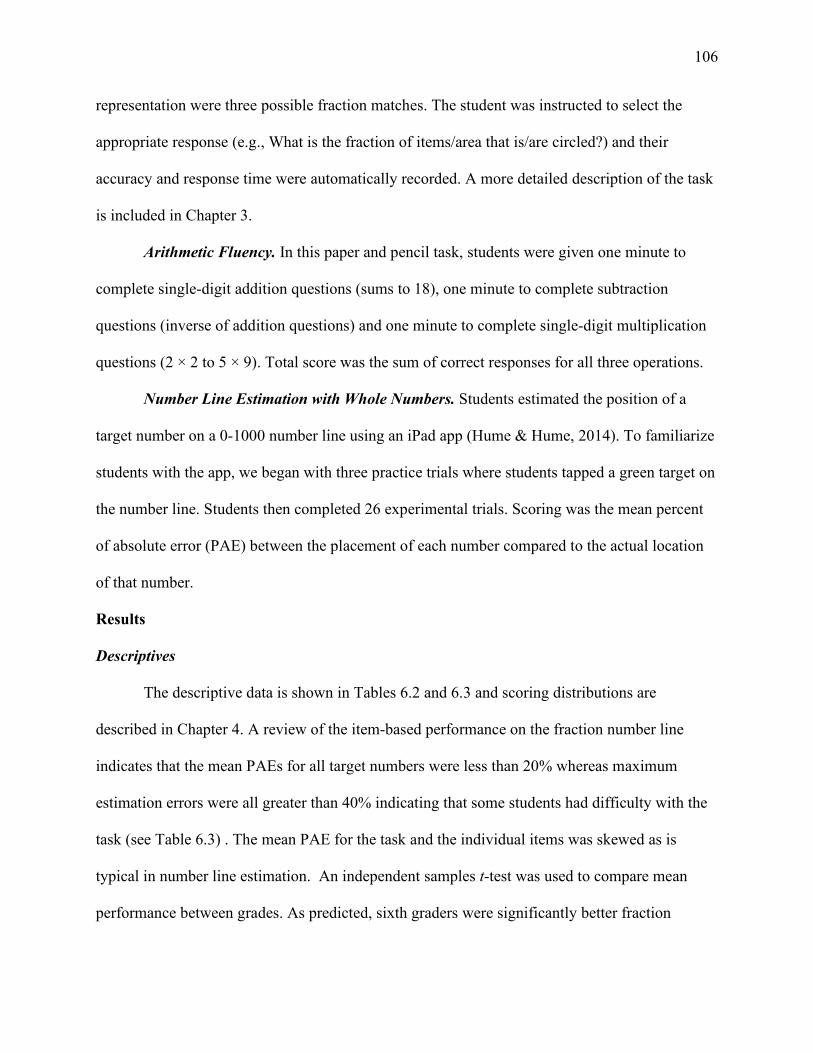
106
representation were three possible fraction matches. The student was instructed to select the
appropriate response (e.g., What is the fraction of items/area that is/are circled?) and their
accuracy and response time were automatically recorded. A more detailed description of the task
is included in Chapter 3.
Arithmetic Fluency. In this paper and pencil task, students were given one minute to
complete single-digit addition questions (sums to 18), one minute to complete subtraction
questions (inverse of addition questions) and one minute to complete single-digit multiplication
questions (2 × 2 to 5 × 9). Total score was the sum of correct responses for all three operations.
Number Line Estimation with Whole Numbers. Students estimated the position of a
target number on a 0-1000 number line using an iPad app (Hume & Hume, 2014). To familiarize
students with the app, we began with three practice trials where students tapped a green target on
the number line. Students then completed 26 experimental trials. Scoring was the mean percent
of absolute error (PAE) between the placement of each number compared to the actual location
of that number.
Results
Descriptives
The descriptive data is shown in Tables 6.2 and 6.3 and scoring distributions are
described in Chapter 4. A review of the item-based performance on the fraction number line
indicates that the mean PAEs for all target numbers were less than 20% whereas maximum
estimation errors were all greater than 40% indicating that some students had difficulty with the
task (see Table 6.3) . The mean PAE for the task and the individual items was skewed as is
typical in number line estimation. An independent samples t-test was used to compare mean
performance between grades. As predicted, sixth graders were significantly better fraction
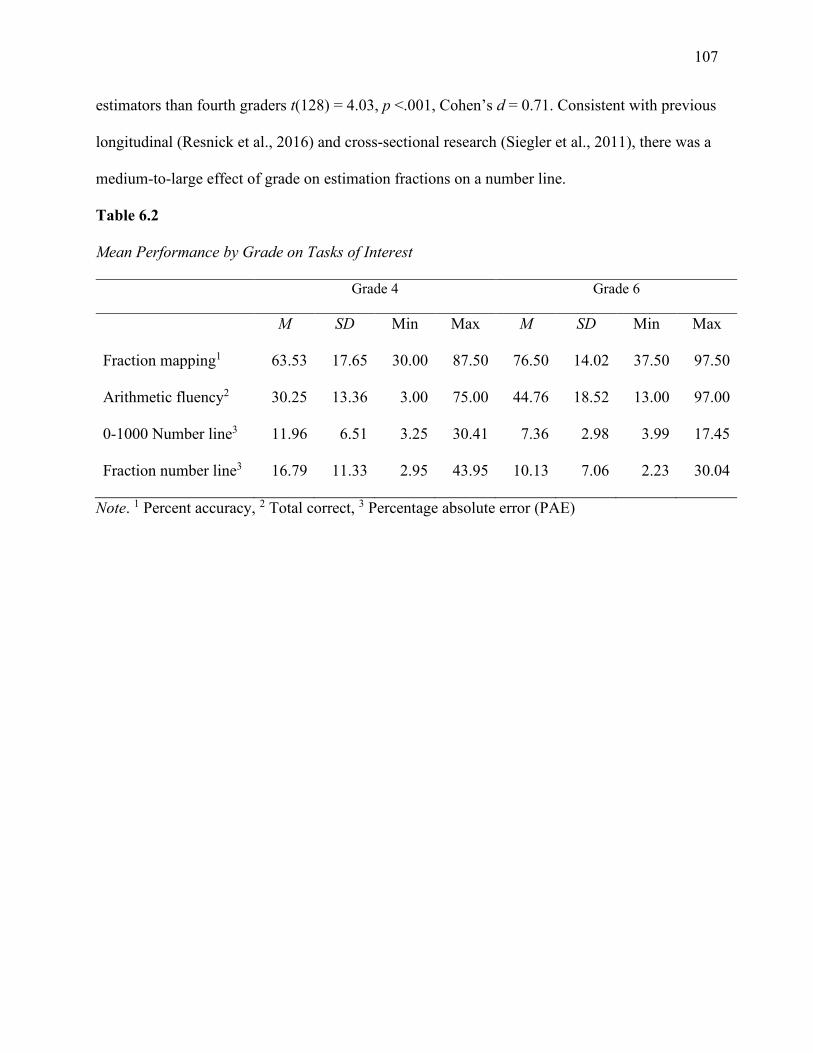
107
estimators than fourth graders t(128) = 4.03, p <.001, Cohen’s d = 0.71. Consistent with previous
longitudinal (Resnick et al., 2016) and cross-sectional research (Siegler et al., 2011), there was a
medium-to-large effect of grade on estimation fractions on a number line.
Table 6.2
Mean Performance by Grade on Tasks of Interest Grade 4 Grade 6
M SD Min Max M SD Min Max
Fraction mapping1 63.53 17.65 30.00 87.50 76.50 14.02 37.50 97.50
Arithmetic fluency2 30.25 13.36 3.00 75.00 44.76 18.52 13.00 97.00
0-1000 Number line3 11.96 6.51 3.25 30.41 7.36 2.98 3.99 17.45
Fraction number line3 16.79 11.33 2.95 43.95 10.13 7.06 2.23 30.04
Note. 1 Percent accuracy, 2 Total correct, 3 Percentage absolute error (PAE)
108
Table 6.3
Descriptive Statistics by Item for the Fraction Number Line
Fraction M SD ZSkew Max Fraction M SD ZSkew Max
12
11.62 17.47 6.05 50.00 37
16.46 12.50 3.76 52.41
13
11.49 12.90 7.52 62.67 38
13.49 12.49 7.43 55.04
14
9.18 13.61 11.95 75.00 45
16.46 18.59 5.14 65.86
15
11.55 16.50 11.52 78.30 47
13.67 10.57 3.14 43.49
16
14.82 21.28 8.95 83.33 49
13.18 12.84 7.95 53.31
17
14.46 21.96 8.29 81.16 56
15.43 17.46 7.38 83.33
18
15.50 24.52 7.86 84.59 57
12.25 11.65 7.38 58.31
19
17.21 27.73 7.90 88.22 58
12.33 10.51 6.62 54.85
23
17.33 18.30 4.71 61.27 59
11.65 11.55 5.90 44.47
25
12.23 11.15 7.95 60.00 67
12.01 13.97 8.48 69.45
27
11.60 14.12 9.24 59.11 78
11.26 17.92 13.81 84.53
29
15.64 21.83 8.24 76.20 79
10.70 11.45 14.24 76.08
34
15.87 18.67 5.29 62.74 89
10.15 16.03 14.14 87.25
35
13.96 12.95 4.48 48.77
Note: All skew values were significant at p < .05.
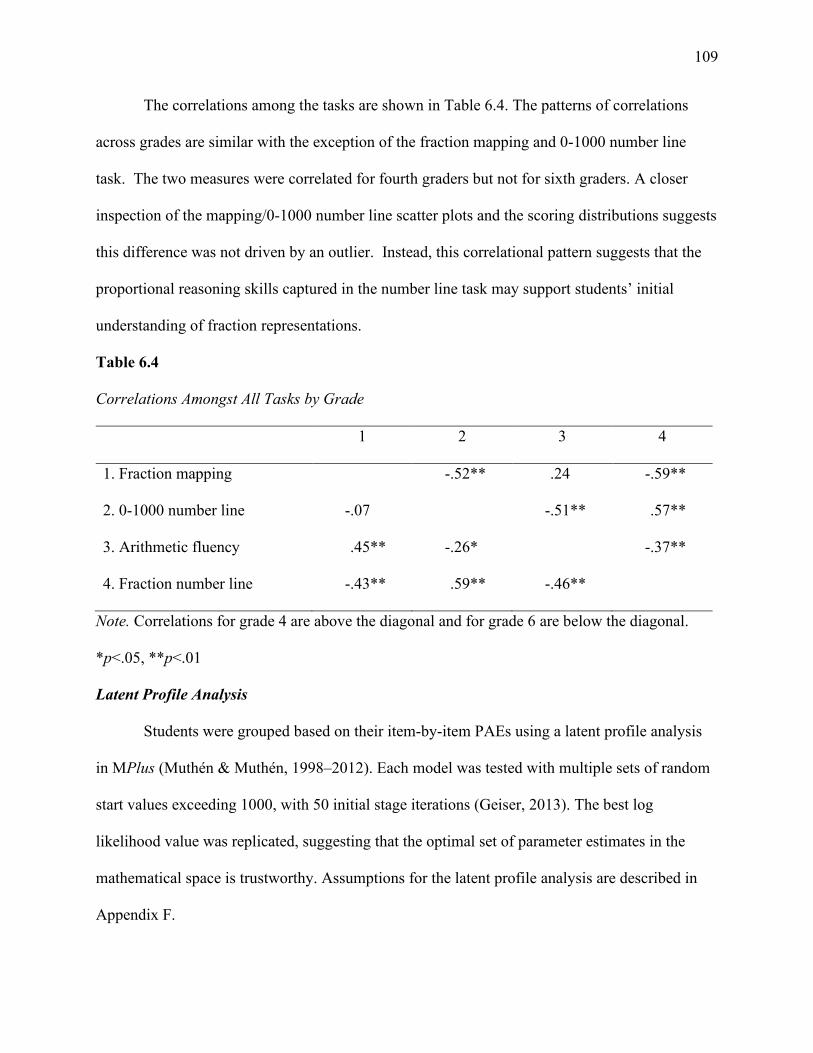
109
The correlations among the tasks are shown in Table 6.4. The patterns of correlations
across grades are similar with the exception of the fraction mapping and 0-1000 number line
task. The two measures were correlated for fourth graders but not for sixth graders. A closer
inspection of the mapping/0-1000 number line scatter plots and the scoring distributions suggests
this difference was not driven by an outlier. Instead, this correlational pattern suggests that the
proportional reasoning skills captured in the number line task may support students’ initial
understanding of fraction representations.
Table 6.4
Correlations Amongst All Tasks by Grade
1 2 3 4
1. Fraction mapping -.52** .24 -.59**
2. 0-1000 number line -.07 -.51** .57**
3. Arithmetic fluency .45** -.26* -.37**
4. Fraction number line -.43** .59** -.46**
Note. Correlations for grade 4 are above the diagonal and for grade 6 are below the diagonal.
*p<.05, **p<.01
Latent Profile Analysis
Students were grouped based on their item-by-item PAEs using a latent profile analysis
in MPlus (Muthén & Muthén, 1998–2012). Each model was tested with multiple sets of random
start values exceeding 1000, with 50 initial stage iterations (Geiser, 2013). The best log
likelihood value was replicated, suggesting that the optimal set of parameter estimates in the
mathematical space is trustworthy. Assumptions for the latent profile analysis are described in
Appendix F.
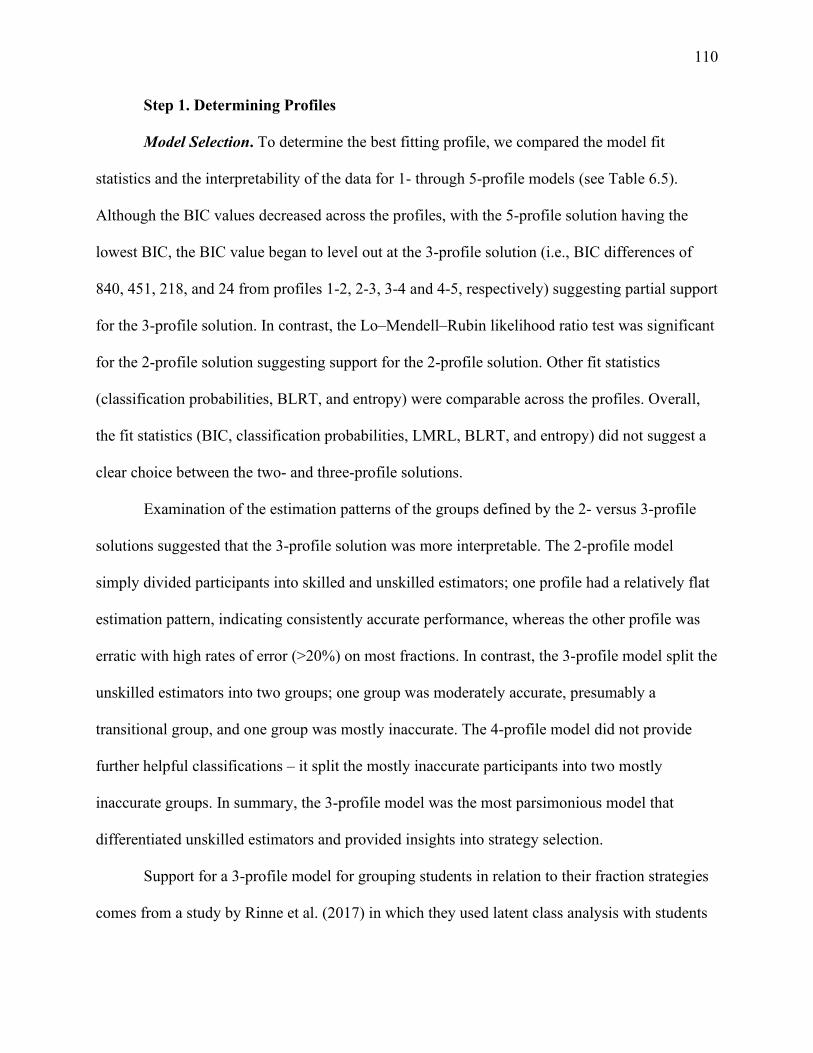
110
Step 1. Determining Profiles
Model Selection. To determine the best fitting profile, we compared the model fit
statistics and the interpretability of the data for 1- through 5-profile models (see Table 6.5).
Although the BIC values decreased across the profiles, with the 5-profile solution having the
lowest BIC, the BIC value began to level out at the 3-profile solution (i.e., BIC differences of
840, 451, 218, and 24 from profiles 1-2, 2-3, 3-4 and 4-5, respectively) suggesting partial support
for the 3-profile solution. In contrast, the Lo–Mendell–Rubin likelihood ratio test was significant
for the 2-profile solution suggesting support for the 2-profile solution. Other fit statistics
(classification probabilities, BLRT, and entropy) were comparable across the profiles. Overall,
the fit statistics (BIC, classification probabilities, LMRL, BLRT, and entropy) did not suggest a
clear choice between the two- and three-profile solutions.
Examination of the estimation patterns of the groups defined by the 2- versus 3-profile
solutions suggested that the 3-profile solution was more interpretable. The 2-profile model
simply divided participants into skilled and unskilled estimators; one profile had a relatively flat
estimation pattern, indicating consistently accurate performance, whereas the other profile was
erratic with high rates of error (>20%) on most fractions. In contrast, the 3-profile model split the
unskilled estimators into two groups; one group was moderately accurate, presumably a
transitional group, and one group was mostly inaccurate. The 4-profile model did not provide
further helpful classifications – it split the mostly inaccurate participants into two mostly
inaccurate groups. In summary, the 3-profile model was the most parsimonious model that
differentiated unskilled estimators and provided insights into strategy selection.
Support for a 3-profile model for grouping students in relation to their fraction strategies
comes from a study by Rinne et al. (2017) in which they used latent class analysis with students
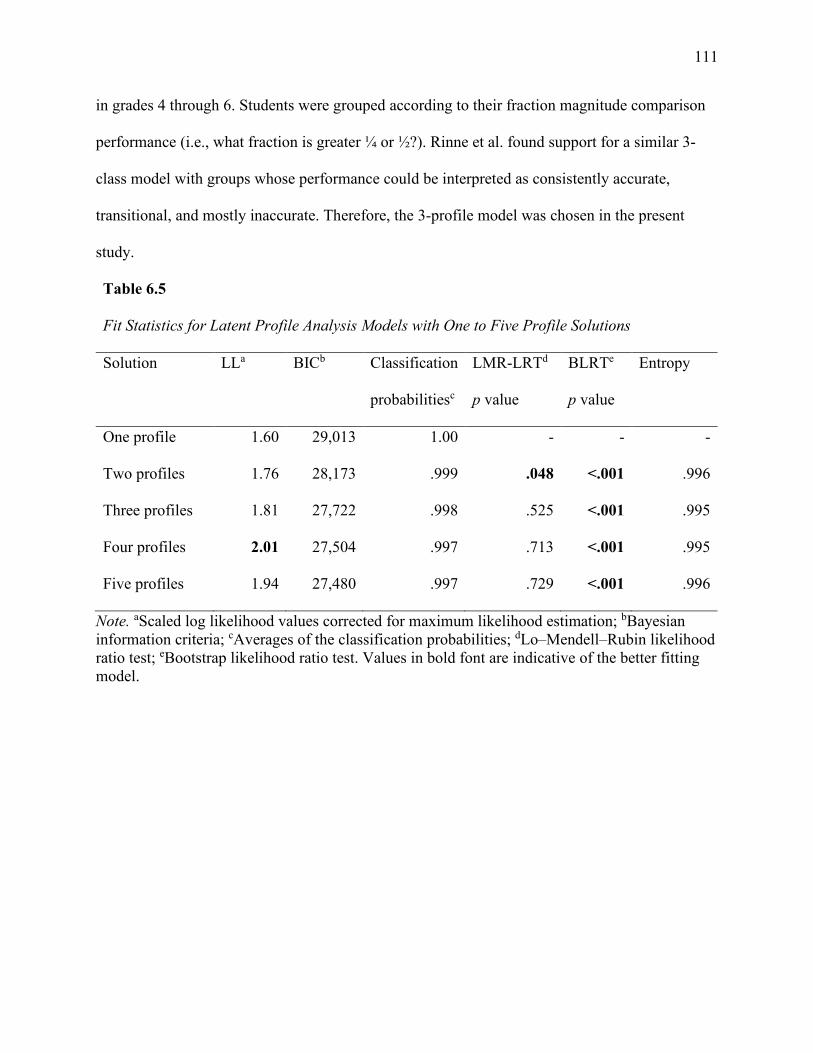
111
in grades 4 through 6. Students were grouped according to their fraction magnitude comparison
performance (i.e., what fraction is greater ¼ or ½?). Rinne et al. found support for a similar 3-
class model with groups whose performance could be interpreted as consistently accurate,
transitional, and mostly inaccurate. Therefore, the 3-profile model was chosen in the present
study.
Table 6.5
Fit Statistics for Latent Profile Analysis Models with One to Five Profile Solutions
Solution LLa BICb Classification
probabilitiesc
LMR-LRTd
p value
BLRTe
p value
Entropy
One profile 1.60 29,013 1.00 - - -
Two profiles 1.76 28,173 .999 .048 <.001 .996
Three profiles 1.81 27,722 .998 .525 <.001 .995
Four profiles 2.01 27,504 .997 .713 <.001 .995
Five profiles 1.94 27,480 .997 .729 <.001 .996
Note. aScaled log likelihood values corrected for maximum likelihood estimation; bBayesian information criteria; cAverages of the classification probabilities; dLo–Mendell–Rubin likelihood ratio test; eBootstrap likelihood ratio test. Values in bold font are indicative of the better fitting model.
112
Figure 6.3
Mean PAE for Each Profile Group in the 3-Profile Solution. Error bars are standard errors of the mean.
Note: Target fractions are presented in order of increasing magnitude; * indicates target fractions where students provided a strategy.
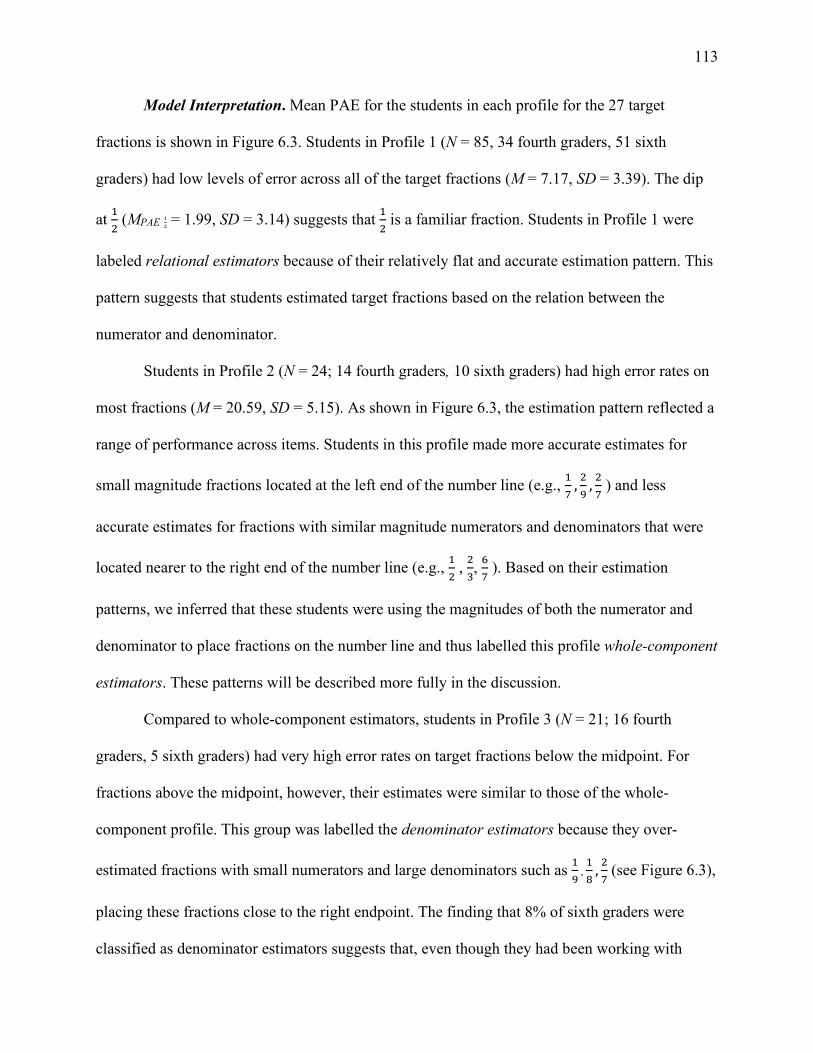
113
Model Interpretation. Mean PAE for the students in each profile for the 27 target
fractions is shown in Figure 6.3. Students in Profile 1 (N = 85, 34 fourth graders, 51 sixth
graders) had low levels of error across all of the target fractions (M = 7.17, SD = 3.39). The dip
at 12 (MPAE 1
2 = 1.99, SD = 3.14) suggests that 1
2 is a familiar fraction. Students in Profile 1 were
labeled relational estimators because of their relatively flat and accurate estimation pattern. This
pattern suggests that students estimated target fractions based on the relation between the
numerator and denominator.
Students in Profile 2 (N = 24; 14 fourth graders, 10 sixth graders) had high error rates on
most fractions (M = 20.59, SD = 5.15). As shown in Figure 6.3, the estimation pattern reflected a
range of performance across items. Students in this profile made more accurate estimates for
small magnitude fractions located at the left end of the number line (e.g., 17
, 29
, 27 ) and less
accurate estimates for fractions with similar magnitude numerators and denominators that were
located nearer to the right end of the number line (e.g., 12 , 23, 67 ). Based on their estimation
patterns, we inferred that these students were using the magnitudes of both the numerator and
denominator to place fractions on the number line and thus labelled this profile whole-component
estimators. These patterns will be described more fully in the discussion.
Compared to whole-component estimators, students in Profile 3 (N = 21; 16 fourth
graders, 5 sixth graders) had very high error rates on target fractions below the midpoint. For
fractions above the midpoint, however, their estimates were similar to those of the whole-
component profile. This group was labelled the denominator estimators because they over-
estimated fractions with small numerators and large denominators such as 19
, 18
, 27 (see Figure 6.3),
placing these fractions close to the right endpoint. The finding that 8% of sixth graders were
classified as denominator estimators suggests that, even though they had been working with
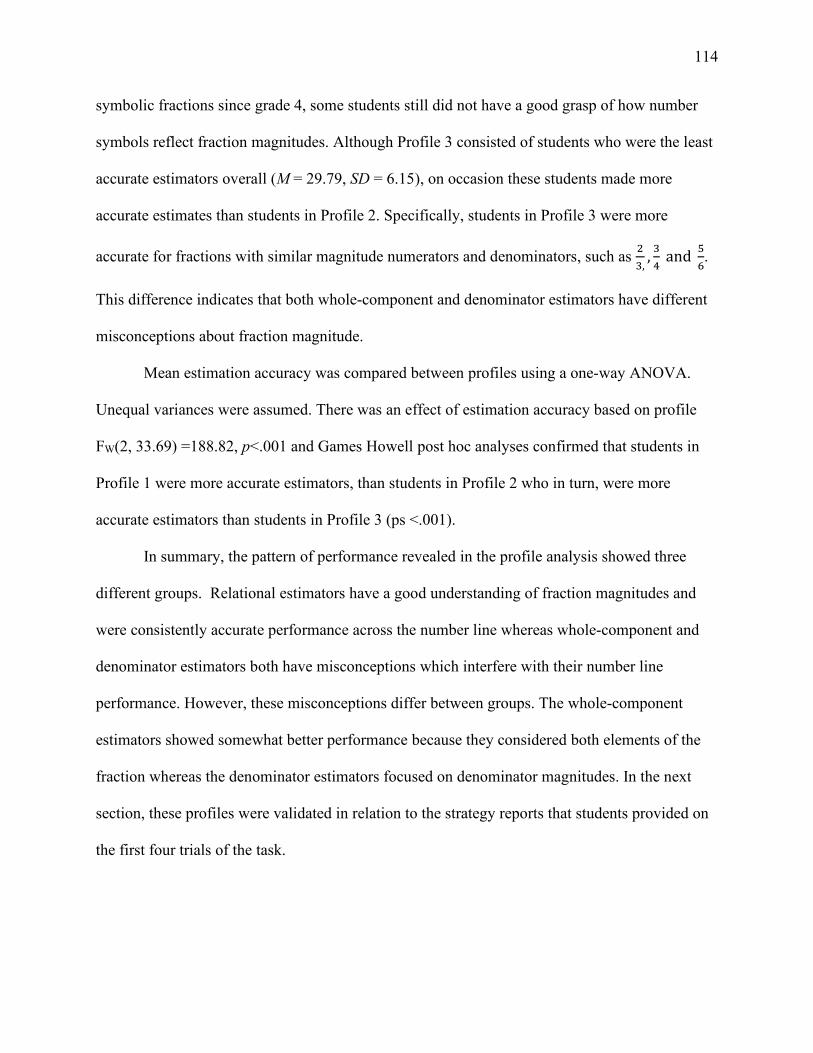
114
symbolic fractions since grade 4, some students still did not have a good grasp of how number
symbols reflect fraction magnitudes. Although Profile 3 consisted of students who were the least
accurate estimators overall (M = 29.79, SD = 6.15), on occasion these students made more
accurate estimates than students in Profile 2. Specifically, students in Profile 3 were more
accurate for fractions with similar magnitude numerators and denominators, such as 23,
, 34
and 56.
This difference indicates that both whole-component and denominator estimators have different
misconceptions about fraction magnitude.
Mean estimation accuracy was compared between profiles using a one-way ANOVA.
Unequal variances were assumed. There was an effect of estimation accuracy based on profile
FW(2, 33.69) =188.82, p<.001 and Games Howell post hoc analyses confirmed that students in
Profile 1 were more accurate estimators, than students in Profile 2 who in turn, were more
accurate estimators than students in Profile 3 (ps <.001).
In summary, the pattern of performance revealed in the profile analysis showed three
different groups. Relational estimators have a good understanding of fraction magnitudes and
were consistently accurate performance across the number line whereas whole-component and
denominator estimators both have misconceptions which interfere with their number line
performance. However, these misconceptions differ between groups. The whole-component
estimators showed somewhat better performance because they considered both elements of the
fraction whereas the denominator estimators focused on denominator magnitudes. In the next
section, these profiles were validated in relation to the strategy reports that students provided on
the first four trials of the task.
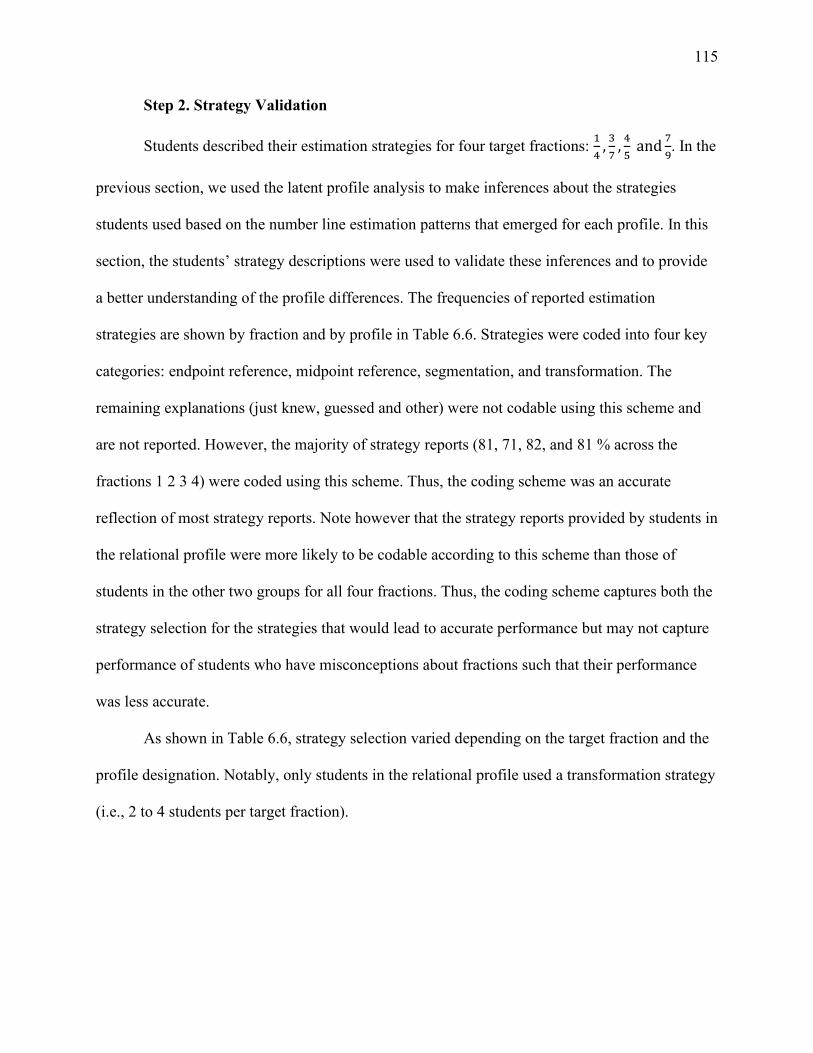
115
Step 2. Strategy Validation
Students described their estimation strategies for four target fractions: 14
, 37
, 45
and 79. In the
previous section, we used the latent profile analysis to make inferences about the strategies
students used based on the number line estimation patterns that emerged for each profile. In this
section, the students’ strategy descriptions were used to validate these inferences and to provide
a better understanding of the profile differences. The frequencies of reported estimation
strategies are shown by fraction and by profile in Table 6.6. Strategies were coded into four key
categories: endpoint reference, midpoint reference, segmentation, and transformation. The
remaining explanations (just knew, guessed and other) were not codable using this scheme and
are not reported. However, the majority of strategy reports (81, 71, 82, and 81 % across the
fractions 1 2 3 4) were coded using this scheme. Thus, the coding scheme was an accurate
reflection of most strategy reports. Note however that the strategy reports provided by students in
the relational profile were more likely to be codable according to this scheme than those of
students in the other two groups for all four fractions. Thus, the coding scheme captures both the
strategy selection for the strategies that would lead to accurate performance but may not capture
performance of students who have misconceptions about fractions such that their performance
was less accurate.
As shown in Table 6.6, strategy selection varied depending on the target fraction and the
profile designation. Notably, only students in the relational profile used a transformation strategy
(i.e., 2 to 4 students per target fraction).
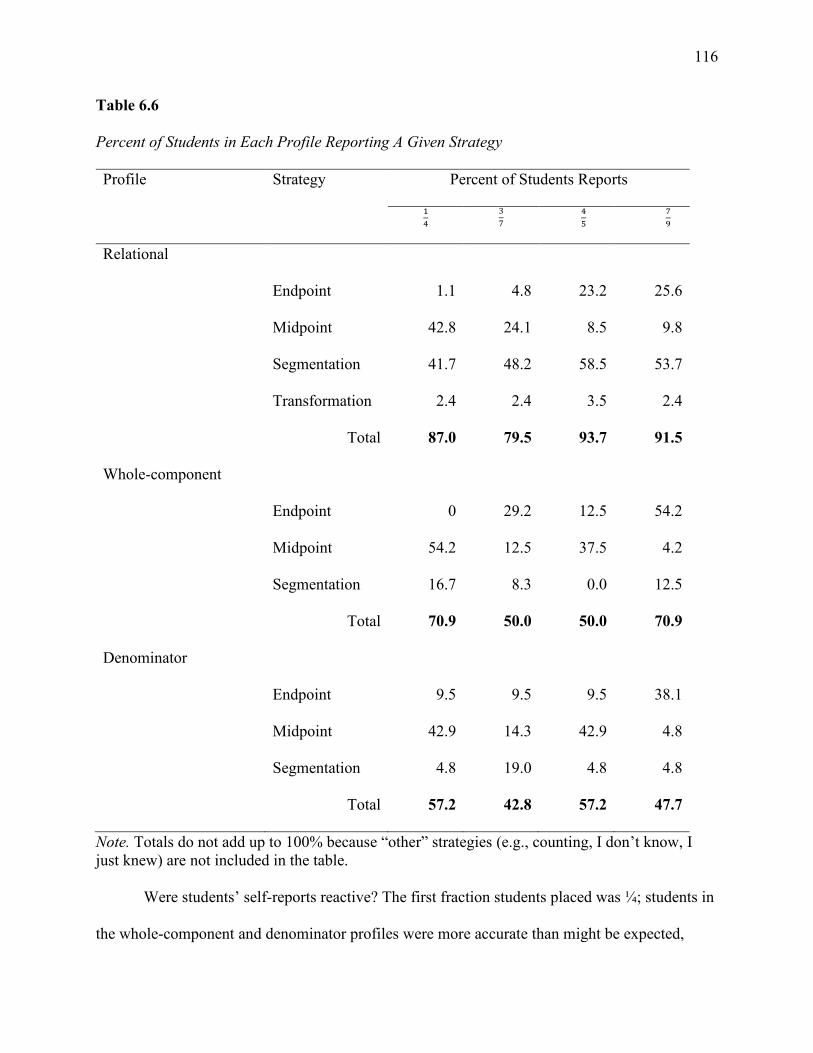
116
Table 6.6
Percent of Students in Each Profile Reporting A Given Strategy
Profile Strategy Percent of Students Reports
14 3
7
45 7
9
Relational
Endpoint 1.1 4.8 23.2 25.6
Midpoint 42.8 24.1 8.5 9.8
Segmentation 41.7 48.2 58.5 53.7
Transformation 2.4 2.4 3.5 2.4
Total 87.0 79.5 93.7 91.5
Whole-component
Endpoint 0 29.2 12.5 54.2
Midpoint 54.2 12.5 37.5 4.2
Segmentation 16.7 8.3 0.0 12.5
Total 70.9 50.0 50.0 70.9
Denominator
Endpoint 9.5 9.5 9.5 38.1
Midpoint 42.9 14.3 42.9 4.8
Segmentation 4.8 19.0 4.8 4.8
Total 57.2 42.8 57.2 47.7
Note. Totals do not add up to 100% because “other” strategies (e.g., counting, I don’t know, I just knew) are not included in the table.
Were students’ self-reports reactive? The first fraction students placed was ¼; students in
the whole-component and denominator profiles were more accurate than might be expected,
117
given their performance on other fractions. Recall that students began the estimation task by
describing their strategies for placing four target fractions. As shown in Figure 6.3, the whole
number estimators and denominator estimators more accurately placed 14 than 1
2 on the number
line. This finding was unexpected because we anticipated students would accurately estimate
both 14 and 1
2 because they are familiar fractions (Liu, 2018). As expected, the students in the
relational profile were very accurate at placing ½. One possible explanation of the pattern is that
students may have been more thoughtful about their fraction placement when they were
describing their strategy to the experimenter than later on in the task. Because 12 was presented
randomly in the sequence, some students may have struggled to inhibit their whole-number
reasoning thus estimating ½ based on the components as opposed to the relation between the
components (Avgerinou & Tolmie, 2019; Dewolf & Vosniadou, 2015; Shtulman & Valcarcel,
2012). In contrast, accuracy on the other three fractions for which strategy descriptions were
given were consistent with the profile patterns suggesting that bias from describing strategies
was limited to 1/4.
Relational Estimators. Students labeled as relational estimators described strategies that
supported the assumption that they understood that fraction magnitude is based on the relation
between the numerator and denominator. For example, using an endpoint strategy to place 79 one
student reasoned “99 is one whole and 7
9 is approximately 1
3 off a whole.” These students
frequently reported using a segmentation strategy (42% to 58% per target fraction; see Table
6.6). Successful segmentation strategies were typically described as follows, “I divided it [the
number line] into four and took one part.” Another student demonstrated relational thinking
when she explained a midpoint strategy while placing the fraction 37, “out of 7, 3 is less than half
118
of 7”; the research assistant noted the student then placed 37 to the left of 1
2. These oral reports
suggest that, when relational estimators placed fractions on a number line, they used a range of
strategies but most of the strategies were based on successful application of correct fraction
knowledge.
Whole-component Estimators. Whole component estimators relied mainly on endpoint
and midpoint strategies (see Table 6.6) and their oral reports reflected a partial understanding of
fraction magnitudes. For example, one student’s report that “one half is in the middle and it <14 >
is less than half” reflects an understanding that for unit fractions, a large denominator means a
small fraction. Whereas midpoint reports for 45, such as, “five is the middle of ten and four is just
under five” and “not in the middle, five-fifths would be in the middle, four-fifths is a bit farther
than half” suggest some students envisioned a number line to ten then looked at the difference
between the numerator and denominator to place the fraction. Notably, students were
inconsistent in their strategizing. Different fractions elicited different rationales. Placing 79 for
example, some students relied on the magnitude of the numerator as evidenced by their endpoint
reports: “1 is 100 and 7 is like 70 and it’s closer to 100”, “close to 1 because the top number is
higher than 5”, “5 is in the middle, this is a bit more than 5”. The whole-component estimators
articulated faulty magnitude reasoning, and based on their comments, these students typically
considered either the numerator or the numerator and denominator as whole components instead
of relational components.
Denominator Estimators. Students classified as denominator estimators primarily
described “other” strategies and reference point strategies that were focused on the magnitude of
the denominator. For example, one “other” strategy was counting: “I counted 0, 12
, 13
then 14
”, “

119
12
and then 13
then 14 .” This counting pattern indicates that these students thought the unit fraction
got larger as the denominator got larger. In contrast to whole number estimators, denominator
estimators did not understand that a larger denominator means a lesser unit fraction. Students’
midpoint reports for 4 5
were also focused on the denominator “near the middle ‘cause it’s five.”
Similar denominator thinking was described by students who estimated 37 using an endpoint
reference: “It’s close to ten like a seven is close to ten”, “close, seven is almost at nine.” In
addition, endpoints strategy reports for 79 , included “nine is close to the end” “the end is 10 so a
little over 9” and “pretty close to 1 whole”. Notably, the magnitude of the numerator was ignored
in these endpoint strategy reports. Based on the oral reports and the observed estimation patterns,
we suggest that, along with some of the faulty reasoning whole number estimators demonstrated,
denominator estimators may be counting and misapplying endpoint and midpoint strategies to
estimate fraction magnitudes.
Step 3. Influence of Profile Predictors
We hypothesized that arithmetic, whole number estimation and fraction mapping skills
would differentiate latent profile membership. Using multinomial logistic regression, we
examined the odds of profile assignment based on students’ Time 1 math skills (see Table 6.7).
Because there were an unequal number of students in each profile, significance testing was based
on 1,000 bootstrapped samples. We compared the probabilities of profile membership in
relational and denominator estimators to whole-component estimators because we were
specifically interested in the skills that differentiated the moderately successful fraction
estimators from the weaker estimators and more proficient estimators.
All predictors (i.e., arithmetic fluency, grade, whole-number estimation and fraction
mapping ) were initially entered into the model and backward elimination was used to remove
120
the predictors that did not influence profile membership. The resulting model included fraction
mapping, 0-1000 number line, and grade. The logistic regression model fit the data significantly
better than the null model, χ2(6) = 69.470, p < .001. Notably, the χ2 values for the Pearson and
deviance goodness of fit statistics were non-significant (p = .84 and p = .99, respectively)
providing evidence that the regression model fit the data well.
What skills differentiated profile membership? Compared to whole-component
estimators, relational estimators were more likely to be in sixth grade, have better fraction
mapping skills and be more accurate placing whole numbers on a 0-1000 number line (see Table
6.7). In contrast, compared to denominator estimators, whole-component estimators were more
likely to have stronger fraction mapping skills. Grade and 0-1000 number line estimation did not
differentiate whole component estimators from denominator estimators. In fact, students with
strong mapping skills were almost twice as likely to be classified as whole-component estimators
compared to denominator estimators. That is, the odds of being classified as a whole-component
estimator increased as fraction mapping skills increased (eb= 1.92). In summary, fraction
mapping skills differentiated profile membership at all levels whereas, 0-1000 number line
estimation accuracy only differentiated the most successful estimators. Presumably, because both
whole-component and denominator estimators had fraction misconceptions, their proportional
reasoning skills captured in the 0-1000 number line were not used to their fraction estimation.
Profile membership for the fraction number line task was related to students’ fraction
mapping skills and whole number estimation skills. Arithmetic skills did not differentiate profile
membership as hypothesized. These findings suggest that fraction mapping skills support
students as they progress from estimating fractions based on whole number magnitudes (i.e.,
denominator and whole-component estimators) to using a relational understanding of fractions.
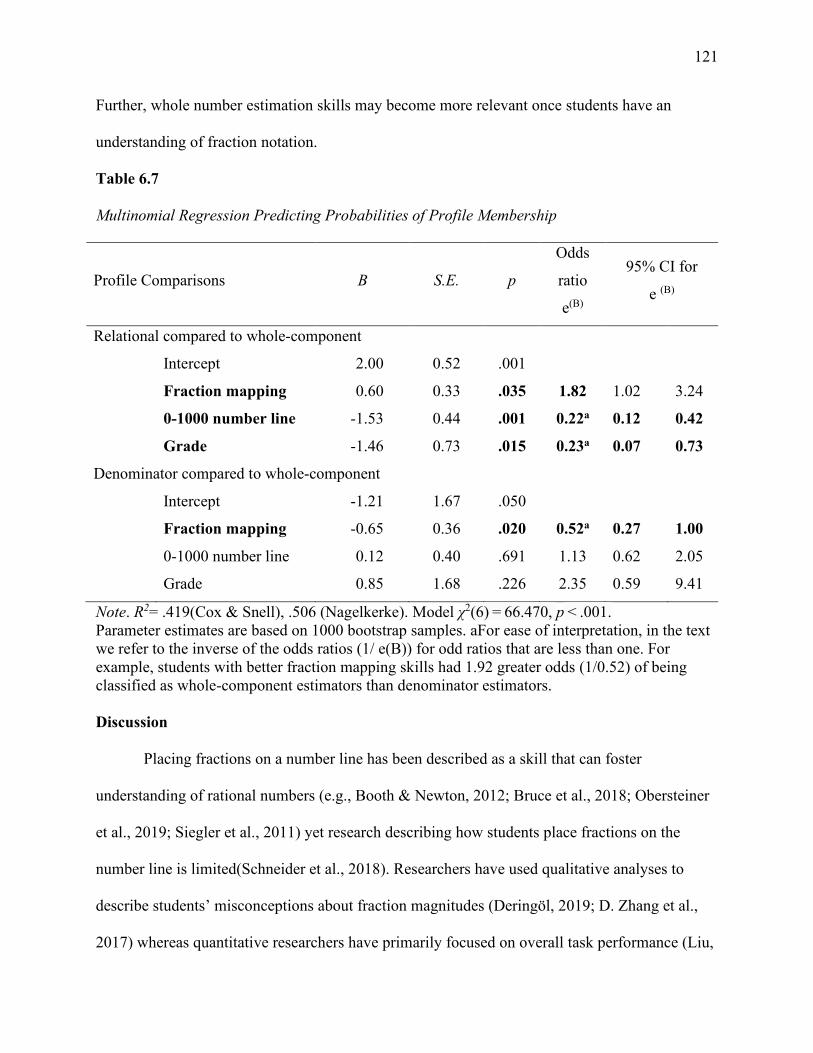
121
Further, whole number estimation skills may become more relevant once students have an
understanding of fraction notation.
Table 6.7
Multinomial Regression Predicting Probabilities of Profile Membership
Profile Comparisons B S.E. p
Odds
ratio
e(B)
95% CI for
e (B)
Relational compared to whole-component
Intercept 2.00 0.52 .001
Fraction mapping 0.60 0.33 .035 1.82 1.02 3.24
0-1000 number line -1.53 0.44 .001 0.22a 0.12 0.42
Grade -1.46 0.73 .015 0.23a 0.07 0.73
Denominator compared to whole-component
Intercept -1.21 1.67 .050
Fraction mapping -0.65 0.36 .020 0.52a 0.27 1.00
0-1000 number line 0.12 0.40 .691 1.13 0.62 2.05
Grade 0.85 1.68 .226 2.35 0.59 9.41
Note. R2= .419(Cox & Snell), .506 (Nagelkerke). Model χ2(6) = 66.470, p < .001. Parameter estimates are based on 1000 bootstrap samples. aFor ease of interpretation, in the text we refer to the inverse of the odds ratios (1/ e(B)) for odd ratios that are less than one. For example, students with better fraction mapping skills had 1.92 greater odds (1/0.52) of being classified as whole-component estimators than denominator estimators. Discussion
Placing fractions on a number line has been described as a skill that can foster
understanding of rational numbers (e.g., Booth & Newton, 2012; Bruce et al., 2018; Obersteiner
et al., 2019; Siegler et al., 2011) yet research describing how students place fractions on the
number line is limited(Schneider et al., 2018). Researchers have used qualitative analyses to
describe students’ misconceptions about fraction magnitudes (Deringöl, 2019; D. Zhang et al.,
2017) whereas quantitative researchers have primarily focused on overall task performance (Liu,
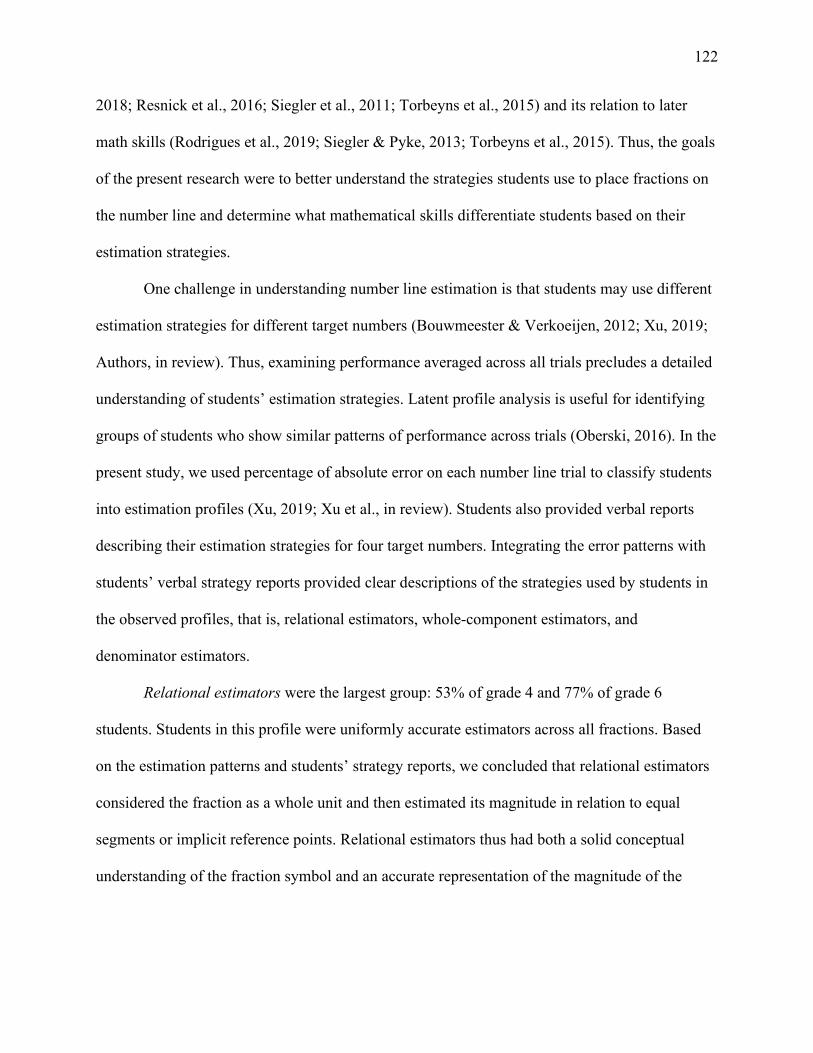
122
2018; Resnick et al., 2016; Siegler et al., 2011; Torbeyns et al., 2015) and its relation to later
math skills (Rodrigues et al., 2019; Siegler & Pyke, 2013; Torbeyns et al., 2015). Thus, the goals
of the present research were to better understand the strategies students use to place fractions on
the number line and determine what mathematical skills differentiate students based on their
estimation strategies.
One challenge in understanding number line estimation is that students may use different
estimation strategies for different target numbers (Bouwmeester & Verkoeijen, 2012; Xu, 2019;
Authors, in review). Thus, examining performance averaged across all trials precludes a detailed
understanding of students’ estimation strategies. Latent profile analysis is useful for identifying
groups of students who show similar patterns of performance across trials (Oberski, 2016). In the
present study, we used percentage of absolute error on each number line trial to classify students
into estimation profiles (Xu, 2019; Xu et al., in review). Students also provided verbal reports
describing their estimation strategies for four target numbers. Integrating the error patterns with
students’ verbal strategy reports provided clear descriptions of the strategies used by students in
the observed profiles, that is, relational estimators, whole-component estimators, and
denominator estimators.
Relational estimators were the largest group: 53% of grade 4 and 77% of grade 6
students. Students in this profile were uniformly accurate estimators across all fractions. Based
on the estimation patterns and students’ strategy reports, we concluded that relational estimators
considered the fraction as a whole unit and then estimated its magnitude in relation to equal
segments or implicit reference points. Relational estimators thus had both a solid conceptual
understanding of the fraction symbol and an accurate representation of the magnitude of the
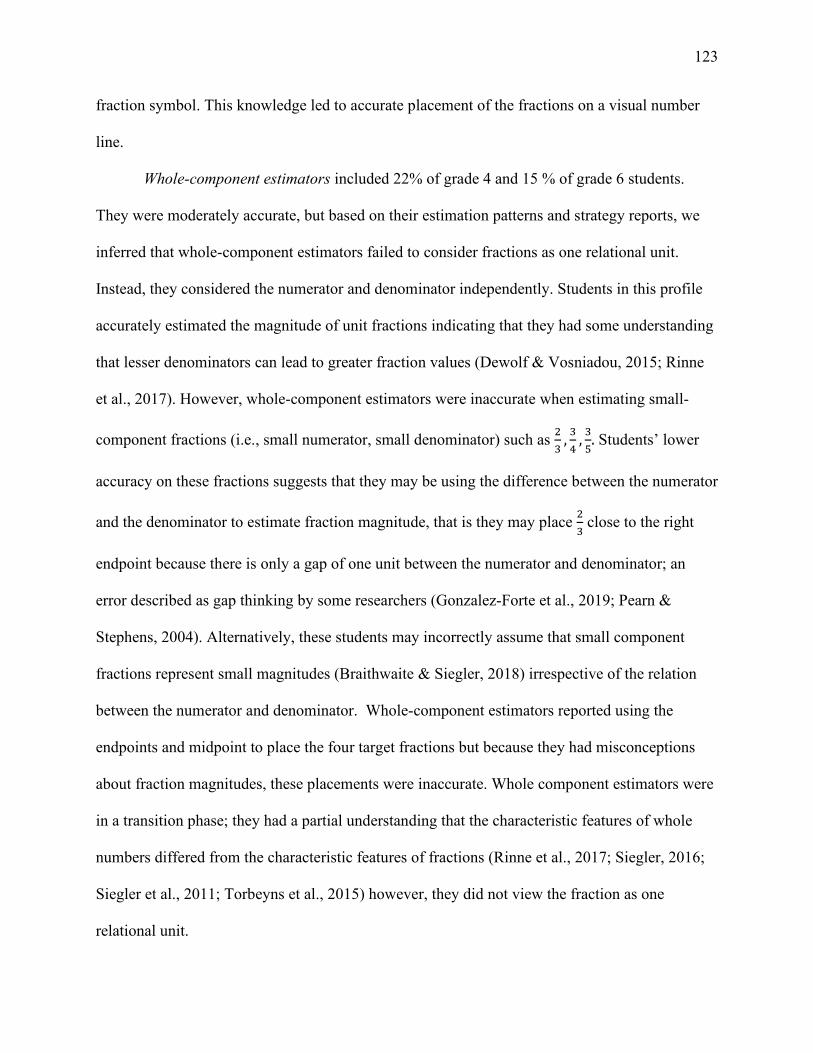
123
fraction symbol. This knowledge led to accurate placement of the fractions on a visual number
line.
Whole-component estimators included 22% of grade 4 and 15 % of grade 6 students.
They were moderately accurate, but based on their estimation patterns and strategy reports, we
inferred that whole-component estimators failed to consider fractions as one relational unit.
Instead, they considered the numerator and denominator independently. Students in this profile
accurately estimated the magnitude of unit fractions indicating that they had some understanding
that lesser denominators can lead to greater fraction values (Dewolf & Vosniadou, 2015; Rinne
et al., 2017). However, whole-component estimators were inaccurate when estimating small-
component fractions (i.e., small numerator, small denominator) such as 23
, 34
, 35. Students’ lower
accuracy on these fractions suggests that they may be using the difference between the numerator
and the denominator to estimate fraction magnitude, that is they may place 23 close to the right
endpoint because there is only a gap of one unit between the numerator and denominator; an
error described as gap thinking by some researchers (Gonzalez-Forte et al., 2019; Pearn &
Stephens, 2004). Alternatively, these students may incorrectly assume that small component
fractions represent small magnitudes (Braithwaite & Siegler, 2018) irrespective of the relation
between the numerator and denominator. Whole-component estimators reported using the
endpoints and midpoint to place the four target fractions but because they had misconceptions
about fraction magnitudes, these placements were inaccurate. Whole component estimators were
in a transition phase; they had a partial understanding that the characteristic features of whole
numbers differed from the characteristic features of fractions (Rinne et al., 2017; Siegler, 2016;
Siegler et al., 2011; Torbeyns et al., 2015) however, they did not view the fraction as one
relational unit.
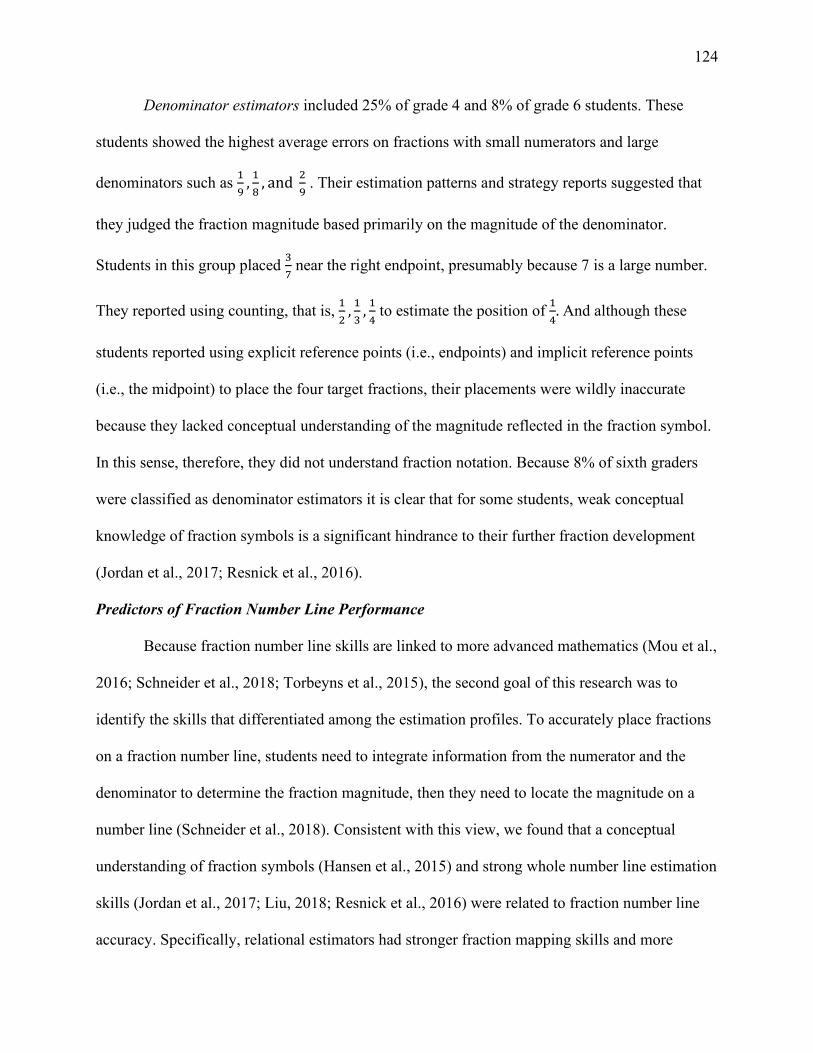
124
Denominator estimators included 25% of grade 4 and 8% of grade 6 students. These
students showed the highest average errors on fractions with small numerators and large
denominators such as 19
, 18
, and 29 . Their estimation patterns and strategy reports suggested that
they judged the fraction magnitude based primarily on the magnitude of the denominator.
Students in this group placed 37 near the right endpoint, presumably because 7 is a large number.
They reported using counting, that is, 12
, 13
, 14 to estimate the position of 1
4. And although these
students reported using explicit reference points (i.e., endpoints) and implicit reference points
(i.e., the midpoint) to place the four target fractions, their placements were wildly inaccurate
because they lacked conceptual understanding of the magnitude reflected in the fraction symbol.
In this sense, therefore, they did not understand fraction notation. Because 8% of sixth graders
were classified as denominator estimators it is clear that for some students, weak conceptual
knowledge of fraction symbols is a significant hindrance to their further fraction development
(Jordan et al., 2017; Resnick et al., 2016).
Predictors of Fraction Number Line Performance
Because fraction number line skills are linked to more advanced mathematics (Mou et al.,
2016; Schneider et al., 2018; Torbeyns et al., 2015), the second goal of this research was to
identify the skills that differentiated among the estimation profiles. To accurately place fractions
on a fraction number line, students need to integrate information from the numerator and the
denominator to determine the fraction magnitude, then they need to locate the magnitude on a
number line (Schneider et al., 2018). Consistent with this view, we found that a conceptual
understanding of fraction symbols (Hansen et al., 2015) and strong whole number line estimation
skills (Jordan et al., 2017; Liu, 2018; Resnick et al., 2016) were related to fraction number line
accuracy. Specifically, relational estimators had stronger fraction mapping skills and more
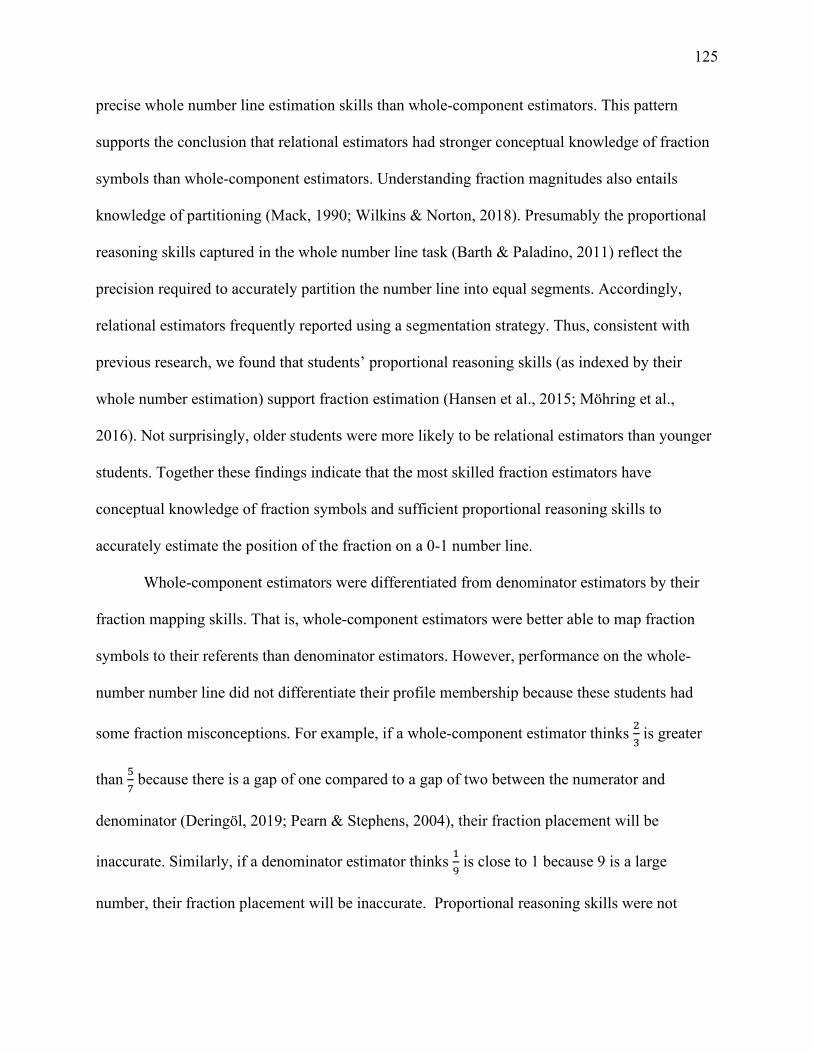
125
precise whole number line estimation skills than whole-component estimators. This pattern
supports the conclusion that relational estimators had stronger conceptual knowledge of fraction
symbols than whole-component estimators. Understanding fraction magnitudes also entails
knowledge of partitioning (Mack, 1990; Wilkins & Norton, 2018). Presumably the proportional
reasoning skills captured in the whole number line task (Barth & Paladino, 2011) reflect the
precision required to accurately partition the number line into equal segments. Accordingly,
relational estimators frequently reported using a segmentation strategy. Thus, consistent with
previous research, we found that students’ proportional reasoning skills (as indexed by their
whole number estimation) support fraction estimation (Hansen et al., 2015; Möhring et al.,
2016). Not surprisingly, older students were more likely to be relational estimators than younger
students. Together these findings indicate that the most skilled fraction estimators have
conceptual knowledge of fraction symbols and sufficient proportional reasoning skills to
accurately estimate the position of the fraction on a 0-1 number line.
Whole-component estimators were differentiated from denominator estimators by their
fraction mapping skills. That is, whole-component estimators were better able to map fraction
symbols to their referents than denominator estimators. However, performance on the whole-
number number line did not differentiate their profile membership because these students had
some fraction misconceptions. For example, if a whole-component estimator thinks 23 is greater
than 57 because there is a gap of one compared to a gap of two between the numerator and
denominator (Deringöl, 2019; Pearn & Stephens, 2004), their fraction placement will be
inaccurate. Similarly, if a denominator estimator thinks 19 is close to 1 because 9 is a large
number, their fraction placement will be inaccurate. Proportional reasoning skills were not
126
relevant in differentiating profile membership because magnitude knowledge was inaccurate for
both whole-component and denominator estimators.
In other research, strong arithmetic skills (Jordan et al., 2017; Resnick et al., 2016) were
also related to fraction number line estimation. Students with stronger arithmetic skills may have
more integrated whole-number knowledge (Siegler, 2016; Siegler et al., 2011; Xu et al., 2019)
which in turn, could support fraction development. Further, students with stronger arithmetic
skills may be more successful at transforming fractions into a number representation that is
easier to estimate [e.g., transforming 15 into a decimal (0.20) or a percentage (20%)] resulting in
more successful number line estimation (Siegler et al., 2011). In contrast, in the present research,
arithmetic skills did not differentiate between estimation profiles. Resnick et al. (2016) found
that whole number knowledge (whole number line estimation and multiplication fluency)
predicted the transition from inaccurate to accurate fraction number line estimation. I offer two
explanations for the differences between their work and the present research. First, because
multiplication fluency performance was poor for our fourth-grade participants, we used a
combined measure of addition, subtraction and multiplication in the regressions. That said, I ran
the regressions with the multiplication scores and the results were unchanged. Thus, a more
likely explanation is strategy use. Strategy reports indicated that few students used arithmetic to
transform fractions when placing them on the number line. Based on the curriculum
expectations, our participants had limited exposure to transformation algorithms, hence,
arithmetic may not differentiate their estimation patterns.
Limitations and Future Research
The present study provides valuable information about how students approach the
fraction number line task. Nonetheless, the study is not without its limitations. First, although
127
this study provided a detailed account of students’ fraction number line estimation, there was no
measure of students’ fraction comparison skills. Charalambous et al. (2007) suggested that
fraction comparison skills are part of a knowledge continuum goes from understanding fractions
as part-whole relations to understanding fractions as units of measure that can be placed on a
number line. Recognizing for example, that 23 > 1
4 may help students accurately place 2
3 on the
number line. Thus, future work could include fraction comparison skills as a predictor of
estimation profiles. Second, I only examined students’ fraction estimation at one time point.
Thus, could not provide insights into the skills that predict changes in estimation profiles. In the
future, statistical analyses such as latent transition analysis could be used to determine which
skills predict the transition from denominator to whole-component estimator or whole-
component to relational estimator. Further, longitudinal research could also provide insights into
the consistency of fraction estimation patterns (e.g., are the number and types of estimation
profiles stable over grades). Thus, future longitudinal research that examines changes in
estimation profiles could provide a more complete picture of students’ estimation strategies and
their understanding of fractions.
Educational Implications
The current research is the first study, to our knowledge, to examine item-based PAE
fraction number line estimation profiles amongst students in fourth and sixth grades. Previous
research shows that fraction number lines are challenging for students (Liu, 2018; Schneider et
al., 2018; Siegler et al., 2011; Torbeyns et al., 2015; D. Zhang et al., 2017) in part, because
students may have misconceptions about fraction symbols and their representations (Braithwaite
& Siegler, 2018; Mack, 1995; Ni & Zhou, 2005; Tunç-Pekkan, 2015; Vamvakoussi, 2015).
Consistent with previous research, the findings of the current study show larger gaps in
128
conceptual fraction knowledge amongst younger students compared to older students
(Braithwaite & Siegler, 2018). However, some older students continue to struggle with basic
knowledge of fractions and their representations. Specifically, understanding fractions as a
relational unit as opposed to two independent numbers. Importantly, students require sufficient
understanding of the relations between fraction symbols and their referents (Liu, 2018) to
develop their fraction estimation skills. Thus, helping struggling students learn to connect
fraction symbols with their referents may be a critical first step in students’ development of
fraction magnitude knowledge.
129
CHAPTER 7: GENERAL DISCUSSION
In this dissertation, I proposed that fraction mapping is an important factor in conceptual
fraction knowledge. The development of mathematical skills are hierarchical whereby earlier
skills are the building blocks for higher-level skills (Cirino et al., 2016; Hiebert, 1988; Siegler &
Lortie-Forgues, 2017; Xu et al., 2019). Previous research has suggested a fraction skill hierarchy
such that whole-number skills support students’ understanding of fraction magnitudes which, in
turn, allows them to acquire other fraction skills (Siegler, 2016; Siegler et al., 2011; Siegler &
Braithwaite, 2017). However, this hierarchy does not account for basic symbol knowledge; that
is, knowledge of what the fraction symbol represents. A student cannot reason about fractions or
place fractions on a number line without knowing what the fraction stands for, that is, linking the
symbol to the magnitude it represents. Thus, the present research was built upon the view that in
the mathematical skill hierarchy, the basic building block for developing formal fraction skills is
the fraction symbol (Hiebert, 1988).
In any symbolic system, knowledge of what the symbol represents; that is, being able to
connect the symbol to its referents, is foundational. For example, learning to read involves
mapping letters to their sounds. Early readers need to learn that letters and letter combinations
are linked to specific sounds and then apply that knowledge to interpret text (Castles et al.,
2018). Similarly, learning to play music from symbols involves mapping musical notation to the
keys on a piano. To acquire mathematical knowledge, learners first need to map numbers to their
referents (Hurst et al., 2017; Jiménez Lira et al., 2017). Math symbols are also linked to words
and importantly, are grounded in meaning; numbers represent magnitudes. Early math learners
recognize that numbers are linked to magnitudes and that knowledge is foundational for
arithmetic skills (Hiebert, 1988; Vanbinst et al., 2016; Xu et al., 2019). Thus, connecting the
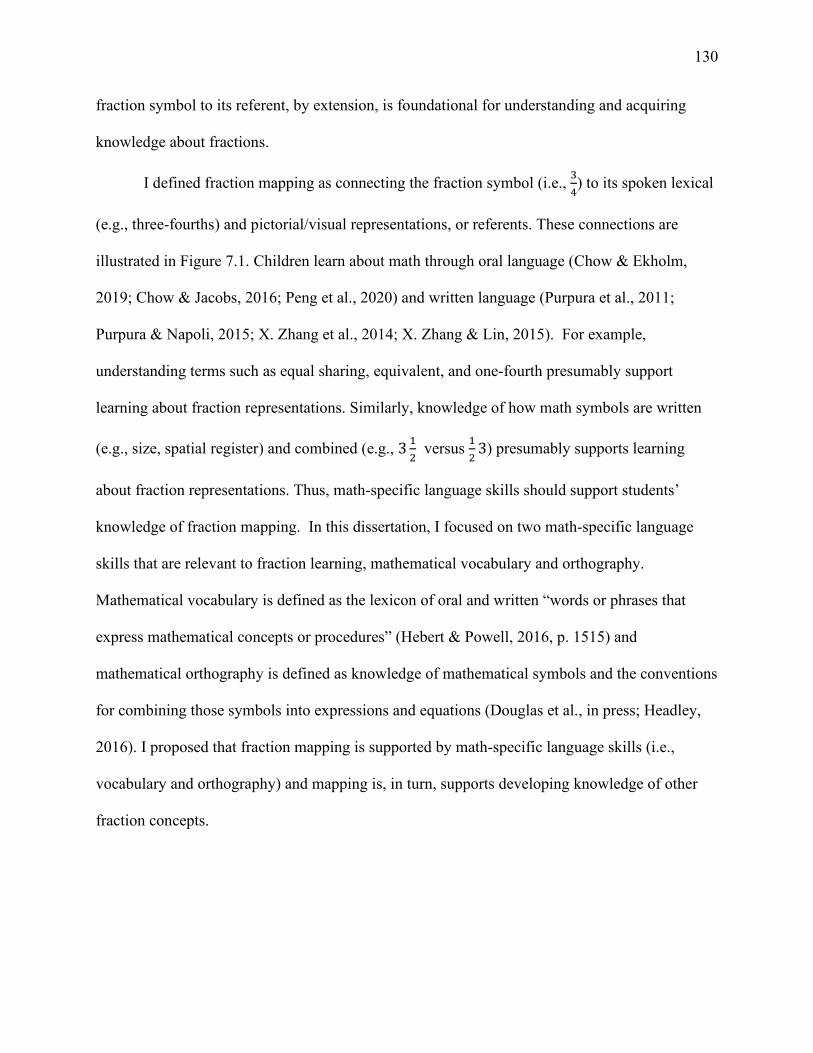
130
fraction symbol to its referent, by extension, is foundational for understanding and acquiring
knowledge about fractions.
I defined fraction mapping as connecting the fraction symbol (i.e., 34) to its spoken lexical
(e.g., three-fourths) and pictorial/visual representations, or referents. These connections are
illustrated in Figure 7.1. Children learn about math through oral language (Chow & Ekholm,
2019; Chow & Jacobs, 2016; Peng et al., 2020) and written language (Purpura et al., 2011;
Purpura & Napoli, 2015; X. Zhang et al., 2014; X. Zhang & Lin, 2015). For example,
understanding terms such as equal sharing, equivalent, and one-fourth presumably support
learning about fraction representations. Similarly, knowledge of how math symbols are written
(e.g., size, spatial register) and combined (e.g., 3 12 versus 1
23) presumably supports learning
about fraction representations. Thus, math-specific language skills should support students’
knowledge of fraction mapping. In this dissertation, I focused on two math-specific language
skills that are relevant to fraction learning, mathematical vocabulary and orthography.
Mathematical vocabulary is defined as the lexicon of oral and written “words or phrases that
express mathematical concepts or procedures” (Hebert & Powell, 2016, p. 1515) and
mathematical orthography is defined as knowledge of mathematical symbols and the conventions
for combining those symbols into expressions and equations (Douglas et al., in press; Headley,
2016). I proposed that fraction mapping is supported by math-specific language skills (i.e.,
vocabulary and orthography) and mapping is, in turn, supports developing knowledge of other
fraction concepts.
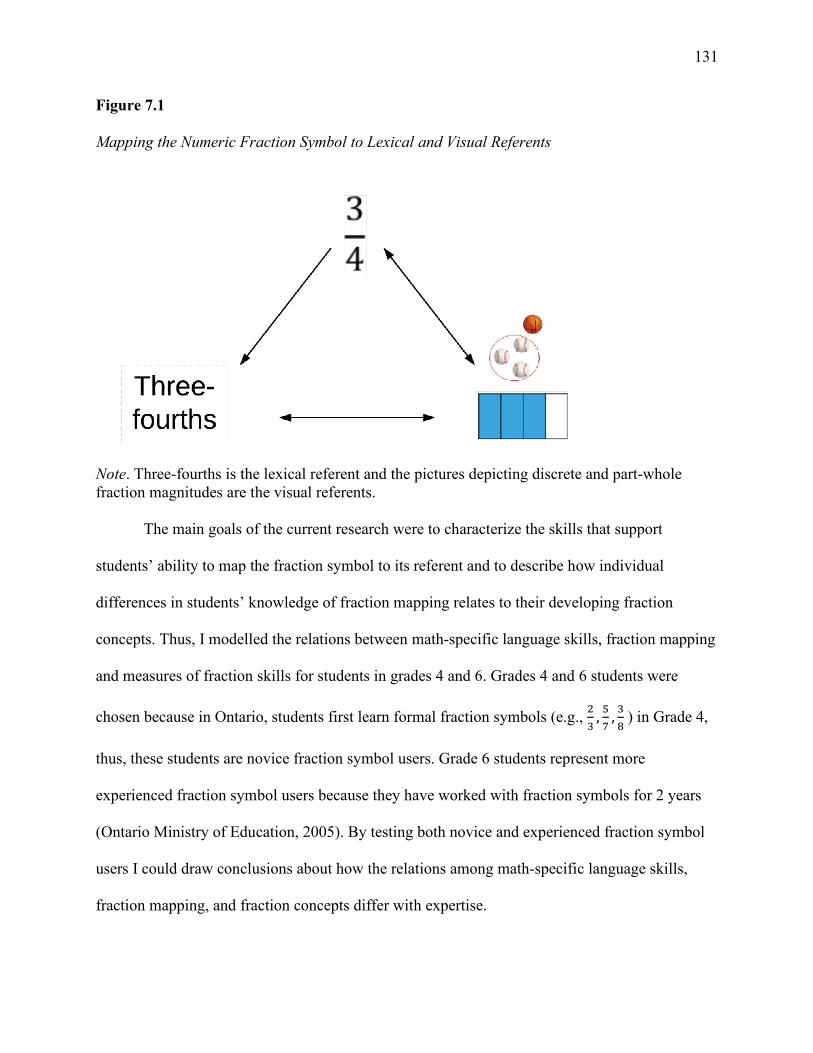
131
Figure 7.1
Mapping the Numeric Fraction Symbol to Lexical and Visual Referents
Note. Three-fourths is the lexical referent and the pictures depicting discrete and part-whole fraction magnitudes are the visual referents.
The main goals of the current research were to characterize the skills that support
students’ ability to map the fraction symbol to its referent and to describe how individual
differences in students’ knowledge of fraction mapping relates to their developing fraction
concepts. Thus, I modelled the relations between math-specific language skills, fraction mapping
and measures of fraction skills for students in grades 4 and 6. Grades 4 and 6 students were
chosen because in Ontario, students first learn formal fraction symbols (e.g., 23
, 57
, 38 ) in Grade 4,
thus, these students are novice fraction symbol users. Grade 6 students represent more
experienced fraction symbol users because they have worked with fraction symbols for 2 years
(Ontario Ministry of Education, 2005). By testing both novice and experienced fraction symbol
users I could draw conclusions about how the relations among math-specific language skills,
fraction mapping, and fraction concepts differ with expertise.
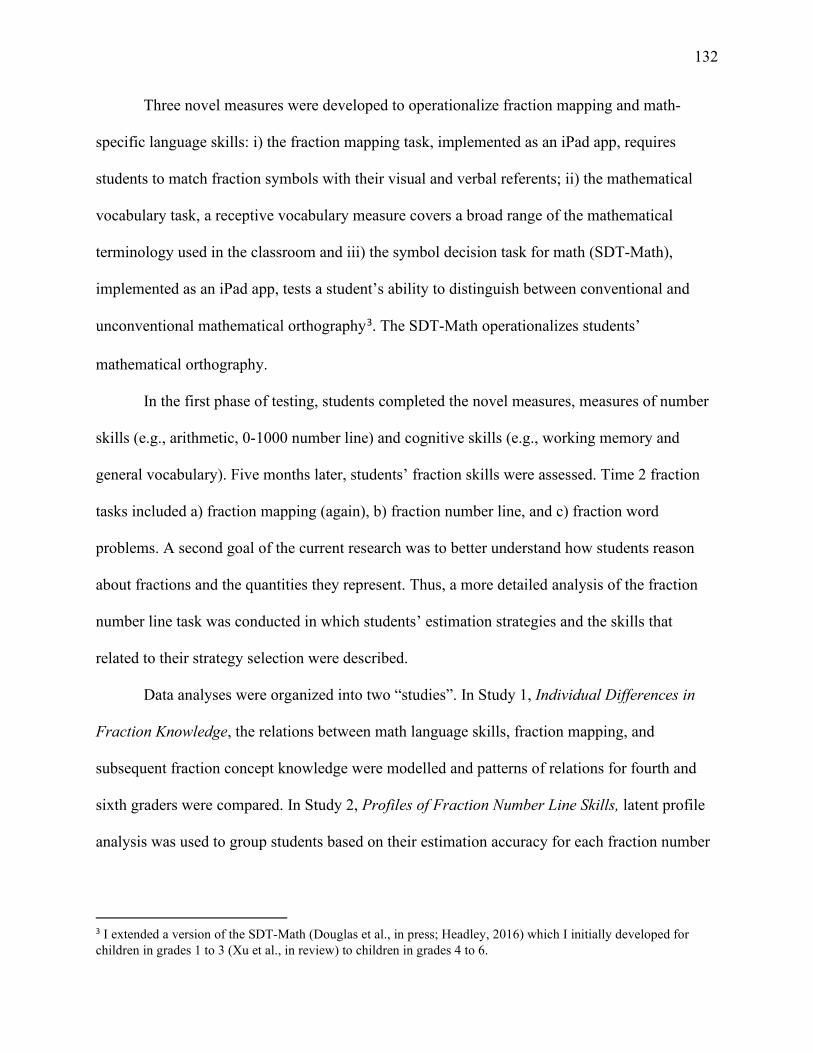
132
Three novel measures were developed to operationalize fraction mapping and math-
specific language skills: i) the fraction mapping task, implemented as an iPad app, requires
students to match fraction symbols with their visual and verbal referents; ii) the mathematical
vocabulary task, a receptive vocabulary measure covers a broad range of the mathematical
terminology used in the classroom and iii) the symbol decision task for math (SDT-Math),
implemented as an iPad app, tests a student’s ability to distinguish between conventional and
unconventional mathematical orthography3. The SDT-Math operationalizes students’
mathematical orthography.
In the first phase of testing, students completed the novel measures, measures of number
skills (e.g., arithmetic, 0-1000 number line) and cognitive skills (e.g., working memory and
general vocabulary). Five months later, students’ fraction skills were assessed. Time 2 fraction
tasks included a) fraction mapping (again), b) fraction number line, and c) fraction word
problems. A second goal of the current research was to better understand how students reason
about fractions and the quantities they represent. Thus, a more detailed analysis of the fraction
number line task was conducted in which students’ estimation strategies and the skills that
related to their strategy selection were described.
Data analyses were organized into two “studies”. In Study 1, Individual Differences in
Fraction Knowledge, the relations between math language skills, fraction mapping, and
subsequent fraction concept knowledge were modelled and patterns of relations for fourth and
sixth graders were compared. In Study 2, Profiles of Fraction Number Line Skills, latent profile
analysis was used to group students based on their estimation accuracy for each fraction number
3 I extended a version of the SDT-Math (Douglas et al., in press; Headley, 2016) which I initially developed for children in grades 1 to 3 (Xu et al., in review) to children in grades 4 to 6.
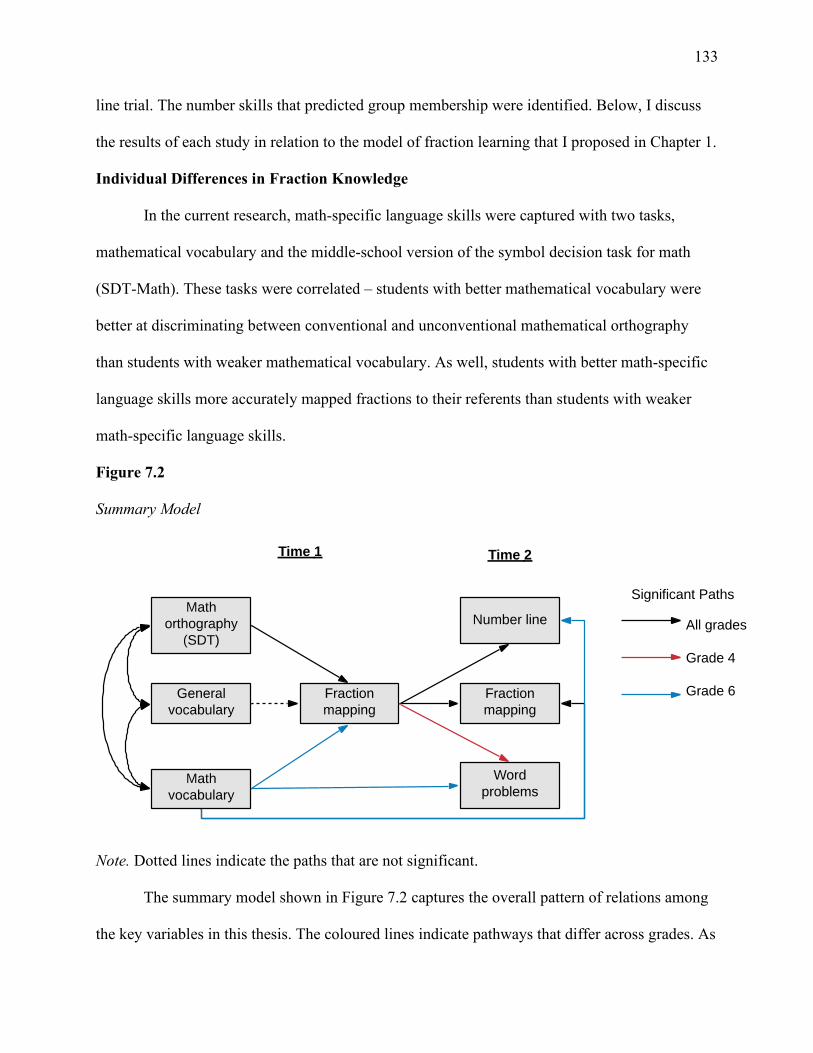
133
line trial. The number skills that predicted group membership were identified. Below, I discuss
the results of each study in relation to the model of fraction learning that I proposed in Chapter 1.
Individual Differences in Fraction Knowledge
In the current research, math-specific language skills were captured with two tasks,
mathematical vocabulary and the middle-school version of the symbol decision task for math
(SDT-Math). These tasks were correlated – students with better mathematical vocabulary were
better at discriminating between conventional and unconventional mathematical orthography
than students with weaker mathematical vocabulary. As well, students with better math-specific
language skills more accurately mapped fractions to their referents than students with weaker
math-specific language skills.
Figure 7.2
Summary Model
Note. Dotted lines indicate the paths that are not significant.
The summary model shown in Figure 7.2 captures the overall pattern of relations among
the key variables in this thesis. The coloured lines indicate pathways that differ across grades. As
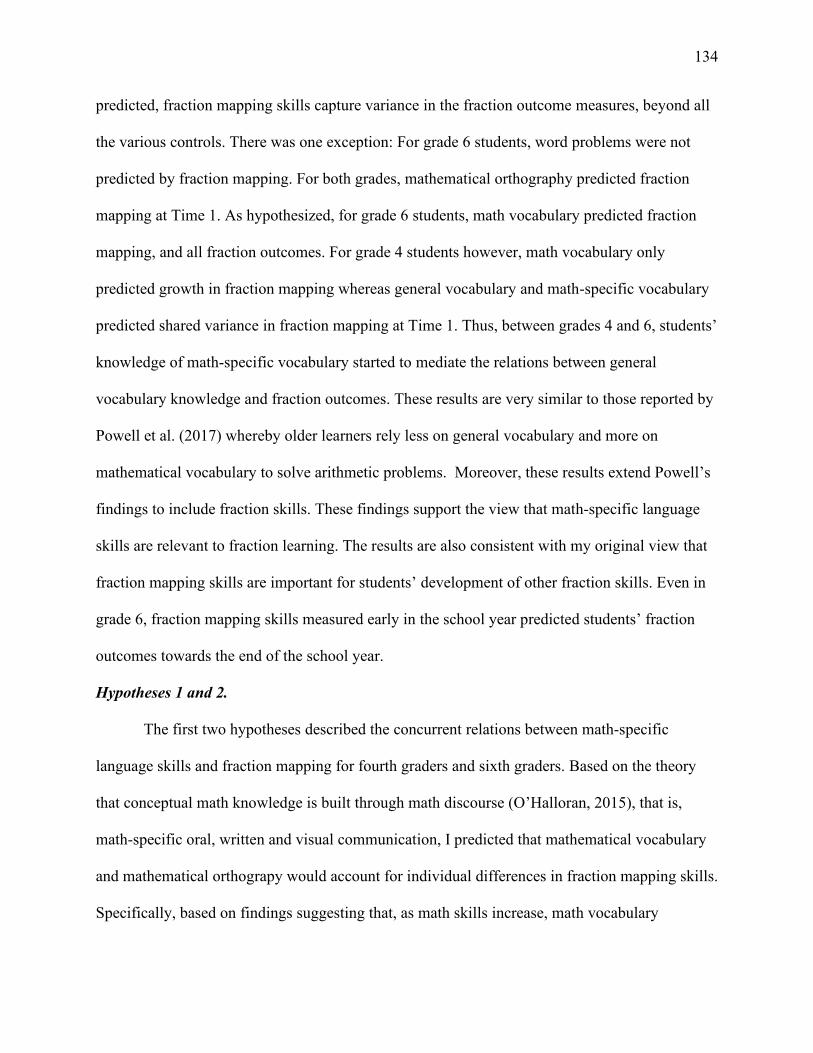
134
predicted, fraction mapping skills capture variance in the fraction outcome measures, beyond all
the various controls. There was one exception: For grade 6 students, word problems were not
predicted by fraction mapping. For both grades, mathematical orthography predicted fraction
mapping at Time 1. As hypothesized, for grade 6 students, math vocabulary predicted fraction
mapping, and all fraction outcomes. For grade 4 students however, math vocabulary only
predicted growth in fraction mapping whereas general vocabulary and math-specific vocabulary
predicted shared variance in fraction mapping at Time 1. Thus, between grades 4 and 6, students’
knowledge of math-specific vocabulary started to mediate the relations between general
vocabulary knowledge and fraction outcomes. These results are very similar to those reported by
Powell et al. (2017) whereby older learners rely less on general vocabulary and more on
mathematical vocabulary to solve arithmetic problems. Moreover, these results extend Powell’s
findings to include fraction skills. These findings support the view that math-specific language
skills are relevant to fraction learning. The results are also consistent with my original view that
fraction mapping skills are important for students’ development of other fraction skills. Even in
grade 6, fraction mapping skills measured early in the school year predicted students’ fraction
outcomes towards the end of the school year.
Hypotheses 1 and 2.
The first two hypotheses described the concurrent relations between math-specific
language skills and fraction mapping for fourth graders and sixth graders. Based on the theory
that conceptual math knowledge is built through math discourse (O’Halloran, 2015), that is,
math-specific oral, written and visual communication, I predicted that mathematical vocabulary
and mathematical orthograpy would account for individual differences in fraction mapping skills.
Specifically, based on findings suggesting that, as math skills increase, math vocabulary
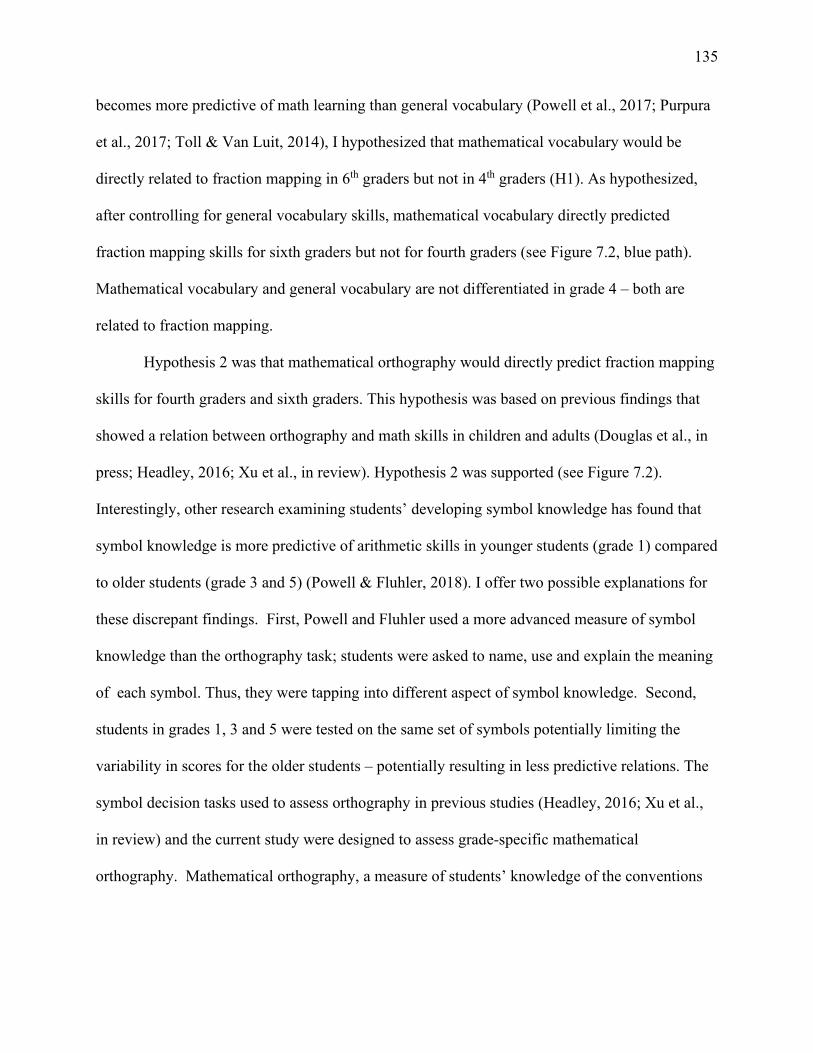
135
becomes more predictive of math learning than general vocabulary (Powell et al., 2017; Purpura
et al., 2017; Toll & Van Luit, 2014), I hypothesized that mathematical vocabulary would be
directly related to fraction mapping in 6th graders but not in 4th graders (H1). As hypothesized,
after controlling for general vocabulary skills, mathematical vocabulary directly predicted
fraction mapping skills for sixth graders but not for fourth graders (see Figure 7.2, blue path).
Mathematical vocabulary and general vocabulary are not differentiated in grade 4 – both are
related to fraction mapping.
Hypothesis 2 was that mathematical orthography would directly predict fraction mapping
skills for fourth graders and sixth graders. This hypothesis was based on previous findings that
showed a relation between orthography and math skills in children and adults (Douglas et al., in
press; Headley, 2016; Xu et al., in review). Hypothesis 2 was supported (see Figure 7.2).
Interestingly, other research examining students’ developing symbol knowledge has found that
symbol knowledge is more predictive of arithmetic skills in younger students (grade 1) compared
to older students (grade 3 and 5) (Powell & Fluhler, 2018). I offer two possible explanations for
these discrepant findings. First, Powell and Fluhler used a more advanced measure of symbol
knowledge than the orthography task; students were asked to name, use and explain the meaning
of each symbol. Thus, they were tapping into different aspect of symbol knowledge. Second,
students in grades 1, 3 and 5 were tested on the same set of symbols potentially limiting the
variability in scores for the older students – potentially resulting in less predictive relations. The
symbol decision tasks used to assess orthography in previous studies (Headley, 2016; Xu et al.,
in review) and the current study were designed to assess grade-specific mathematical
orthography. Mathematical orthography, a measure of students’ knowledge of the conventions
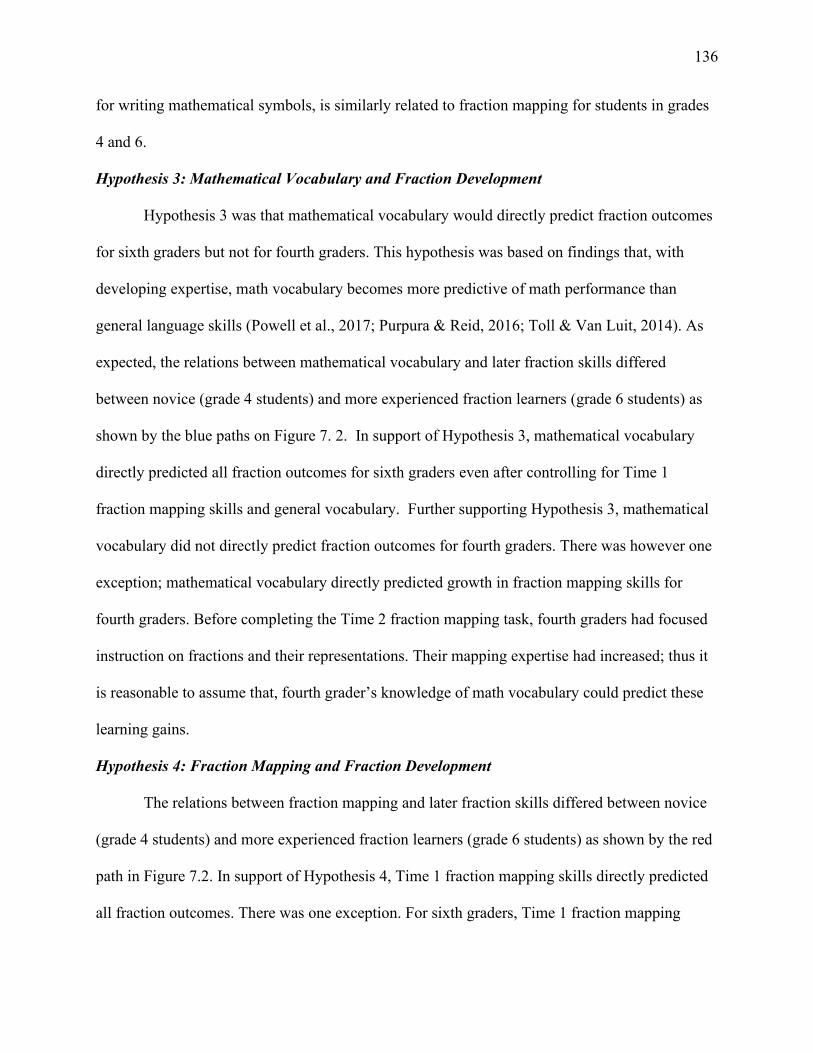
136
for writing mathematical symbols, is similarly related to fraction mapping for students in grades
4 and 6.
Hypothesis 3: Mathematical Vocabulary and Fraction Development
Hypothesis 3 was that mathematical vocabulary would directly predict fraction outcomes
for sixth graders but not for fourth graders. This hypothesis was based on findings that, with
developing expertise, math vocabulary becomes more predictive of math performance than
general language skills (Powell et al., 2017; Purpura & Reid, 2016; Toll & Van Luit, 2014). As
expected, the relations between mathematical vocabulary and later fraction skills differed
between novice (grade 4 students) and more experienced fraction learners (grade 6 students) as
shown by the blue paths on Figure 7. 2. In support of Hypothesis 3, mathematical vocabulary
directly predicted all fraction outcomes for sixth graders even after controlling for Time 1
fraction mapping skills and general vocabulary. Further supporting Hypothesis 3, mathematical
vocabulary did not directly predict fraction outcomes for fourth graders. There was however one
exception; mathematical vocabulary directly predicted growth in fraction mapping skills for
fourth graders. Before completing the Time 2 fraction mapping task, fourth graders had focused
instruction on fractions and their representations. Their mapping expertise had increased; thus it
is reasonable to assume that, fourth grader’s knowledge of math vocabulary could predict these
learning gains.
Hypothesis 4: Fraction Mapping and Fraction Development
The relations between fraction mapping and later fraction skills differed between novice
(grade 4 students) and more experienced fraction learners (grade 6 students) as shown by the red
path in Figure 7.2. In support of Hypothesis 4, Time 1 fraction mapping skills directly predicted
all fraction outcomes. There was one exception. For sixth graders, Time 1 fraction mapping
137
skills did not directly performance on the fraction word problems. Moreover, the strength of the
relation between Time 1 fraction mapping and the fraction number line outcome (although
significant for both groups) was stronger for fourth graders than sixth graders. These findings
suggest that although fraction mapping skills are central for developing knowledge of fraction
concepts, the relation between fraction mapping and fraction concept skills may change with
expertise.
Profiles of Fraction Number Line Skills
The fraction number line has been recommended as a teaching tool to improve students’
understanding of fractions and the quantities they represent (e.g., Bruce et al., 2013; Common
Core State Standards Initiative, 2010; Gersten et al., 2017; Ontario Ministry of Education, 2005;
Siegler et al., 2010; Torbeyns et al., 2015). Thus, understanding how students estimate fractions
on the number line can provide insights into their understanding fractions and the quantities they
represent. For example, students may incorrectly place 68 closer to the right endpoint on a 0-1
number line than 34 because 6
8 has larger components (i.e., 6 and 8 are greater than 3 and 4) in
spite of the fractions being equivalent (Braithwaite & Siegler, 2018). Or students may incorrectly
place 18 near the right endpoint because 8 is a large number indicating that the student is only
considering the value of the denominator (Ni & Zhou, 2005). Both these examples reflect poor
understanding of fraction representations. The goal for Study 2 was to explore strategy use on
fraction number line to better understand how students reason about fractions and the quantities
they represent.
In Study 2, latent profile analysis was used to categorize groups of students based on their
patterns of performance on the fraction number line. Students’ verbal strategy reports supported
the profile analysis. Relational estimators accurately placed fractions on the number line and
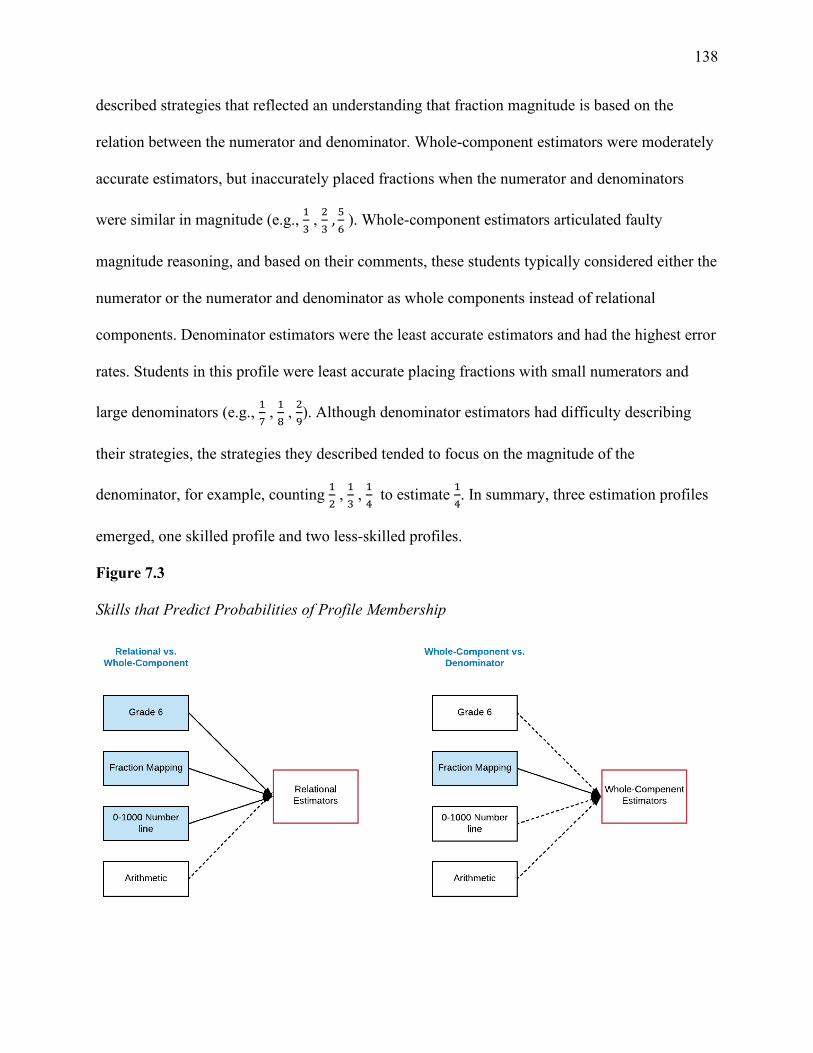
138
described strategies that reflected an understanding that fraction magnitude is based on the
relation between the numerator and denominator. Whole-component estimators were moderately
accurate estimators, but inaccurately placed fractions when the numerator and denominators
were similar in magnitude (e.g., 13 , 23 , 56 ). Whole-component estimators articulated faulty
magnitude reasoning, and based on their comments, these students typically considered either the
numerator or the numerator and denominator as whole components instead of relational
components. Denominator estimators were the least accurate estimators and had the highest error
rates. Students in this profile were least accurate placing fractions with small numerators and
large denominators (e.g., 17 , 18 , 29). Although denominator estimators had difficulty describing
their strategies, the strategies they described tended to focus on the magnitude of the
denominator, for example, counting 12 , 13 , 14 to estimate 1
4. In summary, three estimation profiles
emerged, one skilled profile and two less-skilled profiles.
Figure 7.3
Skills that Predict Probabilities of Profile Membership
139
Note. Solid lines indicate odds ratio predicting profile membership was significantly different
than 1. Dotted lines indicate the odds ratio predicting profile membership was not significant
What skills differentiated profile membership? Results are summarized in Figure 7.3.
Compared to whole component estimators, relational estimators were more likely to be in sixth
grade, have better fraction mapping skills and have more accurate whole number line estimation
skills. Arithmetic skills did not differentiate these groups. Compared to denominator estimators,
whole component estimators did not differ on arithmetic, whole number estimation, or grade.
The only significant differentiator of profile membership was fraction mapping skills; whole-
component estimators were more likely to have better fraction mapping skills than denominator
estimators. There are two conclusions we can draw from these findings. First, fraction
misconceptions can be robust. Grade did not differentiate membership between denominator and
whole-component estimators because a small portion of sixth graders had the same fraction
misconceptions as some fourth graders. Second, and most importantly, regardless of grade,
fraction mapping skills were necessary to successfully place fractions on the number line. Thus,
the present findings suggest that fraction mapping is essential knowledge for students’
developing fraction skills.
Theoretical Implications
Current theories of fraction learning focus on the transition from whole number
knowledge to fraction knowledge. The conceptual change view is that whole number knowledge
can hinder fraction learning (Ni & Zhou, 2005; Vamvakoussi et al., 2012; Vamvakoussi &
Vosniadou, 2004). Evidence for this view comes from research on whole number bias - errors
attributed to inappropriately applying whole number reasoning to fractions (Fazio et al., 2016;
Kainulainen et al., 2017; Mazzocco & Devlin, 2008; Ni & Zhou, 2005). In contrast, according to
140
continuous views of fraction learning, whole number knowledge provides the basic knowledge
required for fraction learning. More specifically, the integrated theory of numerical development
is based on the view that magnitude knowledge acts as unifying concept from whole numbers to
fractions (Lortie-Forgues et al., 2015; Siegler, 2016; Siegler et al., 2011) whereas the
reorganization hypothesis is that counting knowledge acts as the unifying concept (Steffe, 2002;
Steffe & Olive, 2010). In this thesis I took a step back and focused on the fraction symbol itself.
Rather than discarding theories on the transition from whole number knowledge and fraction
knowledge, the fraction mapping view I have proposed and tested extends those theories.
Previous research with young students provides evidence that mapping digits to their
referents is foundational for mathematical learning (Göbel et al., 2014; Jiménez Lira et al., 2017;
Merkley & Ansari, 2016; Nguyen et al., 2016). The current research extends this theoretical
perspective to fractions. To illustrate, fourth and sixth grader’s skill at mapping fractions to
visual representations directly predicted their performance on fraction outcomes (number line
estimation, growth in fraction mapping). Further, mapping skills differentiated how students
reasoned about fraction magnitudes as evidenced by the estimation profiles described in the
number line estimation study. Thus, the current research positions the fraction symbol as the
unifying concept and fraction mapping as the foundational skill for fraction learning.
The findings from the current research support the view that fraction mapping skills are
most relevant when students are developing their understanding of fraction concepts. With whole
numbers, once children have acquired sufficient knowledge of the underlying quantity the digit
represents, the symbol becomes abstracted; children can manipulate the symbols without
accessing the quantity referent (Hiebert, 1988; Merkley & Ansari, 2016; Siegler & Lortie-
Forgues, 2014). Mapping skills are no longer directly relevant (Szűcs et al., 2014). Instead, more
141
complex associations become the proximal predictors of advanced skills (Lyons et al., 2014;
Sasanguie & Vos, 2018; Xu et al., 2019). Similarly, I assumed that fraction mapping skills are
most relevant when students are first acquiring formal fraction knowledge. The finding that
fraction mapping skills were more strongly linked to fraction outcomes for fourth graders
compared to sixth graders supports this assumption. Moreover, the finding that fraction mapping
skills, not grade, differentiated fraction estimation amongst the least skilled estimators suggests
that fraction mapping skills are relevant for learners who are struggling to acquire fraction
knowledge. Based on these findings, educational practices that emphasize linking fraction
symbols with visual representations may help new and struggling fraction learners to succeed.
As students first learn about how conventional fraction symbols are interpreted, their
understanding of mathematical orthography (i.e. their knowledge of the conventions for notating
mathematical symbols) supports mapping fraction symbols to their visual representations. For
more experienced fraction learners, knowledge of mathematical vocabulary also supports
fraction mapping. Importantly, as expertise builds, math vocabulary becomes a stronger predictor
of fraction skills than knowledge of fraction mapping. Together these findings emphasize the
importance of how teachers write about and talk about fractions in the classroom.
Limitations and Future Research
The studies described in this dissertation provide valuable insights into how math
language skills and fraction mapping describe individual differences in developing knowledge of
fractions concepts. Nonetheless, the studies have some limitations which could be addressed with
further research. First, Study 1 included math-specific language skills (i.e., mathematical
vocabulary and mathematical orthography) whereas general vocabulary was the only domain-
general language skill included in the study. Other domain-general language skills may be
142
relevant, especially for younger students. For example, receptive syntax has been linked to
mathematical performance amongst students in first and second grade (Chow & Ekholm, 2019).
Thus, future studies should include domain-general language measures, for example of
orthography, to control for domain-general language skills.
Another limitation of this work is that only the most basic fraction symbol knowledge
was assessed. Based on the view that earlier symbol skills are the building blocks for higher-
level symbol skills (Cirino et al., 2016; Hiebert, 1988; Siegler & Lortie-Forgues, 2017; Xu et al.,
2019), it would be interesting to test the predictive relations amongst fraction mapping and more
advanced indices of fraction symbol knowledge such as fraction comparison and fraction
ordering. Although fraction comparison was included in this study, testing time was limited and
thus, there were too few comparison questions and response time was not measured thus
efficiency of access could not be assessed. More extensive longitudinal research on fraction
mapping and more advanced indices of fraction symbol knowledge are needed to draw
conclusions about the relations between fraction mapping and fraction development.
A third limitation is that causality cannot be inferred from the correlational approach used
in this thesis. My findings indicate that many students lack understanding of fraction mappings.
Intervention studies focused on practices that promote linking the fraction symbol to its referents
could provide further evidence on the causal relation between fraction mapping and fraction
skills. In other work for my thesis, I developed an online tutor that could be used to support
fraction learning (Di Lonardo Burr et al., in review). A wider variety of methods and approaches
are necessary to help educators understand and apply research to instructional situations.
Moreover, the data collected for this research includes item-level responses for a range of
143
fraction measures. Future research could include an in-depth analysis of student errors to help
characterize the patterns of errors observed in students with varying levels of fraction skill.
Can these results be generalized beyond the sample of students who participated? I
consider three potential levels of generalization: Extending to students in other school boards in
Ontario, extending to students in other English-speaking countries with similar school systems,
and extending to countries with other languages and/or other instructional systems. The sample
population in this study was drawn from a school board that draws students from both rural areas
and small towns. These children came from predominantly English-speaking families and, based
on parent education, they represented a range of socioeconomic conditions from moderate to
upper middle-class status. However, Ontario more generally has a culturally diverse population,
especially in the large population centres like Ottawa and Toronto. Studies which tap into this
more diverse group of students are necessary to establish whether the results generalize beyond
English-speaking families. I do note that Ontario received an “A” rating from the Organization
for Economic Co-operation and Development (OECD) on equity in math learning outcomes,
specifically, “the language spoken at home by immigrant students does not necessarily affect
their scores on the PISA math test” (Conference Board of Canada, 2014, para.1). Further support
that my findings can be extended across the province comes from findings that mathematical
performance is similar for younger (grades 2 and 3) Ontario students, both first and second
language learners (Xu et al., in review). However, it is nevertheless important to further test for
similar findings in diverse groups.
Do my results generalize to other Canadian provinces and to the United States?
Education is a provincial responsibility in Canada and thus, although in Ontario fraction symbols
are introduced in grade 4, in other provinces and in the United States, students start to use
144
fraction symbols in Grade 3. Thus, novice fraction learners in other provinces and countries may
be younger than the students in the current study. Although I anticipate that a similar pattern of
relations amongst novice and more experienced fraction learners would occur, this hypothesis
needs to be tested with younger students.
Finally, further research is necessary to determine if these results can be extended across
cultures which have different languages and different instructional systems. For example,
fraction naming is more transparent in East Asian languages than in English; “one-half” roughly
translates to “of two parts one” in Korean and thus verbal labels are very transparent in their
mapping to the symbols and the magnitudes. In English, consider that we use one quarter and
three-fourths whereas in Korean these would have the same structure, “of four parts one”, and
“of four parts three”. This more-transparent labelling helped children more accurately match
fraction symbols to their visual referents (Miura et al., 1999) and promoted knowledge of
fraction proportions (Mix & Paik, 2008). Thus, linguistic differences may influence the relations
among math-language skills, fraction mapping, and fraction outcomes. To summarize, the
current findings can be extended across the province and potentially across the country if
consideration is given to the age of participants and differences in the curriculum. Further
research is needed to generalize the results across cultures.
Practical Implications
Findings from the current research indicate that knowledge of mathematical vocabulary is
related to students’ understanding of fraction concepts. Language plays an important role in
fraction learning. Teachers communicate ideas using through language and children share ideas
through language. General vocabulary skills for example are related to knowledge of fraction
concepts (Hansen et al., 2017; Vukovic et al., 2014). Misunderstanding or misapplying academic
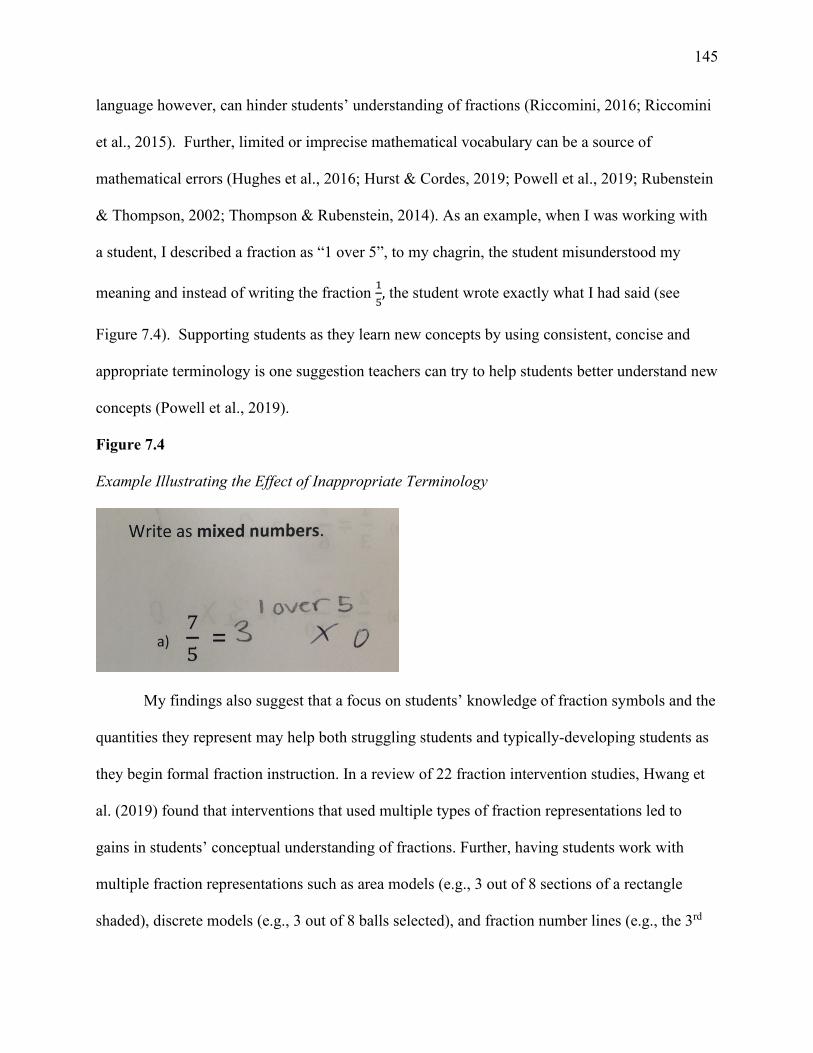
145
language however, can hinder students’ understanding of fractions (Riccomini, 2016; Riccomini
et al., 2015). Further, limited or imprecise mathematical vocabulary can be a source of
mathematical errors (Hughes et al., 2016; Hurst & Cordes, 2019; Powell et al., 2019; Rubenstein
& Thompson, 2002; Thompson & Rubenstein, 2014). As an example, when I was working with
a student, I described a fraction as “1 over 5”, to my chagrin, the student misunderstood my
meaning and instead of writing the fraction 15, the student wrote exactly what I had said (see
Figure 7.4). Supporting students as they learn new concepts by using consistent, concise and
appropriate terminology is one suggestion teachers can try to help students better understand new
concepts (Powell et al., 2019).
Figure 7.4
Example Illustrating the Effect of Inappropriate Terminology
My findings also suggest that a focus on students’ knowledge of fraction symbols and the
quantities they represent may help both struggling students and typically-developing students as
they begin formal fraction instruction. In a review of 22 fraction intervention studies, Hwang et
al. (2019) found that interventions that used multiple types of fraction representations led to
gains in students’ conceptual understanding of fractions. Further, having students work with
multiple fraction representations such as area models (e.g., 3 out of 8 sections of a rectangle
shaded), discrete models (e.g., 3 out of 8 balls selected), and fraction number lines (e.g., the 3rd
146
tick on a 0-1 number divided into eighths) is also recommended teaching practice (Ontario
Ministry of Education, 2005; Siegler et al., 2010). The present findings suggest that helping
students to understand why the symbolic version of these quantities is the same, even when the
models differ, may be important in helping them to acquire integrated representations.
There are two main contributions of the present research. First, this research is the first to
identify fraction mapping as core knowledge that students may need before they can acquire
further fraction concepts. Second, I developed and tested three new measures, each with strong
internal reliability and face and construct validity. These measures can be used by researchers to
replicate and extend the current findings. The fraction mapping task for example, can be used in
studies on the cognitive development of fraction skills. Moreover, the mathematical vocabulary
and orthography tasks can be used to examine the role of math-specific language skills in
multiple math domains. In my commitment to the Open Science movement, I have made these
measures available through https://osf.io/h47c2/ and https://carleton.ca/cacr/math-lab/apps/.
In summary, my research shows that students who experience difficulty acquiring
fraction concepts in the mid-to late-elementary grades have not mastered the mappings among
the symbolic, visual, and verbal fraction representations. The links between written symbols and
their visual representations are critical. These important connections are also supported by the
two other ways that magnitudes and symbols are linked, that is, between the written symbol and
the verbal description, and between the verbal description and the visual magnitude. For
teachers, targeting instruction to help students master these mappings is recommended. The
development of fully integrated representations which can be leveraged to support a variety of
tasks that involve fractions rests on students’ knowledge of how fraction symbols are connected
to magnitudes.
147
REFERENCES
Alibali, M. W., Crooks, N. M., & McNeil, N. M. (2018). Perceptual support promotes strategy
generation: Evidence from equation solving. The British Journal of Developmental
Psychology, 36(2), 153–168. https://doi.org/10.1111/bjdp.12203
Ashcraft, M. H., & Moore, A. M. (2012). Cognitive processes of numerical estimation in
children. Journal of Experimental Child Psychology, 111(2), 246–267.
https://doi.org/10.1016/j.jecp.2011.08.005
Astle, A., Kamawar, D., Vendetti, C., & Podjarny, G. (2013). When this means that: The role of
working memory and inhibitory control in children’s understanding of representations.
Journal of Experimental Child Psychology, 116(2), 169–185.
https://doi.org/10.1016/j.jecp.2013.05.003
Avgerinou, V. A., & Tolmie, A. (2019). Inhibition and cognitive load in fractions and decimals.
British Journal of Educational Psychology, bjep.12321. https://doi.org/10.1111/bjep.12321
Baddeley, A. D. (2000). The episodic buffer: A new component of working memory? In Trends
in Cognitive Sciences (Vol. 4, Issue 11, pp. 417–423). https://doi.org/10.1016/S1364-
6613(00)01538-2
Baddeley, A. D. (2003). Working memory: Looking back and looking forward. Nature Reviews
Neuroscience, 4(10), 829–839. https://doi.org/10.1038/nrn1201
Bailey, D. H., Hansen, N., & Jordan, N. C. (2017). The codevelopment of children’s fraction
arithmetic skill and fraction magnitude understanding. Journal of Educational Psychology,
109(4), 509–519. https://doi.org/10.1037/edu0000152
Bailey, D. H., Siegler, R. S., & Geary, D. C. (2014). Early predictors of middle school fraction
knowledge. Developmental Science, 17(5), 775–785. https://doi.org/10.1111/desc.12155
148
Bailey, D. H., Zhou, X., Zhang, Y., Cui, J., Fuchs, L. S., Jordan, N. C., Gersten, R., & Siegler, R.
S. (2015). Development of fraction concepts and procedures in U.S. and Chinese children.
Journal of Experimental Child Psychology, 129, 68–83.
https://doi.org/10.1016/j.jecp.2014.08.006
Barbieri, C. A., Rodrigues, J., Dyson, N., & Jordan, N. C. (2019). Improving fraction
understanding in sixth graders with mathematics difficulties: effects of a number line
approach combined with cognitive learning srategies. Journal of Educational Psychology,
June. https://doi.org/10.1037/edu0000384
Bardini, C., Pierce, R., & Vincent, J. (2015). Contemplating symbolic literacy of first year
mathematics students. Proceedings of the 38th Annual Conference of the Mathematics
Education Research Group of Australa, 77–84.
https://files.eric.ed.gov/fulltext/ED572419.pdf
Barth, H. C., & Paladino, A. M. (2011). The development of numerical estimation: Evidence
against a representational shift. Developmental Science, 14(1), 125–135.
https://doi.org/10.1111/j.1467-7687.2010.00962.x
Begolli, K. N., Booth, J. L., Holmes, C. A., & Newcombe, N. S. (2020). How many apples make
a quarter? The challenge of discrete proportional formats. Journal of Experimental Child
Psychology, 192. https://doi.org/10.1016/j.jecp.2019.104774
Behr, M. J., Lesh, R., Post, T. R., & Silver, E. A. (1983). Rational number concepts. In R. Lesh
& M. Landau (Eds.), Acquisition of Mathematics Concepts and Processes (pp. 91–125).
Academic Press.
Booth, J. L., & Newton, K. J. (2012). Fractions: Could they really be the gatekeeper’s doorman?
Contemporary Educational Psychology, 37(4), 247–253.
149
https://doi.org/10.1016/j.cedpsych.2012.07.001
Bouwmeester, S., & Verkoeijen, P. P. J. L. (2012). Multiple representations in number line
estimation: A developmental shift or classes of representations? Cognition and Instruction,
30(3), 246–260. https://doi.org/10.1080/07370008.2012.689384
Braithwaite, D. W., & Siegler, R. S. (2018). Developmental changes in the whole number bias.
Developmental Science, 21(2), e12541. https://doi.org/10.1111/desc.12541
Brankaer, C., Ghesquière, P., & De Smedt, B. (2014). Children’s mapping between non-
symbolic and symbolic numerical magnitudes and its association with timed and untimed
tests of mathematics achievement. PLoS ONE, 9(4).
https://doi.org/10.1371/journal.pone.0093565
Brizuela, B. M. (2006). Young Children’s Notations for Fractions. Source: Educational Studies
in Mathematics, 6211710(3), 281–305. http://www.jstor.org/stable/25472103
Brousseau, G., Brousseau, N., & Warfield, V. (2004). Rationals and decimals as required in the
school curriculum. Part I: Rationals as measurement. Journal of Mathematical Behavior,
23(1), 1–20. https://doi.org/10.1016/j.jmathb.2003.12.001
Bruce, C., Chang, D., & Flynn, T. (2013). Foundations to learning and teaching fractions :
Addition and subtraction literature review. Ontario Ministry of Education, Curriculum and
Assessment Branch, 1–53.
Bruce, C., Flynn, T., & Yearley, S. (2018). Fractions Learning Pathways.
http://www.fractionslearningpathways.ca
Bugden, S., & Ansari, D. (2011). Individual differences in children’s mathematical competence
are related to the intentional but not automatic processing of Arabic numerals. Cognition,
118(1), 35–47. https://doi.org/10.1016/j.cognition.2010.09.005
150
Case, R., Okamoto, Y., Griffin, S., McKeough, A., Bleiker, C., Henderson, B., Stephenson, K.
M., Siegler, R. S., & Keating, D. P. (1996). The role of central conceptual structures in the
development of children’s thought. Monographs of the Society for Research in Child
Development, 61(1/2), i–295. https://doi.org/10.4135/9781452286143.n496
Castles, A., Rastle, K., & Nation, K. (2018). Ending the reading wars: Reading acquisition from
novice to expert. Psychological Science in the Public Interest, 19(1), 5–51.
Charalambous, Y. C., & Pitta-Pantazi, D. (2007). Drawing on a theoretical model to study
stduents’ understanding of fractions. Educational Studies in Mathematics, 64, 293–316.
https://doi.org/10.1007/s10649-006-9036-2
Chow, J. C., & Ekholm, E. (2019). Language domains differentially predict mathematics
performance in young children. Early Childhood Research Quarterly, 46, 179–186.
https://doi.org/10.1016/j.ecresq.2018.02.011
Chow, J. C., & Jacobs, M. (2016). The role of language in fraction performance: A synthesis of
literature. Learning and Individual Differences, 47, 252–257.
https://doi.org/10.1016/j.lindif.2015.12.017
Cirino, P. T. (2011). The interrelationships of mathematical precursors in kindergarten. Journal
of Experimental Child Psychology, 108, 713–733.
https://doi.org/10.1016/j.jecp.2010.11.004
Cirino, P. T., Tolar, T. D., Fuchs, L. S., & Huston-Warren, E. (2016). Cognitive and numerosity
predictors of mathematical skills in middle school. Journal of Experimental Child
Psychology, 145, 95–119. https://doi.org/10.1016/j.jecp.2015.12.010
Common Core State Standards Initiative. (2010). Common Core State Standards for
Mathematics.
151
Conference Board of Canada. (2014, June). Equity in learning outcomes.
https://www.conferenceboard.ca/hcp/provincial/education/equity.aspx
Crooks, N. M., & Alibali, M. W. (2013). Noticing relevant problem features: Activating prior
knowledge affects problem solving by guiding encoding. Frontiers in Psychology, 4(NOV).
https://doi.org/10.3389/fpsyg.2013.00884
Crooks, N. M., & Alibali, M. W. (2014). Defining and measuring conceptual knowledge in
mathematics. Developmental Review, 34(4), 344–377.
https://doi.org/10.1016/j.dr.2014.10.001
Deringöl, Y. (2019). Misconceptions of primary school students about the subject of fractions.
International Journal of Evaluation and Research in Education (IJERE), 8(1), 29–38.
https://doi.org/10.11591/ijere.v8.i1.pp29-38
Dewolf, M., & Vosniadou, S. (2015). The representation of fraction magnitudes and the whole
number bias reconsidered. Learning and Instruction, 37, 39–49.
https://doi.org/10.1016/j.learninstruc.2014.07.002
Di Lonardo Burr, S., Douglas, H., Vorobeva, M., & Muldner, K. (n.d.). Refuting misconceptions:
Computer tutors for fraction arithmetic.
Di Lonardo, S. M., Huebner, M. G., Newman, K., & LeFevre, J. A. (2020). Fixated in unfamiliar
territory: Mapping estimates across typical and atypical number lines. Quarterly Journal of
Experimental Psychology (2006), 73(2), 279–294.
https://doi.org/10.1177/1747021819881631
Douglas, H., Headley, M. G., Hadden, S., & LeFevre, J.-A. (n.d.). Knowledge of mathematical
symbols goes beyond numbers. Journal of Numerical Cognition.
Dunn, L. M., & Dunn, D. M. (2007). Peabody Picture Vocabulary Test,. Summary.
152
https://doi.org/10.1037/t15144-000
Education Quality and Accountability Office. (2017). EQAO Sample Assessments.
http://www.eqao.com/en/assessments/examples-of-the-assessments
Empson, S. B. (1999). Equal sharing and shared meaning: The development of faction concepts
in a first-grade classroom. Source: Cognition and Instruction, 17(3), 283–342.
http://www.jstor.org/stable/3233836
Fazio, L. K., Dewolf, M., & Siegler, R. S. (2016). Strategy use and strategy choice in fraction
magnitude comparison. Journal of Experimental Psychology: Learning, Memory, and
Cognition, 42(1), 1–16. https://doi.org/10.1037/xlm0000153.supp
Forsyth, S. R., & Powell, S. R. (2017). Differences in the mathematics-vocabulary knowledge of
gifth-grade students with and without learningdifficulties. Learning Disabilities Research
and Practice, 32(4), 231–245. https://doi.org/10.1111/ldrp.12144
Fuchs, L. S., Fuchs, D., Compton, D. L., Powell, S. R., Seethaler, P. M., Capizzi, A. M.,
Schatschneider, C., & Fletcher, J. M. (2006). The cognitive correlates of third-grade skill in
arithmetic, algorithmic computation, and arithmetic word problems. Journal of Educational
Psychology, 98(1), 29–43. https://doi.org/10.1037/0022-0663.98.1.29
Fuchs, L. S., Malone, A. S., Schumacher, R. F., Namkung, J., & Wang, A. (2017). Fraction
intervention for students with mathematics difficulties: Lessons learned from five
randomized controlled trials. Journal of Learning Disabilities, 50(6), 631–639.
https://doi.org/10.1177/0022219416677249
Fuchs, L. S., Schumacher, R. F., Sterba, S. K., Long, J., Namkung, J., Malone, A., Hamlett, C.
L., Jordan, N. C., Gersten, R., Siegler, R. S., & Changas, P. (2014). Does working memory
moderate the effects of fraction intervention? An aptitude-treatment interaction. Journal of
153
Educational Psychology, 106(2), 499–514. https://doi.org/10.1037/a0034341
Gabriel, F., Coché, F., Szucs, D., Carette, V., Rey, B., & Content, A. (2013). A componential
view of children’s difficulties in learning fractions. Frontiers in Psychology, 4(OCT), 1–12.
https://doi.org/10.3389/fpsyg.2013.00715
Geiser, C. (2013). Data Analysis with MPlus. Guilford Press.
Gersten, R., Schumacher, R. F., & Jordan, N. C. (2017). Life on the number line: Routes to
understanding fraction magnitude for students with difficulties learning mathematics.
Journal of Learning Disabilities, 50(6), 655–657.
https://doi.org/10.1177/0022219416662625
Gilmore, C., Clayton, S., Cragg, L., McKeaveney, C., Simms, V., & Johnson, S. (2018).
Understanding arithmetic concepts: The role of domain-specific and domain-general skills.
PLoS ONE, 13(9), 1–20. https://doi.org/10.1371/journal.pone.0201724
Gjicali, K., Astuto, J., & Lipnevich, A. A. (2019). Relations among language comprehension,
oral counting, and numeral knowledge of ethnic and racial minority young children from
low-income communities. Early Childhood Research Quarterly, 46, 5–19.
https://doi.org/10.1016/j.ecresq.2018.07.007
Göbel, S. M., Watson, S. E., Lervåg, A., & Hulme, C. (2014). Children’s arithmetic
development: It is number Kknowledge, not the approximate number sense, that counts.
Psychological Science, 25(3), 789–798. https://doi.org/10.1177/0956797613516471
Gonzalez-Forte, J. M., Van Hoof, J., Fernadez, C., & Van Dooren, W. (2019). Exploring
students’ reasoning about fraction magnitude. July.
Grimm, K. J. (2008). Longitudinal associations between reading and mathematics achievement.
Developmental Neuropsychology, 33(3), 410–426.
154
https://doi.org/10.1080/87565640801982486
Gunderson, E. A., Hamdan, N., Hildebrand, L., Bartek, V., & Gunderson, E. A. (2019). Number
line unidimensionality is a critical feature for promoting fraction magnitude concepts.
Journal of Experimental Child Psychology, 187, 104657.
https://doi.org/10.1016/j.jecp.2019.06.010
Hallett, D., Nunes, T., & Bryant, P. (2010). Individual differences in conceptual and procedural
knowledge when learning fractions. Journal of Educational Psychology, 102(2), 395–406.
https://doi.org/10.1037/a0017486
Hallett, D., Nunes, T., Bryant, P., & Thorpe, C. M. (2012). Individual differences in conceptual
and procedural fraction understanding: The role of abilities and school experience. Journal
of Experimental Child Psychology, 113(4), 469–486.
https://doi.org/10.1016/j.jecp.2012.07.009
Hannula, M. S. (2003). Locating Fraction on a Number Line. 27th International Group for the
Psychology of Mathematics Education Conference , 17–24.
Hansen, N., Jordan, N. C., Fernandez, E., Siegler, R. S., Fuchs, L., Gersten, R., & Micklos, D.
(2015). General and math-specific predictors of sixth-graders’ knowledge of fractions.
Cognitive Development, 35(September), 34–49.
https://doi.org/10.1016/j.cogdev.2015.02.001
Hansen, N., Jordan, N. C., & Rodrigues, J. (2017). Identifying learning difficulties with
fractions: A longitudinal study of student growth from third through sixth grade.
Contemporary Educational Psychology, 50, 45–59.
https://doi.org/10.1016/j.cedpsych.2015.11.002
Headley, M. G. (2016). What is Symbolic Mathematics Language Literacy? A Mulitlevel Mixed
155
Model Study of Adolescents in Middle School. University of Cincinnati.
Hebert, M. A., & Powell, S. R. (2016). Examining fourth-grade mathematics writing: features of
organization, mathematics vocabulary, and mathematical representations. Reading and
Writing, 29(7), 1511–1537. https://doi.org/10.1007/s11145-016-9649-5
Hecht, S. A., Close, L., & Santisi, M. (2003). Sources of individual differences in fraction skills.
Journal of Experimental Child Psychology, 86(4), 277–302.
https://doi.org/10.1016/j.jecp.2003.08.003
Hecht, S. A., & Vagi, K. J. (2010). Sources of group and individual differences in emerging
fraction skills. Journal of Educational Psychology, 102(4), 843–859.
https://doi.org/10.1037/a0019824
Hecht, S. A., Vagi, K. J., & Hecht, S. A. (2012). Patterns of strengths and weaknesses in
children’s knowledge about fractions. Journal of Experimental Child Psychology, 111, 212–
229. https://doi.org/10.1016/j.jecp.2011.08.012
Hecht, S. A., Vagi, K. J., & Torgesen, J. K. (2007). Fraction skills and proportional reasoning. In
Why is math so hard for some children? The nature and origins of mathematical learning
difficulties and disabilities. (pp. 121–132).
http://psycnet.apa.org.proxy.library.carleton.ca/record/2007-03663-007
Herscovics, N., & Linchevski, L. (1994). A cognitive gap between arithmetic and algebra.
Educational Studies in Mathematics, 27(1), 59–78. https://doi.org/10.1007/BF01284528
Hiebert, J. (1988). A theory of developing competence with written mathematical symbols.
Educational Studies in Mathematics, 19(3), 333–355.
Hoch, M., & Dreyfus, T. (2004). Structure sense in high school algebra: The effect of brackets.
Proceedings of the 28th Conference of the International Group for the Psychology of
156
Mathematics Education, 2004, 3, 49–56.
Holloway, I. D., & Ansari, D. (2015). Numerical symbols: An overview of their cognitive and
neural underpinnings. In The Oxford handbook of numerical cognition (Issue 1, pp. 531–
552). https://doi.org/10.1093/oxfordhb/9780199642342.013.56
Hornburg, C. B., Schmitt, S. A., Purpura, D. J., & Hornburg, C. B. (2018). Relations between
preschoolers’ mathematical language understanding and specific numeracy skills. Journal
of Experimental Child Psychology, 176, 84–100. https://doi.org/10.1016/j.jecp.2018.07.005
Hughes, E. M., Powell, S. R., & Lee, J. Y. (2020). Development and psychometric report of a
middle-school mathematics vocabulary measure. Assessment for Effective Intervention,
45(3), 226–234. https://doi.org/10.1177/1534508418820116
Hughes, E. M., Powell, S. R., & Stevens, E. A. (2016). Supporting clear and concise
mathematics language. TEACHING Exceptional Children, 49(1), 7–17.
https://doi.org/10.1177/0040059916654901
Hume, T., & Hume, S. (2014). EstimationLine (version number) [Mobile application software].
https://hume.ca/ix/pathspan/
Hurst, M. A., Anderson, U., & Cordes, S. (2017). Mapping among number words, numerals, and
nonsymbolic quantities in preschoolers. Journal of Cognition and Development, 18(1), 41–
62. https://doi.org/10.1080/15248372.2016.1228653
Hurst, M. A., & Cordes, S. (2018a). A systematic investigation of the link between rational
number processing and algebra ability. British Journal of Psychology, 109, 99–117.
https://doi.org/10.1111/bjop.12244
Hurst, M. A., & Cordes, S. (2018b). Children’s understanding of fraction and decimal symbols
and the notation-specific relation to pre-algebra ability. Journal of Experimental Child
157
Psychology, 168, 32–48. https://doi.org/10.1016/j.jecp.2017.12.003
Hurst, M. A., & Cordes, S. (2019). Talking about proportion: Fraction labels impact numerical
interference in non-symbolic proportional reasoning. Developmental Science, 22(4),
e12790. https://doi.org/10.1111/desc.12790
Jiménez Lira, C., Carver, M., Douglas, H., & LeFevre, J.-A. A. (2017). The integration of
symbolic and non-symbolic representations of exact quantity in preschool children.
Cognition, 166, 382–397. https://doi.org/10.1016/j.cognition.2017.05.033
Jordan, N. C., Hansen, N., Fuchs, L. S., Siegler, R. S., Gersten, R., & Micklos, D. (2013).
Developmental predictors of fraction concepts and procedures. Journal of Experimental
Child Psychology, 116(1), 45–58. https://doi.org/10.1016/j.jecp.2013.02.001
Jordan, N. C., Resnick, I., Rodrigues, J., Hansen, N., & Dyson, N. (2017). Delaware longitudinal
study of fraction learning: Implications for helping children with mathematics difficulties.
Journal of Learning Disabilities, 50(6), 621–630.
https://doi.org/10.1177/0022219416662033
Kainulainen, M., McMullen, J., & Lehtinen, E. (2017). Early developmental trajectories toward
concepts of rational numbers. Cognition and Instruction, 35(1), 4–19.
https://doi.org/10.1080/07370008.2016.1251287
Keith, T. z, Fine, J. G., Taub, G. E., Reynolds, M. R., & Kranzler, J. H. (2006). Higher order,
multisample, confirmatory factor analysis of the Wechsler Intelligence Scale for Children-
Fourth Edition: What does it measure? School Psychology Review, 35(1), 108–127.
Kimberlin, C. L., & Winterstein, A. G. (2008). Validity and reliability of measurement
instruments used in research. American Journal of Health-System Pharmacy, 65(23), 2276–
2284. https://doi.org/10.2146/ajhp070364
158
Kleemans, T., Segers, E., & Verhoeven, L. (2014). Cognitive and linguistic predictors of basic
arithmetic skills: Evidence from first-language and second-language learners. International
Journal of Disability, Development and Education, 61(3), 306–316.
https://doi.org/10.1080/1034912X.2014.934017
Kline, R. B. (2016). Principles and Practice of Structural Equation Modeling (4th ed.). Guilford
Publications.
Kolkman, M. E., Kroesbergen, E. H., & Leseman, P. P. M. (2013). Early numerical development
and the role of non-symbolic and symbolic skills. Learning and Instruction, 25, 95–103.
https://doi.org/10.1016/j.learninstruc.2012.12.001
Kung, M., Schmitt, S. A., Zhang, C., Whiteman, S. D., Yang, F., & Purpura, D. J. (2019). The
role of mathematical language in mathematical development in China and the US.
International Journal of Educational Research.
Landy, D., Brookes, D., & Smout, R. (2014). Abstract numeric relations and the visual structure
of algebra. Journal of Experimental Psychology: Learning, Memory, and Cognition, 40(5),
1404–1418. https://doi.org/10.1037/a0036823
Landy, D., & Goldstone, R. L. (2007). How abstract is symbolic thought? Journal of
Experimental Psychology: Learning, Memory, and Cognition, 33(4), 720–733.
https://doi.org/10.1037/0278-7393.33.4.720
LeFevre, J.-A., Fast, L., Skwarchuk, S. L., Smith-Chant, B. L., Bisanz, J., Kamawar, D., &
Penner-Wilger, M. (2010). Pathways to mathematics: Longitudinal predictors of
performance. Child Development, 81(6), 1753–1767. https://doi.org/10.1111/j.1467-
8624.2010.01508.x
Lewis, K. E. (2016). Beyond error patterns: A sociocultural view of fraction comparison errors in
159
students with mathematical learning disabilities. Learning Disability Quarterly, 39(4), 199–
212. https://doi.org/10.1177/0731948716658063
Li, Y. (2008). What do students need to learn about division of fractions. Mathematics Teaching
in Middle School, 6125(9), 546–552.
Liu, Y. (2018). Fraction magnitude understanding and its unique role in predicting general
mathematics achievement at two early stages of fraction instruction. British Journal of
Educational Psychology, 88(3), 345–362. https://doi.org/10.1111/bjep.12182
Lortie-Forgues, H., Tian, J., & Siegler, R. S. (2015). Why is learning fraction and decimal
arithmetic so difficult? In Developmental Review (Vol. 38, pp. 201–221).
https://doi.org/10.1016/j.dr.2015.07.008
Luwel, K., Peeters, D., Dierckx, G., Sekeris, E., & Verschaffel, L. (2018). Benchmark-based
strategy use in atypical number lines. Canadian Journal of Experimental Psychology/Revue
Canadienne de Psychologie Expérimentale, 72(4), 253–263.
Lyons, I. M., & Ansari, D. (2015). Foundations of children’s numerical and mathematical ckills:
The roles of symbolic and nonsymbolic representations of numerical magnitude. In
Advances in child development and behavior (Vol. 48, pp. 93–116).
https://doi.org/10.1016/bs.acdb.2014.11.003
Lyons, I. M., & Beilock, S. L. (2011). Numerical ordering ability mediates the relation between
number-sense and arithmetic competence. Cognition, 121(2), 256–261.
https://doi.org/10.1016/j.cognition.2011.07.009
Lyons, I. M., Price, G. R., Vaessen, A., Blomert, L., & Ansari, D. (2014). Numerical predictors
of arithmetic success in grades 1-6. Developmental Science, 17(5), 714–726.
https://doi.org/10.1111/desc.12152
160
Lyons, I. M., Vogel, S. E., & Ansari, D. (2016). On the ordinality of numbers: A review of
neural and behavioral studies. In M. Cappelletti & W. Fias (Eds.), Progress in Brain
Research (Issue May, pp. 187–221). Elsevier B.V.
https://doi.org/10.1016/bs.pbr.2016.04.010
Mack, N. K. (1990). Learning fractions with understanding: Building on informal knowledge.
Journal for Research in Mathematics Education, 21(1), 16. https://doi.org/10.2307/749454
Mack, N. K. (1995). Confounding whole-number and fraction concepts when building on
informal knowledge. Journal for Research in Mathematics Education, 26(5), 422–441.
https://doi.org/10.2307/749431
Manitoba Education. (2013). Kindergarten to Grade 8 Mathematics: Manitoba Framework of
Outcomes. Government of Manitoba.
Marchini, C., & Papadopoulos, I. (2011). Are useless brackets useful tools for teaching?
Proceedings of the 35th Conference of the International Group for the Psychology of
Mathematics Education. http://ikee.lib.auth.gr/record/132667
Mazzocco, M. M. M., & Devlin, K. T. (2008). Parts and “holes”: Gaps in rational number sense
among children with vs. without mathematical learning disabilities. Developmental Science,
11(5), 681–691. https://doi.org/10.1111/j.1467-7687.2008.00717.x
Mazzocco, M. M. M., Myers, G. F., Lewis, K. E., Hanich, L. B., & Murphy, M. M. (2013).
Limited knowledge of fraction representations differentiates middle school students with
mathematics learning disability (dyscalculia) versus low mathematics achievement. Journal
of Experimental Child Psychology, 115, 371–387.
https://doi.org/10.1016/j.jecp.2013.01.005
McMullen, J., Laakkonen, E., Hannula-Sormunen, M., & Lehtinen, E. (2015). Modeling the
161
developmental trajectories of rational number concept(s). Learning and Instruction, 37, 14–
20. https://doi.org/10.1016/j.learninstruc.2013.12.004
McMullen, J., Van Hoof, J., Degrande, T., Verschaffel, L., & Van Dooren, W. (2018). Profiles of
rational number knowledge in Finnish and Flemish students – A multigroup latent class
analysis. Learning and Individual Differences, 66(February), 70–77.
https://doi.org/10.1016/j.lindif.2018.02.005
McNeil, N. M., & Alibali, M. W. (2005). Why won’t you change your mind? Knowledge of
operational patterns hinders learning and performance on equations. In Child Development
(Vol. 76, Issue 4, pp. 883–899). John Wiley & Sons, Ltd (10.1111).
https://doi.org/10.1111/j.1467-8624.2005.00884.x
McNeil, N. M., Fyfe, E. R., Petersen, L. A., Dunwiddie, A. E., & Brletic-Shipley, H. (2011).
Benefits of practicing 4 = 2 + 2: Nontraditional problem formats facilitate children’s
understanding of mathematical equivalence. Child Development, 82(5), 1620–1633.
https://doi.org/10.1111/j.1467-8624.2011.01622.x
Méndez, L. I., Hammer, C. S., Lopez, L. M., & Blair, C. (2019). Examining language and early
numeracy skills in young Latino dual language learners. Early Childhood Research
Quarterly, 46, 252–261. https://doi.org/10.1016/j.ecresq.2018.02.004
Merkley, R., & Ansari, D. (2016). Why numerical symbols count in the development of
mathematical skills: evidence from brain and behavior. Current Opinion in Behavioral
Sciences, 10, 14–20. https://doi.org/10.1016/j.cobeha.2016.04.006
Misquitta, R. (2011). A review of the literature: Fraction instruction for struggling learners in
mathematics. Learning Disabilities Research & Practice, 26(2), 109–119.
https://doi.org/10.1111/j.1540-5826.2011.00330.x
162
Miura, I. T., Okamoto, Y., Vlahovic-Stetic, V., Kim, C. C., & Han, J. H. (1999). Language
supports for children’s understanding of numerical fractions: Cross-National comparisons.
Journal of Experimental Child Psychology, 74(4), 356–365.
https://doi.org/10.1006/jecp.1999.2519
Mix, K. S., Levine, S. C., & Huttenlocher, J. (1999). Early fraction calculation ability.
Developmental Psychology, 35(1), 164–174. https://doi.org/10.1037/0012-1649.35.1.164
Mix, K. S., & Paik, J. H. (2008). Do Korean fraction names promote part-whole reasoning?
Journal of Cognition and Development, 9(2), 145–170.
https://doi.org/10.1080/15248370802022605
Möhring, W., Newcombe, N. S., Levine, S. C., & Frick, A. (2016). Spatial proportional
reasoning Is associated with formal knowledge about fractions. Journal of Cognition and
Development, 17(1), 67–84. https://doi.org/10.1080/15248372.2014.996289
Morrow, P., Connelly, R., Keyes, B., Johnston, J., Thomas, S., Thomas, J., D’Alessandro, A.,
Connell, M. M., Jones, D., Davis, M., Gray, L., Jeroski, S., Brown, T., Edwards, L., &
Gordon, S. (2004). Math Makes Sense - Ontario Teacher Guide. Pearson Education Canada
Inc.
Mou, Y., Li, Y., Hoard, M. K., Nugent, L. D., Chu, F. W., Rouder, J. N., & Geary, D. C. (2016).
Developmental foundations of children’s fraction magnitude knowledge. Cognitive
Development, 39, 141–153. https://doi.org/10.1016/j.cogdev.2016.05.002
Muthén, L.K. and Muthén, B.O. (1998-2012). Mplus User’s Guide. Seventh Edition. Los
Angeles, CA: Muthén & Muthén.
Namkung, J. M., & Fuchs, L. S. (2016). Cognitive predictors of calculations and number line
estimation with whole numbers and fractions among at-risk students. Journal of
163
Educational Psychology, 108(2), 214–228. https://doi.org/10.1037/edu0000055
Newman, R. S., & Berger, C. F. (1984). Children’s numerical estimation: Flexibility in the use of
counting. Journal of Educational Psychology, 76(1), 55–64. https://doi.org/10.1037/0022-
0663.76.1.55
Newstead, K., & Murray, H. (1998). Young students’ constructions of fractions. In A. Oliver &
K. Newstead (Eds.), Proceedings of the Twenty-second International Conference for the
Psychology of Mathematics Education (pp. 295–302).
Nguyen, T., Watts, T. W., Duncan, G. J., Clements, D. H., Sarama, J. S., Wolfe, C., & Spitler,
M. E. (2016). Which preschool mathematics competencies are most predictive of fifth grade
achievement? Early Childhood Research Quarterly, 36, 550–560.
https://doi.org/10.1016/j.ecresq.2016.02.003
Ni, Y., & Zhou, Y. Di. (2005). Teaching and learning fraction and rational numbers: The origins
and implications of whole number bias. Educational Psychologist, 40(1), 27–52.
https://doi.org/10.1207/s15326985ep4001_3
O’Halloran, K. L. (2005). Mathematical discourse: Language, symbolism and visual images.
Continuum.
O’Halloran, K. L. (2015). The language of learning mathematics : A multimodal perspective.
Journal of Mathematical Behavior, 40, 63–74. https://doi.org/10.1016/j.jmathb.2014.09.002
Oberski, D. (2016). Mixture models: Latent profile and latent class analysis (pp. 275–287).
Springer, Cham. https://doi.org/10.1007/978-3-319-26633-6_12
Obersteiner, A., Dresler, T., Bieck, S. M., & Moeller, K. (2019). Understanding fractions:
Integrating results from mathematics education, cognitive psychology, and neuroscience. In
Understanding Number (pp. 135–162). Springer. https://doi.org/10.1007/978-3-030-00491-
164
0_7
Obersteiner, A., Van Dooren, W., Van Hoof, J., & Verschaffel, L. (2013). The natural number
bias and magnitude representation in fraction comparison by expert mathematicians.
Learning and Instruction, 28, 64–72. https://doi.org/10.1016/j.learninstruc.2013.05.003
Ontario Ministry of Education. (2005). The Ontario Curriculum, Grades 1-8: Mathematics.
Osana, H. P., & Pitsolantis, N. (2013). Addressing the struggle to link form and understanding in
fractions instruction. British Journal of Educational Psychology, 83(1), 29–56.
https://doi.org/10.1111/j.2044-8279.2011.02053.x
Papadopoulos, I., & Gunnarsson, R. (2020). Exploring the way rational expressions trigger the
use of “mental” brackets by primary school students. Educational Studies in Mathematics,
103(2), 191–207. https://doi.org/10.1007/s10649-019-09929-z
Pearn, C., & Stephens, M. (2004). Why do you have to probe to discover what Year 8 students
really think about fractions. Mathematics Education for the Third Millennium: Towards
2010. Proceedings of the 27th Annual Conference of the Mathematics Education Research
Group of Australasia., 27–30.
Peeters, D., Degrande, T., Ebersbach, M., Verschaffel, L., & Luwel, K. (2016). Children’s use of
number line estimation strategies. Eur J Psychol Educ, 31, 117–134.
https://doi.org/10.1007/s10212-015-0251-z
Peng, P., & Lin, X. (2019). The relation between mathematics vocabulary and mathematics
performance among fourth graders. Learning and Individual Differences, 69(January 2019),
11–21. https://doi.org/10.1016/j.lindif.2018.11.006
Peng, P., Lin, X., Ünal, Z. E., Lee, K., Namkung, J., Chow, J., & Sales, A. (2020). Examining
the mutual relations between language and mathematics: A meta-analysis. Psychological
165
Bulletin, 146(7), 595–634. https://doi.org/10.1037/bul0000231
Peng, P., Namkung, J., Barnes, M., & Sun, C. (2016). A meta-analysis of mathematics and
working memory: Moderating effects of working memory domain, type of mathematics
skill, and sample characteristics. Journal of Educational Psychology, 108(4), 455–473.
https://doi.org/10.1037/edu0000079
Powell, S. R., Berry, K. A., & Tran, L. M. (2020). Performance differences on a measure of
mathematics vocabulary for English learners and Non-English learners with and without
mathematics difficulty. Reading and Writing Quarterly, 36(2), 124–141.
https://doi.org/10.1080/10573569.2019.1677538
Powell, S. R., Driver, M. K., Roberts, G., & Fall, A. M. (2017). An analysis of the mathematics
vocabulary knowledge of third- and fifth-grade students: Connections to general vocabulary
and mathematics computation. Learning and Individual Differences, 57, 22–32.
https://doi.org/10.1016/j.lindif.2017.05.011
Powell, S. R., & Fluhler, S. K. (2018). A brief measure of mathematics symbols: Performance at
grades 1, 3, and 5. Assessment for Effective Intervention, 1–11.
https://doi.org/10.1177/1534508418809884
Powell, S. R., & Fuchs, L. S. (2010). Contribution of equal-sign instruction beyond word-
problem tutoring for third-grade students with mathematics difficulty. Journal of
Educational Psychology, 102(2), 381–394. https://doi.org/10.1037/a0018447
Powell, S. R., & Nelson, G. (2017). An investigation of the mathematics-vocabulary knowledge
of first-grade students. The Elementary School Journal, 117(4), 664–686.
https://doi.org/10.1086/691604
Powell, S. R., Stevens, E. A., & Hughes, E. M. (2019). Math language in middle school: Be
166
more specific. Teaching Exceptional Children, 51(4), 286–295.
https://doi.org/10.1177/0040059918808762
Purpura, D. J., Baroody, A. J., & Lonigan, C. J. (2013). The transition from informal to formal
mathematical knowledge: Mediation by numeral knowledge. Journal of Educational
Psychology, 105(2), 453–464. https://doi.org/10.1037/a0031753
Purpura, D. J., Hume, L. E., Sims, D. M., & Lonigan, C. J. (2011). Early literacy and early
numeracy: The value of including early literacy skills in the prediction of numeracy
development. Journal of Experimental Child Psychology, 110(4), 647–658.
https://doi.org/10.1016/j.jecp.2011.07.004
Purpura, D. J., & Logan, J. A. R. (2015). The nonlinear relations of the approximate number
system and mathematical language to early mathematics development. Developmental
Psychology, 51(12), 1717–1724. https://doi.org/10.1037/dev0000055
Purpura, D. J., Logan, J. A. R., Hassinger-Das, B., & Napoli, A. R. (2017). Why do early
mathematics skills predict later reading? The role of mathematical language. Developmental
Psychology, 53(9), 1633–1642. https://doi.org/10.1037/dev0000375
Purpura, D. J., & Napoli, A. R. (2015). Early numeracy and literacy: Untangling the relation
between specific components. Mathematical Thinking and Learning, 17(2–3), 197–218.
https://doi.org/10.1080/10986065.2015.1016817
Purpura, D. J., & Reid, E. E. (2016). Mathematics and language: Individual and group
differences in mathematical language skills in young children. Early Childhood Research
Quarterly, 36, 259–268. https://doi.org/10.1016/j.ecresq.2015.12.020
Quinnell, L., & Carter, M. (2013). Gibberish or What ? Use of symbolic language in primary
mathematics. Australian Primary Mathematics Classroom, 18(1), 8–14.
167
Rau, M. A., & Matthews, P. G. (2017). How to make “more” better? Principles for effective use
of multiple representations to enhance students’ learning about fractions. ZDM, 49, 531–
544. https://doi.org/10.1007/s11858-017-0846-8
Reise, S. P., Widaman, K. F., & Pugh, R. H. (1993). Confirmatory factor analysis and item
response theory: Two approaches for exploring measurement invariance. Psychological
Bulletin, 114(3), 552–566. https://doi.org/10.1037/0033-2909.114.3.552
Resnick, I., Jordan, N. C., Hansen, N., Rajan, V., Rodrigues, J., Siegler, R. S., & Fuchs, L. S.
(2016). Developmental growth trajectories in understanding of fraction magnitude from
fourth through sixth grade. Developmental Psychology, 52(5), 746–757.
https://doi.org/10.1037/dev0000102
Reys, B. J., Kim, O.-K., & Bay, J. M. (1999). Establishing fraction benchmarks. Mathematics
Teaching in the Middle School, 4(8), 530.
Riccomini, P. J. (2016). How to use math error analysis to improve instruction.
https://files.ernweb.com/erroranalysis.pdf
Riccomini, P. J., Smith, G. W., Hughes, E. M., & Fries, K. M. (2015). The Language of
Mathematics: The Importance of Teaching and Learning Mathematical Vocabulary.
Reading & Writing Quarterly, 31(3), 235–252.
https://doi.org/10.1080/10573569.2015.1030995
Rinne, L. F., Ye, A., & Jordan, N. C. (2017). Development of fraction comparison strategies: A
latent transition analysis. Developmental Psychology, 53(4), 713–730.
https://doi.org/10.1037/dev0000275
Rittle-Johnson, B., & Alibali, M. W. (1999). Conceptual and procedural knowledge of
mathematics: Does one lead to the other? Journal of Educational Psychology, 91(1), 175–
168
189. https://doi.org/10.1037/0022-0663.91.1.175
Rittle-Johnson, B., & Schneider, M. (2014). Developing conceptual and procedural knowledge
of mathematics. In Oxford Handbook of Numerical Cognition (Vol. 1, pp. 1118–1134).
Oxford University Press. https://doi.org/10.1093/oxfordhb/9780199642342.013.014
Rittle-Johnson, B., Schneider, M., & Star, J. R. (2015). Not a one-way street: Bidirectional
relations between procedural and conceptual knowledge of mathematics. Educational
Psychology Review, 27(4), 587–597. https://doi.org/10.1007/s10648-015-9302-x
Rodrigues, J., Jordan, N. C., & Hansen, N. (2019). Identifying fraction measures as screeners of
mathematics risk status. Journal of Learning Disabilities, 52(6), 480–497.
https://doi.org/10.1177/0022219419879684
Roesslein, R. I., & Codding, R. S. (2019). Fraction interventions for struggling elementary math
learners: A review of the literature. In Psychology in the Schools (Vol. 56, Issue 3, pp. 413–
432). John Wiley & Sons, Ltd. https://doi.org/10.1002/pits.22196
Rubenstein, R. N., & Thompson, D. R. (2001). Learning mathematical symbolism: Challenges
and instructional strategies. Mathematics Teacher, 94(4), 265–271.
Rubenstein, R. N., & Thompson, D. R. (2002). Understanding and supporting children’s
mathematical vocabulary development. Teaching Children Mathematics, 8(2), 107–112.
Salminen, J. B., Koponen, T. K., & Tolvanen, A. J. (2018). Individuality in the early number
skill components underlying basic arithmetic skills. Frontiers in Psychology, 9(JUL), 1–11.
https://doi.org/10.3389/fpsyg.2018.01056
Sasanguie, D., & Vos, H. (2018). About why there is a shift from cardinal to ordinal processing
in the association with arithmetic between first and second grade. Developmental Science,
21(5), e12653. https://doi.org/10.1111/desc.12653
169
Schleppegrell, M. J. (2007). The linguistic challenges of mathematics teaching and learning: A
research review. Reading and Writing Quarterly, 23(2), 139–159.
https://doi.org/10.1080/10573560601158461
Schmitt, S. A., Purpura, D. J., Elicker, J. G., & Schmitt, S. A. (2019). Predictive links among
vocabulary, mathematical language, and executive functioning in preschoolers. Journal of
Experimental Child Psychology, 180, 55–68. https://doi.org/10.1016/j.jecp.2018.12.005
Schneider, M., Beeres, K., Coban, L., Merz, S., Susan Schmidt, S., Stricker, J., & De Smedt, B.
(2017). Associations of non-symbolic and symbolic numerical magnitude processing with
mathematical competence: a meta-analysis. Developmental Science, 20(3), e12372.
https://doi.org/10.1111/desc.12372
Schneider, M., Merz, S., Stricker, J., De Smedt, B., Torbeyns, J., Verschaffel, L., & Luwel, K.
(2018). Associations of number line estimation with mathematical competence: A meta-
analysis. Child Development, 89(5), 1467–1484. https://doi.org/10.1111/cdev.13068
Schneider, M., & Stern, E. (2010). The developmental relations between conceptual and
procedural knowledge: A multimethod approach. Developmental Psychology, 46(1), 178–
192. https://doi.org/10.1037/a0016701
Sherman, J., & Bisanz, J. (2009). Equivalence in symbolic and nonsymbolic contexts: Benefits
of solving problems with manipulatives. Journal of Educational Psychology, 101(1), 88–
100.
http://search.proquest.com.proxy.library.carleton.ca/docview/614495900?accountid=9894
Shtulman, A., & Valcarcel, J. (2012). Scientific knowledge suppresses but does not supplant
earlier intuitions. Cognition, 124(2), 209–215.
https://doi.org/10.1016/j.cognition.2012.04.005
170
Siegler, R. S. (2016). Magnitude knowledge: the common core of numerical development.
Developmental Science, 19(3), 341–361. https://doi.org/10.1111/desc.12395
Siegler, R. S., & Braithwaite, D. W. (2017, January 3). Numerical development. In Annual
Review of Psychology. Annual Reviews. https://doi.org/10.1146/annurev-psych-010416-
044101
Siegler, R. S., Carpenter, T., Fennel, F., Geary, D. C., Lewis, J., Okamoto, U., Thompson, L., &
Wray, J. (2010). Developing Effective Fraction Instruction for Kindergarten Through 8th
Grade (NCEE #2010-4039).
https://ies.ed.gov/ncee/wwc/pdf/practice_guides/fractions_pg_093010.pdf
Siegler, R. S., & Chen, Z. (2008). Differentiation and integration: Guiding principles for
analyzing cognitive change. Developmental Science, 11(4), 433–448.
https://doi.org/10.1111/j.1467-7687.2008.00689.x
Siegler, R. S., Duncan, G. J., Davis-Kean, P. E., Duckworth, K., Claessens, A., Engel, M.,
Susperreguy, M. I., & Chen, M. (2012). Early predictors of high school mathematics
achievement. Psychological Science, 23(7), 691–697.
https://doi.org/10.1177/0956797612440101
Siegler, R. S., Fazio, L. K., Bailey, D. H., & Zhou, X. (2013). Fractions: The new frontier for
theories of numerical development. In Trends in Cognitive Sciences (Vol. 17, Issue 1, pp.
13–19). https://doi.org/10.1016/j.tics.2012.11.004
Siegler, R. S., & Lortie-Forgues, H. (2014). An integrative theory of numerical development.
Child Development Perspectives, 8(3), 144–150. https://doi.org/10.1111/cdep.12077
Siegler, R. S., & Lortie-Forgues, H. (2017). Hard lessons: Why rational number arithmetic Is so
difficult for so nany people. Current Directions in Psychological Science, 26(4), 346–351.
171
https://doi.org/10.1177/0963721417700129
Siegler, R. S., & Opfer, J. E. (2003). The development of numerical estimation: Evidence for
multiple representations of numerical quantity. Psychological Science, 14(3), 237–243.
https://doi.org/10.1111/1467-9280.02438
Siegler, R. S., & Pyke, A. A. (2013). Developmental and individual differences in understanding
of fractions. Developmental Psychology, 49(10), 1994–2004.
https://doi.org/10.1037/a0031200
Siegler, R. S., Thompson, C. A., & Schneider, M. (2011). An integrated theory of whole number
and fractions development. Cognitive Psychology, 62(4), 273–296.
https://doi.org/10.1016/j.cogpsych.2011.03.001
Skemp, R. R. (1982). Communicating mathematics: Surface structures and deep structures.
Visible Language, 16(3), 281–288.
Slusser, E., & Barth, H. (2017). Intuitive proportion judgment in number-line estimation:
Converging evidence from multiple tasks. Journal of Experimental Child Psychology, 162,
181–198. https://doi.org/10.1016/j.jecp.2017.04.010
Sophian, C. (2017). Understanding fractions. In The Origins of Mathematical Knowledge in
Childhood (pp. 106–130). Routledge. https://doi.org/qa135.6S628
Sowinski, C., Dunbar, K., & LeFevre, J.-A. (2014). Calculation Fluency Test. In (unpublished
technical report). https://carleton.ca/cacr/math-lab/measures/calculation-fluency-test/
Sowinski, C., LeFevre, J.-A., Skwarchuk, S.-L., Kamawar, D., Bisanz, J., & Smith-Chant, B. L.
(2015). Refining the quantitative pathway of the Pathways to Mathematics model. Journal
of Experimental Child Psychology, 131, 73–93. https://doi.org/10.1016/j.jecp.2014.11.004
Stafylidou, S., & Vosniadou, S. (2004). The development of students’ understanding of the
172
numerical value of fractions. Learning and Instruction, 14(5 SPEC.ISS.), 503–518.
https://doi.org/10.1016/j.learninstruc.2004.06.015
StataCorp. (2017). Stata Statistical Software: Release 15. StataCorp LLC.
Steffe, L. P. (2002). A new hypothesis concerning children’s fractional knowledge. In Journal of
Mathematical Behavior (Vol. 20).
Steffe, L. P., & Olive, J. (2010). Children’s fractional knowledge. Children’s Fractional
Knowledge, 1–364. https://doi.org/10.1007/978-1-4419-0591-8
Steinberg, R. M., Sleeman, D. H., & Ktorza, D. (1991). Algebra students’ knowledge of
equivalence of equations. Journal for Research in Mathematics Education, 22(2), 112.
https://doi.org/10.2307/749588
Szűcs, D., Devine, A., Soltesz, F., Nobes, A., & Gabriel, F. (2014). Cognitive components of a
mathematical processing network in 9-year-old children. Developmental Science, 17(4),
506–524. https://doi.org/10.1111/desc.12144
Tein, J. Y., Coxe, S., & Cham, H. (2013). Statistical power to detect the correct number of
classes in latent profile analysis. Structural Equation Modeling, 20(4), 640–657.
https://doi.org/10.1080/10705511.2013.824781
Thomas, C. N., Van Garderen, D., Scheuermann, A., & Lee, E. J. (2015). Applying a universal
design for learning framework to mediate the language demands of mathematics. Reading
and Writing Quarterly, 31(3), 207–234. https://doi.org/10.1080/10573569.2015.1030988
Thompson, D. R., & Rubenstein, R. N. (2014). Literacy in language and mathematics: More in
common than you think. Journal of Adolescent and Adult Literacy, 58(2), 105–108.
https://doi.org/10.1002/jaal.338
Toll, S. W. M., & Van Luit, J. E. H. (2014). The developmental relationship between language
173
and low early numeracy skills throughout kindergarten. Exceptional Children, 81(1), 64–78.
https://doi.org/10.1177/0014402914532233
Torbeyns, J., Schneider, M., Xin, Z., & Siegler, R. S. (2015). Bridging the gap: Fraction
understanding is central to mathematics achievement in students from three different
continents. Learning and Instruction, 37, 5–13.
https://doi.org/10.1016/j.learninstruc.2014.03.002
Träff, U., Olsson, L., Skagerlund, K., & Östergren, R. (2018). Cognitive mechanisms underlying
third graders’ arithmetic skills: Expanding the pathways to mathematics model. Journal of
Experimental Child Psychology, 167, 369–387. https://doi.org/10.1016/j.jecp.2017.11.010
Tunç-Pekkan, Z. (2015). An analysis of elementary school children’s fractional knowledge
depicted with circle, rectangle, and number line representations. Educational Studies in
Mathematics, 89(3), 419–441. https://doi.org/10.1007/s10649-015-9606-2
Vamvakoussi, X. (2015). The development of rational number knowledge: Old topic, new
insights. In Learning and Instruction (Vol. 37).
https://doi.org/10.1016/j.learninstruc.2015.01.002
Vamvakoussi, X., Van Dooren, W., & Verschaffel, L. (2012). Naturally biased? In search for
reaction time evidence for a natural number bias in adults. Journal of Mathematical
Behavior, 31(3), 344–355. https://doi.org/10.1016/j.jmathb.2012.02.001
Vamvakoussi, X., & Vosniadou, S. (2004). Understanding the structure of the set of rational
numbers: A conceptual change approach. Learning and Instruction, 14(5 SPEC.ISS.), 453–
467. https://doi.org/10.1016/j.learninstruc.2004.06.013
Van Dooren, W., Lehtinen, E., & Verschaffel, L. (2015). Unraveling the gap between natural and
rational numbers. Learning and Instruction, 37, 1–4.
174
https://doi.org/10.1016/j.learninstruc.2015.01.001
Van Hoof, J., Vamvakoussi, X., Van Dooren, W., & Verschaffel, L. (2017). The transition from
natural to rational number knowledge. In Acquisition of Complex Arithmetic Skills and
Higher-Order Mathematics Concepts (pp. 101–123). Academic Press.
https://doi.org/10.1111/bjep.12134
Vanbinst, K., Ansari, D., Ghesquière, P., & Smedt, B. De. (2016). Symbolic numerical
magnitude processing is as important to arithmetic as phonological awareness is to reading.
PLoS ONE, 11(3). https://doi.org/10.1371/journal.pone.0151045
Vandierendonck, A. (2017). A comparison of methods to combine speed and accuracy measures
of performance: A rejoinder on the binning procedure. Behavior Research Methods, 49(2),
653–673. https://doi.org/10.3758/s13428-016-0721-5
Vlassis, J. (2008). The role of mathematical symbols in the development of number
conceptualization: The case of the minus sign. Philosophical Psychology, 21(4), 555–570.
https://doi.org/10.1080/09515080802285552
Vukovic, R. K., Fuchs, L. S., Geary, D. C., Jordan, N. C., Gersten, R., & Siegler, R. S. (2014).
Sources of individual differences in children’s understanding of fractions. Child
Development, 85(4), 1461–1476. https://doi.org/10.1111/cdev.12218
Vukovic, R. K., & Lesaux, N. K. (2013). The language of mathematics: Investigating the ways
language counts for childrenâ€TMs mathematical development. Journal of Experimental
Child Psychology, 115, 227–244. https://doi.org/10.1016/j.jecp.2013.02.002
Wearne, D., & Hiebert, J. (1989). Cognitive changes during conceptually based instruction on
decimal fractions. Journal of Educational Psychology, 81(4), 507–513.
https://doi.org/10.1037/0022-0663.81.4.507
175
Wechsler, D. (2014). WISC-V: Technical and interpretive manual. NCS Pearson Incorporated.
Werner, H. (1957). The concept of development from a comparative and organismic point of
view. In The concept of development (pp. 125–148). University of Minnesota Press.
Wilkins, J. L. M., & Norton, A. (2018). Learning progression toward a measurement concept of
fractions. International Journal of STEM Education, 5(1). https://doi.org/10.1186/s40594-
018-0119-2
Xu, C. (2019). Ordinal skills influence the transition in number line strategies for children in
Grades 1 and 2. Journal of Experimental Child Psychology, 185, 109–127.
https://doi.org/10.1016/j.jecp.2019.04.020
Xu, C., Gu, F., Newman, K., & LeFevre, J.-A. (2019). The hierarchical symbol integration
model of individual differences in mathematical skill. Journal of Numerical Cognition, 5(3),
262–282. https://doi.org/10.5964/jnc.v5i3.140
Xu, C., Lafay, A., Douglas, H., Osana, H. P., Le-Fevre, J.-A., Wylie, J., & Di Lonardo Burr, S.
(n.d.). The role of mathematical language skills in arithmetic fluency and word-problem
solving for first- and second-language learners.
Xu, C., & LeFevre, J.-A. (2016). Training young children on sequential relations among numbers
and spatial decomposition: Differential transfer to number line and mental transformation
tasks. Developmental Psychology, 52, 854–866.
Ye, A., Resnick, I., Hansen, N., Rodrigues, J., Rinne, L., & Jordan, N. C. (2016). Pathways to
fraction learning: Numerical abilities mediate the relation between early cognitive
competencies and later fraction knowledge. Journal of Experimental Child Psychology,
152, 242–263. https://doi.org/10.1016/j.jecp.2016.08.001
Yearley, S., & Bruce, C. D. (2014). A Canadian effort to address fractions teaching and learning
176
challenges. In Australian Primary Mathematics Classroom (Vol. 19, Issue 4).
Zhang, D., Stecker, P., & Beqiri, K. (2017). Strategies Students with and Without Mathematics
Disabilities Use When Estimating Fractions on Number Lines. Learning Disability
Quarterly, 40(4), 225–236. https://doi.org/10.1177/0731948717704966
Zhang, X., Koponen, T., Räsänen, P., Aunola, K., Lerkkanen, M. K., & Nurmi, J. E. (2014).
Linguistic and spatial skills predict early arithmetic development via counting sequence
knowledge. Child Development, 85(3), 1091–1107. https://doi.org/10.1111/cdev.12173
Zhang, X., & Lin, D. (2015). Pathways to arithmetic: The role of visual-spatial and language
skills in written arithmetic, arithmetic word problems, and nonsymbolic arithmetic.
Contemporary Educational Psychology, 41, 188–197.
https://doi.org/10.1016/j.cedpsych.2015.01.005
177
APPENDICES
Appendix A
Additional Measures Not Included in the Final Analyses
Domain General Measures
Black/White Stroop Task. The Stroop task is used as an indicator of inhibitory control.
In this version of the Stroop, children see one black square and one white square on the iPad
screen. They hear a color name (black or white) and then quickly press the same (congruent) or
different (incongruent) coloured square. There are four trial blocks (5 trials each) alternating
between congruent blocks (e.g., if they hear “white”, they are instructed to press the “white”
square) and incongruent blocks (e.g., if they hear “white”, they are instructed to press the “black”
square). Each child completes a total of 20 trials. The score is the difference between RT
(reaction time) on congruent and incongruent trials. This is a measure of interference cost.
Reliability based on the RTs for the 4 trial blocks was acceptable (Cronbach’s 𝛼𝛼 = 0.74)
Matrix Reasoning. Matrix reasoning taps into fluid reasoning; a child's skill at grasping
relationships amongst visual objects (e.g., shapes, designs, visuospatial patterns) and applying
their reasoning skills to identify and apply rules to complete visual patterns (Keith et al., 2006).
This task is part of the Weschler Intelligence Scale for Children (WISC-5) test battery.
In this task the child sees an incomplete 4 by 4 matrix with one missing item. The child
selects one of five options to complete the matrix. The test-set for this age group includes two
practice trials followed by test items 5 to 35. Testing is discontinued after 3 consecutive errors.
Scoring is based on the total correct. Reliability based on accuracy across all items was high
(Cronbach’s 𝛼𝛼 = 0.91).
178
WIAT Word Reading (Weschler, 2005). In this task, children are shown a set of
increasingly difficult words (total words 40) and asked to read the words aloud, one at a time.
Children are encouraged to try each word even if they are unsure of the pronunciation. As per
standardized administration procedures, testing is discontinued after three consecutive errors.
Reliability across the 40 words was high (Cronbach’s α = .93).
Math Measures
Word Problem Solving. (KeyMath 3; Connolly, 2000). In this standardized task,
children solve a series of progressively more difficult math word problems. The researcher reads
a question to the child and shows a corresponding picture. The child responds orally. A subset of
thirteen questions were chosen to capture a range of skills appropriate for grades 4 to grade 6.
The items were selected based on the standardized means for the age-range and the standard
deviations from the mean. Testing was discontinued after 3 consecutive errors. Scoring is the
total number of correct responses. An example of the types of questions posed is shown in Figure
A1. Reliability across the 13 responses was acceptable (Cronbach’s α = .79).
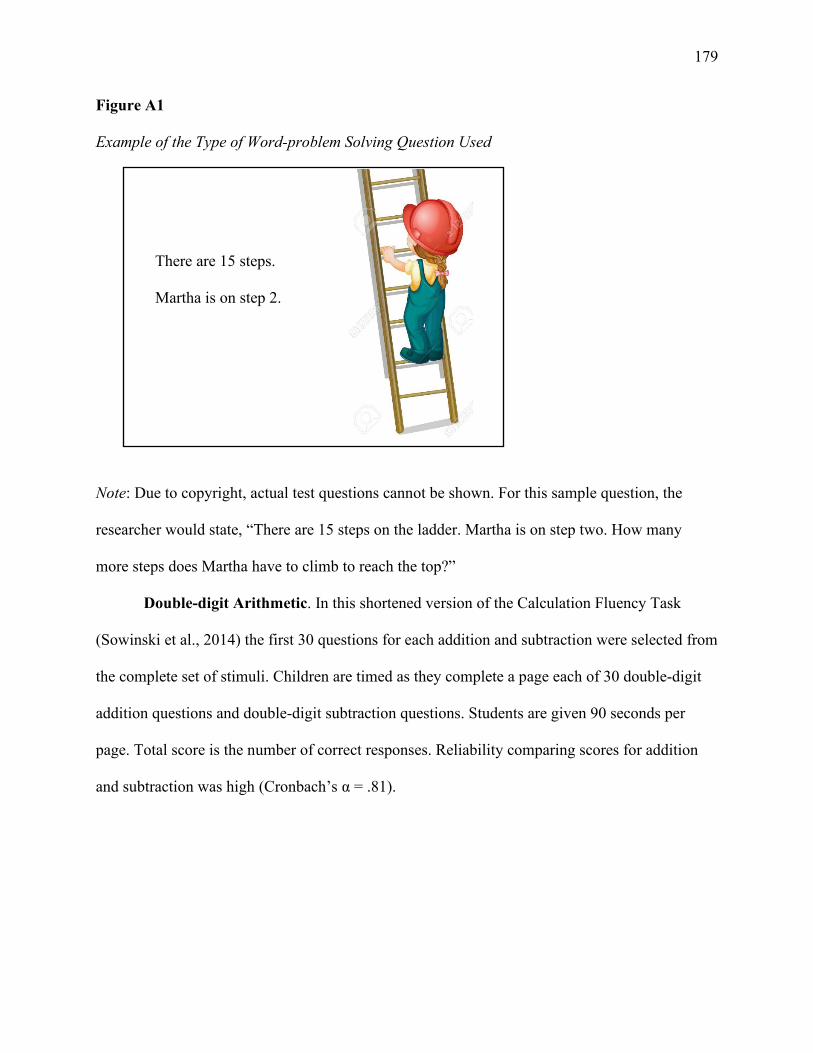
179
Figure A1
Example of the Type of Word-problem Solving Question Used
Note: Due to copyright, actual test questions cannot be shown. For this sample question, the
researcher would state, “There are 15 steps on the ladder. Martha is on step two. How many
more steps does Martha have to climb to reach the top?”
Double-digit Arithmetic. In this shortened version of the Calculation Fluency Task
(Sowinski et al., 2014) the first 30 questions for each addition and subtraction were selected from
the complete set of stimuli. Children are timed as they complete a page each of 30 double-digit
addition questions and double-digit subtraction questions. Students are given 90 seconds per
page. Total score is the number of correct responses. Reliability comparing scores for addition
and subtraction was high (Cronbach’s α = .81).
There are 15 steps.
Martha is on step 2.
180
Appendix B
Mathematical Vocabulary Technical Report - Grades 3 to 6
Test Development
We designed a receptive math vocabulary measure to assess students’ knowledge of
math-specific words used in the classroom. Math vocabulary assessments that are currently
available are designed to assess early vocabulary or tap into both receptive and productive math
vocabulary. For example, many measures are targeted at a younger age group (e.g., Purpura &
Reid, 2016; Toll & Van Luit, 2014) or they involve using manipulatives or providing written
responses (e.g., Powell, Driver, Roberts, & Fall, 2017; Powell & Nelson, 2017). Although these
measures inform our understanding of the role of math vocabulary in math learning, we sought to
create a task that is quick to administer while covering a range of mathematical terms. Receptive
vocabulary assessments are quick and easy to administer so many words can be tested.
Words were chosen to reflect the terminology used in math classrooms in Ontario. A
master list of over 200 words was created using curriculum documents and text glossaries
(Common Core State Standards Initiative, 2010; Manitoba Education, 2013; Ontario Ministry of
Education, 2005). This list was organized by grade and the five math strands described in the
Ontario curriculum. (i.e., numeration, measurement, geometry and spatial sense, patterning and
algebra, data management and probability). The list was narrowed down to 40 common terms by
selecting key words from each of the strands giving a heavier emphasis on numeration words.
The final word list was reviewed by teacher educators.
What does the Mathematical Vocabulary Test measure?
The mathematical vocabulary test is a measure of receptive math vocabulary. Two
versions of the task were created, one for children in grades 2 and 3 (Math vocabulary, primary
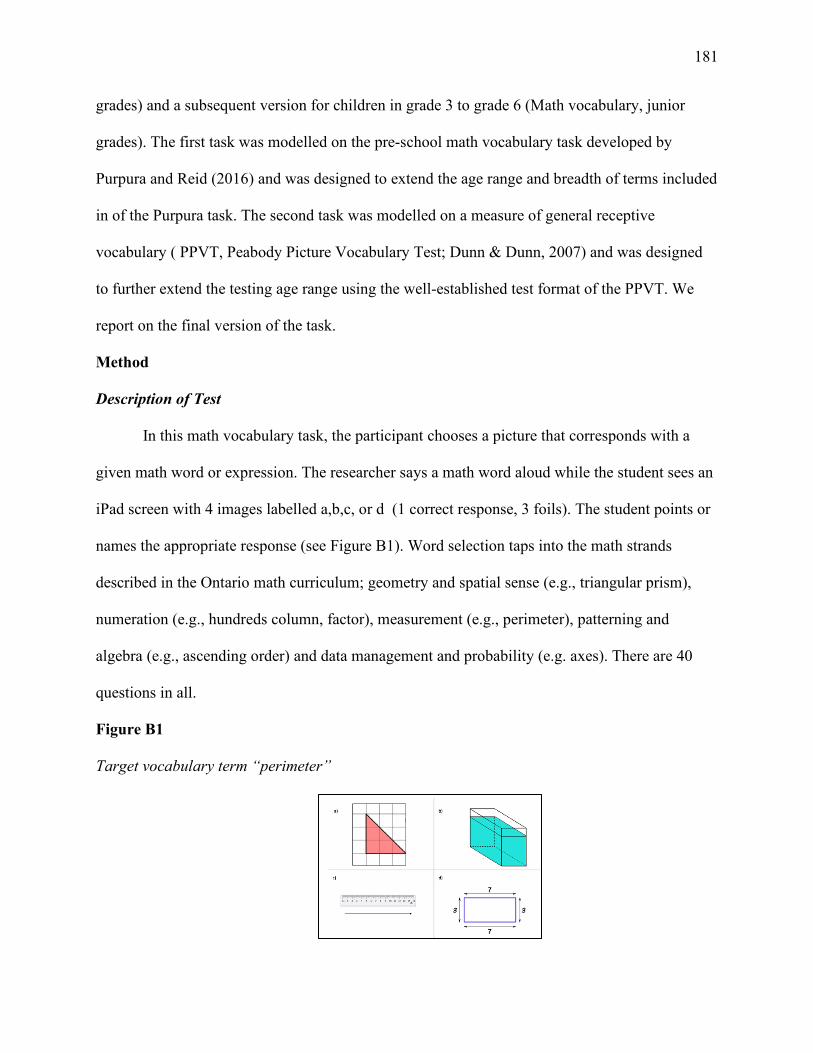
181
grades) and a subsequent version for children in grade 3 to grade 6 (Math vocabulary, junior
grades). The first task was modelled on the pre-school math vocabulary task developed by
Purpura and Reid (2016) and was designed to extend the age range and breadth of terms included
in of the Purpura task. The second task was modelled on a measure of general receptive
vocabulary ( PPVT, Peabody Picture Vocabulary Test; Dunn & Dunn, 2007) and was designed
to further extend the testing age range using the well-established test format of the PPVT. We
report on the final version of the task.
Method
Description of Test
In this math vocabulary task, the participant chooses a picture that corresponds with a
given math word or expression. The researcher says a math word aloud while the student sees an
iPad screen with 4 images labelled a,b,c, or d (1 correct response, 3 foils). The student points or
names the appropriate response (see Figure B1). Word selection taps into the math strands
described in the Ontario math curriculum; geometry and spatial sense (e.g., triangular prism),
numeration (e.g., hundreds column, factor), measurement (e.g., perimeter), patterning and
algebra (e.g., ascending order) and data management and probability (e.g. axes). There are 40
questions in all.
Figure B1
Target vocabulary term “perimeter”
182
Procedure
Administration of the test was approved as part of a larger study involving children in the
Ottawa region. The study was approved by the Carleton University Research Ethics Board and
school board research committees (Ottawa Carleton Research Ethics Committee, Research
Steering Committee of the Upper Canada District School Board). Teachers at participating
schools sent information packages to parents and those whose children wanted to participate
provided informed consent. Children provided verbal assent prior to testing.
Children were tested one-on-one in a quiet area of the school. The tester began by telling
the child that they (the researcher) would read a word or sentence (e.g., “dime”, “which lines are
parallel”) and the child would then select the corresponding picture from the 4 options. The tester
told the child that there were a number of words, some of which the child may not have learned
yet in school. But the child’s job was to just try their best. Children were encouraged to “make a
best guess” and not to skip questions. Anecdotal observations from research assistants indicated
that children guessed accurately on items even though the child lacked confidence in their
response. Children completed additional measures not described here. We report on two
standardized measures included in the test battery, the Key Math Applied Problems Solving
Subset (Connolly, 2007) and the Peabody Picture Vocabulary Test (Dunn & Dunn, 2007).
Sample
Children (N=217, NGirls =106, Mage = 9year:9month) were tested in the fall or winter of
the 2018-2019 school year. Children were taught math in English and English was the first
language for 83% (N=181) of children. The most common non-English first languages spoken
were Mandarin (N= 9, 4 %,) and Arabic (N= 9, 4 %). All children were tested in English. Parents
were well educated. Only 3% of fathers and 1% of mothers did not complete high school.
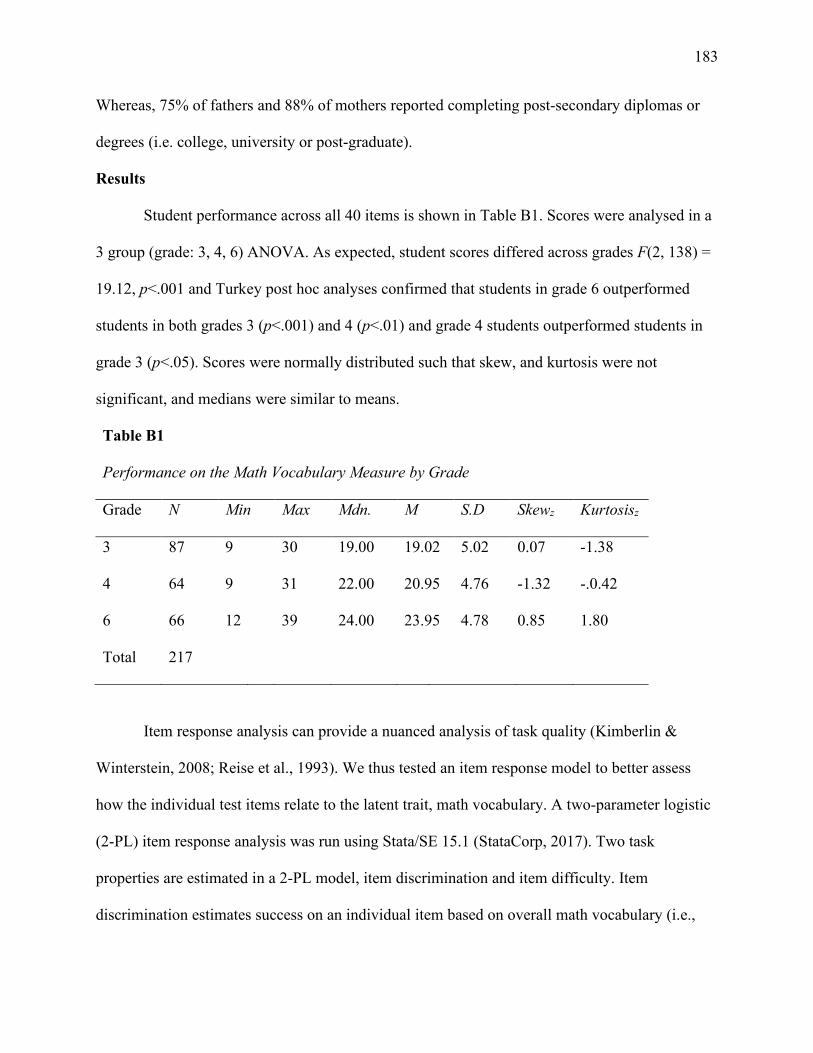
183
Whereas, 75% of fathers and 88% of mothers reported completing post-secondary diplomas or
degrees (i.e. college, university or post-graduate).
Results
Student performance across all 40 items is shown in Table B1. Scores were analysed in a
3 group (grade: 3, 4, 6) ANOVA. As expected, student scores differed across grades F(2, 138) =
19.12, p<.001 and Turkey post hoc analyses confirmed that students in grade 6 outperformed
students in both grades 3 (p<.001) and 4 (p<.01) and grade 4 students outperformed students in
grade 3 (p<.05). Scores were normally distributed such that skew, and kurtosis were not
significant, and medians were similar to means.
Table B1
Performance on the Math Vocabulary Measure by Grade
Grade N Min Max Mdn. M S.D Skewz Kurtosisz
3 87 9 30 19.00 19.02 5.02 0.07 -1.38
4 64 9 31 22.00 20.95 4.76 -1.32 -.0.42
6 66 12 39 24.00 23.95 4.78 0.85 1.80
Total 217
Item response analysis can provide a nuanced analysis of task quality (Kimberlin &
Winterstein, 2008; Reise et al., 1993). We thus tested an item response model to better assess
how the individual test items relate to the latent trait, math vocabulary. A two-parameter logistic
(2-PL) item response analysis was run using Stata/SE 15.1 (StataCorp, 2017). Two task
properties are estimated in a 2-PL model, item discrimination and item difficulty. Item
discrimination estimates success on an individual item based on overall math vocabulary (i.e.,
184
the latent trait estimate). A high positive discrimination level indicates that the item differentiates
well between low and high levels of math vocabulary. In contrast, a negative discrimination level
indicates that high scoring students are less likely to choose the correct item than low scoring
students. The difficulty parameter is an indication of where the item fits in terms of ability. If the
difficulty parameter is low, the probability of success on the item is high. The higher the
difficulty, the lower the probability of success on the item. Reviewing these properties we can
select test items with a range of difficulty that positively discriminate between low and high
levels of math vocabulary knowledge.
Based on the item response model, 4 test items were discarded. First, we examined
discrimination values. The terms unit fraction, variable, perpendicular and integer all had
negative discrimination values (see Table B2) thus were excluded from further analysis. Further,
scores on these 4 items did not correlate with total performance. Next we looked at difficulty
values. We wanted to include items with a range of difficulty, and we were most interested in
identifying performance of typical students, not differentiating struggling or gifted students.
Difficulty ratings for the remaining 36 items ranged broadly from easy (cylinder, b=-9.02) to
difficult (equivalent fraction, b=4.02). To determine the range of skill best differentiated by the
math vocabulary measure we refer to the test information function (TIF) graph (see Figure B2).
Using the TIF we can determine the range of performance (indicated by the 𝜃𝜃 value, the latent
trait math vocabulary) where the information we predict exceeds error associated with the
estimates. As shown in Figure B.2, our 36-item measure provides the most information for
students located near 𝜃𝜃=0 and information exceeds error on a broad range of performance levels
(-3.0<𝜃𝜃 >1.8). This finding suggests our task captures a range math vocabulary skill and can be
used to differentiate vocabulary performance amongst low to above average performing students
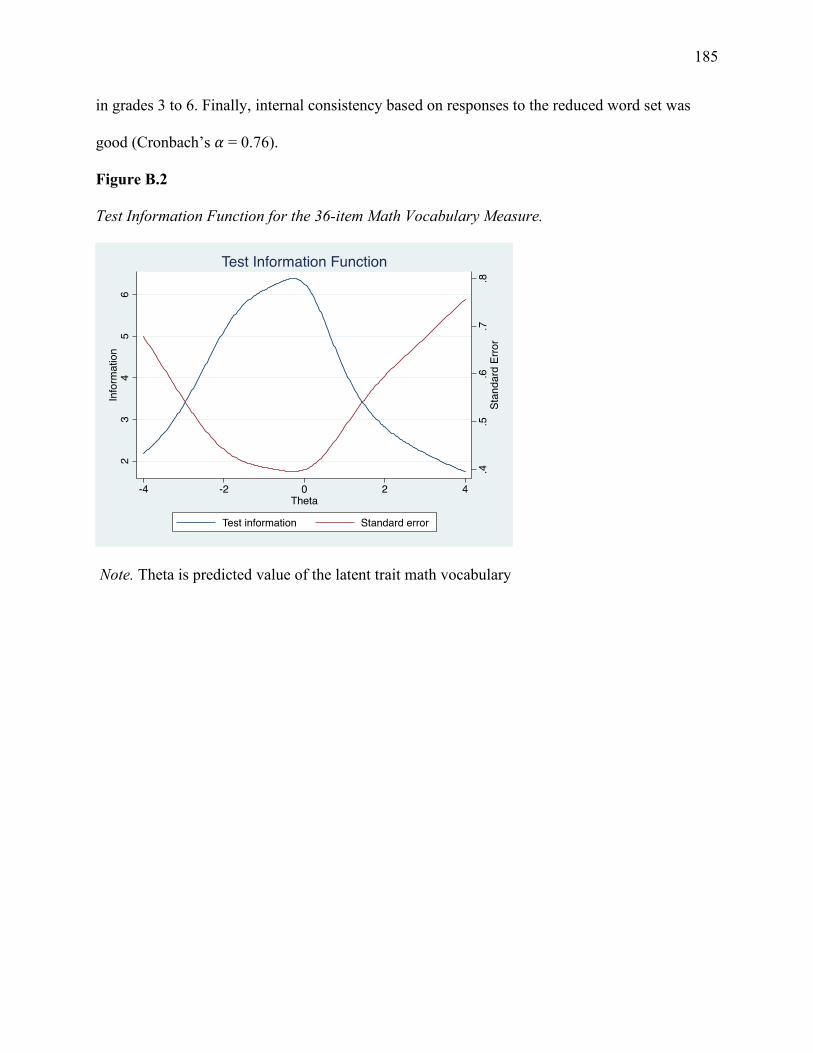
185
in grades 3 to 6. Finally, internal consistency based on responses to the reduced word set was
good (Cronbach’s 𝛼𝛼 = 0.76).
Figure B.2
Test Information Function for the 36-item Math Vocabulary Measure.
Note. Theta is predicted value of the latent trait math vocabulary
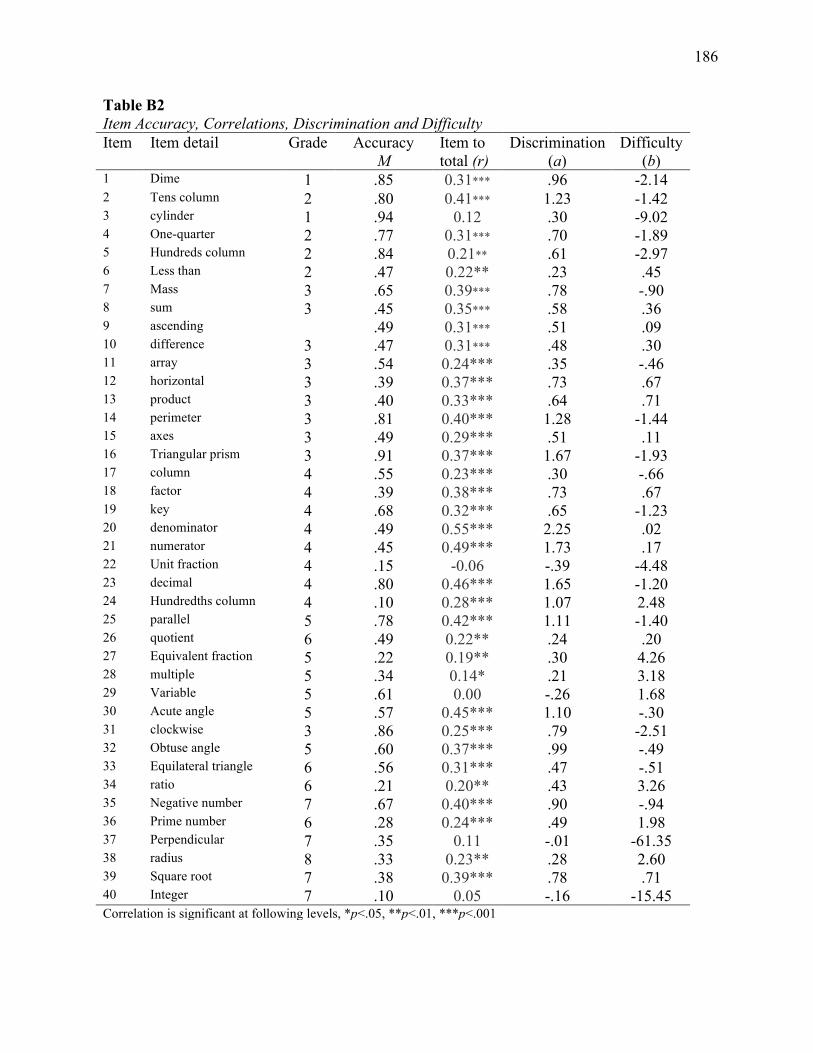
186
Table B2 Item Accuracy, Correlations, Discrimination and Difficulty Item
Item detail Grade Accuracy M
Item to total (r)
Discrimination (a)
Difficulty (b)
1 Dime 1 .85 0.31*** .96 -2.14 2 Tens column 2 .80 0.41*** 1.23 -1.42 3 cylinder 1 .94 0.12 .30 -9.02 4 One-quarter 2 .77 0.31*** .70 -1.89 5 Hundreds column 2 .84 0.21** .61 -2.97 6 Less than 2 .47 0.22** .23 .45 7 Mass 3 .65 0.39*** .78 -.90 8 sum 3 .45 0.35*** .58 .36 9 ascending .49 0.31*** .51 .09 10 difference 3 .47 0.31*** .48 .30 11 array 3 .54 0.24*** .35 -.46 12 horizontal 3 .39 0.37*** .73 .67 13 product 3 .40 0.33*** .64 .71 14 perimeter 3 .81 0.40*** 1.28 -1.44 15 axes 3 .49 0.29*** .51 .11 16 Triangular prism 3 .91 0.37*** 1.67 -1.93 17 column 4 .55 0.23*** .30 -.66 18 factor 4 .39 0.38*** .73 .67 19 key 4 .68 0.32*** .65 -1.23 20 denominator 4 .49 0.55*** 2.25 .02 21 numerator 4 .45 0.49*** 1.73 .17 22 Unit fraction 4 .15 -0.06 -.39 -4.48 23 decimal 4 .80 0.46*** 1.65 -1.20 24 Hundredths column 4 .10 0.28*** 1.07 2.48 25 parallel 5 .78 0.42*** 1.11 -1.40 26 quotient 6 .49 0.22** .24 .20 27 Equivalent fraction 5 .22 0.19** .30 4.26 28 multiple 5 .34 0.14* .21 3.18 29 Variable 5 .61 0.00 -.26 1.68 30 Acute angle 5 .57 0.45*** 1.10 -.30 31 clockwise 3 .86 0.25*** .79 -2.51 32 Obtuse angle 5 .60 0.37*** .99 -.49 33 Equilateral triangle 6 .56 0.31*** .47 -.51 34 ratio 6 .21 0.20** .43 3.26 35 Negative number 7 .67 0.40*** .90 -.94 36 Prime number 6 .28 0.24*** .49 1.98 37 Perpendicular 7 .35 0.11 -.01 -61.35 38 radius 8 .33 0.23** .28 2.60 39 Square root 7 .38 0.39*** .78 .71 40 Integer 7 .10 0.05 -.16 -15.45 Correlation is significant at following levels, *p<.05, **p<.01, ***p<.001
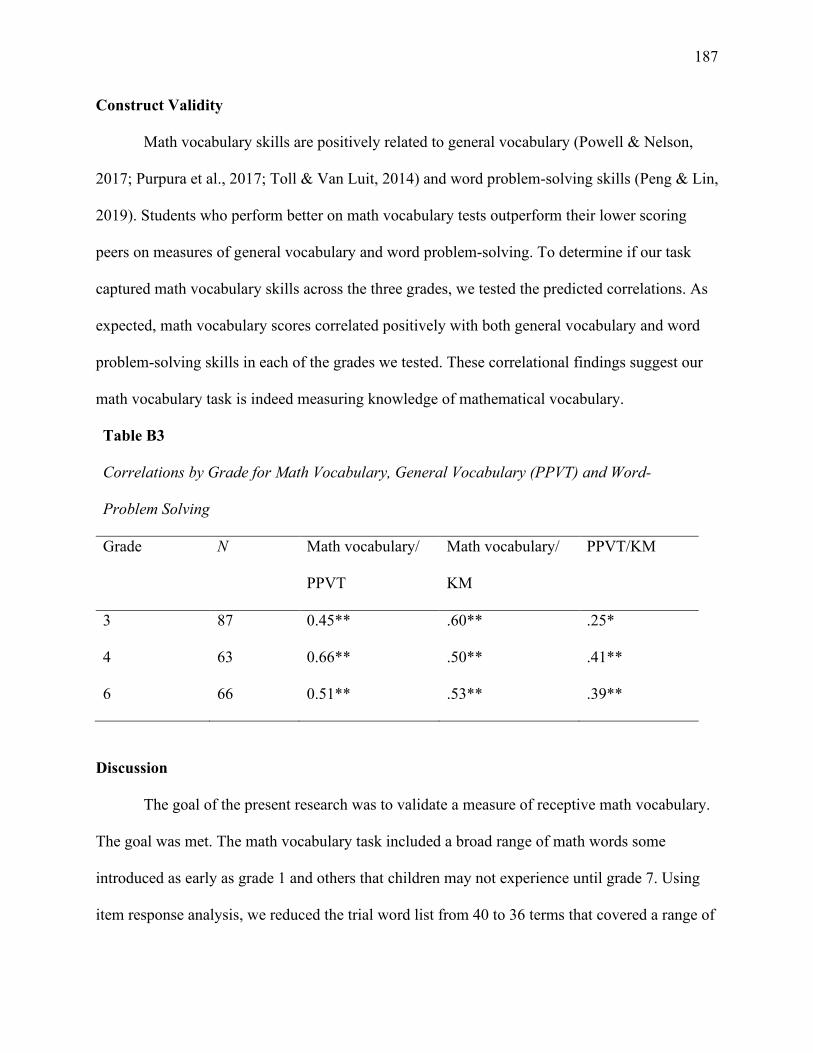
187
Construct Validity
Math vocabulary skills are positively related to general vocabulary (Powell & Nelson,
2017; Purpura et al., 2017; Toll & Van Luit, 2014) and word problem-solving skills (Peng & Lin,
2019). Students who perform better on math vocabulary tests outperform their lower scoring
peers on measures of general vocabulary and word problem-solving. To determine if our task
captured math vocabulary skills across the three grades, we tested the predicted correlations. As
expected, math vocabulary scores correlated positively with both general vocabulary and word
problem-solving skills in each of the grades we tested. These correlational findings suggest our
math vocabulary task is indeed measuring knowledge of mathematical vocabulary.
Table B3
Correlations by Grade for Math Vocabulary, General Vocabulary (PPVT) and Word-
Problem Solving
Grade N Math vocabulary/
PPVT
Math vocabulary/
KM
PPVT/KM
3 87 0.45** .60** .25*
4 63 0.66** .50** .41**
6 66 0.51** .53** .39**
Discussion
The goal of the present research was to validate a measure of receptive math vocabulary.
The goal was met. The math vocabulary task included a broad range of math words some
introduced as early as grade 1 and others that children may not experience until grade 7. Using
item response analysis, we reduced the trial word list from 40 to 36 terms that covered a range of
188
math concepts and terminology. Further, we confirmed that the items varied in difficulty and
could differentiate performance amongst low to high performing students. The task however is
not designed to identify remedial or gifted students. Students in grades 3, 4 and 6 successfully
completed the task. As anticipated, the older students scored higher than the younger students
and scores were normally distributed within grades indicating the task was neither too easy nor
too hard for the students tested. The task had good internal consistency and based on correlations
with general vocabulary and math problem solving we conclude that the task also has strong
construct validity.
189
Appendix C
Item Analysis for the Extended Version of the Children’s Symbol Decision Task
To better understand and validate the extended version of the Symbol Decision Task
(SDT-Child) we analysed item accuracy and estimated the discrimination and difficulty of each
item using an IRT model. Using the findings from item analyses we determined which if any
items should be discarded.
Students accurately accepted most conventional stimuli and rejected most non-
conventional stimuli (see Table C1). Exceptions included the formula for area (item 53, A = l x
w) which was consistently rejected indicating students were unfamiliar with this symbolic text.
Further, the mean accuracy on the area item was not correlated with total mean accuracy on
conventional items suggesting it may be problematic. Similarly, students mistakenly classified
items 48 and 60 (20% and 0.25¢) as correct indicating a lack of familiarity with these items.
Further, mean accuracy on these two non-conventional items did not correlate with mean non-
conventional item accuracy. Reviewing item accuracy, we identified three potentially
problematic stimuli.
To determine if the three low-accuracy items should be excluded from the final score, we
assessed the discrimination value and difficulty of the items using an IRT model. If the low
accuracy items have either a negative or low discrimination value, we can conclude that they do
not help differentiate student performance and can potentially be excluded from the total score.
If, however the discrimination values are positive and strong, we can conclude that the items
should be included in the total score. To evaluate the difficulty ratings, large negative values
represent the least difficult items whereas large positive values represent the most difficult items.
Ideally, we want the scales (conventional, non-conventional) to reflect a range of difficulty to
190
ensure they are neither too easy nor too hard. First, we examined the conventional items. Item 53
had a low discrimination value (a = .05) and was very difficult (b = 36.8). We therefore excluded
this item and its corresponding non-conventional transformation item 54. Next we considered the
non-conventional items. Both item 48 (20%) and 60 (0.25¢) had low discrimination values (a=
.01=, a=-.14 respectively) and extreme difficulty ratings (b=13.3 and b=-13.5 respectively). All
three low-accuracy items and their paired conventional/non-conventional matches were thus
excluded from the final score.
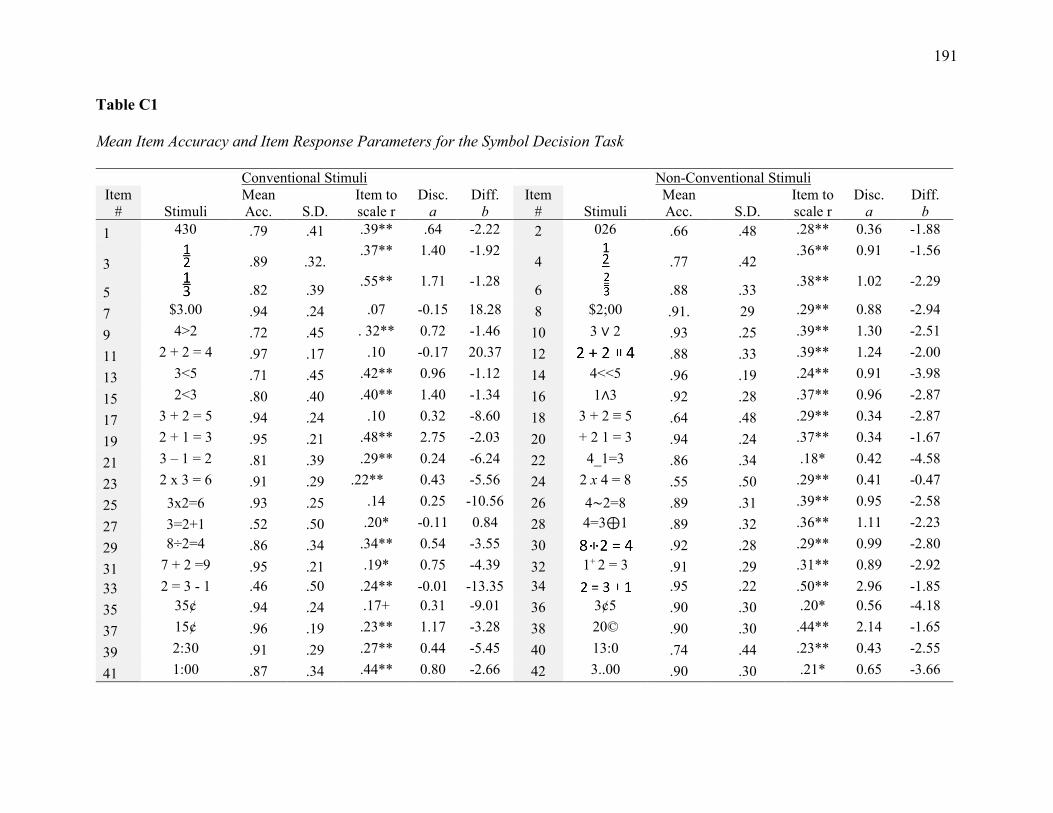
191
Table C1 Mean Item Accuracy and Item Response Parameters for the Symbol Decision Task
Conventional Stimuli Non-Conventional Stimuli Item
# Stimuli Mean Acc. S.D.
Item to scale r
Disc. a
Diff. b
Item # Stimuli
Mean Acc. S.D.
Item to scale r
Disc. a
Diff. b
1 430 .79 .41 .39** .64 -2.22 2 026 .66 .48 .28** 0.36 -1.88
3 .89 .32. .37** 1.40 -1.92
4 .77 .42 .36** 0.91 -1.56
5 .82 .39 .55** 1.71 -1.28 6 .88 .33 .38** 1.02 -2.29
7 $3.00 .94 .24 .07 -0.15 18.28 8 $2;00 .91. 29 .29** 0.88 -2.94
9 4>2 .72 .45 . 32** 0.72 -1.46 10 3 ∨ 2 .93 .25 .39** 1.30 -2.51
11 2 + 2 = 4 .97 .17 .10 -0.17 20.37 12 .88 .33 .39** 1.24 -2.00
13 3<5 .71 .45 .42** 0.96 -1.12 14 4<<5 .96 .19 .24** 0.91 -3.98
15 2<3 .80 .40 .40** 1.40 -1.34 16 1∧3 .92 .28 .37** 0.96 -2.87
17 3 + 2 = 5 .94 .24 .10 0.32 -8.60 18 3 + 2 ≡ 5 .64 .48 .29** 0.34 -2.87
19 2 + 1 = 3 .95 .21 .48** 2.75 -2.03 20 + 2 1 = 3 .94 .24 .37** 0.34 -1.67
21 3 – 1 = 2 .81 .39 .29** 0.24 -6.24 22 4_1=3 .86 .34 .18* 0.42 -4.58
23 2 x 3 = 6 .91 .29 .22** 0.43 -5.56 24 2 x 4 = 8 .55 .50 .29** 0.41 -0.47
25 3x2=6 .93 .25 .14 0.25 -10.56 26 4∼2=8 .89 .31 .39** 0.95 -2.58
27 3=2+1 .52 .50 .20* -0.11 0.84 28 4=3⊕1 .89 .32 .36** 1.11 -2.23
29 8÷2=4 .86 .34 .34** 0.54 -3.55 30 .92 .28 .29** 0.99 -2.80
31 7 + 2 =9 .95 .21 .19* 0.75 -4.39 32 1+ 2 = 3 .91 .29 .31** 0.89 -2.92 33 2 = 3 - 1 .46 .50 .24** -0.01 -13.35 34 .95 .22 .50** 2.96 -1.85 35 35¢ .94 .24 .17+ 0.31 -9.01 36 3¢5 .90 .30 .20* 0.56 -4.18
37 15¢ .96 .19 .23** 1.17 -3.28 38 20© .90 .30 .44** 2.14 -1.65
39 2:30 .91 .29 .27** 0.44 -5.45 40 13:0 .74 .44 .23** 0.43 -2.55
41 1:00 .87 .34 .44** 0.80 -2.66 42 3..00 .90 .30 .21* 0.65 -3.66
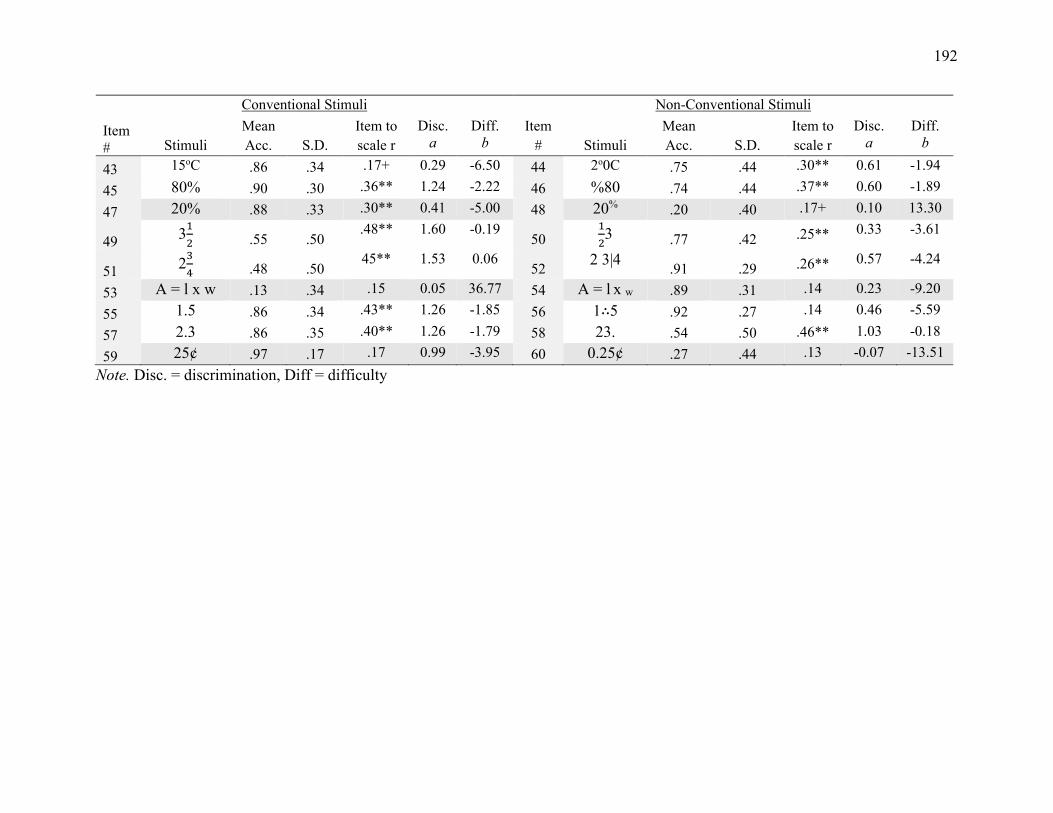
192
Conventional Stimuli Non-Conventional Stimuli
Item # Stimuli
Mean Acc. S.D.
Item to scale r
Disc. a
Diff. b
Item # Stimuli
Mean Acc. S.D.
Item to scale r
Disc. a
Diff. b
43 15oC .86 .34 .17+ 0.29 -6.50 44 2o0C .75 .44 .30** 0.61 -1.94
45 80% .90 .30 .36** 1.24 -2.22 46 %80 .74 .44 .37** 0.60 -1.89
47 20% .88 .33 .30** 0.41 -5.00 48 20% .20 .40 .17+ 0.10 13.30
49 312 .55 .50
.48** 1.60 -0.19 50
123 .77 .42 .25** 0.33 -3.61
51 234 .48 .50
45** 1.53 0.06 52 2 3|4 .91 .29 .26** 0.57 -4.24
53 A = l x w .13 .34 .15 0.05 36.77 54 A = l x w .89 .31 .14 0.23 -9.20
55 1.5 .86 .34 .43** 1.26 -1.85 56 1∴5 .92 .27 .14 0.46 -5.59
57 2.3 .86 .35 .40** 1.26 -1.79 58 23. .54 .50 .46** 1.03 -0.18
59 25¢ .97 .17 .17 0.99 -3.95 60 0.25¢ .27 .44 .13 -0.07 -13.51 Note. Disc. = discrimination, Diff = difficulty
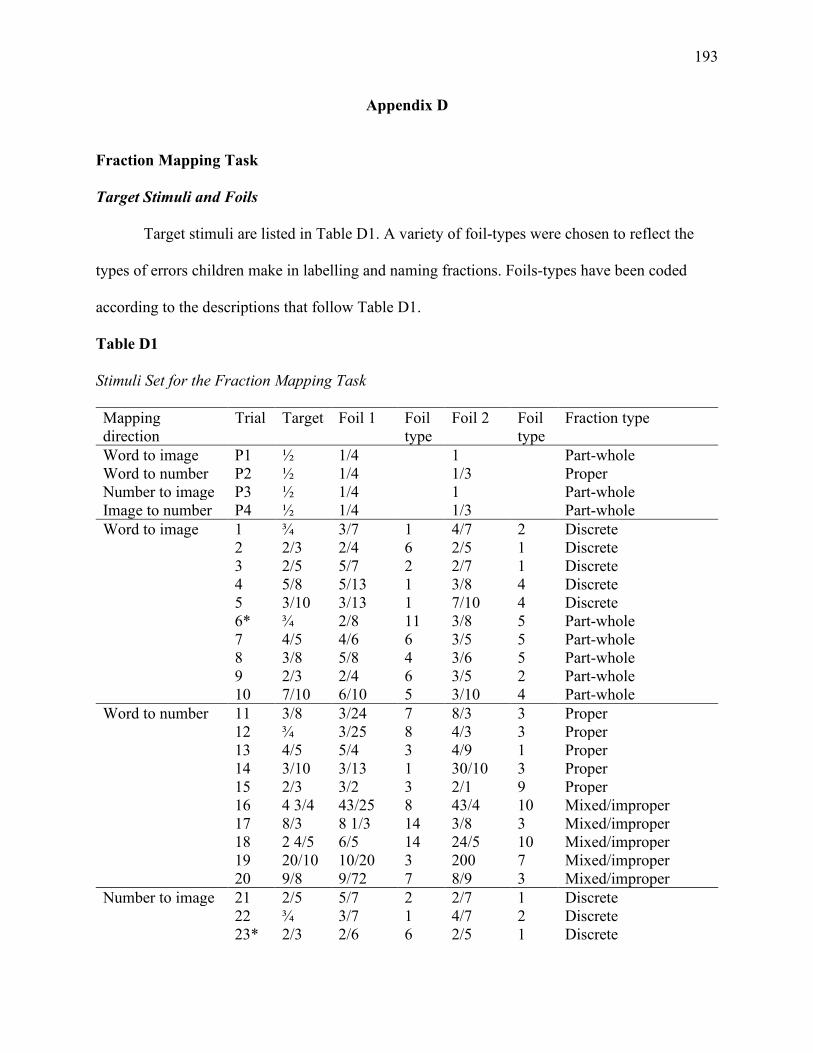
193
Appendix D
Fraction Mapping Task
Target Stimuli and Foils
Target stimuli are listed in Table D1. A variety of foil-types were chosen to reflect the
types of errors children make in labelling and naming fractions. Foils-types have been coded
according to the descriptions that follow Table D1.
Table D1 Stimuli Set for the Fraction Mapping Task Mapping direction
Trial Target Foil 1 Foil type
Foil 2 Foil type
Fraction type
Word to image P1 ½ 1/4 1 Part-whole Word to number P2 ½ 1/4 1/3 Proper Number to image P3 ½ 1/4 1 Part-whole Image to number P4 ½ 1/4 1/3 Part-whole Word to image 1 ¾ 3/7 1 4/7 2 Discrete 2 2/3 2/4 6 2/5 1 Discrete 3 2/5 5/7 2 2/7 1 Discrete 4 5/8 5/13 1 3/8 4 Discrete 5 3/10 3/13 1 7/10 4 Discrete 6* ¾ 2/8 11 3/8 5 Part-whole 7 4/5 4/6 6 3/5 5 Part-whole 8 3/8 5/8 4 3/6 5 Part-whole 9 2/3 2/4 6 3/5 2 Part-whole 10 7/10 6/10 5 3/10 4 Part-whole Word to number 11 3/8 3/24 7 8/3 3 Proper 12 ¾ 3/25 8 4/3 3 Proper 13 4/5 5/4 3 4/9 1 Proper 14 3/10 3/13 1 30/10 3 Proper 15 2/3 3/2 3 2/1 9 Proper 16 4 3/4 43/25 8 43/4 10 Mixed/improper 17 8/3 8 1/3 14 3/8 3 Mixed/improper 18 2 4/5 6/5 14 24/5 10 Mixed/improper 19 20/10 10/20 3 200 7 Mixed/improper 20 9/8 9/72 7 8/9 3 Mixed/improper Number to image 21 2/5 5/7 2 2/7 1 Discrete 22 ¾ 3/7 1 4/7 2 Discrete 23* 2/3 2/6 6 2/5 1 Discrete
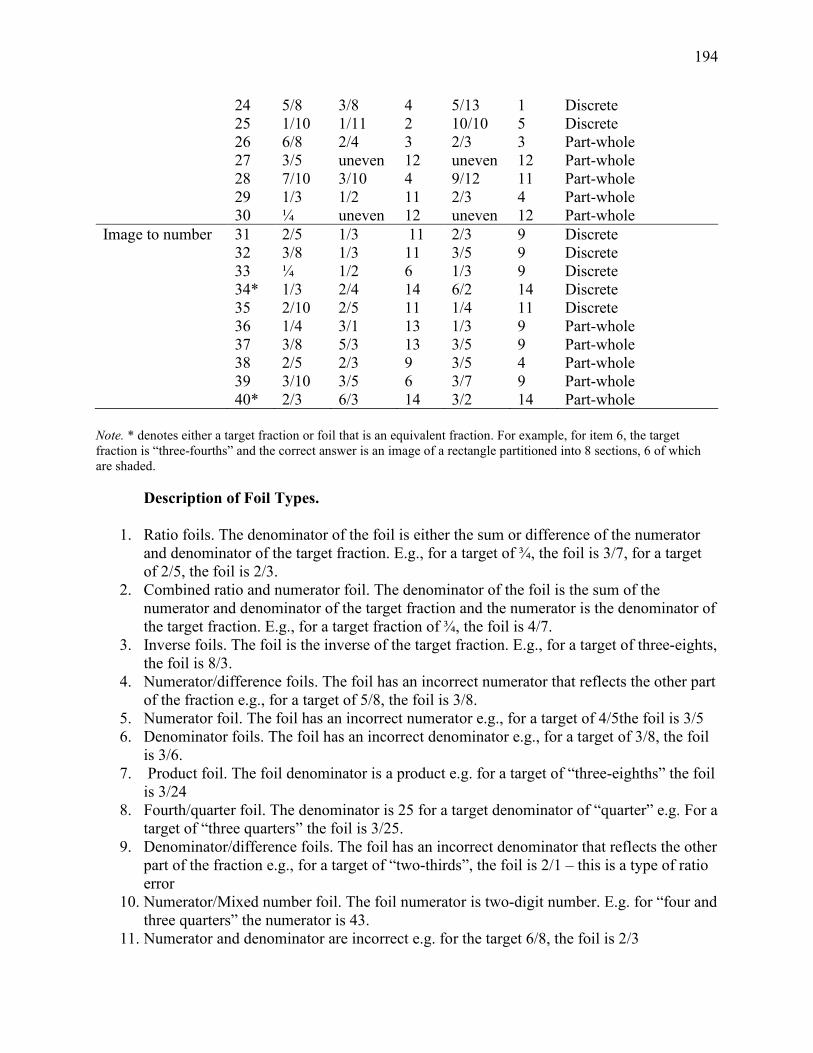
194
24 5/8 3/8 4 5/13 1 Discrete 25 1/10 1/11 2 10/10 5 Discrete 26 6/8 2/4 3 2/3 3 Part-whole 27 3/5 uneven 12 uneven 12 Part-whole 28 7/10 3/10 4 9/12 11 Part-whole 29 1/3 1/2 11 2/3 4 Part-whole 30 ¼ uneven 12 uneven 12 Part-whole Image to number 31 2/5 1/3 11 2/3 9 Discrete 32 3/8 1/3 11 3/5 9 Discrete 33 ¼ 1/2 6 1/3 9 Discrete 34* 1/3 2/4 14 6/2 14 Discrete 35 2/10 2/5 11 1/4 11 Discrete 36 1/4 3/1 13 1/3 9 Part-whole 37 3/8 5/3 13 3/5 9 Part-whole 38 2/5 2/3 9 3/5 4 Part-whole 39 3/10 3/5 6 3/7 9 Part-whole 40* 2/3 6/3 14 3/2 14 Part-whole
Note. * denotes either a target fraction or foil that is an equivalent fraction. For example, for item 6, the target fraction is “three-fourths” and the correct answer is an image of a rectangle partitioned into 8 sections, 6 of which are shaded.
Description of Foil Types.
1. Ratio foils. The denominator of the foil is either the sum or difference of the numerator and denominator of the target fraction. E.g., for a target of ¾, the foil is 3/7, for a target of 2/5, the foil is 2/3.
2. Combined ratio and numerator foil. The denominator of the foil is the sum of the numerator and denominator of the target fraction and the numerator is the denominator of the target fraction. E.g., for a target fraction of ¾, the foil is 4/7.
3. Inverse foils. The foil is the inverse of the target fraction. E.g., for a target of three-eights, the foil is 8/3.
4. Numerator/difference foils. The foil has an incorrect numerator that reflects the other part of the fraction e.g., for a target of 5/8, the foil is 3/8.
5. Numerator foil. The foil has an incorrect numerator e.g., for a target of 4/5the foil is 3/5 6. Denominator foils. The foil has an incorrect denominator e.g., for a target of 3/8, the foil
is 3/6. 7. Product foil. The foil denominator is a product e.g. for a target of “three-eighths” the foil
is 3/24 8. Fourth/quarter foil. The denominator is 25 for a target denominator of “quarter” e.g. For a
target of “three quarters” the foil is 3/25. 9. Denominator/difference foils. The foil has an incorrect denominator that reflects the other
part of the fraction e.g., for a target of “two-thirds”, the foil is 2/1 – this is a type of ratio error
10. Numerator/Mixed number foil. The foil numerator is two-digit number. E.g. for “four and three quarters” the numerator is 43.
11. Numerator and denominator are incorrect e.g. for the target 6/8, the foil is 2/3
195
12. Uneven segments – the foil is portioned unevenly 13. Combined ratio and inverse 14. Other
Task Validation
To validate the fraction mapping task and identify possible problematic test items we first
assessed internal consistency across all 40 items. Internal reliability was strong (Cronbach’s 𝛼𝛼 =
0.88) indicating the students responded consistently to the items.
Next we looked at item responses and conducted a two-parameter logistic (2-PL) item
response analysis using Stata/SE 15.1 (StataCorp, 2017). The 2PL model estimates
discrimination (a) and difficulty (b) levels for each test item. Item discrimination (a) estimates
the probability of success as skill-level changes. A test item that negatively discriminates (a<0)
is problematic because the probability of success on that item increases as skill level decreases.
All items had positive a-values indicating that each item positively discriminated between skilled
and un-skilled levels of performance (see Table D2). Item difficulty captures the probability of
success on an individual item and is a standardized normal score. Thus, negative b-values are
relatively easy items whereas positive b-values are relatively hard. We wanted to include items
with a range of difficulty levels and as shown in Table D2, we were successful as item difficulty
ranged from b=-7.01 to b=4.9. Further, as indicated by the test information function graph (see
Figure D1), our measure provides the most information (task information > task error) for
students with latent trait scores between 𝜃𝜃=-2 to 𝜃𝜃=1 which corresponds to test scores of 13 to 34
(see Figure D2). With actual scores ranging from 12 to 39 and a mean score of 27.9, the task
differentiates fraction mapping performance amongst low to above average performing students.
Based on the internal consistency and item response analysis, all 40 items will be included in the
total performance score.
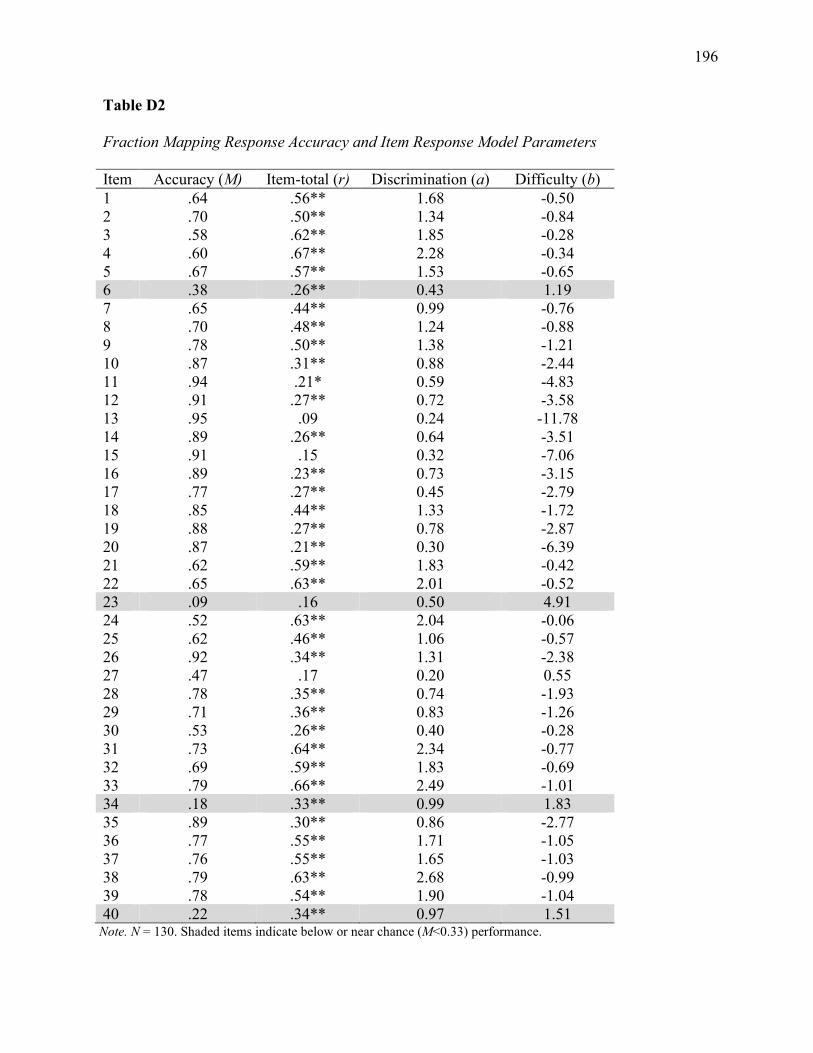
196
Table D2 Fraction Mapping Response Accuracy and Item Response Model Parameters
Item Accuracy (M) Item-total (r) Discrimination (a) Difficulty (b) 1 .64 .56** 1.68 -0.50 2 .70 .50** 1.34 -0.84 3 .58 .62** 1.85 -0.28 4 .60 .67** 2.28 -0.34 5 .67 .57** 1.53 -0.65 6 .38 .26** 0.43 1.19 7 .65 .44** 0.99 -0.76 8 .70 .48** 1.24 -0.88 9 .78 .50** 1.38 -1.21 10 .87 .31** 0.88 -2.44 11 .94 .21* 0.59 -4.83 12 .91 .27** 0.72 -3.58 13 .95 .09 0.24 -11.78 14 .89 .26** 0.64 -3.51 15 .91 .15 0.32 -7.06 16 .89 .23** 0.73 -3.15 17 .77 .27** 0.45 -2.79 18 .85 .44** 1.33 -1.72 19 .88 .27** 0.78 -2.87 20 .87 .21** 0.30 -6.39 21 .62 .59** 1.83 -0.42 22 .65 .63** 2.01 -0.52 23 .09 .16 0.50 4.91 24 .52 .63** 2.04 -0.06 25 .62 .46** 1.06 -0.57 26 .92 .34** 1.31 -2.38 27 .47 .17 0.20 0.55 28 .78 .35** 0.74 -1.93 29 .71 .36** 0.83 -1.26 30 .53 .26** 0.40 -0.28 31 .73 .64** 2.34 -0.77 32 .69 .59** 1.83 -0.69 33 .79 .66** 2.49 -1.01 34 .18 .33** 0.99 1.83 35 .89 .30** 0.86 -2.77 36 .77 .55** 1.71 -1.05 37 .76 .55** 1.65 -1.03 38 .79 .63** 2.68 -0.99 39 .78 .54** 1.90 -1.04 40 .22 .34** 0.97 1.51
Note. N = 130. Shaded items indicate below or near chance (M<0.33) performance.
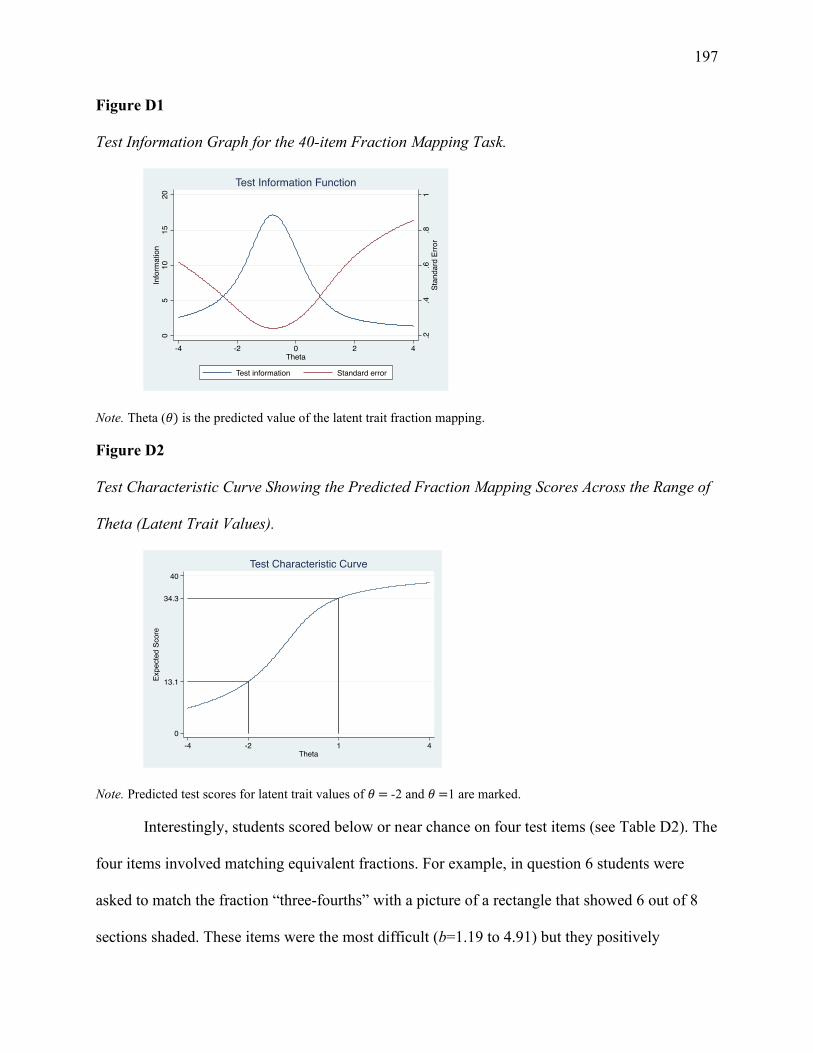
197
Figure D1
Test Information Graph for the 40-item Fraction Mapping Task.
Note. Theta (𝜃𝜃) is the predicted value of the latent trait fraction mapping.
Figure D2
Test Characteristic Curve Showing the Predicted Fraction Mapping Scores Across the Range of
Theta (Latent Trait Values).
Note. Predicted test scores for latent trait values of 𝜃𝜃 = -2 and 𝜃𝜃 =1 are marked.
Interestingly, students scored below or near chance on four test items (see Table D2). The
four items involved matching equivalent fractions. For example, in question 6 students were
asked to match the fraction “three-fourths” with a picture of a rectangle that showed 6 out of 8
sections shaded. These items were the most difficult (b=1.19 to 4.91) but they positively

198
discriminated performance (a = 0.43 to 0.99) thus were included in the final task scoring.
However, because these 4-items were not equally balanced across the mapping formats and
representation types, they were not included in analyses comparing performance across different
mapping formats and representations.
199
Appendix E
Fraction Skills Assessment
A number of resources were referenced to develop this test measure. To ensure questions
reflected what students were learning, questions were adapted from the Ontario Math Makes
Sense text and practice booklets and the Grade 6 EQAO (Education Quality and Accountability
Office) standardized test. Jump Math support documents were also referenced. To align with
previous fraction research, questions were included from the Fraction Test Battery (Fuchs et al.,
2017) and two versions of the Conceptual Procedural Fraction Measure (Hallett et al., 2010,
2012). These two tests (Fraction test battery and Conceptual and procedural fraction measure)
could not be used in their entirety since many of the questions involved procedures such as
fraction multiplication and division that are introduced in grades 7 and 8 in Ontario.
The underlying purpose of the measure was to target students’ knowledge of fraction
concepts and procedures. Conceptual items captured knowledge of fraction magnitude and
fraction facts whereas procedural items involved fraction operations.
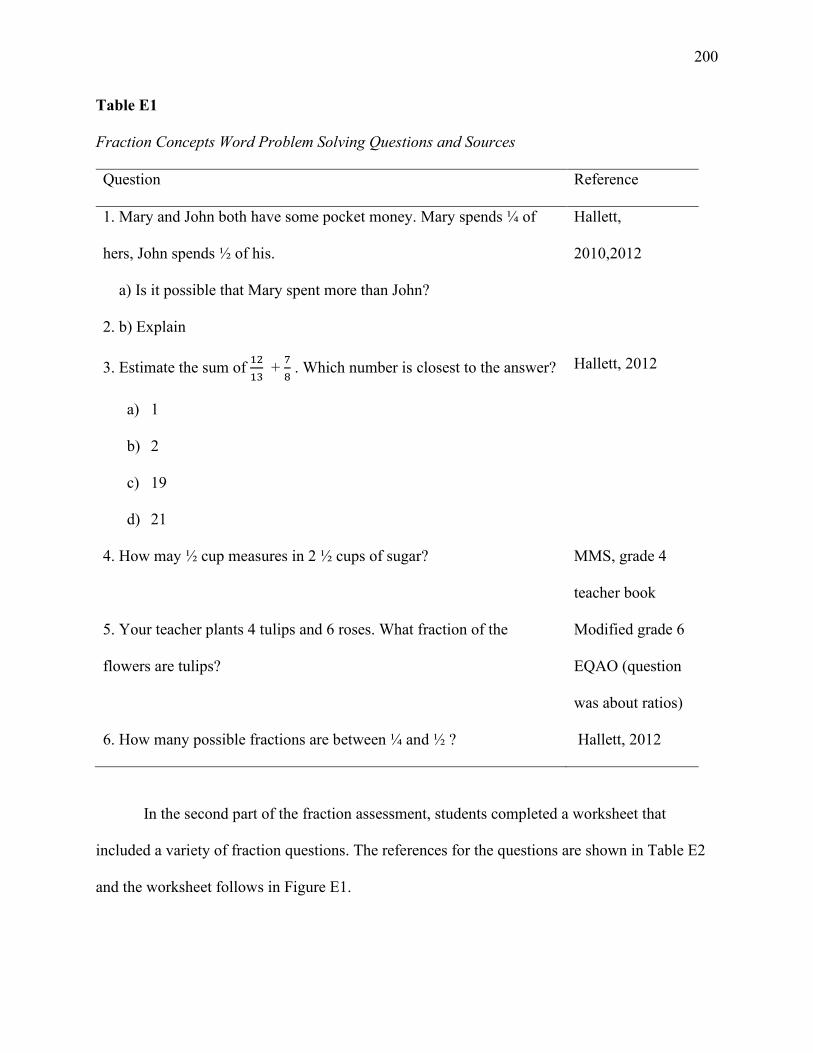
200
Table E1
Fraction Concepts Word Problem Solving Questions and Sources
Question Reference
1. Mary and John both have some pocket money. Mary spends ¼ of
hers, John spends ½ of his.
a) Is it possible that Mary spent more than John?
2. b) Explain
Hallett,
2010,2012
3. Estimate the sum of 1213
+ 78 . Which number is closest to the answer?
a) 1
b) 2
c) 19
d) 21
Hallett, 2012
4. How may ½ cup measures in 2 ½ cups of sugar? MMS, grade 4
teacher book
5. Your teacher plants 4 tulips and 6 roses. What fraction of the
flowers are tulips?
Modified grade 6
EQAO (question
was about ratios)
6. How many possible fractions are between ¼ and ½ ? Hallett, 2012
In the second part of the fraction assessment, students completed a worksheet that
included a variety of fraction questions. The references for the questions are shown in Table E2
and the worksheet follows in Figure E1.
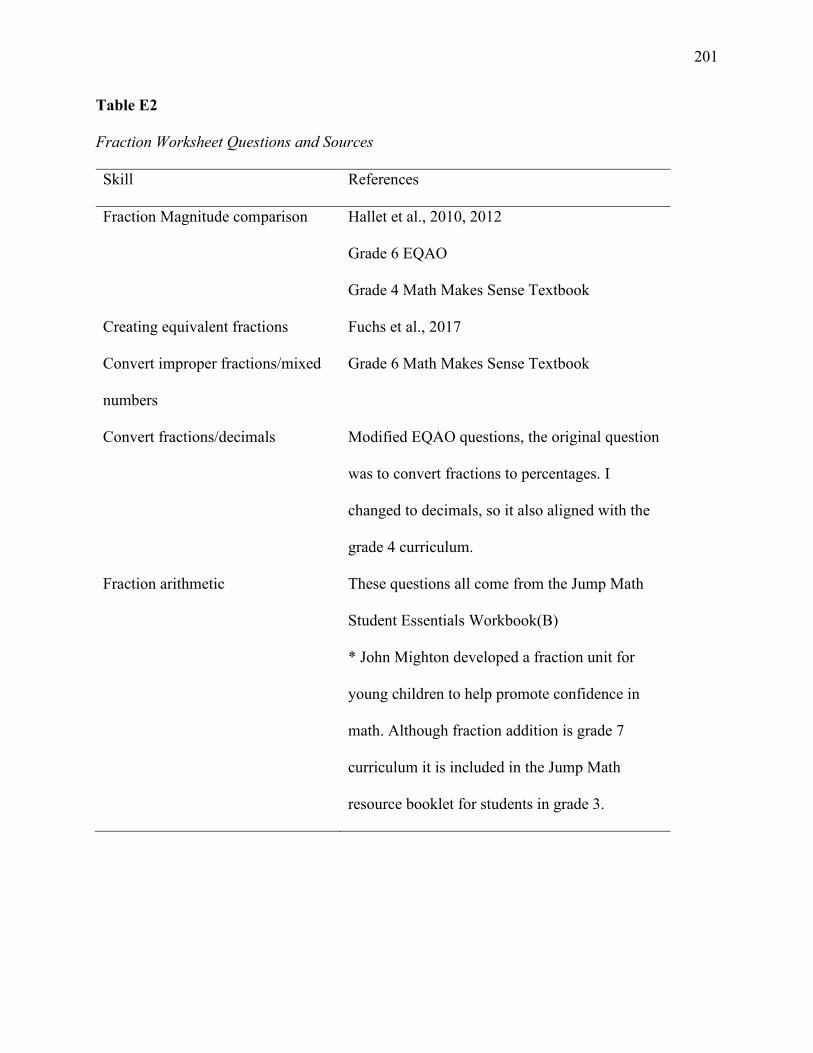
201
Table E2
Fraction Worksheet Questions and Sources
Skill References
Fraction Magnitude comparison Hallet et al., 2010, 2012
Grade 6 EQAO
Grade 4 Math Makes Sense Textbook
Creating equivalent fractions Fuchs et al., 2017
Convert improper fractions/mixed
numbers
Grade 6 Math Makes Sense Textbook
Convert fractions/decimals Modified EQAO questions, the original question
was to convert fractions to percentages. I
changed to decimals, so it also aligned with the
grade 4 curriculum.
Fraction arithmetic These questions all come from the Jump Math
Student Essentials Workbook(B)
* John Mighton developed a fraction unit for
young children to help promote confidence in
math. Although fraction addition is grade 7
curriculum it is included in the Jump Math
resource booklet for students in grade 3.
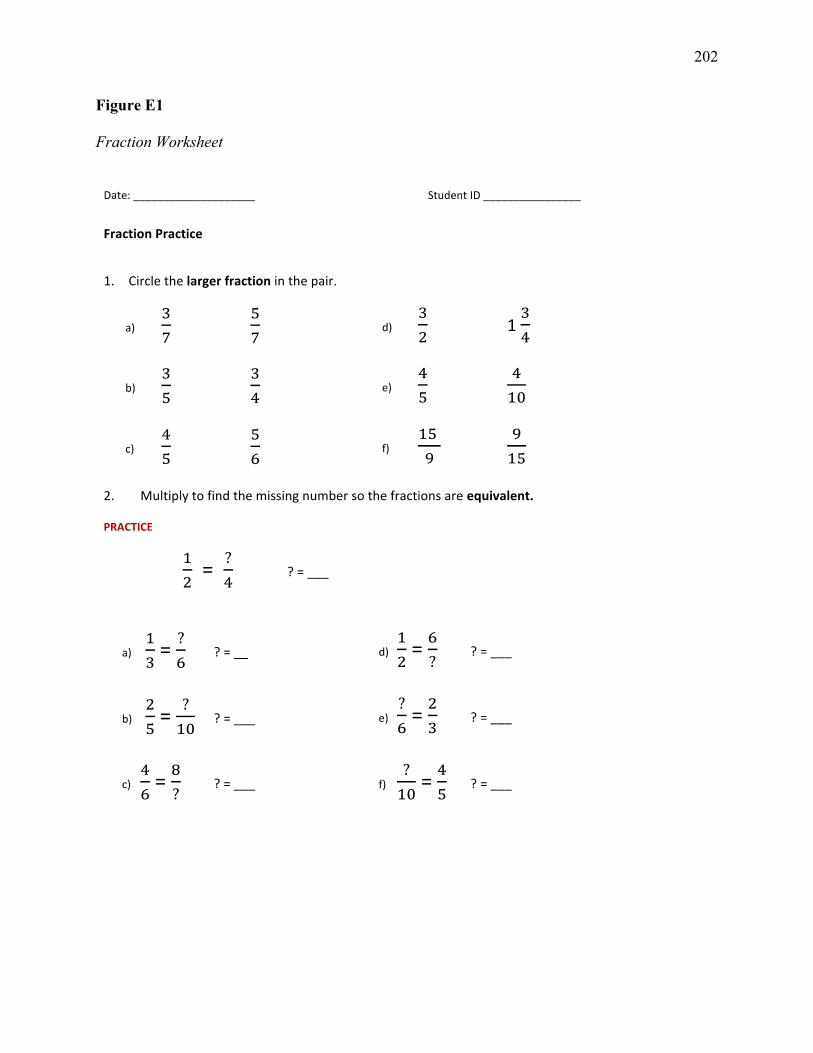
202
Figure E1
Fraction Worksheet
203
Write fractions as decimals.
a) 310
=
b) 4100
=
c) 25100
=
d) 125
=
Write decimals as fractions.
e) 0.8 =
f) 0.03 =
g) 0.125 =
h) 0.12 =
Write as improper fractions.
PRACTICE 1 17 =
a) 3 29 =
b) 4 34 =
c) 2 14 =
Write as mixed numbers.
a) 75 =
b) 256
=
c) 113
=
204
Fraction Challenge
Add the following fractions.
a) 37 + 2
7 =
b) 49 + 3
9 =
c) 16 + 1
3 =
d) 12 + 1
8 =
e) 211
+ 311
=
f) 14 + 3
8 =
205
Appendix F
Latent Profile Analysis Assumptions
Latent profile analysis assumes local independence. That is, the values of the indicators
(i.e., the trial accuracies) within each profile should be independent or uncorrelated after profile
membership is established. Prior to assigning profile membership, however, the indicator values
across all participants should be dependent or correlated (Tein et al., 2013). Correlations between
the trials were thus examined to test the assumption of local independence. As shown in Table
F1, most of the PAEs were correlated with the exception of a few target fractions.
To determine if non-significant correlations would influence profile membership, we
identified outlier PAE scores that could potentially influence correlations. Using a conservative
approach, we first standardized all PAEs (approximately 3500) and any greater than the 3
standard deviations above or below the mean were identified as outliers PAE (N = 48). Next, we
identified outliers based on individual PAEs (N = 176). For example, if a participant had a PAE
trial that was 2 SD above their mean PAE (e.g., M = 9.00, SD = 11.31, PAEtrial = 34.00) that trial
was considered an outlier score. Finally, we identified any score that was classified as an outlier
using both approaches (N = 9). Model fit was unchanged by adding the outliers thus we
concluded that the assumption of local independence was suitably met.
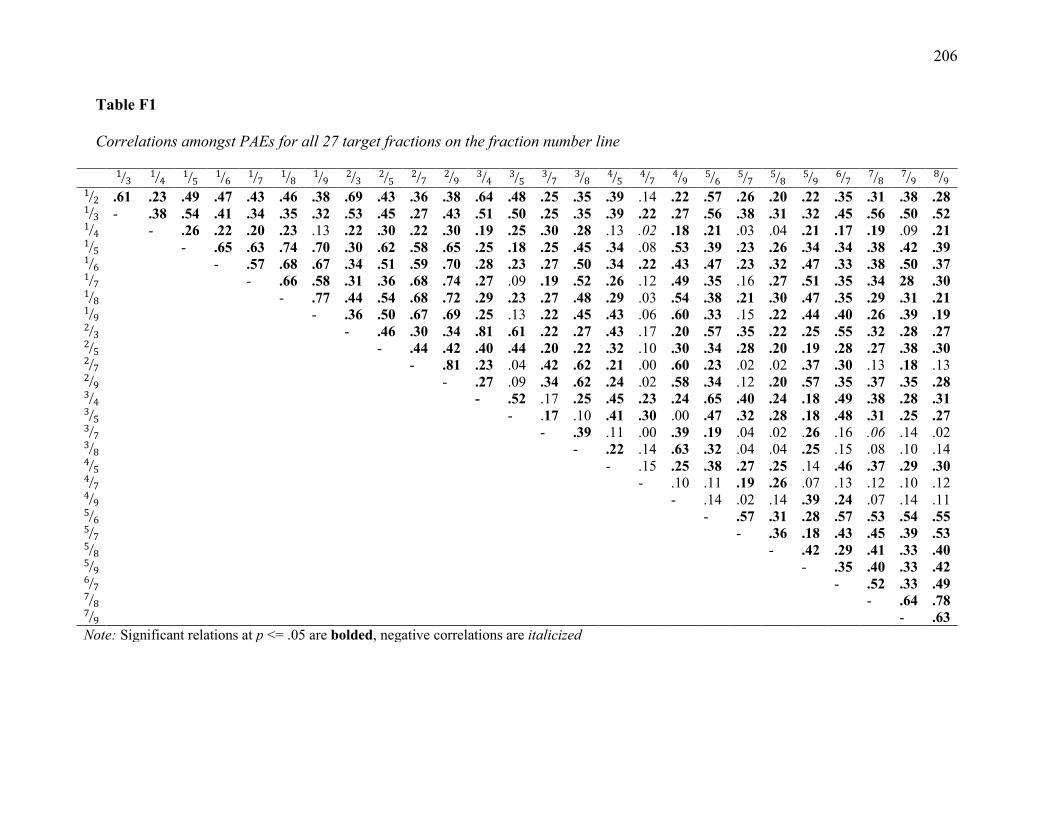
206
Table F1
Correlations amongst PAEs for all 27 target fractions on the fraction number line
13� 1
4� 15� 1
6� 17� 1
8� 19� 2
3� 25� 2
7� 29� 3
4� 35� 3
7� 38� 4
5� 47� 4
9� 56� 5
7� 58� 5
9� 67� 7
8� 79� 8
9� 1
2� .61 .23 .49 .47 .43 .46 .38 .69 .43 .36 .38 .64 .48 .25 .35 .39 .14 .22 .57 .26 .20 .22 .35 .31 .38 .28 1
3� - .38 .54 .41 .34 .35 .32 .53 .45 .27 .43 .51 .50 .25 .35 .39 .22 .27 .56 .38 .31 .32 .45 .56 .50 .52 1
4� - .26 .22 .20 .23 .13 .22 .30 .22 .30 .19 .25 .30 .28 .13 .02 .18 .21 .03 .04 .21 .17 .19 .09 .21 1
5� - .65 .63 .74 .70 .30 .62 .58 .65 .25 .18 .25 .45 .34 .08 .53 .39 .23 .26 .34 .34 .38 .42 .39 1
6� - .57 .68 .67 .34 .51 .59 .70 .28 .23 .27 .50 .34 .22 .43 .47 .23 .32 .47 .33 .38 .50 .37 1
7� - .66 .58 .31 .36 .68 .74 .27 .09 .19 .52 .26 .12 .49 .35 .16 .27 .51 .35 .34 28 .30 1
8� - .77 .44 .54 .68 .72 .29 .23 .27 .48 .29 .03 .54 .38 .21 .30 .47 .35 .29 .31 .21 1
9� - .36 .50 .67 .69 .25 .13 .22 .45 .43 .06 .60 .33 .15 .22 .44 .40 .26 .39 .19 2
3� - .46 .30 .34 .81 .61 .22 .27 .43 .17 .20 .57 .35 .22 .25 .55 .32 .28 .27 2
5� - .44 .42 .40 .44 .20 .22 .32 .10 .30 .34 .28 .20 .19 .28 .27 .38 .30 2
7� - .81 .23 .04 .42 .62 .21 .00 .60 .23 .02 .02 .37 .30 .13 .18 .13 2
9� - .27 .09 .34 .62 .24 .02 .58 .34 .12 .20 .57 .35 .37 .35 .28 3
4� - .52 .17 .25 .45 .23 .24 .65 .40 .24 .18 .49 .38 .28 .31 3
5� - .17 .10 .41 .30 .00 .47 .32 .28 .18 .48 .31 .25 .27 3
7� - .39 .11 .00 .39 .19 .04 .02 .26 .16 .06 .14 .02 3
8� - .22 .14 .63 .32 .04 .04 .25 .15 .08 .10 .14 4
5� - .15 .25 .38 .27 .25 .14 .46 .37 .29 .30 4
7� - .10 .11 .19 .26 .07 .13 .12 .10 .12 4
9� - .14 .02 .14 .39 .24 .07 .14 .11 5
6� - .57 .31 .28 .57 .53 .54 .55 5
7� - .36 .18 .43 .45 .39 .53 5
8� - .42 .29 .41 .33 .40 5
9� - .35 .40 .33 .42 6
7� - .52 .33 .49 7
8� - .64 .78 7
9� - .63 Note: Significant relations at p <= .05 are bolded, negative correlations are italicized

Related Documents


![Quantifiers, Unit Symbols, Chemical Symbols and Symbols of ... · [Technical Data] Quantifiers, Unit Symbols, Chemical Symbols and Symbols of Elements Excerpts from JIS Z 8202 Calculation](https://static.cupdf.com/doc/110x72/5f3249d403d3070d9018fe62/quantifiers-unit-symbols-chemical-symbols-and-symbols-of-technical-data.jpg)
![Quantifiers, Unit Symbols, Chemical Symbols and Symbols of … · 2019-02-26 · [Technical Data] Quantifiers, Unit Symbols, Chemical Symbols and Symbols of Elements Excerpts from](https://static.cupdf.com/doc/110x72/5ea0ef282df5855ac23d36fb/quantifiers-unit-symbols-chemical-symbols-and-symbols-of-2019-02-26-technical.jpg)
