Design of a Floating Production, Storage, and Offloading (FPSO) System and Oil Offtake System For Offshore West Africa By: Team West Africa Enrique Banda Reneè Belton Wole Faleye Brandon Holmes Nikki Ogah Adrojan Spencer Ocean Engineering Program, Civil Engineering Department, Texas A&M University May 5, 2003

Welcome message from author
This document is posted to help you gain knowledge. Please leave a comment to let me know what you think about it! Share it to your friends and learn new things together.
Transcript
Design of a Floating Production, Storage, and Offloading (FPSO) System and Oil Offtake System For
Offshore West Africa
By: Team West Africa
Enrique Banda
Reneè Belton
Wole Faleye
Brandon Holmes
Nikki Ogah
Adrojan Spencer
Ocean Engineering Program, Civil Engineering Department, Texas A&M University
May 5, 2003

2
Table of Contents EXECUTIVE SUMMARY .............................................................................................. 6
ABSTRACT....................................................................................................................... 9
ACKNOWLEDGMENTS .............................................................................................. 10
INTRODUCTION........................................................................................................... 11 TEAM ORGANIZATION.................................................................................................... 12
Team Guidelines ....................................................................................................... 13 Schedule .................................................................................................................... 13
FIELD TRIP ..................................................................................................................... 15
COMPETENCY AREAS ............................................................................................... 15 REGULATORY COMPLIANCE........................................................................................... 15 GENERAL ARRANGEMENT AND OVERALL HULL/SYSTEM DESIGN................................. 17
Ship Shape Option..................................................................................................... 18 Square Shape Option ................................................................................................ 22
WEIGHT, BUOYANCY AND STABILITY............................................................................ 25 Stability ..................................................................................................................... 27
GLOBAL LOADING ......................................................................................................... 34 Environmental Loads due to Wind, Wave, and Current ........................................... 34 Option One: Traditional FPSO ................................................................................ 34 Option Two: Square-shaped FPSO .......................................................................... 40
WIND AND CURRENT LOADING...................................................................................... 46 MOORING/STATION KEEPING......................................................................................... 46
Hardware .................................................................................................................. 47 Mooring System Analysis.......................................................................................... 49 Mooring System Optimization................................................................................... 49
HYDRODYNAMICS OF MOTION AND LOADING ............................................................... 50 Natural Periods......................................................................................................... 50 Pitch, Roll and Heave at Full Capacity: 16m draft .................................................. 52 Pitch, Roll and Heave at 30% Capacity: 10m draft ................................................. 55 Response Amplitude Operators................................................................................. 58
COST.............................................................................................................................. 60
OFFLOADING SYSTEM.............................................................................................. 65
SUMMARY AND CONCLUSIONS ............................................................................. 67
REFERENCES................................................................................................................ 69
APPENDIX A: STABCAD I/O...................................................................................... 70
APPENDIX B: MIMOSA I/O...................................................................................... 131
3
List of Figures FIGURE 1: UKPOKITI SITE LOCATION ................................................................................. 11 FIGURE 2: SCHEDULE OF PROGRESS................................................................................... 14 FIGURE 3: CLASS PHOTO AT THE CONOCOPHILLIPS FACILITY IN FREEPORT, TEXAS.......... 15 FIGURE 4: CONVENTIONAL SHIP SHAPE DESIGN ................................................................ 17 FIGURE 5: SQUARE/RADIAL DESIGN .................................................................................. 18 FIGURE 6: SHIP SHAPE OIL TANK LAYOUT ........................................................................ 19 FIGURE 7: SHIP SHAPE BALLAST TANK LAYOUT ............................................................... 19 FIGURE 8: SHIP SHAPE GENERAL ARRANGEMENT ............................................................. 21 FIGURE 9: SQUARE SHAPE OPTION OIL TANK SCHEMATIC ................................................ 22 FIGURE 10: BALLAST TANK LAYOUT FOR SQUARE SHAPE OPTION.................................... 23 FIGURE 11: SQUARE SHAPE GENERAL ARRANGEMENT..................................................... 24 FIGURE 12: SHIP SHAPE STABCAD MODEL....................................................................... 28 FIGURE 13: DISPLACEMENT DUE TO INCREASING DRAFT .................................................. 29 FIGURE 14: CENTER OF BUOYANCY FOR INCREASING DRAFT ............................................ 29 FIGURE 15: CENTER OF FLOTATION FOR INCREASING DRAFT ............................................ 30 FIGURE 16: METACENTRIC HEIGHTS FOR THE GIVEN DRAFTS ........................................... 31 FIGURE 17: TONS PER INCH IMMERSION FOR INCREASING DRAFTS ................................... 31 FIGURE 18: INTACT STABILITY 30% CAPACITY ................................................................. 32 FIGURE 19: INTACT STABILITY FOR 100 % CAPACITY ....................................................... 33 FIGURE 20: DAMAGE STABILITY FOR BOTH DRAFTS ......................................................... 34 FIGURE 21: BEAM AREAS FOR TRADITIONAL FPSO .......................................................... 35 FIGURE 22: TRADITIONAL FPSO BOW AREAS ................................................................... 36 FIGURE 23: BOW AND BEAM VIEWS FOR SQUARE FPSO ................................................... 41 FIGURE 24: K-4 CHAIN ...................................................................................................... 47 FIGURE 25: STEVIN ANCHOR ............................................................................................. 47 FIGURE 26: COMPLETE UNDERWATER SYSTEM CONFIGURATION / VESSEL WITH MOORING
LINES ......................................................................................................................... 48 FIGURE 27: FPSO ORIENTATION TO MAXIMUM SWELL ENVIRONMENTAL LOADS ............ 50 FIGURE 28: RAO RESPONSE FOR DIRECTION 157.5O.......................................................... 59 FIGURE 29: RAO RESPONSE FOR DIRECTION 180O............................................................. 59 FIGURE 30: PROPOSED TANDEM-STERN OFFTAKE SCHEME............................................... 66 FIGURE 31: PROCESSING FLOWCHART ............................................................................... 67
4
List of Tables TABLE 1: TEAM ASSIGNMENTS .......................................................................................... 12 TABLE 2: DECK AREA OF MODULES .................................................................................. 22 TABLE 3: LIGHTSHIP WEIGHTS .......................................................................................... 25 TABLE 4: MODULAR WEIGHT ESTIMATION........................................................................ 25 TABLE 5: CALCULATED CENTER OF GRAVITY ................................................................... 27 TABLE 6: METACENTRIC HEIGHTS AND CENTERS OF BUOYANCY...................................... 27 TABLE 7: SHIP SHAPE OVERALL DIMENSIONS ................................................................... 34 TABLE 8: ESTIMATED FPSO AREAS................................................................................... 35 TABLE 9: ENVIRONMENTAL LOAD CALCULATIONS FOR 100-YEAR STORM – 10M DRAFT . 37 TABLE 10: CURRENT FORCES FOR TRADITIONAL FPSO – 10M DRAFT............................... 38 TABLE 11: WAVE FORCES FOR THE TRADITIONAL FPSO- 10M DRAFT .............................. 38 TABLE 12: TOTAL ENVIRONMENTAL FORCES- 10M DRAFT ................................................ 38 TABLE 13: ENVIRONMENTAL LOAD CALCULATIONS FOR 100-YEAR STORM – 16M DRAFT39 TABLE 14: CURRENT FORCES FOR TRADITIONAL FPSO - 16M DRAFT................................ 40 TABLE 15: WAVE FORCES FOR THE TRADITIONAL FPSO - 16M DRAFT............................. 40 TABLE 16: TOTAL ENVIRONMENTAL FORCES - 16M DRAFT ............................................... 40 TABLE 17: SQUARE-SHAPE DIMENSIONS............................................................................ 40 TABLE 18: INITIAL ESTIMATE OF WIND AREA ................................................................... 41 TABLE 19: SQUARE FPSO ENVIRONMENTAL LOAD CALCULATIONS FOR 100 YEAR STORM
– 10M......................................................................................................................... 42 TABLE 20: CURRENT FORCES FOR SQUARE FPSO – 10M................................................... 43 TABLE 21: MEAN WAVE DRIFT FORCE- 10M ..................................................................... 43 TABLE 22: TOTAL ENVIRONMENTAL FORCES – 10M (SQUARE FPSO)............................... 43 TABLE 23: SQUARE FPSO ENVIRONMENTAL LOAD CALCULATIONS FOR 100 YEAR STORM
– 16M......................................................................................................................... 44 TABLE 24: CURRENT FORCES FOR SQUARE FPSO – 16M .................................................. 45 TABLE 25: MEAN WAVE DRIFT FORCE- 16M ..................................................................... 45 TABLE 26: TOTAL ENVIRONMENTAL FORCES – 16M (SQUARE FPSO)............................... 45 TABLE 27: SUMMARY OF THE ENVIRONMENTAL LOADS.................................................... 45 TABLE 28: WIND AREAS FOR THE TRADITIONAL SHIP SHAPE ........................................... 46 TABLE 29: HEAVE PERIOD OF THE SHIP SHAPE FPSO AT FULL CAPACITY ........................ 52 TABLE 30: HEAVE PERIOD OF THE SQUARE SHAPE FPSO AT FULL CAPACITY .................. 53 TABLE 31: PITCH PERIOD OF THE SHIP SHAPE AT FULL CAPACITY .................................... 53 TABLE 32: PITCH PERIOD OF THE SQUARE SHAPE AT FULL CAPACITY .............................. 54 TABLE 33: ROLL PERIOD OF SQUARE SHAPE AT FULL CAPACITY ...................................... 54 TABLE 34: ROLL PERIOD OF SQUARE SHAPE AT FULL CAPACITY ...................................... 55 TABLE 35: HEAVE PERIOD OF SHIP SHAPE AT 30% CAPACITY........................................... 55 TABLE 36: HEAVE PERIOD OF SQUARE SHAPE AT 30% CAPACITY..................................... 56 TABLE 37: PITCH PERIOD OF SHIP SHAPE AT 30% CAPACITY ............................................ 56 TABLE 38: PITCH PERIOD OF SQUARE SHAPE AT 30% CAPACITY ...................................... 57 TABLE 39: ROLL PERIOD OF SHIP SHAPE AT 30% CAPACITY ............................................. 57 TABLE 40: ROLL PERIOD OF SQUARE SHAPE AT 30% CAPACITY........................................ 58 TABLE 41: MAXIMUM OFFSETS FOR A 100-YEAR STORM.................................................. 58 TABLE 42: SHIP-SHAPE DESIGN 8-LINE SYSTEM COST...................................................... 61
5
TABLE 43: SHIP-SHAPE DESIGN 12-LINE SYSTEM COST.................................................... 62 TABLE 44: SQUARE-SHAPE 8-LINE SYSTEM COST ............................................................. 63 TABLE 45: SQUARE-SHAPE 12 LINE SYSTEM COST............................................................ 64 TABLE 46: SUMMARY OF COST .......................................................................................... 68

6
Executive Summary Project Definition
Floating Production, Storage, and Offloading (FPSO) systems comprise a new branch in
offshore technology. In keeping with the innovative spirit of the offshore industry, this
design of an FPSO will implement this moderately unused expertise to utilize the oil
fields of the West African coast. A shallow water depth of 27 m (88 ft), storm generated
swells, low daily production output, and various regulatory bodies govern the overall
design.
General Arrangement
Two separate designs have been considered throughout the project. The first option is a
conventional ship shape, while the other is a more creative square shape. Both facilities
include processing modules scaled from existing vessels. The ship shape, weight of
211,000 metric tons and draft of 16 m (52.5 ft), has longitudinally arranged oil storage
tanks and ballast tanks along the side, and under each separate tank. The square shape,
weight of 207,000 metric tons and draft of 9.25 m (30.35 ft), has radially arranged oil
tanks and ballast tanks. This configuration lends to the increased stability over the other
design.
The storage capacity criterion is based on the total daily production output. The intended
shuttling tanker, a 650,000 BBL Aframax, will be used to move the product from West
Africa to the United States. In order to be economical, only full loads will be shuttled.
Based on an output of 20,000 BBL/day, the total lift cycle is approximately thirty days.
This will guarantee that the full storage capabilities of the tanker will be utilized.
7
Systems
Mooring
The purpose of the mooring system is to keep the vessel on station at the site. The
mooring system includes mooring and anchoring. There are several types of mooring
available for use on a FPSO. For this design, a catenary spread-mooring system will be
analyzed using the MIMOSA software package. After optimization, the 12-line mooring
system consists of line lengths equal to 250 m (820.21 ft) and factors of safety ranging
from 2.5 to 3 for an intact system, and 1.4 for a damaged system.
Offloading
The tandem-stern offloading approach was selected based on the safety, cost, and
reliability factors. A floating hose, carried by a workboat, connects the two vessels and
provides a means to transfer huge amounts of product in a relatively short amount of
time. As a result of being located directly behind the FPSO, the tandem configuration
also helps to eliminate the exposure of environmental forces on the shuttling tanker.
Analysis
Environmental Loads
An excel spreadsheet is used to analyze the environmental loads. It calculates forces
induced by the wind and current. These forces are dependent on the wind speed, current
speed, and the bow and beam areas. For the traditional FPSO design, the environmental
loading results show that currents in the Ukpokiti field site are relatively strong in the
beam seas. This is expected due to the major swells that approach the Nigeria delta. The
bow seas show the smallest environmental forces, and so the FPSO will be moored in the
8
direction of the bow. The bow sea forces for the traditional FPSO is 47.8 kips (212.6
kN), and the bow sea forces for the square FPSO is 552.4 kips (2457.2 kN). The loading
for the square shape is nearly equal for both bow and beam seas.
Hydrodynamics
To limit the effects of the natural motions of the ship and square shape designs, the
natural heave, roll and pitch periods of the structure were considered. The natural period
and the wave exciting level are important parameters for estimating the amplitude of
motion of the floating vessel. Due to the large water-plane area of FPSO, the natural
periods of heave is in the range of wave periods. This is the reason why the FPSO
motion characteristic is poor relative to other floating structure (OTRC2002). The period
of maximum wave height from the Met ocean data provided by ConocoPhillips gives a
period of maximum wave height ranging from 13.3s to 13.8s. There are produced from
swells. The heave period of the ship shape FPSO, 7.97 seconds, is close to the maximum
environmental periods, but is still allowable.
Stability
StabCAD is an analysis tool that checks for data consistency, determines heeling and
righting arms and the allowable KG to meet the criteria set by ABS MODU regulations
(ABS 1997). Hydrodynamic, intact stability and damage stability analysis were
performed using StabCAD. Intact stability shows that for the 100% capacity and the 30%
capacity cases the area ratio of 1.4 is satisfied. Damage stability shows that when one
side ballast tank is damaged regulations are satisfied for both cases. There is 14 degrees
between the first intercept and the second intercept, regulations require 7 degrees. Also at
9
some 13.5 degrees, which is before the downflooding angle the righting arm is twice that
of the heeling arm at the same angle is a damage requirement.
Cost
In every creative venture, cost is a major factor in the design process. For the FPSO at
Ukpokiti, general estimations are made to determine the budget for the design. The cost
breakdown was done for both the ship-shape and the square-shape options, using the 8-
line and 12-line mooring systems. The total cost for the ship-shape option is 373 million
dollars and 360 million dollars for the 8-line and the 12-line system, respectively. The
total cost for the square-shape option is 448 million and 443 million for the 8-line and the
12-line systems, respectively.
Abstract Floating Production, Storage, and Offloading (FPSO) systems comprise a new branch in offshore technology. In keeping with the innovative spirit of the offshore industry, this design of an FPSO will implement this moderately unused expertise to utilize the oil fields of the West African coast. The Ukpokiti site has a shallow water depth of 27 m (88 ft), storm generated swells, low daily production output, and various regulatory bodies govern the overall design. Two FPSO’s were analyzed a ship-shape option and a square-shape option. The ship-shape was design along the principle of the more traditional FPSO and the square-shape was a more innovative design that would take into account the site specifics of the Ukpokiti field. After determining the feasibility of the ship-shape option and the square-shape option the ship-shape option was chosen due to its more conventional design, cost factors, and building factors. The team decided to use a 12-line catenary system to moor the vessel consisting of all chain with a 114 mm (4.49 in) diameter. Offloading will be done using the tandem-stern approach due to safety, cost, and reliability factors. Environmental loads for the ship-shape at a 10 m (32.8 ft) draft are largest on the beam at 701 kips (3,118 kN) and least on the bow at 111 kips (494 kN). Hydrodynamics show that the heave period of the ship shape FPSO, 7.97 seconds, is close to the maximum environmental periods, but is still allowable. Intact stability shows that for the 100% capacity and the 30% capacity cases the area ratio of 1.4 is satisfied. Damage stability shows that when one side ballast tank is damaged regulations are satisfied for both cases. There is 14 degrees between the first intercept and the second intercept, regulations require 7 degrees. Also at some 13.5 degrees, which is before the downflooding angle the righting arm is twice that of the heeling arm at the same angle is a damage requirement.

10
Acknowledgments Team West Africa would like to thank the following individuals and companies for their support in this project.
• Robert Randall, TAMU • Matthew Pritchard, ConocoPhillips • Peter Noble, ConocoPhillips • Chuck Steube, ConocoPhillips • J. R. King, ConocoPhillips • Tom Bauer, Halliburton-KBR • Samrat Das, Halliburton-KBR, MIMOSA • Christopher Broussard, Halliburton-KBR, StabCAD • Gennie Krautkremer, Halliburton-KBR, MIMOSA • DNV – Sesam Package • Zentech – StabCAD

11
Introduction The goal of this project is to design a Floating Production, Storage, and Offloading (FPSO) system and an oil offtake system for the West Africa region suitable for oil field production in shallow water. The FPSO design is environmentally safe, efficient, and cost effective. Additionally, the design includes the effects of the environmental loads on stability and the mooring system.
The oil reserve for the site is at the latitude 4° 59’ 21.12” N and longitude 2° 35’ 56.76” E. The recoverable reserves are 30 million barrels. This oil is a good quality. It is crude oil, and it is sweet and light with 42 degree API gravity. There is a peak production of 20,000 barrels per day for three years. This location has a field life of 7.5 years.
The field area is located 15 miles (24.14 km) off the coast of West Africa (approximately 105 miles (169 km) southeast of Lagos and 65 miles (104.6 km) west of Warri) (see Figure 1). The water depth in this area is 88 feet (26.82 m). This region has a benign weather environment. Directional winds encompass this location at wind speeds ranging from 10 to 15 m/s (19 – 29 knots). However, one major concern in the region is the occurrence of swells. Ocean swells are defined as large waves generated by wind systems or storms. They maintain their direction for long periods of time and travel in the general direction of the winds generating them. This is a concern due to pitch and roll associated with ocean swells.
Figure 1: Ukpokiti Site Location
12
The 10-year storm data affects the area in all directions. The omni directional wave height and spectral peak period is 2.4 m (7.87 ft) and 15 s, respectively. The maximum wave height is 4.2 m (13.78 ft) and the period of maximum wave is 13.4 s. Crest elevation is 0.6 times the maximum wave height, which is 2.52 m (8.3 ft). The one hour sustained wind speed is 13 m/s (25.27 km). It is referenced to 10 m (32.8 ft) above sea level (omni directional). The 3-second gust in a thunderstorm is 22 m/s (42.76 knots). Current speed is 9 m/s (17.49 knots) and it is omni directional as well.
Like the 10-year met-ocean data, the 100-year storm data is omni directional. The wave height is 3.2 m (10.5 ft) and the spectral peak period is 15.5 s. The maximum wave height and period is 5.6 m (18.37 ft) and 13.8 s, in that order. The one hour sustained wind speed is 15 m/s (29.16 knots), the 3-second gust is 25 m/s (48.6 knots), and the current speed is 1 m/s (1.94 knots) at the surface.
Two design options are analyzed. Option one is a conventional ship shape design. That allows the team to use current methods of field production to utilize strategies that have already been proven in industry. Option two is a square shape design. The driving force behind this design option is innovation and determination of feasibility.
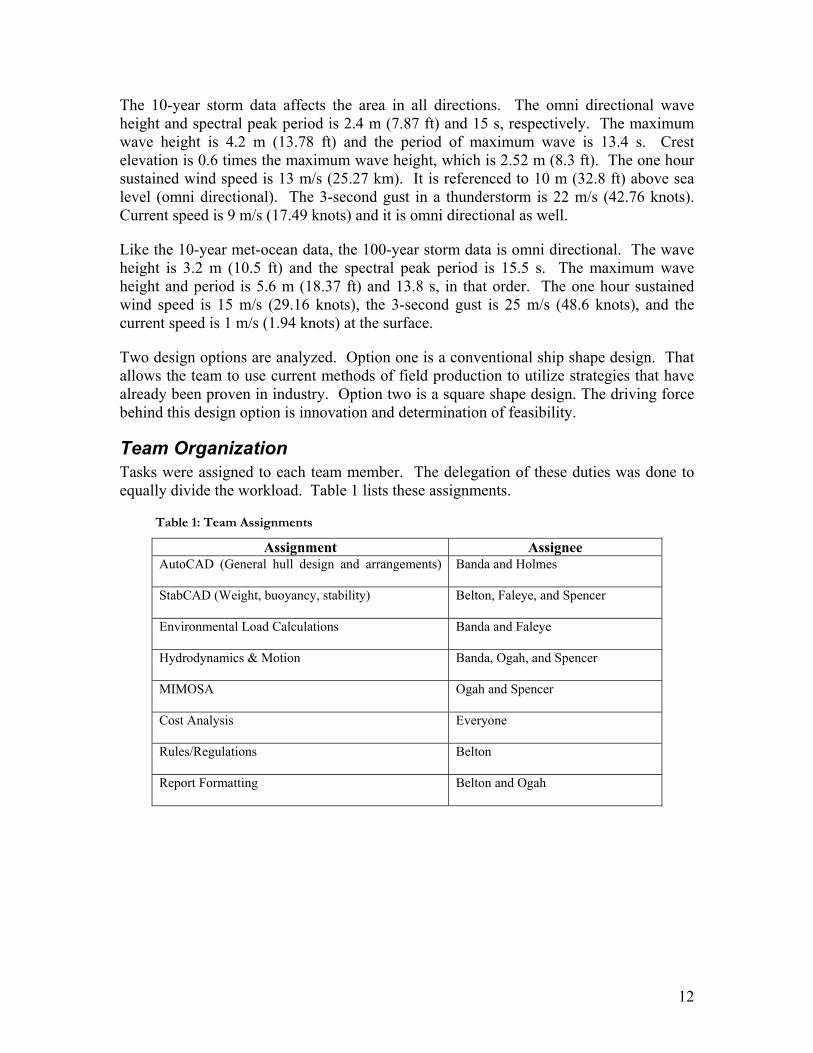
Team Organization Tasks were assigned to each team member. The delegation of these duties was done to equally divide the workload. Table 1 lists these assignments.
Table 1: Team Assignments
Assignment Assignee AutoCAD (General hull design and arrangements)
Banda and Holmes
StabCAD (Weight, buoyancy, stability)
Belton, Faleye, and Spencer
Environmental Load Calculations
Banda and Faleye
Hydrodynamics & Motion
Banda, Ogah, and Spencer
MIMOSA
Ogah and Spencer
Cost Analysis
Everyone
Rules/Regulations
Belton
Report Formatting
Belton and Ogah

13
Team Guidelines Guidelines help the team maintain efficient progress of tasks. These guidelines kept the team working in harmony.
• Respect fellow team members • Be punctual to all team meetings and expect to stay for the entire meeting • Distribute the work load evenly • Communicate ideas clearly and listen to other team members • Expect to be held accountable for your portion of the work • Make every effort to meet deadlines • Prepare an agenda for the next meeting at the end of the previous one • It is your responsibility to stay informed about what the rest of the team is
working on
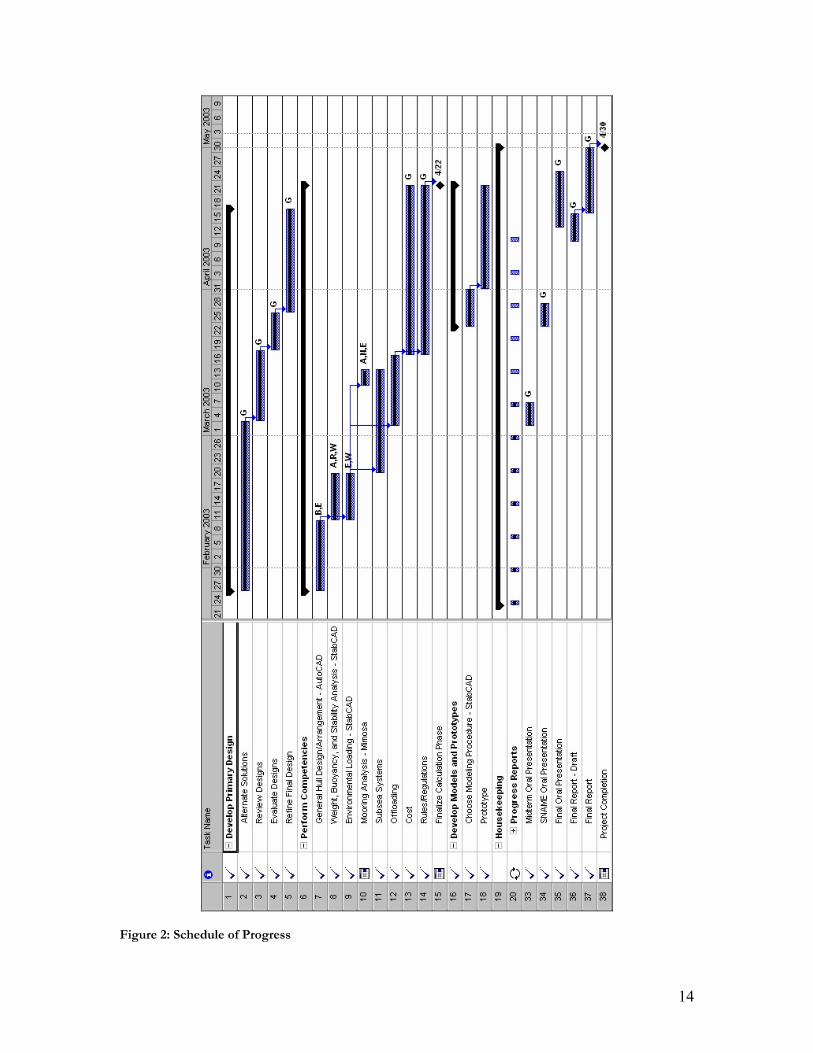
Schedule A schedule is incorporated to manage the team assignments and to ensure progress of the project. Figure 2 illustrates the schedule of the project in the form of a Gantt chart. The software used to generate the Gantt chart is Microsoft Project.
14
Figure 2: Schedule of Progress

15
Field Trip On January 24th, a tour of the ConocoPhillips tanker, The Continental, was taken in order to gather information about the tanker and FPSO design. During the tour, one of the important aspects of the tanker was its capability to carry up to 650, 000 barrels of oil. This provided a good estimate of how large the FPSO would have to be to meet the objectives. It also gave some insight about how the oil is offloaded from the tanker. The general arrangement of the tanker, as far as the engine room, the crew quarters, drafts due to the loading and offloading of oil is relevant to the design of the FPSO.
Figure 3: Class Photo at the ConocoPhillips Facility in Freeport, Texas
Competency Areas In designing an FPSO, various factors must be researched and analyzed. The FPSO in this design focuses on eight specific areas: regulatory compliance, general arrangement and overall hull design, weight, buoyancy, and stability, global loading, wind and current loading, mooring, and the hydrodynamics of motion. Each area is discussed in the following subsections.
Regulatory Compliance Rules and regulations are needed to provide a safe working and operational environment. Agencies, consisting of ocean engineers, naval architects, marine engineers and others involved in this industry, set forth the rules and classify floating vessels. Agencies that influence FPSO design in the West African region are the American Bureau of Shipping (ABS), the American Petroleum Institute (API), and the International Maritime Organization (IMO). ABS is a ship classification society whose purpose is to determine the structural and mechanical fitness of ships and other marine structures for their intended purpose. They develop standards that guide the installation of floating vessels. These guidelines include design criteria for designing the vessel including the hull, mooring system, materials, the production facility, and offloading. API, like ABS, is a society that sets standards for a vessel to be classified. API recommends practices that
16
enhance offshore safety standards and protect the environment. Within IMO is an international treaty that regulates the disposal of wastes generated by the normal operation of vessels. The combined rules must be abided in order to keep classification of the vessel and to prevent hazards.
Almost every aspect of the design process for floating production, storage, and offloading systems utilizing the effects of environmental loads and therefore must be addressed in the design process. The establishment of the environmental loads is based on the parameters of wind, waves, current, tide and storm surge, and temperature. For the most part, the design must withstand the design environmental conditions (DEC) and the design operating conditions (DOC) (ABS 2003). The DEC is the extreme weather conditions of wind, waves, and current. ABS requires that the 100-year storm data (ABS 2003) be used. The DOC is the extreme condition in which normal operation conditions cannot be maintained.
Specifications for the type of hull design are not absolute. However, the double hull arrangement is preferred due to the reduction of risks associated with cargo spills and other damage. A double hull tanker as defined by ABS (2003) is a tank vessel having full depth wing non-cargo spaces (water ballasts) and full breadth wing double bottom non-cargo spaces intended to prevent and/or reduce the liquid cargo outflow in an accidental stranding or collision. The requirements for a double hull vessel indicate that strength and fatigue analysis of the hull be performed (EPA, 2003).
Suitable ventilation is required on the vessel. Holes are to be cut in every part of the structure where otherwise there may be a chance of gases being pocketed. Efficient means should be provided to rid spaces of dangerous vapors by artificial ventilation or steam. If a flare tower is used, the flare/vent tower must meet ABS provisions (ABS Facilities 11.5, 2000), as well as API RP 521 criteria (API, 1990), meaning that the design must be located with respect to prevailing winds to limit the exposure of personnel, equipment, and helicopter traffic to vented gas, flare exhaust or flame radiation (ABS Facilities 5.3, 2000). In addition, heat radiation from elevated flares should be designed at a rate of 1.58 kW/m2 for continuous flare and a maximum rate of 4.73 kW/m2 for short duration.
Fire safety is important aboard vessels offshore. The piping for the fire fighting equipment will be in dual redundancy such that the water can be taken from two different sources and the fire pumps will have their own respective power and fuel supply, lighting, ventilation, and control valves. It is located separate so that one emergency does cause both pumps to fail (ABS Facilities 5.1.2, 2000). Proper shutdown procedures in case of emergency are also a requirement in which a general alarm will sound and the emergency lights, public address system, and radio communication will be functional (ABS Facilities 9.0, 2000).
To battle the potential for oil spills, certain precautions are taken. Spill containment shall be located in areas that process hydrocarbon liquids or chemicals. The spill containment plan on the vessel will utilize drip edges at deck level, recessed drip pans, floor gutters, firewalls, and other methods to prevent discharged liquids from reaching lower levels of
17
the vessel (ABS Facilities 13.1, 2000). In addition, storage tanks are equipped with overflow connections if the tanks are larger than 20 barrels and operating at or near atmospheric pressure (ABS Facilities 13.1, 2000).
As for the passengers and crew aboard the vessel, safekeeping is ensured for emergency as well. Lifeboats accommodate twice the total number of people onboard the vessel (ABS Facilities 15.5.1, 2000). Also, at least one approved life jacket per person onboard is available in readily accessible locations (ABS Facilities 15.5.4, 2000) and near lifeboats.
The stability requirements are taken from ABS Modu rules based on the vessel’s condition. When intact, the vessel must be stable enough to withstand forces produced by a wind from any horizontal direction in accordance with the stability criteria for conditions afloat. The vessel must be able to withstand a wind velocity of a severe storm condition with a wind velocity of 100 knots. Under damaged conditions, the vessel must be capable of 50-knot wind speeds and the final waterline should not submerge any non-watertight openings.
Analysis of mooring is a requirement of classification as well. In mooring, the frequency, extreme vessel offset, and line tension must be examined. A maximum line tension must be determined following API RP 2FPI and API RP 2SK (API 1996).
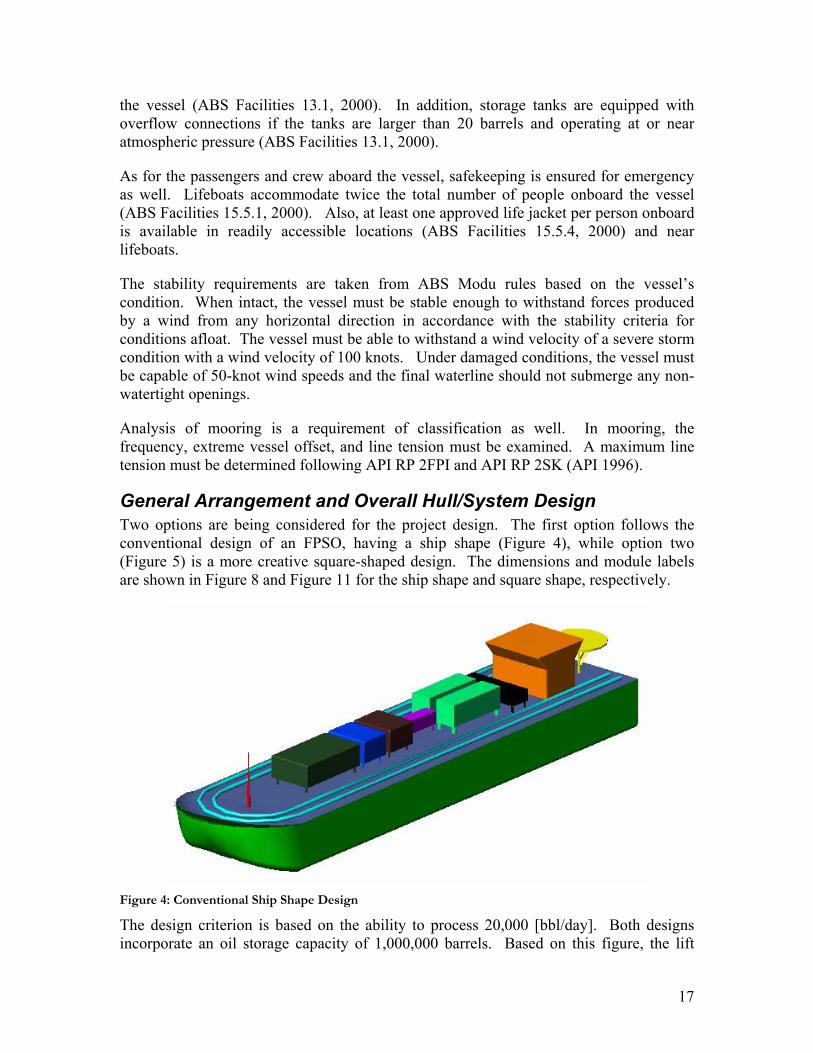
General Arrangement and Overall Hull/System Design Two options are being considered for the project design. The first option follows the conventional design of an FPSO, having a ship shape (Figure 4), while option two (Figure 5) is a more creative square-shaped design. The dimensions and module labels are shown in Figure 8 and Figure 11 for the ship shape and square shape, respectively.
Figure 4: Conventional Ship Shape Design
The design criterion is based on the ability to process 20,000 [bbl/day]. Both designs incorporate an oil storage capacity of 1,000,000 barrels. Based on this figure, the lift

18
cycle is once every thirty days. This duration minimizes the number of trips that a 650,000 bbl Aframax tanker must make. In addition, a sufficient reserve is available for unexpected situations.
Figure 5: Square/Radial Design
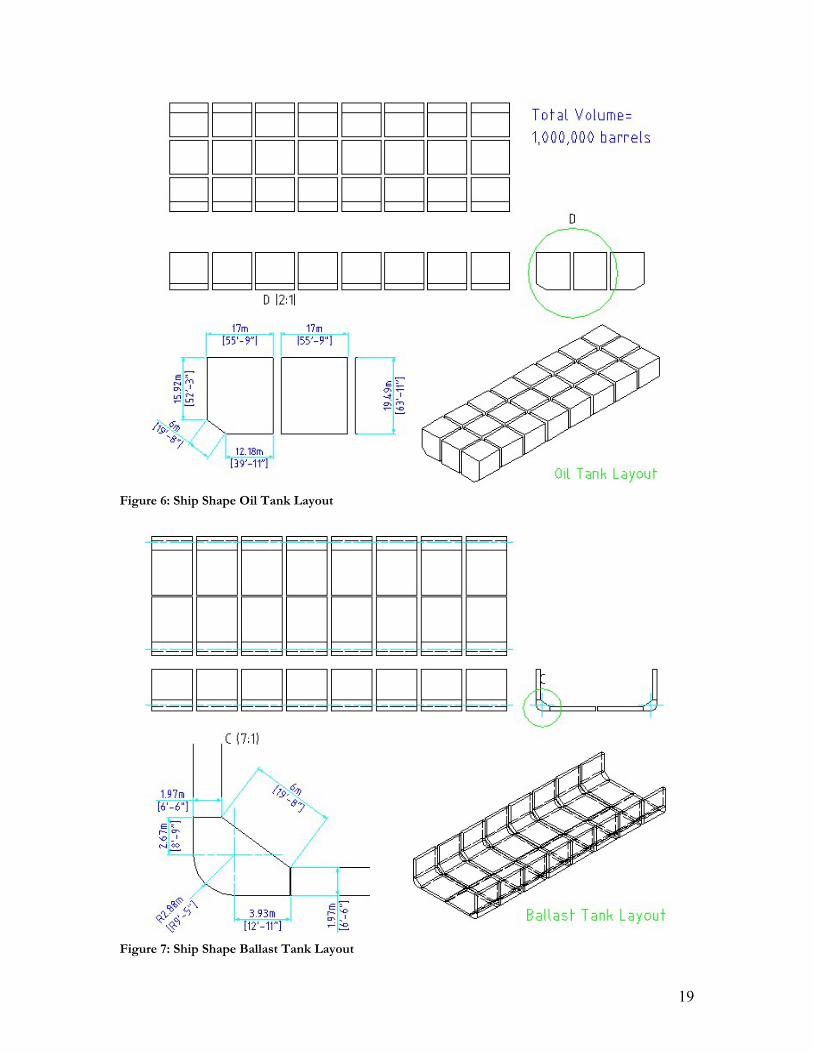
Ship Shape Option The first arrangement consists of longitudinally positioned oil-storage tanks (Figure 6). These tanks have a storage capacity of 7,245 cubic meters (45,570 barrels) each. A total of sixteen tanks, in two rows, span the entire length of the ship. Ballast tanks reside at the lower outboard corners of the oil tanks (Figure 7). A single ballast tank is positioned below each individual oil tank. Each tank has the capacity to ballast 1,281 cubic meters of water.
19
Figure 6: Ship Shape Oil Tank Layout
Figure 7: Ship Shape Ballast Tank Layout
20
The crew quarters and deckhouse are positioned at the stern of the vessel. In addition, a helipad is located behind the aforementioned quarters. A track runs the entire length of the ship on both sides. This enables one crane to cover the entire area. The processing facilities are represented by blocks on the topside of the main deck. The emergency oil flare tower is located opposite the main crew quarters at the bow of the ship. This insures the main quarters are placed as far as possible from the expulsion of noxious gases emitted from the flare tower.

21
Figure 8: Ship Shape General Arrangement
22
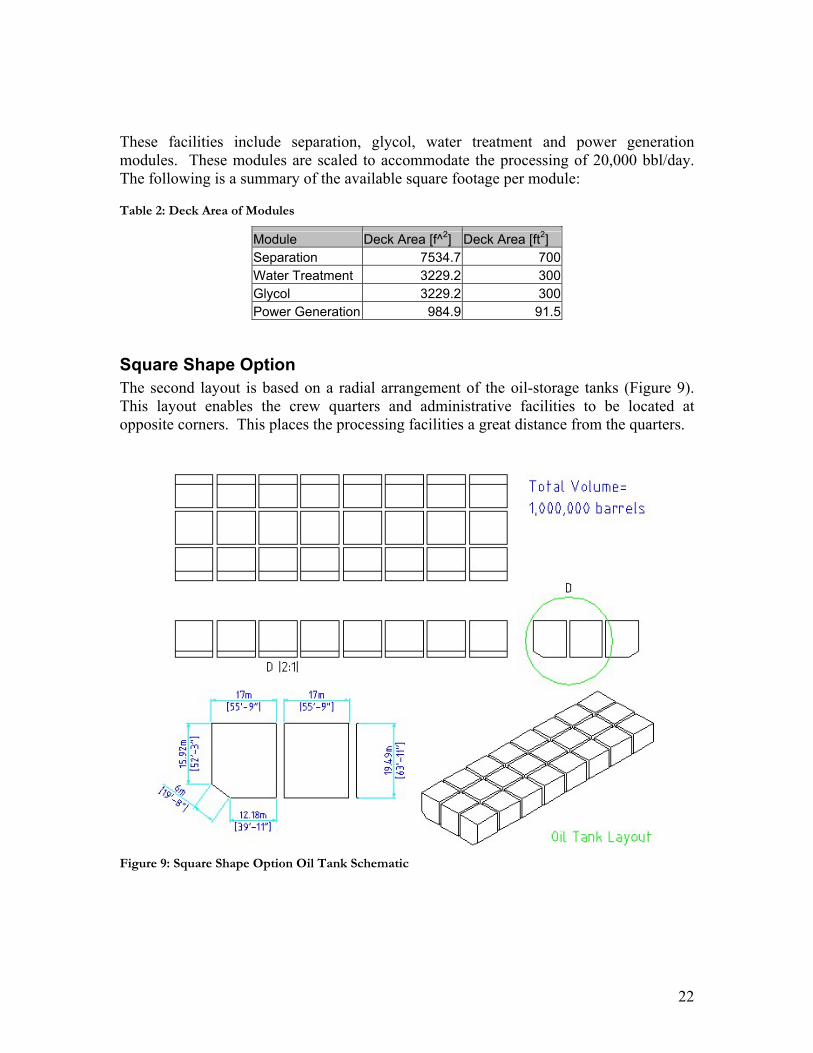
These facilities include separation, glycol, water treatment and power generation modules. These modules are scaled to accommodate the processing of 20,000 bbl/day. The following is a summary of the available square footage per module:
Table 2: Deck Area of Modules
Module Deck Area [f^2] Deck Area [ft2] Separation 7534.7 700Water Treatment 3229.2 300Glycol 3229.2 300Power Generation 984.9 91.5
Square Shape Option The second layout is based on a radial arrangement of the oil-storage tanks (Figure 9). This layout enables the crew quarters and administrative facilities to be located at opposite corners. This places the processing facilities a great distance from the quarters.
Figure 9: Square Shape Option Oil Tank Schematic
23
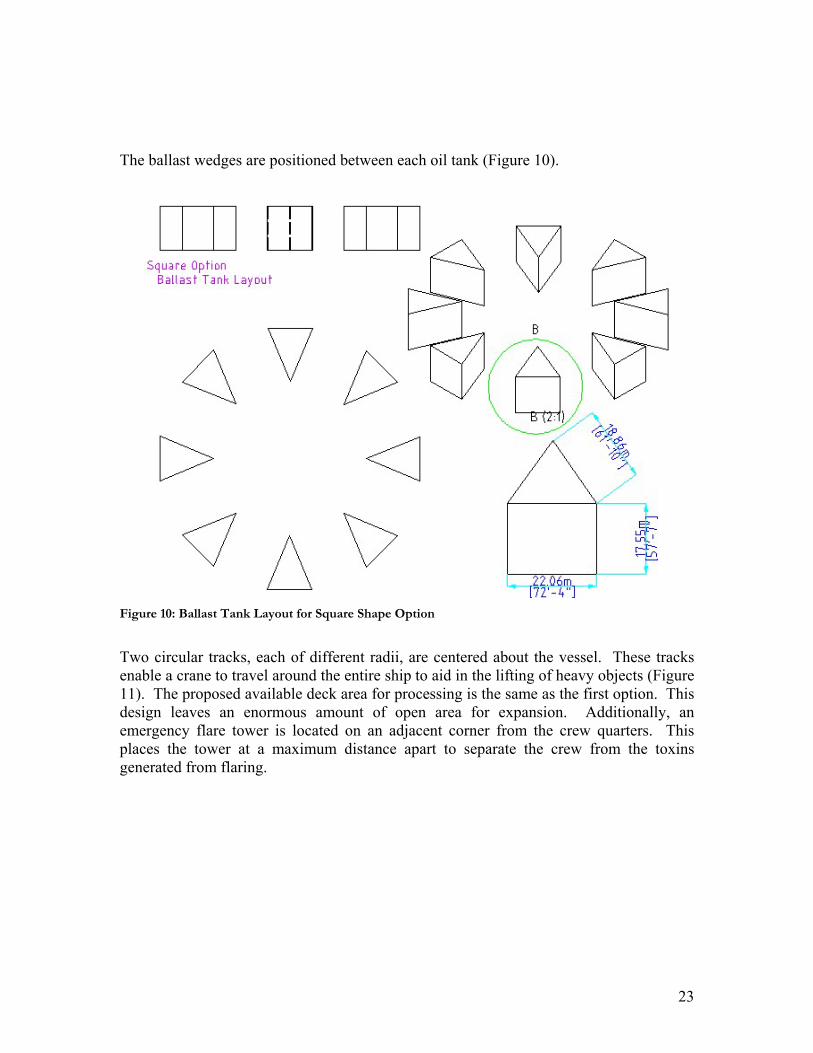
The ballast wedges are positioned between each oil tank (Figure 10).
Figure 10: Ballast Tank Layout for Square Shape Option
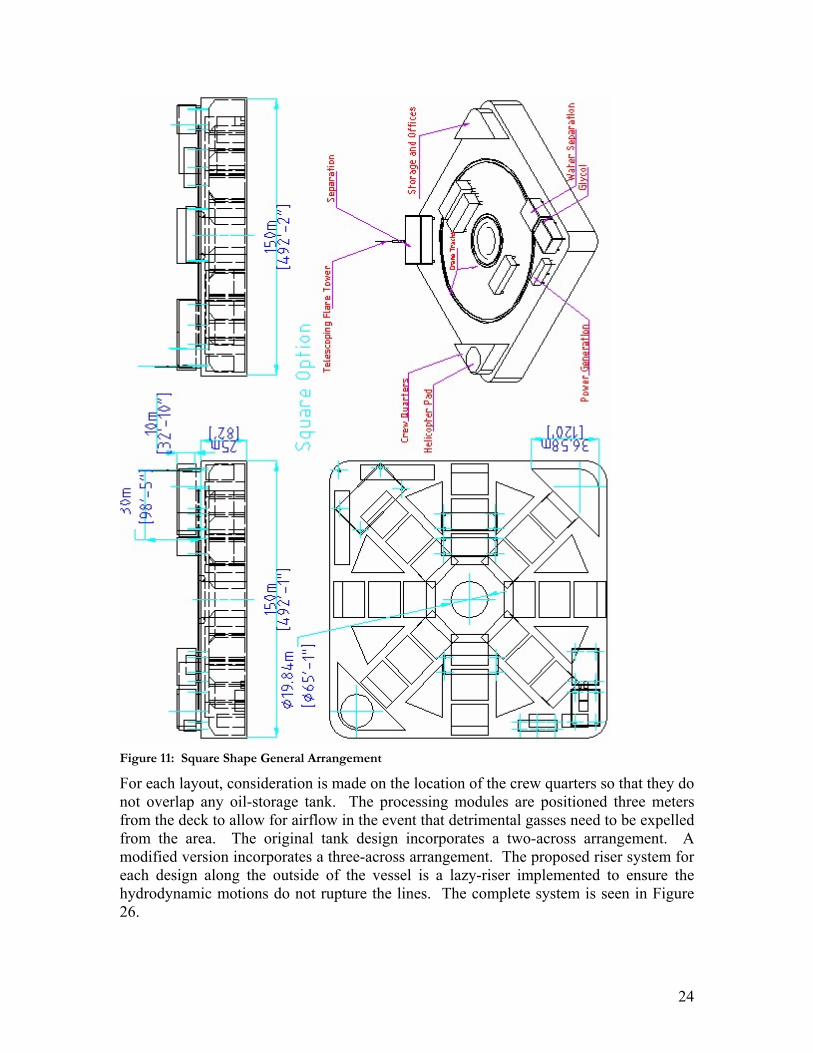
Two circular tracks, each of different radii, are centered about the vessel. These tracks enable a crane to travel around the entire ship to aid in the lifting of heavy objects (Figure 11). The proposed available deck area for processing is the same as the first option. This design leaves an enormous amount of open area for expansion. Additionally, an emergency flare tower is located on an adjacent corner from the crew quarters. This places the tower at a maximum distance apart to separate the crew from the toxins generated from flaring.
24
Figure 11: Square Shape General Arrangement
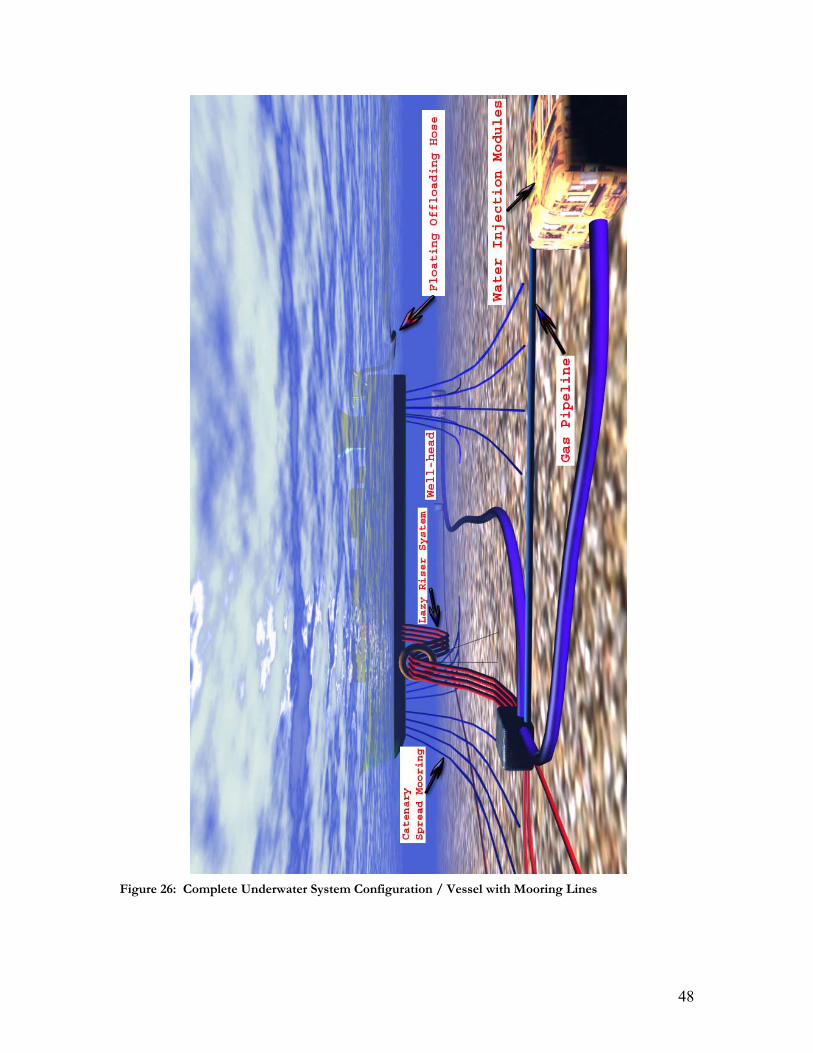
For each layout, consideration is made on the location of the crew quarters so that they do not overlap any oil-storage tank. The processing modules are positioned three meters from the deck to allow for airflow in the event that detrimental gasses need to be expelled from the area. The original tank design incorporates a two-across arrangement. A modified version incorporates a three-across arrangement. The proposed riser system for each design along the outside of the vessel is a lazy-riser implemented to ensure the hydrodynamic motions do not rupture the lines. The complete system is seen in Figure 26.

25
Weight, Buoyancy and Stability Weights for the two options are estimated from both existing and proposed FPSOs. Topside weights are estimated from the previous senior design class FPSO. Lightship and miscellaneous fluid volumes and weights are estimated from the data provided by ConocoPhillips (King 2003). Since accurate structural drawings of the FPSO being designed cannot be constructed, both design options (square and ship-shape) are being considered somewhat similar. The two weights differ only in the amount of ballast that is stored. Table 3 shows the estimated lightship weights.
Table 3: Lightship Weights
Tonnes Long Tons Lightship w/o topsides 31865 31360*scaled from example Topside weight 19870 19555*estimated from previous yearTotal lightship 51735 50915
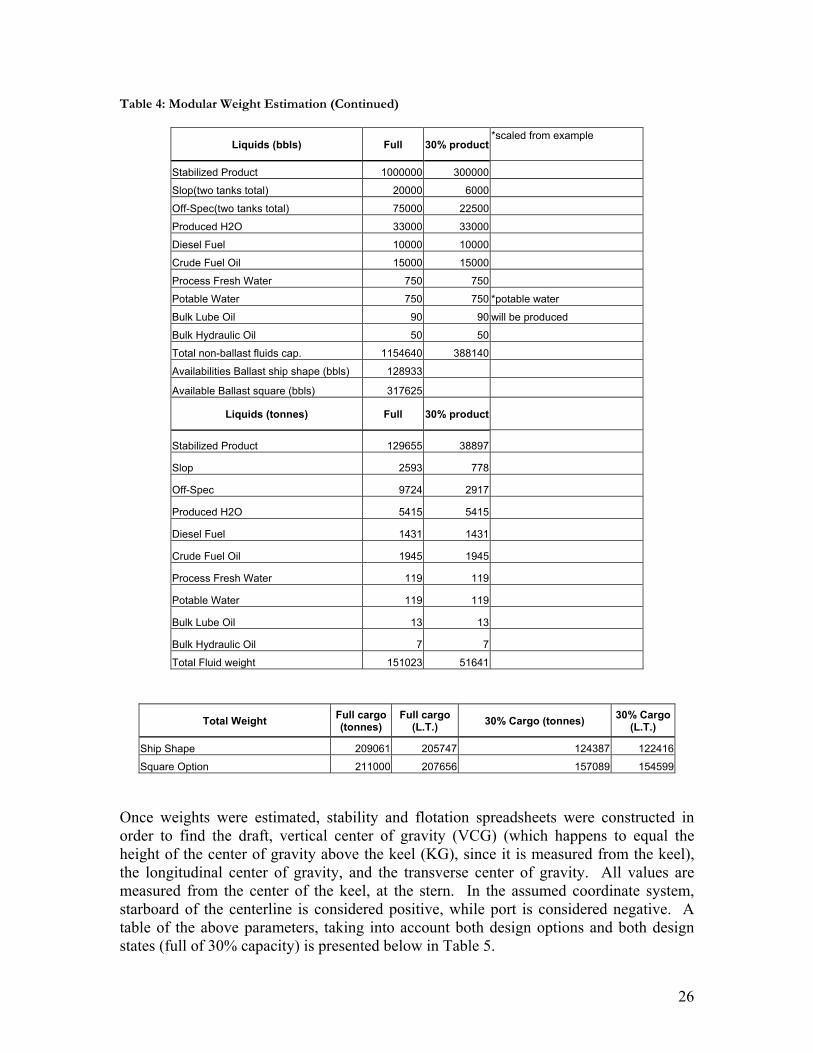
FPSO’s must store liquids of many types on board. The stabilized product accounts for the bulk of liquid weight. The FPSO has a capacity of one million barrels of 42 degree API crude. The FPSO must also have tanks to hold off-spec crude, slop, produced water, diesel fuel, crude oil fuel, process fresh water, potable water, and bulk lube and hydraulic oil. Table 4 shows the total vessel displacement assuming when a full cargo load is carried, a 30% ballast condition exists. When a 30% cargo load is carried, it is assumed that a 100% ballast condition exists.
Table 4: Modular Weight Estimation
Lightship Tonnes Long Tons
Lightship w/o topsides 31865 31360 *scaled from example
Machinery: *assumed from previous year
Crane (2) 70 69
Power Generation 1484 1460
Separation 1790 1762
Production Water Glycol 1400 1378
Water Injection + treatment 1086 1069
Flare tower(optional) 0 0
Helideck 20 20
Quarters 1000 984
Additional Steel 7000 6889
Crew quarters and accommodations 1000 984
Pipes and cables 5000 4920
Topside weight 19870 19555
Total lightship 51735 50915
26
Table 4: Modular Weight Estimation (Continued)
Liquids (bbls) Full 30% product*scaled from example
Stabilized Product 1000000 300000
Slop(two tanks total) 20000 6000
Off-Spec(two tanks total) 75000 22500
Produced H2O 33000 33000
Diesel Fuel 10000 10000
Crude Fuel Oil 15000 15000
Process Fresh Water 750 750
Potable Water 750 750 *potable water
Bulk Lube Oil 90 90 will be produced
Bulk Hydraulic Oil 50 50
Total non-ballast fluids cap. 1154640 388140
Availabilities Ballast ship shape (bbls) 128933
Available Ballast square (bbls) 317625 Liquids (tonnes) Full 30% product
Stabilized Product 129655 38897
Slop 2593 778
Off-Spec 9724 2917
Produced H2O 5415 5415
Diesel Fuel 1431 1431
Crude Fuel Oil 1945 1945
Process Fresh Water 119 119
Potable Water 119 119
Bulk Lube Oil 13 13
Bulk Hydraulic Oil 7 7
Total Fluid weight 151023 51641
Total Weight Full cargo (tonnes)
Full cargo (L.T.) 30% Cargo (tonnes) 30% Cargo
(L.T.)
Ship Shape 209061 205747 124387 122416
Square Option 211000 207656 157089 154599
Once weights were estimated, stability and flotation spreadsheets were constructed in order to find the draft, vertical center of gravity (VCG) (which happens to equal the height of the center of gravity above the keel (KG), since it is measured from the keel), the longitudinal center of gravity, and the transverse center of gravity. All values are measured from the center of the keel, at the stern. In the assumed coordinate system, starboard of the centerline is considered positive, while port is considered negative. A table of the above parameters, taking into account both design options and both design states (full of 30% capacity) is presented below in Table 5.

27
Table 5: Calculated Center of Gravity
Full cargo (m) Full cargo (ft) 30% Cargo (m) 30% Cargo (ft) Ship Shape
Draft 16.00 52.49 10.00 32.81 LCG 113.21 371.43 190.28 624.27 TCG 0.00 0.00 0.00 0.00 VCG(KG) 10.44 34.26 17.55 57.59 Square Shape Draft 9.25 30.35 6.80 22.31 LCG 4.81 15.76 -0.11 -0.35 TCG -2.47 -8.11 -3.32 -10.90 VCG(KG) 11.78 38.64 12.21 40.05 The height of the metacenter (KM) and the height of the center of buoyancy (KB) are also calculated. The above parameters are calculated using the assumption that the ship has a rectangular shaped hull, which is true over much of the hull. The equations used to calculate KM and KB were found using Tupper’s Introduction to Naval Architecture (Tupper, 1996).
TBKB
12
2
=
2
2 12T BKM
T= +
The values for KM and KB are presented below in Table 6. According to the above values, both designs are stable at small angles.
Table 6: Metacentric Heights and Centers of Buoyancy
Full cargo (m) Full cargo (ft) 30% Cargo (m) 30% Cargo (ft) Ship Shape KB 8.00 26.25 5.00 16.40 KM 22.00 72.18 23.77 77.98 Square Shape KB 4.50 14.76 3.40 11.15 KM 212.83 698.25 279.14 915.80
Stability StabCAD is an analysis tool that checks for data consistency, determines heeling and righting arms and the allowable KG to meet the criteria set by ABS MODU regulations (ABS 1997). For the purpose of our analysis the calculations for the hydrostatic analysis are done for one-third of the full draft, since for the full draft the hydrostatic analysis is just an extension of the one-third draft. The intact and damage stability analysis are shown for both the full draft and the one-third draft cases. Only the ship-shape model is considered using the StabCAD analysis.
28
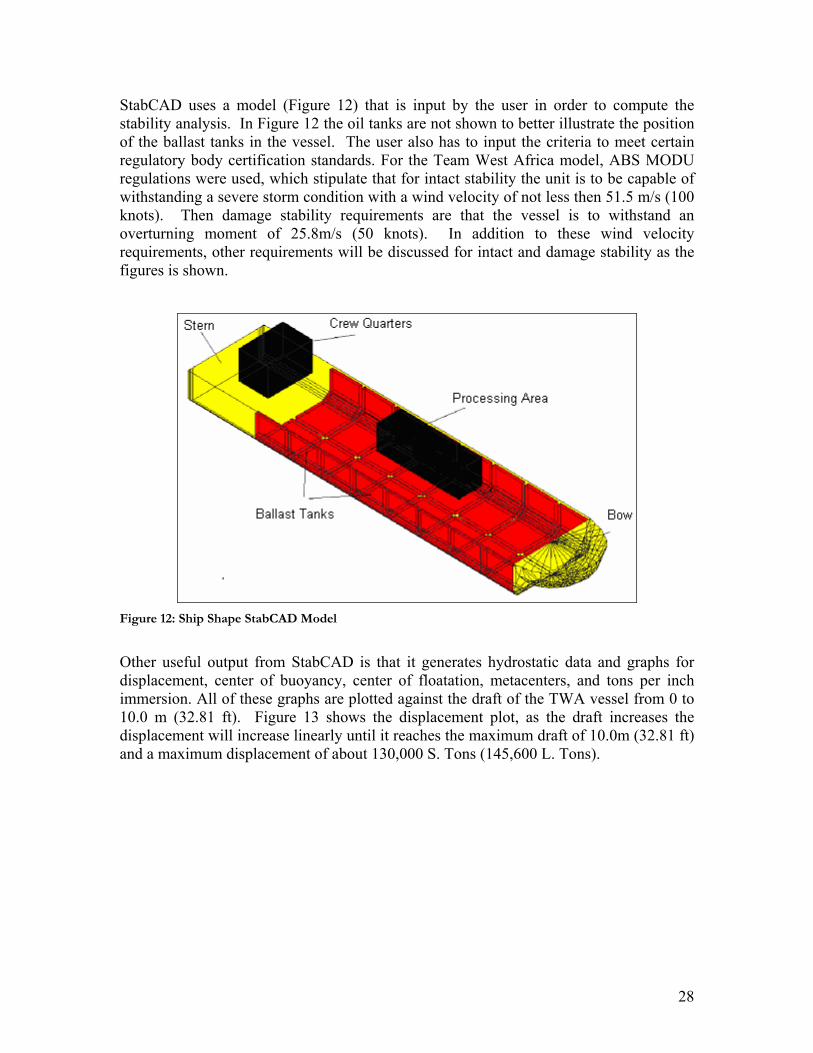
StabCAD uses a model (Figure 12) that is input by the user in order to compute the stability analysis. In Figure 12 the oil tanks are not shown to better illustrate the position of the ballast tanks in the vessel. The user also has to input the criteria to meet certain regulatory body certification standards. For the Team West Africa model, ABS MODU regulations were used, which stipulate that for intact stability the unit is to be capable of withstanding a severe storm condition with a wind velocity of not less then 51.5 m/s (100 knots). Then damage stability requirements are that the vessel is to withstand an overturning moment of 25.8m/s (50 knots). In addition to these wind velocity requirements, other requirements will be discussed for intact and damage stability as the figures is shown.
Figure 12: Ship Shape StabCAD Model
Other useful output from StabCAD is that it generates hydrostatic data and graphs for displacement, center of buoyancy, center of floatation, metacenters, and tons per inch immersion. All of these graphs are plotted against the draft of the TWA vessel from 0 to 10.0 m (32.81 ft). Figure 13 shows the displacement plot, as the draft increases the displacement will increase linearly until it reaches the maximum draft of 10.0m (32.81 ft) and a maximum displacement of about 130,000 S. Tons (145,600 L. Tons).

29
Figure 13: Displacement Due to Increasing Draft
The center of buoyancy is another graph that is calculated as the draft increases. The center of buoyancy is the point through which the centroid of volume of the displaced water acts. Figure 14 shows that the longitudinal center of buoyancy initially decreases with increasing draft but then it continue to increase at a constant rate until the maximum draft is reached. Also, vertical center of buoyancy increases from 0 m to 5.12 m (16.8 ft) as the draft increases. But, the transverse center of buoyancy does not change from zero due to the symmetry of the FPSO.
Figure 14: Center of Buoyancy for Increasing Draft
30
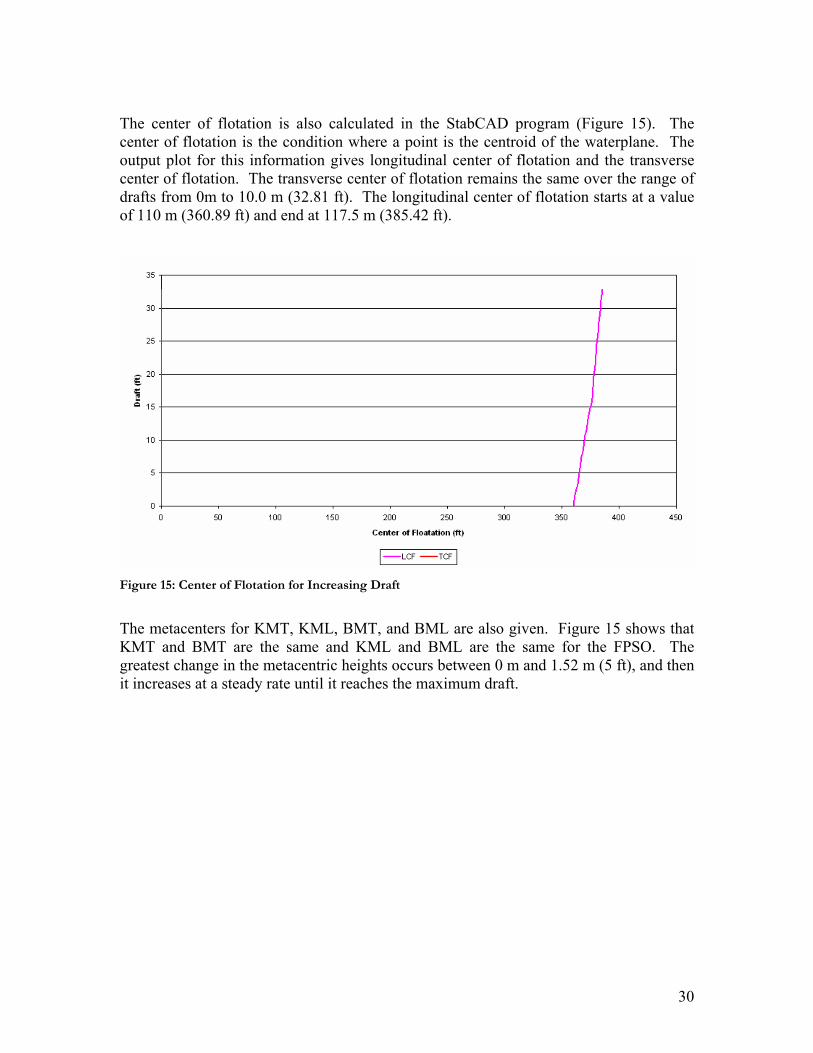
The center of flotation is also calculated in the StabCAD program (Figure 15). The center of flotation is the condition where a point is the centroid of the waterplane. The output plot for this information gives longitudinal center of flotation and the transverse center of flotation. The transverse center of flotation remains the same over the range of drafts from 0m to 10.0 m (32.81 ft). The longitudinal center of flotation starts at a value of 110 m (360.89 ft) and end at 117.5 m (385.42 ft).
Figure 15: Center of Flotation for Increasing Draft
The metacenters for KMT, KML, BMT, and BML are also given. Figure 15 shows that KMT and BMT are the same and KML and BML are the same for the FPSO. The greatest change in the metacentric heights occurs between 0 m and 1.52 m (5 ft), and then it increases at a steady rate until it reaches the maximum draft.
31
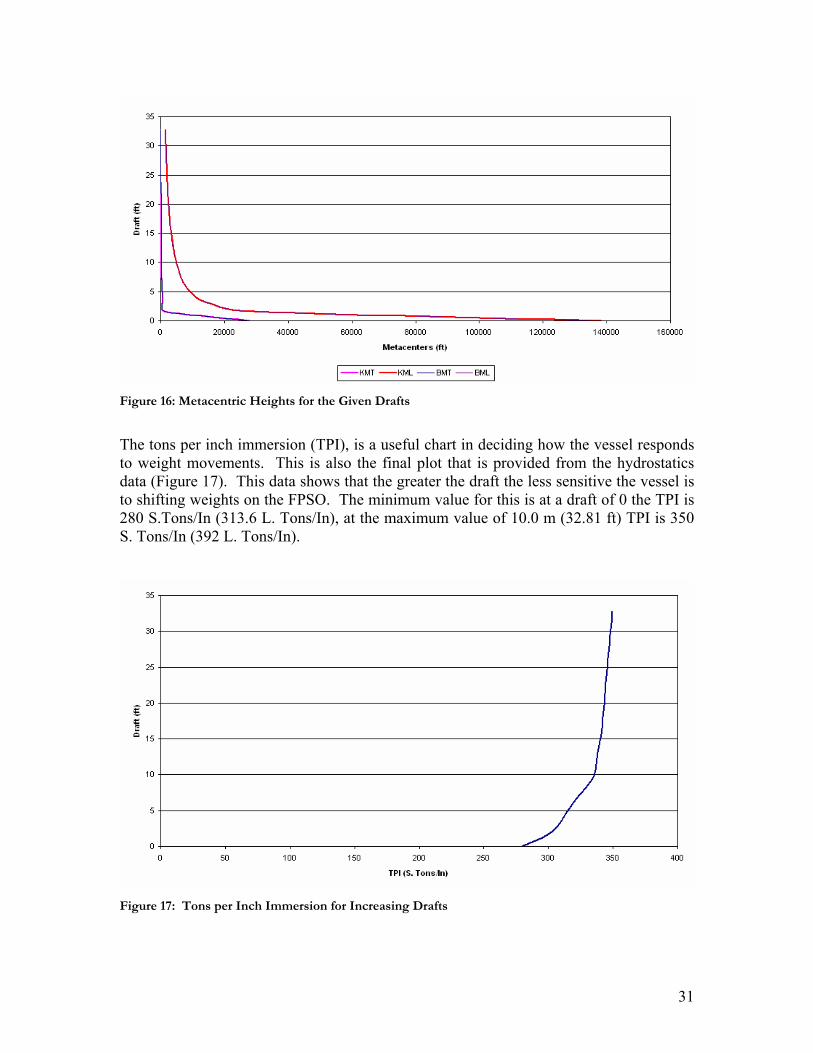
Figure 16: Metacentric Heights for the Given Drafts
The tons per inch immersion (TPI), is a useful chart in deciding how the vessel responds to weight movements. This is also the final plot that is provided from the hydrostatics data (Figure 17). This data shows that the greater the draft the less sensitive the vessel is to shifting weights on the FPSO. The minimum value for this is at a draft of 0 the TPI is 280 S.Tons/In (313.6 L. Tons/In), at the maximum value of 10.0 m (32.81 ft) TPI is 350 S. Tons/In (392 L. Tons/In).
Figure 17: Tons per Inch Immersion for Increasing Drafts

32
For intact and damage stability plots, ABS MODU requirements state that for intact stability the area ratio is to be set to 1.4 and the graph should satisfy the equation below.
[ ] [ ]1.4*Area A B Area C B+ ≥ +
Figure 18 for the 30% capacity vessel with a draft of 10 m (32.81 ft) these areas are shown and that the area ratio is satisfied. The intact stability plot shows the righting arm, heeling arm, and the downflooding point. The righting arm intercepts the heeling arm at 12 degrees and at 26 degrees; the 26 degree intercept indicates that the vessel will overturn at this angle of inclination. The downflooding point is at 24 degrees, this is also the range of stability for the intact vessel. Downflooding points are assumed to be the vents on the inboard corner of the ballast tanks 760 mm (29.92 in) above the deck, where water could enter the tanks. Figure 19 shows the intact stability for the 100% capacity vessel with a draft of 16 m (52.49 ft). The righting and heeling arm intercept at 3 degrees and at 11.5 degrees, downflooding occurs at 11 degrees.
Figure 18: Intact Stability 30% Capacity
33
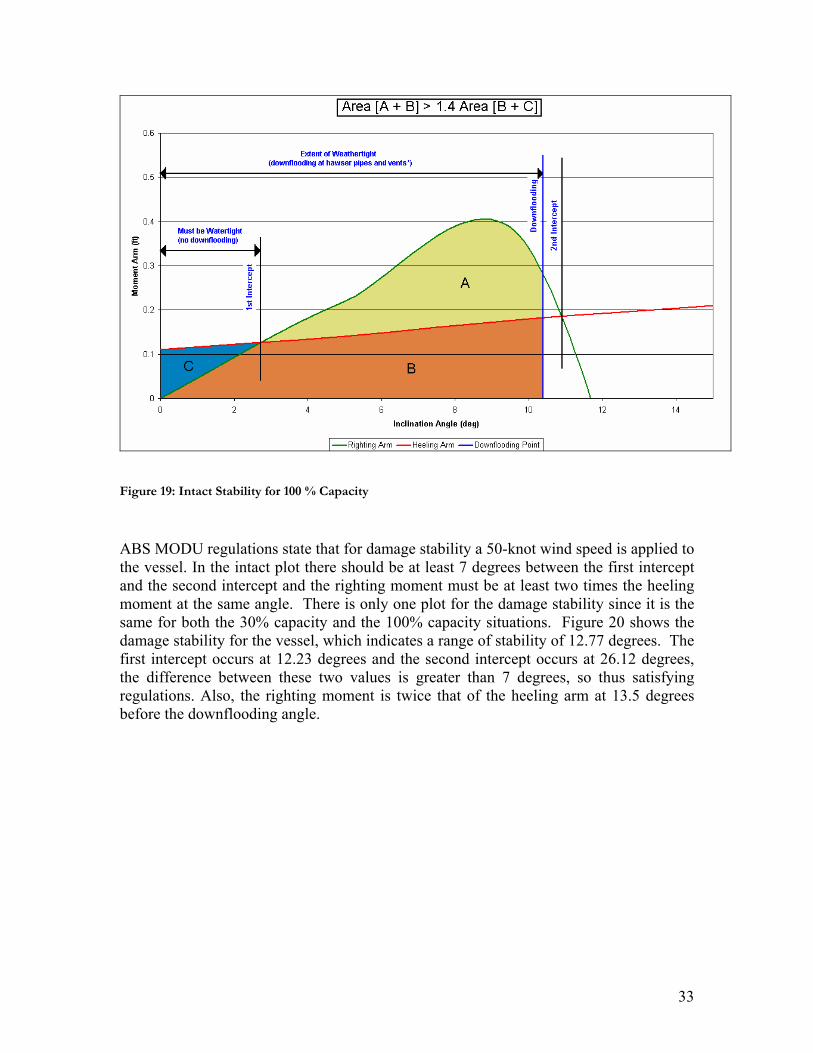
Figure 19: Intact Stability for 100 % Capacity
ABS MODU regulations state that for damage stability a 50-knot wind speed is applied to the vessel. In the intact plot there should be at least 7 degrees between the first intercept and the second intercept and the righting moment must be at least two times the heeling moment at the same angle. There is only one plot for the damage stability since it is the same for both the 30% capacity and the 100% capacity situations. Figure 20 shows the damage stability for the vessel, which indicates a range of stability of 12.77 degrees. The first intercept occurs at 12.23 degrees and the second intercept occurs at 26.12 degrees, the difference between these two values is greater than 7 degrees, so thus satisfying regulations. Also, the righting moment is twice that of the heeling arm at 13.5 degrees before the downflooding angle.

34
Figure 20: Damage Stability for Both Drafts
Global Loading
Environmental Loads due to Wind, Wave, and Current Environmental loads were calculated for two design alternatives picked for the Ukpokiti oil field. The beam and bow views of the FPSO are used to calculate the wind loads. This is done to estimate the best direction for mooring of the floating platform. Met-Ocean data is provided by ConocoPhillips. This data contains the wind, wave and current data from the site of interest. The Ukpokiti field is located 15 miles off the Nigerian coastline. The Met-Ocean data yields 1 year, 10 year, and 100 year storm conditions. For this design project, the 100-year storm data is chosen.
As seen below, the 100 year significant wave height is 10.50 ft (3.2 m), the one-hour wind speed, is 29.16 knots (15 m/s), and the 100-year current speed is 1.944 knots (1 m/s). The wind velocity factor (alpha) is 1.180. This helps to adjust the wind speed to the one-minute speed need for calculate the environmental loads (API RP14J).
Option One: Traditional FPSO The overall dimensions for the ship shape design are tabulated in Table 7. Table 7: Ship Shape Overall Dimensions
Dimension 252.39m x 52m x 19.75m Estimated minimum draft 10m Estimated maximum draft 16m
35
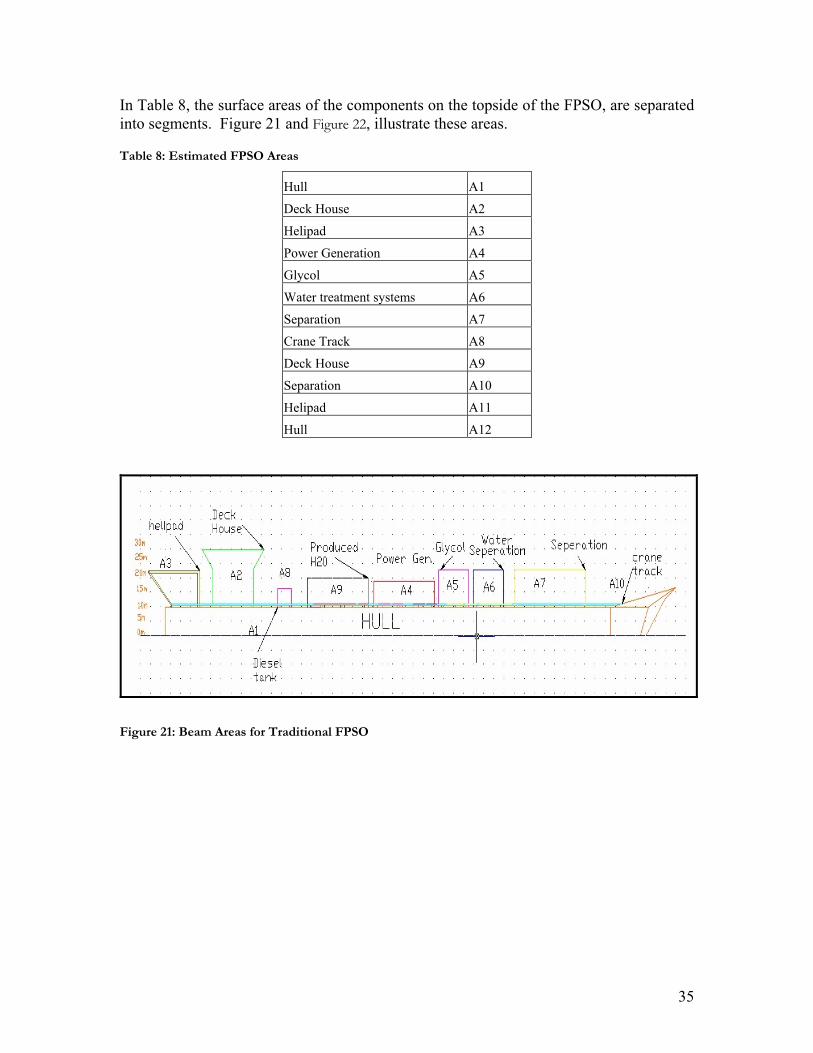
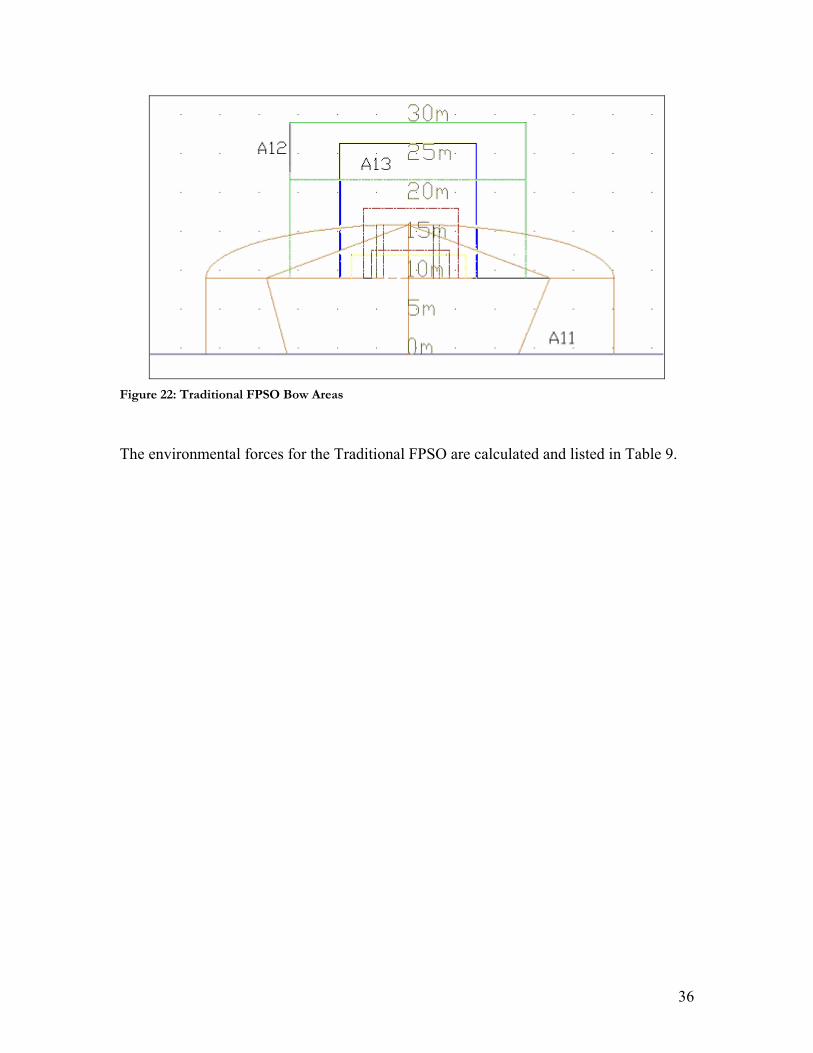
In Table 8, the surface areas of the components on the topside of the FPSO, are separated into segments. Figure 21 and Figure 22, illustrate these areas.
Table 8: Estimated FPSO Areas
Hull A1
Deck House A2
Helipad A3
Power Generation A4
Glycol A5
Water treatment systems A6
Separation A7
Crane Track A8
Deck House A9
Separation A10
Helipad A11
Hull A12
Figure 21: Beam Areas for Traditional FPSO
36
Figure 22: Traditional FPSO Bow Areas
The environmental forces for the Traditional FPSO are calculated and listed in Table 9.

37
Table 9: Environmental Load Calculations for 100-Year Storm – 10m draft
Wind Force Wind Speed Vw(knots) 34.410 alpha 1.180
Projected Areas ft2 (Above Water Line)
Bow Seas Beam Seas
Cs Ch A(Bow) AChCs Cs Ch A(Beam) AChCs
A1 0.0 1.000 1.000 26457.7 26457.7
A2 0.0 1.000 1.180 4686.7 5530.3
A3 0.0 1.300 1.180 272.3 417.7
A4 0.0 1.500 1.000 2906.3 4359.4
A5 0.0 1.500 1.180 2099.0 3715.2
A6 0.0 1.500 1.180 2099.0 3715.2
A7 0.0 1.500 1.180 4891.6 8658.1
A8 0.0 1.500 1.000 491.9 737.9
A9 0.0 1.500 1.180 3228.7 5714.7
A10 0.0 1.300 1.000 1489.7 1936.6
A11 1.000 1.180 7378.4 8706.5 0.0
A12 1.500 1.000 1968.3 2952.4 0.0
A13 1.000 1.000 4417.6 4417.6 0.0
Sum(CsChA) 16076.5 Sum(CsChA) 61242.7
Force(Kips) Fwx 90.1 Fwy 343.3
Quartering Seas
Theta 45.0
Force(Kips) Fwq 288.9
Current Force Current Speed Vc(knot) 1.944 Bow Seas Beam Seas Oblique Environment
Cs(Bow Sea) 0.016 SVc2 761523.364 SVc2 761523.364 Theta 45.000
Csy(Beam Sea) 0.400 Fc(kips) 12.184 Fc(kips) 304.609 Fc(kips) 211.196
Wetted Area 201507.266
Mean Wave Drift Force Curve Fitting Formulae [x=Hs(ft), y=Force (kips)]
Bow Seas y=9.63ln(x)-14
Beam Seas y=2E-5X^4-5E-5X^3-0.1433X^2+7.3983*X-8.9346
Quartering Seas (Surge) y=0.9366x+1.2207
Quartering Seas (Sway) y=1E-5x^4-0.0003x^3-0.0638x^2+4.0954x-7.2682 Maximum Wave Height(ft) 10.500 Bow Seas Beam Seas Quartering Seas
Force(Kips) 8.6 53.1 30.1
Total Environmental Forces Force(Kips) Bow Seas Beam Seas Quartering Seas
Wind 90.1 343.3 288.9
38
Current 12.2 304.6 211.2
Mean Wave Drift Force 8.6 53.1 30.1
Total Force(Kips) 110.9 701.0 530.2
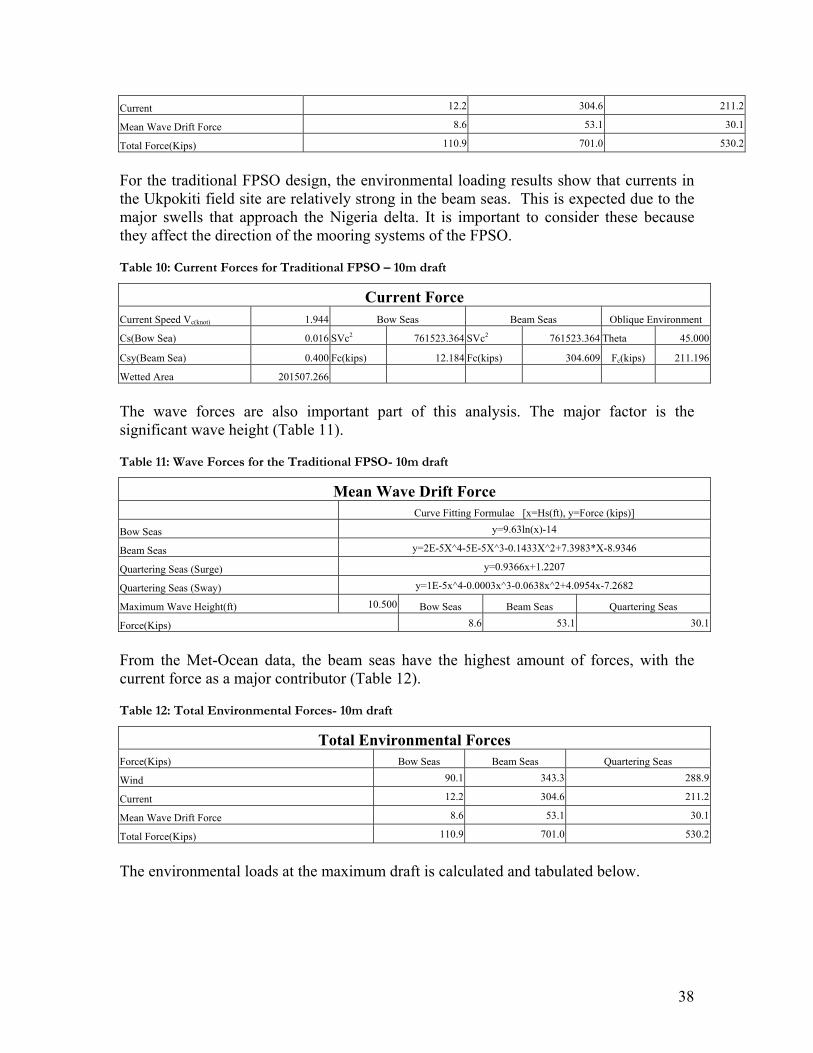
For the traditional FPSO design, the environmental loading results show that currents in the Ukpokiti field site are relatively strong in the beam seas. This is expected due to the major swells that approach the Nigeria delta. It is important to consider these because they affect the direction of the mooring systems of the FPSO.
Table 10: Current Forces for Traditional FPSO – 10m draft
Current Force Current Speed Vc(knot) 1.944 Bow Seas Beam Seas Oblique Environment
Cs(Bow Sea) 0.016 SVc2 761523.364 SVc2 761523.364 Theta 45.000
Csy(Beam Sea) 0.400 Fc(kips) 12.184 Fc(kips) 304.609 Fc(kips) 211.196
Wetted Area 201507.266
The wave forces are also important part of this analysis. The major factor is the significant wave height (Table 11).
Table 11: Wave Forces for the Traditional FPSO- 10m draft
Mean Wave Drift Force Curve Fitting Formulae [x=Hs(ft), y=Force (kips)]
Bow Seas y=9.63ln(x)-14
Beam Seas y=2E-5X^4-5E-5X^3-0.1433X^2+7.3983*X-8.9346
Quartering Seas (Surge) y=0.9366x+1.2207
Quartering Seas (Sway) y=1E-5x^4-0.0003x^3-0.0638x^2+4.0954x-7.2682
Maximum Wave Height(ft) 10.500 Bow Seas Beam Seas Quartering Seas
Force(Kips) 8.6 53.1 30.1
From the Met-Ocean data, the beam seas have the highest amount of forces, with the current force as a major contributor (Table 12).
Table 12: Total Environmental Forces- 10m draft
Total Environmental Forces Force(Kips) Bow Seas Beam Seas Quartering Seas
Wind 90.1 343.3 288.9
Current 12.2 304.6 211.2
Mean Wave Drift Force 8.6 53.1 30.1
Total Force(Kips) 110.9 701.0 530.2
The environmental loads at the maximum draft is calculated and tabulated below.
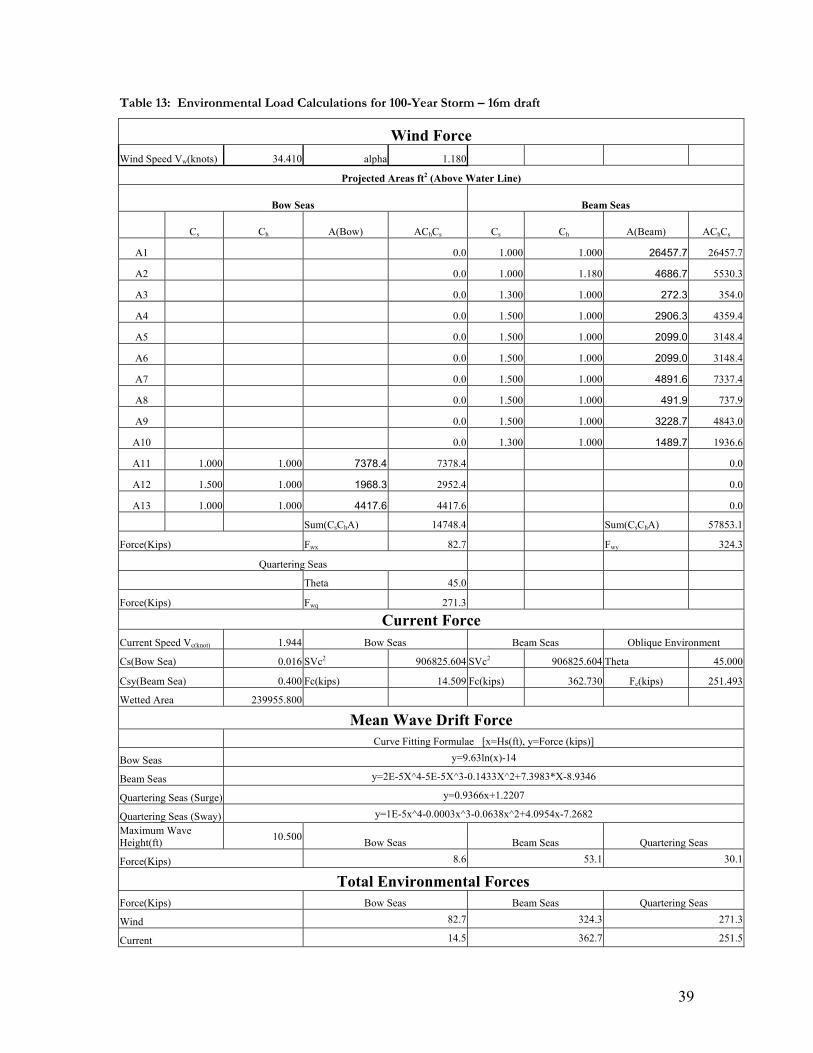
39
Table 13: Environmental Load Calculations for 100-Year Storm – 16m draft
Wind Force Wind Speed Vw(knots) 34.410 alpha 1.180
Projected Areas ft2 (Above Water Line)
Bow Seas Beam Seas
Cs Ch A(Bow) AChCs Cs Ch A(Beam) AChCs
A1 0.0 1.000 1.000 26457.7 26457.7
A2 0.0 1.000 1.180 4686.7 5530.3
A3 0.0 1.300 1.000 272.3 354.0
A4 0.0 1.500 1.000 2906.3 4359.4
A5 0.0 1.500 1.000 2099.0 3148.4
A6 0.0 1.500 1.000 2099.0 3148.4
A7 0.0 1.500 1.000 4891.6 7337.4
A8 0.0 1.500 1.000 491.9 737.9
A9 0.0 1.500 1.000 3228.7 4843.0
A10 0.0 1.300 1.000 1489.7 1936.6
A11 1.000 1.000 7378.4 7378.4 0.0
A12 1.500 1.000 1968.3 2952.4 0.0
A13 1.000 1.000 4417.6 4417.6 0.0
Sum(CsChA) 14748.4 Sum(CsChA) 57853.1
Force(Kips) Fwx 82.7 Fwy 324.3
Quartering Seas
Theta 45.0
Force(Kips) Fwq 271.3
Current Force Current Speed Vc(knot) 1.944 Bow Seas Beam Seas Oblique Environment
Cs(Bow Sea) 0.016 SVc2 906825.604 SVc2 906825.604 Theta 45.000
Csy(Beam Sea) 0.400 Fc(kips) 14.509 Fc(kips) 362.730 Fc(kips) 251.493
Wetted Area 239955.800
Mean Wave Drift Force Curve Fitting Formulae [x=Hs(ft), y=Force (kips)]
Bow Seas y=9.63ln(x)-14
Beam Seas y=2E-5X^4-5E-5X^3-0.1433X^2+7.3983*X-8.9346
Quartering Seas (Surge) y=0.9366x+1.2207
Quartering Seas (Sway) y=1E-5x^4-0.0003x^3-0.0638x^2+4.0954x-7.2682 Maximum Wave Height(ft) 10.500 Bow Seas Beam Seas Quartering Seas
Force(Kips) 8.6 53.1 30.1
Total Environmental Forces Force(Kips) Bow Seas Beam Seas Quartering Seas
Wind 82.7 324.3 271.3
Current 14.5 362.7 251.5
40
Mean Wave Drift Force 8.6 53.1 30.1
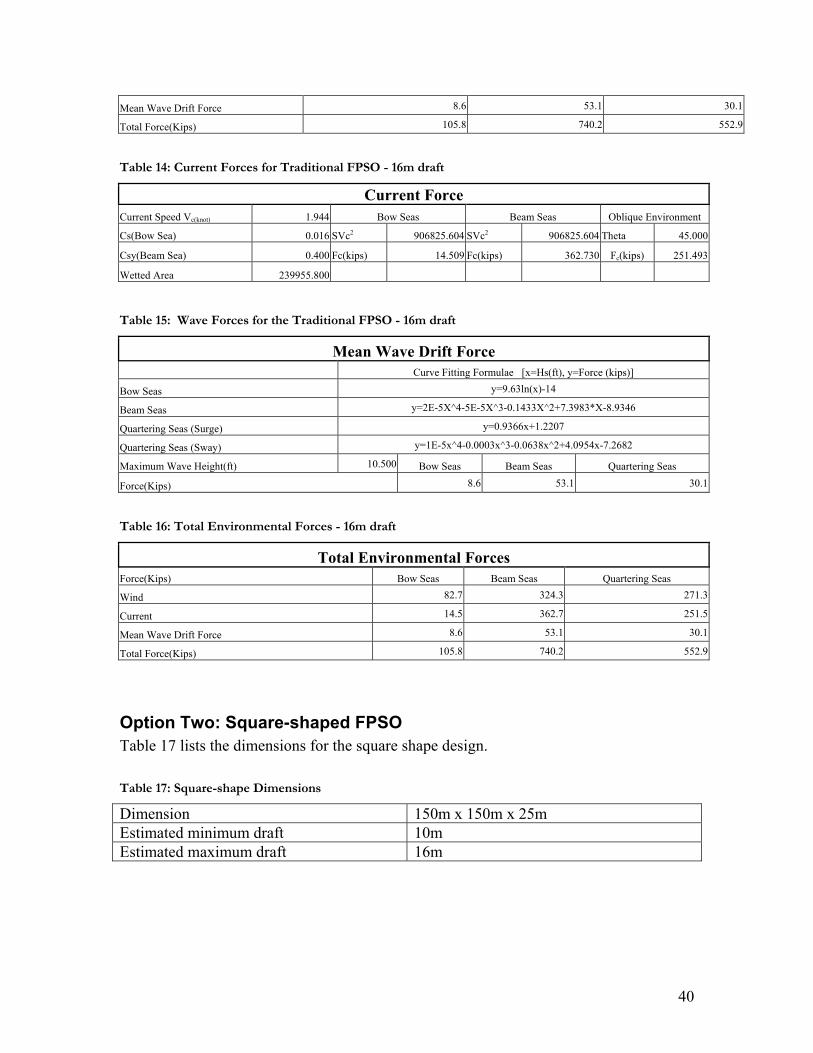
Total Force(Kips) 105.8 740.2 552.9
Table 14: Current Forces for Traditional FPSO - 16m draft
Current Force Current Speed Vc(knot) 1.944 Bow Seas Beam Seas Oblique Environment
Cs(Bow Sea) 0.016 SVc2 906825.604 SVc2 906825.604 Theta 45.000
Csy(Beam Sea) 0.400 Fc(kips) 14.509 Fc(kips) 362.730 Fc(kips) 251.493
Wetted Area 239955.800
Table 15: Wave Forces for the Traditional FPSO - 16m draft
Mean Wave Drift Force Curve Fitting Formulae [x=Hs(ft), y=Force (kips)]
Bow Seas y=9.63ln(x)-14
Beam Seas y=2E-5X^4-5E-5X^3-0.1433X^2+7.3983*X-8.9346
Quartering Seas (Surge) y=0.9366x+1.2207
Quartering Seas (Sway) y=1E-5x^4-0.0003x^3-0.0638x^2+4.0954x-7.2682
Maximum Wave Height(ft) 10.500 Bow Seas Beam Seas Quartering Seas
Force(Kips) 8.6 53.1 30.1
Table 16: Total Environmental Forces - 16m draft
Total Environmental Forces Force(Kips) Bow Seas Beam Seas Quartering Seas
Wind 82.7 324.3 271.3
Current 14.5 362.7 251.5
Mean Wave Drift Force 8.6 53.1 30.1
Total Force(Kips) 105.8 740.2 552.9
Option Two: Square-shaped FPSO Table 17 lists the dimensions for the square shape design. Table 17: Square-shape Dimensions
Dimension 150m x 150m x 25m Estimated minimum draft 10m Estimated maximum draft 16m

41
Below in Table 18, the surface areas of the components on the topside of the FPSO, are separated into segments. Figure 23 displays the areas.
Table 18: Initial Estimate of Wind Area
Item Area (m2) Water Glycol A1 205.00Water Separation A2 206.30Hull A3 3750.00Separation A4 358.50Storage and Offices A5 365.80Crane Tracks A6 60.00Power Generator A7 41.23Deck House A8 365.80Riser Hole A9 70.39
Figure 23: Bow and Beam Views for Square FPSO
42
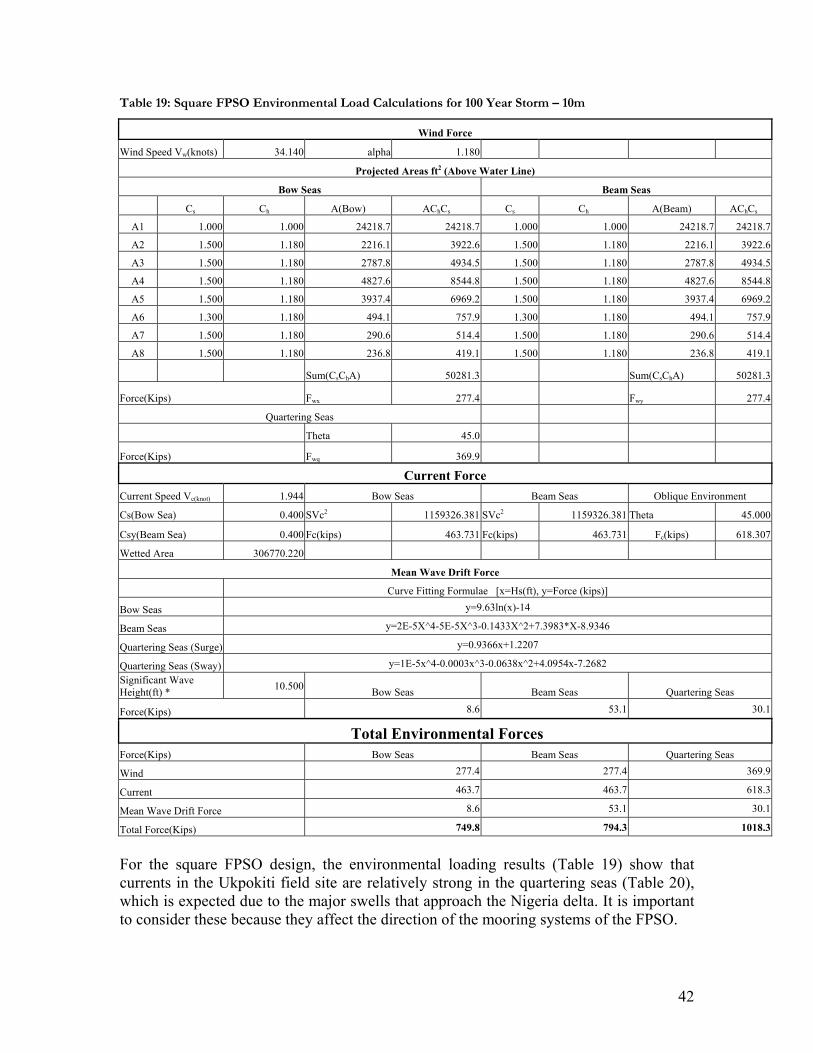
Table 19: Square FPSO Environmental Load Calculations for 100 Year Storm – 10m
Wind Force
Wind Speed Vw(knots) 34.140 alpha 1.180
Projected Areas ft2 (Above Water Line)
Bow Seas Beam Seas
Cs Ch A(Bow) AChCs Cs Ch A(Beam) AChCs
A1 1.000 1.000 24218.7 24218.7 1.000 1.000 24218.7 24218.7
A2 1.500 1.180 2216.1 3922.6 1.500 1.180 2216.1 3922.6
A3 1.500 1.180 2787.8 4934.5 1.500 1.180 2787.8 4934.5
A4 1.500 1.180 4827.6 8544.8 1.500 1.180 4827.6 8544.8
A5 1.500 1.180 3937.4 6969.2 1.500 1.180 3937.4 6969.2
A6 1.300 1.180 494.1 757.9 1.300 1.180 494.1 757.9
A7 1.500 1.180 290.6 514.4 1.500 1.180 290.6 514.4
A8 1.500 1.180 236.8 419.1 1.500 1.180 236.8 419.1
Sum(CsChA) 50281.3 Sum(CsChA) 50281.3
Force(Kips) Fwx 277.4 Fwy 277.4
Quartering Seas
Theta 45.0
Force(Kips) Fwq 369.9
Current Force Current Speed Vc(knot) 1.944 Bow Seas Beam Seas Oblique Environment
Cs(Bow Sea) 0.400 SVc2 1159326.381 SVc2 1159326.381 Theta 45.000
Csy(Beam Sea) 0.400 Fc(kips) 463.731 Fc(kips) 463.731 Fc(kips) 618.307
Wetted Area 306770.220
Mean Wave Drift Force
Curve Fitting Formulae [x=Hs(ft), y=Force (kips)]
Bow Seas y=9.63ln(x)-14
Beam Seas y=2E-5X^4-5E-5X^3-0.1433X^2+7.3983*X-8.9346
Quartering Seas (Surge) y=0.9366x+1.2207
Quartering Seas (Sway) y=1E-5x^4-0.0003x^3-0.0638x^2+4.0954x-7.2682 Significant Wave Height(ft) * 10.500 Bow Seas Beam Seas Quartering Seas
Force(Kips) 8.6 53.1 30.1
Total Environmental Forces Force(Kips) Bow Seas Beam Seas Quartering Seas
Wind 277.4 277.4 369.9
Current 463.7 463.7 618.3
Mean Wave Drift Force 8.6 53.1 30.1
Total Force(Kips) 749.8 794.3 1018.3
For the square FPSO design, the environmental loading results (Table 19) show that currents in the Ukpokiti field site are relatively strong in the quartering seas (Table 20), which is expected due to the major swells that approach the Nigeria delta. It is important to consider these because they affect the direction of the mooring systems of the FPSO.

43
Table 20: Current Forces for Square FPSO – 10m
Current Force Current Speed Vc(knot) 1.944 Bow Seas Beam Seas Oblique Environment
Cs(Bow Sea) 0.400 SVc2 1159326.381 SVc2 1159326.381 Theta 45.000
Csy(Beam Sea) 0.400 Fc(kips) 463.731 Fc(kips) 463.731 Fc(kips) 618.307
Wetted Area 306770.220
The wave forces are also important part of this analysis (Table 21). The major factor is the significant wave height.
Table 21: Mean Wave Drift Force- 10m
Mean Wave Drift Force
Curve Fitting Formulae [x=Hs(ft), y=Force (kips)]
Bow Seas y=9.63ln(x)-14
Beam Seas y=2E-5X^4-5E-5X^3-0.1433X^2+7.3983*X-8.9346
Quartering Seas (Surge) y=0.9366x+1.2207
Quartering Seas (Sway) y=1E-5x^4-0.0003x^3-0.0638x^2+4.0954x-7.2682
Significant Wave Height(ft) * 10.500 Bow Seas Beam Seas Quartering Seas
Force(Kips) 8.6 53.1 30.1
The met-ocean data shows that the beam seas have the highest amount of forces, with the current force as a major contributor (Table 22).
Table 22: Total Environmental Forces – 10m (Square FPSO)
Total Environmental Forces Force(Kips) Bow Seas Beam Seas Quartering Seas
Wind 277.4 277.4 369.9
Current 463.7 463.7 618.3
Mean Wave Drift Force 8.6 53.1 30.1
Total Force(Kips) 749.8 794.3 1018.3
The environmental loads at the maximum draft are calculated and tabulated in Table 23.

44
Table 23: Square FPSO Environmental Load Calculations for 100 Year Storm – 16m
Wind Force
Wind Speed Vw(knots) 34.140 alpha 1.180
Projected Areas ft2 (Above Water Line)
Bow Seas Beam Seas
Cs Ch A(Bow) AChCs Cs Ch A(Beam) AChCs
A1 1.000 1.000 14531.2 14531.2 1.000 1.000 14531.2 14531.2
A2 1.500 1.180 2216.1 3922.6 1.500 1.180 2216.1 3922.6
A3 1.500 1.180 2787.8 4934.5 1.500 1.180 2787.8 4934.5
A4 1.500 1.180 4827.6 8544.8 1.500 1.180 4827.6 8544.8
A5 1.500 1.180 3937.4 6969.2 1.500 1.180 3937.4 6969.2
A6 1.300 1.000 494.1 642.3 1.300 1.000 494.1 642.3
A7 1.500 1.180 290.6 514.4 1.500 1.180 290.6 514.4
A8 1.500 1.180 236.8 419.1 1.500 1.180 236.8 419.1
Sum(CsChA) 40478.2 Sum(CsChA) 40478.2
Force(Kips) Fwx 223.4 Fwy 223.4
Quartering Seas
Theta 45.0
Force(Kips) Fwq 297.8
Current Force Current Speed Vc(knot) 1.944 Bow Seas Beam Seas Oblique Environment
Cs(Bow Sea) 0.400 SVc2 1305767.608 SVc2 1305767.608 Theta 45.000
Csy(Beam Sea) 0.400 Fc(kips) 522.307 Fc(kips) 522.307 Fc(kips) 696.409
Wetted Area 345520.142
Mean Wave Drift Force
Curve Fitting Formulae [x=Hs(ft), y=Force (kips)]
Bow Seas y=9.63ln(x)-14
Beam Seas y=2E-5X^4-5E-5X^3-0.1433X^2+7.3983*X-8.9346
Quartering Seas (Surge) y=0.9366x+1.2207
Quartering Seas (Sway) y=1E-5x^4-0.0003x^3-0.0638x^2+4.0954x-7.2682 Significant Wave Height(ft) * 10.500 Bow Seas Beam Seas Quartering Seas
Force(Kips) 8.6 53.1 30.1
Total Environmental Forces Force(Kips) Bow Seas Beam Seas Quartering Seas
Wind 223.4 223.4 297.8
Current 522.3 522.3 696.4
Mean Wave Drift Force 8.6 53.1 30.1
Total Force(Kips) 754.3 798.8 1024.3
45
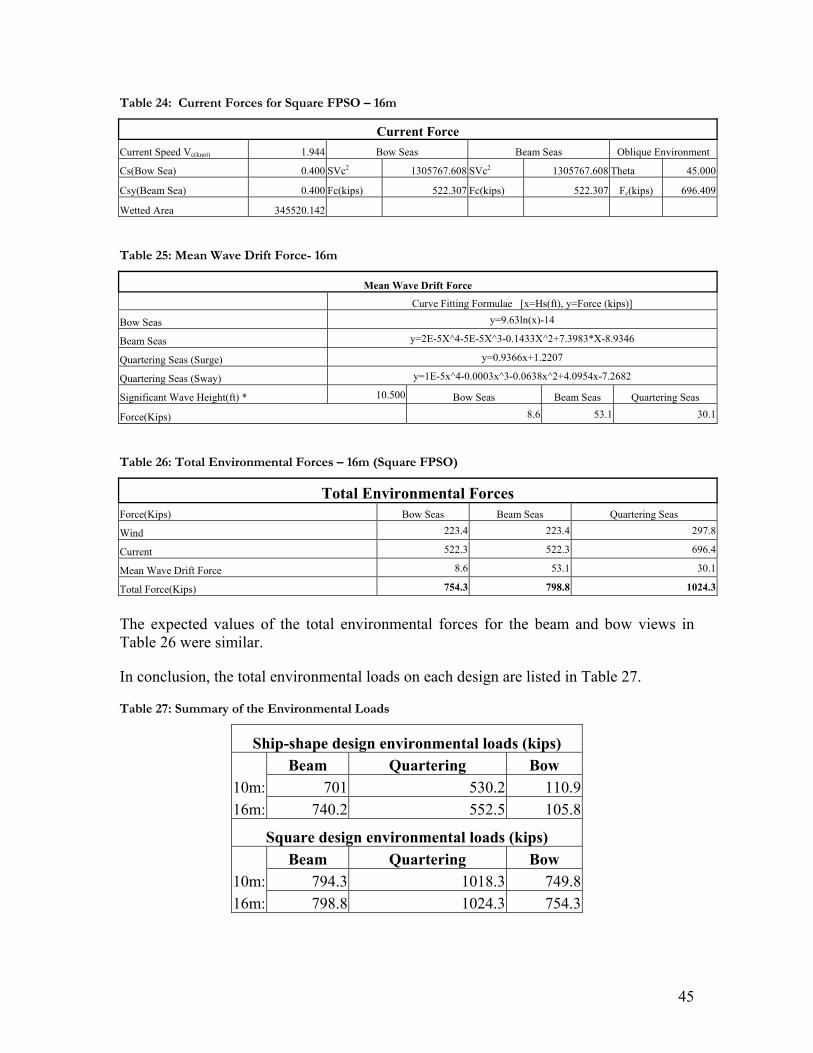
Table 24: Current Forces for Square FPSO – 16m
Current Force Current Speed Vc(knot) 1.944 Bow Seas Beam Seas Oblique Environment
Cs(Bow Sea) 0.400 SVc2 1305767.608 SVc2 1305767.608 Theta 45.000
Csy(Beam Sea) 0.400 Fc(kips) 522.307 Fc(kips) 522.307 Fc(kips) 696.409
Wetted Area 345520.142
Table 25: Mean Wave Drift Force- 16m
Mean Wave Drift Force
Curve Fitting Formulae [x=Hs(ft), y=Force (kips)]
Bow Seas y=9.63ln(x)-14
Beam Seas y=2E-5X^4-5E-5X^3-0.1433X^2+7.3983*X-8.9346
Quartering Seas (Surge) y=0.9366x+1.2207
Quartering Seas (Sway) y=1E-5x^4-0.0003x^3-0.0638x^2+4.0954x-7.2682
Significant Wave Height(ft) * 10.500 Bow Seas Beam Seas Quartering Seas
Force(Kips) 8.6 53.1 30.1
Table 26: Total Environmental Forces – 16m (Square FPSO)
Total Environmental Forces Force(Kips) Bow Seas Beam Seas Quartering Seas
Wind 223.4 223.4 297.8
Current 522.3 522.3 696.4
Mean Wave Drift Force 8.6 53.1 30.1
Total Force(Kips) 754.3 798.8 1024.3
The expected values of the total environmental forces for the beam and bow views in Table 26 were similar.
In conclusion, the total environmental loads on each design are listed in Table 27.
Table 27: Summary of the Environmental Loads
Ship-shape design environmental loads (kips) Beam Quartering Bow 10m: 701 530.2 110.9 16m: 740.2 552.5 105.8
Square design environmental loads (kips) Beam Quartering Bow 10m: 794.3 1018.3 749.8 16m: 798.8 1024.3 754.3
46
The results show the ship shape bow seas show the lowest environmental loads, thus if ship design is used, the ship will be moored into the bow seas. If the square shape is picked, the quartering seas show the lowest loads, and thus the ship will be moored into the quartering seas.
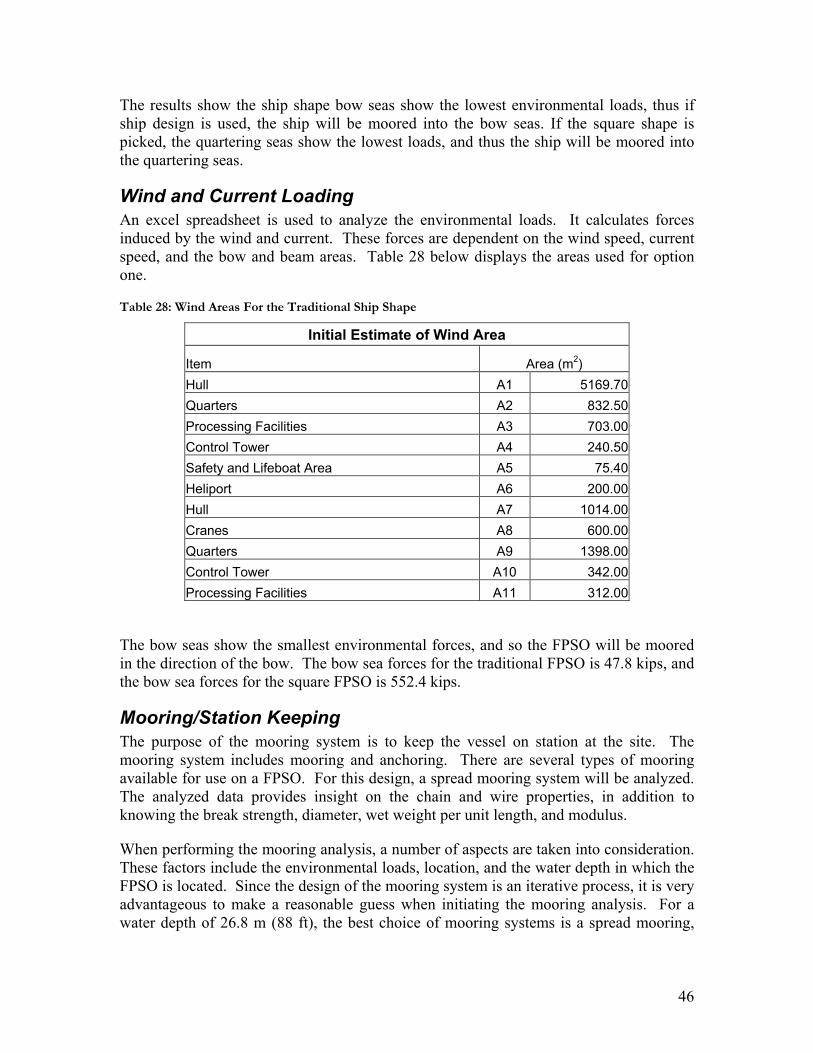
Wind and Current Loading An excel spreadsheet is used to analyze the environmental loads. It calculates forces induced by the wind and current. These forces are dependent on the wind speed, current speed, and the bow and beam areas. Table 28 below displays the areas used for option one.
Table 28: Wind Areas For the Traditional Ship Shape
Initial Estimate of Wind Area
Item Area (m2) Hull A1 5169.70 Quarters A2 832.50 Processing Facilities A3 703.00 Control Tower A4 240.50 Safety and Lifeboat Area A5 75.40 Heliport A6 200.00 Hull A7 1014.00 Cranes A8 600.00 Quarters A9 1398.00 Control Tower A10 342.00 Processing Facilities A11 312.00
The bow seas show the smallest environmental forces, and so the FPSO will be moored in the direction of the bow. The bow sea forces for the traditional FPSO is 47.8 kips, and the bow sea forces for the square FPSO is 552.4 kips.
Mooring/Station Keeping The purpose of the mooring system is to keep the vessel on station at the site. The mooring system includes mooring and anchoring. There are several types of mooring available for use on a FPSO. For this design, a spread mooring system will be analyzed. The analyzed data provides insight on the chain and wire properties, in addition to knowing the break strength, diameter, wet weight per unit length, and modulus.
When performing the mooring analysis, a number of aspects are taken into consideration. These factors include the environmental loads, location, and the water depth in which the FPSO is located. Since the design of the mooring system is an iterative process, it is very advantageous to make a reasonable guess when initiating the mooring analysis. For a water depth of 26.8 m (88 ft), the best choice of mooring systems is a spread mooring,
47
catenary system made up of all chain. The mooring system for this design consists of 4 groups with 3 lines in each.
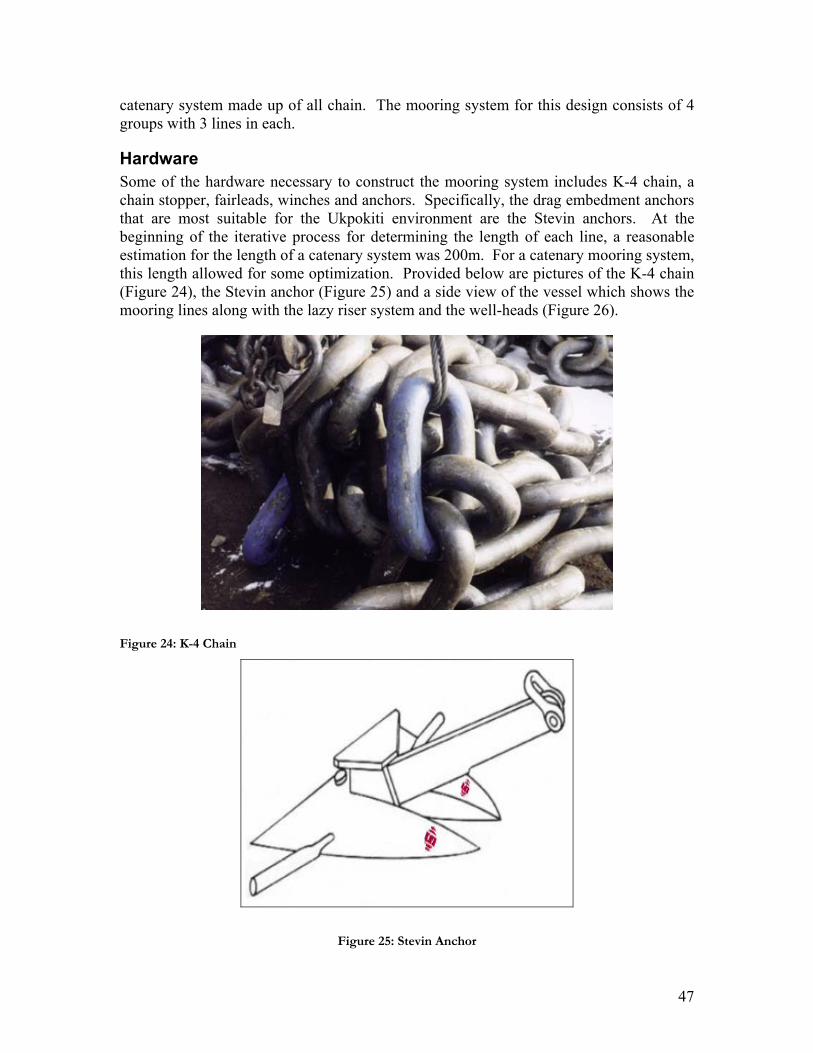
Hardware Some of the hardware necessary to construct the mooring system includes K-4 chain, a chain stopper, fairleads, winches and anchors. Specifically, the drag embedment anchors that are most suitable for the Ukpokiti environment are the Stevin anchors. At the beginning of the iterative process for determining the length of each line, a reasonable estimation for the length of a catenary system was 200m. For a catenary mooring system, this length allowed for some optimization. Provided below are pictures of the K-4 chain (Figure 24), the Stevin anchor (Figure 25) and a side view of the vessel which shows the mooring lines along with the lazy riser system and the well-heads (Figure 26).
Figure 24: K-4 Chain
Figure 25: Stevin Anchor
48
Figure 26: Complete Underwater System Configuration / Vessel with Mooring Lines

49
Design Conditions
The factor that played the biggest part in the design of the mooring system was the environmental loading condition. In a water depth of 26.8 m (88 ft), determining the environmental loads helped in making the decision to use a spread mooring system. Since the FPSO is positioned so that the beam is facing the environment, the beam sea force is the force that the FPSO is designed for. The beam sea for the traditional FPSO environmental force applied is 3292 kN (740 kips). The linear and co-linear forces are as follows. The wave force is 236 kN (53 kips), the current force is 1615 kN (363 kips), and the wind force is 1441 kN (324 kips).
Mooring System Analysis In order to complete the mooring system analysis, MIMOSA, a user interface computer program was utilized. By using the given input files, the program was able to calculate vessel motions in the form of surge, pitch, sway, heave and roll. It was also able to provide useful output data for the static external forces and the offset of the vessel. One of the most important files the user inputs into MIMOSA is called a WADAM file. This file is aids in the determination of the motion transfer functions and wave-drift coefficients. After the WADAM program provides an output, the file is then used in MIMOSA for the determination of the vessel mass, transfer functions, stability and line characteristics for the mooring system. Some of the major results provided by MIMOSA are the static external forces. The total force is 1103.9 kN (248.2 kips) is dominant in to the sway motion of the vessel. The forces are as follows: for the wind is 223.2 kN (50.1 kips) and for the wave it is 439 kN (98.7 kips) and the force due to the current is 888 kN (199.6 kips).
For this particular case, a standard WADAM file, was used in the analysis of the mooring system. The file was created for an FPSO with a capacity of one million barrels; this is very similar to the one that is being designed. The data used for the portion of the mass and wind analysis in MIMOSA also corresponds to FPSO design.
The main aspects of the mooring system that were continually altered are the line characteristics such as the diameter of the K-4 chain. In the 12-line system, each line is spaced 10 degrees apart. The results for a 12-line system with length of 220 m and diameter of 127 mm are as follows: for an intact system, the factors of safety ranged from 4.17 to 9.49 and the offset is 0.1 m. For a damaged system, the factors of safety ranged from 2.64 to 10 and the offset remained at 0.1. The initial design of a 12-line mooring system proved to be over-designed.
Mooring System Optimization Since there is a lot of room for optimization, an 8-line system was analyzed. A minor disadvantage of choosing an 8-line system is that the diameter of the K-4 chain used is larger and more expensive. When evaluating the 8-line system, the diameters of K-4 chain that were used to test the mooring system are 133.4 mm, 139.7 mm, 142.9 mm, and 146.1 mm. The results of the analysis show that the 8-line failed for most cases except for the diameter of 146.1mm where the factors of safety ranged from 3 to 7 for an intact case and from 1.83 to 8.4 for a damaged case. After examining the results of the 8-line
50
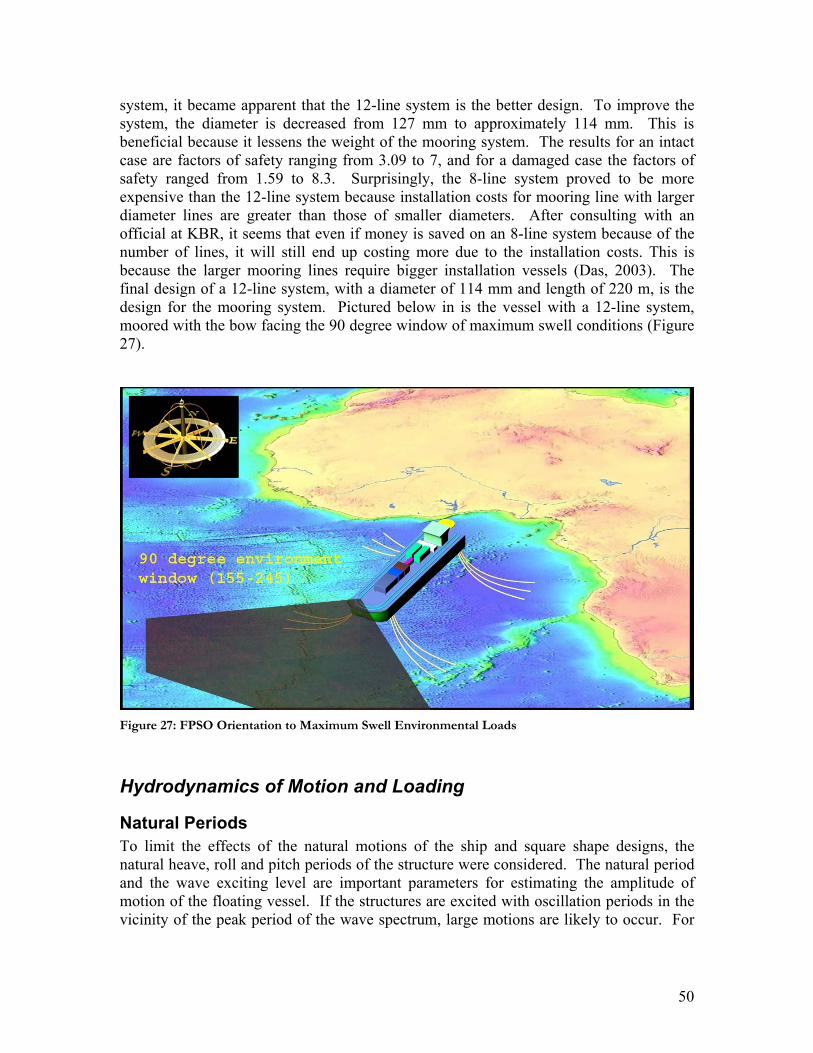
system, it became apparent that the 12-line system is the better design. To improve the system, the diameter is decreased from 127 mm to approximately 114 mm. This is beneficial because it lessens the weight of the mooring system. The results for an intact case are factors of safety ranging from 3.09 to 7, and for a damaged case the factors of safety ranged from 1.59 to 8.3. Surprisingly, the 8-line system proved to be more expensive than the 12-line system because installation costs for mooring line with larger diameter lines are greater than those of smaller diameters. After consulting with an official at KBR, it seems that even if money is saved on an 8-line system because of the number of lines, it will still end up costing more due to the installation costs. This is because the larger mooring lines require bigger installation vessels (Das, 2003). The final design of a 12-line system, with a diameter of 114 mm and length of 220 m, is the design for the mooring system. Pictured below in is the vessel with a 12-line system, moored with the bow facing the 90 degree window of maximum swell conditions (Figure 27).
Figure 27: FPSO Orientation to Maximum Swell Environmental Loads
Hydrodynamics of Motion and Loading
Natural Periods To limit the effects of the natural motions of the ship and square shape designs, the natural heave, roll and pitch periods of the structure were considered. The natural period and the wave exciting level are important parameters for estimating the amplitude of motion of the floating vessel. If the structures are excited with oscillation periods in the vicinity of the peak period of the wave spectrum, large motions are likely to occur. For

51
this reason, estimating natural period of floating platform is very important for preliminary design stage.
The natural heave period of the FPSO can be calculated using:
( )
ac
b
w
2 1g
where:T: periodM : added mass coefficientC : block coefficient C : waterplane area coefficient
: draft of ship (10m @lightship & 1
Bac
W
C DT MC
D
π= +
6m @ 100% full): gravityg
Due to the large water-plane area of FPSO, the natural periods of heave is in the range of wave periods. This is the reason why the FPSO motion characteristic is poor relative to other floating structure (OTRC 2002).
The uncoupled natural period in pitch of the FPSO is calculated using:
2
_______ 2
where:T: pitch periodM: mass of vesselMa: added mass of vesselr: radiation of gyration w/an axis parallel wit
L
Mr MaTg GM
πρ
+=
∀
_______
h the y-axis thru the CGg: gravity
: longitudinal metacentric height (m,ft): displaced volume of vessel
LGM∀
The uncoupled natural period in roll of the FPSO is calculated using:

52
_______ T=2
where:T: roll periodM: mass of vesselMa: added mass of vesselr: radiation of gyration w/an axis parallel with th
T
Mr Ma
g GMπ
ρ
+
∀
_______
e y-axis thru the CG: displaced volume of vessel
: transverse metacentric height.TGM
∀
The parameter that has the most influence on the natural periods is the metacentric height.
Pitch, Roll and Heave at Full Capacity: 16m draft The natural period of the ship shape and square shaped FPSO were calculated. Listed below are the results at 30% capacity, which produced a draft of 10m, and at full capacity it produces a draft of 16m.
Table 29: Heave Period of the Ship Shape FPSO at Full Capacity
Heave Natural Period-Ship Shape @ 16m draft
Units Metric English
Mac 2.02 2.02 added mass coefficient CB 0.97 0.97 block coefficient CW 1.06 1.06 water-plane area coefficient g 9.81 32.20 gravity (m/sec2, ft/sec2)
AW 13112.18 141152.11 water-plane area (m2, ft2) Lwl 237.80 780.22 waterline length (m, ft)
L 252.40 828.12 length of ship (m, ft) B 51.95 170.45 width of ship (m, ft) D 16.00 52.50 draft of ship (m, ft)
∀ 203961.95 7198607.45displaced volume of ship (m3, ft3)
T 13.35 13.34 Heave natural Period (s)

53
Table 30: Heave Period of the Square Shape FPSO at Full Capacity
Heave Natural Period-Square Shape @ 16m draft
Units Metric English
Mac 1.32 1.32 added mass coefficient CB 0.57 0.57 block coefficient CW 1.00 1.00 water-plane area coefficient g 9.81 32.2 gravity
AW 22500 242187 water-plane area (m2, ft2) L 150 492.15 length of ship (m, ft) B 150 492.15 width of ship (m, ft) D 16 52.50 draft of ship (m, ft) ∀ 205853.66 7265373.13 displaced volume of ship (m3, ft3) T 9.24 9.24 Heave natural Period (s)
The period of maximum wave height from the met-ocean data provided by ConocoPhillips gives a period of maximum wave height ranging from 13.3 s to 13.8 s. These are produced from swells. These calculations show the ship shape FPSO will be vulnerable to larger motions compared to the square shaped FPSO in heave.
Table 31: Pitch Period of the Ship Shape at Full Capacity
Pitch Natural Period-Ship Shape @ 16m draft
Units Metric English M 209E+6 14.3E+6 structure mass (kg, slug) Ma 1720999.60 117925.93 pitch added mass (kg, slug) r 15.69 51.48 radii of gyration
GML 331.80 1088.63 longitudinal metacentric height ρ 1025.00 1.99 fluid mass density g 9.81 32.2 gravity (m/sec2, ft/sec2) ∀ 203961.95 7198607.452 displaced volume of structure
Ix 51.9E+9 38.8E+9 Moment of Inertia of Masses T 1.73 1.73 Pitch Natural Period (s)
54
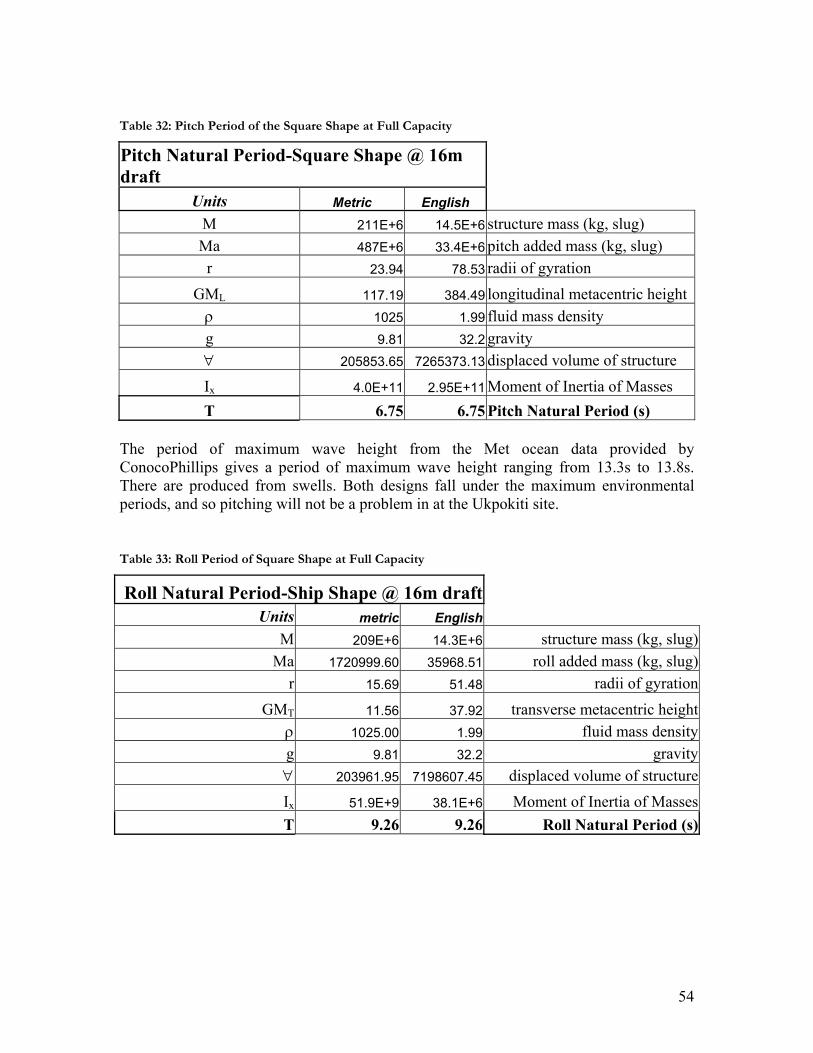
Table 32: Pitch Period of the Square Shape at Full Capacity
Pitch Natural Period-Square Shape @ 16m draft
Units Metric English M 211E+6 14.5E+6 structure mass (kg, slug) Ma 487E+6 33.4E+6 pitch added mass (kg, slug)
r 23.94 78.53 radii of gyration GML 117.19 384.49 longitudinal metacentric height
ρ 1025 1.99 fluid mass density g 9.81 32.2 gravity ∀ 205853.65 7265373.13 displaced volume of structure Ix 4.0E+11 2.95E+11 Moment of Inertia of Masses T 6.75 6.75 Pitch Natural Period (s)
The period of maximum wave height from the Met ocean data provided by ConocoPhillips gives a period of maximum wave height ranging from 13.3s to 13.8s. There are produced from swells. Both designs fall under the maximum environmental periods, and so pitching will not be a problem in at the Ukpokiti site.
Table 33: Roll Period of Square Shape at Full Capacity
Roll Natural Period-Ship Shape @ 16m draftUnits metric English
M 209E+6 14.3E+6 structure mass (kg, slug) Ma 1720999.60 35968.51 roll added mass (kg, slug)
r 15.69 51.48 radii of gyration GMT 11.56 37.92 transverse metacentric height
ρ 1025.00 1.99 fluid mass density g 9.81 32.2 gravity ∀ 203961.95 7198607.45 displaced volume of structure Ix 51.9E+9 38.1E+6 Moment of Inertia of MassesT 9.26 9.26 Roll Natural Period (s)
55
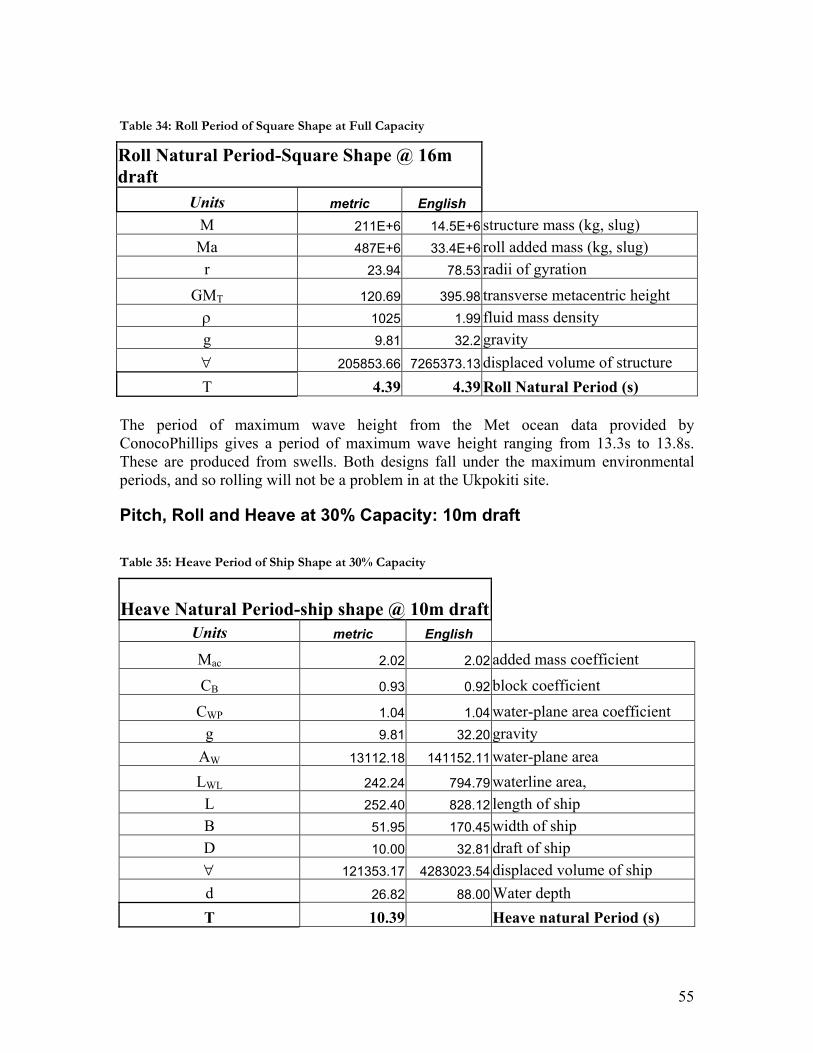
Table 34: Roll Period of Square Shape at Full Capacity
Roll Natural Period-Square Shape @ 16m draft
Units metric English M 211E+6 14.5E+6 structure mass (kg, slug) Ma 487E+6 33.4E+6 roll added mass (kg, slug)
r 23.94 78.53 radii of gyration GMT 120.69 395.98 transverse metacentric height
ρ 1025 1.99 fluid mass density g 9.81 32.2 gravity ∀ 205853.66 7265373.13 displaced volume of structure T 4.39 4.39 Roll Natural Period (s)
The period of maximum wave height from the Met ocean data provided by ConocoPhillips gives a period of maximum wave height ranging from 13.3s to 13.8s. These are produced from swells. Both designs fall under the maximum environmental periods, and so rolling will not be a problem in at the Ukpokiti site.
Pitch, Roll and Heave at 30% Capacity: 10m draft Table 35: Heave Period of Ship Shape at 30% Capacity
Heave Natural Period-ship shape @ 10m draftUnits metric English
Mac 2.02 2.02 added mass coefficient CB 0.93 0.92 block coefficient
CWP 1.04 1.04 water-plane area coefficient g 9.81 32.20 gravity
AW 13112.18 141152.11 water-plane area LWL 242.24 794.79 waterline area,
L 252.40 828.12 length of ship B 51.95 170.45 width of ship D 10.00 32.81 draft of ship ∀ 121353.17 4283023.54 displaced volume of ship d 26.82 88.00 Water depth T 10.39 Heave natural Period (s)

56
Table 36: Heave Period of Square Shape at 30% Capacity
Heave Natural Period-square shape FPSO
Units metric English
Mac 1.32 1.32 added mass coefficient
CB 0.68 0.91 block coefficient
CW 1 1 water-plane area coefficient g 9.81 32.2 gravity
AW 22500 242212 water-plane area L 150 492.15 length of ship B 150 492.15 width of ship D 10 32.81 draft of ship ∀ 153257.56 7265373.13 displaced volume of ship T 7.97 7.97 Heave natural Period
The period of maximum wave height from the Met ocean data provided by ConocoPhillips gives a period of maximum wave height ranging from 13.3s to 13.8s. There are produced from swells. The heave period of the ship shape FPSO is close to the maximum environmental periods, but is still allowable.
Table 37: Pitch Period of Ship Shape at 30% Capacity
Pitch Natural Period-ship shape @ 10m draft Units metric English
M 124E+6 8.5E+6 structure mass
Ma 718858.13 49257.43 pitch added mass r 15.27 50.11 radii of gyration
GML 33.00 108.27 longitudinal metacentric height ρ 1025.00 1.99 fluid mass density g 9.81 32.20 gravity ∀ 121353.17 4283023.54 displaced volume of structure
Ix 29.2E+9 21.5E+9 Moment of Inertia of Masses T 5.33 5.33 Pitch Natural Period (s)
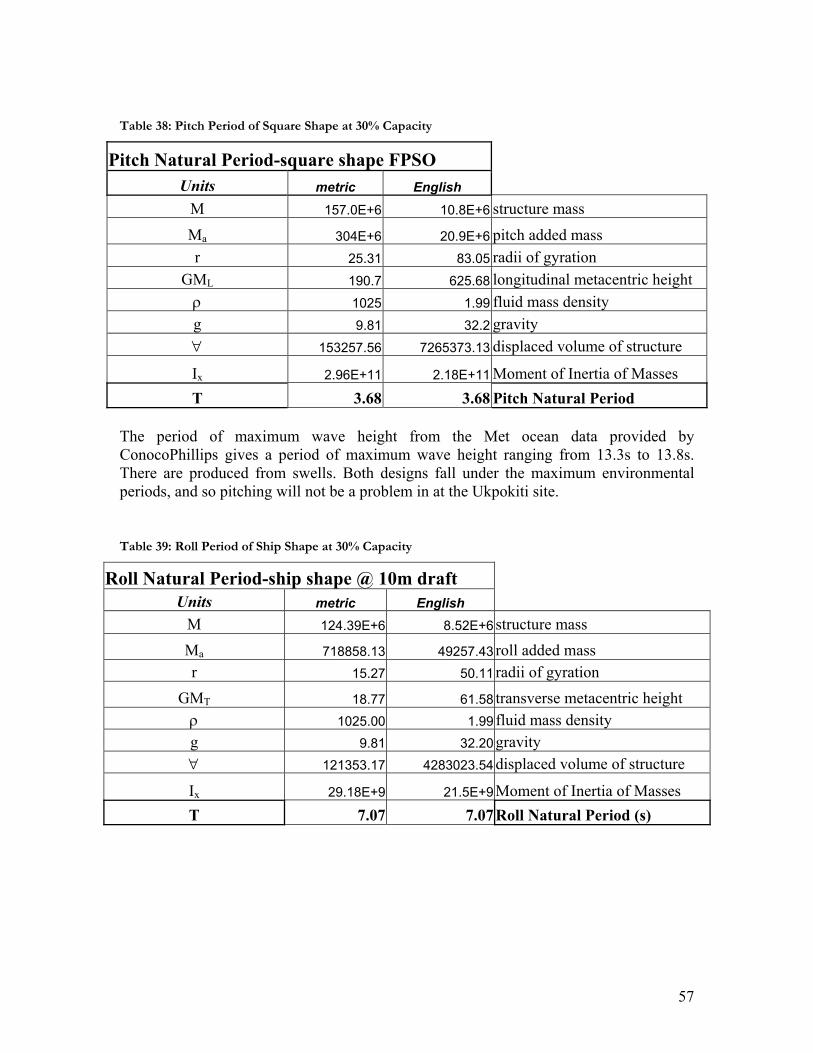
57
Table 38: Pitch Period of Square Shape at 30% Capacity
Pitch Natural Period-square shape FPSO Units metric English
M 157.0E+6 10.8E+6 structure mass
Ma 304E+6 20.9E+6 pitch added mass r 25.31 83.05 radii of gyration
GML 190.7 625.68 longitudinal metacentric height ρ 1025 1.99 fluid mass density g 9.81 32.2 gravity ∀ 153257.56 7265373.13 displaced volume of structure
Ix 2.96E+11 2.18E+11 Moment of Inertia of Masses T 3.68 3.68 Pitch Natural Period
The period of maximum wave height from the Met ocean data provided by ConocoPhillips gives a period of maximum wave height ranging from 13.3s to 13.8s. There are produced from swells. Both designs fall under the maximum environmental periods, and so pitching will not be a problem in at the Ukpokiti site.
Table 39: Roll Period of Ship Shape at 30% Capacity
Roll Natural Period-ship shape @ 10m draft Units metric English
M 124.39E+6 8.52E+6 structure mass Ma 718858.13 49257.43 roll added mass r 15.27 50.11 radii of gyration
GMT 18.77 61.58 transverse metacentric height ρ 1025.00 1.99 fluid mass density g 9.81 32.20 gravity ∀ 121353.17 4283023.54 displaced volume of structure
Ix 29.18E+9 21.5E+9 Moment of Inertia of Masses T 7.07 7.07 Roll Natural Period (s)

58
Table 40: Roll Period of Square shape at 30% Capacity
Roll Natural Period-square shape FPSO Units metric English
M 157.0E+6 10.8E+6 structure mass Ma 304.42E+6 20.9E+6 roll added mass r 25.32 83.05 radii of gyration
GMT 189.1 620.43 transverse metacentric height ρ 1025 1.99 fluid mass density g 9.81 32.2 gravity ∀ 153257.561 7265373.132 displaced volume of structure T 3.7 3.7 Roll Natural Period
The period of maximum wave height from the Met ocean data provided by ConocoPhillips gives a period of maximum wave height ranging from 13.3s to 13.8s. There are produced from swells. Both designs fall under the maximum environmental periods, and so rolling will not be a problem in at the Ukpokiti site.
Response Amplitude Operators Response amplitude operators were extracted from the MIMOSA output so as to measure the motions of the vessel in pitch, roll, yaw, heave, sway, and surge. These values were plotted, and subsequently compared to a JONSWAP spectrum. In order to find the response in a given direction of motion, the RAO at the JONSWAP peak frequency was multiplied by the 100-year wave. The JONSWAP peak frequency was around 0.4 rad/s. Plots of the RAO’s may be found in Figure 28 and Figure 29. Table 41 shows offsets for directions of 157.5 and 180 degrees, for the six different types of motion.
Table 41: Maximum Offsets for a 100-Year Storm
100-year Direction (deg) Wave (m)
157.5 3.2 180 2.3
Direction (deg)
Response 157.5 180Pitch (rad) 0.028656 0.0204769Roll (rad) 0.013747 2.12681E-09Yaw (rad) 0.011898 2.15625E-09Heave (m) 1.51296 0.88205Sway (m) 0.52096 8.3145E-08Surge (m) 0.87264 0.53912

59
0
0.1
0.2
0.3
0.4
0.5
0.6
0.7
0.8
0.9
1
1.1
0 0.2 0.4 0.6 0.8 1 1.2 1.4 1.6 1.8 2 2.2 2.4 2.6 2.8 3
Frequency (rad/s)
Res
pons
e (m
/m) Pitch
Roll
Yaw
Heave
Surge
Sway
Figure 28: RAO Response for Direction 157.5o
0
0.1
0.2
0.3
0.4
0.5
0.6
0.7
0.8
0.9
1
0 0.2 0.4 0.6 0.8 1 1.2 1.4 1.6 1.8 2 2.2 2.4 2.6 2.8 3
Frequency (rad/s)
Res
pons
e (m
/m) Pitch
Roll
Yaw
Heave
Sway
Surge
Figure 29: RAO Response for Direction 180o
60
The maximum motions occur due to heave and surge, oriented 157.5 true. These motions however, are relatively small. This can be attributed to the relatively benign environment that is characteristic of this region. Based on the data provided, it is now apparent that the vessel will not impact the bottom due to pitch or heave. The vessel also does not appear to need bilge keels, since the response in roll is quite small. Tandem offloading should also not be a problem, since the 100-year wave only creates a surge response of 0.87 m, while the 100-year wave only creates a heave response of 1.51m.
Cost In every creative venture, cost is a major factor in the design process. For the FPSO at Ukpokiti, general estimations are made to determine the budget for the design. The cost breakdown was done for both the ship-shape and the square-shape options, using the 8-line and 12-line mooring systems. They were further defined by finding cost percentages from built vessels in operation. The bulks, painting, and fireproofing was found to be 8% of the primary structure weight. The hull outfittings were determined as 13% of the hull main steel and the corrosion protection was determined as 3% of the hull main steel. Using these percentages Table 42, Table 43, Table 44, and Table 45 are given. The total cost for the ship-shape option is 373 million dollars and 360 million dollars for the 8-line and the 12-line system, respectively. The total cost for the square-shape option is 448 million and 443 million for the 8-line and the 12-line systems, respectively.
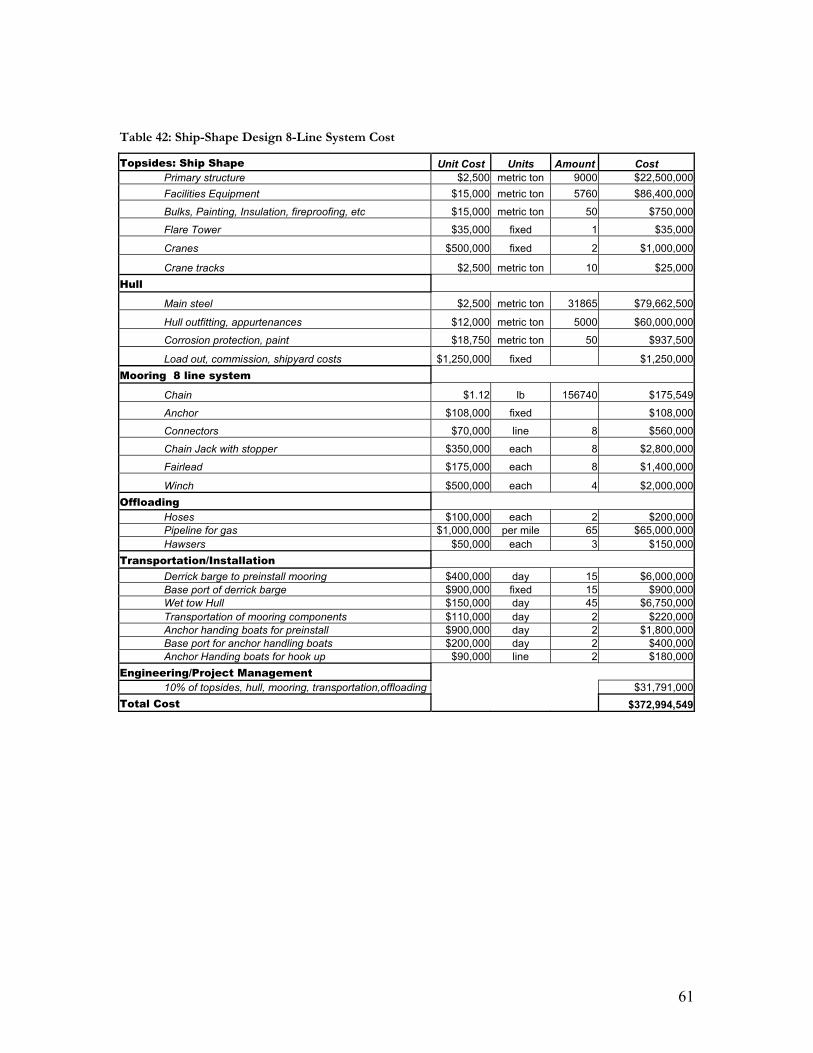
61
Table 42: Ship-Shape Design 8-Line System Cost
Topsides: Ship Shape Unit Cost Units Amount Cost Primary structure $2,500 metric ton 9000 $22,500,000 Facilities Equipment $15,000 metric ton 5760 $86,400,000
Bulks, Painting, Insulation, fireproofing, etc $15,000 metric ton 50 $750,000
Flare Tower $35,000 fixed 1 $35,000
Cranes $500,000 fixed 2 $1,000,000
Crane tracks $2,500 metric ton 10 $25,000 Hull
Main steel $2,500 metric ton 31865 $79,662,500
Hull outfitting, appurtenances $12,000 metric ton 5000 $60,000,000
Corrosion protection, paint $18,750 metric ton 50 $937,500
Load out, commission, shipyard costs $1,250,000 fixed $1,250,000 Mooring 8 line system
Chain $1.12 lb 156740 $175,549
Anchor $108,000 fixed $108,000
Connectors $70,000 line 8 $560,000
Chain Jack with stopper $350,000 each 8 $2,800,000
Fairlead $175,000 each 8 $1,400,000
Winch $500,000 each 4 $2,000,000 Offloading
Hoses $100,000 each 2 $200,000 Pipeline for gas $1,000,000 per mile 65 $65,000,000 Hawsers $50,000 each 3 $150,000
Transportation/Installation Derrick barge to preinstall mooring $400,000 day 15 $6,000,000 Base port of derrick barge $900,000 fixed 15 $900,000 Wet tow Hull $150,000 day 45 $6,750,000 Transportation of mooring components $110,000 day 2 $220,000 Anchor handing boats for preinstall $900,000 day 2 $1,800,000 Base port for anchor handling boats $200,000 day 2 $400,000 Anchor Handing boats for hook up $90,000 line 2 $180,000
Engineering/Project Management 10% of topsides, hull, mooring, transportation,offloading $31,791,000
Total Cost $372,994,549
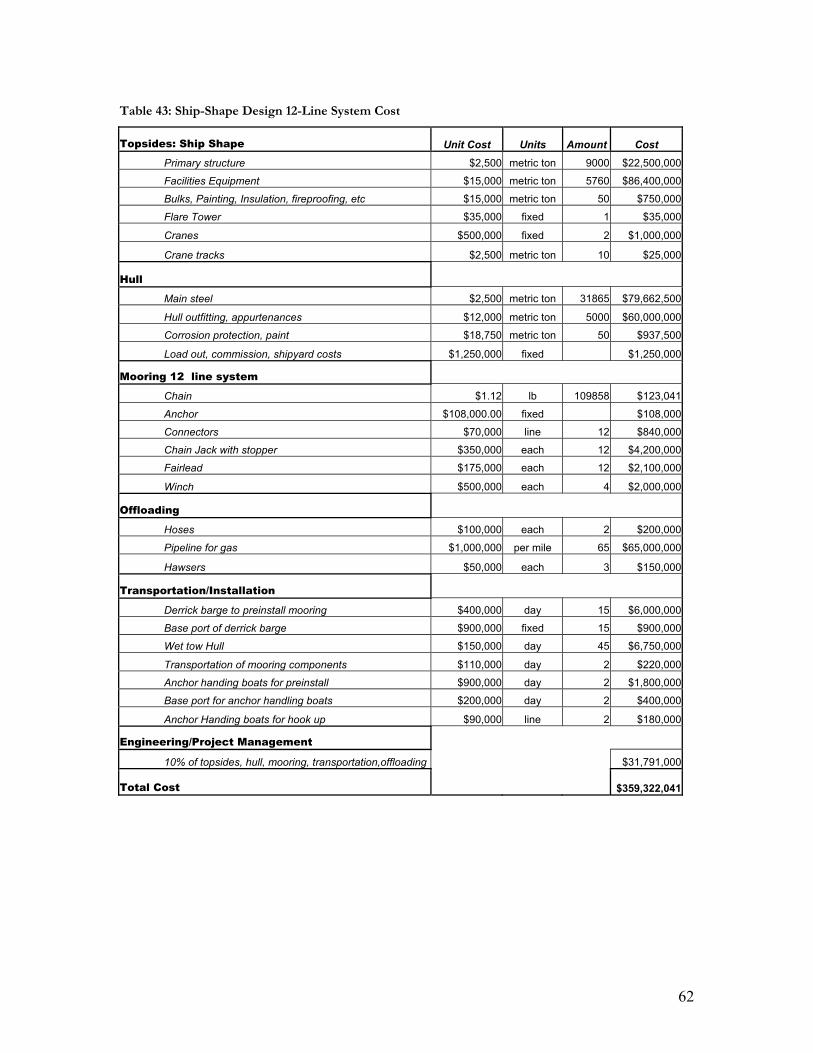
62
Table 43: Ship-Shape Design 12-Line System Cost
Topsides: Ship Shape Unit Cost Units Amount Cost
Primary structure $2,500 metric ton 9000 $22,500,000
Facilities Equipment $15,000 metric ton 5760 $86,400,000
Bulks, Painting, Insulation, fireproofing, etc $15,000 metric ton 50 $750,000
Flare Tower $35,000 fixed 1 $35,000
Cranes $500,000 fixed 2 $1,000,000
Crane tracks $2,500 metric ton 10 $25,000
Hull
Main steel $2,500 metric ton 31865 $79,662,500
Hull outfitting, appurtenances $12,000 metric ton 5000 $60,000,000
Corrosion protection, paint $18,750 metric ton 50 $937,500
Load out, commission, shipyard costs $1,250,000 fixed $1,250,000
Mooring 12 line system
Chain $1.12 lb 109858 $123,041
Anchor $108,000.00 fixed $108,000
Connectors $70,000 line 12 $840,000
Chain Jack with stopper $350,000 each 12 $4,200,000
Fairlead $175,000 each 12 $2,100,000
Winch $500,000 each 4 $2,000,000
Offloading
Hoses $100,000 each 2 $200,000
Pipeline for gas $1,000,000 per mile 65 $65,000,000
Hawsers $50,000 each 3 $150,000
Transportation/Installation
Derrick barge to preinstall mooring $400,000 day 15 $6,000,000
Base port of derrick barge $900,000 fixed 15 $900,000
Wet tow Hull $150,000 day 45 $6,750,000
Transportation of mooring components $110,000 day 2 $220,000
Anchor handing boats for preinstall $900,000 day 2 $1,800,000
Base port for anchor handling boats $200,000 day 2 $400,000
Anchor Handing boats for hook up $90,000 line 2 $180,000
Engineering/Project Management
10% of topsides, hull, mooring, transportation,offloading $31,791,000
Total Cost $359,322,041
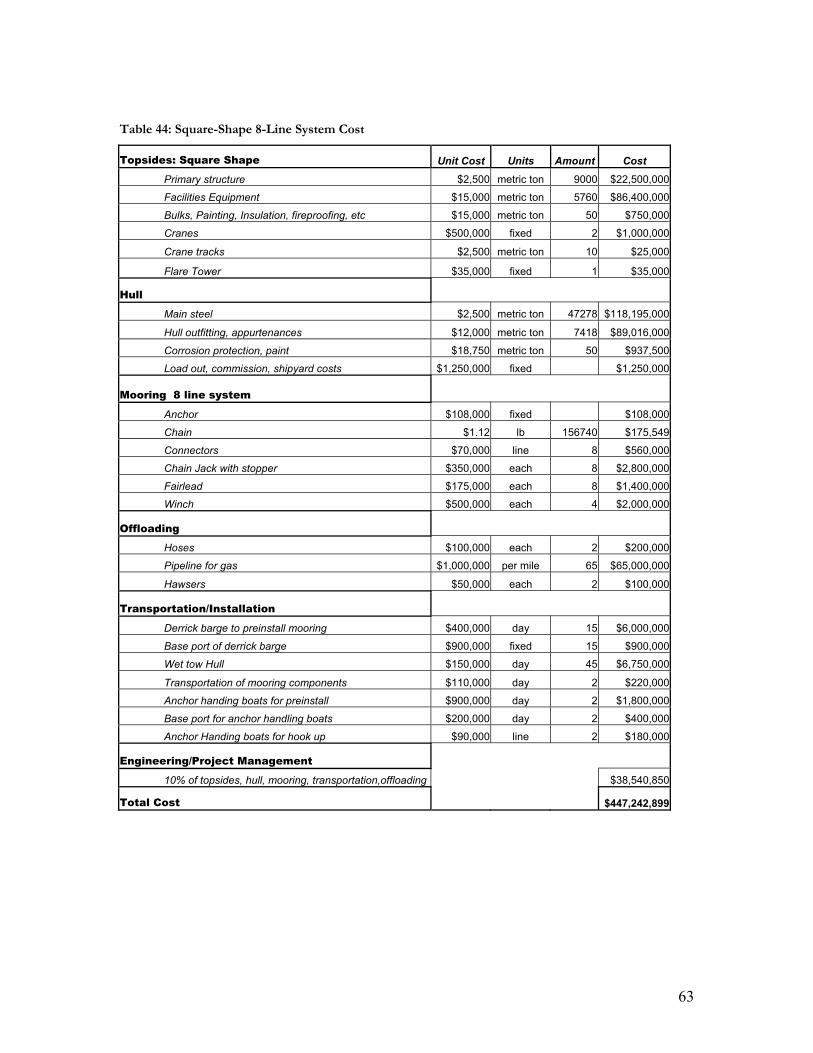
63
Table 44: Square-Shape 8-Line System Cost
Topsides: Square Shape Unit Cost Units Amount Cost
Primary structure $2,500 metric ton 9000 $22,500,000
Facilities Equipment $15,000 metric ton 5760 $86,400,000
Bulks, Painting, Insulation, fireproofing, etc $15,000 metric ton 50 $750,000
Cranes $500,000 fixed 2 $1,000,000
Crane tracks $2,500 metric ton 10 $25,000
Flare Tower $35,000 fixed 1 $35,000
Hull
Main steel $2,500 metric ton 47278 $118,195,000
Hull outfitting, appurtenances $12,000 metric ton 7418 $89,016,000
Corrosion protection, paint $18,750 metric ton 50 $937,500
Load out, commission, shipyard costs $1,250,000 fixed $1,250,000
Mooring 8 line system
Anchor $108,000 fixed $108,000
Chain $1.12 lb 156740 $175,549
Connectors $70,000 line 8 $560,000
Chain Jack with stopper $350,000 each 8 $2,800,000
Fairlead $175,000 each 8 $1,400,000
Winch $500,000 each 4 $2,000,000
Offloading
Hoses $100,000 each 2 $200,000
Pipeline for gas $1,000,000 per mile 65 $65,000,000
Hawsers $50,000 each 2 $100,000
Transportation/Installation
Derrick barge to preinstall mooring $400,000 day 15 $6,000,000
Base port of derrick barge $900,000 fixed 15 $900,000
Wet tow Hull $150,000 day 45 $6,750,000
Transportation of mooring components $110,000 day 2 $220,000
Anchor handing boats for preinstall $900,000 day 2 $1,800,000
Base port for anchor handling boats $200,000 day 2 $400,000
Anchor Handing boats for hook up $90,000 line 2 $180,000
Engineering/Project Management
10% of topsides, hull, mooring, transportation,offloading $38,540,850
Total Cost $447,242,899

64
Table 45: Square-Shape 12 Line System Cost
Topsides: Square Shape Unit Cost Units Amount Cost
Primary structure $2,500 metric ton 9000 $22,500,000
Facilities Equipment $15,000 metric ton 5760 $86,400,000
Bulks, Painting, Insulation, fireproofing, etc $15,000 metric ton 50 $750,000
Cranes $500,000 fixed 2 $1,000,000
Crane tracks $2,500 metric ton 10 $25,000
Flare Tower $35,000 fixed 1 $35,000
Hull
Main steel $2,500 metric ton 47278 $118,195,000
Hull outfitting, appurtenances $12,000 metric ton 7418 $89,016,000
Corrosion protection, paint $18,750 metric ton 50 $937,500
Load out, commission, shipyard costs $1,250,000 fixed $1,250,000
Mooring 12 line system
Anchor $108,000 fixed $108,000
Chain $1.12 lb 109858 $123,041
Connectors $70,000 line 12 $840,000
Chain Jack with stopper $350,000 each 12 $4,200,000
Fairlead $175,000 each 12 $2,100,000
Winch $500,000 each 4 $2,000,000
Offloading
Hoses $100,000 each 2 $200,000
Pipeline for gas $1,000,000 per mile 65 $65,000,000
Hawsers $50,000 each 2 $100,000
Transportation/Installation
Derrick barge to preinstall mooring $400,000 day 15 $6,000,000
Base port of derrick barge $900,000 fixed 15 $900,000
Wet tow Hull $150,000 day 45 $6,750,000
Transportation of mooring components $110,000 day 2 $220,000
Anchor handing boats for preinstall $900,000 day 2 $1,800,000
Base port for anchor handling boats $200,000 day 2 $400,000
Anchor Handing boats for hook up $90,000 line 2 $180,000
Engineering/Project Management
10% of topsides, hull, mooring, transportation,offloading $38,540,850
Total Cost $442,570,391
65
Offloading System The offloading system that will be used in this design is the tandem stern offtake system. The FPSO will be moored with the bow facing the open ocean. Shuttle tankers will anchor off the stern of the FPSO, forming a straight line with the vessel. An offtake hose emanating from the stern will be passed to the shuttle tanker via a workboat, so that it many connect to the intake manifolds of the shuttle tanker. This system has both advantages and disadvantages. A major advantage of the floating hose offtake is that it is a standard practice, and thus a proven technology. It also provides ease of use, with relatively little moving mechanical parts. Some disadvantages of the system however, is that a workboat is required to complete the connection process. It is also open to dismemberment by passing workboats, and finally maintaining the system requires time, since the hose has to be constantly checked for leaks.
The decision criterion for the offloading system for the FPSO offtaking is listed below:
• Expected offloading time
o 12 hours • Offloading capacity
o 650,000 BBLS o Aframax Shuttle tanker
• Offloading Schedule o Once a month.
The offloading criterion affects the decision process in determining the hose, and pump characteristics for the offtake system. The floating hose is determined to be about 200 m (656.2 ft) in length. Specifications such as material, cost analysis, workboat transfer procedures, emergency hoses (amount and location), and storage of hoses are in the formulation stage. In order to transfer the crude oil from vessel to vessel, 24 pumps will be used for the 24 tanks. The specifications of the pump speed, power, dimensions, number, emergency shut off procedures, and emergency pumps (amounts and location) are in the formation stage.
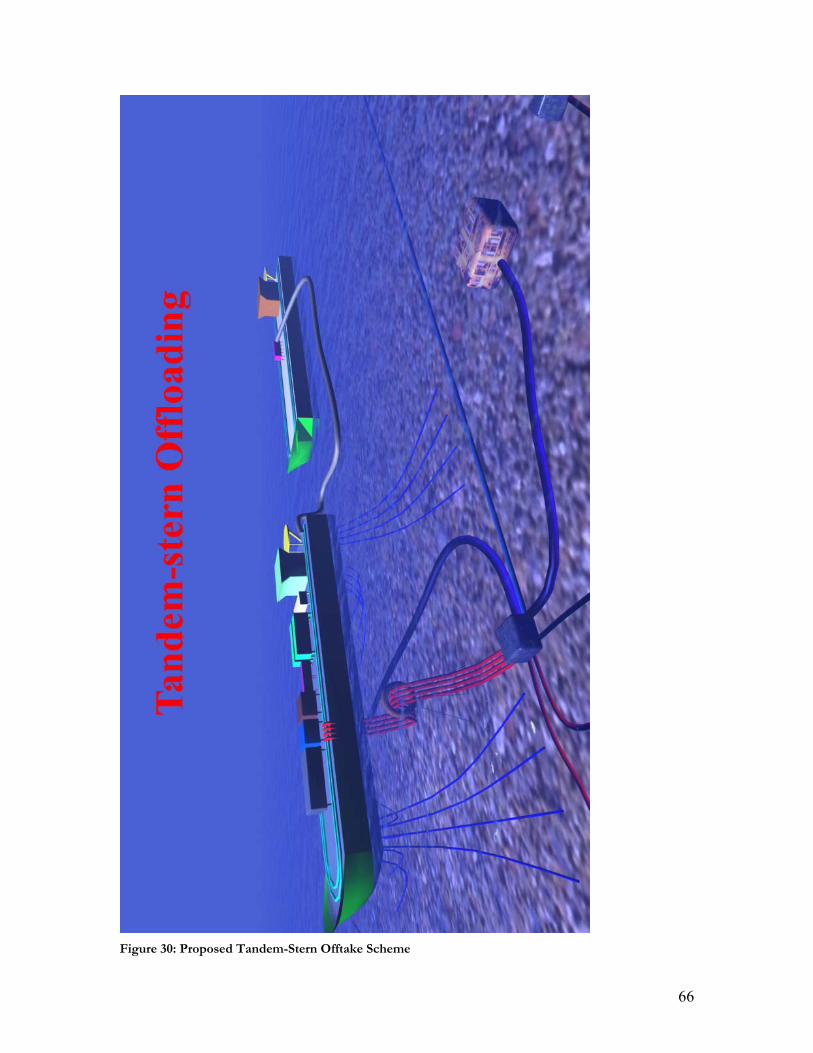
66
Figure 30: Proposed Tandem-Stern Offtake Scheme

67
Figure 31: Processing Flowchart
Summary and Conclusions Floating Production, Storage, and Offloading (FPSO) systems comprise a branch in offshore technology. A shallow water depth of 27 m (88 ft), storm generated swells, low daily production output, and various regulatory bodies govern the overall design. Two separate designs have been considered throughout the project. The first option is a conventional ship shape, while the other is a more creative square shape. Both facilities include processing modules scaled from existing vessels. The storage capacity criterion is based on the total daily production output. The intended shuttling tanker, a 650,000 BBL Aframax, will be used to move the product from West Africa to the United States. In order to be economical, only full loads will be shuttled. Based on an output of 20,000 BBL/day, the total lift cycle is approximately thirty days.
A catenary spread-mooring system is used for the FPSO. After optimization, the 12-line mooring system consists of line lengths equal to 250 m (820.21 ft) and factors of safety ranging from 2.5 to 3 for an intact system, and 1.4 for a damaged system. The tandem-stern offloading approach was selected based on the safety, cost, and reliability factors. A floating hose, carried by a workboat, connects the two vessels and provides a means to transfer huge amounts of product in a relatively short amount of time. As a result of being located directly behind the FPSO, the tandem configuration also helps to eliminate the exposure of environmental forces on the shuttling tanker. Environmental loads were also calculated for both designs, at the maximum and minimum capacity. These forces are dependent on the wind speed, current speed, and the bow and beam areas. For the traditional FPSO design, the environmental loading results show that currents in the Ukpokiti field site are relatively strong in the beam seas. This is expected due to the major swells that approach the Nigeria delta. These swells originate from the southwest. The bow seas show the smallest environmental forces, and so the FPSO will be moored in the direction of the bow. The bow sea forces for the traditional FPSO is 110.9 kips at the 30% capacity, and 105.8 kips at 100% capacity. The quartering sea forces for the

68
square FPSO is 749.8 kips at 30% capacity, and 754.3 kips at the 100% capacity. The loading for the square shape is nearly equal for both bow and beam seas.
To limit the effects of the natural motions of the ship and square shape designs, the natural heave, roll and pitch periods of the structure were considered. The natural period and the wave exciting level are important parameters for estimating the amplitude of motion of the floating vessel. Due to the large water-plane area of FPSO, the natural periods of heave is in the range of wave periods. The period of maximum wave height from the Metocean data provided by ConocoPhillips gives a period of maximum wave height ranging from 13.3s to 13.8s. They are produced from swells. The heave period of the ship shape FPSO at maximum capacity is 13.35 seconds.
Intact stability shows that for the 100% capacity and the 30% capacity cases the area ratio of 1.4 is satisfied. Damage stability shows that when one side ballast tank is damaged regulations are also meet for both cases. There is 14 degrees between the first intercept and the second intercept, regulations require 7 degrees. Also at some 13.5 degrees, which is before the downflooding angle the righting arm is twice that of the heeling arm at the same angle.
A cost analysis for both the ship shape and square shape FPSO was conducted. The estimates are listed below in Table 46.
Table 46: Summary of Cost
FPSO 8 line 12 line
Ship Shape $373,000,000 $359,000,000
Square Shape $443,000,000 $443,000,000
Feasibility of Square Shape FPSO: A major design concern for the square FPSO was the environmental load due to the symmetrical shape of the vessel. The largest environmental loads on the vessel was from currents in the quartering seas for both 30 % and 100% capacity as seen in Table 24. These forces in comparison to the ship FPSO are much larger, and thus will cost more to moor the vessel. However, an advantage of using the square FPSO is that it has a shallower draft as shown in Table 5, and this is a major plus since the field site is only 27 m in depth.
In conclusion, the Team West Africa design team has decided to use the ship shape FPSO, since it is the most cost effective, the environmental loads are not as harsh, and the shape is a tested platform for extracting oil from beneath the seafloor.
69
References American Bureau of Shipping. Rules and Guides. February 24 – 28, 2003.
http://www.eagle.org/rules/downloads.html Copyright 2003. American Bureau of Shipping (ABS) Guide for Building and Class Facilities of Offshore Installations.
June 2000. American Petroleum Institute (API). API RP-2SK Design and Analysis of Station keeping Systems for
Floating Structures, Second Edition. Washington, D.C., 1996 American Bureau of Shipping, Inc. Rules for Building and Classing, Mobile Offshore Drilling Units.
Houston, 1997. American Bureau of Shipping, Inc. Guide for Building and Classing Facilities on Offshore Installations.
Houston, 2000. Das, Samrat. Personal Communications, Halliburton, Houston 2003. Environmental Protection Agency (EPA). http://www.epa.gov/region09/waste/sfund/oilpp/opa.htm. Oil
Pollution Act of 1990. 2003. International Maritime Organization Homepage. February 27, 2003. http://www.imo.org/HOME.html
Copyright 2002. King, J. R. Personal Communication. ConocoPhillips: Houston, 2003. Noble, P. Personal Communication. MetOcean Data. ConocoPhillips: Houston, 2003. Tupper, Eric. Introduction to Naval Architecture. Butterworth Heinmann, Oxford, 1996.

70
Appendix A: StabCAD I/O
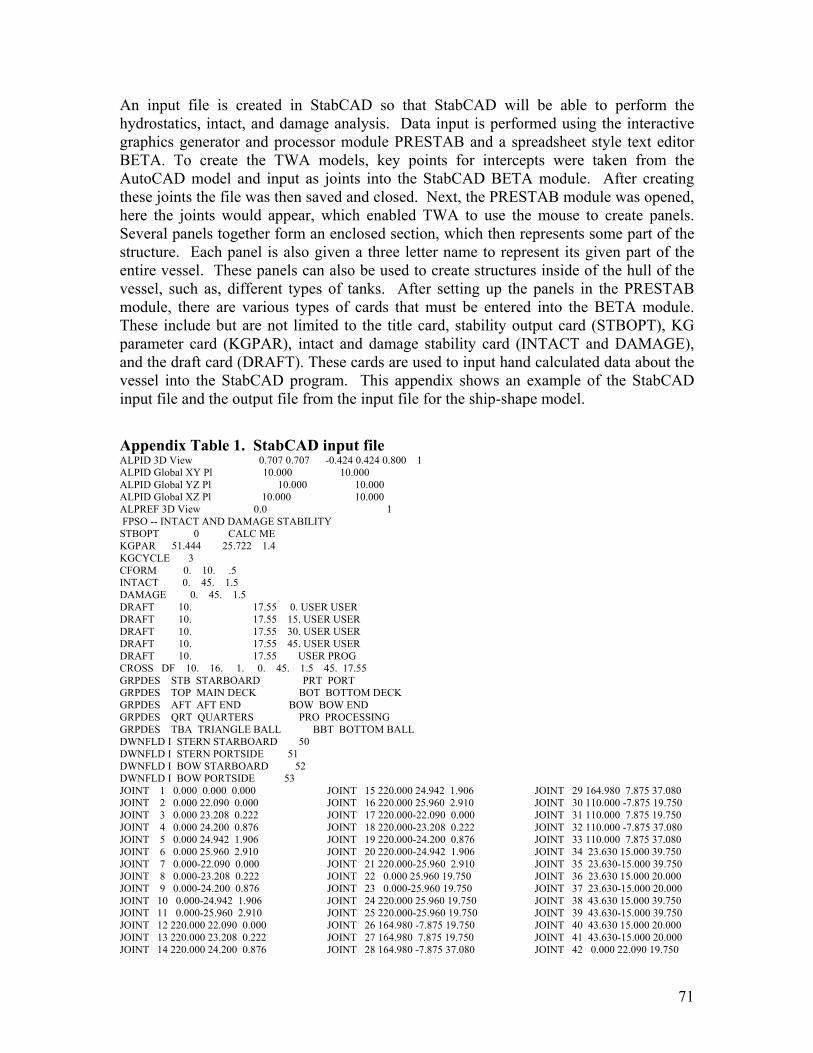
71
An input file is created in StabCAD so that StabCAD will be able to perform the hydrostatics, intact, and damage analysis. Data input is performed using the interactive graphics generator and processor module PRESTAB and a spreadsheet style text editor BETA. To create the TWA models, key points for intercepts were taken from the AutoCAD model and input as joints into the StabCAD BETA module. After creating these joints the file was then saved and closed. Next, the PRESTAB module was opened, here the joints would appear, which enabled TWA to use the mouse to create panels. Several panels together form an enclosed section, which then represents some part of the structure. Each panel is also given a three letter name to represent its given part of the entire vessel. These panels can also be used to create structures inside of the hull of the vessel, such as, different types of tanks. After setting up the panels in the PRESTAB module, there are various types of cards that must be entered into the BETA module. These include but are not limited to the title card, stability output card (STBOPT), KG parameter card (KGPAR), intact and damage stability card (INTACT and DAMAGE), and the draft card (DRAFT). These cards are used to input hand calculated data about the vessel into the StabCAD program. This appendix shows an example of the StabCAD input file and the output file from the input file for the ship-shape model.
Appendix Table 1. StabCAD input file ALPID 3D View 0.707 0.707 -0.424 0.424 0.800 1 ALPID Global XY Pl 10.000 10.000 ALPID Global YZ Pl 10.000 10.000 ALPID Global XZ Pl 10.000 10.000 ALPREF 3D View 0.0 1 FPSO -- INTACT AND DAMAGE STABILITY STBOPT 0 CALC ME KGPAR 51.444 25.722 1.4 KGCYCLE 3 CFORM 0. 10. .5 INTACT 0. 45. 1.5 DAMAGE 0. 45. 1.5 DRAFT 10. 17.55 0. USER USER DRAFT 10. 17.55 15. USER USER DRAFT 10. 17.55 30. USER USER DRAFT 10. 17.55 45. USER USER DRAFT 10. 17.55 USER PROG CROSS DF 10. 16. 1. 0. 45. 1.5 45. 17.55 GRPDES STB STARBOARD PRT PORT GRPDES TOP MAIN DECK BOT BOTTOM DECK GRPDES AFT AFT END BOW BOW END GRPDES QRT QUARTERS PRO PROCESSING GRPDES TBA TRIANGLE BALL BBT BOTTOM BALL DWNFLD I STERN STARBOARD 50 DWNFLD I STERN PORTSIDE 51 DWNFLD I BOW STARBOARD 52 DWNFLD I BOW PORTSIDE 53JOINT 1 0.000 0.000 0.000 JOINT 2 0.000 22.090 0.000 JOINT 3 0.000 23.208 0.222 JOINT 4 0.000 24.200 0.876 JOINT 5 0.000 24.942 1.906 JOINT 6 0.000 25.960 2.910 JOINT 7 0.000-22.090 0.000 JOINT 8 0.000-23.208 0.222 JOINT 9 0.000-24.200 0.876 JOINT 10 0.000-24.942 1.906 JOINT 11 0.000-25.960 2.910 JOINT 12 220.000 22.090 0.000 JOINT 13 220.000 23.208 0.222 JOINT 14 220.000 24.200 0.876
JOINT 15 220.000 24.942 1.906 JOINT 16 220.000 25.960 2.910 JOINT 17 220.000-22.090 0.000 JOINT 18 220.000-23.208 0.222 JOINT 19 220.000-24.200 0.876 JOINT 20 220.000-24.942 1.906 JOINT 21 220.000-25.960 2.910 JOINT 22 0.000 25.960 19.750 JOINT 23 0.000-25.960 19.750 JOINT 24 220.000 25.960 19.750 JOINT 25 220.000-25.960 19.750 JOINT 26 164.980 -7.875 19.750 JOINT 27 164.980 7.875 19.750 JOINT 28 164.980 -7.875 37.080
JOINT 29 164.980 7.875 37.080 JOINT 30 110.000 -7.875 19.750 JOINT 31 110.000 7.875 19.750 JOINT 32 110.000 -7.875 37.080 JOINT 33 110.000 7.875 37.080 JOINT 34 23.630 15.000 39.750 JOINT 35 23.630-15.000 39.750 JOINT 36 23.630 15.000 20.000 JOINT 37 23.630-15.000 20.000 JOINT 38 43.630 15.000 39.750 JOINT 39 43.630-15.000 39.750 JOINT 40 43.630 15.000 20.000 JOINT 41 43.630-15.000 20.000 JOINT 42 0.000 22.090 19.750
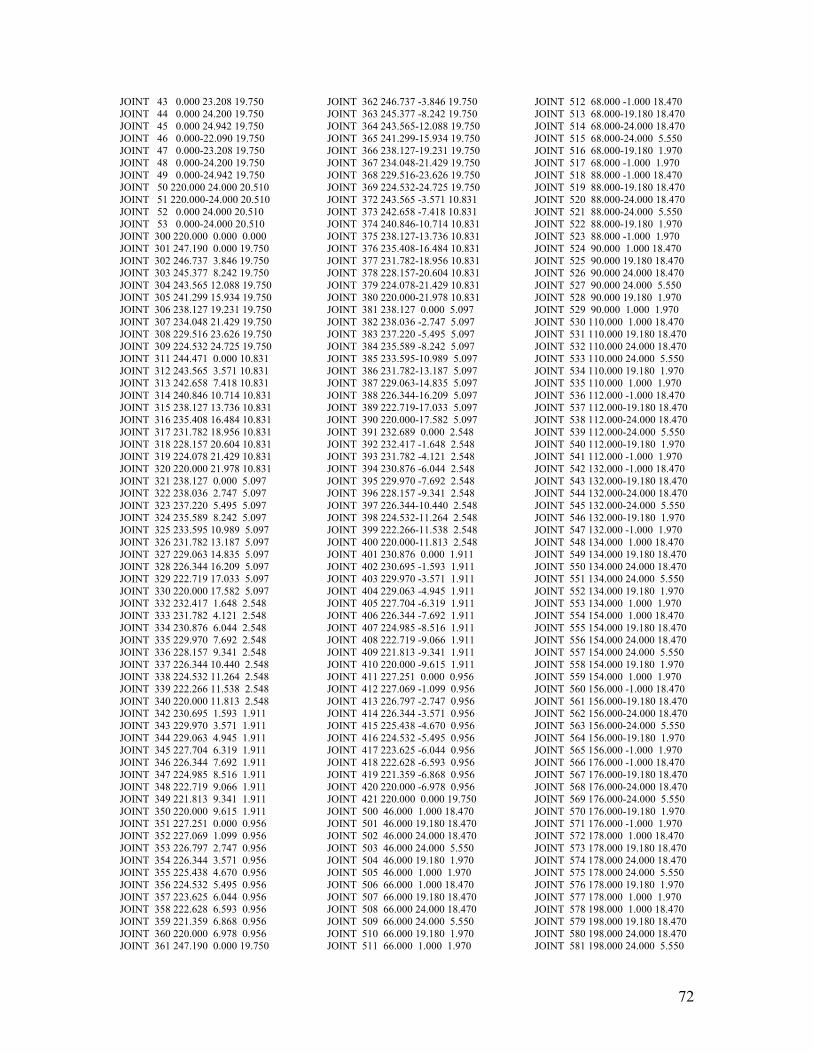
72
JOINT 43 0.000 23.208 19.750 JOINT 44 0.000 24.200 19.750 JOINT 45 0.000 24.942 19.750 JOINT 46 0.000-22.090 19.750 JOINT 47 0.000-23.208 19.750 JOINT 48 0.000-24.200 19.750 JOINT 49 0.000-24.942 19.750 JOINT 50 220.000 24.000 20.510 JOINT 51 220.000-24.000 20.510 JOINT 52 0.000 24.000 20.510 JOINT 53 0.000-24.000 20.510 JOINT 300 220.000 0.000 0.000 JOINT 301 247.190 0.000 19.750 JOINT 302 246.737 3.846 19.750 JOINT 303 245.377 8.242 19.750 JOINT 304 243.565 12.088 19.750 JOINT 305 241.299 15.934 19.750 JOINT 306 238.127 19.231 19.750 JOINT 307 234.048 21.429 19.750 JOINT 308 229.516 23.626 19.750 JOINT 309 224.532 24.725 19.750 JOINT 311 244.471 0.000 10.831 JOINT 312 243.565 3.571 10.831 JOINT 313 242.658 7.418 10.831 JOINT 314 240.846 10.714 10.831 JOINT 315 238.127 13.736 10.831 JOINT 316 235.408 16.484 10.831 JOINT 317 231.782 18.956 10.831 JOINT 318 228.157 20.604 10.831 JOINT 319 224.078 21.429 10.831 JOINT 320 220.000 21.978 10.831 JOINT 321 238.127 0.000 5.097 JOINT 322 238.036 2.747 5.097 JOINT 323 237.220 5.495 5.097 JOINT 324 235.589 8.242 5.097 JOINT 325 233.595 10.989 5.097 JOINT 326 231.782 13.187 5.097 JOINT 327 229.063 14.835 5.097 JOINT 328 226.344 16.209 5.097 JOINT 329 222.719 17.033 5.097 JOINT 330 220.000 17.582 5.097 JOINT 332 232.417 1.648 2.548 JOINT 333 231.782 4.121 2.548 JOINT 334 230.876 6.044 2.548 JOINT 335 229.970 7.692 2.548 JOINT 336 228.157 9.341 2.548 JOINT 337 226.344 10.440 2.548 JOINT 338 224.532 11.264 2.548 JOINT 339 222.266 11.538 2.548 JOINT 340 220.000 11.813 2.548 JOINT 342 230.695 1.593 1.911 JOINT 343 229.970 3.571 1.911 JOINT 344 229.063 4.945 1.911 JOINT 345 227.704 6.319 1.911 JOINT 346 226.344 7.692 1.911 JOINT 347 224.985 8.516 1.911 JOINT 348 222.719 9.066 1.911 JOINT 349 221.813 9.341 1.911 JOINT 350 220.000 9.615 1.911 JOINT 351 227.251 0.000 0.956 JOINT 352 227.069 1.099 0.956 JOINT 353 226.797 2.747 0.956 JOINT 354 226.344 3.571 0.956 JOINT 355 225.438 4.670 0.956 JOINT 356 224.532 5.495 0.956 JOINT 357 223.625 6.044 0.956 JOINT 358 222.628 6.593 0.956 JOINT 359 221.359 6.868 0.956 JOINT 360 220.000 6.978 0.956 JOINT 361 247.190 0.000 19.750
JOINT 362 246.737 -3.846 19.750 JOINT 363 245.377 -8.242 19.750 JOINT 364 243.565-12.088 19.750 JOINT 365 241.299-15.934 19.750 JOINT 366 238.127-19.231 19.750 JOINT 367 234.048-21.429 19.750 JOINT 368 229.516-23.626 19.750 JOINT 369 224.532-24.725 19.750 JOINT 372 243.565 -3.571 10.831 JOINT 373 242.658 -7.418 10.831 JOINT 374 240.846-10.714 10.831 JOINT 375 238.127-13.736 10.831 JOINT 376 235.408-16.484 10.831 JOINT 377 231.782-18.956 10.831 JOINT 378 228.157-20.604 10.831 JOINT 379 224.078-21.429 10.831 JOINT 380 220.000-21.978 10.831 JOINT 381 238.127 0.000 5.097 JOINT 382 238.036 -2.747 5.097 JOINT 383 237.220 -5.495 5.097 JOINT 384 235.589 -8.242 5.097 JOINT 385 233.595-10.989 5.097 JOINT 386 231.782-13.187 5.097 JOINT 387 229.063-14.835 5.097 JOINT 388 226.344-16.209 5.097 JOINT 389 222.719-17.033 5.097 JOINT 390 220.000-17.582 5.097 JOINT 391 232.689 0.000 2.548 JOINT 392 232.417 -1.648 2.548 JOINT 393 231.782 -4.121 2.548 JOINT 394 230.876 -6.044 2.548 JOINT 395 229.970 -7.692 2.548 JOINT 396 228.157 -9.341 2.548 JOINT 397 226.344-10.440 2.548 JOINT 398 224.532-11.264 2.548 JOINT 399 222.266-11.538 2.548 JOINT 400 220.000-11.813 2.548 JOINT 401 230.876 0.000 1.911 JOINT 402 230.695 -1.593 1.911 JOINT 403 229.970 -3.571 1.911 JOINT 404 229.063 -4.945 1.911 JOINT 405 227.704 -6.319 1.911 JOINT 406 226.344 -7.692 1.911 JOINT 407 224.985 -8.516 1.911 JOINT 408 222.719 -9.066 1.911 JOINT 409 221.813 -9.341 1.911 JOINT 410 220.000 -9.615 1.911 JOINT 411 227.251 0.000 0.956 JOINT 412 227.069 -1.099 0.956 JOINT 413 226.797 -2.747 0.956 JOINT 414 226.344 -3.571 0.956 JOINT 415 225.438 -4.670 0.956 JOINT 416 224.532 -5.495 0.956 JOINT 417 223.625 -6.044 0.956 JOINT 418 222.628 -6.593 0.956 JOINT 419 221.359 -6.868 0.956 JOINT 420 220.000 -6.978 0.956 JOINT 421 220.000 0.000 19.750 JOINT 500 46.000 1.000 18.470 JOINT 501 46.000 19.180 18.470 JOINT 502 46.000 24.000 18.470 JOINT 503 46.000 24.000 5.550 JOINT 504 46.000 19.180 1.970 JOINT 505 46.000 1.000 1.970 JOINT 506 66.000 1.000 18.470 JOINT 507 66.000 19.180 18.470 JOINT 508 66.000 24.000 18.470 JOINT 509 66.000 24.000 5.550 JOINT 510 66.000 19.180 1.970 JOINT 511 66.000 1.000 1.970
JOINT 512 68.000 -1.000 18.470 JOINT 513 68.000-19.180 18.470 JOINT 514 68.000-24.000 18.470 JOINT 515 68.000-24.000 5.550 JOINT 516 68.000-19.180 1.970 JOINT 517 68.000 -1.000 1.970 JOINT 518 88.000 -1.000 18.470 JOINT 519 88.000-19.180 18.470 JOINT 520 88.000-24.000 18.470 JOINT 521 88.000-24.000 5.550 JOINT 522 88.000-19.180 1.970 JOINT 523 88.000 -1.000 1.970 JOINT 524 90.000 1.000 18.470 JOINT 525 90.000 19.180 18.470 JOINT 526 90.000 24.000 18.470 JOINT 527 90.000 24.000 5.550 JOINT 528 90.000 19.180 1.970 JOINT 529 90.000 1.000 1.970 JOINT 530 110.000 1.000 18.470 JOINT 531 110.000 19.180 18.470 JOINT 532 110.000 24.000 18.470 JOINT 533 110.000 24.000 5.550 JOINT 534 110.000 19.180 1.970 JOINT 535 110.000 1.000 1.970 JOINT 536 112.000 -1.000 18.470 JOINT 537 112.000-19.180 18.470 JOINT 538 112.000-24.000 18.470 JOINT 539 112.000-24.000 5.550 JOINT 540 112.000-19.180 1.970 JOINT 541 112.000 -1.000 1.970 JOINT 542 132.000 -1.000 18.470 JOINT 543 132.000-19.180 18.470 JOINT 544 132.000-24.000 18.470 JOINT 545 132.000-24.000 5.550 JOINT 546 132.000-19.180 1.970 JOINT 547 132.000 -1.000 1.970 JOINT 548 134.000 1.000 18.470 JOINT 549 134.000 19.180 18.470 JOINT 550 134.000 24.000 18.470 JOINT 551 134.000 24.000 5.550 JOINT 552 134.000 19.180 1.970 JOINT 553 134.000 1.000 1.970 JOINT 554 154.000 1.000 18.470 JOINT 555 154.000 19.180 18.470 JOINT 556 154.000 24.000 18.470 JOINT 557 154.000 24.000 5.550 JOINT 558 154.000 19.180 1.970 JOINT 559 154.000 1.000 1.970 JOINT 560 156.000 -1.000 18.470 JOINT 561 156.000-19.180 18.470 JOINT 562 156.000-24.000 18.470 JOINT 563 156.000-24.000 5.550 JOINT 564 156.000-19.180 1.970 JOINT 565 156.000 -1.000 1.970 JOINT 566 176.000 -1.000 18.470 JOINT 567 176.000-19.180 18.470 JOINT 568 176.000-24.000 18.470 JOINT 569 176.000-24.000 5.550 JOINT 570 176.000-19.180 1.970 JOINT 571 176.000 -1.000 1.970 JOINT 572 178.000 1.000 18.470 JOINT 573 178.000 19.180 18.470 JOINT 574 178.000 24.000 18.470 JOINT 575 178.000 24.000 5.550 JOINT 576 178.000 19.180 1.970 JOINT 577 178.000 1.000 1.970 JOINT 578 198.000 1.000 18.470 JOINT 579 198.000 19.180 18.470 JOINT 580 198.000 24.000 18.470 JOINT 581 198.000 24.000 5.550
73
JOINT 582 198.000 19.180 1.970 JOINT 583 198.000 1.000 1.970 JOINT 584 200.000 -1.000 18.470 JOINT 585 200.000-19.180 18.470 JOINT 586 200.000-24.000 18.470 JOINT 587 200.000-24.000 5.550 JOINT 588 200.000-19.180 1.970 JOINT 589 200.000 -1.000 1.970 JOINT 590 220.000 -1.000 18.470 JOINT 591 220.000-19.180 18.470 JOINT 592 220.000-24.000 18.470 JOINT 593 220.000-24.000 5.550 JOINT 594 220.000-19.180 1.970 JOINT 595 220.000 -1.000 1.970 JOINT 600 46.000 -1.000 18.470 JOINT 601 46.000-19.180 18.470 JOINT 602 46.000-24.000 18.470 JOINT 603 46.000-24.000 5.550 JOINT 604 46.000-19.180 1.970 JOINT 605 46.000 -1.000 1.970 JOINT 606 66.000 -1.000 18.470 JOINT 607 66.000-19.180 18.470 JOINT 608 66.000-24.000 18.470 JOINT 609 66.000-24.000 5.550 JOINT 610 66.000-19.180 1.970 JOINT 611 66.000 -1.000 1.970 JOINT 612 68.000 1.000 18.470 JOINT 613 68.000 19.180 18.470 JOINT 614 68.000 24.000 18.470 JOINT 615 68.000 24.000 5.550 JOINT 616 68.000 19.180 1.970 JOINT 617 68.000 1.000 1.970 JOINT 618 88.000 1.000 18.470 JOINT 619 88.000 19.180 18.470 JOINT 620 88.000 24.000 18.470 JOINT 621 88.000 24.000 5.550 JOINT 622 88.000 19.180 1.970 JOINT 623 88.000 1.000 1.970 JOINT 624 90.000 -1.000 18.470 JOINT 625 90.000-19.180 18.470 JOINT 626 90.000-24.000 18.470 JOINT 627 90.000-24.000 5.550 JOINT 628 90.000-19.180 1.970 JOINT 629 90.000 -1.000 1.970 JOINT 630 110.000 -1.000 18.470 JOINT 631 110.000-19.180 18.470 JOINT 632 110.000-24.000 18.470 JOINT 633 110.000-24.000 5.550 JOINT 634 110.000-19.180 1.970 JOINT 635 110.000 -1.000 1.970 JOINT 636 112.000 1.000 18.470 JOINT 637 112.000 19.180 18.470 JOINT 638 112.000 24.000 18.470 JOINT 639 112.000 24.000 5.550 JOINT 640 112.000 19.180 1.970 JOINT 641 112.000 1.000 1.970 JOINT 642 132.000 1.000 18.470 JOINT 643 132.000 19.180 18.470 JOINT 644 132.000 24.000 18.470 JOINT 645 132.000 24.000 5.550 JOINT 646 132.000 19.180 1.970 JOINT 647 132.000 1.000 1.970 JOINT 648 134.000 -1.000 18.470 JOINT 649 134.000-19.180 18.470 JOINT 650 134.000-24.000 18.470 JOINT 651 134.000-24.000 5.550 JOINT 652 134.000-19.180 1.970 JOINT 653 134.000 -1.000 1.970 JOINT 654 154.000 -1.000 18.470 JOINT 655 154.000-19.180 18.470
JOINT 656 154.000-24.000 18.470 JOINT 657 154.000-24.000 5.550 JOINT 658 154.000-19.180 1.970 JOINT 659 154.000 -1.000 1.970 JOINT 660 156.000 1.000 18.470 JOINT 661 156.000 19.180 18.470 JOINT 662 156.000 24.000 18.470 JOINT 663 156.000 24.000 5.550 JOINT 664 156.000 19.180 1.970 JOINT 665 156.000 1.000 1.970 JOINT 666 176.000 1.000 18.470 JOINT 667 176.000 19.180 18.470 JOINT 668 176.000 24.000 18.470 JOINT 669 176.000 24.000 5.550 JOINT 670 176.000 19.180 1.970 JOINT 671 176.000 1.000 1.970 JOINT 672 178.000 -1.000 18.470 JOINT 673 178.000-19.180 18.470 JOINT 674 178.000-24.000 18.470 JOINT 675 178.000-24.000 5.550 JOINT 676 178.000-19.180 1.970 JOINT 677 178.000 -1.000 1.970 JOINT 678 198.000 -1.000 18.470 JOINT 679 198.000-19.180 18.470 JOINT 680 198.000-24.000 18.470 JOINT 681 198.000-24.000 5.550 JOINT 682 198.000-19.180 1.970 JOINT 683 198.000 -1.000 1.970 JOINT 684 200.000 1.000 18.470 JOINT 685 200.000 19.180 18.470 JOINT 686 200.000 24.000 18.470 JOINT 687 200.000 24.000 5.550 JOINT 688 200.000 19.180 1.970 JOINT 689 200.000 1.000 1.970 JOINT 690 220.000 1.000 18.470 JOINT 691 220.000 19.180 18.470 JOINT 692 220.000 24.000 18.470 JOINT 693 220.000 24.000 5.550 JOINT 694 220.000 19.180 1.970 JOINT 695 220.000 1.000 1.970 JOINT 800 46.000 25.960 5.550 JOINT 801 46.000 25.960 2.910 JOINT 802 46.000 24.942 1.906 JOINT 803 46.000 24.200 0.876 JOINT 804 46.000 23.208 0.222 JOINT 805 46.000 22.090 0.000 JOINT 806 46.000 19.180 0.000 JOINT 807 66.000 25.960 5.550 JOINT 808 66.000 25.960 2.910 JOINT 809 66.000 24.942 1.906 JOINT 810 66.000 24.200 0.876 JOINT 811 66.000 23.208 0.222 JOINT 812 66.000 22.090 0.000 JOINT 813 66.000 19.180 0.000 JOINT 814 68.000 25.960 5.550 JOINT 815 68.000 25.960 2.910 JOINT 816 68.000 24.942 1.906 JOINT 817 68.000 24.200 0.876 JOINT 818 68.000 23.208 0.222 JOINT 819 68.000 22.090 0.000 JOINT 820 68.000 19.180 0.000 JOINT 821 88.000 25.960 5.550 JOINT 822 88.000 25.960 2.910 JOINT 823 88.000 24.942 1.906 JOINT 824 88.000 24.200 0.876 JOINT 825 88.000 23.208 0.222 JOINT 826 88.000 22.090 0.000 JOINT 827 88.000 19.180 0.000 JOINT 828 90.000 25.960 5.550 JOINT 829 90.000 25.960 2.910
JOINT 830 90.000 24.942 1.906 JOINT 831 90.000 24.200 0.876 JOINT 832 90.000 23.208 0.222 JOINT 833 90.000 22.090 0.000 JOINT 834 90.000 19.180 0.000 JOINT 835 110.000 25.960 5.550 JOINT 836 110.000 25.960 2.910 JOINT 837 110.000 24.942 1.906 JOINT 838 110.000 24.200 0.876 JOINT 839 110.000 23.208 0.222 JOINT 840 110.000 22.090 0.000 JOINT 841 110.000 19.180 0.000 JOINT 842 112.000 25.960 5.550 JOINT 843 112.000 25.960 2.910 JOINT 844 112.000 24.942 1.906 JOINT 845 112.000 24.200 0.876 JOINT 846 112.000 23.208 0.222 JOINT 847 112.000 22.090 0.000 JOINT 848 112.000 19.180 0.000 JOINT 849 132.000 25.960 5.550 JOINT 850 132.000 25.960 2.910 JOINT 851 132.000 24.942 1.906 JOINT 852 132.000 24.200 0.876 JOINT 853 132.000 23.208 0.222 JOINT 854 132.000 22.090 0.000 JOINT 855 132.000 19.180 0.000 JOINT 856 134.000 25.960 5.550 JOINT 857 134.000 25.960 2.910 JOINT 858 134.000 24.942 1.906 JOINT 859 134.000 24.200 0.876 JOINT 860 134.000 23.208 0.222 JOINT 861 134.000 22.090 0.000 JOINT 862 134.000 19.180 0.000 JOINT 863 154.000 25.960 5.550 JOINT 864 154.000 25.960 2.910 JOINT 865 154.000 24.942 1.906 JOINT 866 154.000 24.200 0.876 JOINT 867 154.000 23.208 0.222 JOINT 868 154.000 22.090 0.000 JOINT 869 154.000 19.180 0.000 JOINT 870 156.000 25.960 5.550 JOINT 871 156.000 25.960 2.910 JOINT 872 156.000 24.942 1.906 JOINT 873 156.000 24.200 0.876 JOINT 874 156.000 23.208 0.222 JOINT 875 156.000 22.090 0.000 JOINT 876 156.000 19.180 0.000 JOINT 877 176.000 25.960 5.550 JOINT 878 176.000 25.960 2.910 JOINT 879 176.000 24.942 1.906 JOINT 880 176.000 24.200 0.876 JOINT 881 176.000 23.208 0.222 JOINT 882 176.000 22.090 0.000 JOINT 883 176.000 19.180 0.000 JOINT 884 178.000 25.960 5.550 JOINT 885 178.000 25.960 2.910 JOINT 886 178.000 24.942 1.906 JOINT 887 178.000 24.200 0.876 JOINT 888 178.000 23.208 0.222 JOINT 889 178.000 22.090 0.000 JOINT 890 178.000 19.180 0.000 JOINT 891 198.000 25.960 5.550 JOINT 892 198.000 25.960 2.910 JOINT 893 198.000 24.942 1.906 JOINT 894 198.000 24.200 0.876 JOINT 895 198.000 23.208 0.222 JOINT 896 198.000 22.090 0.000 JOINT 897 198.000 19.180 0.000 JOINT 898 200.000 25.960 5.550 JOINT 899 200.000 25.960 2.910
74
JOINT 900 200.000 24.942 1.906 JOINT 901 200.000 24.200 0.876 JOINT 902 200.000 23.208 0.222 JOINT 903 200.000 22.090 0.000 JOINT 904 200.000 19.180 0.000 JOINT 905 220.000 25.960 5.550 JOINT 906 220.000 19.180 0.000 JOINT 907 46.000-25.960 5.550 JOINT 908 46.000-25.960 2.910 JOINT 909 46.000-24.942 1.906 JOINT 910 46.000-24.200 0.876 JOINT 911 46.000-23.208 0.222 JOINT 912 46.000-22.090 0.000 JOINT 913 46.000-19.180 0.000 JOINT 914 66.000-25.960 5.550 JOINT 915 66.000-25.960 2.910 JOINT 916 66.000-24.942 1.906 JOINT 917 66.000-24.200 0.876 JOINT 918 66.000-23.208 0.222 JOINT 919 66.000-22.090 0.000 JOINT 920 66.000-19.180 0.000 JOINT 921 68.000-25.960 5.550 JOINT 922 68.000-25.960 2.910 JOINT 923 68.000-24.942 1.906 JOINT 924 68.000-24.200 0.876 JOINT 925 68.000-23.208 0.222 JOINT 926 68.000-22.090 0.000 JOINT 927 68.000-19.180 0.000 JOINT 928 88.000-25.960 5.550 JOINT 929 88.000-25.960 2.910 JOINT 930 88.000-24.942 1.906 JOINT 931 88.000-24.200 0.876 JOINT 932 88.000-23.208 0.222 JOINT 933 88.000-22.090 0.000 JOINT 934 88.000-19.180 0.000 JOINT 935 90.000-25.960 5.550 JOINT 936 90.000-25.960 2.910 JOINT 937 90.000-24.942 1.906 JOINT 938 90.000-24.200 0.876 JOINT 939 90.000-23.208 0.222 JOINT 940 90.000-22.090 0.000 JOINT 941 90.000-19.180 0.000 JOINT 942 110.000-25.960 5.550 JOINT 943 110.000-25.960 2.910 JOINT 944 110.000-24.942 1.906 JOINT 945 110.000-24.200 0.876 JOINT 946 110.000-23.208 0.222 JOINT 947 110.000-22.090 0.000 JOINT 948 110.000-19.180 0.000 JOINT 949 112.000-25.960 5.550 JOINT 950 112.000-25.960 2.910 JOINT 951 112.000-24.942 1.906 JOINT 952 112.000-24.200 0.876 JOINT 953 112.000-23.208 0.222 JOINT 954 112.000-22.090 0.000 JOINT 955 112.000-19.180 0.000 JOINT 956 132.000-25.960 5.550 JOINT 957 132.000-25.960 2.910 JOINT 958 132.000-24.942 1.906 JOINT 959 132.000-24.200 0.876 JOINT 960 132.000-23.208 0.222 JOINT 961 132.000-22.090 0.000 JOINT 962 132.000-19.180 0.000 JOINT 963 134.000-25.960 5.550 JOINT 964 134.000-25.960 2.910 JOINT 965 134.000-24.942 1.906 JOINT 966 134.000-24.200 0.876 JOINT 967 134.000-23.208 0.222 JOINT 968 134.000-22.090 0.000 JOINT 969 134.000-19.180 0.000
JOINT 970 154.000-25.960 5.550 JOINT 971 154.000-25.960 2.910 JOINT 972 154.000-24.942 1.906 JOINT 973 154.000-24.200 0.876 JOINT 974 154.000-23.208 0.222 JOINT 975 154.000-22.090 0.000 JOINT 976 154.000-19.180 0.000 JOINT 977 156.000-25.960 5.550 JOINT 978 156.000-25.960 2.910 JOINT 979 156.000-24.942 1.906 JOINT 980 156.000-24.200 0.876 JOINT 981 156.000-23.208 0.222 JOINT 982 156.000-22.090 0.000 JOINT 983 156.000-19.180 0.000 JOINT 984 176.000-25.960 5.550 JOINT 985 176.000-25.960 2.910 JOINT 986 176.000-24.942 1.906 JOINT 987 176.000-24.200 0.876 JOINT 988 176.000-23.208 0.222 JOINT 989 176.000-22.090 0.000 JOINT 990 176.000-19.180 0.000 JOINT 991 178.000-25.960 5.550 JOINT 992 178.000-25.960 2.910 JOINT 993 178.000-24.942 1.906 JOINT 994 178.000-24.200 0.876 JOINT 995 178.000-23.208 0.222 JOINT 996 178.000-22.090 0.000 JOINT 997 178.000-19.180 0.000 JOINT 998 198.000-25.960 5.550 JOINT 999 198.000-25.960 2.910 JOINT 1000 198.000-24.942 1.906 JOINT 1001 198.000-24.200 0.876 JOINT 1002 198.000-23.208 0.222 JOINT 1003 198.000-22.090 0.000 JOINT 1004 198.000-19.180 0.000 JOINT 1005 200.000-25.960 5.550 JOINT 1006 200.000-25.960 2.910 JOINT 1007 200.000-24.942 1.906 JOINT 1008 200.000-24.200 0.876 JOINT 1009 200.000-23.208 0.222 JOINT 1010 200.000-22.090 0.000 JOINT 1011 200.000-19.180 0.000 JOINT 1012 220.000-25.960 5.550 JOINT 1013 220.000-19.180 0.000 JOINT 1014 46.000 1.000 0.000 JOINT 1015 46.000 19.180 0.000 JOINT 1016 66.000 1.000 0.000 JOINT 1017 66.000 19.180 0.000 JOINT 1018 68.000 1.000 0.000 JOINT 1019 68.000 19.180 0.000 JOINT 1020 88.000 1.000 0.000 JOINT 1021 88.000 19.180 0.000 JOINT 1022 90.000 1.000 0.000 JOINT 1023 90.000 19.180 0.000 JOINT 1024 110.000 1.000 0.000 JOINT 1025 110.000 19.180 0.000 JOINT 1026 112.000 1.000 0.000 JOINT 1027 112.000 19.180 0.000 JOINT 1028 132.000 1.000 0.000 JOINT 1029 132.000 19.180 0.000 JOINT 1030 134.000 1.000 0.000 JOINT 1031 134.000 19.180 0.000 JOINT 1032 154.000 1.000 0.000 JOINT 1033 154.000 19.180 0.000 JOINT 1034 156.000 1.000 0.000 JOINT 1035 156.000 19.180 0.000 JOINT 1036 176.000 1.000 0.000 JOINT 1037 176.000 19.180 0.000 JOINT 1038 178.000 1.000 0.000 JOINT 1039 178.000 19.180 0.000
JOINT 1040 198.000 1.000 0.000 JOINT 1041 198.000 19.180 0.000 JOINT 1042 200.000 1.000 0.000 JOINT 1043 200.000 19.180 0.000 JOINT 1044 220.000 1.000 0.000 JOINT 1045 220.000 19.180 0.000 JOINT 1046 46.000 -1.000 0.000 JOINT 1047 46.000-19.180 0.000 JOINT 1048 66.000 -1.000 0.000 JOINT 1049 66.000-19.180 0.000 JOINT 1050 68.000 -1.000 0.000 JOINT 1051 68.000-19.180 0.000 JOINT 1052 88.000 -1.000 0.000 JOINT 1053 88.000-19.180 0.000 JOINT 1054 90.000 -1.000 0.000 JOINT 1055 90.000-19.180 0.000 JOINT 1056 110.000 -1.000 0.000 JOINT 1057 110.000-19.180 0.000 JOINT 1058 112.000 -1.000 0.000 JOINT 1059 112.000-19.180 0.000 JOINT 1060 132.000 -1.000 0.000 JOINT 1061 132.000-19.180 0.000 JOINT 1062 134.000 -1.000 0.000 JOINT 1063 134.000-19.180 0.000 JOINT 1064 154.000 -1.000 0.000 JOINT 1065 154.000-19.180 0.000 JOINT 1066 156.000 -1.000 0.000 JOINT 1067 156.000-19.180 0.000 JOINT 1068 176.000 -1.000 0.000 JOINT 1069 176.000-19.180 0.000 JOINT 1070 178.000 -1.000 0.000 JOINT 1071 178.000-19.180 0.000 JOINT 1072 198.000 -1.000 0.000 JOINT 1073 198.000-19.180 0.000 JOINT 1074 200.000 -1.000 0.000 JOINT 1075 200.000-19.180 0.000 JOINT 1076 220.000 -1.000 0.000 JOINT 1077 220.000-19.180 0.000 JOINT 1078 46.000 25.960 18.470 JOINT 1079 66.000 25.960 18.470 JOINT 1080 68.000 25.960 18.470 JOINT 1081 88.000 25.960 18.470 JOINT 1082 90.000 25.960 18.470 JOINT 1083 110.000 25.960 18.470 JOINT 1084 112.000 25.960 18.470 JOINT 1085 132.000 25.960 18.470 JOINT 1086 134.000 25.960 18.470 JOINT 1087 154.000 25.960 18.470 JOINT 1088 156.000 25.960 18.470 JOINT 1089 176.000 25.960 18.470 JOINT 1090 178.000 25.960 18.470 JOINT 1091 198.000 25.960 18.470 JOINT 1092 200.000 25.960 18.470 JOINT 1093 220.000 25.960 18.470 JOINT 1094 46.000-25.960 18.470 JOINT 1095 66.000-25.960 18.470 JOINT 1096 68.000-25.960 18.470 JOINT 1097 88.000-25.960 18.470 JOINT 1098 90.000-25.960 18.470 JOINT 1099 110.000-25.960 18.470 JOINT 1100 112.000-25.960 18.470 JOINT 1101 132.000-25.960 18.470 JOINT 1102 134.000-25.960 18.470 JOINT 1103 154.000-25.960 18.470 JOINT 1104 156.000-25.960 18.470 JOINT 1105 176.000-25.960 18.470 JOINT 1106 178.000-25.960 18.470 JOINT 1107 198.000-25.960 18.470 JOINT 1108 200.000-25.960 18.470 JOINT 1109 220.000-25.960 18.470

75
PANEL STA 11 23 25 21 PANEL PRT 22 6 16 24 PANEL W QRT 35 34 38 39 PANEL W QRT 37 35 39 41 PANEL W QRT 39 38 40 41 PANEL W QRT 38 34 36 40 PANEL W QRT 36 34 35 37 PANEL W QRT 41 40 36 37 PANEL W PRO 27 31 30 26 PANEL W PRO 32 28 26 30 PANEL W PRO 28 29 27 26 PANEL W PRO 29 33 31 27 PANEL W PRO 33 32 30 31 PANEL W PRO 32 33 29 28 PANEL TOP 25 23 22 24 PANEL BOT 3 2 12 13 PANEL BOT 4 3 13 14 PANEL BOT 5 4 14 15 PANEL BOT 6 5 15 16 PANEL BOT 7 8 18 17 PANEL BOT 8 9 19 18 PANEL BOT 9 10 20 19 PANEL BOT 10 11 21 20 PANEL BOT 12 2 7 17 PANEL AFT 6 22 45 5 PANEL AFT 45 44 4 5 PANEL AFT 44 43 3 4 PANEL AFT 43 42 2 3 PANEL AFT 42 46 7 2 PANEL AFT 46 47 8 7 PANEL AFT 47 48 9 8 PANEL AFT 48 49 10 9 PANEL AFT 49 23 11 10 PANEL BOW 319 309 320 PANEL BOW 308 309 319 PANEL BOW 303 304 314 PANEL BOW 313 303 314 PANEL BOW 302 303 313 PANEL BOW 302 313 312 PANEL BOW 301 302 312 PANEL BOW 311 301 312 PANEL BOW 362 361 311 PANEL BOW 372 362 311 PANEL BOW 363 362 372 PANEL BOW 373 363 372 PANEL BOW 364 363 373 PANEL BOW 366 365 375 PANEL BOW 375 365 374 PANEL BOW 367 376 377 PANEL BOW 366 375 376 PANEL BOW 367 366 376 PANEL BOW 368 367 377 PANEL BOW 377 369 368 PANEL BOW 377 378 369 PANEL BOW 374 364 373 PANEL BOW 365 364 374 PANEL BOW 390 389 400 PANEL BOW 400 389 399 PANEL BOW 389 388 399 PANEL BOW 398 399 388 PANEL BOW 388 387 398 PANEL BOW 387 397 398 PANEL BOW 387 386 397 PANEL BOW 386 396 397 PANEL BOW 386 385 396 PANEL BOW 385 395 396 PANEL BOW 385 384 395 PANEL BOW 384 394 395 PANEL BOW 384 383 394 PANEL BOW 383 393 394
PANEL BOW 383 382 393 PANEL BOW 382 392 393 PANEL BOW 382 381 392 PANEL BOW 381 391 392 PANEL BOW 321 322 391 PANEL BOW 391 322 332 PANEL BOW 322 323 332 PANEL BOW 323 333 332 PANEL BOW 323 324 333 PANEL BOW 324 334 333 PANEL BOW 324 325 334 PANEL BOW 325 335 334 PANEL BOW 325 326 335 PANEL BOW 326 327 335 PANEL BOW 335 327 336 PANEL BOW 327 328 336 PANEL BOW 336 328 337 PANEL BOW 328 338 337 PANEL BOW 328 329 338 PANEL BOW 329 330 338 PANEL BOW 338 330 339 PANEL BOW 339 330 340 PANEL BOW 420 410 409 PANEL BOW 409 419 420 PANEL BOW 409 408 419 PANEL BOW 408 407 418 PANEL BOW 418 419 408 PANEL BOW 407 417 418 PANEL BOW 407 406 417 PANEL BOW 406 416 417 PANEL BOW 406 405 416 PANEL BOW 405 415 416 PANEL BOW 405 404 415 PANEL BOW 404 414 415 PANEL BOW 404 403 414 PANEL BOW 403 413 414 PANEL BOW 403 402 413 PANEL BOW 402 412 413 PANEL BOW 402 401 412 PANEL BOW 412 401 411 PANEL BOW 401 342 411 PANEL BOW 342 352 351 PANEL BOW 342 343 352 PANEL BOW 352 343 353 PANEL BOW 343 344 353 PANEL BOW 344 354 353 PANEL BOW 344 345 354 PANEL BOW 345 355 354 PANEL BOW 345 346 355 PANEL BOW 346 356 355 PANEL BOW 346 347 356 PANEL BOW 356 347 357 PANEL BOW 347 348 357 PANEL BOW 357 348 358 PANEL BOW 358 348 349 PANEL BOW 349 350 358 PANEL BOW 358 350 359 PANEL BOW 359 350 360 PANEL BOW 360 300 359 PANEL BOW 300 358 359 PANEL BOW 300 357 358 PANEL BOW 356 357 300 PANEL BOW 355 356 300 PANEL BOW 354 355 300 PANEL BOW 353 354 300 PANEL BOW 352 353 300 PANEL BOW 300 411 352 PANEL BOW 412 351 300 PANEL BOW 413 412 300 PANEL BOW 414 413 300
76
PANEL BOW 415 414 300 PANEL BOW 416 415 300 PANEL BOW 417 416 300 PANEL BOW 418 417 300 PANEL BOW 419 418 300 PANEL BOW 420 419 300 PANEL BOW 410 400 399 PANEL BOW 399 409 410 PANEL BOW 399 398 409 PANEL BOW 398 397 409 PANEL BOW 397 408 409 PANEL BOW 397 396 407 PANEL BOW 397 407 408 PANEL BOW 396 406 407 PANEL BOW 396 395 406 PANEL BOW 395 405 406 PANEL BOW 395 394 405 PANEL BOW 394 404 405 PANEL BOW 394 393 404 PANEL BOW 393 403 404 PANEL BOW 393 392 403 PANEL BOW 392 402 403 PANEL BOW 392 391 402 PANEL BOW 391 401 402 PANEL BOW 391 332 401 PANEL BOW 332 342 401 PANEL BOW 332 333 342 PANEL BOW 333 343 342 PANEL BOW 333 334 343 PANEL BOW 334 344 343 PANEL BOW 334 335 344 PANEL BOW 335 345 344 PANEL BOW 335 336 345 PANEL BOW 336 346 345 PANEL BOW 336 337 346 PANEL BOW 337 347 346 PANEL BOW 337 338 347 PANEL BOW 338 348 347 PANEL BOW 338 339 348 PANEL BOW 339 349 348 PANEL BOW 339 340 349 PANEL BOW 349 340 350 PANEL BOW 329 320 330 PANEL BOW 328 320 329 PANEL BOW 319 320 328 PANEL BOW 318 319 327 PANEL BOW 327 319 328 PANEL BOW 326 318 327 PANEL BOW 317 318 326 PANEL BOW 325 317 326 PANEL BOW 316 317 325 PANEL BOW 315 316 325 PANEL BOW 324 315 325 PANEL BOW 314 315 324 PANEL BOW 323 314 324 PANEL BOW 313 314 323 PANEL BOW 312 313 323 PANEL BOW 322 312 323 PANEL BOW 311 312 322 PANEL BOW 321 311 322 PANEL BOW 372 311 381 PANEL BOW 372 381 382 PANEL BOW 373 372 382 PANEL BOW 373 382 383 PANEL BOW 374 373 383 PANEL BOW 374 383 384 PANEL BOW 375 374 384 PANEL BOW 375 384 385 PANEL BOW 376 375 385 PANEL BOW 376 385 386
PANEL BOW 377 376 386 PANEL BOW 386 387 377 PANEL BOW 378 377 387 PANEL BOW 378 387 388 PANEL BOW 379 378 388 PANEL BOW 379 388 389 PANEL BOW 380 379 389 PANEL BOW 380 389 390 PANEL BOW 308 319 318 PANEL BOW 307 308 318 PANEL BOW 307 318 317 PANEL BOW 306 307 317 PANEL BOW 306 317 316 PANEL BOW 305 306 316 PANEL BOW 305 316 315 PANEL BOW 304 305 315 PANEL BOW 304 315 314 PANEL BOW 379 369 378 PANEL BOW 380 369 379 PANEL BOW 25 369 380 PANEL BOW 25 380 21 PANEL BOW 21 380 390 PANEL BOW 21 390 20 PANEL BOW 20 390 400 PANEL BOW 320 24 16 PANEL BOW 320 16 330 PANEL BOW 15 330 16 PANEL BOW 300 360 12 PANEL BOW 17 420 300 PANEL BOW 360 350 12 PANEL BOW 350 340 12 PANEL BOW 17 410 420 PANEL BOW 15 340 330 PANEL BOW 17 400 410 PANEL BOW 18 400 17 PANEL BOW 18 19 400 PANEL BOW 20 400 19 PANEL BOW 12 340 13 PANEL BOW 13 340 14 PANEL BOW 340 15 14 PANEL BOW 309 24 320 PANEL BOW 421 24 309 PANEL BOW 421 309 308 PANEL BOW 421 308 307 PANEL BOW 421 307 306 PANEL BOW 421 306 305 PANEL BOW 421 305 304 PANEL BOW 421 304 303 PANEL BOW 421 303 302 PANEL BOW 421 302 361 PANEL BOW 421 361 362 PANEL BOW 421 362 363 PANEL BOW 421 363 364 PANEL BOW 364 365 421 PANEL BOW 421 365 366 PANEL BOW 421 366 367 PANEL BOW 367 368 421 PANEL BOW 368 369 421 PANEL BOW 369 25 421 BODY 1 0.815 .02 100. .98 OIL TANKS PANEL OIL 506 511 510 509 508 507 PANEL OIL 500 501 502 503 504 505 PANEL OIL 506 500 505 511 PANEL OIL 511 505 504 510 PANEL OIL 509 510 504 503 PANEL OIL 508 509 503 502 PANEL OIL 507 508 502 501 PANEL OIL 506 507 501 500 PANEL OIL 619 618 623 622 621 620 PANEL OIL 616 617 612 613 614 615
77
PANEL OIL 614 620 621 615 PANEL OIL 616 622 623 617 PANEL OIL 615 621 622 616 PANEL OIL 614 613 619 620 PANEL OIL 613 612 618 619 PANEL OIL 612 617 623 618 PANEL OIL 535 534 533 532 531 530 PANEL OIL 529 524 525 526 527 528 PANEL OIL 530 524 529 535 PANEL OIL 534 535 529 528 PANEL OIL 530 531 525 524 PANEL OIL 531 532 526 525 PANEL OIL 532 533 527 526 PANEL OIL 533 534 528 527 PANEL OIL 642 647 646 645 644 643 PANEL OIL 640 641 636 637 638 639 PANEL OIL 641 647 642 636 PANEL OIL 638 644 645 639 PANEL OIL 640 646 647 641 PANEL OIL 639 645 646 640 PANEL OIL 638 637 643 644 PANEL OIL 637 636 642 643 PANEL OIL 548 553 552 551 550 549 PANEL OIL 557 558 559 554 555 556 PANEL OIL 557 556 550 551 PANEL OIL 558 557 551 552 PANEL OIL 553 559 558 552 PANEL OIL 548 554 559 553 PANEL OIL 555 554 548 549 PANEL OIL 556 555 549 550 PANEL OIL 666 667 668 669 670 671 PANEL OIL 665 664 663 662 661 660 PANEL OIL 671 665 660 666 PANEL OIL 660 661 667 666 PANEL OIL 670 664 665 671 PANEL OIL 669 663 664 670 PANEL OIL 668 662 663 669 PANEL OIL 661 662 668 667 PANEL OIL 575 574 573 572 577 576 PANEL OIL 583 578 579 580 581 582 PANEL OIL 577 583 582 576 PANEL OIL 577 572 578 583 PANEL OIL 576 582 581 575 PANEL OIL 579 578 572 573 PANEL OIL 579 573 574 580 PANEL OIL 580 574 575 581 PANEL OIL 695 690 691 692 693 694 PANEL OIL 689 688 687 686 685 684 PANEL OIL 692 686 687 693 PANEL OIL 693 687 688 694 PANEL OIL 688 689 695 694 PANEL OIL 685 686 692 691 PANEL OIL 684 685 691 690 PANEL OIL 695 689 684 690 PANEL OIL 607 606 611 610 609 608 PANEL OIL 604 605 600 601 602 603 PANEL OIL 606 600 605 611 PANEL OIL 605 604 610 611 PANEL OIL 604 603 609 610 PANEL OIL 603 602 608 609 PANEL OIL 602 601 607 608 PANEL OIL 601 600 606 607 PANEL OIL 518 523 522 521 520 519 PANEL OIL 512 513 514 515 516 517 PANEL OIL 518 512 517 523 PANEL OIL 521 515 514 520 PANEL OIL 513 512 518 519 PANEL OIL 514 513 519 520 PANEL OIL 516 515 521 522 PANEL OIL 523 517 516 522
PANEL OIL 632 631 630 635 634 633 PANEL OIL 629 624 625 626 627 628 PANEL OIL 630 624 629 635 PANEL OIL 635 629 628 634 PANEL OIL 628 627 633 634 PANEL OIL 625 624 630 631 PANEL OIL 626 625 631 632 PANEL OIL 627 626 632 633 PANEL OIL 541 536 537 538 539 540 PANEL OIL 544 543 542 547 546 545 PANEL OIL 546 540 539 545 PANEL OIL 538 537 543 544 PANEL OIL 545 539 538 544 PANEL OIL 547 541 540 546 PANEL OIL 537 536 542 543 PANEL OIL 542 536 541 547 PANEL OIL 655 654 659 658 657 656 PANEL OIL 653 648 649 650 651 652 PANEL OIL 654 648 653 659 PANEL OIL 653 652 658 659 PANEL OIL 649 648 654 655 PANEL OIL 650 649 655 656 PANEL OIL 656 657 651 650 PANEL OIL 658 652 651 657 PANEL OIL 568 567 566 571 570 569 PANEL OIL 561 562 563 564 565 560 PANEL OIL 569 563 562 568 PANEL OIL 570 564 563 569 PANEL OIL 562 561 567 568 PANEL OIL 561 560 566 567 PANEL OIL 566 560 565 571 PANEL OIL 571 565 564 570 PANEL OIL 678 683 682 681 680 679 PANEL OIL 676 677 672 673 674 675 PANEL OIL 678 672 677 683 PANEL OIL 683 677 676 682 PANEL OIL 679 673 672 678 PANEL OIL 676 675 681 682 PANEL OIL 675 674 680 681 PANEL OIL 674 673 679 680 PANEL OIL 587 588 589 584 585 586 PANEL OIL 592 591 590 595 594 593 PANEL OIL 587 586 592 593 PANEL OIL 587 593 594 588 PANEL OIL 584 589 595 590 PANEL OIL 595 589 588 594 PANEL OIL 585 584 590 591 PANEL OIL 586 585 591 592 BODY 2 .02 100. .98 TBA 1 PANEL TBA 16 15 14 13 12 906 694 PANEL TBA 688 904 903 902 901 900 899 PANEL TBA 16 694 693 905 PANEL TBA 688 694 906 904 PANEL TBA 693 694 688 687 PANEL TBA 905 693 687 898 PANEL TBA 904 906 12 903 PANEL TBA 12 13 902 903 PANEL TBA 13 14 901 902 PANEL TBA 14 15 900 901 PANEL TBA 15 16 899 900 PANEL TBA 16 905 898 899 PANEL TBA 899 898 687 688 BODY 3 .02 100. .98 TBA 2 PANEL TBA 892 893 894 895 896 897 582 PANEL TBA 576 890 889 888 887 886 885 PANEL TBA 885 884 575 576 PANEL TBA 891 581 575 884 PANEL TBA 890 897 896 889 PANEL TBA 896 895 888 889 PANEL TBA 895 894 887 888

78
PANEL TBA 894 893 886 887 PANEL TBA 893 892 885 886 PANEL TBA 892 891 884 885 PANEL TBA 576 582 897 890 PANEL TBA 581 582 576 575 PANEL TBA 892 582 581 891 BODY 4 .02 100. .98 TBA 3 PANEL TBA 872 871 664 876 875 874 873 PANEL TBA 878 879 880 881 882 883 670 PANEL TBA 871 870 663 664 PANEL TBA 883 882 875 876 PANEL TBA 882 881 874 875 PANEL TBA 881 880 873 874 PANEL TBA 880 879 872 873 PANEL TBA 879 878 871 872 PANEL TBA 878 877 870 871 PANEL TBA 877 669 663 870 PANEL TBA 878 670 669 877 PANEL TBA 669 670 664 663 PANEL TBA 664 670 883 876 BODY 5 .02 100. .98 TBA 4 PANEL TBA 857 552 862 861 860 859 858 PANEL TBA 864 865 866 867 868 869 558 PANEL TBA 856 551 552 857 PANEL TBA 864 558 557 863 PANEL TBA 552 558 869 862 PANEL TBA 557 558 552 551 PANEL TBA 869 868 861 862 PANEL TBA 868 867 860 861 PANEL TBA 867 866 859 860 PANEL TBA 866 865 858 859 PANEL TBA 865 864 857 858 PANEL TBA 864 863 856 857 PANEL TBA 863 557 551 856 BODY 6 .02 100. .98 TBA 5 PANEL TBA 850 851 852 853 854 855 646 PANEL TBA 843 640 848 847 846 845 844 PANEL TBA 850 646 645 849 PANEL TBA 843 842 639 640 PANEL TBA 640 646 855 848 PANEL TBA 645 646 640 639 PANEL TBA 849 645 639 842 PANEL TBA 848 855 854 847 PANEL TBA 854 853 846 847 PANEL TBA 846 853 852 845 PANEL TBA 845 852 851 844 PANEL TBA 851 850 843 844 PANEL TBA 850 849 842 843 BODY 7 .02 100. .98 TBA 6 PANEL TBA 840 841 534 836 837 838 839 PANEL TBA 829 528 834 833 832 831 830 PANEL TBA 836 534 533 835 PANEL TBA 533 534 528 527 PANEL TBA 835 533 527 828 PANEL TBA 829 828 527 528 PANEL TBA 528 534 841 834 PANEL TBA 834 841 840 833 PANEL TBA 840 839 832 833 PANEL TBA 839 838 831 832 PANEL TBA 831 838 837 830 PANEL TBA 837 836 829 830 PANEL TBA 836 835 828 829 BODY 8 .02 100. .98 TBA 7 PANEL TBA 827 622 822 823 824 825 826 PANEL TBA 815 616 820 819 818 817 816 PANEL TBA 815 814 615 616 PANEL TBA 821 822 622 621 PANEL TBA 821 621 615 814 PANEL TBA 822 821 814 815 PANEL TBA 827 826 819 820
PANEL TBA 819 826 825 818 PANEL TBA 825 824 817 818 PANEL TBA 824 823 816 817 PANEL TBA 815 816 823 822 PANEL TBA 621 622 616 615 PANEL TBA 616 622 827 820 BODY 9 .02 100. .98 TBA 8 PANEL TBA 504 806 805 804 803 802 801 PANEL TBA 813 510 808 809 810 811 812 PANEL TBA 801 800 503 504 PANEL TBA 509 807 808 510 PANEL TBA 504 510 813 806 PANEL TBA 807 509 503 800 PANEL TBA 800 801 808 807 PANEL TBA 806 813 812 805 PANEL TBA 805 812 811 804 PANEL TBA 811 810 803 804 PANEL TBA 810 809 802 803 PANEL TBA 809 808 801 802 PANEL TBA 503 509 510 504 BODY 10 .02 100. .98 TBA PANEL TBA 604 908 909 910 911 912 913 PANEL TBA 916 915 610 920 919 918 917 PANEL TBA 908 604 603 907 PANEL TBA 915 914 609 610 PANEL TBA 909 908 915 916 PANEL TBA 910 909 916 917 PANEL TBA 911 910 917 918 PANEL TBA 911 918 919 912 PANEL TBA 907 914 915 908 PANEL TBA 912 919 920 913 PANEL TBA 610 604 913 920 PANEL TBA 609 603 604 610 PANEL TBA 914 907 603 609 BODY 11 .02 100. .98 TBA PANEL TBA 922 923 924 925 926 927 516 PANEL TBA 930 929 522 934 933 932 931 PANEL TBA 923 922 929 930 PANEL TBA 924 923 930 931 PANEL TBA 925 924 931 932 PANEL TBA 926 925 932 933 PANEL TBA 927 926 933 934 PANEL TBA 922 921 928 929 PANEL TBA 928 921 515 521 PANEL TBA 521 515 516 522 PANEL TBA 522 516 927 934 PANEL TBA 922 516 515 921 PANEL TBA 929 928 521 522 BODY 12 .02 100. .98 TBA PANEL TBA 944 943 634 948 947 946 945 PANEL TBA 936 937 938 939 940 941 628 PANEL TBA 943 942 633 634 PANEL TBA 936 628 627 935 PANEL TBA 937 936 943 944 PANEL TBA 938 937 944 945 PANEL TBA 939 938 945 946 PANEL TBA 940 939 946 947 PANEL TBA 941 940 947 948 PANEL TBA 936 935 942 943 PANEL TBA 942 935 627 633 PANEL TBA 633 627 628 634 PANEL TBA 634 628 941 948 BODY 13 .02 100. .98 TBA PANEL TBA 950 951 952 953 954 955 540 PANEL TBA 958 957 546 962 961 960 959 PANEL TBA 950 540 539 949 PANEL TBA 957 956 545 546 PANEL TBA 951 950 957 958 PANEL TBA 952 951 958 959 PANEL TBA 953 952 959 960

79
PANEL TBA 954 953 960 961 PANEL TBA 955 954 961 962 PANEL TBA 539 540 546 545 PANEL TBA 540 955 962 546 PANEL TBA 950 949 956 957 PANEL TBA 956 949 539 545 BODY 14 .02 100. .98 TBA PANEL TBA 964 965 966 967 968 969 652 PANEL TBA 972 971 658 976 975 974 973 PANEL TBA 964 652 651 963 PANEL TBA 971 970 657 658 PANEL TBA 965 964 971 972 PANEL TBA 966 965 972 973 PANEL TBA 967 966 973 974 PANEL TBA 968 967 974 975 PANEL TBA 969 968 975 976 PANEL TBA 964 963 970 971 PANEL TBA 970 963 651 657 PANEL TBA 657 651 652 658 PANEL TBA 658 652 969 976 BODY 15 .02 100. .98 TBA PANEL TBA 978 979 980 981 982 983 564 PANEL TBA 986 985 570 990 989 988 987 PANEL TBA 978 564 563 977 PANEL TBA 985 984 569 570 PANEL TBA 979 978 985 986 PANEL TBA 978 977 984 985 PANEL TBA 980 979 986 987 PANEL TBA 981 980 987 988 PANEL TBA 982 981 988 989 PANEL TBA 983 982 989 990 PANEL TBA 570 564 983 990 PANEL TBA 569 563 564 570 PANEL TBA 984 977 563 569 BODY 16 .02 100. .98 TBA PANEL TBA 996 997 676 992 993 994 995 PANEL TBA 999 682 1004 1003 1002 1001 1000 PANEL TBA 992 676 675 991 PANEL TBA 999 998 681 682 PANEL TBA 993 992 999 1000 PANEL TBA 994 993 1000 1001 PANEL TBA 995 994 1001 1002 PANEL TBA 996 995 1002 1003 PANEL TBA 997 996 1003 1004 PANEL TBA 992 991 998 999 PANEL TBA 998 991 675 681 PANEL TBA 681 675 676 682 PANEL TBA 682 676 997 1004 BODY 17 .02 100. .98 TBA PANEL TBA 1006 1007 1008 1009 1010 1011 588 PANEL TBA 20 21 594 1013 17 18 19 PANEL TBA 1006 588 587 1005 PANEL TBA 21 1012 593 594 PANEL TBA 1006 1005 1012 21 PANEL TBA 1006 21 20 1007 PANEL TBA 1008 1007 20 19 PANEL TBA 1009 1008 19 18 PANEL TBA 1010 1009 18 17 PANEL TBA 1011 1010 17 1013 PANEL TBA 594 588 1011 1013 PANEL TBA 593 587 588 594 PANEL TBA 1012 1005 587 593 BODY 18 .02 100. .98 BOTTOM BALLASTS PANEL BBT 1044 1045 1043 1042 PANEL BBT 1013 1076 1074 1011 PANEL BBT 1040 1041 1039 1038 PANEL BBT 1072 1070 1071 1073 PANEL BBT 1068 1066 1067 1069 PANEL BBT 1036 883 876 1034 PANEL BBT 1032 1033 1031 1030
PANEL BBT 976 1064 1062 1063 PANEL BBT 1028 855 1027 1026 PANEL BBT 962 1060 1058 1059 PANEL BBT 1024 1025 834 1022 PANEL BBT 948 1056 1054 941 PANEL BBT 1020 827 1019 1018 PANEL BBT 934 1052 1050 1051 PANEL BBT 1016 1017 1015 1014 PANEL BBT 1049 1048 1046 1047 PANEL BBT 611 605 1046 1048 PANEL BBT 505 511 1016 1014 PANEL BBT 604 1047 1046 605 PANEL BBT 610 611 1048 920 PANEL BBT 1052 523 517 1050 PANEL BBT 1056 635 629 1054 PANEL BBT 1060 547 541 1058 PANEL BBT 1064 659 653 1062 PANEL BBT 1068 571 565 1066 PANEL BBT 1072 683 677 1070 PANEL BBT 1076 595 589 1074 PANEL BBT 623 1020 1018 617 PANEL BBT 535 1024 1022 529 PANEL BBT 647 1028 1026 641 PANEL BBT 559 1032 1030 553 PANEL BBT 671 1036 1034 665 PANEL BBT 583 1040 1038 577 PANEL BBT 695 1044 1042 689 PANEL BBT 1050 517 516 1051 PANEL BBT 522 523 1052 1053 PANEL BBT 522 1053 1051 516 PANEL BBT 634 1057 941 628 PANEL BBT 546 962 1059 540 PANEL BBT 941 1054 629 628 PANEL BBT 634 635 1056 1057 PANEL BBT 546 547 1060 1061 PANEL BBT 604 610 1049 913 PANEL BBT 604 605 611 610 PANEL BBT 652 658 1065 1063 PANEL BBT 564 570 1069 1067 PANEL BBT 676 682 1073 997 PANEL BBT 594 1013 1075 588 PANEL BBT 1015 813 510 504 PANEL BBT 616 1019 827 622 PANEL BBT 534 528 1023 841 PANEL BBT 646 640 848 1029 PANEL BBT 1031 1033 558 552 PANEL BBT 664 1035 883 670 PANEL BBT 576 890 897 582 PANEL BBT 688 1043 906 694 PANEL BBT 1014 1015 504 505 PANEL BBT 511 510 1017 1016 PANEL BBT 1019 616 617 1018 PANEL BBT 623 622 827 1020 PANEL BBT 1022 1023 528 529 PANEL BBT 535 534 841 1024 PANEL BBT 1026 848 640 641 PANEL BBT 1059 1058 541 540 PANEL BBT 647 646 855 1028 PANEL BBT 1030 1031 552 553 PANEL BBT 1063 1062 653 652 PANEL BBT 658 659 1064 1065 PANEL BBT 559 558 1033 1032 PANEL BBT 1067 1066 565 564 PANEL BBT 1034 1035 664 665 PANEL BBT 671 670 883 1036 PANEL BBT 570 571 1068 1069 PANEL BBT 997 1070 677 676 PANEL BBT 1038 1039 576 577 PANEL BBT 682 683 1072 1073 PANEL BBT 583 582 1041 1040
80
PANEL BBT 689 1042 1043 688 PANEL BBT 588 1011 1074 589 PANEL BBT 594 595 1076 1013 PANEL BBT 695 694 1045 1044 PANEL BBT 510 511 505 504 PANEL BBT 622 623 617 616 PANEL BBT 523 522 516 517 PANEL BBT 534 535 529 528 PANEL BBT 635 634 628 629 PANEL BBT 547 546 540 541 PANEL BBT 646 647 641 640 PANEL BBT 558 559 553 552 PANEL BBT 659 658 652 653 PANEL BBT 670 671 665 664 PANEL BBT 571 570 564 565 PANEL BBT 683 682 676 677 PANEL BBT 582 583 577 576 PANEL BBT 694 695 689 688 PANEL BBT 595 594 588 589 BODY 19 D .02 100. .98 SIDE BALLAST PANEL SDB 1094 1095 914 907 PANEL SDB 1095 608 609 914 PANEL SDB 1094 602 608 1095 PANEL SDB 608 602 603 609 PANEL SDB 602 1094 907 603 PANEL SDB 609 603 907 914 BODY 20 .02 100. .98 SIDE BALLAST PANEL SDB 1096 1097 928 921 PANEL SDB 1096 514 520 1097 PANEL SDB 520 514 515 521 PANEL SDB 1097 520 521 928 PANEL SDB 521 515 921 928 PANEL SDB 515 514 1096 921 BODY 21 .02 100. .98 SIDE BALLAST PANEL SDB 1099 942 935 1098 PANEL SDB 1098 626 632 1099 PANEL SDB 1099 632 633 942 PANEL SDB 632 626 627 633 PANEL SDB 935 627 626 1098 PANEL SDB 633 627 935 942 BODY 22 .02 100. .98 SIDE BALLAST PANEL SDB 1100 1101 956 949 PANEL SDB 1100 538 544 1101 PANEL SDB 1101 544 545 956 PANEL SDB 544 538 539 545 PANEL SDB 545 539 949 956 PANEL SDB 949 539 538 1100 BODY 23 .02 100. .98 SIDE BALLAST PANEL SDB 1102 1103 970 963 PANEL SDB 1102 650 656 1103 PANEL SDB 1103 656 657 970 PANEL SDB 657 651 963 970 PANEL SDB 656 650 651 657 PANEL SDB 650 1102 963 651 BODY 24 .02 100. .98 SIDE BALLAST PANEL SDB 1104 1105 984 977 PANEL SDB 1104 562 568 1105 PANEL SDB 1105 568 569 984 PANEL SDB 569 563 977 984 PANEL SDB 568 562 563 569 PANEL SDB 977 563 562 1104 BODY 25 .02 100. .98 SIDE BALLAST PANEL SDB 1106 1107 998 991 PANEL SDB 681 675 991 998 PANEL SDB 1107 680 681 998 PANEL SDB 680 674 675 681
PANEL SDB 1106 674 680 1107 PANEL SDB 991 675 674 1106 BODY 26 .02 100. .98 SIDE BALLAST PANEL SDB 1108 1109 1012 1005 PANEL SDB 1108 586 592 1109 PANEL SDB 1109 592 593 1012 PANEL SDB 593 587 1005 1012 PANEL SDB 592 586 587 593 PANEL SDB 1005 587 586 1108 BODY 27 .02 100. .98 SIDE BALLAST PANEL SDT 1093 1092 898 905 PANEL SDT 1092 686 687 898 PANEL SDT 1092 1093 692 686 PANEL SDT 692 1093 905 693 PANEL SDT 905 898 687 693 PANEL SDT 686 692 693 687 BODY 28 .02 100. .98 SIDE BALLAST PANEL SDT 1091 1090 884 891 PANEL SDT 574 1090 1091 580 PANEL SDT 580 1091 891 581 PANEL SDT 1090 574 575 884 PANEL SDT 891 884 575 581 PANEL SDT 574 580 581 575 BODY 29 .02 100. .98 SIDE BALLAST PANEL SDT 1089 1088 870 877 PANEL SDT 662 1088 1089 668 PANEL SDT 668 1089 877 669 PANEL SDT 1088 662 663 870 PANEL SDT 662 668 669 663 PANEL SDT 877 870 663 669 BODY 30 .02 100. .98 SIDE BALLAST PANEL SDT 1087 1086 856 863 PANEL SDT 556 1087 863 557 PANEL SDT 863 856 551 557 PANEL SDT 550 556 557 551 PANEL SDT 856 1086 550 551 PANEL SDT 1086 1087 556 550 BODY 31 .02 100. .98 SIDE BALLAST PANEL SDT 1085 1084 842 849 PANEL SDT 1084 638 639 842 PANEL SDT 1084 1085 644 638 PANEL SDT 644 1085 849 645 PANEL SDT 638 644 645 639 PANEL SDT 645 849 842 639 BODY 32 .02 100. .98 SIDE BALLAST PANEL SDT 1083 1082 828 835 PANEL SDT 532 526 1082 1083 PANEL SDT 532 1083 835 533 PANEL SDT 1082 526 527 828 PANEL SDT 828 527 533 835 PANEL SDT 526 532 533 527 BODY 33 .02 100. .98 SIDE BALLAST PANEL SDT 1081 1080 814 821 PANEL SDT 614 1080 1081 620 PANEL SDT 620 1081 821 621 PANEL SDT 621 821 814 615 PANEL SDT 615 814 1080 614 PANEL SDT 614 620 621 615 BODY 34 .02 100. .98 SIDE BALLAST PANEL SDT 1079 1078 800 807 PANEL SDT 1079 508 502 1078 PANEL SDT 1078 502 503 800 PANEL SDT 800 503 509 807 PANEL SDT 807 509 508 1079 PANEL SDT 502 508 509 503 END
81
StabCAD Output file for Ship-Shape FPSO StabCAD Ver. 4.20 FPSO -- INTACT AND DAMAGE STABILITY Page 1 The following Nomenclature is used in the computer output: Draft ... Measured from the base line (z=0, or x-y plane) Disp .... Displacemet of the vessel TPI ..... Tons/inch displacement KPI ..... Kips/inch displacement MT/Cm ... Metric Ton/ cm displacement KMT ..... Transverse metacentric height (measured from base line) KML ..... Longitudinal metacentric height (measured from base line) LCB ..... Center of Buoyancy position (Longitudinal) (measured from reference point for LCB & LCF) TCB ..... Center of Buoyancy position (Transverse) (measured from coordinate system origin) VCB ..... Center of Buoyancy position (Vertical) (measured from base line) WPA ..... Water plane Area BMT ..... Transv metacentric ht (from ctr of buoyancy) BML ..... Longit metacentric ht (from ctr of buoyancy) LCF ..... Center of Floatation position (Longitudinal) (measured from reference point for LCB & LCF) TCF ..... Center of Floatation position (Transverse) (measured from coordinate system origin) W.P.Moment of Inertia: Longitudinal About neutral axis of water plane area Transverse About neutral axis of water plane area Volume .. of submerged body Tilt Axis The angle of the tilt axis is measured from the posive x-axis Optimum tilt angle The minimum tilt angle at which the area ratio requirement is satisfied KG that satisfies : Heeling arm = Righting arm at or before the downflooding angle Static angle At which the righting moment is zero Area ratio = 1.0 For damage stability - starting at the static angle RM/HM Ratio KG that satisfies the requirement : Righting Moment/Heeling Moment >or= 2 within 7 deg past static angle
Equilibrium position tilt angle When vessel is in equilibrium and not at the upright position, the positive angle indicate that the part of the vessel to the right of the tilt axis is immersed in water

82
StabCAD Ver. 4.20 FPSO -- INTACT AND DAMAGE STABILITY Page 2 * * * Hydrostatic Table * * * Draft AFT (X-Coordinate) ....... 0.00 Initial Heel Angle ......... 0.000 Deg Draft FWD (X-Coordinate) ....... 0.00 Initial Trim Angle ......... 0.000 Deg Reference Point for LCB & LCF Density of Water ........... 63.960 Lbs/Cu.ft (X-Coordinate) ....... 0.00 /--- Draft ---/ /-- Center of Buoyancy--/ /-Center of Floatation-/ Water plane Submerged AFT FWD Disp TPI LCB TCB VCB LCF TCF Area Volume (Ft.) (Ft.) (S.Tons) (ST/In) (Ft.) (Ft.) (Ft.) (Ft.) (Ft.) (S.Ft) (Ft^3) ------- ------- -------- ------- ------- ------- ------- ------- ------- ----------- --------- 0.00 0.00 0.0 279.62 374.81 0.00 0.00 360.89 0.00 104923.6 0.0 1.64 1.64 5737.8 299.15 361.15 0.00 0.83 361.70 0.00 112251.2 179419.1 3.28 3.28 11728.7 309.09 361.92 0.00 1.67 363.78 0.00 115981.2 366749.7 4.92 4.92 17865.7 314.75 362.76 0.00 2.50 365.07 0.00 118106.5 558651.1 6.56 6.56 24116.9 321.06 363.54 0.00 3.34 366.61 0.00 120474.5 754123.3 8.20 8.20 30512.8 329.22 364.38 0.00 4.19 368.53 0.00 123535.7 954120.0 9.84 9.84 37063.3 335.56 365.22 0.00 5.04 369.83 0.00 125913.2 1158951.5 11.48 11.48 43680.7 336.85 366.02 0.00 5.90 371.30 0.00 126398.3 1365874.8 13.12 13.12 50324.5 338.25 366.82 0.00 6.74 372.87 0.00 126923.1 1573625.2 14.76 14.76 56996.8 339.74 367.62 0.00 7.59 374.57 0.00 127483.0 1782264.9 16.40 16.40 63699.5 341.35 368.44 0.00 8.43 376.35 0.00 128085.4 1991855.4 18.04 18.04 70428.2 342.21 369.25 0.00 9.27 377.32 0.00 128409.4 2202259.0 19.69 19.69 77171.2 342.92 369.98 0.00 10.11 378.12 -0.01 128676.1 2413108.0 21.33 21.33 83928.5 343.66 370.67 0.00 10.94 378.96 -0.01 128954.6 2624405.2 22.97 22.97 90700.6 344.42 371.32 0.00 11.78 379.81 -0.01 129239.0 2836166.0 24.61 24.61 97488.0 345.23 371.94 0.00 12.62 380.68 -0.01 129540.9 3048404.0 26.25 26.25 104291.1 346.03 372.54 0.00 13.45 381.60 -0.01 129842.9 3261134.0 27.89 27.89 111110.4 346.88 373.12 0.00 14.29 382.51 -0.01 130159.5 3474370.5 29.53 29.53 117946.4 347.72 373.69 0.00 15.12 383.48 -0.01 130476.1 3688128.5 31.17 31.17 124799.5 348.60 374.26 0.00 15.96 384.46 -0.01 130807.3 3902421.8 32.81 32.81 131670.1 349.45 374.81 0.00 16.80 385.42 -0.01 131126.9 4117264.8
83
StabCAD Ver. 4.20 FPSO -- INTACT AND DAMAGE STABILITY Page 3 * * * Hydrostatic Table * * * Draft AFT (X-Coordinate) ....... 0.00 Initial Heel Angle ......... 0.000 Deg Draft FWD (X-Coordinate) ....... 0.00 Initial Trim Angle ......... 0.000 Deg Reference Point for LCB & LCF Density of Water ........... 63.960 Lbs/Cu.ft (X-Coordinate) ....... 0.00 /----- Water Plane -----/ With KG=0 With KG=0 /--- Draft ---/ /---------- Metacenter ---------/ /-- Moment Of Inertia --/ Moment to Heel Moment to Trim AFT FWD Disp KMT KML BMT BML Transverse Longitudinal 0.01 Deg. 0.01 Deg. (Ft.) (Ft.) (S.Tons) (Ft.) (Ft.) (Ft.) (Ft.) (Ft^4) (Ft^4) (S.Ton-Ft) (S.Ton-Ft) ------- ------- -------- ------- ------- ------- ------- ------------ ----------- -------------- -------------- 0.00 0.00 0.0 27802.98138087.66 27802.98138087.66 966. 4799. 0.0 0.0 1.64 1.64 5737.8 1250.37 27230.31 1249.54 27229.48 224191568. 4885487616. 1252.2 27269.5 3.28 3.28 11728.7 665.94 13933.27 664.28 13931.61 243624016. 5109413376. 1363.2 28521.9 4.92 4.92 17865.7 458.51 9395.50 456.00 9393.00 254747520. 5247408640. 1429.7 29296.5 6.56 6.56 24116.9 357.62 7164.63 354.28 7161.28 267171696. 5400491008. 1505.3 30157.2 8.20 8.20 30512.8 302.01 5869.15 297.82 5864.96 284153632. 5595870720. 1608.3 31256.0 9.84 9.84 37063.3 262.70 4967.76 257.65 4962.72 298605376. 5751547904. 1699.3 32135.3 11.48 11.48 43680.7 224.86 4269.27 218.96 4263.38 299076192. 5823236608. 1714.3 32547.7 13.12 13.12 50324.5 197.18 3755.68 190.43 3748.93 299671008. 5899416064. 1731.8 32987.2 14.76 14.76 56996.8 176.13 3363.56 168.55 3355.98 300392992. 5981241344. 1752.1 33460.1 16.40 16.40 63699.5 159.69 3054.68 151.26 3046.25 301297824. 6067686400. 1775.4 33960.9 18.04 18.04 70428.2 146.31 2787.36 137.04 2778.09 301806240. 6118079488. 1798.5 34262.4 19.69 19.69 77171.2 135.35 2561.98 125.24 2551.88 302223648. 6157952000. 1823.0 34507.1 21.33 21.33 83928.5 126.28 2373.08 115.33 2362.14 302680256. 6199202304. 1849.7 34761.5 22.97 22.97 90700.6 118.67 2212.59 106.89 2200.81 303171424. 6241867264. 1878.6 35025.9 24.61 24.61 97488.0 112.24 2074.66 99.63 2062.04 303708608. 6285945856. 1909.8 35300.1 26.25 26.25 104291.1 106.75 1954.84 93.30 1941.39 304275456. 6331129856. 1943.2 35582.4 27.89 27.89 111110.4 102.04 1850.00 87.76 1835.71 304895136. 6377938944. 1978.9 35875.9 29.53 29.53 117946.4 97.97 1757.45 82.85 1742.33 305559008. 6425923072. 2016.8 36178.0
31.17 31.17 124799.5 94.44 1675.25 78.48 1659.29 306271424. 6475247616. 2057.1 36489.6 32.81 32.81 131670.1 91.36 1601.63 74.56 1584.84 307003424. 6525192192. 2099.5 36806.7
84
StabCAD Ver. 4.20 FPSO -- INTACT AND DAMAGE STABILITY Page 4 * * * Cross Curves of Stability * * * Vertical Center of Gravity ..... 57.58 Ft Yaw Angle of Heel Axis ..... 45.00 Deg Draft Disp /---------------------------- Righting Arm (Ft) @ Heel Angles (Deg) -------------------------/ (Ft) (S.Tons) 0.00 1.50 3.00 4.50 6.00 7.50 9.00 10.50 12.00 13.50 15.00 16.50 32.81 131670.1 0.00 20.95 42.28 64.00 85.86 103.07 113.26 118.97 122.15 123.81 124.49 124.50 36.09 145465.5 0.00 19.06 38.44 58.19 77.54 92.01 100.96 106.09 108.91 110.36 110.92 110.88 39.37 159305.8 0.00 17.47 35.25 53.36 69.56 80.99 88.45 92.94 95.48 96.77 97.25 97.18 42.65 173176.3 0.00 16.15 32.57 49.05 61.65 70.19 76.03 79.75 81.95 83.10 83.53 83.46 45.93 187077.6 0.00 15.02 30.31 44.39 53.61 59.68 63.87 66.72 68.47 69.41 69.78 69.71 49.21 201010.4 0.00 14.06 28.34 39.00 45.30 49.35 52.10 53.99 55.22 55.87 56.09 55.98 52.49 214975.3 0.00 13.23 25.71 32.73 36.64 39.07 40.64 41.66 42.29 42.60 42.62 42.41 Draft Disp /---------------------------- Righting Arm (Ft) @ Heel Angles (Deg) -------------------------/ (Ft) (S.Tons) 18.00 19.50 21.00 22.50 24.00 25.50 27.00 28.50 30.00 31.50 33.00 34.50 32.81 131670.1 124.03 123.18 122.05 120.69 119.12 117.38 115.50 113.47 111.33 109.07 106.70 104.24 36.09 145465.5 110.40 109.59 108.52 107.23 105.77 104.16 102.41 100.54 98.55 96.47 94.29 92.03 39.37 159305.8 96.72 95.96 94.96 93.77 92.42 90.93 89.32 87.61 85.80 83.89 81.91 79.84 42.65 173176.3 83.03 82.32 81.41 80.32 79.09 77.73 76.27 74.72 73.07 71.35 69.56 67.70 45.93 187077.6 69.32 68.68 67.85 66.87 65.76 64.55 63.24 61.84 60.37 58.84 57.24 55.58 49.21 201010.4 55.60 55.03 54.29 53.42 52.44 51.36 50.21 48.98 47.68 46.33 44.93 43.48 52.49 214975.3 42.02 41.46 40.78 40.00 39.13 38.19 37.18 36.11 34.99 33.83 32.62 31.38 Draft Disp /---------------------------- Righting Arm (Ft) @ Heel Angles (Deg) -------------------------/ (Ft) (S.Tons) 36.00 37.50 39.00 40.50 42.00 43.50 45.00 32.81 131670.1 101.68 99.03 96.31 93.50 90.62 87.66 84.64 36.09 145465.5 89.68 87.26 84.76 82.19 79.55 76.85 74.09 39.37 159305.8 77.71 75.51 73.24 70.91 68.52 66.08 63.58 42.65 173176.3 65.78 63.80 61.76 59.67 57.53 55.35 53.12 45.93 187077.6 53.88 52.12 50.31 48.46 46.57 44.65 42.68 49.21 201010.4 41.99 40.45 38.88 37.27 35.63 33.96 32.26
52.49 214975.3 30.10 28.79 27.45 26.09 24.70 23.28 21.85
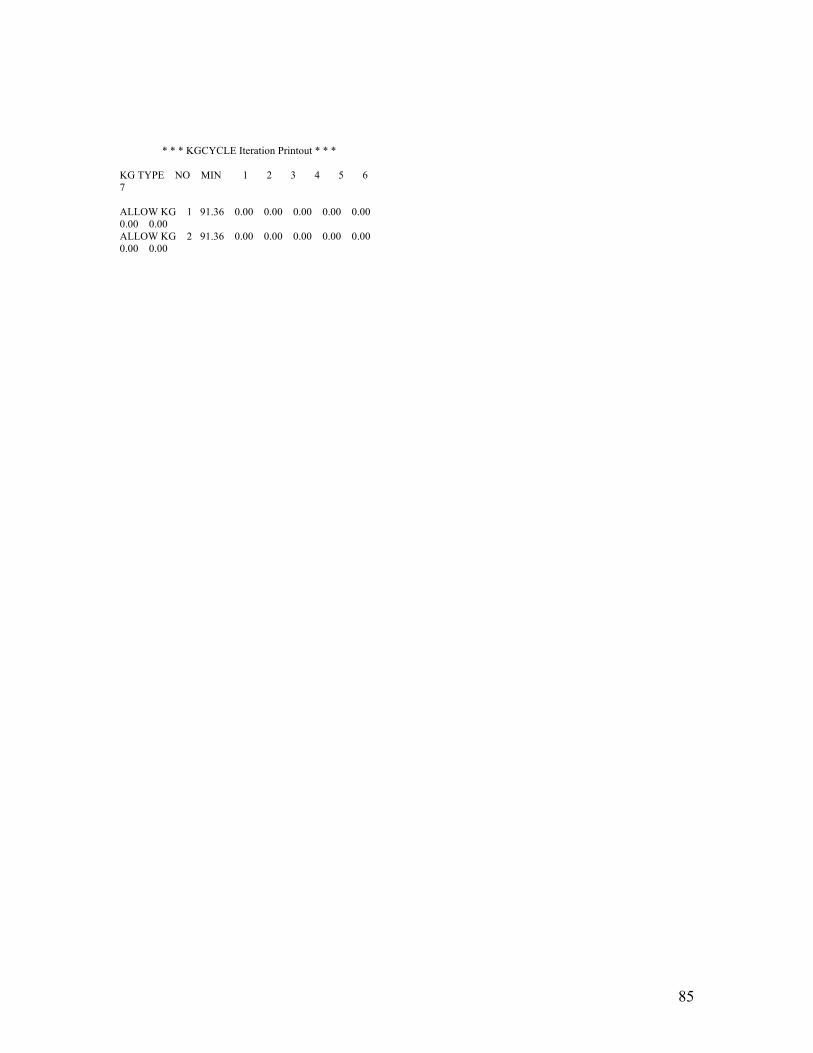
85
* * * KGCYCLE Iteration Printout * * * KG TYPE NO MIN 1 2 3 4 5 6 7 ALLOW KG 1 91.36 0.00 0.00 0.00 0.00 0.00 0.00 0.00 ALLOW KG 2 91.36 0.00 0.00 0.00 0.00 0.00 0.00 0.00

86
StabCAD Ver. 4.20 FPSO -- INTACT AND DAMAGE STABILITY Page 5 * * * Intact Stability Downflooding Point Table * * * Intact Draft .............. 32.81 Ft Displacement .............. 131670.1 S.Tons Center of Gravity (X,Y,Z) = 374.81; 0.00; 91.36 Ft Angle of Tilt Axis ........ 0.00 Deg Downflooding Points Height Above Water (Ft) -------------------------------------------- Downflooding Angle = 23.48 Deg @ BOW PORTSIDE Weathertight Angle = 23.48 Deg @ BOW PORTSIDE H E E L A N G L E S ------- ------- -------------------- --------------------------------------------------------------------------------------------- DF PT. Type Description 0.0 1.5 3.0 4.5 6.0 7.5 9.0 10.5 12.0 13.5 15.0 16.5 ------- ------- -------------------- --------------------------------------------------------------------------------------------- 1 Intact STERN STARBOARD 34.5 36.5 38.6 40.6 42.6 44.6 46.5 48.4 50.3 52.2 54.0 55.9 2 Intact STERN PORTSIDE 34.5 32.4 30.3 28.2 26.1 24.0 21.9 19.7 17.6 15.4 13.3 11.1 3 Intact BOW STARBOARD 34.5 36.5 38.5 40.5 42.5 44.4 46.3 48.2 50.0 51.8 53.5 55.2 4 Intact BOW PORTSIDE 34.5 32.4 30.3 28.2 26.0 23.9 21.7 19.5 17.2 15.0 12.7 10.5 ------- ------- -------------------- --------------------------------------------------------------------------------------------- H E E L A N G L E S ------- ------- -------------------- --------------------------------------------------------------------------------------------- DF PT. Type Description 18.0 19.5 21.0 22.5 24.0 25.5 27.0 28.5 30.0 31.5 33.0 34.5 ------- ------- -------------------- --------------------------------------------------------------------------------------------- 1 Intact STERN STARBOARD 57.7 59.4 61.2 63.0 64.6 66.3 67.9 69.4 70.9 72.4 73.8 75.2 2 Intact STERN PORTSIDE 9.0 6.9 4.8 2.7 0.6 -1.5 -3.6 -5.7 -7.8 -9.9 -12.0 -14.0 3 Intact BOW STARBOARD 56.9 58.6 60.2 61.8 63.2 64.6 66.0 67.3 68.5 69.7 70.9 72.0 4 Intact BOW PORTSIDE 8.2 6.0 3.8 1.5 -0.8 -3.2 -5.5 -7.9 -10.2 -12.6 -14.9 -17.2 ------- ------- -------------------- --------------------------------------------------------------------------------------------- H E E L A N G L E S ------- ------- -------------------- ----------------------------------------------------- DF PT. Type Description 36.0 37.5 39.0 40.5 42.0 43.5 45.0
------- ------- -------------------- ----------------------------------------------------- 1 Intact STERN STARBOARD 76.5 77.7 78.9 80.1 81.2 82.2 83.2 2 Intact STERN PORTSIDE -16.1 -18.1 -20.2 -22.2 -24.2 -26.2 -28.2 3 Intact BOW STARBOARD 73.0 74.0 75.0 75.9 76.7 77.5 78.3 4 Intact BOW PORTSIDE -19.5 -21.8 -24.1 -26.4 -28.6 -30.9 -33.1 ------- ------- -------------------- -----------------------------------------------------
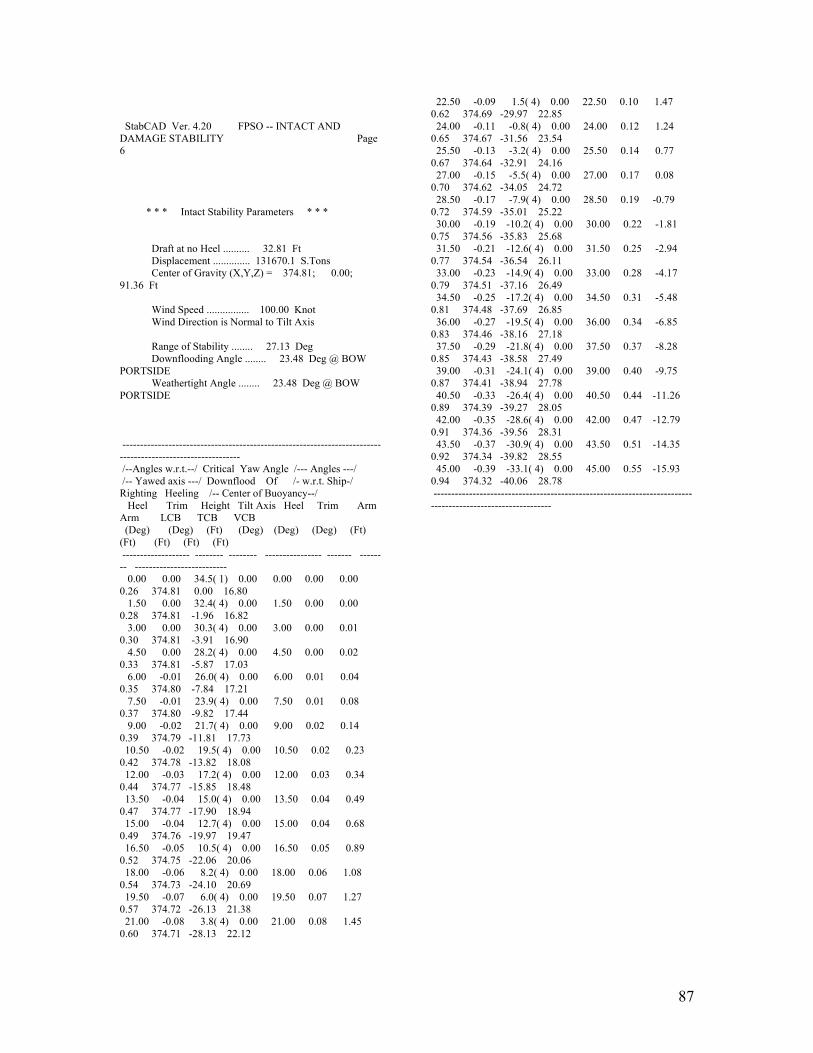
87
StabCAD Ver. 4.20 FPSO -- INTACT AND DAMAGE STABILITY Page 6 * * * Intact Stability Parameters * * * Draft at no Heel .......... 32.81 Ft Displacement .............. 131670.1 S.Tons Center of Gravity (X,Y,Z) = 374.81; 0.00; 91.36 Ft Wind Speed ................ 100.00 Knot Wind Direction is Normal to Tilt Axis Range of Stability ........ 27.13 Deg Downflooding Angle ........ 23.48 Deg @ BOW PORTSIDE Weathertight Angle ........ 23.48 Deg @ BOW PORTSIDE ----------------------------------------------------------------------------------------------------------- /--Angles w.r.t.--/ Critical Yaw Angle /--- Angles ---/ /-- Yawed axis ---/ Downflood Of /- w.r.t. Ship-/ Righting Heeling /-- Center of Buoyancy--/ Heel Trim Height Tilt Axis Heel Trim Arm Arm LCB TCB VCB (Deg) (Deg) (Ft) (Deg) (Deg) (Deg) (Ft) (Ft) (Ft) (Ft) (Ft) ------------------- -------- -------- ---------------- ------- -------- -------------------------- 0.00 0.00 34.5( 1) 0.00 0.00 0.00 0.00 0.26 374.81 0.00 16.80 1.50 0.00 32.4( 4) 0.00 1.50 0.00 0.00 0.28 374.81 -1.96 16.82 3.00 0.00 30.3( 4) 0.00 3.00 0.00 0.01 0.30 374.81 -3.91 16.90 4.50 0.00 28.2( 4) 0.00 4.50 0.00 0.02 0.33 374.81 -5.87 17.03 6.00 -0.01 26.0( 4) 0.00 6.00 0.01 0.04 0.35 374.80 -7.84 17.21 7.50 -0.01 23.9( 4) 0.00 7.50 0.01 0.08 0.37 374.80 -9.82 17.44 9.00 -0.02 21.7( 4) 0.00 9.00 0.02 0.14 0.39 374.79 -11.81 17.73 10.50 -0.02 19.5( 4) 0.00 10.50 0.02 0.23 0.42 374.78 -13.82 18.08 12.00 -0.03 17.2( 4) 0.00 12.00 0.03 0.34 0.44 374.77 -15.85 18.48 13.50 -0.04 15.0( 4) 0.00 13.50 0.04 0.49 0.47 374.77 -17.90 18.94 15.00 -0.04 12.7( 4) 0.00 15.00 0.04 0.68 0.49 374.76 -19.97 19.47 16.50 -0.05 10.5( 4) 0.00 16.50 0.05 0.89 0.52 374.75 -22.06 20.06 18.00 -0.06 8.2( 4) 0.00 18.00 0.06 1.08 0.54 374.73 -24.10 20.69 19.50 -0.07 6.0( 4) 0.00 19.50 0.07 1.27 0.57 374.72 -26.13 21.38 21.00 -0.08 3.8( 4) 0.00 21.00 0.08 1.45 0.60 374.71 -28.13 22.12
22.50 -0.09 1.5( 4) 0.00 22.50 0.10 1.47 0.62 374.69 -29.97 22.85 24.00 -0.11 -0.8( 4) 0.00 24.00 0.12 1.24 0.65 374.67 -31.56 23.54 25.50 -0.13 -3.2( 4) 0.00 25.50 0.14 0.77 0.67 374.64 -32.91 24.16 27.00 -0.15 -5.5( 4) 0.00 27.00 0.17 0.08 0.70 374.62 -34.05 24.72 28.50 -0.17 -7.9( 4) 0.00 28.50 0.19 -0.79 0.72 374.59 -35.01 25.22 30.00 -0.19 -10.2( 4) 0.00 30.00 0.22 -1.81 0.75 374.56 -35.83 25.68 31.50 -0.21 -12.6( 4) 0.00 31.50 0.25 -2.94 0.77 374.54 -36.54 26.11 33.00 -0.23 -14.9( 4) 0.00 33.00 0.28 -4.17 0.79 374.51 -37.16 26.49 34.50 -0.25 -17.2( 4) 0.00 34.50 0.31 -5.48 0.81 374.48 -37.69 26.85 36.00 -0.27 -19.5( 4) 0.00 36.00 0.34 -6.85 0.83 374.46 -38.16 27.18 37.50 -0.29 -21.8( 4) 0.00 37.50 0.37 -8.28 0.85 374.43 -38.58 27.49 39.00 -0.31 -24.1( 4) 0.00 39.00 0.40 -9.75 0.87 374.41 -38.94 27.78 40.50 -0.33 -26.4( 4) 0.00 40.50 0.44 -11.26 0.89 374.39 -39.27 28.05 42.00 -0.35 -28.6( 4) 0.00 42.00 0.47 -12.79 0.91 374.36 -39.56 28.31 43.50 -0.37 -30.9( 4) 0.00 43.50 0.51 -14.35 0.92 374.34 -39.82 28.55 45.00 -0.39 -33.1( 4) 0.00 45.00 0.55 -15.93 0.94 374.32 -40.06 28.78 -----------------------------------------------------------------------------------------------------------

88
StabCAD Ver. 4.20 FPSO -- INTACT AND DAMAGE STABILITY Page 7 * * * Intact Stability Allowable KG * * * Draft at no Heel .......... 32.81 Ft Displacement .............. 131670.12 S.Tons Center of Gravity (X,Y,Z) = 374.81; 0.00; 91.36 Ft Yaw Angle Of Tilt Axis .... 0.00 Deg Downflooding Angle ........ 23.48 Deg @ BOW PORTSIDE Weathertight Angle ........ 23.48 Deg @ BOW PORTSIDE * * * * * Wind Speed 100.00 Knot * * * * * ---------------------------------------------------------------------------------------------- Allowable Optimum Range Of Area /--Intercept--/ Condition KG Tilt Angle Stability Ratio 1st 2nd (Ft) (Deg) (Deg) /----(Deg)----/ ------------------------ ------------ ---------- --------- ------ --------------- For Input KG = 91.36 23.48 23.48 1.21 13.18 25.70 Area Ratio = 1.40 90.94 23.48 23.48 1.40 12.12 26.09 1st Intercept = 15.00* 91.39 23.48 23.48 1.19 13.26 25.68 2nd Intercept = 30.00 86.25 23.48 23.48 3.54 3.38 30.00 ----------------------------------------------------------------------------------------------
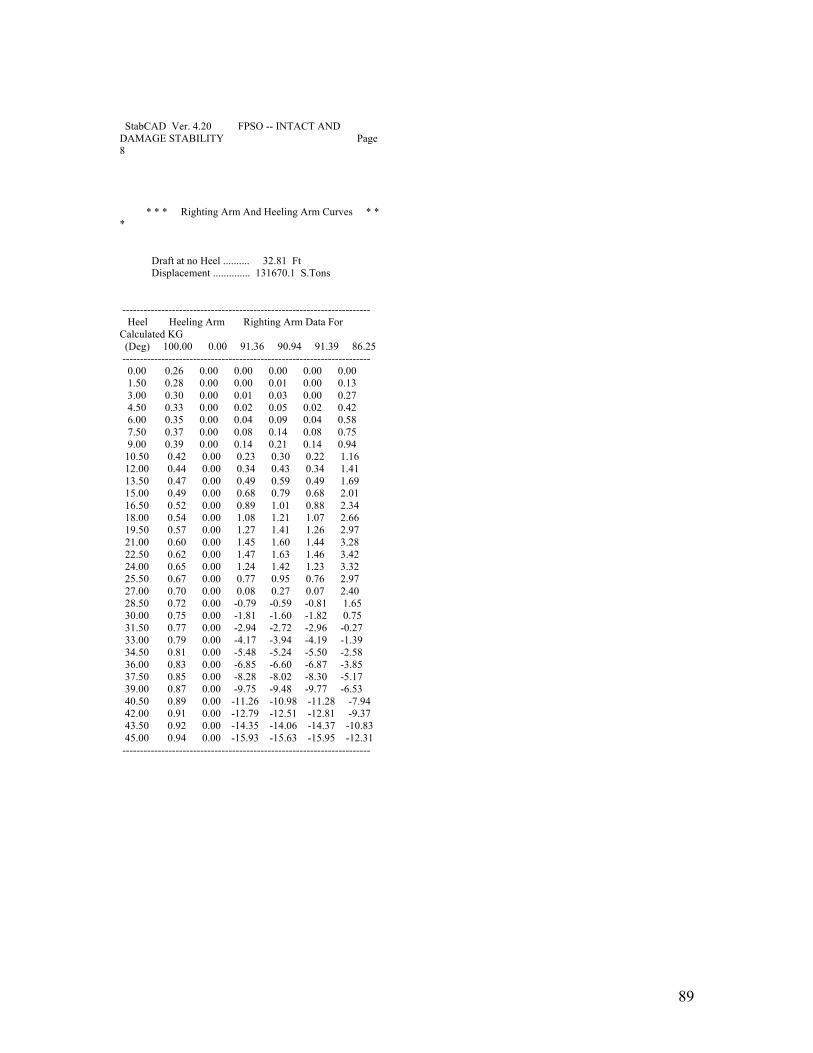
89
StabCAD Ver. 4.20 FPSO -- INTACT AND DAMAGE STABILITY Page 8 * * * Righting Arm And Heeling Arm Curves * * * Draft at no Heel .......... 32.81 Ft Displacement .............. 131670.1 S.Tons ---------------------------------------------------------------------- Heel Heeling Arm Righting Arm Data For Calculated KG (Deg) 100.00 0.00 91.36 90.94 91.39 86.25 ---------------------------------------------------------------------- 0.00 0.26 0.00 0.00 0.00 0.00 0.00 1.50 0.28 0.00 0.00 0.01 0.00 0.13 3.00 0.30 0.00 0.01 0.03 0.00 0.27 4.50 0.33 0.00 0.02 0.05 0.02 0.42 6.00 0.35 0.00 0.04 0.09 0.04 0.58 7.50 0.37 0.00 0.08 0.14 0.08 0.75 9.00 0.39 0.00 0.14 0.21 0.14 0.94 10.50 0.42 0.00 0.23 0.30 0.22 1.16 12.00 0.44 0.00 0.34 0.43 0.34 1.41 13.50 0.47 0.00 0.49 0.59 0.49 1.69 15.00 0.49 0.00 0.68 0.79 0.68 2.01 16.50 0.52 0.00 0.89 1.01 0.88 2.34 18.00 0.54 0.00 1.08 1.21 1.07 2.66 19.50 0.57 0.00 1.27 1.41 1.26 2.97 21.00 0.60 0.00 1.45 1.60 1.44 3.28 22.50 0.62 0.00 1.47 1.63 1.46 3.42 24.00 0.65 0.00 1.24 1.42 1.23 3.32 25.50 0.67 0.00 0.77 0.95 0.76 2.97 27.00 0.70 0.00 0.08 0.27 0.07 2.40 28.50 0.72 0.00 -0.79 -0.59 -0.81 1.65 30.00 0.75 0.00 -1.81 -1.60 -1.82 0.75 31.50 0.77 0.00 -2.94 -2.72 -2.96 -0.27 33.00 0.79 0.00 -4.17 -3.94 -4.19 -1.39 34.50 0.81 0.00 -5.48 -5.24 -5.50 -2.58 36.00 0.83 0.00 -6.85 -6.60 -6.87 -3.85 37.50 0.85 0.00 -8.28 -8.02 -8.30 -5.17 39.00 0.87 0.00 -9.75 -9.48 -9.77 -6.53 40.50 0.89 0.00 -11.26 -10.98 -11.28 -7.94 42.00 0.91 0.00 -12.79 -12.51 -12.81 -9.37 43.50 0.92 0.00 -14.35 -14.06 -14.37 -10.83 45.00 0.94 0.00 -15.93 -15.63 -15.95 -12.31 ----------------------------------------------------------------------

90
* * * KGCYCLE Iteration Printout * * * KG TYPE NO MIN 1 2 3 4 5 6 7 ALLOW KG 1 91.36 0.00 0.00 0.00 0.00 0.00 0.00 0.00 ALLOW KG 2 91.36 0.00 0.00 0.00 0.00 0.00 0.00 0.00

91
StabCAD Ver. 4.20 FPSO -- INTACT AND DAMAGE STABILITY Page 9 * * * Intact Stability Downflooding Point Table * * * Intact Draft .............. 32.81 Ft Displacement .............. 131670.1 S.Tons Center of Gravity (X,Y,Z) = 374.81; 0.00; 91.36 Ft Angle of Tilt Axis ........ 15.00 Deg Downflooding Points Height Above Water (Ft) -------------------------------------------- Downflooding Angle = 22.80 Deg @ BOW PORTSIDE Weathertight Angle = 22.80 Deg @ BOW PORTSIDE H E E L A N G L E S ------- ------- -------------------- --------------------------------------------------------------------------------------------- DF PT. Type Description 0.0 1.5 3.0 4.5 6.0 7.5 9.0 10.5 12.0 13.5 15.0 16.5 ------- ------- -------------------- --------------------------------------------------------------------------------------------- 1 Intact STERN STARBOARD 34.5 36.6 38.7 40.8 42.9 44.9 46.9 48.9 50.8 52.7 54.6 56.5 2 Intact STERN PORTSIDE 34.5 32.3 30.2 28.0 25.8 23.6 21.4 19.2 17.0 14.7 12.5 10.3 3 Intact BOW STARBOARD 34.5 36.6 38.7 40.7 42.8 44.8 46.7 48.6 50.5 52.3 54.1 55.9 4 Intact BOW PORTSIDE 34.5 32.3 30.2 27.9 25.7 23.5 21.2 18.9 16.6 14.3 12.0 9.7 ------- ------- -------------------- --------------------------------------------------------------------------------------------- H E E L A N G L E S ------- ------- -------------------- --------------------------------------------------------------------------------------------- DF PT. Type Description 18.0 19.5 21.0 22.5 24.0 25.5 27.0 28.5 30.0 31.5 33.0 34.5 ------- ------- -------------------- --------------------------------------------------------------------------------------------- 1 Intact STERN STARBOARD 58.3 60.1 62.0 63.7 65.4 67.1 68.8 70.4 72.0 73.6 75.1 76.5 2 Intact STERN PORTSIDE 8.1 5.9 3.7 1.6 -0.6 -2.7 -4.8 -6.9 -8.9 -11.0 -13.0 -15.0 3 Intact BOW STARBOARD 57.7 59.4 61.1 62.6 64.0 65.4 66.7 67.9 69.1 70.2 71.2 72.2 4 Intact BOW PORTSIDE 7.4 5.1 2.8 0.5 -1.9 -4.4 -6.9 -9.4 -11.8 -14.3 -16.8 -19.3 ------- ------- -------------------- --------------------------------------------------------------------------------------------- H E E L A N G L E S ------- ------- -------------------- ----------------------------------------------------- DF PT. Type Description 36.0 37.5 39.0 40.5 42.0 43.5 45.0
------- ------- -------------------- ----------------------------------------------------- 1 Intact STERN STARBOARD 77.9 79.3 80.6 81.8 83.0 84.1 85.2 2 Intact STERN PORTSIDE -16.9 -18.9 -20.8 -22.7 -24.6 -26.5 -28.3 3 Intact BOW STARBOARD 73.1 73.9 74.7 75.4 76.1 76.7 77.3 4 Intact BOW PORTSIDE -21.8 -24.2 -26.7 -29.1 -31.5 -33.9 -36.2 ------- ------- -------------------- -----------------------------------------------------
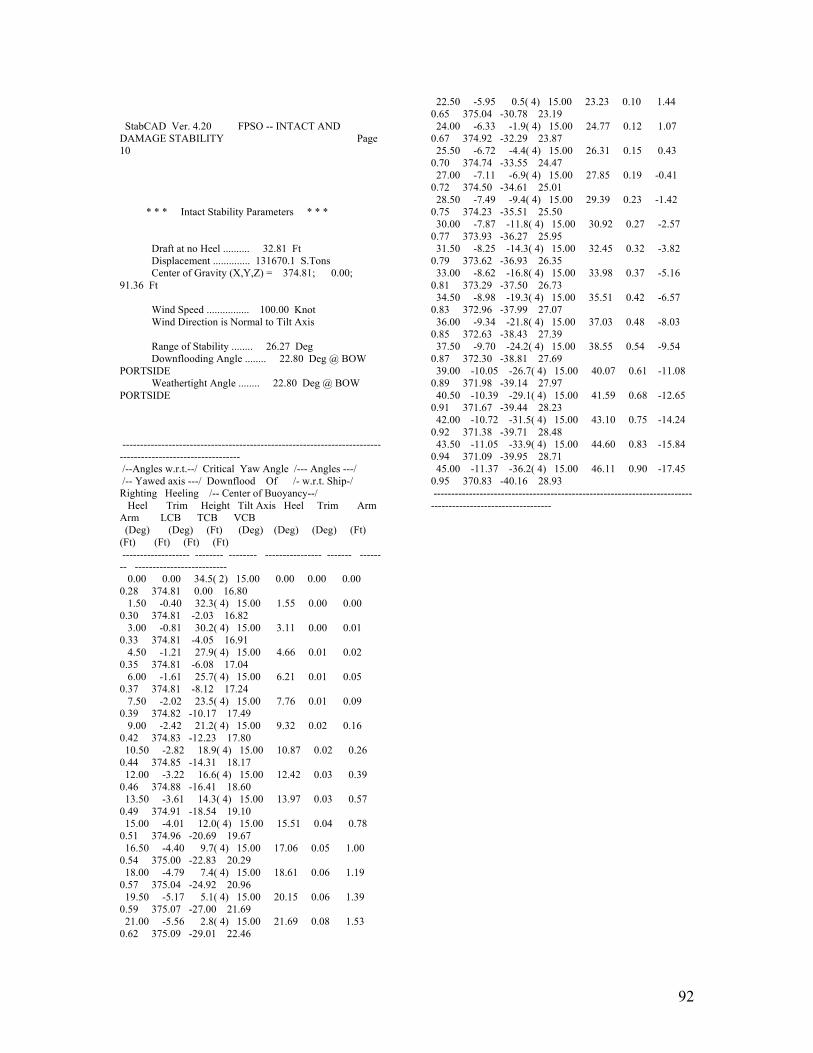
92
StabCAD Ver. 4.20 FPSO -- INTACT AND DAMAGE STABILITY Page 10 * * * Intact Stability Parameters * * * Draft at no Heel .......... 32.81 Ft Displacement .............. 131670.1 S.Tons Center of Gravity (X,Y,Z) = 374.81; 0.00; 91.36 Ft Wind Speed ................ 100.00 Knot Wind Direction is Normal to Tilt Axis Range of Stability ........ 26.27 Deg Downflooding Angle ........ 22.80 Deg @ BOW PORTSIDE Weathertight Angle ........ 22.80 Deg @ BOW PORTSIDE ----------------------------------------------------------------------------------------------------------- /--Angles w.r.t.--/ Critical Yaw Angle /--- Angles ---/ /-- Yawed axis ---/ Downflood Of /- w.r.t. Ship-/ Righting Heeling /-- Center of Buoyancy--/ Heel Trim Height Tilt Axis Heel Trim Arm Arm LCB TCB VCB (Deg) (Deg) (Ft) (Deg) (Deg) (Deg) (Ft) (Ft) (Ft) (Ft) (Ft) ------------------- -------- -------- ---------------- ------- -------- -------------------------- 0.00 0.00 34.5( 2) 15.00 0.00 0.00 0.00 0.28 374.81 0.00 16.80 1.50 -0.40 32.3( 4) 15.00 1.55 0.00 0.00 0.30 374.81 -2.03 16.82 3.00 -0.81 30.2( 4) 15.00 3.11 0.00 0.01 0.33 374.81 -4.05 16.91 4.50 -1.21 27.9( 4) 15.00 4.66 0.01 0.02 0.35 374.81 -6.08 17.04 6.00 -1.61 25.7( 4) 15.00 6.21 0.01 0.05 0.37 374.81 -8.12 17.24 7.50 -2.02 23.5( 4) 15.00 7.76 0.01 0.09 0.39 374.82 -10.17 17.49 9.00 -2.42 21.2( 4) 15.00 9.32 0.02 0.16 0.42 374.83 -12.23 17.80 10.50 -2.82 18.9( 4) 15.00 10.87 0.02 0.26 0.44 374.85 -14.31 18.17 12.00 -3.22 16.6( 4) 15.00 12.42 0.03 0.39 0.46 374.88 -16.41 18.60 13.50 -3.61 14.3( 4) 15.00 13.97 0.03 0.57 0.49 374.91 -18.54 19.10 15.00 -4.01 12.0( 4) 15.00 15.51 0.04 0.78 0.51 374.96 -20.69 19.67 16.50 -4.40 9.7( 4) 15.00 17.06 0.05 1.00 0.54 375.00 -22.83 20.29 18.00 -4.79 7.4( 4) 15.00 18.61 0.06 1.19 0.57 375.04 -24.92 20.96 19.50 -5.17 5.1( 4) 15.00 20.15 0.06 1.39 0.59 375.07 -27.00 21.69 21.00 -5.56 2.8( 4) 15.00 21.69 0.08 1.53 0.62 375.09 -29.01 22.46
22.50 -5.95 0.5( 4) 15.00 23.23 0.10 1.44 0.65 375.04 -30.78 23.19 24.00 -6.33 -1.9( 4) 15.00 24.77 0.12 1.07 0.67 374.92 -32.29 23.87 25.50 -6.72 -4.4( 4) 15.00 26.31 0.15 0.43 0.70 374.74 -33.55 24.47 27.00 -7.11 -6.9( 4) 15.00 27.85 0.19 -0.41 0.72 374.50 -34.61 25.01 28.50 -7.49 -9.4( 4) 15.00 29.39 0.23 -1.42 0.75 374.23 -35.51 25.50 30.00 -7.87 -11.8( 4) 15.00 30.92 0.27 -2.57 0.77 373.93 -36.27 25.95 31.50 -8.25 -14.3( 4) 15.00 32.45 0.32 -3.82 0.79 373.62 -36.93 26.35 33.00 -8.62 -16.8( 4) 15.00 33.98 0.37 -5.16 0.81 373.29 -37.50 26.73 34.50 -8.98 -19.3( 4) 15.00 35.51 0.42 -6.57 0.83 372.96 -37.99 27.07 36.00 -9.34 -21.8( 4) 15.00 37.03 0.48 -8.03 0.85 372.63 -38.43 27.39 37.50 -9.70 -24.2( 4) 15.00 38.55 0.54 -9.54 0.87 372.30 -38.81 27.69 39.00 -10.05 -26.7( 4) 15.00 40.07 0.61 -11.08 0.89 371.98 -39.14 27.97 40.50 -10.39 -29.1( 4) 15.00 41.59 0.68 -12.65 0.91 371.67 -39.44 28.23 42.00 -10.72 -31.5( 4) 15.00 43.10 0.75 -14.24 0.92 371.38 -39.71 28.48 43.50 -11.05 -33.9( 4) 15.00 44.60 0.83 -15.84 0.94 371.09 -39.95 28.71 45.00 -11.37 -36.2( 4) 15.00 46.11 0.90 -17.45 0.95 370.83 -40.16 28.93 -----------------------------------------------------------------------------------------------------------

93
StabCAD Ver. 4.20 FPSO -- INTACT AND DAMAGE STABILITY Page 11 * * * Intact Stability Allowable KG * * * Draft at no Heel .......... 32.81 Ft Displacement .............. 131670.12 S.Tons Center of Gravity (X,Y,Z) = 374.81; 0.00; 91.36 Ft Yaw Angle Of Tilt Axis .... 15.00 Deg Downflooding Angle ........ 22.80 Deg @ BOW PORTSIDE Weathertight Angle ........ 22.80 Deg @ BOW PORTSIDE * * * * * Wind Speed 100.00 Knot * * * * * ---------------------------------------------------------------------------------------------- Allowable Optimum Range Of Area /--Intercept--/ Condition KG Tilt Angle Stability Ratio 1st 2nd (Ft) (Deg) (Deg) /----(Deg)----/ ------------------------ ------------ ---------- --------- ------ --------------- For Input KG = 91.36 22.80 22.80 1.21 12.71 24.90 Area Ratio = 1.40 90.92 22.80 22.80 1.40 11.72 25.33 1st Intercept = 15.00 92.40 22.80 22.80 1.14 15.00 23.90 2nd Intercept = 30.00 84.69 22.80 22.80 4.06 2.72 30.00 ----------------------------------------------------------------------------------------------

94
StabCAD Ver. 4.20 FPSO -- INTACT AND DAMAGE STABILITY Page 12 * * * Righting Arm And Heeling Arm Curves * * * Draft at no Heel .......... 32.81 Ft Displacement .............. 131670.1 S.Tons ---------------------------------------------------------------------- Heel Heeling Arm Righting Arm Data For Calculated KG (Deg) 100.00 0.00 91.36 90.92 92.40 84.69 ---------------------------------------------------------------------- 0.00 0.28 0.00 0.00 0.00 0.00 0.00 1.50 0.30 0.00 0.00 0.01 -0.03 0.18 3.00 0.33 0.00 0.01 0.03 -0.05 0.36 4.50 0.35 0.00 0.02 0.06 -0.06 0.54 6.00 0.37 0.00 0.05 0.09 -0.06 0.75 7.50 0.39 0.00 0.09 0.15 -0.04 0.96 9.00 0.42 0.00 0.16 0.23 0.00 1.21 10.50 0.44 0.00 0.26 0.34 0.07 1.48 12.00 0.46 0.00 0.39 0.49 0.18 1.78 13.50 0.49 0.00 0.57 0.67 0.32 2.12 15.00 0.51 0.00 0.78 0.90 0.51 2.51 16.50 0.54 0.00 1.00 1.12 0.70 2.89 18.00 0.57 0.00 1.19 1.33 0.87 3.26 19.50 0.59 0.00 1.39 1.54 1.04 3.62 21.00 0.62 0.00 1.53 1.69 1.16 3.92 22.50 0.65 0.00 1.44 1.60 1.04 3.99 24.00 0.67 0.00 1.07 1.24 0.64 3.78 25.50 0.70 0.00 0.43 0.62 -0.01 3.31 27.00 0.72 0.00 -0.41 -0.21 -0.88 2.62 28.50 0.75 0.00 -1.42 -1.21 -1.91 1.76 30.00 0.77 0.00 -2.57 -2.34 -3.08 0.77 31.50 0.79 0.00 -3.82 -3.59 -4.36 -0.33 33.00 0.81 0.00 -5.16 -4.92 -5.72 -1.53 34.50 0.83 0.00 -6.57 -6.32 -7.15 -2.79 36.00 0.85 0.00 -8.03 -7.77 -8.64 -4.11 37.50 0.87 0.00 -9.54 -9.27 -10.17 -5.48 39.00 0.89 0.00 -11.08 -10.80 -11.73 -6.88 40.50 0.91 0.00 -12.65 -12.36 -13.32 -8.32 42.00 0.92 0.00 -14.24 -13.94 -14.93 -9.77 43.50 0.94 0.00 -15.84 -15.53 -16.55 -11.25 45.00 0.95 0.00 -17.45 -17.13 -18.18 -12.73 ----------------------------------------------------------------------

95
* * * KGCYCLE Iteration Printout * * * KG TYPE NO MIN 1 2 3 4 5 6 7 ALLOW KG 1 91.36 0.00 0.00 0.00 0.00 0.00 0.00 0.00 ALLOW KG 2 91.36 0.00 0.00 0.00 0.00 0.00 0.00 0.00
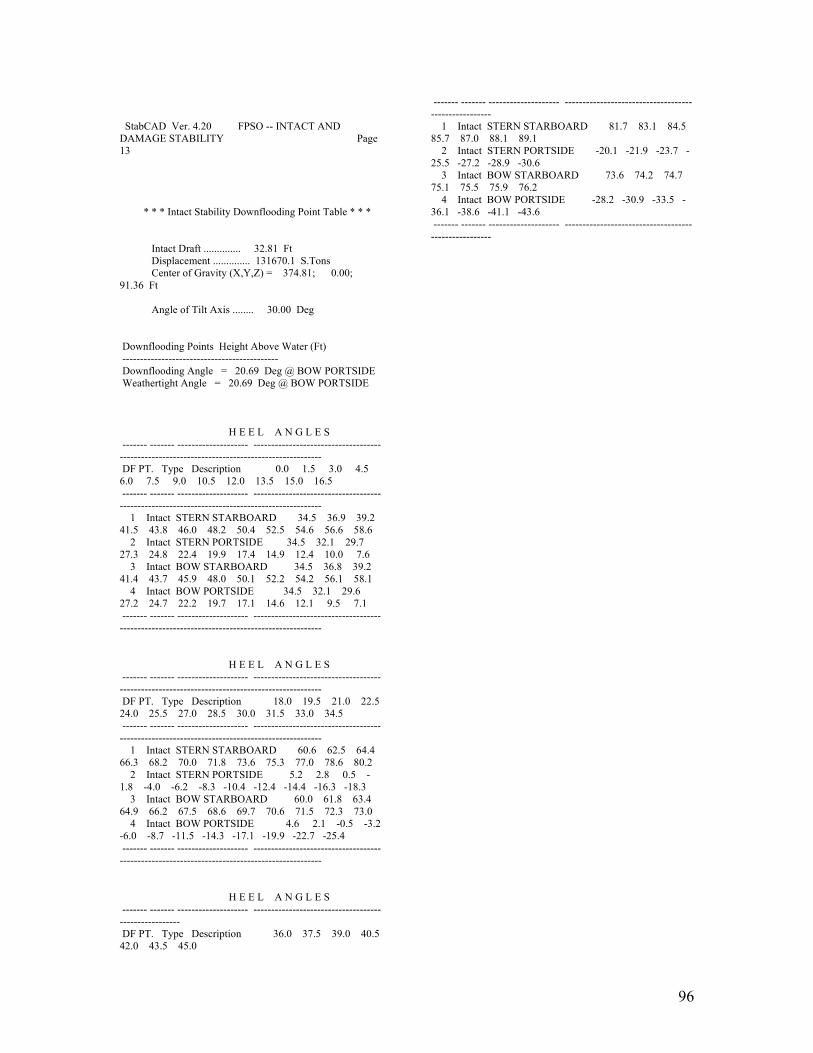
96
StabCAD Ver. 4.20 FPSO -- INTACT AND DAMAGE STABILITY Page 13 * * * Intact Stability Downflooding Point Table * * * Intact Draft .............. 32.81 Ft Displacement .............. 131670.1 S.Tons Center of Gravity (X,Y,Z) = 374.81; 0.00; 91.36 Ft Angle of Tilt Axis ........ 30.00 Deg Downflooding Points Height Above Water (Ft) -------------------------------------------- Downflooding Angle = 20.69 Deg @ BOW PORTSIDE Weathertight Angle = 20.69 Deg @ BOW PORTSIDE H E E L A N G L E S ------- ------- -------------------- --------------------------------------------------------------------------------------------- DF PT. Type Description 0.0 1.5 3.0 4.5 6.0 7.5 9.0 10.5 12.0 13.5 15.0 16.5 ------- ------- -------------------- --------------------------------------------------------------------------------------------- 1 Intact STERN STARBOARD 34.5 36.9 39.2 41.5 43.8 46.0 48.2 50.4 52.5 54.6 56.6 58.6 2 Intact STERN PORTSIDE 34.5 32.1 29.7 27.3 24.8 22.4 19.9 17.4 14.9 12.4 10.0 7.6 3 Intact BOW STARBOARD 34.5 36.8 39.2 41.4 43.7 45.9 48.0 50.1 52.2 54.2 56.1 58.1 4 Intact BOW PORTSIDE 34.5 32.1 29.6 27.2 24.7 22.2 19.7 17.1 14.6 12.1 9.5 7.1 ------- ------- -------------------- --------------------------------------------------------------------------------------------- H E E L A N G L E S ------- ------- -------------------- --------------------------------------------------------------------------------------------- DF PT. Type Description 18.0 19.5 21.0 22.5 24.0 25.5 27.0 28.5 30.0 31.5 33.0 34.5 ------- ------- -------------------- --------------------------------------------------------------------------------------------- 1 Intact STERN STARBOARD 60.6 62.5 64.4 66.3 68.2 70.0 71.8 73.6 75.3 77.0 78.6 80.2 2 Intact STERN PORTSIDE 5.2 2.8 0.5 -1.8 -4.0 -6.2 -8.3 -10.4 -12.4 -14.4 -16.3 -18.3 3 Intact BOW STARBOARD 60.0 61.8 63.4 64.9 66.2 67.5 68.6 69.7 70.6 71.5 72.3 73.0 4 Intact BOW PORTSIDE 4.6 2.1 -0.5 -3.2 -6.0 -8.7 -11.5 -14.3 -17.1 -19.9 -22.7 -25.4 ------- ------- -------------------- --------------------------------------------------------------------------------------------- H E E L A N G L E S ------- ------- -------------------- ----------------------------------------------------- DF PT. Type Description 36.0 37.5 39.0 40.5 42.0 43.5 45.0
------- ------- -------------------- ----------------------------------------------------- 1 Intact STERN STARBOARD 81.7 83.1 84.5 85.7 87.0 88.1 89.1 2 Intact STERN PORTSIDE -20.1 -21.9 -23.7 -25.5 -27.2 -28.9 -30.6 3 Intact BOW STARBOARD 73.6 74.2 74.7 75.1 75.5 75.9 76.2 4 Intact BOW PORTSIDE -28.2 -30.9 -33.5 -36.1 -38.6 -41.1 -43.6 ------- ------- -------------------- -----------------------------------------------------
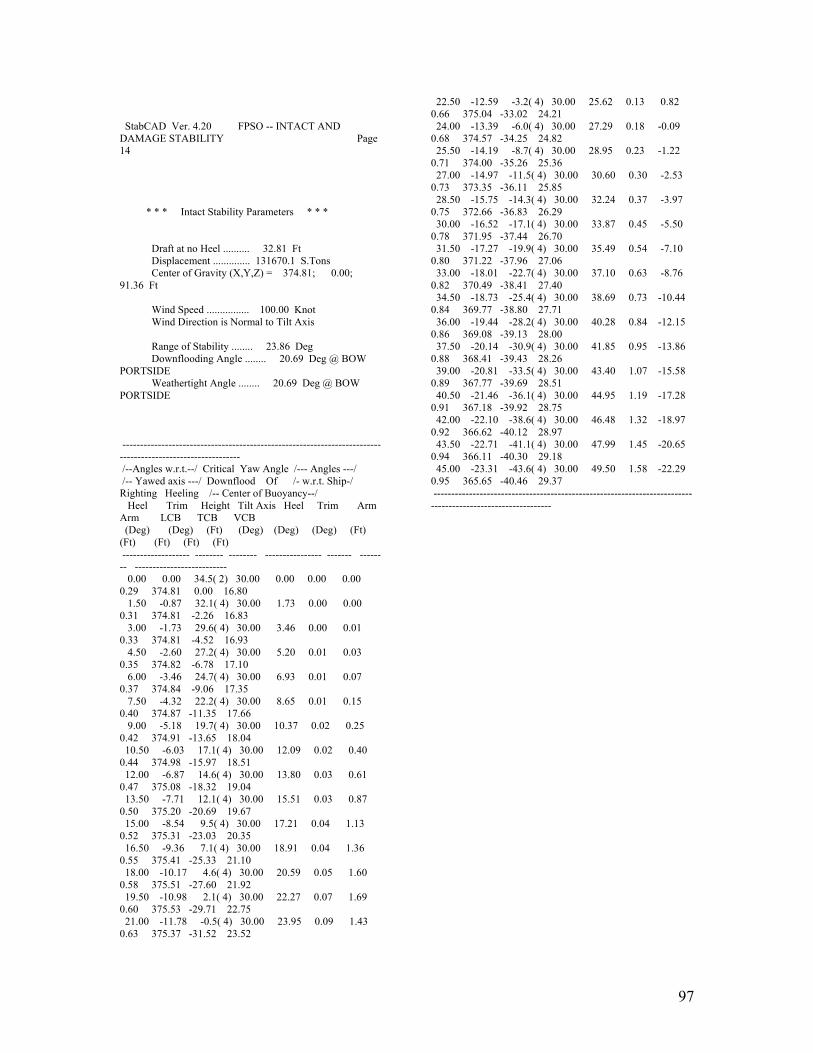
97
StabCAD Ver. 4.20 FPSO -- INTACT AND DAMAGE STABILITY Page 14 * * * Intact Stability Parameters * * * Draft at no Heel .......... 32.81 Ft Displacement .............. 131670.1 S.Tons Center of Gravity (X,Y,Z) = 374.81; 0.00; 91.36 Ft Wind Speed ................ 100.00 Knot Wind Direction is Normal to Tilt Axis Range of Stability ........ 23.86 Deg Downflooding Angle ........ 20.69 Deg @ BOW PORTSIDE Weathertight Angle ........ 20.69 Deg @ BOW PORTSIDE ----------------------------------------------------------------------------------------------------------- /--Angles w.r.t.--/ Critical Yaw Angle /--- Angles ---/ /-- Yawed axis ---/ Downflood Of /- w.r.t. Ship-/ Righting Heeling /-- Center of Buoyancy--/ Heel Trim Height Tilt Axis Heel Trim Arm Arm LCB TCB VCB (Deg) (Deg) (Ft) (Deg) (Deg) (Deg) (Ft) (Ft) (Ft) (Ft) (Ft) ------------------- -------- -------- ---------------- ------- -------- -------------------------- 0.00 0.00 34.5( 2) 30.00 0.00 0.00 0.00 0.29 374.81 0.00 16.80 1.50 -0.87 32.1( 4) 30.00 1.73 0.00 0.00 0.31 374.81 -2.26 16.83 3.00 -1.73 29.6( 4) 30.00 3.46 0.00 0.01 0.33 374.81 -4.52 16.93 4.50 -2.60 27.2( 4) 30.00 5.20 0.01 0.03 0.35 374.82 -6.78 17.10 6.00 -3.46 24.7( 4) 30.00 6.93 0.01 0.07 0.37 374.84 -9.06 17.35 7.50 -4.32 22.2( 4) 30.00 8.65 0.01 0.15 0.40 374.87 -11.35 17.66 9.00 -5.18 19.7( 4) 30.00 10.37 0.02 0.25 0.42 374.91 -13.65 18.04 10.50 -6.03 17.1( 4) 30.00 12.09 0.02 0.40 0.44 374.98 -15.97 18.51 12.00 -6.87 14.6( 4) 30.00 13.80 0.03 0.61 0.47 375.08 -18.32 19.04 13.50 -7.71 12.1( 4) 30.00 15.51 0.03 0.87 0.50 375.20 -20.69 19.67 15.00 -8.54 9.5( 4) 30.00 17.21 0.04 1.13 0.52 375.31 -23.03 20.35 16.50 -9.36 7.1( 4) 30.00 18.91 0.04 1.36 0.55 375.41 -25.33 21.10 18.00 -10.17 4.6( 4) 30.00 20.59 0.05 1.60 0.58 375.51 -27.60 21.92 19.50 -10.98 2.1( 4) 30.00 22.27 0.07 1.69 0.60 375.53 -29.71 22.75 21.00 -11.78 -0.5( 4) 30.00 23.95 0.09 1.43 0.63 375.37 -31.52 23.52
22.50 -12.59 -3.2( 4) 30.00 25.62 0.13 0.82 0.66 375.04 -33.02 24.21 24.00 -13.39 -6.0( 4) 30.00 27.29 0.18 -0.09 0.68 374.57 -34.25 24.82 25.50 -14.19 -8.7( 4) 30.00 28.95 0.23 -1.22 0.71 374.00 -35.26 25.36 27.00 -14.97 -11.5( 4) 30.00 30.60 0.30 -2.53 0.73 373.35 -36.11 25.85 28.50 -15.75 -14.3( 4) 30.00 32.24 0.37 -3.97 0.75 372.66 -36.83 26.29 30.00 -16.52 -17.1( 4) 30.00 33.87 0.45 -5.50 0.78 371.95 -37.44 26.70 31.50 -17.27 -19.9( 4) 30.00 35.49 0.54 -7.10 0.80 371.22 -37.96 27.06 33.00 -18.01 -22.7( 4) 30.00 37.10 0.63 -8.76 0.82 370.49 -38.41 27.40 34.50 -18.73 -25.4( 4) 30.00 38.69 0.73 -10.44 0.84 369.77 -38.80 27.71 36.00 -19.44 -28.2( 4) 30.00 40.28 0.84 -12.15 0.86 369.08 -39.13 28.00 37.50 -20.14 -30.9( 4) 30.00 41.85 0.95 -13.86 0.88 368.41 -39.43 28.26 39.00 -20.81 -33.5( 4) 30.00 43.40 1.07 -15.58 0.89 367.77 -39.69 28.51 40.50 -21.46 -36.1( 4) 30.00 44.95 1.19 -17.28 0.91 367.18 -39.92 28.75 42.00 -22.10 -38.6( 4) 30.00 46.48 1.32 -18.97 0.92 366.62 -40.12 28.97 43.50 -22.71 -41.1( 4) 30.00 47.99 1.45 -20.65 0.94 366.11 -40.30 29.18 45.00 -23.31 -43.6( 4) 30.00 49.50 1.58 -22.29 0.95 365.65 -40.46 29.37 -----------------------------------------------------------------------------------------------------------

98
StabCAD Ver. 4.20 FPSO -- INTACT AND DAMAGE STABILITY Page 15 * * * Intact Stability Allowable KG * * * Draft at no Heel .......... 32.81 Ft Displacement .............. 131670.12 S.Tons Center of Gravity (X,Y,Z) = 374.81; 0.00; 91.36 Ft Yaw Angle Of Tilt Axis .... 30.00 Deg Downflooding Angle ........ 20.69 Deg @ BOW PORTSIDE Weathertight Angle ........ 20.69 Deg @ BOW PORTSIDE * * * * * Wind Speed 100.00 Knot * * * * * ---------------------------------------------------------------------------------------------- Allowable Optimum Range Of Area /--Intercept--/ Condition KG Tilt Angle Stability Ratio 1st 2nd (Ft) (Deg) (Deg) /----(Deg)----/ ------------------------ ------------ ---------- --------- ------ --------------- For Input KG = 91.36 20.69 20.69 1.39 10.84 22.77 Area Ratio = 1.40 91.34 20.69 20.69 1.40 10.81 22.78 1st Intercept = 15.00* 91.42 20.69 20.69 1.39 10.93 22.73 2nd Intercept = 30.00 78.81 20.69 20.69 6.40 1.39 30.00 ----------------------------------------------------------------------------------------------

99
StabCAD Ver. 4.20 FPSO -- INTACT AND DAMAGE STABILITY Page 16 * * * Righting Arm And Heeling Arm Curves * * * Draft at no Heel .......... 32.81 Ft Displacement .............. 131670.1 S.Tons ---------------------------------------------------------------------- Heel Heeling Arm Righting Arm Data For Calculated KG (Deg) 100.00 0.00 91.36 91.34 91.42 78.81 ---------------------------------------------------------------------- 0.00 0.29 0.00 0.00 0.00 0.00 0.00 1.50 0.31 0.00 0.00 0.00 0.00 0.33 3.00 0.33 0.00 0.01 0.01 0.01 0.67 4.50 0.35 0.00 0.03 0.03 0.03 1.02 6.00 0.37 0.00 0.07 0.08 0.07 1.39 7.50 0.40 0.00 0.15 0.15 0.14 1.78 9.00 0.42 0.00 0.25 0.26 0.24 2.22 10.50 0.44 0.00 0.40 0.41 0.39 2.69 12.00 0.47 0.00 0.61 0.61 0.60 3.22 13.50 0.50 0.00 0.87 0.87 0.86 3.80 15.00 0.52 0.00 1.13 1.13 1.11 4.38 16.50 0.55 0.00 1.36 1.37 1.35 4.93 18.00 0.58 0.00 1.60 1.60 1.58 5.48 19.50 0.60 0.00 1.69 1.69 1.67 5.88 21.00 0.63 0.00 1.43 1.44 1.41 5.93 22.50 0.66 0.00 0.82 0.83 0.80 5.62 24.00 0.68 0.00 -0.09 -0.08 -0.11 5.02 25.50 0.71 0.00 -1.22 -1.21 -1.25 4.18 27.00 0.73 0.00 -2.53 -2.52 -2.55 3.17 28.50 0.75 0.00 -3.97 -3.96 -3.99 2.02 30.00 0.78 0.00 -5.50 -5.49 -5.53 0.78 31.50 0.80 0.00 -7.10 -7.09 -7.13 -0.55 33.00 0.82 0.00 -8.76 -8.75 -8.79 -1.92 34.50 0.84 0.00 -10.44 -10.43 -10.48 -3.33 36.00 0.86 0.00 -12.15 -12.14 -12.18 -4.77 37.50 0.88 0.00 -13.86 -13.85 -13.90 -6.22 39.00 0.89 0.00 -15.58 -15.56 -15.61 -7.68 40.50 0.91 0.00 -17.28 -17.27 -17.32 -9.13 42.00 0.92 0.00 -18.97 -18.96 -19.01 -10.58 43.50 0.94 0.00 -20.65 -20.63 -20.68 -12.01 45.00 0.95 0.00 -22.29 -22.28 -22.33 -13.42 ----------------------------------------------------------------------

100
* * * KGCYCLE Iteration Printout * * * KG TYPE NO MIN 1 2 3 4 5 6 7 ALLOW KG 1 91.36 0.00 0.00 0.00 0.00 0.00 0.00 0.00 ALLOW KG 2 91.36 0.00 0.00 0.00 0.00 0.00 0.00 0.00

101
StabCAD Ver. 4.20 FPSO -- INTACT AND DAMAGE STABILITY Page 17 * * * Intact Stability Downflooding Point Table * * * Intact Draft .............. 32.81 Ft Displacement .............. 131670.1 S.Tons Center of Gravity (X,Y,Z) = 374.81; 0.00; 91.36 Ft Angle of Tilt Axis ........ 45.00 Deg Downflooding Points Height Above Water (Ft) -------------------------------------------- Downflooding Angle = 17.19 Deg @ BOW PORTSIDE Weathertight Angle = 17.19 Deg @ BOW PORTSIDE H E E L A N G L E S ------- ------- -------------------- --------------------------------------------------------------------------------------------- DF PT. Type Description 0.0 1.5 3.0 4.5 6.0 7.5 9.0 10.5 12.0 13.5 15.0 16.5 ------- ------- -------------------- --------------------------------------------------------------------------------------------- 1 Intact STERN STARBOARD 34.5 37.4 40.2 43.1 45.8 48.5 51.0 53.5 56.0 58.3 60.7 63.0 2 Intact STERN PORTSIDE 34.5 31.6 28.6 25.6 22.6 19.6 16.6 13.6 10.6 7.7 4.8 2.0 3 Intact BOW STARBOARD 34.5 37.4 40.2 43.0 45.7 48.3 50.8 53.3 55.7 58.0 60.3 62.4 4 Intact BOW PORTSIDE 34.5 31.5 28.5 25.5 22.5 19.4 16.4 13.3 10.3 7.4 4.5 1.5 ------- ------- -------------------- --------------------------------------------------------------------------------------------- H E E L A N G L E S ------- ------- -------------------- --------------------------------------------------------------------------------------------- DF PT. Type Description 18.0 19.5 21.0 22.5 24.0 25.5 27.0 28.5 30.0 31.5 33.0 34.5 ------- ------- -------------------- --------------------------------------------------------------------------------------------- 1 Intact STERN STARBOARD 65.2 67.5 69.8 72.1 74.4 76.5 78.6 80.7 82.6 84.5 86.2 87.8 2 Intact STERN PORTSIDE -0.7 -3.3 -5.7 -8.1 -10.3 -12.5 -14.5 -16.5 -18.4 -20.2 -21.9 -23.6 3 Intact BOW STARBOARD 64.2 65.8 67.2 68.4 69.4 70.2 70.9 71.5 71.9 72.3 72.6 72.8 4 Intact BOW PORTSIDE -1.7 -5.0 -8.4 -11.8 -15.3 -18.8 -22.3 -25.7 -29.0 -32.3 -35.5 -38.6 ------- ------- -------------------- --------------------------------------------------------------------------------------------- H E E L A N G L E S ------- ------- -------------------- ----------------------------------------------------- DF PT. Type Description 36.0 37.5 39.0 40.5 42.0 43.5 45.0
------- ------- -------------------- ----------------------------------------------------- 1 Intact STERN STARBOARD 89.3 90.7 92.0 93.1 94.2 95.1 95.9 2 Intact STERN PORTSIDE -25.2 -26.8 -28.4 -29.9 -31.4 -32.8 -34.3 3 Intact BOW STARBOARD 72.9 73.0 73.1 73.1 73.1 73.1 73.1 4 Intact BOW PORTSIDE -41.6 -44.5 -47.3 -49.9 -52.4 -54.8 -57.1 ------- ------- -------------------- -----------------------------------------------------

102
StabCAD Ver. 4.20 FPSO -- INTACT AND DAMAGE STABILITY Page 18 * * * Intact Stability Parameters * * * Draft at no Heel .......... 32.81 Ft Displacement .............. 131670.1 S.Tons Center of Gravity (X,Y,Z) = 374.81; 0.00; 91.36 Ft Wind Speed ................ 100.00 Knot Wind Direction is Normal to Tilt Axis Range of Stability ........ 19.79 Deg Downflooding Angle ........ 17.19 Deg @ BOW PORTSIDE Weathertight Angle ........ 17.19 Deg @ BOW PORTSIDE ----------------------------------------------------------------------------------------------------------- /--Angles w.r.t.--/ Critical Yaw Angle /--- Angles ---/ /-- Yawed axis ---/ Downflood Of /- w.r.t. Ship-/ Righting Heeling /-- Center of Buoyancy--/ Heel Trim Height Tilt Axis Heel Trim Arm Arm LCB TCB VCB (Deg) (Deg) (Ft) (Deg) (Deg) (Deg) (Ft) (Ft) (Ft) (Ft) (Ft) ------------------- -------- -------- ---------------- ------- -------- -------------------------- 0.00 0.00 34.5( 1) 45.00 0.00 0.00 0.00 0.27 374.81 0.00 16.80 1.50 -1.50 31.5( 4) 45.00 2.12 0.00 0.00 0.29 374.81 -2.77 16.85 3.00 -3.00 28.5( 4) 45.00 4.24 0.00 0.02 0.31 374.82 -5.54 17.00 4.50 -4.50 25.5( 4) 45.00 6.36 0.01 0.07 0.34 374.85 -8.31 17.26 6.00 -5.98 22.5( 4) 45.00 8.47 0.01 0.17 0.36 374.92 -11.10 17.62 7.50 -7.46 19.4( 4) 45.00 10.56 0.01 0.33 0.38 375.02 -13.90 18.09 9.00 -8.91 16.4( 4) 45.00 12.64 0.02 0.56 0.41 375.19 -16.72 18.67 10.50 -10.35 13.3( 4) 45.00 14.71 0.02 0.90 0.43 375.41 -19.57 19.36 12.00 -11.77 10.3( 4) 45.00 16.75 0.02 1.29 0.46 375.68 -22.40 20.16 13.50 -13.17 7.4( 4) 45.00 18.78 0.02 1.63 0.49 375.90 -25.16 21.04 15.00 -14.55 4.5( 4) 45.00 20.78 0.03 1.96 0.52 376.12 -27.85 22.01 16.50 -15.92 1.5( 4) 45.00 22.77 0.05 1.99 0.54 376.10 -30.29 22.98 18.00 -17.28 -1.7( 4) 45.00 24.75 0.09 1.42 0.57 375.66 -32.28 23.86 19.50 -18.64 -5.0( 4) 45.00 26.73 0.15 0.30 0.60 374.83 -33.86 24.62 21.00 -20.00 -8.4( 4) 45.00 28.68 0.24 -1.23 0.63 373.73 -35.11 25.28
22.50 -21.33 -11.8( 4) 45.00 30.62 0.35 -3.03 0.65 372.44 -36.11 25.86 24.00 -22.65 -15.3( 4) 45.00 32.53 0.47 -5.02 0.68 371.06 -36.92 26.36 25.50 -23.94 -18.8( 4) 45.00 34.42 0.61 -7.12 0.70 369.62 -37.58 26.82 27.00 -25.21 -22.3( 4) 45.00 36.27 0.76 -9.29 0.72 368.17 -38.13 27.22 28.50 -26.44 -25.7( 4) 45.00 38.10 0.93 -11.47 0.75 366.74 -38.58 27.59 30.00 -27.64 -29.0( 4) 45.00 39.89 1.10 -13.65 0.77 365.36 -38.96 27.92 31.50 -28.80 -32.3( 4) 45.00 41.64 1.29 -15.80 0.79 364.05 -39.28 28.22 33.00 -29.92 -35.5( 4) 45.00 43.36 1.49 -17.90 0.81 362.82 -39.55 28.49 34.50 -31.00 -38.6( 4) 45.00 45.04 1.69 -19.94 0.83 361.68 -39.78 28.75 36.00 -32.03 -41.6( 4) 45.00 46.68 1.90 -21.91 0.84 360.64 -39.97 28.98 37.50 -33.03 -44.5( 4) 45.00 48.29 2.11 -23.80 0.86 359.70 -40.14 29.20 39.00 -33.98 -47.3( 4) 45.00 49.86 2.33 -25.61 0.88 358.87 -40.29 29.40 40.50 -34.89 -49.9( 4) 45.00 51.39 2.55 -27.34 0.89 358.15 -40.42 29.59 42.00 -35.75 -52.4( 4) 45.00 52.89 2.77 -28.99 0.91 357.53 -40.54 29.77 43.50 -36.58 -54.8( 4) 45.00 54.35 3.00 -30.57 0.92 357.02 -40.64 29.93 45.00 -37.36 -57.1( 4) 45.00 55.78 3.22 -32.06 0.93 356.61 -40.74 30.09 -----------------------------------------------------------------------------------------------------------
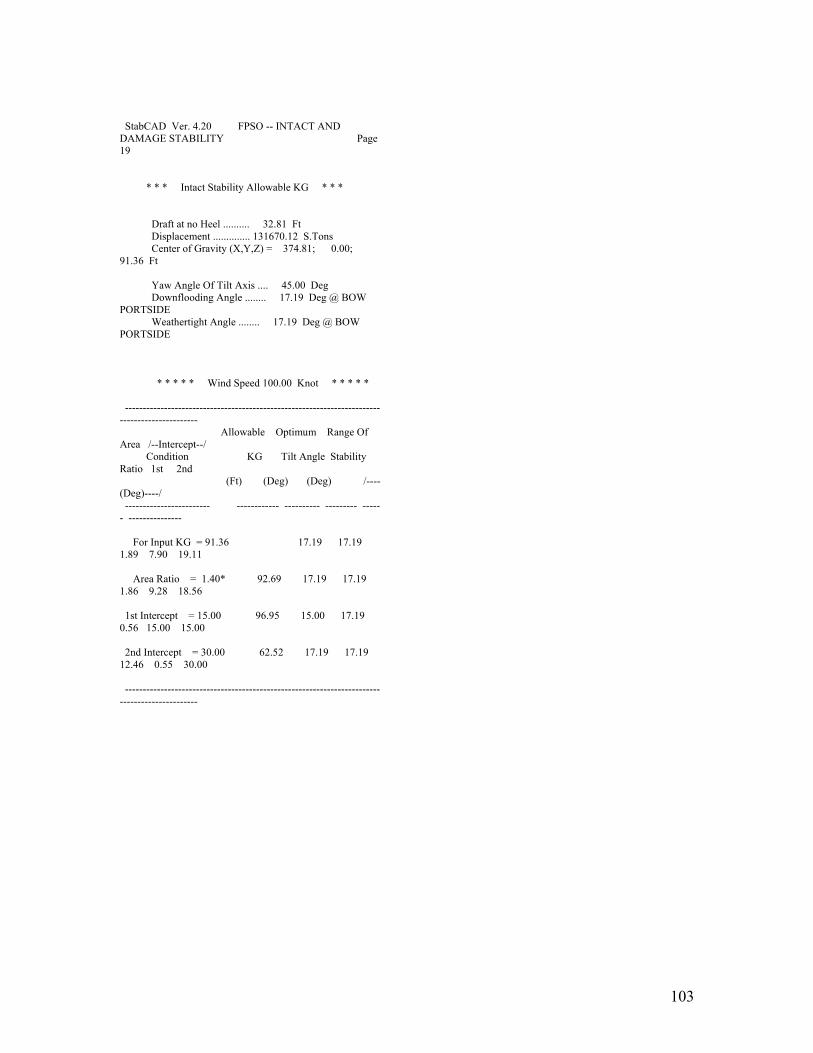
103
StabCAD Ver. 4.20 FPSO -- INTACT AND DAMAGE STABILITY Page 19 * * * Intact Stability Allowable KG * * * Draft at no Heel .......... 32.81 Ft Displacement .............. 131670.12 S.Tons Center of Gravity (X,Y,Z) = 374.81; 0.00; 91.36 Ft Yaw Angle Of Tilt Axis .... 45.00 Deg Downflooding Angle ........ 17.19 Deg @ BOW PORTSIDE Weathertight Angle ........ 17.19 Deg @ BOW PORTSIDE * * * * * Wind Speed 100.00 Knot * * * * * ---------------------------------------------------------------------------------------------- Allowable Optimum Range Of Area /--Intercept--/ Condition KG Tilt Angle Stability Ratio 1st 2nd (Ft) (Deg) (Deg) /----(Deg)----/ ------------------------ ------------ ---------- --------- ------ --------------- For Input KG = 91.36 17.19 17.19 1.89 7.90 19.11 Area Ratio = 1.40* 92.69 17.19 17.19 1.86 9.28 18.56 1st Intercept = 15.00 96.95 15.00 17.19 0.56 15.00 15.00 2nd Intercept = 30.00 62.52 17.19 17.19 12.46 0.55 30.00 ----------------------------------------------------------------------------------------------
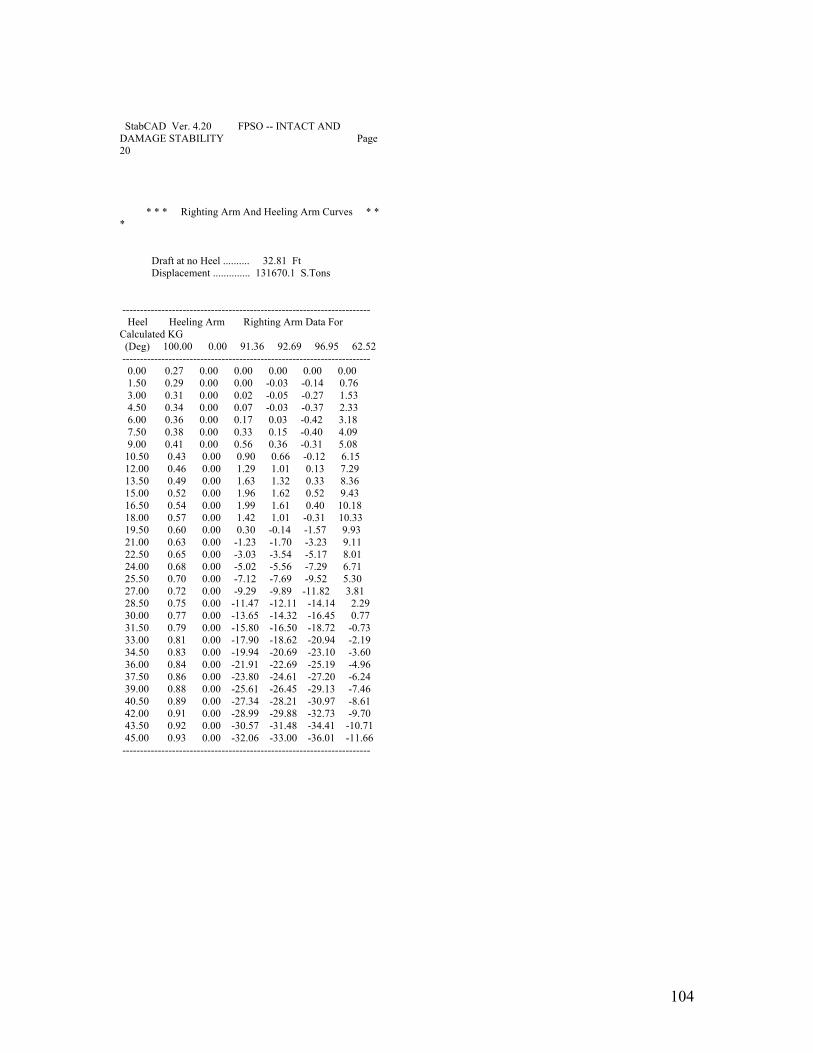
104
StabCAD Ver. 4.20 FPSO -- INTACT AND DAMAGE STABILITY Page 20 * * * Righting Arm And Heeling Arm Curves * * * Draft at no Heel .......... 32.81 Ft Displacement .............. 131670.1 S.Tons ---------------------------------------------------------------------- Heel Heeling Arm Righting Arm Data For Calculated KG (Deg) 100.00 0.00 91.36 92.69 96.95 62.52 ---------------------------------------------------------------------- 0.00 0.27 0.00 0.00 0.00 0.00 0.00 1.50 0.29 0.00 0.00 -0.03 -0.14 0.76 3.00 0.31 0.00 0.02 -0.05 -0.27 1.53 4.50 0.34 0.00 0.07 -0.03 -0.37 2.33 6.00 0.36 0.00 0.17 0.03 -0.42 3.18 7.50 0.38 0.00 0.33 0.15 -0.40 4.09 9.00 0.41 0.00 0.56 0.36 -0.31 5.08 10.50 0.43 0.00 0.90 0.66 -0.12 6.15 12.00 0.46 0.00 1.29 1.01 0.13 7.29 13.50 0.49 0.00 1.63 1.32 0.33 8.36 15.00 0.52 0.00 1.96 1.62 0.52 9.43 16.50 0.54 0.00 1.99 1.61 0.40 10.18 18.00 0.57 0.00 1.42 1.01 -0.31 10.33 19.50 0.60 0.00 0.30 -0.14 -1.57 9.93 21.00 0.63 0.00 -1.23 -1.70 -3.23 9.11 22.50 0.65 0.00 -3.03 -3.54 -5.17 8.01 24.00 0.68 0.00 -5.02 -5.56 -7.29 6.71 25.50 0.70 0.00 -7.12 -7.69 -9.52 5.30 27.00 0.72 0.00 -9.29 -9.89 -11.82 3.81 28.50 0.75 0.00 -11.47 -12.11 -14.14 2.29 30.00 0.77 0.00 -13.65 -14.32 -16.45 0.77 31.50 0.79 0.00 -15.80 -16.50 -18.72 -0.73 33.00 0.81 0.00 -17.90 -18.62 -20.94 -2.19 34.50 0.83 0.00 -19.94 -20.69 -23.10 -3.60 36.00 0.84 0.00 -21.91 -22.69 -25.19 -4.96 37.50 0.86 0.00 -23.80 -24.61 -27.20 -6.24 39.00 0.88 0.00 -25.61 -26.45 -29.13 -7.46 40.50 0.89 0.00 -27.34 -28.21 -30.97 -8.61 42.00 0.91 0.00 -28.99 -29.88 -32.73 -9.70 43.50 0.92 0.00 -30.57 -31.48 -34.41 -10.71 45.00 0.93 0.00 -32.06 -33.00 -36.01 -11.66 ----------------------------------------------------------------------
105
* * * KGCYCLE Iteration Printout * * * KG TYPE NO MIN 1 2 3 4 5 6 7 ALLOW KG 1 91.36 0.00 0.00 0.00 0.00 0.00 0.00 0.00 ALLOW KG 2 91.36 0.00 0.00 0.00 0.00 0.00 0.00 0.00

106
StabCAD Ver. 4.20 FPSO -- INTACT AND DAMAGE STABILITY Page 21 * * * Intact Stability Downflooding Point Table * * * Intact Draft .............. 32.81 Ft Displacement .............. 131670.1 S.Tons Center of Gravity (X,Y,Z) = 374.81; 0.00; 91.36 Ft Angle of Tilt Axis ........ 0.00 Deg Downflooding Points Height Above Water (Ft) -------------------------------------------- Downflooding Angle = 23.48 Deg @ BOW PORTSIDE Weathertight Angle = 23.48 Deg @ BOW PORTSIDE H E E L A N G L E S ------- ------- -------------------- --------------------------------------------------------------------------------------------- DF PT. Type Description 0.0 1.5 3.0 4.5 6.0 7.5 9.0 10.5 12.0 13.5 15.0 16.5 ------- ------- -------------------- --------------------------------------------------------------------------------------------- 1 Intact STERN STARBOARD 34.5 36.5 38.6 40.6 42.6 44.6 46.5 48.4 50.3 52.2 54.0 55.9 2 Intact STERN PORTSIDE 34.5 32.4 30.3 28.2 26.1 24.0 21.9 19.7 17.6 15.4 13.3 11.1 3 Intact BOW STARBOARD 34.5 36.5 38.5 40.5 42.5 44.4 46.3 48.2 50.0 51.8 53.5 55.2 4 Intact BOW PORTSIDE 34.5 32.4 30.3 28.2 26.0 23.9 21.7 19.5 17.2 15.0 12.7 10.5 ------- ------- -------------------- --------------------------------------------------------------------------------------------- H E E L A N G L E S ------- ------- -------------------- --------------------------------------------------------------------------------------------- DF PT. Type Description 18.0 19.5 21.0 22.5 24.0 25.5 27.0 28.5 30.0 31.5 33.0 34.5 ------- ------- -------------------- --------------------------------------------------------------------------------------------- 1 Intact STERN STARBOARD 57.7 59.4 61.2 63.0 64.6 66.3 67.9 69.4 70.9 72.4 73.8 75.2 2 Intact STERN PORTSIDE 9.0 6.9 4.8 2.7 0.6 -1.5 -3.6 -5.7 -7.8 -9.9 -12.0 -14.0 3 Intact BOW STARBOARD 56.9 58.6 60.2 61.8 63.2 64.6 66.0 67.3 68.5 69.7 70.9 72.0 4 Intact BOW PORTSIDE 8.2 6.0 3.8 1.5 -0.8 -3.2 -5.5 -7.9 -10.2 -12.6 -14.9 -17.2 ------- ------- -------------------- --------------------------------------------------------------------------------------------- H E E L A N G L E S ------- ------- -------------------- ----------------------------------------------------- DF PT. Type Description 36.0 37.5 39.0 40.5 42.0 43.5 45.0
------- ------- -------------------- ----------------------------------------------------- 1 Intact STERN STARBOARD 76.5 77.7 78.9 80.1 81.2 82.2 83.2 2 Intact STERN PORTSIDE -16.1 -18.1 -20.2 -22.2 -24.2 -26.2 -28.2 3 Intact BOW STARBOARD 73.0 74.0 75.0 75.9 76.7 77.5 78.3 4 Intact BOW PORTSIDE -19.5 -21.8 -24.1 -26.4 -28.6 -30.9 -33.1 ------- ------- -------------------- -----------------------------------------------------

107
StabCAD Ver. 4.20 FPSO -- INTACT AND DAMAGE STABILITY Page 22 * * * Intact Stability Parameters * * * Draft at no Heel .......... 32.81 Ft Displacement .............. 131670.1 S.Tons Center of Gravity (X,Y,Z) = 374.81; 0.00; 91.36 Ft Wind Speed ................ 100.00 Knot Wind Direction is Normal to Tilt Axis Range of Stability ........ 27.13 Deg Downflooding Angle ........ 23.48 Deg @ BOW PORTSIDE Weathertight Angle ........ 23.48 Deg @ BOW PORTSIDE ----------------------------------------------------------------------------------------------------------- /--Angles w.r.t.--/ Critical Yaw Angle /--- Angles ---/ /-- Yawed axis ---/ Downflood Of /- w.r.t. Ship-/ Righting Heeling /-- Center of Buoyancy--/ Heel Trim Height Tilt Axis Heel Trim Arm Arm LCB TCB VCB (Deg) (Deg) (Ft) (Deg) (Deg) (Deg) (Ft) (Ft) (Ft) (Ft) (Ft) ------------------- -------- -------- ---------------- ------- -------- -------------------------- 0.00 0.00 34.5( 1) 0.00 0.00 0.00 0.00 0.26 374.81 0.00 16.80 1.50 0.00 32.4( 4) 0.00 1.50 0.00 0.00 0.28 374.81 -1.96 16.82 3.00 0.00 30.3( 4) 0.00 3.00 0.00 0.01 0.30 374.81 -3.91 16.90 4.50 0.00 28.2( 4) 0.00 4.50 0.00 0.02 0.33 374.81 -5.87 17.03 6.00 -0.01 26.0( 4) 0.00 6.00 0.01 0.04 0.35 374.80 -7.84 17.21 7.50 -0.01 23.9( 4) 0.00 7.50 0.01 0.08 0.37 374.80 -9.82 17.44 9.00 -0.02 21.7( 4) 0.00 9.00 0.02 0.14 0.39 374.79 -11.81 17.73 10.50 -0.02 19.5( 4) 0.00 10.50 0.02 0.23 0.42 374.78 -13.82 18.08 12.00 -0.03 17.2( 4) 0.00 12.00 0.03 0.34 0.44 374.77 -15.85 18.48 13.50 -0.04 15.0( 4) 0.00 13.50 0.04 0.49 0.47 374.77 -17.90 18.94 15.00 -0.04 12.7( 4) 0.00 15.00 0.04 0.68 0.49 374.76 -19.97 19.47 16.50 -0.05 10.5( 4) 0.00 16.50 0.05 0.89 0.52 374.75 -22.06 20.06 18.00 -0.06 8.2( 4) 0.00 18.00 0.06 1.08 0.54 374.73 -24.10 20.69 19.50 -0.07 6.0( 4) 0.00 19.50 0.07 1.27 0.57 374.72 -26.13 21.38 21.00 -0.08 3.8( 4) 0.00 21.00 0.08 1.45 0.60 374.71 -28.13 22.12
22.50 -0.09 1.5( 4) 0.00 22.50 0.10 1.47 0.62 374.69 -29.97 22.85 24.00 -0.11 -0.8( 4) 0.00 24.00 0.12 1.24 0.65 374.67 -31.56 23.54 25.50 -0.13 -3.2( 4) 0.00 25.50 0.14 0.77 0.67 374.64 -32.91 24.16 27.00 -0.15 -5.5( 4) 0.00 27.00 0.17 0.08 0.70 374.62 -34.05 24.72 28.50 -0.17 -7.9( 4) 0.00 28.50 0.19 -0.79 0.72 374.59 -35.01 25.22 30.00 -0.19 -10.2( 4) 0.00 30.00 0.22 -1.81 0.75 374.56 -35.83 25.68 31.50 -0.21 -12.6( 4) 0.00 31.50 0.25 -2.94 0.77 374.54 -36.54 26.11 33.00 -0.23 -14.9( 4) 0.00 33.00 0.28 -4.17 0.79 374.51 -37.16 26.49 34.50 -0.25 -17.2( 4) 0.00 34.50 0.31 -5.48 0.81 374.48 -37.69 26.85 36.00 -0.27 -19.5( 4) 0.00 36.00 0.34 -6.85 0.83 374.46 -38.16 27.18 37.50 -0.29 -21.8( 4) 0.00 37.50 0.37 -8.28 0.85 374.43 -38.58 27.49 39.00 -0.31 -24.1( 4) 0.00 39.00 0.40 -9.75 0.87 374.41 -38.94 27.78 40.50 -0.33 -26.4( 4) 0.00 40.50 0.44 -11.26 0.89 374.39 -39.27 28.05 42.00 -0.35 -28.6( 4) 0.00 42.00 0.47 -12.79 0.91 374.36 -39.56 28.31 43.50 -0.37 -30.9( 4) 0.00 43.50 0.51 -14.35 0.92 374.34 -39.82 28.55 45.00 -0.39 -33.1( 4) 0.00 45.00 0.55 -15.93 0.94 374.32 -40.06 28.78 -----------------------------------------------------------------------------------------------------------

108
StabCAD Ver. 4.20 FPSO -- INTACT AND DAMAGE STABILITY Page 23 * * * Intact Stability Allowable KG * * * Draft at no Heel .......... 32.81 Ft Displacement .............. 131670.12 S.Tons Center of Gravity (X,Y,Z) = 374.81; 0.00; 91.36 Ft Yaw Angle Of Tilt Axis .... 0.00 Deg Downflooding Angle ........ 23.48 Deg @ BOW PORTSIDE Weathertight Angle ........ 23.48 Deg @ BOW PORTSIDE * * * * * Wind Speed 100.00 Knot * * * * * ---------------------------------------------------------------------------------------------- Allowable Optimum Range Of Area /--Intercept--/ Condition KG Tilt Angle Stability Ratio 1st 2nd (Ft) (Deg) (Deg) /----(Deg)----/ ------------------------ ------------ ---------- --------- ------ --------------- For Input KG = 91.36 23.48 23.48 1.21 13.18 25.70 Area Ratio = 1.40 90.94 23.48 23.48 1.40 12.12 26.09 1st Intercept = 15.00* 91.39 23.48 23.48 1.19 13.26 25.68 2nd Intercept = 30.00 86.25 23.48 23.48 3.54 3.38 30.00 ----------------------------------------------------------------------------------------------

109
StabCAD Ver. 4.20 FPSO -- INTACT AND DAMAGE STABILITY Page 24 * * * Righting Arm And Heeling Arm Curves * * * Draft at no Heel .......... 32.81 Ft Displacement .............. 131670.1 S.Tons ---------------------------------------------------------------------- Heel Heeling Arm Righting Arm Data For Calculated KG (Deg) 100.00 0.00 91.36 90.94 91.39 86.25 ---------------------------------------------------------------------- 0.00 0.26 0.00 0.00 0.00 0.00 0.00 1.50 0.28 0.00 0.00 0.01 0.00 0.13 3.00 0.30 0.00 0.01 0.03 0.00 0.27 4.50 0.33 0.00 0.02 0.05 0.02 0.42 6.00 0.35 0.00 0.04 0.09 0.04 0.58 7.50 0.37 0.00 0.08 0.14 0.08 0.75 9.00 0.39 0.00 0.14 0.21 0.14 0.94 10.50 0.42 0.00 0.23 0.30 0.22 1.16 12.00 0.44 0.00 0.34 0.43 0.34 1.41 13.50 0.47 0.00 0.49 0.59 0.49 1.69 15.00 0.49 0.00 0.68 0.79 0.68 2.01 16.50 0.52 0.00 0.89 1.01 0.88 2.34 18.00 0.54 0.00 1.08 1.21 1.07 2.66 19.50 0.57 0.00 1.27 1.41 1.26 2.97 21.00 0.60 0.00 1.45 1.60 1.44 3.28 22.50 0.62 0.00 1.47 1.63 1.46 3.42 24.00 0.65 0.00 1.24 1.42 1.23 3.32 25.50 0.67 0.00 0.77 0.95 0.76 2.97 27.00 0.70 0.00 0.08 0.27 0.07 2.40 28.50 0.72 0.00 -0.79 -0.59 -0.81 1.65 30.00 0.75 0.00 -1.81 -1.60 -1.82 0.75 31.50 0.77 0.00 -2.94 -2.72 -2.96 -0.27 33.00 0.79 0.00 -4.17 -3.94 -4.19 -1.39 34.50 0.81 0.00 -5.48 -5.24 -5.50 -2.58 36.00 0.83 0.00 -6.85 -6.60 -6.87 -3.85 37.50 0.85 0.00 -8.28 -8.02 -8.30 -5.17 39.00 0.87 0.00 -9.75 -9.48 -9.77 -6.53 40.50 0.89 0.00 -11.26 -10.98 -11.28 -7.94 42.00 0.91 0.00 -12.79 -12.51 -12.81 -9.37 43.50 0.92 0.00 -14.35 -14.06 -14.37 -10.83 45.00 0.94 0.00 -15.93 -15.63 -15.95 -12.31 ----------------------------------------------------------------------

110
StabCAD Ver. 4.20 FPSO -- INTACT AND DAMAGE STABILITY Page 25 * * * Damage Stability Reference Point Table * * * Damaged Body ID. No. 19 Title : SIDE BALLAST Permeability = 98.0 % Intact Draft .............. 32.81 Ft Displacement .............. 131670.1 S.Tons Center of Gravity (X,Y,Z) = 374.81; 0.00; 57.58 Ft Angle of Tilt Axis ........ 0.00 Deg Downflooding Points Height Above Water (Ft) -------------------------------------------- No Downflooding Point was submerged .. No Weathertight Point was submerged .. H E E L A N G L E S ------- ------- -------------------- --------------------------------------------------------------------------------------------- DF PT. Type Description 0.0 1.5 3.0 4.5 6.0 7.5 9.0 10.5 12.0 13.5 15.0 16.5 ------- ------- -------------------- --------------------------------------------------------------------------------------------- ------- ------- -------------------- --------------------------------------------------------------------------------------------- H E E L A N G L E S ------- ------- -------------------- --------------------------------------------------------------------------------------------- DF PT. Type Description 18.0 19.5 21.0 22.5 24.0 25.5 27.0 28.5 30.0 31.5 33.0 34.5 ------- ------- -------------------- --------------------------------------------------------------------------------------------- ------- ------- -------------------- --------------------------------------------------------------------------------------------- H E E L A N G L E S ------- ------- -------------------- ----------------------------------------------------- DF PT. Type Description 36.0 37.5 39.0 40.5 42.0 43.5 45.0 ------- ------- -------------------- ----------------------------------------------------- ------- ------- -------------------- -----------------------------------------------------
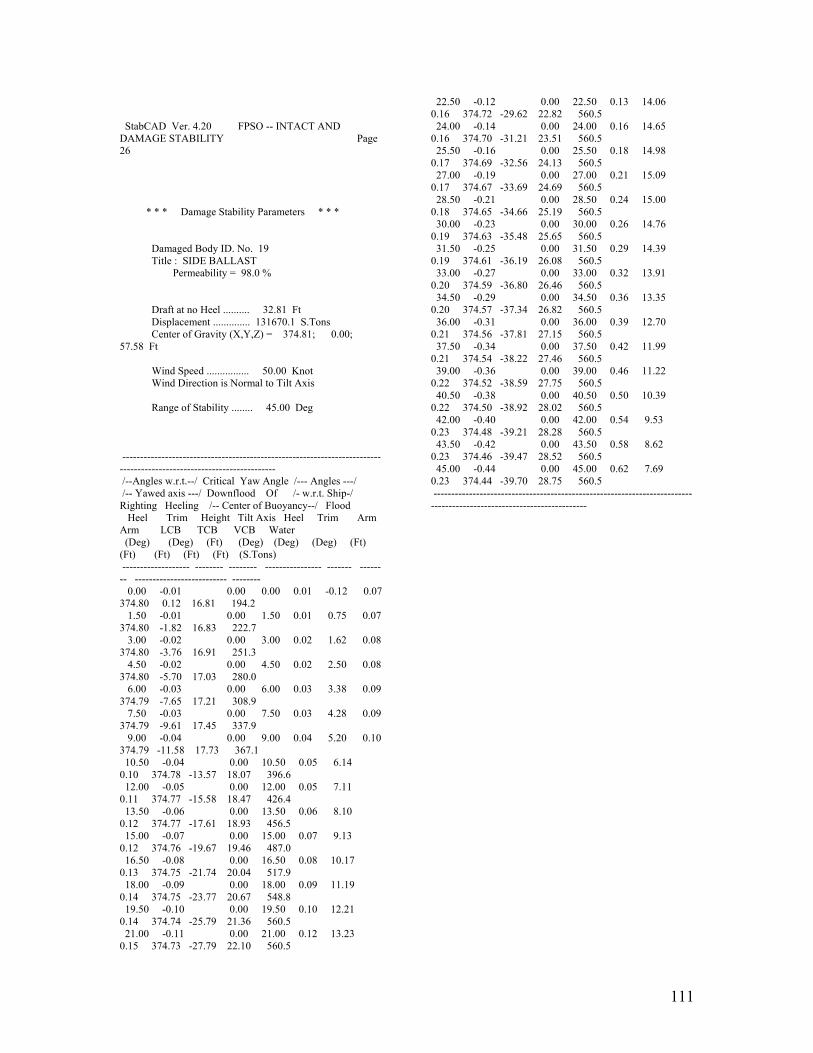
111
StabCAD Ver. 4.20 FPSO -- INTACT AND DAMAGE STABILITY Page 26 * * * Damage Stability Parameters * * * Damaged Body ID. No. 19 Title : SIDE BALLAST Permeability = 98.0 % Draft at no Heel .......... 32.81 Ft Displacement .............. 131670.1 S.Tons Center of Gravity (X,Y,Z) = 374.81; 0.00; 57.58 Ft Wind Speed ................ 50.00 Knot Wind Direction is Normal to Tilt Axis Range of Stability ........ 45.00 Deg --------------------------------------------------------------------------------------------------------------------- /--Angles w.r.t.--/ Critical Yaw Angle /--- Angles ---/ /-- Yawed axis ---/ Downflood Of /- w.r.t. Ship-/ Righting Heeling /-- Center of Buoyancy--/ Flood Heel Trim Height Tilt Axis Heel Trim Arm Arm LCB TCB VCB Water (Deg) (Deg) (Ft) (Deg) (Deg) (Deg) (Ft) (Ft) (Ft) (Ft) (Ft) (S.Tons) ------------------- -------- -------- ---------------- ------- -------- -------------------------- -------- 0.00 -0.01 0.00 0.00 0.01 -0.12 0.07 374.80 0.12 16.81 194.2 1.50 -0.01 0.00 1.50 0.01 0.75 0.07 374.80 -1.82 16.83 222.7 3.00 -0.02 0.00 3.00 0.02 1.62 0.08 374.80 -3.76 16.91 251.3 4.50 -0.02 0.00 4.50 0.02 2.50 0.08 374.80 -5.70 17.03 280.0 6.00 -0.03 0.00 6.00 0.03 3.38 0.09 374.79 -7.65 17.21 308.9 7.50 -0.03 0.00 7.50 0.03 4.28 0.09 374.79 -9.61 17.45 337.9 9.00 -0.04 0.00 9.00 0.04 5.20 0.10 374.79 -11.58 17.73 367.1 10.50 -0.04 0.00 10.50 0.05 6.14 0.10 374.78 -13.57 18.07 396.6 12.00 -0.05 0.00 12.00 0.05 7.11 0.11 374.77 -15.58 18.47 426.4 13.50 -0.06 0.00 13.50 0.06 8.10 0.12 374.77 -17.61 18.93 456.5 15.00 -0.07 0.00 15.00 0.07 9.13 0.12 374.76 -19.67 19.46 487.0 16.50 -0.08 0.00 16.50 0.08 10.17 0.13 374.75 -21.74 20.04 517.9 18.00 -0.09 0.00 18.00 0.09 11.19 0.14 374.75 -23.77 20.67 548.8 19.50 -0.10 0.00 19.50 0.10 12.21 0.14 374.74 -25.79 21.36 560.5 21.00 -0.11 0.00 21.00 0.12 13.23 0.15 374.73 -27.79 22.10 560.5
22.50 -0.12 0.00 22.50 0.13 14.06 0.16 374.72 -29.62 22.82 560.5 24.00 -0.14 0.00 24.00 0.16 14.65 0.16 374.70 -31.21 23.51 560.5 25.50 -0.16 0.00 25.50 0.18 14.98 0.17 374.69 -32.56 24.13 560.5 27.00 -0.19 0.00 27.00 0.21 15.09 0.17 374.67 -33.69 24.69 560.5 28.50 -0.21 0.00 28.50 0.24 15.00 0.18 374.65 -34.66 25.19 560.5 30.00 -0.23 0.00 30.00 0.26 14.76 0.19 374.63 -35.48 25.65 560.5 31.50 -0.25 0.00 31.50 0.29 14.39 0.19 374.61 -36.19 26.08 560.5 33.00 -0.27 0.00 33.00 0.32 13.91 0.20 374.59 -36.80 26.46 560.5 34.50 -0.29 0.00 34.50 0.36 13.35 0.20 374.57 -37.34 26.82 560.5 36.00 -0.31 0.00 36.00 0.39 12.70 0.21 374.56 -37.81 27.15 560.5 37.50 -0.34 0.00 37.50 0.42 11.99 0.21 374.54 -38.22 27.46 560.5 39.00 -0.36 0.00 39.00 0.46 11.22 0.22 374.52 -38.59 27.75 560.5 40.50 -0.38 0.00 40.50 0.50 10.39 0.22 374.50 -38.92 28.02 560.5 42.00 -0.40 0.00 42.00 0.54 9.53 0.23 374.48 -39.21 28.28 560.5 43.50 -0.42 0.00 43.50 0.58 8.62 0.23 374.46 -39.47 28.52 560.5 45.00 -0.44 0.00 45.00 0.62 7.69 0.23 374.44 -39.70 28.75 560.5 ---------------------------------------------------------------------------------------------------------------------

112
StabCAD Ver. 4.20 FPSO -- INTACT AND DAMAGE STABILITY Page 27 * * * Damage Stability Allowable KG * * * Damaged Body ID. No. 19 Title : SIDE BALLAST Permeability = 98.0 % Draft at no Heel .......... 32.81 Ft Displacement .............. 131670.12 S.Tons Center of Gravity (X,Y,Z) = 374.81; 0.00; 57.58 Ft Yaw Angle Of Tilt Axis .... 0.00 Deg No Downflooding Point was submerged .. No Weathertight Point was submerged .. * * * * * Wind Speed 50.00 Knot * * * * * -------------------------------------------------------------------------------------------------------------- Allowable Optimum Range Of Static /---Intercept---/ R.O.S. Condition To Satisfy KG Tilt Angle Stability Angle 1st 2nd 1st-2nd/DF (Ft) (Deg) (Deg) (Deg) /-----(Deg)-----/ (Deg) ------------------------- ------------ ---------- --------- --------- ----------------- ---------- For Input KG = 57.58 44.79 0.21 0.32 45.00 44.68 Heeling Arm = Righting Arm 94.07 21.00 3.93 19.08 21.00 Static Angle = 15.00 92.85 15.00 9.90 15.00 16.23 24.41 8.18 Area Ratio = 1.00 93.79 21.75 5.66 17.93 19.71 22.75 3.05 RM/HM Ratio = 2.00 93.64 21.00 6.52 17.38 19.11 23.04 3.93 --------------------------------------------------------------------------------------------------------------

113
StabCAD Ver. 4.20 FPSO -- INTACT AND DAMAGE STABILITY Page 28 * * * Righting Arm And Heeling Arm Curves * * * Draft at no Heel .......... 32.81 Ft Displacement .............. 131670.1 S.Tons -------------------------------------------------------------------- Heel Heeling Arm Righting Arm Data For Calculated KG ........ (Deg) 50.00 57.58 94.07 92.85 93.79 93.64 -------------------------------------------------------------------- 0.00 0.07 -0.12 -0.12 -0.12 -0.12 -0.12 1.50 0.07 0.75 -0.21 -0.18 -0.20 -0.20 3.00 0.08 1.62 -0.29 -0.23 -0.28 -0.27 4.50 0.08 2.50 -0.37 -0.27 -0.35 -0.33 6.00 0.09 3.38 -0.43 -0.30 -0.40 -0.39 7.50 0.09 4.28 -0.48 -0.32 -0.44 -0.42 9.00 0.10 5.20 -0.51 -0.32 -0.46 -0.44 10.50 0.10 6.14 -0.51 -0.29 -0.46 -0.43 12.00 0.11 7.11 -0.48 -0.23 -0.42 -0.39 13.50 0.12 8.10 -0.42 -0.13 -0.35 -0.32 15.00 0.12 9.13 -0.32 0.00 -0.24 -0.21 16.50 0.13 10.17 -0.19 0.16 -0.11 -0.07 18.00 0.14 11.19 -0.08 0.30 0.01 0.05 19.50 0.14 12.21 0.03 0.44 0.13 0.17 21.00 0.15 13.23 0.15 0.59 0.25 0.30 22.50 0.16 14.06 0.10 0.56 0.21 0.26 24.00 0.16 14.65 -0.19 0.30 -0.08 -0.02 25.50 0.17 14.98 -0.73 -0.20 -0.61 -0.54 27.00 0.17 15.09 -1.48 -0.93 -1.35 -1.29 28.50 0.18 15.00 -2.41 -1.83 -2.28 -2.21 30.00 0.19 14.76 -3.49 -2.88 -3.34 -3.27 31.50 0.19 14.39 -4.68 -4.04 -4.53 -4.45 33.00 0.20 13.91 -5.96 -5.30 -5.81 -5.73 34.50 0.20 13.35 -7.32 -6.63 -7.16 -7.08 36.00 0.21 12.70 -8.75 -8.03 -8.58 -8.50 37.50 0.21 11.99 -10.23 -9.49 -10.06 -9.97 39.00 0.22 11.22 -11.75 -10.98 -11.57 -11.48 40.50 0.22 10.39 -13.30 -12.51 -13.12 -13.03 42.00 0.23 9.53 -14.89 -14.07 -14.70 -14.60 43.50 0.23 8.62 -16.49 -15.66 -16.30 -16.20 45.00 0.23 7.69 -18.12 -17.26 -17.92 -17.82 --------------------------------------------------------------------

114
StabCAD Ver. 4.20 FPSO -- INTACT AND DAMAGE STABILITY Page 29 * * * Damage Stability Reference Point Table * * * Damaged Body ID. No. 19 Title : SIDE BALLAST Permeability = 98.0 % Intact Draft .............. 32.81 Ft Displacement .............. 131670.1 S.Tons Center of Gravity (X,Y,Z) = 374.81; 0.00; 57.58 Ft Angle of Tilt Axis ........ 15.00 Deg Downflooding Points Height Above Water (Ft) -------------------------------------------- No Downflooding Point was submerged .. No Weathertight Point was submerged .. H E E L A N G L E S ------- ------- -------------------- --------------------------------------------------------------------------------------------- DF PT. Type Description 0.0 1.5 3.0 4.5 6.0 7.5 9.0 10.5 12.0 13.5 15.0 16.5 ------- ------- -------------------- --------------------------------------------------------------------------------------------- ------- ------- -------------------- --------------------------------------------------------------------------------------------- H E E L A N G L E S ------- ------- -------------------- --------------------------------------------------------------------------------------------- DF PT. Type Description 18.0 19.5 21.0 22.5 24.0 25.5 27.0 28.5 30.0 31.5 33.0 34.5 ------- ------- -------------------- --------------------------------------------------------------------------------------------- ------- ------- -------------------- --------------------------------------------------------------------------------------------- H E E L A N G L E S ------- ------- -------------------- ----------------------------------------------------- DF PT. Type Description 36.0 37.5 39.0 40.5 42.0 43.5 45.0 ------- ------- -------------------- ----------------------------------------------------- ------- ------- -------------------- -----------------------------------------------------

115
StabCAD Ver. 4.20 FPSO -- INTACT AND DAMAGE STABILITY Page 30 * * * Damage Stability Parameters * * * Damaged Body ID. No. 19 Title : SIDE BALLAST Permeability = 98.0 % Draft at no Heel .......... 32.81 Ft Displacement .............. 131670.1 S.Tons Center of Gravity (X,Y,Z) = 374.81; 0.00; 57.58 Ft Wind Speed ................ 50.00 Knot Wind Direction is Normal to Tilt Axis Range of Stability ........ 45.00 Deg --------------------------------------------------------------------------------------------------------------------- /--Angles w.r.t.--/ Critical Yaw Angle /--- Angles ---/ /-- Yawed axis ---/ Downflood Of /- w.r.t. Ship-/ Righting Heeling /-- Center of Buoyancy--/ Flood Heel Trim Height Tilt Axis Heel Trim Arm Arm LCB TCB VCB Water (Deg) (Deg) (Ft) (Deg) (Deg) (Deg) (Ft) (Ft) (Ft) (Ft) (Ft) (S.Tons) ------------------- -------- -------- ---------------- ------- -------- -------------------------- -------- 0.00 -0.01 15.00 0.00 0.01 -0.12 0.07 374.77 0.11 16.81 194.3 1.50 -0.41 15.00 1.55 0.01 0.81 0.08 375.02 -1.89 16.83 223.4 3.00 -0.80 15.00 3.11 0.00 1.74 0.08 375.26 -3.89 16.91 252.6 4.50 -1.20 15.00 4.66 0.00 2.68 0.09 375.51 -5.90 17.05 281.9 6.00 -1.60 15.00 6.21 -0.01 3.63 0.09 375.75 -7.92 17.24 311.3 7.50 -1.99 15.00 7.76 -0.01 4.60 0.10 376.00 -9.95 17.49 340.9 9.00 -2.39 15.00 9.31 -0.01 5.58 0.10 376.25 -12.00 17.80 370.7 10.50 -2.78 15.00 10.86 -0.02 6.59 0.11 376.50 -14.06 18.17 400.8 12.00 -3.17 15.00 12.41 -0.02 7.63 0.12 376.76 -16.14 18.59 431.1 13.50 -3.56 15.00 13.95 -0.02 8.70 0.12 377.01 -18.24 19.09 461.9 15.00 -3.95 15.00 15.50 -0.02 9.81 0.13 377.28 -20.38 19.65 493.0 16.50 -4.34 15.00 17.04 -0.02 10.91 0.13 377.53 -22.50 20.27 524.3 18.00 -4.72 15.00 18.59 -0.01 11.98 0.14 377.77 -24.58 20.94 554.2 19.50 -5.10 15.00 20.13 -0.01 13.06 0.15 378.01 -26.65 21.67 560.5 21.00 -5.47 15.00 21.67 -0.01 14.08 0.15 378.22 -28.67 22.43 560.5
22.50 -5.85 15.00 23.21 0.00 14.84 0.16 378.36 -30.44 23.16 560.5 24.00 -6.23 15.00 24.75 0.01 15.32 0.17 378.43 -31.95 23.84 560.5 25.50 -6.60 15.00 26.29 0.02 15.53 0.17 378.43 -33.22 24.44 560.5 27.00 -6.97 15.00 27.82 0.04 15.52 0.18 378.36 -34.28 24.98 560.5 28.50 -7.34 15.00 29.35 0.06 15.32 0.19 378.25 -35.18 25.47 560.5 30.00 -7.71 15.00 30.89 0.09 14.98 0.19 378.11 -35.95 25.92 560.5 31.50 -8.07 15.00 32.41 0.12 14.51 0.20 377.93 -36.61 26.33 560.5 33.00 -8.43 15.00 33.94 0.15 13.94 0.20 377.74 -37.18 26.70 560.5 34.50 -8.78 15.00 35.47 0.19 13.28 0.21 377.52 -37.68 27.05 560.5 36.00 -9.13 15.00 36.99 0.22 12.55 0.21 377.29 -38.12 27.37 560.5 37.50 -9.48 15.00 38.51 0.26 11.76 0.22 377.06 -38.50 27.67 560.5 39.00 -9.81 15.00 40.02 0.31 10.91 0.22 376.81 -38.84 27.95 560.5 40.50 -10.14 15.00 41.54 0.36 10.02 0.23 376.56 -39.15 28.21 560.5 42.00 -10.47 15.00 43.05 0.41 9.09 0.23 376.31 -39.42 28.46 560.5 43.50 -10.79 15.00 44.56 0.46 8.13 0.23 376.06 -39.66 28.69 560.5 45.00 -11.10 15.00 46.06 0.52 7.14 0.24 375.81 -39.87 28.91 560.5 ---------------------------------------------------------------------------------------------------------------------
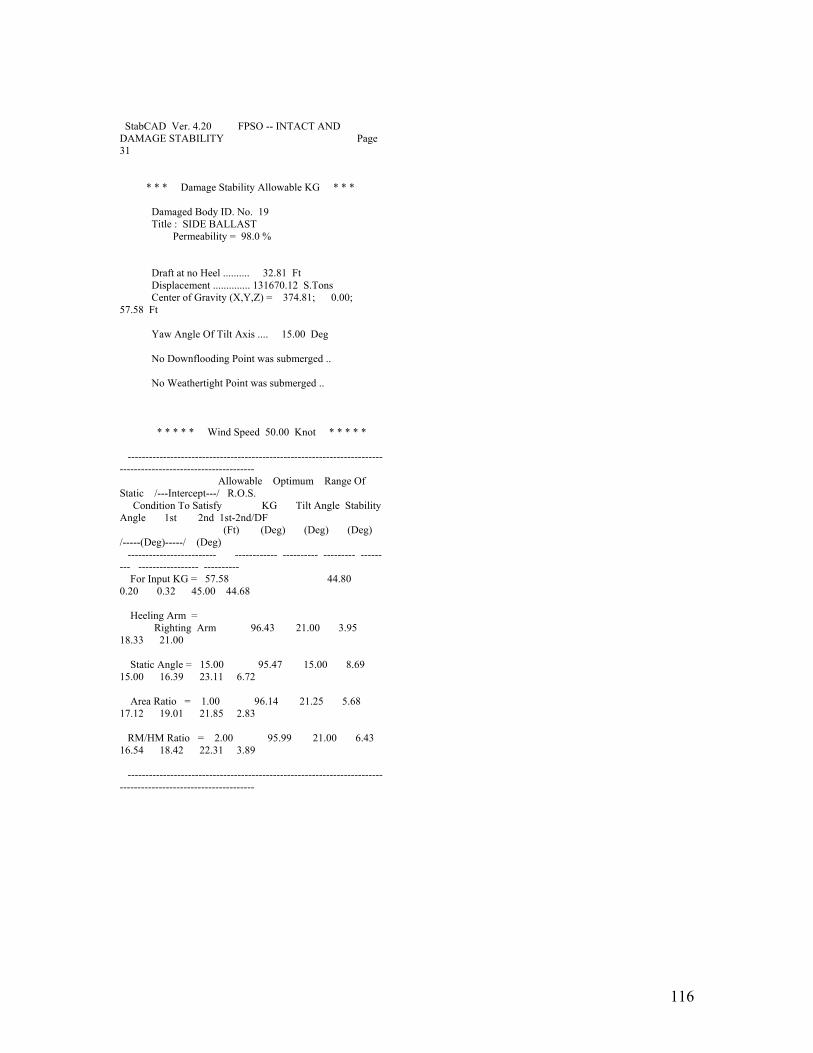
116
StabCAD Ver. 4.20 FPSO -- INTACT AND DAMAGE STABILITY Page 31 * * * Damage Stability Allowable KG * * * Damaged Body ID. No. 19 Title : SIDE BALLAST Permeability = 98.0 % Draft at no Heel .......... 32.81 Ft Displacement .............. 131670.12 S.Tons Center of Gravity (X,Y,Z) = 374.81; 0.00; 57.58 Ft Yaw Angle Of Tilt Axis .... 15.00 Deg No Downflooding Point was submerged .. No Weathertight Point was submerged .. * * * * * Wind Speed 50.00 Knot * * * * * -------------------------------------------------------------------------------------------------------------- Allowable Optimum Range Of Static /---Intercept---/ R.O.S. Condition To Satisfy KG Tilt Angle Stability Angle 1st 2nd 1st-2nd/DF (Ft) (Deg) (Deg) (Deg) /-----(Deg)-----/ (Deg) ------------------------- ------------ ---------- --------- --------- ----------------- ---------- For Input KG = 57.58 44.80 0.20 0.32 45.00 44.68 Heeling Arm = Righting Arm 96.43 21.00 3.95 18.33 21.00 Static Angle = 15.00 95.47 15.00 8.69 15.00 16.39 23.11 6.72 Area Ratio = 1.00 96.14 21.25 5.68 17.12 19.01 21.85 2.83 RM/HM Ratio = 2.00 95.99 21.00 6.43 16.54 18.42 22.31 3.89 --------------------------------------------------------------------------------------------------------------
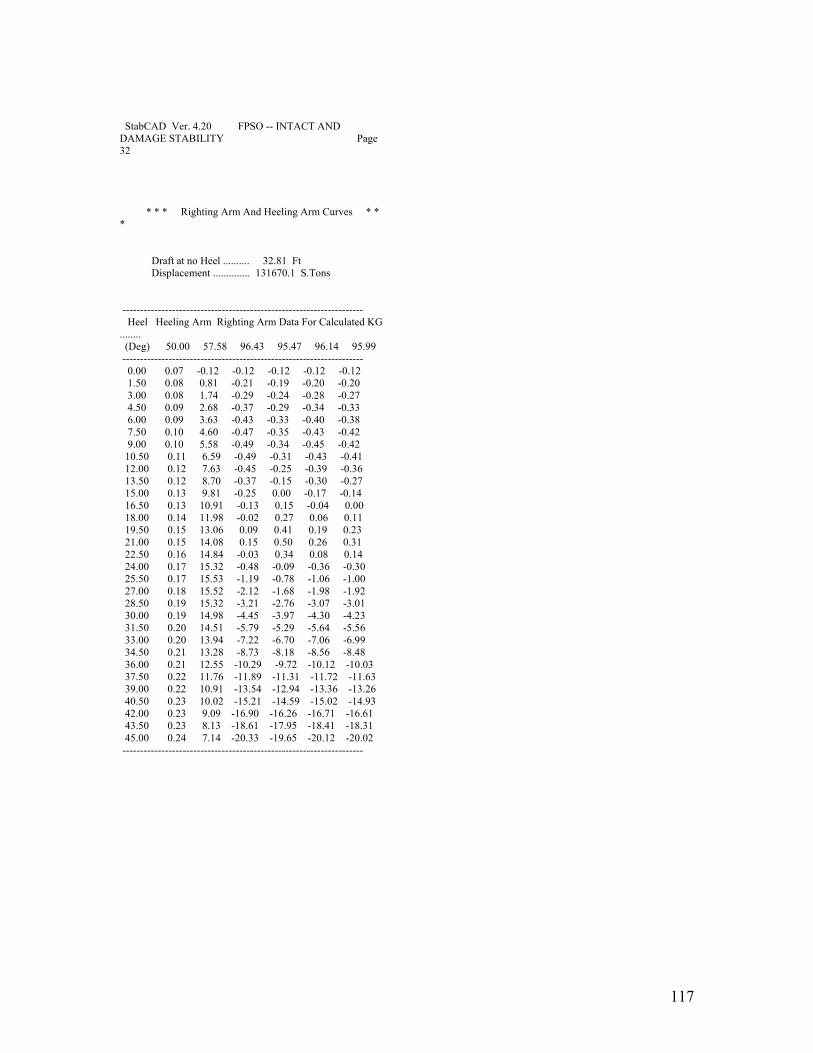
117
StabCAD Ver. 4.20 FPSO -- INTACT AND DAMAGE STABILITY Page 32 * * * Righting Arm And Heeling Arm Curves * * * Draft at no Heel .......... 32.81 Ft Displacement .............. 131670.1 S.Tons -------------------------------------------------------------------- Heel Heeling Arm Righting Arm Data For Calculated KG ........ (Deg) 50.00 57.58 96.43 95.47 96.14 95.99 -------------------------------------------------------------------- 0.00 0.07 -0.12 -0.12 -0.12 -0.12 -0.12 1.50 0.08 0.81 -0.21 -0.19 -0.20 -0.20 3.00 0.08 1.74 -0.29 -0.24 -0.28 -0.27 4.50 0.09 2.68 -0.37 -0.29 -0.34 -0.33 6.00 0.09 3.63 -0.43 -0.33 -0.40 -0.38 7.50 0.10 4.60 -0.47 -0.35 -0.43 -0.42 9.00 0.10 5.58 -0.49 -0.34 -0.45 -0.42 10.50 0.11 6.59 -0.49 -0.31 -0.43 -0.41 12.00 0.12 7.63 -0.45 -0.25 -0.39 -0.36 13.50 0.12 8.70 -0.37 -0.15 -0.30 -0.27 15.00 0.13 9.81 -0.25 0.00 -0.17 -0.14 16.50 0.13 10.91 -0.13 0.15 -0.04 0.00 18.00 0.14 11.98 -0.02 0.27 0.06 0.11 19.50 0.15 13.06 0.09 0.41 0.19 0.23 21.00 0.15 14.08 0.15 0.50 0.26 0.31 22.50 0.16 14.84 -0.03 0.34 0.08 0.14 24.00 0.17 15.32 -0.48 -0.09 -0.36 -0.30 25.50 0.17 15.53 -1.19 -0.78 -1.06 -1.00 27.00 0.18 15.52 -2.12 -1.68 -1.98 -1.92 28.50 0.19 15.32 -3.21 -2.76 -3.07 -3.01 30.00 0.19 14.98 -4.45 -3.97 -4.30 -4.23 31.50 0.20 14.51 -5.79 -5.29 -5.64 -5.56 33.00 0.20 13.94 -7.22 -6.70 -7.06 -6.99 34.50 0.21 13.28 -8.73 -8.18 -8.56 -8.48 36.00 0.21 12.55 -10.29 -9.72 -10.12 -10.03 37.50 0.22 11.76 -11.89 -11.31 -11.72 -11.63 39.00 0.22 10.91 -13.54 -12.94 -13.36 -13.26 40.50 0.23 10.02 -15.21 -14.59 -15.02 -14.93 42.00 0.23 9.09 -16.90 -16.26 -16.71 -16.61 43.50 0.23 8.13 -18.61 -17.95 -18.41 -18.31 45.00 0.24 7.14 -20.33 -19.65 -20.12 -20.02 --------------------------------------------------------------------

118
StabCAD Ver. 4.20 FPSO -- INTACT AND DAMAGE STABILITY Page 33 * * * Damage Stability Reference Point Table * * * Damaged Body ID. No. 19 Title : SIDE BALLAST Permeability = 98.0 % Intact Draft .............. 32.81 Ft Displacement .............. 131670.1 S.Tons Center of Gravity (X,Y,Z) = 374.81; 0.00; 57.58 Ft Angle of Tilt Axis ........ 210.00 Deg Downflooding Points Height Above Water (Ft) -------------------------------------------- No Downflooding Point was submerged .. No Weathertight Point was submerged .. H E E L A N G L E S ------- ------- -------------------- --------------------------------------------------------------------------------------------- DF PT. Type Description 0.0 1.5 3.0 4.5 6.0 7.5 9.0 10.5 12.0 13.5 15.0 16.5 ------- ------- -------------------- --------------------------------------------------------------------------------------------- ------- ------- -------------------- --------------------------------------------------------------------------------------------- H E E L A N G L E S ------- ------- -------------------- --------------------------------------------------------------------------------------------- DF PT. Type Description 18.0 19.5 21.0 22.5 24.0 25.5 27.0 28.5 30.0 31.5 33.0 34.5 ------- ------- -------------------- --------------------------------------------------------------------------------------------- ------- ------- -------------------- --------------------------------------------------------------------------------------------- H E E L A N G L E S ------- ------- -------------------- ----------------------------------------------------- DF PT. Type Description 36.0 37.5 39.0 40.5 42.0 43.5 45.0 ------- ------- -------------------- ----------------------------------------------------- ------- ------- -------------------- -----------------------------------------------------

119
StabCAD Ver. 4.20 FPSO -- INTACT AND DAMAGE STABILITY Page 34 * * * Damage Stability Parameters * * * Damaged Body ID. No. 19 Title : SIDE BALLAST Permeability = 98.0 % Draft at no Heel .......... 32.81 Ft Displacement .............. 131670.1 S.Tons Center of Gravity (X,Y,Z) = 374.81; 0.00; 57.58 Ft Wind Speed ................ 50.00 Knot Wind Direction is Normal to Tilt Axis Range of Stability ........ 45.00 Deg --------------------------------------------------------------------------------------------------------------------- /--Angles w.r.t.--/ Critical Yaw Angle /--- Angles ---/ /-- Yawed axis ---/ Downflood Of /- w.r.t. Ship-/ Righting Heeling /-- Center of Buoyancy--/ Flood Heel Trim Height Tilt Axis Heel Trim Arm Arm LCB TCB VCB Water (Deg) (Deg) (Ft) (Deg) (Deg) (Deg) (Ft) (Ft) (Ft) (Ft) (Ft) (S.Tons) ------------------- -------- -------- ---------------- ------- -------- -------------------------- -------- 0.00 0.02 210.00 0.01 0.01 0.13 0.07 374.74 0.11 16.81 194.5 1.50 -0.83 210.00 -1.71 0.03 1.28 0.08 374.15 2.33 16.84 162.7 3.00 -1.67 210.00 -3.43 0.06 2.44 0.08 373.56 4.55 16.94 131.0 4.50 -2.50 210.00 -5.15 0.08 3.60 0.09 372.96 6.77 17.11 99.2 6.00 -3.34 210.00 -6.86 0.10 4.77 0.09 372.37 9.00 17.34 67.3 7.50 -4.17 210.00 -8.57 0.13 5.96 0.10 371.77 11.25 17.65 35.3 9.00 -4.99 210.00 -10.28 0.15 7.17 0.11 371.16 13.51 18.02 3.8 10.50 -5.80 210.00 -11.98 0.18 8.43 0.11 370.54 15.80 18.48 0.0 12.00 -6.61 210.00 -13.67 0.21 9.73 0.12 369.90 18.11 19.01 0.0 13.50 -7.40 210.00 -15.36 0.25 11.06 0.13 369.26 20.45 19.61 0.0 15.00 -8.19 210.00 -17.04 0.28 12.38 0.13 368.64 22.76 20.29 0.0 16.50 -8.97 210.00 -18.72 0.32 13.65 0.14 368.04 25.03 21.03 0.0 18.00 -9.74 210.00 -20.39 0.35 14.89 0.15 367.48 27.26 21.82 0.0 19.50 -10.49 210.00 -22.04 0.40 15.96 0.15 367.01 29.33 22.63 0.0 21.00 -11.23 210.00 -23.69 0.45 16.69 0.16 366.71 31.12 23.38 0.0
22.50 -11.95 210.00 -25.33 0.50 17.09 0.17 366.57 32.62 24.07 0.0 24.00 -12.67 210.00 -26.96 0.55 17.18 0.17 366.59 33.87 24.68 0.0 25.50 -13.38 210.00 -28.58 0.59 17.01 0.18 366.72 34.91 25.23 0.0 27.00 -14.08 210.00 -30.20 0.63 16.66 0.18 366.96 35.79 25.72 0.0 28.50 -14.77 210.00 -31.81 0.67 16.14 0.19 367.27 36.54 26.17 0.0 30.00 -15.46 210.00 -33.41 0.70 15.50 0.20 367.63 37.19 26.57 0.0 31.50 -16.13 210.00 -35.00 0.72 14.75 0.20 368.04 37.74 26.94 0.0 33.00 -16.79 210.00 -36.59 0.75 13.93 0.21 368.48 38.23 27.29 0.0 34.50 -17.44 210.00 -38.16 0.77 13.03 0.21 368.94 38.65 27.61 0.0 36.00 -18.08 210.00 -39.73 0.79 12.08 0.22 369.42 39.02 27.90 0.0 37.50 -18.70 210.00 -41.28 0.81 11.09 0.22 369.91 39.35 28.17 0.0 39.00 -19.31 210.00 -42.82 0.82 10.06 0.23 370.40 39.64 28.43 0.0 40.50 -19.91 210.00 -44.36 0.83 9.00 0.23 370.88 39.90 28.67 0.0 42.00 -20.49 210.00 -45.88 0.84 7.92 0.23 371.37 40.14 28.90 0.0 43.50 -21.05 210.00 -47.39 0.85 6.83 0.24 371.84 40.35 29.11 0.0 45.00 -21.60 210.00 -48.89 0.86 5.73 0.24 372.30 40.53 29.32 0.0 ---------------------------------------------------------------------------------------------------------------------
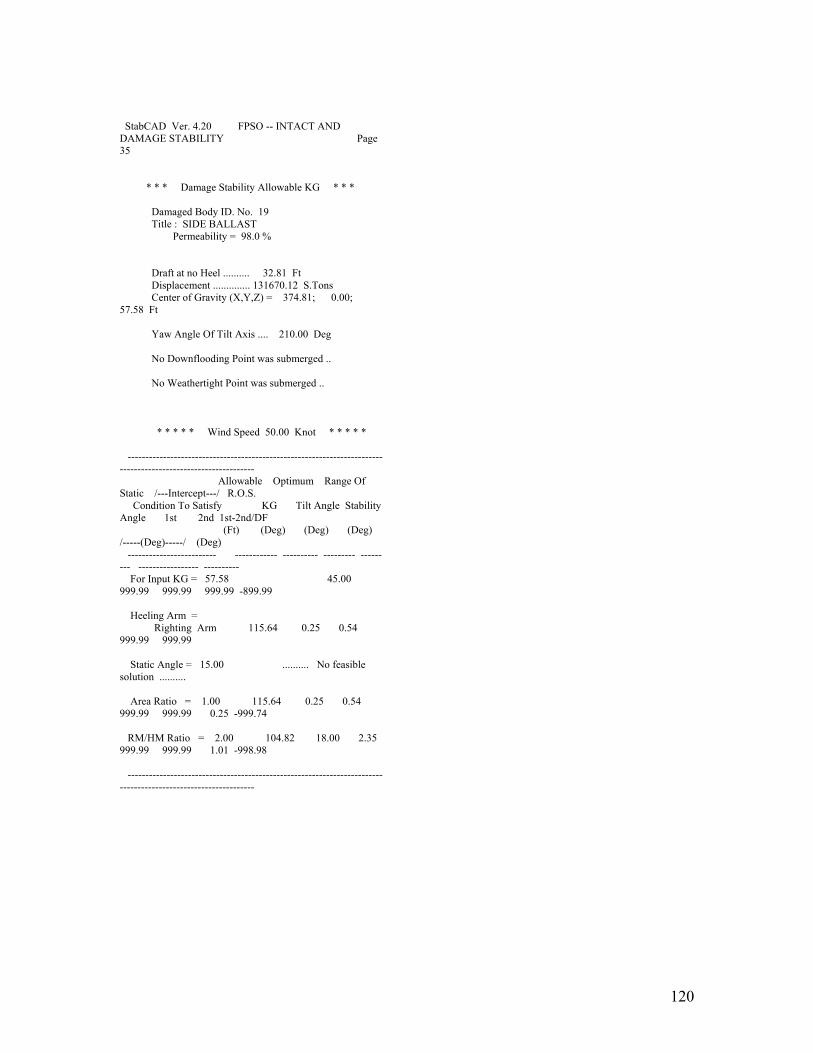
120
StabCAD Ver. 4.20 FPSO -- INTACT AND DAMAGE STABILITY Page 35 * * * Damage Stability Allowable KG * * * Damaged Body ID. No. 19 Title : SIDE BALLAST Permeability = 98.0 % Draft at no Heel .......... 32.81 Ft Displacement .............. 131670.12 S.Tons Center of Gravity (X,Y,Z) = 374.81; 0.00; 57.58 Ft Yaw Angle Of Tilt Axis .... 210.00 Deg No Downflooding Point was submerged .. No Weathertight Point was submerged .. * * * * * Wind Speed 50.00 Knot * * * * * -------------------------------------------------------------------------------------------------------------- Allowable Optimum Range Of Static /---Intercept---/ R.O.S. Condition To Satisfy KG Tilt Angle Stability Angle 1st 2nd 1st-2nd/DF (Ft) (Deg) (Deg) (Deg) /-----(Deg)-----/ (Deg) ------------------------- ------------ ---------- --------- --------- ----------------- ---------- For Input KG = 57.58 45.00 999.99 999.99 999.99 -899.99 Heeling Arm = Righting Arm 115.64 0.25 0.54 999.99 999.99 Static Angle = 15.00 .......... No feasible solution .......... Area Ratio = 1.00 115.64 0.25 0.54 999.99 999.99 0.25 -999.74 RM/HM Ratio = 2.00 104.82 18.00 2.35 999.99 999.99 1.01 -998.98 --------------------------------------------------------------------------------------------------------------
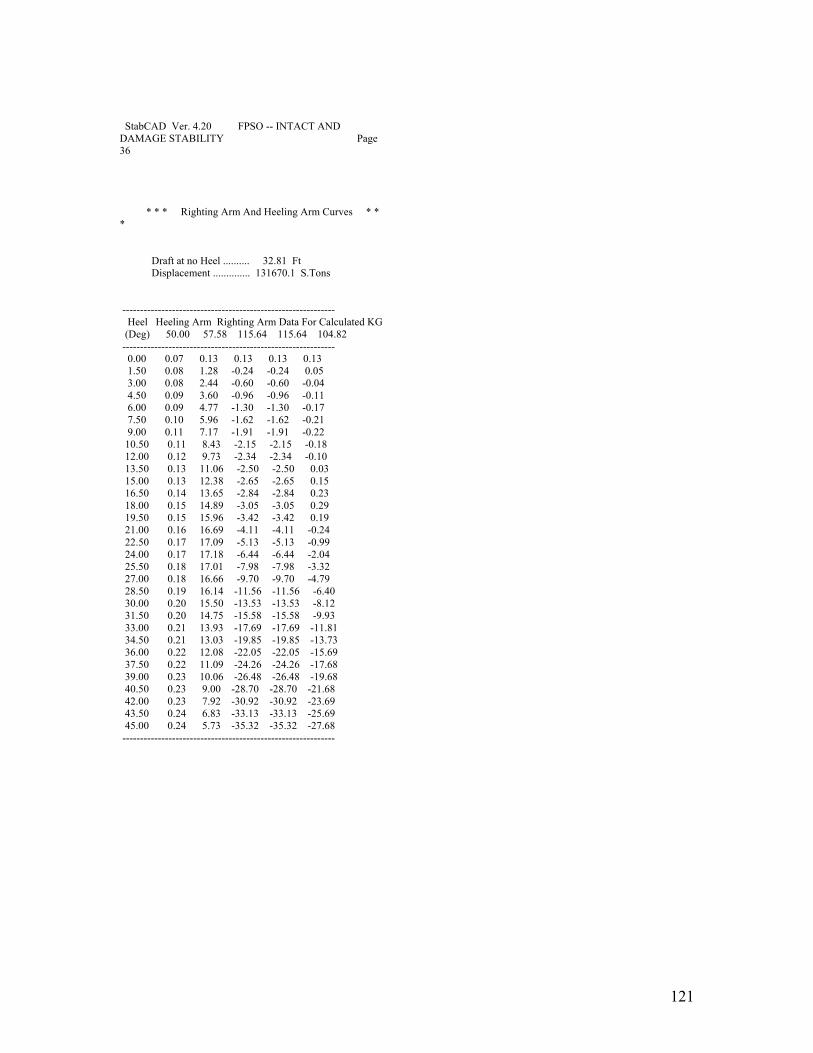
121
StabCAD Ver. 4.20 FPSO -- INTACT AND DAMAGE STABILITY Page 36 * * * Righting Arm And Heeling Arm Curves * * * Draft at no Heel .......... 32.81 Ft Displacement .............. 131670.1 S.Tons ------------------------------------------------------------ Heel Heeling Arm Righting Arm Data For Calculated KG (Deg) 50.00 57.58 115.64 115.64 104.82 ------------------------------------------------------------ 0.00 0.07 0.13 0.13 0.13 0.13 1.50 0.08 1.28 -0.24 -0.24 0.05 3.00 0.08 2.44 -0.60 -0.60 -0.04 4.50 0.09 3.60 -0.96 -0.96 -0.11 6.00 0.09 4.77 -1.30 -1.30 -0.17 7.50 0.10 5.96 -1.62 -1.62 -0.21 9.00 0.11 7.17 -1.91 -1.91 -0.22 10.50 0.11 8.43 -2.15 -2.15 -0.18 12.00 0.12 9.73 -2.34 -2.34 -0.10 13.50 0.13 11.06 -2.50 -2.50 0.03 15.00 0.13 12.38 -2.65 -2.65 0.15 16.50 0.14 13.65 -2.84 -2.84 0.23 18.00 0.15 14.89 -3.05 -3.05 0.29 19.50 0.15 15.96 -3.42 -3.42 0.19 21.00 0.16 16.69 -4.11 -4.11 -0.24 22.50 0.17 17.09 -5.13 -5.13 -0.99 24.00 0.17 17.18 -6.44 -6.44 -2.04 25.50 0.18 17.01 -7.98 -7.98 -3.32 27.00 0.18 16.66 -9.70 -9.70 -4.79 28.50 0.19 16.14 -11.56 -11.56 -6.40 30.00 0.20 15.50 -13.53 -13.53 -8.12 31.50 0.20 14.75 -15.58 -15.58 -9.93 33.00 0.21 13.93 -17.69 -17.69 -11.81 34.50 0.21 13.03 -19.85 -19.85 -13.73 36.00 0.22 12.08 -22.05 -22.05 -15.69 37.50 0.22 11.09 -24.26 -24.26 -17.68 39.00 0.23 10.06 -26.48 -26.48 -19.68 40.50 0.23 9.00 -28.70 -28.70 -21.68 42.00 0.23 7.92 -30.92 -30.92 -23.69 43.50 0.24 6.83 -33.13 -33.13 -25.69 45.00 0.24 5.73 -35.32 -35.32 -27.68 ------------------------------------------------------------

122
StabCAD Ver. 4.20 FPSO -- INTACT AND DAMAGE STABILITY Page 37 * * * Damage Stability Reference Point Table * * * Damaged Body ID. No. 19 Title : SIDE BALLAST Permeability = 98.0 % Intact Draft .............. 32.81 Ft Displacement .............. 131670.1 S.Tons Center of Gravity (X,Y,Z) = 374.81; 0.00; 57.58 Ft Angle of Tilt Axis ........ 225.00 Deg Downflooding Points Height Above Water (Ft) -------------------------------------------- No Downflooding Point was submerged .. No Weathertight Point was submerged .. H E E L A N G L E S ------- ------- -------------------- --------------------------------------------------------------------------------------------- DF PT. Type Description 0.0 1.5 3.0 4.5 6.0 7.5 9.0 10.5 12.0 13.5 15.0 16.5 ------- ------- -------------------- --------------------------------------------------------------------------------------------- ------- ------- -------------------- --------------------------------------------------------------------------------------------- H E E L A N G L E S ------- ------- -------------------- --------------------------------------------------------------------------------------------- DF PT. Type Description 18.0 19.5 21.0 22.5 24.0 25.5 27.0 28.5 30.0 31.5 33.0 34.5 ------- ------- -------------------- --------------------------------------------------------------------------------------------- ------- ------- -------------------- --------------------------------------------------------------------------------------------- H E E L A N G L E S ------- ------- -------------------- ----------------------------------------------------- DF PT. Type Description 36.0 37.5 39.0 40.5 42.0 43.5 45.0 ------- ------- -------------------- ----------------------------------------------------- ------- ------- -------------------- -----------------------------------------------------

123
StabCAD Ver. 4.20 FPSO -- INTACT AND DAMAGE STABILITY Page 38 * * * Damage Stability Parameters * * * Damaged Body ID. No. 19 Title : SIDE BALLAST Permeability = 98.0 % Draft at no Heel .......... 32.81 Ft Displacement .............. 131670.1 S.Tons Center of Gravity (X,Y,Z) = 374.81; 0.00; 57.58 Ft Wind Speed ................ 50.00 Knot Wind Direction is Normal to Tilt Axis Range of Stability ........ 45.00 Deg --------------------------------------------------------------------------------------------------------------------- /--Angles w.r.t.--/ Critical Yaw Angle /--- Angles ---/ /-- Yawed axis ---/ Downflood Of /- w.r.t. Ship-/ Righting Heeling /-- Center of Buoyancy--/ Flood Heel Trim Height Tilt Axis Heel Trim Arm Arm LCB TCB VCB Water (Deg) (Deg) (Ft) (Deg) (Deg) (Deg) (Ft) (Ft) (Ft) (Ft) (Ft) (S.Tons) ------------------- -------- -------- ---------------- ------- -------- -------------------------- -------- 0.00 0.02 225.00 0.02 0.02 0.16 0.07 374.69 0.10 16.81 194.7 1.50 -1.42 225.00 -2.06 0.06 1.86 0.07 373.46 2.78 16.85 157.2 3.00 -2.85 225.00 -4.14 0.10 3.56 0.08 372.22 5.46 17.00 119.8 4.50 -4.27 225.00 -6.20 0.15 5.27 0.08 370.99 8.14 17.25 82.3 6.00 -5.69 225.00 -8.26 0.20 7.00 0.09 369.74 10.83 17.59 44.8 7.50 -7.09 225.00 -10.30 0.25 8.76 0.10 368.49 13.53 18.04 7.1 9.00 -8.47 225.00 -12.33 0.31 10.57 0.10 367.21 16.27 18.59 0.0 10.50 -9.84 225.00 -14.35 0.36 12.43 0.11 365.91 19.02 19.25 0.0 12.00 -11.18 225.00 -16.34 0.42 14.30 0.12 364.62 21.77 20.02 0.0 13.50 -12.51 225.00 -18.32 0.49 16.09 0.12 363.41 24.45 20.86 0.0 15.00 -13.81 225.00 -20.27 0.55 17.77 0.13 362.29 27.05 21.78 0.0 16.50 -15.07 225.00 -22.20 0.62 19.11 0.14 361.42 29.40 22.70 0.0 18.00 -16.30 225.00 -24.10 0.70 19.93 0.14 360.92 31.37 23.55 0.0 19.50 -17.52 225.00 -25.97 0.78 20.23 0.15 360.78 32.98 24.30 0.0 21.00 -18.72 225.00 -27.84 0.85 20.10 0.16 360.95 34.29 24.97 0.0
22.50 -19.90 225.00 -29.68 0.91 19.65 0.17 361.35 35.37 25.55 0.0 24.00 -21.07 225.00 -31.51 0.96 18.94 0.17 361.93 36.26 26.07 0.0 25.50 -22.21 225.00 -33.31 0.99 18.04 0.18 362.63 37.01 26.53 0.0 27.00 -23.34 225.00 -35.10 1.02 17.00 0.18 363.42 37.65 26.95 0.0 28.50 -24.44 225.00 -36.86 1.05 15.86 0.19 364.27 38.19 27.33 0.0 30.00 -25.52 225.00 -38.59 1.06 14.64 0.19 365.16 38.66 27.68 0.0 31.50 -26.57 225.00 -40.30 1.07 13.37 0.20 366.07 39.07 27.99 0.0 33.00 -27.59 225.00 -41.98 1.07 12.06 0.20 366.99 39.42 28.28 0.0 34.50 -28.58 225.00 -43.63 1.06 10.74 0.21 367.90 39.73 28.55 0.0 36.00 -29.54 225.00 -45.26 1.05 9.41 0.21 368.80 40.00 28.80 0.0 37.50 -30.47 225.00 -46.86 1.04 8.08 0.22 369.67 40.24 29.03 0.0 39.00 -31.37 225.00 -48.42 1.03 6.77 0.22 370.51 40.45 29.25 0.0 40.50 -32.23 225.00 -49.96 1.01 5.47 0.23 371.32 40.64 29.45 0.0 42.00 -33.06 225.00 -51.48 0.99 4.19 0.23 372.08 40.80 29.64 0.0 43.50 -33.86 225.00 -52.96 0.97 2.93 0.23 372.81 40.95 29.82 0.0 45.00 -34.63 225.00 -54.42 0.94 1.70 0.24 373.49 41.09 29.99 0.0 ---------------------------------------------------------------------------------------------------------------------
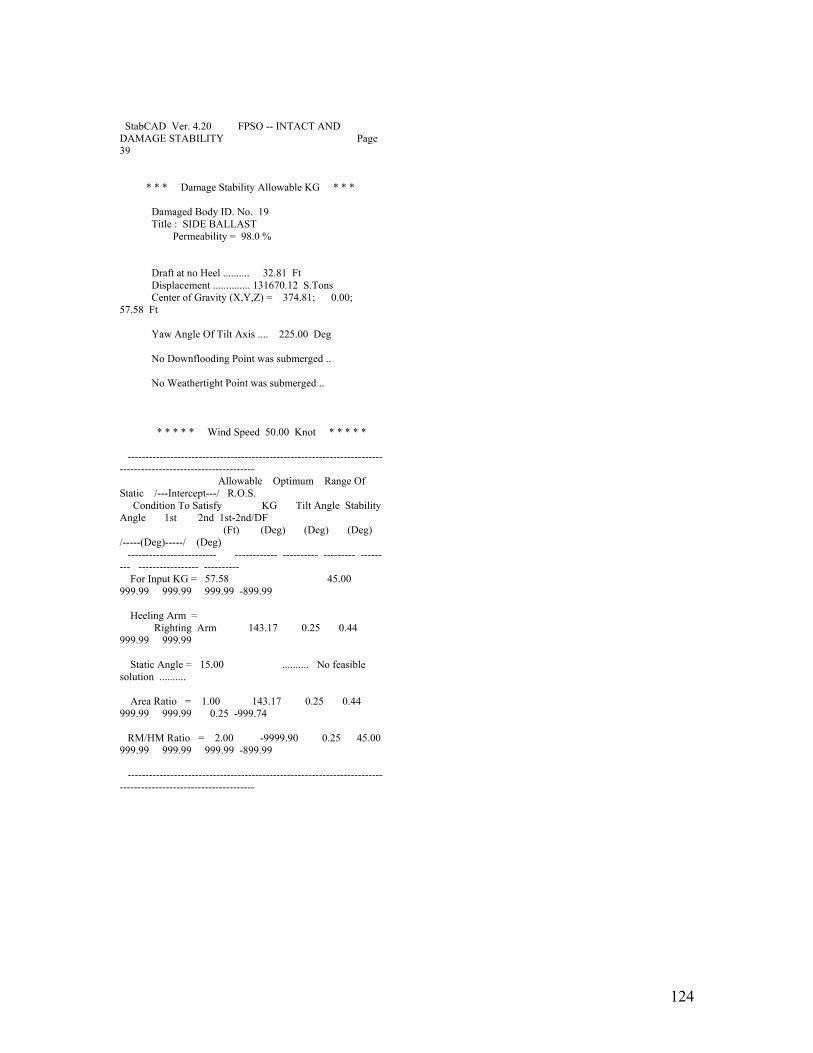
124
StabCAD Ver. 4.20 FPSO -- INTACT AND DAMAGE STABILITY Page 39 * * * Damage Stability Allowable KG * * * Damaged Body ID. No. 19 Title : SIDE BALLAST Permeability = 98.0 % Draft at no Heel .......... 32.81 Ft Displacement .............. 131670.12 S.Tons Center of Gravity (X,Y,Z) = 374.81; 0.00; 57.58 Ft Yaw Angle Of Tilt Axis .... 225.00 Deg No Downflooding Point was submerged .. No Weathertight Point was submerged .. * * * * * Wind Speed 50.00 Knot * * * * * -------------------------------------------------------------------------------------------------------------- Allowable Optimum Range Of Static /---Intercept---/ R.O.S. Condition To Satisfy KG Tilt Angle Stability Angle 1st 2nd 1st-2nd/DF (Ft) (Deg) (Deg) (Deg) /-----(Deg)-----/ (Deg) ------------------------- ------------ ---------- --------- --------- ----------------- ---------- For Input KG = 57.58 45.00 999.99 999.99 999.99 -899.99 Heeling Arm = Righting Arm 143.17 0.25 0.44 999.99 999.99 Static Angle = 15.00 .......... No feasible solution .......... Area Ratio = 1.00 143.17 0.25 0.44 999.99 999.99 0.25 -999.74 RM/HM Ratio = 2.00 -9999.90 0.25 45.00 999.99 999.99 999.99 -899.99 --------------------------------------------------------------------------------------------------------------
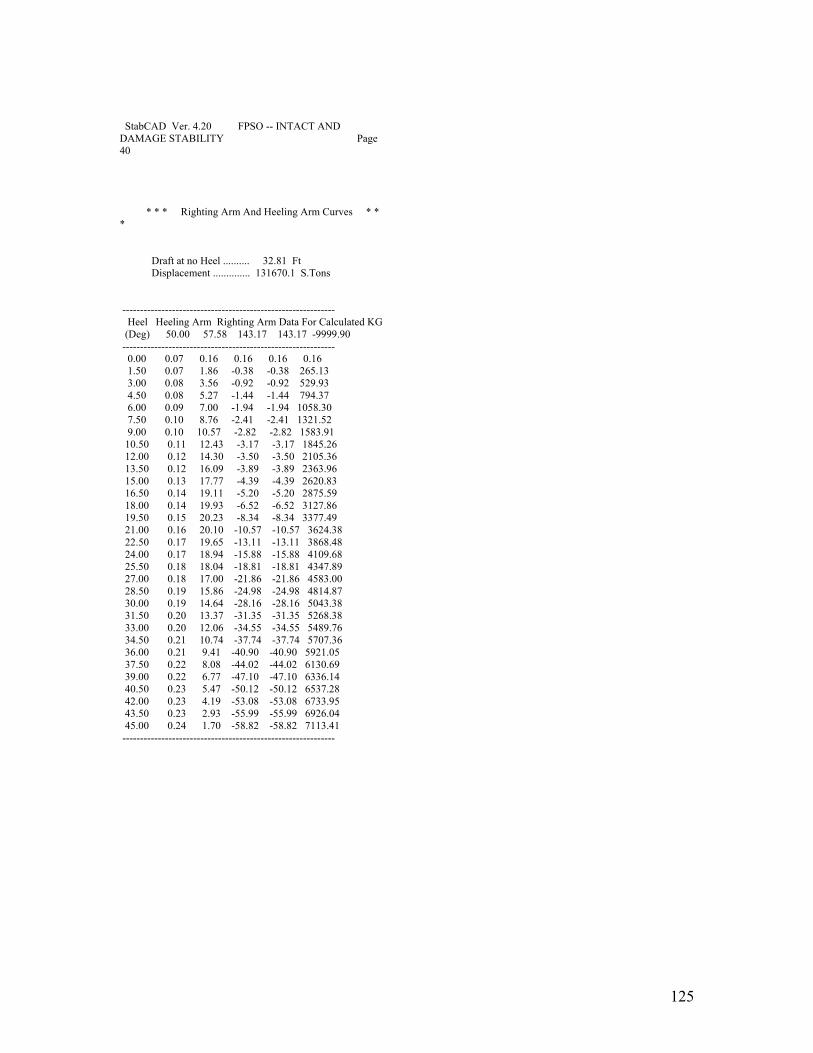
125
StabCAD Ver. 4.20 FPSO -- INTACT AND DAMAGE STABILITY Page 40 * * * Righting Arm And Heeling Arm Curves * * * Draft at no Heel .......... 32.81 Ft Displacement .............. 131670.1 S.Tons ------------------------------------------------------------ Heel Heeling Arm Righting Arm Data For Calculated KG (Deg) 50.00 57.58 143.17 143.17 -9999.90 ------------------------------------------------------------ 0.00 0.07 0.16 0.16 0.16 0.16 1.50 0.07 1.86 -0.38 -0.38 265.13 3.00 0.08 3.56 -0.92 -0.92 529.93 4.50 0.08 5.27 -1.44 -1.44 794.37 6.00 0.09 7.00 -1.94 -1.94 1058.30 7.50 0.10 8.76 -2.41 -2.41 1321.52 9.00 0.10 10.57 -2.82 -2.82 1583.91 10.50 0.11 12.43 -3.17 -3.17 1845.26 12.00 0.12 14.30 -3.50 -3.50 2105.36 13.50 0.12 16.09 -3.89 -3.89 2363.96 15.00 0.13 17.77 -4.39 -4.39 2620.83 16.50 0.14 19.11 -5.20 -5.20 2875.59 18.00 0.14 19.93 -6.52 -6.52 3127.86 19.50 0.15 20.23 -8.34 -8.34 3377.49 21.00 0.16 20.10 -10.57 -10.57 3624.38 22.50 0.17 19.65 -13.11 -13.11 3868.48 24.00 0.17 18.94 -15.88 -15.88 4109.68 25.50 0.18 18.04 -18.81 -18.81 4347.89 27.00 0.18 17.00 -21.86 -21.86 4583.00 28.50 0.19 15.86 -24.98 -24.98 4814.87 30.00 0.19 14.64 -28.16 -28.16 5043.38 31.50 0.20 13.37 -31.35 -31.35 5268.38 33.00 0.20 12.06 -34.55 -34.55 5489.76 34.50 0.21 10.74 -37.74 -37.74 5707.36 36.00 0.21 9.41 -40.90 -40.90 5921.05 37.50 0.22 8.08 -44.02 -44.02 6130.69 39.00 0.22 6.77 -47.10 -47.10 6336.14 40.50 0.23 5.47 -50.12 -50.12 6537.28 42.00 0.23 4.19 -53.08 -53.08 6733.95 43.50 0.23 2.93 -55.99 -55.99 6926.04 45.00 0.24 1.70 -58.82 -58.82 7113.41 ------------------------------------------------------------
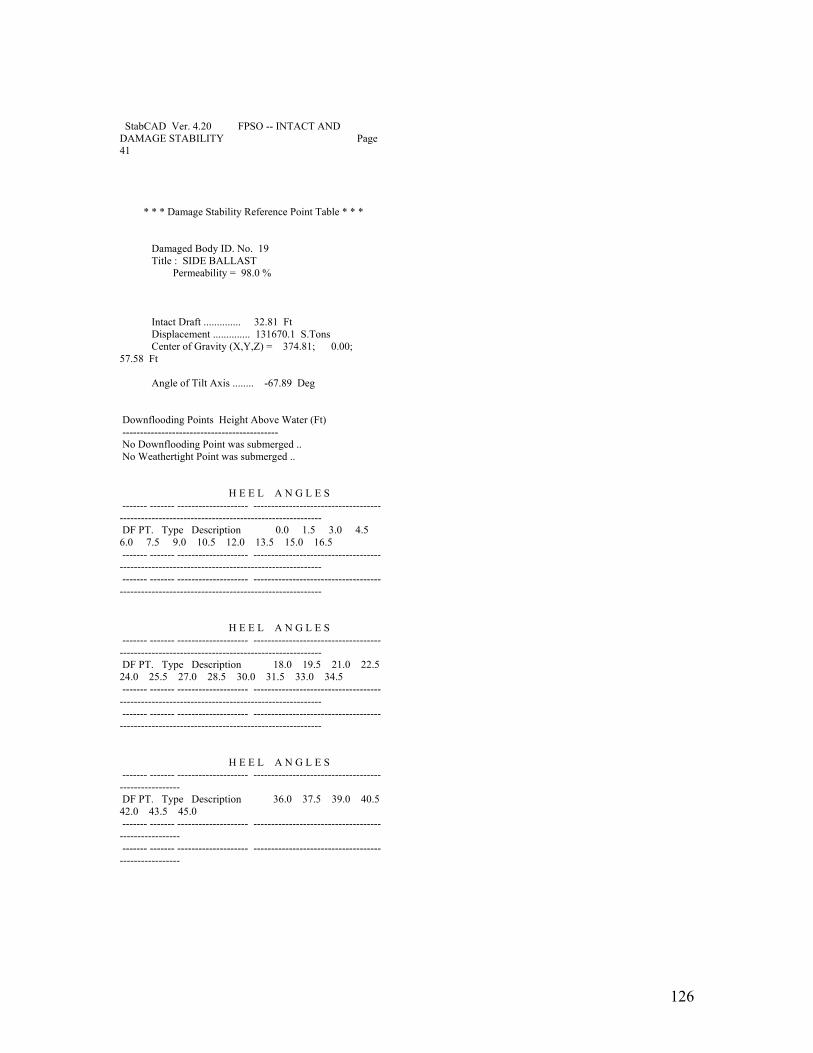
126
StabCAD Ver. 4.20 FPSO -- INTACT AND DAMAGE STABILITY Page 41 * * * Damage Stability Reference Point Table * * * Damaged Body ID. No. 19 Title : SIDE BALLAST Permeability = 98.0 % Intact Draft .............. 32.81 Ft Displacement .............. 131670.1 S.Tons Center of Gravity (X,Y,Z) = 374.81; 0.00; 57.58 Ft Angle of Tilt Axis ........ -67.89 Deg Downflooding Points Height Above Water (Ft) -------------------------------------------- No Downflooding Point was submerged .. No Weathertight Point was submerged .. H E E L A N G L E S ------- ------- -------------------- --------------------------------------------------------------------------------------------- DF PT. Type Description 0.0 1.5 3.0 4.5 6.0 7.5 9.0 10.5 12.0 13.5 15.0 16.5 ------- ------- -------------------- --------------------------------------------------------------------------------------------- ------- ------- -------------------- --------------------------------------------------------------------------------------------- H E E L A N G L E S ------- ------- -------------------- --------------------------------------------------------------------------------------------- DF PT. Type Description 18.0 19.5 21.0 22.5 24.0 25.5 27.0 28.5 30.0 31.5 33.0 34.5 ------- ------- -------------------- --------------------------------------------------------------------------------------------- ------- ------- -------------------- --------------------------------------------------------------------------------------------- H E E L A N G L E S ------- ------- -------------------- ----------------------------------------------------- DF PT. Type Description 36.0 37.5 39.0 40.5 42.0 43.5 45.0 ------- ------- -------------------- ----------------------------------------------------- ------- ------- -------------------- -----------------------------------------------------

127
StabCAD Ver. 4.20 FPSO -- INTACT AND DAMAGE STABILITY Page 42 * * * Damage Stability Parameters * * * Damaged Body ID. No. 19 Title : SIDE BALLAST Permeability = 98.0 % Draft at no Heel .......... 32.81 Ft Displacement .............. 131670.1 S.Tons Center of Gravity (X,Y,Z) = 374.81; 0.00; 57.58 Ft Wind Speed ................ 50.00 Knot Wind Direction is Normal to Tilt Axis Range of Stability ........ 30.01 Deg --------------------------------------------------------------------------------------------------------------------- /--Angles w.r.t.--/ Critical Yaw Angle /--- Angles ---/ /-- Yawed axis ---/ Downflood Of /- w.r.t. Ship-/ Righting Heeling /-- Center of Buoyancy--/ Flood Heel Trim Height Tilt Axis Heel Trim Arm Arm LCB TCB VCB Water (Deg) (Deg) (Ft) (Deg) (Deg) (Deg) (Ft) (Ft) (Ft) (Ft) (Ft) (S.Tons) ------------------- -------- -------- ---------------- ------- -------- -------------------------- -------- 0.00 0.00 -67.89 0.00 0.00 -0.32 0.05 375.11 0.12 16.81 193.7 1.50 3.18 -67.89 3.51 0.19 5.04 0.06 370.01 -4.40 16.95 269.2 3.00 6.32 -67.89 6.98 0.39 10.38 0.06 364.93 -8.89 17.39 344.6 4.50 9.41 -67.89 10.41 0.59 15.72 0.07 359.87 -13.38 18.12 420.1 6.00 12.44 -67.89 13.77 0.80 21.09 0.08 354.81 -17.86 19.14 495.8 7.50 15.37 -67.89 17.04 1.01 26.28 0.08 349.96 -22.25 20.43 560.1 9.00 18.20 -67.89 20.21 1.22 30.62 0.09 345.93 -26.30 21.87 560.5 10.50 20.94 -67.89 23.28 1.44 32.93 0.10 343.80 -29.56 23.22 560.5 12.00 23.61 -67.89 26.29 1.65 33.26 0.11 343.52 -32.07 24.38 560.5 13.50 26.25 -67.89 29.25 1.81 32.09 0.11 344.65 -34.00 25.36 560.5 15.00 28.86 -67.89 32.19 1.92 29.89 0.12 346.76 -35.50 26.18 560.5 16.50 31.43 -67.89 35.07 1.97 27.01 0.13 349.50 -36.69 26.88 560.5 18.00 33.94 -67.89 37.88 1.98 23.76 0.13 352.58 -37.64 27.47 560.5 19.50 36.37 -67.89 40.60 1.95 20.34 0.14 355.81 -38.41 27.98 560.5 21.00 38.69 -67.89 43.20 1.87 16.91 0.15 359.03 -39.02 28.43 560.5
22.50 40.89 -67.89 45.69 1.77 13.58 0.15 362.14 -39.51 28.81 560.5 24.00 42.96 -67.89 48.04 1.64 10.41 0.16 365.06 -39.91 29.15 560.5 25.50 44.90 -67.89 50.25 1.50 7.46 0.16 367.75 -40.23 29.45 560.5 27.00 46.71 -67.89 52.33 1.35 4.74 0.17 370.19 -40.49 29.71 560.5 28.50 48.38 -67.89 54.29 1.19 2.26 0.17 372.37 -40.70 29.94 560.5 30.00 49.93 -67.89 56.12 1.03 0.02 0.18 374.30 -40.87 30.15 560.5 31.50 51.37 -67.89 57.84 0.87 -2.00 0.18 375.99 -41.01 30.34 560.5 33.00 52.69 -67.89 59.45 0.72 -3.82 0.19 377.47 -41.13 30.51 560.5 34.50 53.91 -67.89 60.96 0.58 -5.45 0.19 378.73 -41.23 30.66 560.5 36.00 55.03 -67.89 62.38 0.44 -6.91 0.19 379.82 -41.31 30.80 560.5 37.50 56.07 -67.89 63.72 0.31 -8.22 0.20 380.73 -41.38 30.93 560.5 39.00 57.03 -67.89 64.98 0.20 -9.39 0.20 381.50 -41.43 31.05 560.5 40.50 57.91 -67.89 66.18 0.09 -10.44 0.20 382.14 -41.49 31.16 560.5 42.00 58.73 -67.89 67.31 0.00 -11.39 0.20 382.65 -41.53 31.26 560.5 43.50 59.49 -67.89 68.39 -0.08 -12.25 0.21 383.07 -41.57 31.36 560.5 45.00 60.19 -67.89 69.42 -0.15 -13.02 0.21 383.39 -41.60 31.45 560.5 ---------------------------------------------------------------------------------------------------------------------
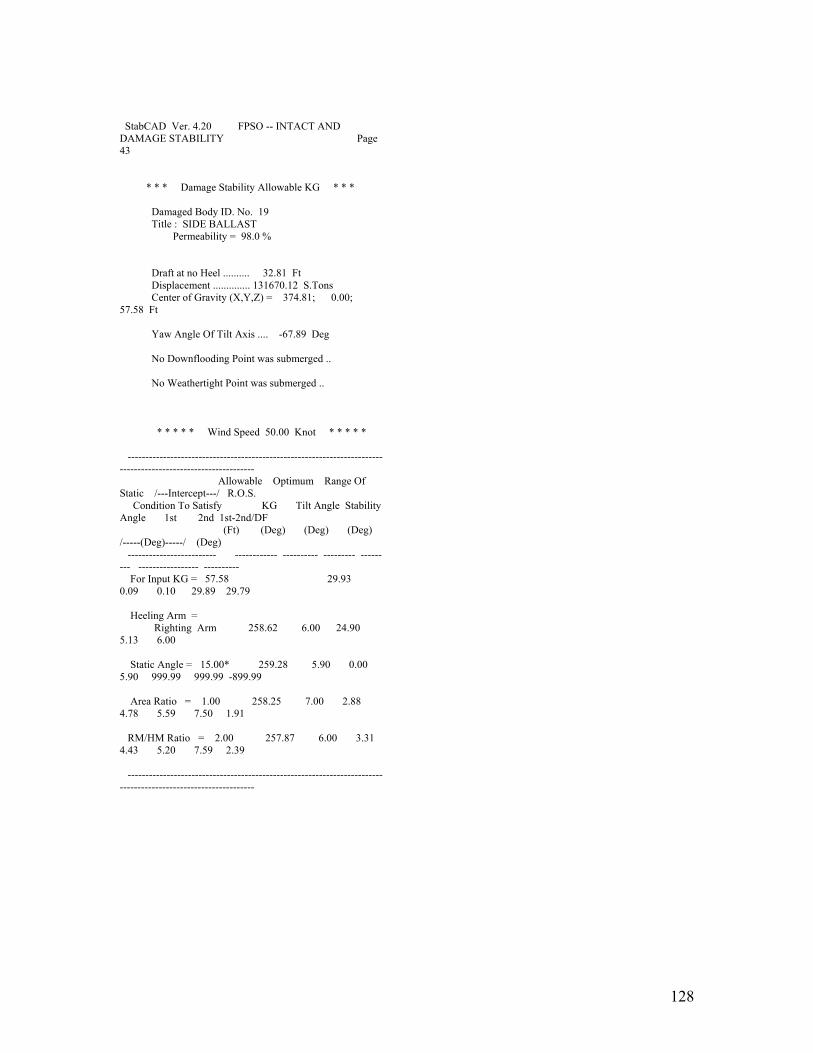
128
StabCAD Ver. 4.20 FPSO -- INTACT AND DAMAGE STABILITY Page 43 * * * Damage Stability Allowable KG * * * Damaged Body ID. No. 19 Title : SIDE BALLAST Permeability = 98.0 % Draft at no Heel .......... 32.81 Ft Displacement .............. 131670.12 S.Tons Center of Gravity (X,Y,Z) = 374.81; 0.00; 57.58 Ft Yaw Angle Of Tilt Axis .... -67.89 Deg No Downflooding Point was submerged .. No Weathertight Point was submerged .. * * * * * Wind Speed 50.00 Knot * * * * * -------------------------------------------------------------------------------------------------------------- Allowable Optimum Range Of Static /---Intercept---/ R.O.S. Condition To Satisfy KG Tilt Angle Stability Angle 1st 2nd 1st-2nd/DF (Ft) (Deg) (Deg) (Deg) /-----(Deg)-----/ (Deg) ------------------------- ------------ ---------- --------- --------- ----------------- ---------- For Input KG = 57.58 29.93 0.09 0.10 29.89 29.79 Heeling Arm = Righting Arm 258.62 6.00 24.90 5.13 6.00 Static Angle = 15.00* 259.28 5.90 0.00 5.90 999.99 999.99 -899.99 Area Ratio = 1.00 258.25 7.00 2.88 4.78 5.59 7.50 1.91 RM/HM Ratio = 2.00 257.87 6.00 3.31 4.43 5.20 7.59 2.39 --------------------------------------------------------------------------------------------------------------
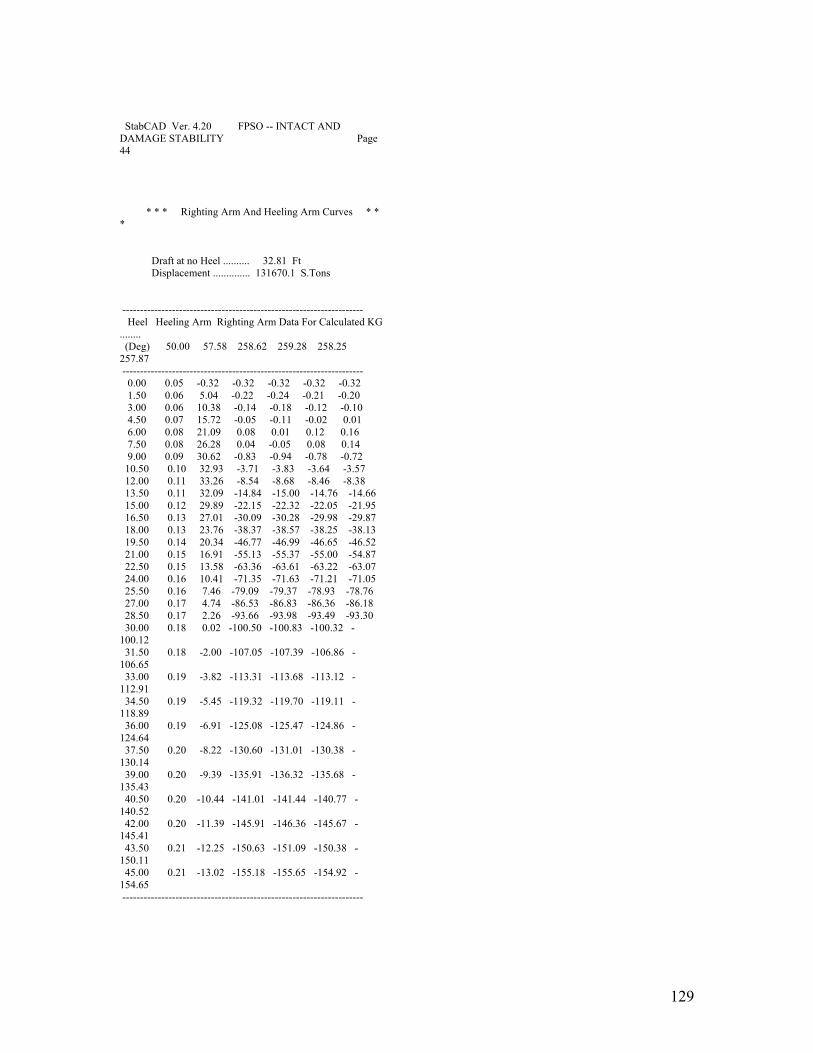
129
StabCAD Ver. 4.20 FPSO -- INTACT AND DAMAGE STABILITY Page 44 * * * Righting Arm And Heeling Arm Curves * * * Draft at no Heel .......... 32.81 Ft Displacement .............. 131670.1 S.Tons -------------------------------------------------------------------- Heel Heeling Arm Righting Arm Data For Calculated KG ........ (Deg) 50.00 57.58 258.62 259.28 258.25 257.87 -------------------------------------------------------------------- 0.00 0.05 -0.32 -0.32 -0.32 -0.32 -0.32 1.50 0.06 5.04 -0.22 -0.24 -0.21 -0.20 3.00 0.06 10.38 -0.14 -0.18 -0.12 -0.10 4.50 0.07 15.72 -0.05 -0.11 -0.02 0.01 6.00 0.08 21.09 0.08 0.01 0.12 0.16 7.50 0.08 26.28 0.04 -0.05 0.08 0.14 9.00 0.09 30.62 -0.83 -0.94 -0.78 -0.72 10.50 0.10 32.93 -3.71 -3.83 -3.64 -3.57 12.00 0.11 33.26 -8.54 -8.68 -8.46 -8.38 13.50 0.11 32.09 -14.84 -15.00 -14.76 -14.66 15.00 0.12 29.89 -22.15 -22.32 -22.05 -21.95 16.50 0.13 27.01 -30.09 -30.28 -29.98 -29.87 18.00 0.13 23.76 -38.37 -38.57 -38.25 -38.13 19.50 0.14 20.34 -46.77 -46.99 -46.65 -46.52 21.00 0.15 16.91 -55.13 -55.37 -55.00 -54.87 22.50 0.15 13.58 -63.36 -63.61 -63.22 -63.07 24.00 0.16 10.41 -71.35 -71.63 -71.21 -71.05 25.50 0.16 7.46 -79.09 -79.37 -78.93 -78.76 27.00 0.17 4.74 -86.53 -86.83 -86.36 -86.18 28.50 0.17 2.26 -93.66 -93.98 -93.49 -93.30 30.00 0.18 0.02 -100.50 -100.83 -100.32 -100.12 31.50 0.18 -2.00 -107.05 -107.39 -106.86 -106.65 33.00 0.19 -3.82 -113.31 -113.68 -113.12 -112.91 34.50 0.19 -5.45 -119.32 -119.70 -119.11 -118.89 36.00 0.19 -6.91 -125.08 -125.47 -124.86 -124.64 37.50 0.20 -8.22 -130.60 -131.01 -130.38 -130.14 39.00 0.20 -9.39 -135.91 -136.32 -135.68 -135.43 40.50 0.20 -10.44 -141.01 -141.44 -140.77 -140.52 42.00 0.20 -11.39 -145.91 -146.36 -145.67 -145.41 43.50 0.21 -12.25 -150.63 -151.09 -150.38 -150.11 45.00 0.21 -13.02 -155.18 -155.65 -154.92 -154.65 --------------------------------------------------------------------
130
StabCAD Ver. 4.20 FPSO -- INTACT AND DAMAGE STABILITY Page 45 Wednesday 4/ 2/2003 6:52: 5 Input File Name:Y:\TWA\FPSO2 Output File Name:Y:\TWA\FPSO2.OT9 * * * Problem Description * * * Number Of Joints ............. 672 Number Of Plates ............. 797 Number Of Cylinders .......... 0 Number Of Stations ........... 0 Total Execution time = 0: 0:24 (000)

131
Appendix B: MIMOSA I/O

132
MIMOSA Analysis G2 Input File IDENT 1.00000000E+00 1.00000000E+00 0.00000000E+00 0.00000000E+00 DATE 1.00000000E+00 0.00000000E+00 4.00000000E+00 7.20000000E+01 DATE: 31-MAY-2001 TIME: 18:38:45 PROGRAM: SESAM WADAM VERSION: 7.2-02 15-MAY-2000 COMPUTER: 586 WIN NT 4.0 [1381INSTALLATION: BROWN BGA2233 USER: HBAO209 ACCOUNT: TEXT 1.00000000E+00 0.00000000E+00 3.00000000E+00 7.20000000E+01 BP BLOCK 18 PRE-FEED FPSO (LOADED CONDITION) WBODCON 7.00000000E+00 1.00000000E+00 1.00000000E+00 1.00000000E+00 1.00000000E+00 1.00000000E+00 0.00000000E+00 WDRESREF 1.00000000E+01 1.00000000E+00 1.00000000E+00 2.00000000E+00 1.00000000E+00 1.00000000E+00 0.00000000E+00 2.00000000E+00 1.00000000E+00 2.09439516E-01 WDRESREF 1.00000000E+01 2.00000000E+00 1.00000000E+00 2.00000000E+00 1.00000000E+00 1.00000000E+00 0.00000000E+00 2.00000000E+00 2.00000000E+00 2.51327425E-01 WDRESREF 1.00000000E+01 3.00000000E+00 1.00000000E+00 2.00000000E+00 1.00000000E+00 1.00000000E+00 0.00000000E+00 2.00000000E+00 3.00000000E+00 2.85599351E-01 WDRESREF 1.00000000E+01 4.00000000E+00 1.00000000E+00 2.00000000E+00 1.00000000E+00 1.00000000E+00 0.00000000E+00 2.00000000E+00 4.00000000E+00 3.14159274E-01 WDRESREF 1.00000000E+01 5.00000000E+00 1.00000000E+00 2.00000000E+00 1.00000000E+00 1.00000000E+00 0.00000000E+00 2.00000000E+00 5.00000000E+00 3.30693960E-01 WDRESREF 1.00000000E+01 6.00000000E+00 1.00000000E+00 2.00000000E+00 1.00000000E+00 1.00000000E+00 0.00000000E+00 2.00000000E+00 6.00000000E+00 3.39631647E-01 WDRESREF 1.00000000E+01 7.00000000E+00 1.00000000E+00 2.00000000E+00 1.00000000E+00 1.00000000E+00 0.00000000E+00 2.00000000E+00 7.00000000E+00 3.49065870E-01 WDRESREF 1.00000000E+01 8.00000000E+00 1.00000000E+00 2.00000000E+00 1.00000000E+00 1.00000000E+00 0.00000000E+00 2.00000000E+00 8.00000000E+00 3.59039158E-01 WDRESREF 1.00000000E+01 9.00000000E+00 1.00000000E+00 2.00000000E+00 1.00000000E+00 1.00000000E+00 0.00000000E+00 2.00000000E+00 9.00000000E+00 3.69599134E-01 WDRESREF 1.00000000E+01 1.00000000E+01 1.00000000E+00 2.00000000E+00 1.00000000E+00 1.00000000E+00 0.00000000E+00 2.00000000E+00 1.00000000E+01 3.80799115E-01 WDRESREF 1.00000000E+01 1.10000000E+01 1.00000000E+00 2.00000000E+00 1.00000000E+00 1.00000000E+00 0.00000000E+00 2.00000000E+00 1.10000000E+01 3.92699093E-01 WDRESREF 1.00000000E+01 1.20000000E+01 1.00000000E+00 2.00000000E+00 1.00000000E+00 1.00000000E+00 0.00000000E+00 2.00000000E+00 1.20000000E+01 4.05366808E-01 WDRESREF 1.00000000E+01 1.30000000E+01 1.00000000E+00 2.00000000E+00 1.00000000E+00 1.00000000E+00 0.00000000E+00 2.00000000E+00 1.30000000E+01 4.18879032E-01 WDRESREF 1.00000000E+01 1.40000000E+01 1.00000000E+00 2.00000000E+00 1.00000000E+00 1.00000000E+00 0.00000000E+00 2.00000000E+00 1.40000000E+01 4.48798954E-01 WDRESREF 1.00000000E+01 1.50000000E+01 1.00000000E+00 2.00000000E+00 1.00000000E+00 1.00000000E+00 0.00000000E+00 2.00000000E+00 1.50000000E+01 4.83321965E-01 WDRESREF 1.00000000E+01 1.60000000E+01 1.00000000E+00 2.00000000E+00 1.00000000E+00 1.00000000E+00 0.00000000E+00 2.00000000E+00 1.60000000E+01 5.02654850E-01 …. …. IEND 4.00000000E+00 2.00000000E+00 0.00000000E+00 0.00000000E+00 IEND 1.00000000E+00 0.00000000E+00 0.00000000E+00 0.00000000E+00
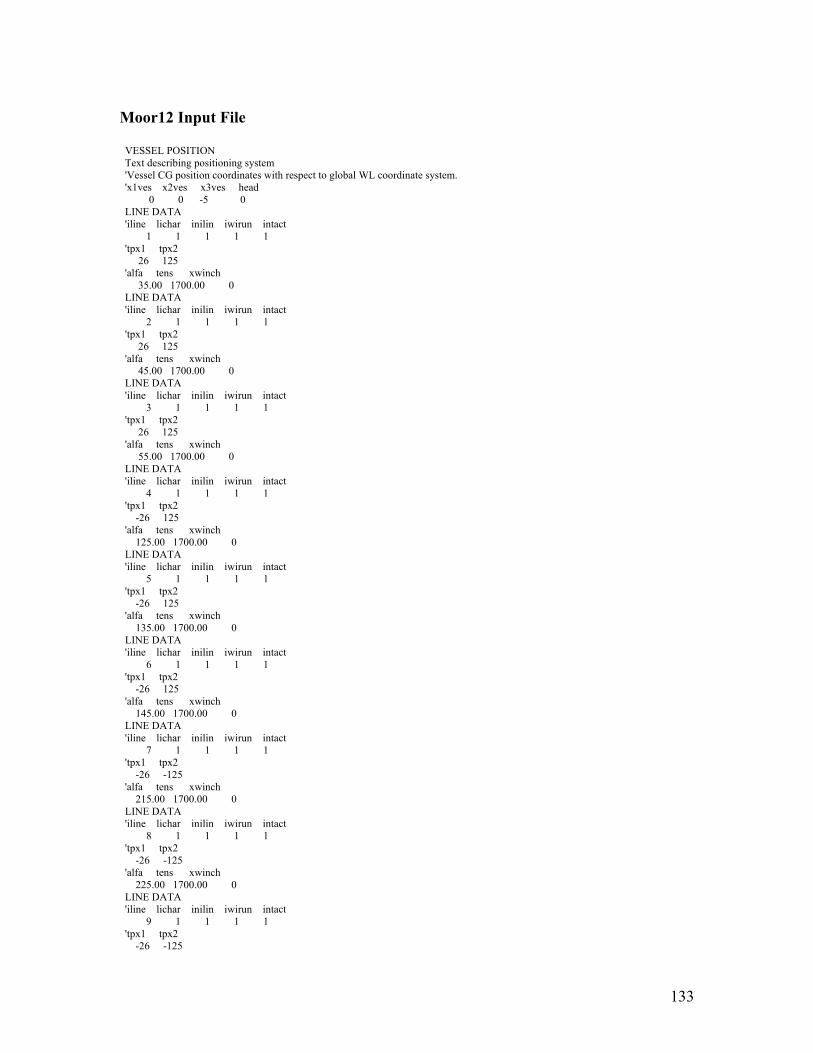
133
Moor12 Input File VESSEL POSITION Text describing positioning system 'Vessel CG position coordinates with respect to global WL coordinate system. 'x1ves x2ves x3ves head 0 0 -5 0 LINE DATA 'iline lichar inilin iwirun intact 1 1 1 1 1 'tpx1 tpx2 26 125 'alfa tens xwinch 35.00 1700.00 0 LINE DATA 'iline lichar inilin iwirun intact 2 1 1 1 1 'tpx1 tpx2 26 125 'alfa tens xwinch 45.00 1700.00 0 LINE DATA 'iline lichar inilin iwirun intact 3 1 1 1 1 'tpx1 tpx2 26 125 'alfa tens xwinch 55.00 1700.00 0 LINE DATA 'iline lichar inilin iwirun intact 4 1 1 1 1 'tpx1 tpx2 -26 125 'alfa tens xwinch 125.00 1700.00 0 LINE DATA 'iline lichar inilin iwirun intact 5 1 1 1 1 'tpx1 tpx2 -26 125 'alfa tens xwinch 135.00 1700.00 0 LINE DATA 'iline lichar inilin iwirun intact 6 1 1 1 1 'tpx1 tpx2 -26 125 'alfa tens xwinch 145.00 1700.00 0 LINE DATA 'iline lichar inilin iwirun intact 7 1 1 1 1 'tpx1 tpx2 -26 -125 'alfa tens xwinch 215.00 1700.00 0 LINE DATA 'iline lichar inilin iwirun intact 8 1 1 1 1 'tpx1 tpx2 -26 -125 'alfa tens xwinch 225.00 1700.00 0 LINE DATA 'iline lichar inilin iwirun intact 9 1 1 1 1 'tpx1 tpx2 -26 -125
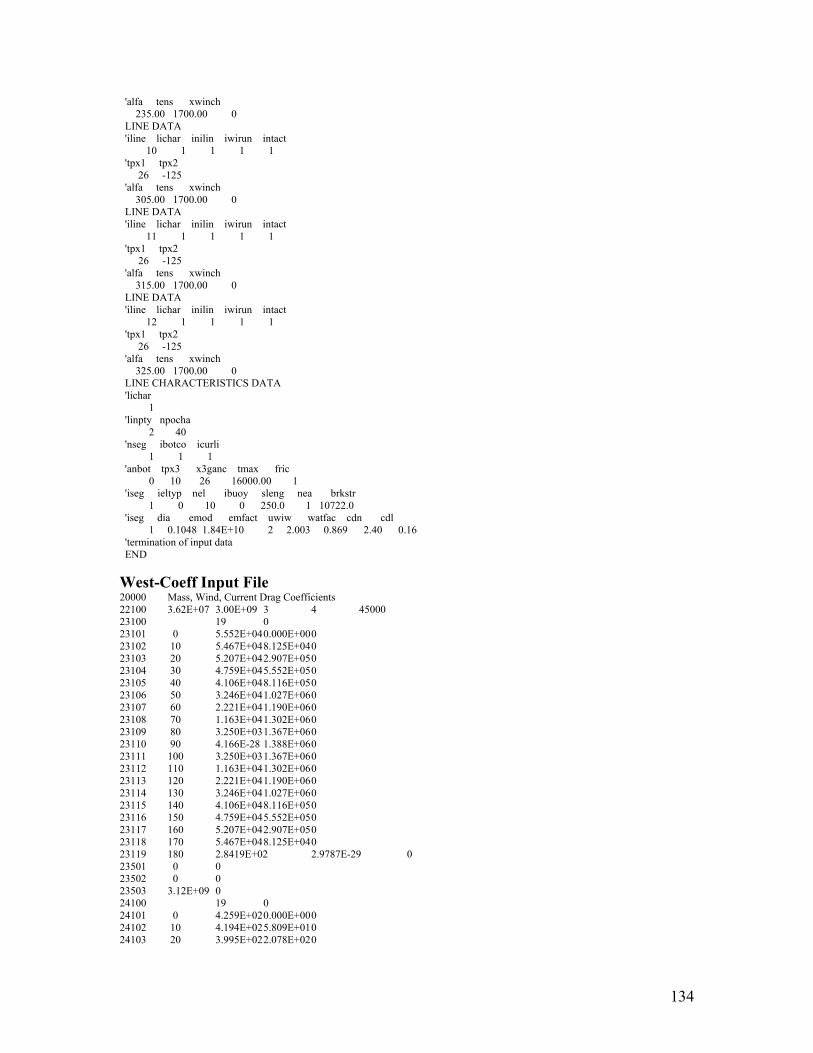
134
'alfa tens xwinch 235.00 1700.00 0 LINE DATA 'iline lichar inilin iwirun intact 10 1 1 1 1 'tpx1 tpx2 26 -125 'alfa tens xwinch 305.00 1700.00 0 LINE DATA 'iline lichar inilin iwirun intact 11 1 1 1 1 'tpx1 tpx2 26 -125 'alfa tens xwinch 315.00 1700.00 0 LINE DATA 'iline lichar inilin iwirun intact 12 1 1 1 1 'tpx1 tpx2 26 -125 'alfa tens xwinch 325.00 1700.00 0 LINE CHARACTERISTICS DATA 'lichar 1 'linpty npocha 2 40 'nseg ibotco icurli 1 1 1 'anbot tpx3 x3ganc tmax fric 0 10 26 16000.00 1 'iseg ieltyp nel ibuoy sleng nea brkstr 1 0 10 0 250.0 1 10722.0 'iseg dia emod emfact uwiw watfac cdn cdl 1 0.1048 1.84E+10 2 2.003 0.869 2.40 0.16 'termination of input data END West-Coeff Input File 20000 Mass, Wind, Current Drag Coefficients 22100 3.62E+07 3.00E+09 3 4 45000 23100 19 0 23101 0 5.552E+04 0.000E+00 0 23102 10 5.467E+04 8.125E+04 0 23103 20 5.207E+04 2.907E+05 0 23104 30 4.759E+04 5.552E+05 0 23105 40 4.106E+04 8.116E+05 0 23106 50 3.246E+04 1.027E+06 0 23107 60 2.221E+04 1.190E+06 0 23108 70 1.163E+04 1.302E+06 0 23109 80 3.250E+03 1.367E+06 0 23110 90 4.166E-28 1.388E+06 0 23111 100 3.250E+03 1.367E+06 0 23112 110 1.163E+04 1.302E+06 0 23113 120 2.221E+04 1.190E+06 0 23114 130 3.246E+04 1.027E+06 0 23115 140 4.106E+04 8.116E+05 0 23116 150 4.759E+04 5.552E+05 0 23117 160 5.207E+04 2.907E+05 0 23118 170 5.467E+04 8.125E+04 0 23119 180 2.8419E+02 2.9787E-29 0 23501 0 0 23502 0 0 23503 3.12E+09 0 24100 19 0 24101 0 4.259E+02 0.000E+00 0 24102 10 4.194E+02 5.809E+01 0 24103 20 3.995E+02 2.078E+02 0
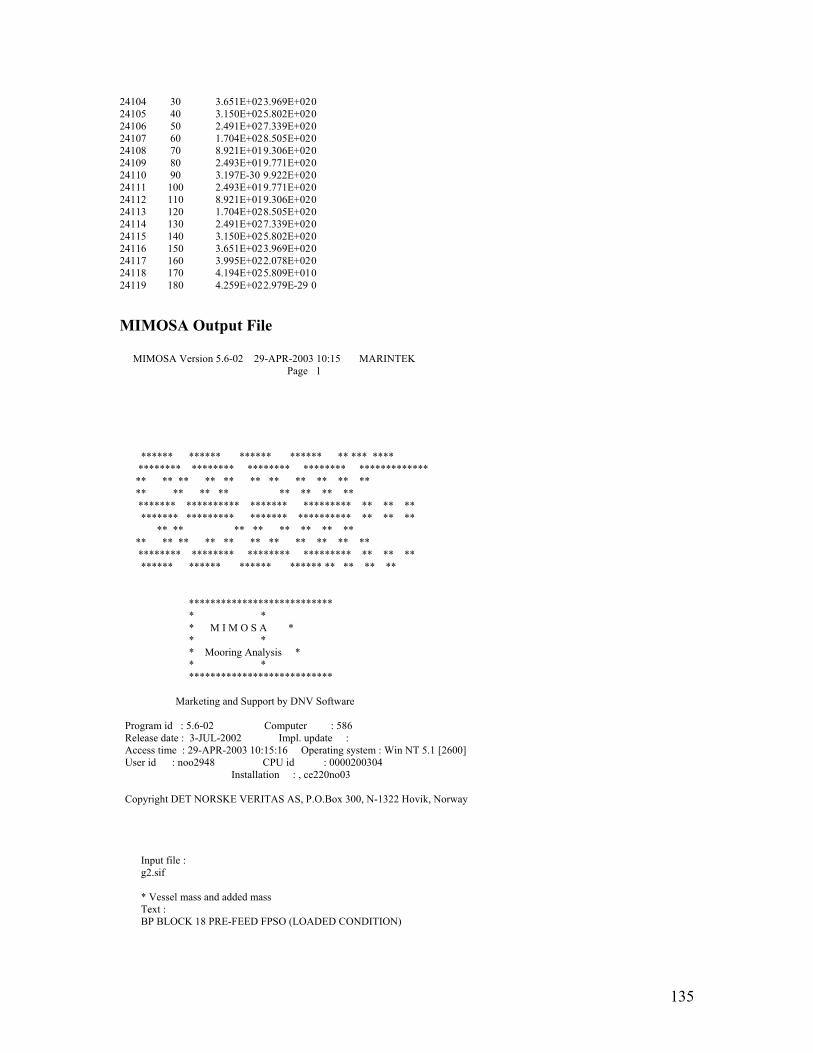
135
24104 30 3.651E+02 3.969E+02 0 24105 40 3.150E+02 5.802E+02 0 24106 50 2.491E+02 7.339E+02 0 24107 60 1.704E+02 8.505E+02 0 24108 70 8.921E+01 9.306E+02 0 24109 80 2.493E+01 9.771E+02 0 24110 90 3.197E-30 9.922E+02 0 24111 100 2.493E+01 9.771E+02 0 24112 110 8.921E+01 9.306E+02 0 24113 120 1.704E+02 8.505E+02 0 24114 130 2.491E+02 7.339E+02 0 24115 140 3.150E+02 5.802E+02 0 24116 150 3.651E+02 3.969E+02 0 24117 160 3.995E+02 2.078E+02 0 24118 170 4.194E+02 5.809E+01 0 24119 180 4.259E+02 2.979E-29 0
MIMOSA Output File MIMOSA Version 5.6-02 29-APR-2003 10:15 MARINTEK Page 1 ****** ****** ****** ****** ** *** **** ******** ******** ******** ******** ************* ** ** ** ** ** ** ** ** ** ** ** ** ** ** ** ** ** ** ** ******* ********** ******* ********* ** ** ** ******* ********* ******* ********** ** ** ** ** ** ** ** ** ** ** ** ** ** ** ** ** ** ** ** ** ** ** ******** ******** ******** ********* ** ** ** ****** ****** ****** ****** ** ** ** ** *************************** * * * M I M O S A * * * * Mooring Analysis * * * *************************** Marketing and Support by DNV Software Program id : 5.6-02 Computer : 586 Release date : 3-JUL-2002 Impl. update : Access time : 29-APR-2003 10:15:16 Operating system : Win NT 5.1 [2600] User id : noo2948 CPU id : 0000200304 Installation : , ce220no03 Copyright DET NORSKE VERITAS AS, P.O.Box 300, N-1322 Hovik, Norway Input file : g2.sif * Vessel mass and added mass Text : BP BLOCK 18 PRE-FEED FPSO (LOADED CONDITION)
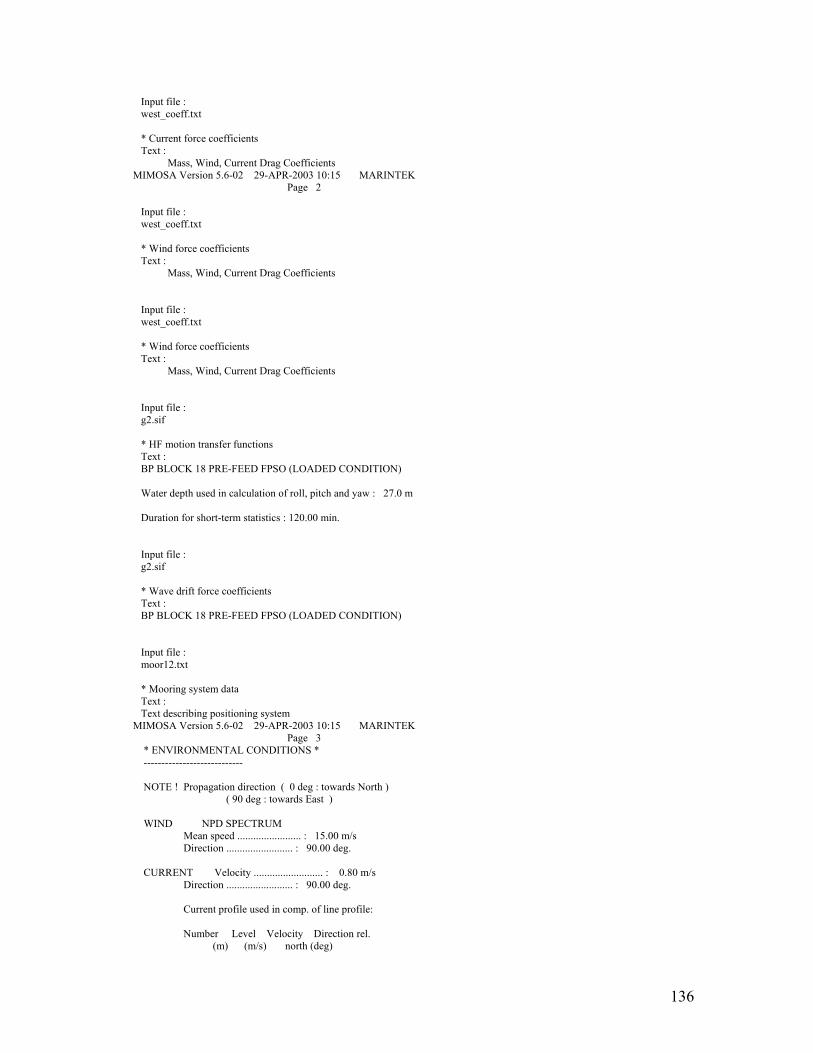
136
Input file : west_coeff.txt * Current force coefficients Text : Mass, Wind, Current Drag Coefficients MIMOSA Version 5.6-02 29-APR-2003 10:15 MARINTEK Page 2 Input file : west_coeff.txt * Wind force coefficients Text : Mass, Wind, Current Drag Coefficients Input file : west_coeff.txt * Wind force coefficients Text : Mass, Wind, Current Drag Coefficients Input file : g2.sif * HF motion transfer functions Text : BP BLOCK 18 PRE-FEED FPSO (LOADED CONDITION) Water depth used in calculation of roll, pitch and yaw : 27.0 m Duration for short-term statistics : 120.00 min. Input file : g2.sif * Wave drift force coefficients Text : BP BLOCK 18 PRE-FEED FPSO (LOADED CONDITION) Input file : moor12.txt * Mooring system data Text : Text describing positioning system MIMOSA Version 5.6-02 29-APR-2003 10:15 MARINTEK Page 3 * ENVIRONMENTAL CONDITIONS * ---------------------------- NOTE ! Propagation direction ( 0 deg : towards North ) ( 90 deg : towards East ) WIND NPD SPECTRUM Mean speed ........................ : 15.00 m/s Direction ......................... : 90.00 deg. CURRENT Velocity .......................... : 0.80 m/s Direction ......................... : 90.00 deg. Current profile used in comp. of line profile: Number Level Velocity Direction rel. (m) (m/s) north (deg)
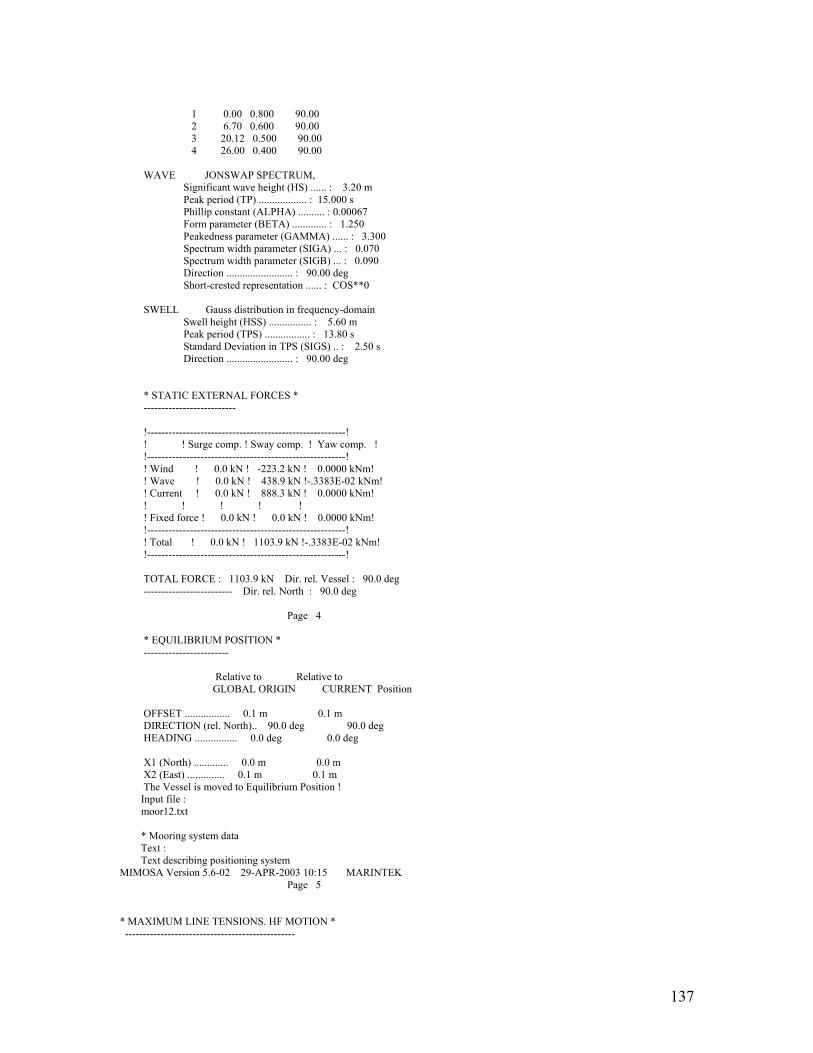
137
1 0.00 0.800 90.00 2 6.70 0.600 90.00 3 20.12 0.500 90.00 4 26.00 0.400 90.00 WAVE JONSWAP SPECTRUM, Significant wave height (HS) ...... : 3.20 m Peak period (TP) .................. : 15.000 s Phillip constant (ALPHA) .......... : 0.00067 Form parameter (BETA) ............. : 1.250 Peakedness parameter (GAMMA) ...... : 3.300 Spectrum width parameter (SIGA) ... : 0.070 Spectrum width parameter (SIGB) ... : 0.090 Direction ......................... : 90.00 deg Short-crested representation ...... : COS**0 SWELL Gauss distribution in frequency-domain Swell height (HSS) ................ : 5.60 m Peak period (TPS) ................. : 13.80 s Standard Deviation in TPS (SIGS) .. : 2.50 s Direction ......................... : 90.00 deg * STATIC EXTERNAL FORCES * -------------------------- !--------------------------------------------------------! ! ! Surge comp. ! Sway comp. ! Yaw comp. ! !--------------------------------------------------------! ! Wind ! 0.0 kN ! -223.2 kN ! 0.0000 kNm! ! Wave ! 0.0 kN ! 438.9 kN !-.3383E-02 kNm! ! Current ! 0.0 kN ! 888.3 kN ! 0.0000 kNm! ! ! ! ! ! ! Fixed force ! 0.0 kN ! 0.0 kN ! 0.0000 kNm! !--------------------------------------------------------! ! Total ! 0.0 kN ! 1103.9 kN !-.3383E-02 kNm! !--------------------------------------------------------! TOTAL FORCE : 1103.9 kN Dir. rel. Vessel : 90.0 deg ------------------------- Dir. rel. North : 90.0 deg Page 4 * EQUILIBRIUM POSITION * ------------------------ Relative to Relative to GLOBAL ORIGIN CURRENT Position OFFSET ................. 0.1 m 0.1 m DIRECTION (rel. North).. 90.0 deg 90.0 deg HEADING ................ 0.0 deg 0.0 deg X1 (North) ............. 0.0 m 0.0 m X2 (East) .............. 0.1 m 0.1 m The Vessel is moved to Equilibrium Position ! Input file : moor12.txt * Mooring system data Text : Text describing positioning system MIMOSA Version 5.6-02 29-APR-2003 10:15 MARINTEK Page 5 * MAXIMUM LINE TENSIONS. HF MOTION * ------------------------------------------------
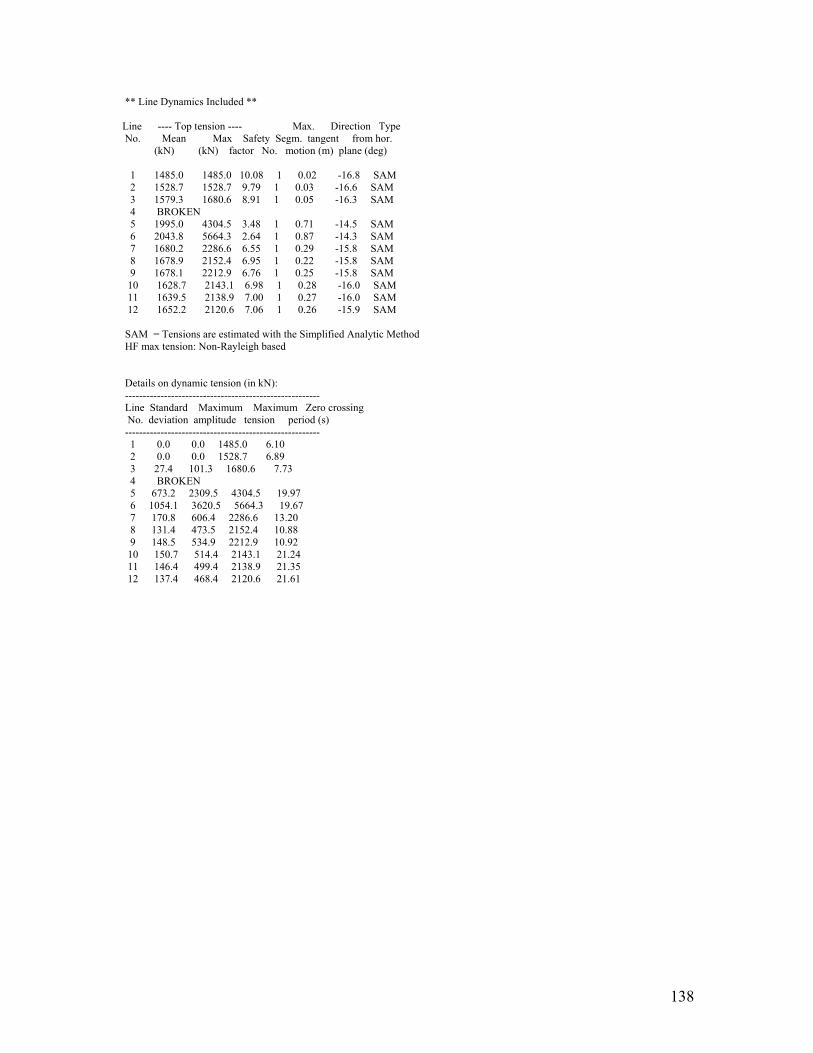
138
** Line Dynamics Included ** Line ---- Top tension ---- Max. Direction Type No. Mean Max Safety Segm. tangent from hor. (kN) (kN) factor No. motion (m) plane (deg) 1 1485.0 1485.0 10.08 1 0.02 -16.8 SAM 2 1528.7 1528.7 9.79 1 0.03 -16.6 SAM 3 1579.3 1680.6 8.91 1 0.05 -16.3 SAM 4 BROKEN 5 1995.0 4304.5 3.48 1 0.71 -14.5 SAM 6 2043.8 5664.3 2.64 1 0.87 -14.3 SAM 7 1680.2 2286.6 6.55 1 0.29 -15.8 SAM 8 1678.9 2152.4 6.95 1 0.22 -15.8 SAM 9 1678.1 2212.9 6.76 1 0.25 -15.8 SAM 10 1628.7 2143.1 6.98 1 0.28 -16.0 SAM 11 1639.5 2138.9 7.00 1 0.27 -16.0 SAM 12 1652.2 2120.6 7.06 1 0.26 -15.9 SAM SAM = Tensions are estimated with the Simplified Analytic Method HF max tension: Non-Rayleigh based Details on dynamic tension (in kN): ------------------------------------------------------- Line Standard Maximum Maximum Zero crossing No. deviation amplitude tension period (s) ------------------------------------------------------- 1 0.0 0.0 1485.0 6.10 2 0.0 0.0 1528.7 6.89 3 27.4 101.3 1680.6 7.73 4 BROKEN 5 673.2 2309.5 4304.5 19.97 6 1054.1 3620.5 5664.3 19.67 7 170.8 606.4 2286.6 13.20 8 131.4 473.5 2152.4 10.88 9 148.5 534.9 2212.9 10.92 10 150.7 514.4 2143.1 21.24 11 146.4 499.4 2138.9 21.35 12 137.4 468.4 2120.6 21.61

139
MIMOSA Version 5.6-02 29-APR-2003 10:15 MARINTEK Page 6 Input file : moor12.txt * Mooring system data Text : Text describing positioning system * MAXIMUM LINE TENSIONS. HF MOTION * ------------------------------------------------ ** Line Dynamics Included ** Line ---- Top tension ---- Max. Direction Type No. Mean Max Safety Segm. tangent from hor. (kN) (kN) factor No. motion (m) plane (deg) 1 1598.1 1598.1 8.97 1 0.02 -15.8 SAM 2 1576.7 1576.7 9.09 1 0.03 -15.9 SAM 3 1558.7 1660.7 8.63 1 0.05 -16.0 SAM 4 1558.7 2479.3 5.78 1 0.48 -16.0 SAM 5 1576.7 3225.9 4.44 1 0.75 -15.9 SAM 6 1598.1 3660.7 3.92 1 0.86 -15.8 SAM 7 1808.3 2681.7 5.35 1 0.37 -14.8 SAM 8 1835.6 2409.7 5.95 1 0.23 -14.7 SAM 9 1858.4 2466.4 5.81 1 0.23 -14.6 SAM 10 1858.4 2439.6 5.88 1 0.25 -14.6 SAM 11 1835.6 2386.7 6.01 1 0.24 -14.7 SAM 12 1808.3 2313.3 6.20 1 0.23 -14.8 SAM SAM = Tensions are estimated with the Simplified Analytic Method HF max tension: Non-Rayleigh based
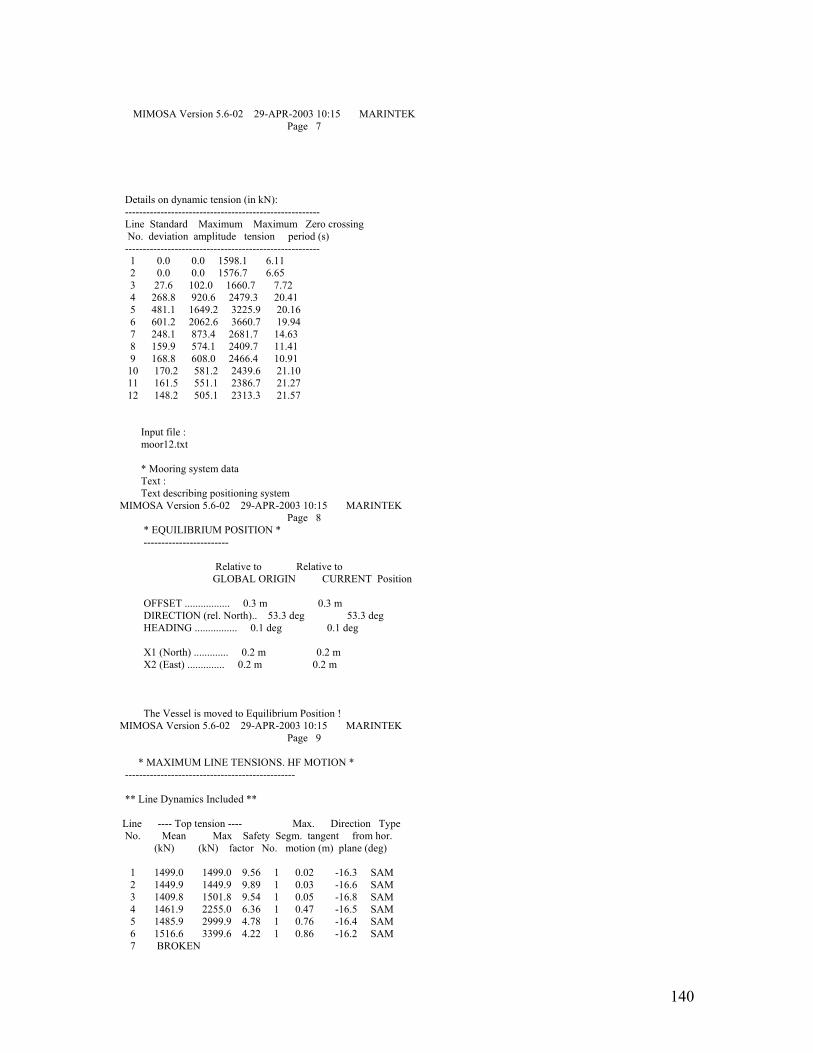
140
MIMOSA Version 5.6-02 29-APR-2003 10:15 MARINTEK Page 7 Details on dynamic tension (in kN): ------------------------------------------------------- Line Standard Maximum Maximum Zero crossing No. deviation amplitude tension period (s) ------------------------------------------------------- 1 0.0 0.0 1598.1 6.11 2 0.0 0.0 1576.7 6.65 3 27.6 102.0 1660.7 7.72 4 268.8 920.6 2479.3 20.41 5 481.1 1649.2 3225.9 20.16 6 601.2 2062.6 3660.7 19.94 7 248.1 873.4 2681.7 14.63 8 159.9 574.1 2409.7 11.41 9 168.8 608.0 2466.4 10.91 10 170.2 581.2 2439.6 21.10 11 161.5 551.1 2386.7 21.27 12 148.2 505.1 2313.3 21.57 Input file : moor12.txt * Mooring system data Text : Text describing positioning system MIMOSA Version 5.6-02 29-APR-2003 10:15 MARINTEK Page 8 * EQUILIBRIUM POSITION * ------------------------ Relative to Relative to GLOBAL ORIGIN CURRENT Position OFFSET ................. 0.3 m 0.3 m DIRECTION (rel. North).. 53.3 deg 53.3 deg HEADING ................ 0.1 deg 0.1 deg X1 (North) ............. 0.2 m 0.2 m X2 (East) .............. 0.2 m 0.2 m The Vessel is moved to Equilibrium Position ! MIMOSA Version 5.6-02 29-APR-2003 10:15 MARINTEK Page 9 * MAXIMUM LINE TENSIONS. HF MOTION * ------------------------------------------------ ** Line Dynamics Included ** Line ---- Top tension ---- Max. Direction Type No. Mean Max Safety Segm. tangent from hor. (kN) (kN) factor No. motion (m) plane (deg) 1 1499.0 1499.0 9.56 1 0.02 -16.3 SAM 2 1449.9 1449.9 9.89 1 0.03 -16.6 SAM 3 1409.8 1501.8 9.54 1 0.05 -16.8 SAM 4 1461.9 2255.0 6.36 1 0.47 -16.5 SAM 5 1485.9 2999.9 4.78 1 0.76 -16.4 SAM 6 1516.6 3399.6 4.22 1 0.86 -16.2 SAM 7 BROKEN
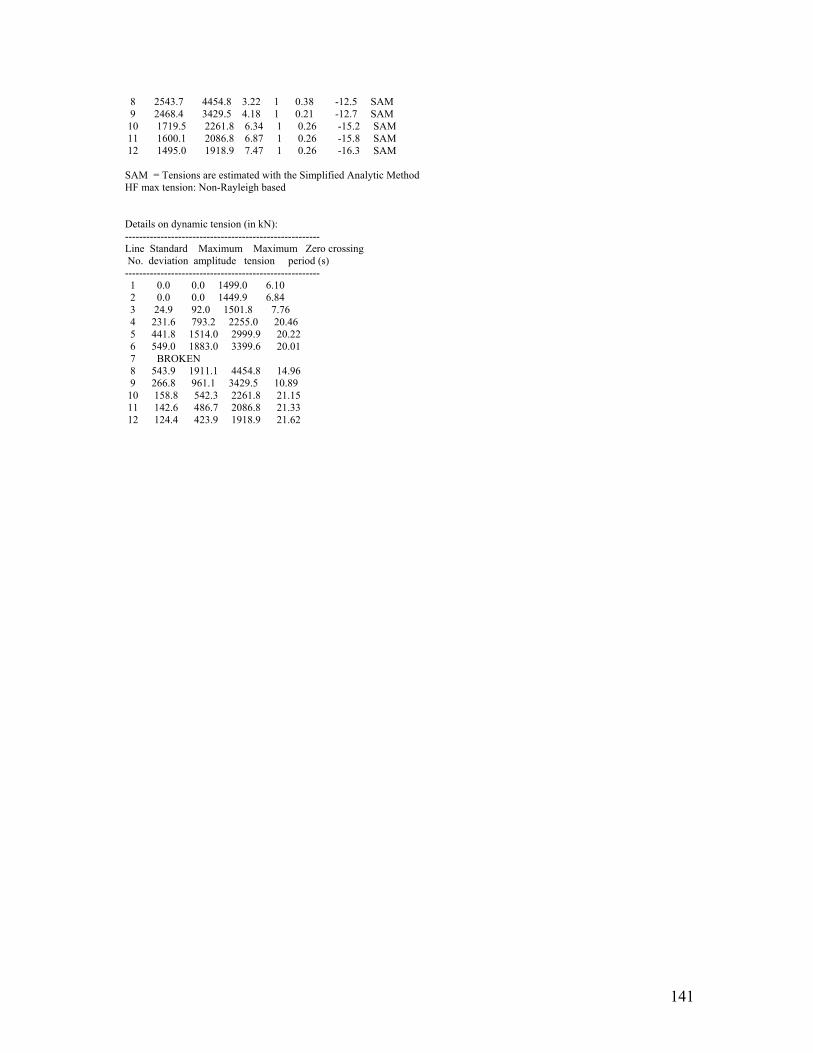
141
8 2543.7 4454.8 3.22 1 0.38 -12.5 SAM 9 2468.4 3429.5 4.18 1 0.21 -12.7 SAM 10 1719.5 2261.8 6.34 1 0.26 -15.2 SAM 11 1600.1 2086.8 6.87 1 0.26 -15.8 SAM 12 1495.0 1918.9 7.47 1 0.26 -16.3 SAM SAM = Tensions are estimated with the Simplified Analytic Method HF max tension: Non-Rayleigh based Details on dynamic tension (in kN): ------------------------------------------------------- Line Standard Maximum Maximum Zero crossing No. deviation amplitude tension period (s) ------------------------------------------------------- 1 0.0 0.0 1499.0 6.10 2 0.0 0.0 1449.9 6.84 3 24.9 92.0 1501.8 7.76 4 231.6 793.2 2255.0 20.46 5 441.8 1514.0 2999.9 20.22 6 549.0 1883.0 3399.6 20.01 7 BROKEN 8 543.9 1911.1 4454.8 14.96 9 266.8 961.1 3429.5 10.89 10 158.8 542.3 2261.8 21.15 11 142.6 486.7 2086.8 21.33 12 124.4 423.9 1918.9 21.62
142
MIMOSA Version 5.6-02 29-APR-2003 10:15 MARINTEK Input file : moor12.txt * Mooring system data Text : Text describing positioning system * EQUILIBRIUM POSITION * ------------------------ Relative to Relative to GLOBAL ORIGIN CURRENT Position OFFSET ................. 0.1 m 0.1 m DIRECTION (rel. North).. 90.0 deg 90.0 deg HEADING ................ 0.0 deg 0.0 deg X1 (North) ............. 0.0 m 0.0 m X2 (East) .............. 0.1 m 0.1 m The Vessel is moved to Equilibrium Position ! MIMOSA Version 5.6-02 29-APR-2003 10:15 MARINTEK Page 11 * EQUILIBRIUM POSITION * ------------------------ Relative to Relative to GLOBAL ORIGIN CURRENT Position OFFSET ................. 0.1 m 0.0 m DIRECTION (rel. North).. 90.0 deg 0.0 deg HEADING ................ 0.0 deg 0.0 deg X1 (North) ............. 0.0 m 0.0 m X2 (East) .............. 0.1 m 0.0 m The Vessel is moved to Equilibrium Position !
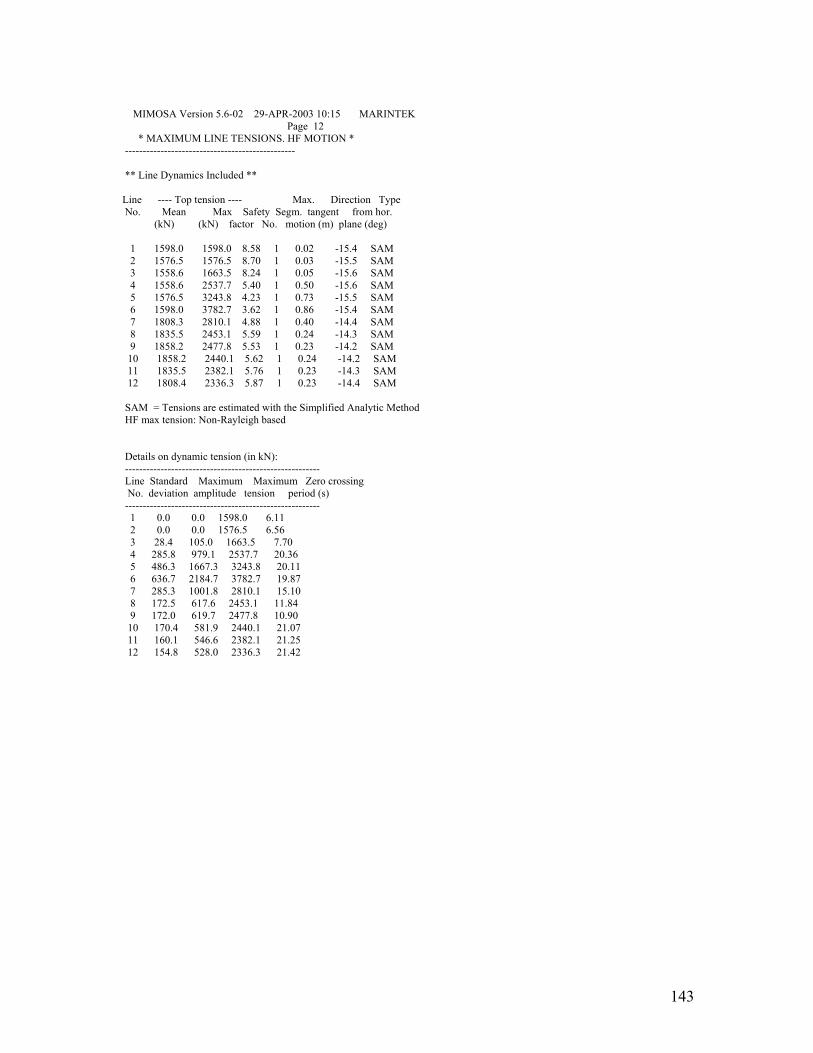
143
MIMOSA Version 5.6-02 29-APR-2003 10:15 MARINTEK Page 12 * MAXIMUM LINE TENSIONS. HF MOTION * ------------------------------------------------ ** Line Dynamics Included ** Line ---- Top tension ---- Max. Direction Type No. Mean Max Safety Segm. tangent from hor. (kN) (kN) factor No. motion (m) plane (deg) 1 1598.0 1598.0 8.58 1 0.02 -15.4 SAM 2 1576.5 1576.5 8.70 1 0.03 -15.5 SAM 3 1558.6 1663.5 8.24 1 0.05 -15.6 SAM 4 1558.6 2537.7 5.40 1 0.50 -15.6 SAM 5 1576.5 3243.8 4.23 1 0.73 -15.5 SAM 6 1598.0 3782.7 3.62 1 0.86 -15.4 SAM 7 1808.3 2810.1 4.88 1 0.40 -14.4 SAM 8 1835.5 2453.1 5.59 1 0.24 -14.3 SAM 9 1858.2 2477.8 5.53 1 0.23 -14.2 SAM 10 1858.2 2440.1 5.62 1 0.24 -14.2 SAM 11 1835.5 2382.1 5.76 1 0.23 -14.3 SAM 12 1808.4 2336.3 5.87 1 0.23 -14.4 SAM SAM = Tensions are estimated with the Simplified Analytic Method HF max tension: Non-Rayleigh based Details on dynamic tension (in kN): ------------------------------------------------------- Line Standard Maximum Maximum Zero crossing No. deviation amplitude tension period (s) ------------------------------------------------------- 1 0.0 0.0 1598.0 6.11 2 0.0 0.0 1576.5 6.56 3 28.4 105.0 1663.5 7.70 4 285.8 979.1 2537.7 20.36 5 486.3 1667.3 3243.8 20.11 6 636.7 2184.7 3782.7 19.87 7 285.3 1001.8 2810.1 15.10 8 172.5 617.6 2453.1 11.84 9 172.0 619.7 2477.8 10.90 10 170.4 581.9 2440.1 21.07 11 160.1 546.6 2382.1 21.25 12 154.8 528.0 2336.3 21.42
Related Documents