Copyright 2000, Offshore Technology Conference This paper was prepared for presentation at the 2000 Offshore Technology Conference held in Houston, Texas, 1–4 May 2000. This paper was selected for presentation by the OTC Program Committee following review of information contained in an abstract submitted by the author(s). Contents of the paper, as presented, have not been reviewed by the Offshore Technology Conference and are subject to correction by the author(s). The material, as presented, does not necessarily reflect any position of the Offshore Technology Conference or its officers. Electronic reproduction, distribution, or storage of any part of this paper for commercial purposes without the written consent of the Offshore Technology Conference is prohibited. Permission to reproduce in print is restricted to an abstract of not more than 300 words; illustrations may not be copied. The abstract must contain conspicuous acknowledgment of where and by whom the paper was presented. Abstract The objective of the Joint Industry project ‘FPSO Integrity’ is to provide insight in the fatigue loading of FPSO’s and the accuracy and validity of computational models. The results should contribute to reliable life time prediction and site assessment studies for this relative new concept of production. Within the frame work of this JIP, ‘Glas Dowr’, a new build double hull FPSO operated by Bluewater for Amerada Hess at the Durward and Dauntless fields in the North Sea, has been instrumented extensively. The objective of the instrumentation was to measure sufficient signals to derive the fatigue loading on the vessel. The dedicated monitoring system comprised the instrumentation of two cross sections of the vessel with strain gauges, pressure transducers and wave height radar’s. Also the deck and the turret were equipped with strain gauges. Both the wave induced motions and the low frequency positions and orientation of the vessel was recorded. For the analysis of the measured signals the wind, wave and current conditions have been recorded as well as the vessel parameters such as draft, trim and tank loads. Data from the Glas Dowr has been collected from October 1, 1997 to 1 August 1999. The data has been subjected to long term statistical analysis and for selected periods to more detailed spectral and statistical analysis as well as rain flow counts. The results have been used for validation of existing fatigue load calculation methods used by five classification societies and for the development of new fatigue load prediction software. INTRODUCTION For design, engineering and site assessment of Floating Production Storage and Offloading (FPSO) units, a reliable fatigue life prediction is essential. A computational model of the fatigue life of an FPSO comprises a description of the environment, a model of the fatigue loads and a model of the fatigue response. As the operation of an FPSO is completely different from a trading tanker, in 1996 a Joint Industry project named FPSO Integrity was initiated to provide insight in the fatigue loading of FPSO’s and the accuracy and validity of computational models. The background, objectives and structure of the project are described in further detail in ref [1]. The FPSO Integrity JIP comprised four major tasks: 1. Structural monitoring of FPSO ‘Glas Dowr’ operated by Bluewater for Amerada Hess on the Dauntless and Durward field in the North Sea. 2. Analysis of the measured data to derive the fatigue loads on the vessel. 3. Development of a fatigue load assessment method, which can be used for a fatigue lifetime prediction. 4. Comparative Study on the existing fatigue analysis methods currently used by the five Classification Societies involved in the project. As the ultimate goal of the project was not only development of new calculations procedures but also comparison against existing methods and real life data, the project demanded a strong input from all stakeholders in the FPSO industry. The JIP formally started on September 1, 1996 with a 3-year programme supported by the Thermie Programme of the European Community, the Dutch Ministry of Economic Affairs and sponsored amongst others: American Bureau of Shipping, Amerada Hess, Astano, Bluewater, Bureau Veritas, Chevron, Conoco, Det Norske Veritas, Germanischer Lloyd, Health & Safety Executive, Hyundai Heavy Industries, Lloyd’s Register, Marin, Mitsubishi Heavy Industries, Nevesbu, Petrobras, Shell, Statoil, Texaco. In 1998 the JIP was extended with a one year programme supported by the above companies and Daewoo Heavy Industries, Maersk Contractors, Kawasaki Heavy Industries, and Samsung Heavy Industries. OTC 12143 FPSO Integrity; Structural Monitoring of Glas Dowr Henk van den Boom (MARIN), Max Krekel (Bluewater) and Pieter Aalberts (MARIN)

Welcome message from author
This document is posted to help you gain knowledge. Please leave a comment to let me know what you think about it! Share it to your friends and learn new things together.
Transcript
Copyright 2000, Offshore Technology Conference
This paper was prepared for presentation at the 2000 Offshore Technology Conference held inHouston, Texas, 1–4 May 2000.
This paper was selected for presentation by the OTC Program Committee following review ofinformation contained in an abstract submitted by the author(s). Contents of the paper, aspresented, have not been reviewed by the Offshore Technology Conference and are subject tocorrection by the author(s). The material, as presented, does not necessarily reflect anyposition of the Offshore Technology Conference or its officers. Electronic reproduction,distribution, or storage of any part of this paper for commercial purposes without the writtenconsent of the Offshore Technology Conference is prohibited. Permission to reproduce in printis restricted to an abstract of not more than 300 words; illustrations may not be copied. Theabstract must contain conspicuous acknowledgment of where and by whom the paper waspresented.
AbstractThe objective of the Joint Industry project ‘FPSO Integrity’ is toprovide insight in the fatigue loading of FPSO’s and theaccuracy and validity of computational models. The resultsshould contribute to reliable life time prediction and siteassessment studies for this relative new concept of production.
Within the frame work of this JIP, ‘Glas Dowr’, a new builddouble hull FPSO operated by Bluewater for Amerada Hess atthe Durward and Dauntless fields in the North Sea, has beeninstrumented extensively.The objective of the instrumentation was to measure sufficientsignals to derive the fatigue loading on the vessel. Thededicated monitoring system comprised the instrumentation oftwo cross sections of the vessel with strain gauges, pressuretransducers and wave height radar’s. Also the deck and theturret were equipped with strain gauges. Both the waveinduced motions and the low frequency positions andorientation of the vessel was recorded. For the analysis of themeasured signals the wind, wave and current conditions havebeen recorded as well as the vessel parameters such as draft,trim and tank loads. Data from the Glas Dowr has beencollected from October 1, 1997 to 1 August 1999. The datahas been subjected to long term statistical analysis and forselected periods to more detailed spectral and statisticalanalysis as well as rain flow counts.The results have been used for validation of existing fatigueload calculation methods used by five classification societiesand for the development of new fatigue load predictionsoftware.
INTRODUCTION
For design, engineering and site assessment of FloatingProduction Storage and Offloading (FPSO) units, a reliablefatigue life prediction is essential. A computational model ofthe fatigue life of an FPSO comprises a description of theenvironment, a model of the fatigue loads and a model of thefatigue response.
As the operation of an FPSO is completely differentfrom a trading tanker, in 1996 a Joint Industry project namedFPSO Integrity was initiated to provide insight in the fatigueloading of FPSO’s and the accuracy and validity ofcomputational models. The background, objectives and structureof the project are described in further detail in ref [1].
The FPSO Integrity JIP comprised four major tasks:1. Structural monitoring of FPSO ‘Glas Dowr’ operated by
Bluewater for Amerada Hess on the Dauntless andDurward field in the North Sea.
2. Analysis of the measured data to derive the fatigue loadson the vessel.
3. Development of a fatigue load assessment method, whichcan be used for a fatigue lifetime prediction.
4. Comparative Study on the existing fatigue analysismethods currently used by the five Classification Societiesinvolved in the project.
As the ultimate goal of the project was not only developmentof new calculations procedures but also comparison againstexisting methods and real life data, the project demanded astrong input from all stakeholders in the FPSO industry.
The JIP formally started on September 1, 1996 with a3-year programme supported by the Thermie Programme ofthe European Community, the Dutch Ministry of EconomicAffairs and sponsored amongst others: American Bureau ofShipping, Amerada Hess, Astano, Bluewater, Bureau Veritas,Chevron, Conoco, Det Norske Veritas, Germanischer Lloyd,Health & Safety Executive, Hyundai Heavy Industries,Lloyd’s Register, Marin, Mitsubishi Heavy Industries,Nevesbu, Petrobras, Shell, Statoil, Texaco. In 1998 the JIPwas extended with a one year programme supported by theabove companies and Daewoo Heavy Industries, MaerskContractors, Kawasaki Heavy Industries, and Samsung HeavyIndustries.
OTC 12143
FPSO Integrity; Structural Monitoring of Glas DowrHenk van den Boom (MARIN), Max Krekel (Bluewater) and Pieter Aalberts (MARIN)

2 HENK VAN DEN BOOM (MARIN), MAX KREKEL (BLUEWATER) AND PIETER AALBERTS (MARIN) OTC 12143
The objective of the measurement campaign was to collectreal life data to be used for the understanding of fatigue loadson FPSO’s, for the development of computational models andfor the validation of new and existing fatigue load predictionmodels such as operated by the five classification societiesinvolved in the JIP. For this purpose FPSO Glas Dowr,converted from a new built double hull tanker was equippedwith a dedicated structural monitoring system. Extensive datasets were derived from the system during the operation of theGlas Dowr on the Durward and Dauntless field in the NorthSea from October 1997 to July 1999.
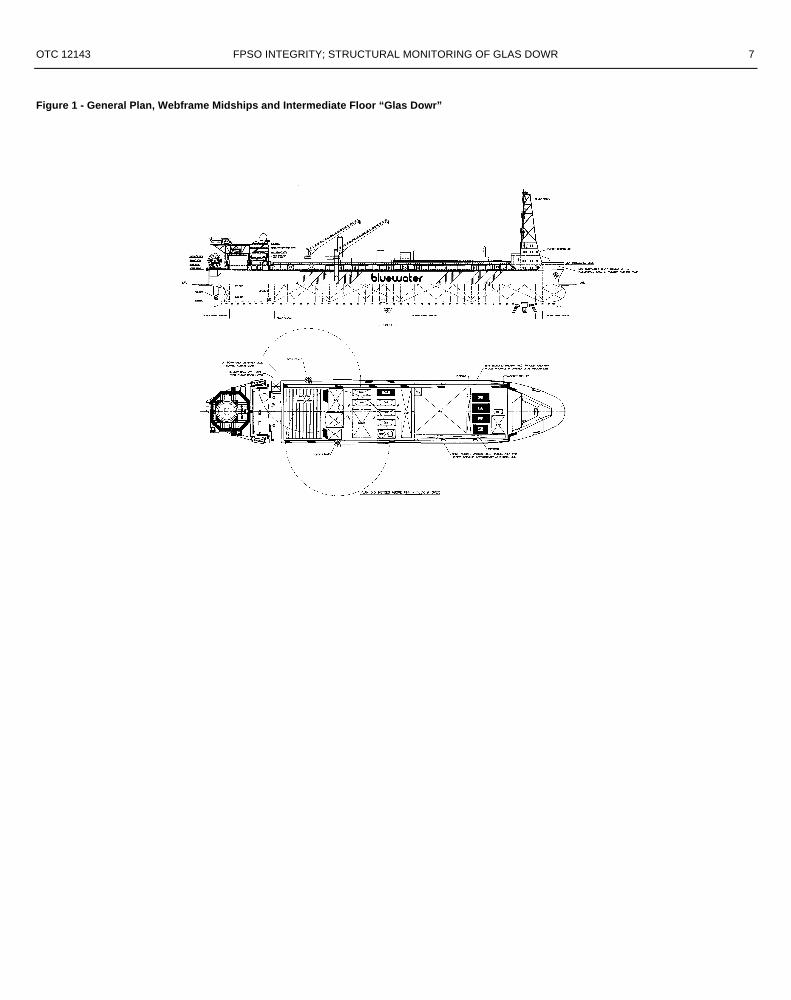
‘Glas Dowr’ is the fifth FPSO owned and operated byBluewater, and its second operating on the UKCS. A generalarrangement is shown in Fig. 1. She produced the Durwardand Dauntless fields, in UK blocks 21/11 and 21/16, on behalfof Amerada Hess Limited from august 1997 to august 1999.The fields are located some 150 nm east of Aberdeen. Thelocal water depth is about 75 m. A more detailed descriptionof the FPSO can be found in ref [1].
The present paper describes the measurement campaign onboard FPSO Glas Dowr and the analysis of the collected data(task 1 & 2 in the JIP), whereas the work performed by theclassification societies and the comparison of their results withthose from the measurements is described in ref. [2].
MONITORING SYSTEM
GeneralAiming at the fatigue loads on FPSO’s, measurement of actualloads and responses on an FPSO in service was consideredessential for the study from the very start. The objectives ofthe measurements were to provide a better insight in thephysical phenomena, to support mathematical modelling andto produce benchmark data for validation of computationalmodels, engineering methods. Fatigue loads on a vessel cannot be measured directly. In general fatigue originates fromvarious internal and external loads such as wave, cargo, wind,current and mooring loads. The occurrence of these loads theirmagnitude and frequency region all vary in time. The forcesmay introduce overall fatigue loads (hogging and sagging ofthe hull) as well as local hull loads.
By measuring the response of the hull e.g. strains incombination with the governing parameters of the excitationsources such as the wave elevation, one may be able todistinguish the various fatigue loading components. Toevaluate global and local response and load components,however, the instrumentation should cover a fair share of thestructure as well as the details of the environmental conditions.Both low cycle large amplitude loads and high cycle lowamplitude loads contribute to fatigue damage. For this reasonnot only severe storm conditions are relevant but also milderweather is relevant for fatigue monitoring.
Another important aspect of FPSO’s in service is that althoughthey are permanently moored, their loading and response cannot be considered as a stationary process. Due to production,storage, ballast and offloading the tanker condition changescontinuously. For the evaluation of the results the status of thevessel (e.g. draft, trim tank loads) should be known at alltimes.
As the response has to be related to the input the wave, windand current condition are extremely important and have to berecorded continuously.
Weather varies from hour to hour not only in magnitude butalso in direction. Due to its mooring the vessel not only movesat wave frequencies but also around the ‘natural frequencies’of the moored system with large amplitudes. Although theforward positions of the turret enable the FPSO toweathervane; in specific situations waves may encounter thevessel from other directions than head on. Vessel motions andheading are therefore needed in the analysis.
Essential for the design of the structural monitoring system isthe modelling of fatigue loading; selection of measurements,analysis of the measured signals and coding of a fatigue loadprediction software all depend on a basic model describing thefatigue load processes. Starting at existing computationalmodels for fatigue loads on ships several areas were identifiedto which in this measurement campaign additional attention isbeing paid (see ref. [5]). An example of this is the well known‘side shell fatigue loading’ which can not be represented bythe linear hydrodynamic model.
Based on the general objectives, experiences from similarcampaigns, the identified specific areas of interest, fatiguemodelling hypothesis and restrictions of the vessel in 1996 afully automated structural monitoring system for the FPSO‘Glas Dowr’ has been designed, assembled and shop tested.
Steelwork preparation on the vessel was conducted by the endof 1996 and the actual instrumentation of the vessel wascarried out early 1997. The structural monitoring systemstarted to deliver results on October 1, 1997. Below theinstrumentation is presented in further detail. Wave and cargopressures and structural response. To derive the fatigueloading the structural response of the vessel as well as relevantload variables were measured at two cross sections of thevessel; at half length (frame 66.5) and approximately at aquarter length from the bow (frame 81.5). At these two crosssections the measurements are aiming at the followingquantities:• global and local hull strains• cargo and ballast tank pressures• external water pressure• relative wave heights
OTC 12143 FPSO INTEGRITY; STRUCTURAL MONITORING OF GLAS DOWR 3
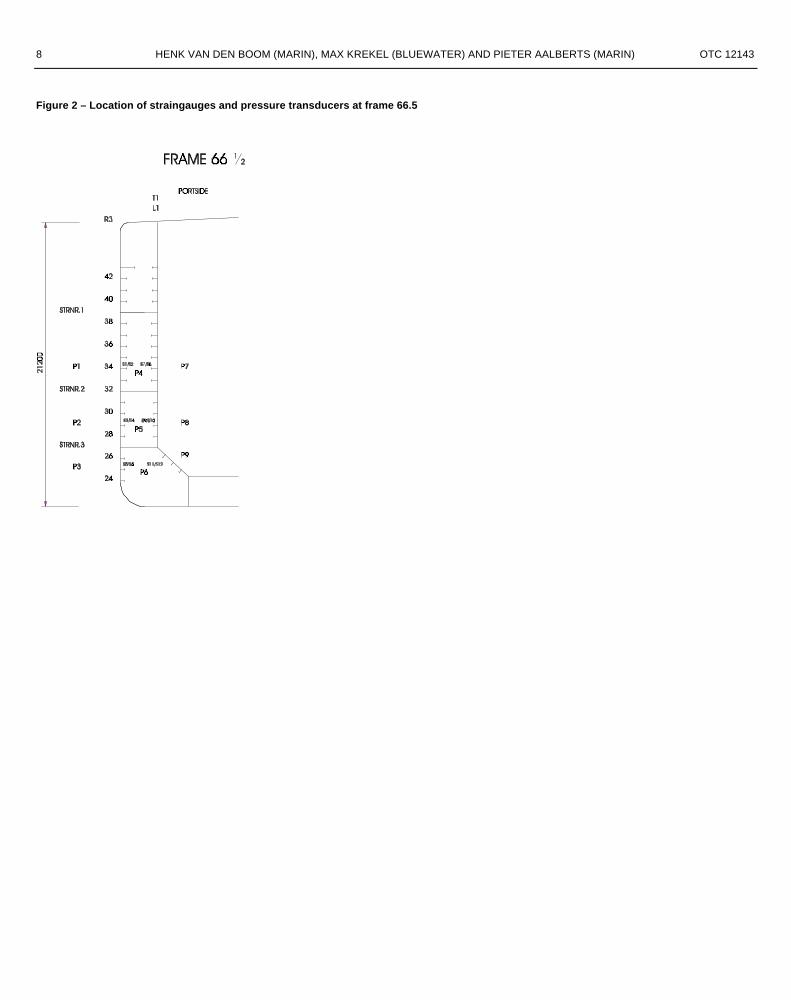
To measure local hull strains, some longitudinals in the ballasttanks were instrumented with strain gauges. The strain gaugeswere fitted at three levels with special attention to the splashedzone (see Figure 2).
Both the plate side and the flange side of the longitudinal webwere instrumented. For redundancy for each gauge a spare wasfitted and cabled.In April 1998 an increasing number of strain gauges failed toprovide reliable stress data. Inspection in the ballast tanks inJuly confirmed the diagnosis that something was wrong withthe coating of the gauges. For this reason all strain gauges inthe tanks were replaced by the end of October 1998. Fromthen on the gauges have been working reliable and accurate.
To derive the global hull strains so-called ‘long base straingauges’ were fitted on the main deck of the vessel on port andstarboard side longitudinal bulkheads. These gauges actuallyare high accuracy displacement devices measuring thedistance between the two end-points. The LBSG’s haveperformed well throughout the campaign.
In the inner hull pressure gauges were fitted to measure theinstantaneous pressures due to oil (centre tanks) and ballastwater (side tanks). Although sloshing is not expected tocontribute significantly to the overall fatigue, the dynamicloading of the cargo and ballast water as moving mass may beimportant. To measure the local pressures excited by waveaction, pressure gauges were fitted in the outside hull at threelevels and both sides of the vessel. The relative wave height atthe location of the strain and pressure devices is recorded bymeans of a doppler radar fitted on dedicated platforms outsidethe hull at deck level. These radar’s have proven to measurethe wave elevation accurately even in fog, spray and greenwater conditions. In total seven radar’s are installed; on portand starboard side of the two measurement cross sections andin front of the superstructure and one at the bow of the vessel.By subtracting the measured vessel motions from themeasured relative wave height the absolute wave heightaround the vessel can be derived.
The bow radar also provides redundant incident wave data. Byaccounting for the waves diffracted by the vessel also theincident wave spectrum can be derived from this device.
The 7 wave radar’s around the deck of ‘Glas Dowr’ haveperformed very well during the campaign. One radar at thestern quarters was damaged probably by crane operations andthe radar at the bow needed to be replaced once due to wavedamage. The highest waves; i.e. 10 m. significant wave heightwere recorded accurately.
MotionsThe motions of the FPSO are of prime importance for thefatigue loading. Motions induced by first order wave forces,
result in accelerations and thus in inertial loads due to thecargo and ballast masses, deck loads and the own mass of thesteel. Depending on the location on the vessel theseaccelerations may be dominated by heave, pitch or roll butnormally contain contributions from all six modes of motion.Due to its mooring the FPSO also moves in the horizontalplane at low frequencies which are determined by the stiffnessof the mooring, the mass of the vessel and low frequencyexcitations such as second order wave drift forces and windgusts. As the hydrodynamic damping of the vessel at these lowfrequencies is small the motions have a resonant characterwith large amplitudes.
The contribution of these motions to the inertia loads innegligible. Combined with the first order motions, however,they are responsible for the dynamic peak loads in the mooringlines and in the turret system.The low frequency yaw motion or heading of the vessel resultsfrom the wave, wind and current conditions and theweathervaning characteristics of the vessel. The headingdetermines the relative wave direction and is thereforeconsidered as a prime parameter in the fatigue loads.
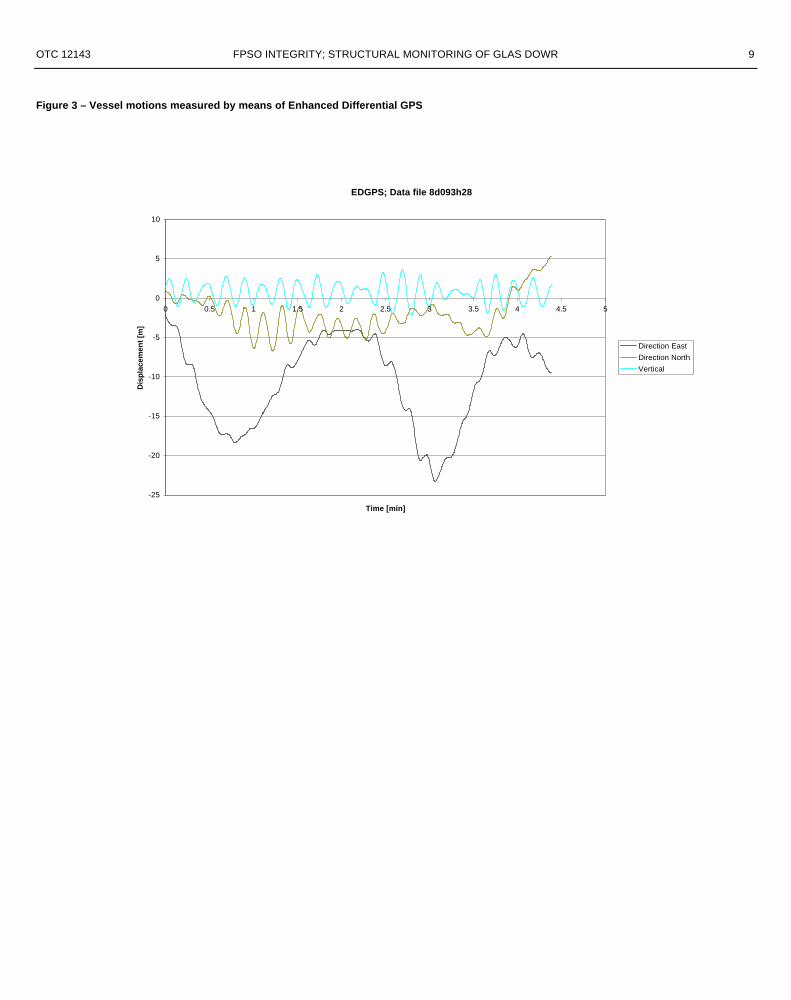
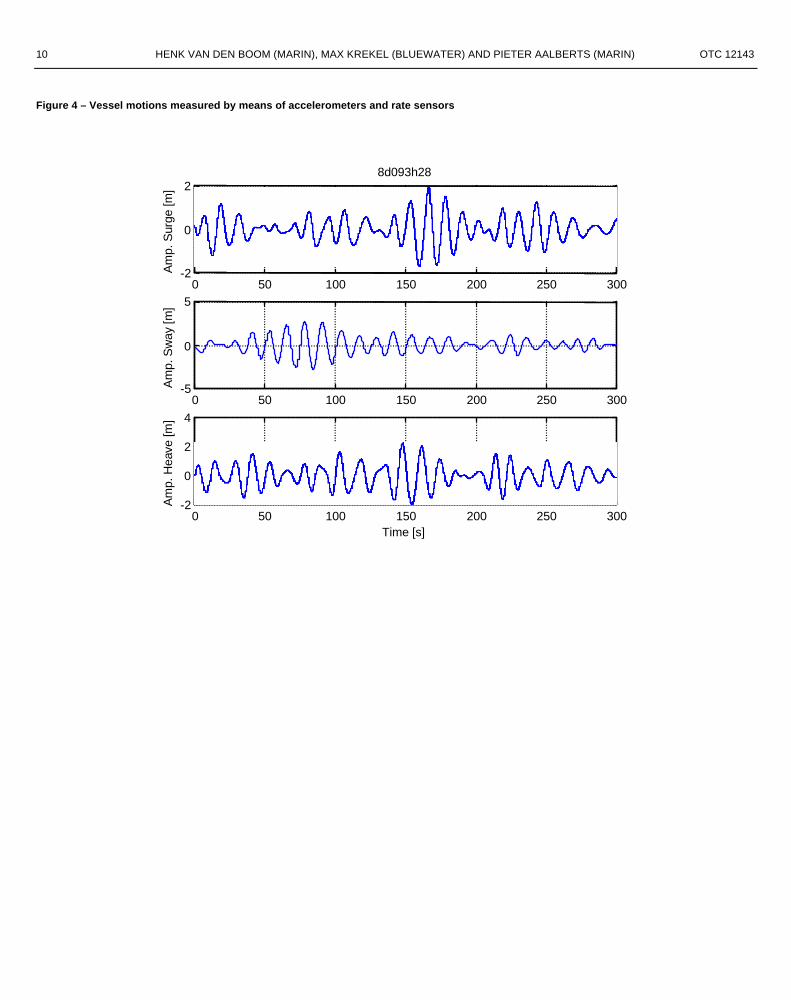
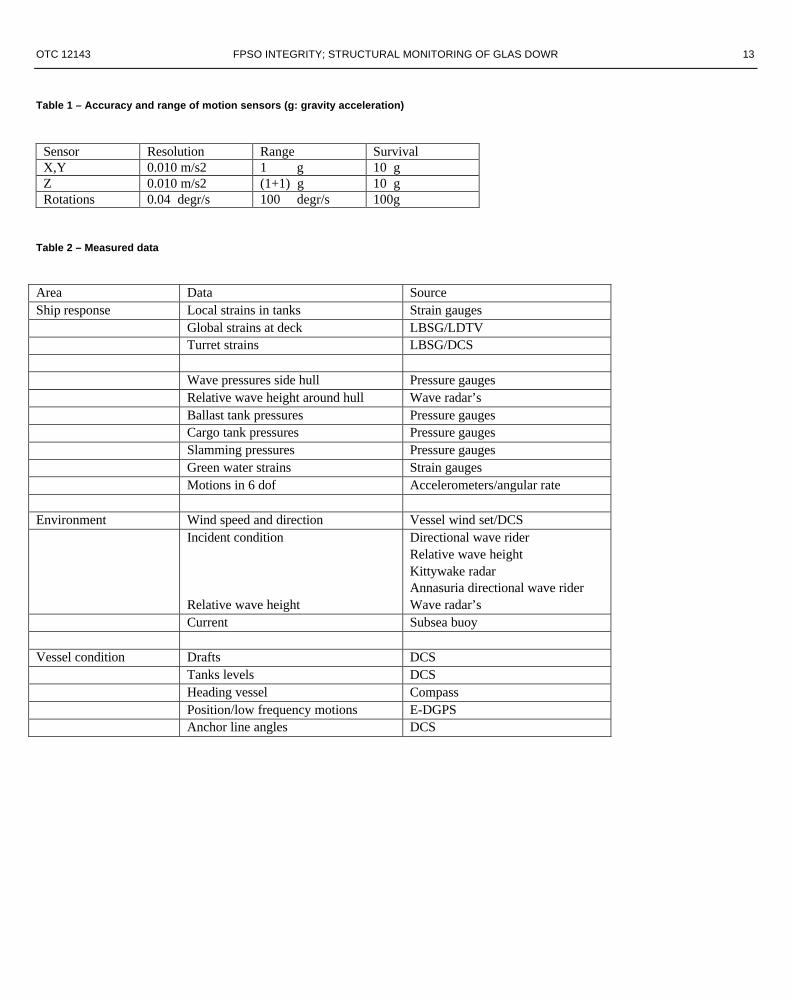
As the frequency ranges and accuracy requirements for eachof the above motions strongly varies different devices are usedfor their recordings (ref. [9]). For motions at wave frequencies(typical periods 2 to 20 seconds) use is made ofaccelerometers and angular rate sensors. These sensors haveproven to be reliable and accurate as indicated by Table 1 andFigures 3 and 4. A benefit of the angular velocity sensors formeasuring rotations is that a compact sensor unit such as theMarin Quality Kit can be placed anywhere on a vessel torecord all six modes of motion. On board “Glas Dowr”additional accelerometers have been installed for sensingimpacts and for redundancy and quality control reasons.Heading of the FPSO is recorded by means of a dedicated fluxgate compass
For the recording of the low frequency motions of Glas Dowruse is made of an Enhanced Differential GPS-system. Thissystem comprises the normal GPS satellites, as well as adedicated reference station which for this purpose was locatedon the Kittywake platform some 10 miles from the Durwardand Dauntless fields. By advanced processing the ED-GPSsystem is capable of recording the position of the vessel within0.30 m.
Figures 3 and 4 present the motions as derived from theaccelerometers and from the ED-GPS system. Whencomparing these two motion recordings we have to keep inmind the frequency range of the systems as well as themagnitude of the motions. The recordings were made on April3, 1997 when Glas Dowr experienced waves with a significantheight of 10 m.
Although mooring loads were not considered to contributesignificantly to the fatigue damage of the hull, the loads in the

4 HENK VAN DEN BOOM (MARIN), MAX KREKEL (BLUEWATER) AND PIETER AALBERTS (MARIN) OTC 12143
mooring system is important for the fatigue behaviour of themooring it self. Furthermore recording of the mooring loadsenables the validation of computational models andengineering methods for prediction of motions, mooring linetensions and turret loads. For these reasons the turret wasequipped with long base strain gauges. At two levels of theturret 6 gauges were fitted around the structure. The mooringwinches are equipped with inclinometers so these signalscould also be logged. The signals of the long base straingauges were put on the DCS together with the inclinometersignals in order to get them to the data acquisition system.
Slamming and Green WaterRecent experiences with FPSO’s and FSU’s in the North Seaand North Atlantic have shown that green water may causesevere damage to the top sides, in particular the turret houseand forecastle deck.
To obtain full scale data on bow slamming and green waterimpact, “Glas Dowr” was equipped with two pressure gaugesunderneath the bulbous bow and several accelerometers andstrain gauges in the bow structure and the turret housing abovedeck. Together with the wave radar in front of the bow,slamming and green water events can be distinguished fromthe recorded pressures, accelerations and strains.
Environmental conditionsLoads on the vessel originate for a large part from theenvironment i.e. the waves, current and wind. For structuralloads also the temperature (and the orientation with respect tothe sun) is of importance. To analyse the measured data and toderive useful information it is therefore essential to recordthese environmental conditions accurately. In the case of GlasDowr much attention has been paid to collect theenvironmental conditions. Besides the 7 wave radar systemson board the vessel, a dedicated directional wave rider buoywas moored approx. 1 nm. West of the vessel. This buoytransmitted the undisturbed wave record, spectrum anddirectionality to the vessel.
During the campaign the wave rider buoy was disabled certainperiods. The lack on wave data from the buoy was resolved byderiving data from various other sources such as:- relative wave height measured around the vessel by
means of radar’s- wave radar on the Shell Kittywake platform some 10
nm away- directional wave rider buoy at Shell’s FPSO Anasuria
on the Teal field- wave hindcasting.
By utilizing these additional sources the wave conditionsencountered during the measurement campaign could bederived with sufficient quality.
Wind direction and velocity is measured on the Glas Dowr andis available from DCS.
Operational conditionsFor the analysis and interpretation of the measured data theactual condition of the vessel is of prime importance. For thisreason the structural monitoring system was connected to theon-board DCS which provided valuable vessel conditions suchas draft, trim, cargo and ballast tank loads. The on-board DCSwas also used to transport data from the turret to the mainmonitoring computer.
DATA COLLECTED
The monitoring system and the sensors used are described inthe previous section. An overview of the type of data is givenin Table 2.
The monitoring campaign on board Glas Dowr started onOctober 1, 1997 and was completed in July 1999. In these 20months the automated monitoring system has been connectedto DCS, fully commissioned, tested and inspected with regularintervals. Maintenance, repair and replacement of componentshave been conducted when needed and when possible in viewof the production operation and travel schemes.
Major problems encountered during the campaign concerned:- The vessels DCS-system which came into operation
late and was linked in April 1998- The straingauges in the ballast tanks suffering from
corrosion (replaced September 1998)- The bad receipt of reference signal for the Enhanced
capability of the Differential GPS- The wave rider buoy (lost in May 1998 and December
1998)- The sub sea current meter which could not be
recovered in October 1999.
An overview of the availability of the signals i.e. the actualdata collected over the complete measurement campaign isgiven in Table 3.Despite the above problems, the data collection over the fullcampaign of 20 months covered 74 per cent of the time withan average of 90 per cent of the desired signals.
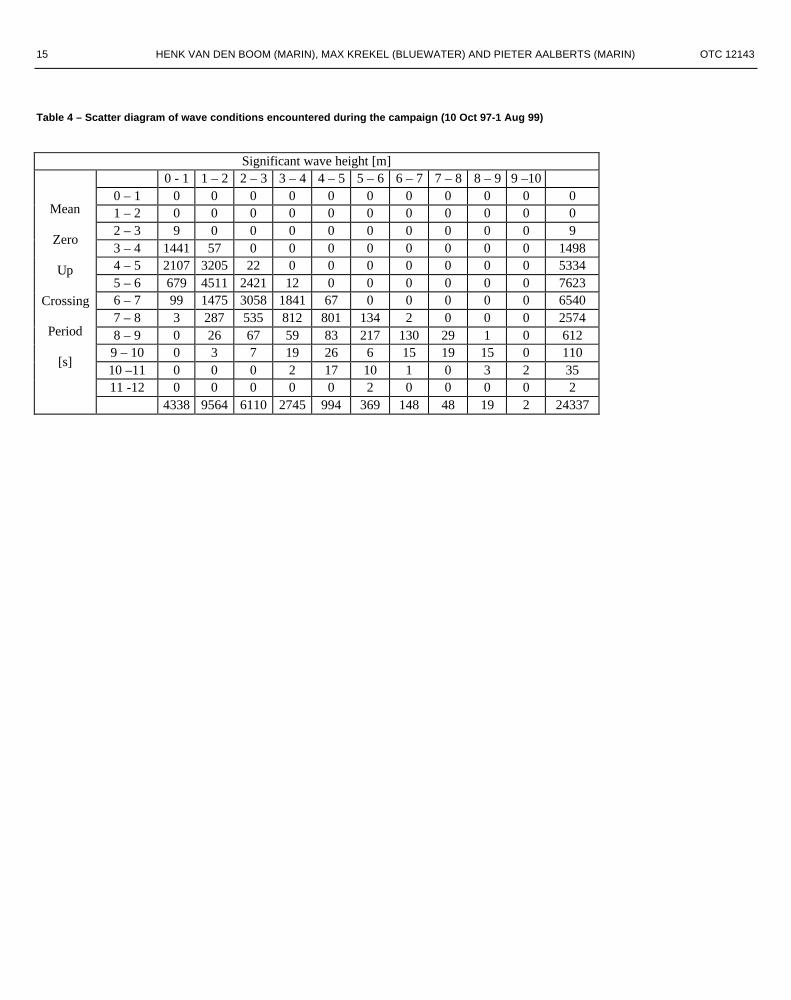
Encountered wave conditionsThe wave conditions encountered during the measurementcampaign from October 1, 1997 to August 1, 1999, arerepresented in the wave scatter diagram in Table 4. Asillustrated by the diagram the campaign covered the completerange of wave conditions representative for the Central NorthSea. The highest waves were encountered during the storm onApril 3, 1998 where significant wave heights up to 10 meter

OTC 12143 FPSO INTEGRITY; STRUCTURAL MONITORING OF GLAS DOWR 5
were measured. In these steep wave condition the monitoringsystem was fully operational including the directional waverider buoy and a set of high quality data for the present JIP andfuture work was obtained.
DATA ANALYSIS
GeneralTo perform a fatigue assessment for a specific ship, it isnecessary to know the structure’s behaviour under a widerange of environmental and operational conditions. Theserelations were derived directly from the full-scale data bysimultaneously monitoring the environmental conditions,loading conditions and the ship’s response.The time records derived from the measurements areprocessed in three steps. Firstly every month so-called long-term statistics were derived. For each signal mean, average,extreme values and standard deviation are derived and plottedas function of time. These results are used for overall qualitychecks of the system and for general purposes. Over thecomplete duration of the projects statistics are being collected.For example a wave scatter diagram of the encountered seaconditions is established.
From these monthly records specific periods with a duration of30 minutes were selected on the basis of stationary behavior,weather etc. For these selected periods detailed so-called‘short term’ spectral and statistical analysis have beenconducted.
Subsequently signals were combined into quantities relevantfor fatigue loading such as global and local strains for furtherevaluation and comparison with computational results.
The strain in the stiffeners due to different load componentswas investigated. Using the strains, measured by the LongBase Strain Gauges, and the strains, measured by the localstrain gauges in the stiffeners, the strain due to global hullgirder bending, outer pressures and inner pressures has beencalculated. Correlations between different signals wereinvestigated.
Long Term AnalysisThe Long Term Analysis consisted of the calculation of thestatistics (mean, minimum, maximum and standard deviation)per data file (half hour) for all measured and calculatedsignals.
The measured signals comprise:Ship’s Distributed Control System (DCS):• Turret strain• Wind velocity
• Wind direction• Draft fore and draft aft• Level in water ballast tanks• Level in cargo oil tanks• Anchor anglesStructural Monitoring system• Relative wave height• Accelerations and angular velocities• Pressure• Temperature• Strain• Heading vessel
Also statistics have been presented for motions in 6 d.o.f. atc.o.g., motions at specific locations and hull girder bendingmoments.
The motions were calculated using the local accelerometers.The vertical bending moments were derived using the LongBase Strain Gauges mounted on deck.
Presented wave data, comprise the significant wave height, themean zero up crossing period and the wave direction. Thewave direction has been presented for the wave with thehighest spectral energy. The wave direction has beenpresented both absolute and relative to the vessel, using dataof the heading of the vessel.The wind direction has been presented absolute to the vessel.
One statistic file was generated for each data tape, whichcontains data files for one week. After four weeks data, theresults of the statistics have been reported. Examples of thelong term analysis results are presented in Figure 5.
Long term analysis have been conducted over the entireduration of the measurements on a monthly basis.
Short Term AnalysisUsing the performed Long Term Analysis, interesting periodswere chosen, which were analysed in more detail.The selection criteria of the data for the Short Term Analysiswere:• Stable environmental conditions.The measured wave spectra during recording of the data filesjust before and just after recording of the selected data fileshould be almost equal to the wave spectra during recording ofthe selected data file itself. Also the standard deviation for theheading of the vessel during recording of the selected data fileshould be small (5 degrees)• A sea state was chosen, in order to fill a scatter diagram.• Storm conditions were preferable.
6 HENK VAN DEN BOOM (MARIN), MAX KREKEL (BLUEWATER) AND PIETER AALBERTS (MARIN) OTC 12143
The Short Term Analysis consists of data analysis per file(half hour data).
The motions (see Long Term Analysis), hull girder bendingmoments and the membrane and bending strain componentshave been calculated. For these data, including the measuredpressures, strains and relative wave heights a standard analysishas been performed and presented in a separate subdocumentwhich comprises (see Figure 6):• Time traces (300 seconds)• Spectra• Transfer functions over the waves• Rain-flow counts
For each measured or calculated signal some statistical andspectral values have been given. A theoretical rain-flow countdistribution has been computed and presented as well,assuming a Raleigh distribution using the total number ofmeasured cycles.
Disturbed wave spectra at the radar locations have beencalculated using the measured motions.Relations between different signals were investigated.
Transfer functions between the relative wave height, measuredby the wave radar’s and the outer pressures have beencomputed and compared with a theoretical pressure model.Also transfer functions have been determined between themeasured pressures and the bending strain components in thestiffeners. These transfer functions have been compared withcalculations using a theoretical beam model.
Using symmetric considerations, the membrane straincomponents and long base strain gauge data was divided intostrain due to horizontal and vertical hull girder bending. Theresults were related to each other and have been comparedwith the simple beam model.
Fatigue damage per half hour according to fatigue Class B, C,D, E, F, F2, G and W for the locations strain gauges have beenwelded, have been calculated.
CONCLUSIONS
FPSO “Glas Dowr” was equipped with an structuralmonitoring system collecting automatically and continuouslyall data relevant for fatigue loads on the FPSO as well as herresponse; i.e. wave, ballast and cargo pressures, motions,global and local strains, ship condition and weather conditions.
During 22 months of her production on Durward andDauntless field in the North Sea, FPSO Glas, data has beencollected during 74% of the operational time and an average of90% of the installed sensors.
The measured data sets comprise a large variety of waveconditions including severe storms with significant waveheights up to 10 m (corresponding to maximum wave height.19 m). Extensive and valuable data sets both for fatigue loadanalysis and method verification were derived and used withinthe project (see ref [2]). Same data sets can be used for futureR&D on related aspects such as green water analysis.
A structural monitoring system as developed for ‘Glas Dowr’provides reliable data on the actual extreme fatigue andincident loads on an FPSO and the fatigue damageexperienced.Long term analysis on the measured data have been conductedand long term statistics reported on a monthly basis. Forselected periods short term analysis have been performed andreported.
References
1. Bultema S., Krekel M. and Boom van den H.J.J., FPSO Integrity;Joint Industry project on Fatigue Loads OTC 12142, Houston,May 2000.
2. Francois, M., Healy B., Fricke W., Mitchel K. and Mo O., FPSOIntegrity; Comparative study on fatigue load calculation methodsOTC 12144, Houston, May 2000.
3. Kaminski, M.L. and Krekel M.; “Reliability analysis offatigue sensitive joints in FPSO”, OMAE 95, Copenhagen, 1995.
4. Potthurst R. and Mitchell K.; “Verification of FPSO StructuralIntegrity” PRADS ’98, The Hague, 1998.
5. Shin, Y. C. Lee and Jones D.E.; “Integrated Motion, Load andStructural Analysis for Offshore Structures”, PRADS’98, TheHague, 1998.
6. Payer, H.G. and Fricke W.: “Rational Dimensioning and Analysisof Complex Ship Structures”, SNAME Annual meeting, NewOrleans, 1994.
7. Adegeest, L.J.M.; “Non-linear Hull Girder Loads in Ships” PhDThesis, Delft, 1995.
8. Erb, P.R., Jeffrys E.R., Mercier J.A. and Peters D.J.H.: “Lessonsfrom TLP Performance Measurements”, Proceedings MarinJubilee Meeting, ISBN 0444 894683, Wageningen 1992.
9. Boom, H.J.J. van den; “Mooring and Dynamic Positioning” 23rd
WEGEMT, Full Scale Surveys of the Performance of Ships andPlatforms, Genova, 1997.
OTC 12143 FPSO INTEGRITY; STRUCTURAL MONITORING OF GLAS DOWR 7
Figure 1 - General Plan, Webframe Midships and Intermediate Floor “Glas Dowr”
8 HENK VAN DEN BOOM (MARIN), MAX KREKEL (BLUEWATER) AND PIETER AALBERTS (MARIN) OTC 12143
Figure 2 – Location of straingauges and pressure transducers at frame 66.5
OTC 12143 FPSO INTEGRITY; STRUCTURAL MONITORING OF GLAS DOWR 9
Figure 3 – Vessel motions measured by means of Enhanced Differential GPS
EDGPS; Data file 8d093h28
-25
-20
-15
-10
-5
0
5
10
0 0.5 1 1.5 2 2.5 3 3.5 4 4.5 5
Time [min]
Dis
pla
cem
ent
[m]
Direction East
Direction North
Vertical
10 HENK VAN DEN BOOM (MARIN), MAX KREKEL (BLUEWATER) AND PIETER AALBERTS (MARIN) OTC 12143
Figure 4 – Vessel motions measured by means of accelerometers and rate sensors
0 50 100 150 200 250 300-2
0
28d093h28
Am
p. S
urge
[m]
0 50 100 150 200 250 300-5
0
5
Am
p. S
way
[m]
0 50 100 150 200 250 300-2
0
2
4
Time [s]
Am
p. H
eave
[m]

OTC 12143 FPSO INTEGRITY; STRUCTURAL MONITORING OF GLAS DOWR 11
Figure 5 – Long term analysis
Vertical bending moment fr 66.58 Nov. 1998 – 6 Dec. 1998

12 HENK VAN DEN BOOM (MARIN), MAX KREKEL (BLUEWATER) AND PIETER AALBERTS (MARIN) OTC 12143
Figure 6 – Short term analysis
Vertical bending moment fr 66.5Nov. 20, 1998 5:30pm
OTC 12143 FPSO INTEGRITY; STRUCTURAL MONITORING OF GLAS DOWR 13
Table 1 – Accuracy and range of motion sensors (g: gravity acceleration)
Sensor Resolution Range SurvivalX,Y 0.010 m/s2 1 g 10 gZ 0.010 m/s2 (1+1) g 10 gRotations 0.04 degr/s 100 degr/s 100g
Table 2 – Measured data
Area Data SourceShip response Local strains in tanks Strain gauges
Global strains at deck LBSG/LDTVTurret strains LBSG/DCS
Wave pressures side hull Pressure gaugesRelative wave height around hull Wave radar’sBallast tank pressures Pressure gaugesCargo tank pressures Pressure gaugesSlamming pressures Pressure gaugesGreen water strains Strain gaugesMotions in 6 dof Accelerometers/angular rate
Environment Wind speed and direction Vessel wind set/DCSIncident condition
Relative wave height
Directional wave riderRelative wave heightKittywake radarAnnasuria directional wave riderWave radar’s
Current Subsea buoy
Vessel condition Drafts DCSTanks levels DCSHeading vessel CompassPosition/low frequency motions E-DGPSAnchor line angles DCS

14 HENK VAN DEN BOOM (MARIN), MAX KREKEL (BLUEWATER) AND PIETER AALBERTS (MARIN) OTC 12143
Week no. 1997 Week no. 199840 41 42 43 44 45 46 47 48 49 50 51 52 01 02 03 04 05 06 07 08 09 10 11 12 13 14 15 16 17System2809
0510
1210
1910
2610
0211
0911
1611
2311
3011
0712
1412
2112
2812
0401
1101
1801
2501
0102
0802
1502
2202
0103
0803
1503
2203
2903
0504
1205
1904
Structural Monitoring SystemDistributed Control System DCSWave Rider BuoySub-sea BuoyCompassEDGPSKittiwake wave and wind data
Week no. 199818 19 20 21 22 23 24 25 26 27 28 29 30 - 35 36 37 38 39 40 41 42 43 44 45 46 47 48 49 50 51System2604
0305
1005
1705
2405
3105
0706
1406
2106
2806
0507
1207
2009
2709
0410
1110
1810
2510
0111
0811
1511
2211
2911
0612
1312
Structural Monitoring SystemDistributed Control System DCSWave Rider BuoySub-sea Buoy 1)CompassEDGPSKittiwake wave and wind dataAnasuria wave and wind data
Week no. 199952 53 01 02 03 04 05 06 07 08 09 10 11 12 13 14 15 16 17 18 19 20 21 22 23 24 25 26 27 28System2012
2712
0301
1001
1701
2401
3101
0702
1402
2102
2802
0703
1403
2103
2803
0404
1104
1804
2504
0205
0905
1605
2305
3005
0606
1306
2006
2706
0407
1108
Structural Monitoring SystemDistributed Control System DCSWave Rider BuoySub-sea BuoyCompassEDGPSKittiwake wave and wind dataAnasuria wave and wind data
Notes 1) Subsea buoy not recovered yet
15 HENK VAN DEN BOOM (MARIN), MAX KREKEL (BLUEWATER) AND PIETER AALBERTS (MARIN) OTC 12143
Table 4 – Scatter diagram of wave conditions encountered during the campaign (10 Oct 97-1 Aug 99)
Significant wave height [m]0 - 1 1 – 2 2 – 3 3 – 4 4 – 5 5 – 6 6 – 7 7 – 8 8 – 9 9 –10
0 – 1 0 0 0 0 0 0 0 0 0 0 01 – 2 0 0 0 0 0 0 0 0 0 0 02 – 3 9 0 0 0 0 0 0 0 0 0 93 – 4 1441 57 0 0 0 0 0 0 0 0 14984 – 5 2107 3205 22 0 0 0 0 0 0 0 53345 – 6 679 4511 2421 12 0 0 0 0 0 0 76236 – 7 99 1475 3058 1841 67 0 0 0 0 0 65407 – 8 3 287 535 812 801 134 2 0 0 0 25748 – 9 0 26 67 59 83 217 130 29 1 0 6129 – 10 0 3 7 19 26 6 15 19 15 0 11010 –11 0 0 0 2 17 10 1 0 3 2 3511 -12 0 0 0 0 0 2 0 0 0 0 2
Mean
Zero
Up
Crossing
Period
[s]
4338 9564 6110 2745 994 369 148 48 19 2 24337

16 HENK VAN DEN BOOM (MARIN), MAX KREKEL (BLUEWATER) AND PIETER AALBERTS (MARIN) OTC 12143
Photo 1Refit of straingauges in ballast tanks September 20, 1998
Related Documents