Financial Results for the full year ended 30 September 2021 Frasers Tower, Singapore 12 November 2021

Welcome message from author
This document is posted to help you gain knowledge. Please leave a comment to let me know what you think about it! Share it to your friends and learn new things together.
Transcript
Financial Resultsfor the full year ended 30 September 2021
Frasers Tower, Singapore
12 November 2021
We are Frasers Property 2
• Statements in this presentation constitute “forward-looking statements”, including forward-looking financial information. Such forward-looking statements
and financial information involve known and unknown risks, uncertainties and other factors which may cause the actual results, performance or
achievements of Frasers Property Limited (“Frasers Property” or the “Company”) and its subsidiaries (together with Frasers Property, the “Group”), or
industry results, to be materially different from any future results, performance or achievements expressed or implied by such forward-looking statements
and financial information. Such forward-looking statements and financial information are based on numerous assumptions regarding the Group’s present
and future business strategies and the environment in which the Group will operate in the future. Because these statements and financial information
reflect Frasers Property’s current views concerning future events, these statements and financial information necessarily involve risks, uncertainties and
assumptions. Actual future performance could differ materially from these forward-looking statements and financial information as a result of these risks,
uncertainties and assumptions and you are cautioned not to place undue reliance on these statements and financial information.
• Frasers Property expressly disclaims any obligation or undertaking to release publicly any updates or revisions to any forward-looking statement or
financial information contained in this presentation to reflect any change in Frasers Property’s expectations with regard thereto or any change in events,
conditions or circumstances on which any such statement or information is based, subject to compliance with all applicable laws and regulations and/or
the rules of the Singapore Exchange Securities Trading Limited (the “SGX-ST”) and/or any other regulatory or supervisory body or agency.
• This presentation includes market and industry data and forecast that have been obtained from internal survey, reports and studies, where appropriate,
as well as market research, publicly available information and industry publications. Industry publications, surveys and forecasts generally state that the
information they contain has been obtained from sources believed to be reliable, but there can be no assurance as to the accuracy or completeness of
such included information. While Frasers Property has taken reasonable steps to ensure that the information is extracted accurately and in its proper
context, Frasers Property has not independently verified any of the data from third party sources or ascertained the underlying economic assumptions
relied upon therein.
• Nothing in this presentation should be construed as financial, investment, business, legal or tax advice and you should consult your independent
advisors.
• Any discrepancies in the figures included herein between the listed amounts and total thereof are due to rounding.
Important notice
We are Frasers Property 3
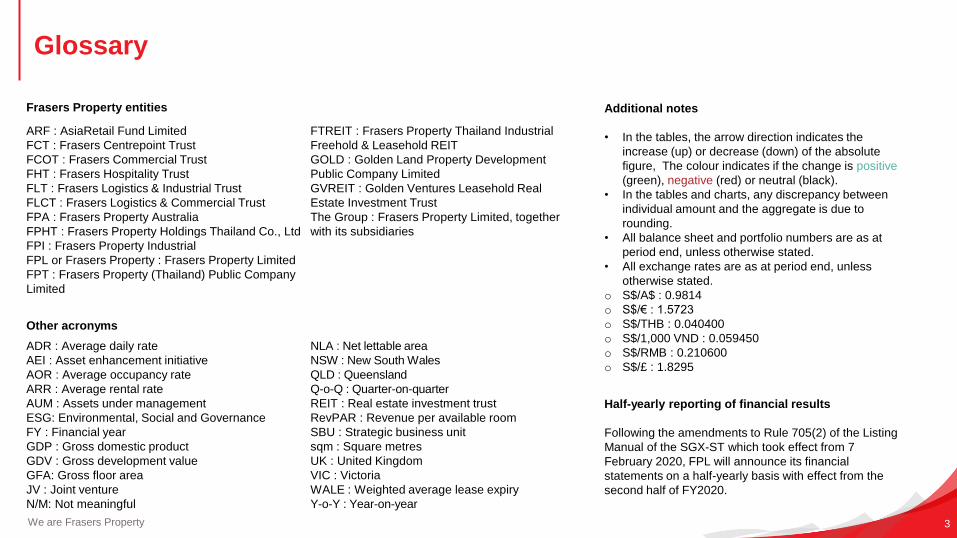
Glossary
ARF : AsiaRetail Fund Limited
FCT : Frasers Centrepoint Trust
FCOT : Frasers Commercial Trust
FHT : Frasers Hospitality Trust
FLT : Frasers Logistics & Industrial Trust
FLCT : Frasers Logistics & Commercial Trust
FPA : Frasers Property Australia
FPHT : Frasers Property Holdings Thailand Co., Ltd
FPI : Frasers Property Industrial
FPL or Frasers Property : Frasers Property Limited
FPT : Frasers Property (Thailand) Public Company
Limited
FTREIT : Frasers Property Thailand Industrial
Freehold & Leasehold REIT
GOLD : Golden Land Property Development
Public Company Limited
GVREIT : Golden Ventures Leasehold Real
Estate Investment Trust
The Group : Frasers Property Limited, together
with its subsidiaries
Half-yearly reporting of financial results
Following the amendments to Rule 705(2) of the Listing
Manual of the SGX-ST which took effect from 7
February 2020, FPL will announce its financial
statements on a half-yearly basis with effect from the
second half of FY2020.
Other acronyms
ADR : Average daily rate
AEI : Asset enhancement initiative
AOR : Average occupancy rate
ARR : Average rental rate
AUM : Assets under management
ESG: Environmental, Social and Governance
FY : Financial year
GDP : Gross domestic product
GDV : Gross development value
GFA: Gross floor area
JV : Joint venture
N/M: Not meaningful
NLA : Net lettable area
NSW : New South Wales
QLD : Queensland
Q-o-Q : Quarter-on-quarter
REIT : Real estate investment trust
RevPAR : Revenue per available room
SBU : Strategic business unit
sqm : Square metres
UK : United Kingdom
VIC : Victoria
WALE : Weighted average lease expiry
Y-o-Y : Year-on-year
Frasers Property entities Additional notes
• In the tables, the arrow direction indicates the
increase (up) or decrease (down) of the absolute
figure, The colour indicates if the change is positive
(green), negative (red) or neutral (black).
• In the tables and charts, any discrepancy between
individual amount and the aggregate is due to
rounding.
• All balance sheet and portfolio numbers are as at
period end, unless otherwise stated.
• All exchange rates are as at period end, unless
otherwise stated.
o S$/A$ : 0.9814
o S$/€ : 1.5723
o S$/THB : 0.040400
o S$/1,000 VND : 0.059450
o S$/RMB : 0.210600
o S$/£ : 1.8295

Key highlights
Results and financials
Business unit highlights
• Singapore
• Australia
• Industrial
• Hospitality
• Thailand & Vietnam
• Others
Capri by Fraser, Leipzig, Germany
Contents
5
Key Highlights
Hermes, Hamburg, Germany
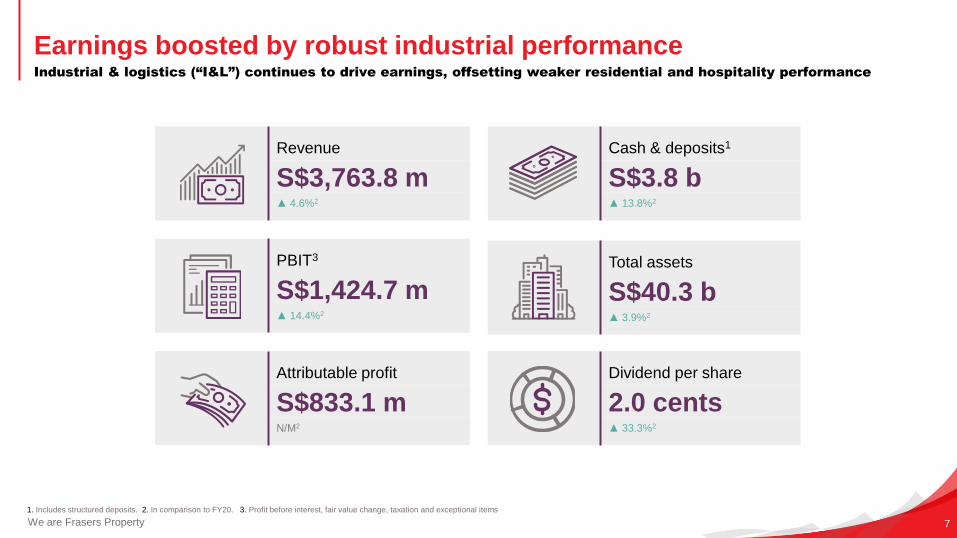
Dividend per share
2.0 cents▲ 33.3%2
Cash & deposits1
S$3.8 b▲ 13.8%2
Attributable profit
S$833.1 mN/M2
PBIT3
S$1,424.7 m▲ 14.4%2
We are Frasers Property 7
1. Includes structured deposits. 2. In comparison to FY20. 3. Profit before interest, fair value change, taxation and exceptional items
Earnings boosted by robust industrial performanceIndustrial & logistics (“I&L”) continues to drive earnings, offsetting weaker residential and hospitality performance
Revenue
S$3,763.8 m▲ 4.6%2
Total assets
S$40.3 b▲ 3.9%2
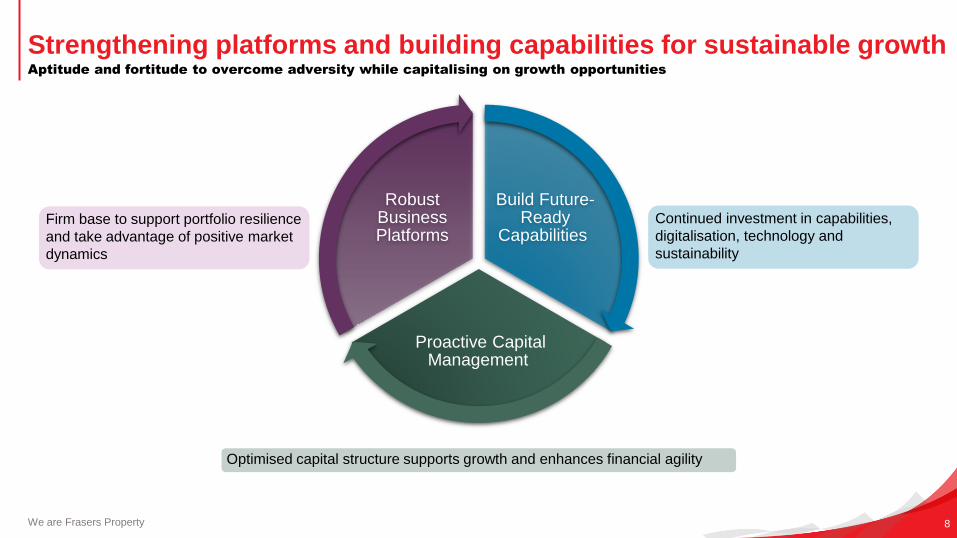
Strengthening platforms and building capabilities for sustainable growth
We are Frasers Property
Aptitude and fortitude to overcome adversity while capitalising on growth opportunities
Build Future-Ready
Capabilities
Proactive Capital Management
Robust Business Platforms
Firm base to support portfolio resilience
and take advantage of positive market
dynamics
Continued investment in capabilities,
digitalisation, technology and
sustainability
Optimised capital structure supports growth and enhances financial agility
8
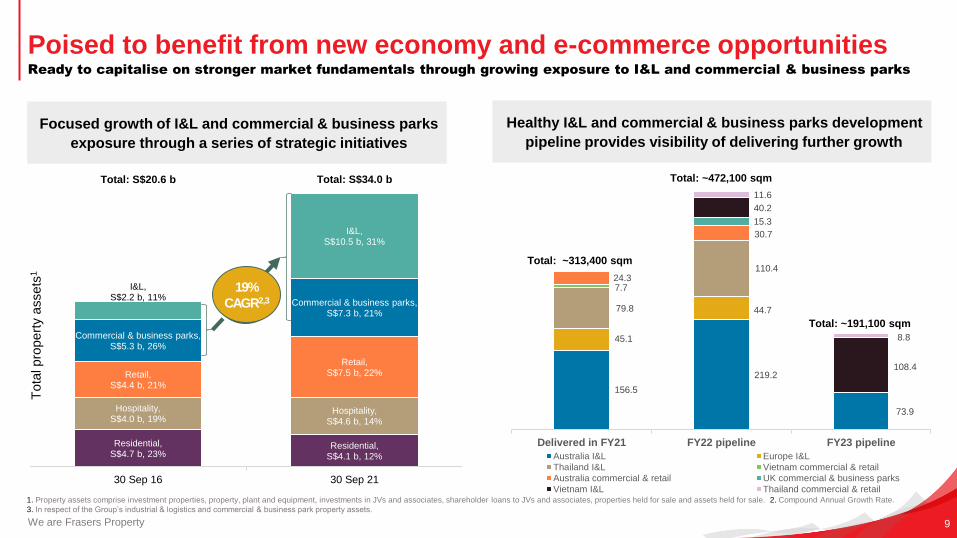
Residential, S$4.7 b, 23%
Residential, S$4.1 b, 12%
Hospitality, S$4.0 b, 19%
Hospitality, S$4.6 b, 14%
Retail, S$4.4 b, 21%
Retail, S$7.5 b, 22%
Commercial & business parks, S$5.3 b, 26%
Commercial & business parks, S$7.3 b, 21%
I&L, S$2.2 b, 11%
I&L, S$10.5 b, 31%
30 Sep 16 30 Sep 21
Tota
l pro
pert
y a
ssets
1
Total: S$34.0 bTotal: S$20.6 b
Actively managing property portfolioEnhancing portfolio resilience
Poised to benefit from new economy and e-commerce opportunitiesReady to capitalise on stronger market fundamentals through growing exposure to I&L and commercial & business parks
1. Property assets comprise investment properties, property, plant and equipment, investments in JVs and associates, shareholder loans to JVs and associates, properties held for sale and assets held for sale. 2. Compound Annual Growth Rate.
3. In respect of the Group’s industrial & logistics and commercial & business park property assets.
We are Frasers Property 9
Focused growth of I&L and commercial & business parks
exposure through a series of strategic initiatives
156.5
219.2
73.9
45.1
44.779.8
110.4
7.724.3
30.7
15.3
40.2
108.4
11.6
8.8
Delivered in FY21 FY22 pipeline FY23 pipeline
Australia I&L Europe I&L
Thailand I&L Vietnam commercial & retail
Australia commercial & retail UK commercial & business parks
Vietnam I&L Thailand commercial & retail
Total: ~313,400 sqm
Total: ~472,100 sqm
Healthy I&L and commercial & business parks development
pipeline provides visibility of delivering further growth
19%
CAGR2,3
Total: ~191,100 sqm
Adopting a rigorous and disciplined approach to optimise returns
We are Frasers Property 10
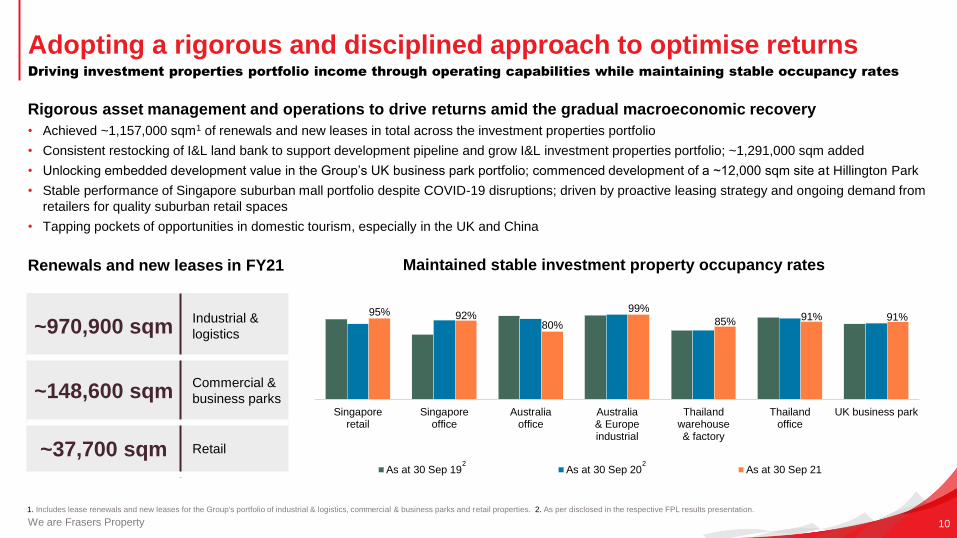
Driving investment properties portfolio income through operating capabilities while maintaining stable occupancy rates
1. Includes lease renewals and new leases for the Group's portfolio of industrial & logistics, commercial & business parks and retail properties. 2. As per disclosed in the respective FPL results presentation.
Maintained stable investment property occupancy rates
95% 92%80%
99%
85% 91% 91%
Singaporeretail
Singaporeoffice
Australiaoffice
Australia& Europeindustrial
Thailandwarehouse& factory
Thailandoffice
UK business park
As at 30 Sep 19 As at 30 Sep 20 As at 30 Sep 212 2
Rigorous asset management and operations to drive returns amid the gradual macroeconomic recovery
• Achieved ~1,157,000 sqm1 of renewals and new leases in total across the investment properties portfolio
• Consistent restocking of I&L land bank to support development pipeline and grow I&L investment properties portfolio; ~1,291,000 sqm added
• Unlocking embedded development value in the Group’s UK business park portfolio; commenced development of a ~12,000 sqm site at Hillington Park
• Stable performance of Singapore suburban mall portfolio despite COVID-19 disruptions; driven by proactive leasing strategy and ongoing demand from
retailers for quality suburban retail spaces
• Tapping pockets of opportunities in domestic tourism, especially in the UK and China
~970,900 sqmIndustrial &
logistics
~148,600 sqmCommercial &
business parks
~37,700 sqm Retail
Renewals and new leases in FY21
Focused on residential segments with robust underlying demand
We are Frasers Property
Steady sales activity and settlements
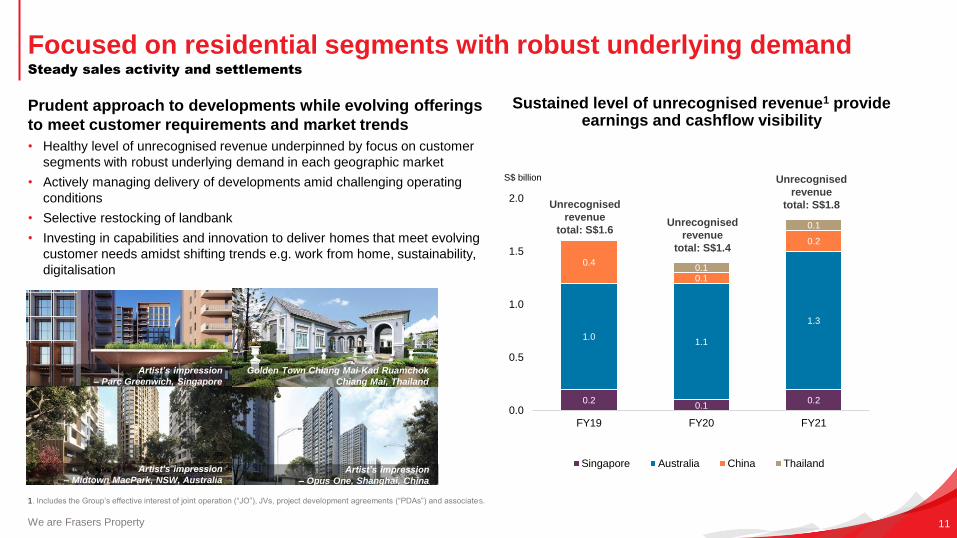
1. Includes the Group’s effective interest of joint operation (“JO”), JVs, project development agreements (“PDAs”) and associates.
0.20.1
0.2
1.01.1
1.3
0.4
0.1
0.2
0.1
0.1
0.0
0.5
1.0
1.5
2.0
FY19 FY20 FY21
Singapore Australia China Thailand
Sustained level of unrecognised revenue1 provide earnings and cashflow visibility
S$ billion
Unrecognised
revenue
total: S$1.6Unrecognised
revenue
total: S$1.4
Unrecognised
revenue
total: S$1.8
Prudent approach to developments while evolving offerings
to meet customer requirements and market trends
• Healthy level of unrecognised revenue underpinned by focus on customer
segments with robust underlying demand in each geographic market
• Actively managing delivery of developments amid challenging operating
conditions
• Selective restocking of landbank
• Investing in capabilities and innovation to deliver homes that meet evolving
customer needs amidst shifting trends e.g. work from home, sustainability,
digitalisation
Artist’s impression
– Parc Greenwich, Singapore
Artist’s impression
– Midtown MacPark, NSW, Australia
Golden Town Chiang Mai-Kad Ruamchok
Chiang Mai, Thailand
Artist’s impression
– Opus One, Shanghai, China
11
Frasers Property Thailand’s
Dashway security system
Building future-ready capabilities
We are Frasers Property
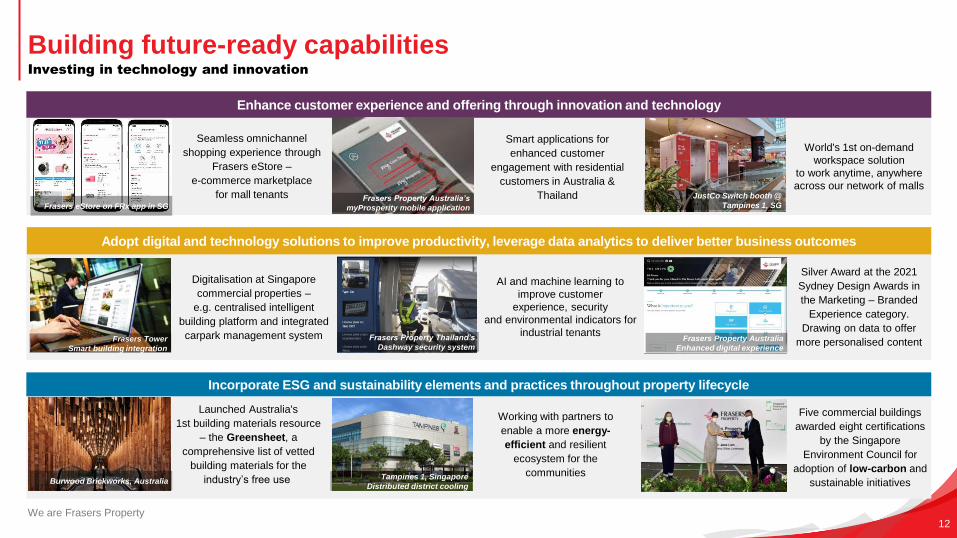
Investing in technology and innovation
Tampines 1, Singapore
Distributed district cooling
Working with partners to
enable a more energy-
efficient and resilient
ecosystem for the
communities
Adopt digital and technology solutions to improve productivity, leverage data analytics to deliver better business outcomes
Seamless omnichannel
shopping experience through
Frasers eStore –
e-commerce marketplace
for mall tenants
AI and machine learning to
improve customer
experience, security
and environmental indicators for
industrial tenants
Frasers eStore on FRx app in SG
Enhance customer experience and offering through innovation and technology
Smart applications for
enhanced customer
engagement with residential
customers in Australia &
Thailand
Digitalisation at Singapore
commercial properties –
e.g. centralised intelligent
building platform and integrated
carpark management system
Launched Australia's
1st building materials resource
– the Greensheet, a
comprehensive list of vetted
building materials for the
industry’s free useBurwood Brickworks, Australia
World's 1st on-demand
workspace solution
to work anytime, anywhere
across our network of malls
Five commercial buildings
awarded eight certifications
by the Singapore
Environment Council for
adoption of low-carbon and
sustainable initiatives
JustCo Switch booth @
Tampines 1, SG
Incorporate ESG and sustainability elements and practices throughout property lifecycle
Silver Award at the 2021
Sydney Design Awards in
the Marketing – Branded
Experience category.
Drawing on data to offer
more personalised content
12
Frasers Property Australia
Enhanced digital experienceFrasers Tower
Smart building integration
Frasers Property Australia’s
myProsperity mobile application
Making sustainability a core part of our DNA
We are Frasers Property 13
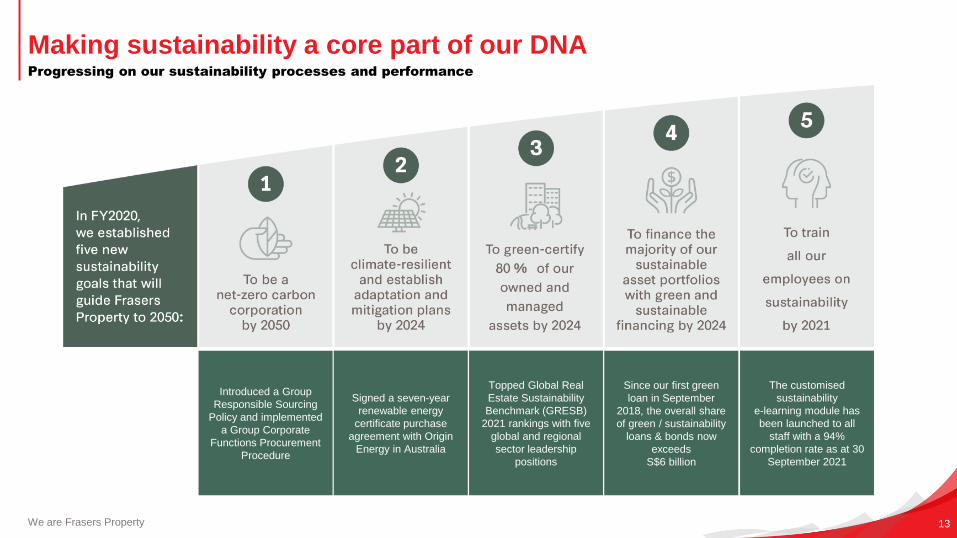
Progressing on our sustainability processes and performance
Introduced a Group
Responsible Sourcing
Policy and implemented
a Group Corporate
Functions Procurement
Procedure
Topped Global Real
Estate Sustainability
Benchmark (GRESB)
2021 rankings with five
global and regional
sector leadership
positions
Since our first green
loan in September
2018, the overall share
of green / sustainability
loans & bonds now
exceeds
S$6 billion
Signed a seven-year
renewable energy
certificate purchase
agreement with Origin
Energy in Australia
The customised
sustainability
e-learning module has
been launched to all
staff with a 94%
completion rate as at 30
September 2021
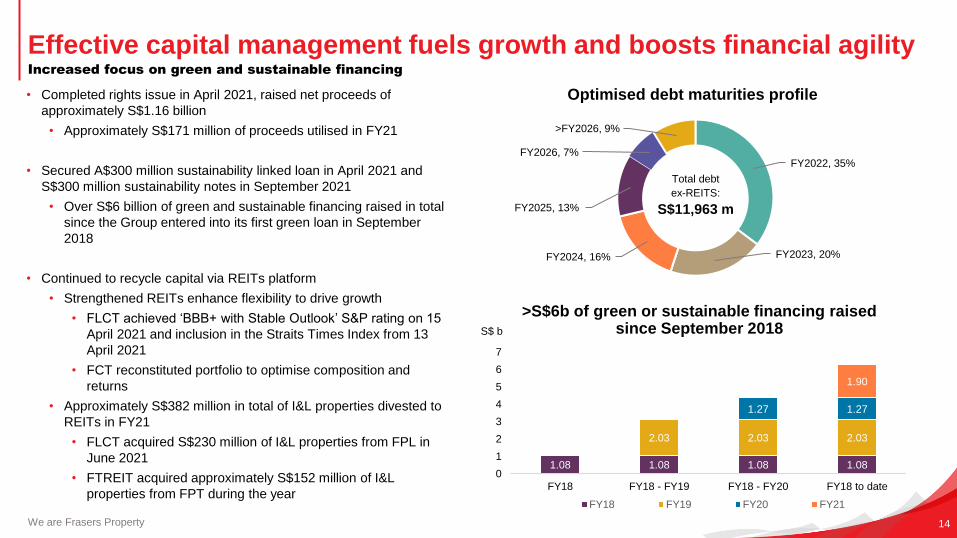
FY2022, 35%
FY2023, 20%FY2024, 16%
FY2025, 13%
FY2026, 7%
>FY2026, 9%
Total debt
ex-REITS:
S$11,963 m
We are Frasers Property
• Completed rights issue in April 2021, raised net proceeds of
approximately S$1.16 billion
• Approximately S$171 million of proceeds utilised in FY21
• Secured A$300 million sustainability linked loan in April 2021 and
S$300 million sustainability notes in September 2021
• Over S$6 billion of green and sustainable financing raised in total
since the Group entered into its first green loan in September
2018
• Continued to recycle capital via REITs platform
• Strengthened REITs enhance flexibility to drive growth
• FLCT achieved ‘BBB+ with Stable Outlook’ S&P rating on 15
April 2021 and inclusion in the Straits Times Index from 13
April 2021
• FCT reconstituted portfolio to optimise composition and
returns
• Approximately S$382 million in total of I&L properties divested to
REITs in FY21
• FLCT acquired S$230 million of I&L properties from FPL in
June 2021
• FTREIT acquired approximately S$152 million of I&L
properties from FPT during the year
Effective capital management fuels growth and boosts financial agilityIncreased focus on green and sustainable financing
1.08 1.08 1.08 1.08
2.03 2.03 2.03
1.27 1.27
1.90
0
1
2
3
4
5
6
7
FY18 FY18 - FY19 FY18 - FY20 FY18 to date
FY18 FY19 FY20 FY21
>S$6b of green or sustainable financing raised since September 2018
Optimised debt maturities profile
S$ b
14
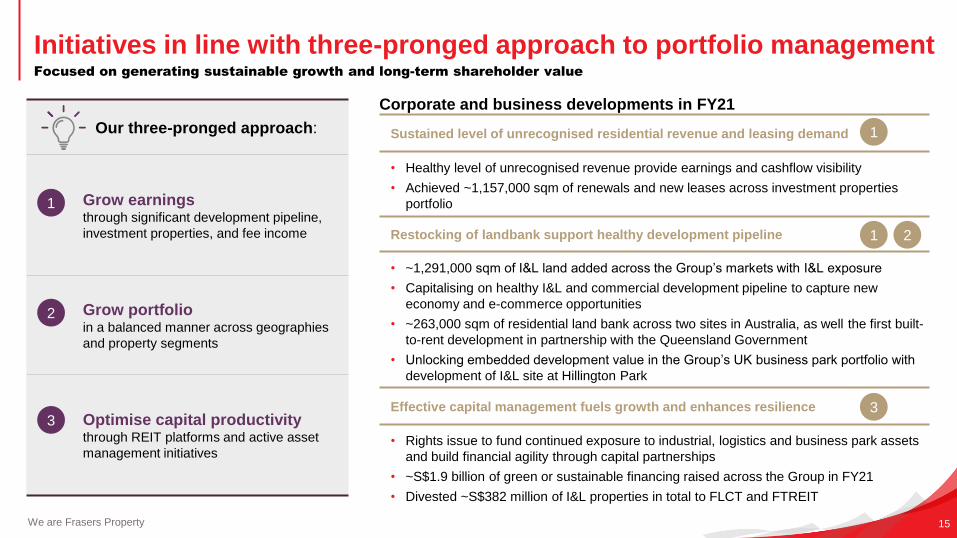
Initiatives in line with three-pronged approach to portfolio management
We are Frasers Property
Focused on generating sustainable growth and long-term shareholder value
Our three-pronged approach:
Grow earningsthrough significant development pipeline,
investment properties, and fee income
Grow portfolioin a balanced manner across geographies
and property segments
Optimise capital productivitythrough REIT platforms and active asset
management initiatives
1
2
3
15
Corporate and business developments in FY21
Restocking of landbank support healthy development pipeline
• ~1,291,000 sqm of I&L land added across the Group’s markets with I&L exposure
• Capitalising on healthy I&L and commercial development pipeline to capture new
economy and e-commerce opportunities
• ~263,000 sqm of residential land bank across two sites in Australia, as well the first built-
to-rent development in partnership with the Queensland Government
• Unlocking embedded development value in the Group’s UK business park portfolio with
development of I&L site at Hillington Park
1 2
Effective capital management fuels growth and enhances resilience
• Rights issue to fund continued exposure to industrial, logistics and business park assets
and build financial agility through capital partnerships
• ~S$1.9 billion of green or sustainable financing raised across the Group in FY21
• Divested ~S$382 million of I&L properties in total to FLCT and FTREIT
3
Sustained level of unrecognised residential revenue and leasing demand
• Healthy level of unrecognised revenue provide earnings and cashflow visibility
• Achieved ~1,157,000 sqm of renewals and new leases across investment properties
portfolio
1
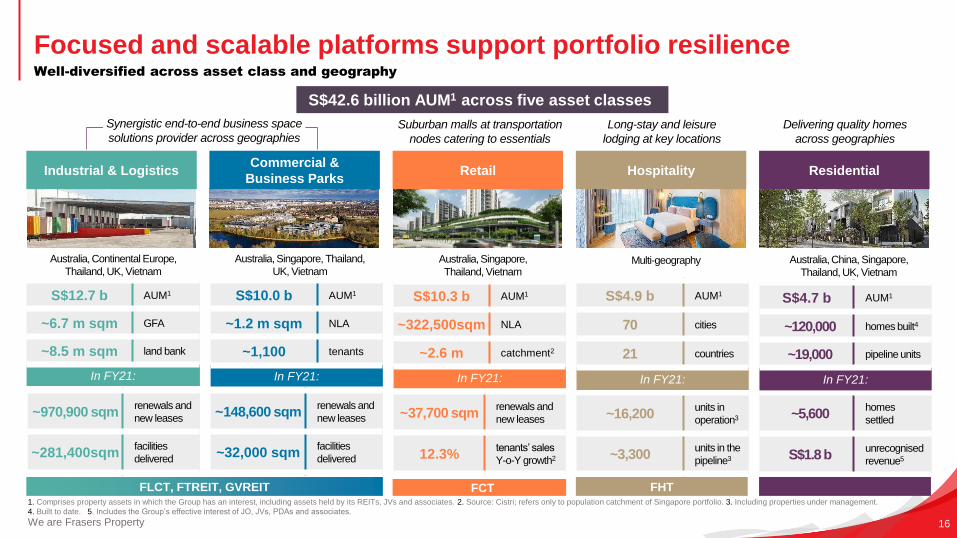
Focused and scalable platforms support portfolio resilience
We are Frasers Property
Well-diversified across asset class and geography
1. Comprises property assets in which the Group has an interest, including assets held by its REITs, JVs and associates. 2. Source: Cistri; refers only to population catchment of Singapore portfolio. 3. Including properties under management.
4. Built to date. 5. Includes the Group’s effective interest of JO, JVs, PDAs and associates.
16
S$42.6 billion AUM1 across five asset classes
Synergistic end-to-end business space
solutions provider across geographiesSuburban malls at transportation
nodes catering to essentials
Long-stay and leisure
lodging at key locations
Delivering quality homes
across geographies
~148,600 sqmrenewals and
new leases
~32,000 sqmfacilities
delivered
~970,900 sqmrenewals and
new leases
~281,400sqmfacilities
delivered
Australia, Singapore,
Thailand, Vietnam
S$10.3 b AUM1
~322,500sqm NLA
~2.6 m catchment2
In FY21:
~37,700 sqmrenewals and
new leases
12.3%tenants’ sales
Y-o-Y growth2
~16,200units in
operation3
~3,300units in the
pipeline3
~5,600homes
settled
S$1.8 bunrecognised
revenue5
Industrial & LogisticsCommercial &
Business ParksRetail Hospitality Residential
FLCT, FTREIT, GVREIT FCT FHT
Australia, Continental Europe,
Thailand, UK, Vietnam
S$12.7 b AUM1
~6.7 m sqm GFA
~8.5 m sqm land bank
In FY21:
Australia, Singapore, Thailand,
UK, Vietnam
S$10.0 b AUM1
~1.2 m sqm NLA
~1,100 tenants
In FY21:
Multi-geography
S$4.9 b AUM1
70 cities
21 countries
In FY21:
Australia, China, Singapore,
Thailand, UK, Vietnam
S$4.7 b AUM1
~120,000 homes built4
~19,000 pipeline units
In FY21:
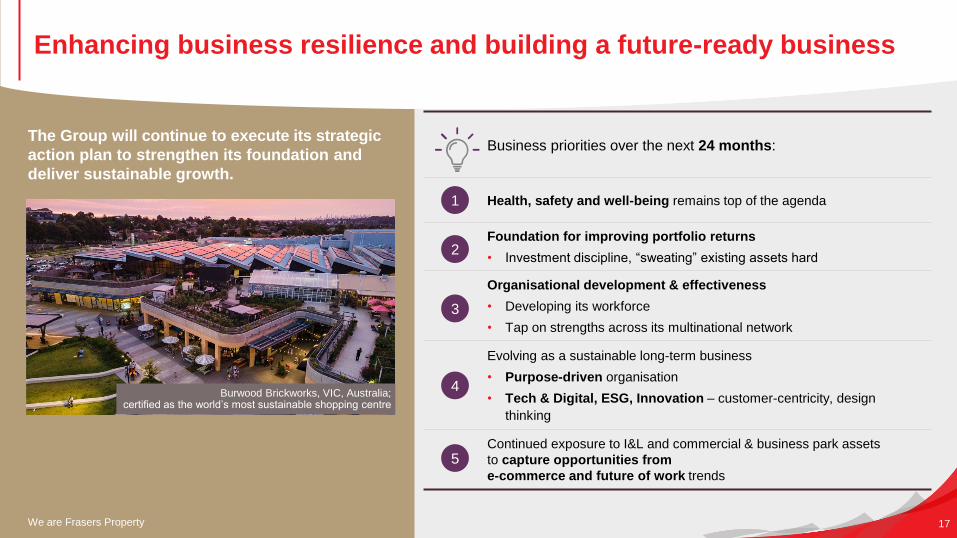
The Group will continue to execute its strategic
action plan to strengthen its foundation and
deliver sustainable growth.
Burwood Brickworks, VIC, Australia;certified as the world’s most sustainable shopping centre
Business priorities over the next 24 months:
Health, safety and well-being remains top of the agenda
Foundation for improving portfolio returns
• Investment discipline, “sweating” existing assets hard
Organisational development & effectiveness
• Developing its workforce
• Tap on strengths across its multinational network
Evolving as a sustainable long-term business
• Purpose-driven organisation
• Tech & Digital, ESG, Innovation – customer-centricity, design
thinking
Continued exposure to I&L and commercial & business park assets
to capture opportunities from
e-commerce and future of work trends
We are Frasers Property 17
Enhancing business resilience and building a future-ready business
1
2
3
4
5
Results and Financials
Farnborough Business Park, United Kingdom
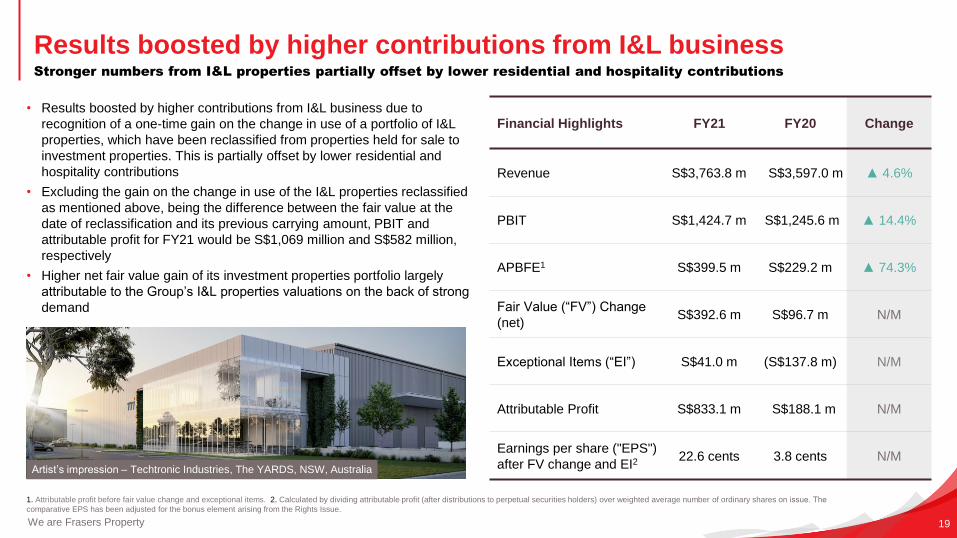
Results boosted by higher contributions from I&L business
We are Frasers Property 19
Stronger numbers from I&L properties partially offset by lower residential and hospitality contributions
• Results boosted by higher contributions from I&L business due to
recognition of a one-time gain on the change in use of a portfolio of I&L
properties, which have been reclassified from properties held for sale to
investment properties. This is partially offset by lower residential and
hospitality contributions
• Excluding the gain on the change in use of the I&L properties reclassified
as mentioned above, being the difference between the fair value at the
date of reclassification and its previous carrying amount, PBIT and
attributable profit for FY21 would be S$1,069 million and S$582 million,
respectively
• Higher net fair value gain of its investment properties portfolio largely
attributable to the Group’s I&L properties valuations on the back of strong
demand
1. Attributable profit before fair value change and exceptional items. 2. Calculated by dividing attributable profit (after distributions to perpetual securities holders) over weighted average number of ordinary shares on issue. The
comparative EPS has been adjusted for the bonus element arising from the Rights Issue.
Financial Highlights FY21 FY20 Change
Revenue S$3,763.8 m S$3,597.0 m ▲ 4.6%
PBIT S$1,424.7 m S$1,245.6 m ▲ 14.4%
APBFE1 S$399.5 m S$229.2 m ▲ 74.3%
Fair Value (“FV”) Change
(net)S$392.6 m S$96.7 m N/M
Exceptional Items (“EI”) S$41.0 m (S$137.8 m) N/M
Attributable Profit S$833.1 m S$188.1 m N/M
Earnings per share ("EPS")
after FV change and EI222.6 cents 3.8 cents N/M
Artist’s impression – Techtronic Industries, The YARDS, NSW, Australia
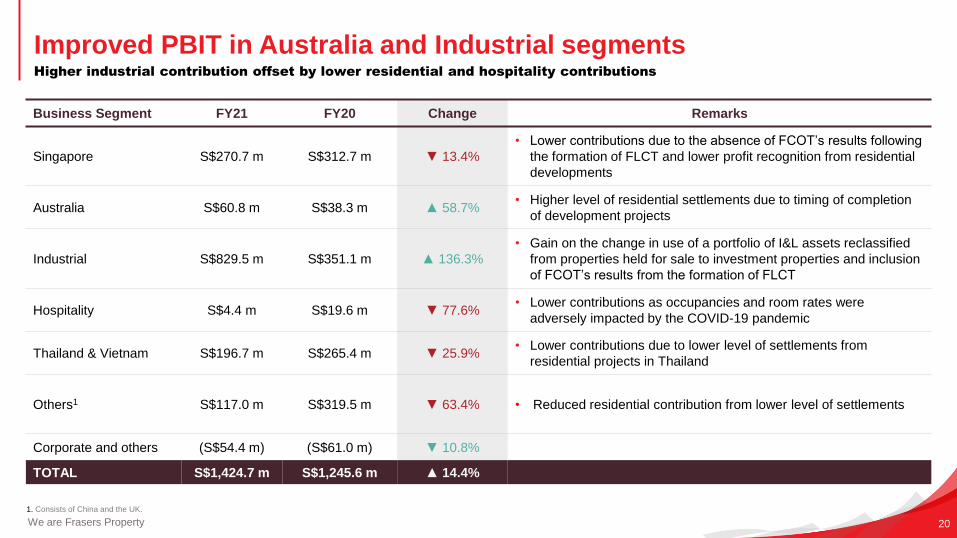
Improved PBIT in Australia and Industrial segments
We are Frasers Property 20
Higher industrial contribution offset by lower residential and hospitality contributions
1. Consists of China and the UK.
Business Segment FY21 FY20 Change Remarks
Singapore S$270.7 m S$312.7 m ▼ 13.4%
• Lower contributions due to the absence of FCOT’s results following
the formation of FLCT and lower profit recognition from residential
developments
Australia S$60.8 m S$38.3 m ▲ 58.7%• Higher level of residential settlements due to timing of completion
of development projects
Industrial S$829.5 m S$351.1 m ▲ 136.3%
• Gain on the change in use of a portfolio of I&L assets reclassified
from properties held for sale to investment properties and inclusion
of FCOT’s results from the formation of FLCT
Hospitality S$4.4 m S$19.6 m ▼ 77.6%• Lower contributions as occupancies and room rates were
adversely impacted by the COVID-19 pandemic
Thailand & Vietnam S$196.7 m S$265.4 m ▼ 25.9%• Lower contributions due to lower level of settlements from
residential projects in Thailand
Others1 S$117.0 m S$319.5 m ▼ 63.4% • Reduced residential contribution from lower level of settlements
Corporate and others (S$54.4 m) (S$61.0 m) ▼ 10.8%
TOTAL S$1,424.7 m S$1,245.6 m ▲ 14.4%
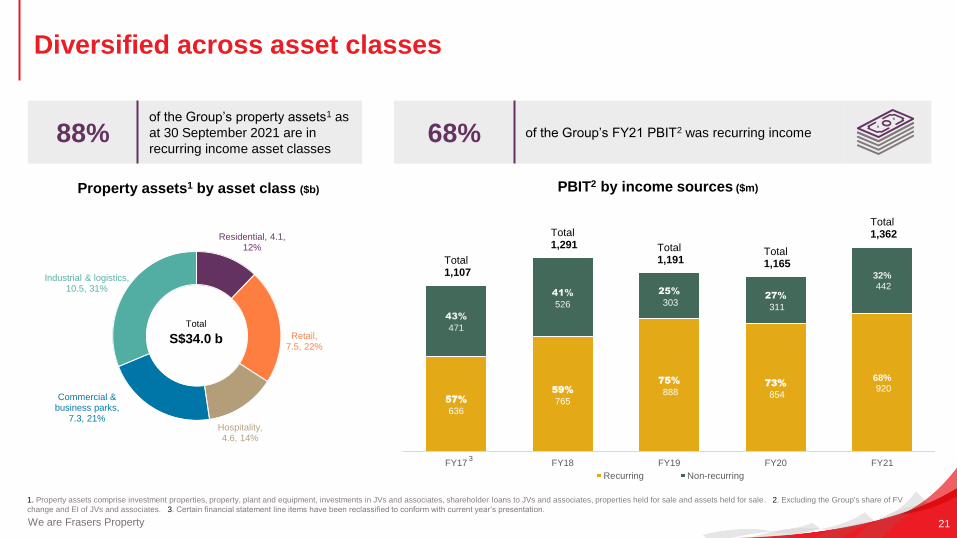
Diversified across asset classes
We are Frasers Property
1. Property assets comprise investment properties, property, plant and equipment, investments in JVs and associates, shareholder loans to JVs and associates, properties held for sale and assets held for sale. 2. Excluding the Group's share of FV
change and EI of JVs and associates. 3. Certain financial statement line items have been reclassified to conform with current year’s presentation.
21
Residential, 4.1, 12%
Retail, 7.5, 22%
Hospitality, 4.6, 14%
Commercial & business parks,
7.3, 21%
Industrial & logistics, 10.5, 31%
Total
S$34.0 b
Property assets1 by asset class ($b)
88%of the Group’s property assets1 as
at 30 September 2021 are in
recurring income asset classes
57%
636
59%
765
75%
888 73%
854
68%920
43%
471
41%
526
25%
303 27%
311
32%442
Total1,107
Total1,291 Total
1,191 Total1,165
Total1,362
FY17 FY18 FY19 FY20 FY21
Recurring Non-recurring
68% of the Group’s FY21 PBIT2 was recurring income
PBIT2 by income sources ($m)
3
316384
281 255 241
376
401
309274
605
105
176
197187
281
32
77
115185
139
247
219
251 255
53
31
34
38 9
43Total1,107
Total1,291
Total1,191
Total1,165
Total1,362
FY17 FY18 FY19 FY20 FY21
Singapore Australia Europe Thailand China Others
18%
44%
21%
10%
4%3%
22%
24%
16%
15%
22%
1%
24%
26%
17%
10%
21%
2%
30%
31%
17%
2%
14%
6%
29%
34%
9%
3%
22%
3%
Singapore,12.3, 36%
Australia, 8.7, 26%
Europe, 7.4, 22%
Thailand, 4.3, 13%
China, 0.5, 1%
Others4, 0.8, 2%
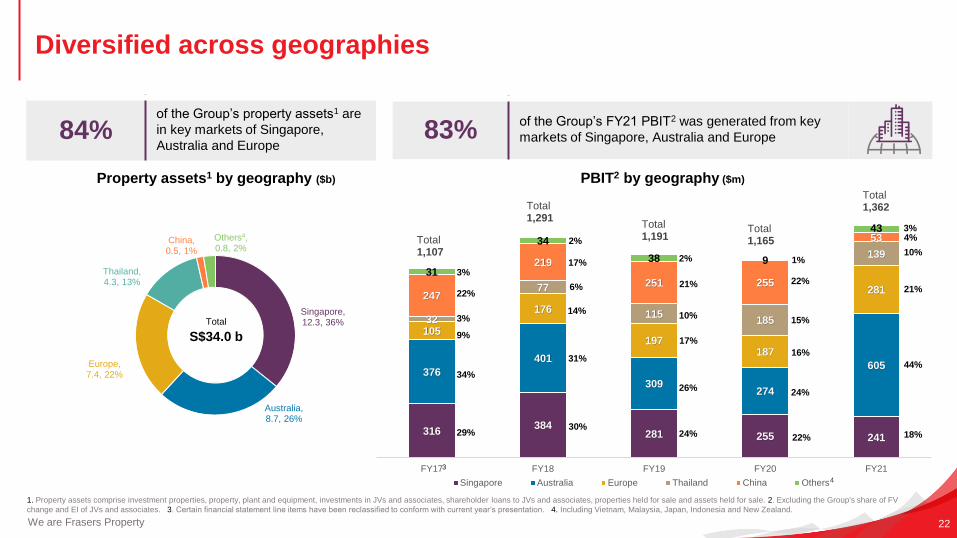
Diversified across geographies
We are Frasers Property
1. Property assets comprise investment properties, property, plant and equipment, investments in JVs and associates, shareholder loans to JVs and associates, properties held for sale and assets held for sale. 2. Excluding the Group's share of FV
change and EI of JVs and associates. 3. Certain financial statement line items have been reclassified to conform with current year’s presentation. 4. Including Vietnam, Malaysia, Japan, Indonesia and New Zealand.
22
83%of the Group’s FY21 PBIT2 was generated from key
markets of Singapore, Australia and Europe
PBIT2 by geography ($m)
4
84%of the Group’s property assets1 are
in key markets of Singapore,
Australia and Europe
Total
S$34.0 b
Property assets1 by geography ($b)
3
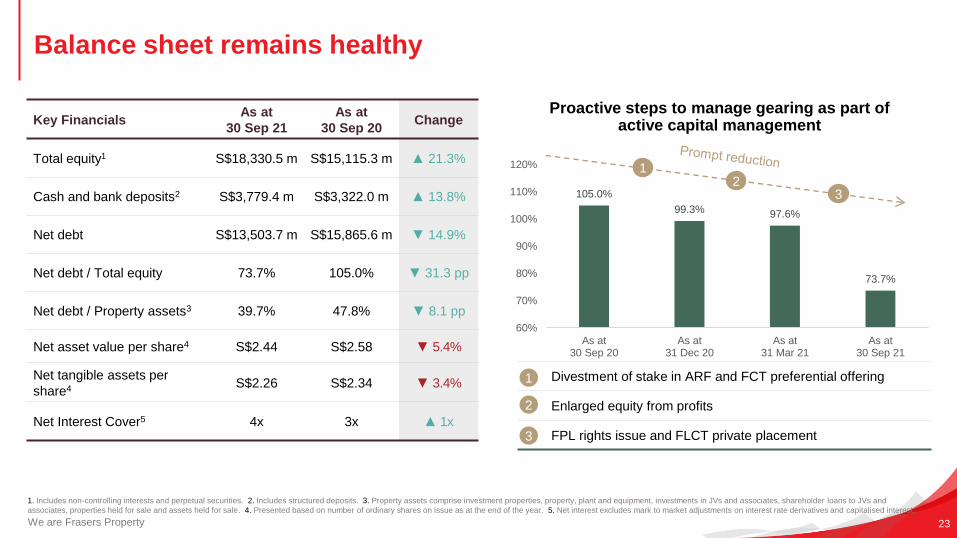
Balance sheet remains healthy
We are Frasers Property 23
1. Includes non-controlling interests and perpetual securities. 2. Includes structured deposits. 3. Property assets comprise investment properties, property, plant and equipment, investments in JVs and associates, shareholder loans to JVs and
associates, properties held for sale and assets held for sale. 4. Presented based on number of ordinary shares on issue as at the end of the year. 5. Net interest excludes mark to market adjustments on interest rate derivatives and capitalised interest.
Key FinancialsAs at
30 Sep 21
As at
30 Sep 20Change
Total equity1 S$18,330.5 m S$15,115.3 m ▲ 21.3%
Cash and bank deposits2 S$3,779.4 m S$3,322.0 m ▲ 13.8%
Net debt S$13,503.7 m S$15,865.6 m ▼ 14.9%
Net debt / Total equity 73.7% 105.0% ▼ 31.3 pp
Net debt / Property assets3 39.7% 47.8% ▼ 8.1 pp
Net asset value per share4 S$2.44 S$2.58 ▼ 5.4%
Net tangible assets per
share4 S$2.26 S$2.34 ▼ 3.4%
Net Interest Cover5 4x 3x ▲ 1x
Proactive steps to manage gearing as part of active capital management
105.0%
99.3% 97.6%
73.7%
60%
70%
80%
90%
100%
110%
120%
As at30 Sep 20
As at31 Dec 20
As at31 Mar 21
As at30 Sep 21
Divestment of stake in ARF and FCT preferential offering
Enlarged equity from profits
FPL rights issue and FLCT private placement
12
3
1
2
3
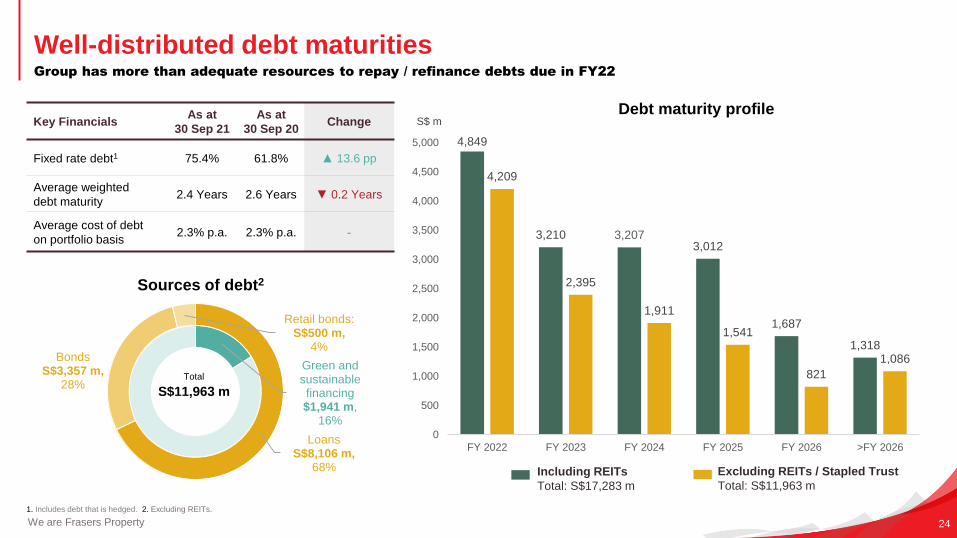
Well-distributed debt maturities
We are Frasers Property 24
Group has more than adequate resources to repay / refinance debts due in FY22
1. Includes debt that is hedged. 2. Excluding REITs.
4,849
3,210 3,2073,012
1,687
1,318
4,209
2,395
1,911
1,541
821
1,086
0
500
1,000
1,500
2,000
2,500
3,000
3,500
4,000
4,500
5,000
FY 2022 FY 2023 FY 2024 FY 2025 FY 2026 >FY 2026
Debt maturity profile
Including REITs
Total: S$17,283 m
Excluding REITs / Stapled Trust
Total: S$11,963 m
Sources of debt2
Green and sustainablefinancing$1,941 m,
16%
LoansS$8,106 m,
68%
BondsS$3,357 m,
28%
Retail bonds:S$500 m,
4%
Total
S$11,963 m
S$ mKey FinancialsAs at
30 Sep 21
As at
30 Sep 20Change
Fixed rate debt1 75.4% 61.8% ▲ 13.6 pp
Average weighted
debt maturity2.4 Years 2.6 Years ▼ 0.2 Years
Average cost of debt
on portfolio basis2.3% p.a. 2.3% p.a. -
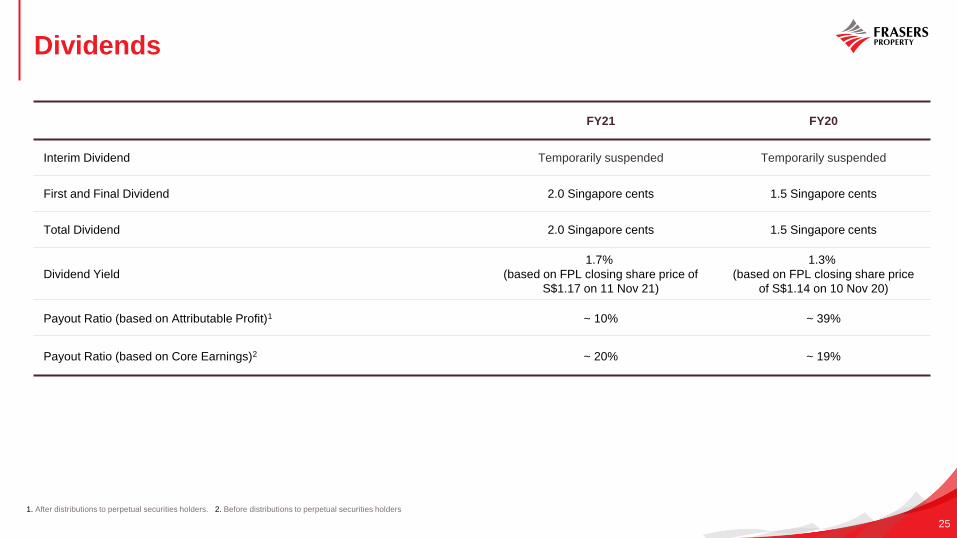
Dividends
FY21 FY20
Interim Dividend Temporarily suspended Temporarily suspended
First and Final Dividend 2.0 Singapore cents 1.5 Singapore cents
Total Dividend 2.0 Singapore cents 1.5 Singapore cents
Dividend Yield
1.7%
(based on FPL closing share price of
S$1.17 on 11 Nov 21)
1.3%
(based on FPL closing share price
of S$1.14 on 10 Nov 20)
Payout Ratio (based on Attributable Profit)1 ~ 10% ~ 39%
Payout Ratio (based on Core Earnings)2 ~ 20% ~ 19%
1. After distributions to perpetual securities holders. 2. Before distributions to perpetual securities holders
25
Singapore
Business Unit Highlights
Tampines 1, Singapore
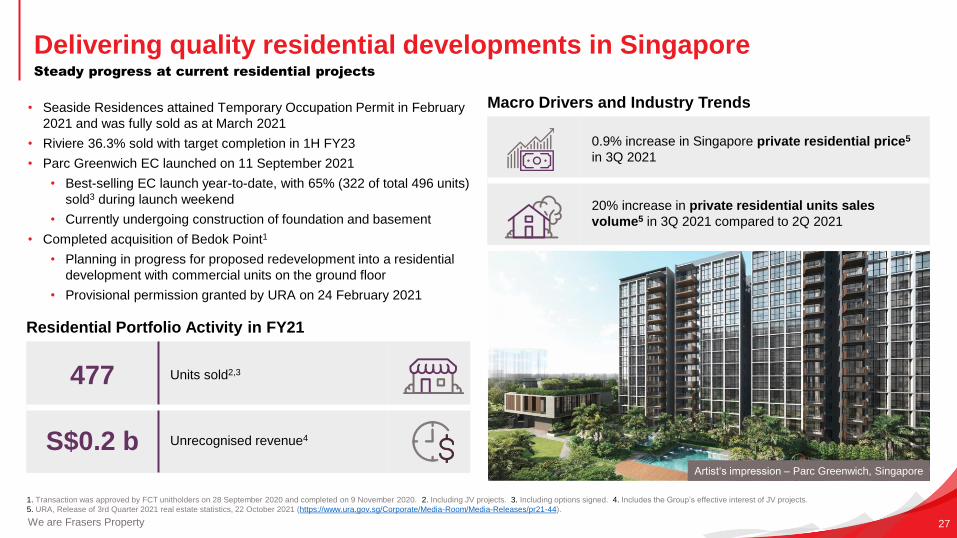
0.9% increase in Singapore private residential price5
in 3Q 2021
20% increase in private residential units sales
volume5 in 3Q 2021 compared to 2Q 2021
Delivering quality residential developments in Singapore
We are Frasers Property 27
Steady progress at current residential projects
• Seaside Residences attained Temporary Occupation Permit in February
2021 and was fully sold as at March 2021
• Riviere 36.3% sold with target completion in 1H FY23
• Parc Greenwich EC launched on 11 September 2021
• Best-selling EC launch year-to-date, with 65% (322 of total 496 units)
sold3 during launch weekend
• Currently undergoing construction of foundation and basement
• Completed acquisition of Bedok Point1
• Planning in progress for proposed redevelopment into a residential
development with commercial units on the ground floor
• Provisional permission granted by URA on 24 February 2021
1. Transaction was approved by FCT unitholders on 28 September 2020 and completed on 9 November 2020. 2. Including JV projects. 3. Including options signed. 4. Includes the Group’s effective interest of JV projects.
5. URA, Release of 3rd Quarter 2021 real estate statistics, 22 October 2021 (https://www.ura.gov.sg/Corporate/Media-Room/Media-Releases/pr21-44).
Macro Drivers and Industry Trends
477 Units sold2,3
S$0.2 b Unrecognised revenue4
Residential Portfolio Activity in FY21
Artist‘s impression – Parc Greenwich, Singapore
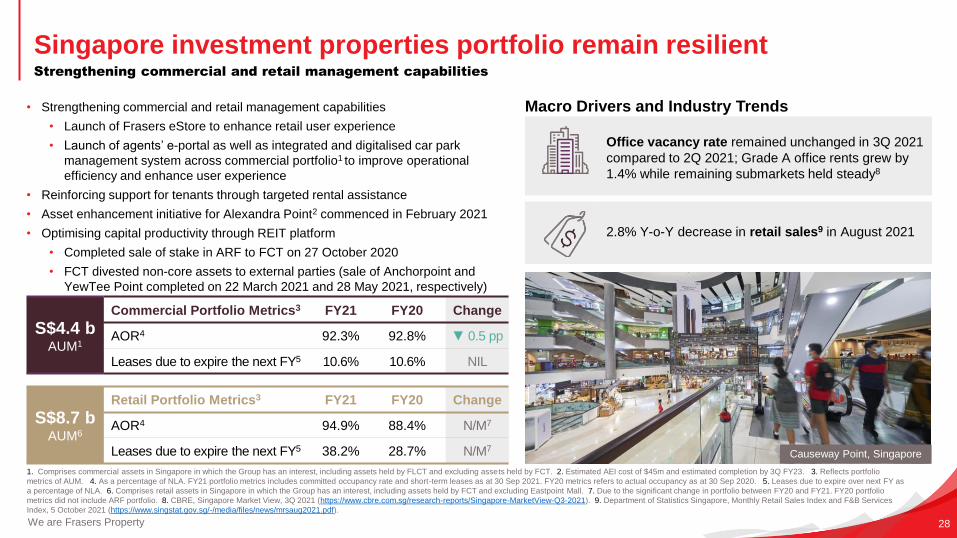
Office vacancy rate remained unchanged in 3Q 2021
compared to 2Q 2021; Grade A office rents grew by
1.4% while remaining submarkets held steady8
2.8% Y-o-Y decrease in retail sales9 in August 2021
Singapore investment properties portfolio remain resilient
We are Frasers Property 28
Strengthening commercial and retail management capabilities
• Strengthening commercial and retail management capabilities
• Launch of Frasers eStore to enhance retail user experience
• Launch of agents’ e-portal as well as integrated and digitalised car park
management system across commercial portfolio1 to improve operational
efficiency and enhance user experience
• Reinforcing support for tenants through targeted rental assistance
• Asset enhancement initiative for Alexandra Point2 commenced in February 2021
• Optimising capital productivity through REIT platform
• Completed sale of stake in ARF to FCT on 27 October 2020
• FCT divested non-core assets to external parties (sale of Anchorpoint and
YewTee Point completed on 22 March 2021 and 28 May 2021, respectively)
1. Comprises commercial assets in Singapore in which the Group has an interest, including assets held by FLCT and excluding assets held by FCT. 2. Estimated AEI cost of $45m and estimated completion by 3Q FY23. 3. Reflects portfolio
metrics of AUM. 4. As a percentage of NLA. FY21 portfolio metrics includes committed occupancy rate and short-term leases as at 30 Sep 2021. FY20 metrics refers to actual occupancy as at 30 Sep 2020. 5. Leases due to expire over next FY as
a percentage of NLA. 6. Comprises retail assets in Singapore in which the Group has an interest, including assets held by FCT and excluding Eastpoint Mall. 7. Due to the significant change in portfolio between FY20 and FY21. FY20 portfolio
metrics did not include ARF portfolio. 8. CBRE, Singapore Market View, 3Q 2021 (https://www.cbre.com.sg/research-reports/Singapore-MarketView-Q3-2021). 9. Department of Statistics Singapore, Monthly Retail Sales Index and F&B Services
Index, 5 October 2021 (https://www.singstat.gov.sg/-/media/files/news/mrsaug2021.pdf).
S$4.4 bAUM1
Commercial Portfolio Metrics3 FY21 FY20 Change
AOR4 92.3% 92.8% ▼ 0.5 pp
Leases due to expire the next FY5 10.6% 10.6% NIL
Causeway Point, Singapore
Macro Drivers and Industry Trends
S$8.7 bAUM6
Retail Portfolio Metrics3 FY21 FY20 Change
AOR4 94.9% 88.4% N/M7
Leases due to expire the next FY5 38.2% 28.7% N/M7
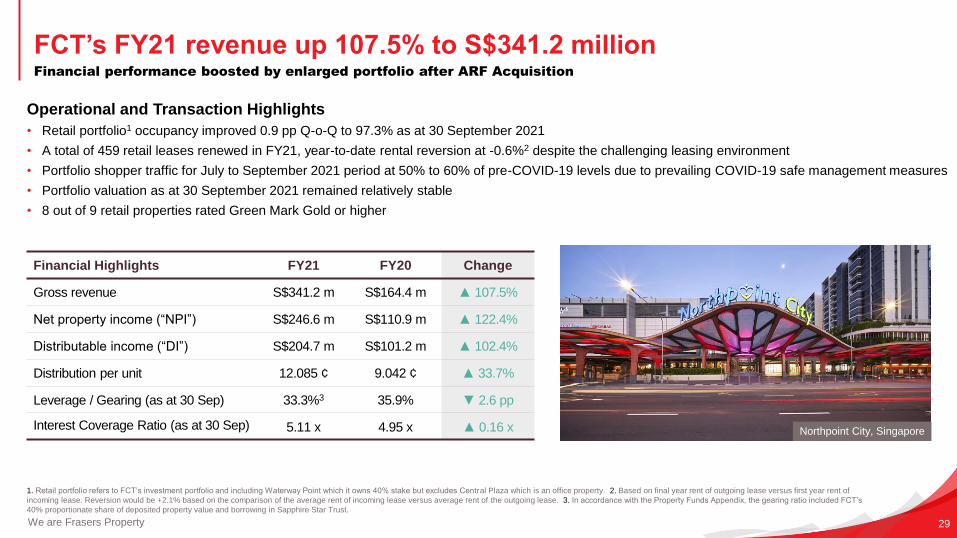
FCT’s FY21 revenue up 107.5% to S$341.2 million
We are Frasers Property 29
Financial performance boosted by enlarged portfolio after ARF Acquisition
Operational and Transaction Highlights
• Retail portfolio1 occupancy improved 0.9 pp Q-o-Q to 97.3% as at 30 September 2021
• A total of 459 retail leases renewed in FY21, year-to-date rental reversion at -0.6%2 despite the challenging leasing environment
• Portfolio shopper traffic for July to September 2021 period at 50% to 60% of pre-COVID-19 levels due to prevailing COVID-19 safe management measures
• Portfolio valuation as at 30 September 2021 remained relatively stable
• 8 out of 9 retail properties rated Green Mark Gold or higher
1. Retail portfolio refers to FCT’s investment portfolio and including Waterway Point which it owns 40% stake but excludes Central Plaza which is an office property. 2. Based on final year rent of outgoing lease versus first year rent of
incoming lease. Reversion would be +2.1% based on the comparison of the average rent of incoming lease versus average rent of the outgoing lease. 3. In accordance with the Property Funds Appendix, the gearing ratio included FCT’s
40% proportionate share of deposited property value and borrowing in Sapphire Star Trust.
Northpoint City, Singapore
Financial Highlights FY21 FY20 Change
Gross revenue S$341.2 m S$164.4 m ▲ 107.5%
Net property income (“NPI”) S$246.6 m S$110.9 m ▲ 122.4%
Distributable income (“DI”) S$204.7 m S$101.2 m ▲ 102.4%
Distribution per unit 12.085 ¢ 9.042 ¢ ▲ 33.7%
Leverage / Gearing (as at 30 Sep) 33.3%3 35.9% ▼ 2.6 pp
Interest Coverage Ratio (as at 30 Sep) 5.11 x 4.95 x ▲ 0.16 x
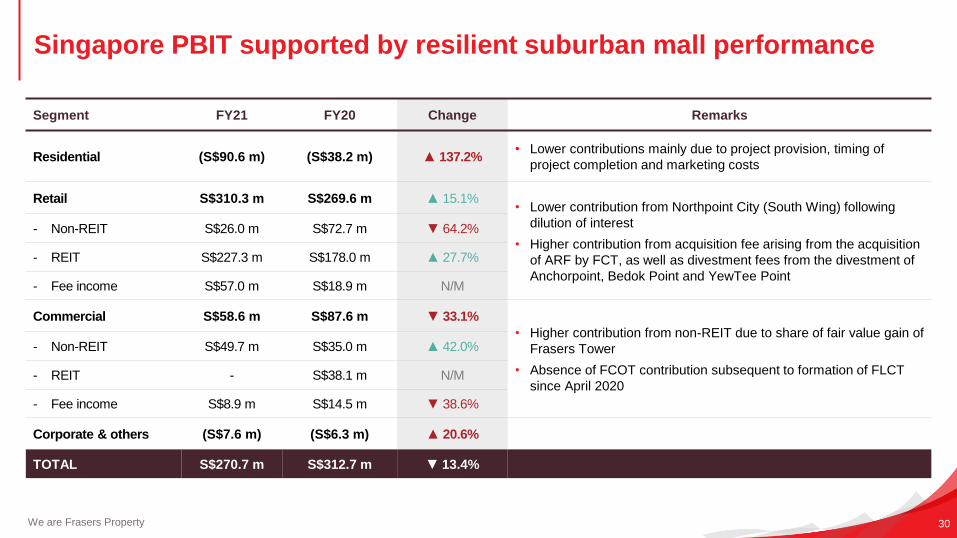
Singapore PBIT supported by resilient suburban mall performance
We are Frasers Property 30
Segment FY21 FY20 Change Remarks
Residential (S$90.6 m) (S$38.2 m) ▲ 137.2%• Lower contributions mainly due to project provision, timing of
project completion and marketing costs
Retail S$310.3 m S$269.6 m ▲ 15.1%• Lower contribution from Northpoint City (South Wing) following
dilution of interest
• Higher contribution from acquisition fee arising from the acquisition
of ARF by FCT, as well as divestment fees from the divestment of
Anchorpoint, Bedok Point and YewTee Point
- Non-REIT S$26.0 m S$72.7 m ▼ 64.2%
- REIT S$227.3 m S$178.0 m ▲ 27.7%
- Fee income S$57.0 m S$18.9 m N/M
Commercial S$58.6 m S$87.6 m ▼ 33.1%
• Higher contribution from non-REIT due to share of fair value gain of
Frasers Tower
• Absence of FCOT contribution subsequent to formation of FLCT
since April 2020
- Non-REIT S$49.7 m S$35.0 m ▲ 42.0%
- REIT - S$38.1 m N/M
- Fee income S$8.9 m S$14.5 m ▼ 38.6%
Corporate & others (S$7.6 m) (S$6.3 m) ▲ 20.6%
TOTAL S$270.7 m S$312.7 m ▼ 13.4%
Australia
Business Unit Highlights
The Waterfront, Shell Cove, NSW, Australia
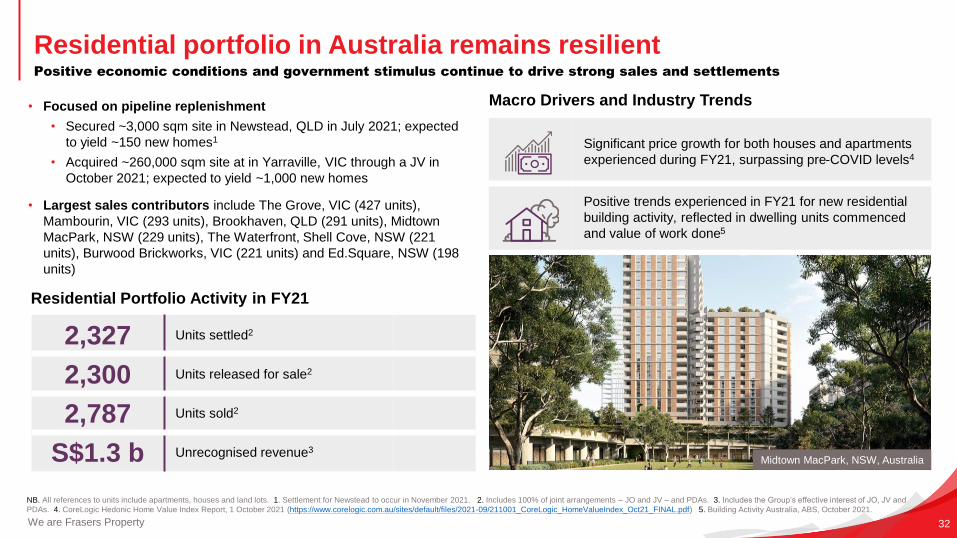
Significant price growth for both houses and apartments
experienced during FY21, surpassing pre-COVID levels4
Positive trends experienced in FY21 for new residential
building activity, reflected in dwelling units commenced
and value of work done5
Residential portfolio in Australia remains resilient
We are Frasers Property 32
Positive economic conditions and government stimulus continue to drive strong sales and settlements
NB. All references to units include apartments, houses and land lots. 1. Settlement for Newstead to occur in November 2021. 2. Includes 100% of joint arrangements – JO and JV – and PDAs. 3. Includes the Group’s effective interest of JO, JV and
PDAs. 4. CoreLogic Hedonic Home Value Index Report, 1 October 2021 (https://www.corelogic.com.au/sites/default/files/2021-09/211001_CoreLogic_HomeValueIndex_Oct21_FINAL.pdf) 5. Building Activity Australia, ABS, October 2021.
Midtown MacPark, NSW, Australia
Macro Drivers and Industry Trends
2,327 Units settled2
2,300 Units released for sale2
2,787 Units sold2
S$1.3 b Unrecognised revenue3
Residential Portfolio Activity in FY21
• Focused on pipeline replenishment
• Secured ~3,000 sqm site in Newstead, QLD in July 2021; expected
to yield ~150 new homes1
• Acquired ~260,000 sqm site at in Yarraville, VIC through a JV in
October 2021; expected to yield ~1,000 new homes
• Largest sales contributors include The Grove, VIC (427 units),
Mambourin, VIC (293 units), Brookhaven, QLD (291 units), Midtown
MacPark, NSW (229 units), The Waterfront, Shell Cove, NSW (221
units), Burwood Brickworks, VIC (221 units) and Ed.Square, NSW (198
units)
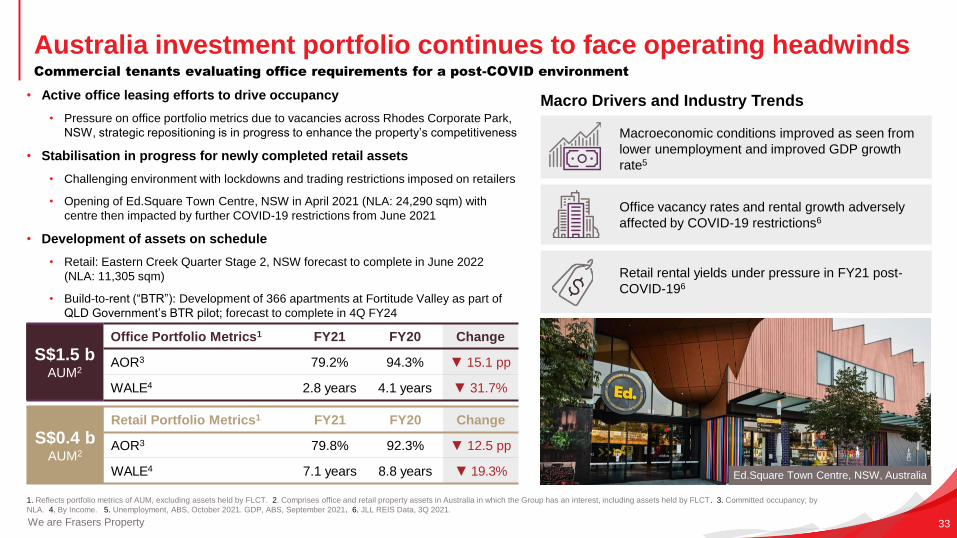
Macroeconomic conditions improved as seen from
lower unemployment and improved GDP growth
rate5
Office vacancy rates and rental growth adversely
affected by COVID-19 restrictions6
Retail rental yields under pressure in FY21 post-
COVID-196
Australia investment portfolio continues to face operating headwinds
We are Frasers Property 33
Commercial tenants evaluating office requirements for a post-COVID environment
• Active office leasing efforts to drive occupancy
• Pressure on office portfolio metrics due to vacancies across Rhodes Corporate Park,
NSW, strategic repositioning is in progress to enhance the property’s competitiveness
• Stabilisation in progress for newly completed retail assets
• Challenging environment with lockdowns and trading restrictions imposed on retailers
• Opening of Ed.Square Town Centre, NSW in April 2021 (NLA: 24,290 sqm) with
centre then impacted by further COVID-19 restrictions from June 2021
• Development of assets on schedule
• Retail: Eastern Creek Quarter Stage 2, NSW forecast to complete in June 2022
(NLA: 11,305 sqm)
• Build-to-rent (“BTR”): Development of 366 apartments at Fortitude Valley as part of
QLD Government’s BTR pilot; forecast to complete in 4Q FY24
1. Reflects portfolio metrics of AUM, excluding assets held by FLCT. 2. Comprises office and retail property assets in Australia in which the Group has an interest, including assets held by FLCT. 3. Committed occupancy; by
NLA. 4. By Income. 5. Unemployment, ABS, October 2021. GDP, ABS, September 2021. 6. JLL REIS Data, 3Q 2021.
S$1.5 bAUM2
Office Portfolio Metrics1 FY21 FY20 Change
AOR3 79.2% 94.3% ▼ 15.1 pp
WALE4 2.8 years 4.1 years ▼ 31.7%
Ed.Square Town Centre, NSW, Australia
Macro Drivers and Industry Trends
S$0.4 bAUM2
Retail Portfolio Metrics1 FY21 FY20 Change
AOR3 79.8% 92.3% ▼ 12.5 pp
WALE4 7.1 years 8.8 years ▼ 19.3%
Australia PBIT driven by stronger development portfolio performance
We are Frasers Property 34
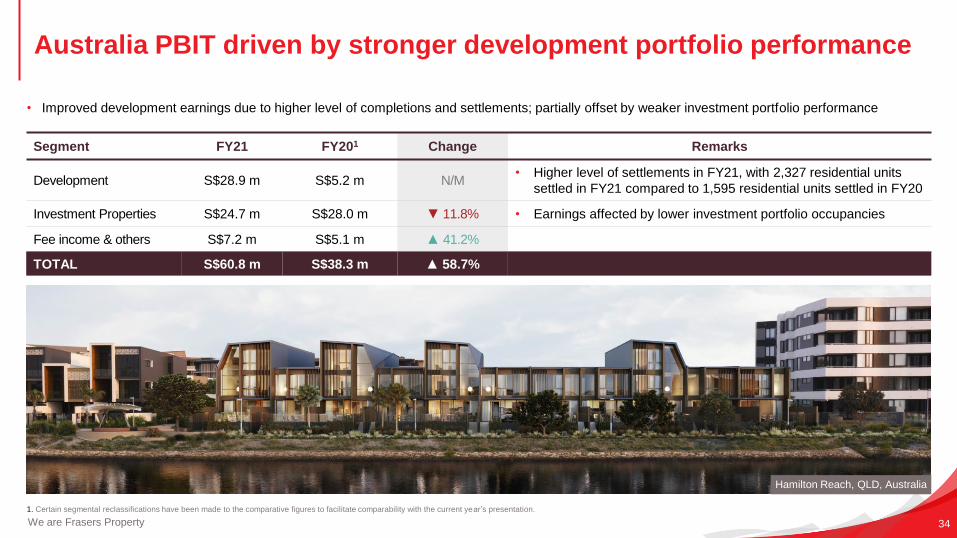
• Improved development earnings due to higher level of completions and settlements; partially offset by weaker investment portfolio performance
1. Certain segmental reclassifications have been made to the comparative figures to facilitate comparability with the current year’s presentation.
Segment FY21 FY201 Change Remarks
Development S$28.9 m S$5.2 m N/M• Higher level of settlements in FY21, with 2,327 residential units
settled in FY21 compared to 1,595 residential units settled in FY20
Investment Properties S$24.7 m S$28.0 m ▼ 11.8% • Earnings affected by lower investment portfolio occupancies
Fee income & others S$7.2 m S$5.1 m ▲ 41.2%
TOTAL S$60.8 m S$38.3 m ▲ 58.7%
Hamilton Reach, QLD, Australia
Industrial
Business Unit Highlights
4Ten Epping, VIC, Australia
Stable I&L development pipeline
We are Frasers Property 36
Continued strong demand from high quality tenants
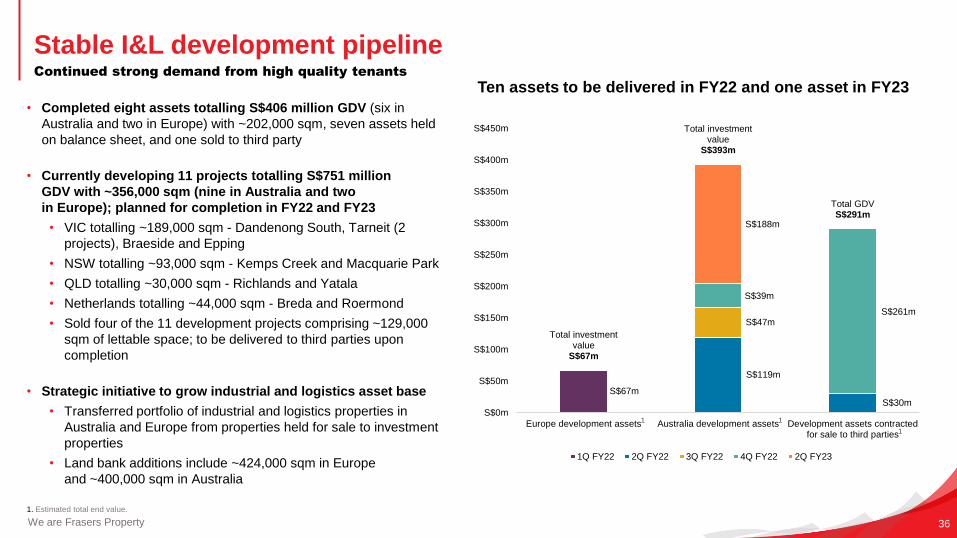
• Completed eight assets totalling S$406 million GDV (six in
Australia and two in Europe) with ~202,000 sqm, seven assets held
on balance sheet, and one sold to third party
• Currently developing 11 projects totalling S$751 million
GDV with ~356,000 sqm (nine in Australia and two
in Europe); planned for completion in FY22 and FY23
• VIC totalling ~189,000 sqm - Dandenong South, Tarneit (2
projects), Braeside and Epping
• NSW totalling ~93,000 sqm - Kemps Creek and Macquarie Park
• QLD totalling ~30,000 sqm - Richlands and Yatala
• Netherlands totalling ~44,000 sqm - Breda and Roermond
• Sold four of the 11 development projects comprising ~129,000
sqm of lettable space; to be delivered to third parties upon
completion
• Strategic initiative to grow industrial and logistics asset base
• Transferred portfolio of industrial and logistics properties in
Australia and Europe from properties held for sale to investment
properties
• Land bank additions include ~424,000 sqm in Europe
and ~400,000 sqm in Australia
1. Estimated total end value.
Ten assets to be delivered in FY22 and one asset in FY23
S$67m
S$119m
S$30m
S$47m
S$39m
S$261m
S$188m
Total investment value
S$67m
Total investment value
S$393m
Total GDVS$291m
S$0m
S$50m
S$100m
S$150m
S$200m
S$250m
S$300m
S$350m
S$400m
S$450m
Europe development assets Australia development assets Development assets contractedfor sale to third parties
1Q FY22 2Q FY22 3Q FY22 4Q FY22 2Q FY23
1
1 1
Robust I&L portfolio performance in Australia and Europe
We are Frasers Property 37
Strong leasing activity underpinned by quality tenant profile
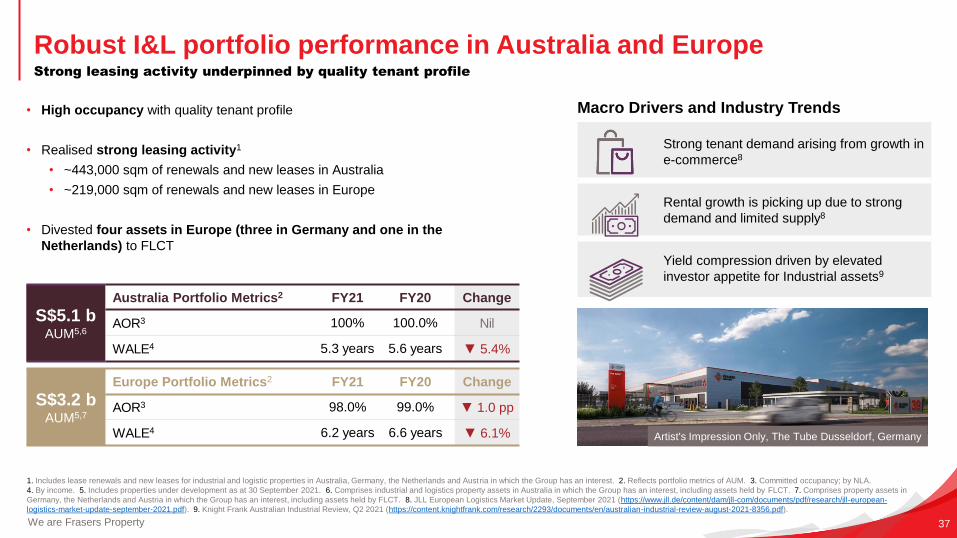
• High occupancy with quality tenant profile
• Realised strong leasing activity1
• ~443,000 sqm of renewals and new leases in Australia
• ~219,000 sqm of renewals and new leases in Europe
• Divested four assets in Europe (three in Germany and one in the
Netherlands) to FLCT
1. Includes lease renewals and new leases for industrial and logistic properties in Australia, Germany, the Netherlands and Austria in which the Group has an interest. 2. Reflects portfolio metrics of AUM. 3. Committed occupancy; by NLA.
4. By income. 5. Includes properties under development as at 30 September 2021. 6. Comprises industrial and logistics property assets in Australia in which the Group has an interest, including assets held by FLCT. 7. Comprises property assets in
Germany, the Netherlands and Austria in which the Group has an interest, including assets held by FLCT. 8. JLL European Logistics Market Update, September 2021 (https://www.jll.de/content/dam/jll-com/documents/pdf/research/jll-european-
logistics-market-update-september-2021.pdf). 9. Knight Frank Australian Industrial Review, Q2 2021 (https://content.knightfrank.com/research/2293/documents/en/australian-industrial-review-august-2021-8356.pdf).
Artist's Impression Only, The Tube Dusseldorf, Germany
Strong tenant demand arising from growth in
e-commerce8
Rental growth is picking up due to strong
demand and limited supply8
Yield compression driven by elevated
investor appetite for Industrial assets9
Macro Drivers and Industry Trends
S$5.1 bAUM5,6
Australia Portfolio Metrics2 FY21 FY20 Change
AOR3 100% 100.0% Nil
WALE4 5.3 years 5.6 years ▼ 5.4%
S$3.2 bAUM5,7
Europe Portfolio Metrics2 FY21 FY20 Change
AOR3 98.0% 99.0% ▼ 1.0 pp
WALE4 6.2 years 6.6 years ▼ 6.1%
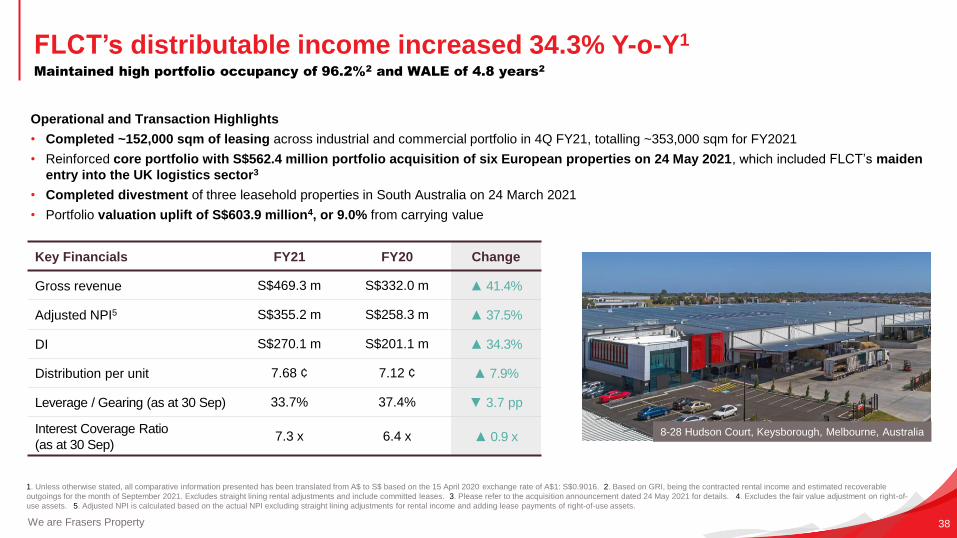
FLCT’s distributable income increased 34.3% Y-o-Y1
We are Frasers Property 38
Maintained high portfolio occupancy of 96.2%2 and WALE of 4.8 years2
1. Unless otherwise stated, all comparative information presented has been translated from A$ to S$ based on the 15 April 2020 exchange rate of A$1: S$0.9016. 2. Based on GRI, being the contracted rental income and estimated recoverable
outgoings for the month of September 2021. Excludes straight lining rental adjustments and include committed leases. 3. Please refer to the acquisition announcement dated 24 May 2021 for details. 4. Excludes the fair value adjustment on right-of-
use assets. 5. Adjusted NPI is calculated based on the actual NPI excluding straight lining adjustments for rental income and adding lease payments of right-of-use assets.
8-28 Hudson Court, Keysborough, Melbourne, Australia
Key Financials FY21 FY20 Change
Gross revenue S$469.3 m S$332.0 m ▲ 41.4%
Adjusted NPI5 S$355.2 m S$258.3 m ▲ 37.5%
DI S$270.1 m S$201.1 m ▲ 34.3%
Distribution per unit 7.68 ¢ 7.12 ¢ ▲ 7.9%
Leverage / Gearing (as at 30 Sep) 33.7% 37.4% ▼ 3.7 pp
Interest Coverage Ratio
(as at 30 Sep) 7.3 x 6.4 x ▲ 0.9 x
Operational and Transaction Highlights
• Completed ~152,000 sqm of leasing across industrial and commercial portfolio in 4Q FY21, totalling ~353,000 sqm for FY2021
• Reinforced core portfolio with S$562.4 million portfolio acquisition of six European properties on 24 May 2021, which included FLCT’s maiden
entry into the UK logistics sector3
• Completed divestment of three leasehold properties in South Australia on 24 March 2021
• Portfolio valuation uplift of S$603.9 million4, or 9.0% from carrying value
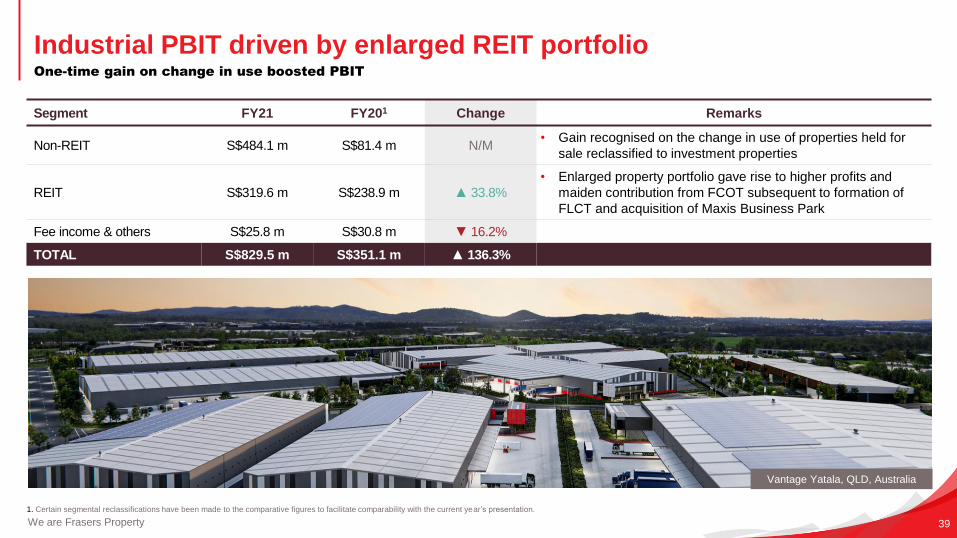
Industrial PBIT driven by enlarged REIT portfolio
We are Frasers Property 39
One-time gain on change in use boosted PBIT
1. Certain segmental reclassifications have been made to the comparative figures to facilitate comparability with the current year’s presentation.
Segment FY21 FY201 Change Remarks
Non-REIT S$484.1 m S$81.4 m N/M• Gain recognised on the change in use of properties held for
sale reclassified to investment properties
REIT S$319.6 m S$238.9 m ▲ 33.8%
• Enlarged property portfolio gave rise to higher profits and
maiden contribution from FCOT subsequent to formation of
FLCT and acquisition of Maxis Business Park
Fee income & others S$25.8 m S$30.8 m ▼ 16.2%
TOTAL S$829.5 m S$351.1 m ▲ 136.3%
Vantage Yatala, QLD, Australia
Hospitality
Business Unit Highlights
Modena by Fraser, Nanjing, China
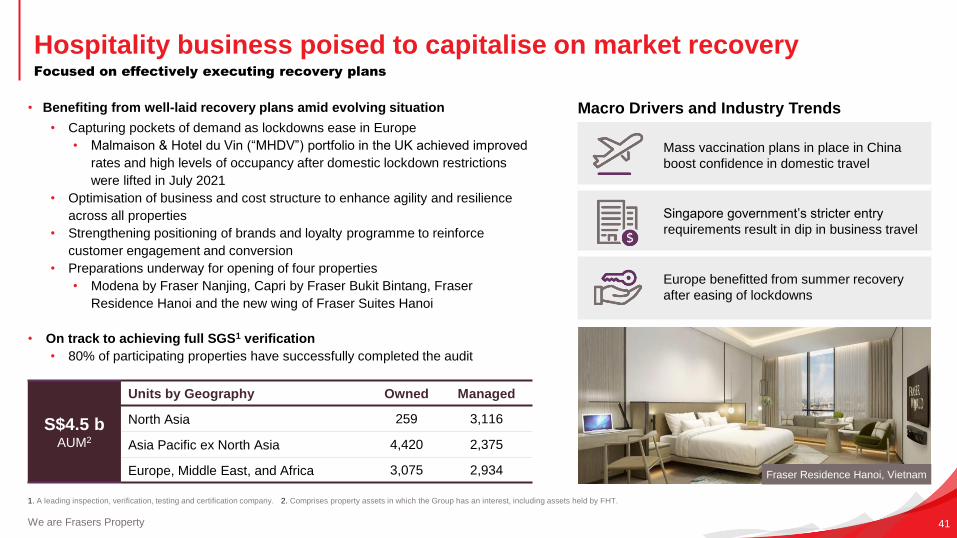
Hospitality business poised to capitalise on market recovery
We are Frasers Property 41
Focused on effectively executing recovery plans
• Benefiting from well-laid recovery plans amid evolving situation
• Capturing pockets of demand as lockdowns ease in Europe
• Malmaison & Hotel du Vin (“MHDV”) portfolio in the UK achieved improved
rates and high levels of occupancy after domestic lockdown restrictions
were lifted in July 2021
• Optimisation of business and cost structure to enhance agility and resilience
across all properties
• Strengthening positioning of brands and loyalty programme to reinforce
customer engagement and conversion
• Preparations underway for opening of four properties
• Modena by Fraser Nanjing, Capri by Fraser Bukit Bintang, Fraser
Residence Hanoi and the new wing of Fraser Suites Hanoi
• On track to achieving full SGS1 verification
• 80% of participating properties have successfully completed the audit
1. A leading inspection, verification, testing and certification company. 2. Comprises property assets in which the Group has an interest, including assets held by FHT.
Mass vaccination plans in place in China
boost confidence in domestic travel
Singapore government’s stricter entry
requirements result in dip in business travel
Europe benefitted from summer recovery
after easing of lockdowns
Macro Drivers and Industry Trends
Fraser Residence Hanoi, Vietnam
S$4.5 bAUM2
Units by Geography Owned Managed
North Asia 259 3,116
Asia Pacific ex North Asia 4,420 2,375
Europe, Middle East, and Africa 3,075 2,934
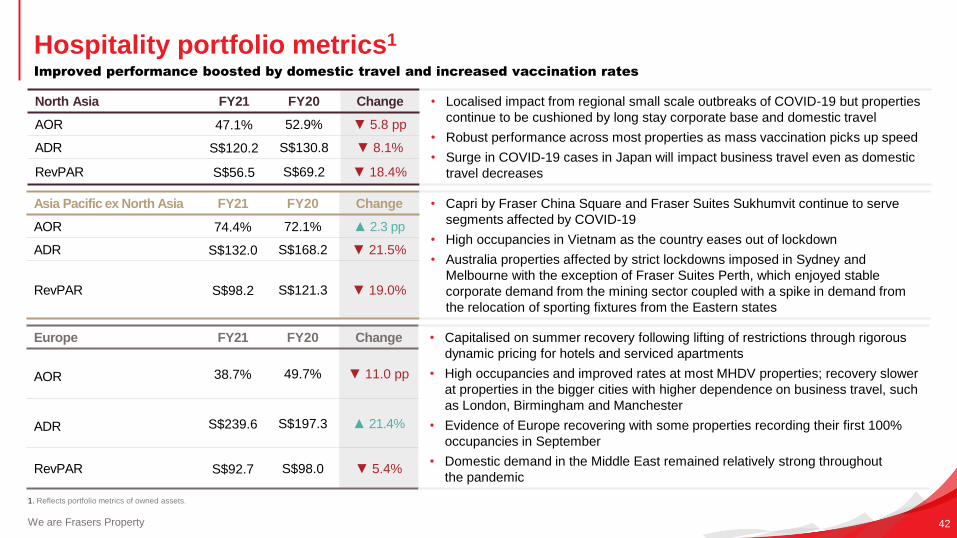
North Asia FY21 FY20 Change • Localised impact from regional small scale outbreaks of COVID-19 but properties
continue to be cushioned by long stay corporate base and domestic travel
• Robust performance across most properties as mass vaccination picks up speed
• Surge in COVID-19 cases in Japan will impact business travel even as domestic
travel decreases
AOR 47.1% 52.9% ▼ 5.8 pp
ADR S$120.2 S$130.8 ▼ 8.1%
RevPAR S$56.5 S$69.2 ▼ 18.4%
Asia Pacific ex North Asia FY21 FY20 Change • Capri by Fraser China Square and Fraser Suites Sukhumvit continue to serve
segments affected by COVID-19
• High occupancies in Vietnam as the country eases out of lockdown
• Australia properties affected by strict lockdowns imposed in Sydney and
Melbourne with the exception of Fraser Suites Perth, which enjoyed stable
corporate demand from the mining sector coupled with a spike in demand from
the relocation of sporting fixtures from the Eastern states
AOR 74.4% 72.1% ▲ 2.3 pp
ADR S$132.0 S$168.2 ▼ 21.5%
RevPAR S$98.2 S$121.3 ▼ 19.0%
Europe FY21 FY20 Change • Capitalised on summer recovery following lifting of restrictions through rigorous
dynamic pricing for hotels and serviced apartments
• High occupancies and improved rates at most MHDV properties; recovery slower
at properties in the bigger cities with higher dependence on business travel, such
as London, Birmingham and Manchester
• Evidence of Europe recovering with some properties recording their first 100%
occupancies in September
• Domestic demand in the Middle East remained relatively strong throughout
the pandemic
AOR 38.7% 49.7% ▼ 11.0 pp
ADR S$239.6 S$197.3 ▲ 21.4%
RevPAR S$92.7 S$98.0 ▼ 5.4%
Hospitality portfolio metrics1
We are Frasers Property 42
Improved performance boosted by domestic travel and increased vaccination rates
1. Reflects portfolio metrics of owned assets.
FHT’s performance remains impacted by the COVID-19 pandemic
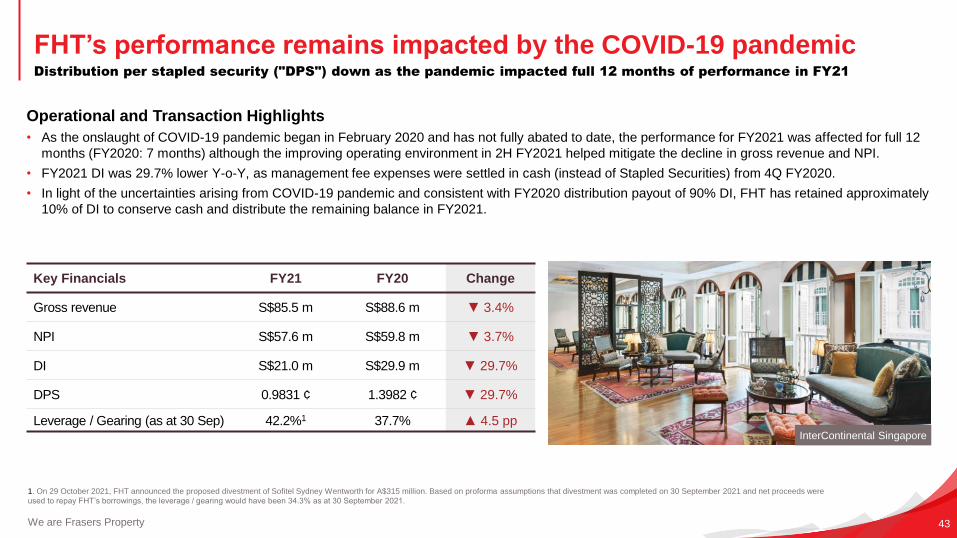
We are Frasers Property 43
Distribution per stapled security ("DPS") down as the pandemic impacted full 12 months of performance in FY21
1. On 29 October 2021, FHT announced the proposed divestment of Sofitel Sydney Wentworth for A$315 million. Based on proforma assumptions that divestment was completed on 30 September 2021 and net proceeds were
used to repay FHT’s borrowings, the leverage / gearing would have been 34.3% as at 30 September 2021.
Key Financials FY21 FY20 Change
Gross revenue S$85.5 m S$88.6 m ▼ 3.4%
NPI S$57.6 m S$59.8 m ▼ 3.7%
DI S$21.0 m S$29.9 m ▼ 29.7%
DPS 0.9831 ¢ 1.3982 ¢ ▼ 29.7%
Leverage / Gearing (as at 30 Sep) 42.2%1 37.7% ▲ 4.5 ppInterContinental Singapore
Operational and Transaction Highlights
• As the onslaught of COVID-19 pandemic began in February 2020 and has not fully abated to date, the performance for FY2021 was affected for full 12
months (FY2020: 7 months) although the improving operating environment in 2H FY2021 helped mitigate the decline in gross revenue and NPI.
• FY2021 DI was 29.7% lower Y-o-Y, as management fee expenses were settled in cash (instead of Stapled Securities) from 4Q FY2020.
• In light of the uncertainties arising from COVID-19 pandemic and consistent with FY2020 distribution payout of 90% DI, FHT has retained approximately
10% of DI to conserve cash and distribute the remaining balance in FY2021.
We are Frasers Property 44
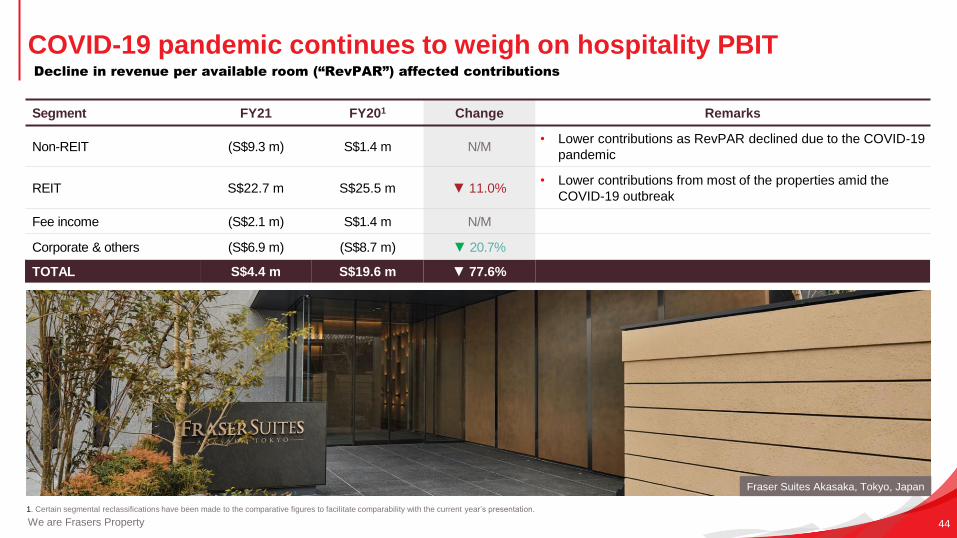
1. Certain segmental reclassifications have been made to the comparative figures to facilitate comparability with the current year’s presentation.
Segment FY21 FY201 Change Remarks
Non-REIT (S$9.3 m) S$1.4 m N/M• Lower contributions as RevPAR declined due to the COVID-19
pandemic
REIT S$22.7 m S$25.5 m ▼ 11.0%• Lower contributions from most of the properties amid the
COVID-19 outbreak
Fee income (S$2.1 m) S$1.4 m N/M
Corporate & others (S$6.9 m) (S$8.7 m) ▼ 20.7%
TOTAL S$4.4 m S$19.6 m ▼ 77.6%
COVID-19 pandemic continues to weigh on hospitality PBIT Decline in revenue per available room (“RevPAR”) affected contributions
Fraser Suites Akasaka, Tokyo, Japan
Thailand and Vietnam
Business Unit Highlights
Golden Neo Ngamwongwan-Prachachuen, Bangkok, Thailand
We are Frasers Property 46
1. Based on SFRS(I). 2. TRIS rating, October 2021 (https://www.trisrating.com/files/8716/3420/5684/FPT170-e.pdf).
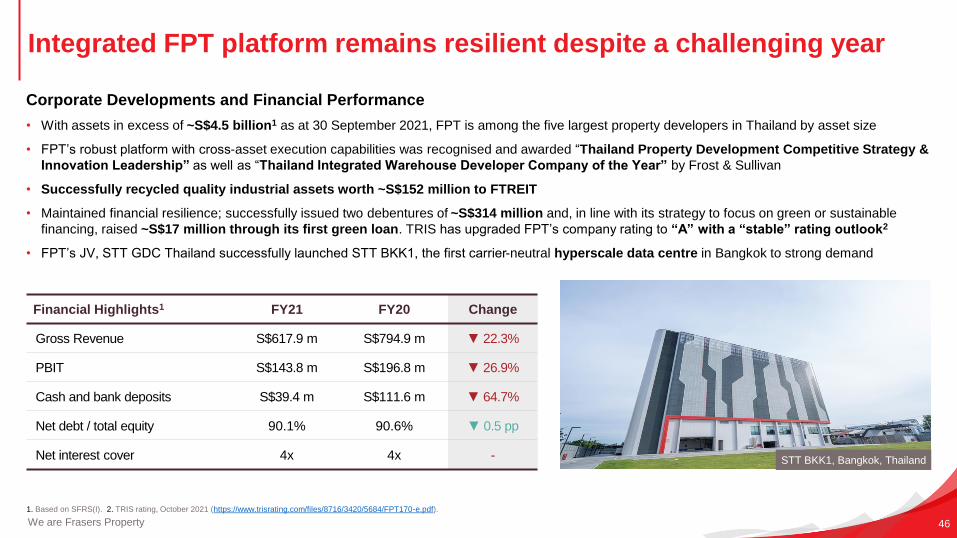
Corporate Developments and Financial Performance
• With assets in excess of ~S$4.5 billion1 as at 30 September 2021, FPT is among the five largest property developers in Thailand by asset size
• FPT’s robust platform with cross-asset execution capabilities was recognised and awarded “Thailand Property Development Competitive Strategy &
Innovation Leadership” as well as “Thailand Integrated Warehouse Developer Company of the Year” by Frost & Sullivan
• Successfully recycled quality industrial assets worth ~S$152 million to FTREIT
• Maintained financial resilience; successfully issued two debentures of ~S$314 million and, in line with its strategy to focus on green or sustainable
financing, raised ~S$17 million through its first green loan. TRIS has upgraded FPT’s company rating to “A” with a “stable” rating outlook2
• FPT’s JV, STT GDC Thailand successfully launched STT BKK1, the first carrier-neutral hyperscale data centre in Bangkok to strong demand
Financial Highlights1 FY21 FY20 Change
Gross Revenue S$617.9 m S$794.9 m ▼ 22.3%
PBIT S$143.8 m S$196.8 m ▼ 26.9%
Cash and bank deposits S$39.4 m S$111.6 m ▼ 64.7%
Net debt / total equity 90.1% 90.6% ▼ 0.5 pp
Net interest cover 4x 4x - STT BKK1, Bangkok, Thailand
Integrated FPT platform remains resilient despite a challenging year
GDP growth forecast for 2021 at 0.7% and projected
to expand 3.9% for 20221
Policy rate maintained with fiscal and financial
measures expedited to support affected groups1
House price index trended down throughout 2021 for
all types, with higher vaccine rollout and lockdown
easing to restore confidence and consumption2
Well-positioned to ride on Thailand’s residential market recovery
We are Frasers Property 47
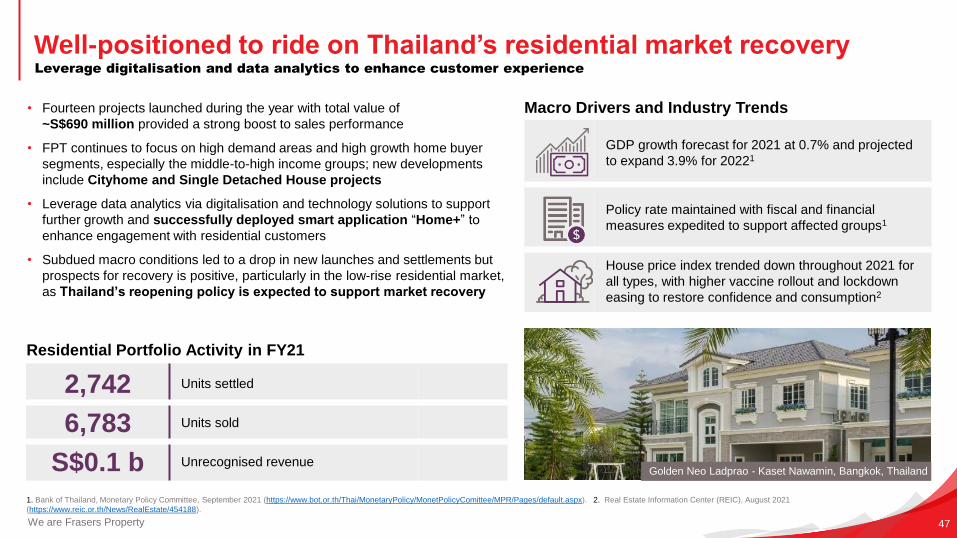
Leverage digitalisation and data analytics to enhance customer experience
• Fourteen projects launched during the year with total value of
~S$690 million provided a strong boost to sales performance
• FPT continues to focus on high demand areas and high growth home buyer
segments, especially the middle-to-high income groups; new developments
include Cityhome and Single Detached House projects
• Leverage data analytics via digitalisation and technology solutions to support
further growth and successfully deployed smart application “Home+” to
enhance engagement with residential customers
• Subdued macro conditions led to a drop in new launches and settlements but
prospects for recovery is positive, particularly in the low-rise residential market,
as Thailand’s reopening policy is expected to support market recovery
1. Bank of Thailand, Monetary Policy Committee, September 2021 (https://www.bot.or.th/Thai/MonetaryPolicy/MonetPolicyComittee/MPR/Pages/default.aspx). 2. Real Estate Information Center (REIC), August 2021
(https://www.reic.or.th/News/RealEstate/454188).
Golden Neo Ladprao - Kaset Nawamin, Bangkok, Thailand
Macro Drivers and Industry Trends
2,742 Units settled
6,783 Units sold
S$0.1 b Unrecognised revenue
Residential Portfolio Activity in FY21
Logistics property will continue to benefit
from the growth of e-commerce4
Promising signs for manufacturing property in the
medium to long term with supply chain relocation, MPI
and exports indicators continue to improve5
The surge in demand for manufacturing facilities for
micro-processors, computer chips and
pharmaceuticals5
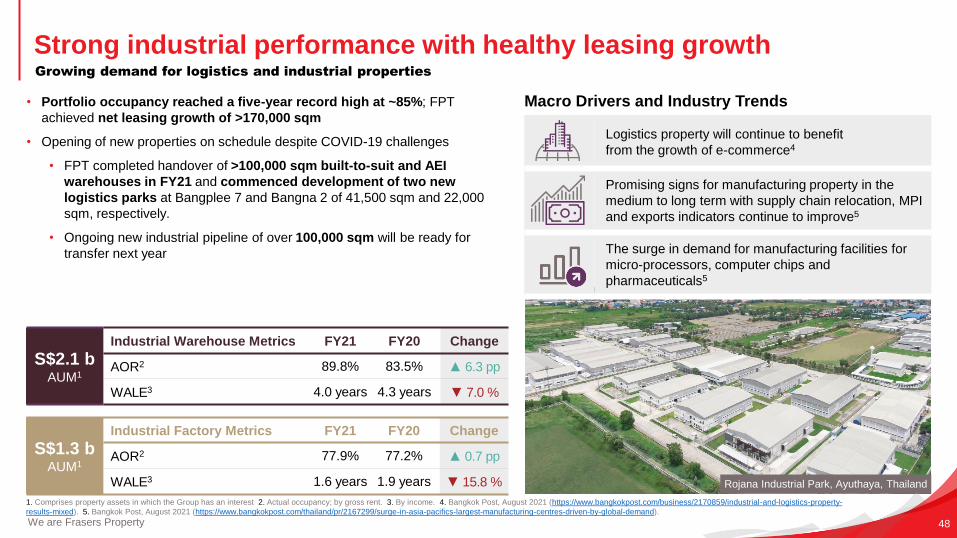
Strong industrial performance with healthy leasing growth
We are Frasers Property 48
Growing demand for logistics and industrial properties
• Portfolio occupancy reached a five-year record high at ~85%; FPT
achieved net leasing growth of >170,000 sqm
• Opening of new properties on schedule despite COVID-19 challenges
• FPT completed handover of >100,000 sqm built-to-suit and AEI
warehouses in FY21 and commenced development of two new
logistics parks at Bangplee 7 and Bangna 2 of 41,500 sqm and 22,000
sqm, respectively.
• Ongoing new industrial pipeline of over 100,000 sqm will be ready for
transfer next year
1. Comprises property assets in which the Group has an interest 2. Actual occupancy; by gross rent. 3. By income. 4. Bangkok Post, August 2021 (https://www.bangkokpost.com/business/2170859/industrial-and-logistics-property-
results-mixed). 5. Bangkok Post, August 2021 (https://www.bangkokpost.com/thailand/pr/2167299/surge-in-asia-pacifics-largest-manufacturing-centres-driven-by-global-demand).
Rojana Industrial Park, Ayuthaya, Thailand
Macro Drivers and Industry Trends
S$2.1 bAUM1
Industrial Warehouse Metrics FY21 FY20 Change
AOR2 89.8% 83.5% ▲ 6.3 pp
WALE3 4.0 years 4.3 years ▼ 7.0 %
S$1.3 b AUM1
Industrial Factory Metrics FY21 FY20 Change
AOR2 77.9% 77.2% ▲ 0.7 pp
WALE3 1.6 years 1.9 years ▼ 15.8 %
The Bangkok office market continues to move away
from its cyclical peak as occupancies fell to their
lowest since 2013 and asking rents declined for most
sub-markets10
As remote and hybrid work arrangements have
become the norm, tenants are seeking creative
solutions for workspaces and office leases10
The COVID-19 pandemic saw landlords providing
tenants with rental offers and non-monetary
incentives i.e. term flexibility, longer rent-free
periods10
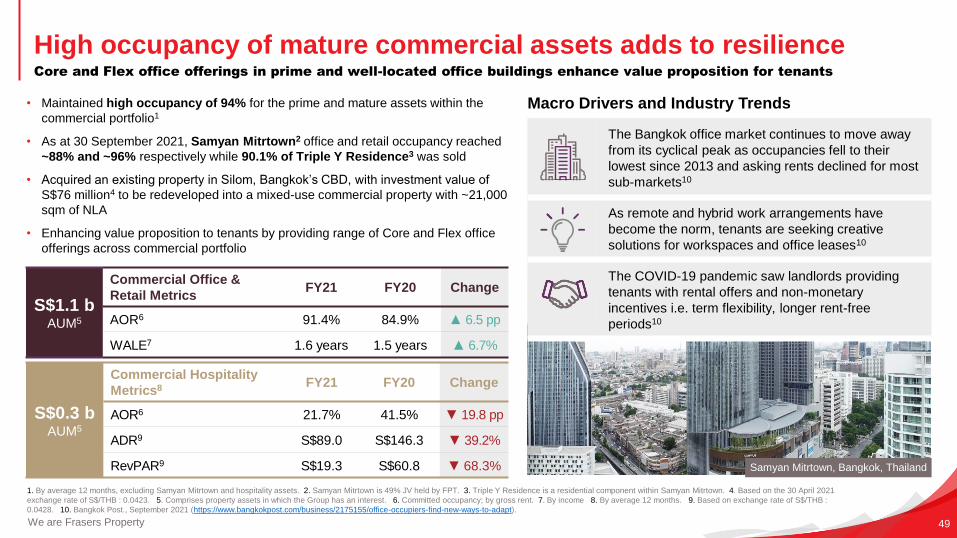
High occupancy of mature commercial assets adds to resilience
We are Frasers Property 49
Core and Flex office offerings in prime and well-located office buildings enhance value proposition for tenants
• Maintained high occupancy of 94% for the prime and mature assets within the
commercial portfolio1
• As at 30 September 2021, Samyan Mitrtown2 office and retail occupancy reached
~88% and ~96% respectively while 90.1% of Triple Y Residence3 was sold
• Acquired an existing property in Silom, Bangkok’s CBD, with investment value of
S$76 million4 to be redeveloped into a mixed-use commercial property with ~21,000
sqm of NLA
• Enhancing value proposition to tenants by providing range of Core and Flex office
offerings across commercial portfolio
1. By average 12 months, excluding Samyan Mitrtown and hospitality assets. 2. Samyan Mitrtown is 49% JV held by FPT. 3. Triple Y Residence is a residential component within Samyan Mitrtown. 4. Based on the 30 April 2021
exchange rate of S$/THB : 0.0423. 5. Comprises property assets in which the Group has an interest. 6. Committed occupancy; by gross rent. 7. By income 8. By average 12 months. 9. Based on exchange rate of S$/THB :
0.0428. 10. Bangkok Post., September 2021 (https://www.bangkokpost.com/business/2175155/office-occupiers-find-new-ways-to-adapt).
Samyan Mitrtown, Bangkok, Thailand
Macro Drivers and Industry Trends
S$1.1 bAUM5
Commercial Office &
Retail MetricsFY21 FY20 Change
AOR6 91.4% 84.9% ▲ 6.5 pp
WALE7 1.6 years 1.5 years ▲ 6.7%
S$0.3 b AUM5
Commercial Hospitality
Metrics8 FY21 FY20 Change
AOR6 21.7% 41.5% ▼ 19.8 pp
ADR9 S$89.0 S$146.3 ▼ 39.2%
RevPAR9 S$19.3 S$60.8 ▼ 68.3%
Focused on developing an integrated Vietnam platform
We are Frasers Property 50
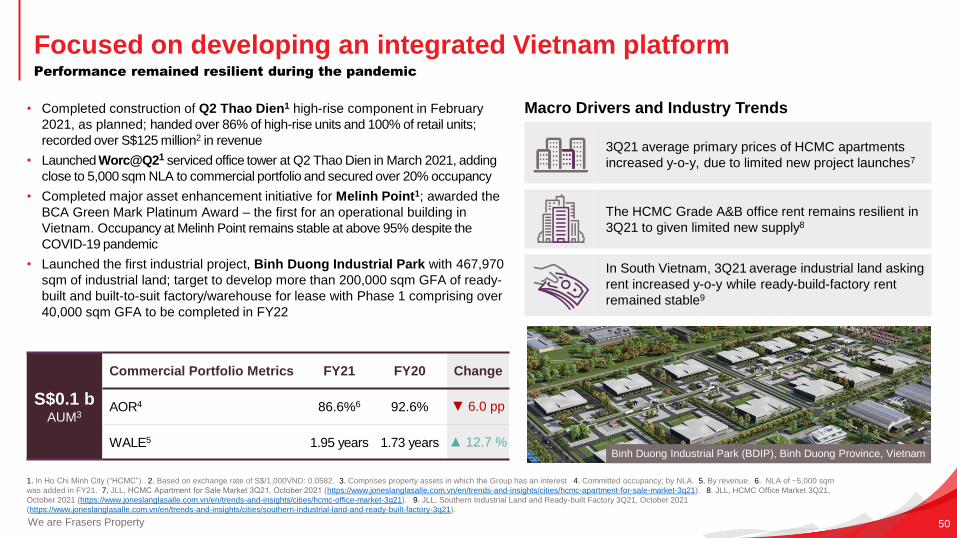
Performance remained resilient during the pandemic
1. In Ho Chi Minh City (“HCMC”). 2. Based on exchange rate of S$/1,000VND: 0.0582. 3. Comprises property assets in which the Group has an interest 4. Committed occupancy; by NLA. 5. By revenue. 6. NLA of ~5,000 sqm
was added in FY21. 7. JLL, HCMC Apartment for Sale Market 3Q21, October 2021 (https://www.joneslanglasalle.com.vn/en/trends-and-insights/cities/hcmc-apartment-for-sale-market-3q21). 8. JLL, HCMC Office Market 3Q21,
October 2021 (https://www.joneslanglasalle.com.vn/en/trends-and-insights/cities/hcmc-office-market-3q21). 9. JLL, Southern Industrial Land and Ready-built Factory 3Q21, October 2021
(https://www.joneslanglasalle.com.vn/en/trends-and-insights/cities/southern-industrial-land-and-ready-built-factory-3q21).
• Completed construction of Q2 Thao Dien1 high-rise component in February
2021, as planned; handed over 86% of high-rise units and 100% of retail units;
recorded over S$125 million2 in revenue
• Launched Worc@Q21 serviced office tower at Q2 Thao Dien in March 2021, adding
close to 5,000 sqm NLA to commercial portfolio and secured over 20% occupancy
• Completed major asset enhancement initiative for Melinh Point1; awarded the
BCA Green Mark Platinum Award – the first for an operational building in
Vietnam. Occupancy at Melinh Point remains stable at above 95% despite the
COVID-19 pandemic
• Launched the first industrial project, Binh Duong Industrial Park with 467,970
sqm of industrial land; target to develop more than 200,000 sqm GFA of ready-
built and built-to-suit factory/warehouse for lease with Phase 1 comprising over
40,000 sqm GFA to be completed in FY22
S$0.1 bAUM3
Commercial Portfolio Metrics FY21 FY20 Change
AOR4 86.6%6 92.6% ▼ 6.0 pp
WALE5 1.95 years 1.73 years ▲ 12.7 %
3Q21 average primary prices of HCMC apartments
increased y-o-y, due to limited new project launches7
The HCMC Grade A&B office rent remains resilient in
3Q21 to given limited new supply8
In South Vietnam, 3Q21 average industrial land asking
rent increased y-o-y while ready-build-factory rent
remained stable9
Binh Duong Industrial Park (BDIP), Binh Duong Province, Vietnam
Macro Drivers and Industry Trends
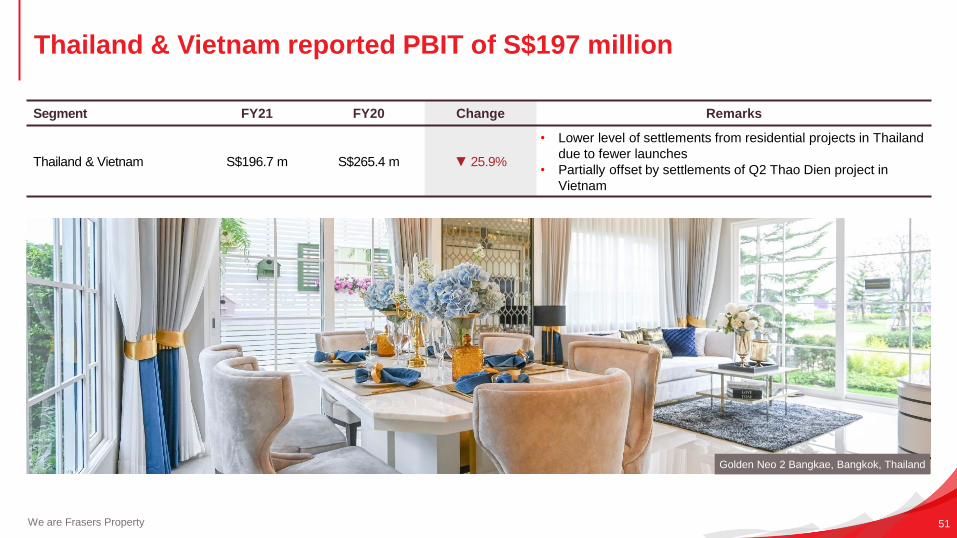
Thailand & Vietnam reported PBIT of S$197 million
We are Frasers Property 51
Segment FY21 FY20 Change Remarks
Thailand & Vietnam S$196.7 m S$265.4 m ▼ 25.9%
• Lower level of settlements from residential projects in Thailand
due to fewer launches
• Partially offset by settlements of Q2 Thao Dien project in
Vietnam
Golden Neo 2 Bangkae, Bangkok, Thailand
Others
Business Unit Highlights
The Rowe – formerly Central House, London, UK
Chengdu office vacancy rate inched upwards
moderately by 0.1% to 22.4% in 3Q 20215
Residential sales prices in Shanghai and Suzhou
increased as a result of the higher sales prices of
newly-launched projects6
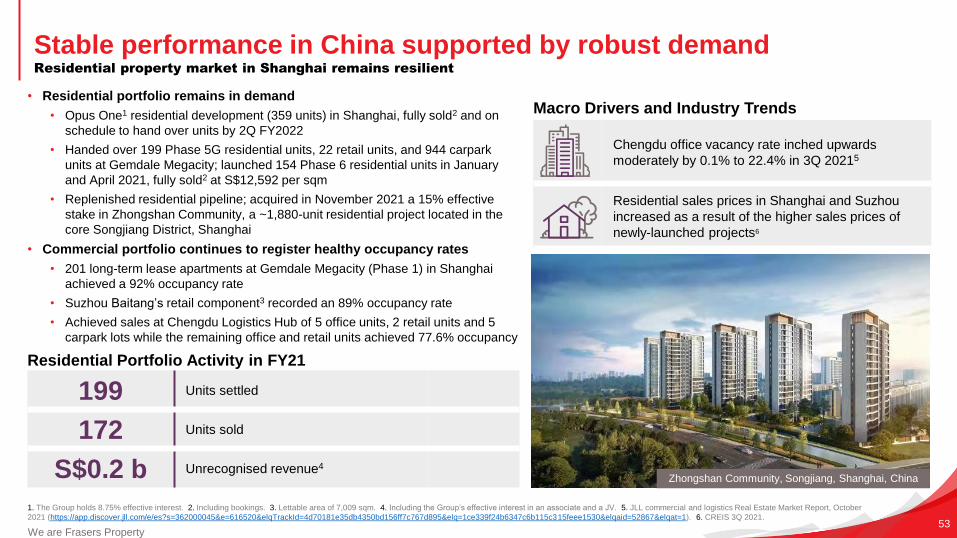
Stable performance in China supported by robust demand
We are Frasers Property53
Residential property market in Shanghai remains resilient
• Residential portfolio remains in demand
• Opus One1 residential development (359 units) in Shanghai, fully sold2 and on
schedule to hand over units by 2Q FY2022
• Handed over 199 Phase 5G residential units, 22 retail units, and 944 carpark
units at Gemdale Megacity; launched 154 Phase 6 residential units in January
and April 2021, fully sold2 at S$12,592 per sqm
• Replenished residential pipeline; acquired in November 2021 a 15% effective
stake in Zhongshan Community, a ~1,880-unit residential project located in the
core Songjiang District, Shanghai
• Commercial portfolio continues to register healthy occupancy rates
• 201 long-term lease apartments at Gemdale Megacity (Phase 1) in Shanghai
achieved a 92% occupancy rate
• Suzhou Baitang’s retail component3 recorded an 89% occupancy rate
• Achieved sales at Chengdu Logistics Hub of 5 office units, 2 retail units and 5
carpark lots while the remaining office and retail units achieved 77.6% occupancy
1. The Group holds 8.75% effective interest. 2. Including bookings. 3. Lettable area of 7,009 sqm. 4. Including the Group’s effective interest in an associate and a JV. 5. JLL commercial and logistics Real Estate Market Report, October
2021 (https://app.discover.jll.com/e/es?s=362000045&e=616520&elqTrackId=4d70181e35db4350bd156ff7c767d895&elq=1ce339f24b6347c6b115c315feee1530&elqaid=52867&elqat=1). 6. CREIS 3Q 2021.
Zhongshan Community, Songjiang, Shanghai, China
Macro Drivers and Industry Trends
199 Units settled
172 Units sold
S$0.2 b Unrecognised revenue4
Residential Portfolio Activity in FY21
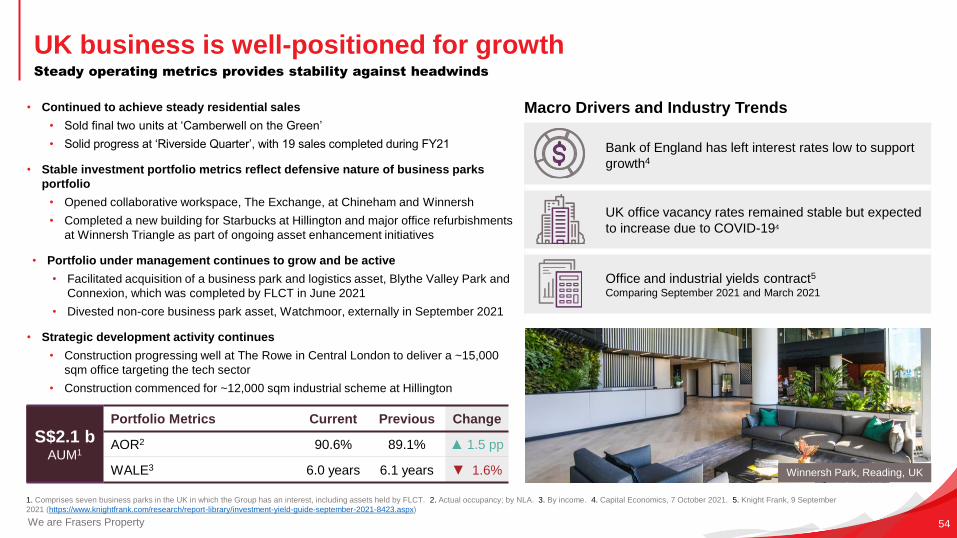
Bank of England has left interest rates low to support
growth4
UK office vacancy rates remained stable but expected
to increase due to COVID-194
Office and industrial yields contract5
Comparing September 2021 and March 2021
UK business is well-positioned for growth
We are Frasers Property 54
Steady operating metrics provides stability against headwinds
• Continued to achieve steady residential sales
• Sold final two units at ‘Camberwell on the Green’
• Solid progress at ‘Riverside Quarter’, with 19 sales completed during FY21
• Stable investment portfolio metrics reflect defensive nature of business parks
portfolio
• Opened collaborative workspace, The Exchange, at Chineham and Winnersh
• Completed a new building for Starbucks at Hillington and major office refurbishments
at Winnersh Triangle as part of ongoing asset enhancement initiatives
• Portfolio under management continues to grow and be active
• Facilitated acquisition of a business park and logistics asset, Blythe Valley Park and
Connexion, which was completed by FLCT in June 2021
• Divested non-core business park asset, Watchmoor, externally in September 2021
• Strategic development activity continues
• Construction progressing well at The Rowe in Central London to deliver a ~15,000
sqm office targeting the tech sector
• Construction commenced for ~12,000 sqm industrial scheme at Hillington
1. Comprises seven business parks in the UK in which the Group has an interest, including assets held by FLCT. 2. Actual occupancy; by NLA. 3. By income. 4. Capital Economics, 7 October 2021. 5. Knight Frank, 9 September
2021 (https://www.knightfrank.com/research/report-library/investment-yield-guide-september-2021-8423.aspx)
Winnersh Park, Reading, UK
Macro Drivers and Industry Trends
S$2.1 bAUM1
Portfolio Metrics Current Previous Change
AOR2 90.6% 89.1% ▲ 1.5 pp
WALE3 6.0 years 6.1 years ▼ 1.6%
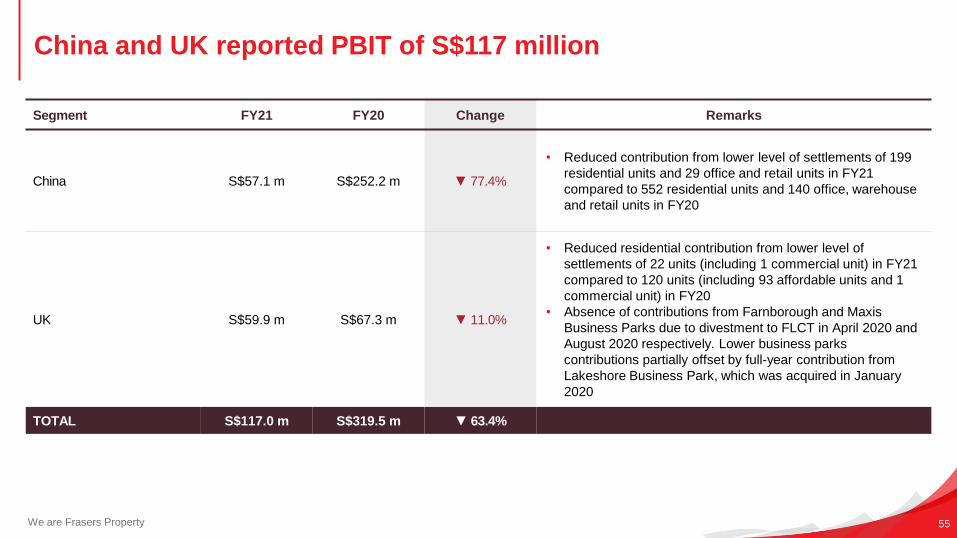
We are Frasers Property 55
China and UK reported PBIT of S$117 million
Segment FY21 FY20 Change Remarks
China S$57.1 m S$252.2 m ▼ 77.4%
• Reduced contribution from lower level of settlements of 199
residential units and 29 office and retail units in FY21
compared to 552 residential units and 140 office, warehouse
and retail units in FY20
UK S$59.9 m S$67.3 m ▼ 11.0%
• Reduced residential contribution from lower level of
settlements of 22 units (including 1 commercial unit) in FY21
compared to 120 units (including 93 affordable units and 1
commercial unit) in FY20
• Absence of contributions from Farnborough and Maxis
Business Parks due to divestment to FLCT in April 2020 and
August 2020 respectively. Lower business parks
contributions partially offset by full-year contribution from
Lakeshore Business Park, which was acquired in January
2020
TOTAL S$117.0 m S$319.5 m ▼ 63.4%
Appendix I
Century Square, Singapore

RE
ITs / S
taple
d T
rust
Singapore Australia IndustrialThailand & Vietnam
Industrial
Commercial & Business Parks
Retail
Industrial &
Logistics
Hospitality
Hospitality
Others2
Segm
ents
Residential
We are Frasers Property 57
1. Comprises property assets in which the Group has an interest, including assets held by its REITs, JVs and associates. 2. Consists of China and the UK. 3. Including both owned and managed properties; and units pending opening.
Multi-national real estate company with
multi-segment expertise• S$42.6 billion AUM1 across five asset classes
• Four main SBUs – Singapore, Australia,
Hospitality, Industrial; as well as Thailand &
Vietnam and Others2
Overview of Frasers Property
~5,600residential units settled in
FY21
S$12.7 b industrial & logistics AUM1
S$10.3 b retail AUM1
S$10.0 bcommercial & business parks
AUM1
S$4.9 bhospitality AUM1;
~19,5003 hospitality units
5 REITs / Stapled Trust
FCT, FLCT, FHT, FTREIT,
and GVREIT
We are Frasers Property 58
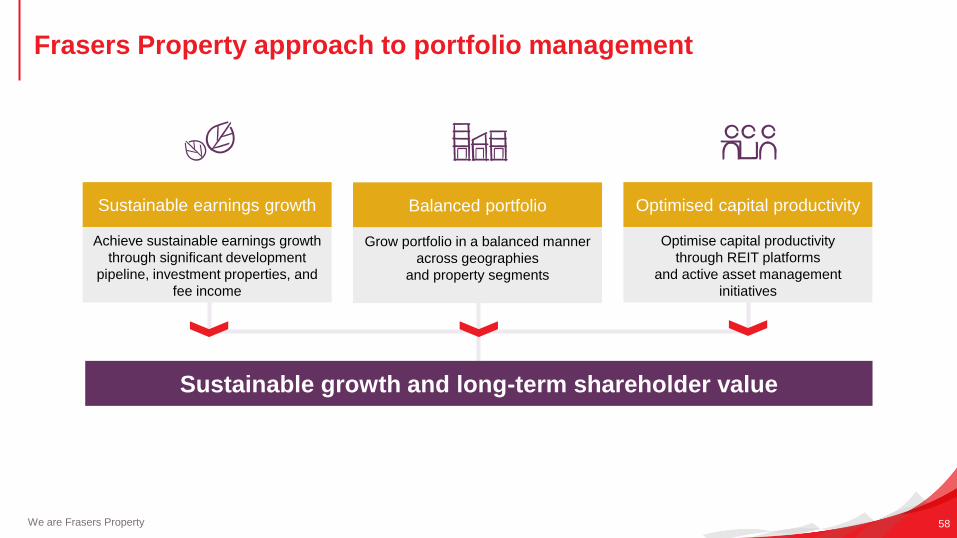
Frasers Property approach to portfolio management
Sustainable growth and long-term shareholder value
Balanced portfolio Optimised capital productivitySustainable earnings growth
Achieve sustainable earnings growth
through significant development
pipeline, investment properties, and
fee income
Grow portfolio in a balanced manner
across geographies
and property segments
Optimise capital productivity
through REIT platforms
and active asset management
initiatives
We are Frasers Property 59
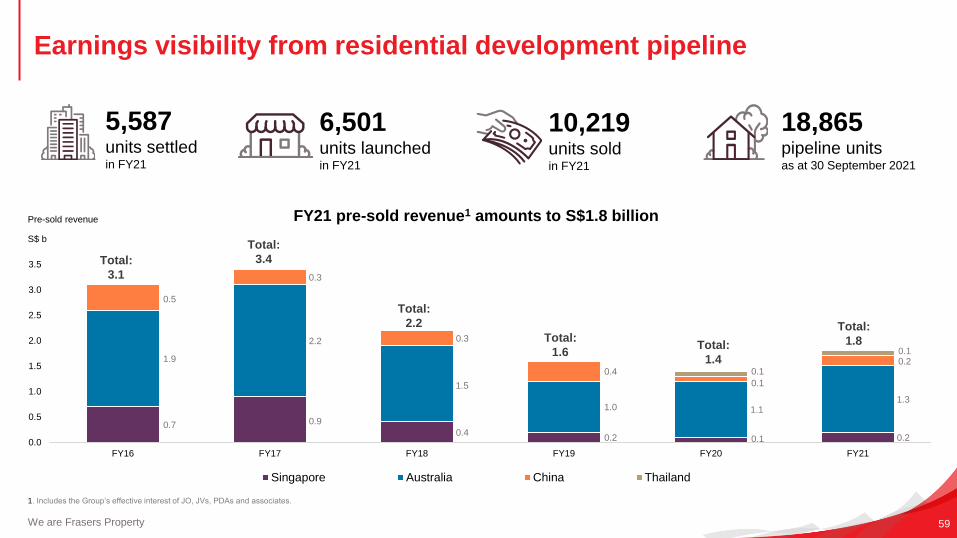
1. Includes the Group’s effective interest of JO, JVs, PDAs and associates.
Earnings visibility from residential development pipeline
5,587units settledin FY21
10,219units soldin FY21
18,865pipeline unitsas at 30 September 2021
6,501units launchedin FY21
FY21 pre-sold revenue1 amounts to S$1.8 billion
0.7 0.9
0.40.2 0.1 0.2
1.9
2.2
1.5
1.0 1.11.3
0.5
0.3
0.3
0.4
0.1
0.20.1
0.1
0.0
0.5
1.0
1.5
2.0
2.5
3.0
3.5
FY16 FY17 FY18 FY19 FY20 FY21
Singapore Australia China Thailand
Total:
1.4
S$ b
Total:
3.1
Total:
3.4
Total:
2.2
Total:
1.6
Total:
1.8
Pre-sold revenue
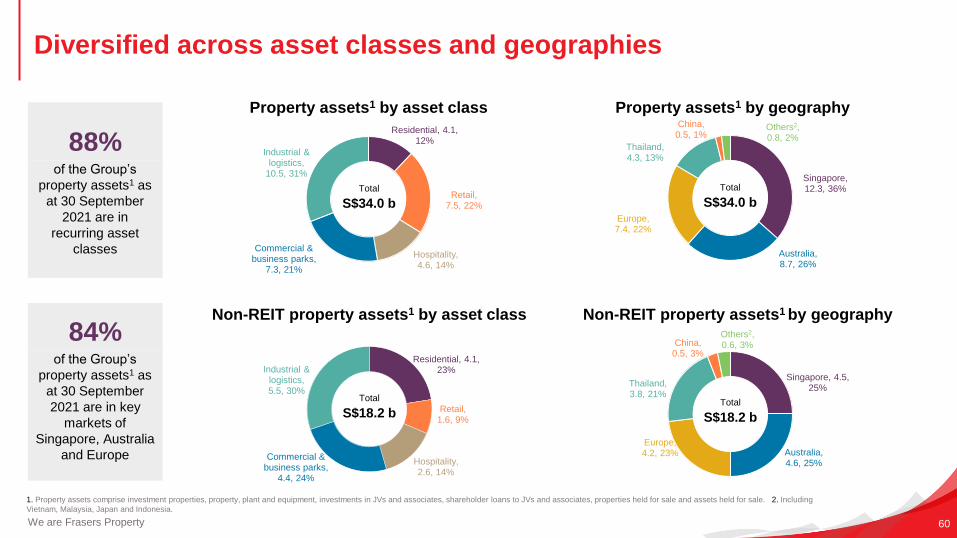
Diversified across asset classes and geographies
We are Frasers Property
1. Property assets comprise investment properties, property, plant and equipment, investments in JVs and associates, shareholder loans to JVs and associates, properties held for sale and assets held for sale. 2. Including
Vietnam, Malaysia, Japan and Indonesia.
Singapore,12.3, 36%
Australia, 8.7, 26%
Europe, 7.4, 22%
Thailand, 4.3, 13%
China, 0.5, 1%
Others2, 0.8, 2%
Singapore, 4.5, 25%
Australia, 4.6, 25%
Europe, 4.2, 23%
Thailand, 3.8, 21%
China, 0.5, 3%
Others2, 0.6, 3%
Residential, 4.1, 12%
Retail, 7.5, 22%
Hospitality, 4.6, 14%
Commercial & business parks,
7.3, 21%
Industrial & logistics,
10.5, 31%
Residential, 4.1, 23%
Retail, 1.6, 9%
Hospitality, 2.6, 14%
Commercial & business parks,
4.4, 24%
Industrial & logistics, 5.5, 30%
Total
S$34.0 b
Total
S$34.0 b
Total
S$18.2 bTotal
S$18.2 b
Property assets1 by asset class Property assets1 by geography
Non-REIT property assets1 by asset class Non-REIT property assets1 by geography
88%of the Group’s
property assets1 as
at 30 September
2021 are in
recurring asset
classes
84%of the Group’s
property assets1 as
at 30 September
2021 are in key
markets of
Singapore, Australia
and Europe
60
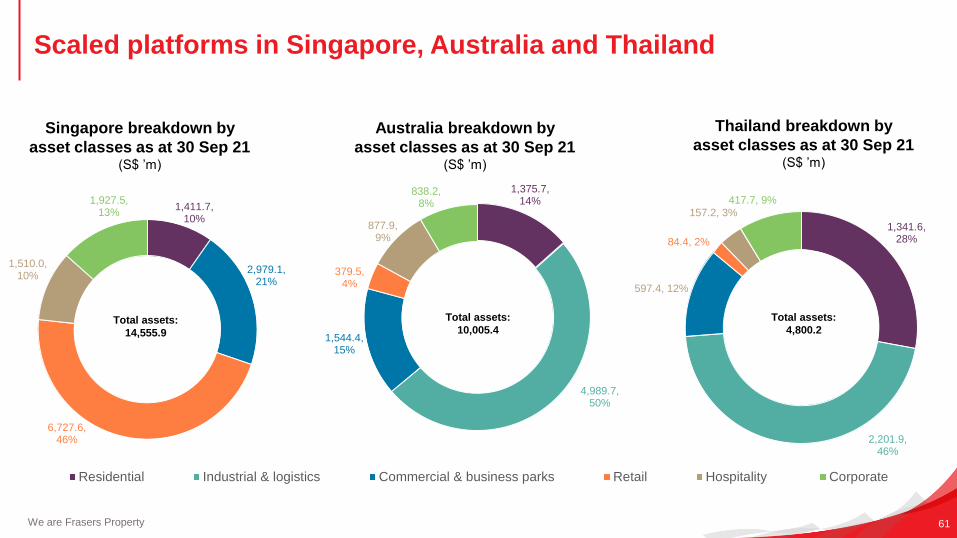
1,341.6, 28%
2,201.9, 46%
597.4, 12%
84.4, 2%
157.2, 3%
417.7, 9%1,411.7,
10%
2,979.1, 21%
6,727.6, 46%
1,510.0, 10%
1,927.5, 13%
1,375.7, 14%
4,989.7, 50%
1,544.4, 15%
379.5, 4%
877.9, 9%
838.2, 8%
Residential Industrial & logistics Commercial & business parks Retail Hospitality Corporate
We are Frasers Property
Australia breakdown by
asset classes as at 30 Sep 21(S$ ’m)
Singapore breakdown by
asset classes as at 30 Sep 21(S$ ’m)
Thailand breakdown by
asset classes as at 30 Sep 21(S$ ’m)
Total assets:
10,005.4Total assets:
14,555.9
Total assets:
4,800.2
61
Scaled platforms in Singapore, Australia and Thailand
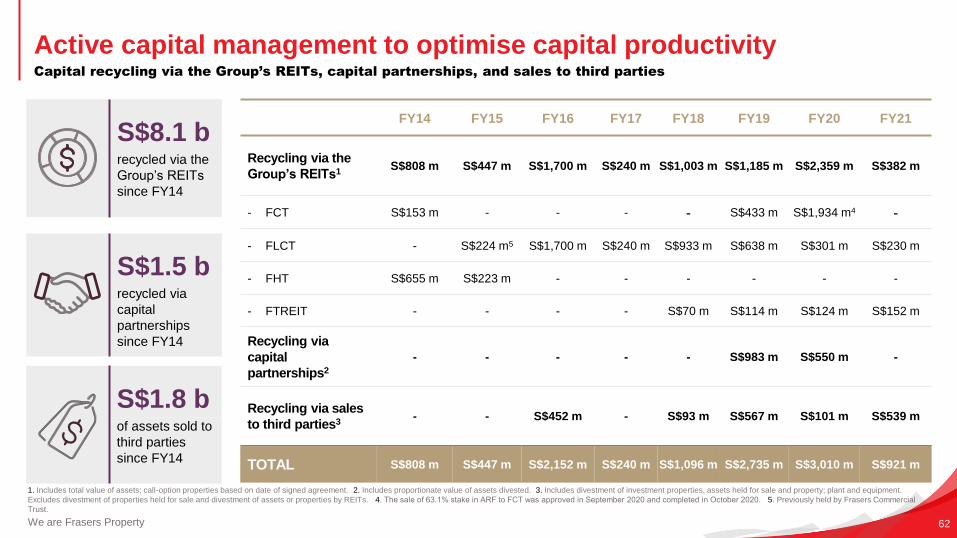
Active capital management to optimise capital productivity
We are Frasers Property 62
Capital recycling via the Group’s REITs, capital partnerships, and sales to third parties
1. Includes total value of assets; call-option properties based on date of signed agreement. 2. Includes proportionate value of assets divested. 3. Includes divestment of investment properties, assets held for sale and property; plant and equipment.
Excludes divestment of properties held for sale and divestment of assets or properties by REITs. 4. The sale of 63.1% stake in ARF to FCT was approved in September 2020 and completed in October 2020. 5. Previously held by Frasers Commercial
Trust.
FY14 FY15 FY16 FY17 FY18 FY19 FY20 FY21
Recycling via the
Group’s REITs1S$808 m S$447 m S$1,700 m S$240 m S$1,003 m S$1,185 m S$2,359 m S$382 m
- FCT S$153 m - - - - S$433 m S$1,934 m4 -
- FLCT - S$224 m5 S$1,700 m S$240 m S$933 m S$638 m S$301 m S$230 m
- FHT S$655 m S$223 m - - - - - -
- FTREIT - - - - S$70 m S$114 m S$124 m S$152 m
Recycling via
capital
partnerships2
- - - - - S$983 m S$550 m -
Recycling via sales
to third parties3- - S$452 m - S$93 m S$567 m S$101 m S$539 m
TOTAL S$808 m S$447 m S$2,152 m S$240 m S$1,096 m S$2,735 m S$3,010 m S$921 m
S$8.1 brecycled via the
Group’s REITs
since FY14
S$1.5 brecycled via
capital
partnerships
since FY14
S$1.8 bof assets sold to
third parties
since FY14
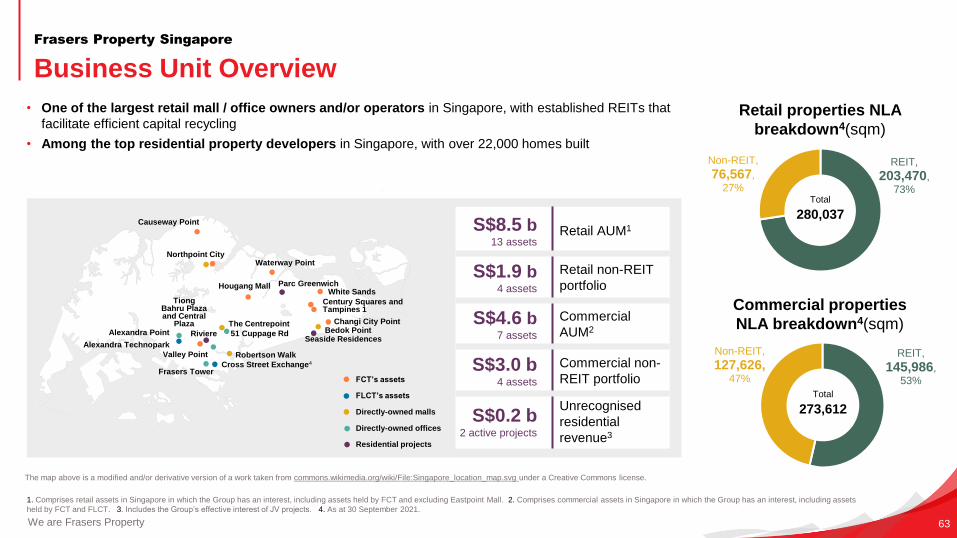
We are Frasers Property 63
• One of the largest retail mall / office owners and/or operators in Singapore, with established REITs that
facilitate efficient capital recycling
• Among the top residential property developers in Singapore, with over 22,000 homes built
1. Comprises retail assets in Singapore in which the Group has an interest, including assets held by FCT and excluding Eastpoint Mall. 2. Comprises commercial assets in Singapore in which the Group has an interest, including assets
held by FCT and FLCT. 3. Includes the Group’s effective interest of JV projects. 4. As at 30 September 2021.
Business Unit Overview
Frasers Property Singapore
REIT,
203,470,
73%
Non-REIT,
76,567,
27%
Retail properties NLA
breakdown4(sqm)
Commercial properties
NLA breakdown4(sqm)
REIT,
145,986,
53%
Non-REIT,
127,626, 47%
The map above is a modified and/or derivative version of a work taken from commons.wikimedia.org/wiki/File:Singapore_location_map.svg under a Creative Commons license.
Bedok Point
Causeway Point
The Centrepoint
Robertson WalkValley Point
Northpoint City
Changi City Point
Waterway Point
Alexandra Point
Alexandra Technopark
51 Cuppage Rd
Frasers TowerCross Street Exchange4
Century Squares and Tampines 1
White SandsHougang Mall
Tiong Bahru Plaza and Central
Plaza
Total
280,037
Total
273,612
FCT’s assets
FLCT’s assets
Directly-owned malls
Directly-owned offices
Residential projects
RiviereSeaside Residences
Parc Greenwich
S$8.5 b13 assets
Retail AUM1
S$1.9 b4 assets
Retail non-REIT
portfolio
S$4.6 b7 assets
Commercial
AUM2
S$3.0 b4 assets
Commercial non-
REIT portfolio
S$0.2 b2 active projects
Unrecognised
residential
revenue3
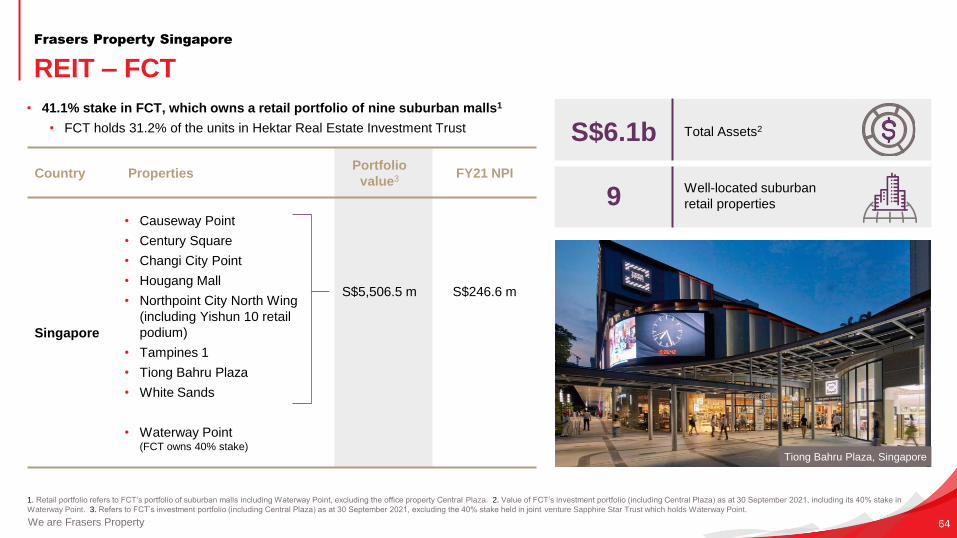
We are Frasers Property 64
• 41.1% stake in FCT, which owns a retail portfolio of nine suburban malls1
• FCT holds 31.2% of the units in Hektar Real Estate Investment Trust
1. Retail portfolio refers to FCT’s portfolio of suburban malls including Waterway Point, excluding the office property Central Plaza. 2. Value of FCT’s investment portfolio (including Central Plaza) as at 30 September 2021, including its 40% stake in
Waterway Point. 3. Refers to FCT’s investment portfolio (including Central Plaza) as at 30 September 2021, excluding the 40% stake held in joint venture Sapphire Star Trust which holds Waterway Point.
REIT – FCT
Frasers Property Singapore
Tiong Bahru Plaza, Singapore
Country PropertiesPortfolio
value3 FY21 NPI
Singapore
• Causeway Point
• Century Square
• Changi City Point
• Hougang Mall
• Northpoint City North Wing
(including Yishun 10 retail
podium)
• Tampines 1
• Tiong Bahru Plaza
• White Sands
• Waterway Point(FCT owns 40% stake)
S$5,506.5 m S$246.6 m
S$6.1b Total Assets2
9Well-located suburban
retail properties
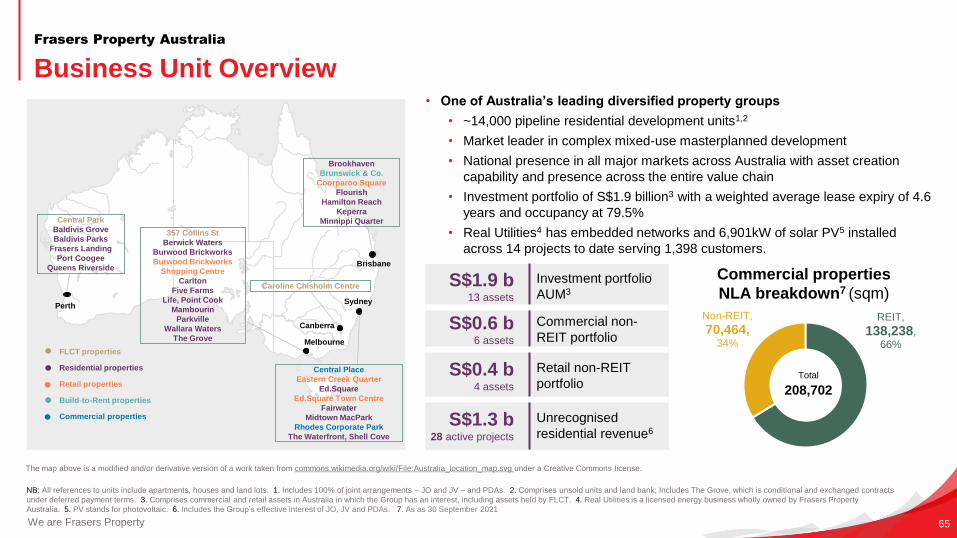
We are Frasers Property 65
• One of Australia’s leading diversified property groups
• ~14,000 pipeline residential development units1,2
• Market leader in complex mixed-use masterplanned development
• National presence in all major markets across Australia with asset creation
capability and presence across the entire value chain
• Investment portfolio of S$1.9 billion3 with a weighted average lease expiry of 4.6
years and occupancy at 79.5%
• Real Utilities4 has embedded networks and 6,901kW of solar PV5 installed
across 14 projects to date serving 1,398 customers.
NB: All references to units include apartments, houses and land lots. 1. Includes 100% of joint arrangements – JO and JV – and PDAs. 2. Comprises unsold units and land bank; Includes The Grove, which is conditional and exchanged contracts
under deferred payment terms. 3. Comprises commercial and retail assets in Australia in which the Group has an interest, including assets held by FLCT. 4. Real Utilities is a licensed energy business wholly owned by Frasers Property
Australia. 5. PV stands for photovoltaic. 6. Includes the Group’s effective interest of JO, JV and PDAs. 7. As as 30 September 2021
Business Unit Overview
Frasers Property Australia
The map above is a modified and/or derivative version of a work taken from commons.wikimedia.org/wiki/File:Australia_location_map.svg under a Creative Commons license.
Commercial properties
NLA breakdown7 (sqm)
REIT,
138,238,
66%
Non-REIT,
70,464, 34%
Total
208,702
Central Park
Baldivis Grove
Baldivis Parks
Frasers Landing
Port Coogee
Queens Riverside
S$1.9 b13 assets
Investment portfolio
AUM3
S$0.6 b6 assets
Commercial non-
REIT portfolio
S$0.4 b4 assets
Retail non-REIT
portfolio
S$1.3 b28 active projects
Unrecognised
residential revenue6
357 Collins St
Berwick Waters
Burwood Brickworks
Burwood Brickworks
Shopping Centre
Carlton
Five Farms
Life, Point Cook
Mambourin
Parkville
Wallara Waters
The Grove
Central Place
Eastern Creek Quarter
Ed.Square
Ed.Square Town Centre
Fairwater
Midtown MacPark
Rhodes Corporate Park
The Waterfront, Shell Cove
Brookhaven
Brunswick & Co.
Coorparoo Square
Flourish
Hamilton Reach
Keperra
Minnippi Quarter
Perth
Melbourne
Sydney
Brisbane
FLCT properties
Residential properties
Retail properties
Build-to-Rent properties
Commercial properties
Canberra
Caroline Chisholm Centre
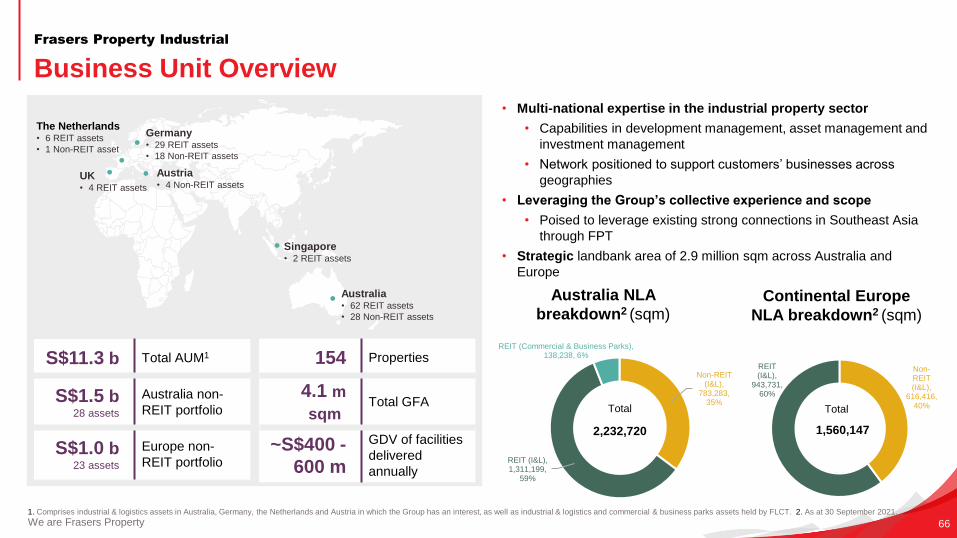
We are Frasers Property 66
• Multi-national expertise in the industrial property sector
• Capabilities in development management, asset management and
investment management
• Network positioned to support customers’ businesses across
geographies
• Leveraging the Group’s collective experience and scope
• Poised to leverage existing strong connections in Southeast Asia
through FPT
• Strategic landbank area of 2.9 million sqm across Australia and
Europe
1. Comprises industrial & logistics assets in Australia, Germany, the Netherlands and Austria in which the Group has an interest, as well as industrial & logistics and commercial & business parks assets held by FLCT. 2. As at 30 September 2021.
Business Unit Overview
Frasers Property Industrial
Australia NLA
breakdown2 (sqm)Continental Europe
NLA breakdown2 (sqm)
The Netherlands• 6 REIT assets
• 1 Non-REIT asset
UK• 4 REIT assets
Germany• 29 REIT assets
• 18 Non-REIT assets
Singapore• 2 REIT assets
Australia• 62 REIT assets
• 28 Non-REIT assets
Austria• 4 Non-REIT assets
S$11.3 b Total AUM1
S$1.5 b28 assets
Australia non-
REIT portfolio
S$1.0 b23 assets
Europe non-
REIT portfolio
154 Properties
4.1 m
sqmTotal GFA
~S$400 -
600 m
GDV of facilities
delivered
annually
Non-REIT (I&L),
783,283, 35%
REIT (I&L), 1,311,199,
59%
REIT (Commercial & Business Parks), 138,238, 6%
2,232,720
Total
Non-REIT (I&L),
616,416, 40%
REIT (I&L),
943,731, 60%
1,560,147
Total
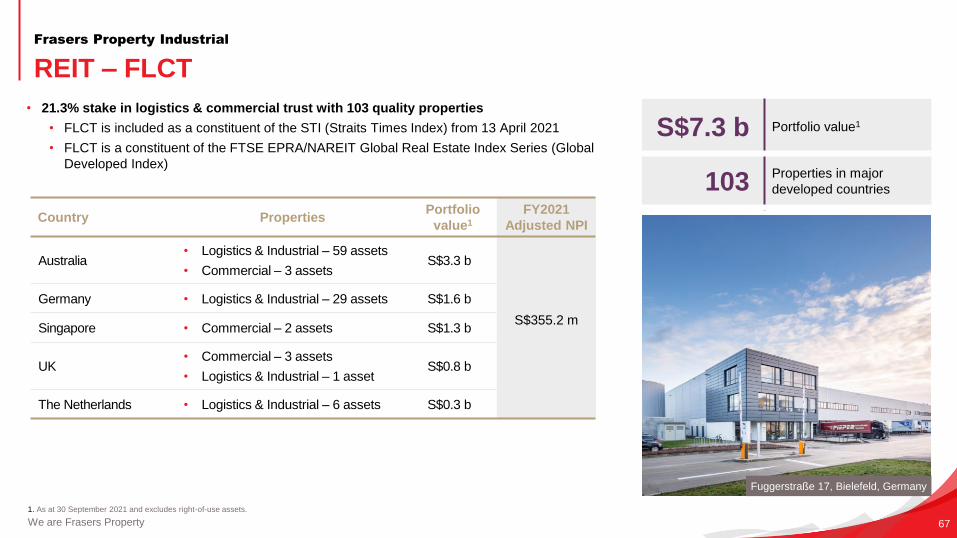
We are Frasers Property 67
• 21.3% stake in logistics & commercial trust with 103 quality properties
• FLCT is included as a constituent of the STI (Straits Times Index) from 13 April 2021
• FLCT is a constituent of the FTSE EPRA/NAREIT Global Real Estate Index Series (Global
Developed Index)
1. As at 30 September 2021 and excludes right-of-use assets.
REIT – FLCT
Frasers Property Industrial
S$7.3 b Portfolio value1
103Properties in major
developed countries
Fuggerstraße 17, Bielefeld, Germany
Country PropertiesPortfolio
value1
FY2021
Adjusted NPI
Australia• Logistics & Industrial – 59 assets
• Commercial – 3 assets S$3.3 b
S$355.2 m
Germany • Logistics & Industrial – 29 assets S$1.6 b
Singapore • Commercial – 2 assets S$1.3 b
UK• Commercial – 3 assets
• Logistics & Industrial – 1 assetS$0.8 b
The Netherlands • Logistics & Industrial – 6 assets S$0.3 b
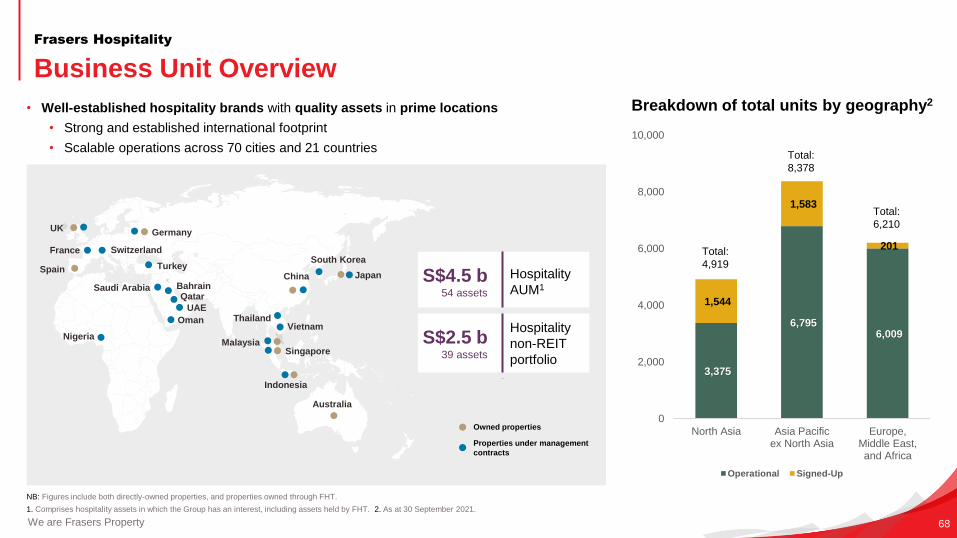
We are Frasers Property 68
• Well-established hospitality brands with quality assets in prime locations
• Strong and established international footprint
• Scalable operations across 70 cities and 21 countries
NB: Figures include both directly-owned properties, and properties owned through FHT.
1. Comprises hospitality assets in which the Group has an interest, including assets held by FHT. 2. As at 30 September 2021.
Business Unit Overview
Frasers Hospitality
Breakdown of total units by geography2
Owned properties
Properties under management
contracts
S$4.5 b54 assets
Hospitality
AUM1
S$2.5 b39 assets
Hospitality
non-REIT
portfolio3,375
6,795 6,009
1,544
1,583
201
0
2,000
4,000
6,000
8,000
10,000
North Asia Asia Pacificex North Asia
Europe,Middle East,and Africa
Operational Signed-Up
Total:
4,919
Total:
8,378
Total:
6,210
China
UK
Australia
Singapore
Indonesia
BahrainJapan
France
Malaysia
Qatar
South Korea
Vietnam
UAE
Turkey
Thailand
Spain
Germany
Saudi Arabia
Nigeria
Switzerland
Oman
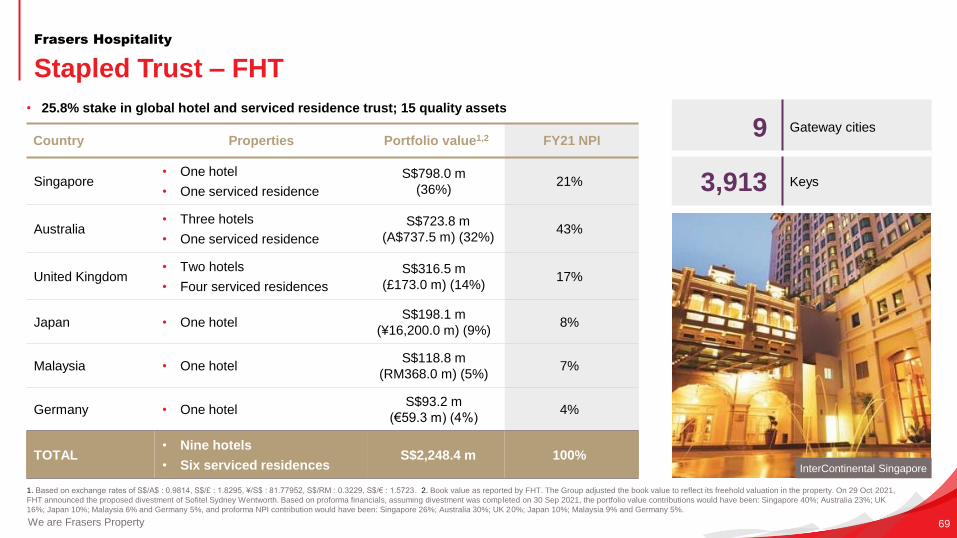
We are Frasers Property 69
1. Based on exchange rates of S$/A$ : 0.9814, S$/£ : 1.8295, ¥/S$ : 81.77952, S$/RM : 0.3229, S$/€ : 1.5723. 2. Book value as reported by FHT. The Group adjusted the book value to reflect its freehold valuation in the property. On 29 Oct 2021,
FHT announced the proposed divestment of Sofitel Sydney Wentworth. Based on proforma financials, assuming divestment was completed on 30 Sep 2021, the portfolio value contributions would have been: Singapore 40%; Australia 23%; UK
16%; Japan 10%; Malaysia 6% and Germany 5%, and proforma NPI contribution would have been: Singapore 26%; Australia 30%; UK 20%; Japan 10%; Malaysia 9% and Germany 5%.
Stapled Trust – FHT
Frasers Hospitality
• 25.8% stake in global hotel and serviced residence trust; 15 quality assets
Country Properties Portfolio value1,2 FY21 NPI
Singapore• One hotel
• One serviced residence
S$798.0 m
(36%)21%
Australia• Three hotels
• One serviced residence
S$723.8 m
(A$737.5 m) (32%)43%
United Kingdom• Two hotels
• Four serviced residences
S$316.5 m
(£173.0 m) (14%)17%
Japan • One hotelS$198.1 m
(¥16,200.0 m) (9%)8%
Malaysia • One hotelS$118.8 m
(RM368.0 m) (5%)7%
Germany • One hotelS$93.2 m
(€59.3 m) (4%)4%
TOTAL• Nine hotels
• Six serviced residencesS$2,248.4 m 100%
9 Gateway cities
3,913 Keys
InterContinental Singapore
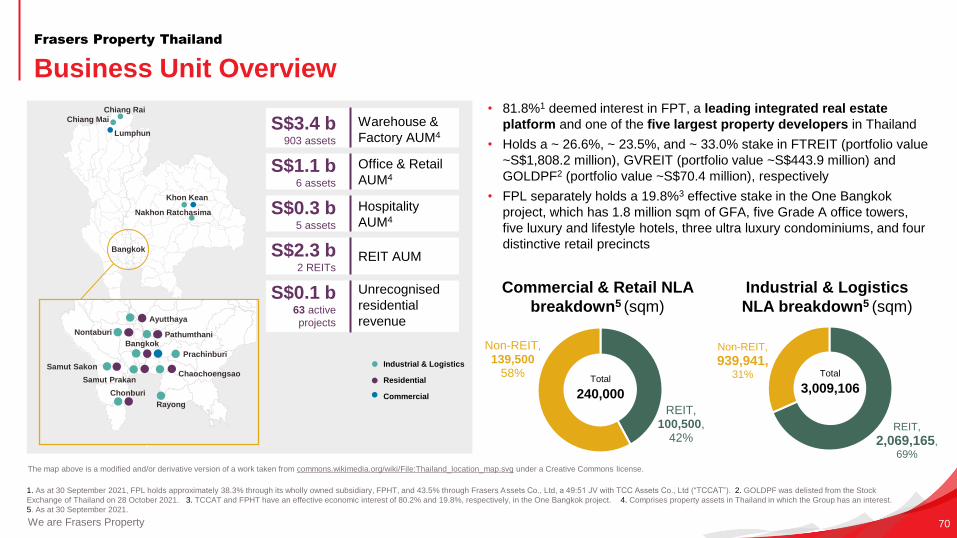
We are Frasers Property 70
1. As at 30 September 2021, FPL holds approximately 38.3% through its wholly owned subsidiary, FPHT, and 43.5% through Frasers Assets Co., Ltd, a 49:51 JV with TCC Assets Co., Ltd (“TCCAT”). 2. GOLDPF was delisted from the Stock
Exchange of Thailand on 28 October 2021. 3. TCCAT and FPHT have an effective economic interest of 80.2% and 19.8%, respectively, in the One Bangkok project. 4. Comprises property assets in Thailand in which the Group has an interest.
5. As at 30 September 2021.
Business Unit Overview
Frasers Property Thailand
Commercial & Retail NLA
breakdown5 (sqm)
Industrial & Logistics
NLA breakdown5 (sqm)
REIT,
2,069,165,
69%
Non-REIT,
939,941, 31%
The map above is a modified and/or derivative version of a work taken from commons.wikimedia.org/wiki/File:Thailand_location_map.svg under a Creative Commons license.
Total
3,009,106
Industrial & Logistics
Residential
Commercial
REIT, 100,500,
42%
Non-REIT, 139,500
58%Total
240,000
Chiang Rai
Chiang Mai
Lumphun
Nakhon Ratchasima
Khon Kean
Bangkok
S$3.4 b903 assets
Warehouse &
Factory AUM4
S$1.1 b6 assets
Office & Retail
AUM4
S$0.3 b5 assets
Hospitality
AUM4
S$2.3 b2 REITs
REIT AUM
S$0.1 b63 active
projects
Unrecognised
residential
revenue
Chonburi
Rayong
Chaochoengsao
Prachinburi
Samut Prakan
Samut Sakon
Nontaburi Pathumthani
Ayutthaya
Bangkok
• 81.8%1 deemed interest in FPT, a leading integrated real estate
platform and one of the five largest property developers in Thailand
• Holds a ~ 26.6%, ~ 23.5%, and ~ 33.0% stake in FTREIT (portfolio value
~S$1,808.2 million), GVREIT (portfolio value ~S$443.9 million) and
GOLDPF2 (portfolio value ~S$70.4 million), respectively
• FPL separately holds a 19.8%3 effective stake in the One Bangkok
project, which has 1.8 million sqm of GFA, five Grade A office towers,
five luxury and lifestyle hotels, three ultra luxury condominiums, and four
distinctive retail precincts
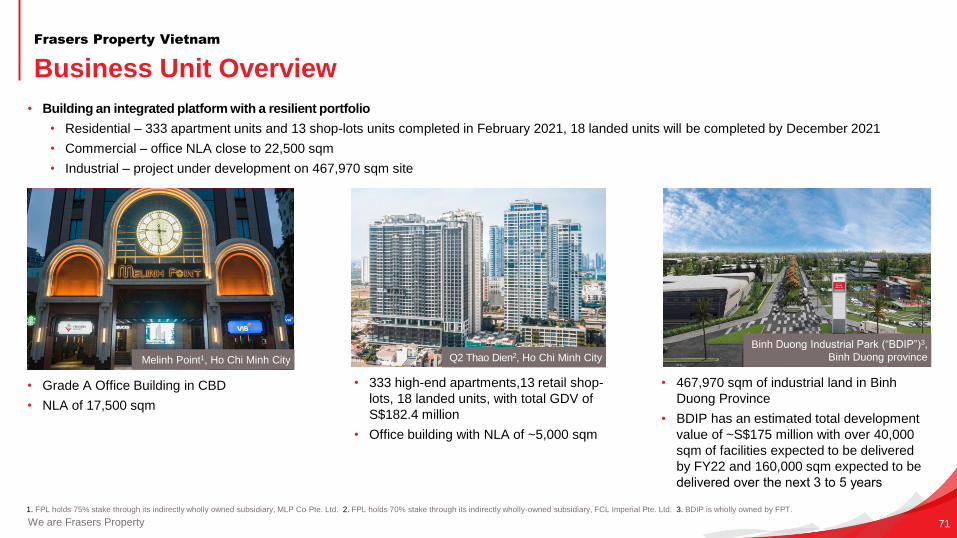
We are Frasers Property 71
1. FPL holds 75% stake through its indirectly wholly owned subsidiary, MLP Co Pte. Ltd. 2. FPL holds 70% stake through its indirectly wholly-owned subsidiary, FCL Imperial Pte. Ltd. 3. BDIP is wholly owned by FPT.
Business Unit Overview
Frasers Property Vietnam
• Building an integrated platform with a resilient portfolio
• Residential – 333 apartment units and 13 shop-lots units completed in February 2021, 18 landed units will be completed by December 2021
• Commercial – office NLA close to 22,500 sqm
• Industrial – project under development on 467,970 sqm site
• Grade A Office Building in CBD
• NLA of 17,500 sqm
Melinh Point1, Ho Chi Minh City Q2 Thao Dien2, Ho Chi Minh City
Binh Duong Industrial Park (“BDIP”)3,
Binh Duong province
• 333 high-end apartments,13 retail shop-
lots, 18 landed units, with total GDV of
S$182.4 million
• Office building with NLA of ~5,000 sqm
• 467,970 sqm of industrial land in Binh
Duong Province
• BDIP has an estimated total development
value of ~S$175 million with over 40,000
sqm of facilities expected to be delivered
by FY22 and 160,000 sqm expected to be
delivered over the next 3 to 5 years
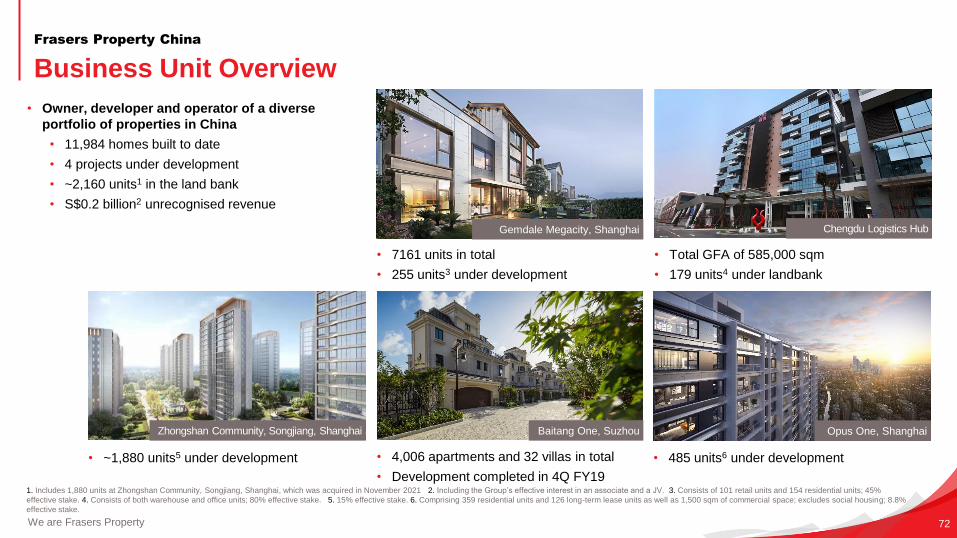
We are Frasers Property 72
• Owner, developer and operator of a diverse
portfolio of properties in China
• 11,984 homes built to date
• 4 projects under development
• ~2,160 units1 in the land bank
• S$0.2 billion2 unrecognised revenue
1. Includes 1,880 units at Zhongshan Community, Songjiang, Shanghai, which was acquired in November 2021 2. Including the Group’s effective interest in an associate and a JV. 3. Consists of 101 retail units and 154 residential units; 45%
effective stake. 4. Consists of both warehouse and office units; 80% effective stake. 5. 15% effective stake. 6. Comprising 359 residential units and 126 long-term lease units as well as 1,500 sqm of commercial space; excludes social housing; 8.8%
effective stake.
Business Unit Overview
Frasers Property China
• 7161 units in total
• 255 units3 under development
Gemdale Megacity, Shanghai Chengdu Logistics Hub
Opus One, Shanghai
• Total GFA of 585,000 sqm
• 179 units4 under landbank
Baitang One, Suzhou
• 4,006 apartments and 32 villas in total
• Development completed in 4Q FY19
• 485 units6 under development
Zhongshan Community, Songjiang, Shanghai
• ~1,880 units5 under development
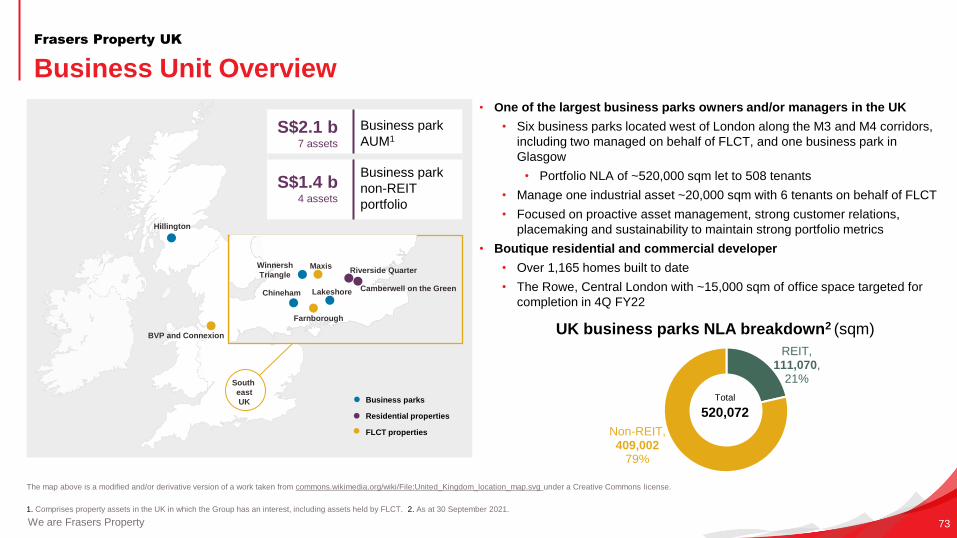
• One of the largest business parks owners and/or managers in the UK
• Six business parks located west of London along the M3 and M4 corridors,
including two managed on behalf of FLCT, and one business park in
Glasgow
• Portfolio NLA of ~520,000 sqm let to 508 tenants
• Manage one industrial asset ~20,000 sqm with 6 tenants on behalf of FLCT
• Focused on proactive asset management, strong customer relations,
placemaking and sustainability to maintain strong portfolio metrics
• Boutique residential and commercial developer
• Over 1,165 homes built to date
• The Rowe, Central London with ~15,000 sqm of office space targeted for
completion in 4Q FY22
We are Frasers Property 73
1. Comprises property assets in the UK in which the Group has an interest, including assets held by FLCT. 2. As at 30 September 2021.
Business Unit Overview
Frasers Property UK
UK business parks NLA breakdown2 (sqm)
The map above is a modified and/or derivative version of a work taken from commons.wikimedia.org/wiki/File:United_Kingdom_location_map.svg under a Creative Commons license.
Business parks
Residential properties
FLCT properties
Total
520,072
S$2.1 b7 assets
Business park
AUM1
S$1.4 b4 assets
Business park
non-REIT
portfolio
Hillington
Riverside Quarter
Camberwell on the Green
Winnersh
Triangle
Chineham Lakeshore
Farnborough
Maxis
South
east
UK
BVP and Connexion
REIT, 111,070,
21%
Non-REIT, 409,002
79%

Appendix II
Eastern Creek Business Park, NSW, Australia

We are Frasers Property 75
1. Profit is recognised based on sales & purchase agreement signed and on a percentage of completion basis except for executive condominiums, which are on a completion basis. 2. As at 30 September 2021 based on sales &
purchase agreements signed. 3. As at 30 September 2021. 4. Excluding 72 serviced apartments units.
Notes on profit recognition1
Frasers Property Singapore
Project Effective share (%) Total no. of units % of units sold2 % completed3 Estimated total saleable area
(’000 sqm)
Target
completion date
Seaside Residences 40 843 100.0 100.0 68 Completed
Rivière 100 4554 36.3 46.8 474 1H FY23
Parc Greenwich (EC) 80 496 - 10.3 50 1H FY24
Notes on profit recognition
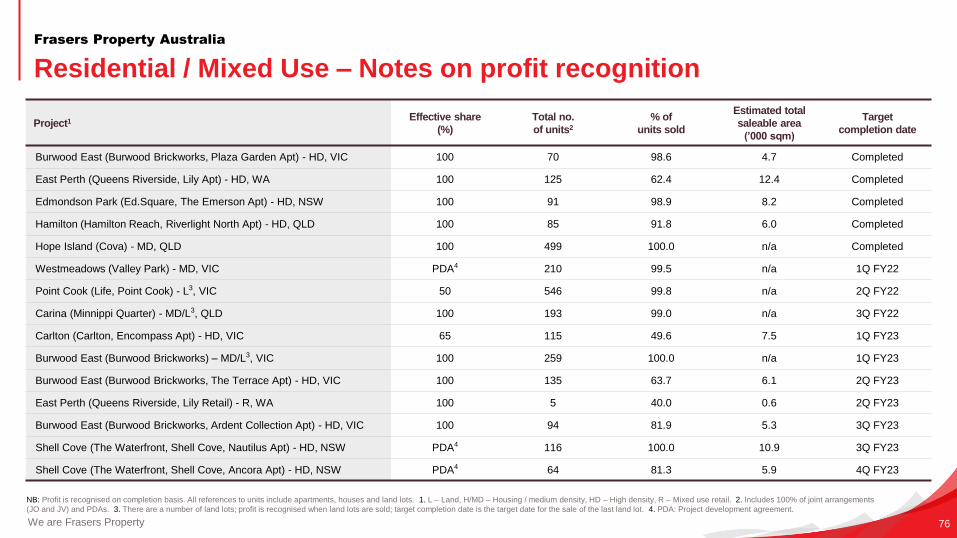
We are Frasers Property 76
NB: Profit is recognised on completion basis. All references to units include apartments, houses and land lots. 1. L – Land, H/MD – Housing / medium density, HD – High density, R – Mixed use retail. 2. Includes 100% of joint arrangements
(JO and JV) and PDAs. 3. There are a number of land lots; profit is recognised when land lots are sold; target completion date is the target date for the sale of the last land lot. 4. PDA: Project development agreement.
Residential / Mixed Use – Notes on profit recognition
Frasers Property Australia
Project1 Effective share
(%)
Total no.
of units2
% of
units sold
Estimated total
saleable area
(’000 sqm)
Target
completion date
Burwood East (Burwood Brickworks, Plaza Garden Apt) - HD, VIC 100 70 98.6 4.7 Completed
East Perth (Queens Riverside, Lily Apt) - HD, WA 100 125 62.4 12.4 Completed
Edmondson Park (Ed.Square, The Emerson Apt) - HD, NSW 100 91 98.9 8.2 Completed
Hamilton (Hamilton Reach, Riverlight North Apt) - HD, QLD 100 85 91.8 6.0 Completed
Hope Island (Cova) - MD, QLD 100 499 100.0 n/a Completed
Westmeadows (Valley Park) - MD, VIC PDA4 210 99.5 n/a 1Q FY22
Point Cook (Life, Point Cook) - L3, VIC 50 546 99.8 n/a 2Q FY22
Carina (Minnippi Quarter) - MD/L3, QLD 100 193 99.0 n/a 3Q FY22
Carlton (Carlton, Encompass Apt) - HD, VIC 65 115 49.6 7.5 1Q FY23
Burwood East (Burwood Brickworks) – MD/L3, VIC 100 259 100.0 n/a 1Q FY23
Burwood East (Burwood Brickworks, The Terrace Apt) - HD, VIC 100 135 63.7 6.1 2Q FY23
East Perth (Queens Riverside, Lily Retail) - R, WA 100 5 40.0 0.6 2Q FY23
Burwood East (Burwood Brickworks, Ardent Collection Apt) - HD, VIC 100 94 81.9 5.3 3Q FY23
Shell Cove (The Waterfront, Shell Cove, Nautilus Apt) - HD, NSW PDA4 116 100.0 10.9 3Q FY23
Shell Cove (The Waterfront, Shell Cove, Ancora Apt) - HD, NSW PDA4 64 81.3 5.9 4Q FY23
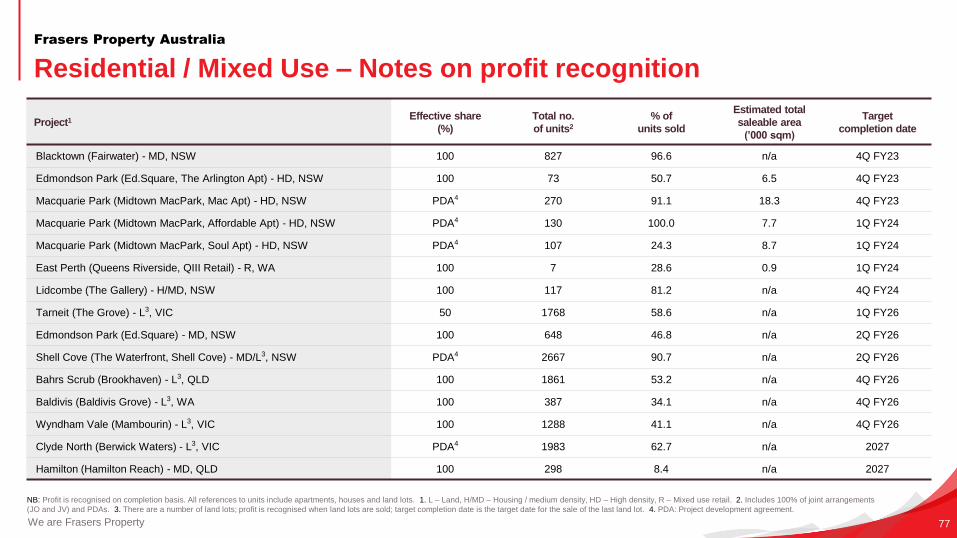
We are Frasers Property 77
NB: Profit is recognised on completion basis. All references to units include apartments, houses and land lots. 1. L – Land, H/MD – Housing / medium density, HD – High density, R – Mixed use retail. 2. Includes 100% of joint arrangements
(JO and JV) and PDAs. 3. There are a number of land lots; profit is recognised when land lots are sold; target completion date is the target date for the sale of the last land lot. 4. PDA: Project development agreement.
Residential / Mixed Use – Notes on profit recognition
Frasers Property Australia
Project1 Effective share
(%)
Total no.
of units2
% of
units sold
Estimated total
saleable area
(’000 sqm)
Target
completion date
Blacktown (Fairwater) - MD, NSW 100 827 96.6 n/a 4Q FY23
Edmondson Park (Ed.Square, The Arlington Apt) - HD, NSW 100 73 50.7 6.5 4Q FY23
Macquarie Park (Midtown MacPark, Mac Apt) - HD, NSW PDA4 270 91.1 18.3 4Q FY23
Macquarie Park (Midtown MacPark, Affordable Apt) - HD, NSW PDA4 130 100.0 7.7 1Q FY24
Macquarie Park (Midtown MacPark, Soul Apt) - HD, NSW PDA4 107 24.3 8.7 1Q FY24
East Perth (Queens Riverside, QIII Retail) - R, WA 100 7 28.6 0.9 1Q FY24
Lidcombe (The Gallery) - H/MD, NSW 100 117 81.2 n/a 4Q FY24
Tarneit (The Grove) - L3, VIC 50 1768 58.6 n/a 1Q FY26
Edmondson Park (Ed.Square) - MD, NSW 100 648 46.8 n/a 2Q FY26
Shell Cove (The Waterfront, Shell Cove) - MD/L3, NSW PDA4 2667 90.7 n/a 2Q FY26
Bahrs Scrub (Brookhaven) - L3, QLD 100 1861 53.2 n/a 4Q FY26
Baldivis (Baldivis Grove) - L3, WA 100 387 34.1 n/a 4Q FY26
Wyndham Vale (Mambourin) - L3, VIC 100 1288 41.1 n/a 4Q FY26
Clyde North (Berwick Waters) - L3, VIC PDA4 1983 62.7 n/a 2027
Hamilton (Hamilton Reach) - MD, QLD 100 298 8.4 n/a 2027
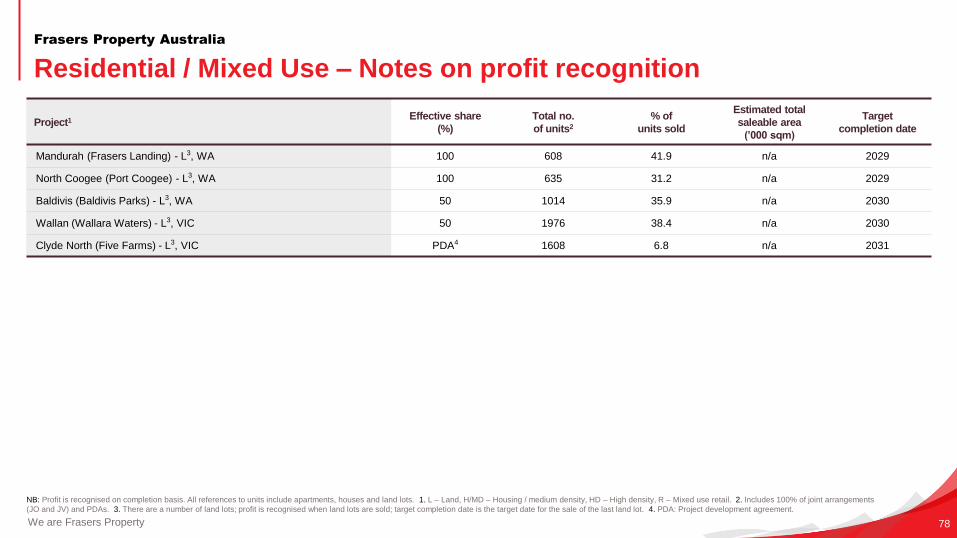
We are Frasers Property 78
Residential / Mixed Use – Notes on profit recognition
Frasers Property Australia
Project1 Effective share
(%)
Total no.
of units2
% of
units sold
Estimated total
saleable area
(’000 sqm)
Target
completion date
Mandurah (Frasers Landing) - L3, WA 100 608 41.9 n/a 2029
North Coogee (Port Coogee) - L3, WA 100 635 31.2 n/a 2029
Baldivis (Baldivis Parks) - L3, WA 50 1014 35.9 n/a 2030
Wallan (Wallara Waters) - L3, VIC 50 1976 38.4 n/a 2030
Clyde North (Five Farms) - L3, VIC PDA4 1608 6.8 n/a 2031
NB: Profit is recognised on completion basis. All references to units include apartments, houses and land lots. 1. L – Land, H/MD – Housing / medium density, HD – High density, R – Mixed use retail. 2. Includes 100% of joint arrangements
(JO and JV) and PDAs. 3. There are a number of land lots; profit is recognised when land lots are sold; target completion date is the target date for the sale of the last land lot. 4. PDA: Project development agreement.
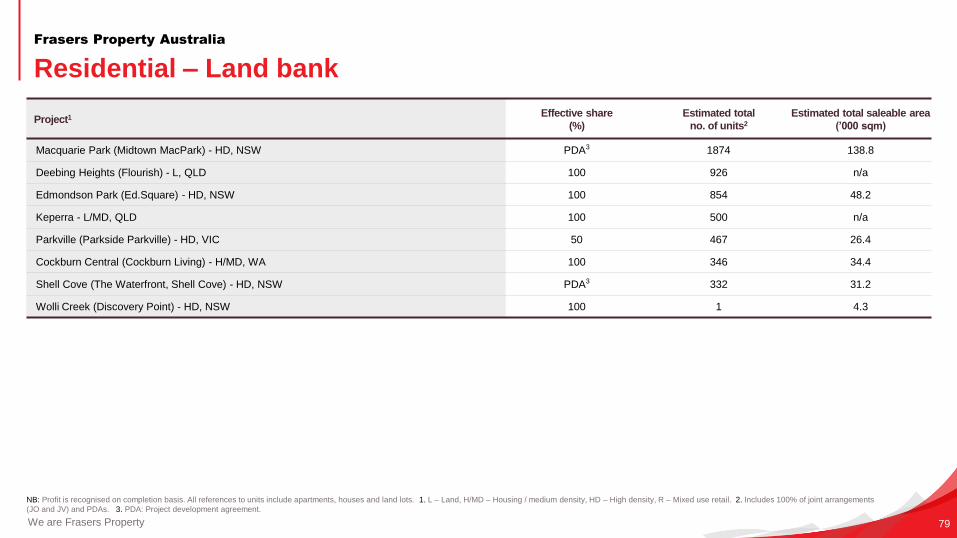
We are Frasers Property 79
NB: Profit is recognised on completion basis. All references to units include apartments, houses and land lots. 1. L – Land, H/MD – Housing / medium density, HD – High density, R – Mixed use retail. 2. Includes 100% of joint arrangements
(JO and JV) and PDAs. 3. PDA: Project development agreement.
Residential – Land bank
Frasers Property Australia
Project1 Effective share
(%)
Estimated total
no. of units2
Estimated total saleable area
(’000 sqm)
Macquarie Park (Midtown MacPark) - HD, NSW PDA3 1874 138.8
Deebing Heights (Flourish) - L, QLD 100 926 n/a
Edmondson Park (Ed.Square) - HD, NSW 100 854 48.2
Keperra - L/MD, QLD 100 500 n/a
Parkville (Parkside Parkville) - HD, VIC 50 467 26.4
Cockburn Central (Cockburn Living) - H/MD, WA 100 346 34.4
Shell Cove (The Waterfront, Shell Cove) - HD, NSW PDA3 332 31.2
Wolli Creek (Discovery Point) - HD, NSW 100 1 4.3
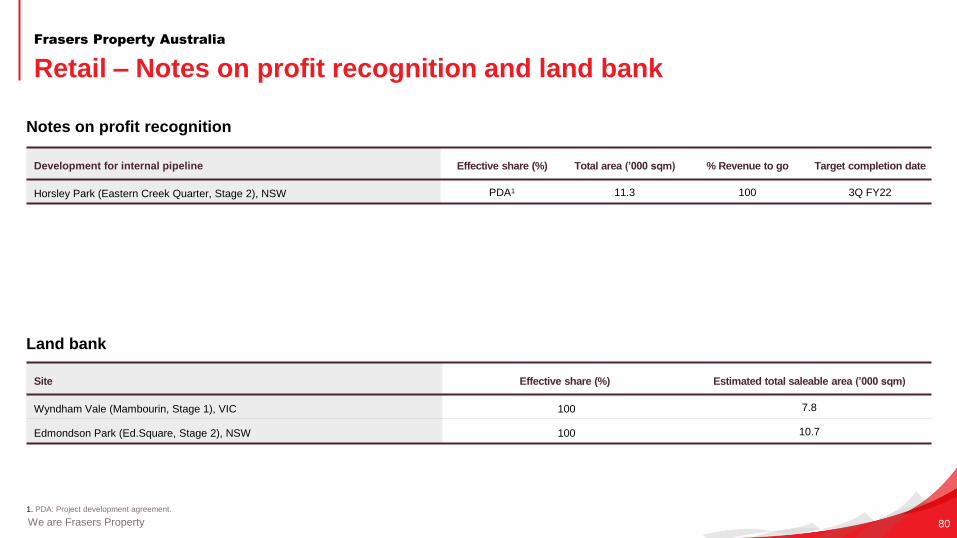
We are Frasers Property 80
1. PDA: Project development agreement.
Retail – Notes on profit recognition and land bank
Frasers Property Australia
Development for internal pipeline Effective share (%) Total area (’000 sqm) % Revenue to go Target completion date
Horsley Park (Eastern Creek Quarter, Stage 2), NSW PDA1 11.3 100 3Q FY22
Site Effective share (%) Estimated total saleable area (’000 sqm)
Wyndham Vale (Mambourin, Stage 1), VIC 100 7.8
Edmondson Park (Ed.Square, Stage 2), NSW 100 10.7
Notes on profit recognition
Land bank
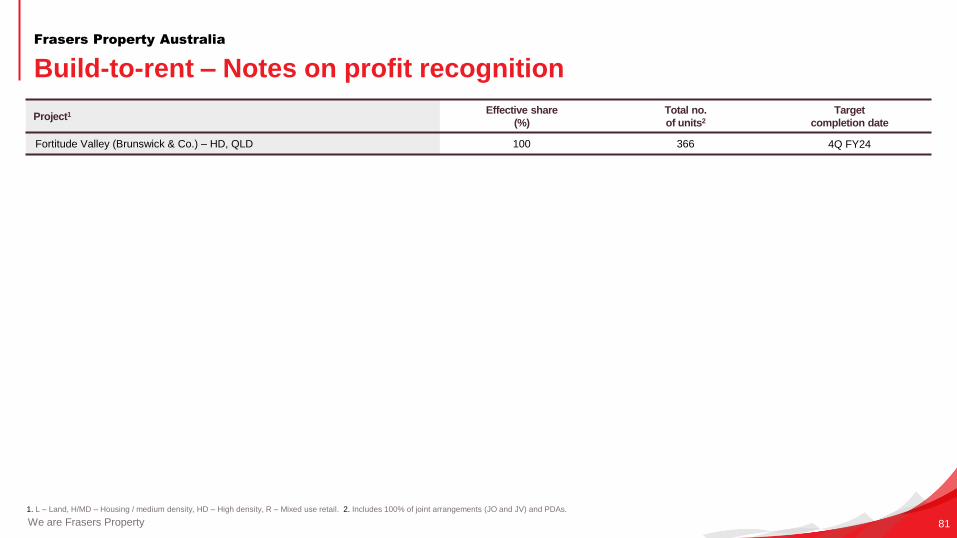
We are Frasers Property 81
Build-to-rent – Notes on profit recognition
Frasers Property Australia
Project1 Effective share
(%)
Total no.
of units2
Target
completion date
Fortitude Valley (Brunswick & Co.) – HD, QLD 100 366 4Q FY24
1. L – Land, H/MD – Housing / medium density, HD – High density, R – Mixed use retail. 2. Includes 100% of joint arrangements (JO and JV) and PDAs.
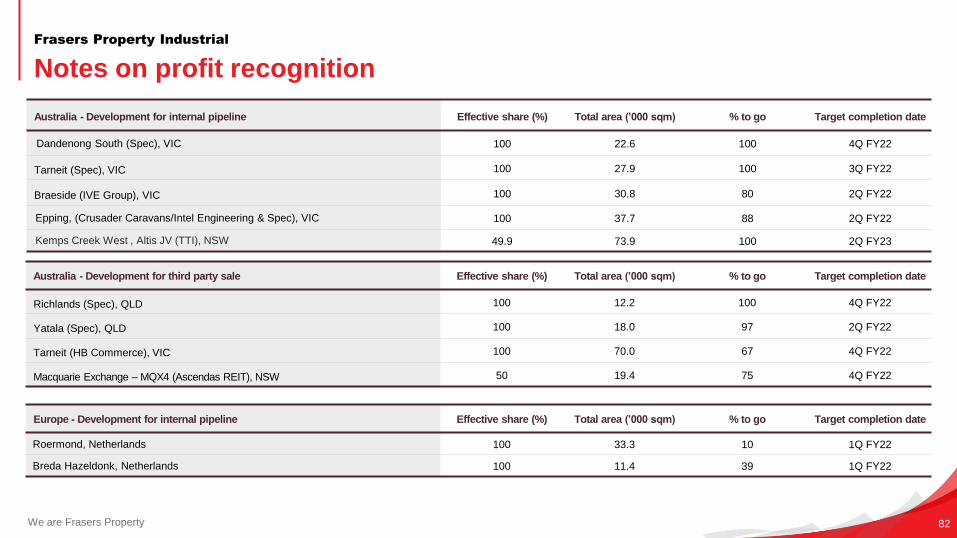
We are Frasers Property 82
Notes on profit recognition
Frasers Property Industrial
Australia - Development for internal pipeline Effective share (%) Total area (’000 sqm) % to go Target completion date
Dandenong South (Spec), VIC 100 22.6 100 4Q FY22
Tarneit (Spec), VIC 100 27.9 100 3Q FY22
Braeside (IVE Group), VIC 100 30.8 80 2Q FY22
Epping, (Crusader Caravans/Intel Engineering & Spec), VIC 100 37.7 88 2Q FY22
Kemps Creek West , Altis JV (TTI), NSW 49.9 73.9 100 2Q FY23
Australia - Development for third party sale Effective share (%) Total area (’000 sqm) % to go Target completion date
Richlands (Spec), QLD 100 12.2 100 4Q FY22
Yatala (Spec), QLD 100 18.0 97 2Q FY22
Tarneit (HB Commerce), VIC 100 70.0 67 4Q FY22
Macquarie Exchange – MQX4 (Ascendas REIT), NSW 50 19.4 75 4Q FY22
Europe - Development for internal pipeline Effective share (%) Total area (’000 sqm) % to go Target completion date
Roermond, Netherlands 100 33.3 10 1Q FY22
Breda Hazeldonk, Netherlands 100 11.4 39 1Q FY22
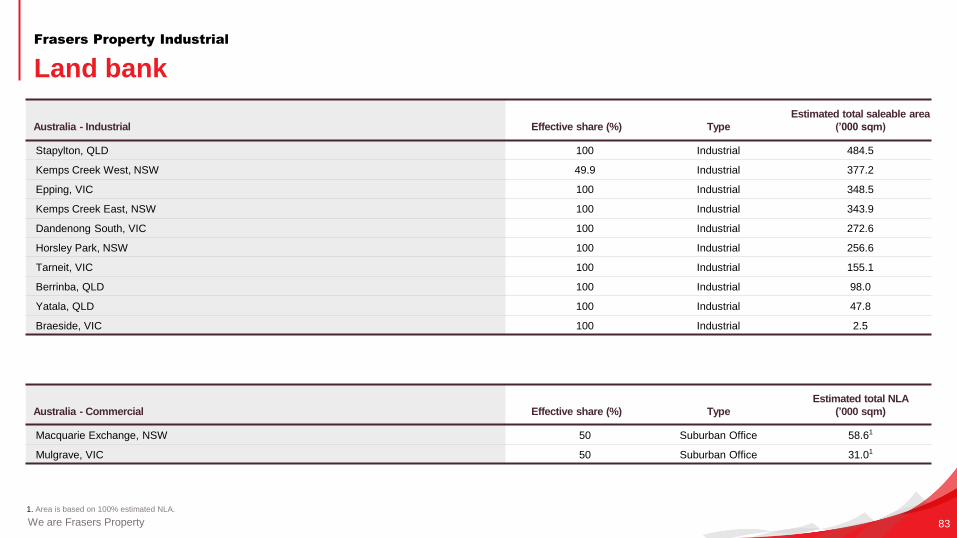
We are Frasers Property 83
1. Area is based on 100% estimated NLA.
Land bank
Frasers Property Industrial
Australia - Industrial Effective share (%) Type
Estimated total saleable area
(’000 sqm)
Stapylton, QLD 100 Industrial 484.5
Kemps Creek West, NSW 49.9 Industrial 377.2
Epping, VIC 100 Industrial 348.5
Kemps Creek East, NSW 100 Industrial 343.9
Dandenong South, VIC 100 Industrial 272.6
Horsley Park, NSW 100 Industrial 256.6
Tarneit, VIC 100 Industrial 155.1
Berrinba, QLD 100 Industrial 98.0
Yatala, QLD 100 Industrial 47.8
Braeside, VIC 100 Industrial 2.5
Australia - Commercial Effective share (%) Type
Estimated total NLA
(’000 sqm)
Macquarie Exchange, NSW 50 Suburban Office 58.61
Mulgrave, VIC 50 Suburban Office 31.01
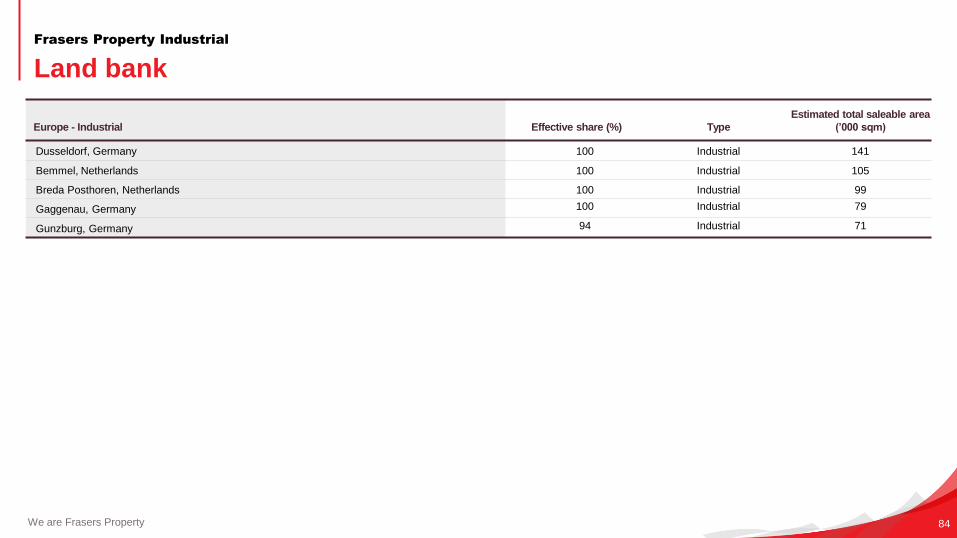
We are Frasers Property 84
Land bank
Frasers Property Industrial
Europe - Industrial Effective share (%) Type
Estimated total saleable area
(’000 sqm)
Dusseldorf, Germany 100 Industrial 141
Bemmel, Netherlands 100 Industrial 105
Breda Posthoren, Netherlands 100 Industrial 99
Gaggenau, Germany 100 Industrial 79
Gunzburg, Germany 94 Industrial 71
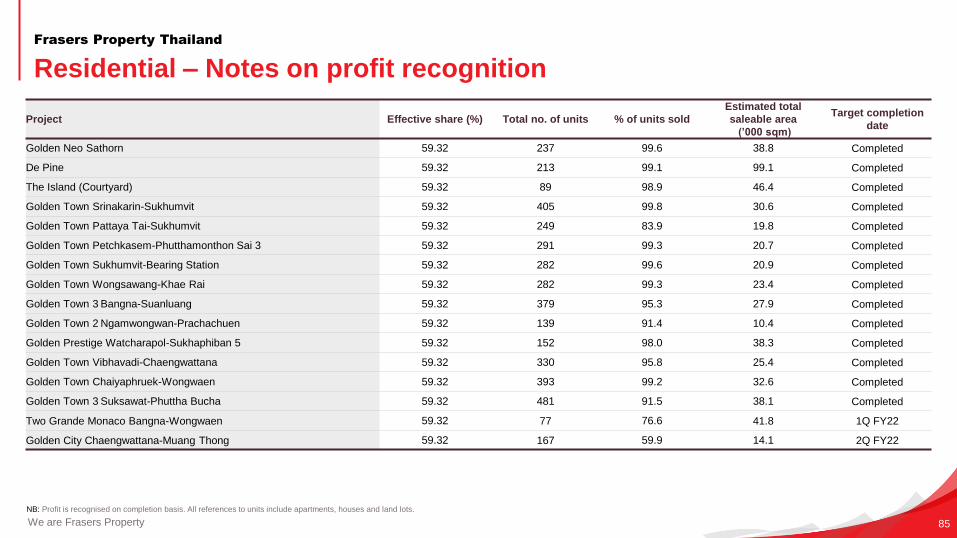
We are Frasers Property 85
Residential – Notes on profit recognition
Frasers Property Thailand
Project Effective share (%) Total no. of units % of units sold
Estimated total
saleable area
(’000 sqm)
Target completion
date
Golden Neo Sathorn 59.32 237 99.6 38.8 Completed
De Pine 59.32 213 99.1 99.1 Completed
The Island (Courtyard) 59.32 89 98.9 46.4 Completed
Golden Town Srinakarin-Sukhumvit 59.32 405 99.8 30.6 Completed
Golden Town Pattaya Tai-Sukhumvit 59.32 249 83.9 19.8 Completed
Golden Town Petchkasem-Phutthamonthon Sai 3 59.32 291 99.3 20.7 Completed
Golden Town Sukhumvit-Bearing Station 59.32 282 99.6 20.9 Completed
Golden Town Wongsawang-Khae Rai 59.32 282 99.3 23.4 Completed
Golden Town 3 Bangna-Suanluang 59.32 379 95.3 27.9 Completed
Golden Town 2 Ngamwongwan-Prachachuen 59.32 139 91.4 10.4 Completed
Golden Prestige Watcharapol-Sukhaphiban 5 59.32 152 98.0 38.3 Completed
Golden Town Vibhavadi-Chaengwattana 59.32 330 95.8 25.4 Completed
Golden Town Chaiyaphruek-Wongwaen 59.32 393 99.2 32.6 Completed
Golden Town 3 Suksawat-Phuttha Bucha 59.32 481 91.5 38.1 Completed
Two Grande Monaco Bangna-Wongwaen 59.32 77 76.6 41.8 1Q FY22
Golden City Chaengwattana-Muang Thong 59.32 167 59.9 14.1 2Q FY22
NB: Profit is recognised on completion basis. All references to units include apartments, houses and land lots.
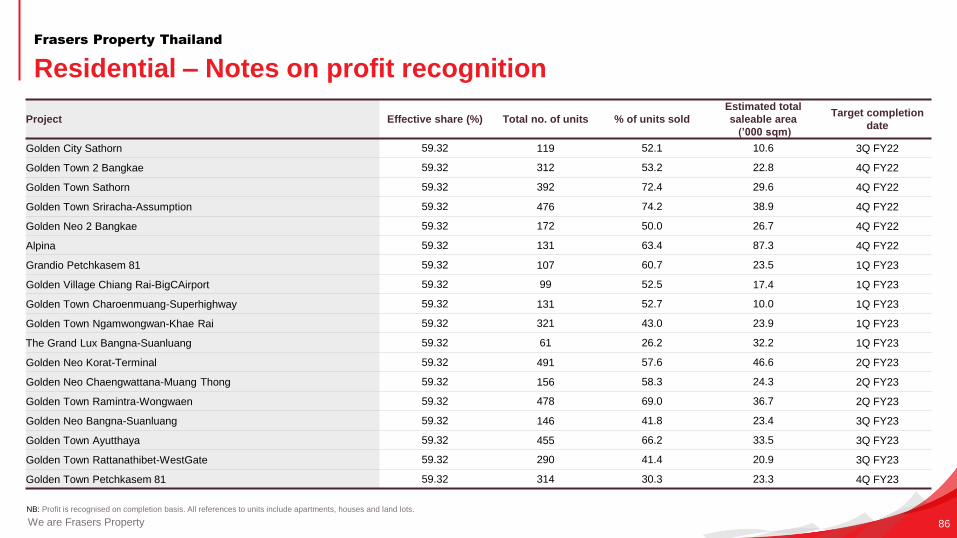
We are Frasers Property 86
Residential – Notes on profit recognition
Frasers Property Thailand
Project Effective share (%) Total no. of units % of units sold
Estimated total
saleable area
(’000 sqm)
Target completion
date
Golden City Sathorn 59.32 119 52.1 10.6 3Q FY22
Golden Town 2 Bangkae 59.32 312 53.2 22.8 4Q FY22
Golden Town Sathorn 59.32 392 72.4 29.6 4Q FY22
Golden Town Sriracha-Assumption 59.32 476 74.2 38.9 4Q FY22
Golden Neo 2 Bangkae 59.32 172 50.0 26.7 4Q FY22
Alpina 59.32 131 63.4 87.3 4Q FY22
Grandio Petchkasem 81 59.32 107 60.7 23.5 1Q FY23
Golden Village Chiang Rai-BigCAirport 59.32 99 52.5 17.4 1Q FY23
Golden Town Charoenmuang-Superhighway 59.32 131 52.7 10.0 1Q FY23
Golden Town Ngamwongwan-Khae Rai 59.32 321 43.0 23.9 1Q FY23
The Grand Lux Bangna-Suanluang 59.32 61 26.2 32.2 1Q FY23
Golden Neo Korat-Terminal 59.32 491 57.6 46.6 2Q FY23
Golden Neo Chaengwattana-Muang Thong 59.32 156 58.3 24.3 2Q FY23
Golden Town Ramintra-Wongwaen 59.32 478 69.0 36.7 2Q FY23
Golden Neo Bangna-Suanluang 59.32 146 41.8 23.4 3Q FY23
Golden Town Ayutthaya 59.32 455 66.2 33.5 3Q FY23
Golden Town Rattanathibet-WestGate 59.32 290 41.4 20.9 3Q FY23
Golden Town Petchkasem 81 59.32 314 30.3 23.3 4Q FY23
NB: Profit is recognised on completion basis. All references to units include apartments, houses and land lots.
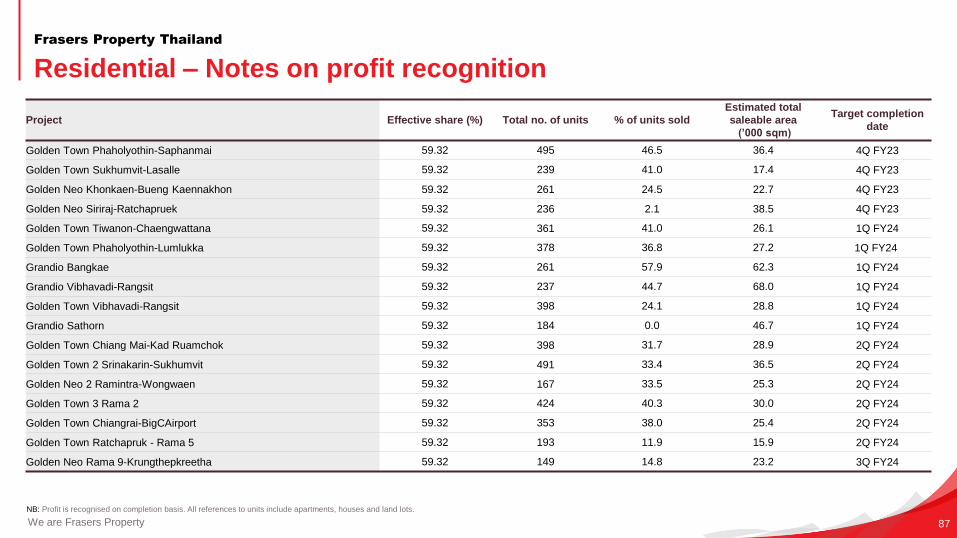
We are Frasers Property 87
Residential – Notes on profit recognition
Frasers Property Thailand
Project Effective share (%) Total no. of units % of units sold
Estimated total
saleable area
(’000 sqm)
Target completion
date
Golden Town Phaholyothin-Saphanmai 59.32 495 46.5 36.4 4Q FY23
Golden Town Sukhumvit-Lasalle 59.32 239 41.0 17.4 4Q FY23
Golden Neo Khonkaen-Bueng Kaennakhon 59.32 261 24.5 22.7 4Q FY23
Golden Neo Siriraj-Ratchapruek 59.32 236 2.1 38.5 4Q FY23
Golden Town Tiwanon-Chaengwattana 59.32 361 41.0 26.1 1Q FY24
Golden Town Phaholyothin-Lumlukka 59.32 378 36.8 27.2 1Q FY24
Grandio Bangkae 59.32 261 57.9 62.3 1Q FY24
Grandio Vibhavadi-Rangsit 59.32 237 44.7 68.0 1Q FY24
Golden Town Vibhavadi-Rangsit 59.32 398 24.1 28.8 1Q FY24
Grandio Sathorn 59.32 184 0.0 46.7 1Q FY24
Golden Town Chiang Mai-Kad Ruamchok 59.32 398 31.7 28.9 2Q FY24
Golden Town 2 Srinakarin-Sukhumvit 59.32 491 33.4 36.5 2Q FY24
Golden Neo 2 Ramintra-Wongwaen 59.32 167 33.5 25.3 2Q FY24
Golden Town 3 Rama 2 59.32 424 40.3 30.0 2Q FY24
Golden Town Chiangrai-BigCAirport 59.32 353 38.0 25.4 2Q FY24
Golden Town Ratchapruk - Rama 5 59.32 193 11.9 15.9 2Q FY24
Golden Neo Rama 9-Krungthepkreetha 59.32 149 14.8 23.2 3Q FY24
NB: Profit is recognised on completion basis. All references to units include apartments, houses and land lots.
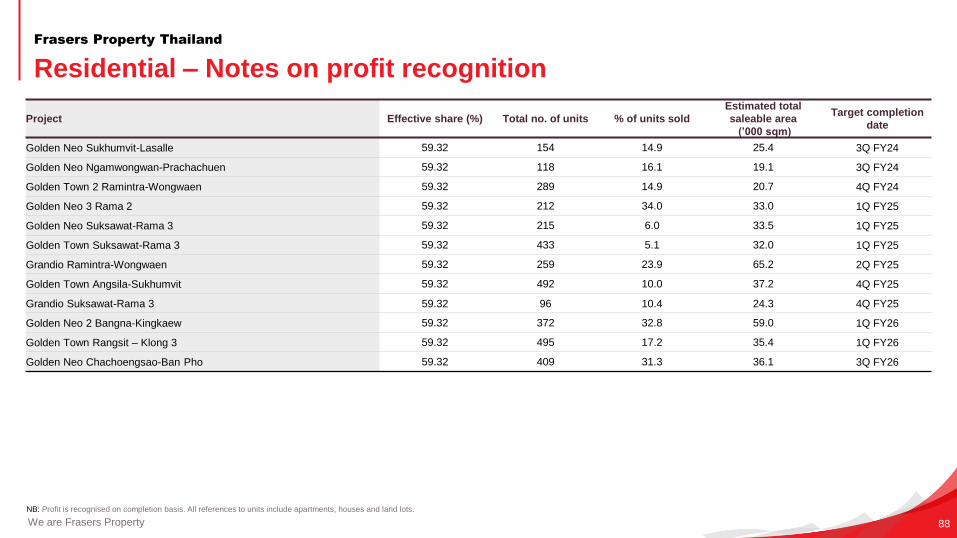
We are Frasers Property 88
NB: Profit is recognised on completion basis. All references to units include apartments, houses and land lots.
Residential – Notes on profit recognition
Frasers Property Thailand
Project Effective share (%) Total no. of units % of units sold
Estimated total
saleable area
(’000 sqm)
Target completion
date
Golden Neo Sukhumvit-Lasalle 59.32 154 14.9 25.4 3Q FY24
Golden Neo Ngamwongwan-Prachachuen 59.32 118 16.1 19.1 3Q FY24
Golden Town 2 Ramintra-Wongwaen 59.32 289 14.9 20.7 4Q FY24
Golden Neo 3 Rama 2 59.32 212 34.0 33.0 1Q FY25
Golden Neo Suksawat-Rama 3 59.32 215 6.0 33.5 1Q FY25
Golden Town Suksawat-Rama 3 59.32 433 5.1 32.0 1Q FY25
Grandio Ramintra-Wongwaen 59.32 259 23.9 65.2 2Q FY25
Golden Town Angsila-Sukhumvit 59.32 492 10.0 37.2 4Q FY25
Grandio Suksawat-Rama 3 59.32 96 10.4 24.3 4Q FY25
Golden Neo 2 Bangna-Kingkaew 59.32 372 32.8 59.0 1Q FY26
Golden Town Rangsit – Klong 3 59.32 495 17.2 35.4 1Q FY26
Golden Neo Chachoengsao-Ban Pho 59.32 409 31.3 36.1 3Q FY26
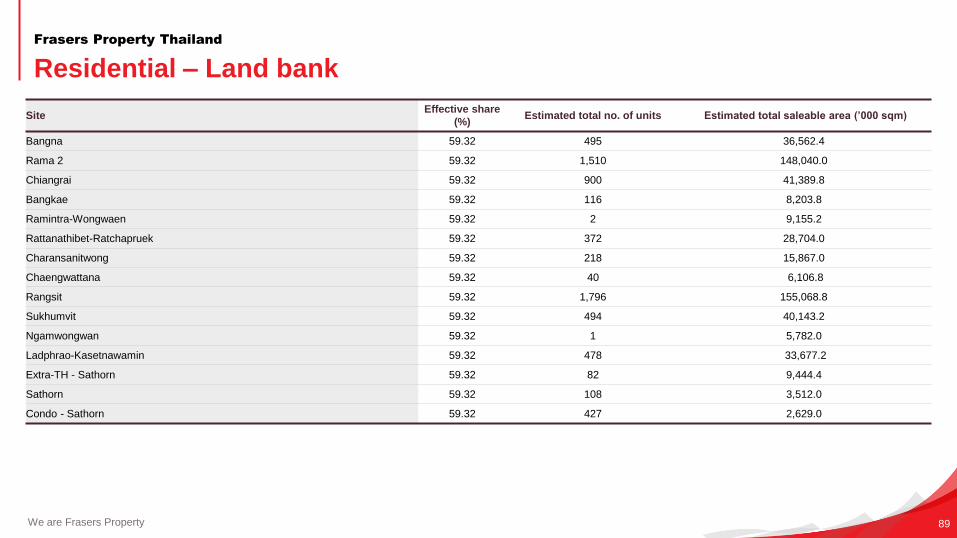
We are Frasers Property 89
Residential – Land bank
Frasers Property Thailand
SiteEffective share
(%)Estimated total no. of units Estimated total saleable area (’000 sqm)
Bangna 59.32 495 36,562.4
Rama 2 59.32 1,510 148,040.0
Chiangrai 59.32 900 41,389.8
Bangkae 59.32 116 8,203.8
Ramintra-Wongwaen 59.32 2 9,155.2
Rattanathibet-Ratchapruek 59.32 372 28,704.0
Charansanitwong 59.32 218 15,867.0
Chaengwattana 59.32 40 6,106.8
Rangsit 59.32 1,796 155,068.8
Sukhumvit 59.32 494 40,143.2
Ngamwongwan 59.32 1 5,782.0
Ladphrao-Kasetnawamin 59.32 478 33,677.2
Extra-TH - Sathorn 59.32 82 9,444.4
Sathorn 59.32 108 3,512.0
Condo - Sathorn 59.32 427 2,629.0
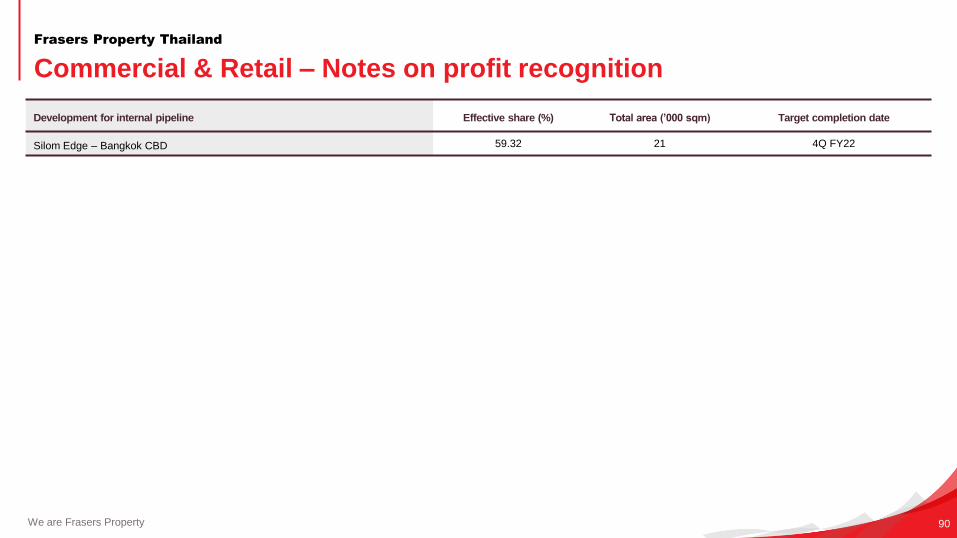
We are Frasers Property 90
Commercial & Retail – Notes on profit recognition
Frasers Property Thailand
Development for internal pipeline Effective share (%) Total area (’000 sqm) Target completion date
Silom Edge – Bangkok CBD 59.32 21 4Q FY22
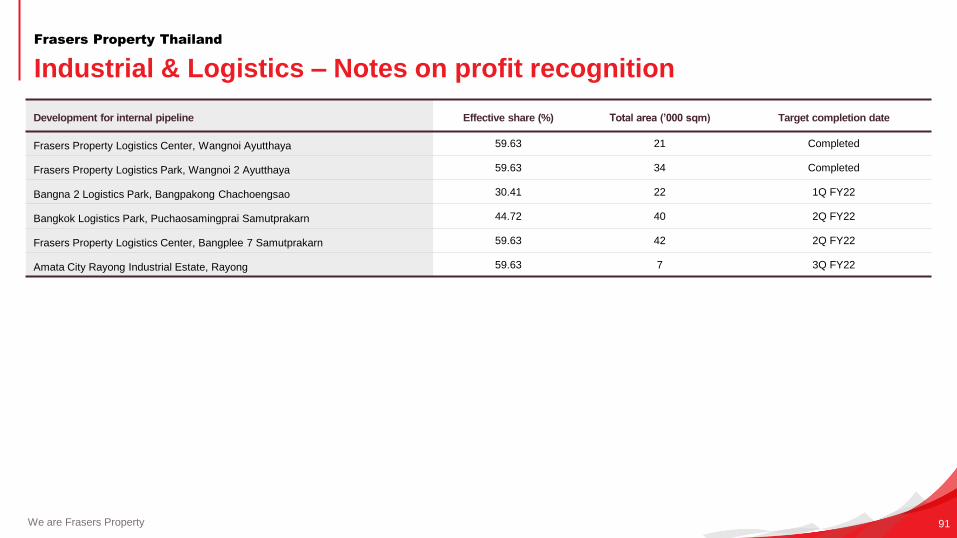
We are Frasers Property 91
Industrial & Logistics – Notes on profit recognition
Frasers Property Thailand
Development for internal pipeline Effective share (%) Total area (’000 sqm) Target completion date
Frasers Property Logistics Center, Wangnoi Ayutthaya 59.63 21 Completed
Frasers Property Logistics Park, Wangnoi 2 Ayutthaya 59.63 34 Completed
Bangna 2 Logistics Park, Bangpakong Chachoengsao 30.41 22 1Q FY22
Bangkok Logistics Park, Puchaosamingprai Samutprakarn 44.72 40 2Q FY22
Frasers Property Logistics Center, Bangplee 7 Samutprakarn 59.63 42 2Q FY22
Amata City Rayong Industrial Estate, Rayong 59.63 7 3Q FY22
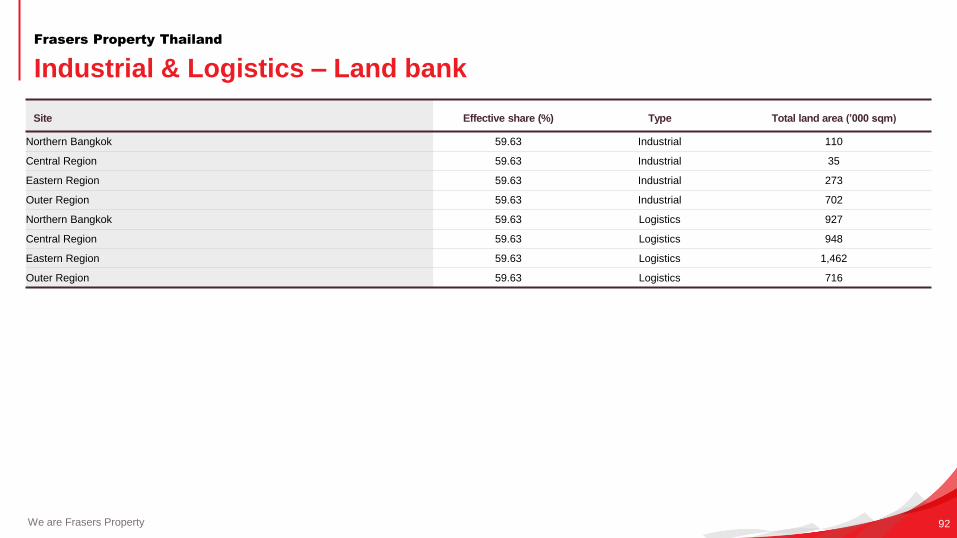
We are Frasers Property 92
Industrial & Logistics – Land bank
Frasers Property Thailand
Site Effective share (%) Type Total land area (’000 sqm)
Northern Bangkok 59.63 Industrial 110
Central Region 59.63 Industrial 35
Eastern Region 59.63 Industrial 273
Outer Region 59.63 Industrial 702
Northern Bangkok 59.63 Logistics 927
Central Region 59.63 Logistics 948
Eastern Region 59.63 Logistics 1,462
Outer Region 59.63 Logistics 716
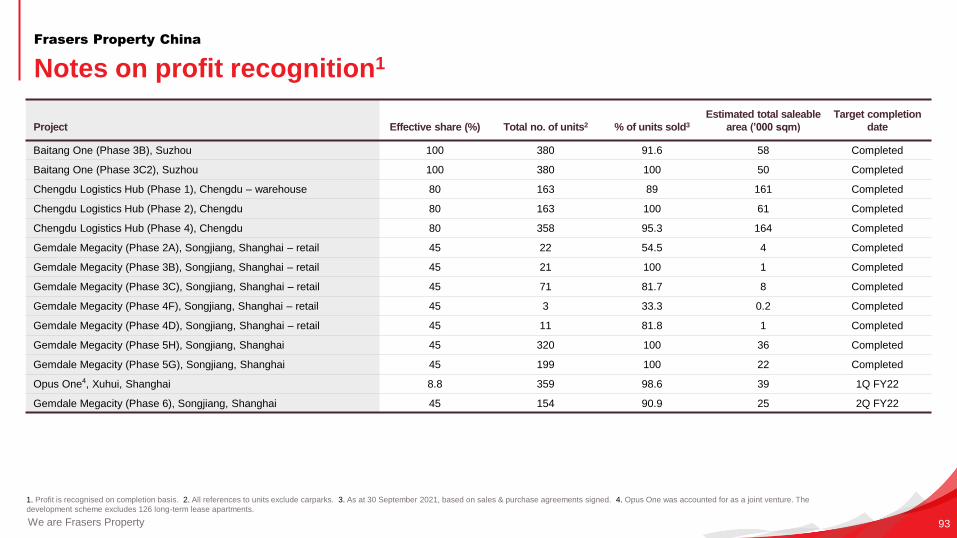
We are Frasers Property 93
1. Profit is recognised on completion basis. 2. All references to units exclude carparks. 3. As at 30 September 2021, based on sales & purchase agreements signed. 4. Opus One was accounted for as a joint venture. The
development scheme excludes 126 long-term lease apartments.
Notes on profit recognition1
Frasers Property China
Project Effective share (%) Total no. of units2 % of units sold3
Estimated total saleable
area (’000 sqm)
Target completion
date
Baitang One (Phase 3B), Suzhou 100 380 91.6 58 Completed
Baitang One (Phase 3C2), Suzhou 100 380 100 50 Completed
Chengdu Logistics Hub (Phase 1), Chengdu – warehouse 80 163 89 161 Completed
Chengdu Logistics Hub (Phase 2), Chengdu 80 163 100 61 Completed
Chengdu Logistics Hub (Phase 4), Chengdu 80 358 95.3 164 Completed
Gemdale Megacity (Phase 2A), Songjiang, Shanghai – retail 45 22 54.5 4 Completed
Gemdale Megacity (Phase 3B), Songjiang, Shanghai – retail 45 21 100 1 Completed
Gemdale Megacity (Phase 3C), Songjiang, Shanghai – retail 45 71 81.7 8 Completed
Gemdale Megacity (Phase 4F), Songjiang, Shanghai – retail 45 3 33.3 0.2 Completed
Gemdale Megacity (Phase 4D), Songjiang, Shanghai – retail 45 11 81.8 1 Completed
Gemdale Megacity (Phase 5H), Songjiang, Shanghai 45 320 100 36 Completed
Gemdale Megacity (Phase 5G), Songjiang, Shanghai 45 199 100 22 Completed
Opus One4, Xuhui, Shanghai 8.8 359 98.6 39 1Q FY22
Gemdale Megacity (Phase 6), Songjiang, Shanghai 45 154 90.9 25 2Q FY22
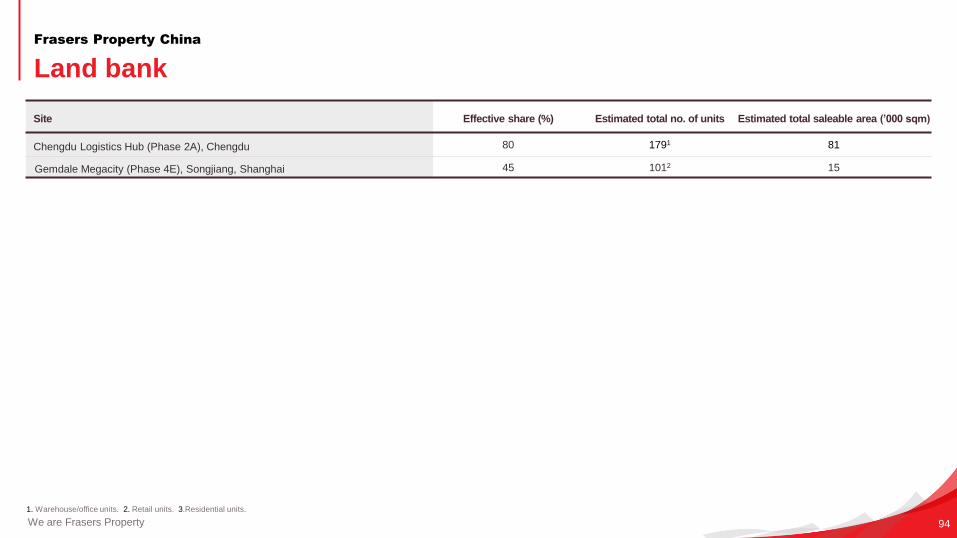
We are Frasers Property 94
1. Warehouse/office units. 2. Retail units. 3.Residential units.
Land bank
Frasers Property China
Site Effective share (%) Estimated total no. of units Estimated total saleable area (’000 sqm)
Chengdu Logistics Hub (Phase 2A), Chengdu 80 1791 81
Gemdale Megacity (Phase 4E), Songjiang, Shanghai 45 1012 15
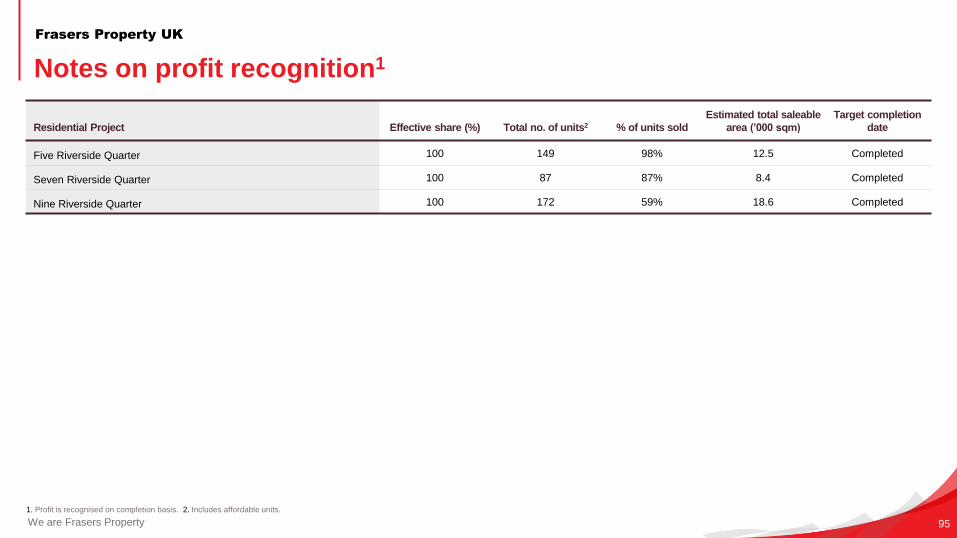
We are Frasers Property 95
• Frasers Property UK
1. Profit is recognised on completion basis. 2. Includes affordable units.
Notes on profit recognition1
Frasers Property UK
Residential Project Effective share (%) Total no. of units2 % of units sold
Estimated total saleable
area (’000 sqm)
Target completion
date
Five Riverside Quarter 100 149 98% 12.5 Completed
Seven Riverside Quarter 100 87 87% 8.4 Completed
Nine Riverside Quarter 100 172 59% 18.6 Completed

Inspiring experiences,creating places for good.
Related Documents