You should consider the Fund's investment objectives, risks, and charges and expenses carefully before you invest. The Prospectus details the Fund's objective and policies and other matters of interest to the prospective investor. Please read this Prospectus carefully before investing. The Prospectus may be obtained by visiting the website at www.fpafunds.com, by calling toll-free, 1-800-982-4372, or by contacting the Fund in writing. Average Annual Total Returns (%) Periods greater than one year are annualized. Performance is calculated on a total return basis which includes reinvestment of all distributions. * Inception of FPA management was July 11, 1984. A benchmark comparison is not available based on the Fund’s inception date; therefore, data from August 1, 1984 is presented. Past performance is no guarantee of future results and current performance may be higher or lower than the performance shown. This data represents past performance and investors should understand that investment returns and principal values fluctuate, so that when you redeem your investment it may be worth more or less than its original cost. The Fund’s expense ratio as of it s most recent prospectus is 0.80%. Current month-end performance data may be obtained at www.fpafunds.com or by calling toll-free, 1-800-982-4372. Mr. Ahitov was named sole portfolio manager effective October 1, 2017. Dennis Bryan and Arik Ahitov had been co-portfolio managers since November 2007 and February 2014, respectively, and managed the Fund in a manner that is substantially similar to the prior portfolio manager, Robert Rodriguez. Mr. Rodriguez ceased serving as the Fund’s portfolio manager effective December 2010. Please see important disclosures at the end of the commentary. As of Date: 3/31/18 Since 8/1/84* 20 Years 15 Years 10 Years 5 Years 3 Years 1 Year YTD QTR FPA Capital 12.82 7.11 8.16 4.59 0.81 -0.38 -4.05 -2.65 -2.65 Russell 2500 11.81 8.57 12.05 10.28 11.55 8.15 12.31 -0.24 -0.24 FPA Capital Fund, Inc. First Quarter 2018 Commentary

Welcome message from author
This document is posted to help you gain knowledge. Please leave a comment to let me know what you think about it! Share it to your friends and learn new things together.
Transcript

You should consider the Fund's investment objectives, risks, and charges and expenses carefully before you invest. The Prospectus details the Fund's objective and policies and other matters of interest to the prospective investor. Please read this Prospectus carefully before investing. The Prospectus may be obtained by visiting the website at www.fpafunds.com, by calling toll-free, 1-800-982-4372, or by contacting the Fund in writing.
Average Annual Total Returns (%)
Periods greater than one year are annualized. Performance is calculated on a total return basis which includes reinvestment of all distributions.
* Inception of FPA management was July 11, 1984. A benchmark comparison is not available based on the Fund’s inception date; therefore, data from August 1, 1984 is presented.
Past performance is no guarantee of future results and current performance may be higher or lower than the performance shown. This data represents past performance and investors should understand that investment returns and principal values fluctuate, so that when you redeem your investment it may be worth more or less than its original cost. The Fund’s expense ratio as of its most recent prospectus is 0.80%. Current month-end performance data may be obtained at www.fpafunds.com or by calling toll-free, 1-800-982-4372.
Mr. Ahitov was named sole portfolio manager effective October 1, 2017. Dennis Bryan and Arik Ahitov had been co-portfolio managers since November 2007 and February 2014, respectively, and managed the Fund in a manner that is substantially similar to the prior portfolio manager, Robert Rodriguez. Mr. Rodriguez ceased serving as the Fund’s portfolio manager effective December 2010.
Please see important disclosures at the end of the commentary.
As of Date: 3/31/18 Since 8/1/84* 20 Years 15 Years 10 Years 5 Years 3 Years 1 Year YTD QTR
FPA Capital 12.82 7.11 8.16 4.59 0.81 -0.38 -4.05 -2.65 -2.65
Russell 2500 11.81 8.57 12.05 10.28 11.55 8.15 12.31 -0.24 -0.24
FPA Capital Fund, Inc. First Quarter 2018 Commentary

For the fiscal year ending and quarter ending on March 31, 2018, the fund was down by -4.05% and -2.65%, respectively. In many cases, our companies’ earnings have grown, but because their share prices have not kept up with earnings, their multiples have compressed. Our largest detractor for the last fiscal year 2017 was Babcock & Wilcox (BW). We have discussed our investment in BW in detail in our first quarter and third quarter 2017 letters.1 BW, after a successful 100-year run with few missteps, managed to incur significant charges from half a dozen projects in a short period. We exited the position in August 2017 because it no longer fit our investment criteria. Another area that detracted from our performance was energy. We believe we are in the early stages of another historic multi-year oil bull market and explained our rationale in detail in our fourth quarter 2017 letter.2 In summary, our energy investment is not just tied to our belief that oil prices will go higher. We also see that extreme investor bearishness has caused oil-related equity performance to disconnect from crude oil commodity performance. As we said in our previous investor letter, we expect our energy shares to benefit from both continued earnings acceleration and a likely multiple re-rating as the performance gap between crude oil and crude oil equities closes over time. On the positive side, in fiscal year 2017 Aaron’s Inc. (AAN) was our largest contributor to performance followed by Allegiant Travel Company (ALGT). AAN is an RTO (rent-to-own) operator. It serves the part of the population that does not have immediate access to credit via its company-owned, franchised locations, and its Progressive brand (virtual). The Company had strong results in 2017, where it beat its revenue and earnings per share (all record results) guidance and raised 2018 guidance across the board. ALGT is an ultra-low cost domestic airline focused on underserved routes. Their results were robust with revenues at the high end of the recently revised (upward) range, better than expected fixed fee and other revenue, and lower than expected unit operating cost on lower maintenance & repair expenses. As we finish another fiscal year, our 35th, we would like to report our progress on the three portfolio management initiatives we committed to since FPA announced that I would become the sole Portfolio Manager of the FPA Capital Fund (the “Fund”) at the beginning of the fourth quarter of 2017.
1. Avoid position inertia
2. Be more nimble
3. Differentiate between long-term and opportunistic investments
Avoid position inertia: Our team has been busy transitioning the portfolio. Since the announcement, we have initiated eight new positions and eliminated seven holdings. To put this level of activity into perspective, over the preceding seven years, we invested in an average of four new names per year. It is important to note that our in-depth research process remains intact. We believe we are doing a better job in cutting our work short when the opportunity is not there, which allows us to look at more companies. Also, having just one portfolio manager has streamlined our decision-making process. Because our purchases more than offset our sales, the portfolio’s cash level decreased from 32.0% when I took over on Oct. 1, to 26% at the end of first quarter 2018. Be more nimble:
1 http://fpafunds.com/quarterlyinfo_capital 2 http://fpafunds.com/docs/hc_capital/fpa-capital-fund-commentary-2017-q4.pdf?sfvrsn=2
FPA Capital Fund, Inc. First Quarter 2018 Commentary

We have focused on adjusting position sizing when there are changes in our analysis and the risk/reward profile. Here are a few examples of what we have done since the portfolio management change announcement:
3 As shown above, we cut our position in Cubic (CUB) by more than 80% as our thesis played out and the stock price approached our target price. We also added opportunistically to one of our newer positions, Capital Federal Financial (CFFN), as the risk/reward ratio got more attractive, allowing us to lower our average cost basis while collecting a very attractive dividend yield. Finally, as you can see on the right side of the above chart, we have been taking advantage of the volatility inherent in our energy positions, and we will look to opportunistically adjust our position sizing to take advantage of these swings. Of course, there can be no guarantee that such strategies will be successful in the future, and past performance does not guarantee future results. Differentiate between long-term and opportunistic investments: Going forward, you should expect your invested capital to reflect a higher allocation to long-term core holdings in businesses that we view as having strong competitive positions in stable or growing industries at attractive valuations. We believe increasing the Fund’s weighting to these businesses is especially important during the later stages of the economic cycle, since the larger allocation seeks to mitigate downside risk and in our view increases the likelihood of generating long-term market outperformance. At the same time, we intend to reserve some room for opportunistic investments in lower-quality businesses, particularly when valuations are at extreme levels. We believe flexing this higher-beta segment of the portfolio during times of market distress also enhances full-cycle returns. In keeping with our philosophy of seeking to minimize downside risk, we will always seek to ensure such investments
3 Px is an abbreviation for the price of the position

have ample balance sheet strength to minimize thesis duration risk. Right now, our offshore energy investments are a perfect example of this. Additionally, we have tightened our process to avoid a permanent loss of your capital by generally sidestepping opportunities that require a correct call on industry cycle timing and identifying where consensus is categorically incorrect about a secular decline theme. The margin for error on such a thesis is very small, while the consequences of getting things wrong can be devastating. Finally, we would like to point out that we have enacted a process to score our portfolio and pipeline companies on a quality ranking (“1” being highest, and “3” being the lowest) and we are able to track these metrics in the aggregate. A company’s quality score reflects our historic framework (market leadership, history of profitability, solid balance sheets, and high-quality management teams) as well as aspects like industry quality assessed via Porter’s Five Forces.4 Importantly, the entire FPA Capital team reviews and debates each company’s score. Since I became the sole portfolio manager of the Fund, the positions we have sold had an average score of 2.5, while the positions we have initiated have an average score of 1.9. We will continue to update you on this facet of the ongoing portfolio transformation. Our portfolio has gotten cheaper: In many cases, our companies’ earnings have grown, but because their share prices have not kept up with earnings, their multiples have compressed. That phenomenon can be seen in the charts below for Western Digital (WDC) and Arris International (ARRS) and is especially prominent in the chart for Tenneco (TEN), one of our latest investments. The charts below show each issuer’s earnings per share (a measure of profitability), price to earnings ratio (a measure of valuation that compares profitability to the stock price), and stock price.
4 Porter’s Five Forces analysis seeks to assess the competitive strengths and weaknesses of industries and companies by looking at competitive rivalry, supplier power, buyer power, threat of substitution, and threat of new entry.

As shown above, Tenneco has done an exceptional job delivering earnings growth, yet the stock has been flattish, producing multiple compression. The bear thesis equates adoptions of electric vehicles with the demise of Tenneco’s Clean Air division. We think this view is an oversimplification and underestimates the growth in clean air content per vehicle as environmental regulations continue to tighten. Furthermore, we believe battery-only vehicles will represent only a tiny fraction of vehicles sold, and that the shift to electrification will start with hybrids—and those still require a substantial amount of clean-air technology. We believe Tenneco will continue delivering organic top-line growth, even stronger bottom-line growth, and ultimately, we think the market will decide that an 8x P/E multiple is insufficient given these metrics. We believe that our largest positions have significant upside potential. Below you can see a quick summary of our thesis for our largest six positions:
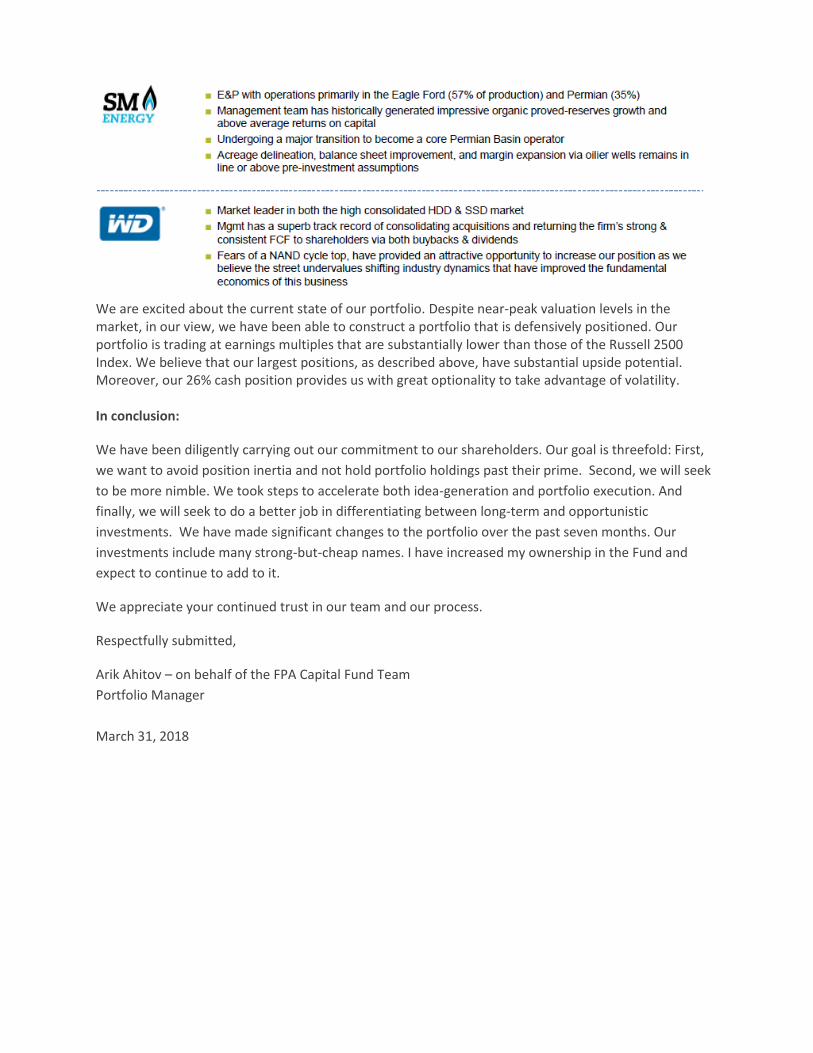
We are excited about the current state of our portfolio. Despite near-peak valuation levels in the market, in our view, we have been able to construct a portfolio that is defensively positioned. Our portfolio is trading at earnings multiples that are substantially lower than those of the Russell 2500 Index. We believe that our largest positions, as described above, have substantial upside potential. Moreover, our 26% cash position provides us with great optionality to take advantage of volatility. In conclusion:
We have been diligently carrying out our commitment to our shareholders. Our goal is threefold: First,
we want to avoid position inertia and not hold portfolio holdings past their prime. Second, we will seek
to be more nimble. We took steps to accelerate both idea-generation and portfolio execution. And
finally, we will seek to do a better job in differentiating between long-term and opportunistic
investments. We have made significant changes to the portfolio over the past seven months. Our
investments include many strong-but-cheap names. I have increased my ownership in the Fund and
expect to continue to add to it.
We appreciate your continued trust in our team and our process.
Respectfully submitted,
Arik Ahitov – on behalf of the FPA Capital Fund Team
Portfolio Manager
March 31, 2018

TICKER
SHARES /
PRINCIPAL SECURITY COUPON RATE (%) MATURITY DATE MKT PRICE ($) MKT VALUE ($)
% OF NET
ASSET VALUE
COMMON STOCKS
AAN 295,050 AARON'S INC 46.60 13,749,330 3.9%
AGCO 77,408 AGCO CORP 64.85 5,019,909 1.4%
ALGT 104,491 ALLEGIANT TRAVEL CO 172.55 18,029,922 5.1%
ARRS 698,470 ARRIS INTERNATIONAL PLC 26.57 18,558,348 5.2%
ARW 86,059 ARROW ELECTRONICS INC 77.02 6,628,264 1.9%
AVT 429,720 AVNET INC 41.76 17,945,107 5.1%
CFFN 623,849 CAPITOL FEDERAL FINANCIAL 12.35 7,704,535 2.2%
XEC 200,617 CIMAREX ENERGY CO 93.50 18,757,689 5.3%
CISN 233,712 CISION LTD 11.57 2,704,048 0.8%
CUB 42,490 CUBIC CORP 63.60 2,702,364 0.7%
GNTX 191,064 GENTEX CORP 23.02 4,398,293 1.2%
GPK 321,042 GRAPHIC PACKAGING HOLDING CO 15.35 4,927,995 1.4%
HP 111,420 HELMERICH + PAYNE 66.56 7,416,115 2.1%
HMHC 921,480 HOUGHTON MIFFLIN HARCOURT CO 6.95 6,404,286 1.8%
IDCC 251,320 INTERDIGITAL INC 73.60 18,497,152 5.2%
MATX 96,140 MATSON INC 28.64 2,753,450 0.8%
NBL 609,420 NOBLE ENERGY INC 30.30 18,465,426 5.2%
OTHER 5,288,277 1.5%
PTEN 577,157 PATTERSON UTI ENERGY INC 17.51 10,106,019 2.9%
RDC 1,126,792 ROWAN COMPANIES PLC 11.54 13,003,180 3.7%
SM 992,415 SM ENERGY CO 18.03 17,893,242 5.1%
SAVE 197,293 SPIRIT AIRLINES INC 37.78 7,453,730 2.1%
TEN 147,270 TENNECO INC 54.87 8,080,705 2.3%
VECO 477,084 VEECO INSTRUMENTS INC 17.00 8,110,428 2.3%
WDC 232,354 WESTERN DIGITAL CORP 92.27 21,439,304 6.1%
TOTAL EQUITIES 266,037,118 75.3%
U.S GOVERNMENT AND AGENCIES
20,000,000 US TREASURY NOTE 0.750 04/30/2018 99.92 19,984,180 5.7%
25,000,000 US TREASURY NOTE 0.875 05/31/2018 99.85 24,963,340 7.0%
20,000,000 US TREASURY NOTE 1.375 06/30/2018 99.89 19,978,808 5.7%
7,500,000 US TREASURY NOTE 0.750 07/31/2018 99.64 7,472,950 2.1%
7,500,000 US TREASURY NOTE 0.750 08/31/2018 99.53 7,464,604 2.1%
TOTAL US GOVT AND AGENCIES 79,863,882 22.6%
REPURCHASE AGREEMENTS
8,858,000 STATE STREET BANK/FICC REPO 0.280 04/02/2018 8,858,000 2.5%
TOTAL REPURCHASE AGREEMENTS 8,858,000 2.5%
CASH & EQUIVALENTS (NET OF LIABILITIES) (1,492,771) -0.4%
TOTAL CASH & EQUIVALENTS 87,229,111 24.7%
TOTAL NET ASSETS 353,266,229$ 100.0%
NO. OF EQUITY POSITIONS 24
Portfolio Holding Submission Disclosure
FPA Capital Fund, Inc.Portfolio Holdings
03/31/18

TICKER
SHARES /
PRINCIPAL SECURITY COUPON RATE (%) MATURITY DATE MKT PRICE ($) MKT VALUE ($)
% OF NET
ASSET VALUE
FPA Capital Fund, Inc.Portfolio Holdings
03/31/18
Except for certain publicly available information incorporated herein, the information contained in these materials is our confidential and proprietary information and is being submitted to you
for your confidential use with the express understanding that, without our prior written permission, you will not release these materials or discuss the information contained herein or make
reproductions of or use these materials for any purpose other than evaluating a potential advisory relationship with First Pacific Advisors.
You should consider the Fund’s investment objectives, risks, and charges and expenses carefully before you invest. The Prospectus details the
Fund's objective and policies, sales charges, and other matters of interest to the prospective investor. Please read this Prospectus carefully before
investing. The Prospectus may be obtained by visiting the website at www.fpafunds.com, by email at [email protected], toll-free by calling 1-800-
982-4372 or by contacting the Fund in writing.
Investments in mutual funds carry risks and investors may lose principal value. Stock markets are volatile and can decline significantly in response to adverse issuer, political, regulatory,
market, or economic developments. The Fund may purchase foreign securities including American Depository Receipts (ADRs) and other depository receipts, which are subject to interest
rate, currency exchange rate, economic and political risks; this may be enhanced when investing in emerging markets. Small and mid- cap stocks involve greater risks and they can
fluctuate in price more than larger company stocks. Groups of stocks, such as value and growth, go in and out of favor which may cause certain funds to underperform other equity funds.
Portfolio composition will change due to ongoing management of the fund. References to individual securities are for informational purposes only and should not be construed as
recommendations by the Funds, the Portfolio Managers or Distributor.
The FPA Funds are distributed by UMB Distribution Services, LLC, 235 W. Galena Street, Milwaukee, WI, 53212.

Important Disclosures
The views expressed herein and any forward-looking statements are as of the date of the publication and are those of the portfolio management team. Future events or results may vary significantly from those expressed and are subject to change at any time in response to changing circumstances and industry developments. This information and data has been prepared from sources believed reliable, but the accuracy and completeness of the information cannot be guaranteed and is not a complete summary or statement of all available data.
Portfolio composition will change due to ongoing management of the Fund. References to individual securities are for informational purposes only and should not be construed as recommendations by the Fund, the portfolio managers, or the Distributor. It should not be assumed that future investments will be profitable or will equal the performance of the security examples discussed. The portfolio holdings as of the most recent quarter-end may be obtained at www.fpafunds.com.
Investments in mutual funds carry risks and investors may lose principal value. Stock markets are volatile and can decline significantly in response to adverse issuer, political, regulatory, market, or economic developments. The Fund may purchase foreign securities, including American Depository Receipts (ADRs) and other depository receipts, which are subject to interest rate, currency exchange rate, economic and political risks; this may be enhanced when investing in emerging markets. Small and mid-cap stocks involve greater risks and they can fluctuate in price more than larger company stocks.
Value stocks, including those selected by the Fund’s portfolio managers, are subject to the risk that their intrinsic value may never be realized by the market and that their prices may go down. Securities selected by the portfolio managers using a value strategy may never reach their intrinsic value because the market fails to recognize what the portfolio managers consider to be the true business value or because the portfolio managers have misjudged those values. In addition, value style investing may fall out of favor and underperform growth or other styles of investing during given periods.
Definitions
The Russell 2500 Index consists of the 2,500 smallest companies in the Russell 3000 total capitalization universe offers investors access to the small to mid-cap segment of the U.S. equity universe, commonly referred to as "smid" cap. The Russell 2500 Value Index measures the performance of those Russell 2500 companies with lower price-to-book-ratios and lower forecasted growth values.
The S&P 500 Index includes a representative sample of 500 hundred companies in leading industries of the U.S. economy. The Index focuses on the large-cap segment of the market, with over 80% coverage of U.S. equities, but is also considered a proxy for the total market.
Indices are unmanaged, do not reflect any commissions or fees which would be incurred by an investor purchasing the underlying securities. Investors cannot invest directly in an index.
An exploration & production (E&P) company is in a specific sector within the oil and gas industry — companies involved in the high-risk/high-reward area of exploration and production focus on finding, augmenting, producing and merchandising different types of oil and gas.
EBITA (Earnings before interest, taxes and amortization) is a financial indicator used widely as a
measure of efficiency and profitability.
Margin of safety - Buying with a “margin of safety” is when a security is purchased at a discount to the portfolio manager’s estimate of its intrinsic value. Buying a security with a margin of safety is designed to protect against permanent capital loss in the case of an unexpected event or analytical mistake. A purchase made with a margin of safety does not guarantee the security will not decline in price.
Price/Earnings ratio (P/E) is the price of a stock divided by its earnings per share.

West Texas Intermediate (WTI) - crude oil is the underlying commodity of the New York Mercantile
Exchange's oil futures contracts.
The FPA Funds are distributed by UMB Distribution Services, LLC, 235 W. Galena Street, Milwaukee, WI, 53212.
Related Documents


