Final Project F11 [ARCH 6990-01]_Prof. Ted Ngai

FP1_Book
Mar 21, 2016
Thesis: Research Phase
Welcome message from author
This document is posted to help you gain knowledge. Please leave a comment to let me know what you think about it! Share it to your friends and learn new things together.
Transcript

Final Project F11 [ARCH 6990-01]_Prof. Ted Ngai

Final Project F11 [ARCH 6990-01]_Prof. Ted Ngai
thesis statement03
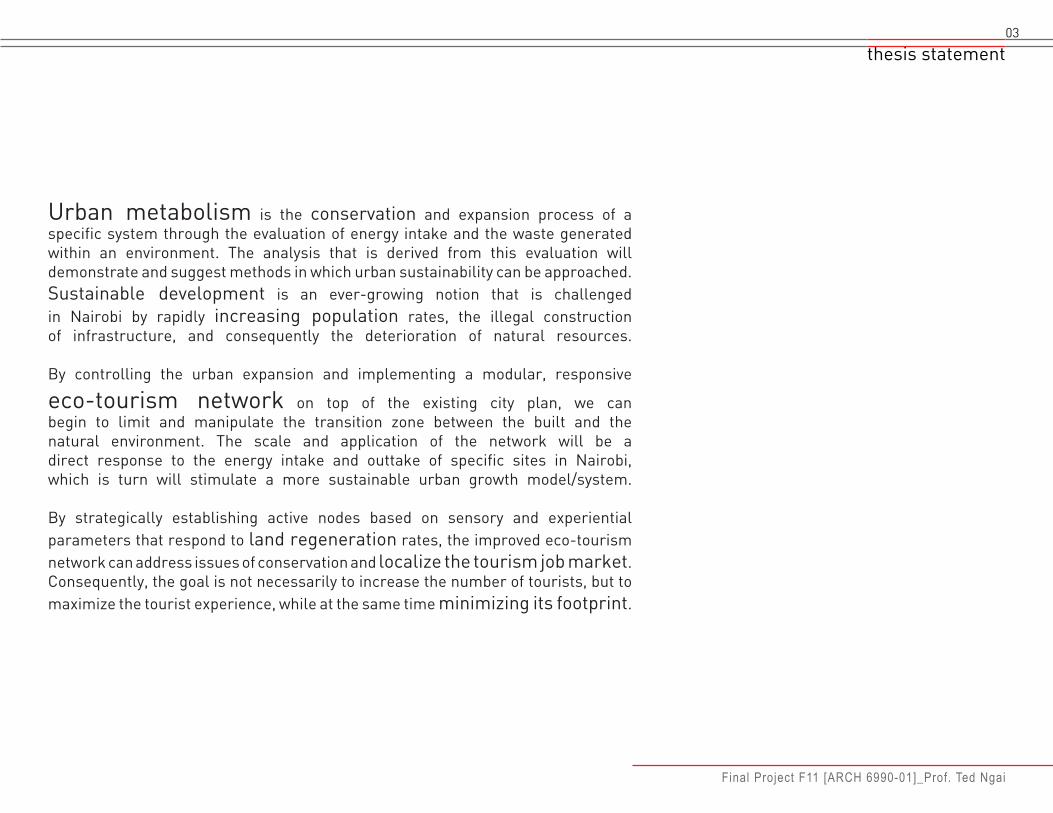
Urban metabolism is the conservation and expansion process of a specific system through the evaluation of energy intake and the waste generated within an environment. The analysis that is derived from this evaluation will demonstrate and suggest methods in which urban sustainability can be approached. Sustainable development is an ever-growing notion that is challenged in Nairobi by rapidly increasing population rates, the illegal construction of infrastructure, and consequently the deterioration of natural resources.
By controlling the urban expansion and implementing a modular, responsive
eco-tourism network on top of the existing city plan, we can begin to limit and manipulate the transition zone between the built and the natural environment. The scale and application of the network will be a direct response to the energy intake and outtake of specific sites in Nairobi, which is turn will stimulate a more sustainable urban growth model/system.
By strategically establishing active nodes based on sensory and experiential parameters that respond to land regeneration rates, the improved eco-tourism network can address issues of conservation and localize the tourism job market. Consequently, the goal is not necessarily to increase the number of tourists, but to maximize the tourist experience, while at the same time minimizing its footprint.


Final Project F11 [ARCH 6990-01]_Prof. Ted Ngai
table of contents05
• Thesis Statement• Table of Contents
INTRODUCTION:
UNDER CONSTRUCTION...p.04p.05
p.06p.06p.p.p.p.p.
p.p.p.p.p.p.p.p.
p.p.p.p.p.p.p.p.


Final Project F11 [ARCH 6990-01]_Prof. Ted Ngai

INTRODUCTION
NAIROBI, KENYA
The chosen site is Kenya’s capital and most developed metropolitan city, Nairobi, which was established about a century ago during the construction of the Uganda railway. The railway is the main connecting system between Kampala, the largest city and capital of Uganda, and Mombasa, Kenya’s second largest city and major port.
The central location of Nairobi between these major cities transformed the region from swampland to a main transportation hub. The Uganda Railway and a major international airport have made Kenya very accessible and because of that, the city has become a central hub for a lot of businesses, international corporations and international conferences.
This caused an increase in it development, and therefore, the city has been growing rapidly over the years.

Nairobi
Nanyuki
Nakuru
Kisumu
Torore
Arua
Kasese
Mwanza
Kigoma
Mpanda
Tabora
ArushaMoshi
Magadi
Tanga
Dar es Salaam
Kidatu
KENYA
UGANDA
train station
airport / train station
railroad
TANZANIA
Mombasa
Kampala
demographics09
Final Project F11 [ARCH 6990-01]_Prof. Ted Ngai
References:1. http://www.infoplease.com/ipa/A0107678.html2. http://kenya.rcbowen.com/cities/nairobi.html

INTRODUCTION
Population Density
Poverty Rate
>600
>65
300-600
55-65
100-300
45-55
20-100
34-45
<20
<35
What stands out about Kenya is not only its diversity, but also the stark contrast that exists within various regions and landscapes.
natural
urban
built
rural

demographics11
Final Project F11 [ARCH 6990-01]_Prof. Ted Ngai
Major Ecosystem Types
Predicted Diversity of Mammal Species
69-79
forest
63-68
bush/woodland
56-62
cropland
48-55
savanna/grassland
37-47
bare areas
This notion is most evident in central and south-western Kenya, where the land is most developed due to the number of rivers that are accumulated in this region.
arid
wildlife
tropical
community

INTRODUCTION
Rift Valley
Climate
6,000 km valley from Southwest Asia to South East Africa
1067
4
6162
86566
260
66364
059
Jan
Feb
Mar Apr
May Jun
Jul
Aug
Sep
Oct
Nov
Dec
NAIROBI FACTS
Nairobi is located within a 100km radius of the Great Rift Valley (lowland between mountains created by a geologic rift), which is a 6,000 km trench running from northern Syria to central Mozambique.
Due to its location right on the equator, Nairobi has a moderate subtropical highland climate. The city is located 1,795 above sea level, therefore the evenings can be fairly chilly. Besides the difference between the wet and dry seasons, there’s very little difference between the seasons.
The city houses over 100 major international companies, the Nairobi Stock Exchange, the United Nations Environment Program and UN headquarters, which have all made Nairobi a financially, politically and socially prominent city.
The major exports include coffee, rice, fruit, flowers, sugar and tea, which amounts to approximately $5 billion worth of goods exported.

demographics13
Final Project F11 [ARCH 6990-01]_Prof. Ted Ngai
Economy
Exports
Nairobi Stock ExchangeKenyatta Intl. Conference CenterMajor international companies and organizations based in Nairobi
Coffee Rice Fruit Flowers Sugar Tea
References:1. http://www.jambokenya.com/jambo/location/rvalley.htm2. http://www.unhabitat.org/content.asp?typeid=19&catid=546&cid=49393. http://daniel-workman.suite101.com/top-kenyan-exports-imports-a404544. http://archive.unu.edu/unupress/unupbooks/uu26ue/uu26ue0o.htm

INTRODUCTION
NAIROBI GROWTH
With a population of 3,318,369 people, Nairobi is the largest city in Kenya and the 4th largest African city.
The city is growing at a rate of 3.8% annually, which amounts to over 127,000 people per year.
As one of the world’s overpopulated cities, its condition creates a conflicts between the human population and its environment.
All the development caused a mass migration to the city from surrounding villages and towns, in hope of better opportunities, and ultimately, a better life. This is also the reason why Nairobi has a fairly young population. What actually ends up happening when people move to the city is that they end up in a dense region and are unable to find jobs.
The city also doesn’t have the resources to sustain the growing population, which results in massive pollution as one consequence and also the displacement of the local poor to the boundaries, ultimately resulting in informal settlements.
rural Kenya
hope for a better life
dense urban fabric
inability to sustain (/metabolize)
consequence: informal sprawl

demographics15
Final Project F11 [ARCH 6990-01]_Prof. Ted Ngai
Urban Growth
Pop
ulat
ion
Den
sity
(peo
ple/
km2 )
0
1000
2000
2,000,000
3,000,000
3000
1,000,000
500,000
1,500,000
2,500,000
5000
6000
1906
1928
1931
1936
1944
1962
1969
1979
1989
1999
2009
2005
5,000+ people move from rural areas to urban
areas in
Kenya
every
day!
References:1. http://www.youtube.com/watch?v=9tpabRBrjWY2. http://www.unep.org/geo/pdfs/NCEO_Report_FF_New_Text.pdf3. http://www.greenstone.org/greenstone3/nzdl?a=d&d=HASH36d6 40644c86b4ce92061b.7.5.np&c=envl&sib=1&dt=&ec=&et=&p.a=b&p. s=ClassifierBrowse&p.sa=

INTRODUCTION
ACCESSIBILITY
Amsterdam
DakarFreetownMonroviaAbidjan
Lagos
Yaounde
Kinshasa
Johannesburg
Maputo
HarareLusaka
Lilongwe
Lubumbashi
Mahe-Seychelles
Mayotte
NairobiZanzibar
Dar es Salaam
Douala
Contonou
Bamako
London
Paris
Cairo
Djibouti
Dubai
Nairobi’s major airport is Jomo Kenyatta International Airport. As the largest airport of East and Central Africa, it handles millions of passengers on a yearly basis.
This airport is also considered the main transportation hub for visiting Africa’s safari lands, serving not only Kenya, but also other cities in East and Central Africa.
Located within 20 km from downtown Nairobi, it serves passengers ranging from Europe to Asia.
Plans for the expansion of the airport will allow for direct flights from other far destinations, such as the United States, therefore accomodating growing number of visitors and air traffic.

demographics17
Final Project F11 [ARCH 6990-01]_Prof. Ted Ngai
Mumbai
Bangkok
Hongkong
Guangzhou
References:1. http://www.kenyaairports.com/jkia/IndexJkia.php2. http://www.airport-technology.com/projects/jomo-kenyatta/

INTRODUCTION
NAIROBI GROWTH CITY GROWTH [1]
2005
1988
1976
6 x
Population: 827,775Area: 25.4 km2
Density: 1,210 people/km2
10 x
Population: 1,324,570Area: 684 km2
Density: 1,937 people/km2
20 x
Population: 2,751,860Area: 696 km2
Density: 3,954 people/km2
Currently, Nairobi has a population of over 3 million people, and it is predicted that it will reach 4 million by 2015.
Its convenient location caused an increase in it development, and therefore, the city has been growing rapidly over the years. That presents a problem because the city’s master plan has not been updated since 1948 [2], so they city is not in the condition to sustain its growing population.
Nairobi has been growing in a very contained manner, meaning that the center which was also the most developed region has remained intact. The city center started growing towards the flat lands, away from the protected lands, and around the main roads and high ways that branched off of the railway.

demographics19
Kahawa
Mbagathi
Kangemi
Kasarani
Embakasi
Kabete
Nairobi City
Dandora
Dangoretti
Riruta
Wilson AirportJKIA
airport
city
train station
railroad
highway
main road
boundary
References:1. http://unepatlas.blogspot.com/2. http://www.isocarp.net/Data/case_studies/2022.pdf
Final Project F11 [ARCH 6990-01]_Prof. Ted Ngai

INTRODUCTION
DENSITY VS. POVERTY
Transportation and Ecotourism
Eco-tourism
Airport
Bus stop
Density per km2
34,668-75,471
23,161-34,667
11,811-23160
5,274-11,810
154-5,273
Poverty >70%60-70%50-60%
30-40%40-50%
20-30%<20%
Most of the activity in Nairobi is established within its core, but what’s interesting is that the most impoverished settlement in Nairobi, Kibera, is attached to that core, demonstrating the disparity in economic levels within the same region.[1]
This creates a dilemma of rich vs. poor, where the poor are not benefiting from the economic sector. The economic sector is mainly driven by the service industry, where 63% of the annual revenue is generated from tourism.[2]
This contrast has also been the cause of the displacement of the indigenous and local communities, where they’re being pushed to the outskirts and are forced to settle on open lands.
Pages 24-27 demonstrate the scattered urban fabric that emerges within city districts.[3] Pages 28-29 display the large gap that exists between the economy and community in Nairobi.

Final Project F11 [ARCH 6990-01]_Prof. Ted Ngai
density21
References:1. http://www.unep.org/geo/pdfs/NCEO_Report_FF_New_Text.pdf2. http://lcweb2.loc.gov/frd/cs/profiles/Kenya.pdf3. http://csud.ei.columbia.edu/?id=projects_nairobi_maps

AGRICULTURAL INDUSTRIAL
LANDUSE

Final Project F11 [ARCH 6990-01]_Prof. Ted Ngai
landuse23
RESIDENTIAL TRANSPORTATION

LANDUSE
FOREST RECREATIONAL

Final Project F11 [ARCH 6990-01]_Prof. Ted Ngai
25
EDUCATIONAL UNDEVELOPED
landuse

EMPLOYMENT
I N D U S T R Y - 1 6 % A G R I C U L T U R E - 2 2 %
Source of Income
Land Distribution
R E S I D E N T I A L - 2 5 . 2 2 %
I N D U S T R I A L - 4 . 5 7 %i n d u s t r i a l c o n c e n t r a t i o nq u a r r y
A D M I N . / C O M M E R C I A L - 0 . 4 0 %r e s e a r c h c e n t e r sl e a r n i n g i n s t i t u t i o n sh o s p i t a l s
I N F R A S T R U C T U R E - 2 . 2 8 %a i r p o r tr a i l w a y s t a t i o ns e w a g e p l a n t sr o a d s
R E C R E A T I O N - 1 . 7 2 %p a r k s / g a r d e n sg o l f c o u r s ep l a y g r o u n d sr a c e c o u r s ed r i v e - i n s
U R B A N A G R I C U L T U R E - 1 3 . 9 0 %c r o p sp l a n t a t i o n sr a n g e l a n d s
O P E N L A N D S - 2 8 . 5 5 %
O T H E R - 2 2 . 0 6 %n a t i o n a l p a r kg a z e t t e d f o r e s t
W A T E R B O D I E S - 1 . 6 9 %d a m sr i v e r i n e a r e a s

Final Project F11 [ARCH 6990-01]_Prof. Ted Ngai
employment27
S E R V I C E / T O U R I S M - 6 2 %
Employment DistributionI n f o r m a l S e c t o r - 7 7 %
A g r i c u l t u r e & F o r e s t r y - 4 . 1 %
M i n i n g & Q u a r r y i n g - 0 . 3 %
B u i l d i n g & C o n s t r u c t i o n - 1 %
T r a d e , R e s t a u r a n t & H o t e l s - 2 . 2 %
T r a n s p o r t & C o m m u n i c a t i o n s - 1 . 3 %
E l e c t r i c i t y & W a t e r - 0 . 6 %
F i n c a n c e , I n s u r a n c e & R e a l E s t a t e - 1 . 1 %
C o m m u n i t y , S o c i a l & P e r s o n a l S e r v i c e s - 9 . 6 %
M a n u f a c t u r i n g - 3 . 1 %

INTRODUCTION
NATIONAL PARKS IN KENYA
Kenya has a total of 55 national parks and reserves, totalling to 580,367 km2 of protected land.[1]
Land-based tourism is a major economic activity in Africa, drawing millions of visitors to different sites across the region every year and generating millions of dollars in foreign exchange earnings. Tourism not only generates revenue to support conservation and management of natural environments but also generates many jobs.
Approximately 180,000 people in Kenya are employed by the tourism industry, however only about 15% of the tourism money reaches Kenya.[2]
With over 1,810,700 visitors to Parks yearly, the tourism earnings total to about $73 million.[3]
Nairobi is located within a 100 km radius of some of the nation’s most popular national parks.
total of 580,367 km2 of protected areas
total of 55 National parks and reserves
total of 435,275 km2 of rangelands
total of 363,454 km2 of unprotected rangelands
Northern21.6%
protected12.3%
unprotected87.7%
built land25%
rangelands75%
unprotected83.5%
protected16.5%
Coast10.1%
Southern57.6%
Central9.6%
Western1.1%

context29
Gatamaiyo Forest Nature Reserve
Oldonyio Sapuk National Park
Downtown Nairobi
Mwea National Reserve
Lake Naivasha National Park
Longonot National Park
Suswa
Hell’s Gate
30 km
50 km
60 km
70 km
80 km
90 km
References:1. http://www.kws.org/parks/2. http://castinet.castilleja.org/private/faculty/peggy_mckee/africaweb/betsy-andmeagan/TourisminKenya.htm3. http://allafrica.com/stories/201110240181.html
Final Project F11 [ARCH 6990-01]_Prof. Ted Ngai

INTRODUCTION
The Big Five
TOURISM IN KENYA Safari
Tourism in Nairobi mainly consists of wildlife and safari.
The city offers the big 5, which are elephants, black rhinos, buffalos, lions and leopards. Of course the main draw in the interaction between humans and wildlife.
Within city boundaries, there are numerous tourist attractions within walking distance from the city core. It is also within a 10 min driving radius of forests, parks and national reserves.
Nairobi National Park, the largest park within the city limits, was the first established National Park in Kenya, established in 1946. [1]
The park offers more than 400 species of animals and covers an area of 117 km2.
Interaction with humans
1 mile = 1.6 km
1/4 mile = 400 m
WALKING RADIUS = 400m

tourism31
ecotourism sites
museums/shops/parks
restaurants
lodging
References:1. http://kws.go.ke/parks/parks_reserves/NANP.html
Final Project F11 [ARCH 6990-01]_Prof. Ted Ngai
Nairobi National Park
Ngong Road Forest
Ngong Forest
Gigiri Forest
Karura Forest
Ngong Hills National Reserve

INTRODUCTION
Modes of TransportationTourist Transportation
Bus
Taxi
Matatu
Rental Car
Tuk Tuk
TRANSPORTATION
The main mode of transportation in Nairobi is the Matatu, which is a minibus. [1]
While other modes of transportation do exist, due to the lack of infrastructure and proper roads, the vehicles cause trail damage, ultimately leading to erosion, land degradation, and loss of biodiversity.
Furthermore, most people in Nairobi cannot afford public transportation. [2]
http://www.foldabikes.com/CurrentEvents/Story/EastAfrica.html
http://lovingthebigisland.wordpress.com/tag/best-snorkeling/

Final Project F11 [ARCH 6990-01]_Prof. Ted Ngai
layers33
water basins
boundaries
roads
contours
terrain
About 1.9 percent of Kenya is covered by water. Kenya’s network of perennial rivers is most dense in the central and western parts of the country, leading to uneven supplies of surface water.
Road transport in Kenya consists a total of 63,265 kilometres of interurban roads, 8,933 km of which are paved. Kenya has one of the best paved highway networks and some of the busiest roads south of the Sahara, but maintenance is often neglected.
Nairobi is the capital and largest city of Kenya. While it is also the most populous city in East Africa with a population of over 3 million people, it is also the most developed within its surroundings.
The lowest point on Kenya is at sea level on the Indian Ocean. The highest point on Kenya is 5,199 meters above sea level at Mount Kenya. Nairobi lies at 1,661m above sea level.
Kenya’s landscape ranges from deserts to snow capped mountains, sandy coastlines to freshwater lakes, savannah grasslands to fertile agricultural plantations, extinct volcanoes to coral reefs. 8.01% of the land is arable. Permanent crops occupy 0.97% of the land. 1030 km² of Kenya’ land is irrigated.
References:1. http://www.thedaysnew.com/Transport_Nairobi.html2. http://www.worldwatch.org/node/5263. http://www.wri.org/publication/content/9506#ch3

INTRODUCTION
ECO-TOURISM IN KENYA
Kenya has been recognized as one of the top 10 eco-tourism destinations in the world.
This title is based on the effects that eco-tourism has in these regions.
Whereas the larger dots on the map (including Kenya) have been successfull at promoting sustainable tourism, destinations such as Gabon, Laos and Ireland are making progress. The islands of Turks & Caicos and Greece on the other hand are facing challenges that years of eco-tourism have presented.[1]
While eco-tourism has been promoted as low-impact travel, over the years, it has presented more challenges than benefits.

demographics35
Final Project F11 [ARCH 6990-01]_Prof. Ted Ngai
Brazil Dubai
Canada
Greece
Ireland
Belize
Gabon
Turks & Caicos
Laos
Kenya
References:1. http://ngadventure.typepad.com/blog/2008/03/beyond-green--2.html

INTRODUCTION
HISTORY OF ECO-TOURISM
The current eco-tourism industry has become a mass market, where the offering of predefined packages are the norm.[1] As a consequence, there is a lack of understanding and exploration of other landscapes, settlements and communities that have a lot to offer.
Eco-tourism really started booming in the past 30 years, however at the same time, we are now realizing that even the most miniscule impact has negative effects on the environment.[2]
A definition eco-tourism is the practice of low-impact, educational, ecologically and culturally sensitive travel that benefits local communities and host countries”. Many of the ecotourism projects are not meeting these standards. Even if some of the guidelines are being executed, the local communities are still facing other negative impacts.[3]
establishment of first National Park (Nairobi National Park)
first form of eco-tourism
legalization of hunting in Africa
creation of recreational hunting zones
creation of protected lands
awareness of biodiversity decline
hunting became illegal
change in safari & start of new eco-tourism with more ideals
eco-tourism became more widely known & studied
more education = growth of eco-tourism
more awareness of traveling alternatives
less mass-market tourism -> more environmentally sensitive, intimate & integrative
“green movement” becomes mainstream
institutionalization of info & teaching to public
1910
1946
1950
1970
1980
1990
2000

demographics37
Final Project F11 [ARCH 6990-01]_Prof. Ted Ngai
References:1. http://www.keralaforest.org/index.php?option=com_content&view=article&id=159&Itemid=2012. http://www.medindia.net/news/Eco-tourism-can-Have-Negative-Impact-on-Wildlife-40587-1.htm3. Kamauro, O. (1996). Ecotourism: Suicide or Development? Voices from Africa #6: Sustainable Development, UN Non-Governmental Liaison Service. United Nations News Service.
After the 2004 Indian Ocean tsunami, coastal communities in Thailand, Southern India and Sri Lanka were permanently relocated inland while their traditional lands were earmarked for tourism development.
In Kenya, the Endorois were expelled from their lands to make way for a conservation area in 1973.
http://www.gwu.edu/~sigur/assets/docs/scap/SCAP25-Tsunami2.pdf http://www.essex.ac.uk/human_rights_centre/hrc/projects/Endorois_case.

INTRODUCTION
Human-Wildlife Conflicts
Displacement of wildlife through snaring and fencing can cause crop raiding by herbivores, livestock depredation by large carnivores, transmission of wildlife diseases to livestock, human injury and death, and destruction to other property.
Increasing human settlements and associated infrastructure in the vicinity of protected area boundaries can cause Illegal grazing of livestock in protected areas.
Illegal extraction of medicinal plants, timber, firewood, wood carving, thatching and construction materials causes land depletion, degradation and deforestation.
Fertilizers and pesticides from agricultural activities outside protected areas, and industrial and domestic effluents infiltrate into aquatic habitats, such as wetlands, streams and rivers .
Off road driving and associated destruction of fragile habitats, harassment of wildlife, feeding of wildlife, construction of tourist accommodation facilities, and poor enforcement of park rules.
Human Encroachment
Over-Exploitation of Natural Resources
Pollutants
Tourism Impacts
Threats Causes Effects

demographics39
Final Project F11 [ARCH 6990-01]_Prof. Ted Ngai
Effects
Tourism Life-Cycle
Construction of Infrastructure & Facilities Unmanagable Waste Disposal of Campsite Sewage in Rivers
Exploitation of Non-Renewable Energy sources Deforestation Contamination of Wildlife
discovery launch increasing accomodation increasing # of tourists displacement of locals environmental degradation decline ?
discovery launch stagnation decline

INTRODUCTION
TOURISM IN KENYA Wildebeest Population Trends
1978 = 29,000 1999 = 1,500
Wildlife Density 1977 Wildlife Density 1999
>125>12545-12545-125
15-4515-450-150-15
Kenya has been recognized as one of the top 10 eco-tourism destinations in the world.
This title is based on the effects that eco-tourism has in these regions.
Whereas the larger dots on the map (including Kenya) have been successfull at promoting sustainable tourism, destinations such as Gabon, Laos and Ireland are making progress. The islands of Turks & Caicos and Greece on the other hand are facing challenges that years of eco-tourism have presented.[1]
While eco-tourism has been promoted as low-impact travel, over the years, it has presented more challenges than benefits.

Final Project F11 [ARCH 6990-01]_Prof. Ted Ngai
wildebeest migration41
February
April
July
November
Jan
Feb
Mar
Apr
May
Jun
Jul
Aug
Sep
Oct
Nov
Dec
104 82 60
6761 62 65 6660 63 6459
wildebeest migration pattern average climate and rainfall annual rainfall

INTRODUCTION
THREATS Example of Deforestation near Nairobi (Mumoni Hill Forest Reserve)
Since independence in 1963, Kenya’s human population has dramaticallyincreased putting a lot of pressure and demand on the available land and associated resources. This has led to an increased demand for agricultural land and settlement both in rural areas and urban centres.
From the mid-1970s, human encroachment by agricultural communities in the less productive and semi-arid rangelands, which now supports most wildlife, has skyrocketed. This has precipitated multiple problems such as environmental degradation, human–wildlife conflicts, competition forwater and forage resources and a serious general hatred and negative altitude towards wildlife, tourism and conservation areas.

desertification factors43
Historical, socio-economic & political factors of low-
potential areas
insuffiecient education for nomadic life
basin drain through urban drift
modification of microclimates
soil erosion
desertification
increased run-off & less water penetration
herb layer destruction
tree & shrub destruction
soil compaction
drought overgrazing more livestock night enclosures
concentration of human & animal impact around settlements
increasing livestock herds for subsistence & fora herds for
insurance against drought mortality
expanding human populations
more fuel & building materials
traditional land tenure communal ownership of landprivate ownership of animals
increased sedentarization of
nomads
sedentary education fac.
insufficient security against
raiding
insufficient range management & grazing control
insufficient livestock
marketing fac.
boreholes & dams
low sale price of animal products
reduced infant mortality
increased adult survival
intrinsic capacity for
increase
veterinary facilities
medical care
famine relief
government & quasi-government services
References:1.http://www.nzdl.org/gsdlmod?a=p&p=about&c=hdl
Final Project F11 [ARCH 6990-01]_Prof. Ted Ngai
INTRODUCTION
CONSEQUENCES & RISKS
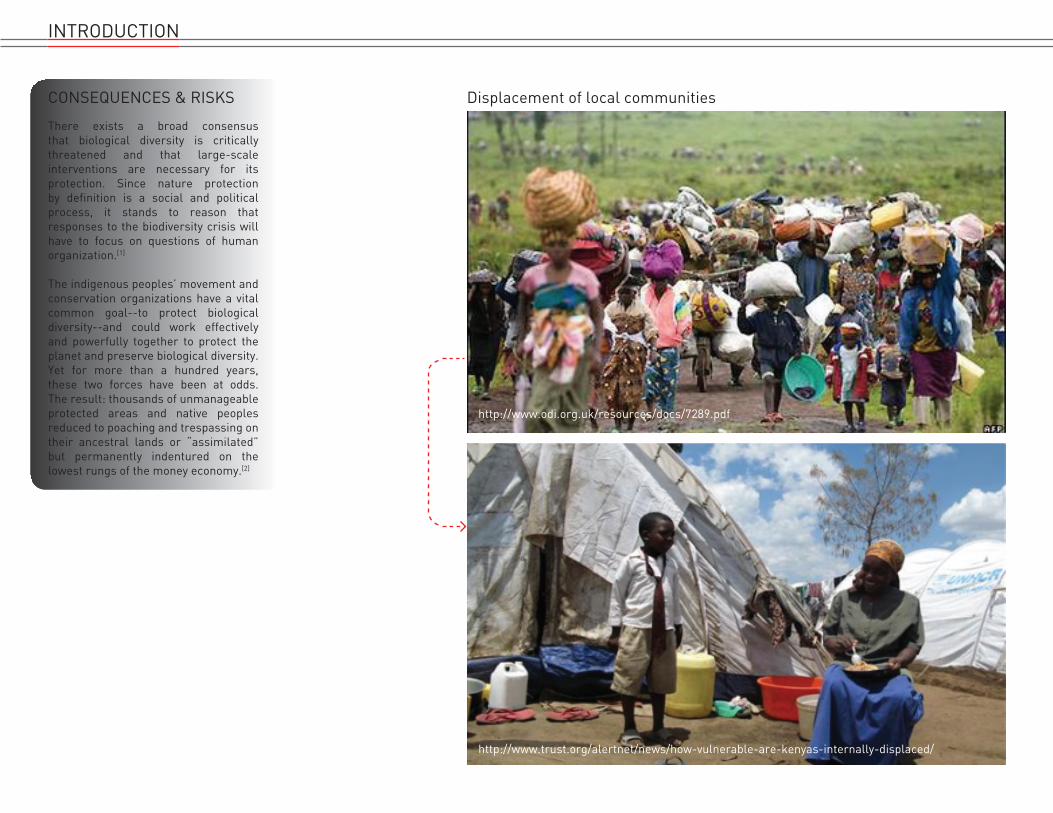
There exists a broad consensus that biological diversity is critically threatened and that large-scale interventions are necessary for its protection. Since nature protection by definition is a social and political process, it stands to reason that responses to the biodiversity crisis will have to focus on questions of human organization.[1]
The indigenous peoples’ movement and conservation organizations have a vital common goal--to protect biological diversity--and could work effectively and powerfully together to protect the planet and preserve biological diversity. Yet for more than a hundred years, these two forces have been at odds. The result: thousands of unmanageable protected areas and native peoples reduced to poaching and trespassing on their ancestral lands or “assimilated” but permanently indentured on the lowest rungs of the money economy.[2]
Displacement of local communities
http://www.odi.org.uk/resources/docs/7289.pdf
http://www.trust.org/alertnet/news/how-vulnerable-are-kenyas-internally-displaced/

demographics45
Final Project F11 [ARCH 6990-01]_Prof. Ted Ngai
landnessnessland-based
re-establishment
joblessness re-employment
alternate land or new job opportunities
continuous, long-term health monitoring
rebirth of community institutions
require institution building & concurrence from host area
population
new means of livelihood
marginalization social inclusion
loss of access to common property resources
restoration of community assets
homelessness house reconstruction
increased morbidity
adequate nutritionfood insecurity
improved health care
community disarticulation
networks & community rebuilding
References:1. http://www.facstaff.bucknell.edu/pwilshus/scholarship/snr_sqwh2.pdf2. Dowie, Mark, “Conservation Refugees”, The MIT Press, 2009.

EXAMPLES
EcoCamp Patagonia Torres del Paine National Park, Chile
The domes have semi-spherical structures, which minimize external surface area and temperature exchange through walls, as well as giving maximum internal space and ensuring a uniform distribution of wind stress. The dome exteriors are green and of limited height so they blend harmoniously into the natural environment. All walls have an outer canvas layer and thick insulation cushion, ensuring warmth and protection from strong winds. Skylight windows allow guests to follow natural light patterns, star gaze at night, and utilize natural heat and light resources. Recycled materials are used for amenities and wooden dome structures, and fallen dead wood is used in fireplaces. Walkways connecting domes are raised so as not to damage the terrain, and to allow animals to roam around freely without structures blocking their path. As they walk between domes on these walkways, guests can responsibly connect with their outside surroundings.
SUCCESSFUL TOURISM
FincubeDolomite Mountains, Italy
The 506 sq ft Fincube is designed to coexist with, not to trample Mother Nature. Designed as a high-tech, low-energy, small footprint resident offering magnificent views of Italy’s Dolomite Mountains, the one-bedroom residence is built on a pedestal, with minor damange to the ground below it and also a portability factor of a small house that is easy to move.The Fincube is oriented in a helical pattern, so when visitors enter up through the pedestal, they travel in a circle through the kitchen, living area, then the bedroom and finally the bathroom. Triple-glazed windows cover the entire facade of the home, offering 360 degree views of the surrounding landscape, and an exterior shade screen with walkway cages in the house. The shade screen provides shading and ventilation for the house without impinging on the stunning views
The current eco-tourism industry has become a mass market, where the offering of predefined packages are the norm.[1] As a consequence, there is a lack of understanding and exploration of other landscapes, settlements and communities that have a lot to offer.
Eco-tourism really started booming in the past 30 years, however at the same time, we are now realizing that even the most miniscule impact has negative effects on the environment.[2]
A definition eco-tourism is the practice of low-impact, educational, ecologically and culturally sensitive travel that benefits local communities and host countries”. Many of the ecotourism projects are not meeting these standards. Even if some of the guidelines are being executed, the local communities are still facing other negative impacts.[3]
http://goglamping.net/americas/ecocamp-patagonia/
http://www.fincube.eu/en

demographics47
Kimana wildlife sanctuary in AMBOSELI
Ilngwesi tourism bandas in LAIKIPIA
Lumo wildlife sanctuary in TSAVO
Mwaluganje Elephant sanctuary in SHIMBA HILLS
Communities who depend on plant and wildlife resources for their livelihood often contribute to stresses on vulnerable natural resources. An approach known as community-based natural resource management (CBNRM) sees management of human and natural resources as part of the same equation: when communities are able to increase their incomes through improved agricultural practices and alternative economic activity, precious natural resources are sustained.
Kenya’s Wildlife Sanctuary has established conservation areas on communally owned land in the hope that small scale sustainable tourism will generate income for the community.The Kimana community has been able to recognize ways to coexist with wildlife as a key partner in sustainable wildlife conservation.
The area welcomes about 86,000 visitors every year and its tourism demonstrates the economic viability of wildlife conservation by providing employment and income for many residents. The staff involved in the construction and subsequent running of the lodge are all group ranch members and the project therefore provides an increase in local employment.It is constructed with materials from the local area, and water heating and electricity are powered by solar systems.
The Mwaluganje Elephant Sanctuary is a community-based organization that works to alleviate human-wildlife conflicts arising from the large population of elephants in Mwaluganje and the conflicting land use practices of local farmers. It aims to resolve human-elephant conflicts in the Golini-Mwaluganje area, encourage communities to support wildlife conservation by funding social projects and enterprise development related to wildlife conservation, and ensure that community and individual landowners within the Mwaluganje – Shimba Hills National Reserve corridor benefit from wildlife conservation and Eco-tourism development.
http://www.africaodyssey.com/kenya/il-ngwesi http://www.kenya-safari.tv/lumo-sanctuary.html
h t t p : / / w w w . e l e p h a n t m w a l u g a n j e . c o m /ABOUT%20US/aboutus/Aboutus.htm
http://www.naturalhighsafaris.com/explore/kenya/kimana-wildlife-sanctuary
Final Project F11 [ARCH 6990-01]_Prof. Ted Ngai

PROPOSAL
Current Condition
Proposed Condition
The new eco-tourism network proposes to redefine the boundaries by constructing new and improved transport infrastructure. The reinforcement of new tourism “hubs” outside the capital will create wealth and promote sustainable development versus uncontrolled growth.
The scheme will provide an integrated environmental plan that provides for an ecological balance while at the same time supporting new technologies and energy initiatives throughout the regions.
By improving the quality of life for both the residents and the visitors, the new network will strengthen the identiy of the existing towns and communities.
The new network proposes to integrate community, economy and environment. Currently, these sectors are functioning separately, without benefiting from one another. The new network will create a synthesis amongst the three sectors in order to create a more efficient settlements.
NEW TOURISM NETWORK
Economy
Community
Environment
Economy
Community
Environment

surrounding settlements49
Ngong
Downtown Nairobi
Mlolongo
Sabuk
Athi River
Kitengela
Isinya
Kajiado
Mitaboni
KagundoIndustry Core
Salama
Thika
Kiambu
urban rural
Kikuyu
Limuru
Ruiru
Current Tourism Condition
Proposed Network of TourismFinal Project F11 [ARCH 6990-01]_Prof. Ted Ngai

LOOKING FORWARD
For this proposal to be able to function properly, threats to biodiversity and their implications need to be addressed early on to lessen the negative impact.
The diagram on the right shows a 100 year plan that focuses on these issues and presents specific events that can take place in order to address them.
The diagram shows the synthesis between community, environment and economy and how they can potentially work together.
From top to bottom, you can predict revenue streams, infrastructure development, and ecological strategies.
Transformation of Kibera
1. consultants hired2. education in local facilities
3. scientific research4. experimental processing
facilities5. processing facilities
development6. industry at optimum
proficiency7. peak intensity
8. focus towards leisure & national park maintenance
9. conversion of former plants to new usage
A. establishment /re-organization of community
eventsB. networked economy allows
events to take place all over the region
C.communities move away from forest land and require indoor
space for community eventsD.community events dispersed
over the entire region
Environment connections
Economic connections
Community connections
community amenities
leisure activities
community events
PROPOSAL

Final Project F11 [ARCH 6990-01]_Prof. Ted Ngai
communal, economical & environmental development51
existing roads
0 years 10 years 20 years 30 years 40 years 50 years 60 years 70 years 80 years 90 years
REVIVED ECONOMY
LOCAL JOB MARKET
personal mobility infrastructure
non-renewable energymicro-renewable energy
water management
ecological & biodiversity increase
communications
recycling center
urban pantry
“Pioneer species are species which colonizes previously uncolonized land, usually leading to ecological succession.”
“Secondary successionoccurs when anestablished eco -system has beendisturbed by man ornature”
“Tertiarry species pavethe way for a stablestate eco-systemwhere there isoptimum balancebetween diversity andsustenance.”
pioneering plant species
pioneering plant species
secondary succession
secondary succession
tertiary succession
tertiary succession
recolonization = regeneration if eco-system is destroyed/
altered
mycelium
spread
mycelium
spread
mycelium
spread
hiking hiking
hiking
safari
observatory
picnics
wild food walks
safari
safari
safaricrop harvesting
crop harvesting
new revenue
com
post
was
te
rem
edia
ted
soil
natu
ral s
oil b
uild
up
safarifood growing program
food growing program
food growing program food
growing program
community eateries
bird watching
EVENTScelebrations
feastseducation
community
bird watching
bird watching
nature trails
1
2
A
B
C
D
3 4
5
6
7
8
9
elevated transport

Existing Urban Settlements vs. Current Poles of Attraction:
while most tourists visit Nairobi solely for the safari experience, many are unaware of other settlements and areas in close proximity to the city.
Green Corridors & Open Space:
by revitalizing the existing settlements, the population of Nairobi can decentralize to other regions for better opportunities. The new infrastructure will link towns across the existing network of roads, river and rail lines by improving and cleaning up the city’s arteries.
CLEANING ARTERIES
As the current tourism hubs are set up in near proximity to Nairobi, the main footprint is implemented on Nairobi.
By revitalizing these regions and bringing the main economic driver, which is the tourism industry to the existing settlements in the region, we have the opportunity to create a more integrated network of communication, transportation, infrastructure, and tourism. This will eventually improve and clean up the cities arteries.
PROPOSAL

demographics53
Final Project F11 [ARCH 6990-01]_Prof. Ted Ngai
Ngo
ng
Dow
ntow
n N
airo
bi
Mlo
long
o
Sabu
k
Ath
i Riv
erK
iteng
ela
Isin
ya
Kaj
iado
Mita
boni
Kag
undo
Indu
stry
Cor
e
Sala
ma
Thik
a Kia
mbu
Kik
uyu
Lim
uru
Rui
ru

WASTE ECONOMY
By introducing a new waste economy system. the process of land regenaration can potentially be accelerated, and eventually optimized.
The system operates within the restoration strategy, providing jobs and livelihoods for communities.
The proposal involves localized renewable energy production, which can be developed by using re-processed waste products.
This recycling process makes use of existing transportation paths, but also proposes the rehabilitation of new transportation infrastructure.
Infrastructure changes as vegetation grows and biological diversification increases, thus transforming the types of activities that take place in a particular area.
This waste economy system ultimately creates a regenerative loop that enables self-sustainability of nature and community.
PROPOSAL
0 years
2 years
10 years

waste processing55
output
input
inorganic and organic waste
mycelium added
remediated organic matter
with various plants
energy generator
conversion
food waste collected
compost waste collected
edible plants sorted
community restaurant
system is integrated with safari/eco-tourism
composting toilets
microfiltration of graywater for
purification
composting facilities
plants
rainwater harvest
rainwater/graywater
system
help global waste economy
educate
rain
injection moulding machines
biodegradable pellets
biodegradable food/drink/perishable packaging
birds spread seeds across
country
biodegradable packaging can be composed
packaging degrades into
soil
seeds absorbed/eaten
by birds
bio-gas accumulation
general public
transfer area
systems/facilities needed for regeneration
Final Project F11 [ARCH 6990-01]_Prof. Ted Ngai

PROPOSAL
UNDERSTANDING CONTEXT
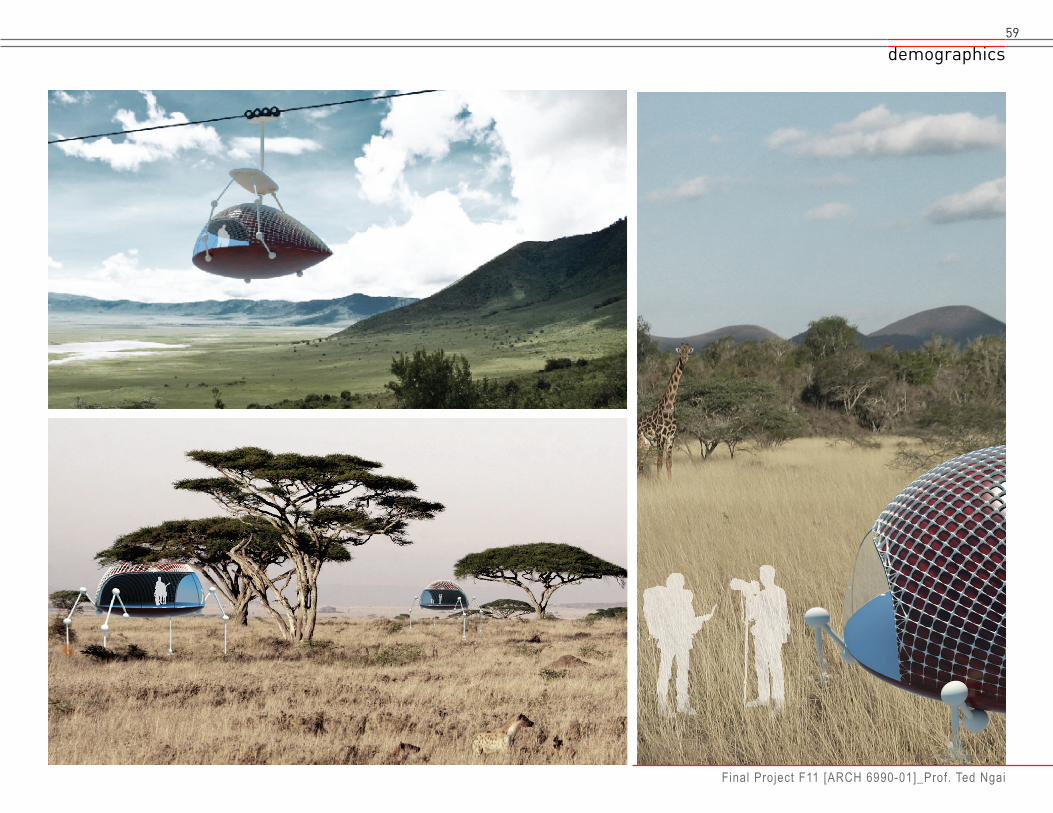
In order to start regenerating land, it is important to take the exisiting biodiversity into account.
The new strategy proposes to accomodate wildlife habitat and habits in order to avoid scaring off the animals or encroaching onto their territories.
Instead of having the animals be the objects on display, perhaps the humans in turn can be viewed by the animals in a non-threatening matter.
By reversing the roles, we start questioning the relationship between humans and wildlife, which can ultimately spark an investigation into animal lifestyles and needs.

demographics57
Final Project F11 [ARCH 6990-01]_Prof. Ted Ngai
cliff
passpeak
ridge
valley
lake
drumlin
kettle
hill
forest
mountain slope
crest
spursummit
plateau mountain torrent
solar radiation
condensation
action of windevaporation
percipitation
river
evaporationsurface runoff
underground flow
intrusive rocks
mountain range
water level
river bed
sedimentary rocks
metamorphic rocks
granitic layer
igneous rocks
basaltic layer
volcano
infiltration
transpiration
percipitation cliff
References:1. http://visual.merriam-webster.com/earth/geology/mountain.php

Current state of Kibera
Vision of Kibera in the future
PROPOSAL
The new eco-tourism network proposes to redefine the boundaries by constructing new and improved transport infrastructure. The reinforcement of new tourism “hubs” outside the capital will create wealth and promote sustainable development versus uncontrolled growth.
The scheme will provide an integrated environmental plan that provides for an ecological balance while at the same time supporting new technologies and energy initiatives throughout the regions.
By improving the quality of life for both the residents and the visitors, the new network will strengthen the identiy of the existing towns and communities.
The new network proposes to integrate community, economy and environment. Currently, these sectors are functioning separately, without benefiting from one another. The new network will create a synthesis amongst the three sectors in order to create a more efficient settlements.
VISION OF FUTURE
demographics59
Final Project F11 [ARCH 6990-01]_Prof. Ted Ngai