Fourth Quarter & Full Year 2017 Earnings Results January 30, 2018 POLARIS INDUSTRIES INC.

Welcome message from author
This document is posted to help you gain knowledge. Please leave a comment to let me know what you think about it! Share it to your friends and learn new things together.
Transcript

Fourth Quarter & Full Year 2017
Earnings Results
January 30, 2018
POLARIS INDUSTRIES INC.
SAFE HARBOR & NON-GAAP MEASURES
2Q4 & FY'17 Earnings
Except for historical information contained herein, the matters set forth in this presentation, including management’s expectations regarding 2018
future sales, shipments, net income, and net income per share, operational initiatives and impact of tax reform are forward-looking statements that
involve certain risks and uncertainties that could cause actual results to differ materially from those forward-looking statements. Potential risks and
uncertainties include such factors as the Company’s ability to successfully implement its manufacturing operations expansion initiatives, product
offerings, promotional activities and pricing strategies by competitors; economic conditions that impact consumer spending; acquisition integration
costs; product recalls, warranty expenses; impact of changes in Polaris stock price on incentive compensation plan costs; foreign currency
exchange rate fluctuations; environmental and product safety regulatory activity; effects of weather; commodity costs; uninsured product liability
claims; uncertainty in the retail and wholesale credit markets; performance of affiliate partners; changes in tax policy and overall economic
conditions, including inflation, consumer confidence and spending and relationships with dealers and suppliers. Investors are also directed to
consider other risks and uncertainties discussed in documents filed by the Company with the Securities and Exchange Commission. The Company
does not undertake any duty to any person to provide updates to its forward-looking statements. The data source for retail sales figures included in
this presentation is registration information provided by Polaris dealers in North America and compiled by the Company or Company estimates.
The Company must rely on information that its dealers supply concerning retail sales, and other retail sales data sources and this information is
subject to revision.
This presentation contains certain non-GAAP financial measures, consisting of “Adjusted” sales (total and organic), gross profit, operating
expenses, net income and net income per diluted share as measures of our operating performance. Management believes these measures may be
useful in performing meaningful comparisons of past and present operating results, to understand the performance of its ongoing operations and
how management views the business. Reconciliations of Adjusted non-GAAP measures to reported GAAP measures are included on slides 4 and
5 in this presentation. These measures, however, should not be construed as an alternative to any other measure of performance determined in
accordance with GAAP.
2018 GUIDANCE ADJUSTMENTS
3Q4 & FY'17 Earnings
2018 guidance excludes the pre-tax effect of acquisition integration costs of approx. $10 million, supply chain transformation
costs of approx. $10 million to $20 million and the remaining impacts associated with the Victory wind down which is estimated to
be in the range of $5 million to $10 million. 2018 Adjusted sales guidance excludes any Victory wholegood, accessories and
apparel sales and corresponding promotional costs as the Company is in the process of exiting the brand. The Company has not
provided reconciliations of guidance for Adjusted diluted net income per share, in reliance on the unreasonable efforts exception
provided under Item 10(e)(1)(i)(B) of Regulation S-K. The Company is unable, without unreasonable efforts, to forecast certain
items required to develop meaningful comparable GAAP financial measures. These items include costs associated with the
Victory wind down that are difficult to predict in advance in order to include in a GAAP estimate.

NON-GAAP RECONCILIATIONS
4Q4 & FY'17 Earnings
Key Definitions: Throughout this presentation, the word
“Adjusted” is used to refer to GAAP results excluding: TAP
inventory step-up purchase accounting, TAP integration
expenses, impacts associated with the Victory Motorcycles®
wind down, restructuring and realignment costs, and impacts
of the tax reform.
Reconciliation of GAAP "Reported" Results to Non-GAAP "Adjusted" Results(In Thousands, except per share data; Unaudited)
Adjustments:
(1) Represents adjustments for the wind down of Victory Motorcycles, including wholegoods, accessories and apparel
(2) Represents adjustments for TAP integration expenses
(3) Represents adjustments for corporate restructuring and network realignment costs
(4) Represents an adjustment for impacts of a charge in its income tax provision due to the remeasurement of its deferred income tax positions at the new corporate income tax rate of 23.8 percent (from 37.1 percent)
(5) The Company used its estimated statutory tax rate of 37.1% for the non-GAAP adjustments, except for the non-deductible items and the tax reform related changes noted in Item 4
2016 Reclassified Results: 2016 sales and gross profit results for ORV/Snowmobiles, Motorcycles and Aftermarket are reclassified for the new Aftermarket reporting segment.
Three months ended December 31, Years ended December 31,
2017 2016 2017 2016
Sales $ 1,431,049 $ 1,217,789 $ 5,428,477 $ 4,516,629
Victory wind down (1) (2,364) — (1,857) —
Restructuring & realignment (3) 1,048 — 1,048 —
Adjusted sales 1,429,733 1,217,789 5,427,668 4,516,629
Gross profit 367,812 312,772 1,324,651 1,105,623
Victory wind down (1) 2,874 — 57,844 —
TAP (2) — 8,803 12,950 8,803
Restructuring & realignment (3) 2,463 — 12,980 —
Adjusted gross profit 373,149 321,575 1,408,425 1,114,426
Income before taxes 117,977 85,459 318,791 313,251
Victory wind down (1) 164 — 77,398 —
TAP (2) 3,463 21,454 26,921 21,454
Restructuring & realignment (3) 11,598 — 22,116 —
Adjusted income before taxes 133,202 106,913 445,226 334,705
Net income 31,475 62,581 $ 172,492 212,948
Victory wind down (1) (1,012) — 52,366 —
TAP (2) 2,177 13,515 16,923 13,515
Restructuring & realignment (3) 7,291 — 13,902 —
Tax reform (4) 55,398 — 55,398 —
Adjusted net income (5) $ 95,329 $ 76,096 $ 311,081 $ 226,463
Diluted EPS $ 0.49 $ 0.97 $ 2.69 $ 3.27
Victory wind down (1) (0.02) — 0.82 —
TAP (2) 0.03 0.21 0.26 0.21
Restructuring & realignment (3) 0.11 — 0.22 —
Tax reform (4) 0.86 — 0.86 —
Adjusted EPS (5) $ 1.47 $ 1.18 $ 4.85 $ 3.48
NON-GAAP RECONCILIATIONS - SEGMENTS
5Q4 & FY'17 Earnings
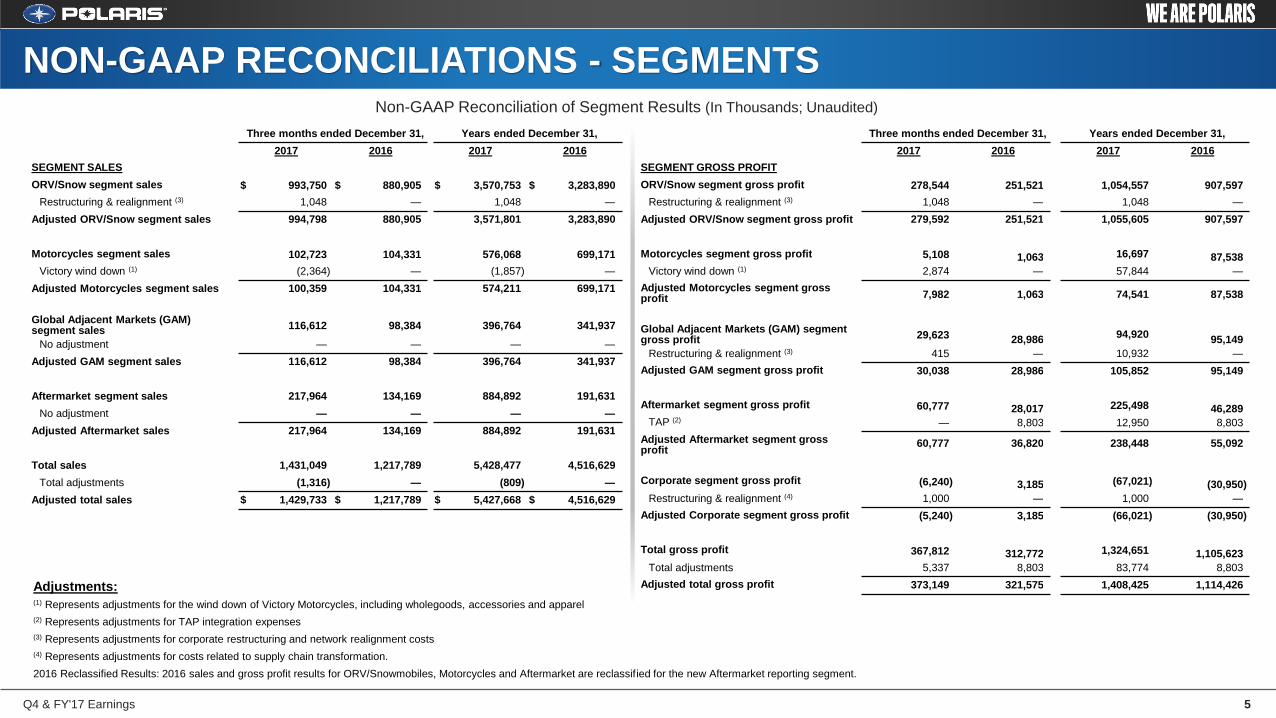
Non-GAAP Reconciliation of Segment Results (In Thousands; Unaudited)
Adjustments:(1) Represents adjustments for the wind down of Victory Motorcycles, including wholegoods, accessories and apparel
(2) Represents adjustments for TAP integration expenses
(3) Represents adjustments for corporate restructuring and network realignment costs
(4) Represents adjustments for costs related to supply chain transformation.
2016 Reclassified Results: 2016 sales and gross profit results for ORV/Snowmobiles, Motorcycles and Aftermarket are reclassified for the new Aftermarket reporting segment.
Three months ended December 31, Years ended December 31,
2017 2016 2017 2016
SEGMENT SALES
ORV/Snow segment sales $ 993,750 $ 880,905 $ 3,570,753 $ 3,283,890
Restructuring & realignment (3) 1,048 — 1,048 —
Adjusted ORV/Snow segment sales 994,798 880,905 3,571,801 3,283,890
Motorcycles segment sales 102,723 104,331 576,068 699,171
Victory wind down (1) (2,364) — (1,857) —
Adjusted Motorcycles segment sales 100,359 104,331 574,211 699,171
Global Adjacent Markets (GAM) segment sales 116,612 98,384 396,764 341,937
No adjustment — — — —
Adjusted GAM segment sales 116,612 98,384 396,764 341,937
Aftermarket segment sales 217,964 134,169 884,892 191,631
No adjustment — — — —
Adjusted Aftermarket sales 217,964 134,169 884,892 191,631
Total sales 1,431,049 1,217,789 5,428,477 4,516,629
Total adjustments (1,316) — (809) —
Adjusted total sales $ 1,429,733 $ 1,217,789 $ 5,427,668 $ 4,516,629
Three months ended December 31, Years ended December 31,
2017 2016 2017 2016
SEGMENT GROSS PROFIT
ORV/Snow segment gross profit 278,544 251,521 1,054,557 907,597
Restructuring & realignment (3) 1,048 — 1,048 —
Adjusted ORV/Snow segment gross profit 279,592 251,521 1,055,605 907,597
Motorcycles segment gross profit 5,108 1,063 16,697 87,538
Victory wind down (1) 2,874 — 57,844 —
Adjusted Motorcycles segment gross profit 7,982 1,063 74,541 87,538
Global Adjacent Markets (GAM) segment gross profit 29,623 28,986
94,92095,149
Restructuring & realignment (3) 415 — 10,932 —
Adjusted GAM segment gross profit 30,038 28,986 105,852 95,149
Aftermarket segment gross profit 60,777 28,017 225,498 46,289
TAP (2) — 8,803 12,950 8,803
Adjusted Aftermarket segment gross profit
60,777 36,820 238,448 55,092
Corporate segment gross profit (6,240) 3,185 (67,021) (30,950)
Restructuring & realignment (4) 1,000 — 1,000 —
Adjusted Corporate segment gross profit (5,240) 3,185 (66,021) (30,950)
Total gross profit 367,812 312,772 1,324,651 1,105,623
Total adjustments 5,337 8,803 83,774 8,803
Adjusted total gross profit 373,149 321,575 1,408,425 1,114,426

Scott W. Wine, Chairman & CEO
Fourth Quarter & Full Year 2017 Earnings Results
January 30, 2018
POLARIS INDUSTRIES INC.

FOURTH QUARTER AND FULL YEAR 2017 SUMMARY
7Q4 & FY'17 Earnings
Significant Investments and Improvements in People, Processes, Product Innovation and Quality
Q4 and FY 2017 financials met expectations with strong topline growth
N.A. retail sales increased 1% for full year; +5% in 2nd Half
Indian Motorcycles out-performed industry and gained share again
All segments and regions reported positive sales in Q4 and Full Year
Increased R&D and Safety & Quality spend yielding results
Production flow improving; dealer inventories adequate in aggregate
Adjusted* Gross Margins improved; positive product mix, lower warranty
Manufacturing realignment, restructuring and TAP integration execution progressing
FY 2017 Sales* by Segment
66%16%
7%
11%
$5.4B20%
ORV/Snow
9%
Motorcycles
7% excl. Victory
Adj. Markets
16%
Aftermarket
362%
* See GAAP/Non-GAAP Reconciliation on Slides #4-5
NORTH AMERICAN POWERSPORTS RETAIL SALES
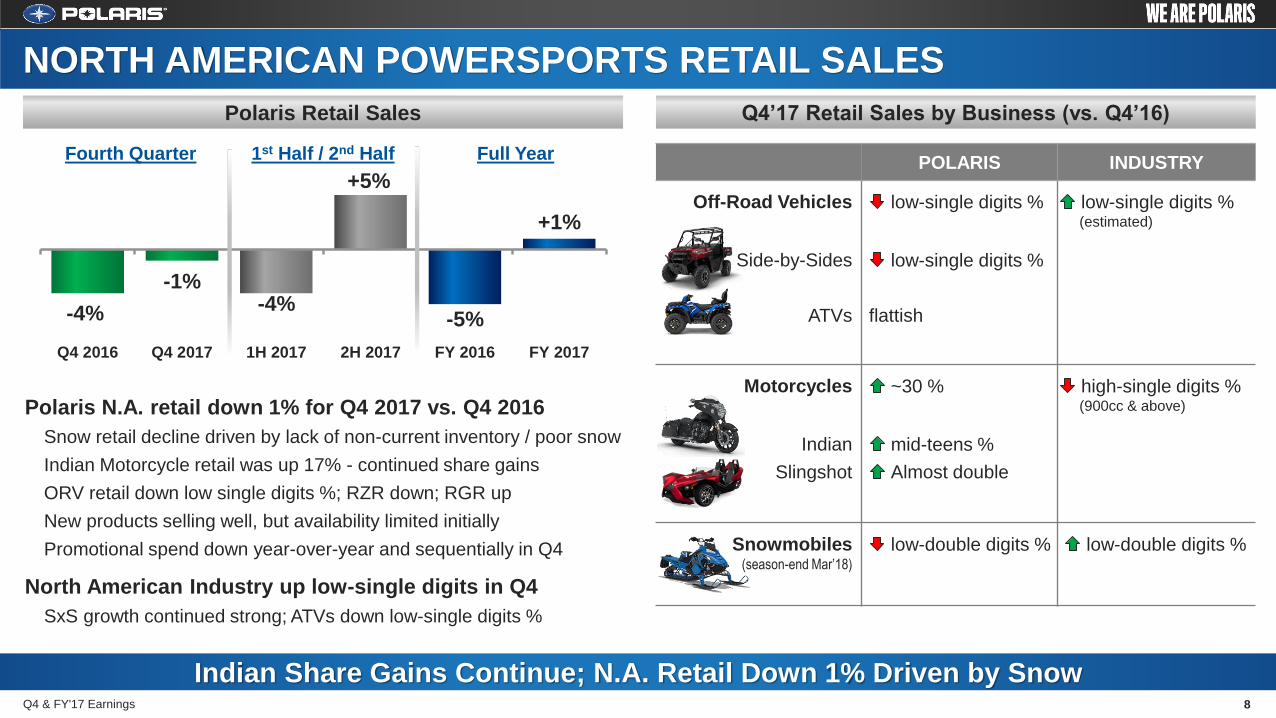
Polaris N.A. retail down 1% for Q4 2017 vs. Q4 2016
Snow retail decline driven by lack of non-current inventory / poor snow
Indian Motorcycle retail was up 17% - continued share gains
ORV retail down low single digits %; RZR down; RGR up
New products selling well, but availability limited initially
Promotional spend down year-over-year and sequentially in Q4
North American Industry up low-single digits in Q4
SxS growth continued strong; ATVs down low-single digits %
-4%
-1%-4%
+5%
-5%
+1%
Q4 2016 Q4 2017 1H 2017 2H 2017 FY 2016 FY 2017
POLARIS INDUSTRY
Off-Road Vehicles low-single digits % low-single digits %(estimated)
Side-by-Sides
ATVs
low-single digits %
flattish
Motorcycles ~30 % high-single digits %(900cc & above)
Indian
Slingshot
mid-teens %
Almost double
Snowmobiles(season-end Mar’18)
low-double digits % low-double digits %
Indian Share Gains Continue; N.A. Retail Down 1% Driven by Snow
Q4’17 Retail Sales by Business (vs. Q4’16)Polaris Retail Sales
Q4 & FY'17 Earnings 8
Fourth Quarter 1st Half / 2nd Half Full Year
Q1 Q2 Q3 Q4
2015 2016 2017
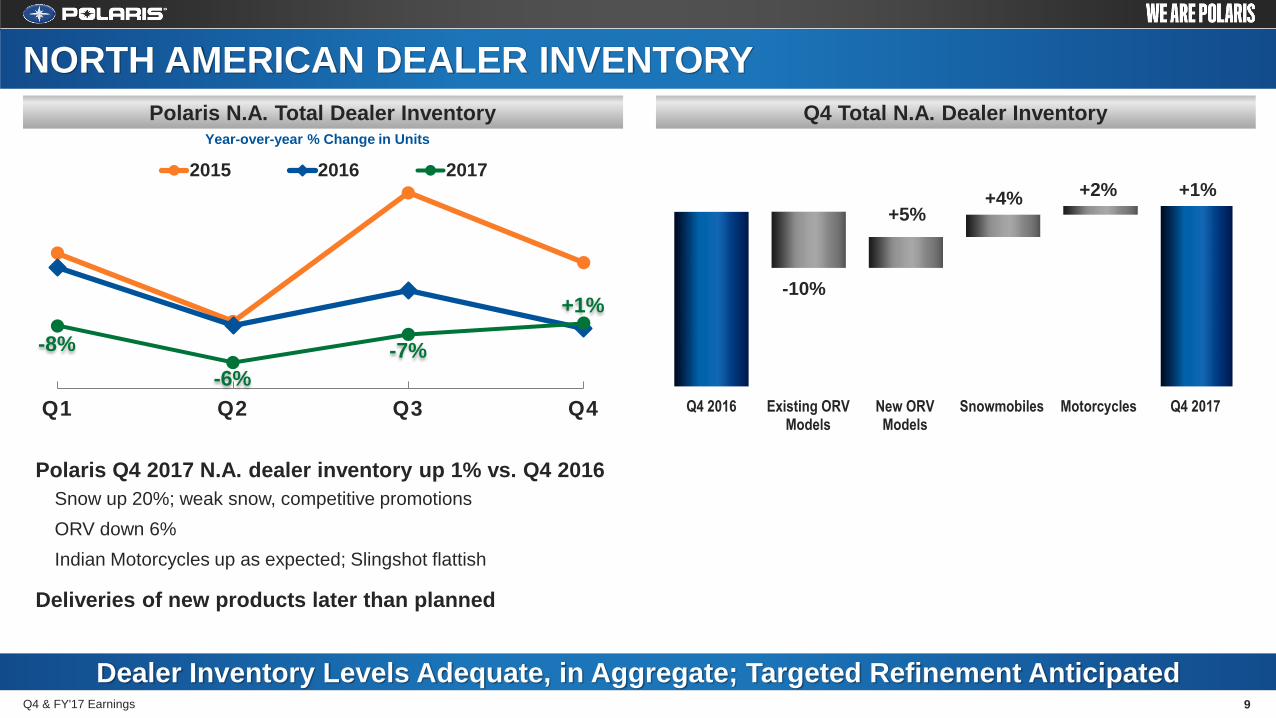
Polaris Q4 2017 N.A. dealer inventory up 1% vs. Q4 2016
Snow up 20%; weak snow, competitive promotions
ORV down 6%
Indian Motorcycles up as expected; Slingshot flattish
Deliveries of new products later than planned
Dealer Inventory Levels Adequate, in Aggregate; Targeted Refinement Anticipated
Q4 Total N.A. Dealer InventoryPolaris N.A. Total Dealer Inventory
NORTH AMERICAN DEALER INVENTORY
Q4 2016 Existing ORVModels
New ORVModels
Snowmobiles Motorcycles Q4 2017
+1%
Q4 & FY'17 Earnings 9
-6%
Year-over-year % Change in Units
-10%
+5%+4% +2%
-8% -7%
+1%

Welcome to Polaris!
Lucy Clark DoughertySVP – General Counsel
Effective January 29, 2018
Michael F. DonougheChief Technical Officer
Effective January 22, 2018
MANAGEMENT LEADERSHIP CHANGES
Two Strong Leaders: Executive Leadership Transition Complete
Eight year career with General Motors
Deputy GC for General Motors International, Autonomous Vehicles and Vehicles as a Service
Provided pivotal support for GM’s global growth strategy
First Chief Legal Officer for Dept. of Homeland Security
Part of core team that defined and established DHS
Nearly 30 years of automotive technology experience
Engineering, R&D, and senior management for Chrysler and Mercedes-Benz; EVP of Engineering, Mfg, Quality for Tesla
CEO of SINOEV Technologies, COO of Bright Automotive
Founding partner and principal of Third Shore Group
Venture capital firm specializing in clean energy development
Q4 & FY'17 Earnings 10

Improve Customer & Dealer RelationsProductivity Powerhouse
2018 FOCUS AREAS
Safety and Quality
Culture of Zero Defects
Improved Supplier Quality
Product Development Process 2.0
Improved Customer Feedback
Know our Consumer Better
Sales Force Realignment – CRM
Improve Dealer Profitability
Store layout, dealer training, on-time delivery, better communication, RFM, smarter promotions
Driven to Become a Highly Efficient Growth CompanyQ4 & FY'17 Earnings 12
Warranty
Down
Recalls
Down
Rework
Down
Claims
Down
Engineering
Mfg. / Logistics
Indirect Sourcing / SG&A
Strategic Sourcing

Mike Speetzen, EVP Finance & CFO
Fourth Quarter & Full Year 2017 Earnings Results
January 30, 2018
POLARIS INDUSTRIES INC.
Q4 2017 GAAP AND ADJUSTED* SALES AND INCOME
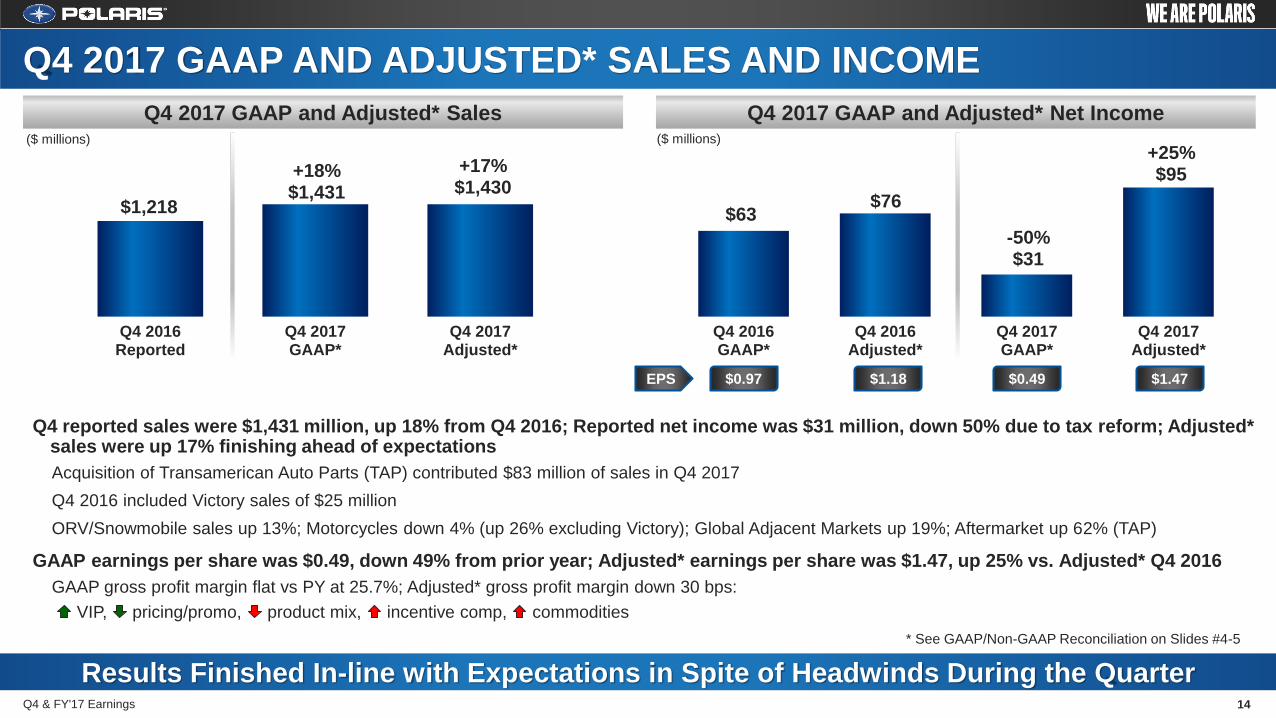
Q4 reported sales were $1,431 million, up 18% from Q4 2016; Reported net income was $31 million, down 50% due to tax reform; Adjusted* sales were up 17% finishing ahead of expectations
Acquisition of Transamerican Auto Parts (TAP) contributed $83 million of sales in Q4 2017
Q4 2016 included Victory sales of $25 million
ORV/Snowmobile sales up 13%; Motorcycles down 4% (up 26% excluding Victory); Global Adjacent Markets up 19%; Aftermarket up 62% (TAP)
GAAP earnings per share was $0.49, down 49% from prior year; Adjusted* earnings per share was $1.47, up 25% vs. Adjusted* Q4 2016
GAAP gross profit margin flat vs PY at 25.7%; Adjusted* gross profit margin down 30 bps:
VIP, pricing/promo, product mix, incentive comp, commodities
Results Finished In-line with Expectations in Spite of Headwinds During the Quarter
Q4 2017 GAAP and Adjusted* Net IncomeQ4 2017 GAAP and Adjusted* Sales
$1,218
+18%$1,431
+17%$1,430
Q4 2016Reported
Q4 2017GAAP*
Q4 2017Adjusted*
$63$76
-50%$31
+25%$95
Q4 2016GAAP*
Q4 2016Adjusted*
Q4 2017GAAP*
Q4 2017Adjusted*
($ millions)($ millions)
Q4 & FY'17 Earnings 14
* See GAAP/Non-GAAP Reconciliation on Slides #4-5
EPS $1.18$0.97 $0.49 $1.47

FY 2017 GAAP AND ADJUSTED* SALES AND INCOME
Full year 2017 reported sales were $5,428 million, up 20% from 2016; reported net income was $172 million, down 19% from prior year
as a result of tax reform adjustment for deferred taxes
Acquisition of Transamerican Auto Parts (TAP) added $685 million of sales in 2017
2016 includes Victory sales of $164 million
ORV/Snowmobile sales up 9%; Motorcycles down 18% (up 7% excl. Victory); Global Adjacent Markets up 16%; Aftermarket up significantly (TAP)
GAAP earnings per share was $2.69, down 18% from prior year; Adjusted* earnings per share was $4.85, up 39%
GAAP gross profit margin down 10 bps; Adjusted* gross profit margin up 120 bps: VIP, product mix, one-time warranty, promotions/pricing
Full Year Results Finished as Expected
FY 2017 GAAP and Adjusted* Net IncomeFY 2017 GAAP and Adjusted* Sales
$4,517
+20%$5,428
+20%$5,428
FY 2016Reported
FY 2017GAAP*
FY 2017Adjusted*
$213 $226 -19%$172
+37%$311
FY 2016GAAP*
FY 2016Adjusted*
FY 2017GAAP*
FY 2017Adjusted*
($ millions)($ millions)
Q4 & FY'17 Earnings 15
* See GAAP/Non-GAAP Reconciliation on Slides #4-5
EPS $3.48$3.27 $2.69 $4.85

FY 2017 ORV/Snow Segment Sales
OFF-ROAD VEHICLES (ORV) / SNOWMOBILES
Q4 2017 ORV/Snow Segment Sales
Q4 2016 Q4 2017
13%$1.0B
FY 2016 FY 2017
ORV up 13% in Q4 2017 vs. Q4 2016
Side-by-side and snow up significantly
PG&A up 9%
Average selling price for ORV up 4% in Q4’17; Snowmobiles down 3% due to
higher promotions
FY 2017 up 9% driven by all business categories
Increased Shipments in Q4 to Replenish Dealers After Strong Q3 ORV RetailQ4 & FY'17 Earnings 16
7%
13%
9%
$3.3B
ORV
PG&ASnow
ORV
PG&A
Snow
9%$3.6B
ORV
PG&ASnow
$0.9B
ORV
PG&ASnow
9%
11%
14%
% ∆
Reclassified(1)
(1) 2016 sales, for comparison purposes, have been reclassified to account for the new Aftermarket segment which included aftermarket brands previously reported in their respective segments
% ∆
Reclassified(1)
Q4 2016Reclassified
Q4 2017GAAP*
Q4 2017Adjusted*
FY 2016Reclassified
FY 2017GAAP*
FY 2017Adjusted*
FY 2017 Motorcycles Segment Sales
MOTORCYCLES
Q4 2017 Motorcycles Segment Sales
Q4 & FY'17 Earnings 17
$699
PG&A
PG&A PG&A
18%$574$576
VictoryIndian
Slingshot
VictoryIndian
Slingshot
IndianSlingshot
IndianSlingshot
(1)
($ millions) ($ millions)
flat
27%
4%$100
PG&A
$104
PG&A
IndianSlingshot
($ millions)
VictoryPG&A
IndianSlingshot
% ∆2%
$103
Victory
* See GAAP/Non-GAAP Reconciliation on Slides #4-5(1) 2016 sales, for comparison purposes, have been reclassified to account for the new Aftermarket segment which
included aftermarket brands previously reported in their respective segments
5%
5%
% ∆
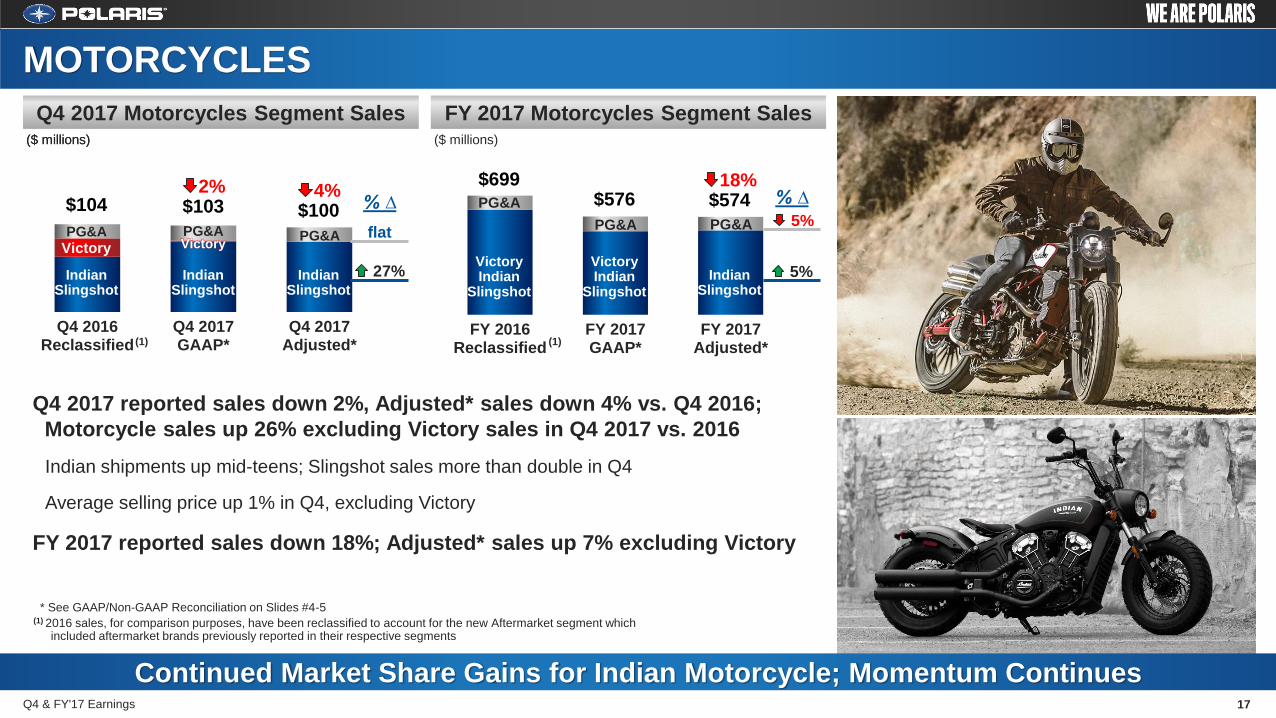
Q4 2017 reported sales down 2%, Adjusted* sales down 4% vs. Q4 2016;
Motorcycle sales up 26% excluding Victory sales in Q4 2017 vs. 2016
Indian shipments up mid-teens; Slingshot sales more than double in Q4
Average selling price up 1% in Q4, excluding Victory
FY 2017 reported sales down 18%; Adjusted* sales up 7% excluding Victory
Continued Market Share Gains for Indian Motorcycle; Momentum Continues
(1)
FY 2017 GAM Segment Sales
GLOBAL ADJACENT MARKETS (GAM)
Q4 2017 GAM Segment Sales
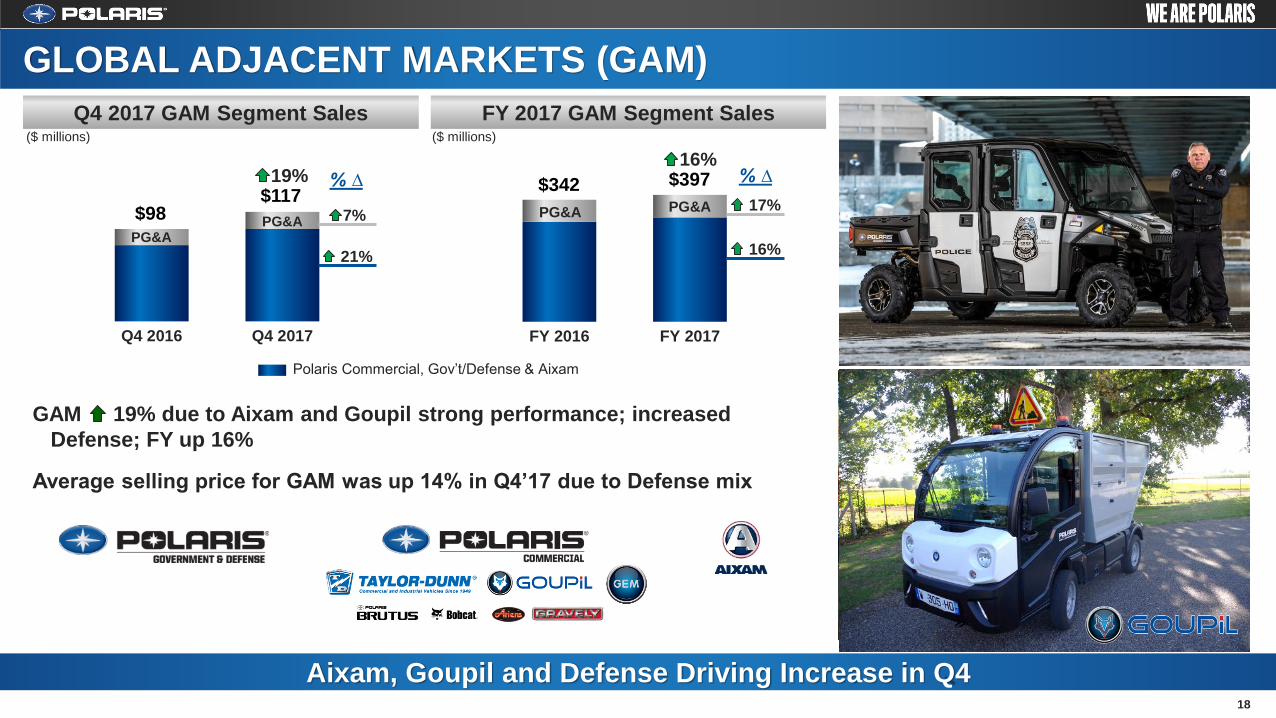
GAM 19% due to Aixam and Goupil strong performance; increased
Defense; FY up 16%
Average selling price for GAM was up 14% in Q4’17 due to Defense mix
Q4 & FY'17 Earnings
18
($ millions) ($ millions)
Q4 2016 Q4 2017 FY 2016 FY 2017
7%
21%
19%$117
PG&APG&A
% ∆ $342
PG&A PG&A
16%$397
17%
16%
% ∆
$98
Aixam, Goupil and Defense Driving Increase in Q4
Polaris Commercial, Gov’t/Defense & Aixam
FY 2017 Aftermarket Segment Sales
AFTERMARKET
Q4 2017 Aftermarket Segment Sales
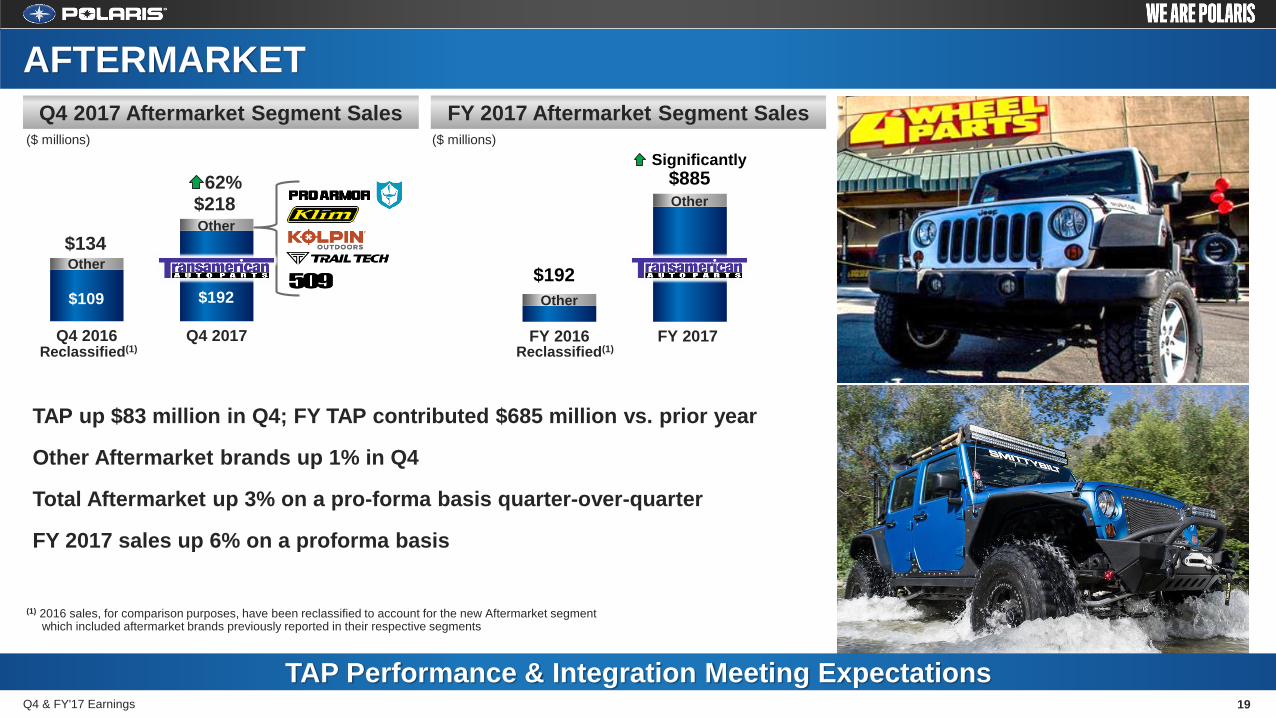
TAP up $83 million in Q4; FY TAP contributed $685 million vs. prior year
Other Aftermarket brands up 1% in Q4
Total Aftermarket up 3% on a pro-forma basis quarter-over-quarter
FY 2017 sales up 6% on a proforma basis
Q4 & FY'17 Earnings 19
($ millions) ($ millions)
Pics?
(1) 2016 sales, for comparison purposes, have been reclassified to account for the new Aftermarket segment which included aftermarket brands previously reported in their respective segments
$109
62%$218
Q4 2016 Q4 2017 FY 2016 FY 2017
$192
Other
Other
Significantly
$885
TAP
Reclassified(1)Reclassified(1)
$192
$134
TAP Performance & Integration Meeting Expectations
Other
Other

2018 FULL YEAR SALES & EPS GUIDANCE
Full Year Adjusted* EPS GuidanceFull Year Total Company Adjusted* Sales Guidance
Gross margin improves 40 to 60 bpsVIP savings, warranty
FX (assume 2017 avg. rates), Pricing/promotions
Product mix, commodities/investments
Operating expense $ up slightly; down 40 to 60 bps as a % of sales
Financial services flat to down slightly
Interest expense up due to rising interest rates
Tax rate ~23% vs. 30% 2017, tax reform
Share count up ~2% ~dilution impacts
2018 Adjusted* Sales & Earnings Guidance Aligned with Long-Term StrategyQ4 & FY'17 Earnings 20
($ millions)($ millions)
$5,428
+3% to +5%$5,600 to $5,700
FY 2017Sales
FY 2018Sales
Guidance
Powersports market expected flat to up slightly
Motorcycle share gains continue
ORV share stabilizing
$4.85
+24% to +28%$6.00 to $6.20
FY 2017EPS
FY 2018EPS
Guidance
* See slide 3 for discussion regarding non-GAAP adjustments excluded from 2018 guidance
AftermarketORV/Snowmobiles
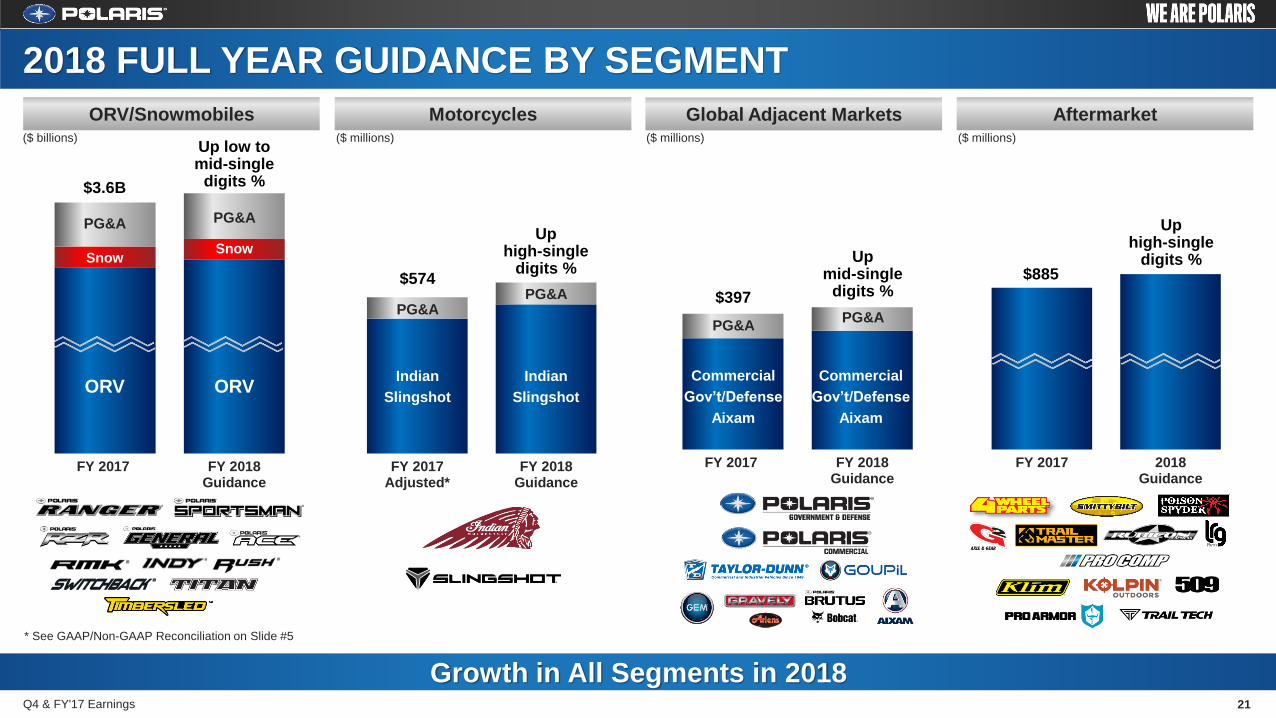
Growth in All Segments in 201821Q4 & FY'17 Earnings
2018 FULL YEAR GUIDANCE BY SEGMENT
Global Adjacent MarketsMotorcycles
FY 2017 FY 2018Guidance
FY 2017Adjusted*
FY 2018Guidance
FY 2017 FY 2018Guidance
FY 2017 2018Guidance
Up low tomid-single
digits %$3.6B
ORV
PG&A
Snow
ORV
PG&A
Snow
PG&A
$574
Indian
Slingshot
PG&A
Up high-single
digits %
Indian
Slingshot
PG&APG&A
Commercial
Gov’t/Defense
Aixam
Up mid-single
digits %$397
Up high-single
digits %$885
($ millions) ($ millions) ($ millions)($ billions)
* See GAAP/Non-GAAP Reconciliation on Slide #5
Commercial
Gov’t/Defense
Aixam
GROSS PROFIT MARGIN GUIDANCE
Adjusted* Gross Profit 2018 GuidanceGross Margin FY 2017
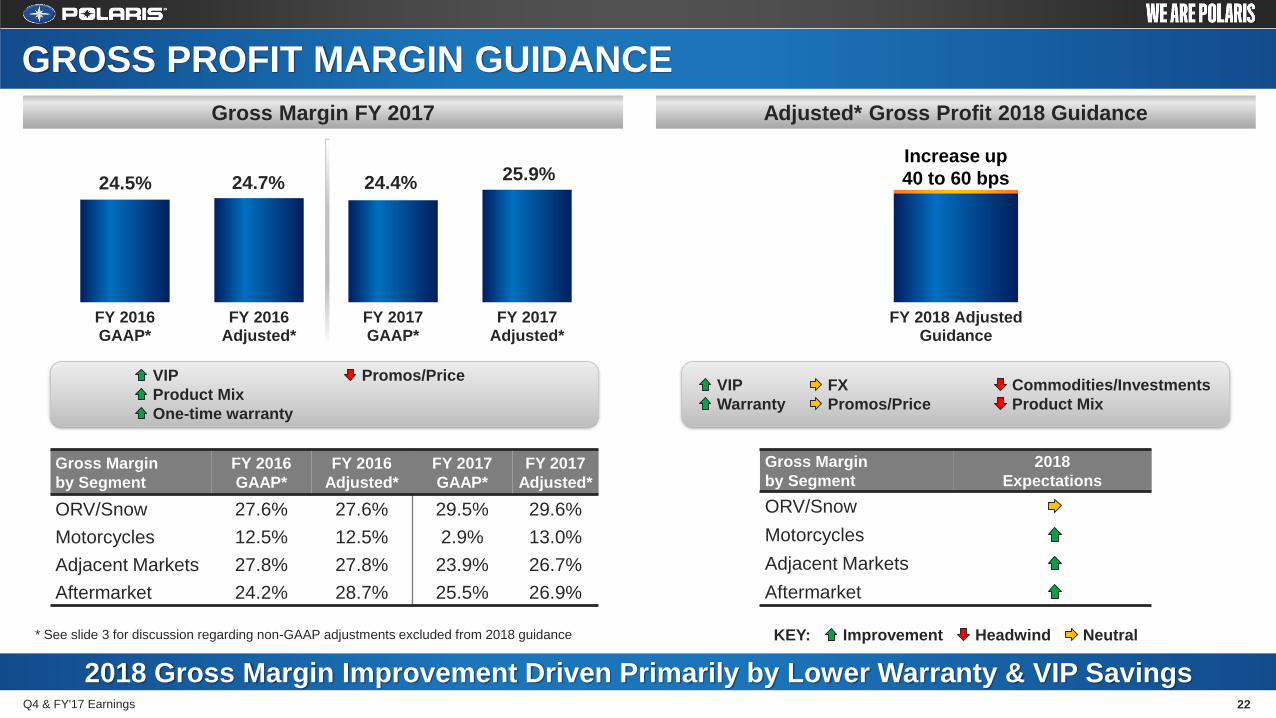
2018 Gross Margin Improvement Driven Primarily by Lower Warranty & VIP SavingsQ4 & FY'17 Earnings 22
KEY: Improvement Headwind Neutral* See slide 3 for discussion regarding non-GAAP adjustments excluded from 2018 guidance
24.5% 24.7% 24.4% 25.9%
FY 2016GAAP*
FY 2016Adjusted*
FY 2017GAAP*
FY 2017Adjusted*
FY 2018 AdjustedGuidance
Increase up
40 to 60 bps
VIP
Product Mix
One-time warranty
Promos/PriceVIP
Warranty
FX
Promos/Price
Commodities/Investments
Product Mix
Gross Margin
by Segment
FY 2016
GAAP*
FY 2016
Adjusted*
FY 2017
GAAP*
FY 2017
Adjusted*
ORV/Snow 27.6% 27.6% 29.5% 29.6%
Motorcycles 12.5% 12.5% 2.9% 13.0%
Adjacent Markets 27.8% 27.8% 23.9% 26.7%
Aftermarket 24.2% 28.7% 25.5% 26.9%
Gross Margin
by Segment
2018
Expectations
ORV/Snow
Motorcycles
Adjacent Markets
Aftermarket

$572+1%$580
FY 2016 FY 2017 2018
2017 ENDING & 2018 FINANCIAL POSITION EXPECTATIONS
23Q4 & FY'17 Earnings
Capital Summary December 2017Cash Drivers
Variance to
December 2016
Cash $ 138 +9%
Debt /Capital Lease Obligations $ 913 -20%
Shareholders’ Equity $ 932 +7%
Total Capital $1,845 -8%
Debt to Total Capital 49% -8% points
Operating cash flow up slightly
Factory inventory down sequentially from Q3; up 5% vs. 2016
Cap Ex expected higher than 2017; distribution/tooling
Operating cash flow expected lower; timing of accrual payments
and higher working capital requirements
Operating Cash Flow
Cash Flow and Net Debt Improving – Strong Financial Position Ongoing
CashYE 2016
OperatingActivities
Dividends Capex Net Debt ShareRepurchase
Other CashYE 2017
$127 $138
($ millions) ($ millions)
($ millions)
FY 2017 Summary
FY 2018 Expectations
Down
about 10%
Expectations
+$580
-$145
-$184
-$235-$90
+$85

Scott W. Wine, Chairman & CEO
Fourth Quarter & Full Year 2017 Earnings Results
January 30, 2018
POLARIS INDUSTRIES INC.
25Q4 & FY'17 Earnings
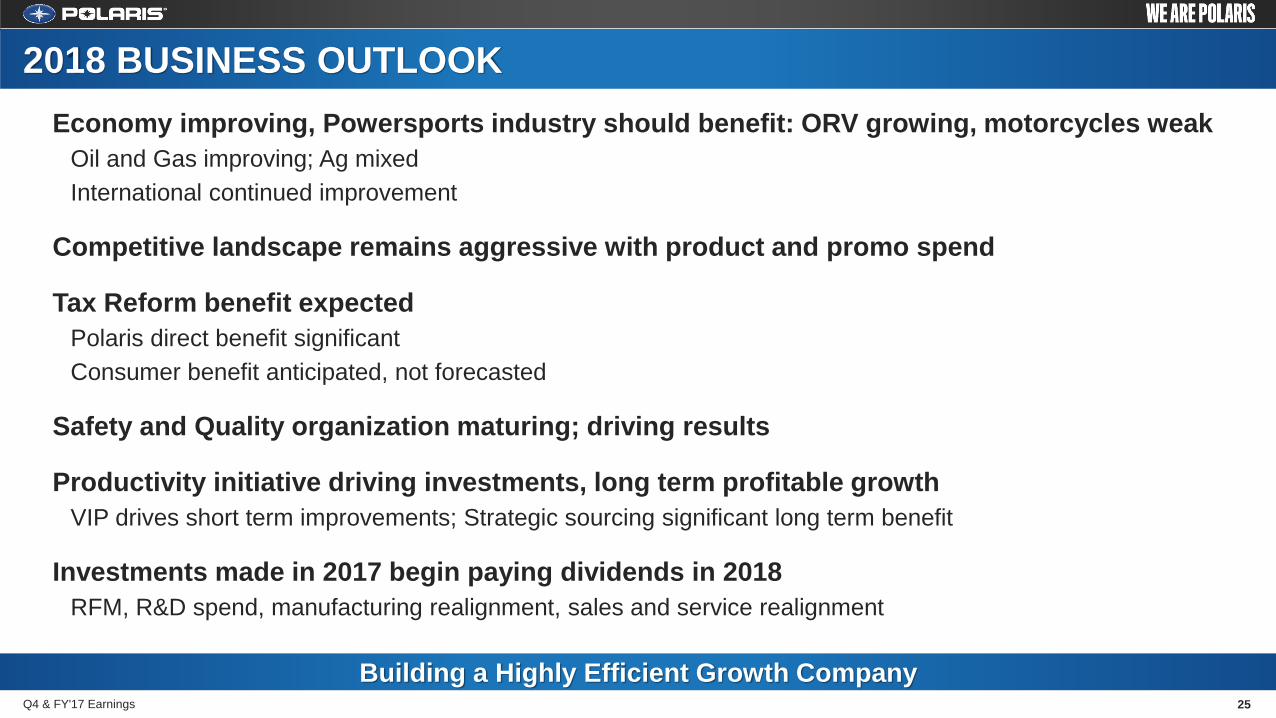
2018 BUSINESS OUTLOOK
Building a Highly Efficient Growth Company
Economy improving, Powersports industry should benefit: ORV growing, motorcycles weak
Oil and Gas improving; Ag mixed
International continued improvement
Competitive landscape remains aggressive with product and promo spend
Tax Reform benefit expected
Polaris direct benefit significant
Consumer benefit anticipated, not forecasted
Safety and Quality organization maturing; driving results
Productivity initiative driving investments, long term profitable growth
VIP drives short term improvements; Strategic sourcing significant long term benefit
Investments made in 2017 begin paying dividends in 2018
RFM, R&D spend, manufacturing realignment, sales and service realignment

Thank You
Questions?
POLARIS INDUSTRIES INC.

APPENDIX
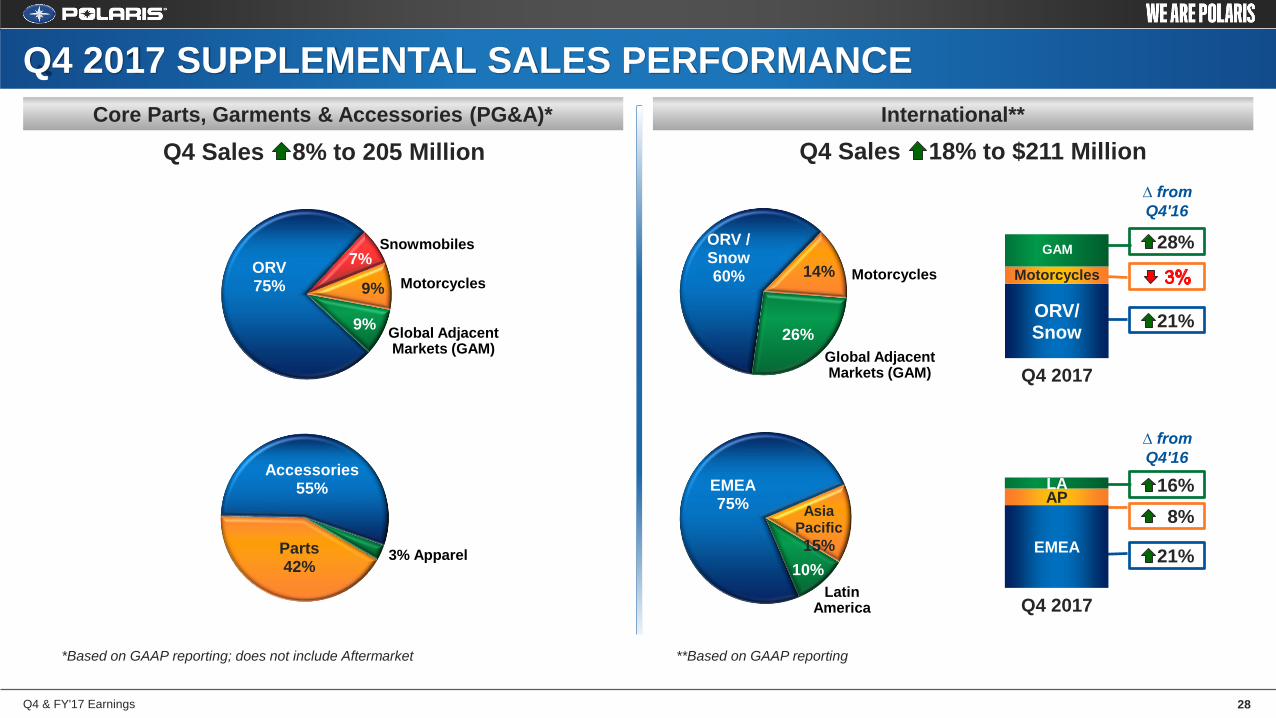
Q4 2017 SUPPLEMENTAL SALES PERFORMANCE (PG&A / INTERNATIONAL)
Q4 2016 & 2017 INCOME FROM FINANCIAL SERVICES
Q4 & FY'17 Earnings 27
ORV/Snow
Motorcycles
GAM
Q4 2017
ORV75%
7%
9%
9%
ORV / Snow60% 14%
26%
Parts42%
Accessories55%
10%
EMEA75% Asia
Pacific
15% EMEA
APLA
Q4 2017
International**Core Parts, Garments & Accessories (PG&A)*
28Q4 & FY'17 Earnings
Q4 2017 SUPPLEMENTAL SALES PERFORMANCE
Motorcycles
Global Adjacent Markets (GAM)
Snowmobiles
Motorcycles
Global Adjacent Markets (GAM)
3% Apparel
LatinAmerica
28%
16%
8%
21%
21%
Q4 Sales 8% to 205 Million Q4 Sales 18% to $211 Million
∆ from
Q4'16
∆ from
Q4'16
*Based on GAAP reporting; does not include Aftermarket **Based on GAAP reporting

Retail CreditWholesale Credit PA Receivables
29Q4 & FY'17 Earnings
Income from Financial Services
Other Other
WholesaleCredit
Q4 2016 Q4 2017 Q4 2016 Q4 2017
Portfolio Remains Healthy
Q4 2016 & 2017 INCOME FROM FINANCIAL SERVICES
Polaris Acceptance (PA) receivables down, trending with dealer inventory
Q4 income from financial services down – lower wholesale credit offset slightly by higher retail income
FY 2018 Guidance: Income from Financial Services flat to down slightly
$194%
$19 1%
$1,193$1,207
($ millions) ($ millions)
32% 32%
Q4 2016 Q4 2017
Approval Rate Penetration Rate
Wholesale
Credit
Retail
Financing
Retail
Financing
63% 63%
Q4 2016 Q4 2017

30Q4 & FY'17 Earnings
Related Documents