Fourth Quarter 2016 Earnings Conference Call March 30, 2017

Welcome message from author
This document is posted to help you gain knowledge. Please leave a comment to let me know what you think about it! Share it to your friends and learn new things together.
Transcript

Fourth Quarter 2016Earnings Conference Call
March 30, 2017
Disclaimer
BY READING THIS PRESENTATION, YOU ARE DEEMED TO HAVE READ AND ACCEPTED THE STATEMENT BELOW.
This presentation has been prepared by Nomad Foods Limited. This presentation provides information about Nomad Foods Limited and its subsidiaries. Any references to Nomad shall mean Nomad Foods Limited and its subsidiaries.
While Nomad takes reasonable care to ensure the accuracy of the information in this presentation, to the extent permitted by law, it makes no representation or warranty, express or implied, of its accuracy or completeness. This presentation has not been the subject of an audit or a similar investigation. Nomad shall not be held responsible for any direct or indirect losses, damages or liabilities of whatsoever kind arising from the access to, the use of or reliance on this presentation or any of the information it contains. Nomad reserves the right to change, delete or move any of the material in this presentation at any time without notice. The information contained in this presentation should not be deemed accurate or current except as of the date of issue. Nomad does not intend to, and does not undertake any duty to, update or correct such information.
This presentation may contain financial information regarding the businesses and assets of Nomad and such financial information may not have been audited, reviewed or verified by any independent accounting firm. In addition, this presentation may include information pertaining to Nomad’s markets and its competitive positions therein; such information is based on management estimates. It is not the intention to provide, and you may not rely on these materials as providing, a complete or comprehensive analysis of Nomad’s financial or trading position or prospects. Any use of this presentation by you for any purpose whatsoever will be entirely at your own risk.
This presentation may include projections, estimates, forecasts, targets, prospects, statements and/or opinions with respect to the anticipated future performance of Nomad. Such projections, estimates, forecasts, targets, prospects, statements and/or opinions reflect significant assumptions and subjective judgments by Nomad’s management concerning anticipated results. These assumptions and judgments may or may not prove to be correct and there can be no assurance that any projections, estimates, forecasts, targets or prospects are attainable or will be realized. Accordingly, neither Nomad nor any of their respective directors, partners, employees or advisers nor any other person, shall give any representation or warranty as to achievements or reasonableness of future projections, estimates, forecasts, targets or prospects, nor will they be liable for any direct, indirect or consequential loss or damage suffered by any person as a result of relying on any statement or opinion in, or omission from, this presentation and any such liability is expressly disclaimed. Past results are no indication as to future performance.
Certain statements in this presentation are forward-looking statements which are based on the Company's expectations, intentions and projections regarding its future performance, anticipated events or trends and other matters that are not historical facts, including expectations regarding (i) the Company’s ability to expand its presence in the frozen foods market; (ii) the success of the Company’s strategic initiatives; (iii) completion of successful acquisitions in the same and adjacent categories; (iv) the future operating and financial performance of the Company; (v) synergies from combining the Findus and Iglo businesses and (vi) the success of the unified Findus brand. These statements are not guarantees of future performance and are subject to known and unknown risks, uncertainties and other factors that could cause actual results to differ materially from those expressed or implied by such forward-looking statements, including (i) economic conditions, competition and other risks that may affect the Company's future performance; (ii) the risk that securities markets will react negatively to actions by the Company; (iii) the ability to recognize the anticipated benefits to the Company of strategic opportunities; (iv) the successful completion of strategic acquisitions; (v) changes in applicable laws or regulations; and (vi) the other risks and uncertainties disclosed in the Company’s public filings and any other public disclosures by the Company. Given these risks and uncertainties, prospective investors are cautioned not to place undue reliance on forward-looking statements. Forward-looking statements speak only as of the date of such statements and, except as required by applicable law, the Company does not undertake any obligation to update or revise publicly any forward-looking statements, whether as a result of new information, future events or otherwise.
This presentation may contain information from other sources which are not controlled or maintained by Nomad. Nomad is not responsible for the accuracy of this information. The information contained in this presentation is not intended to be and shall not be deemed to be an offer, invitation or inducement to invest in or otherwise deal in any securities of Nomad or in any other investment, nor to provide or constitute any advice or recommendation in connection with any investment decision.
This presentation is not directed to, or intended for distribution to, directly or indirectly, or use by, any person or entity that is a citizen or resident or located in any locality, state, country or other jurisdiction where such distribution, publication, availability or use would be contrary to law or regulation or which would require any registration, licensing or other permission within such jurisdiction. If you require advice, please consult your independent professional financial adviser.
Nomad Foods also utilizes certain additional key performance indicators described within this presentation including, but not limited to, EBITDA, As Adjusted EBITDA, As Adjusted EBITDA margin, As Adjusted operating profit, As Adjusted (loss)/profit before tax, As Adjusted (loss)/profit for the period, As Adjusted basic and diluted earnings per share, revenue adjusted for certain items, including like-for-like adjustments, advertising and promotions adjusted for certain item, including like-for-like adjustments, indirects adjusted for certain items, including like-for-like adjustments, Pro Forma As Adjusted financial information, As Adjusted operating cash flow before tax and Pro Forma As Adjusted operating cash flow before tax that are non-IFRS financial measures. Nomad Foods believe these non-IFRS financial measures provide an important alternative measure with which to monitor and evaluate the Company’s ongoing financial results, as well as to reflect its acquisitions. Nomad Foods’ calculation of these financial measures may be different from the calculations used by other companies and comparability may therefore be limited. You should not consider the Company’s non-IFRS financial measures an alternative or substitute for the Company’s reported results.
The copyright in this presentation belongs to Nomad. All other intellectual property rights are reserved.
2

Stabilize Topline Trends● 4Q16 like-for-like sales decline of 2.7%
● 5th consecutive quarter of sequential topline improvement
● “Must Win Battles” strategy is working with related sales inflecting positive 1.2% in 4Q16
● Momentum into 2017 with 1Q like-for-like sales growth expected to move into positive territory
Realize Synergies from the Findus Acquisition● €12 million run-rate synergies delivered as of 2016
● Remain on track to deliver €43-48 million annualized synergies by 2018
Generate Strong Cash Flow to Drive Consolidation within the Global Food Industry● Continue to view strategic acquisitions as the best use of excess capital
● Enter 2017 with a stronger operational foundation to support future acquisitions
● Exceeded our target of €200 million adjusted free cash flow in 2016
2016 Highlights
3

What are “Must Win Battles”?● A strategic cross-portfolio evaluation resulting in
redirected resources to our most scalable sub-categories
● Key “Must Win Battles” criteria include market share,
gross margin, growth potential and ROI
● A renewed focus on core products and local brand icons
● Examples include Fish Fingers, Spinach and Peas
● 360 degree activation through a coordination of product
innovation, packaging renovation, in-store execution and
media
● First major wave of activations began in 3Q16
Evidence of Progress Entering 2017● Sales from “Must Win Battles” products represented 67%
of Nomad Foods sales in 2016
● Related sales grew 1.2% in 4Q16, the first positive
inflection
● A meaningful number of activations still to come in 1H17
“Must Win Battles” Are Working
4

“Must Win Battles” Success Stories
Fish Fingers
Fish Fingers was one of the first “Must Win Battles”
launched across a number of markets
360 degree activation: return of highly effective
“Captain” advertising, product innovation (“Gluten
Free”, “Crispier Crumb”), upgraded packaging and
revised promotional tactics
4Q16 Fish Finger like-for-like sales grew 6.2%, a third
consecutive quarter of growth
Spinach
Spinach was activated in Germany, Austria and the
Netherlands in 4Q16, resulting in a return to YoY
growth
4Q16 Spinach like-for-like growth inflected into positive
territory, up 1.7%
Revival of this core category demonstrates the impact of
“Must Win Battles”
5

Our Strategic Vision
Our Goal
Transform Nomad into a Leading Global
Consumer Foods Company
Operational ExcellenceCatalyze organic topline growth
through “Must Win Battles” while managing operating
expenses with a disciplined, ZBB-based philosophy
Global Growth Across FoodPursue acquisition opportunities that expand our geographic footprint into
the US market and our category reach outside of frozen
Consolidate FrozenContinue to seek bolt-on
acquisitions to complete our consolidation of the European
frozen food category
6

(1.5%) (0.8%)
(5.4%)
(8.0%)(7.0%)
(6.1%)
(3.8%) (3.3%) (2.7%)
4Q2013
1Q 2014
2Q 2014
3Q 2014
4Q 2014
1Q 2015
2Q 2015
3Q 2015
4Q 2015
1Q 2016
2Q 2016
3Q 2016
4Q 2016
1Q 2017
2Q 2017
3Q 2017
4Q 2017
7
Food of Life Pan-European Ad Campaign Launch
New Packaging
Launch
NPD Strategy Launches
Cost Review
Like-for-Like Net Sales Growth
Quarterly Like-for-Like Net Sales
Pre-Nomad Strategy New Strategic Direction
Annual Negotiations
Promo Changes
Renovation LaunchesRefreshed
Advertising
Strategic Review
Revenue Mgmt.
Annual Negotiations
New Advertising
5 Consecutive Quarters of Sequential Improvement
1Q17 and 2017 like-for-like sales are expected to be positive

4Q16 Revenue Bridge
1) For comparative purposes, Nomad Foods is also presenting Pro Forma As Adjusted financial information for the three months ended December 31, 2015. Pro Forma As Adjusted financial information for the three months ended December 31, 2015 includes the reported results of Nomad Foods for such period, which includes the results of the acquired Findus Group from November 2, 2015. The Findus Group results for the one month ended October 31, 2015 have been derived using unaudited carve-out financial information prepared by the Seller and adjusted for information received post-acquisition relating to the pre-acquisition period, as set out in Appendix 3. The Pro Forma As Adjusted results for the three months ended December 31, 2015 have been normalized for transaction-related items, share based payment charges, exceptional items, foreign currency translation charges/gains and taxation
Like-for-Like Revenue: (2.7%)
1)
8
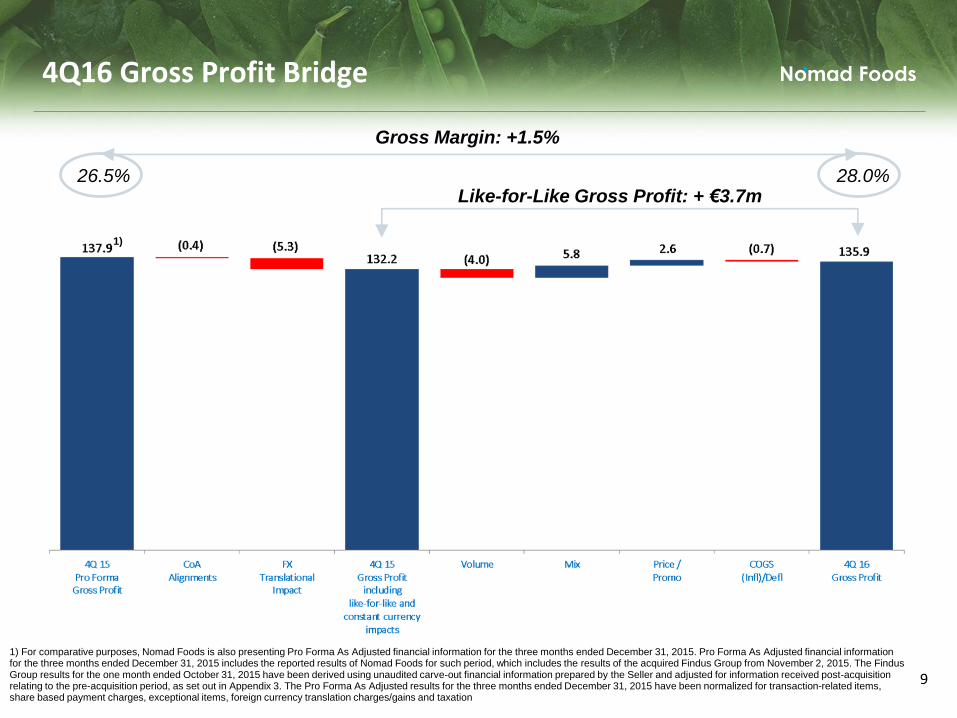
4Q16 Gross Profit Bridge
9
26.5% 28.0%
Gross Margin: +1.5%
1)
Like-for-Like Gross Profit: + €3.7m
9
1) For comparative purposes, Nomad Foods is also presenting Pro Forma As Adjusted financial information for the three months ended December 31, 2015. Pro Forma As Adjusted financial information for the three months ended December 31, 2015 includes the reported results of Nomad Foods for such period, which includes the results of the acquired Findus Group from November 2, 2015. The Findus Group results for the one month ended October 31, 2015 have been derived using unaudited carve-out financial information prepared by the Seller and adjusted for information received post-acquisition relating to the pre-acquisition period, as set out in Appendix 3. The Pro Forma As Adjusted results for the three months ended December 31, 2015 have been normalized for transaction-related items, share based payment charges, exceptional items, foreign currency translation charges/gains and taxation

€m, except per share data 4Q 16 4Q 15 Delta
Revenue 485.2 520.8 -35.6
Gross Profit 135.9 137.9 -2.0
Gross profit margin (%) 28.0% 26.5% 1.5%
Advertising & Promotions -37.3 -26.9 -10.4
Advertising &Promotions (% Revenue) 7.7% 5.2% 2.5%
Indirects -49.8 -52.3 2.5
Indirects (% Revenue) -10.3% -10.0% -0.3%
Depreciation & Amortization 13.3 12.5 0.8
As Adjusted EBITDA 62.1 71.2 -9.1
Adj EBITDA margin (%) 12.8% 13.7% -0.9%
Depreciation & Amortization -13.3 -12.5 -0.8
As Adjusted Net Financing Costs -18.3 -18.8 0.5
As Adjusted Taxation -6.9 -9.4 2.5
As Adjusted Profit 23.6 30.5 -6.9
As Adjusted Basic & Diluted EPS, € 0.13 0.17 -0.04
4Q16 Operating Performance
1)
10
1) For comparative purposes, Nomad Foods is also presenting Pro Forma As Adjusted financial information for the three months ended December 31, 2015. Pro Forma As Adjusted financial information for the three months ended December 31, 2015 includes the reported results of Nomad Foods for such period, which includes the results of the acquired Findus Group from November 2, 2015. The Findus Group results for the one month ended October 31, 2015 have been derived using unaudited carve-out financial information prepared by the Seller and adjusted for information received post-acquisition relating to the pre-acquisition period, as set out in Appendix 3. The Pro Forma As Adjusted results for the three months ended December 31, 2015 have been normalized for transaction-related items, share based payment charges, exceptional items, foreign currency translation charges/gains and taxation

2016 Revenue Bridge
1) For comparative purposes, Nomad Foods is also presenting Pro Forma As Adjusted financial information for the twelve months ended December 31, 2015 for the combined results of Nomad Foods, the Iglo Group and the Findus Group. Pro Forma As Adjusted financial information for the twelve months ended December 31, 2015 includes the reported results of Nomad Foods for such period (which includes the results of the Iglo Group from June 1, 2015 and the Findus Group from November 2, 2015) and have had (i) the reported results of the Iglo Group for the five months ended May 31, 2015 added to them; (ii) the unaudited consolidated carve out results of the Findus Group for the ten months ended October 31, 2015 added to them, as set out in Appendix 4. The Pro Forma As Adjusted results for the twelve months ended December 31, 2015 have been normalised for the differential in trading days (excluding the additional day for the leap year in 2016) between year-on-year periods, share based payment charges, transaction-related items, exceptional items, foreign currency translation charges/gains and taxation.
Like-for-Like Revenue: (4.0%)
1)
11
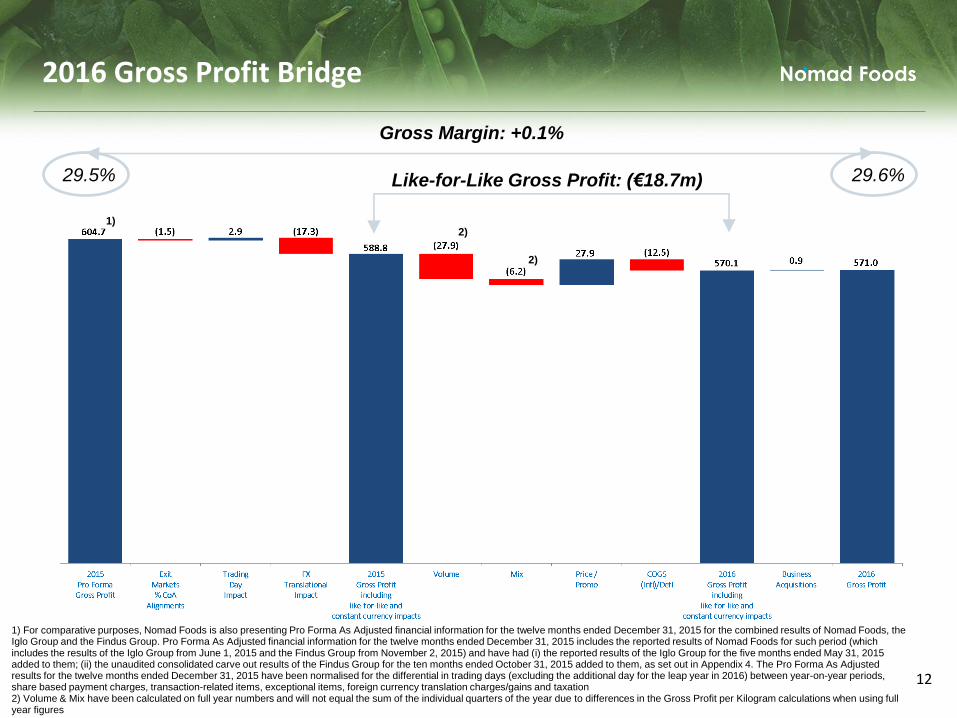
2016 Gross Profit Bridge
12
29.5% 29.6%
Gross Margin: +0.1%
1)
Like-for-Like Gross Profit: (€18.7m)
2)
2)
12
1) For comparative purposes, Nomad Foods is also presenting Pro Forma As Adjusted financial information for the twelve months ended December 31, 2015 for the combined results of Nomad Foods, the Iglo Group and the Findus Group. Pro Forma As Adjusted financial information for the twelve months ended December 31, 2015 includes the reported results of Nomad Foods for such period (which includes the results of the Iglo Group from June 1, 2015 and the Findus Group from November 2, 2015) and have had (i) the reported results of the Iglo Group for the five months ended May 31, 2015 added to them; (ii) the unaudited consolidated carve out results of the Findus Group for the ten months ended October 31, 2015 added to them, as set out in Appendix 4. The Pro Forma As Adjusted results for the twelve months ended December 31, 2015 have been normalised for the differential in trading days (excluding the additional day for the leap year in 2016) between year-on-year periods, share based payment charges, transaction-related items, exceptional items, foreign currency translation charges/gains and taxation2) Volume & Mix have been calculated on full year numbers and will not equal the sum of the individual quarters of the year due to differences in the Gross Profit per Kilogram calculations when using full year figures

€m, except per share data 2016 2015 Delta
Revenue 1,927.7 2,051.7 -124.0
Gross Profit 571.0 604.7 -33.7
Gross profit margin (%) 29.6% 29.5% 0.1%
Advertising & Promotions -113.7 -120.1 6.4
Advertising &Promotions (% Revenue) 5.9% 5.9% 0.0%
Indirects -183.5 -204.0 20.5
Indirects (% Revenue) -9.5% -9.9% 0.4%
Depreciation & Amortization 51.1 51.1 0.0
As Adjusted EBITDA 324.9 331.7 -6.8
Adj EBITDA margin (%) 16.9% 16.2% 0.7%
Depreciation & Amortization -51.1 -51.1 0.0
As Adjusted Net Financing Costs -73.3 -75.2 1.9
As Adjusted Taxation -45.6 -47.3 1.7
As Adjusted Profit 154.9 158.1 -3.2
As Adjusted Basic & Diluted EPS, € 0.84 0.88 -0.04
2016 Operating Performance
1)
13
1) For comparative purposes, Nomad Foods is also presenting Pro Forma As Adjusted financial information for the twelve months ended December 31, 2015 for the combined results of Nomad Foods, the Iglo Group and the Findus Group. Pro Forma As Adjusted financial information for the twelve months ended December 31, 2015 includes the reported results of Nomad Foods for such period (which includes the results of the Iglo Group from June 1, 2015 and the Findus Group from November 2, 2015) and have had (i) the reported results of the Iglo Group for the five months ended May 31, 2015 added to them; (ii) the unaudited consolidated carve out results of the Findus Group for the ten months ended October 31, 2015 added to them, as set out in Appendix 4. The Pro Forma As Adjusted results for the twelve months ended December 31, 2015 have been normalised for the differential in trading days (excluding the additional day for the leap year in 2016) between year-on-year periods, share based payment charges, transaction-related items, exceptional items, foreign currency translation charges/gains and taxation.

Key Cash Flow Metrics
1) All 2015 figures are Pro Forma/Pro Forma As Adjusted.2) 2015 pro forma information has been calculated based on the charge to the Statement of Profit or Loss. The methodology differs to that used in Q2 2016. The year to date cash flow of €90.1 million shown in Q2 2016 would be restated to €51.9 million under this new methodology.3) Calculated as the sum of financing costs paid less financing income received.4) Calculated as As Adjusted Operating cash flow (excl. Tax) divided by As Adjusted EBITDA in 2016 and Pro Forma As Adjusted EBITDA in 2015.5) One-off capital expenditure directly related to the Findus integration.
14
€m 2016 2015(1) Delta
As Adjusted EBITDA 324.9 331.7 (6.8)
Loss on disposal of property, plant & equipment 0.7 0.1 0.6
Working Capital movement 33.9 (26.0) 59.9
Pensions & Other Provisions movements (3.3) (6.8) 3.5
Capital Expenditure (42.4) (53.4) 11.0
As Adjusted Operating Cash flow (excl. Tax) 313.8 245.6 68.2
Tax Paid (24.9) (32.5) 7.6
As Adjusted Operating Cash flow 288.9 213.1 75.8
Restructuring & Non-Recurring (2) (49.2) (100.6) 51.4
Contingent consideration for purchase of Frudesa brand (8.0) - (8.0)
As Adjusted Cash flow available for Debt Servicing 231.7 112.5 119.2
Net Interest & Other Financing Costs paid (3) (67.7) (64.8) (2.9)
As Adjusted Cash flow available for Debt Repayment 164.0 47.7 116.3
As Adjusted Operating Cash flow Conversion (4) 96.6% 74.0%
As Adjusted Operating Cash flow 288.9 213.1 75.8
Net Interest & Other Financing Costs paid (67.7) (64.8) (2.9)
Add back Findus Integration Capital Expenditure (5) 2.6 - 2.6
As Adjusted Free Cash flow 223.8 148.3 75.5
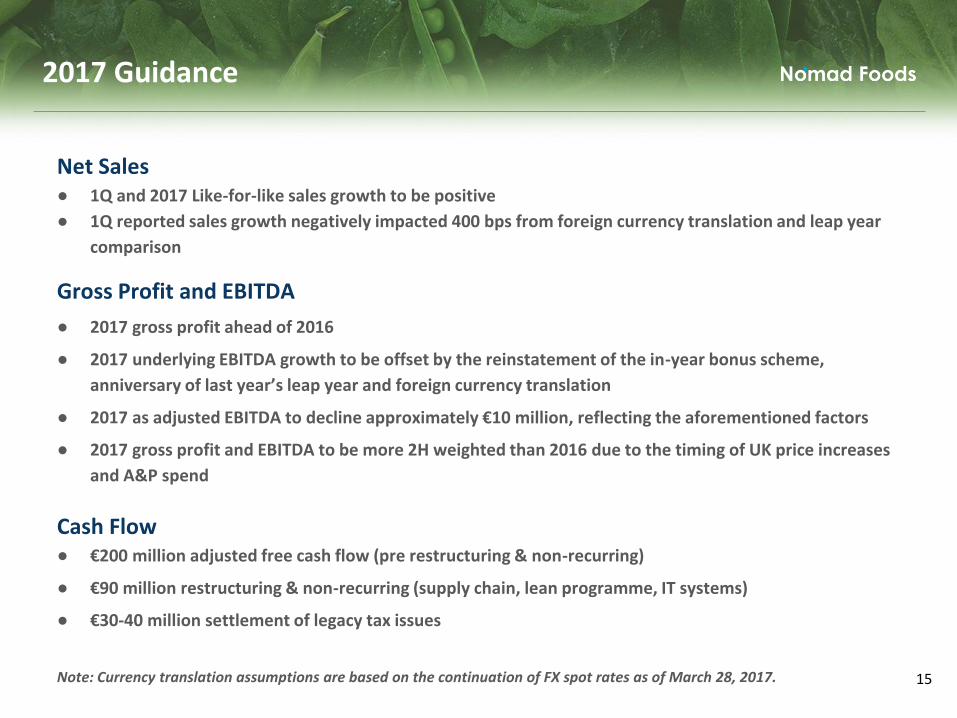
Net Sales● 1Q and 2017 Like-for-like sales growth to be positive
● 1Q reported sales growth negatively impacted 400 bps from foreign currency translation and leap year
comparison
Gross Profit and EBITDA
● 2017 gross profit ahead of 2016
● 2017 underlying EBITDA growth to be offset by the reinstatement of the in-year bonus scheme,
anniversary of last year’s leap year and foreign currency translation
● 2017 as adjusted EBITDA to decline approximately €10 million, reflecting the aforementioned factors
● 2017 gross profit and EBITDA to be more 2H weighted than 2016 due to the timing of UK price increases
and A&P spend
Cash Flow● €200 million adjusted free cash flow (pre restructuring & non-recurring)
● €90 million restructuring & non-recurring (supply chain, lean programme, IT systems)
● €30-40 million settlement of legacy tax issues
Note: Currency translation assumptions are based on the continuation of FX spot rates as of March 28, 2017.
2017 Guidance
15

Stabilize Topline Trends● 4Q16 like-for-like sales decline of 2.7%
● 5th consecutive quarter of sequential topline improvement
● “Must Win Battles” strategy is working with related sales inflecting positive 1.2% in 4Q16
● Momentum into 2017 with 1Q like-for-like sales growth expected to move into positive territory
Realize Synergies from the Findus Acquisition● €12 million run-rate synergies delivered as of 2016
● Remain on track to deliver €43-48 million annualized synergies by 2018
Generate Strong Cash Flow to Drive Consolidation within the Global Food Industry● Continue to view strategic acquisitions as the best use of excess capital
● Enter 2017 with a stronger operational foundation to support future acquisitions
● Exceeded our target of €200 million adjusted free cash flow in 2016
2016 Highlights
16

Questions?
17

Appendix
18

The following tables have been included to allow users to reconcile non-IFRS financial information as well as As Adjusted and Pro Forma AsAdjusted financial information included within this presentation to reported IFRS financial information.
1. Definitions of all key terms and P&L measures referred to in this presentation.
2. Constant Currency reconciliations for the three months ended December 31, 2015 and December 31, 2016 and the 12 months endedDecember 31, 2015 and December 31, 2016.
3. Reconciliation of reported to Pro Forma As Adjusted financial information for the three months ended December 31, 2015.
4. Reconciliation of reported to Pro Forma As Adjusted financial information for the twelve months ended December 31, 2015.
5. Reconciliation of reported to As Adjusted financial information for the three months ended December 31, 2016.
6. Reconciliation of reported to As Adjusted financial information for the twelve months ended December 31, 2016.
7. Reconciliation of reported net cash flows from operating activities to As Adjusted Operating Cash flow (excl. tax) for the year endedDecember 31, 2016.
8. Reconciliation of reported net cash flows from operating activities to Pro Forma As Adjusted Operating Cash flow (excl. tax), Pro Forma AsAdjusted Operating Cash flow, Pro Forma As Adjusted Cash flow available for Debt Servicing, and, Pro Forma As Adjusted Cash flowavailable for Debt Repayment for the year ended December 31, 2015.
9. Reconciliations of reported cash flow detail line items to As Adjusted financial information for the year ended December 31, 2016.
10. Reconciliations of reported cash flow detail line items to Pro Forma As Adjusted financial information for the year ended December 31,2015.
11. Reconciliation from reported Findus Sverige AB Consolidated Carve-out Financial Statements for the year ended September 30, 2015, tofinancial information for other periods used elsewhere in this appendix.
12. Reconciliation of Net Debt to calculate As Adjusted Net Leverage for the twelve month periods ending December 31, 2016 and 2015
Contents
19
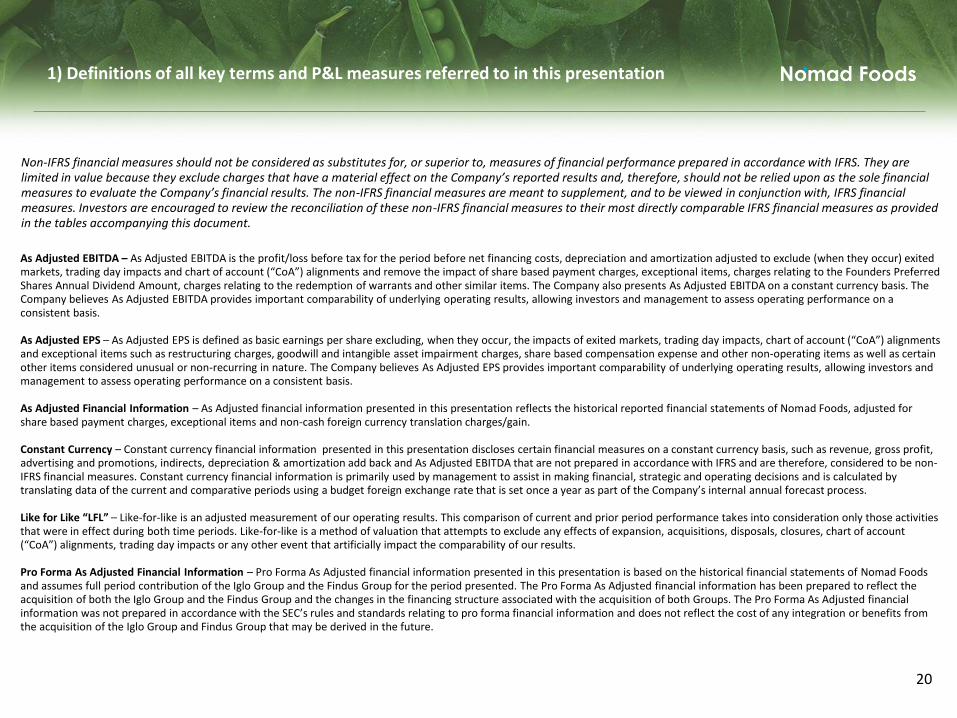
1) Definitions of all key terms and P&L measures referred to in this presentation
As Adjusted EBITDA – As Adjusted EBITDA is the profit/loss before tax for the period before net financing costs, depreciation and amortization adjusted to exclude (when they occur) exited markets, trading day impacts and chart of account (“CoA”) alignments and remove the impact of share based payment charges, exceptional items, charges relating to the Founders Preferred Shares Annual Dividend Amount, charges relating to the redemption of warrants and other similar items. The Company also presents As Adjusted EBITDA on a constant currency basis. The Company believes As Adjusted EBITDA provides important comparability of underlying operating results, allowing investors and management to assess operating performance on a consistent basis.
As Adjusted EPS – As Adjusted EPS is defined as basic earnings per share excluding, when they occur, the impacts of exited markets, trading day impacts, chart of account (“CoA”) alignments and exceptional items such as restructuring charges, goodwill and intangible asset impairment charges, share based compensation expense and other non-operating items as well as certain other items considered unusual or non-recurring in nature. The Company believes As Adjusted EPS provides important comparability of underlying operating results, allowing investors and management to assess operating performance on a consistent basis.
As Adjusted Financial Information – As Adjusted financial information presented in this presentation reflects the historical reported financial statements of Nomad Foods, adjusted for share based payment charges, exceptional items and non-cash foreign currency translation charges/gain.
Constant Currency – Constant currency financial information presented in this presentation discloses certain financial measures on a constant currency basis, such as revenue, gross profit, advertising and promotions, indirects, depreciation & amortization add back and As Adjusted EBITDA that are not prepared in accordance with IFRS and are therefore, considered to be non-IFRS financial measures. Constant currency financial information is primarily used by management to assist in making financial, strategic and operating decisions and is calculated by translating data of the current and comparative periods using a budget foreign exchange rate that is set once a year as part of the Company’s internal annual forecast process.
Like for Like “LFL” – Like-for-like is an adjusted measurement of our operating results. This comparison of current and prior period performance takes into consideration only those activities that were in effect during both time periods. Like-for-like is a method of valuation that attempts to exclude any effects of expansion, acquisitions, disposals, closures, chart of account (“CoA”) alignments, trading day impacts or any other event that artificially impact the comparability of our results.
Pro Forma As Adjusted Financial Information – Pro Forma As Adjusted financial information presented in this presentation is based on the historical financial statements of Nomad Foods and assumes full period contribution of the Iglo Group and the Findus Group for the period presented. The Pro Forma As Adjusted financial information has been prepared to reflect the acquisition of both the Iglo Group and the Findus Group and the changes in the financing structure associated with the acquisition of both Groups. The Pro Forma As Adjusted financial information was not prepared in accordance with the SEC’s rules and standards relating to pro forma financial information and does not reflect the cost of any integration or benefits from the acquisition of the Iglo Group and Findus Group that may be derived in the future.
Non-IFRS financial measures should not be considered as substitutes for, or superior to, measures of financial performance prepared in accordance with IFRS. They are limited in value because they exclude charges that have a material effect on the Company’s reported results and, therefore, should not be relied upon as the sole financial measures to evaluate the Company’s financial results. The non-IFRS financial measures are meant to supplement, and to be viewed in conjunction with, IFRS financial measures. Investors are encouraged to review the reconciliation of these non-IFRS financial measures to their most directly comparable IFRS financial measures as provided in the tables accompanying this document.
20
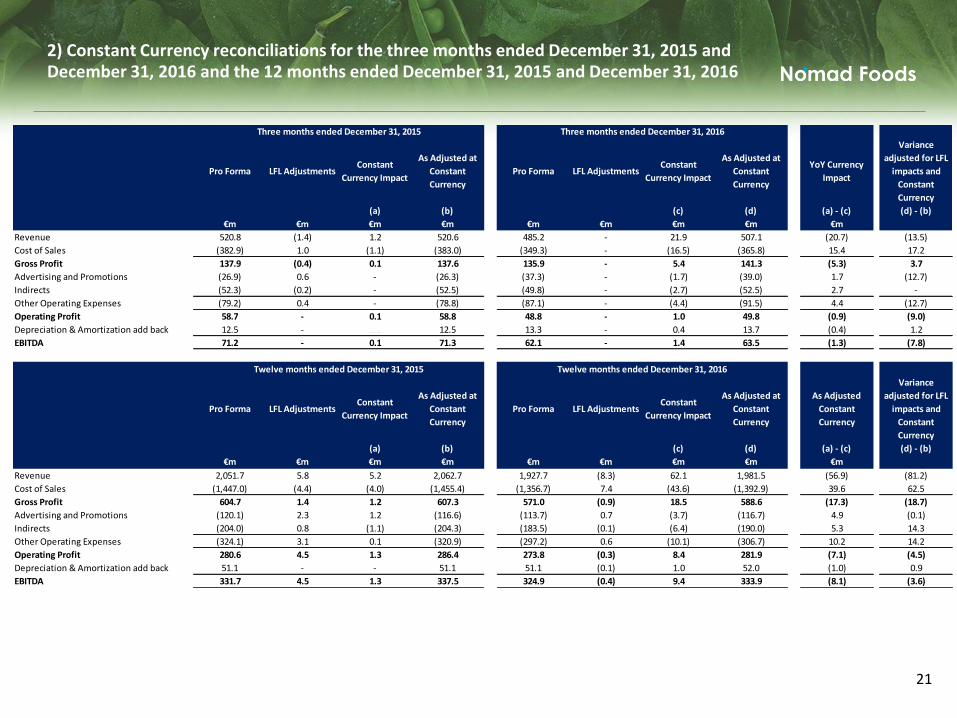
2) Constant Currency reconciliations for the three months ended December 31, 2015 and December 31, 2016 and the 12 months ended December 31, 2015 and December 31, 2016
21
Pro Forma LFL AdjustmentsConstant
Currency Impact
As Adjusted at
Constant
Currency
Pro Forma LFL AdjustmentsConstant
Currency Impact
As Adjusted at
Constant
Currency
YoY Currency
Impact
Variance
adjusted for LFL
impacts and
Constant
Currency
(a) (b) (c) (d) (a) - (c) (d) - (b)
€m €m €m €m €m €m €m €m €m
Revenue 520.8 (1.4) 1.2 520.6 485.2 - 21.9 507.1 (20.7) (13.5)
Cost of Sales (382.9) 1.0 (1.1) (383.0) (349.3) - (16.5) (365.8) 15.4 17.2
Gross Profit 137.9 (0.4) 0.1 137.6 135.9 - 5.4 141.3 (5.3) 3.7
Advertising and Promotions (26.9) 0.6 - (26.3) (37.3) - (1.7) (39.0) 1.7 (12.7)
Indirects (52.3) (0.2) - (52.5) (49.8) - (2.7) (52.5) 2.7 -
Other Operating Expenses (79.2) 0.4 - (78.8) (87.1) - (4.4) (91.5) 4.4 (12.7)
Operating Profit 58.7 - 0.1 58.8 48.8 - 1.0 49.8 (0.9) (9.0)
Depreciation & Amortization add back 12.5 - 0.0 12.5 13.3 - 0.4 13.7 (0.4) 1.2
EBITDA 71.2 - 0.1 71.3 62.1 - 1.4 63.5 (1.3) (7.8)
Pro Forma LFL AdjustmentsConstant
Currency Impact
As Adjusted at
Constant
Currency
Pro Forma LFL AdjustmentsConstant
Currency Impact
As Adjusted at
Constant
Currency
As Adjusted
Constant
Currency
Variance
adjusted for LFL
impacts and
Constant
Currency
(a) (b) (c) (d) (a) - (c) (d) - (b)
€m €m €m €m €m €m €m €m €m
Revenue 2,051.7 5.8 5.2 2,062.7 1,927.7 (8.3) 62.1 1,981.5 (56.9) (81.2)
Cost of Sales (1,447.0) (4.4) (4.0) (1,455.4) (1,356.7) 7.4 (43.6) (1,392.9) 39.6 62.5
Gross Profit 604.7 1.4 1.2 607.3 571.0 (0.9) 18.5 588.6 (17.3) (18.7)
Advertising and Promotions (120.1) 2.3 1.2 (116.6) (113.7) 0.7 (3.7) (116.7) 4.9 (0.1)
Indirects (204.0) 0.8 (1.1) (204.3) (183.5) (0.1) (6.4) (190.0) 5.3 14.3
Other Operating Expenses (324.1) 3.1 0.1 (320.9) (297.2) 0.6 (10.1) (306.7) 10.2 14.2
Operating Profit 280.6 4.5 1.3 286.4 273.8 (0.3) 8.4 281.9 (7.1) (4.5)
Depreciation & Amortization add back 51.1 - - 51.1 51.1 (0.1) 1.0 52.0 (1.0) 0.9
EBITDA 331.7 4.5 1.3 337.5 324.9 (0.4) 9.4 333.9 (8.1) (3.6)
Three months ended December 31, 2015 Three months ended December 31, 2016
Twelve months ended December 31, 2015 Twelve months ended December 31, 2016

(a) Findus Group results for the month ended October 31, 2015 have been constructed using unaudited carve out financial information prepared by the Seller, adjusted for information received post-acquisition which related to the pre-acquisition period.(b) Adjustments to (i) decrease revenue by (€7.7) million for the differential in trading days between year-on-year periods, (ii) eliminate (€2.1) million of intercompany trade between Findus and Iglo Groups for the three months ended December 31, 2015 and (iii) a Nomad Foods accounting policy alignment to reclassify (€0.1) million of advertising and promotion expenses from other operating expenses for the Findus Group three month period.(c) Adjustments to (i) decrease cost of sales by €3.4 million for the differential in trading days between year-on-year periods, (ii) add back €11.0 million non-cash charge related to the increase in inventory fair value recorded as part of the Findus Group’s purchase price accounting (PPA); (iii) eliminate €2.1 million of intercompany trade between the Findus Group and Iglo Group for the three months ended December 31, 2015 and (iv) reverse a €1.3 million non-cash Iglo acquisition accounting adjustment relating to the discontinuation of hedge accounting on acquired derivatives.(d) Adjustments to (i) reflect (€0.2) million incremental amortization on the increase in the fair value uplift of brands and customer lists recorded as part of the Findus Acquisition PPA; (ii) eliminate a €0.2 million Findus prior ownership corporate charge; and, (iii) adjustment to Findus for Nomad Foods accounting policy alignments to reclassify €0.1 million of advertising and promotion expenses to revenue and increasing expense by (€0.1) million, net, relating to the capitalization of new product development costs and related amortization.(e) Adjustment to add back exceptional items, which management believe do not have a continuing impact. See table ‘EBITDA and Pro Forma As Adjusted EBITDA (unaudited) three months ended December 31, 2015’ overleaf for a detailed list of exceptional items.(f) The Company’s adjustment of €9.6 million to restate net financing costs to reflect the new debt structure put in place with the Iglo Acquisition and the financing of the Findus Acquisition and eliminate €13.9 million of non-cash foreign exchange translation gains.(g) The Company’s adjustment to reflect the tax impact of the above at the applicable tax rate for each exceptional item, determined by the nature of the item and the jurisdiction in which it arises.(h) Pro Forma As Adjusted weighted average shares assumes all shares issued in connection with the acquisitions or for which the proceeds were used to complete acquisitions were issued as of January 1, 2015. All other adjustments for weighting are based on actual issuance date.
3) Reconciliation of reported to Pro Forma As Adjusted financial information for the three months ended December 31, 2015
22
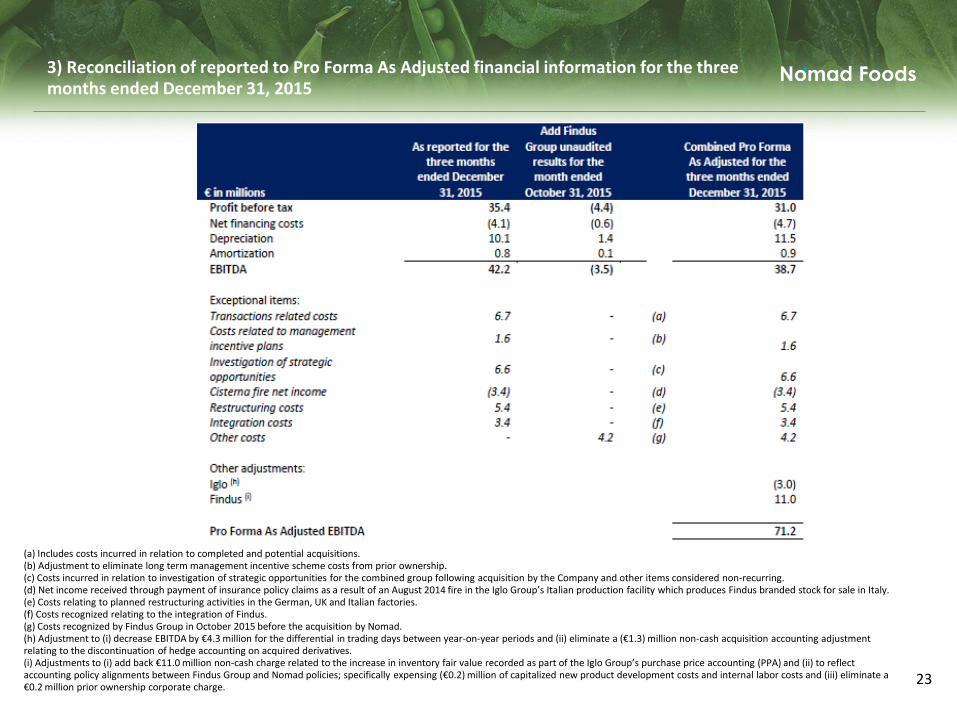
3) Reconciliation of reported to Pro Forma As Adjusted financial information for the three months ended December 31, 2015
(a) Includes costs incurred in relation to completed and potential acquisitions.(b) Adjustment to eliminate long term management incentive scheme costs from prior ownership.(c) Costs incurred in relation to investigation of strategic opportunities for the combined group following acquisition by the Company and other items considered non-recurring.(d) Net income received through payment of insurance policy claims as a result of an August 2014 fire in the Iglo Group’s Italian production facility which produces Findus branded stock for sale in Italy. (e) Costs relating to planned restructuring activities in the German, UK and Italian factories.(f) Costs recognized relating to the integration of Findus.(g) Costs recognized by Findus Group in October 2015 before the acquisition by Nomad.(h) Adjustment to (i) decrease EBITDA by €4.3 million for the differential in trading days between year-on-year periods and (ii) eliminate a (€1.3) million non-cash acquisition accounting adjustment relating to the discontinuation of hedge accounting on acquired derivatives. (i) Adjustments to (i) add back €11.0 million non-cash charge related to the increase in inventory fair value recorded as part of the Iglo Group’s purchase price accounting (PPA) and (ii) to reflect accounting policy alignments between Findus Group and Nomad policies; specifically expensing (€0.2) million of capitalized new product development costs and internal labor costs and (iii) eliminate a €0.2 million prior ownership corporate charge.
23

(a) Findus Group unaudited results for the ten months ended October 31, 2015 have been derived from the audited carve out accounts for the year to 30 September 2015, unaudited carve out financial information for the three month period to December 31, 2014 prepared by the Seller, unaudited carve out financial information for the month to October 31, 2015 prepared by the Seller, adjusted for information received post-acquisition which related to the pre-acquisition period.(b) Adjustments to (i) eliminate (€14.5) million of intercompany trade between the Findus Group and Iglo Group for the year ended December 31, 2015 and (ii) reflect accounting policy alignment between Findus Group and Nomad policies to reclassify (€1.4) million of advertising and promotion expenses from other operating expenses for the Findus Group three month period.(c) Adjustments to (i) add back €26.0 million non-cash charge related to the increase in inventory fair value recorded as part of the Iglo Group’s purchase price accounting (PPA); (ii) add back €11.0 million non-cash charge related to the increase in inventory fair value recorded as part of the Findus Group’s PPA; (iii) increase depreciation expense by (€0.9) million net to reflect the Iglo and Findus PPA adjustments to the fair value of property, plant and equipment and (iv) eliminate €14.5 million of intercompany trade between the Findus Group and Iglo Group for the year ended December 31, 2015 and (v) reverse a €4.9 million non-cash Iglo acquisition accounting adjustment relating to the discontinuation of hedge accounting on acquired derivatives..(d) Adjustments to (i) reflect (€1.9) million incremental amortization on the increase in the fair value uplift of brands and customer lists recorded as part of the Findus acquisition PPA (there was no increase in the value of definite life intangible assets as part of the Iglo Group PPA); (ii) reflect a reduction of €0.5 million of amortization based on the fair valuation of intangible assets acquired with the Iglo Group; (iii) eliminate a €2.3 million Findus prior ownership corporate charge; and, (iv) adjustment to Findus results for Nomad Foods accounting policy alignments to reclassify €1.3 million of advertising and promotion expenses to revenue and increasing expense by (€0.5) million net, relating to the capitalization of new product development costs and related amortization.(e) Adjustment to add back a Nomad Foods €492.2 million non-cash charge relating to the Founder Preferred Shares Annual Dividend Amount & Warrant Redemption Amount.(f) Adjustment to add back exceptional items, which management believe do not have a continuing impact. See table ‘EBITDA and Pro Forma As Adjusted EBITDA (unaudited) year ended December 31, 2015’ overleaf for a detailed list of exceptional items.(g) The Company’s adjustment of €64.8 million to restate net financing costs to reflect the new debt structure put in place with the Iglo Acquisition and the financing of the Findus Acquisition and eliminate €25.3 million of non-cash foreign exchange translation charges.(h) The Company’s adjustment to reflect the tax impact of the above at the applicable tax rate for each exceptional item, determined by the nature of the item and the jurisdiction in which it arises.(i) Pro Forma As Adjusted weighted average shares assumes all shares issued in connection with the acquisitions or for which the proceeds were used to complete acquisitions were issued as of January 1, 2015. All other adjustments for weighting are based on actual issuance date.
4) Reconciliation of reported to Pro Forma As Adjusted financial information for the twelve months ended December 31, 2015
24
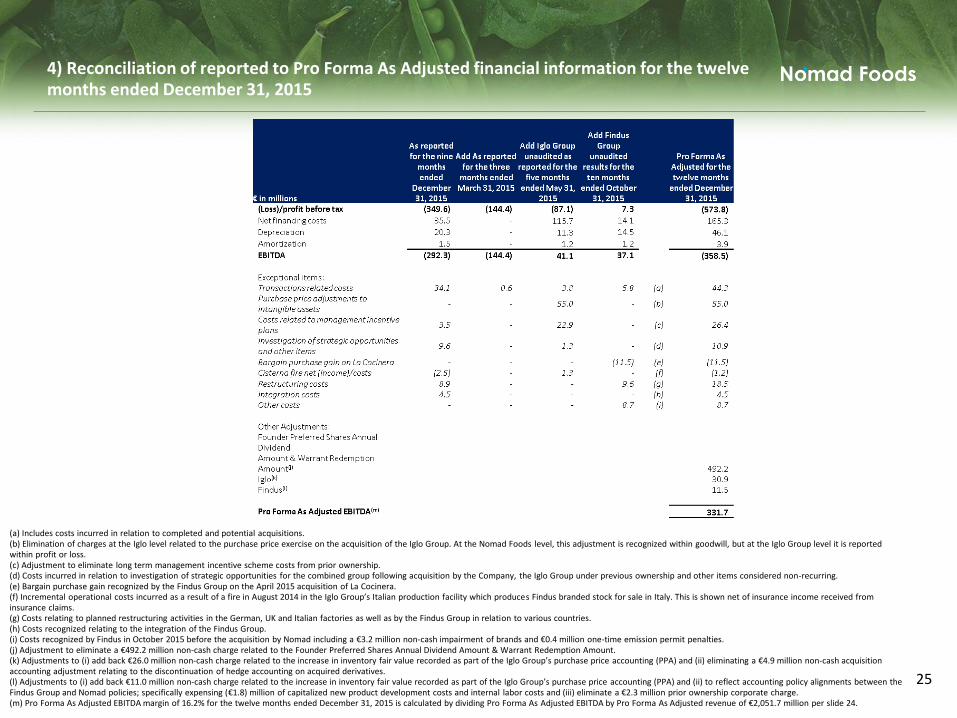
(a) Includes costs incurred in relation to completed and potential acquisitions.(b) Elimination of charges at the Iglo level related to the purchase price exercise on the acquisition of the Iglo Group. At the Nomad Foods level, this adjustment is recognized within goodwill, but at the Iglo Group level it is reported within profit or loss.(c) Adjustment to eliminate long term management incentive scheme costs from prior ownership.(d) Costs incurred in relation to investigation of strategic opportunities for the combined group following acquisition by the Company, the Iglo Group under previous ownership and other items considered non-recurring.(e) Bargain purchase gain recognized by the Findus Group on the April 2015 acquisition of La Cocinera.(f) Incremental operational costs incurred as a result of a fire in August 2014 in the Iglo Group’s Italian production facility which produces Findus branded stock for sale in Italy. This is shown net of insurance income received from insurance claims.(g) Costs relating to planned restructuring activities in the German, UK and Italian factories as well as by the Findus Group in relation to various countries.(h) Costs recognized relating to the integration of the Findus Group.(i) Costs recognized by Findus in October 2015 before the acquisition by Nomad including a €3.2 million non-cash impairment of brands and €0.4 million one-time emission permit penalties.(j) Adjustment to eliminate a €492.2 million non-cash charge related to the Founder Preferred Shares Annual Dividend Amount & Warrant Redemption Amount.(k) Adjustments to (i) add back €26.0 million non-cash charge related to the increase in inventory fair value recorded as part of the Iglo Group’s purchase price accounting (PPA) and (ii) eliminating a €4.9 million non-cash acquisition accounting adjustment relating to the discontinuation of hedge accounting on acquired derivatives.(l) Adjustments to (i) add back €11.0 million non-cash charge related to the increase in inventory fair value recorded as part of the Iglo Group’s purchase price accounting (PPA) and (ii) to reflect accounting policy alignments between the Findus Group and Nomad policies; specifically expensing (€1.8) million of capitalized new product development costs and internal labor costs and (iii) eliminate a €2.3 million prior ownership corporate charge. (m) Pro Forma As Adjusted EBITDA margin of 16.2% for the twelve months ended December 31, 2015 is calculated by dividing Pro Forma As Adjusted EBITDA by Pro Forma As Adjusted revenue of €2,051.7 million per slide 24.
4) Reconciliation of reported to Pro Forma As Adjusted financial information for the twelve months ended December 31, 2015
25

5) Reconciliation of reported to As Adjusted financial information for the three months ended December 31, 2016
(a) Adjustment to add back share based payment charge.(b) Adjustment to add back exceptional items which management believes are non-recurring and do not have a continuing impact. (c) Adjustment to eliminate €0.2 million of non-cash foreign exchange translation losses, €0.9 million foreign exchange loss on derivatives and €2.8 million of interest charges on provisions for tax exposures.(d) Adjustment to reflect the tax impact of the above at the applicable tax rate for each adjustment, determined by the nature of the item and the jurisdiction in which it arises.(e) Diluted weighted average shares outstanding has been adjusted by the dilutive impact of the 2016 Non-Executive Directors Restricted Stock Awards
26
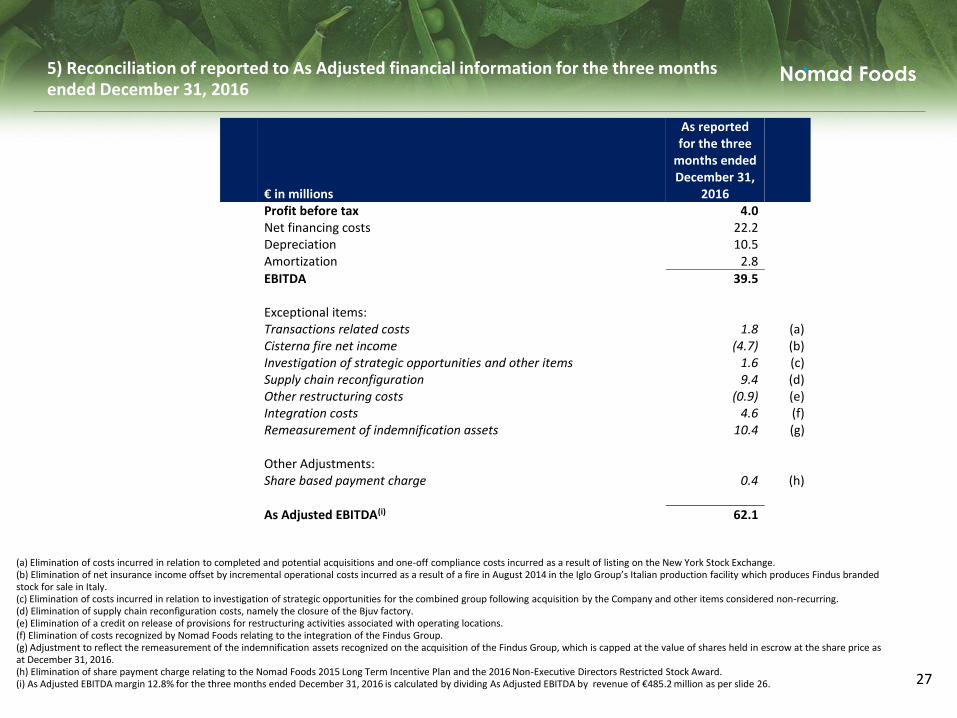
(a) Elimination of costs incurred in relation to completed and potential acquisitions and one-off compliance costs incurred as a result of listing on the New York Stock Exchange.(b) Elimination of net insurance income offset by incremental operational costs incurred as a result of a fire in August 2014 in the Iglo Group’s Italian production facility which produces Findus branded stock for sale in Italy. (c) Elimination of costs incurred in relation to investigation of strategic opportunities for the combined group following acquisition by the Company and other items considered non-recurring.(d) Elimination of supply chain reconfiguration costs, namely the closure of the Bjuv factory.(e) Elimination of a credit on release of provisions for restructuring activities associated with operating locations.(f) Elimination of costs recognized by Nomad Foods relating to the integration of the Findus Group.(g) Adjustment to reflect the remeasurement of the indemnification assets recognized on the acquisition of the Findus Group, which is capped at the value of shares held in escrow at the share price as at December 31, 2016.(h) Elimination of share payment charge relating to the Nomad Foods 2015 Long Term Incentive Plan and the 2016 Non-Executive Directors Restricted Stock Award.(i) As Adjusted EBITDA margin 12.8% for the three months ended December 31, 2016 is calculated by dividing As Adjusted EBITDA by revenue of €485.2 million as per slide 26.
5) Reconciliation of reported to As Adjusted financial information for the three months ended December 31, 2016
27
€ in millions
As reported for the three
months ended December 31,
2016 Profit before tax 4.0 Net financing costs 22.2 Depreciation 10.5 Amortization 2.8
EBITDA 39.5 Exceptional items: Transactions related costs 1.8 (a) Cisterna fire net income (4.7) (b) Investigation of strategic opportunities and other items 1.6 (c) Supply chain reconfiguration 9.4 (d) Other restructuring costs (0.9) (e) Integration costs 4.6 (f) Remeasurement of indemnification assets 10.4 (g) Other Adjustments: Share based payment charge 0.4 (h)
As Adjusted EBITDA(i) 62.1

6) Reconciliation of reported to As Adjusted financial information for the twelve months ended December 31, 2016
(a) Adjustment to add back share based payment charge.(b) Adjustment to add back exceptional items which management believes are non-recurring and do not have a continuing impact. See table ‘EBITDA and As Adjusted EBITDA (unaudited) twelve months ended December 31, 2016’ for a detailed list of exceptional items.(c) Adjustment to eliminate (€18.3) million of non-cash foreign exchange translation gains, €4.3 million foreign exchange loss on derivatives and €2.8 million of other exceptional non-cash interest charges.(d) Adjustment to reflect the tax impact of the above at the applicable tax rate for each adjustment, determined by the nature of the item and the jurisdiction in which it arises.(e) Basic weighted average shares outstanding includes shares the Company is obligated to issue relating to the 2016 Non-Executive Restricted Stock Award shares granted in June 2016.(f) Diluted weighted average shares outstanding has been adjusted by the dilutive impact of the 2016 Non-Executive Restricted Stock Award.
28
€ in millions, except per share data
As reported for the
twelve months ended December
31, 2016
Adjustments
As Adjusted for
the twelve months ended December
31, 2016
Revenue 1,927.7 - 1,927.7 Cost of sales (1,356.7) - (1,356.7)
Gross profit 571.0 - 571.0 Other operating expenses (298.4) 1.2 (a) (297.2) Exceptional items (134.5) 134.5 (b) -
Operating profit 138.1 135.7 273.8 Finance income 24.2 (18.3) 5.9 Finance costs (86.3) 7.1 (79.2)
Net financing costs (62.1) (11.2) (c) (73.3)
Profit before tax 76.0 124.5 200.5 Taxation (39.6) (6.0) (d) (45.6)
Profit for the period 36.4 118.5 154.9
Weighted average shares outstanding - basic(e)
183,518,743 183,518,743
Basic earnings per share 0.20 0.84 Weighted average shares outstanding - diluted(f)
183,528,621
183,528,621
Diluted earnings per share
0.20 0.84

(a) Elimination of costs incurred in relation to completed and potential acquisitions and one-off compliance costs incurred as a result of listing on the New York Stock Exchange. (b) Adjustment to eliminate long term management incentive scheme costs from prior ownership.(c) Elimination of costs incurred in relation to investigation of strategic opportunities for the combined group following acquisition by the Company and other items considered non-recurring.(d) Elimination of net insurance income offset by incremental operational costs incurred as a result of a fire in August 2014 in the Iglo Group’s Italian production facility which produces Findus branded stock for sale in Italy.(e) Elimination of supply chain reconfiguration costs, namely the closure of the Bjuv factory.(f) Elimination of a credit on release of provisions for restructuring activities associated with operating locations.(g) Elimination of costs recognized by Nomad Foods relating to the integration of the Findus Group.(h) Adjustment to reflect the remeasurement of the indemnification assets recognized on the acquisition of the Findus Group, which is capped at the value of shares held in escrow at the share price as at December 31, 2016.(i) Elimination of share payment charge relating to the Nomad Foods 2015 Long Term Incentive Plan and annual Non-Executive Directors Restricted Stock Awards.(j) As Adjusted EBITDA margin of 16.9% for the twelve months ended December 31, 2016 is calculated by dividing As Adjusted EBITDA by revenue of €1,927.7 million as per slide 28.
6) Reconciliation of reported to As Adjusted financial information for the twelve months ended December 31, 2016
29
€ in millions
As reported for the twelve months ended December 31,
2016 Profit before tax 76.0
Net financing costs 62.1 Depreciation 43.3 Amortization 7.8
EBITDA 189.2 Exceptional items: Transaction related costs 4.8 (a) Costs related to management incentive plans 1.9 (b) Investigation of strategic opportunities and other items 8.8 (c) Cisterna fire net income (4.3) (d) Supply chain reconfiguration 84.3 (e) Other restructuring costs (1.0) (f) Integration costs 29.6 (g) Remeasurement of indemnification assets 10.4 (h) Other Adjustments: Share based payment charge 1.2 (i)
As Adjusted EBITDA(j) 324.9

7) Reconciliation of reported net cash flows from operating activities to As Adjusted Operating Cash flow (excl. tax) for the year ended December 31, 2016
(a) Defined as the sum of property, plant and equipment and intangible assets purchased in the year.
30
€ in millions (unaudited)
As reported for the year ended
December 31, 2016
Net cash flows from operating activities 282.1 Add back: Tax paid 24.9 Cash flows relating to exceptional items 49.2 Deduct: Capital expenditure (a) (42.4)
As Adjusted Operating Cash flow (excl. tax) 313.8
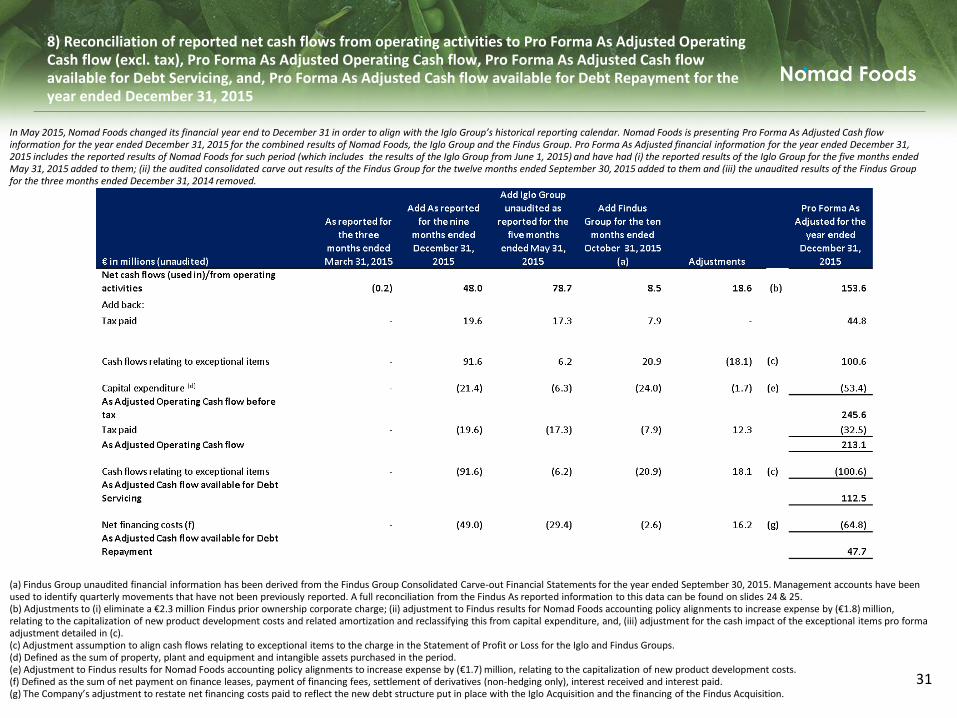
8) Reconciliation of reported net cash flows from operating activities to Pro Forma As Adjusted Operating Cash flow (excl. tax), Pro Forma As Adjusted Operating Cash flow, Pro Forma As Adjusted Cash flow available for Debt Servicing, and, Pro Forma As Adjusted Cash flow available for Debt Repayment for the year ended December 31, 2015
(a) Findus Group unaudited financial information has been derived from the Findus Group Consolidated Carve-out Financial Statements for the year ended September 30, 2015. Management accounts have been used to identify quarterly movements that have not been previously reported. A full reconciliation from the Findus As reported information to this data can be found on slides 24 & 25.(b) Adjustments to (i) eliminate a €2.3 million Findus prior ownership corporate charge; (ii) adjustment to Findus results for Nomad Foods accounting policy alignments to increase expense by (€1.8) million, relating to the capitalization of new product development costs and related amortization and reclassifying this from capital expenditure, and, (iii) adjustment for the cash impact of the exceptional items pro forma adjustment detailed in (c). (c) Adjustment assumption to align cash flows relating to exceptional items to the charge in the Statement of Profit or Loss for the Iglo and Findus Groups. (d) Defined as the sum of property, plant and equipment and intangible assets purchased in the period.(e) Adjustment to Findus results for Nomad Foods accounting policy alignments to increase expense by (€1.7) million, relating to the capitalization of new product development costs.(f) Defined as the sum of net payment on finance leases, payment of financing fees, settlement of derivatives (non-hedging only), interest received and interest paid.(g) The Company’s adjustment to restate net financing costs paid to reflect the new debt structure put in place with the Iglo Acquisition and the financing of the Findus Acquisition.
In May 2015, Nomad Foods changed its financial year end to December 31 in order to align with the Iglo Group’s historical reporting calendar. Nomad Foods is presenting Pro Forma As Adjusted Cash flow information for the year ended December 31, 2015 for the combined results of Nomad Foods, the Iglo Group and the Findus Group. Pro Forma As Adjusted financial information for the year ended December 31, 2015 includes the reported results of Nomad Foods for such period (which includes the results of the Iglo Group from June 1, 2015) and have had (i) the reported results of the Iglo Group for the five months ended May 31, 2015 added to them; (ii) the audited consolidated carve out results of the Findus Group for the twelve months ended September 30, 2015 added to them and (iii) the unaudited results of the Findus Group for the three months ended December 31, 2014 removed.
31

9) Reconciliation of reported cash flow detail line items to As Adjusted financial information for the year ended December 31, 2016
32
€ in millions (unaudited)
As reported for the year
ended December 31, 2016
Increase in inventories (18.1) Increase in trade and other receivables (8.8) Increase in trade and other payables 60.8
Working capital movement 33.9

10) Reconciliation of reported cash flow detail line items to Pro Forma As Adjusted financial information for the year ended December 31, 2015
(a) Findus Group unaudited financial information has been derived from management accounts and the Findus Group Consolidated Carve-out Financial Statements for the year ended September 30, 2015. Management accounts have been used to identify quarterly movements that have not been previously reported. A full reconciliation from the Findus As reported information to this data can be found on slides 24 & 25.
33
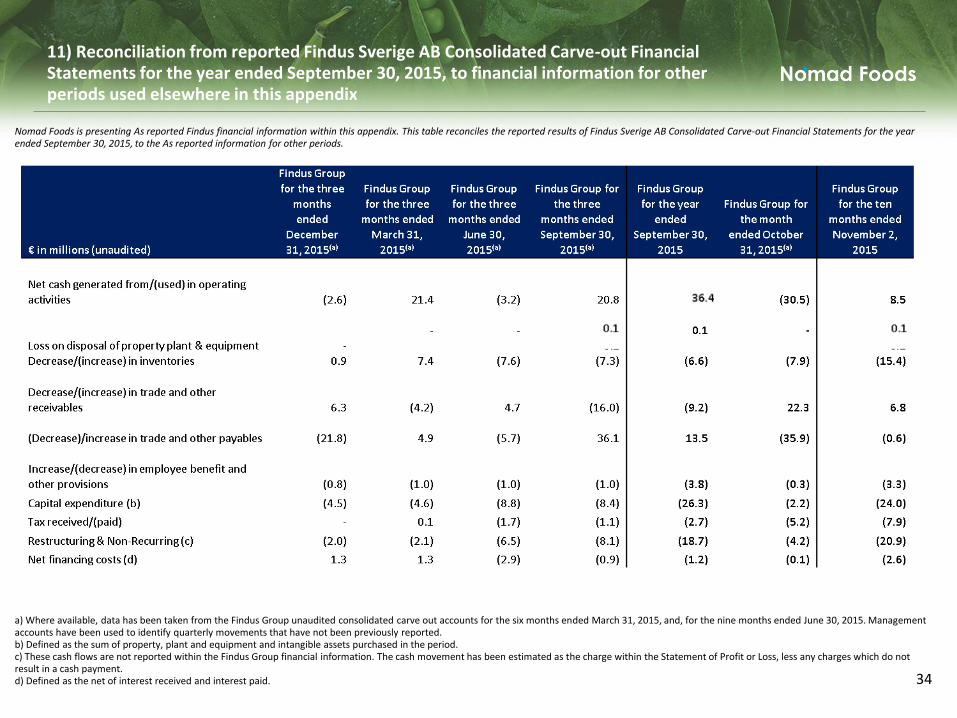
11) Reconciliation from reported Findus Sverige AB Consolidated Carve-out Financial Statements for the year ended September 30, 2015, to financial information for other periods used elsewhere in this appendix
a) Where available, data has been taken from the Findus Group unaudited consolidated carve out accounts for the six months ended March 31, 2015, and, for the nine months ended June 30, 2015. Management accounts have been used to identify quarterly movements that have not been previously reported.b) Defined as the sum of property, plant and equipment and intangible assets purchased in the period.c) These cash flows are not reported within the Findus Group financial information. The cash movement has been estimated as the charge within the Statement of Profit or Loss, less any charges which do not result in a cash payment.d) Defined as the net of interest received and interest paid.
Nomad Foods is presenting As reported Findus financial information within this appendix. This table reconciles the reported results of Findus Sverige AB Consolidated Carve-out Financial Statements for the year ended September 30, 2015, to the As reported information for other periods.
34
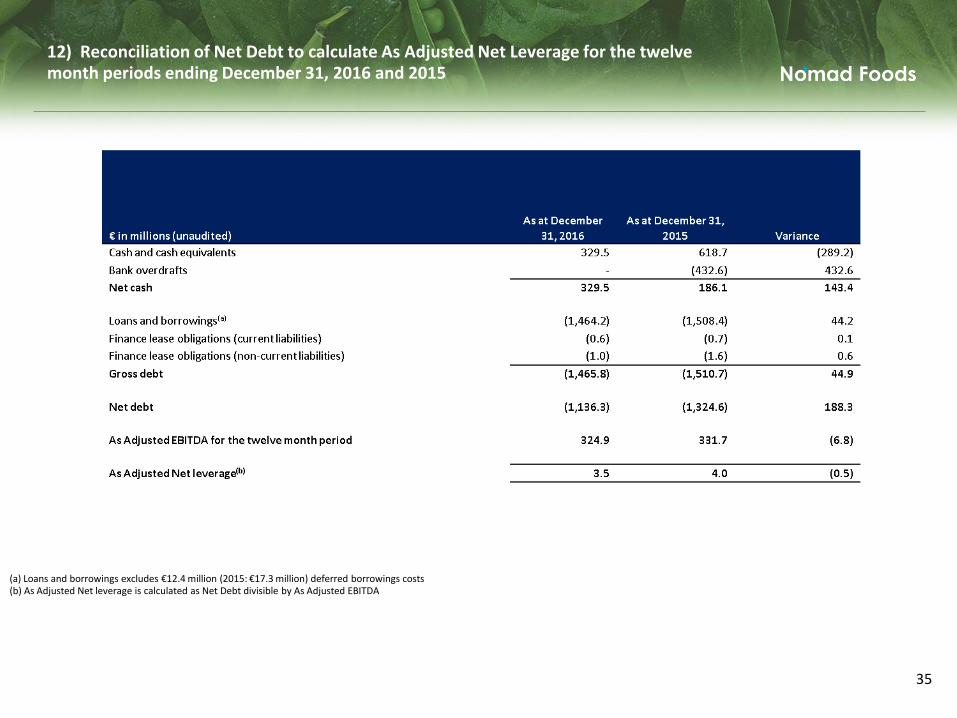
12) Reconciliation of Net Debt to calculate As Adjusted Net Leverage for the twelve month periods ending December 31, 2016 and 2015
(a) Loans and borrowings excludes €12.4 million (2015: €17.3 million) deferred borrowings costs(b) As Adjusted Net leverage is calculated as Net Debt divisible by As Adjusted EBITDA
35
Related Documents