271 J. Phycol. 37, 271–279 (2001) FOURIER TRANSFORM INFRARED SPECTROSCOPY AS A NOVEL TOOL TO INVESTIGATE CHANGES IN INTRACELLULAR MACROMOLECULAR POOLS IN THE MARINE MICROALGA CHAETOCEROS MUELLERII (BACILLARIOPHYCEAE) 1 Mario Giordano 2 Department of Biological Sciences, Monash University, Clayton, Australia Mustafa Kansiz Department of Chemistry, Monash University, Clayton, Australia Philip Heraud Departments of Biological Sciences and Chemistry, Monash University, Clayton, Australia John Beardall Department of Biological Sciences, Monash University, Clayton, Australia Bayden Wood and Don McNaughton Department of Chemistry, Monash University, Clayton, Australia Fourier Transform Infrared (FT-IR) spectroscopy was used to study carbon allocation patterns in re- sponse to changes in nitrogen availability in the dia- tom Chaetoceros muellerii Lemmerman. The results of the FT-IR measurements were compared with those obtained with traditional chemical methods. The data obtained with both FT-IR and chemical meth- ods showed that nitrogen starvation led to the disap- pearance of the differences in cell constituents and growth rates existing between cells cultured at either high [NO 3 2 ] or high [NH 4 1 ]. Irrespective of the ni- trogen source supplied before nitrogen starvation, a diversion of carbon away from protein, chlorophyll, and carbohydrates into lipids was observed. Under these conditions, cells that had previously received nitrogen as nitrate appeared to allocate a larger amount of mobilized carbon into lipids than cells that had been cultured in the presence of ammonia. All these changes were reversed by resupplying the cultures with nitrogen. The rate of protein accumula- tion in the N-replete cells was slower than the rate of decrease under nitrogen starvation. This study dem- onstrates that the relative proportions of the major macromolecules contained in microalgal cells and their changes in response to external stimuli can be determined rapidly, simultaneously, and inexpen- sively using FT-IR. The technique proved to be equally reliable to and less labor intensive than more traditional chemical methods. Key index words: allocation; ammonium; FT-IR; ni- trate; starvation; spectroscopy Abbreviations: FT-IR, Fourier Transform Infrared The microalgae that constitute the phytoplankton in open oceans contribute a significant fraction to to- tal global productivity (Falkowski 1994). Phytoplank- ton physiology therefore plays a role of paramount importance in the dynamics of aquatic ecosystems. A better comprehension of the mechanisms involved in the stress responses of photolithotrophic organisms to environmental changes would thus have relevance well beyond the mere knowledge of the metabolism of the organisms involved. The response to stress in- duced by environmental change, such as in the avail- ability of nutrients, is aimed at the maintenance of the status quo. Organisms react to change by redistribut- ing resources so that the reproductive and growth po- tentials are affected as little as possible (Geider and Osborne 1989). This often results in a massive reorga- nization of cellular components (e.g. Morris 1981, Turpin 1991, Falkowski 1994, Giordano and Bowes 1997, Giordano et al. 2000). The study of the changes in the pools of macromolecules in cells and their quantification, especially in relation to each other, is therefore essential for understanding the response of organisms to alterations in environmental conditions. Unfortunately, most methods used for the assessment of the size of cellular pools of macromolecules and of their variations are invasive and require the disrup- tion of the cell, which introduces both large experi- mental errors and major perturbations of the system. Also, work of this kind is technically challenging and time consuming and often requires large numbers of cells. In this study, we show that these problems can be overcome by using a novel technique that involves ac- quiring mid-infrared absorbance spectra from fixed and dried microalgal samples using a Fourier trans- form infrared (FT-IR) spectrometer. When FT-IR spec- troscopy is applied to intact microorganisms, the re- sulting spectra reflect the total biochemical composition 1 Received 28 August 2000. Accepted 6 December 2000. 2 Present address and author for correspondence: Istituto di Scienze del Mare, Facoltà di Scienze, Università di Ancona, 60131 Ancona, Italy. E-mail: [email protected].

Welcome message from author
This document is posted to help you gain knowledge. Please leave a comment to let me know what you think about it! Share it to your friends and learn new things together.
Transcript
271
J. Phycol.
37,
271–279 (2001)
FOURIER TRANSFORM INFRARED SPECTROSCOPY AS A NOVEL TOOL TO INVESTIGATE CHANGES IN INTRACELLULAR MACROMOLECULAR POOLS IN THE MARINE
MICROALGA
CHAETOCEROS MUELLERII
(BACILLARIOPHYCEAE)
1
Mario Giordano
2
Department of Biological Sciences, Monash University, Clayton, Australia
Mustafa Kansiz
Department of Chemistry, Monash University, Clayton, Australia
Philip Heraud
Departments of Biological Sciences and Chemistry, Monash University, Clayton, Australia
John Beardall
Department of Biological Sciences, Monash University, Clayton, Australia
Bayden Wood and Don McNaughton
Department of Chemistry, Monash University, Clayton, Australia
Fourier Transform Infrared (FT-IR) spectroscopywas used to study carbon allocation patterns in re-sponse to changes in nitrogen availability in the dia-tom
Chaetoceros muellerii
Lemmerman. The results ofthe FT-IR measurements were compared with thoseobtained with traditional chemical methods. Thedata obtained with both FT-IR and chemical meth-ods showed that nitrogen starvation led to the disap-pearance of the differences in cell constituents andgrowth rates existing between cells cultured at eitherhigh [NO
3
2
] or high [NH
4
1
]. Irrespective of the ni-trogen source supplied before nitrogen starvation, adiversion of carbon away from protein, chlorophyll,and carbohydrates into lipids was observed. Underthese conditions, cells that had previously receivednitrogen as nitrate appeared to allocate a largeramount of mobilized carbon into lipids than cellsthat had been cultured in the presence of ammonia.All these changes were reversed by resupplying thecultures with nitrogen. The rate of protein accumula-tion in the N-replete cells was slower than the rate ofdecrease under nitrogen starvation. This study dem-onstrates that the relative proportions of the majormacromolecules contained in microalgal cells andtheir changes in response to external stimuli can bedetermined rapidly, simultaneously, and inexpen-sively using FT-IR. The technique proved to beequally reliable to and less labor intensive than moretraditional chemical methods.
Key index words:
allocation; ammonium; FT-IR; ni-trate; starvation; spectroscopy
Abbreviations:
FT-IR, Fourier Transform Infrared
The microalgae that constitute the phytoplanktonin open oceans contribute a significant fraction to to-tal global productivity (Falkowski 1994). Phytoplank-ton physiology therefore plays a role of paramountimportance in the dynamics of aquatic ecosystems. Abetter comprehension of the mechanisms involved inthe stress responses of photolithotrophic organisms toenvironmental changes would thus have relevancewell beyond the mere knowledge of the metabolismof the organisms involved. The response to stress in-duced by environmental change, such as in the avail-ability of nutrients, is aimed at the maintenance of thestatus quo. Organisms react to change by redistribut-ing resources so that the reproductive and growth po-tentials are affected as little as possible (Geider andOsborne 1989). This often results in a massive reorga-nization of cellular components (e.g. Morris 1981,Turpin 1991, Falkowski 1994, Giordano and Bowes1997, Giordano et al. 2000). The study of the changesin the pools of macromolecules in cells and theirquantification, especially in relation to each other, istherefore essential for understanding the response oforganisms to alterations in environmental conditions.Unfortunately, most methods used for the assessmentof the size of cellular pools of macromolecules and oftheir variations are invasive and require the disrup-tion of the cell, which introduces both large experi-mental errors and major perturbations of the system.Also, work of this kind is technically challenging andtime consuming and often requires large numbers ofcells.
In this study, we show that these problems can beovercome by using a novel technique that involves ac-quiring mid-infrared absorbance spectra from fixedand dried microalgal samples using a Fourier trans-form infrared (FT-IR) spectrometer. When FT-IR spec-troscopy is applied to intact microorganisms, the re-sulting spectra reflect the total biochemical composition
1
Received 28 August 2000. Accepted 6 December 2000.
2
Present address and author for correspondence: Istituto di Scienzedel Mare, Facoltà di Scienze, Università di Ancona, 60131 Ancona, Italy.E-mail: [email protected].
272
MARIO GIORDANO ET AL.
of the cells (Naumann et al. 1991). Furthermore, FT-IRspectra can be used to determine the relative concen-tration of macromolecules such as nucleic acids, pro-teins, lipids, and carbohydrates in the cells (Heise1997). As part of ongoing research to develop newand rapid methods for screening natural populationsof algae for signs of nutrient stress, we examined themarine diatom
Chaetoceros muellerii
, grown under con-ditions of differing nitrogen supply, using FT-IR spec-troscopy.
materials and methods
Nonspectroscopic methodsCultures.
All the experiments were carried out on batch cul-tures of
Chaetoceros muellerii
Lemmermann (strain CS-176,CSIRO culture collection, Australia) grown in a modified formof “D” medium of Provasoli et al. (1957), containing 1.5 mM ofeither NaNO
3
or NH
4
Cl, buffered at pH 8.0 with 10 mM Tris-HCl, and maintained at 18
8
C (
6
0.1
8
C) under a photon fluxdensity of 150
m
mol photons
?
m
2
2
?
s
2
1
. In the presence of eitherform of nitrogen, 10 mM Tris was sufficient to keep the pH atthe end of the experiment within 0.2 units of the initial pH. Forthe nitrogen-starvation experiments, the medium was preparedwithout any nitrogen source. The batch cultures were inocu-lated from low cell density, “air-lift,” semicontinuous cultures inthe early exponential phase. The size of the inoculum was suchthat the initial cell concentration in the batch cultures wasabout 5
3
10
4
cells
?
mL
2
1
. Exponentially growing cultures, at acell density of about 50
3
10
6
cells
?
mL
2
1
, were pelleted by cen-trifugation at 500
g
for 15 min, washed twice in nitrogen-freemedium, and transferred to an equal volume of the same me-dium.
Nitrogen-enrichment experiments were carried out on cellspreviously subjected to nitrogen starvation for 7 days by addingfilter-sterilized NO
3
2
or NH
4
1
solution (depending on the ini-tial source of nitrogen before nitrogen starvation) to the nitro-gen-free medium such that the final concentration of N in themedium was 1.5 mM. Control experiments were performed inwhich nitrogen-replete cells were transferred to nitrogen-sufficientmedium, following the same procedure adopted for the nitrogen-starvation experiments. The cell density of the batch cultures wasdetermined with a Neubauer hemocytometer (Hawkley, Sus-sex, England), after fixation with Lugol’s iodine solution.
Analysis of cell components.
Cell components were analyzedby conventional methods to validate the FT-IR analysis and toallow an easy comparison with the data available in the litera-ture. All experiments were replicated five times. Cells were son-icated for protein extraction (2
3
15 s, 30 W) in 1:4 (vol/vol)tetrahydrofuran:methanol, centrifuged (15,000
g
, 10 min), andstored at 4
8
C for 30 min. This procedure was repeated twice.The final pellet was treated and assayed for total protein ac-cording to Peterson (1977). BSA was used as a standard.
Chlorophyll was extracted in 90% acetone and determinedspectrophotometrically, using the equation for chromophytealgae indicated by Jeffrey et al. (1997).
Carbohydrates were extracted by sonicating the cells in 0.5 MHClO
4
(2
3
1.5 s, 30 W, on ice). After centrifugation, the su-pernatant and the pellet were separated, and the pellet was sub-jected to a second extraction. The combined neutralized super-natants were assayed for soluble carbohydrates, and the pelletwas analyzed for acid insoluble carbohydrates according toKochert (1978).
d
-Glucose was used as standard.Dry and ash-free weights were assessed using 40-mL aliquots
of the cultures that were filtered through a precombusted GF/Cfiberglass filter (Whatman, Kent, England) under mild vac-uum. The filter was washed with 40 mL of NH
4
1
-acetate, incu-bated at 100
8
C for 12 h to allow determination of dry weight,and then placed in a muffle furnace at 450
8
C overnight. Thefilter was allowed to equilibrate to room temperature in a desic-cator and was then weighed. After a further 24 h in the furnace,
the measurement was repeated to confirm complete combus-tion of the sample. Filters washed with 40 mL of growth me-dium followed by 40 mL of NH
4
1
-acetate were used as controls.
Spectroscopic methodsCell deposition.
Preliminary trials were performed to deter-mine the density of cell suspensions necessary to produce spec-tra with a good signal-to-noise ratio without band saturation.Final cell concentrates used were approximately 2.0
3
10
8
cells
?
mL
2
1
. The culture volumes required to obtain the abovecell concentrations were harvested and transferred to centrifugetubes. Lugol’s iodine solution was added at a concentration of1
m
L per mL of cell suspension, fixing the cells and therebypreventing possible biochemical changes that might have oth-erwise occurred during the subsequent drying step. The tubeswere centrifuged at 600
g
for 5 min, the supernatants removed,and the resultant pellet resuspended in isotonic saline. Thisprocess was repeated twice to thoroughly wash the cells ofgrowth medium, which may otherwise interfere with the spec-tra. After the final wash, 150
m
L of isotonic saline was left be-hind in the centrifuge tube, and the cellular pellet was resus-pended in this volume. A 100-
m
L aliquot was pipetted onto amodified (Teflon top-plate) multicavity KRS-5 infrared trans-parent substrate (Harshaw Chemical Co., Cleveland, OH) (Woodet al. 1996). The samples were then desiccated under vacuumfor several hours. After removal of the Teflon top-plate, thedried cellular deposit on the KRS-5 plate was placed on theFT-IR microscope stage for spectral acquisition.
Spectral acquisition.
Spectra were collected on an FT-IR spec-trometer (model IFS-55, Bruker Instruments, Billerica, MA)coupled to an infrared microscope (model A590, Bruker) fittedwith a liquid N
2
cooled mercury-cadmium-tellurium detector.The Bruker system was controlled by an IBM-compatible PCrunning OPUS version 2.2 software. The absorbance spectrawere collected between 3650 cm
2
1
and 700 cm
2
1
at a spectralresolution of 8 cm
2
1
with 10 scans coadded and averaged. ABlackman-Harris 4-term apodization function was used, with azero-filling factor of 2. The pinhole aperture on the micro-scope was set at a diameter of 1.2 mm, with the diameter of theactual region scanned being 80
m
m.To minimize differences between spectra due to baseline
shifts, the spectra were baseline corrected using the “
RubberBand
” algorithm within the
OPUS 2.2
software using 200 base-line points and excluding the CO
2
bands. Spectra were normal-ized to the silica band at 1074 cm
2
1
to account for any differ-ences in the deposit thickness.
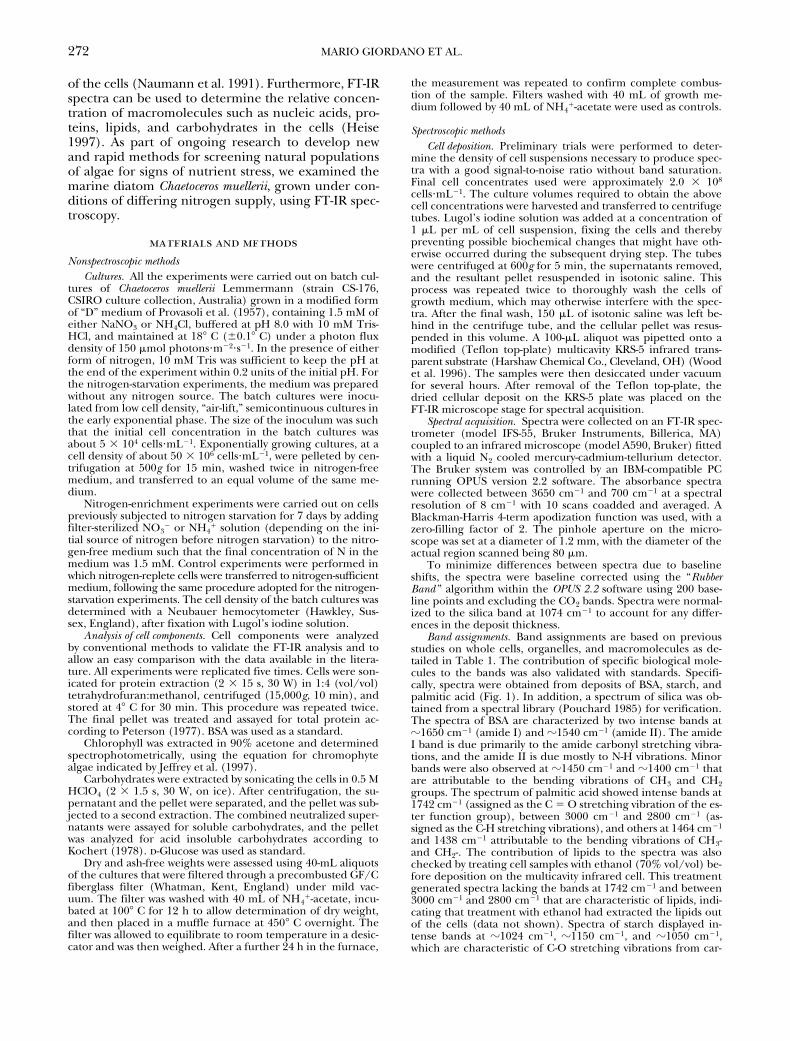
Band assignments.
Band assignments are based on previousstudies on whole cells, organelles, and macromolecules as de-tailed in Table 1. The contribution of specific biological mole-cules to the bands was also validated with standards. Specifi-cally, spectra were obtained from deposits of BSA, starch, andpalmitic acid (Fig. 1). In addition, a spectrum of silica was ob-tained from a spectral library (Pouchard 1985) for verification.The spectra of BSA are characterized by two intense bands at
z
1650 cm
2
1
(amide I) and
z
1540 cm
2
1
(amide II). The amideI band is due primarily to the amide carbonyl stretching vibra-tions, and the amide II is due mostly to N-H vibrations. Minorbands were also observed at
z
1450 cm
2
1
and
z
1400 cm
2
1
thatare attributable to the bending vibrations of CH
3
and CH
2
groups. The spectrum of palmitic acid showed intense bands at1742 cm
2
1
(assigned as the C
5
O stretching vibration of the es-ter function group), between 3000 cm
2
1
and 2800 cm
2
1
(as-signed as the C-H stretching vibrations), and others at 1464 cm
2
1
and 1438 cm
2
1
attributable to the bending vibrations of CH
3
-and CH
2
-. The contribution of lipids to the spectra was alsochecked by treating cell samples with ethanol (70% vol/vol) be-fore deposition on the multicavity infrared cell. This treatmentgenerated spectra lacking the bands at 1742 cm
2
1
and between3000 cm
2
1
and 2800 cm
2
1
that are characteristic of lipids, indi-cating that treatment with ethanol had extracted the lipids outof the cells (data not shown). Spectra of starch displayed in-tense bands at
z
1024 cm
2
1
,
z
1150 cm
2
1
, and
z
1050 cm
2
1
,which are characteristic of C-O stretching vibrations from car-
FT-IR AND MACROMOLECULAR POOLS
273
bohydrates. The spectrum of silica obtained from a spectral li-brary shows an intense and broad band at
z
1080 cm
2
1
assignedas a silicon-oxygen stretching vibration.
results
FT-IR studiesFT-IR spectra of
Chaetoceros muellerii
cells.
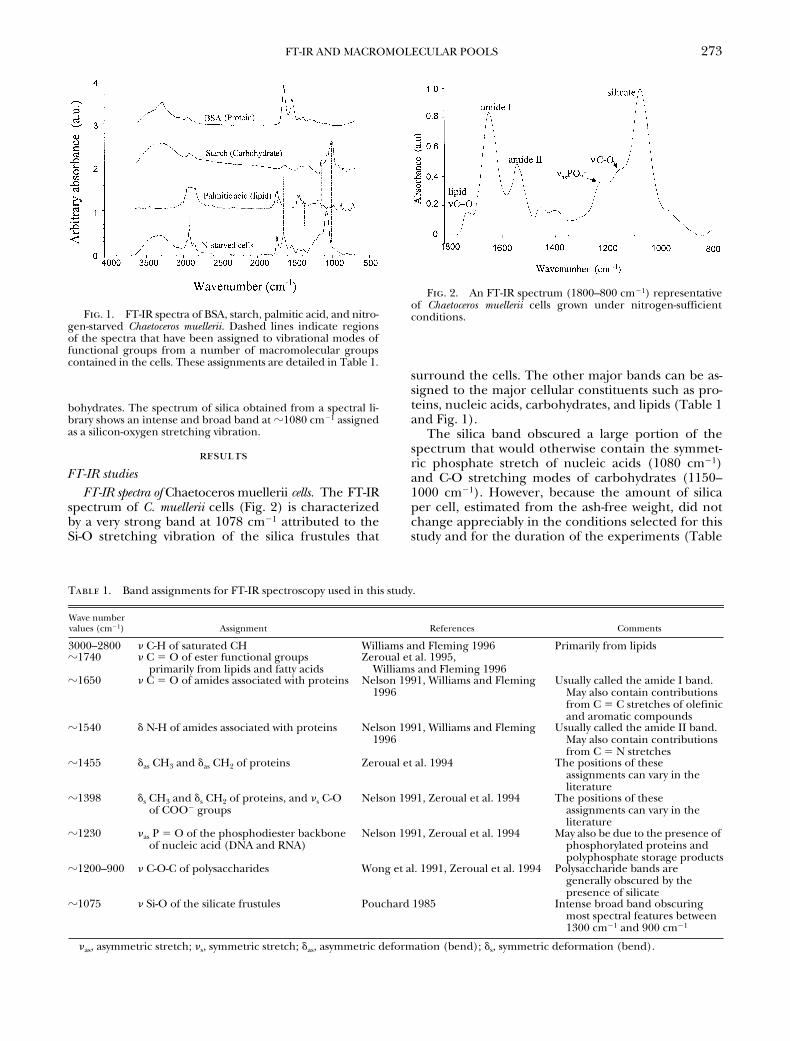
The FT-IRspectrum of
C. muellerii
cells (Fig. 2) is characterizedby a very strong band at 1078 cm
2
1
attributed to theSi-O stretching vibration of the silica frustules that
surround the cells. The other major bands can be as-signed to the major cellular constituents such as pro-teins, nucleic acids, carbohydrates, and lipids (Table 1and Fig. 1).
The silica band obscured a large portion of thespectrum that would otherwise contain the symmet-ric phosphate stretch of nucleic acids (1080 cm
2
1
)and C-O stretching modes of carbohydrates (1150–1000 cm
2
1
). However, because the amount of silicaper cell, estimated from the ash-free weight, did notchange appreciably in the conditions selected for thisstudy and for the duration of the experiments (Table
Fig. 1. FT-IR spectra of BSA, starch, palmitic acid, and nitro-gen-starved Chaetoceros muellerii. Dashed lines indicate regionsof the spectra that have been assigned to vibrational modes offunctional groups from a number of macromolecular groupscontained in the cells. These assignments are detailed in Table 1.
Fig. 2. An FT-IR spectrum (1800–800 cm21) representativeof Chaetoceros muellerii cells grown under nitrogen-sufficientconditions.
Table
1. Band assignments for FT-IR spectroscopy used in this study.
Wave numbervalues (cm
2
1
) Assignment References Comments
3000–2800
n
C-H of saturated CH Williams and Fleming 1996 Primarily from lipids
z
1740
n
C
5
O of ester functional groupsprimarily from lipids and fatty acids
Zeroual et al. 1995,Williams and Fleming 1996
z1650 n C 5 O of amides associated with proteins Nelson 1991, Williams and Fleming1996
Usually called the amide I band. May also contain contributionsfrom C 5 C stretches of olefinicand aromatic compounds
z1540 d N-H of amides associated with proteins Nelson 1991, Williams and Fleming1996
Usually called the amide II band. May also contain contributions from C 5 N stretches
z1455 das CH3 and das CH2 of proteins Zeroual et al. 1994 The positions of these assignments can vary in the literature
z1398 ds CH3 and ds CH2 of proteins, and ns C-Oof COO2 groups
Nelson 1991, Zeroual et al. 1994 The positions of these assignments can vary in the literature
z1230 nas P 5 O of the phosphodiester backboneof nucleic acid (DNA and RNA)
Nelson 1991, Zeroual et al. 1994 May also be due to the presence of phosphorylated proteins and polyphosphate storage products
z1200–900 n C-O-C of polysaccharides Wong et al. 1991, Zeroual et al. 1994 Polysaccharide bands are generally obscured by the presence of silicate
z1075 n Si-O of the silicate frustules Pouchard 1985 Intense broad band obscuring most spectral features between 1300 cm21 and 900 cm21
nas, asymmetric stretch; ns, symmetric stretch; das, asymmetric deformation (bend); ds, symmetric deformation (bend).
274 MARIO GIORDANO ET AL.
2), the silica proved to be an ideal and convenientband to which the spectra could be normalized.
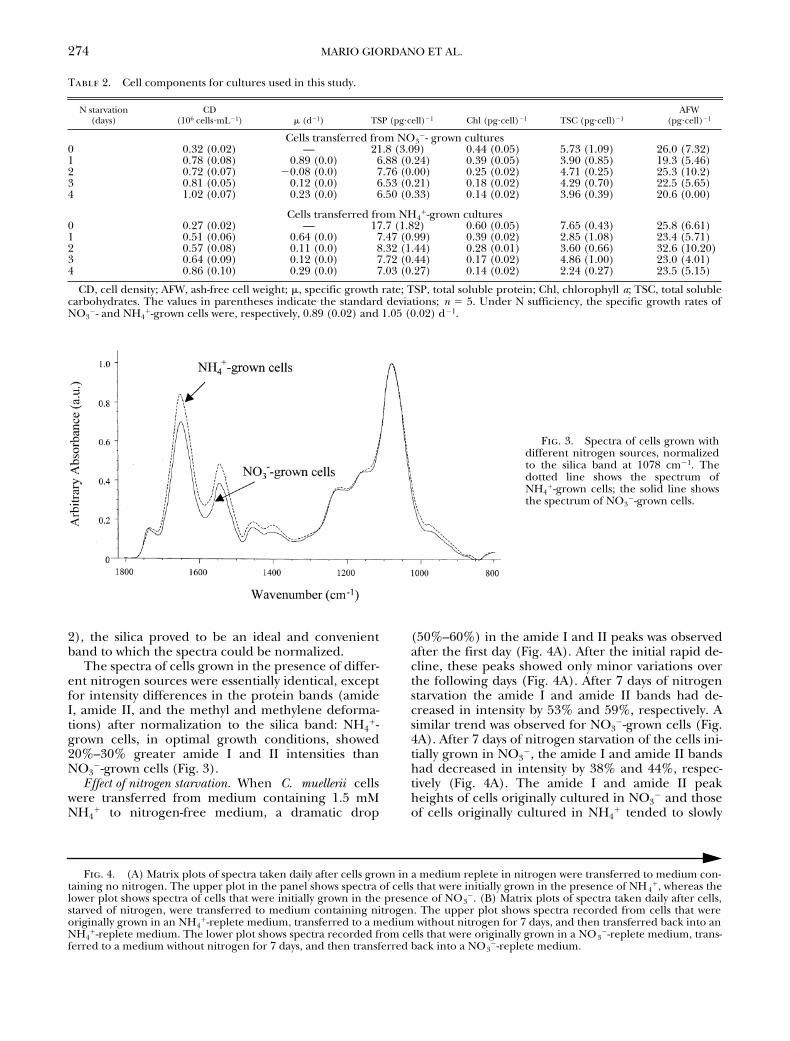
The spectra of cells grown in the presence of differ-ent nitrogen sources were essentially identical, exceptfor intensity differences in the protein bands (amideI, amide II, and the methyl and methylene deforma-tions) after normalization to the silica band: NH4
1-grown cells, in optimal growth conditions, showed20%–30% greater amide I and II intensities thanNO3
2-grown cells (Fig. 3).Effect of nitrogen starvation. When C. muellerii cells
were transferred from medium containing 1.5 mMNH4
1 to nitrogen-free medium, a dramatic drop
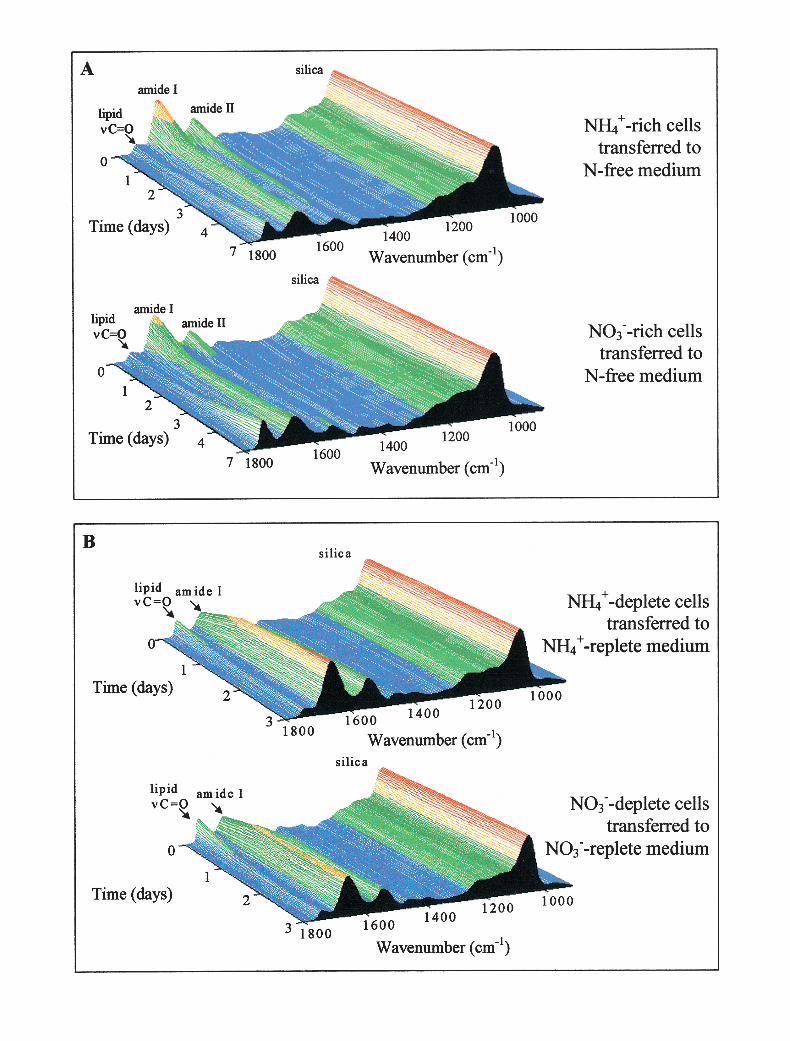
(50%–60%) in the amide I and II peaks was observedafter the first day (Fig. 4A). After the initial rapid de-cline, these peaks showed only minor variations overthe following days (Fig. 4A). After 7 days of nitrogenstarvation the amide I and amide II bands had de-creased in intensity by 53% and 59%, respectively. Asimilar trend was observed for NO3
2-grown cells (Fig.4A). After 7 days of nitrogen starvation of the cells ini-tially grown in NO3
2, the amide I and amide II bandshad decreased in intensity by 38% and 44%, respec-tively (Fig. 4A). The amide I and amide II peakheights of cells originally cultured in NO3
2 and thoseof cells originally cultured in NH4
1 tended to slowly
Table 2. Cell components for cultures used in this study.
N starvation (days)
CD(106 cells?mL21) m (d21) TSP (pg?cell)21 Chl (pg?cell)21 TSC (pg?cell)21
AFW (pg?cell)21
Cells transferred from NO32- grown cultures
0 0.32 (0.02) — 21.8 (3.09) 0.44 (0.05) 5.73 (1.09) 26.0 (7.32)1 0.78 (0.08) 0.89 (0.0) 6.88 (0.24) 0.39 (0.05) 3.90 (0.85) 19.3 (5.46)2 0.72 (0.07) 20.08 (0.0) 7.76 (0.00) 0.25 (0.02) 4.71 (0.25) 25.3 (10.2)3 0.81 (0.05) 0.12 (0.0) 6.53 (0.21) 0.18 (0.02) 4.29 (0.70) 22.5 (5.65)4 1.02 (0.07) 0.23 (0.0) 6.50 (0.33) 0.14 (0.02) 3.96 (0.39) 20.6 (0.00)
Cells transferred from NH41-grown cultures
0 0.27 (0.02) — 17.7 (1.82) 0.60 (0.05) 7.65 (0.43) 25.8 (6.61)1 0.51 (0.06) 0.64 (0.0) 7.47 (0.99) 0.39 (0.02) 2.85 (1.08) 23.4 (5.71)2 0.57 (0.08) 0.11 (0.0) 8.32 (1.44) 0.28 (0.01) 3.60 (0.66) 32.6 (10.20)3 0.64 (0.09) 0.12 (0.0) 7.72 (0.44) 0.17 (0.02) 4.86 (1.00) 23.0 (4.01)4 0.86 (0.10) 0.29 (0.0) 7.03 (0.27) 0.14 (0.02) 2.24 (0.27) 23.5 (5.15)
CD, cell density; AFW, ash-free cell weight; m, specific growth rate; TSP, total soluble protein; Chl, chlorophyll a; TSC, total solublecarbohydrates. The values in parentheses indicate the standard deviations; n 5 5. Under N sufficiency, the specific growth rates ofNO3
2- and NH41-grown cells were, respectively, 0.89 (0.02) and 1.05 (0.02) d21.
Fig. 3. Spectra of cells grown withdifferent nitrogen sources, normalizedto the silica band at 1078 cm21. Thedotted line shows the spectrum ofNH4
1-grown cells; the solid line showsthe spectrum of NO3
2-grown cells.
Fig. 4. (A) Matrix plots of spectra taken daily after cells grown in a medium replete in nitrogen were transferred to medium con-taining no nitrogen. The upper plot in the panel shows spectra of cells that were initially grown in the presence of NH4
1, whereas thelower plot shows spectra of cells that were initially grown in the presence of NO3
2. (B) Matrix plots of spectra taken daily after cells,starved of nitrogen, were transferred to medium containing nitrogen. The upper plot shows spectra recorded from cells that wereoriginally grown in an NH4
1-replete medium, transferred to a medium without nitrogen for 7 days, and then transferred back into anNH4
1-replete medium. The lower plot shows spectra recorded from cells that were originally grown in a NO32-replete medium, trans-
ferred to a medium without nitrogen for 7 days, and then transferred back into a NO32-replete medium.
FT-IR AND MACROMOLECULAR POOLS 275
276 MARIO GIORDANO ET AL.
converge to similar values with time, and their differ-ences reached negligible values after 5 days in nitro-gen-free medium (data not shown).
The bands attributed to lipids (C-H stretching be-tween 3000 cm21 and 2800 cm21 not shown; ester C 5O 1740 cm21; Fig. 4) showed an opposite trend to theamide I and amide II peaks; this was especially obvi-ous when NO3
2-grown cells were transferred into ni-trogen-free medium. The increase in the height ofthese bands continued for the whole duration of theexperiments but was greatest in the last 3–4 days ofthe starvation period under both treatments. In thenitrate-grown cells, the 1740-cm21 band almost tripledafter 7 days in the nitrogen-free medium, as com-pared with its height at the time of transfer into nitro-gen-free medium. In NH4
1-grown cells, transfer into ni-trogen-free medium caused the 1740-cm21 peak heightto increase to a much lesser degree: After 7 days itsheight was about 89% greater than the initial one.
To better resolve changes in the amide bands, theexperiment was repeated, using NH4
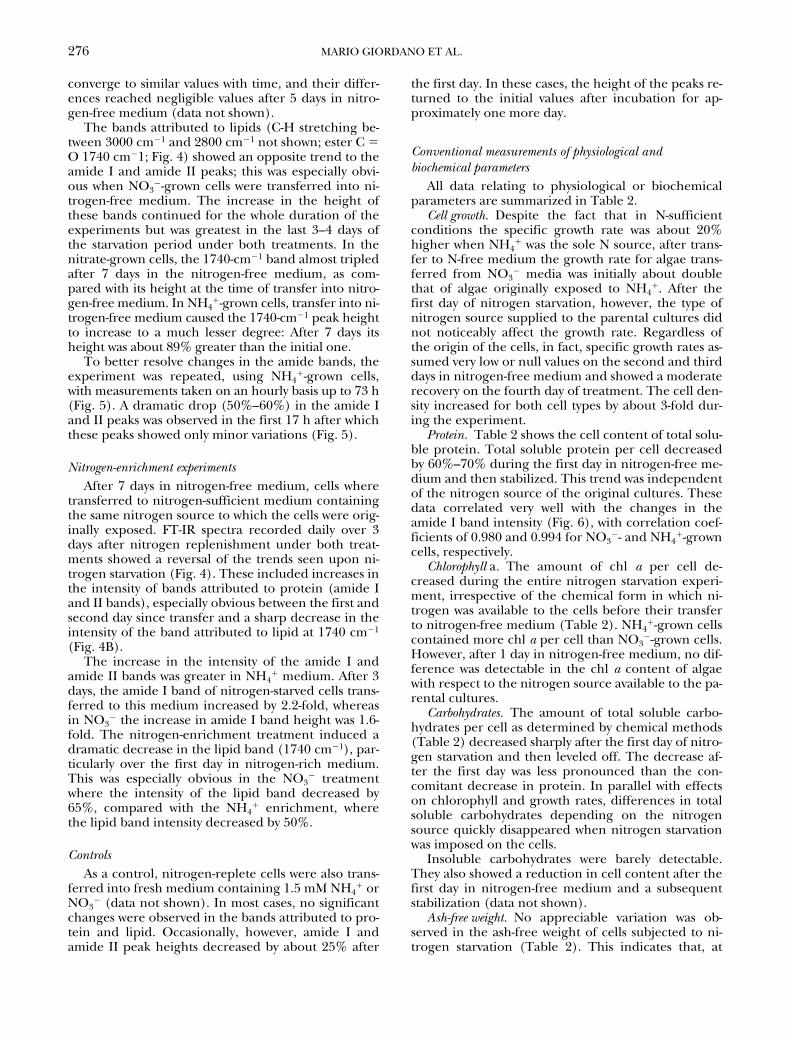
1-grown cells,with measurements taken on an hourly basis up to 73 h(Fig. 5). A dramatic drop (50%–60%) in the amide Iand II peaks was observed in the first 17 h after whichthese peaks showed only minor variations (Fig. 5).
Nitrogen-enrichment experimentsAfter 7 days in nitrogen-free medium, cells where
transferred to nitrogen-sufficient medium containingthe same nitrogen source to which the cells were orig-inally exposed. FT-IR spectra recorded daily over 3days after nitrogen replenishment under both treat-ments showed a reversal of the trends seen upon ni-trogen starvation (Fig. 4). These included increases inthe intensity of bands attributed to protein (amide Iand II bands), especially obvious between the first andsecond day since transfer and a sharp decrease in theintensity of the band attributed to lipid at 1740 cm21
(Fig. 4B).The increase in the intensity of the amide I and
amide II bands was greater in NH41 medium. After 3
days, the amide I band of nitrogen-starved cells trans-ferred to this medium increased by 2.2-fold, whereasin NO3
2 the increase in amide I band height was 1.6-fold. The nitrogen-enrichment treatment induced adramatic decrease in the lipid band (1740 cm21), par-ticularly over the first day in nitrogen-rich medium.This was especially obvious in the NO3
2 treatmentwhere the intensity of the lipid band decreased by65%, compared with the NH4
1 enrichment, wherethe lipid band intensity decreased by 50%.
ControlsAs a control, nitrogen-replete cells were also trans-
ferred into fresh medium containing 1.5 mM NH41 or
NO32 (data not shown). In most cases, no significant
changes were observed in the bands attributed to pro-tein and lipid. Occasionally, however, amide I andamide II peak heights decreased by about 25% after
the first day. In these cases, the height of the peaks re-turned to the initial values after incubation for ap-proximately one more day.
Conventional measurements of physiological and biochemical parameters
All data relating to physiological or biochemicalparameters are summarized in Table 2.
Cell growth. Despite the fact that in N-sufficientconditions the specific growth rate was about 20%higher when NH4
1 was the sole N source, after trans-fer to N-free medium the growth rate for algae trans-ferred from NO3
2 media was initially about doublethat of algae originally exposed to NH4
1. After thefirst day of nitrogen starvation, however, the type ofnitrogen source supplied to the parental cultures didnot noticeably affect the growth rate. Regardless ofthe origin of the cells, in fact, specific growth rates as-sumed very low or null values on the second and thirddays in nitrogen-free medium and showed a moderaterecovery on the fourth day of treatment. The cell den-sity increased for both cell types by about 3-fold dur-ing the experiment.
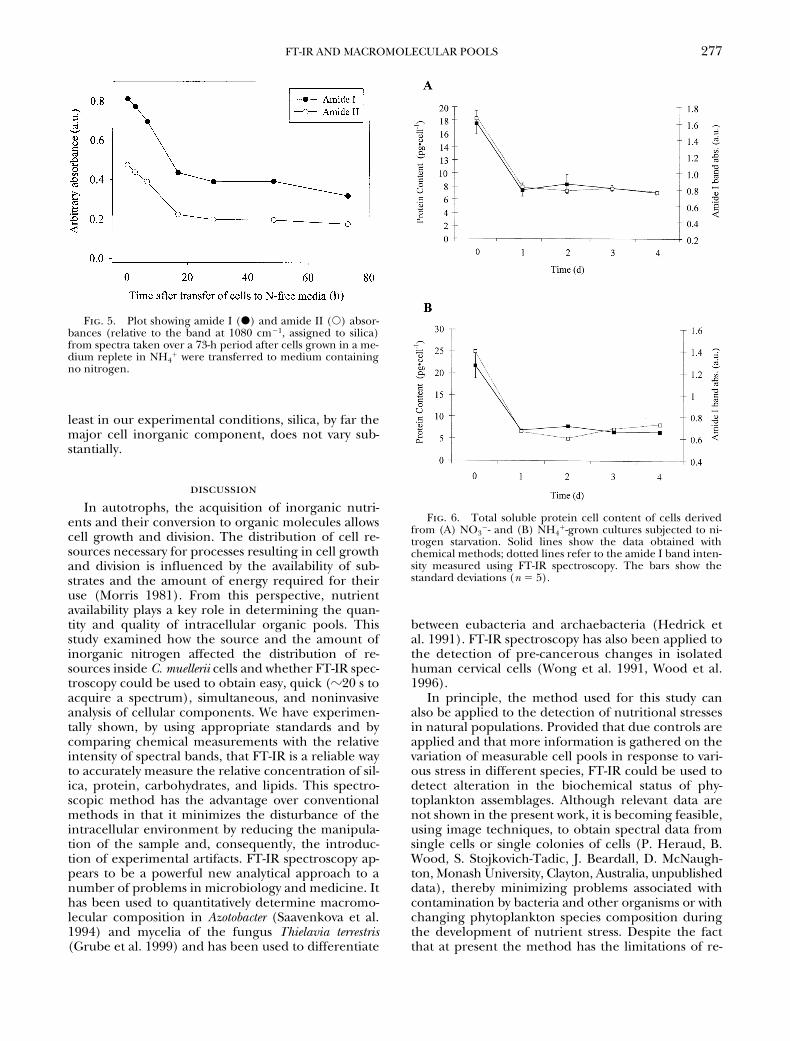
Protein. Table 2 shows the cell content of total solu-ble protein. Total soluble protein per cell decreasedby 60%–70% during the first day in nitrogen-free me-dium and then stabilized. This trend was independentof the nitrogen source of the original cultures. Thesedata correlated very well with the changes in theamide I band intensity (Fig. 6), with correlation coef-ficients of 0.980 and 0.994 for NO3
2- and NH41-grown
cells, respectively.Chlorophyll a. The amount of chl a per cell de-
creased during the entire nitrogen starvation experi-ment, irrespective of the chemical form in which ni-trogen was available to the cells before their transferto nitrogen-free medium (Table 2). NH4
1-grown cellscontained more chl a per cell than NO3
2-grown cells.However, after 1 day in nitrogen-free medium, no dif-ference was detectable in the chl a content of algaewith respect to the nitrogen source available to the pa-rental cultures.
Carbohydrates. The amount of total soluble carbo-hydrates per cell as determined by chemical methods(Table 2) decreased sharply after the first day of nitro-gen starvation and then leveled off. The decrease af-ter the first day was less pronounced than the con-comitant decrease in protein. In parallel with effectson chlorophyll and growth rates, differences in totalsoluble carbohydrates depending on the nitrogensource quickly disappeared when nitrogen starvationwas imposed on the cells.
Insoluble carbohydrates were barely detectable.They also showed a reduction in cell content after thefirst day in nitrogen-free medium and a subsequentstabilization (data not shown).
Ash-free weight. No appreciable variation was ob-served in the ash-free weight of cells subjected to ni-trogen starvation (Table 2). This indicates that, at
FT-IR AND MACROMOLECULAR POOLS 277
least in our experimental conditions, silica, by far themajor cell inorganic component, does not vary sub-stantially.
discussionIn autotrophs, the acquisition of inorganic nutri-
ents and their conversion to organic molecules allowscell growth and division. The distribution of cell re-sources necessary for processes resulting in cell growthand division is influenced by the availability of sub-strates and the amount of energy required for theiruse (Morris 1981). From this perspective, nutrientavailability plays a key role in determining the quan-tity and quality of intracellular organic pools. Thisstudy examined how the source and the amount ofinorganic nitrogen affected the distribution of re-sources inside C. muellerii cells and whether FT-IR spec-troscopy could be used to obtain easy, quick (z20 s toacquire a spectrum), simultaneous, and noninvasiveanalysis of cellular components. We have experimen-tally shown, by using appropriate standards and bycomparing chemical measurements with the relativeintensity of spectral bands, that FT-IR is a reliable wayto accurately measure the relative concentration of sil-ica, protein, carbohydrates, and lipids. This spectro-scopic method has the advantage over conventionalmethods in that it minimizes the disturbance of theintracellular environment by reducing the manipula-tion of the sample and, consequently, the introduc-tion of experimental artifacts. FT-IR spectroscopy ap-pears to be a powerful new analytical approach to anumber of problems in microbiology and medicine. Ithas been used to quantitatively determine macromo-lecular composition in Azotobacter (Saavenkova et al.1994) and mycelia of the fungus Thielavia terrestris(Grube et al. 1999) and has been used to differentiate
between eubacteria and archaebacteria (Hedrick etal. 1991). FT-IR spectroscopy has also been applied tothe detection of pre-cancerous changes in isolatedhuman cervical cells (Wong et al. 1991, Wood et al.1996).
In principle, the method used for this study canalso be applied to the detection of nutritional stressesin natural populations. Provided that due controls areapplied and that more information is gathered on thevariation of measurable cell pools in response to vari-ous stress in different species, FT-IR could be used todetect alteration in the biochemical status of phy-toplankton assemblages. Although relevant data arenot shown in the present work, it is becoming feasible,using image techniques, to obtain spectral data fromsingle cells or single colonies of cells (P. Heraud, B.Wood, S. Stojkovich-Tadic, J. Beardall, D. McNaugh-ton, Monash University, Clayton, Australia, unpublisheddata), thereby minimizing problems associated withcontamination by bacteria and other organisms or withchanging phytoplankton species composition duringthe development of nutrient stress. Despite the factthat at present the method has the limitations of re-
Fig. 5. Plot showing amide I (d) and amide II (s) absor-bances (relative to the band at 1080 cm21, assigned to silica)from spectra taken over a 73-h period after cells grown in a me-dium replete in NH4
1 were transferred to medium containingno nitrogen.
Fig. 6. Total soluble protein cell content of cells derivedfrom (A) NO3
2- and (B) NH41-grown cultures subjected to ni-
trogen starvation. Solid lines show the data obtained withchemical methods; dotted lines refer to the amide I band inten-sity measured using FT-IR spectroscopy. The bars show thestandard deviations (n 5 5).
278 MARIO GIORDANO ET AL.
quiring bulky and expensive equipment, its capabilityto provide comprehensive analysis of the major cellu-lar biochemical fractions suggests that this approachhas considerable future potential for studies of thephysiological responses of algae to varying environ-mental conditions.
In the present study, the intense and broad silicaband, characteristic of diatoms, reduced the numberof measurable compounds by obscuring some of thebands from nucleic acids and carbohydrates. How-ever, because the silica content per cell was found notto vary considerably under controlled growth condi-tions, the silica band was used to normalize the spec-tra. The necessity for normalization came from thefact that the sample deposit was not even, resulting indifferential infrared absorbance from different re-gions of the same sample. Normalization, in fact,could be the limiting factor in the application of themethodology used for this work on non-diatomaceousalgae and other organisms, given the susceptibilityof most cell pools to changes in external conditions.Of course, in these cases the measurement of rela-tive changes in macromolecular concentrations, refer-enced to a particular molecular class (proteins, for in-stance), would be possible. A solution to the problemwould be the selection or construction of a markerthat couples a good infrared absorbance with the ab-sence of interference with the portion of the spectraof biological interest. For example, potassium thyoci-anate, which has a strong absorbance in the regionaround 2250 cm21, well away from signals of biologi-cal interests, was successfully used by Shaw et al.(1998) as an internal marker for quantification ofmultiple analytes in blood serum.
The macromolecular changes observed in Chaeto-ceros in this study, using FT-IR spectroscopy, are con-sistent both with measurements using conventionalchemical analysis and with observations (also basedon chemical analyses) reported elsewhere in the liter-ature. Thus, growth on NO3
2 as the nitrogen source,rather than NH4
1, substantially affects the carbon ac-quisition and resource partitioning in chlorophyte mi-croalgae, when high concentrations of nitrogen areavailable to the cells (Giordano 1997, Giordano andBowes 1997). However, the effect of the nitrogensource is attenuated when nitrogen is present at con-centrations in the order of magnitude of those usuallyencountered in the sea (Dalsass 2000, M. Giordanounpublished data). The data reported here, showingthe tendency of the differences between NO3
2- andNH4
1-grown Chaetoceros cells to disappear with theprogression of nitrogen starvation, support the previ-ous studies. To test the method, we used rather highinitial N concentrations (1.5 mM). Our experimentalprotocol, however, appears to have a sufficient sensi-tivity to detect even relatively small changes in macro-molecular pools, as those that can be expected in thefield. For protein, for instance, variations in the orderof few picograms per cell can be confidently detected(Fig. 4, Table 2).
Most variation in the cell protein content tookplace within the first 15–20 h since the cells weretransferred from nitrogen-sufficient medium to nitro-gen-free medium. This change was in part the resultof continued cell division during the first day, possiblycombined with starvation and the consequent dilu-tion of cellular pools by new biomass production (Mc-Glathery et al. 1996). The high growth rates of cellssubjected to nitrogen deprivation during the first dayof treatment also indicate that the cells can success-fully cope with quite large variation of nitrogen cellquota (Parslow et al. 1984, Borchardt 1996). It shouldbe noticed that while the rate of decrease of total sol-uble protein was similar for algae transferred fromNO3
2-containing medium and those transferred fromNH4
1-containing medium, the division rates, over thefirst 24 h, were substantially higher for cells originallycultured in the presence of NO3
2. This may be due tothe fact that microalgae more readily store NO3
2 thanNH4
1 (Dortch 1982, Stolte and Riegman 1995, Mc-Glathery et al. 1996). This is also in agreement withthe observations of Parslow et al. (1984), showing thatNO3
2-starved cells are able to better control the cellquota of nitrogen than their NH4
1-starved counter-parts. Moreover, an equal initial decrease in proteinobserved in NO3
2- and NH41-starved algae, despite
the differences in initial growth rates, indicates thatthe decline in nitrogen availability induced a substan-tial rearrangement of intracellular pools (McGlatheryet al. 1996) that drove carbon and nitrogen away fromincorporation into protein, independent from thegrowth dilution effect. The results also demonstratethat a conspicuous portion of the carbon mobilizedduring nitrogen deficiency was reallocated into lipidsin Chaetoceros; this reallocation took place for the wholeduration of the nitrogen starvation treatment and wasespecially evident for cells derived from NO3
2-growncultures. By contrast, no appreciable change in thestorage of polysaccharides was observed, as is oftenfound in diatoms (Morris 1981, Larson and Rees1996). The larger increase in the lipid content in cellsthat originated from NO3
2 cultures could be derivedfrom mobilization of carbon from a larger amino acidcell content present in cells grown on NO3
2 (McGlath-ery et al. 1996).
Upon addition of NH41 and NO3
2 to nitrogen-starved cultures, the FT-IR spectra regressed to thoseobserved before nitrogen starvation. However, theprotein content of the cell recovered at a slower ratethan it was depleted. These results are similar to thosedetermined for other aquatic autotrophs (McGlatheryet al. 1996).
In summary, the study of the changes in macromo-lecular pools in microalgal cells is generally time con-suming and complex because of the need to extractand at least partially purify the various classes of mole-cules. In this study, we attempted to conduct an analy-sis on the partitioning of resources in C. muellerii cellsusing FT-IR spectroscopy. This method allowed us todetermine the relative levels of some of the major
FT-IR AND MACROMOLECULAR POOLS 279
classes of cell compounds in one step, using a verysmall amount of material and manipulating the cellsto a minimum extent. Changes observed on the ba-sis of FT-IR spectra showed close correspondence tochanges measured by more conventional means. Thus,Chaetoceros responded to nitrogen limitation by reduc-ing rates of protein (re)synthesis. This induced a de-crease of the intracellular protein pool as long as thegrowth rate was higher than the protein (re)synthesisrate. Carbon was reallocated into lipids for the wholeduration of the nitrogen-starvation treatment, espe-cially for cells derived from NO3
2-grown cultures.
D. McNaughton and J. Beardall acknowledge support from theAustralian Research Council under grant A19800773.
Borchardt, M. A. 1996. Nutrients. In Stevenson, R. J., Lowe, R. L. &Bothwell, M. L. [Eds.] Algal Ecology: Freshwater Benthic Ecosys-tems. Academic Press, London, pp. 183–227.
Dalsass, A. 2000. Ruolo della Fosfoenolpiruvato Carbossilasi Nell’assimi-lazione di Azoto. MA thesis. University of Ancona, Ancona, Italy,120 pp.
Dortch, Q. 1982. Effect of growth conditions on accumulation ofinternal nitrate, ammonium, amino acids and protein in threemarine diatoms. J. Exp. Marine Biol. Ecol. 61:243–64.
Falkowski, P. G. 1994. The role of phytoplankton photosynthesis inglobal biogeochemical cycles. Photosynth. Res. 39:235–58.
Geider, R. J. & Osborne, B. A. 1989. Respiration and microalgalgrowth: a review of the quantitative relationship between darkrespiration and growth. New Phytol. 112:327–94.
Giordano, M. 1997. Adaptation of Dunaliella salina (Volvocales,Chlorophyceae) to growth on NH4
1 as the sole nitrogensource. Phycologia 36:345–50.
Giordano, M. & Bowes, G. 1997. Gas exchanges, metabolism, andmorphology of Dunaliella salina in response to the CO2 con-centration and nitrogen source used for growth. Plant Physiol.115:1049–56.
Giordano, M., Pezzoni, V. & Hell, R. 2000. Strategies for the allo-cation of resources under sulfur limitation in the green algaDunaliella salina. Plant Physiol. 124:857–64.
Grube, M., Zagreba, E., Gromozova, E. & Fomina, M. 1999. Com-parative investigation of the macromolecular composition ofmycelia forms of Thielavia terrestris by infrared spectroscopy. Vi-brat. Spectrosc. 19:301–6.
Hedrick, D. B., Nivens, D. E., Stafford, C. & White, D. C. 1991.Rapid differentiation of archaebacteria from eubacteria by dif-fuse reflectance FTIR spectroscopic analysis of lipid. J. Micro-biol. Methods 13:67–73
Heise, H. M. 1997. Medical applications of infrared spectroscopy.Mikrochim. Acta 14(Suppl):67–77.
Jeffrey, S. W., Mantoura, R. F. C. & Wright, S. W. 1997. Phytoplank-ton Pigments in Oceanography: Guidelines to Modern Methods.UNESCO Publishing, Paris, 661 pp.
Kochert, G. 1978. Carbohydrate determination by the phenol-sulfu-ric acid method. In Hellebust, J. A. & Craigie, J. S. [Eds.] Hand-book of Phycological Methods. Physiological and Biochemical Methods.Cambridge University Press, Cambridge, pp. 95–7.
Larson, T. R. & Rees, T. A. V. 1996. Changes in cell compositionand lipid metabolism mediated by sodium and nitrogen avail-ability in the marine diatom Phaeodactylum tricornutum (Bacilla-riophyceae). J. Phycol. 32:388–93.
McGlathery, K. J., Pedersen, M. F. & Borum, J. 1996. Changes inintracellular nitrogen pools and feedback controls on nitro-gen uptake in Chaetomorpha linum (Chlorophyta). J. Phycol. 32:393–401.
Morris, I. 1981. Photosynthetic products, physiological state andphytoplankton growth. Can. Bull. Fish. Aquat. Sci. 210:83–102.
Naumann, D., Helman, D. & Labischinski, H. 1991. Microbiologicalcharacterisations by FTIR spectroscopy. Nature 351:81–2
Nelson, W. H. 1991. Modern Techniques for Rapid Microbiological Anal-ysis. VCH Publishers, New York, 263 pp.
Parslow, J. S., Harrison, P. J. & Thompson, P. A. 1984. Saturated up-take kinetics: transient response of the marine diatom Thalassi-osira pseudonana to ammonium, nitrate, silicate or phosphatestarvation. Mar. Biol. 83:51–9.
Peterson, G. L. 1977. Simplification of the protein assay method ofLowry et al. which is more generally applicable. Anal. Biochem.83:346–56.
Pouchard, C. J. 1985. Aldrich Library of FT-IR Spectra. Ed. 1, Vol. 2. Al-drich Chemical Company Inc., Milwaukee, WI, 1567 pp.
Provasoli, L., McLachlan, J. J. & Droop, M. R. 1957. The develop-ment of artificial media for marine algae. Arch. Microbiol. 25:392–428.
Saavenkova, L., Bonartseva, G., Gertsberg, Z., Besskina, N., Zagreba,J. &. Grube, M. 1994. Nitrogen fixation and poly-3-hydroxybu-tyrate accumulation by some Azotobacter genus bacteria strains.Proc. Latv. Acad. Sci. B 562/563:89–92.
Shaw, R. A., Kotowich, S., Leroux, M. & Mantsch, H. H. 1998. Multi-analyte serum analysis using mid-infared spectroscopy. Anal.Clin. Biochem. 35:624–32.
Stolte, W. & Riegman, R. 1995. Effect of phytoplankton cell size ontransient-state nitrate and ammonium uptake kinetics. Microbi-ology 141:1221–9.
Turpin, D. H. 1991. Effects of inorganic N availability on algal pho-tosynthesis and carbon metabolism. J. Phycol. 27:14–20.
Williams, D. H. & Fleming, I. 1996. Spectroscopic Methods in OrganicChemistry. Ed. 5. McGraw-Hill International Ltd., London, 329 pp.
Wong, P. T. T., Wong, R. H., Caputo, T. A., Godwin, T. A. & Rigas,B. 1991. Infrared spectroscopy of exfoliated human cervicalcells: evidence of extensive structural changes during carcino-genesis. Proc. Natl. Acad. Sci. USA 88:10988–92.
Wood, B. R., Quinn, M. A., Burden, F. R. & McNaughton, D. 1996.An investigation into FTIR spectroscopy as a biodiagnostic toolfor cervical cancer. Biospectroscopy 2:143–53.
Zeroual, W., Choisy, C., Doglie, S. M., Bobichon H., Angiboust, J-F.& Manfait, M. 1994. Monitoring of bacterial growth and struc-tural analysis as probed by FT-IR spectroscopy. Biochim. Biophys.Acta. 1222:171–8.
Zeroual, W., Manfait, M., & Choisy, C. 1995. FT-IR spectroscopystudy of perturbations induced by antibiotic on bacteria.Pathol. Biol. 43:300–4.
Related Documents