Instructions for use Title Four-point bending test of determining stress-strain curves asymmetric between tension and compression Author(s) Kato, Hiroyuki; Tottori, Yutaka; Sasaki, Kazuaki Citation Experimental Mechanics, 54(3): 489-492 Issue Date 2014-03 Doc URL http://hdl.handle.net/2115/58040 Rights The final publication is available at Springer via http://dx.doi.org/10.1007/s11340-013-9791-9 Type article (author version) File Information HKato_revised.pdf Hokkaido University Collection of Scholarly and Academic Papers : HUSCAP

Welcome message from author
This document is posted to help you gain knowledge. Please leave a comment to let me know what you think about it! Share it to your friends and learn new things together.
Transcript

Instructions for use
Title Four-point bending test of determining stress-strain curves asymmetric between tension and compression
Author(s) Kato, Hiroyuki; Tottori, Yutaka; Sasaki, Kazuaki
Citation Experimental Mechanics, 54(3): 489-492
Issue Date 2014-03
Doc URL http://hdl.handle.net/2115/58040
Rights The final publication is available at Springer via http://dx.doi.org/10.1007/s11340-013-9791-9
Type article (author version)
File Information HKato_revised.pdf
Hokkaido University Collection of Scholarly and Academic Papers : HUSCAP
Experimental Mechanics, 2014, vol.54, 489-492. manuscript No.(will be inserted by the editor)
Four-point bending test of determining stress-strain
curves asymmetric between tension and compression
Hiroyuki Kato · Yutaka Tottori ·
Kazuaki Sasaki
Submitted Apr.12,2013/ Accepted Aug.1.2013
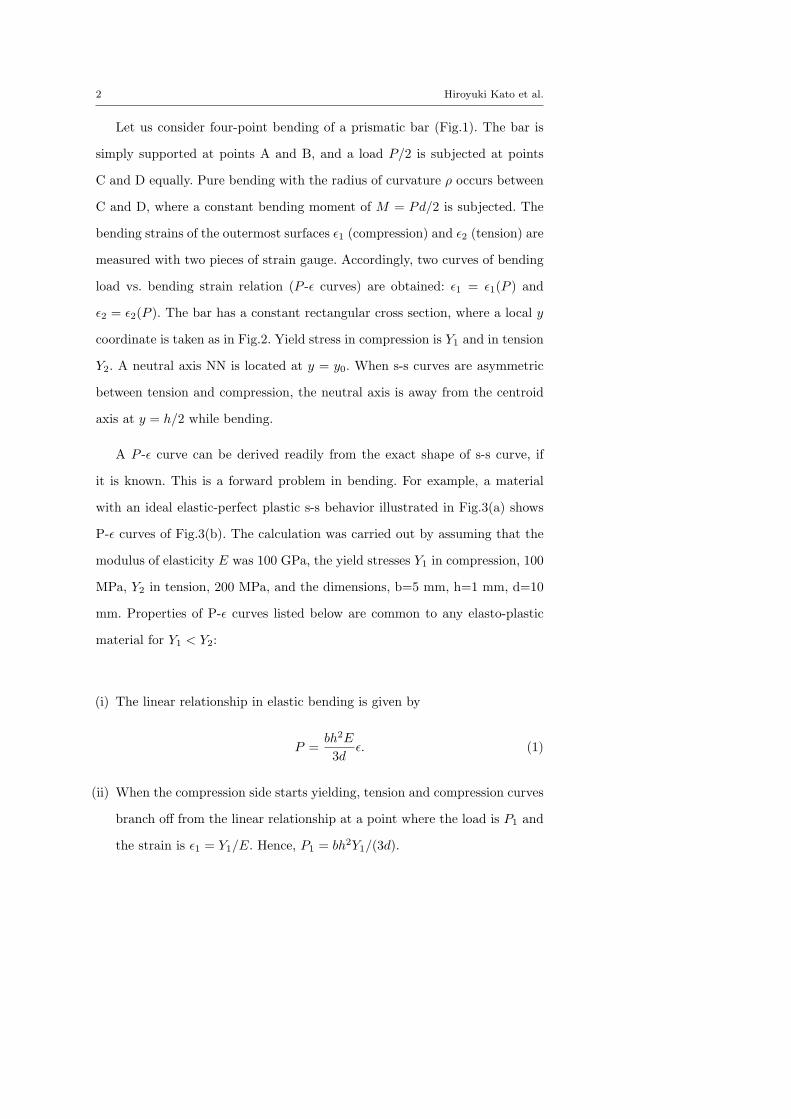
Keywords inverse problem · plasticity · four-point bending
A method of determining both uniaxial tension and compression stress-
strain curves from the result of a single four-point bending test was demon-
strated. Stress-strain curves of magnesium showing tension-compression asym-
metry due to twinning deformation and those of an S45C steel due to the
Bauschinger effect were calculated. The Mayville-Finnie equation was modi-
fied slightly for this calculation. The calculation is sensitive to small change
in the derivative of bending curve, revealing an aspect of inverse problem.
An inverse problem in elasto-plastic bending of a material may be to de-
termine uniaxial stress-strain (s-s) curve of the material. This classical subject
was discussed by Nadai [1]. Later, Mayville and Finnie studied this problem,
and derived a formula [2]. Despite the potential of the formula and also the
usefulness of bending test, very few application has been found.
H.Kato K.SasakiMechanical and Space Engineering, Hokkaido University, Sapporo JapanTel.: +81-11-706-6365Fax: +81-11-706-7889E-mail: [email protected] at JFE Steel Corp. East Japan Works, Kawasaki, Japan
2 Hiroyuki Kato et al.
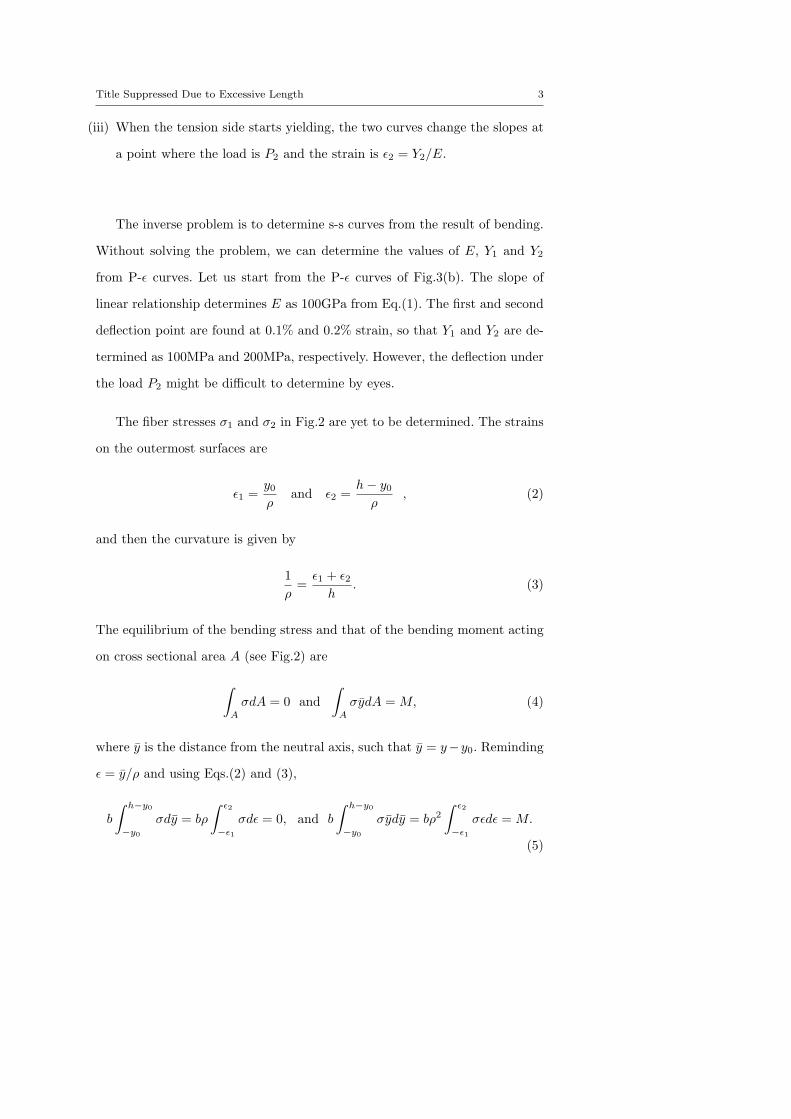
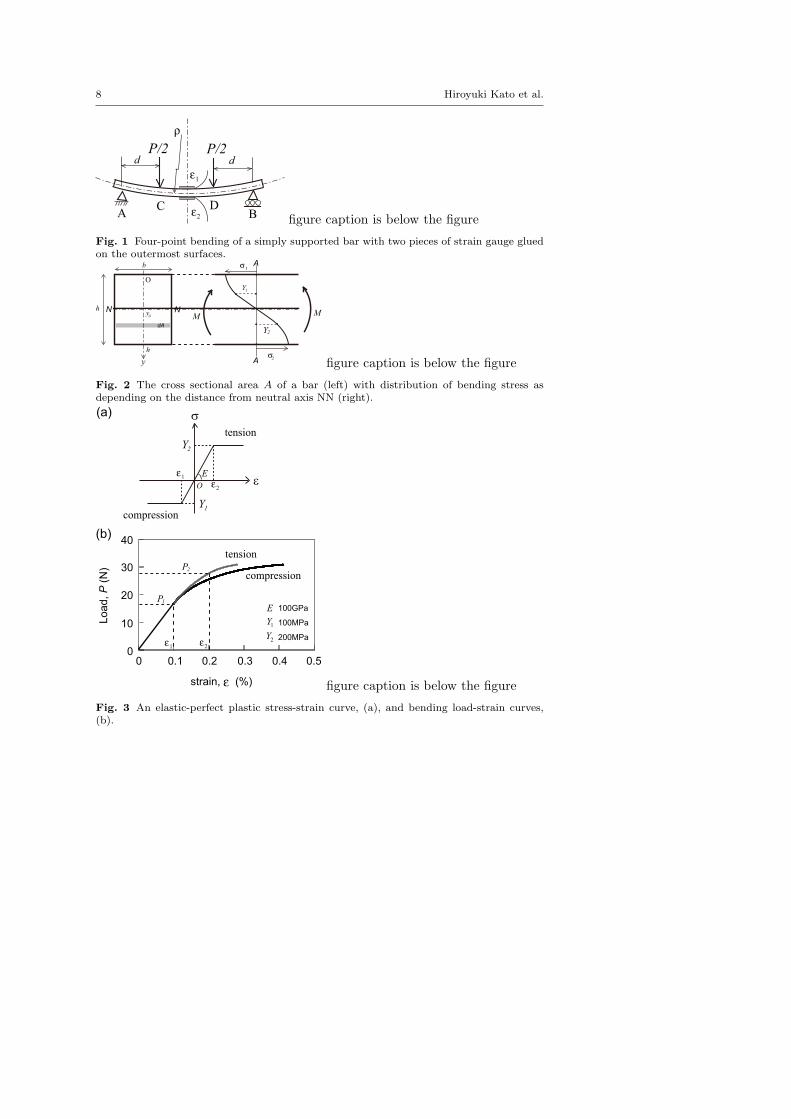
Let us consider four-point bending of a prismatic bar (Fig.1). The bar is
simply supported at points A and B, and a load P/2 is subjected at points
C and D equally. Pure bending with the radius of curvature ρ occurs between
C and D, where a constant bending moment of M = Pd/2 is subjected. The
bending strains of the outermost surfaces ϵ1 (compression) and ϵ2 (tension) are
measured with two pieces of strain gauge. Accordingly, two curves of bending
load vs. bending strain relation (P -ϵ curves) are obtained: ϵ1 = ϵ1(P ) and
ϵ2 = ϵ2(P ). The bar has a constant rectangular cross section, where a local y
coordinate is taken as in Fig.2. Yield stress in compression is Y1 and in tension
Y2. A neutral axis NN is located at y = y0. When s-s curves are asymmetric
between tension and compression, the neutral axis is away from the centroid
axis at y = h/2 while bending.
A P -ϵ curve can be derived readily from the exact shape of s-s curve, if
it is known. This is a forward problem in bending. For example, a material
with an ideal elastic-perfect plastic s-s behavior illustrated in Fig.3(a) shows
P-ϵ curves of Fig.3(b). The calculation was carried out by assuming that the
modulus of elasticity E was 100 GPa, the yield stresses Y1 in compression, 100
MPa, Y2 in tension, 200 MPa, and the dimensions, b=5 mm, h=1 mm, d=10
mm. Properties of P-ϵ curves listed below are common to any elasto-plastic
material for Y1 < Y2:
(i) The linear relationship in elastic bending is given by
P =bh2E
3dϵ. (1)
(ii) When the compression side starts yielding, tension and compression curves
branch off from the linear relationship at a point where the load is P1 and
the strain is ϵ1 = Y1/E. Hence, P1 = bh2Y1/(3d).
Title Suppressed Due to Excessive Length 3
(iii) When the tension side starts yielding, the two curves change the slopes at
a point where the load is P2 and the strain is ϵ2 = Y2/E.
The inverse problem is to determine s-s curves from the result of bending.
Without solving the problem, we can determine the values of E, Y1 and Y2
from P-ϵ curves. Let us start from the P-ϵ curves of Fig.3(b). The slope of
linear relationship determines E as 100GPa from Eq.(1). The first and second
deflection point are found at 0.1% and 0.2% strain, so that Y1 and Y2 are de-
termined as 100MPa and 200MPa, respectively. However, the deflection under
the load P2 might be difficult to determine by eyes.
The fiber stresses σ1 and σ2 in Fig.2 are yet to be determined. The strains
on the outermost surfaces are
ϵ1 =y0ρ
and ϵ2 =h− y0
ρ, (2)
and then the curvature is given by
1
ρ=
ϵ1 + ϵ2h
. (3)
The equilibrium of the bending stress and that of the bending moment acting
on cross sectional area A (see Fig.2) are
∫A
σdA = 0 and
∫A
σydA = M, (4)
where y is the distance from the neutral axis, such that y = y−y0. Reminding
ϵ = y/ρ and using Eqs.(2) and (3),
b
∫ h−y0
−y0
σdy = bρ
∫ ϵ2
−ϵ1
σdϵ = 0, and b
∫ h−y0
−y0
σydy = bρ2∫ ϵ2
−ϵ1
σϵdϵ = M.
(5)
4 Hiroyuki Kato et al.
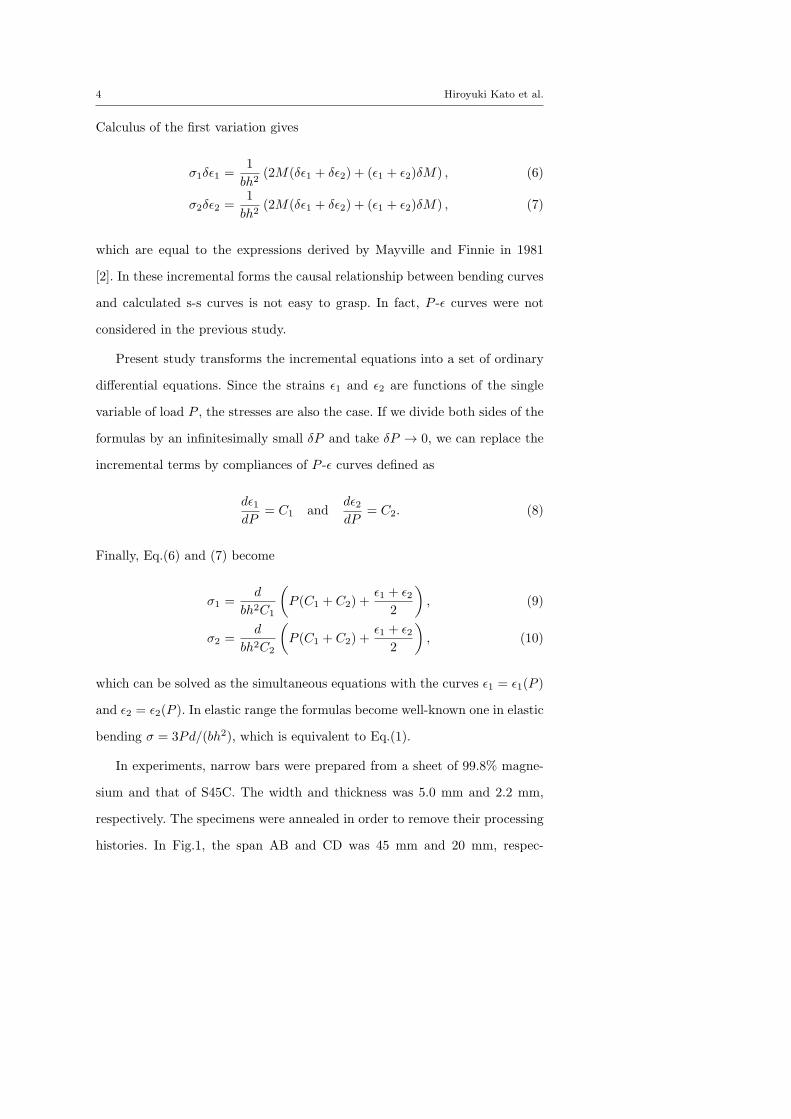
Calculus of the first variation gives
σ1δϵ1 =1
bh2(2M(δϵ1 + δϵ2) + (ϵ1 + ϵ2)δM) , (6)
σ2δϵ2 =1
bh2(2M(δϵ1 + δϵ2) + (ϵ1 + ϵ2)δM) , (7)
which are equal to the expressions derived by Mayville and Finnie in 1981
[2]. In these incremental forms the causal relationship between bending curves
and calculated s-s curves is not easy to grasp. In fact, P -ϵ curves were not
considered in the previous study.
Present study transforms the incremental equations into a set of ordinary
differential equations. Since the strains ϵ1 and ϵ2 are functions of the single
variable of load P , the stresses are also the case. If we divide both sides of the
formulas by an infinitesimally small δP and take δP → 0, we can replace the
incremental terms by compliances of P -ϵ curves defined as
dϵ1dP
= C1 anddϵ2dP
= C2. (8)
Finally, Eq.(6) and (7) become
σ1 =d
bh2C1
(P (C1 + C2) +
ϵ1 + ϵ22
), (9)
σ2 =d
bh2C2
(P (C1 + C2) +
ϵ1 + ϵ22
), (10)
which can be solved as the simultaneous equations with the curves ϵ1 = ϵ1(P )
and ϵ2 = ϵ2(P ). In elastic range the formulas become well-known one in elastic
bending σ = 3Pd/(bh2), which is equivalent to Eq.(1).
In experiments, narrow bars were prepared from a sheet of 99.8% magne-
sium and that of S45C. The width and thickness was 5.0 mm and 2.2 mm,
respectively. The specimens were annealed in order to remove their processing
histories. In Fig.1, the span AB and CD was 45 mm and 20 mm, respec-
Title Suppressed Due to Excessive Length 5
tively, and thus d=12.5 mm. Uniaxial push-pull tests were also carried out for
specimens of 6 mm in gauge with a hydrofluoric Shimadzu Servopulser EHF
machine. Owing to large flexure of thin plate samples, present bending test
was limited below 1.5% strain.
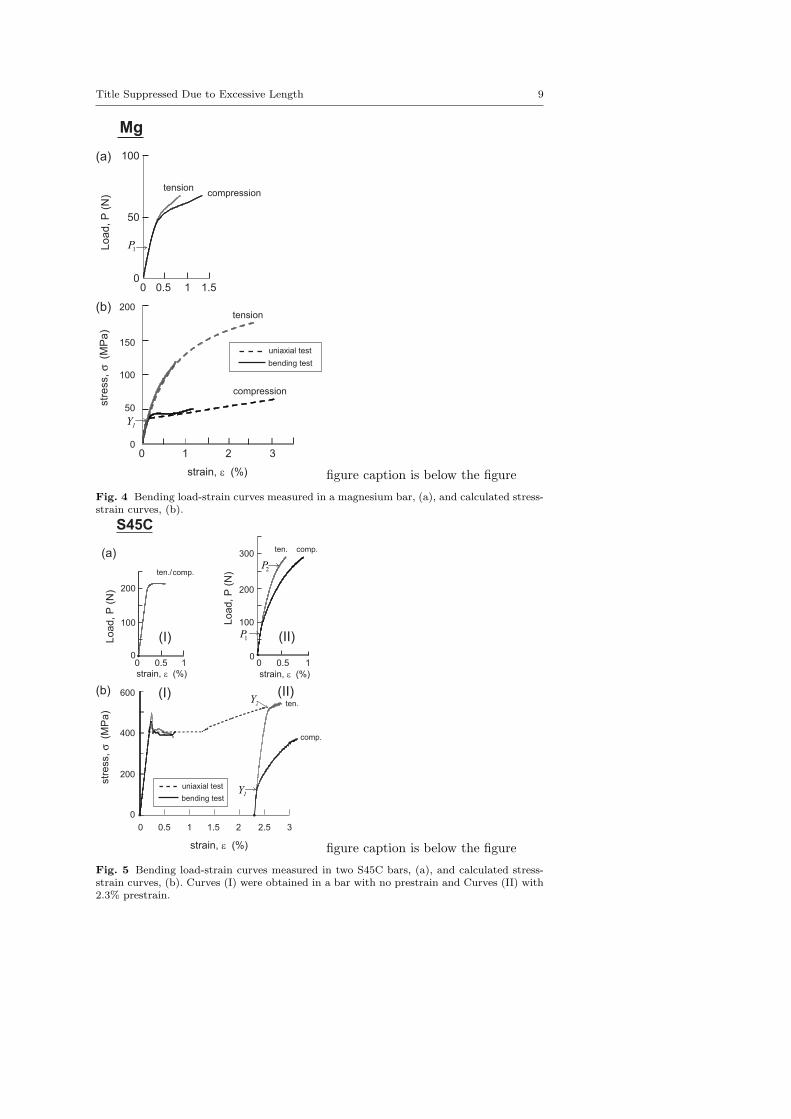
P -ϵ curves of a magnesium bar are shown in Fig.4(a). The curve began
with elastic bending, and then showed a marked deflection at a point under
the load P1=27 N, which gives E=43 GPa from Eq.(1). The strains at this
point ϵ1 was 0.08%. Then the yield stress Y1 is estimated as 34 MPa. These
values agree with those in literatures [3]. As the load was increased above P1,
the strain in compression became larger than that in tension for a given load
P .
The s-s curves calculated from Eq.(9) and (10) are shown as solid lines
in Fig.4(b), while the results of uniaxial tension and compression testing as
dotted lines. The flow stress of the calculated curves agrees well with that of
measured one. It is known that magnesium is plastically deformable at room
temperature due to the mixture of slip and twinning, and that the asymmetry
is a typical nature of twining in hexagonal metals and alloys [3].
P -ϵ curves measured in S45C steel bars are shown in Fig.5(a). An an-
nealed S45C is known to show yield point elongation (YPE) followed by strain-
hardening, which can exhibit pronounced Bauschinger effect. Curves (I) were
measured in an as-annealed specimen to observe YPE, while curves (II) were
in a specimen with 2.3% pre-strain to observe the Bauschinger effect. As ex-
pected, the bending curves (I) were equal between tension and compression,
but the curves (II) were well-separated between them.
The s-s curves calculated from the P -ϵ curves (I) and (II) are shown in
Fig.5(b). The dotted line was obtained by uniaxial testing when giving the
pre-strain. The calculated curves (I) agreed well with the YPE in measured
curve. A yield drop was revealed in the calculated curves. A Bauschinger effect
6 Hiroyuki Kato et al.
was clearly observed in the s-s curve (II) in compression, where the yielding at
Y1 corresponds to the load P1 in P -ϵ curve (II). It is reasonable that the yield
stress in tension remains the same as that of the pre-straining. These results
show that this method is very useful for observing Bauschinger effect.
It is seen that later parts of the calculated curves are somewhat wavy.
Coarse oscillation are seen in Fig.4(b) and Fig.5(b)(I), while fine ones in
Fig.5(b)(II). The oscillation is not the stress-strain behavior of the material
because the curves are smooth when measured by uniaxial testings. Experi-
mental data has shown that the oscillation occurred in the values of C1 and
C2. That is, the calculation is sensitive to the derivative of P -ϵ curves, which
means that a high-order precision is needed in the bending experiment. This
oscillation was not found in the previous study, since the calculation of s-s
curves was carried out in a few points [2]. Some data processing to smooth the
P -ϵ curves may be effective to remove oscillation originating from instrumental
errors.
Conclusively, it was demonstrated first that tension-compression asymmet-
ric s-s curves of pure magnesium and those of S45C steel are determined from
the result of four-point bending tests. A set of simultaneous equations was
derived from the Mayville-Finnie equations. The calculated s-s curves showed
good agreement with the curves measured in uniaxial deformation. The calcu-
lation was found to be able to follow closely both yield drop and yield point
elongation in steels. It was pointed out that the bending test needs a high-order
precision to avoid oscillation in calculated s-s curves.
Acknowledgements We are grateful to Professor T Mori of University of Manchester for
continuous encouragement throughout this work. Thanks are also due to Professor Takashi
Yokoyama of Okayama University of Science, Japan, for helpful advice.

Title Suppressed Due to Excessive Length 7
References
1. Nadai A (1950) Theory of flow and fracture of solids, McGraw-Hill, New York, pp 353-
370.
2. Mayville RA, Finnie I (1981) Uniaxial Stress-Strain Curves from a Bending Test, Exp.
Mech. 22:197-201.
3. Barnett MR (2007) Twinning and the ductility of magnesium alloy: Part I: ”Tension”
twins, Mater. Sci. Eng. A, 464:1-7.
8 Hiroyuki Kato et al.
P/2 P/2d
A BC D
ρ
d
1ε
2εfigure caption is below the figure
Fig. 1 Four-point bending of a simply supported bar with two pieces of strain gauge gluedon the outermost surfaces.
O
h
Y2
M M
1Y
y
h N N
b
0y
1σ
2σ
A
A
dA
figure caption is below the figure
Fig. 2 The cross sectional area A of a bar (left) with distribution of bending stress asdepending on the distance from neutral axis NN (right).
O
σ
εE
0 0.1 0.2 0.3 0.4 0.5
40
30
20
10
0
strain, ε (%)
Lo
ad
, P
(N
)
P1
P2
(a)
(b)
tension
compression
tension
compression
1Y
2Y
2
1
Y
Y
E 100GPa
100MPa
200MPa
1ε
2ε
1ε
2ε
figure caption is below the figure
Fig. 3 An elastic-perfect plastic stress-strain curve, (a), and bending load-strain curves,(b).
Title Suppressed Due to Excessive Length 9
strain, ε (%)
0 1 2 3
0
50
100
10 1.5
tensioncompression
compression
tension
0.5
Lo
ad
, P
(N
)
Mg
1P
1Y
150
50
0
100
str
ess,
σ (M
Pa
)
200
(a)
(b)
uniaxial test
bending test
figure caption is below the figure
Fig. 4 Bending load-strain curves measured in a magnesium bar, (a), and calculated stress-strain curves, (b).
strain, ε (%)
0 1 2 3
comp.
ten.
Lo
ad
, P
(N
)
S45C
600
200
0
400
str
ess,
σ (M
Pa
)
0.5 1.5 2.5
ten. comp.
comp.ten./
0 10.5 0 10.5
Lo
ad
, P
(N
)
0 0
100
200 200
100
300
(I) (II)
(I) (II)
(a)
(b)
1P
1Y
2P
2Y
strain, ε (%) strain, ε (%)
uniaxial test
bending test
figure caption is below the figure
Fig. 5 Bending load-strain curves measured in two S45C bars, (a), and calculated stress-strain curves, (b). Curves (I) were obtained in a bar with no prestrain and Curves (II) with2.3% prestrain.
Related Documents