Foundation for TRANSMISSION Tower
Oct 27, 2015
Welcome message from author
This document is posted to help you gain knowledge. Please leave a comment to let me know what you think about it! Share it to your friends and learn new things together.
Transcript


DESIGNING FOR LOADS
LOADS AND PERFORMANCE 23
Present design practice for transmission ,structure
foundations relies upon the use of methods and formul_as
which attempt to define the ultimate or failure capacity ofthe foundation in the various soil or rock typesencountered. Foundations are also designed to a deflection
criteria, usually at a working load. Soil parameters aredetermined from past experience in the area (if any) coupledwith various amounts of geotechnical study and field
exploration. The soil values used for design are generallyconservative depending upon the degree of actual data and
testing that went into their determination. The appliedloads for the foundations generally include a small
additional overload factor applied to the structure ultimateloads except for NESC loads for which the specified NESCoverload factors for foundations are used. The result is a
foundation which the engineer believes will sustain theapplied factored loads whenever they occur.
The use of a load and resistance factor design (LRFD)format as presented in the ASCE Transmission Line StructuralLoading Guide will allow varying both the load factor and
the foundation strength factor to suit the given conditions.
Load factors (one or larger) are applied to account forthe statistical nature of variation of the climatic loads as
well as to provide extra reliability in important lines or
greater safety for conditions where failures can injureworkmen. Load factors can also be used to control a
sequence of failure, thus by the use of load factors afoundation can be designed to withstand greater loads thanthe structure it supports.
Resistance factors (one or smaller) are applied to thestrength of the component and generally reflect thevariability of the strength and the confidence in the
knowledge of the material properties or the accuracy of the
design methods. Thus a foundation design strength valueshould normally have a smaller resistance factor than wouldbe assigned to a more uniform component such as steel.
The advantage of the LRFD method is that it provides a
means to design for a desired probability of failure andalso to identify which component is the more likely to fail.In order to achieve this for the design of foundations or
any transmission line component, strength resistance factors
need to be determined. For foundation design, methods orequations proposed for determining the strength orde fIe c t ion sh 0 u Id be spe c i ficas tow he the r the de term in edresult is an average strength value or a minimum strength
value. Additionally, sufficient tests should be performed

24 TRANSMISSION LINE TOWERS FOUNDA TrONS
to eventually establish a data base from which the degree ofvariability of the results or a coefficient of variation can
be established. Knowing the coefficient of variation allowsthe engineer to select the strength resistance factor whichprovides the degree of reliability which is desired.
SUMMARY
Transmission line structures are unique compared to
other structures such as bridges or buildings. They requiredifferent safety and reliability criteria which should be
reflected in the design of the foundations.
The reliability based LRFD method can be used to assigndifferent reliabilities to the foundations and other
transmission line components and provides a means to accountfor the degree of variation of actual foundation strengthversus the calculated strength.
ACKNOWLEDGEMENT
Much of the material in this paper is based uponSections 1 and 2 of the IEEE Trial-Use Guide for
Transmission Structure Foundation Design which was preparedby a joint ASCE/IEEE committee and is currently underrevision by a joint ASCE/IEEE committee which includes the
authors of this paper.
APPENDIX - REFERENCES
1. ASCE Foundations Subcommittee/IEEE Subgroupof Foundations for Transmission Structures,Trail-Use Guide for Transmission Structure
Design, Institute of Electrical ElectronicNew York, New York.
on Design1985, IEEEFoundation
Engineers,
2. Committee on Electrical Transmission Structures, 1984,
Transmission Line Structural Loading Guide, AmericanSociety of Civil Engineers, New York, New York.
CONSTRUCTION AND DESIGN OF FOUNDATIONS FOR FRENCHOVERHEAD POWER TRANSMISSION NETWORK
* **M. GAGNEUX J.L. LAPEYRE
This paper summarizes present conception and design of foundations for90 to 400 kV overhead lines in France. Firstly principles of
geotechnical studies in use are presented : various types and number ofsoil investigations are discussed. Then several kinds of foundationsemployed are described :
- pad and chimney foundations for towers in soft soils ;block foundation in case of rocky soils
- present tendency in use of driven piers for separate footingfoundations or towers ;
- roundations for single poles.
At last, designs and safety coefficients of such foundations are
presented.
O. Introduction
In 1985 Electricite de France commissioned (in tower files) :950 km of 400 kV overhead lines, 200 km of 220 kV overhead lines, and
450 km of 63/90 overhead kV lines. The coming years will witness
principally an increase in the construction of 63/90 kV lines. -The
foundation average cost represent 7 to 15 % of the construction costs.Since 1970 design and technological conceptions or foundations haveconsiderably progressed. This paper presents the major developments inthese diverse fields.
1. Soil reconnaissance
Soil investigations are performed essentially for high voltage
(63 or 90 kV) or extra-high voltage (225 or 400 kV) structure. Thesestructures are chiefly four-legged lattice towers which apply tension/compression loads to the soil, and since about ten years, single member
supports (called "Muguet" in France) of aesthetic finality but ofrather limited use.
11. Originally: the "penevane"It will be seen subsequently that the calculation method, developed inthe 1970's and used in France, requires the knowledge of limit
characteristics of the soil : C, ~ and I .Being conscious or precautions to be taken for determination of C and ~
ELECTRICITE DE FRANCE :
* Engineer. Service du Transport - Centre d'Equipement du Reseau deTransport 92068 PARIS LA DEFENSE CEDEX 48 - FRANCE.
** Engineer. Direction des Etudes et Recherches 1 avenue du General deGaulle 92141 CLA}~RT CEDEX - FRANCE.
25

26 TRANSMISSION LINE TOWERS FOUNDA nONS
in laboratory, emphasis was put on the development of an "in-situ"
measuring method that would be convenient, rapid and if possibleunexpensive. It is under such circumstances that the "penevane" whose
design and prototype are due to Mr TRAN VO NIEHM L8] , was defined.
This apparatus, that combines a dynamic penetrometer and a scissometer,was being used during few years in the early 1970's by contractorsentrusted with line construction. Comparative tests had enabled
correlations to be established between the cohesion, angle of internalfriction and the dynamic and scissometric characteristics provided by
the penevane .. However, this apparatus was not able to keep all its
promises mainly because of insufficient penetration power. Developingonly an energy of 10 daN.m, its driving-in was often impeded not onlyby compact layers even of small thickness, but also by the presence ofsmall-sized solitary boulders. Facing such a state of things, decision
was then taken to come back to C and cp measurements, usinggeotechnicians for these measurements.
12. Officialization and codification of soil studies
Calling almost systematically uppon the geotechnical engineer prior toany choice of foundations, occurred only by the late 1970's. If at theoutset the idea was to preemptively obtain the values of cohesions andangles of internal friction needed for the design of shallow
foundations, it appeared very soon that the soil studies could enableus to obtain a large set of informations both qualitative andquantitative. They may for instance provide valuable indications on
problems associated with the actual execution of excavations (tools tobe employed) and on the time stability of their walls. Besides, withthe growing number of pile supported towers, it is indispensable thatquantitative data be available, for their sizing and also for thechoice of the pile type to be made use of. Starting from the simple
idea that each line forms a unique structure, we try both to limit thenumber of measurements and soundings, in order to obtain not toosignificant costs, and to carry out a sufficient number of measurementsso that the results thus obtained should not be contested.
13. Qualitative study
The qualitative study prepares the measurement campaign which will endwith the design or foundations. It is based on geological maps,information gathered by geotechnicians during earlier soundings and ona obligatory field reconnaissance campaign (auger sampling, shovelled
pits, dynamic penetrometer, seismic-refraction). It makes it possible,first of all, to get an insight into the nature of ground layers
encountered all along the line and hence to attract attention to thezones where shallow foundations can be implemented as well as to those
where their installation is to be procluded. Next, it leads to definehomogeneity zones, namely sections or groups of sections where the
character of the soil is markedly the same for all supports that areto be installed. It endeavours also to gather informations relevant,
for example, to hydrogeology, as well as to the difficulties of actualexecution of excavations as to the kind and number of measurements to
be considered in the quantitative stage.
OVERHEAD TRANSMISSION NETWORK 27
14. Quantitative study
The quantitative study consists essentially in taking samples on
selected sites to measure in laboratory the C and ¢ values and toperform pressuremetric measurements with a view to determine the
permissible compressive stresses and as well as the characteristics
being of use for the calculation of special pile foundations whetheracted on by tensile/compressive or overturning stresses.
We attract attention to the fact that the importance of cohesion in thecalculation of the block has led us, under the present conditions, toconsider, in the design, the long term (or drained) characteristics
C', ¢' (usely, C' is notably less than Cu undrained cohesion) and this
because durations of excavations opening in frequently encountered,silty soils are rapidly leading to a perceptible reduction in thecohesion of these grounds.
At the present time, generally one support location every 4 to 10 is
concerned either by a non-destructive sampling or by a pressuremetric
sounding to which are being added the elements contributed by thequalitative study, in particular by dynamic penetrometers.Between a sounding at each foot tower as some would desire - (an idealbut too expensive solution) - and the present practice, there exists arange where the extrapolation of obtained results to unsounded
locations should be done. It is why we recommend that prior to thebeginning of works, a meeting systematically takes place between allthe actors that contribute to the choice or actual execution of
foundations : prime contractors, geotechnicians, purchaser. The purposeof this meeting, after a last examination of adopted solutions, is for
one thing to advocate under which conditions and on which assumptionsthe choice of foundations was made and more particularly at locationswhere no soil-investigation was performed.
For another, it is important to examine for these locations, the
elements that may lead to question again some hypothesis adopted at the
outset : thickness of different nature of the surface layer, presenceor not of water and to derive therefrom eventual modifications of theoriginal foundations.
In spite of this proceeding by successive approximations it may happen,nevertheless, that the contractor is in presence of a situation which
was not considered during previous proceedings j under these
circumstances, the geotechnician is requested, to carry out acomplementary study with a view to define very rapidly the changes tointroduce in the initial project.
2. Diverse kinds of foundations
21. Foundations for four-legged lattice towers211. Shallow foundations (pad and chimney foundations
These still represent at the present time most foundations used for
63/90 kV, 225 kV, and 400 kV lines. An example for medium soil is givenin Figure 1 for an uplift force of 700 kN. These pad and chimneyfoundations are still widely used, because they are economical and canbe carried out

28 TRANSMISSION LINE TOWERS FOUNDATIONS
without particular implementation means. For lines based on this typeof blocks, the foundation cost represents, an average of 10 to 12 % oftotal line cost.
212. Deep foundations
Uplift capacities are to day greater than in the past, and asignificant advance in this foundations design can be nowadays noted.The cost of this kind of foundation represents around 15 to 17 % of theoverall line cost.
In the early days of EDF's existence, special foundations like
driven-piles were only intended for poor-grade soils in which allshallow foundations solution was to be precluded, things have verynoticeably changed since. Pile or group of piles appear now more andmore often as the rival of the shallow foundations, because of the
increase in the uplift stresses.
The drilled and cast piers used until the early 1950's were rapidlysuperseded by the HULLER pile introduced in France. This pile with
metallic core is driven and is surrounded by exterior mortar jetting(Figure 2).
The development of HuLLER system, especially since the 1970's led to
the implementation or piles with growing transverse sizes. Startingfrom metallic cores of diameter varying from 250mm to 450mm andrequiring, in order to ensure the junction with the support, theconstruction of a reinforced concrete bonding block always expensive,
the special roundations companies are now implementing piles ordiameters larger than 1000mm. The significant sizes, in addition to themechanical advantage offered by a great top inertia to absorbe highsecondary moments, permit furthermore direct interconnection of thetower base angle inside the tube.
Another major advantage lies in the fact that only one of these
injected piles allows tensile or compressive stresses more than4000 kN. Driven piles, whether they have small or large transverse
sizes, can be implemented in all the soils ranging from lowcharacteristics to rairly compact ones (pressuremeter limite pressurelower than 2 to 2.5 ~Wa). In case of strongly consolidated grounds such
as rocks, the possibility of achieving drilled and injected micropiles(100 to 4S0mm in diameter) permits realization of foundation without
impairing the natural environment by the use of explosives. Thus,regarding the pile, there always exiqts a solution in this technicalfield that can be implemented whatever the caracteristics of the soil.
22. Foundations for single polesThe shallow foundations, for reinforced concrete
poles (for 63/90 kV voltages) are still being widely
poles or metallicused in the

OVERHEAD TRANSMISSION NETWORK 29
0.15 , x
01
II
Ij2
I
Ijc
a
I[0,1010.20I
o
,
~f,i.c:1I
r
0.7 m
1.10 m
h1 = 0.4 m
Figure 1 Shallow foundation block
uplift force : 700 kN.
D : 2.90 m CP1a - 1.85 m CP?c = 1.55 m -x=0.15mh = 0.5 m
with base plate
h3 = 1. 10 m
construction of such lines. However, the implementation of single polesupports for 225 and 400 kV voltages has led to a change in the design
of these blocks through the use of deep foundations.At the outset, for these 225 and 400 kV structures, the foundations
group of injected MULLER type piers, as well as the bond with the tower- (flange and rods embedded in a reinforced concrete block) - formed
complicated and expensive assemblies.Very soon simplifications were applied : the groups of piers were
replaced by a driven cylindrical metallic tube of large diameter ( ¢ >
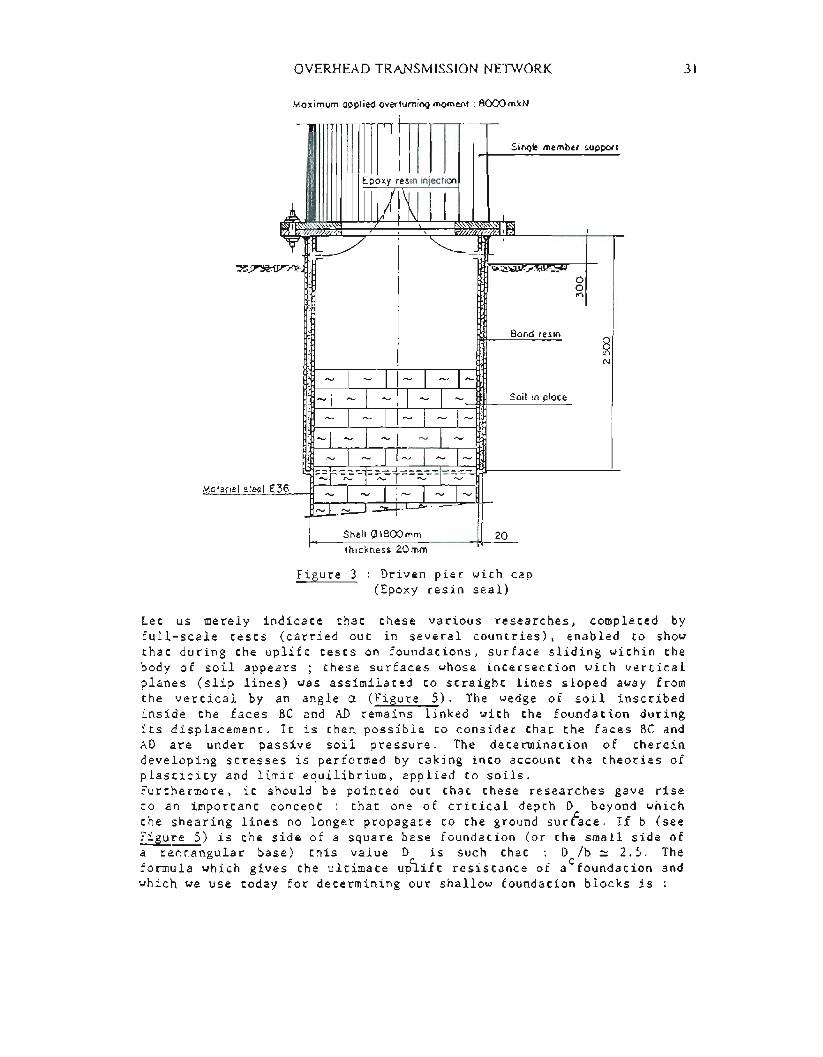
1200mm), the bond between the tower and this foundation being providedby a flange welded onto a tubular cap covering the upper part of thefoundation tube over a height of about 2.50m (Figure 3).
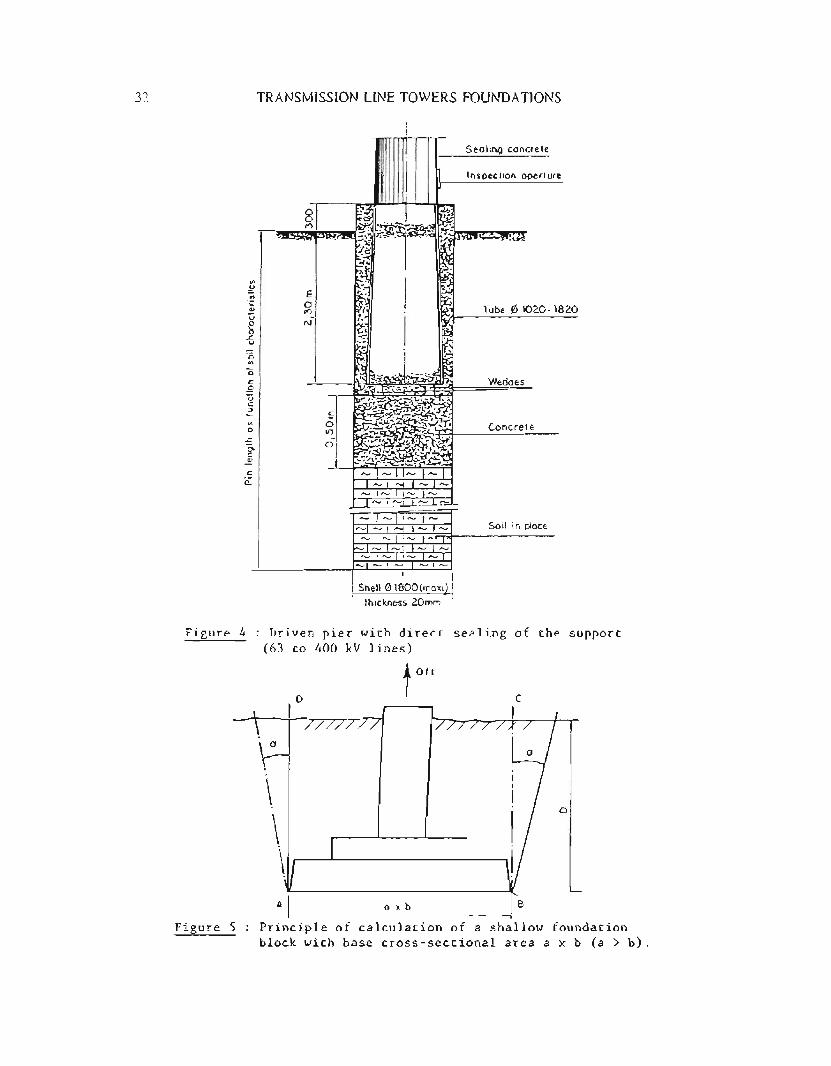
The increase in diameter of driven shells (9> 1800rnrn) allowedafterwards, in many cases, the base section of the tower to be directlysealed within its foundation (Figure 4). This bind of tower-foundation
interconnection is also employed for the 63/90 kV lines.In spite of these improvements, the cost of such constructions canstill be from 15 to 30 % of the line cost.
3. Calculation methods
31. Calculation of foundations for four-legged towers:311. Shallow foundation blocks
Researches were conducted as early as 1963, by EDF in close cooperationwith the Grenoble University. It is not our purpose to deal in detailwith the calculation method proceeding from these studies, called
"c, ¢' I method" a description of which can be found in [lJ, [6J, [7J.

30
Coupling conneciion
¢ 2.50 0 ~OOOmm
In\eciion
Injected driven pierof 250 to 1000 mID diameter
Ii1T I I I I I Si", m,m'" '",PO"Epoxy resin injection
OVERHEAD TRANSMISSION NETWORK
Maximum applied overturning moment: 80CXJmkN
~.~ ..,..,...'l':'1K.,;...,
Bond resin
aar<"I
I
~IC\J
31
Materiel steel E36
Shell (01800 mm
thickness 20mm
Il 20
Soil in piece
Figure 3 : Driven pier with cap(Epoxy resin seal)
Let us merely indicate that these various researches, completed byfull-scale tests (carried out in several countries), enabled to show
that during the uplift tests on foundations, surface sliding within thebody of soil appears ; these surfaces whose intersection with vertical
planes (slip lines) was assimilated to straight lines sloped away fromthe vertical by an angle a (Figure 5). The wedge of soil inscribedinside the faces BC and AD remains linked with the foundation during
its displacement. It is then possible to consider that the faces BC andAD are under passive soil pressure. The determination of thereindeveloping stresses is performed by taking into account the theories of
plasticity and limit equilibrium, applied to soils.Furthermore, it should be pointed out that these researches gave riseto an important concept : that one of critical depth D beyond which
the shearing lines no longer propagate to the ground surface. If b (seeFigure 5) is the side of a square base foundation (or the small side of
a rectangular base) this value D is such that : D /b ~ 2.5. The
formula which gives the ultimate up~ift resistance of aCfoundation andwhich we use today for determining our shallow foundation blocks is
32 TRANSMISSION LINE TOWERS FOUNDATIONS
'".!.!-;;.;:CI
Woo
.:::u'0
on
'0c.2Wc:>
on
o.:::.0.1cCI
ca.
Sealing concrete
Inspection aperture
Tube ~ 1020- 1820
Wedoes
Concrete
Soil in place
Shell 01800 {maxi
thickness 20mm
\ I
I : I 0. I
\\.~Al
a x b
c
sealing of the support: Driven pier with direct(63 to 400 kV lines)
tOft
Figure 4
Figure 5: Principle of calculation of a shallow foundationblock with base cross-sectional area a x b (a > b).

Q ft
- PD
C
-/- ~!
c
- Pt
OVERHEAD TRANSMISSION NETWORK
pD (CM + D (Mcp+ M /) + Pt (Figure 5)foundagion perimeter (m)foundation depth (m)soil cohesion (MPa)
volume weights of soils (N/m3)
and (Mcp+ M /) : coefficients depending on the internal frictionangle of the soil and on the ratio D/R, R being the radius ofa circular slab having the same perimeter as the rectangular
slab (R = a ; b) [6J ' [7J .
weight of the foundation and of soils plumb with the slab (N).
33
312. Deep foundations on piles
As indicated above, the utilization of such foundations is becomingincreasingly important in France. This utilization coincides moreover
with the use of a simple, recently developed design method [2J ' whichis based on the pressuremeter test and mainly on the measurement of thelimit pressure of the ground at several levels.
This method is essentially an experimental one, since based on the
results provided by several hundreds of tests ; it suggests, fordifferent kinds of piles and in different soils, a correlation between
the pressuremeter limit pressure and limit unit skin friction (Table I
and Figure 6 according to [2J ).The design of the pile is then immediate. This kind of design, matched
with safety coefficients given in paragraph 4, is used and whollysatisfactory.
32. Calculation of foundations for poles, subjected to overturningFor deep foundations of single member supports, a calculation method
inspired by the work carried out by E.P.R.I. [3J in this field, hasrecently been developed. Its basic principles are the following- use of the pressuremeter test through its main data :
~enard Modulus and Limit Pressure ;
- design of reaction modulus (kh), by means of the formula proposed by~!enard [4J ;the foundation block is supported on lateral springs with non-linearplastic behaviour. Lateral friction and under-base reactions exhibit,on the contrary, a linear plastic behaviour.
This mode of calculation was compared with 2 full-scale EDF tests andwith 14 tests carried out in the USA by E.P.R.I. The results are
·..;hollyconvenient [5J (Figures 7 and 8) and very close to thoseobtained by E.P.R.I. 's code PADLL.
A computer program has therefrom resulted, ensuring
calculation of deformations of the foundation submitted to givenapplied moment ;
search for optimum installation depth, by using of displacement androtation criteria provided by the user ;
- design of the moment-displacement curve at the ground level and theanalysis of the limit overturning moment.

34 TRANSMISSION LINE TOWERS FOUNDATIONS
TABLE I : Pressuremetric rules
Table for the selection of nomographs (Figure 6) relative to unit
friction (according t~
Type
Pressuremeter Implementation and nature of the pile body
of
LimitDrilled
Tubed drilledDriven-inInjectedsoils
pressure
(10
5
ConcretePa) ConcreteMetalConcreteMetalLowHigh
Pl
bodybodybodybodybodypressurepressure
Argillaceousto silty or
< 7A bisA bisA bisA bisA bisA-muddy sand I
I
Soft chalk< 7A bisA bis
I A bisA bisA bisA-
Soft to com-
** *
< 30
(A)(A) (A) **
pact clay A bisA bis
A bis
A bis
A bisAD
Loam to com-
** *< 30
(A)(A) (A)A bisAD**pact loam
A bisA bis
A bis A bis
Sands and gr,-
** *
vels moderate-10 to 20(B)(A) (B)
A bisAB> D
ly compactAA bis A
Compact to
** *very compact
> 25(C)(B) (C)BC> DAsands and
BA B
gravels
weathered to
** *
fragmented
> 10(C)
(B)A
(C)
BC> D
BA B
chalk
Marl and mar
**limes tone
15 to 40(E)(C)
******B
CB EEE E
Very compact
> 45E-- -- F> F
marl
wea thered
20 to 40FF-******F
F> F > F
rock
Fragmen ted
> 45F- --> F> F-
rock
* The values in parenthesis ( ) correspond, for drilled piers, to a careful execution
of the pier and to an implementation technology implying minimum rehandling of the
soil in contact with the pier body, but for the driven piers to a tightening of the
soil around the pier •. 5
** Recommended for soils whose pl > 15 10 Pa
*** Only for cases where driving is possible.

OVERHEAD TRANSMISSION NETWORK 35
0E! 4.0~ I III_(\10~1 ' ---L--1 E_~ ,(\5pO .c:J
.~ 2.0--1
_ q s (105 Po)
2.22.0
'0 Cl.on
1.8S2 ~ 1.6c .9u
1.41 I~,
2
1.2OJ :§ 1.0·c
:J 0.8:g
0.6--1
0.40.2oV I1-
5
10
'" Qs (1Q5po)
,
0Cl.ong.§ 6.0u~
20 25
o
c
B
A
A bis
30 Pf (105 PO)
F
oo 10 20 30 40 50
Figure 6
Limit pressure (pressuremeter test)
New pressuremetric rulesa) nomographs for the determination of the unit friction q
(clays, loams, sands, gravel, chalk, marls, organic ssoils)
b) nomographs for the determination of the unit friction qs(very compact marls, rocks)
The criteria to be adopted to use this program, is under consideration.Presently, a verification of the pressure induced at all the ground
concerned levels, associated with a limitation of the displacement to1 cm under working loads is the rule.

36
Figure 7
TRANSMISSION LINE TOWERS FOUNDA nONS
Comparison between measured and calculated upper
displacements
line x=y
lines y= 2x and y = O,5xmean line
• C:'L':'! S
o ...·;.iHN
c £?~ j 7
T E?R; 12
J.. £??J 13
v E??! }'
.:. £?r.; 11
Figure 8 Comparison between measured and calculated upper rotations.
o.~Meosured rotation~' (degrees)
line x = ylines y= 2x crd y=O,5xmeon line,//,
/
• c:..:...:..!S
'.>
OVERHEAD TRANSMISSION NETWORK
4. Safety factors
41. Shallow foundations for four-legged lattice towers
411. Compression
37
The stress taken into acount in compression is that resulting from theapplication of a ice-loading hypothesis (2 or 4 cm thickness of rime
whose density is 600 kg/m3) : it will be verified that the resultingcompression stresses under the foundations are at most equal to themaximum permissible punching stress divided by three and this whateverthe kind of loading, permanent or not.
412. Tension
The tensile stress taken into acount is the highest one resultingeither from the application of the "administrative hypothesis" (wind of
110 km/h) multiplied by 1.5 or of an assymetrical ice-loadinghypothesis (2cm/Ocm or 4cm/2cm).Two cases are considered :
1°) If towers angles are less than 30 degrees, the relation between the
ultimate load calculated Qft and the higher of the two stressesindicated above should be greater than 1.
2°) In case of "dead end" towers or angles greater than 30° the
relation between the calculated ultimate load Qft and the higher ofthe two stresses indicated above should be greater than 1.2.
42. Deep foundations for four-legged lattice towers
We will merely indicate the rules adopted for uplift. For compressionthe permissible peak resistance to take eventually into consideration
is affected by the coefficient 3 with respect to rupture as in the caseof shallow foundations.
For uplift the stresses taken into account are chosen under the same
conditions as in the case of shallow foundations, two possibilities mayarise :
1°) If the tower angles are less than 30 degrees, the relation between
the ultimate stress calculated Qft and the stress applied should begreater than 1.4.
2°) If the tower angle is greater than 30 degrees, the relation between
the calculated ultimate stress Qft and the applied stress should begreater than 1.7.
As indicated in paragraph 3, notion of safety factor is not used fordeep foundations subjected to overturning.

38 TRANSMISSION LINE TOWERS FOUNDATIONS
Bibliography
BIARREZ - BARRAUD
Calcul des fondations superficielles a dalle (Design of shallow
foundations with base plates)Paper 22106 CIGRE Session 1968 (in English)
BUSTAMENTE Michel - GIANESELLI LuigiPrevision de la capacite portante des pieux isoles sous chargeverticale (Prediction of bearing capacity of separate piles
subjected to vertical load)Bulletin de liaison of LCPC nO 113 Hai-Suin 1981 (in French)
E.P.R.I.
Design of laterally loaded drilled pier foundationPaper n° EL 2197 January 1982
[4J M. GAMBINCalculation of foundations subjected to horizontal forces using
pressuremeter dataSOLS/SOILS n° 30/31 1979 (in English)
[5J J.L. LAPEYRE - M. GAGNEUX - J. VIEILLECalcul des fondations de supports de lignes aeriennessoumises au
renversement : deux besoins differents et deux approches
differentes (Calculation of overhead line support foundationssubjected to overturning : two different requirements and twodifferent approaches)SEE Symposium on "Foundations" 27 November 1986 (in French)
[6J MARTIN DanielCalcul des pieux et des fondations a dalle (The design of piersand pad and chimney foundations)Annales of ITBTP n° 307/308 July 1973 (in French)
[7) MARTIN Daniel - PORCHERON YvesEtude de la rupture des fondations de pylones sollicites al'arrachement (Study of the rupture of tower foundations subjected
to uplift loads)Bulletin of Direction des Etudes et Recherches (E.D.F.) June 1968
(in French)
[8J TRAN-VO-NHIEMForce portante limite des fondations superficielles et resistancemaximale a l'arrachement des ancrages (Limit bearing capacity ofshallow foundations and maximum uplift resistance of anchors).
Thesis for Doctor Engineer degree, Grenoble University,12 February 1971 (in French).

STEEL PILE FOUNDATIONS FOR TRANSMISSION LINE TOWERS,AS USED IN WESTERN EUROPE.
Alexander J. Verstraeten (1)
INTRODUCTION.
The design and construction of foundations for power transmissionline towers present some special problems. This paper describes a
system of design and construction for these foundations that wasdeveloped in Europe and has attained general use there because of
its reliability and cost effectiveness.
Transmission line foundations distinguish themselves by having todeal not only with compressive and lateral loads, but withuplift loads and, because of the wind (in some regionsearthquakes), with dynamic loading.
The construction of transmission line foundations distinguishesitself mainly in the great number of inaccesible locations
involved, resulting in extensive geotechnical investigation andlogistical problems in moving men, materials and equipment.
This paper describes:
- A foundation system for lattice and single pole towertransmission lines using steel pipe, prefabricated piles. Thesystem allows much of the work to be shifted form the fie ld to
the manufacturing plant, speeds up the work in the field, andcreates highly reliable foundations.
- The Cone Penetration Test (CPT) based design method fortransmission line foundations developed by the Delft SoilMechanics Laboratory of the Ne therlands. We generally considerthe CPT, where applicable, to be the most reliable and cost
effective method of geotechnical investigation available. The CPT
based design method reduces costs by allowing the optimum choiceof pile type and length of pile, and by minimizing "surprises" inthe field.
- The methods and equipment used in installing thetransmission line foundations.
HISTORY
Before describing the technology of the pipe-based .transmissionline foundations we will discuss the historical factors that led
to its development.
The first foundations for Dutch (lattice) transmission towers
consisted of 4 groups of timber piles, driven through very soft
1 President, Fundex Companies, P.O. Box 55, 4500 AB Oostburg,The Netherlands
39

40 TRANSMISSION LINE TOWERS FOUNDATIONS
and compressible toplayers into a dense sand stratum, and capped
by reinforced concrete caps, which were in turn connected bylarge, reinforced concrete beams. The timber piles carriedcompressive loads only; the weight of the foundation caps andbeams carried the uplift forces.
The next development was that the wooden piles were replaced by
reinforced concrete piles. Because of the larger bearing capacityof the concrete piles it was possible to employ fewer piles. Theconcrete piles were also able to withstand moderate upliftforces, so that it was possible to reduce the weight of thepilecaps and connecting beams.
At a limited number of locations with sandy soils of larger
bearing capaci ties, sha 11 ow foundations were used. Theseconsisted of concrete foundation blocks; in order to save on
concrete the blocks were prestressed onto the soil by means ofalmost vertical placed, grouted tie-backs. The application ofthis type of foundation was limited because in most cases itproved to be less competitive than pile foundations.
Further simplification was achieved with the introduction of the
pipe-based pile system, which has now become the most commonsystem in use. The pipe-piles can carry such large uplift forcesthat the application of a single pile per tower leg is possible,pilecaps have become unnecessary, and the connection betweenpiles and legs has become very simple. The system has resulted
in foundations that are highly reliable and cost-effective, andthat can be installed in a minimum of time.
SOIL CONDITIONS.
The develpment of the pipe based foundation system was influencedby Dutch soil conditions.
Dutch soil generally consists of a layer considerable depth ofyoung deposits without any sound rock on which to base a
foundation. The soft top layer can run to a depth of up to 65feet and, because of consolidation, subsides at a rate of up to 1
foot per 100 years. All pile foundations are driven 6 to 10 feetthrough this soft layer into the bearing sand stratum underneath,
and are therefore end bearing.
The groundwater level is usually high and not more than 1 to 3feet below the ground surface.
Furthermore, the accessibility of the low lying polders in themore densely populated Western part of the country is poor.
In order to resist the large uplift forces that are exerted ontransmission towers, a deeper than usual penetration into thesand stratum is required, resul ting in hard driving conditions.
Steel pipe piles are very suitable under such circumstances.
STEEL PILE FOUNDATIONS
The steel pipe piles generate large side friction as well as
large end-bearing. They are also very suitable to transferlateral loads onto the subsoil. Their relatively light weight
and large strength make them attractive for transport underdifficult circumstances.
In areas with poor accessibility pipe-piles have been transported
by helicopter and piling machines have been moved from mast to
mast location, using specially made hardwood 20'x3' movablemattrasses that spread the machines weight over a sufficientlylarge area.
Because precast concrete piles take up 80% of the verycompetitive piling market and are manufactured industrially,their prices are low and a supp ly from stock is norma 1. Stee 1piles are more expensive. However, because of the aforementionedreasons the application of pipe-piles is more economical thanthat of precast concrete piles.
THE STEEL-PIPE PILES.
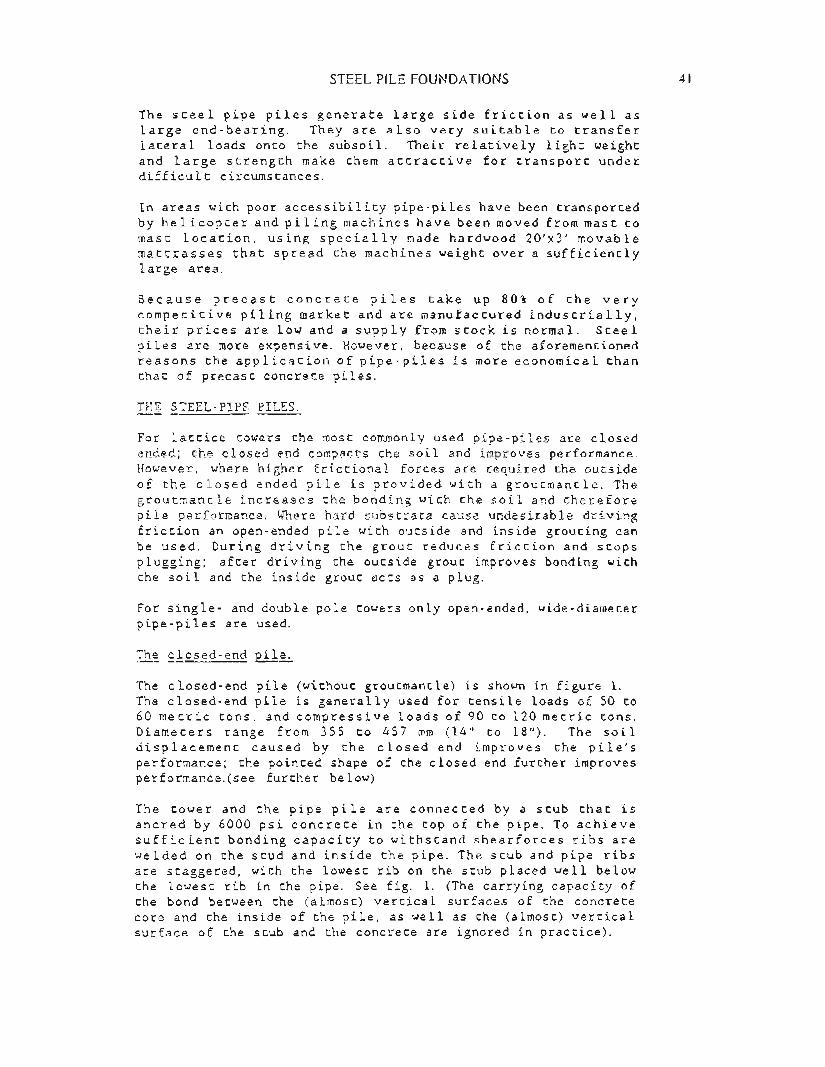
For lattice towers the most commonly used pipe-piles are closedended; the closed end compacts the soil and improves performance.
However, where higher frictional forces are required the outsideof the closed ended pile is provided with a groutmantle. Thegroutmantle increases the bonding with the soil and therefore
pile performance. wnere hard substrata cause undesirable drivingrriction an open-ended pile with outside and inside grouting can
be used. During driving the grout reduces rriction and stopsplugging; after driving the outside grout improves bonding withthe soil and the inside grout acts as a plug.
For single- and double pole towers only open-ended, wide-diameterpipe-piles are used.
The closed-end pil~
The closed-end pile (without groutmantle) is shown in figure 1.The closed-end pile is generally used for tensile loads of 50 to60 metric tons, and compressive loads of 90 to 120 metric tons.Diameters range from 355 to 457 mm (14" to 18"). The soildisplacement caused by the closed end improves the pile'sperformance; the pointed shape of the closed end further improvesperformance.(see further below)
The tower and the pipe pile are connected by a stub that is
ancred by 6000 psi concrete in the top of the pipe. To achievesufficient bonding capacity to withstand shearforces ribs arewelded on the stud and inside the pipe. The stub and pipe ribs
are staggered, with the lowest rib on the stub placed well belowthe lowest rib in the pipe. See rig. 1. (The carrying capacity ofthe bond between the (almost) vertical surfaces of the concrete
core and the inside of the pile, as well as the (almost) verticalsurface of the stub and the concrete are ignored in practice).
41
42 TRANSMISSION LINE TOWERS FOUNDATIONS
/
/
FIg- 2.
Coner('!('
Groui 2.5"-)"
Fig.1
;.5' - 50'
.~-'~--':'-'.'_'
." .. .... . ', ,
S,3n·j . Grav~: or'-- ._-------(oncr •.le
ring
\.'. Nak('d surtae~ to oel 05 C sat••ty earth

STEEL PILE FOUNDATIONS
Each rib of the stub is considered to load the concrete over its
(almost) horizontal surface, while the rings inside the pipe takeover the same load from the concrete. The concrete core itselfis loaded in shear. The shear surface is taken as the distance
between the lowest ring inside the pile and the pile top,mul tip 1 ied by the circumference of the rings ins ide the pipe.
The allowable shear stress is normally 7,6 kg/cm sq. = 106lbs/sq.inch.
The allowable compression on the ringsurface is 110 kg/cm sq =1500 lbs/sq.inch.
To prevent corrosion, the outside of the top-end of the pipe isshotblasted and coated with epoxy resins down to 3 feet below thewater table. Corrosion at deeper levels can be ignored.
After installation the pile is filled, up to 5' below the top,with clean sand, gravel or lean concrete. Next, the stubs for
mounting the tower leg are fixed in position by tack-welding themto s trip s that are we 1de d tot he pip e. Th is a 1sot akes car e 0 fgrounding the tower. Finally, the top 5' of the pile isconcreted.
The "closed-end, grout-mantle Ei.l~
The "closed-end, grout-mantle pile" is shown in figure 2. Forfrictional forces in excess of 50 to 80 metric tons per pile,increased capacity is obtained by providing the closed-end pile'",itha 2 1/2 to 3 1/8 inch grout-mantle. The grout-mantle pro
vides improved bonding to the soil.
The pipe diameters used for the "closed-end grout-mantle pile"and the corresponding pile bearing capacities are as follows:
43
Maximum uplift
Maximum upliftMaximum uplift
60 - 120 mt:
120 - 160 mt:160 - 250 mt:
dia. 609 mm
dia. 762 mmdia. 914 mm
24"30"36"
To make the grout-mantle a collar is welded just above the point
of the pipe and grout-hoses are placed from the top of the pipeto the collar. During driving grout is pumped through the hosesto the anular space that the collar creates. The grout used for
the mantle is a mix of 550 kgs cement, 1200 kgs sand, water andan additive to keep the mix sufficiently fluid and pumpable.Very often the additive Tricosal is added to reduce shrinkage
during hardening. Practice has shown that at the start of groutpumping the required pressure is low. At penetrations over 50feet pressure will have to be increased significantly, mainly
because the mortar in the top part of the mantle has dewatered somuch that it has lost its fluidity and prevents the upward escape
of freshly pumped material from lower levels. When the pile hasreached its required penetration, pressure is increased to appro10 ato. (15 psi). Application of this additional pressure further
44 TRANSMISSION LINE TOWERS FOUNDATIONS
improves bonding with the soil and pile performance by forcingexcess water into the surrounding soil while the grout densifiesand stiffens.
The amount of grout required runs from 1.1 to 1.5 times of the
theoretical volume. In the deeper layers the over-consumption is
of course less than at the top. To avoid excess use of grout thegrout level should be maintained as close to ground level as
possible. However, some excess upward flow can usually not beprevented.
As the grout mantle bonds very well to the steel of the pile,it protects the steel surface against corrosion. However, the
top of the mantle is removed to 4" below the ground surface andthe steel surface is coated with bitumen or epoxy.
The short ungrouted pipe point extending below the collar acts as
a guide during the early stages of driving and, after completionof the tower, guarantees grounding.
Open-ended pile with inside and outside grout-mantle.
Wnere the substratum is particularly hard and difficult to drive
into it may be advisable to use an open-ended pipe and grout boththe inside and outside. The open-ended pipe will reduce total
soil displacement (as compared to a closed-end pipe) and the
inside grouting will reduce friction and prevent plugging duringdriving.
For inside and outside grouting a minimum diameter pipe of 609 mm(24") is required. Collars are welded inside and outside of the
pipe and a number of holes are made in the pipe-wall to allow thegrout to move freely from the outside to the inside anularspaces.
After hardening of the mantles, the bonding of the inner groutmantle guarantees a "plugged" behaviour under service conditions.
After the inside plug is augured to a depth of 6 to 8 feet and
the inside is cleaned, the pile is completed in the same manneras the other two types of pile.
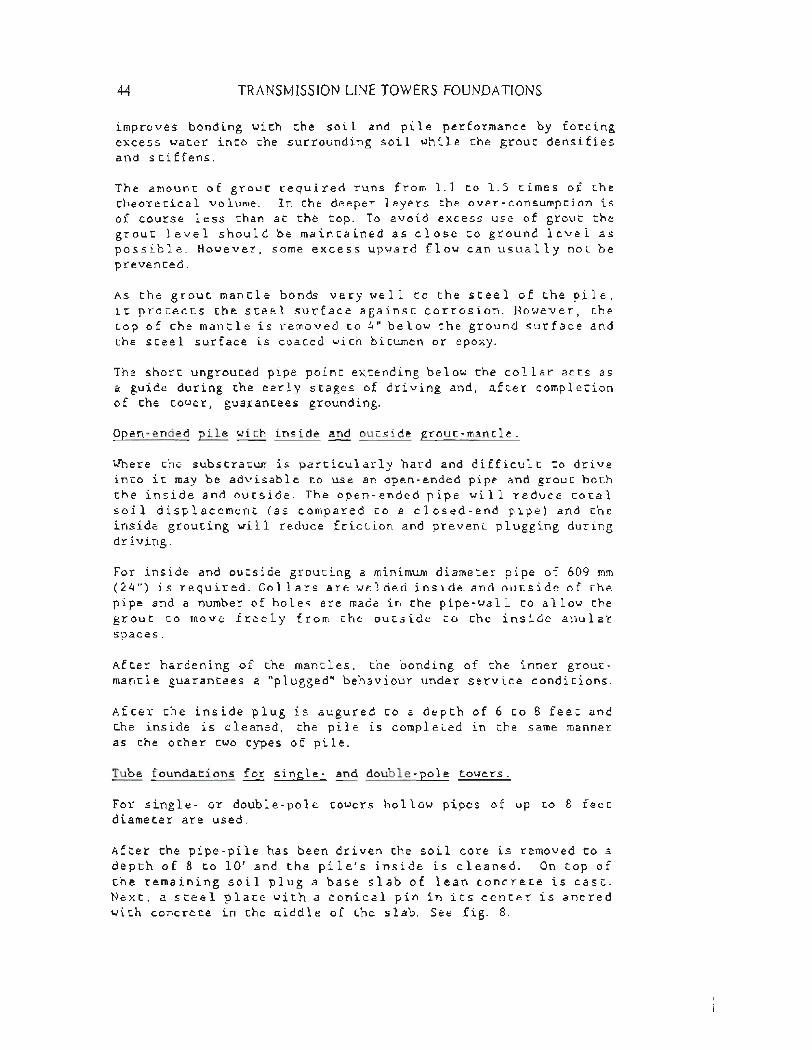
Tube foundations for single- and double-pole towers.
For single- or double-pole towers hollow pipes of up to 8 feetdiameter are used.
After the pipe-pile has been driven the soil core is removed to a
depth of 8 to la' and the pile's inside is cleaned. On top ofthe remaining soil plug a base slab of lean concrete is cast.
Next, a steel plate with a conical pin in its center is ancred
wi th concrete in the middle of the slab. See fig. 8.

STEEL PILE FOUNDATIONS 45
,.,.---1---- ~~'---~
":f~----- --
-----
/
Cencrete% /
, .)
Conc-.rete Steel wedses
Clam~_2.lece
I
II
~-=- I
Fig 8a.
-----~~_.
Conical pin/
Anchor ~,'-(steel) ,
Clamp piece
9cse ~la!LQLleon concrete
/ .0'~, I, 'd:>
'-Concrete
,..:"
~.I','.'" .. ;..;/
Fig 8.
J f 7.. '../ ~! .;~ ,J
J '¥ •~~,~1 ,'"",- /,r/' ~ 111") ..• I)' "J' '-',"
'" ;:.. to I!) .-I ',,,"J' '\, "-
~ ~', :, ''''.~1'? )'"" An~or bol t s...i ~~~' .""","'v ~. 1 "-
t - ...,- .....~ { I s! ( '" "',t ~ :5.~·'f "-, , "-, ' .. j _.' I" '
'. '·.· •• 1; :,\,' --'" .~Fig 8b.
Steel flange

46 TRANSMISSION LINE TOWERS FOUNDA nONS
In the center of the foot of the mast a hole has been made, that
matches the conical pin. The mast is placed in the pipe-pile and
centred by placing the hole over the pin. The mast is positionedvertically by means of steel wedges placed between pipe and mast.Next the space between pipe-pile and mastfoot is concreted. See
Figure 8a.
Another possibility is to equip the polefoot with a thick
hoizontal steel flange with a number of anchor holes. Prior toplacing the mast the pilecore is concreted while a matchingnumber of long anchor bo 1ts is placed and he 1d in the ir exac tposition. See Fig. 8b.
_DE_S_I_G_N_I_N_G_F_OU_N_D_A_T_I_O_~_S_FO_R_P_R_EV_A_I_L_I_N_G_SO_I_L_C_ON_'D_I_T_I_O_N_S_AN_TD_NA_T_U_Ri_A._LFORCES
In order to design powerline foundations that will meet
requirements at minimum cost it is essential that thoroughgeotechnical investigations be carried out. Experience in theNetherlands suggests that it pays to carry out investigations at
all tower locations. The distances between the towers, varyingbetween 1000 to 1600', are so large that substantial variationsin the soil profile may occur between locations. These variationsmust be known beforehand to allow the pipe-piles to be pre
manufactured at their optimum length, and to prevent unnecessaryinterruptions in the field because soil conditions turn out to bedifferent than expected.
For Dutch conditions the static Cone Penetration Test (CPT) is
the most effective soil investigation method (the StandardPenetration Test (SPI) is not used at all in the Netherlands).
The Cone Penetration Test (CPT)
For those not familiar with the CPT, it can best be described as
a miniaturized and instrumented model pile (the cone) that ispushed into the soil while the end resistance and the sidefriction of the cone are measured and recorded in relation to
depth. Ihe depth to which the cone is pushed is greater than thedepth that the piles will reach.
CPT readings are made for every inch of penetration. This
gaurantees that even very thin soil layers do not go unnoticed.
During its penetration the cone displaces the soil. Its behaviour
is comparable to that of a displacement pile and CPT readingsare therefore predictive of the bearing capacity of displacement
piles. The end resistance, as measured with the CPT, must bescaled up in order to arrive at the correct end-resistance for anactual pile. The skin friction has been shown to be independent
of the pile size and can thus be applied directly.

STEEL PILE FOUNDATIONS
CPT's have also proven to be re 1 iab le indicators of soi 1
type. CPT soil type analysis is done on the basis of theso-called measured friction ratio, that is: cone-resistance
divided by local friction, times 100%. See fig. 4. Usually asoil-type analysis based on CPT readings is far more reliablethan the description of the soil profile given by a drillforeman.
A further advantage of the CPT is that results are independent ofthe skill and experience of the operator; if 2 operators performa CPT at the same location the same results are obtained.
The analysis of CPT data is increasingly being facilitated by thecomputer. Usually CPT readings are recorded on tapes or discs andlater processed by a computer which will plot the cone resistance
and the skin friction in relation to depth. See fig. 5. Softwareis available that will plot the pile's allowable bearing capacityas a function of depth (provided data on the applicable safetyfactor, pile size and pile type are entered). Increasinglycomputers are operational in the field and process CPT readingsin real- time.
The main disadvantage of the CPT is that in some soil conditions
the cone will not penetrate to the required depth. The pushingcapacity of the heaviest CPT equipment is 20 tonnes for astandard cone and rod system of 36 mm diameter. This force is
sufficient to push the cone with rods through shales, marls andother soft rocks. Soil containing sound rock and larger sized
stones make it necessary to combine CPT's with drillingtechniques.
Another disadvantage is that because CPT's are only now becominggenerally used in the US, the available data from the past are
mostly SPT data. This may require conversion of old SPT data toallow comparison with new CPT data.
Nevertheless we believe that, where applicable, the CPT method is
the mos t cos t- effec ti ve geo technica 1 inves tigation techniqueavailable. It is relevant to mention here that Larry Nottinghamof the University of Florida did extensive research into the
capacity of different methods for predicting the bearing capacityof a number of piles used and tested in the USA (Doctoral
Dissertation 1977). The work was done under supervision ofProfessor John Schmertmann. One of the systems investigated byNottingham was a CPT based system developed by the Delft Soil
Mechanics Laboratory of the Netherlands. (This system isdescribed below). Nottingham came to the conclusion that he couldnot improve on the CPT/Delft method; it came out as the clearwinner. In the Netherlands the confidence in the Delft method is
so complete that less than 5 pile load tests per year are done tocheck on actual bearing capacity, remarkeable for a country wherepile foundations are used on a larger scale than in any othercountry of the world.
47

48 TRANSMISSION LINE TOWERS FOUNDATIONS
MN/m'
8 40cro
'";;.
~OJ
Cou30
20
10
oo 0,1 0,2 0,3
1.3
- local IfictlOn
Fig L.. Relation between the friction ratio and the type ofsoil for the mechanical adhesion Jacket cone
ConE' ":'5IstaneE' in kg/em2 _
30eI
200I
AeeumulatE'd frictIon ko/cm_"- .•., -..•c"'-"r~urn fE"E'nc E'1000 2000 3000
E
10
I, 15
:::. 1'"o
100
II,
20
Ec.!:0.~o
--Loeal f rI e t Ion In kg/em2
Fig.5.

STEEL PILE FOUNDATIONS
Because of its superior predictive capabilities the CPT
techno logy allows for the optimum des ign of foundations,resulting in savings on materials and improved productivity inthe fie 1d.
Pile Design
The Delft Soil Mechanics Laboratory of the Netherlands has doneextensive research into the correlation of CPT data and the
actual bearing capacity of different types of displacement piles.This has resulted in reliable design procedures for displacement
pile foundations, including foundations for transmission towers.
Most piles only undergo static compression loads and pile
penetration is determined on the basis of tensile capacitygenerated under static conditions. Since friction under tensionis equal to friction under compression, the maximum compressivecapacity of closed-end piles is calculated by adding the endresistance to the total friction resistance.
However, the factors determining foundation design for latticetransmission towers are;
- the dynamic pattern of uplift and compression forces,which in turn depend on,
- the position of the tower in the line,- the natural forces exerted on towers and cables,
- and the weight of towers and cables,
- the strength, flexibility and shape of the piles, thevolume of soil displacement and the form of the pilefoot,and the effect of such techniques as pressure-grouting of
the pi le pipe.
Transmission line towers can be positioned in three ways on the
line. There are the dead-end towers, which are longitudinally
loaded from one side by the suspension cables, (the overturningmoment acting on such towers is large), the tangent towers,
placed where the line makes an angle, which are vertically aswell as transversally loaded, and the towers on a straight linebetween two other towers, which under static conditions carry a
vertical load only. Normally the design load per footing forsuspension towers varies between 20 and 60 mt in uplift and
compression. For both other types of towers, the pileloads mayvary between 50 and 250 mt in uplift as well as in compression.
As a result of the position of a tower in the transmission line
and the dynamic effect of natural forces different patterns of
dynamic loading of the foundation result. In general, these canbe divided into 4 types (see fig. 6.):I. The load alternates between compression and uplift.II. The load alternates between small and large uplift.III. The load alternates between the maximum uplift and zero.
IV. The uplift is constant.
49

50 TRANSMISSION LINE TOWERS FOUNDATIONS
I' :', + ."
! i Ii!·1-...!...l..L
iime>~
•! I' :, - .
+'~ , ; I
P.~ III ". I I , I I '" ..
iime> -..
i ime> ---...
CaseI : 0,35
Decrease of friclion II: 0,50III: 050IV: 100
Fig.6.
Accumulated fnclicr kg/cm Clrumference _
~ IiI -~
I~l. b f'\r---1..
5
~ 10
15
20
WI
Pi Ie point level i
I, IY- II
::
2000
~!!
3OJO
I
Ir
Fig. 7.

STEEL PILE FOUNDATIONS
Dynamic loading results in continuous pile movement that causes
deterioration of frictional bearing capacity and relatively largefoot settlements. Experiments have shown that the effect of this
deterioration is concentrated in the middle section of the pileand varies with the type of loading pattern.
Figure 6. graphically illustrates the different loading patterns;
next to Decrease of Friction are given the factors indicating theeffective friction in the middle of a pile that undergoes thecorresponding type of dynamic loading pattern. The greatestdeterioration of friction results where the load alternates
between tension and compression, such as illustrated for type I.
As mentioned before, the shape of the pile, the volume of soil
displacement, the form of the pilefoot, and such techniques asgrouting, also influence pile bearing capacity. This influencehas been experimentally quantified by the Delft Soil MechanicsLaboratory in a "factor p", for which some values are as follows:
for piles with a flat underside or open pipe piles andH-beams: factor p = 0,30.
for piles with a sharply pointed foot: factor p = 0,55.for open pipe piles with an injected outer mortar mantle:factor p = 0,80.
for closed ended pipe piles (flat shape) and an injected outermortar mantle: factor p = 0,95.
Numerous field tests have shown that it is very advantageous toequip pipe-piles with a mortar mantle, as their total skin
friction is almost three times as large as that of ungrouted pipepiles. The Delft Soil Mechanics Laboraratory has also found thatprefabricated piles (steel or concrete) with a pointed foot can
generate almost twice the side friction of piles with a flat foot(but tend).
In view of the above, the De 1 ft Laboratory has deve loped thefollowing method for calculating pile length.
Based on experience a certain pile length is assumed. This lengthis divided into 3 parts for each of which friction will be
calculated seperately. These parts are;
A. a top part consisting of the top 1/4 of the pile-lengthminus the top 1 meter,
B. amiddle part; being the next 1/2 of thepile-Iength, and,C. a lower part; being the rest 1/4 of the pile.
The friction measured by the CPT for the corresponding depth ofeach part of the pile is totaled (see figure 7).
51
capacity of the pile is calculated asThe to ta 1 frictionfollows:
The sum of:
Total (CPT)friction part A,Total(CPT)friction part B, mul tip 1ied by the appropriate
"decrease of friction factor",
52 TRANSMISSION LINE TOWERS FOUNDATIONS
Total (CPT)friction part C,Mul tiplied by:
The circumference of the pile,
Multiplied by:The factor p.
~Q!: £~lCUl~!lQ~ Q! !Q~ ~Ellft £~E~£l!y Q! !he Ell~ th~ to!~lfriction £~E~£l!Y Q! !Q~ Ell~ l~ ~Qi~~!~QE.YQlYlQl~g E.Yasafety factor ~ which is usually taken to be between ~ and ~
Once pile bearing capacity has been established for the asssumed
pile length, optimum pile length is determined through aniterative process that matches pile bearing capacities fordifferent length piles with bearing requirements. It will be
clear that design calculations are usually computerized.Designing Single Poles
For single poles the diameter of the pipe-piles is in the rangeof 30" to 100". The wall thickness of the pipes varies between0,8 to 1,0% of the outer diameter. To resist extreme bending
that can take place under special conditions thicker pile wallscan be app 1ied .
Pile design is usually based on the assumption that the soilrenders a lateral purely elastic support. This approach requiresdata on the spring constants of the various soil layers, whichare derived from the site investigations. Computer programs areavailable for the determina~ion of pile strength and pile
deflections for any multi-layered soil profile.
INSTALLA..TION.
In order to gain the full benefits of working with prefabricatedpipe-piles it is essential that the piling rig can be mobilized,transported and demobilized in a very short time. For this
purpose Fundex Piling Equipment B.V.of the Netherlands hasdesigned and built the Fundex rig with fixed guides that is veryeasily mounted and dismounted in the field. Transport from towerto tower location is usually done per low-loader because this isfaster than having the machine move by itself; rarely is itpossible to follow the shortest route between towers.
Lattice tower pipe-piles are driven under an inclination that
matches that of the tower legs. The Fundex rig is constructed todo this. For single pole pipe piles pile installation is easierbecause the position of the pile is always vertical. Both impact
hammer and vibratory hammers are used; in cohesive soils theimpact hammer is more effective, but in saturated granular soilsvibratory driving can be very effective. For purposes of drivingthe Fundex rig is usua lly equipped wi th a diese 1 hammer of theDelmag D-30 type, which supplies 80,000 LBF on impact.
The Fundex rig has made it possible to install several towerfoundations in a day.

STEEL PILE FOUNDATIONS
TESTLOADING.
Testloading under tension is relatively simple just as is loadinghorizontally. It is more difficult and expensive to test under
compressive load, because this requires either a large deadwe igh tor a suffic ient ly 1arge numbe r 0 f grouted tie -backs to
supply the large reaction force required. However, we are veryaware of the fact that test loading is always necessary to gainsufficient insight and confidence in a new foundation system. If
such testing is done under the guidance of an expert, the programcan be limited to the essentials and the cost and time loss
minimized. In the Netherlands the contractor usually sets up thetest and an expert engineer or consultant, such as the DelftLaboratory, carries out the test.
we intend to do tests of the pipe-pile system for transmission
1 ine foundations in the USA and make arrangements for Americanexperts and consultants to carry out these tests.
Over the years we have developed practical and effective testprocedures to establish or extrapolate failure load for thepowerline pipe-piles. The procedure is to do anumber of
compression/decompression loading cycles at increasing loads
while registering the uplift after every cycle. The cycle loadsare increased in increments of 10 to 12 1/2 % of the projectedfailure load. The first cycle at a particular load is maintainedfor some time to establish time/settlement behaviour. The next 4
cycles are short, after which another series of cycles starts ata higher load (see fig.9).
It has been experimentally established that when one of thecompression/decompression cycles at a particular load results in
a rise of 0,2 mm, the respective load is very near 50% of thefailure load, which is usually also considered the maximumallowable design load. This knowledge is important in cases whereit is impossible to load the pile to failure. where it ispossible to load the pile to failure, the failure load is
established when there is cumulative permanent rise of thepiletop of 20 mm or more after a cycle.
Lateral deflections under the maximum allowable horizontal load
should remain within the elastic range.
CONCLUSION.
The design and construction of foundations for power transmissionline towers presents some special problems. These foundations
have to deal not only with compressive and lateral loads, but
with uplift loads and, because of the wind (in some regionsearthquakes), with dynamic loading. The large number ofinaccesible locations involved result in extensive geotechnicalinvestigation and logistical problems in moving men, materialsand equipment.
53

54 TRANSMISSION LINE TOWERS FOUNDATIONS
fT 1) up ----·--·10· ..· - D
II I i
/1,~! I
b '/ I I I
. ~ I • I,) I I! I I I I I I I
)1 II· i I I , I i1'- ,,! , I I i II J/ , , -. i I
III! ~ I I I! In I I~ I i I
Ii . I I 1-.;::'-n I I II il Tub•• 91~mm,(36") I I .x I ,
===fll Ir--~! I! J
I I I Ii '_ I I I I I I I II I ~: I! I I I I
10
3000 psi1000 psil000psl
15
o
~.
.s
.cc.•.o
Dutch Cone Penetration Test for test pile ~ 36"
j.11500z"
" 1000..o-: 50Oi..
•..o 1
T Im~ in hours --.
1050KN
1
TIME - LOADDIAGRAM
13lOKN
3 5
1//8
Tlmf' in hour!t ~
.o 5
ig9:Upllft tesllood on a groutinJe:tedpile ¢36'
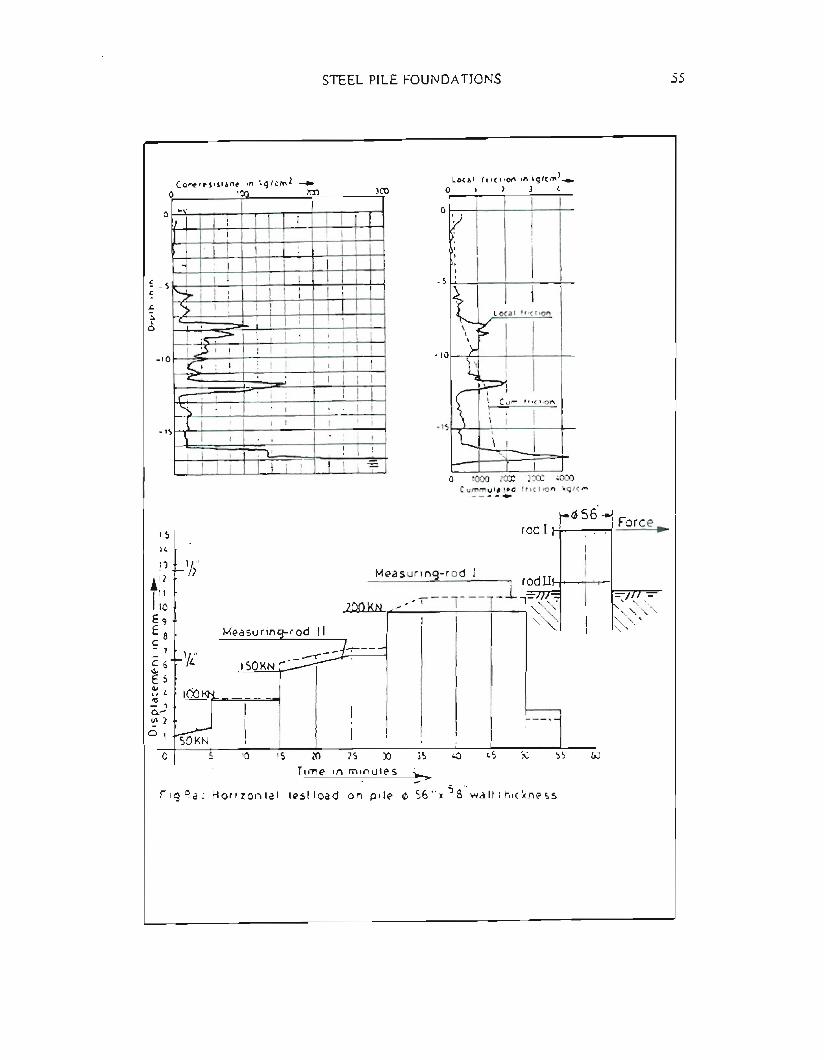
STEEL PILE FOUNDATIONS 55
-15
.c::>...a
o
-10
COl"M!'r"sislan" in kg/cm1 _0 '02aJ3({
... J II !i I I!I I I
,I II II !!
I. I ! I Ii:II
-i
I I1 I I !I I
I I I i
i iI! III
~iliI III II II
':> i ! !I ! I !II I
, , I ! IIiII , • I
--1:~1 iIi II I
IPI!I IIIII I
CI : i
: jI .II I<:
,I ,I IIII,IIi, !
: i, ,III
~I' !, !I i I I
( I
! III ,iI ',
, I
\ I' I, ,I• ! I
I I ! i
,!!
I II iI I i II I-
-5
Local friction In kg/cmZ __
o 1 Z 3 ,
I
iI
Local !rlellon
o 1000 zero !XC '000Cummu1alpCl frlCllon ltg/em--- - ....
ISr~56'radII ... lForce~
II,
rig9a: Horizontal
20 25 )) 35
Time in minutes ~
test load on' pile 0;6"xS8"wallthlc~ness
551,5
M",asuring-rod I ,radII-J._=- ..
---r-r-i i~
L1510
J50KN ~__ --r--
Measurinc-rod II
5
50KN
!3
tl211
10
Eg
Eac.- 7
c 6~E 5
~ I,~...Ja.~ 2
°1o

56 TRANSMISSION LINE TOWERS FOUNDATIONS
Because of its reliability and costeffectiveness the pipe-basedfoundation has gained a large share of the European market fortransmission line foundations.
For fast installation of pipe-piles with a safe holding capacityof up to 80 mt, plain steel pipes with a pointed, closed end arecompetitive and fast to install.
The bearing capacity of the closed-end pipe-piles can be much
increased by injecting an outside grout mantle during driving, orfor large diameter piles, by doing this both at the in- andoutside of an open-ended pipe. Grouting facilitates pileinstallation and gives a reliable protection against corrosion.
The higher bearing capacity of grouted pipe-piles make itpossible to apply one pile per tower leg for any type of towerstructure.
Single pole transmission· towers can be founded on large-diameter
single pipe-piles, which are simple to install and have provedto be competitive.
The pipe-pile foundations for transmission towers have the
advantages of:
- Avoiding unnecessary earth work and field damages.- Reduction of the in situ application of concrete for pile-
caps or drilled shaft piles.- Where the groundwater level lies at a short distance below
the groundsurface there is no need for dewatering or danger thatthe quality of concrete structures suffer because of groundwater.
- Simpler and consequently faster construction.
- Straight forward load transfer from tower leg tofoundation pile.
The CPT based design system developed by the Delft Soil MechanicsLaboratory has allowed the optimization of transmission line
foundation design, allowing for a smaller design safety factor,
and minimizing costs and "surprises" during installation.
Penetration depth of these piles is usually determined by themaximum uplift force and not by the maximum compression.
The Fundex rig which has been designed for installing pipefoundation systems for transmission lines; it provides very short
mobilisation and demobilization times, easy transportability, andthe capacity to speedily install pipe-piles with the required
accuracy and at the required angle.
Only positive experience has been gained with thousands of pipe
pile foundations for transmission towers in Holland, Belgium,Western-Germany and France.
Uplift Capacity of Model Group Anchors ill Sand
Braja ~!. Das,l M. ASCE, and Yang Jin-Kaun2
Abstract
Small-scale laboratory experimental results for the ultimate uplift capacity of shallow horizontal circular singleand group anchors embedded in sand have been presented. Theexperimental ultimate uplift capacity of single anchors hasbeen compared with theories provided by Meyerhof and Adams(7), Vesic (8), and Clemence and Veesacrt (~). For anchorgroups, the uplift efficiency varies with the number of anchors, center-to-center anchor spacing, embedment ratio, andsoil friction angle. The experimental uplift efficiency ofgroup anchors has been compared with the theory of ~leyerhofand Adams (7).
Introduction
Horizontal anchors are often used in construction offoundations such as transmission towers to resist vertical
uplifting forces. During the past 15-20 years, the resultsof several investigations (both theoretical and experimental) related to the ultimate uplift capacity of single anchors embedded in sand have been published. Important contributions in this aspect can be found in the works of Adamsand Hayes (1), Baker and Kondner (2), Balla (3), Das andJones (5), Esquivel-Diaz (6), ~{eyerhof and Adams (7), Vesic(8), and Clemence and Veeseart (4). Vesic (8) has provideda review of most of the important works on this topic. Inmany cases however horizontal anchors are used in groups.Until this time, only a limited number of studies relatingto the uplift capacity and efficiency of horizontal groupanchors have been published. The purpose of this paper isto report some laboratory model test results of shallowgroup horizontal anchors in sand.
Immediate practical application of the results obtainedfrom this study may be somewhat limited, primarily becauseof the fact that many of the present transmission lines haveguy tensions far greater than what a shallow group anchor
Iprofessor, Department of Civil Engineering, The Universityof Texas at El Paso, EI Paso, Texas, 79968
2Graduate Student, Department of Civil Engineering, The University of Texas at EI Paso, EI Paso, Texas, 79968
57
58 TRANSMISSION LINE TOWERS FOUNDA TrONS
would support. However, the results SJIOW the general trendfor further research in the area of uplift capacity of shallow and deep anchor groups.
Uplift Capacity of Single Horizontal Anchors
A review of most of the theoretical studies for evalua
tion of the ultimate uplift capacity of single horizontalanchors embedded in sand has been given in an excellentpaper by Vesic (8). It is not the intention of this paperto review all pertinent theories; however, the theories forcircular anchors provided by Vesic (8), Meyerhof and Adams(7), and Clemence and Veesaert (4) will be briefly discussedbelow since these are the most widely referred to in literature.
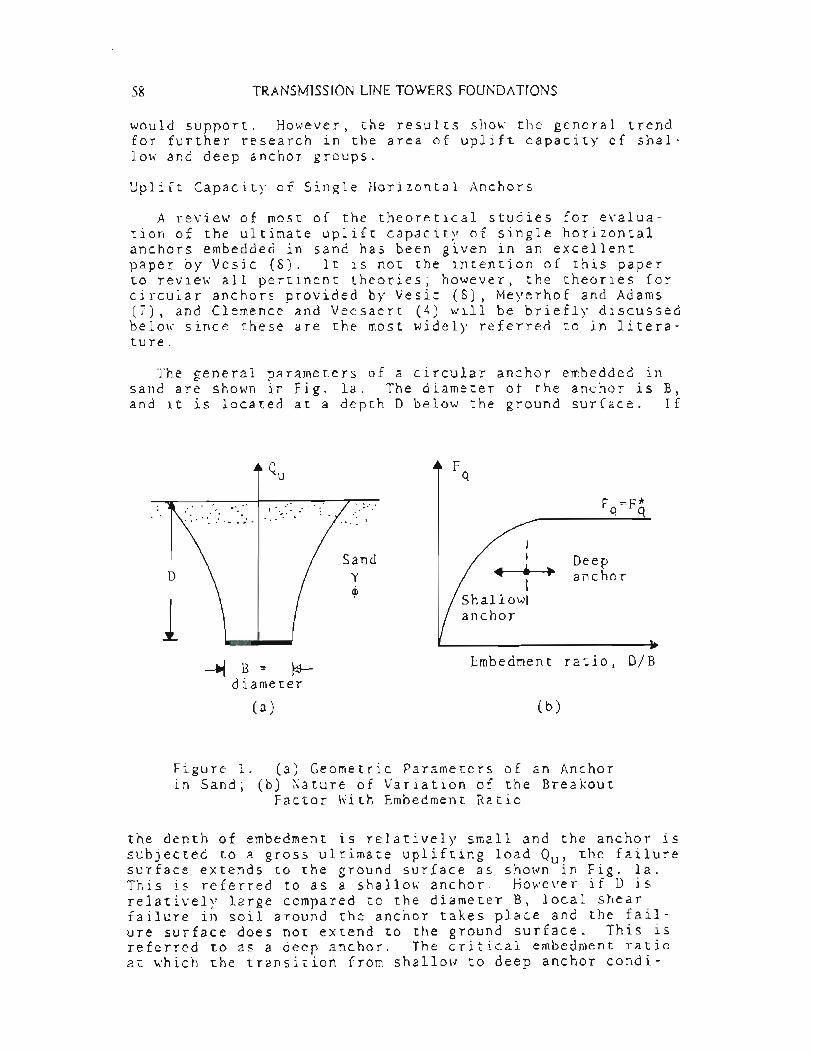
The general parameters of a circular anchor embedded insand are shown in Fig. la. The diameter of the anchor is B,and it is located at a depth D below the ground surface. If
Fq
Embedment ratio, D/B
F =F*q q
Deepanchor
II
~ ...I
Shallowlanchor
;." .
Sand
ycp
.......
~ B = ~diameter
D
1
(a) (b)
Figure 1. (a) Geometric Parameters of an Anchorin Sand; (b) ~ature of Variation of the Breakout
Factor With Embedment Ratio
the depth of embedment is relatively small and the anchor issubjected to a gross ultimate uplifting load Qu' the failuresurface extends to the ground surface as shown in Fig. la.This is referred to as a shallow anchor. However if D is
relatively large compared to the diameter B, local shearfailure in soil around the anchor takes place and the failure surface does not extend to the ground surface. This isreferred to as a deep anchor. The critical embedment ratioat which the transition from shallow to deep anchor condi-

MODEL GROUP ANCHORS IN SAND 59
tion takes place depends upon the relative compaction of thesoil. For loose sands (¢~300), (D/B)cr~4; and for densesands (¢~45°), (D/B)cr~8 to 9 (7). Perhaps a better parameter for correlation of (D/B)cr would be the relative density, Dr. Figure 2 shows the nature of variation of thecritical embedment ratio with relative density as obtained
8
H
Ur-..:.:Q6
---- Q'--.J
4
0
20 40 60 80 100
Relative density, Dr (%)
Figure 2. Experimental Variation of CriticalEmbedment Ratio With Relative Density (5)
from the limited model tests reported by Das and Jones (5)on square anchors. Based on their results
(D/B)cr ~ 4 + O. 0:5 32Dr (f0r 25 % ~D r~ 75% ) (1)
The net ultimate uplift capacity Qo of an anchor can bedefined as
(2)
where Qu=gross ultimate uplift capacity, and Wa=self-weightof the anchor
The net ultimate uplift capacity of an anchor embedded insand can be conveniently expressed in a nondimensional formas
(3)
where Fg=breakout factor, A=area of the anchor plate, and y=unit weight of the soil
The general nature of variation of Fq with embedmentratio (D/B) is shown in Fig. lb. The breakout factor increases with O/B up to a maximum value Fa=Fa at D/B=(D/B)cr.For D/B~(D/B)cr' the magnitude of the breakout factor remains constant.

60 TRA.NSMISSION LINE TOWERS FOUNDATIONS
Vesic's Theory (8)
Using the principles of expansion of cavities, Vesic (8)
has presented the variation of the breakout factor (Fq) withembedment ratio (D/B) and the soil friction angle (¢) forshallow circular ancho~s embedded in sand. TJlese values are
shown in Fig. 3.
12
0-•.....•
10~ •...08
+J Uro~ 6+J
;J0~ro4
(J) •...:::t::
2
a . 5 1.5 2.5 3.5 4.5 5.5
Embedment ratio, D/B
Figure 3. Variation of Vesic's Fq With ¢ and D/B (8)
Meyerhof and Adams' Theory (7)
According to this theory, the ultimate uplift capacity ofa shallow circular anchor can be given as
,·;hereS=shape factor=l + m' (D/B)
(4)
(5)
Ku=nominal uplift earth pressure coefficient, W=weight ofsoil immediately above the anchor, and m'=shape factor coefficient=f(¢)
For circular anchors

MODEL GROUP ANCHORS IN SAND 61
(6)
The variations of Ku and m' (which are functions of 4»
are shown in Fig. 4a. Substitution of Eqs. (5) and (6) intoEq. (4) yields
1.0 0.6
Nominal upliftcoefficient, Ku
Ku 0.8
(a)//////
Shape factor //coefficient, m'/,/
...•.•... ..-"""
0.3 m'
----0.6
I IIII<40
01020304045
Soil friction angle,
¢(deg)
100I
III/(b),,///50 I- qJ=4::J-////
30 ~/d
20 f-
//" Deep anchor
/
,• condition
108642
5
3o
Embedment ratio, D/B
Figure 4. (a) Variation of Ku and m' With ¢; (b) Variation
of Fq With D/B and ¢ For Shallow Anchors (7)--Eq. (7)

62 TRANSMISSION LINE TOWERS FOUNDATIONS
or
2 [1 + m 1 (DI B)] (DI B) Ku tan ¢ + 1 (7)
By using Eq. (7) and the values of Ku and m' given in Fig.4a, the variation of the breakout factor (Fa) with embedmentratio for shallow circular anchors in sand has been calcu
lated and is given in Fig. 4b. Also shown in the figure isthe zone of deep anchor condi tion as recommended by ;'ieyerhofand Adams (7).
Clemence and Veesaert's Theory (4)
According to this method, the failure surface in soil is
assumed to be a truncated cone (for shalloK anchors) asshoKn in the insert of Fig. S. The net ultimate uplift capacity of a circular anchor in sand can be expressed as
100
:; - •. -0,.
7,/,/
,//~ Deep
/ / // anchor0/7 400 condition/35°
l ./4- B= ~
IIdiameter
,46810
2a:s
5
50
20
30
10
Embedment ratio, D/B
Figure S. Variation of Fq Kith D/B and ¢ For ShallowAnchors--Eq. (9)

MODEL GROUP ANCHORS IN SAND 63
(8)
where Vs=volume of the truncated cone shown in Fig. 5, andKo=coefficient of lateral earth pressure
The value of Ko varies from 0.7 to 1.5, with an averageof about 1.0. The lower limit of Ko is for the case inwhich sand is poured by the raining technique, and the upperlimit is for the case where sand is compacted around afterthe placement of the anchor. It can easily be seen that
Vs = ~[B+Dtan(¢/2)]2DY
Substituting this into Eq. (8) and rearranging
[1+ (D/B)tan(¢/2)]2Qo
(~) B 2 D4 y
+ 4Kotan¢ cos2(q>/2)[}(D/B) + (D/B)2tan~¢/2) J(9)
Using and average value of Ko=l, the breakout factor variation with ¢ and D/B has been calculated and is shown in Fig.S. In this figure, the embedment ratios at which deep anchor behavior starts have been taken to be the same as de
fined by ~eyerhof and Adams (7). A comparison of the breakout factors shown in Figs. 3, 4b, and 5 shows the following:
1. For a given soil friction angle (¢) and embedmentratio (D/B), Vesic's theory (8) yields a substantially lower
value of Fq than those obtained from the theories of Meyerhof and Adams (7) and Clemence and Veesaert (4).
2. For ¢=30° and 35° with Ko=l, Eq. (9) consistentlyyields a higher value of breakout factor (for similar D/B)than those obtained by using Eq. (7). For ¢=40°, Eqs. (7)
and (9) give practically the same variation of Fq for shallow anchors .
.). With ¢=45° and Ko=l, Eq. (9) results in lower valuesof the breakout factor for D/B ~ about 3.5 than those ob-tained from 0'1eye rho fan dAd am s' the 0 ry [Eq . (7) ].
Uplift Capacity of Horizontal Group Anchors
A review of the existing literature shows that the onlytheoretical study proposed so far to estimate the ultimateuplift capacity of horizontal group anchors is that of~Ieyerhof and Adams (7). According to this theory, the netultimate uplift capacity of shallow circular group anchorscan be given as

64 TRANSMISSION LINE TOWERS FOUNDATIONS
Qo(g) = Qu(g) -h'g = yD2[L' +L" + (-rr/2)SIB]Kutan<P+\\'ag (10)
where Qu(a), Qo(o)=gross and net ultimate uplift capacity ofanchor gr8up, Kogself-weight of anchors in the group and the
cap, Kag=weightbof soil located immediately above the anchorgroup,
L'
L"
S'(m- 1)
S'(n-l)
(11)
(12)
where m and n=number of columns and rows in the plan of thegroup anchor (Fig. 6), and S'=center-to-center spacing ofthe anchors
I~S' S' S I.. ~~~
.--.--e-- • .-f I : S'I . I
L"=S t (n-l). e •• el-I : S I
i. --_ft_.8 __Ci t.!4- L'= 4i
S I (m-l)
Figure 6. Plan of a Group Anchor
Hence, for similar D/B ratios, the group efficiency (n)can be expressed as
Qo ( a)n(%) = b (100) = <100
mnQ o(13)
1S gl\'en by Eq. (~). Thus
YD2[ L' + L" + (0/2)SIB]K tancp + \\'= u ag(lOO)~lOO
(mn) [(0/2) SyBD2Kutan¢ + \\']
(14)
Present Laboratory Model Tests
A total of 49 small-scale laboratory model tests onsingle and group anchors were conducted in the laboratory inorder to compare (a) the existing theories to the experimentally observed net ultimate uplift capacity of single anchors, and (b) laboratory group efficiency variation (withdifferent ancl10r configurations) with the theory presented

MODEL GROUP ANCHORS IN SAND 65
by ~!eyerhof and Ada;ns (7), i.e., Eq. (14). A total of 9 model anchors were used in the present study. All anchors hada diameter of 2 in. (50.8 mm) and were made out of steelp1ate s 1/8 in. (3.18 mm) thick . Each an chor was we 1de d ta avertical steel shaft having a diameter of 1/2 in. (12.7 mm).The length of each shaft was 18 in. (457.2 mm). Holes weredrilled in the top of the anchor shaft for attaching the capwhich was required for the group anchor tests. Table 1shows the sequence of laboratory model tests conducted underthis program.
Table1.Sequence af ~!ode1Tests
Group
EmbedmentAnchorspaclngTest
No.configurationratio,D/Bln group,S'/B
(mxn)1
to6 lxl3,4,5,6,7,80
7
to11 2xl 41,2,3,4,612
to17 3xl 41,2,3,4,5,6IS
to7 - 2x2 41,2,3,4,5,6_J24
to30 3x3 41,1.5,2,3,4,5,631
to35 2xl 61,2,3,4,636
to40 3xl 61,2,3,4,641
to44 2x2 61,2,4,645
to49 3x3 61,2,3,5,6
The model tests were conducted in a box measuring 5 ft x
) ft x 3 ft (depth) (1.52 m x 1.52 m x 0.915 m). The sidesof the box were heavily braced to avoid lateral yielding.The sand used for the model tests was angular and had 100%passing No. 10 U.S. sieve, 71% passing No. 40 U.S. sieve,and 0% passing No. 200 U.S. sieve. The uniformity coefficient and coefficient of gradation were 2.14 and 1.2, respectively. The sand was compacted in the model test box bymeans of raining to an average unit weight of 98 lb/ft3(15.41 kN/m3). The triaxial angle of friction at this average unit weight of compaction was 37°. The relative densityof compaction (Dr) was 68%. In order to determine if thesize of the container used for the model tests had any effect on the ultimate capacity of single and group anchors, afew tests were conducted in a box measuring 6 ft x 6 ft x 3ft (1.83 m x 1.83 m x 0.915 m). Under similar conditions,the ultimate capacities as obtained from this box were notdifferent than those obtained from the box measuring 5 ft x5 ft x 3 ft (1.52 m x 1.52 m x 1.52 m).
For single anchor tests (Tests 1 to 6 as shown in Table1), the anchor was placed centrally in the test box and sandwas poured in 2-in. (50.8 mm) layers until the desired depthof embedment was reached. After that, a steel cable was attached to the top anchor shaft by means of a hook. Thecable passed over two pulleys attached to a steel frame.

66 TRANSMISSION LINE TOWERS FOUNDA TlONS
Step loads ',\'ereappl ied to the load hangcr, and the corre sponding deflections were recorded by a dial gauge untilpullout occurred. All tests relating to the ultimate upliftcapacity of single anchors were repeated three times, sincethese were used as the base values to determine the experimental group efficiency. The Jilagnitudes of the experimentalQo reported in the following sections are the average ofthree trials.
For group anchor tests (Tests 7 to 49), a desired numberof anchors with proper center-to-center spacing were lightlyattached to thin steel strips by means of screws. The groupassembly was centrally placed inside the test box, and sandwas then poured into the box by raining up to the desireddepth. After that, the steel strips were carefully removedfrom the top of the anchor shafts. A rigid aluminum platemeasuring 23 in. x 23 in. (584.2 mm x 584.2 mm) with severalholes drilled in it was used as the anchor cap. Once thesteel strips were removed, the aluminum cap was carefullyplaced on the anchor shafts. The anchor shafts and the capwere rigidly connected by scrcws. The reason for attachingthe anchor shafts to thin stccl strips first was to assureproper sand compaction as much as possible and still maintain proper center-to-center spacing. A steel cable was attached to the top of the pile cap. Other loading procedureswere similar to those used for single anchor tests describedabove. A schematic diagram of the laboratory test arrangement is shown in Fig. 7. For all group anchor tests, thefailure surface did extend to the surface signifying shallowanchor conditions.
Laboratory Test Results
Ultimate Uplift Capacity of Single Anchors
During the laboratory tests, the net load on the anchorincreased with the vertical movement of the anchor, andfailure occurred by sudden pullout of the anchor. The vertical anchor displacement at which the net ultimate load wasreached increased with the embedment ratio, D/B, varyingfrom about 4 mrn to 8 mm, signifying that the failure loadoccurred at a displacement of 8-16% of the anchor diameter.The net ultimate load, Qo, as determined from the laboratoryexperiments is shown in Fig. 8a.
In order to compare the present experimental results withvarious existing theories, the experimental breakout factorsat various embedment ratios have been calculated and are
shown in Fig. 8b. Along with this, Fig. 8b also shows thetheoretical plots as obtained from the theories of Vesic (8),
~Jeyerhof and Adams (7) ~ and Clemence and Veeseart (4). Fromthis, the following conclusions can be drawn.
1. The experimcntal value of the breakout factor increases with the embedment ratio and remains practically

MODEL GROUP ANCHORS IN SAND 67
Cable
Pulley
Dial gauge
. '--1" ., ..... ': . -:' :.. ;.. : .' .: . ' :.. ::... ...Sand
-,".-L -L-L~.. .. .
, r •••••••••
'..•....... .. .. ~ ...... ,.. '" ~ : ~ •••• O' ••• ~ J
Figure7 ,Schematic Diagram of ModelTest ArrangementFor Group Anchors
90 I
I Ij50(a)
I(b).-
0 I /CY
,I 30/-:J
/oj /I200 rl fQ-JF
~45 ,q
:'jI
.,...;
/I10~ /rl::1 /.
~
/Q)
,,/Z
,;' I5 r- \_T"hD~"""'T---e---,;'Experiment
o III
~V)
I
I I33
4 6034 68
D/B
D/B
Figure
8.(a)Net Ultimate Uplift Capacity of SingleAnchor;
(b)Comparison of Theoretical and ExperimentalBreakout Factor For Single Anchor

68 TRANSMISSION LINE TOWERS FOUNDATIONS
constant beyond D/n~6.5. This is fairly close to a value ofD/B=(D/Bcr=6 as predicted by Meyerhof and Adams (7) and alsoEq. (1).
2. The present experimental values of F for D/B<6 areclose to wh~t has been predicted by Meyer]lo~ and Adams (7).The theoretical variation of Fa as given by Vesic (8) issubstantially lower than the experimental values.
3. The theory of Clemence and Veesaert (4) gives slight
ly higher values of Fq than the experimental results forshallow anchor range. However, for deep anchor condition,the agreemen~ of the magnitude of the breakout factor isgood.
Ultimate Uplift Capacity of Group Anchors
The experimental ultimate uplift capacity of group anchors listed in Table I (Tests 7 to 49) were determined fromthe load-displacement plots. As in the case of single anchors, failure occurred by sudden pullout. Using the conventional definition of the group efficiency as given in Eq.(13), the experimental variations of n vs. St/B have beendetermined and are shown in Figs. 9 and 10 for D/B=4 and 6,respectively.
Trleory;Eq. (14)
-- -.--- 2xl;Expt.
---a --- 3xl;Expt.
--- • --- 2xl;Expt.
---T ---
100
80
60 r 2x)
3xl2
400
I23456
S' /B
Figure 9. Comparison of Theoretical and ExperimentalVariation of Group Efficiency--D/B=4
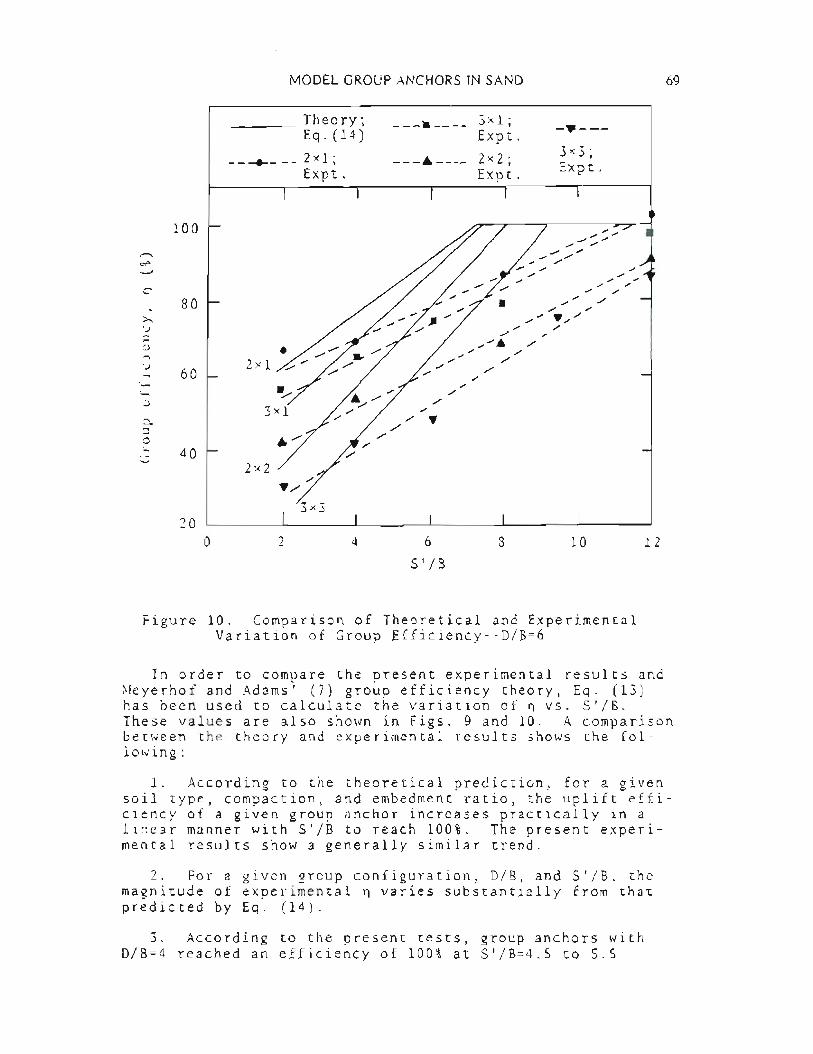
MODEL GROUP ANCHORS IN SAND
Theory;Eq. (14)
__ -.. 2xl;Expt.
___ • 3x1;Expt.
---A---- 2x2;Expt.
-..---3x3;Expt.
69
/",
/'" ~/, /,/
....,
u.~
100
80
60
40
20
o
2xl
2x2
2 4 6
S' /B
8 10 12
Figure 10. Comparison of Theoretical and ExperimentalVariation of Group Efficiency--D/B=6
In order to compare the present experimental results and~!eyerhof and Adams' (7) group efficiency theory, Eq. (13)has been used to calculate the variation of ~ vs. S'/B.These values are also shown in Figs. 9 and 10. A comparisonbetween the theory and experimental results shows the following:
1. According to the theoretical prediction. for a givensoil type, compaction, and embedment ratio, the uplift efficiency of a given group anchor increases practically in alinear manner with S'/B to reach 100%. The present experimental results show a generally similar trend.
2. For a given group configuration. D/B, and S'/B, themagnitude of experimental ~ varies substantially from thatpredicted by Eq. (14).
J. According to the present tests, group anchors withD/B=4 reached an efficiency of 100% at S'/B~4.S to 5.5

70 TRANSMISSION LINE TOWERS FOUNDA nONS
(i.e., S'/B about 1.25D/B). However, the theoretical valueof S'/B for ~=100% is approximately 3 (i.e., 0.75D/B).
4. For group anchors with D/B=6, the experimental efficlency cf 100% was reached at S'/B~6 for group cOJlfigurations of 2x1 and 3x1. However for group configurations of2x2 and 3x3, a value of n~about 90% was reached at S'/B:6.Although no experiments were conducted beyond S'/B=6, theprojection of ~ vs. S'/B plots for these configurations showthat the efficiency might have reached 100% at S'/B~7 to7.5. The theoretical values of S'/B for n=100% for thesecases varies between 3.5 to 4.5 (i.e., S'/B~0.75D/B).
5. In general. for a given D/B and SI/B, the group efficlency decreases with the increase of the number of anchorsin the group.
6. For a given SI/B and group configurations, the efficlency decreases with the increase of embedment ratio.
Conclusions
The results of the laboratory model tests for ultimateuplift capacity of shallow circular single and group anchorsembedded in medium dense sand have been presented. A maximum of 9 anchors in a group was used for the present tests.Based on the present study, the following conclusjons can bedrawn:
1. The ultimate uplift capacity of single shallow Clrcular anchors in medium sand agrees well with those predictedby the theory of jljeyerhof and Adams (7). The magnitudes ofQo predicted by Vesicls theo~y and Clemence and Veesaert'stheory are too low and too large, respectively.
2. The efficiency of shallow circular group anchors insand depends on several factors such as the degree of compaction of sand, embedment ratio, number of anchors in thegroup, group configuration, center-to-center spacing of anchors, etc. Foy medium dense sands as used in these tests,the experimental group efficiency reaches 100% at S'/B~1.25D/B.
3. The group efficiency of an anchor group follows agenerally similar trend as predicted by the theory of Meyerhof and Adams (7). However, the magnitude of ~ varieswidely from those predicted by the theory. The experimentalvalues of S'/B at which ~=100% is obtained is about 1.25 to1.5 times the value predicted by theory.
4. The group efficiency of horizontal anchor groups decreases with the increase of anchors in the group, centerto-center anchor spacing, and embedment ratio (D/B).

References
MODEL GROUP ANCHORS IN SAND 71
1. Adams, J.1., and Hayes, K., "The Uplift Capacity ofShallow Foundations," Ontario Hydro Research Quarterly,Vol. 19, No.1, 1967, pp. 1-12.
2. Baker, W. H., and Kondner, R. L., "Pullout Load Capacityof a Circular Earth Anchor Buried in Sand," HighwayResearch Record No. 108, National Academy of Sciences,1967, pp. 1-10.
3. Balla, A., "The Resistance of Breakout of ~Iushroom Foundations for Pylons," Proceedings, V International Conference on Soil Mechanics and Foundation Engineering,Paris, Vol. 1, 1961, pp. 569-576.
4. Clemence, S.P .., and Veesaert, C.J., "Dynamic PulloutResistance of Anchors in Sand," Proceedings, International Symposium on Soil-Structure Interaction, Roorkee,India, 1977, pp. 389-397.
S. Das, B.M., and Jones, A.D., "Uplift Capacity of Rectangu 1ar Founda tions in Sand," .I.T_~!l.2P0rta tion Re se archRecord No. 884, National Academy of Sciences, 1982, pp.S 4 - S 8 . --_.
6. Esquivel-Diaz, R.F., "Pullout Resistance of DeeplyBuried Anchors in Sand," M.S. Thesis, Duke University,Durham, N.C., 1967.
7. Meyerhof, G.G., and Adams, J.1., "The Ultimate UpliftCapacity of Foundations," Canadian Geotechnical Journal,Vol. S, No.4, 1968, pp. 224-244.
8. Vesic, A.S., "Breakout Resistance of Objects Embedded inOcean Bottom," Journal of the Soil :Vlechanics and Foundations Division, ASCE, Vol. 97, No. SM9, 1971, pp. 11831205.
Acknowledgements
In-depth studies relating to the subject described inthis report, as well as determination of the dynamic upliftcapacity of anchors, are presently being pursued under~ational Science Foundation Grant No. RII8604l32. This
support is greatly appreciated.

HELIX ~~CHOR FOUNDATIONS--TWO CASE HISTORIES
Albert M. Weikartl, M ASCE, and Samuel P. Clemence2, M ASCE
ABSTRACT
Two case histories are presented which describe the site conditions,
foundation design, construction, and performance of transmission towerssupported on helix anchor foundations. Both sites are located in low
lying marshes in Central New York. Access for site exploration and construction was limited. The foundation design was based on minimal in
formation of soil properties and was modified in the field due to installation problems. A comparison of the foundation capacities basedon an estimate from installation torque is made with capacities based
on geotechnical parameters of the soil. Construction procedures indifficult terrain and resolution of problems encountered during construction are described.
Introduction
The construction of structural foundations in remote, low lying
marshes presents a challenge to the geotechnical engineer. The casehistories described in this paper describe the use of helix anchors as
a successful foundation system ror electric transmission towers in theRattlesnake Gulch and Bear Swamp sites in Central New York. Both ofthese sites presented problems in terms of poor foundation material andremote location with limited access. The construction of conventional
foundation systems was precluded due to the high water table and diffi
culty of access for equipment and materials. Helix anchor foundationsprovided a viable alternative which could be installed under difficult
conditions with moderate equipment support in a short amount of time.The helix anchors were used to support four towers at the Rattlesnake
Gulch site and four towers at the Bear Swamp site. (The foundationswere installed in the summer of 1975 and winter of 1975-76 and have per
formed successfully for the past twelve years.) The site conditions,foundation design, and construction will be discussed for each site.
Rattlesnake Gulch Site
During the summer of 1974, Niagara Mohawk Power Corporation's linedepartment began an effort to repair the deteriorated foundations on theTeall-Oneida #2 and #5 11SkV double circuit transmission line.
IStructural Engineer, Niagara Mohawk Power Corporation, Syracuse, NewYork.
2professor and Chairman, Civil Engineering Department, Syracuse Univer
sity, Syracuse, New York.
72
HELIX ANCHOR FOUNDATIONS 73
The line was constructed in 1913. According to descriptions of old
er residents of the area, the primary construction equipment was horsesand stone boats. The area known as "Rattlesnake Gulch" is a swamp in
which the water table has risen over the years. It is reported that
during the 1940's the line blew over and the towers were pulled back upand guyed. According to the story, a horse became mired in the mud.
Attempts were made to pull it out but failed and the horse had to bedestroyed. During the repair program in 1974, the skeleton was uncovered confirming the story and the hazardous nature or the site.
The line is composed of steel flex (two dimensional) towers on steel
grillage foundations. Due to the soft soils, rising water table, and
marginal design, the foundations were rising on one side and/or settlingon the other side resulting in towers leaning in response to the pre
vailing winds. It had been recognized that replacement grillage typeroundations would not be appropriate. Assuming the need for heavy
equipment to install a deep foundation such as piles or drilled piers,construction of an access road was initiated.
In 1974 before beginning a tower repair program, the line departmentinitiated construction of a routine gravel road to provide access forconstruction vehicles. As the road progressed into the softer areas,
more gravel was required. When the gravel requirement became excessive,a geotextile, Mirafi 140, a new product at the time, was placed on the
ground and gravel was placed on it. The "magic carpet" floated the roadon top of the swamp eliminating the need for enough gravel to build a
road up from the bottom of the swamp. As the road construction progressed onto the deeper part of the swamp, there was insufficient bear
ing capacity to support the road, and it sank overnight leaving a long
narrow pond. A road was initiated along the right of way from the opposite side of the swamp but also ended in a pond. The shallow bearing
capacity railures of the road created mud waves and displaced one towerseveral feet transversely off the centerline of the line.
Since the access roads would probably not withstand repetitive heavytraffic and vibration and since one of the leaning towers needing foun
dation repair was isolated between the terminations of the two roads,it was apparent that the usual piles or drilled piers could not be used.
Something new and difrerent would be required.
Foundation Design
The site is located 10 miles (16 km) northeast of Syracuse, New York
in the Erie-Ontario plain region of ~ew York State. The soil profilewas developed based on three test borings made along the transmissionline route. The soil profile consists of three to four foot (0.9-1.2 m)
layer of gravel fill underlain by six to eight feet (1.8-2.4 m) of verysoft peat, muck, and marl. This organic layer is underlain by 20 to 24feet (6.1-7.3 m) of soft organic silts. These sort soils are underlain
at depths from 30 to 38 feet (9.2-11.6 m) by compact to dense interbedded silts and fine sand. The borings terminated in the dense silt and
sand at a depth of 50 feet (15.3 m).
The area is very poorly drained (swampy) resulting in a water table
at or very near the ground surface. The soils were saturated throughout

74 TRANSMISSION LINE TOWERS FOUNDATIONS
the profile. Figure 1 gives the profile with N values from standard
penetration tests taken during the subsurface investigation.
The transmission towers were double circuit 45 foot (13.7 m) (at the
bottom arm) steel flex towers supporting two 115 kV power lines. The
design loads based on high wind and heavy ice conditions for each legare as follows:
Horizontal Load:
Vertical Load:5,000 Ibs (22.3 kN)
Bearing: 55,000 Ibs (244.8 kN)Uplift: 48,500 Ibs (215.8 kN)
A deep foundation system was required due to thick zone of sort soils
overlying the compact, dense sand layer at 30 to 38 feet (9.2-11.6 m)below the surface.
Due to the depth of soft compressible soils at the site, a shallow
type foundation was ruled out. Driven piles were considered, but therewas a concern for safety with the heavy pounding or vibrating equipmenton the road. There was already evidence that the vegetation mat wasfailing where subjected to repetitive traffic. A local contractor did
submit a price, but it was high and did not provide a solution to correct the isolated structure.
The concept of the combined tension compression helical anchor foun
dation was selected. Helix anchors had been used widely as tension an
chors primarily for guy applications and in limited applications forbearing type foundations. To protect their own R&D work, the vendors
were willing to recommend an anchor for the application but would not
30
40
I 20.-CLWo
. ..
. ,..
-, ...
•• <I
, ••..• , I ••..I ,
~~. DENSE' FI NE .19'SAND AND SiLT·.··
2 i·..·: ~I • - ~ .', : : •••. . ' . '.: ..... " .
8-1
-97/ (GRAVEL
2 -:::'-- --=..::. '=-PEAT
2 --
I
o
10-.WWL.1..
Figure 1. Subsurface Profile for Rattlesnake GulchNote 1 ft = 0,305 m

HELIX ANCHOR FOUNDATIONS 75
provide an analytical basis for the design other than some empirical anchor selection charts.
Since access was limited and movement of heavy construction equipment
into the area was not feasible, a helical anchor foundation which could
1--
SOFT SOILS
.• - , ..... ~, '.
,,-'-.DENSE SOIL
/
3 HELIX ANCHOR
(01 AM. 11.3,10 and 8 inches)
Figure 2. Typical Anchor Configuration in Soil ProfileNote 1 inch = 2.54 cm

76 TRANSMISSION LINE TOWERS FOUNDATIONS
be installed using relatively light torque installation equipment wasselected. The helix anchor foundation system is shown in Figure 2. Tosustain the compressive and tensile loads from the tower legs through
the soft soils, an eight inch (20.3 em) diameter, Schedule 40 steel pipewas selected for each tower leg. The bottom of the pipe was attached toa triple helix anchor with plate diameters of 11.3 in, 10.0 in, and 8.0
in (28.7 em, 25.4 em, 20.3 em). The specifications from the anchor company required that the anchors must be installed in the dense soil layerat least three to four reet above the top helix (0.9-1.2 m) with anaverage installation torque or 5,000 ft-lbs (6.78 kN-m) to develop capa
city ror the anticipated design loads.
During construction the recommended penetration depths could not be
achieved due to the compact nature of the dense sand and silt layer.The average depth of penetration ror the top helix for each tower legwas only two feet (0.6 m) into the dense sand; the anchors refused at
approximately 8000 ft-lb (10,850 N.m) torque.
The maximum torque criteria was easily achieved; however, the re
quired minimum depth or penetration was not met. This limited penetra
tion raised questions as to the ultimate uplift capacity or the anchor.
In order to estimate the anchor capacity based on geotechnical para
meters, an analysis was performed using uplift design procedures recommended by Mitsch and Clemence (2) and Goin (1). The estimated capaci
ties along with the estimate based on installation torque are shown inTable 1. The calculated values neglect any skin friction which may dev
elop on the sides of the eight inch (20.3 em) diameter pipe in the softsilts and organic soil above the dense soil layer. The calculatedvalues are in fair agreement with those estimated from installationtorque. Table 2 shows anchor uplift capacity relationships.
Table 1. Comparison of Anchor Uplift Capacity for Rattlesnake GulchSite
Soil PropertiesI&,chor Uplift Capacity
¢
y'HID~~ kMitsch andA.B. ChanceTorque(Degrees)
(pet)qquuClemence (2) (1)Prediction
(1bs)(lbs)(lbs)
Soft Silt
26
I60
I60 ,
9 I151 0.5 ------
(0-40 feet) I
Medium Dense Sand I
34I
60I
60
231
381.2 52,40069,25080,000
(40-70 feet)
~ote 1 ft = 0.305 m, 1 Ib/ft3 = 0.157 ~~/m3, 1 Ib = -4.5 N
The field performance of the towers confirms that sufficient upliftand bearing capacity has been developed by the anchor foundation. Thetowers have withstood severe wind and ice conditions with no movement or
damaging settlement.
Construction
The foundations of the three towers accessible via the access road
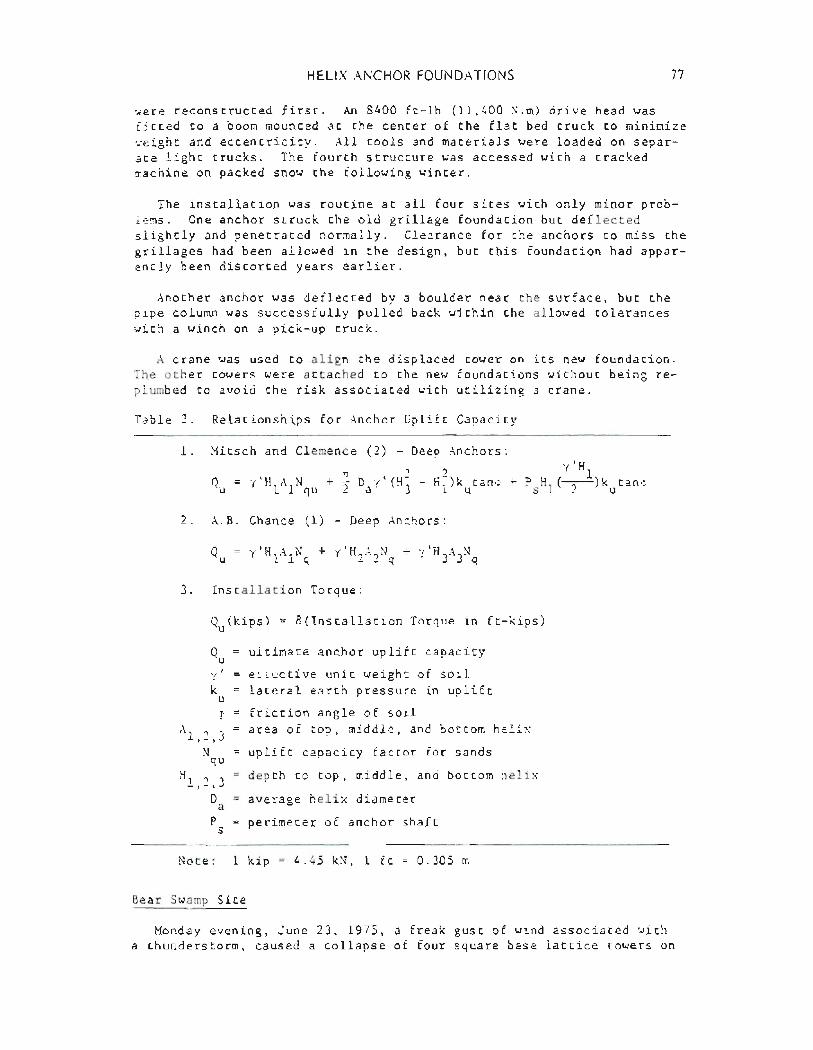
HELIX ANCHOR FOUNDA TrONS 77
~ere reconstructed first. An 8400 ft-lb (11,400 ~.m) drive head wasfitted to a boom mounted at the center of the flat bed truck to minimize
~eight and eccentricity. All tools and materials were loaded on separate light trucks. The fourth structure was accessed with a tracked
machine on packed snow the following winter.
The installation was routine at all four sites with only minor problems. One anchor struck the old grillage foundation but deflectedslightly and penetrated normally. Clearance for the anchors to miss the
grillages had been allowed in the design, but this foundation had apparently been distorted years earlier.
Another anchor was deflected by a boulder near the surface, but thepipe column was successfully pulled back within the allowed tolerances
with a winch on a pick-up truck.
A crane was used to align the displaced tower on its new foundation.
The other towers were attached to the new foundations without being replumbed to avoid the risk associated with utilizing a crane.
Table 2. Relationships for Anchor Uplift Capacity
1. Mitsch and Clemence (2) - Deep Anchors:
iT '( 2 .2)+ - D y " -" k tano2 a' 3 1 u
2. A.B. Chance (1) - Deep Anchors:
3. Installation Torque:
Q (kips) = 8(Installation Torque in ft-kips)u
Qu,
yk
U
'11
A ? 31,_,N. qu
"1,2,3D
aps
ultimate anchor uplift capacity
effective unit weight of soil
lateral earth pressure in uplift
friction angle of soil
area of top, middle, and bottom helix
uplift capacity factor ror sands
depth to top, middle, and bottom helix
average helix diameter
perimeter or anchor shaft
Note: 1 kip
Bear Swamp Site
4.45 kN, 1 ft 0.305 m
Monday evening, June 23, 1975, a freak gust of wind associated witha thunderstorm, caused a collapse of four square base lattice towers on
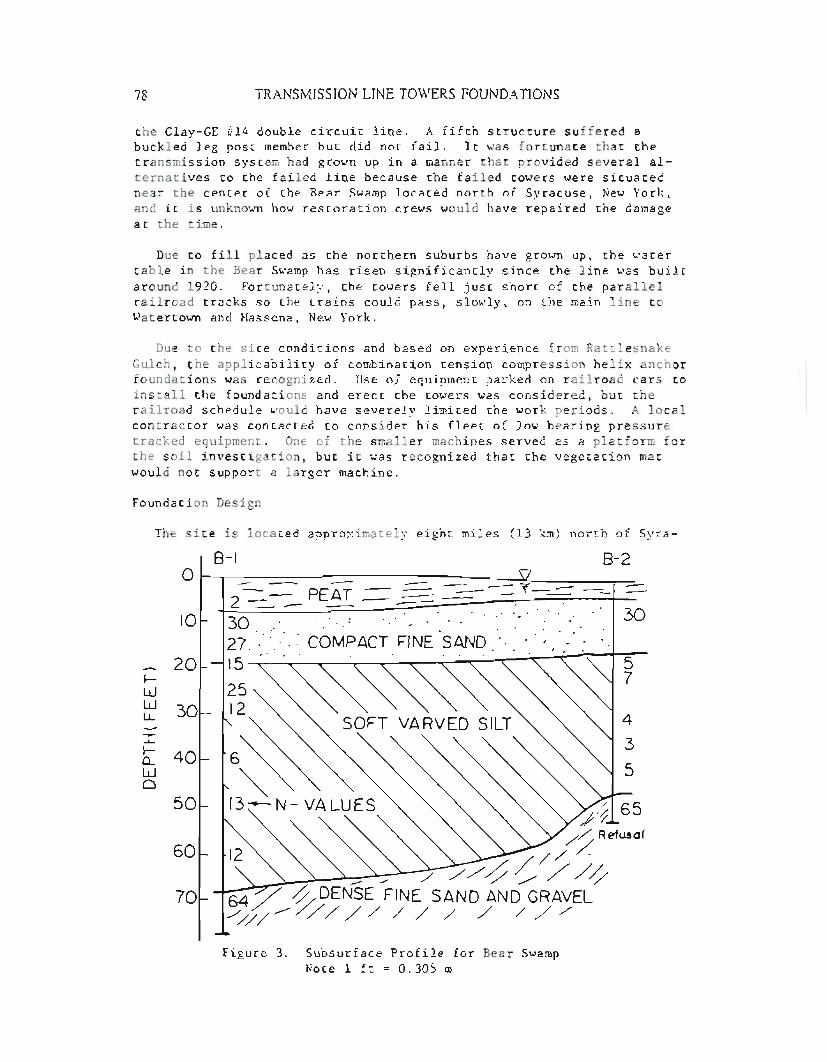
78 TRANSMISSION LINE TOWERS FOUNDA TrONS
the Clay-GE #14 double circuit line. A fifth structure suffered abuckled leg post member but did not fail. It was fortunate that thetransmission system had grown up in a manner that provided several alternatives to the failed line because the failed towers were situated
near the center of the Bear Swamp located north of Syracuse, New York,and it is unknown how restoration crews would have repaired the damageat the time.
Due to fill placed as the northern suburbs have grown up, the water
table in the Bear Swamp has risen significantly since the line was built
around 1920. Fortunately, the towers fell just short of the parallelrailroad tracks so the trains could pass, slowly, on the main line toWatertown and Massena, New York.
Due to the site conditions and based on experience from Rattlesnake
Gulch, the applicability of combination tension compression helix anchorfoundations was recognized. Use of equipment parked on railroad cars toinstall the foundations and erect the towers was considered, but therailroad schedule would have severely limited the work periods. A local
contractor was contacted to consider his fleet of low bearing pressuretracked equipment. One of the smaller machines served as a platform forthe soil investigation, but it was recognized that the vegetation mat
would not support a larger machine.
Foundation Design
The site is located approximately eight miles (13 kID) north of Syra-
---
10L hl'"'\
. ... ....~
• >
20
~ ww 30l.J... -It 40w0
50
6070
o8-2
Figure 3. Subsurface Profile for Bear SwampNote I ft = 0.305 m

HELIX ANCHOR FOUNDATIONS 79
cuse, New York in the Erie-Ontario plain region. Five borings weremade along the transmission line right of way. A typical soil profileis shown in Figure 3. The surficial layer consists of five to seven
feet (2.4-3.0 m) of very soft organic muck and peat. The organic layer
is underlain by eight to ten feet (3.4-4.8 m) of cospact fine sand. Thesand is underlain by a thick layer of interbedded sort varved silts and
sand which range from 25 to 45 feet (7.6-13.7 m) in thickness. The var
ved silt is underlain by a dense fine sand and gravel layer. Boringswere terminated at depths of 52 to 75 feet (15.9-22.9 m). The water
table was at the ground surface in all the borings. Figure 3 also includes the standard penetration test values (N) taken during construction.
The replacement transmission towers are double circuit 45 foot (13.7
m) (at the lower arm) steel flex towers to support two 115 kV powerlines. The flex towers were selected for their light weight anticipat
ing erection by helicopter. The design loads and foundation design werethe same as the Rattlesnake Gulch site. The anchors were intended to
extend into the dense fine sand and gravel. Installation, however, ofthe anchor was also difficult in the compact sand layer with the tophelixes penetrating an average of one foot (0.3 m) into the compactsand. A comparison of uplift capacities based on analyses by Mitschand Clemence (2) and Goin (1) is showu in Table 3. The uplift capaci
ties are based on uplift resistance from the anchor helixes only neglecting skin friction along the eight inch (20.3 em) diameter pipe in the
soft soils overlying the dense sand. All of the calculated capacities
are well in excess of the design loads. These to~ers have performed
with no problems since installation under ice and ~ind conditions.
Table 3. Comparison of Anchor Uplift Capacity for 3ear Swamp Site
I
-
Soil PropertiesAnchor Uplift Capacity
¢
y'HID)l)l Ik
Mitsch and I A.B. Chance
Torque(Degrees)
(pcf)qquuClemence (2) (1) Prediction
I(lbs) (lbs)
(lbs)
)lote1 ft = 0.305 m,
peat
Compact Fine
I
sand! 6 31 ~~ 8
Ib = 4.5 ~
55,110 86,000 100,000
Construction
The decision was made to wait for winter when it was possible to pack
down the snow with a small tracked machine and thus build up a frozenroad which was reinforced with slab wood as well. A torque head wasfitted to the boom on a large flexible track machine and a hydraulic
pressure gauge calibrated to the torque rating of the head was installedto provide direct torque readings. Plans were made to install the foun
dations and erect the flex towers from the tracked rig.
Although the foundation anchors were intended to be embedded with the
top helix at least two feet (0.6 m) in the sand layer 50 to 70 feet (15-
80 TRANSMISSION LINE TOWERS FOUNDATIONS
20 m) down, the anchors refused when the top helix was one foot (0.3 m)
into the fine sand at 10 to 12 feet down. Excessive torque only resulted in rotation with no penetration.
In an effort to confirm the soil boring data, a double ten inch tension anchor was installed nearby. It drove to more than 30 feet (9 m)
at 2000 ft-lb (2730 K.m) of torque. The adhesion and cohesion nearlyprevented withdrawal of the installing wrench from that depth.
The foundation anchor had performed properly, however, once the tip
of the column formed a sand plug, it could not displace enough sand topenetrate any deeper. Since the high (rerusal) torque was due to the
pipe column and not the helix anchor, there was concern that the anchorscould rail in uplift. Also, there was concern that in bearing, the anchors could punch through the compact fine sand layer into the soft var
ved silt below. Therefore, to supplement the foundation anchors, smaller tension compression anchors were fabricated from double ten inch
(25.4 em) guy anchors and three inch (7.6 em) Schedule 80 pipe. Theywere installed into the sand layer and framed into the tower base.
Warmer weather arrived as the supplemental anchors were being in
stalled. The flexible track machine destroyed the road on the way back
out. The following summer helicopters were employed to erect the towers
and lift the wires back up to the towers from the swamp where they hadbeen for a year.
Summarv and Conclusions
Helix anchor foundations provided a viable alternative to a standarddeep roundation system at sites where limited access and dirficult construction conditions were encountered. The installation problems in the
field provide userul inrormation ror future use of these roundations.
The results rrom these two sites indicate that pipe columns will not
advance into a compact fine sand layer. The designer should be aware ofthis installation limitation when using helix anchor-pipe column roundations.
A comparison or predicted uplift capacities based on installationtorque and an analysis based on geotechnical parameters indicate that
both methods are useful in estimating uplirt capacity. The tower roundations have perrormed successfully ror a significant length or time
during periods of ice and wind conditions.
References
1. Goin, J.L., "Design Examples of Helical Anchors," Foundations in
Tension, Seminar Notes, Kansas City, MO, October 2, 1986.
2. Mitsch, M.P., and Clemence, S.P., "The Vplift Capacity of HelixAnchors in Sand," Uplift Behavior of Anchor Foundations in Soil,ASCE, October 1985, pp. 26-47.

HIGH CAPACITY MULTI-HELIX SCRE'WAOCHORSFOR TRANSMISSICN LTh1EFOUNDATICNS
Thomas E. Rodgers, Jr.*
Abstract
Three case history summaries are presented which discuss the siting,design, and construction of towers supported on multi-helix screwanchor foundations in the Virginia Power service area. Access for~xploration and construction was difficult. The procedure used forconstruction and the problems encountered during construction aredescribed.
Introduction
In the past, Virginia Power has been called on to rebuildtransmission lines in eastern Virginia and northeastern North Carolinaas part of a program to upgrade service to areas which are~xperiencing industrial and residential gr~vth. Each projectauthorization called for the replacement of existing wood H-frame 115kV lines with 500 kV or 230 kV lines.
Each project appeared to be relatively routine. However,preliminary engineering reviews of aerial photos and geodetic mapsrevealed a basic fact which would greatly change the engineeringapproach to a portion of each line. The lines lay in the geomorphicEastern Coastal Plain Province which is characterizedby a gentlysloping flat regional surface with wide flat flood plains in the formof tidal marshes or swamps. The ~xisting line routes dictated thecrossing points, and it was obvious that major access andenvironmental problems would be encountered. Engineers were faced\vith the task of developing a combination of structures andfoundations which could be constructed by enviropmentallycompatiblemeans. These circumstances eventually lead to ~~e use of powerinstalled multi-helix screw anchor foundations.
Multi-helix screw anchors are often used to support a variety ofhigh voltage transmission line structures such as free-standing andguyed lattice towers, guyed pole and guyed H-frame structures.Structures of this type generate very large base reactions whensubjected to wind and ice loadings and, therefore, require foundationsand anchors capable of resisting enormous compressive and upliftforces. The use of high capacity multi-helix scr~N anchors for these
*Civil Engineering Manager (T&D),Virginia Power, P. o. Box 26666, 7th& Cary Street, Richmond, Virginia 23261.
81
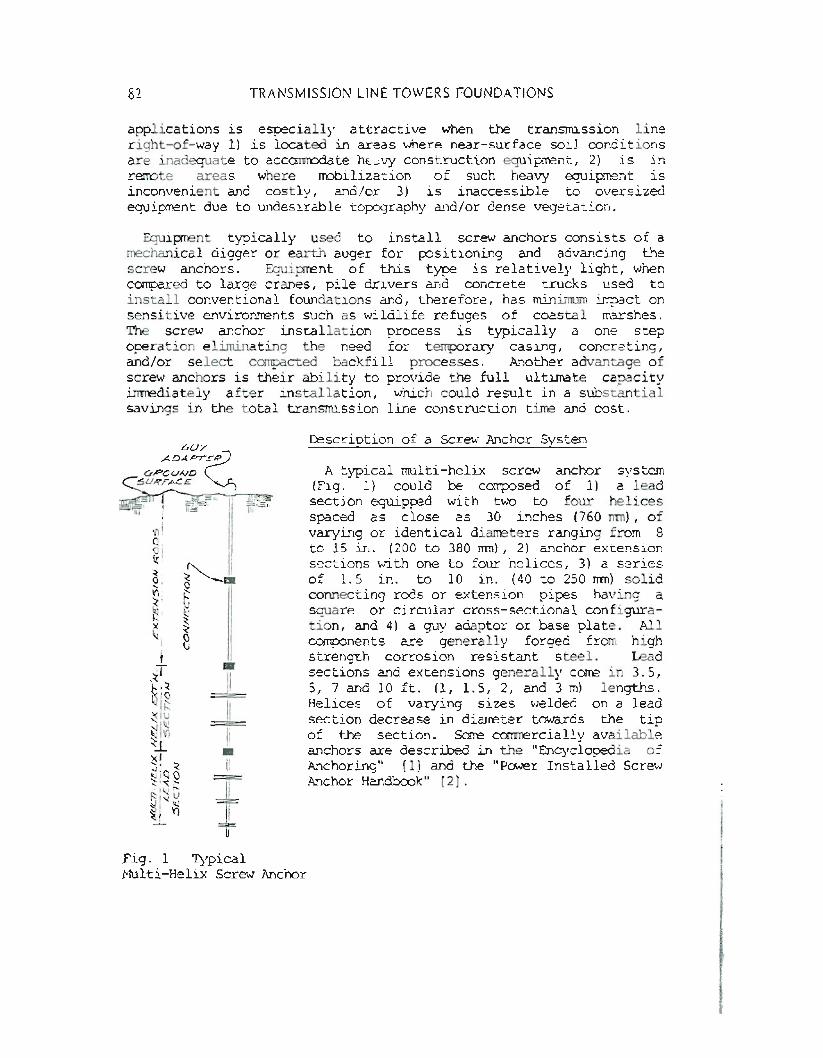
82 TRANSMISSION LINE TOWERS FOUNDATIONS
applications is especially attractive when the transmission lineright-of-way 1) is located in areas where near-surface soil conditions
are inadequate to accommodate heavy construction equipment, 2) is inremote areas where mobilization of such heavy equip.~nt isinconvenient and costly, and/or 3) is inaccessible to oversized
equip.~nt due to undesirable topography and/or dense vegetation.
Equipment typically used to install screw anchors consists of a
mechanical digger or earth auger for positioning and advancing the
screw anchors. Equipment of this type is relatively light, whencompared to large cranes, pile drivers and concrete trucks used to
install conventional foundations and, therefore, has minimum impect onsensitive environments such as wildlife refuges of coastal marshes.
Tne screw anchor installation process is typically a one stepoperation eliminating the need for temporary casing, concreting,
and/or select compacted backfill processes. Another advantage ofscrew anchors is their ability to provide the full ultimate capacityimmediately after installation, which could result in a substantialsavings in the total transmission line construction time and cost.
,.j!II,.~
Ii=====
Ii•Ii=Ii=1o
Description of a Screw Anchor System
A typical multi-helix screw anchor system(Fig. 1) could be composed of 1) a lead
section equipped with two to four helicesspaced as close as 30 inches (760 rom), of
varying or identical diameters ranging from 8to IS in. (200 to 380 rom), 2) anchor extension
sections wiL~ one to four helices, 3) a seriesof 1.5 in. to 10 in. (40 to 250 rom) solid
connecting rods or extension pipes having a
square or circular cross-sectional configura
tion, and 4) a guy adaptor or base plate. Allcomponents are generally forged from highstrength corrosion resist~Dt steel. Lead
sections and extensions generally come in 3.5,5, 7 and 10ft. (1, 1.5, 2, and 3 m) lengths.
Helices of varying sizes welded on a leadsection decrease in diillnetertowards the tipor the section. Some commercially availableanchors are described in the "Encyclopedia 0:Anchoring" [1] and the "PCM1er Installed ScrewAnchor Handbook" [2].
Fig. 1 Typical~mlti-Helix ScrBv Anchor

MULTI-HELIX SCREW ANCHORS
O.5E HISTORIE'S
Site Description and Geology
The three transmission line segrrents to be examinedin the CoastalPlains Province are: 13 mi. (21 km) on the Suffolk-Yadkin 500 kVline, engineered in 1968 and built in 1969-70; 1.25 mi. (2 kIn)on theLane..xa-Shackleford 230 kV line, engineered in 1974, built in 1976-77;and 3 mi. (5 kIn)on the Earleys-Trowbridge 230 kV li.1'1e,engineered in1977, built in 1978.
The Suffolk-Yadkin 500 kVtransmission line crossed the northern endof one of the geological wonders of the area, The Great Disrral Swamp.Originally, the swamp spread over approximately twenty-two hundredsquare miles of dense, partially inundated forest 1~1'1din southeasternVirginia and northeastern North Carolina. Thousandsof acres of theswampland have been cleared and drained for cultivation. There aremany miles of dry forest around the edges of the swamp. Today theswampproper contains between seven hundred fifty and one thousandsquare miles and is about 40 mi. (64 km) long, running north andsouth, and 15 mi. (24 kIn)wide east and west. (Fig. 2). The water inthis swampyreservoir is trapped by the land escarp:rent on the west, asedirrentary sea bottom underlying the swamp which is linpervious towater, by rows of sand dunes on the seaward side, and denselyentangled undergrowth in and about the swamp. The floor of the swampcomposed of bark, woodand juniper leaves is a quagmire locally ~~owTIas "scurf". This huge sponge remains water soaked and is so soft thathorses and mules find it difficult to walk on, and it trembles undermanI s feet.
Soil borings along the line reveal that the Dismal Swamppeat ishighly variable in L~ickness, 2 to 20 ft. (0.61 to 6.1 m), because itwas deposited on an irregular topography. The peat consists of soft,spongeliJ<.e masses of decaying leaves, twigs, st1.:IIrq?s,logs and otherplant debris. It is highly compressible, is sheared easily, and isaccompanied by a high water table. Draining the swampis unfeasiblebecause of the potential for fire damageand atrrospheric oxidation ofthe peat.
The Lanexa-Shackleford 230 kV transmission line, (Fig. 3) crossesapproximately 1.25 mi. (2 km)of tidal marsh from G'1ehigh ground onthe south edge to the Pamt1f\.keyRiver. The Eltham i-1arshis a tranquiltidal marsh located on the Pamunkey River, immediately above theconfluence of the Mattaponi and L~e PamunkeyRivers at West Point,Virginia. The marsh cover is predominantly marsh grasses with sparsescatterings of scrub trees or shrubs. A network of meandering canalscriss-cross the area. This type of marsh is considered to be veryimportant with respect to the environment and, therefore, was givencareful attention by Virginia Power. Soil borings taken in the marsh
83
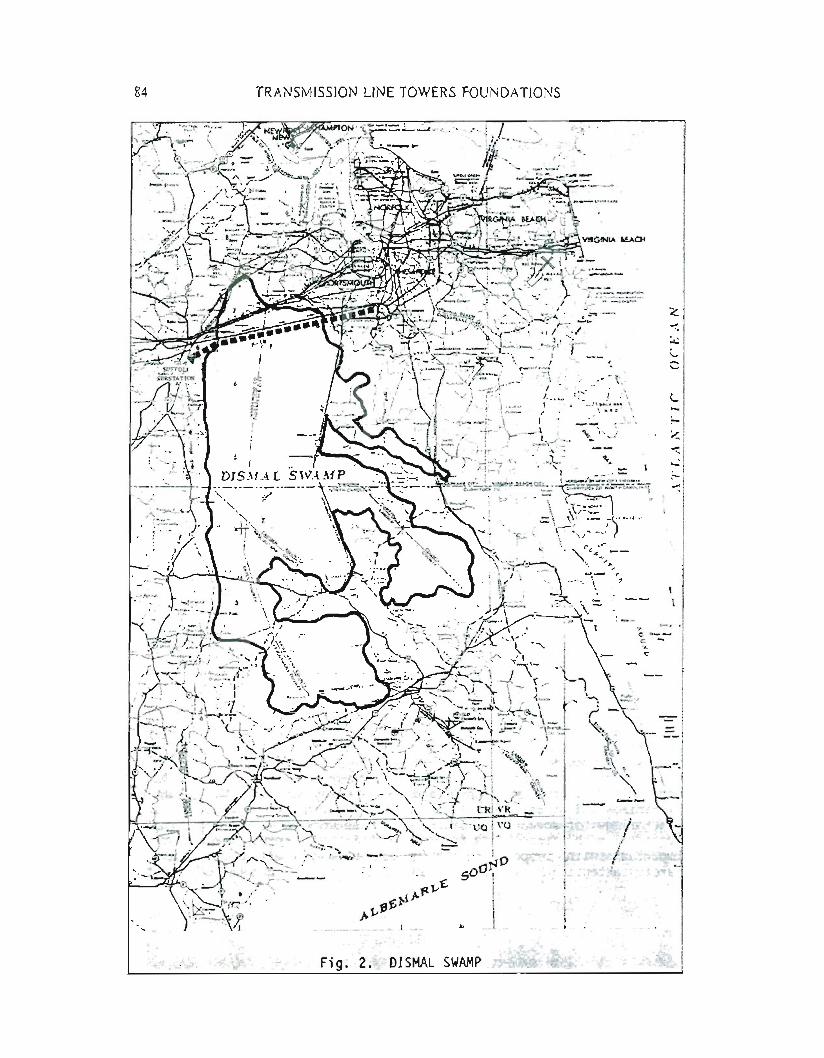
84 TRANSMISSION LINE TOWERS FOUNDATIONS
.. '..,.~"J
~.~f-- "~ f.-._ i.
'" ·'.fI
-,'c'· _/'0;!/:::-;;:
....
Fi g. 2 ;.,' DISMAL SWAMP

MULTI-HELIX SCREW ANCHORS
FIG. 3. ELTHAMMARSH
Fig. 4. ROANOKE SWAMP
85
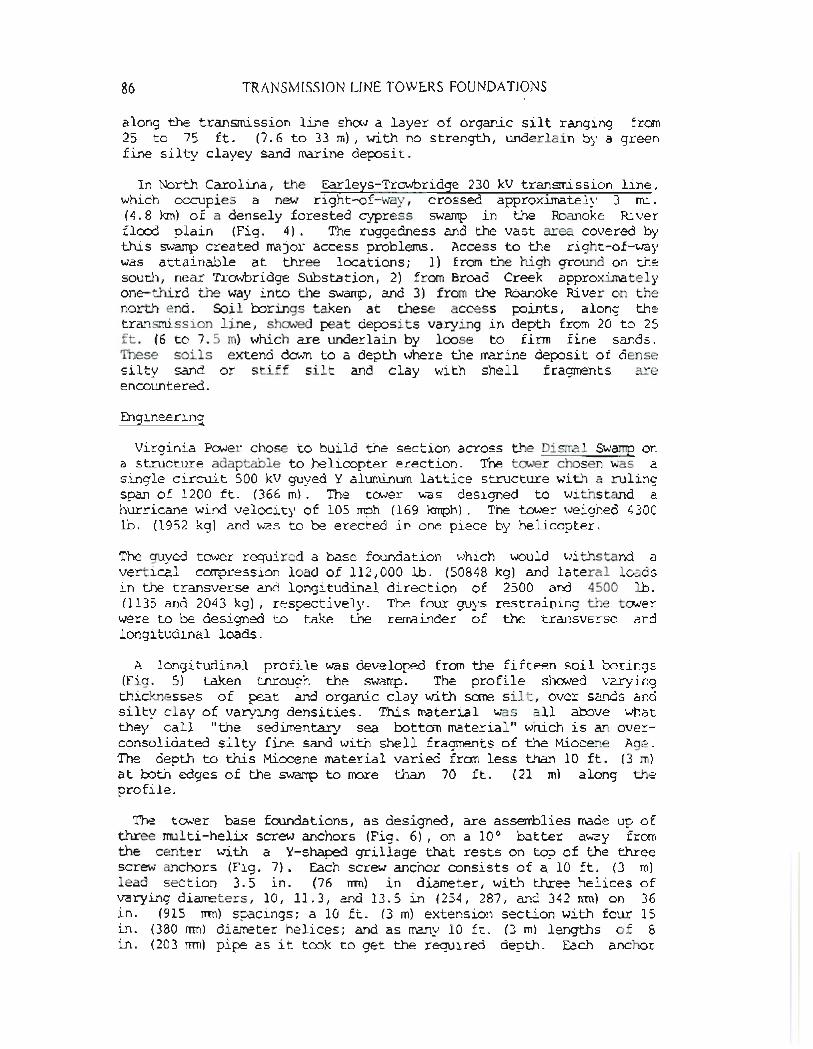
86 TRANSMISSION LINE TOWERS FOUNDATIONS
along the transmission line show a layer of organic silt ranging from25 to 75 ft. (7.6 to 33 m), with no strength, underlain by a green
fine silty clayey sand marine deposit.
In North Carolina, the Earleys-Trowbridge 230 kV transmission line,which occupies a new right-of-way, crossed approximately 3 mi.(4.8 krn)of a densely forested cypress swamp in the Roanoke River
flood plain (Fig. 4). The ruggedness and the vast area covered bythis swamp created major access problems. Access to the right-of-waywas attainable at three locations; 1) from the high ground on the
south, near Trowbridge Substation, 2) from Broad Creek approximately
one-third the way into the swamp, and 3) from the Roanoke River on thenorth end. Soil borings taken at these access points, along thetransmission line, showed peat deposits varying in depth from 20 to 25ft. (6 to 7.5 m) which are underlain by loose to firm fine sands.Tnese soils extend down to a depth where the marine deposit of dense
silty sand or stiff silt and clay with shell fragments areencountered.
Engineering
Virginia Power chose to build the section across the Dismal SWamp ona structure adaptable to helicopter erection. Tne tower chosen was a
single circuit 500 kV guyed Y aluminum lattice structure with a rulingspan of 1200 ft. (366 m). The tower was designed to withstand a
hurricane wind velocity of 105 mph (169 krnph). The tower weighed 4300lb. (1952 kg) and waS to be erected in one piece by helicopter.
The guyed tower required a base foundation which would withstand a
vertical compression load of 112,000 lb. (50848 kg) and lateral loadsin the transverse ~~d longitudinal direction of 2500 and 4500 lb.
(1135 and 2043 kg), respectively. The four guys restraining the towerwere to be designed to t~~e the remainder of the transverse andlongitudinal loads.
A longitudinal profile was developed from the fifteen soil borings(Fig. 5) taken through the swamp. The profile showed varying
thicknesses of peat and organic clay with some silt, over sands and
silty clay of varying densities. This material was all above whatthey call "the sedimentary sea bottom material" which is an overconsolidated silty fine sand with shell fragments of the Miocene Age.
The depth to this Miocene material varied from less than 10 ft. (3 m)at both edges of the swamp to more than 70 ft. (21 m) along the
profile.
The tower base foundations, as designed, are assemblies made up of
three multi-helix screw anchors (Fig. 6), on a 100 batter away fromthe center with a Y-shaped grillage that rests on top of the three
screw ~~chors (Fig. 7). Each screw anchor consists of a 10 ft. (3 m)lead section 3.5 in. (76 rom) in diameter, with three helices of
varying diameters, 10, 11.3, and 13.5 in (254, 287, fu~d 342 rom) on 36
in. (915 rom) spacL~gs; a 10 ft. (3 m) extension section with four 15in. (380 rom) diameter helices; and as ~~y 10 ft. (3 m) lengths of 8
in. (203 rrm) pipe as it took to get the required depth. Each anchor

87MULTI-HELIX SCREW ANCHORS
was to te installed to 9000 Th.ft (12195 N'm) rnin.imurnand 10,000 Th·ft(13560 N·m) ~ torque so as to penetrate the Miocenematerial as
muchas possible.
The guy tension anchor, as designed, was a multi-helix screw anchorutilizing a 1.5 in. (38 rrm)square steel bar for the rod section.Each anchor consisted of a 10 ft. (3 m) lead section with four helices8, 10, 11. 3, and 13.5 in. (203, 254, 287, and 342 rrm)on 36 in. (915rrm) spacing and a 10 ft. (3 m) extension section. fach anchor was tobe installed approximately 30° off the vertical, to 4500 Th.ft (6100~m) minimumand 5300 Th.ft (7186 N.m)IM.Ximumtorque. Installed, theguy anchor should give an ultimate holding p:1Ner of 70,000 Th(31780 kg) .
After the installation of the first complete tower foundationsystem, a static load test of the tower base foundation and a guyanchor was rrade under the supervision of A. B. ChanceCompanyandobserved by Virginia Power. The static load test of the tower basefoundation unit was to 125,000 lb. (56750 kg). Loading increments of20,000 to 100,000 lb. (9080 to 45400 kg) and then in 5,000 lb. (2270kg) increments to 125,000 lb. (56750 kg) were applied and settlementreadings were rrade at each of the load incr~~ts. Under theIM.Ximumcompression loading conditions, the foundation settled 0.25in. (6 rrm); upon release of the load, the unit recovered to itsoriginal elevation.
The first test of the guy anchor, which was being tested to 60,000lb. (27240 kg) failed at 50,000 lb. (22700 kg) with a steady creep.The 40 ft. (12 m) anchor was placed at a 60 degree angle giving it a34 ft. (10.4 m) vertical orientation from the ground surface. Asecond anchor was installed with the helix section of the designilllchor plus a 10 ft. (3 m) extension with two 13 in. (330 rom)helices.It was installed to 4500 lb·ft (6100 N.m) torque at 30 ft. (9 m) alongthe rod or a 25 ft. (8 m) vertical measur~rnent below the surface.This anchor held up to 69,000 lb. (31326 kg) and failed under a steadycreep at 70,000 lb. (31780 kg) .
The guy tension anchors installed were changed from the initialdesign to the guy multi-helix anchor consisting of a 10 ft. (3 m)section with four helices, 8.0, 10.0, 11.3 and 13.5 in. (203, 254, 287and 342 rrm) in diameter on 36 in. (915 rrm)spacing, a 10 (3 m) foot~xtension section with two 13.5 in. (342 rom) diameter helices andextension rods. The anchors were to be augered until a minimumof4500 lb·ft (6100 N~m)torque was reached. Each guy anchor assemblyinstalled was field tested to 25,000 lb. (1135 kg) tension. Thepurpose was to test the anchor to working load, set the anchor, andcheck its alignment.
For the 230 kV transmission line across the Eltr2rnMarsh, six 155ft. (47 m) self-supporting double circuit lattice towers were to beused. The maximumfoundation reactions are 100,000 lb. (45400 kg)tension, 123,000 lb. (55850 kg) compression and 24,000 lb. (10900 kg)shear. This tower was also designed to be, and was, erected byhelicopter.

88 TRANSMISSION LINE TOWERS FOUNDA nONS
A series of five soil borings (Fig. 8) were taken as close to thetransmission line centerline as :possible by using the rreanderingcanals, setting the drilling equipment off on the bank and taking aboring. This produced a profile that showeda layer of organic siltranging from 25. ft. (7.7 m) at the south end to 75 ft. (33 m) at thePamunkey River bank, with no strength, underlain by a dense very fineto fine sand.
\\)
~
FIG. 7 - GRILLAGE
FIG. 6 - SCREW ANCHOR FIG. 9 - BASE PLATE
The multi-helix screw anchor foundation designed for the ElthamHa.rsh was a three anchor cluster, one vertical anchor and Th.D anchorsbattered (one transverse, one longitudinal), for each of the tOYler'sfour legs (Fig. 9). Each screw anchor consists of a 10 ft. (3 m) leadsection 3.5 in. (76 mn) in diarreter, with three helices of varyingdiarreters, 10, 11.3, and 13.5 in. (254, 289, and 342 mn) on 36 in.(915 mm) spacings; a 10 ft. (3 m) extension section, 3.5 in. (76 rom)
diarreter with two 13.5 in. (342 mn) helices; and the appropriatenumberof 10 ft. (3 m) length of 8 in, (203 rom) diarreter pipe extension to reach the required depth. Each anchor was to be installed to10,000 lb ft (13560N m) of torque to penetrate the dense sand as faras :possible. There was no practical way of testing the anchors.
After all anchors in a group were in place, they were cut off tograde, approxinately 24 in. (610 nm) above the marsh, and a 1.5 in.(38 nm) plate was set over the anchors and each anchor was welded tothe plate. The tower base showis :positioned and welded to the plate.Tne helicopter guide angle was installed, (Fig. 10) and then thefoundation was ready to accept the transmission tower.

MULTI-HELIX SCREW ANCHORS 89
80RING E-7 BORING E-8
~oq CHANCI-.G fO r.A"" \oflfH~.6Cf OF $>o£LL "'~AC;I"\["Ir,
DESCRIPTION
\..JCWT SRC\oI" "IHI( 10 ~orlJf'O SAHO
LESS: o.o£O!UM SAN()
>- 9RO_ "£",r
l!.(.;oT 8~OV" OW'~rc CLA" \of1T'"
~ ')ft.f ""4J '"""C( r::F poor'S
:;;sw •••• ft.f" CU'" .••If'" f~o!oC( OF"~:'L "~A(Ofo4IE"lS: two«) OEC.6"£O'f'E(;;[TAql)o.l
:;o>{e- •••fS •••·G.QIA •• SIL n ~['NE SAo,()
••:1'1 SOf4€ SH::LL 'I'It1oGI"£HTS
PT
0•.•
CH
S"
SuRFAC£ ELEvATJON "ZI'ilOCAf;Qt>.b 4QJAC£NT TO ExiSTING
n:.E:R 57
23
SY/"BDLS
12
I"
205
103
103
I"
102
SIL T ,"00:£ TS ANQ Se»-o£
~LL ""AGME"'S
O&oRot B••., ••••• "f4'
g••c ••• c••,.•••••••!C r:!."~ _If"" 'SOME:
\11.' ••...., '''acE 'Y" "rXHS
GA." ,: lNE ~o C'JaRS£ $"'0.0•• ttH r"'GCE OF tIN{ ~"'A"'Et
C;~"'f ':1"'( S<>NO••IT'" SILT'":1.•••1' '"OCI«(fS .-.0 '''ACE 0"C£C"':fED ••.rCE,a1!t)I'I
SA
SA
SURFACE ELEI/ATtON "21'L
LOCATION. AOJACENT TO EXISTiNG
1O~H~ 71
:::':15IJ
SYMBOLS DESCRIPTION
z.
86
,.
151
~0/7'
45
15
20
25
60
55
30
35
40
- 50
NOrEi T!-'E •. IGIJRES IN rHE CCLUMN lA8ELED3LOW COUNT INDICATE fHE NUM8U~ OF SLO ••••.S~E:DU!RE:O ro ADVANCE THE DAMES \ ~aORESOIL SAMPLE!=! .Q OISTANCE O~ Q".jE ~aOT
USING A 140 LB.\otEICHT ~ALUNG Je' r~'CHE5.THE [lA""~S e. MOORE SOIL SClMPI.ER HAS AN
G.O. OF Jlf. iNCHES ONO AN \.0. OF 2~ INCHES.
o1
2
34
56 789 -
10
FIG. 5 SUFFOLK YADKIN
BORING TR-8 BOR[NO 8-5
cPAOI'CC ""{T11 A LITTLE M(O(l.f"IS~"0<1 S•.•••.LL rA",o"'e",TS
~ ••• ORCANIC SRT A"IO Oe:C:A"I~Vt:!:;tT",qON II/ER" SO'-O
!IlUlE·GI'I""" F'!H( 5.....0 WI''''•• fll'1,""E OF 'SIL T I,",EOIUM OEH5C:1
"-L'E-CAtIoY cLA ••ey SILT IofPH A
p•.6CE OF '1N€ SA"<) toN() S"'fLL"~E"'TS. SUCI<IT\.y ""IC"-C£OUS:
, •.•e:OIUM "TIn",
~AOJNC TO 5H""
:tr..L£-CRA'I' nNE SAN() ""ITH
S;:)Io<€ SIL T tLOOSEI
SP
SYMBOLS DESCRIPTION
A
q
Iq
15
45
20
25
30
7121
75
55
50
35
4121
60
65
15
6789
10
V£~'I' <"INI; '0 q ••£ GI:>"~r•••.•GI'IEEN SAND ""I'" SU ••••" G~"' .•..£L
P(AT "'lJCI(
PEAT 1'041,£1(
GRA,. SILTY ~UCI( \oI!1" Gi:lA'I'!SH(jR'EEN SIL 11 S,n,1ot() Lf"l'SrS
OL
.,"-.I sw
:....:
',: .
SYMBOLS DESCRIPTION
2q
21
Iq
45
70
20
25
30
35
15
50
o
5
75
10
60
65
55
40
SURFACE ELEv,,",TION (•• "'0~5j:":·)LO[OftOl'h 5To.. !6gq .• 48
FIG.8 LANEXA SHACKLEFORD FIG. 11 EARLEYS - TROWBRIDGE

90 TRANSMISSION LINE TOWERS FOUNDATIONS
The 230 kV line across the RoanokeRiver Swampused ten 155 ft.(47 m) self-supporting double-circuit lattice towers, the same towersas on the Eltham Marsh line. This line was constructed on newright-of-way and access into the swamp for soil borings was verydifficult. Wecut in from the land side approximately 300 ft. (100 m)to take one boring. Wecame in Broad Creek and cut both ways to gettv.Dborings, and from the river, we got one on the bank a!1d in about150 ft. (45 m). A profile was then m:tdeof the three miles using thefive soil borings (Fig. 11). This inforffi3.tionwas used to design theanchors. The profile showed 20 to 25 ft. (6 to 7.5 m) of peat,underlain by loose to firm fine sands which varied in depth at eachboring from 12 to 30 ft. (3 to 9 m) and then into a stiff marineclayey silt. The anchors were designed to take up at 10,000 lb·ft(13560 N·m) of torque in the sand layer, at an approxim:tte depth of50 ft. (15 m) •
The anchor design was about the sameas that used in the ElthamMarsh. Tne differences were: the extension section was a 6 in.(152 mn) diameter pipe instead of the 3.5 in. (76 mn) pipe and thepipe sections were joined together by 13.5 in. (342 rom)helix flangesbol ted together instead of threaded coupling. The rest or the threeanchor assembly was the same.
Fig. 10Foundation For Leaof Lattice Tower

Construction
MULTI-HELIX SCREW ANCHORS 91
In the Dismal Swamp,the construction of the tower foundations wasstarted approaching the swampfrom the west side. Union-Camp,a paperproduct company who owned the portion of the Dismal Swamp inNarlserrDnd,Virginia, at that tirre, had built sane pr:Lrnitiveroads forG~eir timbering operation. By using sane of these roads, thecontractor could reach the transmission line right-of-way in thece:1ter of the swamp. This center point and the ti_Dline-entry pointsinto the swampwere the contractors only ground access for work.
Because of the trafficability problems, the contractor used twotyt:€s of track equiprent along the right-of-way. The one used for thehea\y hauling of the foundation materials was a quad-track carriercalled "Juggernunt" which is buil t li.."I(ea truck, but rW1Son abouteiqht-foot tracks instead of wheels.
The other type of equiprent was a small track vehicle called a"&::fT1bardier". Three different rrodels of this vehicle were used. Twom::x:.els,the "MuskegCarrier" and the "MuskegTractor", weighed about7,000 lb. (3180 kg), travel on 28 in. (711 rom)wide tracks loaded witha r:B.Xi1m..rrnpay-load of 8,000 lb. (3630 kg), and have a zero penetrationground pressure of only 1.5 psi (10.3 ~~/m2). These tivo were used aspersonnel carriers and for light hauling. This type of vehicle wasalso used to make the soil borings.
The third "Banbardier" vehicle was called the "Terrain Master", afour-powered track unit. The Terrain Master weighs 16,000 lb. (7260
kq) and can carry a maxi1m..rrnload of 15,000 lb. (6800 kg). wnenloaded, the ground pressure at zero penetration is 3.4 psi (23 kN/m2)for the power unit and 7 psi (48 kN/m2)for the loaded deck unit wherethe contractor mounted a hydraulic boom with a 10,000 lb ft(13560 N m), two speed rotating hydraulic digger unit.
\'lith the above equiprent, the contractor approached the western edgeof the Dismal Swampand started the foundation work for the fortyguyed-Y aluminumtowers. His work procedure was to install the threebase anchors--consisting of tivo 10 ft. (3 m), 3.5 :L~. (89 rom) hollowshaft pipe with increasing diameter helices, and then the 8 in.(203 rom)standard structural pipe--until the hydraulic digger unitregistered a shaft torque of 9,000 lb·ft (12200 N.m)mini1m..rrnreading.The torque was measured by a dynamometerinstalled on the kelly barbeDoJeen the digger unit and the anchor shaft. The unit usually tookb.D to four pieces of 8 in. (203 rrm)pipe. After all three units werein place, the 8 in. (203 rom)pipe was burned off to allow the top ofthe grillage to be 24 in. (610 nm) above the swamp. The foundationwaS then ready to take the tower.
The Terrain Master was positioned to install each of the multi-helixscrew anchors at each guying point. The anchors varied in length from28 ft. to 124 ft. (8.5 to 38 m) before reaching the required torque of4500 lb·ft (6100 N.m). After each anchor was installed to therequired torque reading, it was tested in tension to 25,000 lb. (11350
kg). The anchor was pulled to 5,000 lb. (2270 kg) and then loaded in
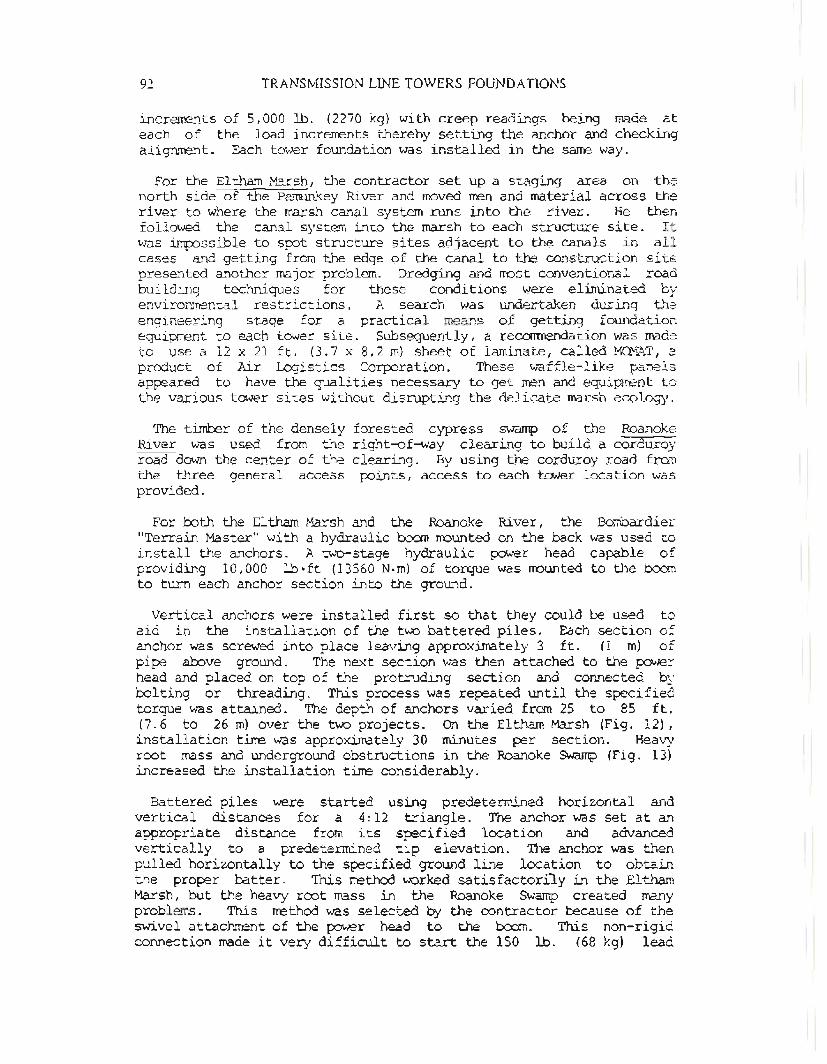
92 TRANSMISSION LINE TOWERS FOUNDA TrONS
increments of 5,000 lb. (2270 kg) with creep readings being made ateach of the load increments thereby setting the anchor and checkingalignment. Each tower fOllildationwas installed in the sameway.
For the Eltham Marsh, the contractor set up a staging area on thenorth side of the PamunkeyRiver and movedmenand material across theriver to where the marsh canal system rUJ1Sinto the river. He thenfollowed the canal system into the marsh to each structure site. Itwas impossible to spot structure sites adjacent to the ca.'1als in allcases and getting from the edge of the canal to the construction sitepresented another major problem. Dredging and rrost conventional roadbuilding techniques for these conditions were eliminated byenvironmental restrictions. A search was llildertaken during theengineering stage fora practical means of getting fOllildationequipment to each tower site. Subsequently, a recorrmendationwas madeto use a 12 x 21 ft. (3.7 x 8.2 m) sheet of laminate, called M~~T, aproduct of Air Logistics Corporation. These waffle-like panelsappeared to have the qualities necessary to get menand equipment tothe various tower sites without disrupting the delicate marsh ecol090'.
The timber of the denselyRiver was used from theroad downthe center of thethe three general accessprovided.
forested cypress swamp of the Roanokeright-of-way clearing to build a corduroyclearing. By using the corduroy road frompoints, access to each tower location was
For both the Eltham Marsh and the Roanoke River, the Bombardier"Terrain Master" with a hydraulic boommolliltedon the back was used toinstall the anchors. A two-stage hydraulic power head capable orproviding 10,000 lb·ft (13560 N.m) of torque was ffiOlliltedto the boomto turn each anchor section into the grollild.
Vertical anchors were installed first so that they could be used toaid in the installation. or the two battered piles. Each section ofanchor was screwed into place leaving approximately 3 ft. (1 m) ofpipe above grollild. The next section was then attached to the powerhead and placed on top or the protruding section and connected bybolting or threading. This process was repeated lliltil the specifiedtorque was attained. The depth of anchors varied from 25 to 85 ft.(7.6 to 26 m) over the two projects. On the Eltham Marsh (Fig. 12),
installation tiTre was approximately 30 minutes per section. Heavyroot mass and underground obstructions in the RoanokeSwamp(Fig. 13)increased the installation tiTre considerably.
Battered piles were started using predetermined horizontal andvertical distances for a 4:12 triangle. Tne anchor waSset at anappropriate distance from its specified location and advancedvertically to a predetermined tip elevation. Tne anchor was thenpulled horizontally to the specified ground line location to obtaillthe proper batter. This rrethod worked satisfactori1.y in the ElthamMarsh, but the heavy root roass in the Roanoke SWampcreated manyproblems. Tnis rrethod waSselected by the contractor because of theswivel attachrrent of the power head to the boom. This non-rigidconnection made it very difficult to start the 150 lb. (68 kg) lead
MULTI-HELIX SCREW ANCHORS
Fig. 12 Construction - ELTHAM ~~H
Fig. 13 Construction - ROANOKE SW?~~
93

94 TRANSMISSION LINE TOWERS FOUNDATIONS
section on the proper batter without a rigid guide or template whichthe contractor elected not to use. The nature of the surficial soilson these projects allowed for the horizontal movementof the anchorsto be accomplished satisfactorily, but soil with any appreciable shearstrengr...hwould not allow the anchor to be movedhorizontally as in thearove rrethod. Consideration should be given to a rigid guide ortemplate which would allow the anchor to be started at the properbatter with little horizontal movement.
Unfortunately, the construction of the two projects was not problemfree. The Roanoke Swampand its heavy root mass caused significantproblems and construction delays. Subrnergedlogs and massive cypressroots made it very difficult to get proper anchor alignrrent. Muchofthe debris had to be removed, this created significant loss of tirre.
Anchor failure during construction occurred on both projects. Onthe Eltharn Marsh, two anchors failed near the cut off torque of 10,000lbon (13560N,m). Sorreof the anchor sections were recovered, butactual cause of failure was undetermined. In the RoanokeSwamp,construction was plagued with several anchor failures. Tnese failuresare thought to have been a result of the underground obstructionsencountered during construction. The failures generally occurred atshallow depths and at relatively low torque. Wefeel that excessivehorizontal movementof the anchors during installation put unduestress on the anchors and caused failure.
Tne lead time for the anchor material was 8-10 weeks. Tnis createdscheduling problems on the Earlej's Line whenanchor failures occurred.When ordering material, anchor failure was not anticipated and noextra lead nor lead extension sections were purchased. Anchorpenetration can be estimated, but actual length is not definite.Actual penetration of someanchors was 20 ft. (6.6 m) deeper thanestimated.
In the Eltham Marsh, anchor penetration was within 3 ft. (1 m) ofestimated depths and, except for the two anchors that failed,materials procurement was not a problem.
Conclusion
Surface and access conditions on all three jobs were the mainfactors for using multi-helix screw anchors. The peat and organicsurface materials in the Dismal Swampmade the moving from site tosite slow going. The delicate ecology of the Eltharn Marsh remainsunblemished because we were able to use the lightweight equipment onthe Ma1AT,and manpo.verto install a foundation capable of taking thetower loads. The ruggedness of the RoanokeSwampmade the going slowa.."1dtook its toll in anchors. But, with such acces s limi ta tions asdescribed aro\~ and increasing environrrental restraints, VirginiaPower's engineers considered the high capacity multi-helix screwanchor foundation to be a viable alternative to conventionalfoundations.

MULTI-HELIX SCREW ANCHORS
References
95
1. A. B. Chance Canpany, "Encyclopedia of Anchoring."4-7706, 1977, 29 pp.
Bulletin
2. Joslyn HardwareSystem HandJ:x:::ok."
Division, "Joslyn Power Installed Screw AnchorPLHD-PED-I-75;Chicago, Illinois, 1975, 121 pp.
3. Rcdgers, T. E., Jr., "The Dismal Swampand the Successful 500 kVLine." CIGRE's (International Conference on Large High TensionElectric Systems), Study Carmittee 22 Meeting, Stuttgart, Gerrrany,JW1e 1973.
4. Rodgers, T.E., Jr., and Elliott, O.F., Jr., "High Capacity of!v1ulti-Helix Screw Anchor for Self-Supporting To.ver FOW1dation."Southeastern Electric Exchange, Engineering & Ooerations Division,Transmission Section, May 9-11, 1979, Bal Harbour, Florida.
SPREADFOUNDATIONSIN UPLIFT: EXPERIMENTALSTUDY
Fred H. Kulha~7l, F.ASCE, Charles H. Trautmann 2, M.ASCE, andCostakis N. Nicolaides3
ABSTRACT
The uplift capacity of spread foundations can be influenced bythe native soil density, backfill soil density, foundation depth; andfoundation shape. Each of these factors was investigated for modelspread foundations in dry sand by an experimental program of 90 uplifttests. Load- displacement data and observations of the failure modewere obtained, and the results indicate that backfill compactionincreases the uplift capacity and stiffens the load-displacementresponse for all native soil densities, with greatest influence indense soils. Foundation capacity increases substantially with depth,especially in dense soil. The test results agree well with publishedexperimental studies in homogeneous deposits; however, there appear tobe no comparative studies in which the densities of the native soiland backfill soil differ. These test results are relevant to theoptimal design of foundations for electrical transmission linestructures.
INTRODUCTION
Spread foundations are used extensively within the electricutility industry as the foundations for four-legged lattice towers.For example, the results of a recent survey by the Electric PowerResearch Institute showed that about half of all existing towers inthe U.S., and about one-third of those planned for construction in thenext decade, use this type of foundation (Kulhawy, et al., 1983). Inspite of this extensive usage, many of the factors controlling theuplift behavior of these foundations are not understood adequately.
It has been accepted for many years that the uplift capacity ofspread foundations increases, in general, with increasing size anddepth of foundation and increasing soil density. Field rest data alsohave been available that have shown the important effects of backfillcompaction, for example as sho~~ in Figure 1. These data clearlyillustrate that increased compaction of the backfill over the foundation increases the uplift capacity and stiffens the load-displacementresponse of the foundation.
Experimental and analytical studies of uplift capacity largely
Iprofessor, 2Research Associate,School of Civil and EnvironmentalIthaca, NY, 14853-3501
and 3 Gradua teEngineeering,
ResearchCornell
Assistant,University,
96

SPREAD FOUNDATIONS IN UPLIFT
125
100
z II ~a: 75 / ________ ----b-
"U0a
50 r a} Compocted loy",
....J
~
.•...
0.8 m thick'+- b)Compacted layer, 22.50a. 1.75m l 0:) 25 OAm thick
c) Loose back fill
T -,11.3I
a 00.20.40.6
Displacement
(m)
Figure 1. Effect of Backfill Compaction on Uplift Behavior(after Heikkal~ and Laine, 1964)
97
have disregarded that spread foundations are constructed in excava-tions, and that the backfill can have a wide range of densities. Boththe experimental and analytical studies have assumed, eitherexplicitly or implicitly, that the native soil and the backfill are atthe same density and state of stress and therefore are homogeneous.Unfortunately, this assumption does rot model the field case, in whichthe backfill can range from loosely dumped to very well compacted.The assumption of homogeneity therefore is only a special case of thegeneral problem.
In this paper, preliminary results are presented of an extensivelaboratory study of the behavior of model spread foundations inuplift. In these tests, the foundation size and depth have beenvaried over typical ranges employed in practice, and the fieldconstruction process has been simulated from excavation throughbackfilling, using a range of densities. The general behaviorobserved in these tests is presented herein.
TEST FACILITIES
An overview of the test apparatus is shown in Figure 2. All ofthe tests were conducted in a chamber fabricated from a standard 210liter steel drum. Each test was prepared individually and, in everycase, the observed uplift failure surface was located well aMay fromthe walls of the chamber.
The lID de1 foundations rreasured 100 by 100 nm and 100 by 200 11m
and were fabricated from 6.4 mm thick steel plate. A 6.4 11m rod wasthreaded into the center of each plate to transfer the uplift forcefrom the loading system to the plate. The weight of the modelfoundation was subtracted from the gross measured force during data
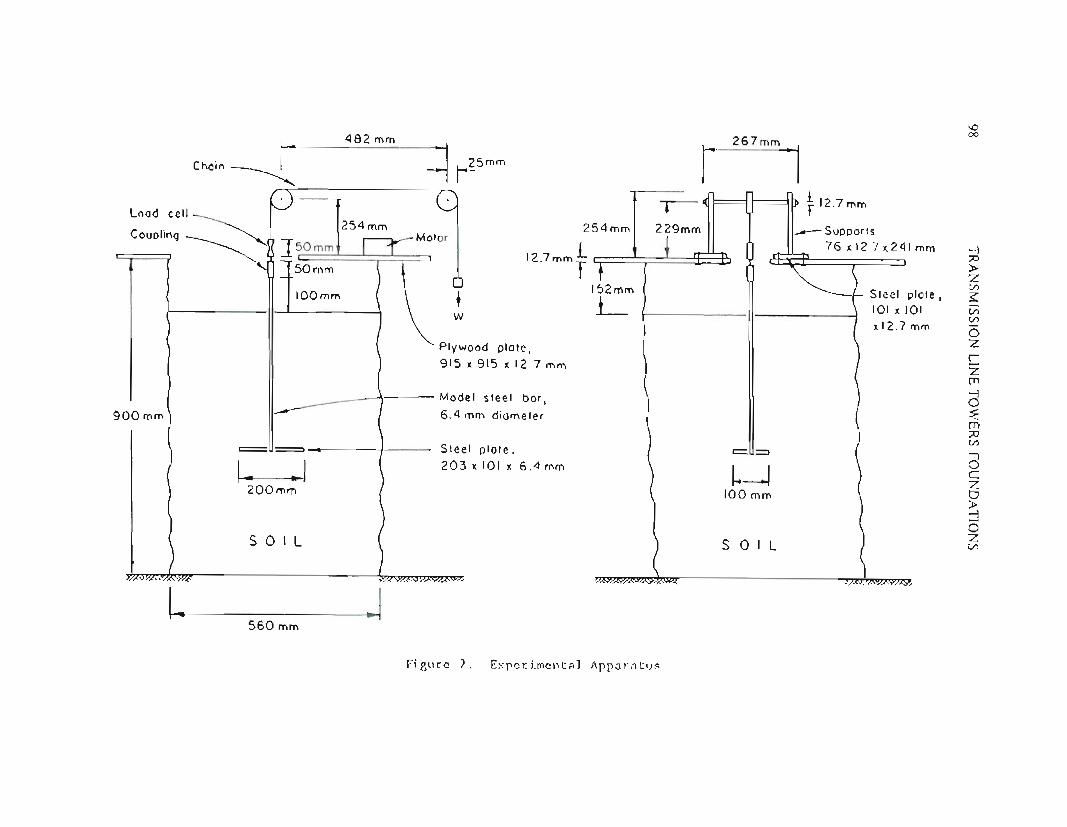
I • 482 mm
C ho; n --------.:.... =I r~5 mmr 267mm ~I
\000
Load. cell ~ 1254 mmCoupling ~ J~~ -f50mm
.•.V//
>--J
~;J>ZC/)
$:enC/)
ozCZtT1
>--Jo<tT1:;0C/)
'11oCZo;J>>--J
oZC/J
=u=
Steel plate I101 x 101xlZ.7mm
___ Supports76 x 12.7x241 mm
~~100 mm
SOl L
254mm
i12.7mmr
152mmL+
w
Steel plate,203 x 101 x 6.4 mm
Model steel bar,6.4 mm diameter
Plywood plate,915 x 915 x 12.7 mm
===u=_
SOl L
1- .1200mm
'Ii
100mm
900 mm
I~ .1560 mm
Fi~ure 2. Experimental Apparatus

reduction.
SPREAD FOUNDATIONS IN UPLIFT 99
The soil used in the tests was a mixture of a filter sand and asilty fine sand available near Ithaca, NY; both materials areglacially derived. The filter sand is sub-angular outwash materialcontaining limestone, quartz, and other rock fragments, and the siltysand is a lacustrine material containing mostly quartz. A grain-sizecurve for this composite soil is shown in Figure 3, and the results ofdirect shear tests are shown in Figures 4 and 5. 'l"..lenty three directshear tests were conducted over normal stress levels of 2.5 to 25k.."tjm2, which correspond to the range of normal stresses in the actualtests. Additional information on the soil properties and test methodsis given by Nicolaides, Kulhawy, and Trautmann (1987).
The uplift loads were applied to the rod e.xtending from thecenter of the foundation by a standard roller chain. This wasgear-driven by an electric rrotor at a loading rate of approximately 2rnrnjmin. These loads were monitored by a load cell having a precisionof about 5 N. Displacements were monitored by a DCDThaving aprecision of about 0.2 TIm. All readings were made using aHewlett-Packard HP-3455A multimeter under the control of a HP-9825Adesktop computer.
LXPERIMENTALPROGRAM
A total of 90 tests were performed, in which the variables werethe ratio of foundation depth to width (1, 2, and 3), ratio offoundation length to width (1 and 2), native soil density, andbackfill density. In designing the test program, emphasis was placedon modeling the actual field construction procedure as closely aspossible to ch.lplicate the stress history that occurs in practice as aresult of excavation, construction, backfilling, and loading. Foreach test, the native soil was placed by one of four differentprocedures. Then a hole was excavated, being particularly careful toavoid disturbing the native soil. The model foundation was placed inthe excavation and then backfilled by one of three differentprocedures. The procedures used and measured soil densities arepresented in Table 1. No correlation was made to relative densitybecause the placement procedures were different. However," loose"material was placed by carefully releasing the soil from a smallscoop, using a drop height of less than 100 run. Hedium-dense materialwas created by placing loose soil as described above and thencompacting it with a 60-Hz electric vibrating plate. Dense soil wascreated by one of two procedures: the first employed strong vibration,while the. other employed a falling weight on a plate resting on thesoil surface.
In the loose native soil, it often was difficult to maintain theexcavation walls, so they were "stabilized" by spraying a fine mist ofwater to establish a capillary stress or by using a square orrectangular sheet metal casing. The water mist did rot penetrate intothe native soil more than 1 to 2 rrm. For rectangular foundations atthe greatest depth, partial collapse of the excavation walls requiredcasing for support. In these cases, backfilling was done and the'

100 TRANSMISSION LINE TOWERS FOUNDA nONS
U. S. StandardSieve Size3/8 in. 4
102040 60 100 200
100"-:-\I I
I I I~ 80 I I· I
.~ 1 1 \'
:?: I I I~ 60 I I~ I I~ 1 I~ I •~ 40 I f'\ I- I I I~ I I ."" I(ij I I. I0... 1 I '.20r I I I'"I
II.•...•...•..
I II.•..
01.", ,I, ,II1I II" I,I "I
101.00.\0.01
Groin Size 1 mm
Figure 3.Grain Size Distribution for Test Soil
60;;; CI.>
CI.> 57...0>
l";:;:~~;~:
CI.>
~ 541
3•~ -CI.> 51
20.5~
uc:
~ 196~~/
0'"
4S18.8
'"
a:0'BB~ 451
IkN/m2~
0>p~
.S
25p...
.:Pr'042 4.5 D
Q) ..c 6.5/°(/)
~26 •-39
0
••J~24.5IV0/ 0. 36
0c:0<i
4 S 12 16 20
Normal Stress, kN/m2
Figure 4. Failure Envelopes forTest Soil
28f24
N
r
~ 20~('~en 12-
~ L0sL~ ~en
40
0
2433' 'I I I
IS.O 18.5 19.0 19.5 20.0 20.5
Initial Density, kN/m3
Figure 5. Angle of Shearing Resistance vs. Density for Test Soil
casing was removed as the backfill was placed in layers.
The testing program consisted of a partial factorial or
parametric experimental design, generally with one replicate for eachcombination of parameters. The test variables ~re ordered randomlyto eliminate any possible systematic effects of long-term changes in

SPREAD FOUNDATIONS IN UPLIFf
Table 1. Soil Densities Measured in Tests
101
Soil Density (kNfm3)
Placement
Placement
ConditionTechniqueNaMeanRangeS.D.bCOVc
~a:ive
Loose P1uviation6217.9416.86-18.630.362.0
:1edium Dense
Gentle vibration9219.4518.26-20.410.502.6
Dense-tamped
Tamping8020.3519.79-20.990.351.7
Dense-vibratedStrong vibration6520.3119.17-21.260.422.1
Backfi 11
Loose P1uviation2717.1616.18-18.850.714.1
:1edium DenseLight tamping2719.0517.94-20.470.562.9
Dense
Heavy tamping3219.9318.85-21.050.512.6
a - number of measurements
b - standard deviationc - coefficient of variation (%)
apparatus during the course of the testing. Some combinations ofparameters were not included, particularly those involving rectangularshaped foundations. For these cases, a general trend was determinedon the basis of a limited number of tests on rectangular models.
LXPERIMENTALRESULTS
The principal data from the tests consist or load-displacementcurves and observations of the failure rrodes. These data show anumber of trends that have significant implications for designpractice. A summary of the key results is presented below.
Load-Displacement Response
The general pattern of the load-displacement curves is shown inFigure 6. As indicated, the response of the foundation becomesincreasingly dilatant as the soil density increases. Concurrently,the foundation capacity increases, with the amount of increase being afunction of the foundation depth and shape, as well as the soildensity. In each case, however, the capacity at large displacements,when mrmalized by the factor iDBL, in which i = backfill soildensity, D = foundation depth, B = foundation width, and Lfoundation length, appears m be relatively independent of the initialsoil density.
Furthermore, as the peak foundation capacity increases, there isa tendency for increased stiffness in the load-displacement response.This finding is important for practice, since the limiting factor forspread foundations in uplift commonly is displacement, rather thanultimate capacity.
Failure Mode
Three failure modes ~re observed, including shear along verticalsurfaces extending upward from the edges of the foundation, ~dge orcombined wedge and side shear failure, and punching failure. Most of

102 TRANSMISSION LINE TOWERS FOUNDATIONS
'"tJoo...J
..••......
Loose
Displacement
Medium'"tJ
'"tJ0 00
0...J
...J
+-
+-••......
••......
~~
~~L
Displacement
Di splacement
Figure 6. Typical Load-Displacement Curves
the tests exhibited failure by shear along vertical surfaces, asillus trated in Figure 7. Wedge or combined shear failure occurred, ingeneral, for foundations with DjB less than two in medium to densenative soil, where the backfill was at least 85 percent as dense asthe native soil. This failure mode is illustrated in Figure 8.Punching failure occurred only at DjB equal to three where thebackfill was less dense than the native soil. Punching failureproduced essentially no disturbance at the soil surface as the soilnear the foundation flowed down around the edges of the foundationmodel.
In practice, spread foundations for transmission structures arerarely buried deeper than DjB = 3, and this depth ratio was themaximum used in the tests. Based on observations in previous studies,punching failure would be the tendency for foundations as DjBincreased beyond about three (e.g., Esquivel-Diaz, 1967).
Effect of Backfill Density
Increased backfill density was found tocapacity and the stiffness in the initialdisplacement curve, as shown in Figure 9.uplift load as a function of displacementdensi ties, using the square model foundationThe loose and dense native soil cases arerespectively.
increase the foundationportion of the load
This figure shows thefor the three backfill
v.rith DjB equal to three.shown in (a) and (b),
For the loose native soil, densifying the backfill increased thecapaci ty by about 40 percent, while the displacement required to reach50 percent of the capacity (corresponding to a typical design factorof safety of two) decreased by 75 percent. For the dense native soil,the effect of densifying the backfill was to increase the capacity byabout 110 percent, while the displacement required to reach 50 percentof capacity decreased by 35 percent. These effects rended to decreaseat shallower depths.
Effect of Native Soil Density
The native soil density also had a marked effect on foundation

SPREAD FOUNDATIONS IN UPLIFT 103
oBackfill
Side1\t Shear Native Soil
~ ~.._------~
a) Elevation View of
Failure Surface
b) Plan View of
Failure Surface
Figure 7. Side Shear Failure Mode Observations
--------- .../ ,I \I I
Radial ) (Cracks / )I\ J
'. I---_ .... ~
----~,\\
o I :I,I
\\'~ - /,
,,,III\,
~~-------,·,,,·,••
II
Side
11t Shear
~ ----------,\,I,,,I,!
c- :;;'- .1
a) Elevation View ofFailure Surface
b) Plan View ofFailure Surface
Figure 8. Combined Wedge and Side Shear Failure Mode Observations
capacity, with the effects being more pronounced at greater depths andwhere the backfill was ~ll-compacted. This behavior is illustratedin Figure 10, which shows the load-displacement response for squaremodel foundations with loose and dense backfill. The capacityincreased about 190 percent as the native soil density increased fromloose to dense with loose backfill. For densely compacted backfill,the increase was about 365 percent. These results indicate that thereis significant interaction between the native soil and backfill, andthat both need to be addressed in design. The results also indicatethat the effect of compaction is rruch greater in dense native soil.For sites with dense soil, backfill compaction can lead to very largeincreases in capacity which may outweigh the costs of ~eper or largerfoundations.

104 TRANSMISSION LINE TOWERS FOUNDA nONS
Uplift Displacement, mm
(a) Loose Native,D/B=3,Square
20
( b) Dense Native,0/ B = 3,Square
4 8 12 16
Uplift Displacement, mm
200
400
800
600
1000
1200
1400
20161284
300
250z - 200
-000..J 150- ....~::> 100
50a
0
Figure 9. Influence of Backfill Density on Load-Displacement Response
(a) Loose Backfill
D/B=2,Square
z-
"1:Joo-1
400
2 4 6 8 10
Soil Density
12 14
Uplift Displacement, mm
1600
Z
1200
"1:J
00-1800
- .•..0.::) 400
0
0 (b) Dense Backfill
D/B = 3,Square
M-L{Native Soil DensityI
IIIIII4
8121620
Uplift Displacement, mm
Figure 10. Influence of Native Soil Density on Load-DisplacementResponse

SPREAD FOUNDATIONS IN UPLIFT
Effects of Foundation Depth
105
Figure 11 shows the effect of foundation depth for a squarefoundation in both loose and dense native soil wi.th varying backfill.In this figure, the net foundation capacity has been rormalized by thefactor -yDBL (after subtracting the foundation weight). As shown,depth has a major effect on capacity for dense native soils, withincreases up to 500 percent. For loose native soils, the effect issmaller, with increases up to 75 percent.
Effects of Foundation Shape
Spread foundations for transmission line structures commonly aresquare, although rectangular foundations are used occasionally; inthese instances, LIB ratios generally are less than two. Severaltests were performed to evaluate the effect of shape, and it was foundthat the square foundations tended to have a higher dimensionlesscapacity factor than the rectangular counterparts at the same D/Bratio. The few exceptions to this general observation appear to befrom random experimental errors. The effect is greatest for densenative soil deposits.
This finding does mt imply, however, that square foundationshave higher capacities than rectangular foundations of the same areaat the same depth because, in this case, the rectangular foundationhas a smaller width B and a correspondingly greater D/B ratio. Whencorrection for this is made, the data indicate that there is little,if any, difference between the capacities of square and rectangularfoundations of equal area at equal depths.
COMPARISONWITHPUBLISHEDEXPERIMENTALSTUDIES
There are few data in the literature for uplift tests on rrodelfoundations in which the densities of the native soil and backfillsoil differ; most published studies have been performed by placingmodel foundations or anchors on a soil surface and then placing layersof soil above. For these studies, the "native" soil and "backfill",as defined in this study, would be identical. These published studiescan be compared with the present test results in v.hich the native soiland backfill v;ere placed at the same density. The results will stillbe influenced to some degree by the excavation procedure and theaccompanying changes in stress; however, the effects should berelatively small for carefully prepared soil deposits.
Figure 12 shows several published test results plotted with thoseof the present tests. The results agree reasonably ·~ll. The resultsfor dense soil are in close agreement with the results ofEsquivel-Diaz (1967), which were conducted in dense sand. The resultsfor medium dense sand fall slightly below those of Baker and Kondner(1966), Clemence and Veesaert (1977), and Balla (1961) conducted inmedium dense sand. They fall slightly above those of Das and Seeley(1975) reported for loose sand with a friction angle of 34 degrees.
It is difficult to evaluate the noted differences precisely,
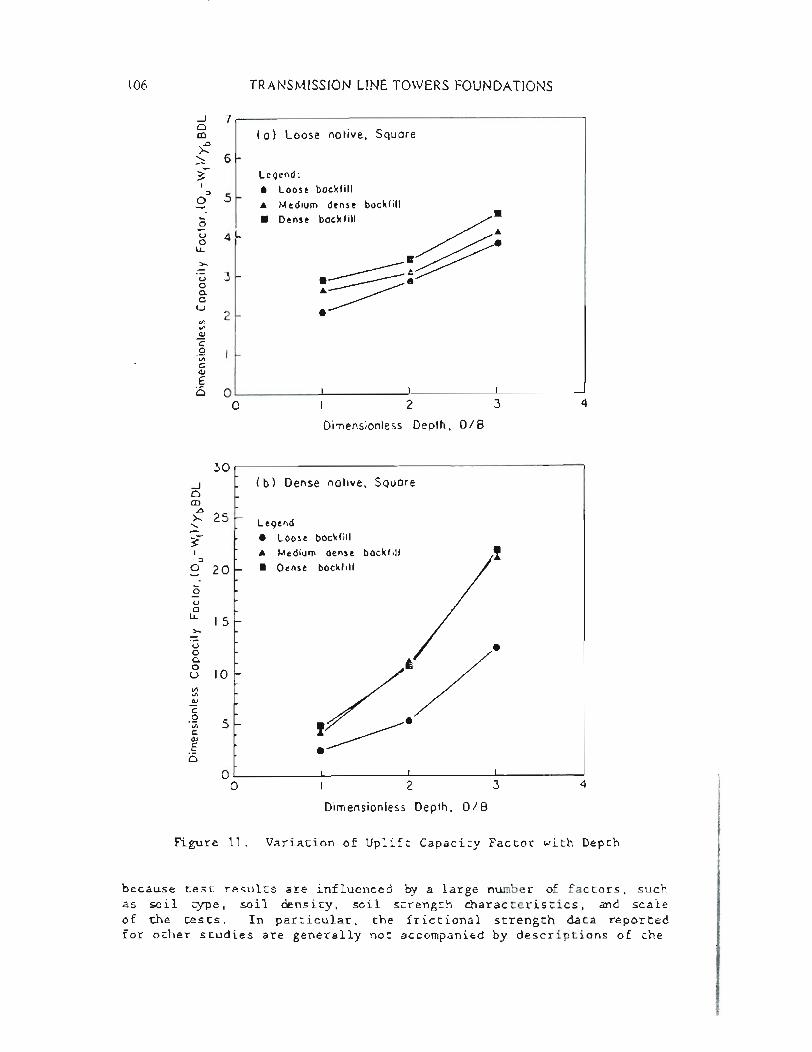
106 TRANSMISSION LINE TOWERS FOUNDATIONS
-'
70 I(a) Loose native, SquareCD.l:>~ 6
.......
3"Legend:I •Loose backfill
::> 5a "-Medium dense backfill-
D,,,, b,,'WI .~;
•....•0 u 40 l.L.
>- .~:~u
30 "-~Q. 0u 2
•'" '"ClJc:0"inc:ClJE 01
0 III0
I234
Dimensionless
Depth, D/B
30
-'t
(b) Dense native, Square0 CD.l:>
t 25[
Legend:• Loose backfill
"-
Medium dense backfill
S 20
•Densebackfill
•....
0u0l.L. 15>- u
A/·0 Q.0 10u
'"'"
I~.ClJ
c:0 5"Vi c:ClJ
"~•0
00I234
Dimensionless Depth, D/BFigure 11.
Variation of Uplift Capacity Factor with Depth
because test results are influenced by a large nW11berof factors, suchas soil type, soil density, soil strength characteristics, and scaleof the tests. In particular, the frictional strength data reportedfor other studies are generally not accompanied by descriptions of the

28
..J
0CD
24..0
;...."--"3- 20I~a..:0 16...- u0l.L>.- 12u 0a.0<.)
en
8en C1Jc0enc 4C1J E0
00
SPREAD FOUNDA TrONS IN UPLIIT
SQUARE MODELS: Yb = Yn
0-0 Loose }
+-+ Medium dense This studyX- x Dense - tamped*-* Dense-vibrated0- -0 Baker and Kondner (1966)
.--. ESQuivel- Diaz (1967)
[).--[). Dos and Seeley (1975)A--A Balla (1961)0--0 Clemence and
Veesaert (1977)
2 3Dimensionless Depth, 0/8
4
107
Figure 12. Comparison with Other Experimental Studies
type of soil strength test and the mrmal stress levels used in thetests. The latter can have a significant effect on the measuredfriction angle for granular soils, as shown clearly by the stressdependency indicated in Figures 4 and 5. Given these uncertainties,the agreement between the experimental results appears to be good.
DISCUSSIONANDDESIGNIMPLICATIONS
The test results have a number of implications for the design ofspread foundations for electric transmission line structures. First,the effect of compacting the backfill is to increase the upliftcapaci ty and the stiffness of the uplift response to loading. Thiseffect is greater at sites where the native soil is relatively dense.For projects in which excavation costs and/or foundation fabricationcosts are greater than compaction costs, it is therefore moreeconomical to compact the backfill well than to require larger ordeeper foundations.
Second, the uplift capacity is a function of both the backfilland native soil. This effect is shown clearly by tests in loosenative soil with differing backfill densities. Therefore, compacting

108 TRANSMISSION LINE TOWERS FOUNDATIONS
granular native soil always will provide beneficial effects, even whenthe soil is loose.
Third, the uplift capacity of spread foundations increasesdramatically with depth as D/B increases from one to three. Thiseffect is particularly evident when the native soil is dense, becausethe soil dilates during shear and is better able to mobilize thestrength of the soil mass above the foundation.
SUMMARY
This paper has described an experimental study of the effects ofnative soil density, backfill density, foundation depth, andfoundation shape on the uplift capacity of model spread foundations indry granular soil. The results are summarized in Table 2, whichindicates the relative effects of parameter increase on capacity.Because the factors are interdependent, it is not possible to specifythe effect of one parameter without first indicating the values of theothers. In general, the results show that increased backfillcompaction and increased foundation depth lead to significantincreases in foundation capacity, while foundation shape hasrelatively little, if any, influence.
Table 2. Qualitative Trends in Uplift Capacity
Increase inParameter
BackfillDensity
Native SoilDensity
Depth(D/B)
Length(L/B)
ACKNOwLEDGMENTS
Effect onCapacity
Increase
Moderateincrease
Substantialincrease
Little, ifany, increase
Conditions for Which Changein Capacity is Most Pronounced
Deep (D/B = 3), DenseNative Soil, Square
Deep (D/B = 3), DenseBackfill, Square
Dense Native Soil andBackfill, Square
This study was sponsored by the Electric Power Research Instituteunder Project RP1493-4, for which Vito J. Longo was the EPRI ProjectManager. Appreciation is extended to Paul Jones and Glenn Darling,who fabricated much of the experimental apparatus, to Lorraine Crouse,who typed the text, and to Ali Avcisoy, who drafted the figures.

REFERENCES
SPREAD FOUNDATIONS IN UPLIFT 109
1. Baker, W. H. and Kondner, R. L., "Pullout Load Capacity of aCircular Earth Anchor Buried in Sand", Record 108, HighwayResearch Board, Washington, 1966, p. 1-10.
"The Resistancefor Pylons" ,Soil Mechanics
pp. 569-576.
2. Balla, A. ,FoundationsConference onParis, 1961,
to Breaking Out of MushroomProceedings, 5th International
and Foundations Engineering, Vol. 1,
3. Clemence, S. P. andVeesaert, C. J., "Dynamic Pullout Resistanceof Anchors in Sand", Proceedings, International Symposium on SoilStructure Interaction, Vol. 2, University of Roorkee, 1977, 31 p.
4. Das, B. M. and Seeley, G. R., "Breakout Resistance of ShallowHorizontal Anchors", Journal of the Geotechnical EngineeringDivision, ASCE, Vol. 101, No. GT9, Sept. 1975, pp. 999-1003.
5. Esquivel-Diaz, R. F.,Anchors in Sand", SoilDurham, NC, 1967, 57 p.
"PulloutMechanics
ResistanceSeries No.
of Deeply Buried8, D.1ke University,
6. HeikkaUI, K. and L:iine, J., "Uplift Resistance of Anchor Plates",Proceedings, 20th Session of the International Conference onLarge Electric Systems at High Tension (CIGRE), Vol. 2, Report217, Paris, June 1964, 14 p.
7. Kulhawy, F. H., Trautmann, C. H., Beech, J. F., O'Rourke, T. D.,McGuire, W., Wood, W. A., and Capano, C., "Transmission LineStructure Foundations for Uplift-Compression Loading", ReportEL-2870, Electric Power Research Institute, Palo Alto, CA, Feb.1983, 412 p.
8. Nicolaides, C. N., Kulhawy, F. H., and Trautmann, C. H., "Experimental Investigation of the Uplift Behavior of Spread Foundationsin Cohesionless Soil", Report El-xxxx, Electric Power ResearchInstitute, Palo Alto, CA (in press).
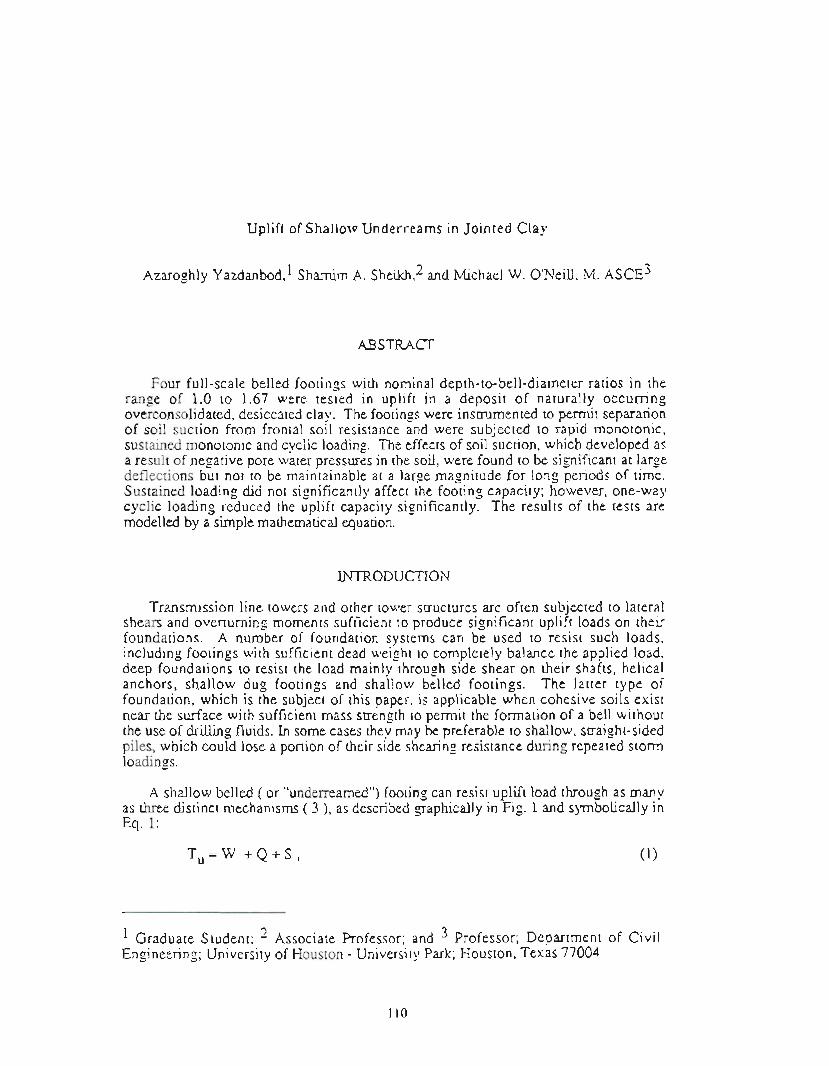
Uplift of Shallow Underreams in Jointed Clay
Azaroghly Yazdanbod,l Shamim A. Sheikh,2 and Michael W. O'Neill, M. ASCE3
ABSTRAcr
Four full-scale belled footings with nominal depth-to-bell-diameter ratios in therange of 1.0 to 1.67 were tested in uplift in a deposit of naturally occurringoverconsolidated, desiccated clay. The footings were instrumented to permit separationof soil suction from frontal soil resistance and were subjected to rapid monotonic,sustained monotonic and cyclic loading. The effects of soil suction, which developed asa result of negative pore water pressures in the soil, were found to be significant at largedeflections but not to be maintainable at a large magnitude for long periods of time.Sustained loading did not significantly affect the footing capacity; however, one-waycyclic loading reduced the uplift capacity significantly. The results of the tests aremodelled by a simple mathematical equation.
INTRODUCTION
Transmission line towers and other tower structures are often subjected to lateralshears and overturning moments sufficient to produce significant uplift loads on theirfoundations. A number of foundation systems can be used to resist such loads,including footings with sufficient dead weight to completely balance the applied load,deep foundations to resist the load mainly through side shear on their shafts, helicalanchors, shallow dug footings and shallow belled footings. The latter type offoundation, which is the subject of this paper, is applicable when cohesive soils existnear the surface with sufficient mass strength to permit the formation of a bell withoutthe use of drilling fluids. In some cases they may be preferable to shallow, straight-sidedpiles, which could lose a portion of their side shearing resistance during repeated stormloadings.
A shallow belled ( or "underreamed") footing can resist uplift load through as manyas three distinct mechanisms ( 3 ), as described graphically in Fig. 1 and symbolically inEq.l:
Tu=W +Q+S, (1)
1 Graduate Student; 2 Associate Professor; and 3 Professor; Department of CivilEngineering; University of Houston - University Park; Houston, Texas 77004
110

UPLIIT IN JOINTED CLAY III
w
j
Bell
jS
-: -ShaftII~ ArbitraryI limit of soilI includedI in W
III
I
II
Reamerseat
Fig. 1. Schematic of a Belled Footing Under Uplift Loading
su(ksf)
su= 1.08 + 0.160(D(ft) - 2) ksf•.......--'"".!::.-QQ)o
oo
10
16
1
---••
--- Bottom ofFooting B
--- Bottom ofFootings A,C,D
•
2 3
•
su = 1.88+ 0.083 (O(ft) - n k sf
•
Fig. 2. Undrained Shear Strength Vs. Depth; UU Triaxial Data(1 ft = 0.305 m; 1 ksf = 47.9 kPa)

112 TRANSMISSION LINE TOWERS FOUNDATIONS
where T u = total ultimate uplift resistance, W = appropriate weight of the footing andsome zone of overlying soil, Q = frontal resistance of the soil acting downward on thetop of the bell and S = suction (tension) developed between the soil and the bottom of thefooting. The force Q is the vertical resultant of the shearing stresses that develop on thefailure surface in the soil above the base of the footing. [Q may act partially in shaftfriction if adequate bonding exists between the soil and the shaft. This will be shownnot to be the case for the shallow footings considered in this study.] To develop arational procedure for the design of belled footings under uplift loading, it is important toevaluate these components separately for conditions of geometry and loading that aretypical of in-service foundations. This paper describes a series of instrumented,full-scale, footing tests conducted in moderately jointed, saturated, overconsolidatedclay, in which two depth-to-bell diameter (DIB) ratios were studied (approximately 1.0and 1.67) and in which loads were applied as rapid monotonic, sustained monotonic andone-way cyclic axial forces at the tops of the footings. The tests were conducted toprovide full-scale data to assist Houston Lighting and Power Company's evaluation ofdesign procedures based on smaller-scale uplift tests ( 2, 8 ); however, this paper doesnot address design procedures.
GEOTECHNICAL CONDITIONS
The site of the uplift tests was the University of Houston Foundation Test Facility,located in Houston, Texas, about 3 mi (5 km) southeast of the downtown district. Thegeneral geological and geotechnical conditions, as well as the behavior of one shallowfooting tested in compression at this facility, are well documented ( 4, 6). Thenear-surface soil belongs to the Beaumont Clay formation, a Pleistocene-aged plasticclay that was preconsolidated by a process of desiccation that left the soil with a networkof closed, discontinuous joints.
Profiles of undrained shear strength at the location of the footing tests, as measuredwith UU triaxial compression tests and quasi-static CPT tests conducted with a one-pieceelecronic cone penetrometer, are shown in Figs. 2 and 3, respectively. UU triaxial testsamples were taken using thin-walled tube samplers from 3 borings adjacent to the testfootings, and 6 CPT soundings were made in a matrix pattern throughout the location ofthe footing tests. The highest water table at the site is located at a depth of 7 ft (2.13 m);the overconsoldation ratio of the soil is about 8 at a depth of 10 ft (3.05 m) (theshallowest depth at which OCR could be reliably measured); and the average plasticityindex and total unit weight of the soil above a depth of 10 ft (3.05 m) are 30 and 126 pef(19.8 kN/m3), respectively. Zero shear strength is indicated above a depth of 2 ft (0.61m) on the profiles of undrained shear strength. This was the depth to which surfacejoints and brittle, highly desiccated soil were observed to penetrate and which werepresumed to render the soil ineffective in providing frontal uplift resistance against thebell (Q) or shear resistance between the shaft and the soil mass. The qc values from the
quasi-static CPT were converted to undrained shear strength by first subtracting totalvertical stress and dividing the result by 19, a correlation factor that has been developedfor the test facility (4). The spikes in the CPT profiles were the result of calcareousnodules and occasional sand seams that are not effective in providing uplift resistance.Tnerefore, the interpreted shear strength profile was drawn to eliminate the spikes.
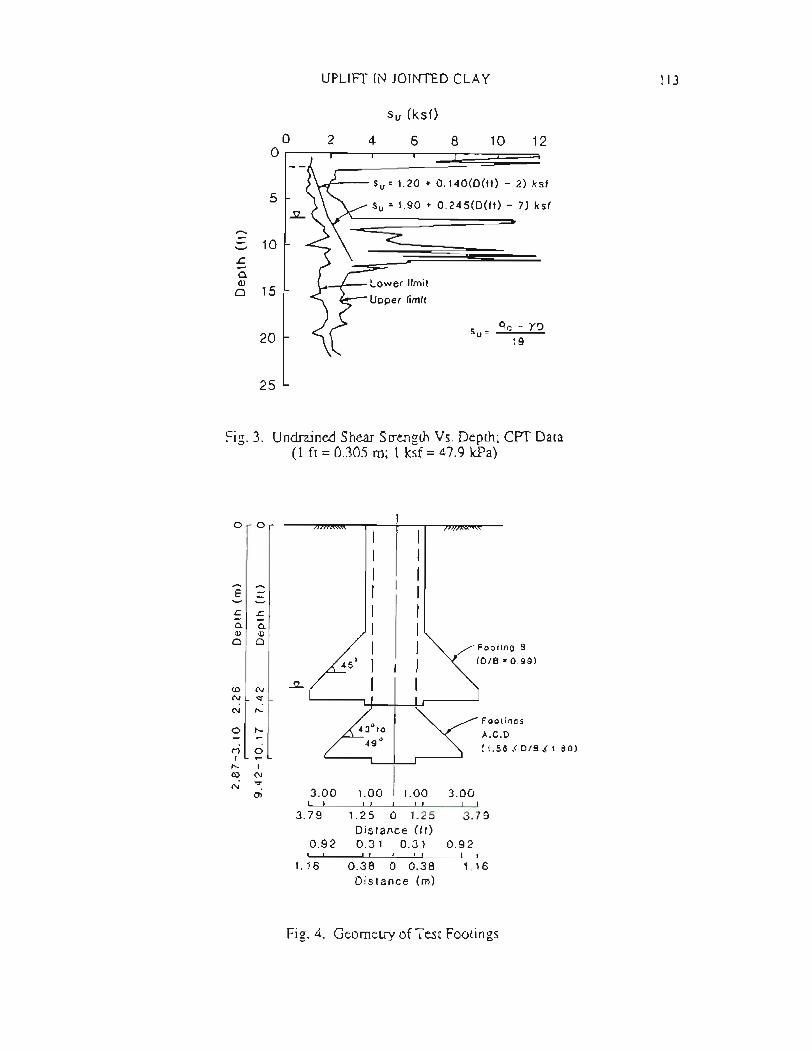
UPLIFf IN JOINTED CLAY 113
Su = 1.20 + 0.140(D(ft) - 2) ksf
Su = 1.90 + 0.245(D(ft) - 7) ksf
oo
5
-S 10£.•...0.Q)o 15
20
25
2 4
Su (ksf)
6 8 10
Su=
12
Fig. 3. Undrained Shear Strength Vs. Depth; CPT Data(1 ft = 0.305 m; 1 ksf = 47.9 kPa)
OrO
•....• •....•
E--'-" .•....
.t=.t=- a. a.
OJOJ0 0
~lN
N ~N r--o r--......C') 0I •••r--
IaJ
NN
~OJ
3.00 1.00 I 1.00I
I I I,, I3.79
1.2501.25Distance (tt)0.92
0.310.31I
I I!I, r
1.160.3800.38
Distance (m)
Footing B(D/B = 0.99)
Footings
A,C,D
(1.56~D/8~1.69)
3.00L...J3.79
0.92L...J1.16
Fig. 4. Geometry of Test Footings
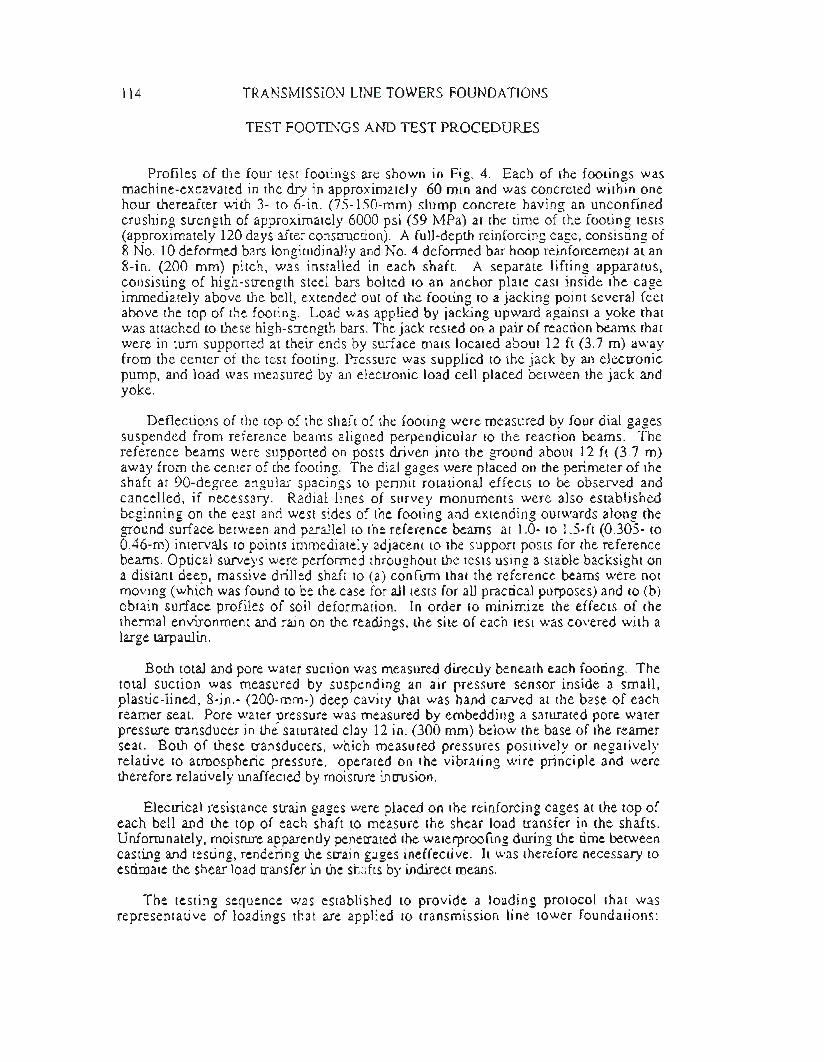
114 TRANSMISSION LINE TOWERS FOUNDATIONS
TEST FOOTINGS AND TEST PROCEDURES
Profiles of the four test footings are shown in Fig. 4. Each of the footings wasmachine-excavated in the dry in approximately 60 min and was concreted within onehour thereafter with 3- to 6-in. (7S-1S0-mm) slump concrete having an unconfinedcrushing strength of approximately 6000 psi (59 MPa) at the time of the footing tests(approximately 120 days after construction). A full-depth reinforcing cage, consisting of8 No. 10 deformed bars longitudinally and No.4 deformed bar hoop reinforcement at an8-in. (200 mm) pitch, was installed in each shaft. A separate lifting apparatus,consisting of high-strength steel bars bolted to an anchor plate cast inside the cageimmediately above the bell, extended out of the footing to a jacking point several feetabove the top of the footing. Load was applied by jacking upward against a yoke thatwas attached to these high-strength bars. The jack rested on a pair of reaction beams thatwere in turn supported at their ends by surface mats located about 12 ft (3.7 m) awayfrom the center of the test footing. Pressure was supplied to the jack by an electronicpump, and load was measured by an electronic load cell placed between the jack andyoke.
Deflections of the top of the shaft of the footing were measured by four dial gagessuspended from reference beams aligned perpendicular to the reaction beams. Thereference beams were supported on posts driven into the ground about 12 ft (3.7 m)away from the center of the footing. The dial gages were placed on the perimeter of theshaft at 90-degree angular spacings to permit rotational effects to be observed andcancelled, if necessary. Radial lines of survey monuments were also establishedbeginning on the east and west sides of the footing and extending outwards along theground surface between and parallel to the reference beams at 1.0- to 1.5-ft (0.305- to0.46-m) intervals to points immediately adjacent to the support posts for the referencebeams. Optical surveys were performed throughout the tests using a stable backsight ona distant deep, massive drilled shaft to (a) confirm that the reference beams were notmoving (which was found to be the case for all tests for all practical purposes) and to (b)obtain surface profiles of soil deformation. In order to minimize the effects of thethermal environment and rain on the readings, the site of each test was covered with alarge tarpaulin. ~
Both total and pore water suction was measured directly beneath each footing. Thetotal suction was measured by suspending an air pressure sensor inside a small,plastic-lined, 8-in.- (200-mm-) deep cavity that was hand carved at the base of eachreamer seat. Pore water pressure was measured by embedding a saturated pore waterpressure transducer in the saturated clay 12 in. (300 mm) below the base of the reamerseat. Both of these transducers, which measured pressures positively or negativelyrelative to atmospheric pressure, operated on the vibrating wire principle and weretherefore relatively unaffected by moisture intrusion.
Electrical resistance strain gages were placed on the reinforcing cages at the top ofeach bell and the top of each shaft to measure the shear load transfer in the shafts.Unfortunately, moisture apparently penetrated the waterproofmg during the time betweencasting and testing, rendering the strain gages ineffective. It was therefore necessary toestimate the shear load transfer in the shafts by indirect means.
The testing sequence was established to provide a loading protocol that wasrepresentative of loadings that are applied to transmission line tower foundations:

UPLIFr IN JOINTED CLAY 115
monotonic loading (rapid, as occurs if unbalanced line tension develops duringconstruction, and slow, as occurs when permanent unbalanced loads exist on towers)and cyclic loading, such as may be developed by high wind gusts or seismic events.The tests were conducted as follows. Footings A and B (nominal DIB of 1.67 and 1.0,respectively) were tested in rapid monotonic uplift to failure (defined as continuousupward movement under constant load) in a time period of approximately 50 min., withuniform load increments being applied every 5 min., after which they were unloaded andreloaded again to failure in approximately the same period of time to observe post-failurebehavior. Footing B was also subjected to a third cycle of loading. Difficulty wasexperienced with the suction pressure recording device during the test on Footing B, sono usable suction data were available for that footing. Footing C was tested undermonotonically increasing sustained loads of 18, 36, 54, 72 and 90 percent of theultimate uplift capacity of its geometric twin, Footing A. Loads were maintained for 48hr without unloading for each of the former four loads. When the fifth load was applied,steady upward movement was observed, so that the load was held for only two hI.Following the sustained load test, Footing C was also subjected to a rapid monotonic testin a manner similar to the tests on Footings A and B. Footing D was subjected toone-way cyclic loading at load amplitudes of 32 percent (125 cycles) and 55 percent(100 cycles) of the ultimate capacity of Footing A, which was geometrically identical toFooting D. The cycling period was 3 to 15 min. Following the tests at the second loadamplitude, the load amplitude was decreased again to 32 percent of the capacity ofFooting A, and 15 cycles were applied to investigate the effect of cyclic movement at lowamplitude loading following cycling at a higher load amplitude. Finally, the loadamplitude was increased to 73 percent of the capacity of Footing A, at which time thefooting failed after the application of 6 cycles of load. Additional information can befound in Ref. 7.
TEST RESULTS
Footin g A
The "baseline" test was the test conducted on Footing A; therefore, its behavior willbe described first. The load (T)-total suction-uplift deflection data are shown on Fig. 5.Failure of this footing first occurred at a deflection of about 2.0 in. (50 mm) (about 3percent of the bell diameter) and a load of 220 K(980 kN). Total suction could not bemeasured accurately at that load, but extrapolation of the first-cycle suction-load curve to220 K (980 kN) and observation of the second-cycle suction-load curve suggests that itsvalue was about 3 psi (20.7 kPa). Loading in the second cycle was carried out to a totaldisplacement of 7 in. (175 mm) with no decrease in total load but with an increase inma.ximum total suction to about 10 psi (68.9 kN) at maximum deformation. Pore watersuction is not shown on Fig. 5 for clarity, but it was found to track the total suctionalmost identically, indicating that loading did not produce soil framework (effective)stress changes directly below the base of the footing. The suction was a time-dependentvariable, decreasing by a factor of about 2 from the maximum value measured directlyafter applying a load to the end of the 5-min. hold period between load applications.Time-dependent suction decrease in these tests is thought to be associated with thedevelopment of minute pathways in the jointed clay between the atmosphere and the baseof the footing. It is unlikely that it was the result of air coming out of solution in thepore water and diffusing through the plastic liner in the total suction cavity because theliner used had a high air entry point.
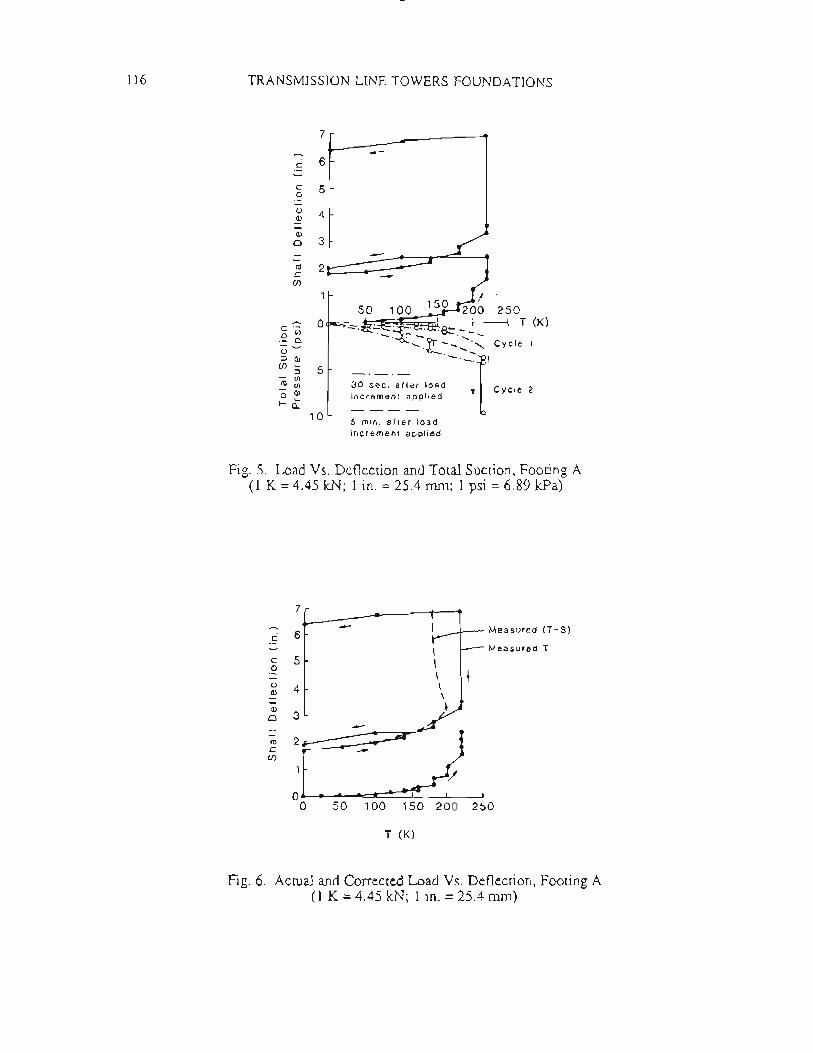
116 TRANSMISSION LINE TOWERS FOUNDATIONS
7
+---
c:
6~ c:
50u
4(J)
(J)
30I-- (t\ 2.r. (/)
250~
0=. ~ .... &:__ T (K)c: .- o U) ........r-_ .............•- Co
....•.~ -_ ....•~•..•....Cycle 1-....- U:J (J)
- r(/) •...
5
30 ~;;: '~er load .~ Cycle 2
:J - U)(t\ U)o (J)f-Q:
increment applied----10 5 min. a tter loadincrement applied
Fig. 5. Load Vs. Deflection and Total Suction, Footing A(1 K = 4.45 kN; 1 in. = 25.4 mm; 1 psi = 6.89 kPa)
7
6r
--~M,"'"'" (T-S'c:
~c:
1 Measured T
0 u(J)
(J)0
(t\
2.r. (/)
50 100 150 200 250
T (K)
Fig. 6. Actual and Corrected Load Vs. Deflection, Footing A(1 K = 4.45 kN; 1 in. = 25.4 mm)
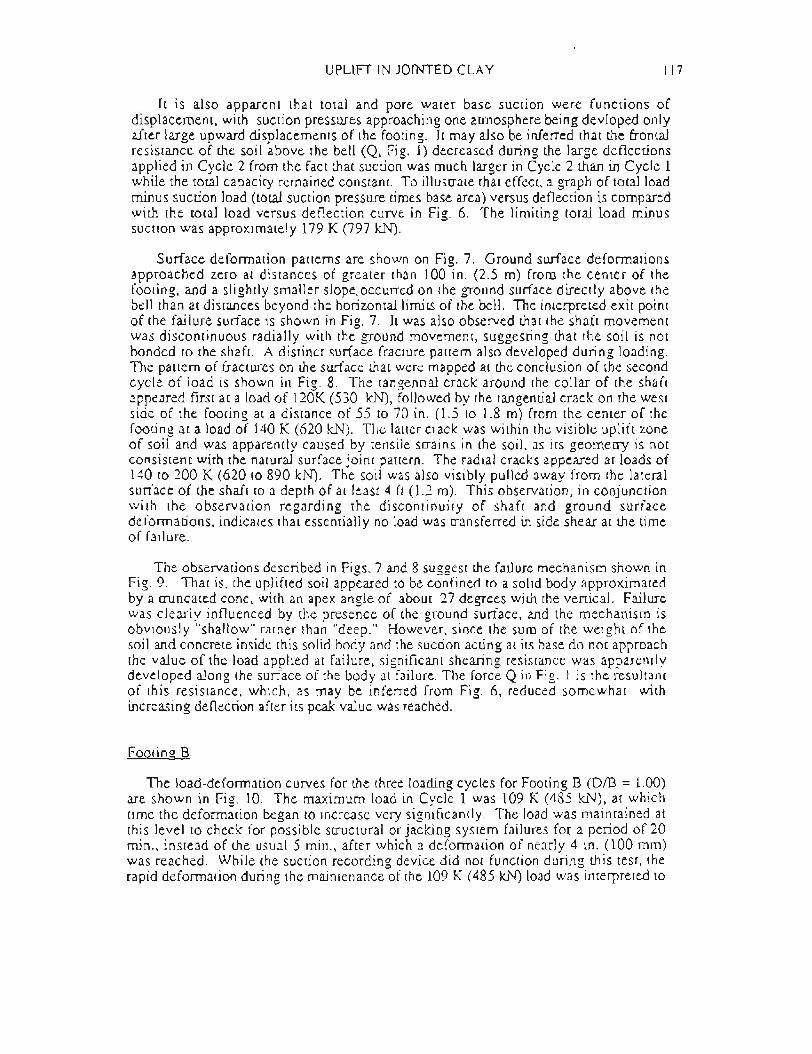
UPLIFf IN JOINTED CLAY 117
It is also apparent that total and pore water base suction were functions ofdisplacement, with suction pressures approaching one atmosphere being devloped onlyafter large upward displacements of the footing. It may also be inferred that the frontalresistance of the soil above the bell (Q, Fig. 1) decreased during the large deflectionsapplied in Cycle 2 from the fact that suction was much larger in Cycle 2 than in Cycle Iwhile the total capacity remained constant. To illustrate that effect, a graph of total loadminus suction load (total suction pressure times base area) versus deflection is comparedwith the total load versus deflection curve in Fig. 6. The limiting total load minussuction was approximately 179 K (797 kN).
Surface deformation patterns are shown on Fig. 7. Ground surface deformationsapproached zero at distances of greater than 100 in. (2.5 m) from the center of thefooting, and a slightly smaller slope. occurred on the ground surface directly above thebell than at distances beyond the horizontal limits of the bell. The interpreted exit pointof the failure surface is shown in Fig. 7. It was also observed that the shaft movementwas discontinuous radially with the ground movement, suggesting that the soil is notbonded to the shaft. A distinct surface fracture pattern also developed during loading.The pattern of fractures on the surface that were mapped at the conclusion of the secondcycle of load is shown in Fig. 8. The tangential crack around the collar of the shaftappeared fIrst at a load of 120K (530 kN), followed by the tangential crack on the westside of the footing at a distance of 55 to 70 in. (1.5 to 1.8 m) from the center of thefooting at a load of 140 K (620 k1~). The latter crack was within the visible uplift zoneof soil and was apparently caused by tensile strains in the soil, as its geometry is notconsistent with the natural surface joint pattern. The radial cracks appeared at loads of140 to 200 K (620 to 890 kN). The soil was also visibly pulled away from the lateralsurface of the shaft to a depth of at least 4 ft (1.2 m). This observation, in conjunctionwith the observation regarding the discontinuity of shaft and ground surfacedeformations, indicates that essentially no load was transferred in side shear at the timeof failure.
The observations described in Figs. 7 and 8 suggest the failure mechanism shown inFig. 9. That is, the uplifted soil appeared to be confined to a solid body approximatedby a truncated cone, with an apex angle of about 27 degrees with the vertical. Failurewas clearly influenced by the presence of the ground surface, and the mechanism isobviously "shallow" rather than "deep." However, since the sum of the weight of thesoil and concrete inside this solid body and the suction acting at its base do not approachthe value of the load applied at failure, significant shearing resistance was apparentlydeveloped along the surface of the body at failure. The force Q in Fig. 1 is the resultantof this resistance, which, as may be inferred from Fig. 6, reduced somewhat withincreasing deflection after its peak value was reached.
Footing B
The load-deformation curves for the three loading cycles for Footing B (DIB = 1.00)are shown in Fig. 10. The maximum load in Cycle 1 was 109 K (485 kN), at whichtime the deformation began to increase very signifIcantly. The load was maintained atthis level to check for possible structural or jacking system failures for a period of 20min., instead of the usual 5 min., after which a deformation of nearly 4 in. (100 mm)was reached. While the suction recording device did not function during this test, therapid deformation during the maintenance of the 109 K (485 kN) load was interpreted to

118 TRANSMISSION LINE TOWERS FOUNDATIONS
SurfaceDeflection (in.)
InterpretedFailure PlaneExit
~
• T = 100K. Cycle 1
o T = 180K. Cycle 1
I:> T = 220K. Cycle 1
+ T = O. End of Cycle 1
o T = 220K. Cycle 2
10 5 5 10
Distance westfrom shaftface (ft)
Distance eastfrom shaft
face (t1)
Fig. 7. Deflections on Shaft and Soil Surface, Footing A(1 in. = 25.4 rom; 1 ft = 0.305 rn)
.-.//'/II
II
\\
Crackwidthexaggerated
/
~ Bell outline/
/ 1 ft (0.305m)" ./ H--_.--/
Fig. 8. Surface Crack Pattern, Footing A
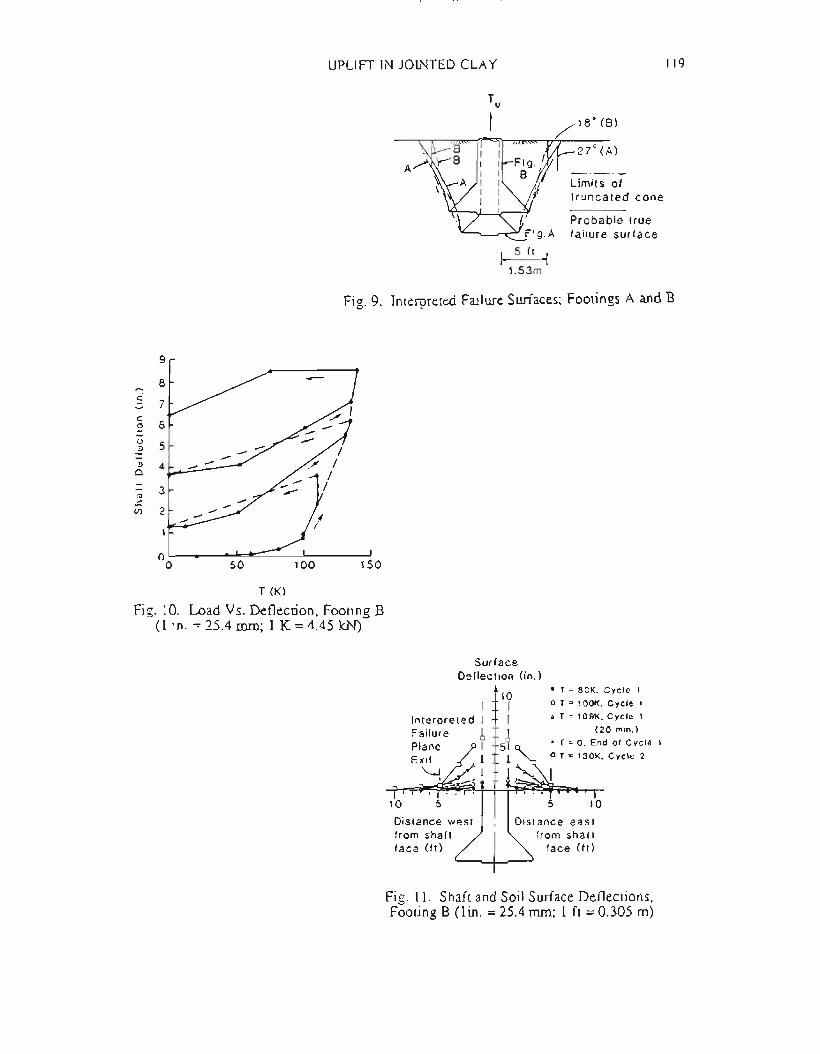
UPLIFT IN JOINTED CLAY
A
I. 5 It .11.53m
limits oftruncated cone
Probable truefailure surface
119
9
8c:
7c::
06
()5:J
;1)a(Ij
3.c (/)
2
50 100
Fig. 9. Interpreted Failure Surfaces; Footings A and B
150
T (K)
Fig. 10. Load Vs. Deflection, Footing B(1 in. = 25.4 mm; 1 K = 4.45 !eN)
I10
• T = 80K. Cycle 1o T = 100K, Cycle 1o.T=109K,Cycle 1
(20 min.)+ T = O. End of Cycle 1
o T = 130K. Cycle 2
Fig. 11. Shaft and Soil Surface Deflections,Footing B (Iio. = 25.4 mm; 1 ft = 0.305 m)
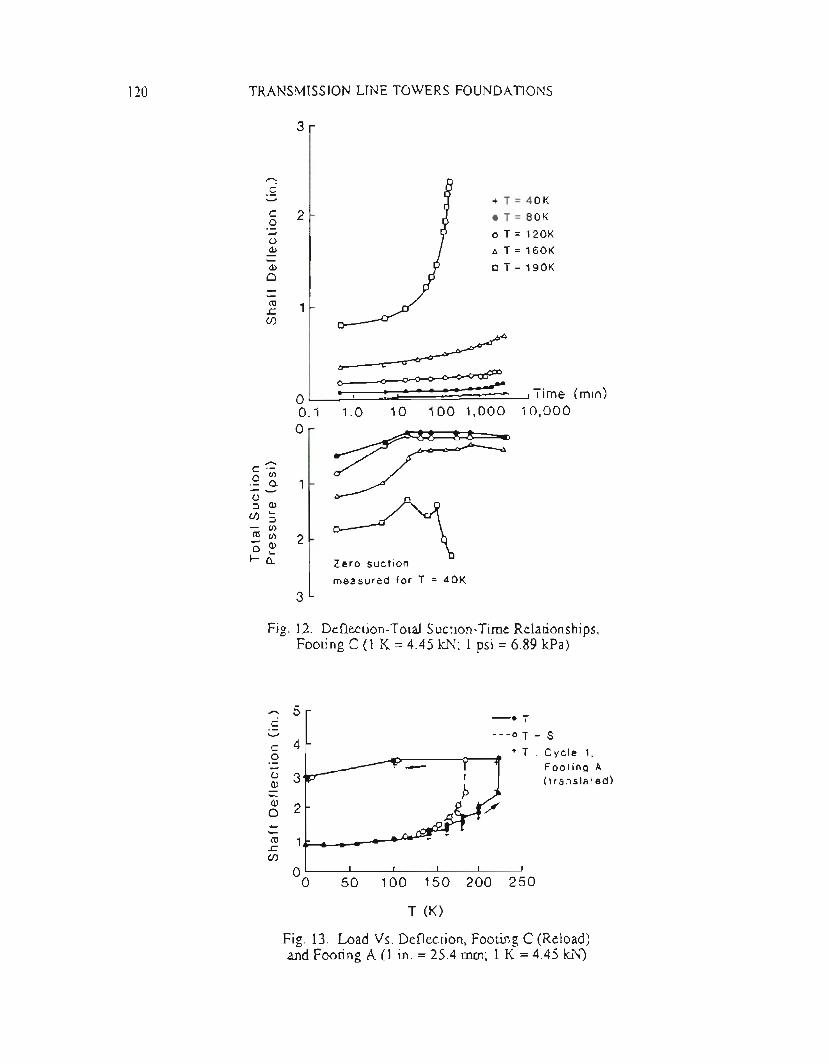
120 TRANSMISSION LINE TOWERS FOUNDATIONS
3
~c::;
21 J
+ T = 40Kc:
• T = 80K0 - o T = 120K() Q)
Do T= 160K.•... oT=190KQ) 0-.•...~ 1~
CJ)
Zero suction
measured for T = 40K
o0.1o
•.....c: .-
o (/) 1.- 0.- •......
() Q)::J •...
CJ) ::J
cu ~ 2- Q)o •...1-0..
3
e
1.0
~ ; •• r •..•.•.•••
10 100 1,000Time (min)
10,000
Fig. 12. Deflection-Total Suction-Time Relationships,Footing C (1 K = 4.45 kN; 1 psi = 6.89 kPa)
50 100 150 200 250
T (K)
•.....5c: •......c:
40 -() 3Q) .•...
Q) 20 -.•...~ 1~ CJ) 00 -eT---0 T - S
+T: Cycle 1,Footing A(transla ted)
Fig. 13. Load Vs. Deflection, Footing C (Reload)and Footing A (1 in. = 25.4 mm; 1 K = 4.45 kN)

UPUFf IN JOINTED CLAY 121
be due to the release of suction. The footing was then unloaded and reloaded morerapidly than in Cycle 1 (in 15 min.), and an increase in capacity was observed. Thedeformation associated with the second-cycle reload was about 5 in. (125 mm), and it ishypothesized that the higher capacity realized during the second cycle was principally asa result of a rapid buildup of suction pressure, which did not have sufficient time todissipate prior to reaching the peak total load of 135 K (601lu'D. A third cycle ofloadwas also applied in a manner similar to the second cycle, with similar results. It wasconcluded that the appropriate capacity of the footing, excluding the suction reaction,was 109 K (485 kN) and that it would be reasonable to assign a unit value of suctionpressure at first failure equivalent to that which developed at first failure in Footing A (3psi). Hence, had loading continued at the rate employed in the early stages of the firstcycle, a total peak capacity of about 128 K (570 lu"\J") would have been realized. Notethat this value is considerably lower than that for Footing A, despite the fact that FootingB had a diameter of 90 in. (2.29 m) compared with 72 in. (1.83 m) for Footing A.
The surface deformation patterns and interpreted failure mechanism for Footing Bare shown in Figs. 11 and 9, respectively. Less difference in the soil deformationadjacent to the footing and shaft deformation was evident for Footing B than for FootingA. Major surface deformation was also confined to a zone within 60 in. (1.5 m) of theface of the shaft, suggesting a failure body more nearly cylindrical than that for FootingA. The cracking pattern on the surface was similar to that for Footing A, except thatonly short segments of tangential cracks developed.
Footing C
The displacement-suction pressure-time relation for Footing C is shown in Fig. 12.Since the intent of the test was to investigate the behavior of the footing under sustainedmonotonic loading, the results have been plotted as functions of the logarithm of time. Itis normally assumed that log-linear displacement-time relationships are indicative ofstable behavior. Displacement-time relations for loads up to 160 K (712 kN) (73 percentof the capacity of Footing A) are essentially log linear; with minor variations due tothermal effects. Suction pressures on the order of 1.2 psi (8.3 kPa) or less weredeveloped after first applying each load. Within several minutes these pressures hadreduced to 0.4 psi (2.8 kPa) or less and remained essentially constant for the remainderof the load increment. Upon application of the final increment of load, which broughtthe total load to 190 K (846 kN), a decidedly nonlinear displacement-log time relationwas observed, which indicated failure. Suction increased, rather than decreased, withtime, in response to the large deformations generated during the maintenance of the finalload. However, due to the slow rate of movement, the magnitudes of suction neverexceeded 2.3 psi (16 kPa). The total capacity of Footing C, hlded over a long period oftime, minus the suction pressure reaction at failure, was 181 K (805 kN), which wasalmost identical to the total capacity minus suction pressure reaction at largedisplacements in Footing A. As in the case of Footing A, the pore water suction wasessentially identical to the total suction each time readings were taken.
No discernable soil surface cracking pattern was evident in the sustained, monotonicloading portion of the test, although when the footing was unloaded and reloaded, acracking pattern and a soil surface deformation pattern developed that resembled thosefor Footing A.

122 TRANSMISSION LINE TOWERS FOUNDATIONS
Upon unloading and reloading Footing C in a rapid monotonic manner, the load vs.deformation pattern shown in Fig. 13 ensued. The total capacity increased to a total of219 K (974 kN), but a corresponding suction pressure of 8.8 psi was generated duringreloading, which converts to a suction reaction force of 36 K (160 kN), leaving a totalforce less suction reaction force at failure of 183 K (814 kN), essentially identical to theequivalent capacity measured in the sustained-load portion of the test In Fig. 13 a translated graph of uplift force (T) vs. deflection for the fIrst (virgin) cycle test for Footing Ais also shown. Note the almost perfect resemblance to Cycle 2, Footing C.
Footin £ D
The results of the test on Footing D are summarized in Fig. 14 in the form ofdisplacement versus cycle number for various magnitudes of load amplitude. At thelowest value of load amplitude (70 K (312 kN)), the behavior was essentially elastic to125 cycles. The behavior at a load amplitude of 120 K (534 kN) appears at fIrst to beerratic. The variable slope of the displacement-cycle number relation is due, however, toa variable cycle period. The steeper slopes correspond to long periods (in the order of 5to 15 min.), while the flatter slopes correspond to short periods (in the order of 3 min.).The behavior is generally log linear and stable to 100 cycles of applied load. Reductionof the load amplitude to 70 K (312 k!\T) again resulted in elastic behavior. However,abrupt failure was observed after application of 6 cycles at a load amplitude of 160 K(712 kN).
Suction pressures generally followed the cyclic trend of the loads. During the fIrstset of cyclic loads at 70 K (312 kN), total and pore water suction values ranged from1.5 psi (10.3 kPa) during load application to -1.0 psi (-6.9 kPa) during load removal.The negative value of suction (positive total pressure) is probably due to therecompression of air inducted into the total pressure cavity during the loading portion ofthe cycle and complete return of the base of the footing to zero total displacement duringthe unloading part of the cycle. Values of suction pressure measured 30 sec afterapplication and removal of load on selected cycles at the failure load amplitude of 160 K(712 kN) are shown in Fig. 15. The total suction pressures, which again were virtuallyidentical to the pore water suction pressures, were generally larger than the suctionpressures at corresponding displacements in the monotonic tests. Here, the suctionremained positive even during unloading.
The maximum load minus corresponding suction pressure (11.3 psi (77.9 kPa))reacting over the base of the footing is only 114 K (507 kN), compared to about 180 K(800 kN) for the rapid and sustained monotonic loading on Footings A and C, whichwere of comparable dimensions to Footing D. This observation suggests that cyclicloads of increasing amplitude had a severe degrading effect on the maximum frontal soilresistance (Q) available above the bell.
QUMrrIFICA TION OF OBSERVED CAPACITIES
The salient results of the tests are summarized in Table 1. Based on the valuesreported in that table and on the observed phenomena described in the preceding section,it is possible to develop a simple, coherent, phenomenologically-based equation for

DPUFf IN JOINTED CLAY 123
x - 3 min. periody - 5-15 min. period
• T = 70K
oT=120K
6 T = 70K (Reload)c T = 160K
1,00010010
5
C
4-'C0E
3Q) ()~D-(/)
2Q
~.c(f)
0
1
Number of Cycles (N)
Fig. 14. Displacement Vs. Cycle Number,Footing D (1 in. = 25.4 mm; 1 K = 4.45 kN)
Footing Loaded-- --..•....
c: ";no D
';:: --() Q)::J ••••
(f) ::J(/)
CO (/)- Q)o •...f-D.
I,
/---Footing UnloadedPeriod::: 6 min
2 3 456
Number of Cycles (N)
Fig. 15. Total Suction Vs. N, Footing 0, 160KLoad (1 K = 4.45 kN; 1 psi = 6.89 kPa)
::J
Z
8
7
6
5
4
3
2
1
oo
I
/~From Breakout Theory
/ for Flat Plates (rp = 0) (9)////l·Nu = 4.64 «D/B)-0.77)
/ (This study) __/ ..---/ ..- ..---~ From in-situ tests on belled
/ __ ..- footings in fissured cia y (1),..--2 3
D/B
Fig. 16. Factor Nu Vs. DIB
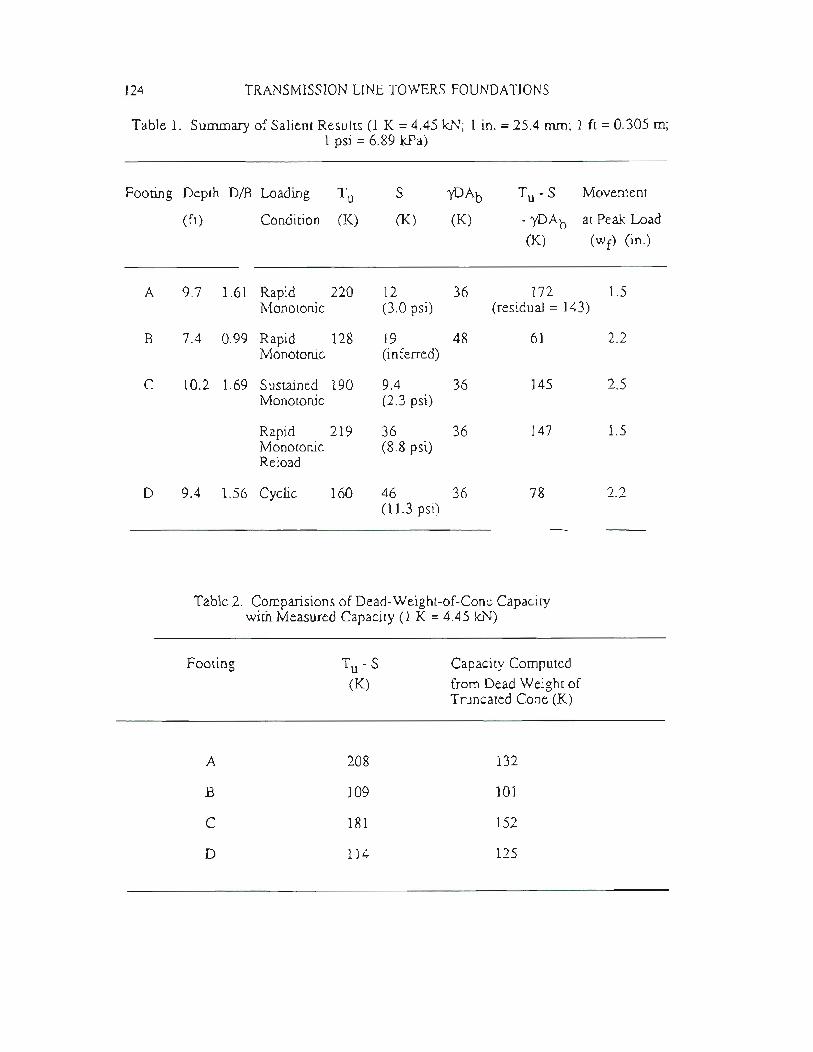
124 TRANSMISSION LINE TOWERS FOUNDATIONS
Table 1. Summary of Salient Results (1 K = 4.45 kN; 1 in. = 25.4 mm; 1 ft = 0.305 m;1 psi = 6.89 kPa)
Footing Depth DIB Loading
TuS"fD AbT -SMovementu
(ft)Condition(K)(K)(K)- yDAbat Peak:Load
(K)(wf) (in.)
A
9.71.61 Rapid22012 361721.5Monotonic
(3.0 psi)(residual = 143)
B
7.40.99 Rapid12819 48612.2Monotonic
(inferred)
C
10.21.69 Sustained 1909.4361452.5Monotonic
(2.3 psi)
Rapid
21936 361471.5Monotonic
(8.8 psi)ReloadD
9.41.56 Cyclic16046 36782.2(11.3 psi)
Table 2. Comparisions of Dead-Weight-of-Cone Capacitywith Measured Capacity (1 K = 4.45 kN)
Footing
A
B
C
D
T -Su(K)
208
109
181
114
Capacity Computed
from Dead Weight ofTruncated Cone (K)
132
101
152
125

UPUFf IN JOINTED CLAY 125
describing the peak, rapid monotonic, failure loads for the test shafts. Assuming thatundrained failure occurs in the day, Eq. 1 can be rewritten in the form developed forbreakout of flat disks near the soil surface ( 9 ), which has been shown to modelaccurately the capacity of the top surface of helical anchors in homogeneous clay ( 5 ):
(2)
where Nu = 4.64 ( DIB - 0.77 ) (using the triaxial data),= 4.35 (DIB - 0.77 ) (using the CPT data);
Su = average undrained shear strength from the base of the footing to a level2 ft (0.61 m) below the ground surface from either UU triaxial shearstrength profile or CPT shear strength profile (Nk = 19);
'Y = soil/concrete unit weight;D = footing depth;ps = maximum total suction pressure at failure at the base of the footing
(approximately 3 psi (20.7 kPa));
Au = 1t ( B2 - b2) j 4, where B = bell diameter and b = shaft diameter; and
Ab = 1tB2j4;
All factors in Eq. 2 were measured directly, except for Nu' which was thencalculated from Tu (Table 1) and fitted linearly to DIB. Eq. 2 can be modified to account
for the observed effects of sustained and one-way cyclic loading by including two
factors <1>1and <1>2'as described in Eq. 2a:
(2a)
where <1>1 = shear strength degradation factor = 1.0 for rapid monotonic loading, =
0.85 for slow (sustained) monotonic loading, = 0.45 for progressivelyincreasing one-way cyclic loading;
<1>2 = suction factor = 1.0 for loads applied for less than one minute, = 0.1
for loads applied for longer than five minutes (for small displacements).
The Nu factors are shown as functions of DIB on Fig. 16, on which are also plottedresults from model and full-scale tests in fissured clay ( 1 ) and a theoretical relation forflat circular disks in homogeneous soil. The factor for the smaller DIB in the presentstudy is near the corresponding value from Ref. 1, which suggests that the low capacityof the shallowest footing (Footing B, DIB = 1.0) was associated with opening of jointsduring loading, which is not reflected in the shear strength measurements. The factor forDIB = 1.67 is much closer to the theoretical relation for surface breakout of flat disks,

126 TRANSMISSION LINE TOWERS FOUNDA nONS
suggesting less effect from the opening of soil joints.
Another common method of computing uplift capacity of shallow belled footings isthe dead-weight-of-cone method. The capacity of the footiing is taken to be the deadweight of the footing plus the soil inside a truncated cone that rises from the perimeter ofthe base of the footing and makes an angle of 30 degrees with the vertical. Thisproposed failure block is not dissimilar to the inferred failure block for Footing A. Noshearing resistance is assigned to the soil, and zero suction is assumed. Table 2summarizes the results from this method and compares them to the measured capacitiesminus suction resistance. The dead-weight-of-cone method predicted capacities thatwere conservative for the monotonic tests, although the error was small for DIB = 1.0(Footing B), and predicted a capacity that was somewhat too high for the cyclic test(Footing D).
CONCLUSIONS
The following conclusions are drawn from this study:
1. The uplift capacities of shallow belled footings in jointed Beaumont Clay wereinfluenced by surface effects and the presence of joints in the soil, but morepredominantly at DIB = 1.0 than at DIB = 1.67. The footing tested at D/B = 1.0apparently had very low frontal soil resistance above the bell, which implies that suchshallow embedment was ineffective in the jointed soils at the test site.
2. Suction (primarily pore water suction) contributed significantly to short-termuplift capacity, although large displacements were necessary to affect total suctionpressures approaching 1 atmosphere. Suction also was found to dissipate rapidly afterapplication of an increment of load but not to disappear entirely under sustained loads.These characteristics can possibly be considered in design in the Beaumont Clay if theduration of applied loads is known.
3. Cyclic loading produced a severe loss of frontal resistance in the soil above thebell, while sustained loading produced only minor soil capacity reduction.
4. The capacities of the test footings are expressed in simple mathematical form inEqs. 2 and 2a. These equations are rational, although they contain empirically evaluatedterms, and incorporate the most important characteristics of the test-footing/soil system.They are not proposed for general design use.
APPENDIX - REFERENCES
1. Adams, 1. I., and Radhakrishna, H. S., "Uplift Resistance of Augered Footings inFissured Clay," Canadian Geotechnical Journal, Vol. 8, 1971, pp. 452-462.
2. Bonar, A, J., "Uplift Resistance of Tower Foundations," Research Report toHouston Li~hting and Power Company, Department of Civil Engineering, University ofHouston, August, 1961.

UPLIFT IN JOINTED CLAY 127
3. Kulhawy, F. H., "Uplift Resistance of Shallow Soil Anchors - An Overview," UpliftBehavior of Anchor Foundations in Soil, Ed. by S. P. Clemence, ASCE SpecialTechnical Publication, Oct. 1985.
4. Mahar, L. J., and O'Neill, M. W., "Geotechnical Characterization of DesiccatedClay," Journal of Geotechnical Engineering, ASCE, Vol. 109, No.1, Jan. 1983, pp.56- 71.
5. Mooney, J. S., Adamczak, S., Jr., and Clemence, S. P., "Uplift Capacity of HelicalAnchors in Clay and Silt," Uplift Behavior of Anchor Foundations in Soil, Ed. by S. P.Clemence, ASCE Special Technical Publication, Oct. 1985.
6. O'Neill, M. W., and Sheikh, S. A., "Geotechnical Behavior of Underreams inPleistocene Clay," Drilled Piers and Caissons II, Ed. by C. N. Baker, Jr., ASCESpecial Technical Publication, May 1985.
7. Sheikh, S. A., O'Neill, M. W., and Yazdanbod, A., "Uplift Behavior of Shallow,Fun-Sized Underreamed Footings in Beaumont Clay," ReDon No. UHCE 86-5,Department of Civil Engineering, University of Houston - University Park, June, 1986.
8. Turner, E. A., "Uplift Resistance of Transmission Tower Foundations," Preprint,ASCE National Convention, Houston, Texas, Feb. 1962.
9. Vesic, A. S., "Breakout Resistance of Objects Embedded in Ocean Bottom," Journalof the Soil Mechanics and Foundations Division, ASCE, VoL 97, No. SM9, September,1971, pp. 1183 - 1205.
ACKNOWLEDGMENTS
The authors thank Houston Lighting and Power Company for sponsoring this study,for providing construction personnel and for permitting publication of the results. Theyare also grateful for the assistance and technical support given by Dywidag SystemsInternational, USA, Inc., Farmer Foundation Company, and McClelland Engineers, Inc.The participation of several staff members and present and former students at theUniversity of Houston - University Park in the performance of the field tests, especiallyDavid Menzies, Ketan Kapasi, Dennis Paul, Harry Yearsley, Todd Dunnavant and BradGana, is also acknowledged.

UPLIFT CAPACITY OF DRILLED PIERS IN DESERT SOILS
A CASE HISTORY
By Byron Konstantinidis1, Albert]. Pacal2, Arthur W. Shivel/
ABSTRACT
This paper presents an evaluation of uplift capacity of drilled piers indesert soils based on comprehensive geotechnical investigations and fullscale load tests performed at four sites. The geotechnical investigationsincluded borings, laboratory tests, pressuremeter tests, and conepenetration tests. The soils at the four sites ranged from stiff clays todense gravelly sands. The paper includes a comparative evaluation ofstate-of-the-art uplift capacity prediction methods available to thegeotechnical engineers.
INTRODUCTION
Drilled cast-in-place piers are the most common foundation type used forhigh-voltage transmission line towers located in the deserts of theWestern United States. The lattice type towers commonly used for suchtransmission lines are typically supported on four piers. Due to highoverturning loads imposed by wind loads or line tension, the design ofthese piers is generally governed by uplift capacity considerations.Typical design uplift loads for high voltage (230 KY and higher) lines areon the order of 100 kips (445 kN). However, at angle (corner) towers,design uplift loads can exceed 300 kips (1335 kN) for sustained lineloads and 500 kips (2225 kN) for transient line loads.
lYice President, GEOFON, Inc., Cypress, California.?-Civil Engineer, Department of Water and Power, Los Angeles, CA.3Manager of Quality Assurance, Dept. of \Vater and Power, L.A., CA.
128
UPLIFT CAPACITY OF DRILLED PIERS 129
This paper presents an evaluation of uplift capacities of drilled piers intypical desert soils based on comprehensive geotechnical investigations andfull-scale load tests performed at four sites. The main purpose of thesetests was to confirm foundation designs for a major 500KV transmissionline in the Southwestern United States. The foundation designs werebased on empirical in-house techniques that generally resulted in moreeconomical designs than those indicated by conventional analytical methods.A secondary purpose of these tests was to evaluate the accuracy of stateof-the-art methods based on in-situ soil exploration methods in predictingthe uplift behavior of drilled piers in desert soils.
Geotechnical investigation at all four sites included cone penetration tests,borings, and laboratory tests. Pressuremeter tests were also performedat three of the four sites (the soils at the fourth site were too coarsefor such tests).
SITE CONDITIONS
A detailed geologic reconnaissance was completed along the entiretransmission line alignment before undertaking the foundation studiesdescribed in this paper. Based on the results of this reconnaissance,four sites, representing the range of soil conditions present along thealignment, were selected for detailed studies. The range of soilconditions at these sites is representative of desert soils, in general.Characteristically, desert soils are overconsolidated by desiccation, exhibitsome cementation, and have relatively high shear strength. Thesubsurface conditions at the four test sites are summarized below.
SITE NO.1 - DELTA
Site No.1 is located in the Sevier Desert, 20 miles (32 km) southwestof Delta, Utah. This area was once part of Lake Bonneville. Soils inthe upper 19 feet (5.8 m) at the site consist of silty clays of low tomedium plasticity. The consistency of these soils ranged from firm tovery stiff. For the foundation evaluations presented herein, the Delta siteis considered a "stiff clay" site. Medium dense to dense silty sandsunderlay the clays. Groundwater was encountered at a depth of 18 feet(5.5 m). The Moisture content in the soils above the groundwater tablewas variable, ranging from slightly above the plastic limit to slightlybelow the liquid limit.
130 TRANSMISSION LINE TOWERS FOUNDATIONS
SITE NO.2 - CALIENTE
Site No. 2 is located on a very extensive alluvial fan in the DelmarValley, 20 miles (32 km) southwest of Caliente, Nevada. Soils at thissite consist of dense, slightly to heavily cemented silty and gravelly sandswith occasional cobbles. The moisture content of these soils was
generally very low. No groundwater was encountered in the borings.
SITE NO. 3 - ALAMO
Site No. 3 is located within the Delmar Dry Lake, 16 miles (26 km) eastof Alamo, Nevada. The dry lake is located at the bottom of DelmarValley, at the base of very long alluvial fans. Soils at this site consistof very stiff to hard silty clays. The in situ moisture content of thesesoils was near the plastic limit.
SITE NO.4 - BAKER
Site No. 4 is located in the Silurian Valley, 10 miles (16 km) north ofBaker, California. This site is located on a relatively short alluvial fan.Soils at this site consist of medium dense to dense silty sand and gravel.The moisture content of these soils was very low (less than 2 percent).No groundwater was encountered in the borings.
Results of in-situ tests performed at the four sites are presented inFigure 1. The cone penetration tests were performed using a truckmounted electric cone penetrometer with a maximum thrust capacity of 20tons (178 kN). Pressuremeter tests were performed using a TEXAMpressuremeter (1) in pre-drilled small diameter boreholes. At Site No. 1
the boring was drilled with a hand auger. At Site No. 2 rotary washwith foam and mud was used. At Site No. 3 rotary drilling with airinjection was used. At each location tests were performed at four depth
intervals. The coefficient of earth pressure at rest (Ko) was obtainedusing a new method (1) which is analogous to the determination of preconsolidation pressure from laboratory consolidation tests.
Geotechnical parameters derived from field and laboratory tests aresummarized in Table 1. It should be noted that shear strength data wereobtained by three-point direct shear tests performed under in situmoisture conditions.

UPLIFf CAPACITY OF DRILLED PIERS 131
CONE PENETRATION TEST DATA PRESSUREMETER TESTDATA
FRICTION RE£lnANCE CONE RESISTANCE
TSF(KG/CM2) TSF (KG/CM2) FRICTION RATIO 1-POH (k Pal(~;) ---- PL· (102kP.)
SITE NO.1 DELTA
ena::u.J
>u.J
::E
<;4 :r
>Q.u.Ja
8o
60 80 0 2100 200 300 400 500 600 010I20 15o
20
~ 10
>-u.J 5u.J
u.
,...0..u.J 15a
>-u.J 5u.J
u.
~ 10
,...
0.. 15',,"a
20
enc:u.J
>u.J
::E
~>=Q.u.J
a
SITE NO.2 CALIENTE
:t 15a
20
..:,I'o
ena::u.J
>w::E
~4 :r
>Q.Wa
SITE NO.3 ALAMO
I
S5~1 : i
u. : I, I
~ 10 ' ,',
- ,I1-0 I'0.. ,~UJ 15· , ,
a I I I ; ~LJ20 I ' " I
SITE NO.4 BAKER
!
I
I
i!i!
i
I ,~O TEST
; PERFORMED
III
I
II
I ND TEST
PERFORMEDena::w>-
2 w::E
z4 ~
>=0..Wa
FIGURE 1: IN-SITU TEST RESULTS

132
t;; 5w...
~ ~O
:I:•...
fu 15o
20
•...5
ww...~ 10
•...~ 1S0 20
TRANSMISSION LINE TOWERS FOUNDATIONS
TABLE 1 - LABORATORY TEST RESULTS
SOIL
LABOR A TORY TEST DATA
DESCRIPTION
CI
Q
I Yd
Wuf (kPa)
~pcf (;;;cm3)(~.)LLPL
SIL TY ISANDY CLA Y
--I--I99 11.59117I28 I16
ICLI l 0.58 1561,28 95 11.521I19 ---SIL TV CLAY
0.58 1561I32 ,99 11.591 254116
ICLI0.35 1341I I8211.311
4244I232' I,
ISIL TY ISANDY CLA Y
0.40 138127
I 11511.84117
2613
ICLI --, ---
SITE NO.1 DELTA
0
48I10711.7114NP
INP
SIL TY SANDY
048I11011.7613NPINPto GRA VELL Y SAND --I--I114 11.831 I•iNPINP
ISP-SMJ i
III
~m.n tl'd • 4 teet
Iocc ••. on.1 cobble1
048
I11311.811
4NPNP
SITE NO.2 CALIENTE
U)c:w
2 t;;:!:~
4 :I:•..."wo
U)c:w•...w:!:~
4 :I:•..."wo
o
t;; 5w...
~ 10:I:•...
~ 15o
0.501481 I 53
SIL TY TO
SANDY CLA Y ICLI
becoming sandi.r"'ltho~th
SITE NO.3 ALAMO
15 I31I20IU)c:wt";:!:40
I14I~•...
<-w06
0
•...
ww...~10
;:::
"-15w 020
0.1011014711811.8912NPiNP
0.101101
3411611.8611!NPINP
SIL TY TO
0.15114138114 11.8312INPNP
GRAVELL Y SAND ISP·SMI0.30 1291
4110e 11.73)2NPNP
SITE NO.4 BAKER
'"c:w
2 ••..w:!:Z:I:•..."Wo
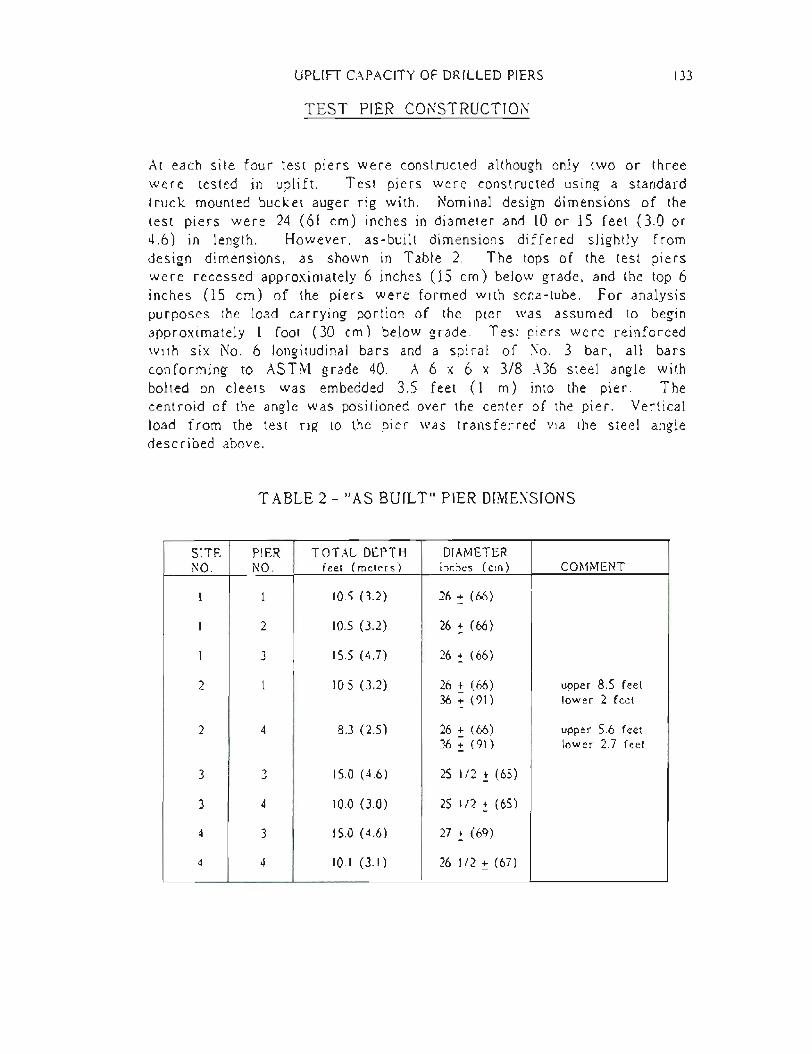
UPLIFr CAPACITY OF DRILLED PIERS
TEST PIER CONSTRUCTION
133
At each site four test piers were constructed although only two or threewere tested in uplift. Test piers were constructed using a standardtruck mounted bucket auger rig with. Nominal design dimensions of thetest piers were 24 (61 cm) inches in diameter and 10 or 15 feet (3.0 or4.6) in length. However, as-built dimensions differed slightly fromdesign dimensions, as shown in Table 2. The tops of the test pierswere recessed approximately 6 inches (15 cm) below grade, and the top 6inches (15 cm) of the piers were formed with sona-tube. For analysispurposes the load carrying portion of the pier was assumed to beginapproximately 1 foot (30 cm) below grade. Test piers were reinforcedwith six No. 6 longitudinal bars and a spiral of No. 3 bar, all barsconforming to ASTM grade 40. A 6 x 6 x 3/8 :\.36 steel angle withbolted on c1eets was embedded 3.5 feet (1 m) into the pier. Thecentroid of the angle was positioned over the center of the pier . Verticalload from the test rig to the pier was transferred via the steel angledescribed above.
TABLE 2 - "AS BUILT" PIER DIMENSIONS
SITE PIERTOTAL DEPTHDIAMETERNO.
NO.feet (meters)inches (cm)COMMENT
1
1 10.5 (3.2)26 ~ (66)
1
2 10.5 (3.2)26 ~ (66)
1
3 15.5 (4.7)26 ~ (66)
2
1 10.5 (3.2)26 ~ (66)upper 8.5 feet36 ~ (91)
lower 2 feet
2
4 8.3 (2.5)26 ~ (66)upper 5.6 feet36~(91)
lower 2.7 feet
3
3 15.0 (4.6)25 1/2 ~ (65)
3
4 10.0 (3.0)25 1/2 ~ (65)
4
3 15.0 (4.6)27 ~ (69)
4
4 10.1 (3.1)26 1/2 ~ (67)

134 TRANSMISSION LINE TOWERS FOUNDATIONS
LOAD TESTING
Uplift loads were applied to the test piers via a 300 kip (1335 KN)hydraulic jack mounted between two W27 x 84 wide flanged beams. Adistance of 10 feet (3 m) was maintained between the pier and points ofsupport for the test rig.
Load increments were maintained for a minimum of 5 minutes to a
maximum of 60 minutes. Equilibrium was usually established in about 15minutes. Due to system limitations, it was very difficult to maintainloads for extended periods of time.
Pier deflections were monitored utilizing two independently supported dialindicators mounted 180 degrees apart relative to the top of pier. Dialindicators were graduated to 0.001 inch (0.025 mm). In addition tomonitoring pier deflections, ground disturbance was also monitored. Hubswere driven into the ground radiating out along a tangent to the pier. Afine piano wire was stretched taut directly above the hubs. Grounddeflections were measured with a scale graduated to 0.01 inch
(0.25 mm).
Load-deflection curves are presented in Figure 2. It should be noted thatthe maximum applied load was limited to 200 kips (890 K1'\', 2/3 of thejack capacity). In all cases a "yield" load could be detected within thisrange although in three cases (Pier No. 1 at Site No. 1 and both piers atSite No.3) the ultimate capacity appeared to be greater than 200 kips(890 KN).
Ground heave measurements around the test piers indicated movement inall cases. The heave adjacent to the pier approached the verticaldeflection of the pier gradually diminishing with radial distance. Themaximum radial distances where ground displacement was detected (orprojected based on adjacent monitoring points) are presented in Table 3.

UPLIFT CAPACITY OF DRILLED PIERS135
DEFLECTION IN MILLIMETERS
DEFLECTION IN MILLIMETERS
a
-2-oj-6a-2-4-6200 800en
c.. 160 Z~ 600 .:JI!.ZZ
0120
0<: 400
<:0 0...J
80 ...J
~.
~u..
u..:i 40200 :i
c..c..
:;:)SITE NO.1SITE NO.2:;:)
DELTACALIENTE
aa
200 I I~I I--"1I III- 800en
c.. 160~ ZPIER 4
600 .:JI!.Z Z0
120 0<:400 ~
0 ...J 80--...J~ ~u.. u..
...J 40200 :i
c.. SITE NO.4c..
:J SITE NO.3 :JALAMO
BAKERa
a
a
-.1-.2-.3 a-.1-.2-.3
DEFLECTION IN INCHES
DEFLECTION IN INCHES
FIGURE 2:
LOAD TEST RESULTS
TABLE 3 - APPROXIMATE LIMITS OF GROUNDREAVE
LENGTH OF PIERDIAMETER OF HEAVED GROUND
SITE NO.
PIER NO.feet (meters)feet (meters)
1
1 10.5 (3.2)9 (2.7)1
2 10.5 (3.2)8 (2.4)1
3 15.5 (4.7)8 (2.4)2
1 10.5 (3.2)10 (3.0)2
4 8.3 (2.5)11 (3.4)3
3 15.0 (4.6)10 (3.0)3
4 10.0 (3.0)10 (3.0)4
3 15.0 (4.6)11 (3.4)4
4 10.1 (3.1)10 (3.0)

136 TRANSMISSION LINE TOWERS FOUNDATIONS
EVALUATION OF RESULTS
Prior to conducting the full scale load tests, uplift capacities werepredicted using two techniques, in this paper briefly referred to as theEPRI method and the CPT method, respectively. Ultimate upliftcapacities were also predicted by others (2) based on pressuremeter data.The results are summarized by Briaud et. al. (3) and will not berepeated here.
The EPRI method is based on shear .strength data obtained fromlaboratory tests and in situ lateral stress estimates either obtained bypressuremeter tests or analytically derived from the geologic load historyof the site. The method is described in Chapters 8 and 9 of acomprehensive state-of-the-art research report (4) prepared by CornellUniversity for the Electric Power Research Institute. The method isbased on the assumption that failure occurs primarily as a cylindricalshear surface along the perimeter of the pier. The uplift capacity of astraight-shaft assumed to consist primarily of side friction andloradhesion along the cylindrical surface of the pier plus the weight of thepier. Under drained condition, the ultimate uplift capacity derived fromside friction, F , iss
Where
F =s iT B-"'(z K(z) tan 0 dz
B
D
z and dz
K(z)
IS the diameter of the pier
IS the total embedded length of the pIer
IS the average effective unit weight of the soil
are the average depth and thickness of a layer
is the coefficient of horizontal stress
(assumed to be equal to the at rest coefficient, K )o
is the angle of friction for the soil to concrete interface(equal to the soil friction angle, , for cast-in-place piers)
For undrained loading conditions, typically used for saturated, fine grainedsoils under quick loading conditions, the uplift capacity due to adhesion isexpressed as
F =s iT B S (z) dzu

where
S (z)u
UPLIFT CAPACITY OF DRILLED PIERS
IS the undrained shear strength of the soil in a given layer
137
a(z) is an empirical adhesion factor, for concrete piles rangingbetween 0.4 for hard soils to over 1.0 for soft soils
For short piers in hard soils, it is also recognized that a compositefailure surface consisting of a cone near the ground surface andcylindrical surface at depth can develop resulting in somewhat lowercapacity than would be predicted by the cylindrical failure surface model.
The CPT method is based on side friction values obtained from electric
cone penetration tests. This method is described by Schmertmann (5)based partly on research performed by Nottingham for driven piles. Thismethod is also based on the assumption that failure occurs along acylindrical surface. However, for granular soils reduction factors areapplied to side friction values near the ground surface to account forreduced confinement effects. For granular soils, the ultimate sidefriction resistance, F . for piles in compression iss
z
Where
F =s Ks 88 ~~ 88of s A s L )
+ 88"" f sA s
Ks
Fs
A s
is ratio of unit pile friction to unit sleeve friction(for short concrete piles, it ranges between 1.2 and 1.5)
is unit sleeve friction resistance from CPT's using electricpenetrometers
pile-soil contact area for the depth interval beingconsidered
For cohesive soils, side friction is estimated by
Where
a IS the adhesion factor, defined earlier

138 TRANSMISSION LINE TOWERS FOUNDA nONS
For piles in tension, Schmertmann (5) recommends that the frictionalcapacities be reduced to 2/3 of the values computed by the aboveformulae. For drilled piers, Schmertmann (5) recommends a furtherreduction to 3/4 of the computed values. Thus, with the combinedreduction factors, the frictional capacity of drilled piers in uplift isexpected to be equal to half of the frictional capacity of driven piles incompreSSIOn.
Upon completion of the load tests, the predicted uplift capacities werecompared with the actual observed capacities. The results of theseevaluations are summarized in Table 4. It should be noted that the actualcapacities were defined by four different methods described in thereferenced EPRI publication (4). In some cases the range of capacitiesindicated by the four methods was very wide making objectivecomparisons difficult. In all cases, however, the capacities indicated bythese methods were lower than the ultimate uplift capacity. Thus, theyare more representative of a "yield" or "plunging" load rather thanultimate capacity. In practice the writers have found the "slope tangent"method to be most convenient to use for evaluating uplift capacities ofdrilled piers in desert soils. In addition to its simplicity, this methodconsistently produced capacities slightly below the ultimate measuredcapacities, at tolerable measured deflections (less than 1/4 inch or6 mm).
TABLE 4 - PREDICTED AND ACTUAL UPLIFT CAPACITIES
PREDICTED CAPACITIES (KIPS)ACTUAL CAPACITIES (KIPS)
Site
Pier SlopeTangent
No.
No. EPRI CPTLog-logTangentIntersect90%Avg.
1
1 75 907895908888
2
75 907690857882
3
118 145130145130142137
2
1 110 145125178135>200>160
4
90 11510512290126111
3
3 180 40091210135>200>159
4
140 20375175120>200>142
4
3 - 160145160144180157
4
- 807980628576

UPLIFT CAPACITY OF DRILLED PIERS 139
The EPRI method predicted capacities that were typically slightly lowerthan the actual capacities indicated by at least three of the four methods.In general, the capacities predicted by the EPRI method were within 30percent of actual capacities. It should be noted that the predictions made
using the EPRI method were based on very high Ko values indicated bythe pressuremeter tests (see Figure 1). Had the lateral pressurecoefficient, K, been limited to a value less than 1.0, as it is commonlydone in western geotechnical practice, the predicted capacities would havebeen less than half of the actual values.
The CPT method predicted the uplift load capacities at three of the foursites even more accurately than the EPRI method. However, at Site No.3 (Alamo) it predicted uplift capacities that were substantially greaterthan the actual capacities indicated by at least three or the four methods.This discrepancy can be attributed to a combination of two potentialfactors; namely
a) As can be seen in the load-deformation curves (see Figure 2),the actual ultimate uplift capacity for both piers at this sitewas much greater than the "yield" load indicated by three ofthe four techniques, and quite likely much greater than the 200kip load limit of the test. Thus the discrepancy may not be assignificant as it appears.
b) The site soils were highly desiccated and possibly had planesof weakness that would have reduced the uplift capacity. Suchsecondary structure would be not detected by cone penetrationtesting.
CONCLUSIONS
Based on the results of the geotechnical investigations and load testsdescribed in this paper, the following are concluded:
1. The EPRI method consistently provided reasonably conservativeuplift capacity estimates despite the liberal earth pressurecoefficients used in the analyses.
2. The CPT method generally provided very realistic estimates ofthe ultimate uplift capacity with the possible exception of SiteNo. 3 where the method overestimated the capacity of at leastone pier. The results of these studies are encouragingconsidering the fact that cone penetrometer testing is one ofthe more economical subsurface exploration methods and that
adequate penetration was achieved even in dense gravelly and

140 TRANSMISSION LINE TOWERS FOUNDATIONS
cobbly sands. However, the data base for drilled pIerapplications is very limited and more research is needed intothe effect of limiting conditions such as secondary soilstructure (fissures, cracks, bedding planes, cementation, etc.)and moisture content variations.
3. The mode of failure in all cases appeared to involve theformation of a conical surface. However, this mode offailure did not appear to adversely affect the accuracy ofuplift load predictions.
ACKNOWLEDGMENTS
The studies described in this paper were sponsored by the IntermountainPower Agency, as part of the design effort for the Intermountain PowerProject. The studies were coordinated by the engineering staff of theLos Angeles Department of Water and Power, who also performed theload tests. Subsurface exploration and laboratory testing services wereprovided by the Earth Technology Corporation. Pressuremeter testingservices were provided by Briaud Engineers.
APPENDIX I - REFERENCES
1. Briaud, ].-L., Babb, L., Capelle, J .-F., "The TEXAMPressuremeter" Geotechnical testing Journal ASTM 1983.
2. Briaud Engineers, "Foundation Investigation by PressuremeterTesting for Electric Power Line in Utah, Nevada, andCalifornia", unpublished report, July 1982.
3. Briaud, ].-L., Pacal, A. ]., and Shively, A. W., "Power LineFoundation Design", Proceedings of International Conference onCase Histories in Geotechnical Engineering, Saint Louis, May1984.
4. Cornell University, "Transmission Line Structure Foundationsfor Uplift-Compression Loadings", Electric Power ResearchInstitute Publication, EPRI EL-2870, Research Project 1493-1,February 1983.
5. Schmertmann,]. H., "Guidelines for Cone Penetration Test,Performance and Design", U. S. Department of Transportation,publication FHW A- TS-78-209, May 1978.
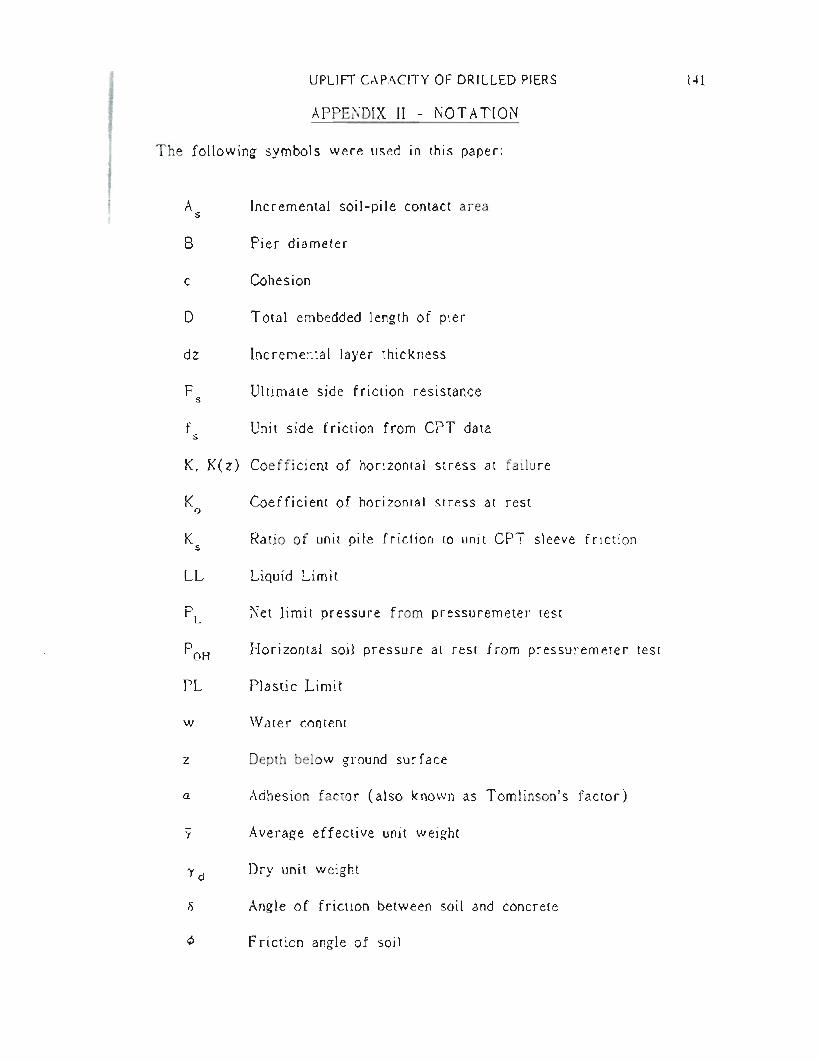
J
,
IIi
UPLIFT CAPACITY OF DRILLED PIERS
APPENDIX II - NOT ATION
The following symbols were used in this paper:
A Incremental soil-pile contact areasB
Pier diameter
c
Cohesion
D
Total embedded length of pier
dz
Incremental layer thickness
F
Ultimate side friction resistancesf
Unit side friction from CPT datas
K, K(z) Coefficient of horizontal stress at failure
K Coefficient of horizontal stress at resto
K Ratio of unit pile friction to unit CPT sleeve frictions
LL Liquid Limit
P L Net limit pressure from pressuremeter test
P OH Horizontal soil pressure at rest from pressuremeter test
PL Plastic Limit
w Water content
z Depth below ground surface
a Adhesion factor (also known as Tomlinson's factor)
'Y Average effective unit weight
'Y d Dry unit weight
o Angle of friction between soil and concrete
¢ Friction angle of soil
141
UPLIFT CAPACITY OF DRILLED SHAFTS AND
DRIVEN PILES IN GRANULAR MATERIALS
Keith D. Tucker*, A. M. ASCE
ABSTRACT: Southern California Edison Company has
performed field uplift load tests on cast-in-place drilled
shafts and driven piles along transmission line routes and
generating facilities within its service territory. Field
exploratory borings and cone penetrometer test soundings
were placed at many of the test sites to identify the soil
types, densities and strength characteristics of thesubsurface materials.
In this paper, results from 91 field uplift load tests are
utilized to evaluate design methodologies for computation
of ultimate uplift capacities. The field load-deflection
results are normalized to predict behavior of the drilled
shafts and driven piles. Correlations of side friction
factors with shear strength and foundation geometry are
given for use in predicting the uplift capacity of
foundations in granular materials.
INTROOUCTI ON
The Southern California Edison Company (SCE) has performed more than
100 field uplift load tests on drilled shafts and driven piles over
the past 50 years for transmission line structures throughout the
SCE service territory. These tests provide a large data base to
evaluate design methodologies for estimating the ultimate uplift
capacity and associated deflections of drilled shafts and driven
pile foundations in granular materials.
LOCATION OF FIELD LOAD TESTS
The field uplift load tests were conducted along eight transmissionline routes from 1936 to 1985 and at six SCE facilities from 1941 to
1986. These test locations ranged from the Tehachapi mountains
southeast of Bakersfield, California, to coastal sites near Ventura,
California, and as far east as the Colorado River at Blythe,
California. The SCE service territory and location of the field
load tests are shown in Figure 1.
*Geotechnical Engineer, Southern California Edison, Rosemead, CA
142

DRILLED SHAFTS AND DRIVEN PILES 143
FRESNO
o
BAKERSFIELD
o
MAGUNOENPASTORIA T IL
ORMONO BEACHGEN. STATION
SCE REPORTNO. 124 SITES
~\ »r-1:tJ=T\IN0'0:::>\',,>
OEVERS-PALO :; i~VEROE TIL )PALM ~
SPRINGS .'
,0 NEWPORT /BEACH
FIGURE 1 LOCATION OF SCE UPLIFT LOAD TESTS
SOIL CONDITIONS
The soil conditions encountered along the transmission line routesranged from 'Wind-blo'Wn sands in desert regions to alluvial depositsof dense sands and gravels near mountains. Fractured and slightly'Weathered sandstones, siltstones and granitic materials 'Wereprevalent in the Tehachapi mountain range. The coastal sites in theLos Angeles basin and 10'W-lying areas near the Colorado Riverconsisted of intermixed sand, silt and clay materials 'Withground'Water depths from 2 to 15 feet (0.6 to 4.6 meters).
FIELD EXPLORATION AND LABORATORY DATA
The earlier load tests from 1940 to 1950 'Were performed at sites'Where a minimum of subsurface information 'Was available. A
description of the soil type, consistency and drilling procedures'Were the primary data obtained in field explorations. From 1950 to1986, exploratory borings 'Were often placed near the test piles 'WithStandard Penetration Tests (SPT) performed to obtain blo'Wcounts atdifferent depths. T'Wo types of samplers 'Were used in the field, thestandard split barrel sampler 'With a 2 inch (5.1 cm) 0.0. for SPTtests and a ring sampler 'With 4 inch (10.2 cm) 0.0. to collectrelatively undisturbed samples.

144 TRANSMISSION LINE TOWERS FOUNDATIONS
Since 1981, electric Cone Penetration Test (CPT) soundings have also
been performed to obtain in-situ strength parameters. A standard
electric cone was pushed at a rate of 0.8 in/sec (2 cm/sec) using a
20 ton (89 KN) reaction truck. Both side friction and tip
resistance profiles were recorded continuously and used in computingthe friction ratios.
The laboratory testing program on selected samples consisted of
moisture content, unit weight, gradation, Atterberg limits and
drained direct shear tests on saturated samples at various
consolidation pressures. These soil parameters from laboratory
tests are given in unpublished SCE reports and were used in
evaluating the load test results.
FIELD UPLIFT LOAD TEST PROCEDURES
Uplift load tests were performed using various equipment and
methods. From 1936 to 1980, a steel beam was placed across reaction
piles with a hydraulic jack resting on the beam. The load was
applied manually and recorded from a pressure gauge attached to the
pump. Originally, proof tests were conducted to at least 150
percent of design load with typical vertical deflections of less
than 0.15 inch (0.4 cm). The load was then rebounded to zero and
the permanent deflection noted.
In 1981, SCE fabricated a portable steel tripod test frame which is
10 feet (3.0 m) high and has three legs spaced 18 feet (5.5 m) apart
at 120 degree angles from each other. A double-acting hollow
plunger hydraulic jack with 150 ton (1335 kN) capacity and 8 inch
(20 cm) stroke was used to apply the tensile loads. A 1.375 inch
(3.5 cm) diameter, high-strength Dywidag bar extends through the
jack and was attached to the top of the foundation.
Load tests were conducted by applying a tensile load to the Dywidag
bar in increments of approximately 25 percent of design load. The
load was typically rebounded to zero from 25, 50 and 75 percent of
the design load, then the load was re-applied until the peak value
was reached prior to a final rebound. Deflections at the top of the
pile foundations were measured using two or more dial gauges with an
accuracy of at least 0.001 inches (0.0025 cm). The, dial gauge
readings were averaged to obtain the actual vertical displacement ofthe foundation.
BASIC CONSIDERATIONS
In principle, the uplift capacity of drilled shafts in granular
soils is shown in Fig. 2a and may be computed from the following
vertical equilibrium equation:
(1)

If
DRILLED SHAFfS AND DRIVEN PILES 145
with Ou = uplift capacity, W = foundation weight, Os = side
resistance and Ot = tip resistance. The side resistance varies
depending on the shearing surface and shearing resistance of the
granular materials. The tip resistance can be developed fromtension and suction stresses at the bottom of the foundation.
During drained loading, suction is not present and tip tension is
normally very low for cast-in-place concrete drilled shafts (5).
Since the tensile strength of granular soils is usually low, the tip
resistance for the drilled shafts and driven piles was assumed to bezero.
~ Otu
A) FORCE DIAGRAM
OU
I" ~I
I..~I•• 1
0tu 0su
B) SIDE AND TIPRESISTANCE
FIGURE 2 DRILLED SHAFT IN UPLIFT
The side resistance, Os. is shown in Fig. 2b and may be expressedas:
( 2)
where As = surface area of soil-shaft interface, fs = averageskin friction along soil-shaft interface and D = embedded depth of
f0undat ion. The sid ere sistan ce va riesin a par ab0 1ic ma nnera 10ngthe shaft to a minimum value at the tip of the shaft (7,10).
INTERPRETATION OF FIELD LOAD TEST DATA
Based on recent SCE structural analysis of transmission line towers,a one inch differential deflection of the tower foundations were
considered acceptable for design using ultimate uplift loads. For
field load tests where the peak uplift resistance occurred at
displacements greater than one inch, the ultimate uplift capacity

146 TRANSMISSION LINE TOWERS FOUNDATIONS
was established as the applied load at a vertical deflection equalto one inch. Typical applied load versus vertical deflection curvesfrom field uplift load tests are shown in Figure 3 for drilledshafts and driven piles.
140 I DC •••.I." I ("\~n""1~n KIP~ __ I140
PEAK LOAD=120 KIPS120
120
c;,
100 c;,100
~~----1Cl.
Cl.
g;Z
/' I />-
80>-
80 /I/ULTIMATE LOAD OF
>-
>-
0 -- --r;0/<i
<iJ 101 KIPS AT
Cl.
/~I V
Cl.I!1 INCH DEFLECTION
<i
<i
<.)
"1//<~ BELLED ;/ ULTIMATE LOAD
<.)60/>-
>-
"-
"-
/1::J
PIER OF 78 KIPS AT::J
ICl. I II 1 INCHCl.
I=>40
=>40
DEFLECTION I
I
II20-1:/
/III I20
I;,/ I
0
0
0
0.20.40.60.81.01.2 00.20.40.60.81.01.2
VERTICAL DISPLACEMENT <INCHES)
VERTICAL DISPLACEMENT <INCHES)
A) DRILLED SHAFTS
B) DRIVEN CONCRETE PILES
FIGURE 3 SELECTION OF PEAK AND ULTIMATE UPLIFT CAPACITIES FROM TYPICAL FIELDLOAD TEST DATA FOR DRILLED SHAFTS AND DRIVEN PILES (1 INCH=2.54 CM,1 KIP=4.45 KN)
For this study, field data from 36 uplift loads tests on 27 drilledshafts and 9 driven piles were evaluated where the peak upliftresistance was obtained. The peak uplift resistance was reached atvertical deflections less than one inch in 25 load tests with theremaining seven tests yielding peak resistances at displacementsgreater than one inch. The ultimate uplift capacity for these seventests was selected at a vertical deflection of one inch as shown inFigure 3.
A method was developed for test foundations where the peak upl iftresistance was not reached during field load tests to estimate theultimate uplift capacity using normalized curves shown in Figures 4and 5. The measured uplift load at small deflections was comparedto the normalized uplift curves based on the type of foundation andembedded depth to width (D/B) ratio. The ultimate uplift capacitywas then estimated for use in this evaluation.

DRILLED SHAFTS AND DRIVEN PILES 147
20
~~~« •....>zUJ
:<:::;«llJ
llJu
0..«o~••..•0..
(/)0llJO
N:J::JU« z::; a:llJOzzO~~00~«•....011.~
:Ja:g;o
120
100
80
60
40
20
oo 0.2 0.4 0.6
D/B
1.5-25-8
12-1416-17
0.8 1.0 1.2
120
~~--'-« •....> z 100llJ
:<:::;
«llJ
llJU0..«o ~ 80••..•0..(/)0llJO
:J is 60«Z::;a:llJ
OZz 0 40
~~00--'«•....011.--':Ja:g;o
oo 0.2 0.4 0.6 0.8 1.0 1.2
VERTICAL DISPLACEMENT IINCHES)
A) DRILLED PIERS
VERTICAL DISPLACEMENT IINCHES)
B) BELLED PIERS
FIGURE 4
120
NORMALIZED UPLIFT LOAD RELATIONSHIP FOR CAST-iN-PLACECONCRETE DRILLED SHAFTS (1 INCH=2.S4 CM)
120llJ -
::) ?f..
--' -« •....> Z 100:<: llJ« ::;llJ llJ
a.. U0:5 80•.... a..
a ~llJ 0~ G 60« z::; a:: wo zZ 0 40o •....« «':3 0•.... C3 2011. --'
:J a:g; 0
o .o 0.2 0.4 0.6 0.8 1.0 1.2
llJ
::)<f?--' « •....> Z 100:<:llJ
«::;llJllJo..U0:5••••• 0..
O~llJO
:J is 60« Z::; a:llJo ZZ 0 400 •....« «00~ «•....0 20~ --'
~a:g;o
0.2 0.4 0.6 0.8 1.0 1.2
VERTICAL DISPLACEMENT IINCHES)
A) CONCRETE SQUARE PILES
VERTICAL DISPLACEMENT IINCHES)
B) RAYMOND STEEL STEP-TAPERED PILES
FIGURE 5 NORMALIZED UPLIFT LOAD RELATIONSHIP FOR DRIVEN PILES (1 INCH=2.54 CM)
FIELD UPLIFT LOAD TEST RESULTS
Field uplift load tests were performed on 50 drilled piers and29 belled piers using cast-in-place concrete construction, as wellas 10 prestressed concrete and 2 steel step-tapered driven piles.The field load test results are given in Tables 1, 2, and 3 for thedrilled piers, belled piers and driven piles, respectively, alongwith the foundation depth, shaft width, base width, soil types andconstruction methods.

TABLE I. SCt: FIELD UPLIFT LOAD tEST RESULTS - DRILLED PIERS
DAn: AND LOCATlON
PIER
OEI'TH
~PH:R
WIDTH
P;ef>t).
UPLIFT CAPACITY
o/s TOTAL NET
_~ Q.!l'~ Q.!l'~
VENT •
OHI..~
GROUND
WATER
..u:~
AYF.RM:F:
SKIN
FHICTloN REI/!.
1~ .J.:.LK
1::L
TOTALUNIT
WEIGHT
l!s.LL
EF •...ECrtYF.
FRICTION
ANGLE
(lX.!p,re~
rORe I
~~~Al!~
.f::.00
~1!.. •.!.U...JJ~~!JE1JPt1e No. I 1],0 I.')
!!~~_~~.!..!2er-f!!..t'!2-!L~.I'JI,. No. 1',-H]24lf< 12.0 I.')
.2s!.ober I 1941 Chlno-l...,~un. Be LL!.L.hPl1~ No. I-H149 18.0 1.5
!!!lL-l!40 Second Bould~r-ChJr.o TILPile No. 2-H2UT4 14.8 1.5
>-3~>Zen~-enC/.J
5zl"'ZtT1
>-3o~tT1~en'Tjoc::zo>>-3
5zen
ChyE"Y ,'lilt Aod !'Itlty 9i1od.
Clayey stir nnd sIlty BAnd.
TRnnrc top 2 feet
Clayey 9:1od with flooded sand
bad.f 111 around <:ttr c8sin.R:.Clayry SAnd with vlhrated "'And
backfill around GHP casing_Clnyey sl1nd with tamped l!landbAckf 1\1 Around CHP casing.Clayry S:lnd with flooded 8And
hRckfill Around CHI' cuinR;.Cll'lyf'Y 811.\(J with vlhrllt('d ."ndhAckfil1 Around CHI' Cllllillg.ClI1YC'Y tI:lnd wHI> tllmped lIanti
bllckflll UOllnd CHP cuing.ClllYPY "'nnd. C"Rt-ln-pJ,'H~e ('on,n>te.
CJayey sand. CAst-In-plAce concrete
S11Rht1y Cf'mf'l1t('d F1llty s8nd.
Loose' sAnrl. Steel casing uaed tn
C"OI1AtI'"IICt pilE" And then n'movP\!.
Sf Ity 9 ..•".1 frol1\ 0-7 ft
S:wd I rom 7-1, ft51 It Y "'and from 0-4 f t
Clny('y !If It from '.-12 ft
51 Jty I'Inod with Rr •.•• e1.
Silty SAnd wHh gr"'v~I.51 Ity sand with gravel.Silty !'lAIrd w(th .':ravel.
Loolt' dg r rom 0-4 f t
Cf'rnt'oled dR (rOIll 4-11 ftDecompos(Od RfAnite f rOIll 0-7 ftC"",('nted $find from 7-11 ftHaillt dg from 0-4 ftSAndy glJt from 4-JR ft
Holst dR frnm 0-].'; ftCemented dR from 3.5-10 ftL"ose RAnd from 0-1.5 ft
C".melltt'd fIR frnm 1.5-6 ft"\lIU~ !ll1ud f lun, 0-1. f t
Ccmelll ••d '••wd from 4-10 ftSnnd from 0-5 ftSand :\nd gravel from 5-10 ftLoos", 1'1(11 I from 0-) f tU.-Itd l'illt and Aaod from )-10 ft
!>1Ip:hlly e.'m •••,It"'d !'IIInd Aud RIAvr)40"
41"
40'
40'
35(:
45'
)'):1
33b
36'
40'
3511
35'
45'
»"
31 '
31 b
31 '
31 b
11 b
31 '
31 '
JI b
31d
31d41dI.Sd
10'
0.1103
O. I 22
0.120
0.126
0.125
0.1200.1200.1200.120
0.126
0.120'"
0.120"
0.110"
0.120"
0.1209.
0.\10"
0.126
0.122
0.110"
0.100
0.122
0.125""
0.110"
0.1209.
0.122
0.126
0.110""
3.74
1.43
1.61
7.)3
1.48
0.87
2.IS
5.76
".59
I. 24
1.42
2.13
1•• 19
1.IR
2.76
5.53
2.192.07J.124.63
2.84
1.0
1.21
0.95
0.98
0.11,
10.75
3.68
5.78
l.f,l
2.72
R.74
1.651.163.124.6)
3.85
1.93
1.60
2.92
0.)9
0.57
5.76
0.88
I. 99
1.5J
0.86
0.52
0.93
0.97
OJ.4
0.74
O.RS
I f,.56
0.100.17
0,990.941. 872.78
1.292.0G
0.981.47
1.803.61I. 91J.801.362.B9
2.155,463.996.261.682.631.392.J 7
1.)02.21
1.221.9R
0.41
0.540.610.190.260.300.J60.420.~40.440.540.390.'80.620.68O. J I
0.76
0.670.980.191.1 fI
5.0
NE
NE
7.0
NE
HE
NE
NE
HE
NE
NE
Nt:
NE
NE
Nt:
NE
NE
NE
NE
NE
NE
NE
NE
N~:
NE
N~:
NE
NR
NR
NR
NR
0.130(1.00)0.140
(1.00)
0.130( 1.(0)
1.00
0.104( 1.00)
0.28( 1.00)0.30
(l.OO)0.45
( 1.00)0.30
(1.00)0.52
( 1.00)0.49
(1.00)0.111
(1.00)0.51
( 1.(0)
0.123( 1.00)
O.Olb
( 1.00)0.072
( 1.00)0.046
( 1.00)0.034
( 1.00)0.193
( 1.00)0.100
(1.00)0.140
( 1.00)0.094
( 1.00)0.102
( 1.(0)
72.8(" 1.6)
37.8115.4 )4'1.8
(61.4)
11.8
46.897.8
14/, .8
21.3(2B. B)
9.5(14 .0)
I S.O
(lR.O)21.0
(27 .0)33.1
(40.1)29.5
Ob.5)'&.5
(51.0)50.0
(53.5)
19.1
42.4
(65.1 )
b8.b
(102.7)9J.1
(IB9.1)101.1
(197.1)111.2
(241.2)101. )
(257.J)118.3
(I BI.B)77.4
(lJo.nbl.5
( 96.0)61.J
(104.01114.1
(I Rr,.l)
6.67 20.9
8.0 76.0(II R.B)
8.0 '1.0( 16.b)
R.O '.8.0(6ij.6)
6.67 2B.0131.1)
6.25 12.5(17.0)
6.2') Ifl.O(21.0)
6.2S 24.000.0)
9.36 38.0(41.0)
C).38 34.0
(41.0)9.18 51.0
(\1.5)9.57 54.0
(\7.S)
9.9 72.5( IOb.6)
7.J 96.0(192.0)
7.3 104.0(200.0)
12.0 IlO.I})<250.0)
6.7 104.0( 260.0)
1,.2 120.0(187.5 )
1'1. ') 80.0(Il}.)
6.2 6".0(9B.I)
6.7 6".r)( 10b.1)
11.3 120.0( 192.0)
12.0 46.0(6B.7)
6.0 15.0b.O 12.06.0 101.06.0 148.0
I.':i
1.1
1.5
1.1
1.5
1.5
1.5
1.5
1.5
1.5
1.50
1.66).661.66
l.fl6
1.51
1.60
1.')0
1.60
1.60
1.60
1.60
1.60
9.4
q. e
6.3
IR.O
11.0
I S.O
20.0
11.0
10.0
12.0
10.0
1'•• 6
10.0
15.0
10.0
15.0
10.0
Ptl •• No. 9-H97Tl
Pi If! No. 4-H5311
Pi 1" No. 6-H69T2
Pil •• No. 11-H179rl
Pi I •• No. ~-HMJTJ
I'i 1•• No. l-Hl?TI
Pi Jr No. ~-HR9TI
Pt1e No. 16-H2J2T2
Pile No. I J-H20IT/.
Pile No. 6A
PI I•• No. 10-HI09T1.
Pill!' No. 6C
Pi}@ No. 6R
I'i If! No. 7C
Pi 1•• No. 7ft
rile No. ]A.
Pi If" No. 1:1
t£!..!.lLl9S3 SCE R~rort No. 124I'llI!' No. I 10.0
ML.-.llli~~~!.!!rn'pakt C()II<:ret •• I'f 1(0 10.0
1ii~'N~~4~_~:~~n-Heu T/1.10•0Pile- No. 4-H89T4 10.0Pile No. IO-H43T) 10.0Pill! No. 11-H4313 10.0
NF: •. Not F.nrounten·d. NR - Not Rrrord('d. Nltmh,..rtll fn 1';no!'nthrflt!J ;HI:" (,!'Itlmnt('d valu('<; from l1ormnl17('d rurVf'F1 In FI~urf' '"
Not •• : II) '·l'Illm,.I •• d. b) frot!> dtr"('r IIIhE'lIr '!'tltlll, ,) frnm SI'T v"llIt.l'I. d) from CI'T rl·IHilt". (1.0 kJp _ 4.4S kn. I Font •• 30.48 ,m. I Inch" 2.';4 C!I1. I kRf _ 1.7.9 kplt)

"'<;'i"'~",
rAlH.t: I. Sl:t: t·IU.I' tll'l.lt'!" LIIAII n,:;1 In-SULI:-- - 111t!!.:..!....!J!...!:!~~
OATt::ANO~!..!!!!
PIt:H
DfPTlI
(feet)
t'11::I<
~IUTII
O'ecl
lJl-'LlfT (;At'ACITY
0111 TOTAL NETti ~cl ~VI::N.T.
HEFL.
~C!WUNU
~ATl::R
(f.'eet)
Avt.:RA{;t::
SKIN
t'l<ICTION IH::TA
~ -.1:.LK
i:L
TOTAL
UNIT
~EIGIIT
ili!.L
t:Ht::CTIVE
FRICTIONANGU:
~
t'age 2
SOli. CONOITIONS AND C()MH~NTS
~~~~~!<J~<J Sc.:ond SlHl~'~.!.....:._!l<:HfI T/!:.._~~ll~~~. IbO1'ilt! No. I-H]I'J') 9.0 1.10 5.29 85.0- tH.9
100.0/..lJ J 10.0
(J]].5)5.2 bU.O
(bl.O)
~().) J .110
llo.o 2./J·)
tI.IJU 4.9J
tJ:;0prmtJVI:r:~::JVI~ZtJtJ:;0
=2mZ'"0
Pr;j
SI Uy tl.ttnd. Caat-ln-phce CllnCrete.
Sand with !:obble. aod boulder",
~~<ttlu~r~d granJ(e. The 2 J •.•••:h
dla. b.n pulled out of COllcrele..'fflcture" aandatone. An 8 feo:t
dill. failure "one developed.Poorly celll~nt~d .andatooe. Shear
failure alollg perllluHer of pile
Silty ••and with cobblea. U.ed
Ccuwut slurry tu ralnimhe cavJng.Silty lIIaod. U"ed cement
"llIrry to "Inlmh:e. cavin8.Silty chy & _t lty .an,l. Uud
drlllln8 •••"d bel()w wal.r tabl ••Silty aalloJ ••,ui clay. Uaad
,IIIIIII'K •••",j t.•• luw wat.r tal.I.,Sa 11.1 11110.1 elllY .and. Ua.ddr111111& .ud b~luw water tabla.
Sf lty und and chy. Uaed
drlll1n¥ IImoJ b.,low water tabh.SlJty sand /lild clay. Uaed
drlllJng .ud below water table.
Silty ulld and clay. Ultlddrilling lIIud below Watar tabla.
Stlty und Ind dlY. Uud
drilling IIl1ld below water table.
Silty ",.nd with flouded aand backf11! arolln.)
CHP cuing In 2 It. dl". holo:.Silty lIi1ud. VILrat~d aand backfill
atound CHt' cdalng.
Silty undo Tamped und backfill
aruund CMt' ca.lng.Silty undo Floo,jed .ano.l bdcktlll
arollnd IIIIIOOlh IIte!.!1 cas.ln((.Silty undo Vlbrnted und bd!.:ktlll
aruund sll/ooth ateel caalng.Silty •••••nd. l·ulr~d .and backlill
<arollno.l smouth ateel caaJlIg.S11ly undo IJrllled 2.0 fet!t Jla. hule anti uud
.lIIouth c.alll)( with hol ••a In t".tto. to mdlt •• a bellSilty uno.l. I>rllird 1.6 teet dla. hole au.)
IllIO~d Kruut UIO backf I 11 around IOlliouth caMll1g.Silty undo Ulled drilling l'uJbelow water tabile.
50"
55"
JJb
JJb
3Jb
JJb
3Jb
)Jb
JJb
3Jb
JJb
))b
40J
40b
Jbd
)]oJ
4UJ
45"
42c
,.J
JJd
)ld
Jld
0.110
U.11O
0.110
0.110
0.110
0.110
0.110
0.110
U.IIO
0.110
U.IIO
0.1111"
O.llU
0.1 }OOl
0.14UOI
0.120a.
0.110"
0.110
O.IIU
O.IIU
U.IO'::l
o.ln
0.120a
lo.62 '>.1]
, .'1) t. .bl
1./:I1i 2.141.22 1.45
J.I) ].1~
0.tl6 1.12
O.hS U./:I9
I.]() 2.10
I.n l.tH
0.") 0.b1
0.18 1.2S
lI.l'.! O.~<}0.lJ8 1.21
0.35 O.Slo
O."}U O.lob
O.tI'i 1.1 tI
1 .b4 2.52
().~lo O.tO
u.n 0.))
O.lll I.Ot!
u.)) 0.54
II.'III 0./1
ILlob 'J.loJ
1.151.57
1.102,02J.7blo.71
2.10l.)b
O.7t1
D.b20.59
0.61
0.93
I.OJ
O.l)0.260.120.130.14O.lb
0.410.450.090.110.010.080.190.200.110.110.450.540.380.lo9
u.71
II.).o.ll0. ~ I
0. /191.05
ICJ
ICJ
1.5
1.5
1.5
1.5
I.)
1.5
II
N<
1.5
Nl
10
1.\
1.5
10
1.5
10
15
N<
N<
N<
N<
U.SO
(1.00)O.loO
(1.00)0.25
( 1.00)O.loO
( 1.00)0.10
( 1.00)0.25
( 1.00)0.b5
( 1.00)0.20
( 1.00)a.loO
( 1.00)0.52
(1.00)
U.20(1.00)
I.UUI.b7O.SS
(1.00)O. ]7
(1.00)
O.~O
~ .14O.\J7.1,0O.b~
10.00
U. Sb
( 1.00)0.272.50O. )JQ.lo50.05
(I.oo)U.IO
(1.00)0.97
Ilio.U
'/0.1
]).0
1:I'J.4
(9J.8)17 .1
11.5
(I J..)5.8
(b.5)7.0
( b.O)20.5
(22.5)4.20.])J.2
(J.B)9.2
(9.5)5.2
(b. ])19. )
(2J.])IfI.6
(23.b)
"J.9
IOtI.O
(1)5.5)51:1.tI
(tJ5.8)
1111.0
(i1''!,'I)II'L8
(2UH.I)99.0
b.3B 13.5
(1500)to.25 1.t!
( b.5)b.25 9.0
( 10.0)b.2') 22. ')
(24.5)b.b) b.O
(1.0)b.b3 S.O
0.5)b.b) 11.0
(11.2 )b.o] 1,0
( b.O)
).bt! 21.0(25.0)
6.19 2U.5
(2505)
1.3 90.U tJO.1:I(12500) (1I5.b)
1.9 106.0(110.5)
I.b 100.0lolLO
13,0 10).0100.0
11.9 124.0
(nt!. J)'J, '> 11/1.u
(2"/.6.2)2l.1:1 102.0
I. 51
I.bO
I. 51:1
LbO
I.LO
J. 5/:1
1.'1
1.2)
l.l:IJ
1.10 13.5 120.0125.0
2.0S tI.3 80.045.0
1.15 12.b 1JO.O73.0
1.)1:1
1.) I
1.)\
4.lI
5.0
b. \
n. tJ 1.1)
17.0
21.9
2to.J I. I ~
2l.0
I'HU ~v'H,,-t',dll Vtlrde TII.
f:I.OO 4.21
Pllt: No. 11(; 10.0
t'IIt: No. IUC 10.0
Pile Nu. )-MIJT2
Pile No. lOt! 10,0
Pile No. lit! 10.U
t'1Ie No. IIA IU.U
PI It: No. llo 9.1:1
t'lle No. 12 IU.U
"lIe No. l-HI7T3
"lie Nu. I] tJ.1
Site 47)98
1'11t: Nu. IUA. IO.t)
Site 4]]9A
:illa "IV
Sit", 4n~-I.I''''' A
Site "'21
SI te lo I It)
Site 47J9C
SUI! lo1"]
~!.(h-SCP(~l!!bCf •Site 401 tJ
~!£l!.~Ku-Hlra loma TII.Site !I]-leg C S.~I:I
~!..!.l. 1'::1')] set:: I<t:purt Nu. 12"Pile No.9 10.1
~y-H •• rl:h.-11~~!~r'lno T/I.Sitt! 11 25.0 1.5 Ib.l Ito2.0
Ib4.01)5.4 l.lIO
I.b8Nl I.Jl
I.)t,U.l:ltI 1.41 0.12ua )4J SI Ity .land and clay.
Nt; •. N\,I( t::ncO,Iuntt!rll:'d, NI< •• Nut I<t:curded. NUI~!.t:r •• In paro:nthedll>l art: edtlwdted vu.luell trulD lIoru'dlll-ed curve.:! In .·Ig:urt: 4.
Nutes: a) tltltlmtttcd, b) truIU dltect tiheu.r t •.•••t"'. c) from St'I value •• , 0.1) from CPT result'"' (I.O k1" •. 4.loS kn, I t'out •. 30.41:1 em, I Jnch" 2.54 Cal, I kat _ 41.9 kpa) ~\D

150 TRANSMISSION LINE TOWERS FOUNDATIONS
~ to; 0:. a,';> > ;> ::>
or It' ce 0:
co.::.t!>t!>t
.,r..;;;.;;;.;;;
3-;3-;-;:;-;:;":"C
~::~>->->.>.
..:
~uc
=
~z
~~:~=~=~
..:
•.•...•.:cO•...•NON:::•.•.<:OO.D •.•••:::=:::.00":''':'0'':'0''':
coocoooc2giii;:~- - - •..• - •...
~~~~~~;:~c-oco-oo
coc
co:::o..cc~::. . . . . . . .••.••.....•o.c •....•=~~==co o,o,~=
~
co
~~g~gg~g~g;~~.............=C-:::--N-"'-~=-
~~;::,::;:;:;
oo~='2='o=cc=c2.............o~~ •......:".,••••::c.c-~c•....:::::;.~ ...•."....,. •.•."'..., ••.••.•.•••.•co.::- -- ..., -
=:;x:,~•...••....__.cc..::...:-X
..:.c.:.~o=
c~.;:
~:t;::~~g:::,~~cooo-=oc
...... ---. .
N •.•.••..••.•.~OOc
~:i~:~:i~~
.......................~"':=:r.:":~~=:~:;:~~~~£
........................~O""'OOONC~~~~~~~~0-::;'-0-0-
............................
~o
•••. _~C>"0'0-"'''''c::::::c

TABU: 2.sc~ FIHD UPLIft LOADn:ST RESULTS - BULEO PII::H.S (Cont.)
Avt:RAGI:::
TOTALEHt:CTlHI'II::R
1'11::k.ISHI. UHI tI CA1'ACl1'Yvt:k.T.Gk,UUHOSKIN UNITfRICTIONDHTH
\.IIUTII~loTIl U/ISTOTAl.N!:::TDt::FL.~ATt::Kt'k,l CTIONISI-.:TAK ~t:ICIiTANGLE
DAn: ANLI1.0CATtoN(Fel!!t) lli!.!.L~1:ll!.!f.!l~ 1.!.!!£h1 (t'cet) -1!!lL....i=L1:L .-f!£!..L ~ SOIL CONIHT(ONS AND COI1Ht:NTS
~£r1 I. 1985 HaJ!.unJl:n-Putoria T/L)J<
Site H10-T4 1.11.03.13 ••05.0bl.41.00N<0.992.253.40 0.114 SiltSill!! /'I13-TI
14.01.03.61.056.049.40.02NE0.4) 0.12630bSilt(166.0)
( 161.4)( 1.00) 1.411.512.71)lb
S(te HI4-Tlo 14.02.03.01.074.067.40.13N<0.66 0.115Silt( 129.6)
(12), 2)( 1.00) 1.201.492.4931 b
S1tl: H20-T)14.01.03.11.074.061.41.00N<0.&00.611.34 0.100 SUt
SUe /'I24-r26.52.03.54.340.0J6.00.69NE0.54 0.11433b
Sihy und with cobblu(40.4)
(36.4)( 1.00) 0.551.12Ion)2b
51 t~ H21-TI 8.252.04.04.140.036.11.00NE0.521.111.16 0.114 Silty und with cobbl ••46.0
1.600.61
Ht: •• Not t:ncountored, NR •• Hot Rl:!cord~d. NUlllbt:ul in parenthl:llill lire e,tillilHed YMluea frolll normalized curveM in Fll1ure 4.
Note,.; a) t:llltim.l.rad, b) troll direct aht::ilT talllta. c) Crom C1'T raauit •• (1.0 kip" 4.45 kN. I Foot •• 30.48 cm, I Inch" 2.54 em, I kat •. 47.9 kh)
KTucker02: nptl3
TAbU:: J. SCt: fino Unin LOADn:sl' kt:SUI.TS - URlvt:N PIU:S
AVt:RAGt:TOTALEfFJ::CTIvt:pILt:
p(I,t: upLin CAPACITYVt:kT.GttulJNOSKIN UNITfRICTtoN()HTU
WIUTU0/.TOTAI.N£TDEn.WAHNt'k ICtI ONtlt:TAK WI:::ICUTANCLEOATt: ANI) LOCATION
i!::!.ill('·ect)1:2.illlli ~ ~ 1ill!l.----1!!.1L....i=LAfu.!..L~ SOIL CONUITIONS ANI>COHHt:NTS
~ 19JO Unllond BeAch Gener.llng Stilt Ion (kilyUlund Sleel Slep-TapereJ Pll ••.lI))1b
PUe No. I 54.01.1146.6141.0139.60.639o. 7~ 0.122Sand and .tlt.Predrill1nl tu )4 tut dal'th.(112.6)
(167.5)( 1.00) (0.69)0.420.5531b
Pile No.2 3').01.2830.4110.0164.90.9J91.050.630.840.122 Sand and lIih.Predrllled to )8 fut depth.Huch-September, 1981 I>eveu-Palo VerdI: T/L (Concrete Piles) 40<
Stte 473IA )H.O ) .17 sq.32.6120.011).80.8015O.b40.310.~40.110· S.nd and .thy aand.NO predrflHna:.120.0
1.20Site 47)lb
40.01.17 Mq.34. )150.0IloJ.90.1015O. J7 0.1101:140<Sand and 8tlt)' .and.No predrUl1na.(254.2)
(246.1 )( 1.00) I.))0.740.66Site 4135
40.01.17 .••q.34.390.063.90.10150.45 0.110'"40<Sand ••.nd IIllly lIand.No predrillinjl.(152.5)
(14b.lo)( 1.(0) D.H0.550.66
-Fn: ..~~:r rl1~L1!!!.!.!:.!.~5ij:f~!Ii!!.,~ir;~:~~1:~.!l!.jTI::;1"/1(" ~ :b:pcC"H' r~::~ 1'1190U.'.ItI
0.110))bSilty unal Alld 11lIt.
( 230.9)(224.0)( 1.00) 0.9b0.)1O.JI) I'udrllhd to 42 hilt d.pth.
Pile No.349.)1.1 J ilq.42.4215.0208.10.66100.90 0.110))"
SlJty und and IIlit.(226.1 )
(221.6)( 1.00) 0.960.520.80 Pudrtlled to 39 het dapth.Pile No.5
56.01.17 IiIq.49.7212.0203.60.65100.15 0.110))bSilty •• nd and ,ilt.(2)5.5)
(217 .J)( 1.00) 0.640.400.0233b
Predrll1ed to ~2 feet depth.
Pile No. 751.01.11 IIIq.46.9210.0201.70.59100.16 0.110Silty aand and .Ilt.
(236.6)(230.3)( 1.00) 0.660.~20.65 Pr.drilhd to 40 fut depth.
July. 1960 WellltmlUliter HUlrolo~y'tdb (Cuncrt.'te 1'llell) ))bPUe No. I 26.71.00 .q.26.770.066.4O.9~140.560.~3O.bb0.105 Silty lIand and ailt.No predrlll1ng.
PI Ie No.234 .01.00 8q.34.0101.091.00.99140.710.410.120.1053)b
Silty •• nd and at It.Predrilled to 2) feet depth.PI Ie No.3
31.11.00 8q.31.7136.01)).71.03140.690.540.630.105))bStlty und and .Ilt.Pr.dr1l1ed to 30 feet depth.
............•••.•.•.........••••..
o::0FrtT1o(/J::r:>::J(/J
~oo::0
=2tT1Z'l::J
FtT1(/J
NE •• Nut Encountered, Hit • Not Recorded. Numbers tn p.lHenthealll esthlated valuell from normalized curVeM in Figure 4.
Not~y: a) utimated, b) frOID direcl aha ••r le&tll, c) froll! CPT (aIlU!tV. (1.0 kip •• 4.~5 kH, 1 foot - 30.48 cm, I tnch • 2.~4 CII, I kilt •• ~7.9 kl'a)
VI
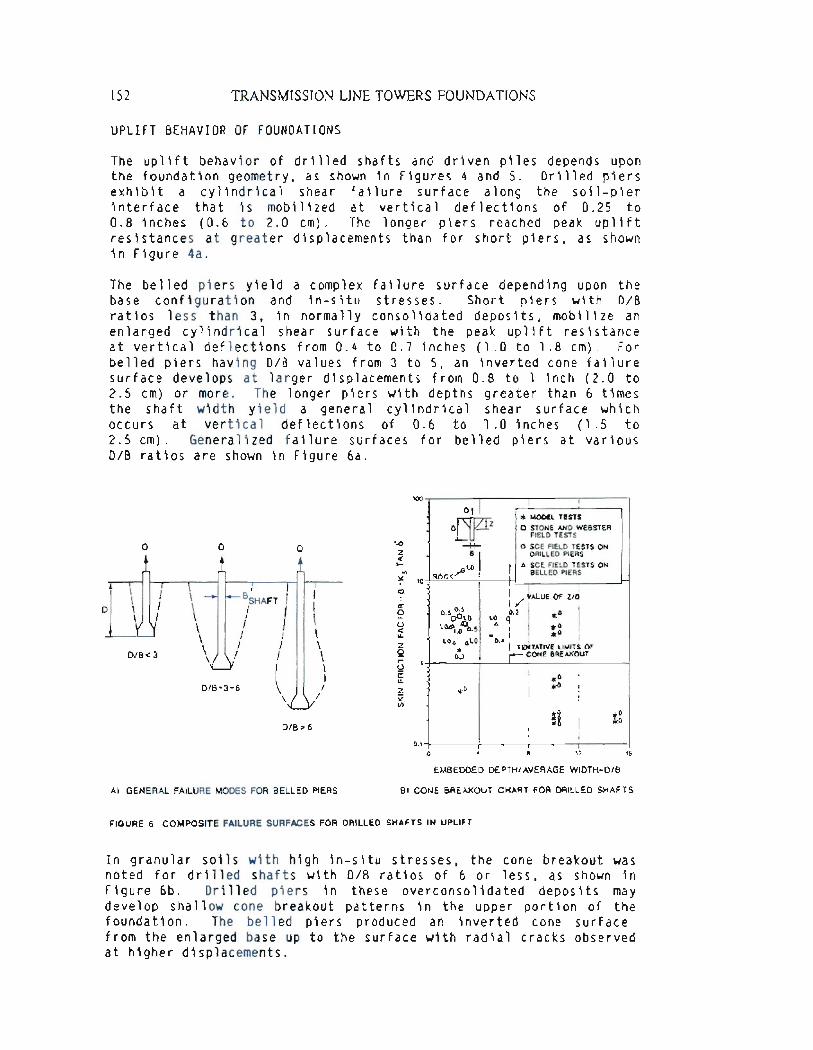
152 TRANSMISSION LINE TOWERS FOUNDATIONS
UPLIFT BEHAVIOROF FOUNDATIONS
The uplift behavior of drilled shafts and driven piles depends uponthe foundation geometry, as shown in Figures 4 and 5. Drilled piersexhibit a cylindrical shear failure surface along the soil-pierinterface that is mobilized at vertical deflections of 0.25 to0.8 inches (0.6 to 2.0 cm). The longer piers reached peak upliftresistances at greater displacements than for short piers, as shownin Figure 4a.
The belled piers yield a complex failure surface depending upon thebase configuration and in-situ stresses. Short piers with D/Bratios less than 3, in normally consolidated deposits, mobilize anenlarged cylindrical shear surface with the peak uplift resistanceat vertical deflections from 0.4 to 0.7 inches (1.0 to 1.8 cm). Forbelled piers having D/B values from 3 to 5, an inverted cone failuresurface develops at larger displacements from 0.8 to 1 inch (2.0 to2.5 cm) or more. The longer piers with depths greater than 6 timesthe shaft width yield a general cylindrical shear surface whichoccurs at vertical deflections of 0.0 to 1.0 inches (1.5 to2.5 cm). Generalized failure surfaces for belled piers at variousD/B ratios are shown in Figure oa.
0.1
100
Q
D/B=3-6
Q -.0
Z«I-'"r --
~
II
,Q
II
Ia:
I
\0
l-I()
I
«/
\1L
/
z
\0
I\
i=()
\
J c:
\1
1L
\/ z
52CI)
D/B > 610
at II!
* MODEL TESTSDlJP
o STONE AND WEBSTERFIELD TESTS-H-o SCE FIELD TESTS ON
~1·:1
DRILLED PIERS
!
" SCE FIELD TESTS ON
ROCK
BELLED PIERS
I
I I
I /" VALUE OF ZlDI I '0.50.5
0.2 I *0 I
001.0 1.0 q I1·~.~0.5
b *0* I *o!1.06 ,61.0 0.4 I TEHTATIVE lIMIT~ OF*0.3
I r CONE BREAKOUT
i ",0*0
*0
~8
19
12 16
EMBEDDED DEPTHI AVERAGE WIDTH-D/B
A) GENERAL FAILURE MODES FOR BELLED PIERS B) CONE BREAKOUT CHART FOR DRILLED SHAFTS
FIGURE 6 COMPOSITE FAILURE SURFACES FOR DRILLED SHAFTS IN UPLIFT
In granular soils with high in-situ stresses, the cone breakout wasnoted for drilled shafts with D/B ratios of 6 or less, as shown inFigure ob. Drilled piers in these overconsolidated deposits maydeve lop sha 11ow cone breakout patterns in the upper porti on of thefoundati on. The belled pi ers produced an inverted cone surfacefrom the enlarged base up to the surface with radial cracks observedat higher displacements.
DRILLED SHAFrS AND DRIVEN PILES
Driven piles with embedded depths up to 50 feet required larger
displacements to obtain the peak uplift resistance. The normal1zed
curves in Figure 5 show the soil-pile failure surface along the
perimeter of the driven piles was fully mobilized at vertical
deflections of 0.4 to 1 inch (1.0 to 2.5 cm) or more based on theD/B ratio.
FACTORS INFLUENCING UPLIFT CAPACITY
The uplift capacity of drilled shafts and driven piles in granular
materials is influenced by the shear strength and stress history of
in-situ materials, foundation geometry, construction methods and
other parameters described in detail by Kulhawy and others (3, 5,
7, 8). The expanded general equation for side resistance is
expressed as:
153
with fs = (ovl)(Ks)(tan &')
(3 )
( 4)
wh ere K
original
vertical
friction
= operative coefficient of horizontal soil stress, Ko
in-situ coefficient of horizontal soil stress, 0v'
effective stress and &' = effective stress angle offor soil-shaft interface.
The skin friction factor, Bs, is the single parameter which
incorporates these factors with the effective overburden pressure by
the following relationship:
( 5)
Shear strength - The shear strength of the granular soils were
obtained from drained direct shear tests on selected samples as well
as correlations with field SPT and CPT results (3, 11). The
effective stress friction angle, <1>', was selected for each site
and used in evaluating the coefficient of horizontal soil stress,
Ks, using the following relationship:
Ks = Bs/tan &' = fs/(ov')(tan &') (6 )
A detailed study (4) of soil-concrete interfaces has shown that with
normal cast-in-place concrete placed yielding a rough interface,
0' ::: <1>'. The use of steel casing reduces the roughness along
the soil-shaft interface with the following results from Downs and
Chieruzzi (1) are given in Table 4.
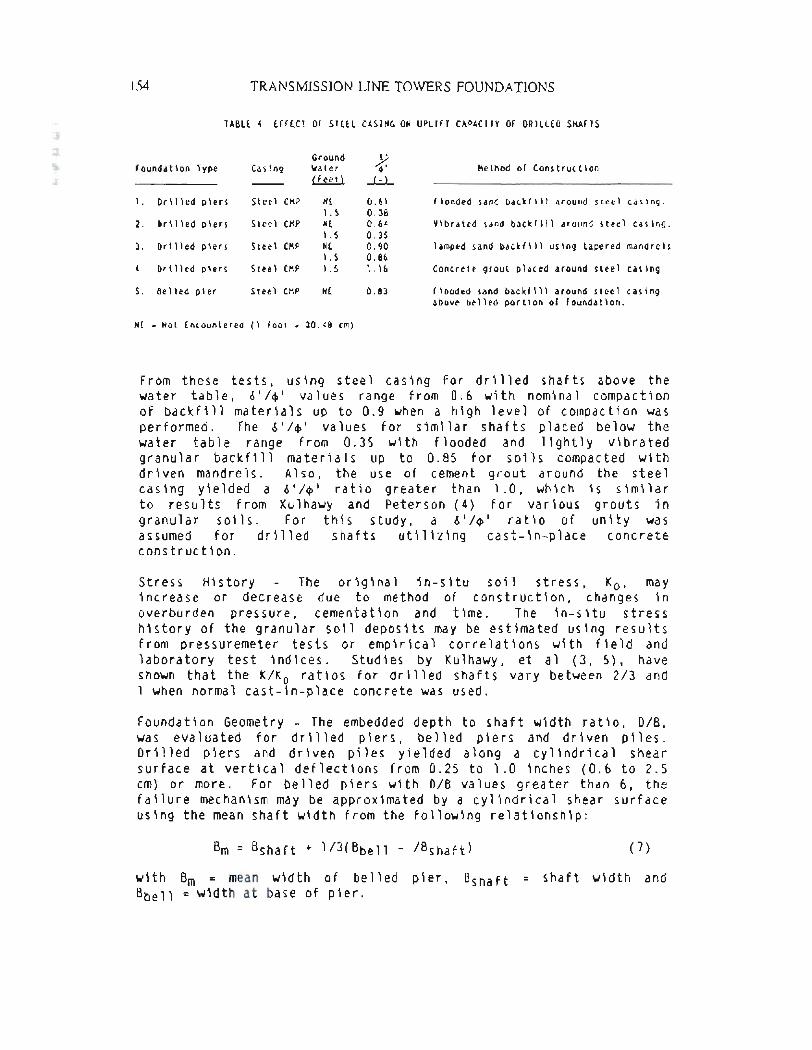
154 TRANSMISSION LINE TOWERS FOUNDATIONS
TABLE 4 EFFEC1 OF STEEL CASING ON UPLIFT CAPACITY OF DRILLED SHAFTS
Ground6'
FoundatIon Type
CasIngWater~lli.ill
--L:.L
1.
DrIlled pIers Steel CMPNE0.& 1
1.5
0.38
2.DrIlled pIers Steel CMPNEO. &4
1.5
0.35
3.
DrIlled pIers Steel CMPNE0.90
1.5
0.8&
4.
DrIlled pIers Steel CMP1.51.10
5.
Belled pIer Steel CMPNE0.83
NE = Not Encountered (1 foot = 30.48 cm)
Method of ConstructIon
Flooded sand backfIll around steel casIng.
VIbrated sand backfIll around steel casIng.
1amped sand backfIll usIng tapered mandrels
Concrete grout placed around steel casIng.
Flooded sand backfIll around steel casIng
above belled portIon of foundatIon.
From these tests, using steel casing for dri lled shafts above the
water table, 6'/¢' values range from 0.6 with nominal compaction
of backfill materials up to 0.9 when a high level of compaction was
performed. The 6'/¢' values for similar shafts placed below the
water table range from 0.35 with flooded and lightly vibrated
granular backfill materials up to 0.85 for soils compacted with
driven mandrels. Also, the use of cement grout around the steel
casing yielded a 6'/¢' ratio greater than 1.0, which is similar
to results from Kulhawy and Peterson (4) for various grouts in
granular soils. For this study, a 6'/¢' ratio of unity wasassumed for drilled shafts utilizing cast-in-place concrete
construction.
stress History - The original in-situ soil stress, Ko, mayincrease or decrease due to method of construction, changes in
overburden pressure, cementation and time. The in-situ stress
history of the granular soil deposits may be estimated using results
from pressuremeter tests or empirical correlations with field and
laboratory test indices. Studies by Kulhawy, et al (3,5), have
shown that the K/Ko ratios for dri lled shafts vary between 2/3 and1 when normal cast-in-place concrete was used.
Foundati on Geometry - The embedded depth to shaft wi dth rati 0, D/B,
was evaluated for drilled piers, belled piers and driven piles.
Drilled piers and driven piles yielded along a cylindrical shearsurface at vertical deflections from 0.25 to 1.0 inches (0.6 to 2.5
cm) or more. For belled piers with D/B values greater than 6, the
failure mechanism may be approximated by a cylindrical shear surface
using the mean shaft width from the following relationship:
Bm = Bshaft + 1/3(Bbell - /Bshaft)
with Bm = mean width of belled pier, Bshaft
Bbell = width at base of pier.
( 7)
shaft width and

DRILLED SHAFfS AND DRIVEN PILES
Construction Methods - Drilled shafts placed below the groundwater
table were constructed using drilling fluids to minimize caving and
sloughing of the granular soils. A thin film or thick cake of
slurry bui lds up along the soi l-shaft interface whi ch reduces the
uplift capacity of the foundation. Previous studies produced KIKoratios of 2/3 for this type of construction. The 1nfluence of steel
casing and groundwater also reduced the uplift capacity of drilledshafts.
EVALUATION OF SIDE RESISTANCE
The load test results were evaluated with field exploration records
and laboratory test data using the simplif1ed side resistance
relationship:
155
Qs = oJ~As)(av')(Ks)(tan ~')dz
and Qs = I1/2 B D (av') (Ks) (tan ~')
for dr11led shafts with KIKo = 1 and o'/~' = 1.
square piles, the constant I1 should be replaced
f1eld load test results. The mean width from eq.
belled piers.
(8 )
(9)
For concrete
by 4.0 to evaluate7 was uti11zed for
Average Skin Friction, fs - The side resistance, Qs, was divided
by the embedded surface area, As, assuming a cylindrical shear
surface for drilled shafts and driven piles to obtain the average
skin friction value, fs. The average skin friction 1ncreases withhigher shear strengths, as shown in Figure 7a.
20 , , 20FOUNDATION TYPE
o c••..u:o II'IE" MOVEWATE" TMl.E
u:10~ • cwu.'D •••• BELOW
WATER TMLEen8 6 BEUED "'fR
::;1 a DRIVEN P'llE
'"
6
IZ
4
Q I-0a: 2u.. z52en 1.0w 0.8CD « 0.6a: w~ 0.4
0.2
25354555
EFFECTIVE FRICTION ANGLE-¢' (DEGREES)
u: 10en
8::;
$!
6
I4Z
QI-Qa:2u.. z52
en 10w .CD 0.8«a: 0.6w~ 0.4 LOWER I
DRILLE0.2
I
1
2468 10 2040
EMBEDDED DEPTHI AVERAGE WIDTH = D/B
FIGURE 7 VARIATION OF AVERAGE SKIN FRICTION, fs, WITH SHEAR STRENGTH AND
FOUNDATION GEOMETRY
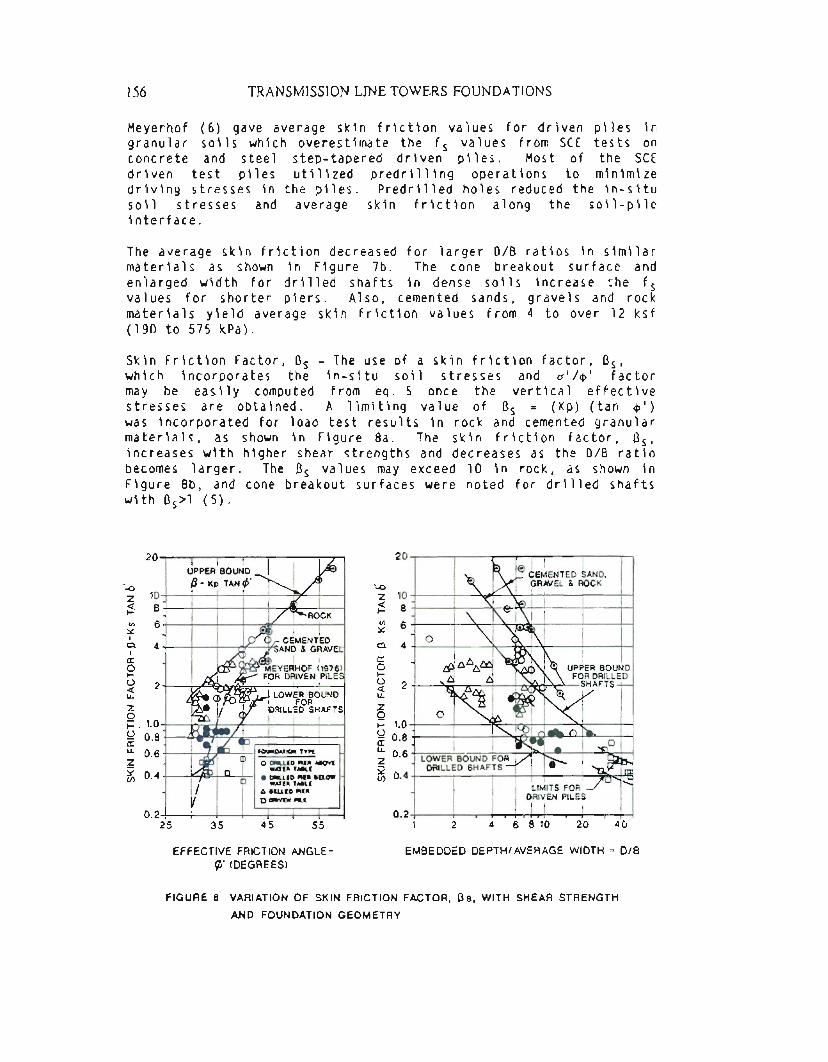
156 TRANSMISSION LINE TOWERS FOUNDATIONS
Meyerhof (6) gave average skin friction values for driven piles in
granular soils which overestimate the fs values from SCE tests onconcrete and steel step-tapered driven piles. Most of the SCE
driven test piles utilized predrilling operations to minimize
driving stresses in the piles. Predrilled holes reduced the in-situ
soil stresses and average skin friction along the soil-pileinterface.
The average skin friction decreased for larger D/B ratios in similar
materials as shown in Figure 7b. The cone breakout surface and
enlarged width for drilled shafts in dense soils increase the fsvalues for shorter piers. Also, cemented sands, gravels and rock
materials yield average skin friction values from 4 to over 12 ksf
(190 to 575 kPa).
Skin Friction Factor, Bs - The use of a skin friction factor, Bs,
which incorporates the in-situ soil stresses and a'/¢' factor
may be easily computed from eq. 5 once the vertical effective
stresses are obtained. A limiting value of Bs = (Kp) (tan ¢')was incorporated for load test results in rock and cemented granular
ma teria 1s, ass hown in Fig ure 8a . The ski n friction fact 0 r, B s 'increases with higher shear strengths and decreases as the D/B ratio
becomes larger. The Bs values may exceed 10 in rock, as shown inFigure 8b, and cone breakout surfaces were noted for drilled shafts
with Bs>l (5).
EMBEDDED DEPTHI AVERAGE WIDTH = D/B
20 ,III
UPPER BOUND-..0
10 I{3 - Kp TAN ¢/
,I,z 81II« f-
r/)
6:x:: "e!).
4I c:0f-U 2« u..z0t= . 1.0Q0.8c: u.. 0.6z 1~!DT I 0 =-~:DT~~ AaOVE
~ (/)0.4 I n • DAIlLED "'EIII BElOW
, I WATE" TABLE6. BELLED"fRD [AVEN P"M.E
0.2 !
,IIL-I ,,,
25354555
EFFECTIVE FRICTION ANGLE-¢' !DEGREES)
20
-..0Z 10~ 8 1~ 6I
?- 4c:of-~ 2u..
zQ
o 1.0a: 0.8u..
z 0.6~(/) 0.4
0.21
o
01 iI
LOWER BOUND FORDRILLED SHAFTS
ILIMITS FOR
DRIVEN PILES
II I I I
2 4 6 8 10 20
FIGURE 8 VARIATION OF SKIN FRICTION FACTOR, 115, WITH SHEAR STRENGTH
AND FOUNDATION GEOMETRY
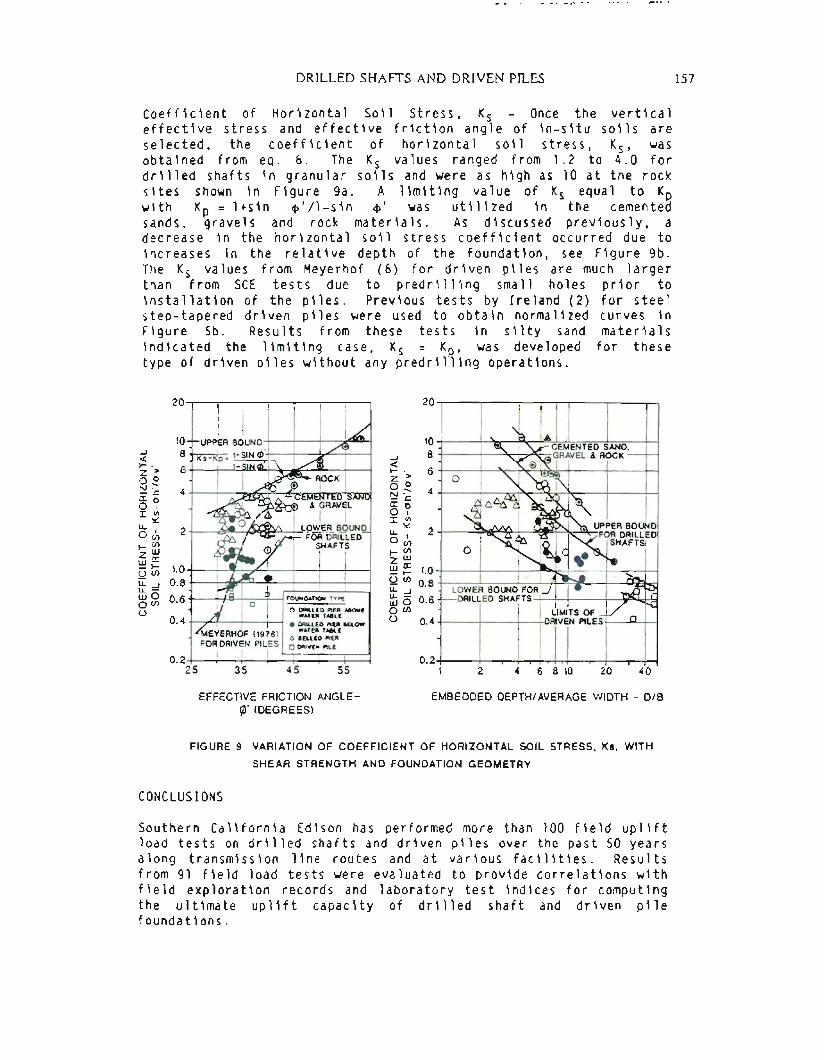
DRILLED SHAFTS AND DRIVEN PILES 157
Coeff1c1ent of Hor1zonta1 S011 Stress, Ks - Once the vert1ca1effect1ve stress and effect1ve fr1ct10n angle of 1n-situ s011s areselected, the coeff1c1ent of hor1zonta1 s011 stress, Ks, wasobta 1ned from eq. 6. The Ks va 1ues ranged from 1.2 to 4. a fordr111ed shafts 1n granular 50115 and were as h1gh as 10 at the rocksites shown in F1gure 9a. A 11mit1ng value of Ks equal to Kpwith Kp = 1+s1n <p'/1-s1n <pI was ut111zed 1n the cementedsands, gravels and rock mater1a1s. As d1scussed prev10us1y, adecrease in the hor1zonta1 soil stress coeff1cient occurred due toincreases in the re1at1ve depth of the foundat10n, see F1gure 9b.The Ks values from Meyerhof (6) for dr1ven pl1es are much largerthan from SCE tests due to predri111ng small holes pr10r toinstallat10n of the pl1es. Previous tests by Ireland (2) for steelstep-tapered driven pl1es were used to obtain normalized curves inFigure 5b. Results from these tests 1n silty sand mater1als
ind1cated the 11miting case, Ks = KR' was developed for thesetype of dr1ven piles w1thout any predr1111ng operations.
FOUNDATION TYP"E
o DAH.LED "'fA ABOVEWATER TMlE
• DRILLED "'EA BELOWWATER TASLE
Q BELLED flfER
a DRIvEN P'lLE
10
8
6
40
UPPER BOUNDFOR DRILLED
ISHAFTSI
te I~
I
!
lot.CEMENTED SAND.GRAVEL & ROCK
i3 i~(1 I I
_. ]
j
o
0.2.1
20
..J«i-z >o ~ 4N--.c0: 0OuI'"
:.::2LL,OU)i-U)Zw~ (: 1.0~ U) 0.8tt :::! 06w 0 .0U)() 0.4
5545
20
10
..J
8« i-- 6z >00~=:: 40:0- 0".,... '"~:.::LL,
2OU)i-U)z~w~-i-
1.0~U)LL..J
0.8LL- wO 0.60U) () 0.4, / I
IMEYERHOF (1976)FOR DRIVEN PILES0.2 I
III,,
2535
EFFECTIVE FRICTION ANGLE
¢' (DEGREES)
EMBEDDED DEPTHI AVERAGE WIDTH = D/B
FIGURE 9 VARIATION OF COEFFICIENT OF HORIZONTAL SOIL STRESS, Ks, WITH
SHEAR STRENGTH AND FOUNDATION GEOMETRY
CONCLUSIONS
Southern Ca1iforn1a Edison has performed more than 100 field upliftload tests on drilled shafts and driven p11es over the past 50 yearsalong transmission line routes and at various facilities. Resultsfrom 91 field load tests were evaluated to provide corre1at10ns withfield exp10rat10n records and laboratory test indices for comput1ngthe ultimate uplift capac1ty of drilled shaft and dr1ven pilefoundations.
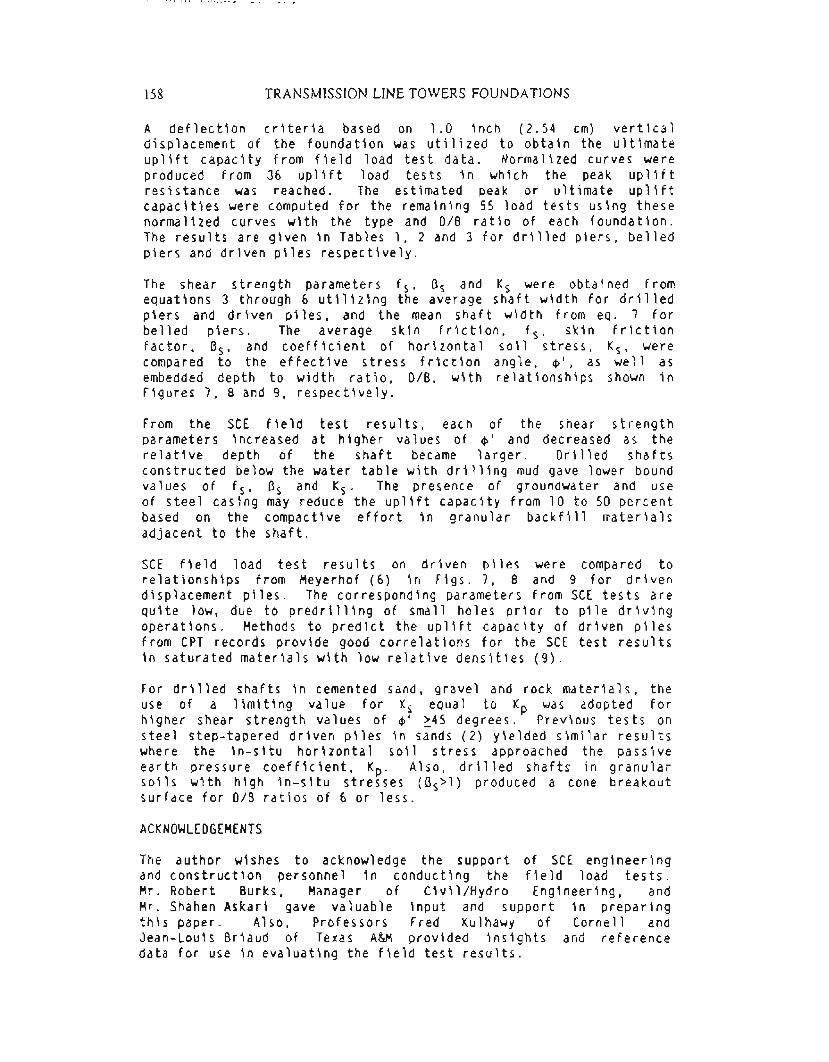
158 TRANSMISSION LINE TOWERS FOUNDATIONS
A deflection criteria based on 1.0 inch (2.54 cm) vertical
displacement of the foundation was utilized to obtain the ultimate
uplift capacity from field load test data. Normalized curves were
produced from 36 uplift load tests in which the peak uplift
resistance was reached. The estimated peak or ultimate uplift
capacities were computed for the remaining 55 load tests using these
normalized curves with the type and D/B ratio of each foundation.
The results are given in Tables 1, 2 and 3 for drilled piers, belled
piers and driven piles respectively.
The shear strength parameters fs, Bs and Ks were obtained from
equations 3 through 6 utilizing the average shaft width for drilled
piers and driven piles, and the mean shaft width from eq. 7 for
belled piers. The average skin friction, fs' skin friction
factor, Bs, and coefficient of horizontal soil stress, Ks, were
compared to the effective stress friction angle, 4>', as well as
embedded depth to width ratio, D/B, with relationships shown in
Figures 7, 8 and 9, respectively.
From the SCE field test results, each of the shear strength
parameters increased at higher values of 4>' and decreased as the
relative depth of the shaft became larger. Drilled shafts
constructed below the water table with drilling mud gave lower bound
values of fs' Bs and Ks. The presence of groundwater and use
of steel casing may reduce the uplift capacity from 10 to 50 percent
based on the compactive effort in granular backfill materials
adjacent to the shaft.
SCE field load test results on driven piles were compared to
relationships from Meyerhof (6) in Figs. 7, 8 and 9 for driven
displacement piles. The corresponding parameters from SCE tests are
quite low, due to predrilling of small holes prior to pile driving
operations. Methods to predict the uplift capacity of driven piles
from CPT records provide good correlations for the SCE test results
in saturated materials with low relative densities (9).
For drilled shafts in cemented sand, gravel and rock materials, the
use of a limiting value for Ks equal to Kp was adopted forhigher shear strength values of 4>' ~45 degrees. Previous tests on
steel step-tapered driven piles in sands (2) yielded similar results
where the in-situ horizontal soil stress approached the passive
earth pressure coefficient, Kp. Also, drilled shafts in granularsoils with high in-situ stresses (Bs>l) produced a cone breakoutsurface for D/B ratios of 6 or less.
ACKNOWLEDGEMENTS
The author wishes to acknowledge the support of SCE engineering
and construction personnel in conducting the field load tests.
Mr. Robert Burks, Manager of Civil/Hydro Engineering, and
Mr. Shahen Askari gave valuable input and support in preparing
this paper. Also, Professors Fred Kulhawy of Cornell and
Jean-Louis Briaud of Texas A&M provided insights and reference
data for use in evaluating the field test results.

DRILLED SHAFTS AND DRIVEN PILES
REFERENCES
159
1. Downs, D. 1. andFoundations,lI JournalPaper 4750, April, 1966.
Chieruzzi,of Power
R., IITransmission TowerDivision, ASCE, No. 92,
2. Ireland, H. 0., IIPulling Tests on Piles in Sand,1I Proceedingsof the 4th International Conference on Soil Mechanics and
Foundation Engineering, Vol. 2, London, England, 1957.
3. Kulhawy, F. H. and Peterson, M. S., IIBehavior of Sand-ConcreteInterfacesll, Proceedings of the 6th Pan American Conference onSoil Mechanics and Foundation Engineering, Vol. 2, Lima, Peru,1979.
4. Kulhawy, F. H., Trautmann, C. H., Beech, J. F., O'Rourke,T. 0., McGuire, W., Wood, W. A. and Capono, C., IITransmissionLine Structure Foundations for Uplift-Compression Loading,1IReport EL-2870, Electric Power Research Institute, Palo Alto,California, February, 1983.
5. Kulhawy, F. H., IIDrained Uplift Capacity of Drilled Shafts,1IProceedings of the 11th International Conference on SoilMechanics and Foundation Engineering, San Francisco,California, August, 1985.
6. Meyerhof, G. G., IIBearing Capacity and Settlement of PileFoundationsll, Journal of the Geotechnical Engineering Division,ASCE, GT3, March, 1976.
7. Reese, L. C., Touma, F. T., and O'Neill, M. W., IIBehavior ofDrilled Piers Under Axial Loadingll, Journal of the GeotechnicalEngineering Division, ASCE, Vol. 102, No. GTS, May 1976.
8. Stas, C. V. and Kulhawy, F. H. IICritical Evaluation of DesignMethods for Foundations Under Axial Uplift and CompressionLoading, II Report EL-3771, Electric Power Research Institute,Palo Alto, California, November, 1984.
9. Tucker, K. 0., IIUplift Capacity of Pile Foundations Using CPTDatall, Proceedings of the In-Situ '86 Conference, GeotechnicalSpecial Publication No.6, Blacksburg, Virginia, June, 1986.
10. Ves i c, A. S., IITests on Instrumented Pil es, Ogeechee Ri verSite, II Journal of the Soil Mechanics and Foundations Division,ASCE, Vol. 96, No. SM2, Proc. Paper 7170, March, 1970, pp.561-584.
ll. Vi llet, W., and Mitchell, J. M., IICone Resistance, RelativeDensity and Friction Anglell, Proceedings of the ASCE Session onCone Penetration Testing and Experience, St. Louis, Missouri,October, 1981.

Foundation Design for Directly Embedded Single Poles
by Richard A. Bragg1 2Anthony M. DiGioia, Jr., Fellow ASCE
Vito J. Longo3
Abstract
An improved model has been developed for foundation analysis/designof directly embedded, single-pole electric transmission structures
subject to high overturning moments. The model uses a multi-spring,nonlinear subgrade modulus approach to predict the load-deflection
response and ultimate capacity of direct embedment foundations placedin multi-layered subsurface conditions, and with uniform or multi
layered annulus backfill. To verify the predictive capabilities ofthe model, ten full-scale lateral load tests were conducted on
directly embedded transmission poles. The development of the subgrademodulus and bearing capacity expressions are described. Comparison ofthe field load tests, and model predictions of the ultimate overturn
ing moment capacity and load-deflection behavior are presented.
Introduction
Directly embedded single wood poles have long been used by theelectric utility industry in the construction of distribution and
transmission lines. However, wide spread use of directly embedded
wood, concrete or steel single poles for the construction of moreheavily loaded transmission lines has, in general, been limited. This
is mainly due to a lack of basic knowledge concerning the performanceof the directly embedded poles subjected to a high overturning moment
at the ground line and due to the lack of a design methodology for
computing the ultimate capacity and load-deflection behavior of theembedded portion of the transmission pole which has been verified withwell-documented load test data.
This paper presents an analytical model suitable for the analysisand design of direct embedded pole foundations subject to lateral
loads (combination of moment and shear). The model was developed by
modifying the four-spring nonlinear subgrade modulus model for drilledshaft foundations developed for the Electric Power Research Institute
1project Engineer, GAl
Monroeville, PA 15146.
2president, GAl Consultants, Inc., 570 Beatty Road, Monroeville, PA15146.
Consultants, Inc. , 570 Beatty Road,
3project Manager, Electric Systems Division, Electric Power Research
Institute, 3412 Hillview Avenue, P.O. Box 10412, Palo Alto, CA 94303.
160

DIRECTLY EMBEDDED SINGLE POLES 161
(EPRI) under Project RP-1280-1 (1) and described by DiGioia, Davidson,
and Donovan (2). A field testing program, consisting of 10 full-scale
foundation load tests in soil, was conducted to test the predictive
capabilities of the modified model. The development of the directembedment foundation model and comparisons of model predictions withthe observed field load test results are presented.
Review of the Four-Spring Drilled Pier Model
Direct embedment foundations may be described as a cylindrical
shaft type foundation constructed by augering a hole in the ground,inserting the transmission pole, and backfilling the annulus between
the surface of the pole and the in-place soil. Due to the similarityin geometry, loading conditions, and the mode of resisting applied
loads to drilled shaft foundations used to support single pole typetransmission structures, the four-spring nonlinear subgrade modulusdrilled shaft model developed for EPRI Project RP-1280-1 (1) wasselected as a starting point for the development of a direct embedment
foundation design/analysis model.
Referring to Figure 1, the four-spring subgrade modulus modelcharacterizes the soil-foundation interaction through the use of four
discrete sets of springs. Lateral translational springs are used to
characterize the lateral force-d~placement response of the soil.Vertical side shear springs are used to characterize the verticalshear stress-vertical displacement response at the perimeter of the
pier. A base translational spring is used to characterize thehorizontal shearing force-base displacement response, and a base
moment spring is used to characterize the base normal force-rotation
response. Figure 2 shows schematic representations of the varioussprings and gives expressions for the corresponding subgrade moduli.
Since, the load-deflection relationship for laterally loaded
drilled shafts 'is highly nonlinear, the relationship between lateralpressure and deflection was modeled using a variant of the so-called
p-y curves developed by Reese (3) and his coworkers at the Universityof Texas. Referring to Figure 2a, the resultant nonlinear p-y
expression for the lateral translational spring is (1):
( )0.5
2khy
p = 0.6 Pult Pul~
wher: Pult is the' -ultimate lateral bearing pressurelateral subgrade modulus. The other three springs ofmodel were modeled as elastic-perfectly plasticFigures 2b, 2c, and 2d.
(1)
and kh is thethe four-springas shown in
The ultimate lateral capacity for the four-spring model wasdetermined using a methodology similar to that proposed by Ivey (4),
but incorporating the ultimate lateral bearing capacity theory of
Hansen (5) to determine-the ultimate lateral pressure, Pult' in theabove p-y expression. The ultimate vertical side shear moment isderived from the vector resultant of vertical and horizontal shearing
stresses corresponding to the fully mobilized shear strength at the

162 TRANSMISSION LINE TOWERS FOUNDATIONS
'LA TERAL .. 'y- TRANSLA TIONA!..
SPRING (typ)
-VERTICAL SIDESHEAR MOMENT
. SPRING (typ)
..CENTER OF ROT ATION...................................................................................................................................................................... - .s·"A:t; E" M'6tie Nt"·S PR i"N'"....................................................................................
Hun~i~kb -:BASE SHEAR
TRANSLA TIONAlSPRING
FIGURE l.--Four Spring Subgrade Modulus Model
P
Pu1t 1--1 (. \ -042 Jktt=\fJ (O/B)
y
(A) LATERAL SPRINGS
(C) BASE SHEAR SPRING
re= 0.55 E BI .
(B,) VERTICAL SIDE SHEAR SPRING
I'r 0.4Uk8b = 0.24 E B(D/B)
(D) BASE MOMENT SPRING
FIGURE 2.--Schematic Representation of Springs

DIRECTLY EMBEDDED SINGLE POLES 163
pier-soil interface. The ultimate shearing force and moment at the
base of the shaft were determined from an equation of vertical
equilibrium combined with assumptions concerning the percentage of thebase in contact with the subgrade and the distribution of the basenormal stresses (1).
The model described above was incorporated into a computer program
PADLL (~ier Analysis and Design for Lateral Loads) (1) which has geotechnical design and analysis capabilities for drilled shaftssubjected to high overturning moments and lateral loads and embedded
in multi-layered soil profiles.
Proposed Model for Direct Embedment Foundations
The major difference between the geometry of direct embedment
foundations and drilled shaft foundations is the presence of thebackfilled annulus surrounding the perimeter of the direct embeddedstructure. The influence of this material on the stiffness and ulti
mate capacity of the lateral translational spring and the vertical
side shear moment spring must be considered when the strength anddeformation properties of the backfill differ from those of the sur
rounding soil. Consequently, the four-spring drilled pier model was
modified for direct embedment foundations by adding two addi tionalspring sets. A lateral translational spring and a vertical side shearmoment spring modeling the load-deflection characteristics of the
annulus backfill were added in series to the previously existinglateral translational spring and vertical side shear moment springs ofthe drilled shaft model.
The relative contributions of the four springs to the load
resistance of 14 prototype drilled shafts tested during EPRIProject 1280-1 were determined (1). Based on the results of this
study, the base shear and base moment springs were determined toprovide only a relatively_small contribution to the overall stiffness/
ultimate capacity of the drilled shafts. Therefore, these springshave, for the present, not been included in the direct embedment
foundation model. Figure 3 provides a schematic representation of therevised four-spring model for direct embedment foundations.
Subgrade Moduli.--In the case of the lateral translational spring,
the nonlinear pressure-deflection relationship given by Equation (1)
was maintained. However, the subgrade modulus, kh, required revisionto account for the presence of an annulus material having a different
modulus of elasticity (Ea) from that of the in-place soil (Es)'Figure 4 presents an illustration of a direct embedment foundation in
cross-section. When E equals E the combined stiffness of thea sannulus lateral spring and the in-place soil lateral spring shouldapproach the stiffness of the corresponding lateral spring for a
drilled shaft of diameter Bo' When E is much greater than E , thea scombined lateral spring stiffness should approach the lateral springstiffness for a drilled shaft having a diameter of B.

164 TRANSMISSION LINE TOWERS FOUNDATIONS
/1;\MQ ,
RIGID LINK
BACKFILLED ANNULU if
ANNULUS LATERAL SPRING
IN-PLACE NATURALSOIL LATERAL SPRING
ANNULUS VERTICALFORCE SPRING
IN-PLACE NATURALSOIL VERTICAL FORCESPRING
~f- BASE MOMENT SPRING~ BASE SHEAR FORCE SPRING
(2)
FIGURE 3.--Direct Embedment Foundation Model
~ DIRECT EMBEDDEDPOLE
NA TlVE SOIL
BACKFILLED ANNULUS
FIGURE 4.--Cross-~~ctlon of Direct Embedment Foundation
Using these two limiting conditions and the concept of combining
the annulus and in-place soil springs in series, yielded the following
expression for the annulus spring stiffness (Kha):
a E (D/B )-Sa 0
1 - (BIB )-So
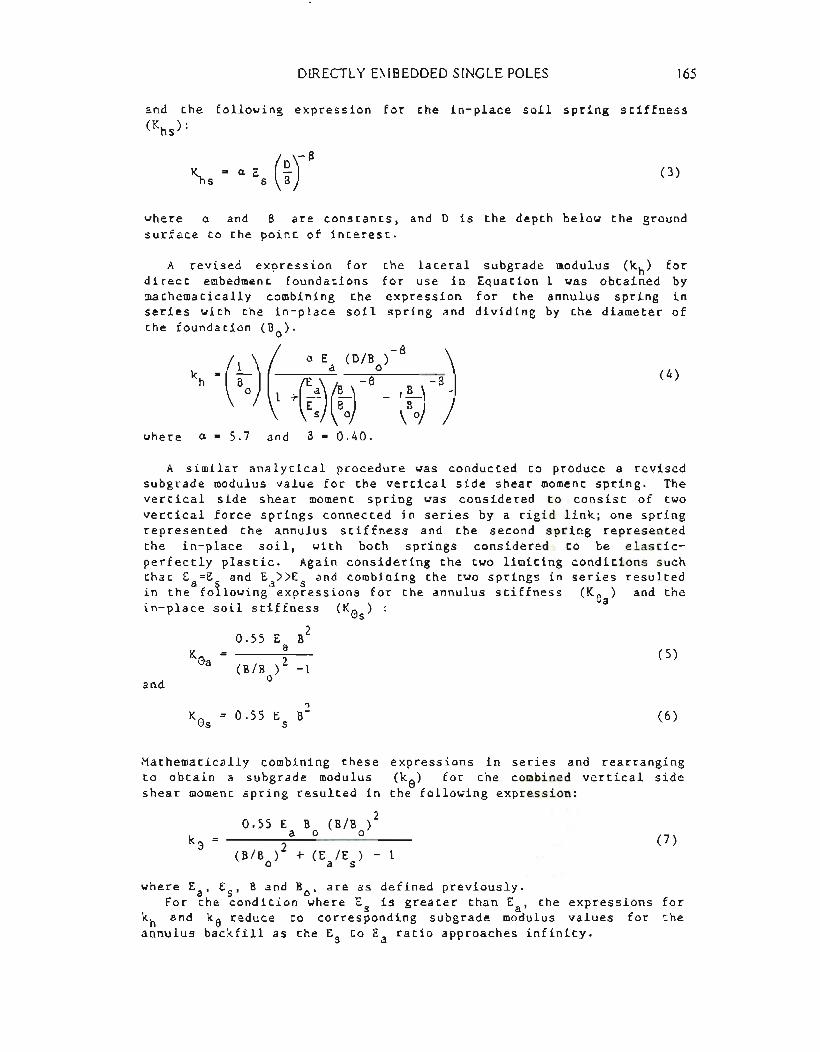
DIRECTLY EMBEDDED SINGLE POLES 165
and the following expression for the in-place soil spring stiffness
(Khs):
(3)
where a and 8 are constants. and D is the depth below the ground
surface to the point of interest.
A revised expression fordirect embedment foundations
mathematically combining theseries with the in-place soil
the foundation (Bo)'
the lateral subgrade modulus (kh) forfor use in Equation 1 was obtained byexpression for the annulus spring inspring and dividing by the diameter of
where a = 5.7 and 8 = 0.40.
(4)
A similar analytical procedure was conducted to produce a revisedsubgrade modulus value for the vertical side shear moment spring. Thevertical side shear moment spring was considered to consist of two
vertical force springs connected in series by a rigid link; one springrepresented the annulus stiffness and the second spring represented
the in-place soil, with both springs considered to be elastic
perfectly plastic. Again considering the two limiting conditions suchthat E =E and E »E and combining the two springs in series resulted
a ~ a sin the following expressions for the annulus stiffness (Ke) and the
in-place soil stiffness (Ke) : a-s
and
Kea
0.55 E B2a
(B/B )2 -1o
(5)
(6)
Mathematically combining these expressions in series and rearranging
to obtain a subgrade modulus (ke) for the combined vertical sideshear moment spring resulted in the following expression:
B (B/B /o 0
+ (E /E ) - 1a s(7)
where Ea' Es' Band Bo' are as defined previously.For the condition where E is greater than E , the expressions fors a
kh and ke reduce to corresponding subgrade modulus values for the
annulus backfill as the Es to Ea ratio approaches infinity.

166 TRANSMISSION LINE TOWERS FOUNDATIONS
Ultimate Capacity.--For direct embedment foundations, the
computation of the ultimate capacity (lateral pressure), Pult' of thelateral spring must consider several potential conditions; 1) the
failure mechanism may be contained within the interior of the annulus(e.g., when the annulus material is much weaker than the in-situ
soil), 2) the annulus material may act as part of the foundation andthe failure mechanism will be located exclusively in the in-situ soil
(e.g. when an annulus backfill such as concrete is much stronger thanthe in-situ soil), and 3) the failure mechanism involves both theannulus backfill and the in-situ soil.
For the second condition, the foundation may effectively bedesigned as a drilled shaft foundation and Hansen's (5) solution used
to determine Pult' In the case of the third condition, it is assumedthat the percentage of the foundation failure mechanism (failuresurface) contained within the annulus will be very small since the
annulus thickness is generally on the order of less than 1 foot.
Therefore, Hansen's equation may also be used to determine theultimate lateral pressure using the strength properties of the in-situsoil and assuming the effective diameter of the foundation to be equalto the diameter of the embedded structure.
An approximate solution for the ultimate lateral pressure basedupon a failure mechanism contained wi thin the annulus (Condition 1)
was developed based upon the simplified geometry shown in Figure 5.The circular cross-section of a direct embedment foundation and
annulus were represented by concentric squares and a failure surfaceconsisting of a series of rigid wedges was assumed. The expressionobtained for the ultimate pressure was arranged in the form of:
Pult (8)
where q is the effective overburden pressure at a given depth in the
annulusmbackfill, ca is the cohesion of the annulus backfill, and KQmand Kcm are bearing capacity factors presented in Appendix A. THebearing capacity factors were adjusted to provide the same numerical
values for Pult as the Hansen solution (5) when the ratio of B to Bowas large.
In the case of the vertical side shear moment spring, it wasassumed that two potential failure surfaces must be considered due tothe manner of construction of direct embedment foundations; 1) theinterface between the foundation and the annulus material and 2) theinterface between the annulus backfill and the in-situ soil. The
development of expressions to determine the ultimate vertical side
shear moment followed explicitly the formulation developed for the
drilled shaft four-spring model (1). Appendix B summarizes therelationships for ultimate vertical side shear force (V ) and ultimatezside shear moment (Mzult)' The influence of construction method onthe available shear strength at the two interface locations isaccommodated by the inclusion of strength reduction factors a and
a shown in Appendix B. rars

m
DIRECTLY EMBEDDED SINGLE POLES
AT-REST EARTH PRESSURE
ANNULUS BACKFILL
ASSUMED RIGID BOUNDARY
IN-PLACE NATURALSOil
167
(A) CROSS-SECTION OF FOUNDATION - ANNULUS SYSTEM
AT-REST PRESSURE RESULT ANT
(B) ASSUMED FAILURE' WEDGES AND FORCES
FIGURE 5.--Simplified Model for Failure Surface ContainedTotally Within the Annulus
The direct embedment foundation model and the original PADLL
drilled shaft model are contained in a new EPRI computer program MFAD(Moment Foundation Analysis and Design). Thus, MFAD has
d~sign/analysis capabilities for both drilled shaft and directembedment foundations (6).
Field Testing Program
In order to obtain comprehensive data on the performance of direct
embedment foundations subjected to high overturning moments, a seriesof 10 full-scale direct embedment foundation load tests were conductedat various test sites.
Subsurface Investigation.--In order to characterize subsurfaceconditions and select stiffness and strength parameters for design and
analysis of the test foundations, two borings were typically drilledat each test site. The initial boring at a each site includedstandard penetration testing, pocket penetrometer testing, and visual
classification. Following the determination of the stratigraphy ateach test site, a second boring was drilled in close proximity to thefirst. Pressuremeter tests were conducted at selected intervals and
undisturbed soil samples were extracted for laboratory testing.
In addition, samples of backfill materials were obtained prior todesign of the test foundations for laboratory testing to obtain
strength and deformation parameters which could be used in conjunction
with the model to design the test foundations. The backfill material

J68 TRANSMISSION LINE TOWERS FOUNDATIONS
consisted of either compacted native soil excavated during theaugering of the foundation hole or select material (crushed stone).
Instrumentation.--Surface instrumentation, consisting of 6 dialgages, for the field load tests was installed at the ground-line tomeasure displacement and rotation of the foundation in the plane ofand perpendicular to the direction of the applied loads. Surveymeasurements were made with a transit to determine the deflection ofthe top of the pole and to measure large ground-line movements. Thebelow-ground ins trumentation consis ted of s train gages bonded to thesteel or concrete poles at various intervals below the groundsurface. The strain gages were used to determine the below groundbending moment distribution in the foundation. No strain gages weremounted on the one wood pole tested.
Loading of all of the tests poles was accomplished by attaching acable at a convenient location near the top of the pole. Test loadswere applied to the cable by means of a winch mounted on a dozer ortruck. The applied load was measured using either two dynamometersmounted in series or a dynamometer mounted in series with anelectronic load cell connected to the loading cable (as well as byback-calculating the applied load from the measured deflection of thetop of the pole).
Foundation Test Design.--The full-scale test foundations wereselected from available transmission poles owned by the utilitiessponsoring the load tests. The embedment depths for the test foundations were computed using the design capabilities of the computerprogram MFAD for an applied ground-line moment equal the ultimateground-line capacity of the transmission pole divided by a factor ofsafety of 1.5; so that geotechnical failure of the foundation wouldoccur well before structural failure.
The load testing program included 7 tubular steel poles, 2prestressed coricrete poles, and one timber pole. The two concretepoles were embedded using native soil (silty clay) as backfillmaterial and the remaining 8 load tests utilized various crushed stonebackfills. The test poles varied from 65 to 115 feet in length, 27 to38 inches in diameter, and the embedded lengths varied from 7.7 to11.5 feet. In general, the backfill was well-compacted, with theexception of one test using native soil backfill and one test usingselect backfill in which the backfill was not compacted or onlylightly tamped, respectively.
The test loads were applied to the pole in increments keyed topercentages of the ultimate moment capacity of the foundation predicted by the model. Each load increment was maintained on the testfoundation until the rate of ground-line deflection decreased to 0.01inches/hour. Typically, three load-unload cycles were applied priorto reaching the predicted ultimate foundation capacity. Figure 6shows a typical load test curve (applied ground-line moment vs.ground-line deflection) obtained from the testing program. The loadtests were concluded when an applied load increment could not be sustainfd and large ground-line deflections occurred (the exception isTest No. 10 in which the applied moment was increased until the factor
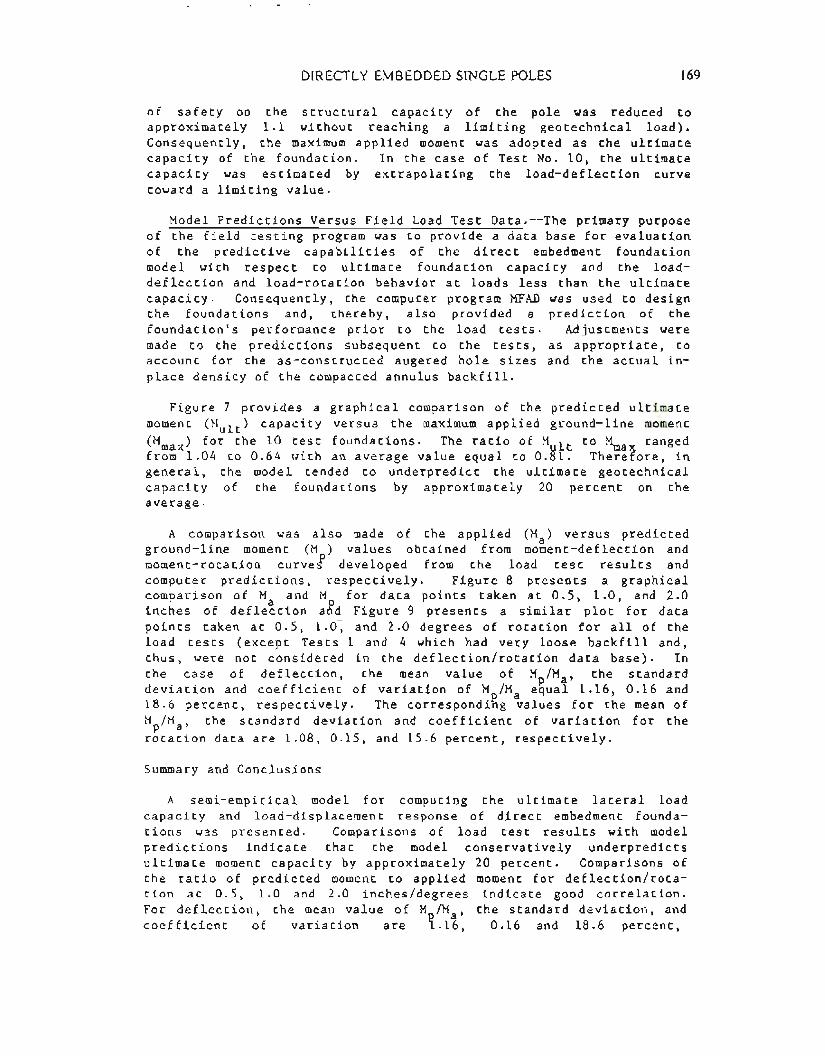
DIRECTLY EMBEDDED SINGLE POLES 169
of safety on the structural capacity of the pole was reduced toapproximately 1.1 without reaching a limiting geotechnical load).
Consequently, the maximum applied moment was adopted as the ultimatecapacity of the foundation. In the case of Test No. 10, the ultimatecapacity was estimated by extrapolating the load-deflection curve
toward a limiting value.
Model Predictions Versus Field Load Test Data.--The primary purpose
of the field testing program was to provide a data base for evaluationof the predictive capabilities of the direct embedment foundationmodel with respect to ultimate foundation capacity and the loaddeflection and load-rotation behavior at loads less than the ultimate
capacity. Consequently, the computer program MFAD was used to designthe foundations and, thereby, also provided a prediction of thefoundation's performance prior to the load tests. Adjustments were
made to the predictions subsequent to the tests, as appropriate, toaccount for the as-constructed augered hole sizes and the actual in
place density of the compacted annulus backfill.
Figure 7 provides a graphical comparison of the predicted ultimate
moment (Mult) capacity versus the maximum applied ground-line moment
(Mmax) for the 10 test foundations. The ratio of M lt to Mmax rangedfrom 1.04 to 0.64 with an average value equal to O.~l. Therefore, in
general, the model tended to underpredict the ultimate geotechnicalcapacity of the foundations by approximately 20 percent on theaverage.
A comparison was also made of the applied (Ma) versus predictedground-line moment (M) values obtained from moment-deflection andmoment-rotation curvef developed from the load test results andcomputer predictions, respectively. Figure 8 presents a graphicalcomparison of M and M for data points taken at 0.5, 1.0, and 2.0inches of defle~tion aKd Figure 9 presents a similar plot for data
points taken at a .5, 1.0~ and 2.0 degrees of rotation for all of theload tests (except Tests 1 and 4 which had very loose backfill and,thus, were not considered in the deflection/rotation data base). In
the case of defl~ction, the mean value of Mp/Ma' the standarddeviation and coefficient of variation of M /Ma equal 1.16, 0.16 and18.6 percent, respectively. The correspondi~g values for the mean of
Mp/Ma' the standard deviation and coefficient of variation for therotation data are 1.08, 0.15, and 15.6 percent, respectively.
Summary and Conclusions
A semi-empirical model for computing the ultimate lateral load
capacity and load-displacement response of direct embedment founda
tions was presented. Comparisons of load test results with modelpredictions indicate that the model conservatively underpredicts
ultimate moment capacity by approximately 20 percent. Comparisons of
the ratio of predicted moment to applied moment for deflection/rotation at 0.5, 1.0 and 2.0 inches/degrees indicate good correlation.
For deflection, the mean value of M /Ma, the standard deviation, andcoefficient of variation are ~.16, 0.16 and 18.6 percent,

170
,... 1600I-u.I
2S
TRANSMISSION LINE TOWERS FOUNDATIONS
400
(1189) MAXIMUM APPLIED MOMENT---------------(1060) MULT (MFAD PREDICTION)
I-r5 1200~o~wz:i 800Io
Z::>octCJ
oW..JCl.Cl.«
2 4 6 8 10DEFLECTION AT GROUND-LINE (IN)
12 14 16
FIGURE 6.--Typical Applied Moment/Deflection Curve (Test No.3)
2000ILEGEND:01 est 1-;:
•2n 3"- 1600
(54
I ~()5
~6
,...7-'
::E
f::.B
'"9~ 1200•IDz w::; I LINE OF~QUALITY/Y0,0 'Jc::;
IC
WI- BOO
<: ::;I---':;)l-t)0WII:£l.
oo 400 BOO 1200 1600 2000
MAXIMUM APPLIED MOMENT, MMAx, (K-FT)
FIGURE 7.--Predicted Ultimate Capacity vs.
Maximum Applied Moment

DIRECTLY EMBEDDED SINGLE POLES 171
DEFLECTION 0.S:1.0:AND 2.0'
LEGEND• TEST 2o •<) •• •() T~ .~ .• 10
LINE OF
<)
L~ tao.~ZI.U
::<
o ao.~aI.U~() II'aI.U
a:0..
••.• 1 toou.I>::
'••0
200
"00
'00
200 .00 100 100 1000 1200 1 COO 1100
APPLIED MOMENT,M.(K-FT)
FIGURE 8.--Applied vs. Predicted Moment at Ground-Line
Deflections of 0.5, 1.0 and 2.0 Inches
IROTATlON'0.S:1.0:AND 2.0'
"'0
140'
t.I,~U.I:: "0'L
~~zW 10'::<
o::<
aI.U
co.~ ()aI.Ua:
'000..
200
LINE OF EQUALITY
LEGEND• TEar 2o •<) •
• Io 1~ .& •• 10
100 <00 I •• 100 1000 1200 1COO ,.00
APPLIED MOMENT.M.(K-FT)
FIGURE 9.--Applied vs. Predicted Moment at Ground-Line
Rotations of 0.5, 1.0 and 2.0 Degrees

172 TRANSMISSION LINE TOWERS FOUNDATIONS
respectively. For rotation the corresponding values are 1.08, 0.15
and 15.6 percent, respectively.
Acknowledgments
The research described herein was cosponsored by the Electric Power
Research Institute, Palo Alto, California (Project RP 1280-3), EmpireState Electric Energy Research Corporation (Project 85-33), Delmarva
Power Company, Jersey Central Power & Light Company, New York StateElectric & Gas, Pennsylvania Power & Light Company, Potomac Electric
Company, Virginia Electric Power Company, Kansas Gas and Electric
Company, and Public Service Electric & Gas Company.
References
GAl Consultants, Inc., "Laterally Loaded Drilled Pier Research,"
Volumes I and II, Electric Power Research Institute Report
EL-2197, Project 1280-1, Palo Alto, California, January 1982.
2. DiGioia, A.M., Davidson, H.L., and Donovan, T.D.,
Loaded Drilled Piers, A Design Model," ProceedingsPiers and Caissons Session, ASCE National Convention,
Missouri, October 28, 1981, pp. 132-149.
"Laterallyof Drilled
St. Louis,
3. Reese, L.C., and Welch, R., "Lateral Loading of Deep Foundations
in Stiff Clay," Journal of Geotechnical Engineering Division,ASCE, Vol. 101, No. GT7, July 1975, pp. 633-649.
4. Ivey, D.1., "Theory, Resistance of a Drilled Shaft Footing toOverturning Loads," Texas Transportation Institute, Research
Report No. 105-1, February 1968.
5. Hansen, J. Brinch, "The Ultimate Resistance of Rigid Piles
Against Transversal Forces," The Danish Geotechnical Institute
Bulletin, No. 12, 1961, pp. 5-9.
6. Final Report, EPRI Research Project 1280-3, Volume II, "Research
Documentation," Electric Power Research Institute, Palo Alto, CA.

DIRECiL Y EMBEDDED SINGLE POLES 173
Appendix A - Bearing Capacity Factors for Approximate Solution to
Ultimate Lateral Annulus Bearing Pressure
The earth pressure coefficients for overburden pressure (K ) andcohesion (K ) are determined as follows: qmcm
Kqm + 2 Tan <p )a
where:
¢ = Angle of internal friction for the annulus backfilla
K = coefficient of at-rest earth pressure = 1-sin <pom a
+ Tan <pa
- Tan <paCapacity
o
<p = 0a
x 10-2 +
Cos S) (1 + Tan <p Tan a)aSin S) (Tan a - Tan <p)aCorrection Factor for Overburden
(Sin SF = (Cos S1m
Aq
= Bearing
o when-0.652
-4- 0.693 x 10
0.230<p - 0.299 xa4 -6
<p + 0.824 x 10a
-1 210 <p +0 .218a
5<p when ~ > 0a a
Pressure Term
t(Tan a-Tan <p) T (Sin S + Tan a Cos S) JF = a__ Tan a+ _a_n_a + a. Tan a+12m (l+Tan <PaTan a) Tan S (Cas S - Tan <PaS~n S)
x(l + Tan <P Tan a)a(Tan a - Tan <P)a
Bearing Capacity Correction Factor for Cohesion Term
-2 30.196 x 10 <pa
o <Pa
1 + Tan (45 + 2)and when
o45
<Pa
2)] + 1
<Pa2)] + 1
o(45
1.233 + 0.103 <p - 0.229 xa-4 4
- 0.655 x 10 <P + 0.801
-1(B ~ a 0 (OalTan ~ - 7 < 45 +\2)
o45
when (~o)<l + Tan (450
<Pa ~ \ 0 <Pa
(2 when 0 Bor~[Tan~(45 + 2) ITan
-1 Tan (45 + <pa/2) B
Tan (B/Bo) - 1 When(Bo»
B \ 0 <Pa 0
Bo)<[Tan (45 + 2)/Tan (45
a
S
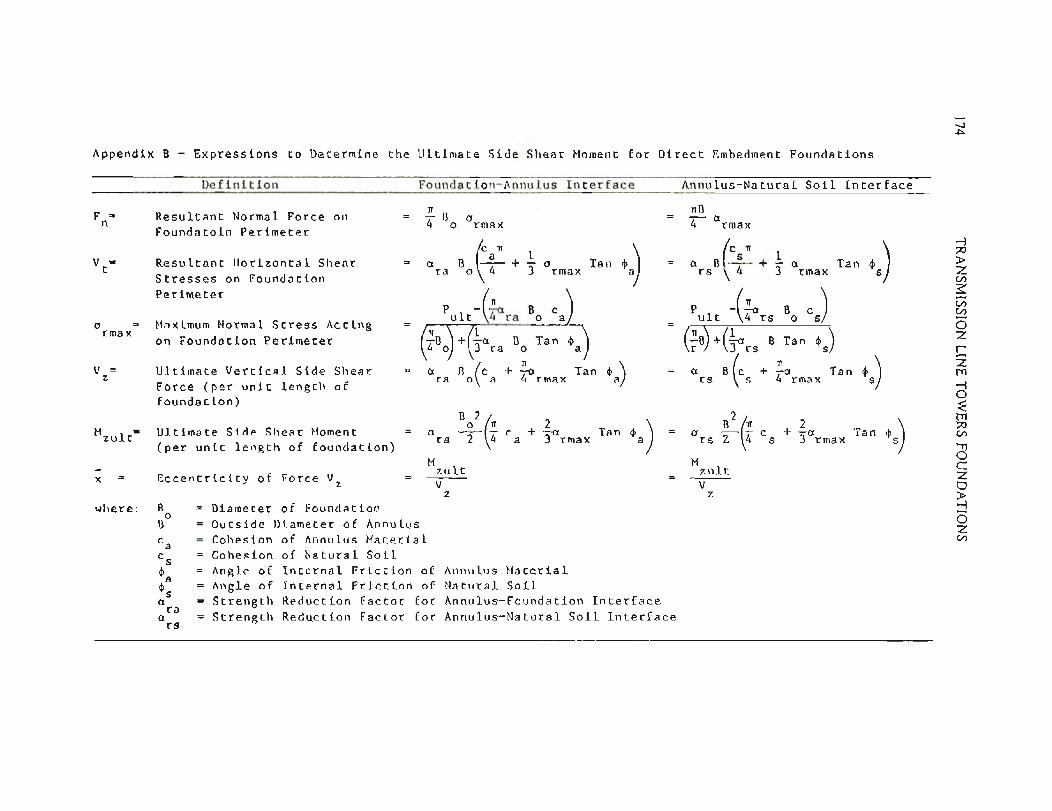
-.).J::>.
Appendix B - Expressions to Determine the Ultimate Side Shear Moment for Direct Embedment Foundations
Definition Foundation-Annulus Interface Annulus-Natural Soil Interface
Diameter of FoundationOutside Diameter of Annulus
Cohesion of Annulus MaterialCohesion of Natural Soil
Angle of Internal Friction of Annulus Material
Angle of Internal Friction of Natural SoilStrength Reduction Factor for Annulus-foundation Interface
Strength Reduction Factor for Annulus-Natural Soil Interface
~a 11 1a B --- + - crra 0 4 3 rmax
(11 ~
P --;-a B cult 4 ra 0 a
(~B ) +(ta B Tan;\o ra or a )
a B (c + ia Tan ~ )ra 0 a rmax a
B 2 (
o 11
ara -2- 4 ca
Mzult---V
z
Tan 'a)
.....,;:::0
>ZC/)
~-C/)C/)
(5ZlZtTJ
-3o:<tTJ;:::0C/)
"I1oc::Zt:i>.....,
(5ZC/)
~s)
Tan ")
c + %a Tan ~)s rmax s
B 2 f-1Iar s Z \4MzultV
z
1IB-a4 rmax
(C1l 1a B--s_+_ars \ 4 3 rmax
P -(~ B c)ult 4 rs 0 s
(~B)+(tars B Tan ~s)
a B(C +~ Tanrs s rmax
Tan ~a)
2+ -a3 rmax
crrmax
2!. B4 0
caCs¢a~sa raars
Bo
B
Eccentricity of Force Vz
Ultimate Vertical Side Shear
Force (per unit length offoundation)
Maximum Normal Stress Actingon Foundation Perimeter
Resultant Horizontal Shear
Stresses on FoundationPerimeter
Resultant Normal Force on
Foundatoin Perimeter
Ultimate Side Shear Moment
(per unit length of foundation)
x
crrmax
where:
Mzult'"
v =z
F =n
v =t
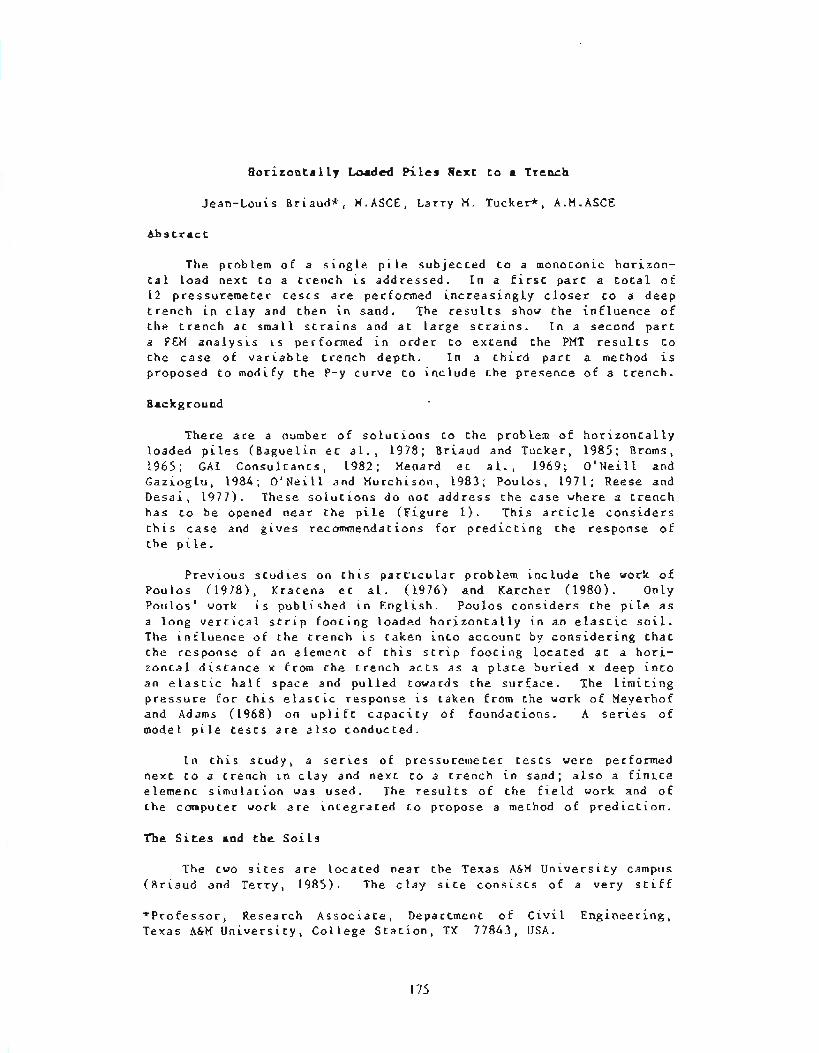
Horizontally Loaded Piles Next to a Trench
Jean-Louis Briaud*, M.ASCE, Larry M. Tucker*, A.M.ASCE
Abstract
The problem of a single pile subjected to a monotonic horizontal load next to a trench is addressed. In a first part a total of
12 pressuremeter tests are performed increasingly closer to a deeptrench in clay and then in sand. The results show the influence ofthe trench at small strains and at large strains. In a second part
a FEM analysis is performed in order to extend the PMT results tothe case of variable trench depth. In a third part a method is
proposed to modify the P-y curve to include the presence of a trench.
Background
There are a number of solutions to the problem of horizontally
loaded piles (Baguelin et al., 1978; Briaud and Tucker, 1985; Broms,
1965; GAl Consultants, 1982; Menard et al., 1969; O'Neill andGazioglu, 1984; O'Neill and Murchison, 1983; Poulos, 1971; Reese andDesai, 1977). These solutions do not address the case where a trench
has to be opened near the pile (Figure 1). This article considers
this case and gives recommendations for predicting the response ofthe pile.
Previous studies on this particular problem include the work ofPoulos (1978), Kratena et al. (1976) and Karcher (1980). Only
Poulos' work is published in-English. Poulos considers the pile as
a long vertical strip footing loaded horizontally in an elastic soil.The influence of the trench is taken into account by considering thatthe response of an element of this strip footing located at a hori
zontal distance x from the trench acts as a plate buried x deep intoan elastic half space and pulled towards the surface. The limitingpressure for this elastic response is taken from the work of Meyerhof
and Adams (1968) on uplift capacity of foundations. A series ofmodel pile tests are also conducted.
In this study, a series of pressuremeter tests were performednext to a trench in clay and next to a trench in sand; also a finiteelement simulation was used. The results of the field work and of
the computer work are integrated to propose a method of prediction.
The Sites and the Soils
The two sites
(Briaud and Terry,
are located near the Te~as A&M University campus
1985). The clay site consists of a very stiff
*Professor, Research Associate, Department of Civil Engineering,Texas A&M University, College Station, TX 77843, USA.
175
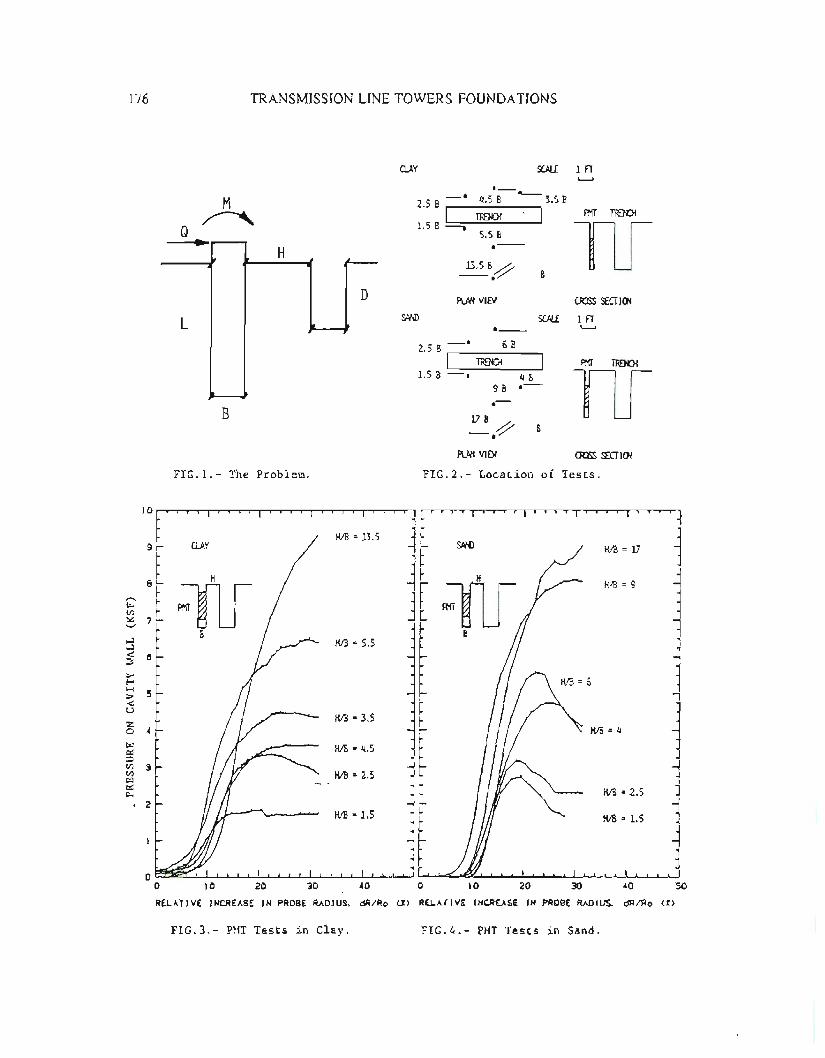
176 TRANSMISSION LINE TOWERS FOUNDATIONS
QAY SCAl.£ 1 FT~.-
• IO-M 2.5 8 - 4.5 8 3.58
~ I TIDQj , ffif TIDOi
Q 1.58-. Tlf5.5 B.~ .--H
13.5 B~--./ B
D PI..Ni VI Ell cross ~CiI Oi
L I I L-1. ~ SCALE 1 FT.--2.5 8 -. 6 8
I TRENOi I P.'If TROO!
1.5B -. 48 nr98 .-.-B V8_p/ 8
PI..Ni VI Ell cross ~CiI Oi
FIG.l.- The Problem. FIG.2.- Location of Tests.
J"~:,',I' , , " ' '~'.~:,' ,1''~',"I ' , "I' '~.'~ ' , '1~ ~ [ .Jsl H I H HIE =9 -i
r-- ~ 11f r 11f oJ
.~ ~ ffif ~r Fffi J
:x: 7- _ --.J
~ , ~ I
~ - 8 .,
j ~ J) HIE = 5.5 ~
~ e- 1
;.- ~ .J
t: 't". 1> 5 ~ -< ~~ I HIE = 3.5 ~ ~
o .(- •... H1B=4 l~ ~ HIE = 4.5 t j
~ 3r ~ 1~ [ HIB = 2.5 j r _~
Po. 2 1:.. HIE - 2.:> ...JM'15 ~~ M ,1,' ~
O~""I""I""I""~ I Jo 10 20 30 ,(0 0 10 20 30 .(0 50RELATIVE INCREASE IN PROSE RAOIUS. dR/Ro (%) RELATIVE INCREASE IN PROBE RAOI~ dR/Ro (:)
FIG.3.- PMT Tests in Clay. FIG.4.- PMT Tests in Sand.

IiHORIZONTALLY LOADED PILES 177
plastic clay with the following average properties over the first 6.1m (20 ft); plastic limit 21%, liquid limit 54%, water content 24%,
unit weight 19.8 kN/m3 (126 lb/ft3), undrained shear strengthfrom unconfined compression tests 114.9 kPa (1.2 tsf), electric cone
penetrometer point resistance 1916 kPa (20 tsf). The water table is5.2 m (17 ft) deep.
The sand site consists of a medium dense fine silty sand with the
following average properties over the first 20 feet: dry unit weight17 kN/m3 (108 pcf), water content 12.9%, 15% passing sieve no. 200,
friction angle from direct shear tests 31°, SPT blow count 18.5 blows
per 30 cm (18.5 bpf). The water table is 7.3 m (24 ft) deep.
The Pressuremeter Tests
A series of pressuremeter tests were performed. The pressure
meter used was the TEXAM (Roctest, 1983); the probe diameter is 74 rom
(2.91 in.) and the inflatable length of the probe is 49 cm 09.3in.). The boreholes were prepared by using a hand auger and the
middle of the probe was placed at a depth of 60 cm (2 ft). A trenchwas opened which was 0.91 m deep, 0.45 m wide, 1.83 m long (3 x 1.5 x
6 ft). The pressuremeter boreholes were drilled at various distancesfrom the trench as shown on Figure 2.
The test results are shown on Figures 3 and 4. These pressuremeter curves show the decrease in soil resistance as the pressure
meter gets closer to the trench. The shape of the pressuremetercurve is normal for tests far away from the trench but for tests
performed close to the trench some curves show a peak. This peak isespecially noticeable for the tests in sand. Therefore it is logicalto conclude that the failure of a pile horizontally loaded near atrench would be more sudden in sand than in clay.
From each pressuremeter curve, a modulus Eo and a limit pres
sure PI.. were calculated. When the pressuremeter curve displayed apeak, the peak value was used as the limit pressure. Figures 5 and 6
show the variation of Eo and PI.. as a function of the distancebetween the pressuremeter and the trench. Figure 7 is similar toFigures 5 and 6 except that the vertical scale is normalized.
The results show similar trends in sand and in clay. However theinfluence of the trench is felt more severely and further away at the
limit pressure than for the modulus. The crack pattern developing onthe vertical face of the excavation as a result of the pressuremeterexpansion was monitored. In the clay, cracks appeared only for thetest closest to the trench (1.5 PMT diameter from the trench); a ver
tical and a horizontal crack appeared in the shape of a plus sign. Inthe sand, cracks developed for the tests at 1.5, 2.5, 4, and 6 PMTdiameters from the trench. At 6 diameters one single vertical crack
was apparent while at 1.5 diameters a 60 cm by 60 cm (2 x 2 ft) blockof sand fell into the excavation. Note that if the sand had been
clean and dry, the trench would not have stood up.

178 TRANSMISSION LINE TOWERS FOUNDA TrONS
o
l20l l2l0._-------
/' 0/ MJIUlJS
.-0- -IDOL
10 L/ .--" --- .- - .:------~~
P'M)!XJLUS0//
roL8L/ • /
/ 0/ op/
LIMIT PRESSURE
ffil
6 l ° •/ /0/
40l
4 ~ I• B H/ ./B H/ SAt'IDnr1/ •CLAYnr•
:t :17,OJ
I 4I
IIII,0
5101520°5101520
HIE
HIE
FIG.S.- Eo and PI vs. RIB (Sand)
1.0
0.8
0.6
0.4
0.2
FIG.6.- Eo,P1 vs.R/B (Clay)
_ -0
B H
lfUo
o 2 6
HIE
8 10 l2
FIG.7.- Normalized Parameters as a Function of RIB.
FIXED
A'W..YSIS INH
FREE
TIE rrnI zr:m AL 110 BPLN£
N\ALYSIS
ij""T1
I UD
xIN n£ I
I~~I
'""
~ L I~ a
~B
0';fin!CPtu...
F'l..NE I DISPLAC2'8H Cf 11-iE PILE
',",: 4H
W: 4H0.25_
~-I\.DISPlA..-m.£NTCf TI£ PILE---
PrE (TREK.,)
8B ~FIXED
16 B
FIG.8.- Mesh in Horizontal Plane 'FIG.9.- Mesh in Vertical Plane

HORIZONTALLY LOADED prLES
FEM Simulation in the Horizontal Plane
The program CRACKTIP (1986) was used to simulate the problem inthe horizontal plane. The soil was considered to be linear elastic;a typical mesh with boundary conditions is shown on Figure 8. Thisplane strain problem simulates the case of an infinitely long pilenext to an infinitely deep excavation. The distance from the pile tothe trench was varied from 1 to 10 pile diameters. In all cases, thepi Ie was pushed horizontally 6.35 rom (0.25 in.) towards the excavation and the stress Gi in the first element against the pile wasrecorded. In order to simulate the case where no trench exists arigid boundary was placed at 10 pile diameters from the pile. Thestress Gi in the case of no trench is called GNT' Figure 7 isa graph of Gi/GNT versus H/B, H being the distance from thepile to the trench and B the pile diameter.
FEM Simulation in the Vertical Plane
The same program was used to simulate the problem in the vertical plane. The soil was considered to be linear elastic; a typicalmesh with boundary conditions is shown in Figure 9. This planestrain representation of the problem simulates the case of aninfinitely long wall next to an infinitely long excavation. Thedistance from the pile to the trench as well as the depth of thetrench were varied. In all cases, all the nodes of the pile werepushed horizontally 6.25 mm (0.25 in.) towards the trench and thestress Gi in the first element against the pile was recorded foreach of the 8 layers of soil (Figure 9) including the case where notrench existed. The stress oi in the case of no trench is calledGNT' Figures 10 to 17 summarize the results.
In order to compare the results of the FEM analysis in the vertical plane and in the horizontal plane, the average of Gi/GNTfor the vertical plane cases where the trench is as deep as the pileare plotted on Figure 7. The comparison shows that the wall loading(vertical plane) is generally more severe than the infinitely longpile (horizontal plane). Note however that the FEM wall loading casefalls between the results for the modulus and for the limit pressureof the pressuremeter.
Proposed P-y Curve Approach
One of the most common ways of predicting the response of horizontally loaded piles is to use the concept of P-y curves (Reese andDesai, 1977). These P-y curves have been recommended first by Mat-lock and Reese and later by other authors (Briaud and Tucker,1985; GAl Consultants, 1982; Menard et a1., 1969; O'Neill andGazioglu, 1984; O'Neill and Murchison, 1983) these recommendationspertain to the case of a horizontal ground surface. When a trenchexists at some distance from the pile the P-y curves are affected.
In order to include the effect of a trench, the P of the P-ycurve needs to be reduced by a trench influence factor A since for agiven y the soil reaction P will be less. The factor A will always
179
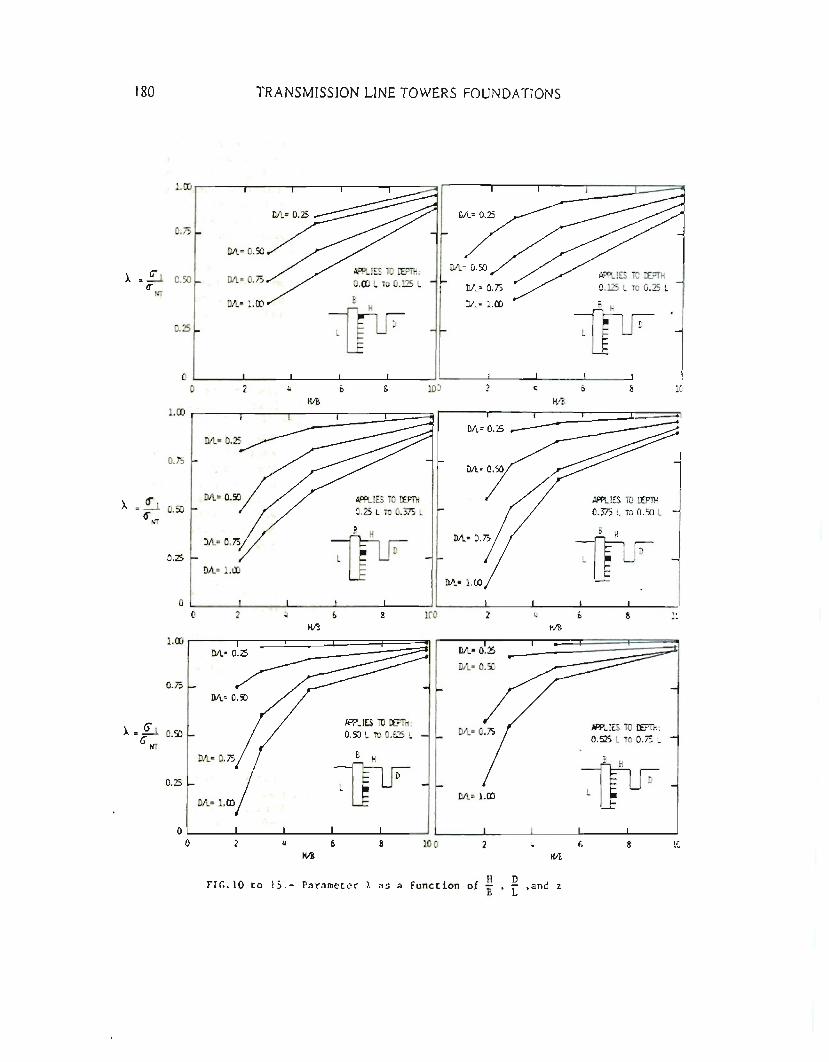
180 TRANSMISSION LINE TOWERS FOUNDATIONS
1.00
0.75
O~~
D/l= O.SO
A =.£1 / HI"T~'~O IU LU"1r.:
I
O/L=O~75 /
AP?L !ES iD !£?TH
(f
OIL= 0.75 0,00 L TO 0.125 L
0,125 L TO 0.25 Lto(i
W,-l00 1TwOJI_= 1.00llT0.25 L
0
IIII0
24 6S10) .46810
H/B
HIB
1.00OIL= 0.25
0.75
A =:' O.SO
APf\.IES TO [UTHAP?LIES iD l.B'TH
0.25 L TO 0.375 L
0.375 L TO O.SO Lto(i
1)1F¥0.25 f-
/' L >--
[ Dft_" 100
L /!I1OIL= 1.00 .J:I
a I
,III IIII
I I°2468lro 24681~.J
KIB
H/B
1.00D/l= 0:25
D/l= O.SO/ II
or, ~
OIL= O.SO
L :~ O,SO
AOf".IES TO 1E'Th: ~ ~OIL= 0:75 (
AOf"dES TO l.B'TH:O.SO L TO 0,525 L 0.525 L TO 0,75 L
o:r
/¥j~
/ POIL= 1.00
• I
III IIIIa
2468100 246810
H/B
HIE
FIG.10 to 15.- Parameter A as a Function of i'i ,and z

I
I
HORIZONT ALLY LOADED PILES
be less than one and will represent the ratio of the soil reactionwith trench over the soil reaction without trench. This factor A
corresponds to the parameter plotted on the vertical axis of Figures
10 to 17. Therefore it is recommended that, in order to correct P-ycurves for trench effect, P be multiplied by A obtained from Figures10 to 17. The A values vary along the pile length and depend on thedistance to the trench as well as the depth of the trench.
Note that since these A values come from the elastic analysis of
a horizontally loaded wall instead of a pile, they are conservativevalues. However they are conservative at small strains (elasticanalysis) but not at large strains since, as shown on Figure 7, the
wall analysis is between· the pressuremeter modulus curve and thelimit pressure curve. It is also necessary to make a distinction
between the case where 8. pile element is moving towards the trenchand the case where it moves away from the trench. in other words the
P-y curves need to be nonsymmetrical (Figure 18) with a reduced P-ycurve towards the trench and an unreduced P-y curve away from thetrench. This can be easily handled by a Beam Column program (Bogardand Matlock, 1977).
In the case of a pile in sand which is within 6 diameters from atrench, Figure 6 shows that there is a need to use P-y curves whichexhibit a peak. This peak occurs at a relative increase in cavity
radius ilRc/Rc (Figure 6) of approximately 10%. It has been shown(Baguelin et a1., 1978; Briaud and Tucker, 1985) that this corre
sponds on the P-y curve to a y value equal to 0.10 Rpile.Therefore beyond 0.1 Rpile the P-y curves, in this special case,should be softened according to the shape of the pressuremeter curveson Figure 6. If this provision is not included in the P-y curves the
pile response prediction will only be valid up to a displacement
equal to 0.1 Rile. Alternatively the P-y curve can beobtained directly ~y performing pressuremeter tests at the site near
the trench and using the method de~cribed by Briaud and Tucker(1985).
Coaclasions
A method is proposed to predict the response of piles loadedhorizontally near a trench. In order to propose this method a seriesof pressuremeter tests were performed near a trench in sand and inc lay and a series of FEM simulations were conducted. The pressure
meter tests showed that: 1. When a deep trench is at5 pressuremeterdiameters from the test the modulus is reduced to 80% of the modulus
without trench and the limit pressure is reduced to 50%. A curve ispresented to quantify the reduction as a function of the distance tothe trench (Figure 7). 2. In sand pressuremeter tests within 6
pressuremeter diameters of the trench show a peak in the expansioncurve. 3. In sand and in clay the modulus is less sensitive to thetrench than the limit pressure.
The FEM analysis shows the influence of the depth of the trench,a factor which was not investigated with the pressuremeter. Theresults allow to obtain the ·trench influence factor A . for various
181
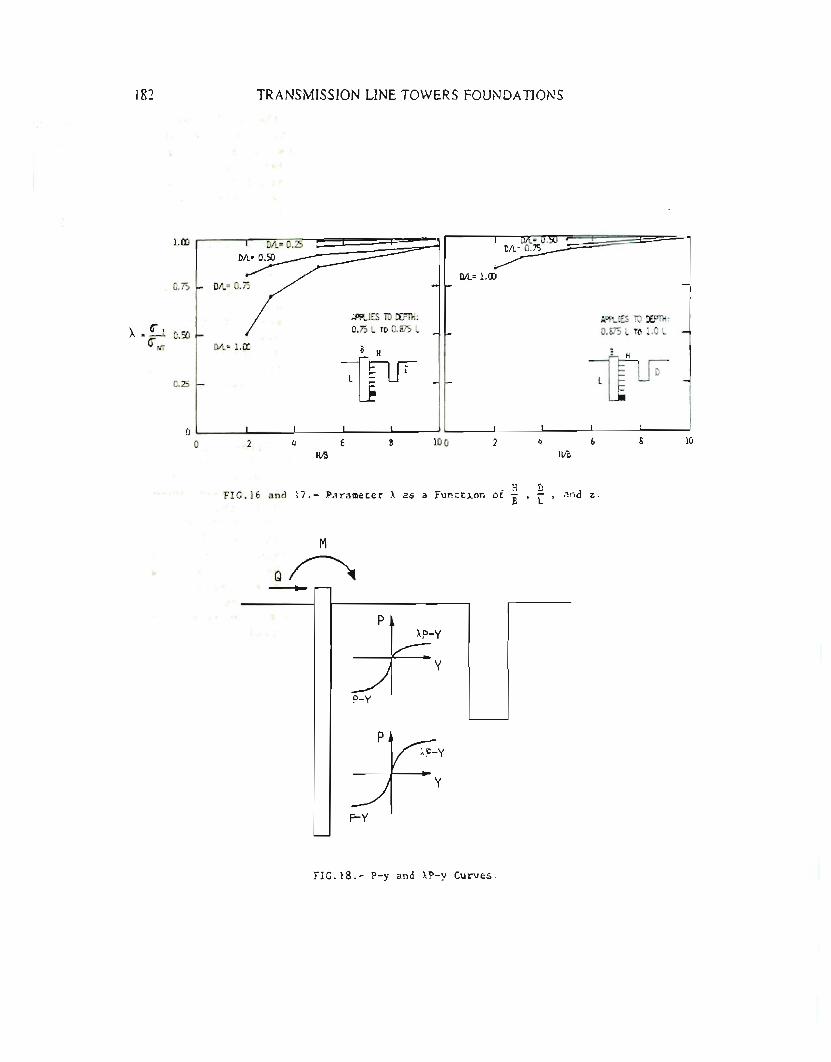
182 TRANSMISSION LINE TOWERS FOUNDATIONS
1.())
0.75
A = £.1 0.:0U,...
0.25
D/l = 1.())
APPlIES TO IPTH:
0.75 L TO 0.375 L
D/l = 1.())
A"PliES TO EE?TH:
0.875 L TO 1.0 L
o
o 5 8 100 6 8 10
FIG.16 and 17.- Parameter A as a Function or ~ ' I'and z.
M
Q~---..
p~:~
p-y
FIG.18.- P-y and AP-y Curves.

HORIZONTALLY LOADED PILES
depths of trench, distances between the pile and the trench, anddepth along the pile (Figures 10 to 17). It is proposed to use this;\ factor to reduce the P-y curves to;\ P-y curves in order to predictthe response of piles loaded horizontally next to a trench. Fullscale load tests need to be performed to evaluate the reliability ofthe proposed method. It must also be kept in mind that if the sanddoes not have a sufficient amount of fines and is either dry or submerged the trench alone is not stable. In all cases the stability ofthe trench alone must be established before addressing the problem ofthe horizontally loaded pile.
Acknowledgments
This project was sponsored in part by Briaud Engineers. Thefollowing individuals participated in the project and are thanked fortheir contribution: Lopez, X., Gan, K.C., Chandra, D., Kon, C.J.,Leonard, J.N., Pittenger, H.A., Schuller, R.E., and Webb, R.E.
References
183
1. Baguelin, F., Jezequel, J.F., Shields, D.H., The Pressuremeterand Foundation Engineering, Transtech Publications, Rockport,Mass., 1978.
2. Bogard, D., Mat lock, H., "A Computer Program for the Analysis ofBeam-Column under Static Axial and Lateral Loads," Offshore Technology Conference, Paper OTC 2953, 1977.
3. Briaud, J. L., Terry, T., "Texas A&M Uni versi ty GeotechnicalResearch Sites," Research Report, Civil Engineering, Texas A&MUniversity, 1985.
4. Briaud, J.L., Tucker, L.M., "A PressuremeterLoaded piles," Int. Con£. on Soil Mechanicsneering, Vol. 3, p 1353, 1985.
5. Broms, B.B., "Design of Laterally Loaded Piles,"Soil Mechanics and Foundations Division, ASCE,1965.
6. "CRACKTIP User's Manual," Civil Engineering, Texas A&MUniversity, 1986.
7. GAl Consultants, Inc., "Laterally Loaded Drilled pier Research:Volumne 1 and 2," Reports to EPRI, 1982.
8. Karcher, K., "Model Tests of the Bearing Capaci.ty of HorizontallyLoaded piles on Slopes," Bautechnik 57, No. 10, pp 328-330,1980.
9. Kratena, J., Kysela, Z., Bartos, F., "A Model Study of the Interaction between Horizontally Loaded piles at the Crest of aSlope," Stravebnicky cas. 24, No.1, pp 44-52, 1976.Menard, L., Bourdon, G., Gambi.n, M., Methode Generale de Calculd'un Rideau ou pieu Sollicite Horizontalement en Fonction desResultats pressiometriques," Sols-Soils No. 20/23, 1969.Meyerhof, G.G., Adams, J.1., "The Ultimate Uplift CapacityFoundations," Canadian Geot.echnical Journal, Vol. 5, No.4,225-244, 1968.O'Neill, M.W., Gazioglu, S.M., "An Evaluation of P-y Relationships in Clays," Research Report UHCE-84-3 to API, Civil Engi-neering, University of Houston, 1984.
10.
11.
12.
~ethod for Laterallyand Foundation Engi-
Journal of theVol. 9 1 , SM3,
ofpp
184 TRANSMISSION LINE TOWERS FOUNDA TrONS
l3.-0'Neill, M.W., Murchison, J.M., "An Evaluation of P-y Relationships in Sands," Research Report GT-DF02-83 to API, Civil Engineering, University of Houston, 1983.
14. Poulos, H.G., "Behavior of Laterally Loaded piles: 1 - SinglePiles," Journal of Soil Mechanics and Foundation Engineering,ASCE, Vol. 98, SM4, 1971.
15. Poulos, H.G., "Behavior of Laterally Loaded piles Near a Cut orSlope," Australian Geomechanics Journal, Vol. G6, No.1, 1978.
16. Reese, L.C., Desai, C.S., "Laterally Loaded Piles," Chapter 9 inNumerical Methods in Geotechnical Engineering, McGraw-Hill, 1977.
17. Roctest, Inc., "TEXAM Pressuremeter Operation Manual," Plattsburg, New York, 1983.

SUBJECT INDEX·
Page number refers to first page of paper.
Anchors, 57, 72, 81
Bell footings, 110Boring, 1
Clays, 128, 175Cone penetration tests, 39Construction methods, 72, 81
Drilled piers, 128Drilled shafts, 142Driven piles, 142
Foundation design, 15,25, 72, 160Foundation performance, 15Framed structures, 15France, 25
Granular materials, 142Guyed towers, 15
Helixes, 72, 81Horizontal loads, 175
Laboratory tests, 57Lateral loads, 160
185
Lattices, 15,39Load tens, 128, 160
Marshes, 72, 81
Networks, 25
Overconsolidated clays, 110
Pile foundations, 39Piles, 175Poles, 39, 160Probabilistic methods, 1
Sand, 57, 96, 128, 175Shafts, 15Site evaluation, 1,81Soil investigations, 25Soil suction, 110Spread foundations, 96Steel piles, 39Subsurface investigations, 1,25, 128
Transmission towers, 25
Uplift resistance, 57, 96, 128, 142

AUTHOR INDEX
Page number refers to first page of paper.
Bragg, Richard A., 160Briaud, Jean-Louis, 175
Clemence, Samuel P., 72
Das, Braja M., 57DiGioia, Anthony M., Jr., 160
Filippas, Olga B., 1
Gagneux, M., 25Grigori, Mircea D., 1
Jin-Jaun, Yang, 57
Konstantinidis, Byron, 128Kulhawy, Fred H., 1, 96
Lapeyre, J. L,25Longo, Vito J., 160
Nicolaides, Costakis N., 96
186
O'Neill, Michael W., 110
Pacal, Albert J., 128
Rodgers, Thomas E., Jr., 81
Sheikh, Shamim A., 110Shively, Arthur W., 128Spry, Mary J., 1
Tedesco, Paul A., 15Thomas, Walter G., 15Trautmann, Charles H., 96Tucker, Keith D., 142Tucker, Larry M., 175
Verstraeten, Alexander J., 39
Weikart, Albert M., 72
Yazdanbod, Azaroghly, 110
Related Documents