Fortescue Metals Group Ltd ABN 57 002 594 872 Level 2, 87 Adelaide Terrace, East Perth, Western Australia 6004 PO Box 6915, East Perth, Western Australia 6892 P +61 8 6218 8888 E [email protected] W www.fmgl.com.au 100-TE-DC-0006_5 Page 1 of 2 The Companies Officer Australian Securities Exchange Ltd Level 40, Central Park 152-158 St Georges Terrace PERTH WA 6000 21 August 2020 Dear Madam or Sir Fortescue Ore Reserves and Mineral Resources Update: Operating Properties Fortescue Metals Group (ASX:FMG, Fortescue) presents the Ore Reserves and Mineral Resources statement for its Hematite and Magnetite operating properties as at 30 June 2020. Ore Reserves and Mineral Resources are reported in accordance with the Australasian Code for Reporting of Exploration Results, Mineral Resources and Ore Reserves, December 2012 (the 2012 JORC Code) as required by the Australian Securities Exchange (ASX). The annual summary will be included in Fortescue’s FY20 Annual Report and should be read in conjunction with the enclosed supporting technical information (Attachment 1 – Hematite Ore Reserves and Mineral Resources Report and Attachment 2 – Magnetite Ore Reserves and Mineral Resources Report). Summary Mineral Resources and Ore Reserves Operating Properties – Hematite Reporting 30 June 2020 30 June 2019 Basis Million Tonnes Fe % Million Tonnes Fe % Ore Reserves (Dry Product) 2,247 57.5 2,288 57.5 Mineral Resources (Dry In-Situ) 5,832 56.2 6,175 56.3 Summary Mineral Resources and Ore Reserves Operating Properties – Magnetite Reporting 30 June 2020 30 June 2019 Basis Million Tonnes (in-situ) Mass recovery % Fe % Million Tonnes (in-situ) Mass recovery % Fe % Ore Reserves (Dry Product) 716 (1) 29.4 67.0 716 (1) 29.4 67.0 Mineral Resources (Dry In-Situ) 5,448 22.7 30.4 5,448 22.7 30.4 1 dry product tonnes = dry in-situ tonnes x mass recovery Operating Properties include the Chichester and Solomon Hubs as well as the Eliwana deposit (part of the Western Hub). Ore deposit types include Bedded Iron (BID), Channel Iron (CID) and Detrital Iron (DID) mineralisation. Magnetite Properties refers to the Iron Bridge Magnetite Project.

Welcome message from author
This document is posted to help you gain knowledge. Please leave a comment to let me know what you think about it! Share it to your friends and learn new things together.
Transcript

Fortescue Metals Group Ltd ABN 57 002 594 872 Level 2, 87 Adelaide Terrace, East Perth, Western Australia 6004 PO Box 6915, East Perth, Western Australia 6892 P +61 8 6218 8888 E [email protected] W www.fmgl.com.au 100-TE-DC-0006_5 Page 1 of 2
The Companies Officer Australian Securities Exchange Ltd Level 40, Central Park 152-158 St Georges Terrace PERTH WA 6000 21 August 2020
Dear Madam or Sir
Fortescue Ore Reserves and Mineral Resources Update: Operating Properties
Fortescue Metals Group (ASX:FMG, Fortescue) presents the Ore Reserves and Mineral Resources statement for its Hematite and Magnetite operating properties as at 30 June 2020.
Ore Reserves and Mineral Resources are reported in accordance with the Australasian Code for Reporting of Exploration Results, Mineral Resources and Ore Reserves, December 2012 (the 2012 JORC Code) as required by the Australian Securities Exchange (ASX). The annual summary will be included in Fortescue’s FY20 Annual Report and should be read in conjunction with the enclosed supporting technical information (Attachment 1 – Hematite Ore Reserves and Mineral Resources Report and Attachment 2 – Magnetite Ore Reserves and Mineral Resources Report).
Summary Mineral Resources and Ore Reserves Operating Properties – Hematite
Reporting 30 June 2020 30 June 2019
Basis Million Tonnes Fe % Million Tonnes Fe %
Ore Reserves (Dry Product) 2,247 57.5 2,288 57.5
Mineral Resources (Dry In-Situ) 5,832 56.2 6,175 56.3
Summary Mineral Resources and Ore Reserves Operating Properties – Magnetite
Reporting 30 June 2020 30 June 2019
Basis
Million Tonnes (in-situ)
Mass recovery
% Fe %
Million Tonnes (in-situ)
Mass recovery
% Fe %
Ore Reserves (Dry Product) 716 (1) 29.4 67.0 716 (1) 29.4 67.0
Mineral Resources (Dry In-Situ) 5,448 22.7 30.4 5,448 22.7 30.4 1 dry product tonnes = dry in-situ tonnes x mass recovery
Operating Properties include the Chichester and Solomon Hubs as well as the Eliwana deposit (part of the Western Hub). Ore deposit types include Bedded Iron (BID), Channel Iron (CID) and Detrital Iron (DID) mineralisation. Magnetite Properties refers to the Iron Bridge Magnetite Project.

Fortescue Ore Reserves and Mineral Resources Update: Operating Properties Page 2 of 2
Insert our Number here
Chief Executive Officer Elizabeth Gaines said, “We are pleased to report over 2.2 billion tonnes of Hematite Ore Reserves and 5.8 billion tonnes of Mineral Resources at our operating properties, supporting the sustainability of our core iron ore assets across our Solomon and Chichester Hubs, as well as our developing Western Hub.”
“Our investment in significant growth projects including the Eliwana Mine and Rail Project in the Western Hub is now well advanced with first ore on train scheduled in December 2020. Our Iron Bridge Magnetite Project is developing Australia’s largest publicly disclosed magnetite Mineral Resource, with first ore on ship planned in the first half of calendar year 2022.”
Yours sincerely FORTESCUE METALS GROUP Authorised by CAMERON WILSON Company Secretary Media contact: Investor Relations contact: Michael Vaughan, Fivemark Partners Andrew Driscoll, GM Investor Relations E: [email protected] E: [email protected] M: +61 422 602 720 P: +61 8 9230 1647 Background The Iron Bridge Magnetite project is an Unincorporated Joint Venture (UJV) between FMG Iron Bridge Limited (88 per cent Fortescue and 12 per cent Baosteel) with a 69 per cent interest, and Formosa Steel IB Pty Ltd (a 100 per cent wholly owned entity of Formosa Plastics Group) with a 31 per cent interest.

1
––

2
Fortescue Hematite Mineral Resource Reporting as at 30 June 2020
The locations of the Operating Properties Mineral Resources (Cloudbreak, Christmas Creek, Kutayi, Eliwana, Firetail, Kings and Queens) are shown in Figure 1.
Figure 1

3
Chichester Deposits (Cloudbreak, Christmas Creek and Kutayi) Geology The Cloudbreak, Christmas Creek and Kutayi deposits lie within the Chichester Ranges, in northern Western Australia. Iron mineralisation is primarily hosted by the Nammuldi Member which is the lowest member of the late Archaean aged Marra Mamba Iron Formation (MMIF). The Nammuldi Member is characterised by extensive, thick and podded iron rich bands, separated by equally extensive units of siliceous and carbonate rich chert and shale. The Nammuldi Member in the Chichester Range is interpreted to be up to 60 metres in true thickness. Underlying the Nammuldi Member rocks are black shales and volcanic rocks belonging to the Jeerinah Formation. Extended periods of tectonic activity have variably folded and faulted these rocks, and induced weak metamorphism. Subsequent erosion and hardcapping or lateritic processes have altered the rocks, with present outcrop of Nammuldi Member rocks occurring along a ridge of low-lying hills (relief up to 30 metres) throughout the prospect areas. These ridges are recognised as the Chichester Ranges.
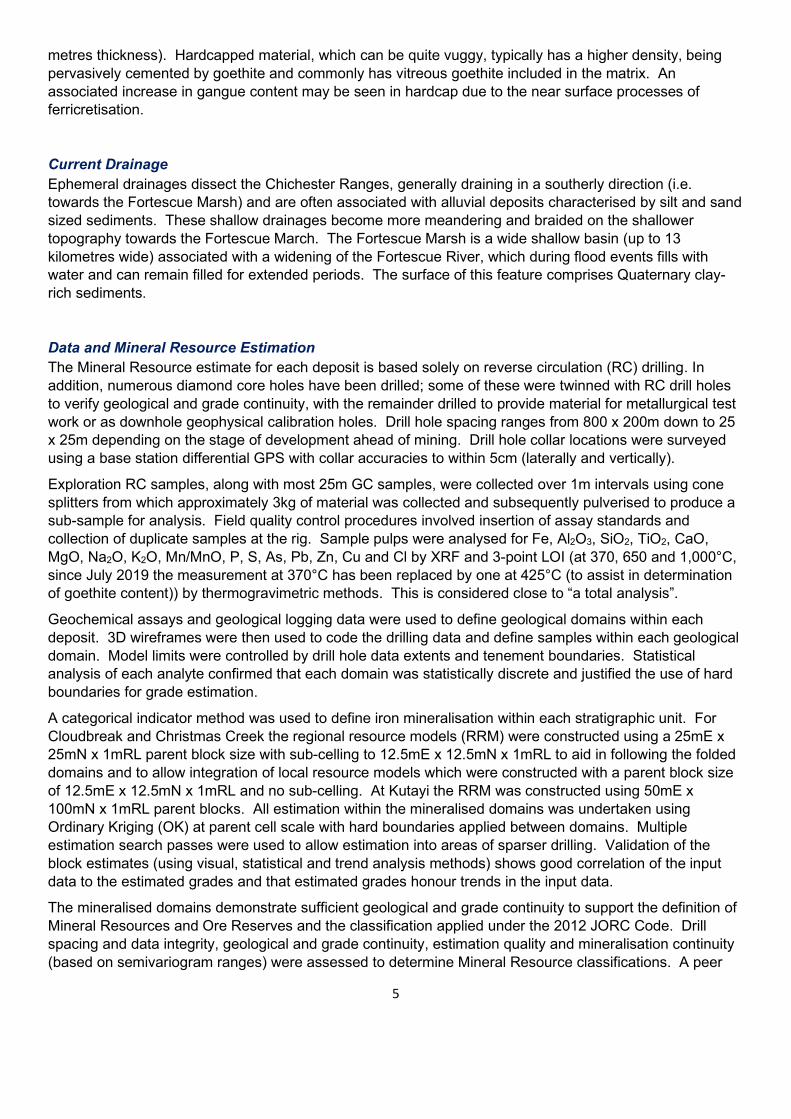
Drilling within the Chichester prospects has indicated that the Nammuldi target horizons extend below cover away from the hills, with mineralisation intersected more than 6 kilometres down-dip from the outcrop. In these regions, the target iron formation is often overlain by Tertiary age colluvium and alluvium (younger than 65 million years). The colluvium comprises both cemented and un-cemented detrital products of iron enriched material, banded iron formation (BIF), chert and shale within a matrix of finer grained sediments (including clays). Percolation of groundwater through the weathering profiles has precipitated both calcrete and ferricrete, creating resistant horizons within the extensive regolith. The Tertiary sediments thicken towards the south (i.e. towards the Fortescue Marsh), becoming progressively finer grained and more clay dominant, with some recognised calcareous zones. A simplified geological cross section through the Chichester Ranges is shown in Figure 2. A typical stratigraphic section of the Chichester Ranges is shown in Figure 3.
Figure 2
Simplified Schematic geological section through Chichester Ranges
Footwall BIF + shales
Nammuldi ore horizon
Hardcap and detritals
Alluvial Overburden
TARGET INTERVAL, NAMMULDI ORE
20 METRES
UP TO 4000 METRES

4
Figure 3
Structure The structural geology of the area is predominantly concealed with limited exposure in outcrop. However, small scale faulting and folding (metre offsets) are observed in some outcrops, and larger-scale faults are interpreted from aeromagnetics and regional mapping, plus drilling results. In places faults may be the conduit for the mineralisation (hypogene model).
Iron Mineralisation Styles Iron mineralisation characteristically comprises hematite, goethite and ocherous goethite, with variable degrees of alteration between these minerals. The main gangue minerals are kaolinite, quartz and gibbsite, with minor amounts of carbonates, either calcite or dolomite.
Iron is enriched in the parent BIF (iron layers banded with cherts and lesser carbonates) by processes of supergene and/or hypogene enrichment. In both processes, the original iron, which is present as magnetite bands within the BIF, is oxidised to hematite and goethite. Contemporaneous with the iron enrichment, the original gangue minerals are partially to fully leached out or may be replaced by iron minerals. These processes increase the iron content of the BIF depending upon the degree of enrichment. A volume loss of up to 35 per cent can occur with enrichment due to loss of gangue minerals.
Microplaty hematite (MplH) is recognised in varying degrees throughout Fortescue’s Chichester Range deposits. This is interpreted to occur due to hypogene enrichment of the MMIF in proximity to tectonic structures (faults or tight folds), which have allowed upward fluid flow, and low-grade metamorphism of the parent rock, resulting in extensive hematite mineralisation.
The majority of the iron mineralisation at the Chichester deposits, is interpreted to be martite-goethite resulting from supergene enrichment of a magnetite-rich BIF (oxidised to martite) parent rock.
Hardcapping (ferricrete development) of portions of the mineralisation has been identified in mapping and drilling. This process, which occurred during latter stages of geological development (Tertiary), has changed the physical and geochemical properties of the upper portions of the mineralisation (up to 10
Ta, Te, ToTa, Te, To
TdiTdi, , TdsTds, , TdmTdm
HcHc, , HsoHso
MuhMuh, Mum, , Mum, MufMuf
MutMut
MubMub
JrJr, , FjFj
Alluvium and colluvium, clay dominant transported material
Hardcapped material
Detritals, dominant with Iron Rich clasts
Primary bedded ore,Variable hardness material dependant upon degree of enrichemnt and cementation(hard, medium, friable)
Transition zone material, interbedded clays and iron ore
Unenriched BIF, high chert content
Jeerinah Formation, weathered shales, black and carbonaceous when fresh
Ter
tiary
Nam
mul
di M
embe
r
Fortescue Group
Typical stratigraphic section of Chichester Ranges ore intersection
5
metres thickness). Hardcapped material, which can be quite vuggy, typically has a higher density, being pervasively cemented by goethite and commonly has vitreous goethite included in the matrix. An associated increase in gangue content may be seen in hardcap due to the near surface processes of ferricretisation.
Current Drainage Ephemeral drainages dissect the Chichester Ranges, generally draining in a southerly direction (i.e. towards the Fortescue Marsh) and are often associated with alluvial deposits characterised by silt and sand sized sediments. These shallow drainages become more meandering and braided on the shallower topography towards the Fortescue March. The Fortescue Marsh is a wide shallow basin (up to 13 kilometres wide) associated with a widening of the Fortescue River, which during flood events fills with water and can remain filled for extended periods. The surface of this feature comprises Quaternary clay-rich sediments.
Data and Mineral Resource Estimation The Mineral Resource estimate for each deposit is based solely on reverse circulation (RC) drilling. In addition, numerous diamond core holes have been drilled; some of these were twinned with RC drill holes to verify geological and grade continuity, with the remainder drilled to provide material for metallurgical test work or as downhole geophysical calibration holes. Drill hole spacing ranges from 800 x 200m down to 25 x 25m depending on the stage of development ahead of mining. Drill hole collar locations were surveyed using a base station differential GPS with collar accuracies to within 5cm (laterally and vertically).
Exploration RC samples, along with most 25m GC samples, were collected over 1m intervals using cone splitters from which approximately 3kg of material was collected and subsequently pulverised to produce a sub-sample for analysis. Field quality control procedures involved insertion of assay standards and collection of duplicate samples at the rig. Sample pulps were analysed for Fe, Al2O3, SiO2, TiO2, CaO, MgO, Na2O, K2O, Mn/MnO, P, S, As, Pb, Zn, Cu and Cl by XRF and 3-point LOI (at 370, 650 and 1,000°C, since July 2019 the measurement at 370°C has been replaced by one at 425°C (to assist in determination of goethite content)) by thermogravimetric methods. This is considered close to “a total analysis”.
Geochemical assays and geological logging data were used to define geological domains within each deposit. 3D wireframes were then used to code the drilling data and define samples within each geological domain. Model limits were controlled by drill hole data extents and tenement boundaries. Statistical analysis of each analyte confirmed that each domain was statistically discrete and justified the use of hard boundaries for grade estimation.
A categorical indicator method was used to define iron mineralisation within each stratigraphic unit. For Cloudbreak and Christmas Creek the regional resource models (RRM) were constructed using a 25mE x 25mN x 1mRL parent block size with sub-celling to 12.5mE x 12.5mN x 1mRL to aid in following the folded domains and to allow integration of local resource models which were constructed with a parent block size of 12.5mE x 12.5mN x 1mRL and no sub-celling. At Kutayi the RRM was constructed using 50mE x 100mN x 1mRL parent blocks. All estimation within the mineralised domains was undertaken using Ordinary Kriging (OK) at parent cell scale with hard boundaries applied between domains. Multiple estimation search passes were used to allow estimation into areas of sparser drilling. Validation of the block estimates (using visual, statistical and trend analysis methods) shows good correlation of the input data to the estimated grades and that estimated grades honour trends in the input data.
The mineralised domains demonstrate sufficient geological and grade continuity to support the definition of Mineral Resources and Ore Reserves and the classification applied under the 2012 JORC Code. Drill spacing and data integrity, geological and grade continuity, estimation quality and mineralisation continuity (based on semivariogram ranges) were assessed to determine Mineral Resource classifications. A peer

6
review process, whereby each model is reviewed at key stages of the model development, ensures the integrity and quality of each model. Additionally, a final review of each model is conducted by the Competent Person.
For Mineral Resource reporting, the Cloudbreak and Christmas Creek RRM were regularised to a 12.5mE x 12.5mN x 1mRL block size prior to merging with the local resource models (LRM). The resulting combined models were then depleted for all mining based on the surveyed mined surfaces as at 31 March 2020. Areas where mining has been completed and confirmed that no ore remains, were excluded from the Mineral Resource reporting. Similarly, heritage restricted areas (where appropriate) have been excluded from the Mineral Resource. Adjustments were then made to the Measured Mineral Resources to subtract the mined tonnage (assumed at average grade) for April, May and June 2020, and to add in the stockpiled tonnes as at the end of June 2020. As such, the reported Mineral Resources are considered to be depleted for all mining to end June 2020.

7
Solomon Deposits (Firetail, Kings and Queens) Geological Setting The Solomon Project area is situated approximately 60 kilometres to the north of the Tom Price township in the northern Hamersley ranges (Figure 1). Outcropping geology in the project area is dominated by the Dales Gorge, Whaleback Shale and Joffre Members of the Brockman Iron Formation which hosts large bedded iron deposits (BID) throughout the Hamersley Province. The Firetail deposit comprises the majority of BID tonnes at Solomon, where geologically favourable environments have allowed for the formation and preservation of large tonnages of bedded iron mineralisation.
Incised into the bedrock geology are regional palaeochannel systems, predominantly one to two kilometres in width, and stretching for tens of kilometres. During the Miocene period, deep chemical weathering and erosion of iron rich material into these fluvial channels has formed channel iron deposits (CID). The CID is subdivided into an upper ‘hard CID’ and a lower ‘ochreous CID’. Clay lenses within the CID are observed as semi-discrete bands, often several meters thick. The clay lenses are somewhat discontinuous and of a poddy nature although often traceable between drill holes. CID of approximately 40 km strike length is preserved in the Kings CID system, with an additional 25 km of CID located in the Serenity deposit to the west. Other CID occurrences are also known throughout the Solomon project area. The material overlying the CID (and other areas) has been eroded from adjacent mineralised and un-mineralised bedrock. This clastic material is concentrated into horizons of elevated iron grade termed detrital iron deposits (DID), which forms part of the sequence of overlying late Tertiary aged alluvial and colluvial deposits. A simplified geological section through the Solomon deposit is shown in Figure 4.
Figure 4

8
Data and Mineral Resource Estimation The Mineral Resource estimate for each deposit is based solely on reverse circulation (RC) drilling. In addition, diamond core holes have been drilled to provide material for metallurgical test work and some to twin with RC drill holes to verify the geological and grade continuity. Several RC/RC twins were also drilled to confirm geological and grade continuity. No major biases were identified. Drill hole spacing ranges from 400 x 100m down to 25 x 25m, depending on the stage of development ahead of mining. Drill hole collar locations were surveyed using a base station differential GPS with collar accuracies to within 10cm (laterally and vertically).
Exploration RC samples, along with most 25m GC samples, were collected over 1m intervals using cone splitters from which approximately 3kg of material was collected and subsequently pulverised to produce a sub-sample for analysis. Field quality control procedures involved insertion of assay standards and collection of duplicate samples at the rig. Sample pulps were analysed for Fe, Al2O3, SiO2, TiO2, CaO, MgO, Na2O, K2O, Mn/MnO, P, S, As, Pb, Zn, Cu and Cl by XRF and 3-point LOI (at 370, 650 and 1,000°C, since July 2019 the measurement at 370°C has been replaced by one at 425°C (to assist in determination of goethite content)) by thermogravimetric methods. This is considered close to “a total analysis”.
Geochemical assays and geological logging data were used to define geological domains within each deposit (Table 1). 3D wireframes were then used to code the drilling data and define samples within each geological domain. Model limits were controlled by drill hole data extents and tenement boundaries. Statistical analysis of each analyte confirmed that each domain was statistically discrete and justified the use of hard boundaries for grade estimation.
Table 1 - Geological Domains within the Solomon regional resource models
Firetail North Firetail South Kings Queens Detritals Detritals Detritals Detritals CID Lower Hardcap Hardcap (CID) Oakover J1 CID Lower CID Upper Hardcap J2 Joffre CID Lower CID Upper J3 Whaleback Shale Bedded CID Lower Whaleback Shale D4 Joffre Peat D4 D3 Whaleback Shale Bedded D3 D2 D4 Dolerite Dykes D2 D1 D3 D1 Mt. McRae Shale D2 Mt. McRae Shale D1 Mt. McRae Shale
A categorical indicator method was used to define iron mineralisation within each stratigraphic unit. The block models were constructed using a parent block size appropriate for the drill hole spacing. In the Firetail South area, sub-celling to 5.0mE x 5.0mN x 0.25mRL was used, in Kings and Firetail North a minimum block size of 12.5mE x 12.5mN x 1mRL was used and in the Queens area parent cells of 50mE x 25mN x 1mRL with sub-celling to 12.5mE x 12.5m N x 1mRL was used. All estimation was undertaken using inverse distance or ordinary kriging at parent cell scale. Hard boundaries were applied between all estimation domains, with multiple search passes used in areas of sparser drilling. Validation of the block models (using visual, statistical and trend analysis methods) shows good correlation of the input data to the estimated grades and that the estimated blocks honour the trends in the input sample data.

9
The mineralised domains demonstrate sufficient geological and grade continuity to support the definition of Mineral Resources and Ore Reserves and the classification applied under the 2012 JORC Code. Drill spacing and data integrity, geological and grade continuity, estimation quality and mineralisation continuity (based on semivariogram ranges) were assessed to determine Mineral Resource classifications. A peer review process, whereby each model is reviewed at key stages of the model development, ensures the integrity and quality of each model. Additionally, a final review of each model is conducted by the Competent Person.
For Mineral Resource reporting, the Firetail, Kings and Queens regional resource models were regularised to a 12.5mE x 12.5mN x 1mRL block size prior to merging with the local models. The resulting combined models were then depleted for all mining based on the surveyed mined surfaces as at 31 March 2020. Areas where mining has been completed and confirmed that no ore remains, were excluded from the Mineral Resource reporting. Similarly, heritage restricted areas (where appropriate) have been excluded from the Mineral Resource. Adjustments were then made to the Measured Mineral Resources to subtract the mined tonnage (assumed at average grade) for April, May and June 2020, and to add in the stockpiled tonnes as at the end of June 2020. As such, the reported Mineral Resources are considered to be depleted for all mining to end June 2020.

10
Eliwana (part of Western Hub) Project location The Eliwana deposit is located approximately 100km north-west of Tom Price and 120km west of Fortescue’s Solomon operations in the Pilbara region of Western Australia (Figure 1).
Geology The Eliwana deposit occurs on the southern limb of the Jeerinah anticline in the western Hamersley Province. The deposit covers a narrow zone that follows the outcrop of mineralised Brockman and Marra Mamba Iron Formations, with Tertiary sediments in the valleys separating these formations. Iron mineralisation predominantly occurs as bedded iron deposits (BID) with some detrital iron deposits (DID). The mineralisation, which occurs at surface and extends to depths of 350m below surface (Figure 5), is variably distributed across an area of approximately 40km along strike and 3.5km across strike.
Figure 5 - Eliwana schematic geological cross section
Data and Mineral Resource Estimation Drill samples at Eliwana are primarily from reverse circulation (RC) drilling with samples of approximately 3kg collected at 1m intervals using cone splitters. The drill spacing is variable across the deposits depending on the development stage and ranges from 800 x 100m down to 50 x 25m.
All data is captured electronically and passes extensive quality assurance and quality control (QAQC) procedures. QAQC is an ongoing analysis and includes validation of drill hole collar coordinates, field standards, laboratory standards, field duplicates, twin holes, as well as ‘round robin’ checks between laboratories. Results of the QAQC show that good precision and accuracy has been achieved and that no systematic bias is evident. Sample pulps were analysed for Fe, Al2O3, SiO2, TiO2, CaO, MgO, Na2O, K2O, Mn/MnO, P, S, As, Pb, Zn, Cu and Cl by XRF and 3-point LOI (at 370, 650 and 1,000°C, since July 2019 the measurement at 370°C has been replaced by one at 425°C (to assist in determination of goethite content)) by thermogravimetric methods. This is considered close to “a total analysis”.
Geochemical assays and geological and geophysical (natural gamma) logging data were used to define geological domains within each deposit. 3D wireframes were then used to code the drilling data and define samples within each geological domain. Model limits were controlled by drill hole data extents and tenement boundaries. Statistical analysis of each analyte confirmed that each domain was statistically discrete and justified the use of hard boundaries for grade estimation.

11
A categorical indicator method was used for most deposits to define iron mineralisation within each stratigraphic unit. The resource models were constructed using a parent block size which is nominally half the dominant drill spacing for each deposit, with sub-celling along domain boundaries. Estimation within the mineralised domains was undertaken using Ordinary Kriging (OK) at the parent cell scale with hard boundaries applied between domains. Multiple estimation search passes were used to allow estimation into areas of sparser drilling. Validation of the block estimates (using visual, statistical and trend analysis methods) shows good correlation of the input data to the estimated grades and that estimated grades honour trends in the input data.
The mineralised domains demonstrate sufficient geological and grade continuity to support the definition of Mineral Resources and Ore Reserves and the classification applied under the JORC Code. Drill spacing and data integrity, geological and grade continuity, estimation quality and mineralisation continuity (based on semivariogram ranges) were assessed to determine Mineral Resource classifications. A peer review process, whereby each model is reviewed at key stages of the model development, ensures the integrity and quality of each model. Additionally, a final review of each model is conducted by the Competent Person.

12
Table 2 - Hematite Mineral Resources (Operating Properties) - as at 30th June 2020
June 2020 June 2019
In-Situ Tonnes
(mt)
Iron Fe %
Silica SiO2
%
Alumina Al2O3
%
Phos P %
Loss On Ignition LOI %
In-Situ Tonnes
(mt)
Iron Fe %
Silica SiO2
%
Alumina Al2O3
%
Phos P %
Loss On Ignition LOI %
Cloudbreak
Measured 419 56.6 5.75 3.45 0.058 8.7 460 56.6 5.69 3.44 0.058 8.6
Indicated 401 56.2 6.63 3.41 0.060 8.0 414 56.2 6.66 3.43 0.060 8.0
Inferred 117 56.4 6.29 3.62 0.054 7.6 123 56.4 6.31 3.60 0.054 7.7
Total 936 56.4 6.20 3.45 0.058 8.2 997 56.4 6.17 3.45 0.058 8.3
Christmas Creek
Measured 480 56.7 6.37 3.15 0.049 7.9 556 56.9 6.28 3.13 0.047 7.9
Indicated 922 56.1 6.59 3.70 0.051 7.9 935 56.1 6.59 3.70 0.051 7.9
Inferred 447 55.6 6.91 3.79 0.054 7.9 463 55.6 6.90 3.80 0.055 7.9
Total 1,849 56.1 6.61 3.58 0.051 7.9 1,954 56.2 6.57 3.56 0.051 7.9
Sub-total Chichester Hub
Measured 898 56.7 6.08 3.29 0.053 8.2 1,016 56.8 6.01 3.27 0.052 8.2
Indicated 1,323 56.1 6.61 3.61 0.054 7.9 1,349 56.1 6.61 3.62 0.054 7.9
Inferred 564 55.8 6.78 3.75 0.054 7.9 586 55.8 6.77 3.75 0.055 7.8
Total 2,785 56.2 6.47 3.54 0.054 8.0 2,951 56.3 6.44 3.53 0.053 8.0
Firetail
Measured 3 57.1 7.25 3.76 0.111 6.6 14 57.9 6.28 3.34 0.121 6.9
Indicated 166 57.9 6.94 2.74 0.119 6.9 195 58.1 6.86 2.67 0.119 6.8
Inferred 102 56.1 8.00 3.77 0.107 7.4 110 56.1 8.02 3.74 0.106 7.4
Total 271 57.2 7.34 3.14 0.115 7.1 319 57.4 7.23 3.07 0.115 7.0
Kings and Queens
Measured 204 55.3 7.72 3.52 0.085 9.1 183 54.8 7.48 3.31 0.086 10.4
Indicated 1,111 55.0 8.18 3.27 0.078 9.0 1,137 55.1 8.25 3.34 0.079 9.0
Inferred 535 54.6 8.88 3.75 0.076 8.5 585 54.6 8.71 3.72 0.079 8.7
Total 1,851 54.9 8.33 3.44 0.078 8.9 1,905 54.9 8.32 3.44 0.080 9.0
Sub-total Solomon Hub
Measured 208 55.3 7.71 3.53 0.085 9.1 197 55.1 7.39 3.15 0.089 10.1
Indicated 1,277 55.3 8.02 3.20 0.083 8.7 1,331 55.5 8.05 3.25 0.085 8.7
Inferred 636 54.9 8.74 3.75 0.081 8.3 694 54.9 8.60 3.72 0.083 8.5
Total 2,121 55.2 8.21 3.40 0.083 8.6 2,223 55.3 8.16 3.39 0.085 8.7

13
Eliwana
Measured 229 60.0 4.89 2.61 0.141 5.8 229 60.0 4.89 2.61 0.141 5.8
Indicated 122 58.4 5.44 2.77 0.096 7.2 122 58.4 5.44 2.77 0.096 7.2
Inferred 575 58.1 5.69 3.45 0.102 6.9 650 58.1 5.76 3.40 0.102 7.0
Total 926 58.6 5.46 3.16 0.111 6.7 1,001 58.6 5.52 3.14 0.110 6.7
Total Hematite Operational Mineral Resources
Measured 1,335 57.0 6.13 3.21 0.073 8.0 1,442 57.0 6.02 3.15 0.071 8.1
Indicated 2,722 55.9 7.22 3.38 0.069 8.2 2,802 55.9 7.24 3.40 0.071 8.2
Inferred 1,776 56.2 7.13 3.66 0.079 7.7 1,930 56.2 7.09 3.62 0.081 7.8
Total 5,832 56.2 6.94 3.43 0.073 8.0 6,175 56.3 6.91 3.41 0.074 8.1
Notes in reference to table • Chichester Hub Mineral Resources are quoted above a cut-off grade of 53.5% Fe, Solomon Hub and Eliwana Mineral Resources are quoted above a
cut-off grade of 51.5% Fe. • The Measured Mineral Resource estimate includes mine stockpiles totalling approximately 32Mt. • Mineral Resources are reported inclusive of Ore Reserves. • Tonnage information has been rounded and as a result the figures may not add up to the totals quoted.

14
Fortescue Hematite Ore Reserve Reporting as at 30 June 2020
Ore Reserves Fortescue Ore Reserves are based on integrating contributions from the various mine-sites and assembling bedded iron deposit (BID) and channel iron deposit (CID) into blended saleable products at the port.
The BID products are West Pilbara Fines (WPF), Fortescue Blend (FB) and Super Special Fines (SSF). The CID product is Kings Fines (KF). Within the primary BID and CID product streams, controlled blending of non-primary ore types occurs on an opportunistic basis to optimise product outcomes.
Due to the deposit integration inherent in the Ore Reserve, the following supporting data is comprehensive and addresses the Ore Reserve generation process collectively for all deposits.
Mining Models Mining Models consist of regularised regional resource models (RRM) overprinted with local models. Application of reconciliation grade adjustment factors to incorporate historical mining losses and dilution into the in-situ estimates is used to generate estimates of Run of Mine (ROM) ore. Conversion of ROM to Product by the ore processing facilities (OPFs) is achieved by the application of OPF upgrade factors. This process is summarised as:
1. The regional resource models are regularized to a block size consistent with both the RRM and the local model block size (typically 12.5m x 12.5m x 1m).
2. The local models are created with an origin and orientation consistent with the RRM. 3. Merged models are then created by over printing the RRM with the local models. 4. The Merged Models are regularised to a block size consistent with the selective mining unit (SMU)
that is appropriate to the mining method that will be applied for each style of deposit (eg 25m x 25m x 3m).
5. Factoring of in-situ grades is based on reconciliation between the underlying models (Resource or GC) and actual diluted plant feed, back-calculated from sales. Twelve months of historical model performance is used to derive factored grades in the Mining Models. Grade adjustment factors for Fe and major impurities (SiO2 and Al2O3) are typically minor.
6. Application of respective OPF mass yield and upgrade factors. The Chichester OPFs and Solomon CID mining models incorporate theoretical OPF yields and upgrade factors based on metallurgical test-work, calibrated to historical results. The Firetail and Eliwana OPFs are operating in “dry” mode and therefore have no beneficiation factors applied.
Scheduling Inventory Pit optimisation software is used to determine how the mining inventory varies as a function of ore cut-off grade (Fe) and limiting strip-ratio for selected ultimate pit wall slopes.
A combination of selected Fe cut-off and limiting strip ratio is then used to identify the starting geometry for the pit design. Higher strip-ratio peripheral shells are used to identify where ramps should be located without unnecessarily compromising value.
Due to the large lateral extensions and flat and shallow nature of the deposits in the Chichesters it is not feasible, nor necessary, to maintain detailed ultimate pit designs for the entire deposits. Life of Mine (LOM) planning is carried out using Lerchs-Grossman pit optimisation geometries (with conservative slope angles) to generate inventories based on limiting strip ratios. Detailed pit designs are developed closer to the time of mining of the deposit parts, incorporating the required ramp and wall geometries to facilitate safe, practical and efficient mining.

15
Solomon and Eliwana mining is by conventional drill and blast followed by excavators, and Life of Mine (LOM) ultimate pit designs are generated and used as the bounding geometry for Ore Reserves estimation.
In all cases, Inferred material is converted to waste, generating mining costs but contributing no revenue.
Mine Scheduling Mine scheduling is integrated across all Fortescue properties to maximise value. Chichester mineralisation is combined with Solomon BID (principally from Firetail, and with Eliwana) to manufacture the BID blended products – West Pilbara Fines, Fortescue Blend and Super Special Fines. The CID product, Kings Fines is predominantly sourced from the Kings and Queens deposits and will include a proportion of BID and detrital iron deposit (DID) mineralisation incidental to mining the CID channels.
Scheduling aims to maintain the target blended ore quality and maximise NPV. In general terms this equates to deferring higher strip ratio, higher mining cost mineralisation until later in the collective scheduled mine life. A leading edge linear programming tool is used to identify the integrated mining sequence that will deliver the maximum NPV for the nominated constraints. Major constraints include the nominated ore tonnage and blend quality and the maximum OPF treatment rates that, in turn, are matched to the logistics capacity of the Fortescue rail and port system.
Blending between sites takes advantage of impurity synergies that maximise the ore supply relative to products being sourced from single sites. The proportion of each of the collective BID and CID products will change with time depending on the respective ore quality being delivered from individual deposits. The constituent products are manufactured at the port by blending individual trains onto port stockpiles.
The scheduling inventory is initially collected into ore “bins” based on Fe and impurity cut-offs. Since mineralisation distributions and presentation varies with time, so too may the shorter term effective ore cut-off grade. The Ore Reserve cut-off can be approximated by an Fe-only cut-off that closely approximates that portion of the scheduling inventory that is converted into product over the life of the Ore Reserve schedule (see below).
Financial Analysis The scheduling programme utilises unit revenue (per product brand) and cost (per deposit per activity) information to allow an NPV to be targeted and to allow relative NPV values to be assigned to schedule alternatives, however these do not constitute a robust valuation. Further financial analysis to determine more realistic absolute financial indicators and sensitivity analysis is performed separately using the quantity and quality data extracted from the scheduler. This analysis is performed by the Finance team using audited business valuation models and assumptions.
A +/-30% sensitivity of the main financial drivers was carried out on the base case valuation and was demonstrated to be robustly NPV positive under all cases tested.
Ore Reserve Statement The Fortescue hematite Ore Reserve is quoted on a dry product basis, post processing, as of 30 June 2020. Individual BID deposits included in the Ore Reserve include Cloudbreak, Christmas Creek, Kutayi, Firetail and Eliwana.
The Kings and Queens Ore Reserves are principally CID mineralisation.
Due to opportunistic blending and stockpiling, the Ore Reserve is not reported at a fixed cut-off. However, the reported Ore Reserve quantity and quality can be closely approximated by the following ROM Fe cut-off grades:

16
Site ROM Cut-Off Grade (%Fe)
Cloudbreak ~53.5 Christmas Creek ~53.5 Kutayi ~54.5 Firetail ~55.5 Kings ~51.5 Queens ~53.5 Eliwana ~56.0
Ore Reserves are summarised in Table 3.

17
Table 3 - Hematite Ore Reserves as at 30 June 2020
June 2020 June 2019
Product Tonnes
(mt)
Iron Fe %
Silica SiO2
%
Alumina Al2O3
%
Phos P %
Loss On Ignition LOI %
Product Tonnes
(mt)
Iron Fe %
Silica SiO2
%
Alumina Al2O3
%
Phos P %
Loss On Ignition LOI %
Cloudbreak
Proved 266 57.2 5.12 2.70 0.055 8.56 231 57.6 5.29 2.69 0.055 8.28
Probable 294 57.2 5.47 2.65 0.059 7.93 255 57.4 5.82 2.67 0.063 7.67
Total 560 57.2 5.30 2.67 0.057 8.23 486 57.5 5.57 2.68 0.059 7.96
Christmas Creek
Proved 315 56.9 6.01 2.63 0.045 7.81 340 56.9 6.07 2.75 0.048 7.59
Probable 528 57.0 5.78 3.12 0.050 7.70 492 57.5 5.18 2.96 0.054 7.61
Total 843 57.0 5.87 2.93 0.048 7.74 832 57.3 5.54 2.88 0.052 7.60
Sub-total Chichester Hub
Proved 581 57.1 5.60 2.66 0.050 8.15 570 57.2 5.75 2.73 0.051 7.86
Probable 822 57.1 5.67 2.95 0.053 7.78 748 57.5 5.40 2.86 0.057 7.63
Total 1,404 57.1 5.64 2.83 0.052 7.94 1,318 57.4 5.55 2.80 0.055 7.73
Firetail
Proved 2 59.3 5.77 2.96 0.116 5.81 8 59.5 5.69 2.58 0.115 6.07
Probable 82 59.9 5.22 2.25 0.110 6.56 118 59.1 6.02 2.24 0.112 6.61
Total 84 59.9 5.23 2.27 0.111 6.54 126 59.1 6.00 2.26 0.113 6.57
Kings and Queens
Proved 99 57.3 6.22 2.88 0.075 9.04 102 56.0 6.29 2.72 0.078 10.54
Probable 451 57.3 6.20 2.38 0.070 9.53 539 56.9 6.68 2.69 0.070 8.79
Total 550 57.3 6.20 2.47 0.071 9.44 641 56.8 6.62 2.70 0.071 9.07
Sub-total Solomon Hub
Proved 101 57.3 6.21 2.88 0.076 8.97 110 56.3 6.24 2.71 0.080 10.22
Probable 533 57.7 6.04 2.36 0.076 9.07 657 57.3 6.56 2.61 0.077 8.40
Total 634 57.6 6.07 2.44 0.076 9.05 768 57.2 6.52 2.63 0.078 8.66
Eliwana
Proved 143 60.6 4.55 2.47 0.137 5.52 136 60.8 4.39 2.41 0.137 5.41
Probable 66 58.9 5.00 2.61 0.102 7.09 96 58.7 5.28 2.64 0.096 7.10
Total 209 60.1 4.69 2.52 0.126 6.02 202 60.1 4.68 2.49 0.124 5.96
Total Hematite Ore Reserves
Proved 826 57.7 5.49 2.66 0.068 7.80 816 57.7 5.59 2.67 0.069 7.77
Probable 1,421 57.4 5.78 2.71 0.064 8.23 1,471 57.5 5.91 2.74 0.068 7.95
Total 2,247 57.5 5.67 2.69 0.066 8.07 2,288 57.5 5.80 2.72 0.068 7.89

18
Notes in reference to table 3 • All Ore Reserve estimates are quoted on a dry product, post processed basis. • The diluted mining models used to report the 2020 Ore Reserves are based on regional Mineral Resource models completed in 2016 for Christmas
Creek, 2016 for Cloudbreak, 2018 for Firetail, 2019 for Queens, 2017 for Kings, 2019 for Kutayi and 2019 for Eliwana. The regional models for the operating sites were updated for local pit areas as infill drilling is completed, with updates included through to 2019.
• Diluted mining models are validated by reconciliation against historical production. • Proved Ore Reserves are inclusive of ore stockpiles at the mines which total approximately 33.6Mt on dry product basis. • The Chichester Ore Reserve is inclusive of the Cloudbreak, Christmas Creek and Kutayi BID deposits. Selected Christmas Creek Ore Reserves
will be directed to the Cloudbreak OPF to optimise upgrade performance and optimise Cloudbreak and Christmas Creek OPF utilisation. • Tonnage figures have been rounded and may not add up to the totals quoted.

19
JORC Code, 2012 Edition – Table 1 Fortescue Chichester Deposits (Cloudbreak, Christmas Creek and Kutayi)
Section 1 Sampling Techniques and Data Criteria Commentary
Sampling techniques
The deposits are sampled using Reverse Circulation (RC) and Diamond drill holes (DD). Drill hole spacing ranges from 800 x 200m to a staggered 50 x 50m pattern. In the area of the original test pit this was reduced to 12.5 x 12.5m (plus some at 6.5 x 6.5m). Drilling for local resource models uses a 25 x 25m pattern (where achievable). RC samples only are used for resource estimation. Approximately 30% of holes are downhole geophysically logged. Initial exploration holes were assayed from collar to end of hole. Partway through the exploration program the sampling regime was modified and analysis was restricted to samples with visually higher Fe, subsequent infill holes are sampled in a similar manner. This may mean that not all potentially mineralised material has been analysed.
All holes are surveyed by qualified surveyors using a Base station Differential GPS, with collar accuracies to within 5 centimetres (laterally and vertically). Analytical standards were used to assist in checking laboratory results. Field duplicates are used to assist with determining sampling quality at the rig. Geophysical probes are calibrated on a regular basis (using static methods and specific calibration holes).
For RC drilling, samples from 0.5m or 1m intervals pass through cyclone and cone splitter, 2-3kg sample collected in calico bag (~6-7% of samples total volume). Samples from mineralised zones (plus ~3-4m above and below), as selected, are sent for analysis.
Drilling techniques
Standard face sampling hammer drilling samples from ~130mm or ~140mm diameter RC drill holes used for Resource Estimation. Over 200 diamond drill holes have been completed. Some of these were drilled as twins to RC holes, the rest were drilled to provide samples for metallurgical test work, to provide geotechnical information or for downhole geophysical data calibration purposes, they were not incorporated into resource models.. Most holes were PQ size, core was not oriented as the majority of the holes were drilled vertically. No diamond drill hole data has been used for grade estimation. Drilling of large diameter (Bauer) holes (0.78 or 1m) commenced during the Exploration phase and ceased in ~2010. These holes were limited to shallow parts of the deposit (by working depth of rigs). Samples were primarily used for metallurgical test work, data from these holes was not used in creation of any model.
Drill sample recovery
The quality of each sample is recorded at the time of logging and categorised as either poor, moderate or good.
No significant issues with sample collection system identified during Exploration drilling or subsequent infill programs. Minimal loss of fines was achieved through the use of an automated sample collection and splitting system.
There is assumed to be no expected relationship between sample recovery and grade.
Logging
Geological logging was completed by personnel experienced in iron mineralisation, logging considered to be adequate for resource estimation.
Quantitative – chemical analysis of samples logged as mineralised, downhole geophysical surveys of approximately 30% of drill holes. Qualitative – logging is completed over the whole drill hole, based on this 'ore' +/- 3-4m surrounding waste is submitted for analysis. Detailed texture logging of infill drilling ceased during 2017, a smaller data set is now collected. There is some risk of material being mis-logged and therefore not analysed.

20
Criteria Commentary
Effectively 100% for RC during Exploration, limited to mineralised intersections +/- 3-4m surrounding waste during infill programs.
Sub-sampling techniques and sample preparation
The majority of diamond holes were drilled to provide material for metallurgical testwork. No assays from diamond holes were used in the estimates.
Samples are collected in labelled bags from each 1m of drilling, which are stored onsite or sent for analysis. These samples are collected using a cone splitter installed directly beneath the cyclone. Wet samples are collected using the same technique as dry samples, with thorough cleaning of equipment between samples. Wet samples are allowed to dry before being processed. For drill rigs using riffle splitters, once wet samples are encountered, the splitter is changed to a chisel splitter. Larger samples are collected and later split.
All sub-sample preparation undertaken by the laboratory performing the sample analysis.
Field QC procedures involved the use of certified reference material as assay standards together with the collection of duplicate samples.
During Exploration drilling, field (rig) duplicates were collected at a rate of 1 in 20 samples at Cloudbreak and Christmas Creek, and at a rate of 3 in 100 samples at Kutayi. Analysis of duplicates did not indicate that there were any issues. QA/QC reports are available. For infill drilling, field (rig) duplicates were originally collected every 50 samples, subsequently increased to every 33 samples. Sample numbers are pre-determined, therefore it is possible that not all duplicates will be analysed. Monthly QA/QC reports are now routinely prepared.
No formal analysis of the appropriateness of sample size compared to grain size has been completed but the sampling regime is considered to be industry best practice.
Quality of assay data and laboratory tests
Various laboratories have been used, including SGS (Christmas Creek and Perth), Ultra Trace (now Bureau Veritas) and Intertek (Cloudbreak, Christmas Creek, Mt Webber, and Perth) and Genalysis (Perth). All laboratories have National Association of Testing Authorities, Australia (NATA) accreditation (or conform with NATA accreditation). All chemical analysis by XRF using 'standard iron ore suite' (reported as Fe, Al2O3, SiO2, TiO2, CaO, MgO, Na2O, K2O, MnO (Exploration) or Mn (infill), P and S). Also 3-point LOI (370, 650 & 1,000°C, the analysis at 370ºC was replaced by one at 425ºC in July 2019) by thermogravimetric methods. This is considered to be close to “a total analysis”. From early 2013 As, Pb, Zn, Cu and Cl have also routinely been included in sample analysis.
Details of geophysical tools used for downhole geophysical analysis are available in the drill hole database.
Exploration (Cloudbreak and Christmas Creek) - Field (rig) duplicates collected 1 in 20 samples. Standards submitted at 1 in every 50 samples. Analysis of duplicates and standards did not indicate that there were any issues. QA/QC reports were prepared. Exploration (Kutayi) - Field (rig) duplicates collected 3 in 100 samples. Standards submitted at 1 in every 100 samples. Analysis of duplicates and standards did not indicate that there were any issues. QA/QC reports were prepared. Infill - Field (rig) duplicates collected 1 in 50 samples. Standards submitted at 1 in every 100 samples (historically). Since ~Q1 2009, field duplicates collected 1 in 33 samples and standards submitted 1 in 50. Sample numbers for duplicates & standards are pre-determined, if they occur in waste in a drill hole they may not end up being submitted to the laboratory for analysis. QA/QC is performed on laboratory analyses prior to accepting the data in the acQuire database. Monthly QA/QC reports are now routinely prepared. Concerns over the quality of a few of the historical standards have been raised. Through investigation it appears that this is due to standard preparation methods, size

21
Criteria Commentary
of standards, and homogenisation issues (similar problems have not been noted in newer standards). Also issues with inadequate round-robin testing resulting in over-precise certified values.
Verification of sampling and assaying
Significant intersections have been visually inspected by senior Fortescue personnel and by independent consultants.
Approximately 40 RC drill holes were twinned with diamond drill holes. In general there was good correlation between both grade and geology.
Several different methods/systems have been used to store sample data (including GBIS and an ‘in-house’ system). The sample data is now stored in customised acQuire drill hole databases, which include a series of automated electronic validation checks. Fortescue data entry procedures are documented. Only trained personnel perform further manual data validation.
Conversion of MnO% to Mn% for grade estimation has been made where necessary (mainly exploration data). Samples with analytes reporting below detection limits are given the value of half the detection limit of that analyte.
Location of data points
All holes were surveyed by qualified surveyors using a Base station Differential GPS, with collar accuracies to within 5 centimetres (laterally and vertically) (or better at Kutayi) or Real Time Kinematic GPS with collar accuracies to within 10-30mm (laterally and vertically). Holes for which there is no collar survey data, or where the collar RL is significantly different from the topographic surface, are excluded from regional and local modelling.
Grid coordinates given for each point are Map Grid of Australia (GDA94) and heights are in the Australian Height Datum. The Cloudbreak and Christmas Creek deposits lie within UTM zone 50, The Kutayi deposit lies within UTM zone 51. Drill hole collar elevations are also validated against local topographic data.
The topography was created from 1 metre contours from LIDAR data (Cloudbreak and Christmas Creek) and 2 metres from a Landgate 20 metre DEM (Kutayi). Vertical accuracy of the LIDAR data is +/-0.2 metres.
Data spacing and distribution
NOTE: No Exploration Results Reported. Data spacing reported below is for reported Mineral Resources. Exploration Drilling - Ranges from 800 x 200m down to staggered 50 x 50m. In the area of the test pit this was reduced to 12.5 x 12.5m (plus some at 6.5 x 6.5m). Infill Drilling - Infill commences at 100 x 100m (where Exploration drilling missing), with subsequent infill at 50 x 50m and 25 x 25m. All RC holes were drilled vertically.
Considered adequate for Resource Modelling. Studies demonstrated that Mineral Resource Classification is closely related to drill hole spacing.
Samples are not composited prior to analysis.
Orientation of data in relation to geological structure
Sampling considered unbiased in terms of possible geological structures. Drilling is perpendicular to (ie vertical) main geological structure controlling mineralisation (bedding, horizontal).
No sampling bias is apparent.
Sample security Consignment notes (sample submission information) generated for each batch of samples. Samples trucked to Perth laboratories, samples delivered directly to site laboratories.
Audits or reviews
Several audits have been undertaken with varying recommendations. Those relating to Exploration drilling concluded that there were no major risk factors relating to the sampling and assaying of the Exploration data.

22
Criteria Commentary
An audit of grade control drilling at Cloudbreak highlighted the lack of routine formal QA/QC reporting. Preparation of monthly QA/QC reports is now standardised and implemented across all operational sites. An independent audit of the CC Resource model has been conducted and found no fatal flaws, in process or output.
Section 2 Reporting of Exploration Results Criteria Commentary
Mineral tenement and land tenure status
The Cloudbreak deposit is located within the following 100% owned Fortescue Exploration and Mining Leases: E45/2497, E45/2498, E46/0590, M45/1082, M45/1083, M45/1102, M45/1103, M45/1104, M45/1105, M45/1106, M45/1107, M45/1124, M45/1125, M45/1126, M45/1127, M45/1128, M45/1138, M45/1139, M45/1140, M45/1141, M45/1142, M45/1263, M46/0356, M46/0357, M46/0401, M46/0402, M46/0405, M46/0407, M46/0408, M46/0409, M46/0410, M46/0411, M46/0449, M46/0450, M46/0452, M46/0453 and M46/0454. The Cloudbreak project area is within the external boundaries of the Nyiyaparli and Palyku native title determination areas. In 2005, Fortescue entered into comprehensive Land Access Agreements (LAA) with the Nyiyaparli and Palyku Traditional Custodians. The LAAs facilitate the certain grant of all required Fortescue tenure and include comprehensive Aboriginal heritage identification and management procedures. The LAAs also provide the Traditional Custodians with opportunities for training and employment; business opportunities; financial benefits; and consultation on a range of project–related matters. On 15 December 2016, an Indigenous Land Use Agreement (ILUA) between Fortescue and the Nyiyaparli People was registered on the National Native Title Tribunal’s (NNTT’s) Register of Indigenous Land Use Agreements. On 3 November 2017, an ILUA between Fortescue and Palyku People was registered on the NNTT’s Register of Indigenous Land Use Agreements. The Christmas Creek deposit is located within the following 100% owned Fortescue Exploration and Mining Leases: E46/0566, E46/0612, M46/0320, M46/0321, M46/0322, M46/0323, M46/0324, M46/0325, M46/0326, M46/0327, M46/0328, M46/0329, M46/0330, M46/0331, M46/0332, M46/0333, M46/0334, M46/0335, M46/0336, M46/0337, M46/0338, M46/0339, M46/0340, M46/0341, M46/0342, M46/0343, M46/0344, M46/0345, M46/0346, M46/0347, M46/0348, M46/0349, M46/0350, M46/0351, M46/0352, M46/0353, M46/0354, M46/0355, M46/0402, M46/0403, M46/0405, M46/0406, M46/0412, M46/0413, M46/0414, M46/0415, M46/0416, M46/0417, M46/0418, M46/0419, M46/0420, M46/0421, M46/0422, M46/0423, M46/0424 and M46/0534. The Christmas Creek project area is within the external boundaries of the Nyiyaparli native title determination area. In 2005, Fortescue entered into a comprehensive Land Access Agreement with the Nyiyaparli Traditional Custodians (Nyiyaparli LAA). The Nyiyaparli LAA facilitates the certain grant of all required Fortescue tenure and include comprehensive Aboriginal heritage identification and management procedures. The Nyiyaparli LAA also provides the Traditional Custodians with opportunities for training and employment; business opportunities; financial benefits; and consultation on a range of project–related matters. On 15 December 2016, an Indigenous Land Use Agreement (ILUA) between Fortescue and the Nyiyaparli People was registered on the National Native Title Tribunal’s (NNTT’s) Register of Indigenous Land Use Agreements.

23
Criteria Commentary
To ensure compliance with the Aboriginal Heritage Act 1972 (WA)(AHA) Fortescue conducts both archaeological and ethnographic surveys over all land prior to the commencement of ground disturbing works. Within the Christmas Creek mining and resource area heritage surveys have identified places that are highly significant to the Nyiyaparli People; and in some instances, neighbouring Traditional Custodians Groups. This includes the ethnographic place Mankarlyirrkurra (ETH-NYI11-001), and Heritage Restricted Zones associated with Kakutungutanta CB10-093 (HRZ-0132) and CB09-292 (HRZ-0005), which should be excluded from the mining resource area into the future. Fortescue Marsh has significance to the Nyiyaparli People and neighbouring Traditional Custodians groups. The creek lines that run through the Christmas Creek mining and resource area towards Fortescue Marsh and the quality/flow of water entering the marsh system are important to the Traditional Custodians groups. In accordance with the Nyiyaparli LAA Fortescue has an obligation to minimise impact to creeks and has committed to avoiding Kandama Creek (Christmas Creek, HRZ-006) and portions of Kakutungutanta Creek (HRZ-0259 and HRZ-0007) which should be excluded from the mining resource area into the future. Wherever possible, when creeks must be temporarily diverted for mining purposes they should be re-established following completion of the project operations. Fortescue has agreed not to undertake exploration or mining on the Fortescue Marsh without the consent of the Nyiyaparli People, and is committed to ensuring the flow and quality of water entering the marsh system is not affected by mining activities. Most notably this is focused on the protection of known ethnographic ‘Yintha’ sites along the Marsh edges, which are fed by creek flows into the Marsh. This is currently managed by consultation with the group and the implementation of various water management methods including monitors, diversions, containments and conveyance. These water management methods must be continued and maintained during the development of Christmas Creek mine to ensure compliance with the Nyiyaparli LAA. The Kutayi deposit is located with the 100% owned Fortescue Mining Lease M46/0533. It is also within the Nyiyaparli native title determination area.
The tenure is currently in good standing and no impediments are known to exist. Exploration done by other parties
Both BHP and Hancock Prospecting Pty Ltd (HPPL) have undertaken exploration for iron within the project boundaries. No historical data has been used by Fortescue.
Geology
The majority of the iron mineralisation is hosted by the Nammuldi Member which is the lowest member of the late Archaean aged Marra Mamba Iron Formation (MMIF). The Nammuldi Member is characterised by extensive, thick and podded iron rich bands, separated by equally extensive units of siliceous and carbonate rich chert and shale. The Nammuldi Member in the Chichester Range is interpreted to be up to 60 metres in true thickness. Underlying the Nammuldi Member rocks are black shales and volcanic rocks belonging to the Jeerinah Formation. Limited iron mineralisation also occurs in the overlying CID and Tertiary alluvial material.
Drill hole information
Collar details of the RC holes used in the Cloudbreak, Christmas Creek and Kutayi estimates are not reported here.
Data aggregation methods
No exploration results are being reported. For methods used in the estimation of Cloudbreak and Christmas Creek please refer to: Section 3 Estimation and Reporting of Mineral Resources

24
Criteria Commentary
Relationship between mineralization widths and intercept lengths
No exploration results are being reported. Please refer to: Orientation of data in relation to geological structure in Section 1 Sampling Techniques and Data for the geometry of mineralisation with respect to drill hole angle.
Diagrams The Mineral Resource extents are shown in the release. Balanced reporting
No exploration results are being reported
Other substantive exploration data
No exploration results are being reported.
Further work Further infill drilling is planned for at all deposits. Extensions to known mineralisation may exist at all deposits.
Section 3 Estimation and Reporting of Mineral Resources Criteria Commentary
Database integrity
Since 2011 all drill hole data has been captured and stored in customised acQuire drill hole databases (a secure and industry standard system). Field (texture) logging data is captured electronically, assay and downhole geophysical data are uploaded directly from source files. Sample numbers are unique to each site and pre-numbered and barcoded sample bags are used. These methods are all aimed at minimising data errors. Exploration data older than this has been transferred between a number of different data storage systems, there is a risk that some of it may have been lost or compromised in the process (but this data only represents a small subset of the overall data used for regional and local modelling).
All drill hole data used to update the resource models are reviewed by Fortescue geologists. Complete drill holes and individual samples are excluded if any problems with the data are noted (eg erroneous drill hole co-ordinates, suspect assays, missing texture data etc). Data exclusion is considered to be minimal. The acQuire drill hole databases include semi-automated validation procedures designed to minimise data errors.
Site visits Site visits were undertaken by senior Fortescue personnel and by independent consultants during Exploration drilling programs. Site visits by the current Competent Person are undertaken on a semi-regular basis to discuss drilling/modelling progress and any other issues.
Geological interpretation
For the updated regional resource models, four geological zones were interpreted on the basis of geochemistry: overburden, hanging wall, ore zone and footwall. There is some risk of mis-interpretation in areas of wider spaced drilling where assay data is limited, this is not considered to be material. In future model updates texture logging from the wider spaced drilling should also be reviewed to refine definition of the overburden/hanging wall contact. For the local resource models, up to 14 geological zones are interpreted on the basis of geochemistry and downhole geophysical logging: overburden (separating CID where possible), U8, U7U, U7l, U6, U6l, U5, U5l, U4, U3, U2, U1 & Roy Hill Shale. The U7U, U7l, U6, U6l & U5 units correspond to the ore zone of the regional resource models.
Interpretation is based on geochemistry of RC drill samples and downhole gamma logging.

25
Criteria Commentary
The updated regional resource models are an alternative interpretation of the drill hole data used to create earlier regional resource models and incorporate additional drill hole data.
All samples are flagged with their host geological zone, only samples with the same geological zone as the block to be estimated can be used in grade estimation.
There are a number of factors which have an impact of geological and grade continuity: • Faults (geology and grade) – minor impact • Creeks (grade and to a lesser extent geology) – slightly more significant impact
(evidenced by a reduction of iron grades at both sites and erosion of the ore body, primarily at Christmas Creek but also locally at Cloudbreak)
• Late stage hardcapping/weathering of mineralisation • Localised late stage supergene Mn mineralisation
Dimensions
Cloudbreak and Christmas Creek - Up to ~80km along strike and up to 5km plan width. Upper limit of mineralised domain is located between 0m to 125m below the surface. Lower limit of mineralised domain is located between 1m and 130m below the surface. The average thickness of the mineralised domain is 7.0m and the range of thickness is 1m to 28m. Kutayi – Mineralisation occurs in an area covering approximately 4.5km (N-S) and 3.5km (E-W). Mineralisation extends from surface to depths of up to around 50m. The defined mineralised units are approximately between 1m and 40m thick.
Estimation and modelling techniques
Grade estimation using inverse distance (waste) ordinary kriging (mineralised) was completed using Vulcan™ software for 14-18 analytes (see above). Drill hole sample data was flagged using three dimensional wireframes. Variography undertaken on 1m drill hole composites in unfolded space. Initial variography on Fe indicator values (<48% Fe = 0, >48% Fe = 1), was used to create wireframe solids of areas within the ore zone with indicator values >0.4 (note 48% Fe was selected after substantial testing to get the 'best' fit of block grade Fe distribution vs the composite data distribution). The drill hole composites were re-flagged using these solids to give 'high grade' and 'low grade' data sets. Additional variography was then undertaken for Fe, SiO2, Al2O3, P and LOI on these data sets. Variograms were generally robust (low nuggets, long horizontal ranges and short Z ranges), 'low grade' variography was used for waste domains. A separate Mn indicator was also created (at 1%) and used to control estimation of Mn. Quantitative kriging neighbourhood analysis used to establish optimum search and estimation parameters. Each geological domain was interpolated separately, the ore zone domain was separately interpolated for high and low grade areas. Mn modelled separately with no geological domaining.
Reconciliation of previous model against production showed a loss of tonnage, decreased iron grade and increased contaminant grades. Preliminary reconciliation of the updated models against historic production shows a marked improvement.
No assumptions regarding the recovery of by-products have been made.
The iron ore suite of Fe, Al2O3, SiO2, TiO2, CaO, MgO, Na2O, K2O, Mn/MnO, P, S, LOI370/LOI425, LOI650 and LOI1000 has been estimated. Pb, As, Cl and Cu have also been estimated but as they are not sampled at the same density as the previously discussed analytes, they are not considered as accurate. A program of selected analysis of waste material for potentially deleterious elements (eg Se, As) has commenced (these are not currently included in the regional resource models). Routine analysis for arsenic (by Intertek) is now part of the grade control drilling program, this data will be included in future models when sufficient information is available to allow interpolation.

26
Criteria Commentary
Following kriging neighbourhood analysis, statistical investigations and discussions with Fortescue staff, for Cloudbreak and Christmas Creek, a parent block size of 25m x 25m x 1m was selected (drill hole spacing varies from 800 x 200m to 6.25 x 6.25m in some small areas). To allow for integration of local resource models and to aid in following the folded geometry of the geological domains, sub-celling to 12.5m x 12.5m x 1m was allowed. For the local resource models a block size of 12.5m x 12.5m x 1m is used (drill hole spacing nominally 25 x 25m). For Kutayi, a parent block size of 50mE x 100mN x 1m was selected (reflecting half the nominal drill hole spacing and orientation of mineralisation).
No selective mining units were assumed in these estimates.
No assumptions about correlations between variables were made in these estimates.
Drill hole samples were geologically flagged using the interpreted domain wireframes. These domains were used as hard boundaries to select samples populations for variography and estimation.
For both regional resource models, some element grades were top-cut during estimation based on coefficient of variation values higher than 1.2.
All resource models (regional and local) are validated as follows: • Block model geology vs geological surfaces; • Visual comparison of block grades vs drill hole data (all analytes, using 25m or
50m sections); • Review of average grades by geology (blocks vs composites); • Grade Trend plots on eastings, northings and rl for all analyses (100m slices
(eastings & northings), 1m slices (vertically)); • Block total assay check; • Un-estimated block check; • Reconciliation against production (where possible).
Moisture The tonnages are estimated on a dry basis. Cut-off parameters Cut-offs were not used to define domains, they are used to report Mineral Resources.
Mining factors or assumptions
The models are considered suitable for the current mining method (drill & blast nominally on 3m benches).
Metallurgical factors or assumptions
It has been assumed that current OPF’s will continue to be used in the future.
Environmental factors or assumptions
A program of waste characterisation sampling is now in place as part of the requirements allowing mining. No significant concentrations of environmentally deleterious elements have been identified to date.
Bulk density
Densities are average above water table (AWT) downhole geophysical strand (stratigraphic) densities. Although the current downhole geophysical density data has not been fully calibrated with diamond core measurements, reconciliation against historic production data is considered reasonable. Work to allow estimation of downhole gamma density data into the models (with subsequent conversion to dry in-situ values) is progressing. Densities in all resource models are dry.
Downhole geophysical probes measure the in-situ bulk density which accounts for void spaces. The measurements are grouped by geological domains.
The densities used are similar to known densities of other deposits in the region.

27
Criteria Commentary
Classification
Overall regional resource model limits were designed to minimise extrapolation of drilling data, all material within the model boundaries could at least be classified as Inferred. The following range of criteria were considered in determining the final resource classification over each model: • Geological and mineralisation continuity; • Data quality; • Drill hole spacing; • Modelling technique; • Estimation properties including search strategy, number of informing data and
average distance of data from blocks; The Mineral Resource classification methodology used also incorporated a number of parameters derived from the kriging algorithms in combination with drill hole spacing and continuity and size of mineralised domains. Appropriate account has been taken of all these factors in creation of the updated resource models. Block model validations show good correlation of the drill hole data to the estimated grades.
The Mineral Resource classification reflects the views of the Competent Person.
Audits or reviews
An external audit of both the CB and CC regional resource models has been completed, no fatal flaws were identified. Several external audits of the local resource model modelling process have been undertaken.
Discussion of relative accuracy/ confidence
Statistical/geostatistical procedures have not been used to quantify the relative accuracy of the resources. However, comparisons between regional and local models show that on average tonnage and grades are similar (in some areas local models show reduced tonnages when compared with the regional models, in other areas the opposite is the case).
Regional resource models are global in that they include as much of each deposit as is covered by sufficient drilling to support geological and grade continuity.
Comparisons with production data are available for mined areas. Currently these only cover limited areas of the resources. The updated resource models show an improved reconciliation against production data.
Competent Person’s Statements The information in this report that relates to Chichester Mineral Resources is based on information compiled by Mr David Frost-Barnes, a Competent Person who is a Member of The Australasian Institute of Mining & Metallurgy. Mr Frost-Barnes is a full-time employee and shareholder of Fortescue Metals Group Limited. Mr Frost-Barnes has sufficient experience that is relevant to the style of mineralisation and type of deposit under consideration and to the activity being undertaken to qualify as a Competent Person as defined in the 2012 Edition of the ‘Australasian Code for Reporting of Exploration Results, Mineral Resources and Ore Reserves’. Mr Frost-Barnes consents to the inclusion in the report of the matters based on his information in the form and context in which it appears.

28
JORC Code, 2012 Edition – Table 1 Fortescue Solomon Deposits (Firetail, Kings and Queens)
Section 1 Sampling Techniques and Data Criteria Commentary
Sampling techniques
The deposits are sampled using Reverse Circulation (RC) and Diamond drill holes (DD). Approximate drill hole spacings are as follows: Firetail – 200 x 100m and 50 x 50m. Kings – 400 x 100m, 200 x 100m, 100 x 100m, 10m x 25m and 25 x 25m. Queens – 400 x 50m and 100 x 50m. Infill drilling uses a 25 x 25m pattern. RC samples only are used for resource estimation. Where possible, all holes undergo downhole geophysical logging.
All holes are surveyed by qualified surveyors using a Base station Differential GPS, with collar accuracies to within 3-10 centimetres (laterally and vertically). Analytical standards used to assist in checking laboratory results. Field duplicates are used to assist with determining sampling quality at the rig. Geophysical probes are calibrated on a regular basis (using static methods and specific calibration holes).
RC drilling, samples from 1m intervals pass through cyclone and cone splitter, 2-3kg sample collected in calico bag (~6-7% of samples total volume). Samples from mineralised zones (plus ~5m above and below), as selected by a geologist, are sent for analysis, all other samples are moved to a bag farm.
Drilling techniques
Standard face sampling hammer drilling samples from ~130mm or ~140mm diameter RC drill holes used for Resource Estimation. All holes are drilled vertically with the exception of 14 inclined holes at Firetail North targeting Joffre mineralisation. Diamond drill holes were drilled as twins to RC holes, for metallurgical test work, to provide geotechnical information or for downhole geophysical data calibration purposes, they were not incorporated into resource or local models. Core size was predominantly PQ with some 6 inch holes. All diamond holes were drilled vertically, the core was not oriented. Drilling of large diameter (Bauer) holes (0.78 or 1m) commenced during the Exploration phase and ceased in ~2010. These holes were limited to shallow parts of the deposit (by working depth of rigs). Samples were primarily used for metallurgical test work, data from these holes was not used in estimation.
Drill sample recovery
The quality of each sample is recorded at the time of logging and categorised as either poor, moderate or good.
No major issues with sample collection system identified during drilling. Minimal loss of fines was achieved through the use of an automated sample collection and splitting system.
Twin holes were drilled to compare grades, no significant sample bias was identified.
Logging
Geological logging was completed by geologists experienced in iron mineralisation, logging considered to be adequate for resource estimation.
Detailed geological logging captured the following qualitative and quantitative information: mineralogy, sample quality, colour and numerous physical characteristics. This data is relevant for both mineral resource estimation and future mining and processing.
100% of drilled meters logged.
Sub-sampling techniques and sample preparation
Majority of diamond holes drilled to provide material for density determination and for metallurgical test work. Whole core was used for metallurgical test work. No assays from diamond holes were used in the estimates.
Samples are collected in labelled bags from each 1m of drilling, which are stored onsite or sent for analysis. These samples are collected using a cone or multi-tier riffle splitter of dry cuttings installed directly beneath the cyclone. Wet samples are

29
Criteria Commentary
collected using the same technique as dry samples, with thorough cleaning of gear between samples. Wet samples are allowed to dry before being processed. For drill rigs using riffle splitters, once wet samples are encountered, the splitter is changed to a chisel splitter. Larger samples are collected and later split.
All sub-sample preparation undertaken by the laboratory performing the sample analysis.
Coarse standards were inserted at rates of 1 per 50 samples.
Field (rig) duplicates were collected at a rate of 1 in 33 samples.
No formal analysis of the appropriateness of sample size compared to grain size has been completed but the sampling regime is considered to be industry best practice.
Quality of assay data and laboratory tests
All samples were sent to SGS Perth, Ultra Trace (now Bureau Veritas) or the on-site laboratory for analysis. All laboratories now have National Association of Testing Authorities, Australia (NATA) accreditation (or conform with NATA accreditation). The standard analytes tested were Fe, SiO2, Al2O3, P, MnO/Mn, MgO, CaO, TiO2, Na2O, S and K2O by X Ray Fluorescence (XRF) and a 3 point LOI thermogravimetric analysis at 371 (425ºC since July 2019), 650 and 1000 degrees Celsius. The 3 point LOI was not undertaken for all samples with only the LOI 1000 being completed. A three point LOI was subsequently carried out on all samples with a Fe grade greater than 3%. This is considered to be close to “a total analysis”. From early 2013 As, Pb, Zn, Cu and Cl have also routinely been included in sample analysis.
Details of geophysical tools used for down hole geophysical analysis are available in the drill hole database.
Field duplicates were collected 3 in 100 samples. Standards submitted at 1 in every 50 samples. Analysis of duplicates and standards did not indicate there any major issues. QA/QC reports were prepared for the project areas. Concerns over the quality of a few of the historical standards have been raised. Through investigation it appears that this is due to standard preparation methods, size of standards, and homogenisation issues (similar problems have not been noted in newer standards). Also issues with inadequate round-robin testing resulting in over-precise certified values.
Verification of sampling and assaying
Significant intersections have been visually inspected by senior Fortescue personnel and by independent consultants.
Twin holes have been completed to check the variance of the ore body and sampling. Results show good correlation between the original RC hole and the twin hole.
Sample data is now stored in customised acQuire drill hole databases, which include a series of automated electronic validation checks. Fortescue data entry procedures are documented. Only trained personnel perform further manual data validation.
Conversion of MnO% to Mn% for grade estimation has been made where necessary (mainly exploration data). Samples with analytes reporting below detection limits are given the value of half the detection limit of that analyte.
Location of data points
Drill hole collar locations have been surveyed using a differential GPS (by Navaids Pty Ltd and VEKTA Pty Ltd during exploration), currently all hole collars are surveyed using high precision Trimble R10 GNSS with RTK correction from the base station, with an accuracy of better than +/- 10 cm for Easting and Northing and RL for the majority of drill holes. Downhole survey data is available for drill holes which have been down hole geophysically surveyed by PWS (now WSG), as the majority of drill holes are vertical and less than 200m in total depth, deviations from vertical are negligible. Collar survey data is validated against planned coordinates and dtm surface.

30
Criteria Commentary
Holes for which there is no collar survey data, or where the collar RL is significantly different from the topographic surface, are excluded from Resource and GC Modelling.
Grid co-ordinates are Map grid of Australia (GDA94), heights are in Australia Height Datum. Area is within UTM zone 50, AusGeoid98 used to obtain separation between GDA94 spheroid and the Geoid.
The topography was created from 1 metre contours from LIDAR data. Vertical accuracy of the LIDAR data is +/-0.2 metres.
Data spacing and distribution
Firetail: Drill hole data on nominal 200 x 100m spacing for assays and geology with 100 x 50m, 50 x 50m and 25 x 25m sections of infill and some more sparsely drilled 400 x 100m areas. Kings: Drill hole data on nominal 200 x 100m spacing for assays and geology with 100 x 50m and 50 x 50m sections of infill and some more sparsely drilled 400 x 100m areas. The drilling is on an imprecise grid spacing with three different grid orientations. Queens: Drill hole data on nominal 200 x 50m spacing for assays and geology with 100 x 50m sections of infill and some more sparsely drilled 400 x 100m areas. The drilling is on an imprecise grid spacing with two different grid orientations. For all deposits infill drilling is on a nominal 25 x 25m grid.
This level of data density is sufficient to define geological and grade continuity for a mineral resource estimate. Locally, the drilling pattern may be inadequate to fully define bedded mineralisation. In some areas, there are also uncertainties in detritals/bedded interface.
No sample compositing was conducted for this estimation.
Orientation of data in relation to geological structure
Firetail: Drilling grid oriented perpendicular to the local bearing of mineralisation, all but 14 holes are vertical (the inclined holes were drilled to test for mineralisation in the Joffre). This results in no significant sampling bias. Kings & Queens: Drill hole data have been drilled as vertical holes in grid orientations sub-parallel to the local bearing of the orebody, and thus the mineralisation (paleochannel). This results in no significant sampling bias.
No sampling bias is apparent.
Sample security Use of consignment notes (sample submission information), direct delivery to site laboratories.
Audits or reviews Fortescue has had a sampling audit by Snowden (in the Chichester's), there were no major risk factors relating to the sampling and assaying of the data. Similar rigs and splitter systems were utilised in this area.
Section 2 Reporting of Exploration Results Criteria Commentary
Mineral tenement and land tenure status
The Firetail deposit is located within the following 100% owned Fortescue Exploration and Mining Leases: E47/1334, E47/3762, M47/1413 (M47/1546 Pending), M47/1431 (M47/1545 Pending), M47/1453 (M47/1543 Pending) and M47/1473 (M47/1549 Pending). The Kings deposit is located within the following 100% owned Fortescue Exploration and Mining Leases: E47/1334, M47/1409 (M47/1542 Pending), M47/1411 (M47/1541 Pending), M47/1431 (M47/1545 Pending), M47/1453 (M47/1543 Pending), M47/1474 (M47/1550 Pending), M47/1475 (M471554 Pending) and M47/1511.

31
Criteria Commentary
The Queens deposit is located within the following 100% owned Fortescue Exploration and Mining Leases: E47/1333, M47/1410 (M47/1540 Pending), M47/1411 (M47/1541 Pending), M47/1493 (Pending), M47/1573 (Pending) and M47/1577 (Pending).
The Solomon project area intersects both the Eastern Guruma native title determination area and the Yindjibarndi #1 native title determination area. In 2009, Fortescue entered into an LAA with Wintawari Guruma Aboriginal Corporation on behalf of the Eastern Guruma native title holders (Wintawari LAA). The Wintawari LAA facilitates the certain grant of all required Fortescue tenure and includes comprehensive Aboriginal heritage identification and management procedures. The LAAs also provide the Traditional Custodians with opportunities for training and employment; business opportunities; financial benefits; and consultation on a range of project–related matters.
Fortescue does not have an agreement with the Yindjibarndi native title holders over the tenure associated with the Solomon Mineral Resource and Ore Reserve; however, Fortescue conducts regular heritage surveys and consultation with Yindjibarndi people, ensuring legislative compliance. Fortescue meets regularly with Yindjibarndi people to consult on a range of project-related matters and has developed an excellent working relationship with Yindjibarndi people through the Wirlu-Murra Yindjibarndi Aboriginal Corporation (WMYAC). In partnership with the WMYAC, Fortescue has delivered contracts for road maintenance, earthworks, airport transfers & across various operational sites in the Pilbara, including the Solomon project, providing a valuable revenue stream for the community and a variety of job opportunities. Fortescue has further committed $3 million to a cultural project (Gamburlarna Project), driven by Yindjibarndi people & supported by the WA National Trust, which includes community initiatives in Roebourne & on Yindjibarndi country.
The tenure is currently in good standing and no impediments are known to exist. Exploration done by other parties
Both BHP and Hamersley Iron have undertaken exploration for iron within the project boundaries. No historical data has been used by Fortescue.
Geology
Mineralisation within the Solomon area is hosted by buried Channel Iron Deposits (CID), Bedded mineralisation (BID and Detrital mineralisation (DID). Outcropping geology in the area is the Dales Gorge, Whaleback Shale and Joffre Members of the Brockman Iron Formation which contain the BID mineralisation. Incised into this bedrock geology are the large Channel systems which contain the DID and CID mineralisation.
Drill hole information Collar details of the RC holes used in these estimates are not reported here.
Data aggregation methods
No exploration results are being reported. For methods used in the estimation of Mineral Resources for these deposits please refer to: Section 3 Estimation and Reporting of Mineral Resources
Relationship between mineralization widths and intercept lengths
No exploration results are being reported. Please refer to: Orientation of data in relation to geological structure in Section 1 Sampling Techniques and Data for the geometry of mineralisation with respect to drill hole angle.
Diagrams The Mineral Resource extents are shown in the release. Balanced reporting
No exploration results are being reported and this is not pertinent to the reporting of Mineral Resources.
Other substantive exploration data
No exploration results are being reported and this is not pertinent to the reporting of Mineral Resources.

32
Criteria Commentary
Further work Further infill drilling is planned for all deposits. Extensions to known mineralisation may exist in all deposit areas.
Section 3 Estimation and Reporting of Mineral Resources Criteria Commentary
Database integrity
Sample data is stored using a customised acQuire database (a secure and industry standard system), which includes a series of automated electronic validation checks.
Only trained personnel perform further manual validation which passes on the data in order to confirm results reflect field collected information and geology. In order to ensure integrity of the database, any changes to the database only occur after a review of the suggested changes are authorised, and these changes can only be performed by a single person. Prior to modelling, further validation was performed on the dataset being used. No issues were uncovered in this final validation step.
Site visits Site visits, by both the Competent Person and resource modelling/estimation geologist(s), are undertaken on a semi-regular basis to discuss drilling/modelling progress and issues.
Geological interpretation
Logging and geological interpretation was completed by geologists experienced in iron mineralisation. Geology over the majority of the deposit is relatively straight forward. There is some risk of misinterpretation in areas of wider spaced drilling with limited assay data, this is not considered to be material.
Geological interpretation based on geological logging and geochemistry of RC drill samples.
The stratigraphy of the deposits is well known and it is envisaged that any alternative geological interpretation, with or without further drilling, would not have a material impact on the resource estimates. Further close spaced drilling may improve the confidence in the stratigraphic interpretation of the BID mineralisation in the Kings & Queens deposits.
All samples are flagged with their host geological zone, only samples with the same geological zone as the block to be estimated can be used in grade estimation.
Kings & Queens: The major source of error is at detrital/bedded and detrital/CID interface. The structure and stratigraphy is unknown in the bedded material over much of the deposits.
Dimensions
Firetail: The bedded mineralisation has a strike length of 7km and outcrops on the north and south limbs of an anticline. Mineralisation is strata bound, has an average thickness of 20m and extends to a depth of 100m below surface in places. Kings: The CID mineralisation has a strike length of 20 km and a width of 1 - 2km. Though the CID mineralisation outcrops in the southeast corner of the deposit, the majority of the CID mineralisation is buried and occurs at depths of up to 40m below surface and the defined mineralised units are between 1m and 65m thick Queens: The CID mineralisation has a strike length of 10km and a width of 0.5 - 1km. The CID mineralisation is buried and occurs at depths of up to 60m below surface and the defined mineralised units are between 1m and 65m thick.
Estimation and modelling techniques
Inverse distance (waste) and ordinary kriging (mineralised) was used to estimate grades. Estimation was undertaken using Vulcan™ software. The model areas extend half the distance of drill spacing away from the drilling. Kriging parameters were derived from semivariograms using Supervisor software. The deposit was domained by stratigraphy, local orientation of the paleochannel, and mineralised/un-mineralised zones.

33
Criteria Commentary
Comparison with previous resource estimates generally showed an increase in tonnes with slight decrease in Fe grades together with a slight increase in contaminant grades. Reconciliation of production data against the models (Firetail and Kings) is reasonable.
No assumptions regarding the recovery of by-products have been made.
The iron ore suite of Fe, Al2O3, SiO2, TiO2, CaO, MgO, Na2O, K2O, Mn/MnO, P, S, LOI 370 (425 since July 2019), LOI 650 and LOI 1000 has been estimated. A program of selected analysis of waste material for potentially deleterious elements (eg Se, As) has commenced (these are not currently included in the regional resource models). Routine analysis for As, Zn, Pb, Cu and Cl is now part of the grade control drilling program, this data will be included in future models when sufficient information is available to allow interpolation.
Firetail: Ordinary kriging into parent cells of 25mE x 25mN x 1mRL. In Firetail South, sub blocking down to 5m x 5m x 0.25m was used along domain boundaries to better define the domain interface. Kings: Ordinary kriging into block sizes of 12.5m x 12.5m x 1m and panel sizes of 50mE x 100mN x 1mRL and 100mE x 50mN x 1mRL. Queens: Ordinary kriging into parent cells of 50mE x 25mN x 1mRL. Sub blocking down to 12,5m x 12.5m x 1m was used along domain boundaries to better define the domain interface. For the local resource models a parent block size of 12.5m x 12.5m x 1m was used.
No selective mining units were assumed in these estimates.
No assumptions about correlations between variables were made in these estimates, however significant correlation between certain variables was noted during statistical analysis of the drilling data.
The definition of mineralised zones within each stratigraphic unit was accomplished using an indicator approach. The probability of any zone being mineralised was estimated using appropriate geochemical indicator cut-offs for Fe, SiO2 and Al2O3 for the individual stratigraphic units. These cut-offs were based on data population statistics and visual validation. A ‘geozone’ code was assigned to each sample, defined by the stratigraphic unit and mineralisation.
Grades were top cut for estimation based on high coefficient of variation values as well as other statistical characteristics of the distributions for the Firetail and Queens regional resource models. Grade cutting is not used in local resources models nor in the Kings regional resource model.
Visual validation of the block model coding of the geozones was completed prior to estimation. Once estimated, the grade of all elements was also visually validated. Visual validation of both the geozones and grade were completed in Vulcan™ by comparing section and plan slices of the block model against the drill holes. Statistics for the mean grade of the mineralised blocks within each stratigraphic unit were compared to the mean grade of the mineralised samples within each stratigraphic unit. Overall, the mean values between the model and samples are well within an acceptable range. Trend analysis graphs have been created for each of the mineralised geozones. These have been generated in Northing, Easting and RL, for all elements. The trend analysis graphs show the modelled grade vs. the raw data grade at a particular slice in space. The trend analysis charts show that overall, the model grade is consistent with the raw data. Areas with a large number of samples correlate much better with the model grade than do areas with few samples.
Moisture The tonnages are estimated on a dry basis. Cut-off parameters Cut-offs were not used to define domains, they are used to report Mineral Resources.

34
Criteria Commentary
Mining factors or assumptions
It has been assumed that current mining methods will continue to be used in the future, the block size in the models is appropriate for this.
Metallurgical factors or assumptions
It has been assumed that current OPF’s will continue to be used in the future.
Environmental factors or assumptions
A program of waste characterisation sampling is now in place as part of the requirements allowing mining. No significant concentrations of environmentally deleterious elements have been identified to date.
Bulk density
Kings: Density has been calculated from physical diamond core measurement throughout the deposit. Average densities by geological unit and mineralisation have been applied globally to the model. Physical density measurements are measured from diamond PQ core. Density measurements are taken at least 4 weeks after the core has been drilled to drive off any excessive moisture. Although the core has not been oven dried the core has been dried in the high temperatures, high evaporation rates and low humidity of the Pilbara would have driven off any free moisture. No good quality down hole geophysics density is available in the Kings area, therefore no comparisons could be made with the diamond measurement. Firetail & Queens: Density has been calculated from physically measured diamond core and down hole geophysical gamma-gamma measurements conducted at Firetail & Queens. Average densities by geological unit and mineralisation have been applied globally to the model. Physical density measurements are measured from diamond PQ core. Density measurements are taken at least 4 weeks after the core has been drilled to drive off any excessive moisture. Although the core has not been oven dried the core has been dried in the high temperatures, high evaporation rates and low humidity of the Pilbara would have driven off any free moisture. Geophysical density data is collected and validated with caliper data to ensure down hole data integrity. A program to allow estimation of downhole gamma density data into the models (with subsequent conversion to dry in-situ values) is progressing.
Where used, the down hole geophysical probes measure the in-situ bulk density which accounts for void spaces. The measurements are grouped by geological domains.
The densities used are similar to known densities for current and historic mines, of similar geology and mineralisation, across the Pilbara.
Classification
Firetail & Kings: The Mineral Resources are classified as Measured, Indicated and Inferred. This takes into account drill spacing and data integrity, geological complexity, and estimation risk and mineralisation continuity based on the semi-variogram ranges of influence. Queens: The Mineral Resource is classified as Indicated and Inferred. This takes into account drill spacing and data integrity, geological complexity, and estimation risk and mineralisation continuity based on the semi-variogram ranges of influence.
Appropriate account has been taken of all these factors in creation of the updated resource models. Block model validations show good correlation of the drill hole data to the estimated grades.
The Mineral Resource classification reflects the views of the Competent Person.
Audits or reviews
An external audit of the updated Kings regional resource model has been completed, no major issues with the model were identified, internal peer reviews of the other models have been completed. Several external audits of the local resource modelling process have been undertaken.

35
Criteria Commentary
Discussion of relative accuracy/ confidence
Statistical/geostatistical procedures have not been used to quantify the relative accuracy of the resources. However, comparisons with local resource models show that on average tonnage and grades are comparable (in some areas grade control models show reduced tonnages when compared with the regional resource models, in other areas the opposite is the case).
Regional resource models are global in that they include as much of each deposit as is covered by sufficient drilling to support geological continuity.
An external audit of the resource estimation methodology used by Fortescue at the Solomon Project has been undertaken by a respected Consultancy group. Overall, the methods used to categorise the Kings and Firetail Mineral Resource estimates were considered to be fair, reasonable and consistent with industry standards in the iron ore sector. Recommendations included further twin hole drilling; deeper drill holes to be down hole surveyed; statistical comparison to use de-clustered sample data; additional bulk density measurements required using other techniques.
Competent Person’s Statements The information in this report that relates to Chichester Mineral Resources is based on information compiled by Mr David Frost-Barnes, a Competent Person who is a Member of The Australasian Institute of Mining & Metallurgy. Mr Frost-Barnes is a full-time employee and shareholder of Fortescue Metals Group Limited. Mr Frost-Barnes has sufficient experience that is relevant to the style of mineralisation and type of deposit under consideration and to the activity being undertaken to qualify as a Competent Person as defined in the 2012 Edition of the ‘Australasian Code for Reporting of Exploration Results, Mineral Resources and Ore Reserves’. Mr Frost-Barnes consents to the inclusion in the report of the matters based on his information in the form and context in which it appears.

36
JORC Code, 2012 Edition – Table 1 Fortescue Western Hub Deposits (Eliwana)
Section 1 Sampling Techniques and Data Criteria Commentary
Sampling techniques
The deposits were sampled using Reverse Circulation (RC) and Diamond Drill holes (DD). Over 2,800 RC holes have been drilled and used in the model. Over 70 diamond drill holes have also been completed in the area these were used for bulk density, geotechnical and metallurgical test work. No diamond drill samples were used for the Mineral Resource grade estimate. RC samples sent for analytical work were selected based on potential ore-grade material with a reasonable envelope both above and below this interval. Where possible, most holes undergo down-hole geophysical logging.
Analytical standards were used to assist in checking laboratory results. Field duplicates were used to assist with determining sampling quality at the rig. Geophysical probes were calibrated on a regular basis using static methods and specific calibration holes. Drill hole locations were determined by survey contractors.
All samples were taken on 1m intervals from reverse circulation drill holes. A sample weighing approximately 1 to 3 kilograms was collected for each metre which was transported to a commercial laboratory and then pulverised for XRF analysis.
Drilling techniques
Reverse circulation drill holes of approximately 140mm diameter were completed using a standard face sampling hammer, the majority of these are vertical. All diamond holes were triple tube and had either a PQ or 6 inch drill bit size. A number of diamond holes were drilled on an angle some of these were orientated using core barrel mounted tools.
Drill sample recovery
The quality of the RC samples from each metre drilled was recorded by the logging geologist at the time of drilling and categorised as either poor, moderate or good (with the majority being recorded as good). Core recovery was recorded during geotechnical logging for all diamond holes and was considered to be of an acceptable level.
No major issues with the sample collection system were identified during drilling. For RC holes, minimal loss of fines was achieved through the use of an automated sample collection and splitting system. Triple tube sampling was used for diamond holes to minimise core loss.
There is assumed to be no expected material relationship between sample recovery and grade.
Logging
Logging was completed by geologists, metallurgists and geotechnical engineers experienced in iron ore mineralisation. The standard of logging is suitable to support an estimate of Mineral Resources.
Stratigraphy, mineralogy, recovery, hardness, colour, moisture and sample quality were recorded qualitatively for both RC and diamond holes. Geotechnical logging was completed on diamond holes. Chip trays from RC holes were collected on an intermittent basis and diamond holes have been photographed. Down-hole televiewer data for RC and diamond holes has also been interpreted for geotechnical purposes.
All drill holes were geologically logged.
Sub-sampling techniques and sample preparation
RC drill samples are collected in labelled bags, which are stored onsite or sent for analysis. These samples are collected using a cone splitter installed directly beneath the cyclone. Wet samples are collected using the same technique as dry samples, with thorough cleaning of sampling system between samples. Wet samples are allowed to dry before being processed.
The sample collected from the cone splitter represents approximately 6 to 7% of the total sample interval. Cone splitters are the preferred splitting system used by Fortescue as they generally give the most representative sample in both dry and wet conditions.
At the laboratory, samples were weighed, dried and pulverised to either 90% passing through 106 microns (Ultra Trace and SGS) or 85% passing through 75 microns (Genalysis).

37
Criteria Commentary
Coarse field standards (approximately 1 in 100 samples) and laboratory standards (1 per lab job) were used as a quality control measure at different sub-sampling stages.
Rig duplicate samples are taken at an average of 3 rig duplicate samples per approximately 100 samples sent to the laboratory. An analysis of these duplicate samples indicates that they are of good quality and repeatable.
No formal analysis of the appropriateness of sample size compared to grain size has been completed but the sampling regime is considered to be industry best practice.
Quality of assay data and laboratory tests
All samples were sent to SGS, Genalysis or Ultra Trace laboratories for analysis. All laboratories have National Association of Testing Authorities, Australia (NATA) accreditation. The standard elements tested were Fe, SiO2, Al2O3, P, MnO/Mn, MgO, CaO, TiO2, Na2O, S and K2O by X Ray Fluorescence (XRF) and a three point LOI thermo gravimetric analysis at 371 (425 from July 2019), 650 and 1000 degrees Celsius. This is considered a total analysis. As, Pb, Zn, Cu and Cl have also routinely been analysed in more recent sample submission.
No geophysical tools were used to determine any element concentrations used in the estimate.
Field duplicates were collected at a rate of approximately 3 in 100 samples. Standards are submitted at approximately 1 in every 100 samples. Analysis of duplicates did not indicate any major issues. Analysis of laboratory standard results indicates high confidence in XRF analysis at each laboratory. Analysis of field standards have indicated results are generally acceptable however issues with laboratory sample preparation and standard certification have been noted. Field standard and duplicate results are monitored for all laboratory submissions and reported on monthly and annually. Ongoing discussions with field personnel and laboratory staff are completed in order to mitigate any issues.
Verification of sampling and assaying
Significant intersections have been visually verified by Fortescue's Exploration and Resource Geology Managers.
An RC/RC twin hole study has been completed on over 50 sets of holes throughout the project area. In general the level of grade and geology correlation between holes noted was acceptable.
Sample data is stored using a customised acQuire database, which includes a series of automated electronic validation checks. Fortescue data entry procedures are documented and readily available. Only trained personnel perform further manual validation in order to confirm results reflect field collected information and geology.
Samples returning below detection limit values were given the result of half the detection limit for the relevant analyte(s). Missing data was set to -99 and those samples were excluded from statistical analysis and estimation.
Location of data points
Drill hole collar locations have been surveyed using a differential GPS by Down Under Surveys, with an accuracy of better than 3 cm for Easting and Northing and 5 cm in elevation. Downhole surveys have been completed on approximately 12% of drill holes. Collar survey data is validated against planned coordinates and the topographic surface.
Grid coordinates given for each point are Map Grid of Australia (GDA94) and heights are in the Australian Height Datum. The project area lies inside UTM zone 50.
The topography was created from 0.5m or 2m contours produced from 1 metre LIDAR data. Vertical and horizontal accuracy of this data is+/-0.15 metres.
Data spacing and distribution
The grade estimate used predominantly vertical RC drill holes which occur nominally on 50 × 25m, 50 × 50m, 100 × 50m, 100 × 100m, 200 × 100m, 400 × 100m and minor 800 × 100m spacings with some more sparsely drilled areas for assays and geology.
This level of drill spacing is sufficient to establish the degree of geological and grade continuity required for a Mineral Resource estimate and the classification applied as deemed by the Competent Person.
No sample compositing was conducted for this estimation.

38
Criteria Commentary
Orientation of data in relation to geological structure
Drill holes have been predominantly drilled as vertical holes in drill lines sub-perpendicular to the local bearing of the ore body. The mineralisation is sub-horizontal and these vertical holes are sufficient to imply geological and grade continuity.
No material relationship is apparent between sampling bias and geological orientation.
Sample security To ensure sample security consignment notes (sample submission information) have been used and direct delivery to site laboratories has been carried out.
Audits or reviews
All sampling has been carried using Fortescue standard procedures.
For analogous deposits Fortescue has had a sampling audit conducted by Snowden. For this project there were no major risk factors relating to the sampling and assaying of the data. Similar rigs and splitter systems were utilised in this deposit.
Section 2 Reporting of Exploration Results Criteria Commentary
Mineral tenement and land tenure status
FMG Pilbara Pty Ltd is a wholly owned subsidiary of Fortescue Metals Group Ltd and owns 100% of all mineral rights in the tenements which cover the project area: M47/1509 (M47/1553 Pending), M47/1522, M47/1523, M47/1524, M47/1537, P47/1667 (M47/1586 Pending) and P47/1668 (M47/1587).
The Eliwana mining project is within the external boundaries of the Puutu Kunti Kurrama and Pinikura (PKKP) native title determination area. In 2010, Fortescue entered into a comprehensive Land Access Agreement with the PKKP Traditional Custodians (PKKP LAA). The PKKP LAA facilitates the certain grant of all required Fortescue tenure and include comprehensive Aboriginal heritage identification and management procedures. The PKKP LAA also provides the Traditional Custodians with opportunities for training and employment; business opportunities; financial benefits; and consultation on a range of project–related matters.
The tenure is currently generally in good standing and no impediments are known to exist.
Exploration done by other parties
Exploration work prior to Fortescue within the Eliwana project area has been conducted since the mid-1970s. Several companies have held ground within the region including Robe River Mining Company Pty. Ltd., Hamersley Iron Pty. Ltd., Talisman Mining Ltd. and De Beers Australia Exploration Ltd. No historical data has been used by Fortescue.
Geology
The Eliwana project is situated on the southern limb of the Jeerinah anticline in the western Hamersley Province. Geographically, the Eliwana deposit covers a relatively narrow (average width of approximately 2km) zone which follows the outcropping of mineralised Marra Mamba and Brockman Iron Formations.
Drill hole Information
Collar details of the RC drill holes used in the Eliwana estimate are not being reported here. Significant intersections have been released previously.
Data aggregation methods
No exploration results are being reported. For methods used in the estimation of Eliwana please refer to: Section 3 Estimation and Reporting of Mineral Resources.
Relationship between mineralisation widths and intercept lengths
No exploration results are being reported. Please refer to: Orientation of data in relation to geological structure in Section 1 Sampling Techniques and Data for the geometry of mineralisation with respect to drill hole angle.
Diagrams The Mineral Resource extents are shown in the report.
Balanced reporting
No exploration results are being reported and this is not pertinent to the reporting of Mineral Resources.

39
Criteria Commentary
Other substantive exploration data
The density study carried out at Eliwana is discussed in: Section 3 Estimation and Reporting of Mineral Resources.
Geological surface mapping of the Eliwana project has been carried out by Fortescue geologists. Dip and strike measurements, stratigraphy and mineralisation have been recorded into a database.
Down hole geophysics has been undertaken on some drill holes including: televiewer, natural gamma, magnetic susceptibility and gamma gamma density.
The estimated groundwater level has been recorded in most RC drill holes.
Further Work Further infill drilling and metallurgical test work is planned for Eliwana. Extensions to known mineralisation may occur in the Eliwana area.
Section 3 Estimation and Reporting of Mineral Resources Criteria Commentary
Database integrity
Sample data is stored using a customised acQuire database, which includes a series of automated electronic validation checks. acQuire is a secure and an industry standard strength database.
Only trained personnel perform further manual validation on the data in order to confirm results reflect field collected information and geology. In order to ensure integrity of the database, any changes to the database only occur after a review of the suggested changes are authorised, and these changes can only be performed by an authorised person. Prior to modelling, further validation was performed on the dataset being used.
Site visits The Competent Person and Competent Persons team conducts regular site visits to inspect the model area, RC drill hole logging and sampling practices. Discussions are held regularly with site geologists.
Geological interpretation
Logging and geological interpretation was completed by geologists experienced in iron mineralisation. Geology over the majority of the deposit is relatively straight forward. There is some risk of misinterpretation in areas of wider spaced drilling with limited assay data, however, this is not considered to be material.
Geological interpretation is based on geological logging, down hole geophysics and geochemistry of RC drill samples.
The stratigraphy at Eliwana is reasonably well known and it is envisaged that any alternative geological interpretation, with or without further drilling, would not have a material impact on the Mineral Resource estimate. Extrapolation of mineralisation has been restricted to approximately half of the nominal drill spacing.
All samples are flagged with their host geological zone, only samples with the same geological zone as the block to be estimated can be used in grade estimation.
The grade and geological continuity is generally good compared with analogous areas. The main factors affecting continuity are stratigraphy, structure, erosion and weathering.
Dimensions
Mineralisation is distributed variably within an area of approximately 40km in an east west direction and 3.5km in a north south direction. Mineralisation occurs at surface and extends to depths of up to 350 metres below the ground surface. The reported tonnes and grade in the Mineral Resource occur at depths of up to 350 metres.
Estimation and modelling techniques
Ordinary kriging was used to estimate all mineralised domains and inverse distance cubed for all waste domains. Estimation was done using Vulcan software. Mineralisation was extrapolated approximately half the distance of drill spacing away from the drilling. The deposit was domained by stratigraphy, local strike/orientation and mineralised/un-mineralised zones.

40
Criteria Commentary
Check estimates were completed in selected areas of the deposit using inverse distance cubed. Strings from the previous resource estimate were initially used to aid in the geological interpretation. Changes can be attributed to additional drilling available for model updates.
No assumptions regarding the recovery of by-products have been made.
The iron ore suite of Fe, SiO2, Al2O3, P, Mn, MgO, CaO, TiO2, Na2O, S, K2O, LOI Total, LOI 371 (LOI425 since July 2019), LOI 650 and LOI 1000 has been estimated. In addition, As, Pb, Zn, Cu and Cl are also estimated where this data is available.
Size and orientation of parent blocks reflected predominantly half to a quarter of the nominal drill spacing and orientation of mineralisation. Sub blocking was used along domain boundaries to better define the domain interface.
Up to three estimation passes were used for each element, gradually increasing search ellipse distances with each pass. Search distances along strike and across strike varied between each domain. These were primarily defined by sample spacing within each domain and determined by neighbourhood iterative tests.
No assumptions behind the modelling of selective mining units have been made.
Correlation between some elements has been noted during statistical analysis. Similar variogram parameters were achieved for mineralised domains that had elements with a correlation coefficient of > 0.7 or < -0.7.
The definition of mineralised zones within each stratigraphic unit was accomplished using an indicator approach. The probability of any zone being mineralised was estimated using appropriate geochemical indicator thresholds for Fe, SiO2 and Al2O3 for the individual stratigraphic units. These thresholds were based on data population statistics and visual validation. A domain code was assigned to each sample, defined by the stratigraphic unit and mineralisation.
Some element grades were top-cut during estimation based on coefficient of variation values higher than 1.2.
Visual validation of the block model coding of the domains was completed prior to estimation. Once estimated, the grade of all elements was also visually validated. Visual validation of both the domains and grade were completed in Vulcan by comparing section and plan slices of the block model against the drill holes. Statistics for the mean grade of the mineralised blocks within each stratigraphic unit were compared to the mean grade of the mineralised samples within each stratigraphic unit. Overall, the mean values between the model and samples are within an acceptable range. Trend analysis graphs have been created for each of the mineralised domains. These have been generated in Northing, Easting and RL, for all elements. The trend analysis graphs show the modelled grade vs. the raw data grade at a particular slice in space. The trend analysis charts show that overall, the model grade is consistent with the raw data and shows no bias. Areas with a large number of samples correlate much better with the model grade than do areas with few samples.
Moisture Tonnages are estimated on a dry basis. Cut-off parameters Cut-offs were not used to define domains, they are used to report Mineral Resources.
Mining factors or assumptions
It is assumed that mining will be carried out with medium to large scale mining equipment using 5 metre bench heights, though bench heights may vary depending on mining studies. These methods will be similar to analogous Fortescue deposits such as Firetail where conventional: truck & shovel/excavator; drill & blast and; grade control methods are used. The impact of dilution will be assessed as part of the mining studies.
Metallurgical factors or assumptions
It is assumed that similar metallurgical techniques to analogous Fortescue operations such as Firetail will be utilised. The expectation is that it will be a process as applied at Firetail. Final processing methods will be defined by further mining studies.

41
Criteria Commentary
Environmental factors or assumptions
Fortescue has an extensive environmental and heritage approvals process. Waste is considered to be inert and formed waste dumps will conform to WA standards. Waste will be formed as dumps or into mining voids. In the case of acid and fibre mitigation, Fortescue has industry standard procedures. Some beneficiation may take place but reject is considered to be inert and as beneficiation will be a dry process there will be no tailings requiring disposal.
Bulk density
Density has been measured from down-hole gamma-density and diamond core throughout the deposit. Whilst on site down-hole geophysical tools are calibrated fortnightly in a designated test diamond drill hole. Density values have either been estimated or applied globally to the model. Ordinary kriging was used for mineralised domains and inverse distance was used for un-mineralised domains when density has been estimated. A formula was then applied to the estimated values to yield a dry bulk density. For areas where density was applied globally, average rounded densities by geological unit and mineralisation have been compared with analogous areas/deposits and applied globally. A program to refine the conversion factor is currently underway.
Downhole geophysical probes measure the insitu bulk density which accounts for void spaces. These measurements are not corrected for moisture but are validated against known dry bulk densities from diamond core drilled in the area. Downhole geophysical measurements are grouped by geological and mineralisation domains.
The densities used are similar to known densities for current and historical mines, of similar geology and mineralisation, across the Pilbara.
Classification
The Mineral Resource has been classified as Measured, Indicated and Inferred. This takes into account drill spacing, data integrity, geological complexity, grade estimation quality and interpreted risk.
The Mineral Resource classification reflects the views of the competent persons.
Audits or reviews Internal peer reviews have been completed during all stages of the estimate. An external audit of a previous Inferred Mineral Resource for Eliwana was completed by Snowden with no significant flaws identified. Similar processes have been used for this estimate.
Discussion of relative accuracy/ confidence
Estimation uncertainty analysis has been completed on certain areas of the deposit using sub-set estimates and the estimation variance. The volumes of the areas tested are approximately equivalent to annual and quarterly rates of production. The accuracy noted is similar to analogous Fortescue operational deposits and the confidence level of the Mineral Resource is appropriate as deemed by the Competent Person.
No production data is available at this stage.
Competent Person’s Statements The information in this report that relates to Eliwana Mineral Resources is based on information compiled by Mr Stuart Robinson who is a Fellow of The Australasian Institute of Mining and Metallurgy, and Mr Nicholas Nitschke and Ms Erin Retz who are Members of The Australasian Institute of Mining and Metallurgy. Mr Stuart Robinson, Mr Nicholas Nitschke and Ms Erin Retz are full-time employees and shareholders of Fortescue Metals Group Ltd. Mr Robinson, Mr Nitschke and Ms Retz have sufficient experience that is relevant to the style of mineralisation and type of deposit under consideration and to the activity which they are undertaking to qualify as a Competent Person as defined in the 2012 Edition of the ‘Australasian Code for Reporting of Exploration Results, Mineral Resources and Ore Reserves’. Mr Robinson, Mr Nitschke and Ms Retz consent to the inclusion in this report of the matters based on this information in the form and context in which it appears.

42
JORC Code, 2012 Edition – Table 1 Combined Fortescue Hematite Deposits Section 4 Estimation and Reporting of Ore Reserves
Criteria Commentary
Mineral Resource estimate for conversion to Ore Reserves
The Chichester and Solomon individual regional resource models described in Section 3, depleted by mining to 30 March 2020, are the basis for the conversion to Ore Reserves (which are subsequently adjusted for an additional 3 months of mining depletion and ore stockpiling to reflect Ore Reserves position at end of June 2020). These models are regularised, merged with local models and adjusted based on reconciliation history to create the Mining Models that form the basis for Ore Reserve reporting. The Eliwana individual resource model described in Section 3, is the basis for the conversion to Ore Reserves position at end of June 2020. The model is regularised to create the Mining Model that forms the basis for Ore Reserve reporting. Mineral Resources are inclusive of the Ore Reserves quoted here.
Site visits Periodic site visits are undertaken by the Competent person to monitor on-going mining and processing operations relevant to estimation of Ore Reserves.
Study status
Cloudbreak (CB) and Christmas Creek (CC) Ore Reserves relate to operating properties that have been established for over ten years. The Firetail deposit has been mined and processed for approximately seven years while mining and processing has occurred at the Kings CID deposit for six years. Routine integrated short, medium and long term planning activities are carried out according to a company planning calendar, including annual life-of-mine (LOM) and Ore Reserve plans. The technical feasibility of mining and processing activities is well understood based on the operating history for both the Chichester and the Solomon deposits. Where possible, material Modifying Factors are derived from actual operating history to maximise the confidence in plan and Reserve outcomes. The LOM and associated Ore Reserve plans include an ore sales product strategy, ore definition and cut-offs, mine and waste designs and schedules, infrastructure designs including roads, drainage, remote crushing, dewatering, tails dams and the like, closure designs and schedules, fleet and manpower requirements, operating and capital costs and financial analysis. Due to the site operating history and the 170Mt per annum installed infrastructure, the Chichester and Solomon Ore Reserve estimations are considered to be equivalent or better than a “definitive” feasibility study standard. Shorter term plans (1 to 3 years) are supported by a detailed budgeting process. Eliwana is currently a construction project with mining fleet executing pre-stripping activities and expected OPF commissioning and first ore on train in 2020. The feasibility study was completed in 2018.
Cut-off parameters
The company produces a number of standard BID and CID blended products that are delivered by rail and assembled at the Fortescue Port Hedland ore stockyards from contributions of each mine-site. A linear programming approach is adopted where “ore bins” are created and the maximum tonnage of blended ore is assembled that meets the product specification of each of the BID and CID brands. Since the quality of mineralisation varies with time at each deposit and site, the cut-off grade(s) can also vary with time to achieve the required product outcome. Due to the methodology, and opportunistic blending, a fixed cut-off is not used for Ore Reserve reporting. However, Fe cut-off, SiO2 and Al2O3 cut-off for each major ore type deposit can be applied to approximate the Ore Reserve outcome. The ROM Fe grade that most closely approximates the Ore Reserve for all deposits is 53.5%

43
Criteria Commentary
Mining factors or assumptions
Both the Chichester and Solomon regional resource models are estimated into parent block and sub-cells and are regularised to a common block size to match the local resource models (typically 12.5m x 12.5m x 1m) to allow for model merging. After regularisation, the regional resource models are merged with local models (built to a common origin and orientation as the regional resource models) to reflect the greatest level of detailed information available for each deposit. Both the Chichester and Solomon merged models are then regularised to the most appropriate block size to simulate the expected mining selectivity, dilution and ore loss for the mining method applied at each deposit (eg 25m x 25m x 3m). Chichester pit geometry with an average overall slope angle of approximately 35 degrees are optimised based on the latest available excavator mining models with inferred materials included in the optimisation. Due to the Chichester ore body flat and shallow nature, no detailed ultimate pit designs are maintained, optimised pit shells are used directly for mine scheduling. The resulting models are compared with sales data over the prior twelve months to derive reconciliation factors that are then applied to the in-situ regularised tonnage and quality attributes to create the adjusted Run Of Mine (ROM) estimates of tonnage and grade in the “Mining Model”. The Mineral Resource models for Eliwana were regularised to a block size of 25 m E x 25 m N x 5 m RL for the Marra Mamba deposits, 25 m E x 25 m N x 10 m RL for West End (Brockman deposit) and 25 m E x 25 m N x 6 m RL for the other Brockman deposits, which was determined to be the selective mining unit following analysis of a range of selective mining units. Dilution and mining recovery were modelled by applying the regularisation process to the sub-block geological model. Solomon and Eliwana pits are fully designed geometries with dimensions consistent with the scale of mining equipment employed, and geotechnical and operational considerations made. Geotechnical design recommendations for the Eliwana Project have been supplied based on geotechnical studies in accordance with industry guidelines to the required confidence levels. The underlying data consists specific of geotechnical drilling programs with associated core logging, downhole surveys and laboratory programs, in addition to resource estimation programs that support the geological and structural models. Data analysis and reporting is undertaken by a combination of internal and external expertise. The resultant recommended slope design domains and parameters are dependent on the local rock mass, hydrogeology, and structural geological conditions. Conventional mining methods (truck and shovel) are utilised (or will be utilised) at all Fortescue operating/future mines. Ore Processing Facility (OPF) upgrade factors (predicted based on test-work and/or reconciled from actual OPF upgrade performance) are then applied to the ROM data to

44
Criteria Commentary
create a “product” data set. There is no beneficiation associated with ore directed to the Firetail (at Solomon) or Eliwana OPFs, so the ROM values constitute the product data set. It is this product dataset that is used as the basis for both LOM and Ore Reserve plans and Ore Reserve reporting. The LOM plan fully includes Inferred mineralisation. For the Ore Reserve plan, only Measured and Indicated Mineral Resources are considered. Inferred mineralisation is treated as waste for the purposes of scheduling, reporting and financial valuation of the Ore Reserve.
Metallurgical factors or assumptions
Cloudbreak (CB) and Christmas Creek (CC) mineralisation is all treated through 3 existing wet processing plants at a collective Reserve design rate of 90 (wet) Mt of product per annum. Processing consists of primary, secondary and tertiary crushing; screening, and downstream beneficiation based on particle sizing and density. Low grade reject is directed to wet tailings disposal facilities. The processes are well tested and the sites have developed an operating history for both mass yield and element upgrades for typical OPF feed to supplement historical test-work. CC2 OPF is adding a Wet High Intensity Magnetic Separation (WHIMS) process to provide the option of the downstream beneficiation conducted by particle sizing and either density or WHIMS. All wet OPF’s yields and upgrades are based on recent test work carried out on diamond drill core. This program aim’s to better predict up-coming mineralisation types. Previous 12 months operating history is then used to augment these factors. Firetail and Eliwana OPFs are dry plants with 100% yield and no upgrading.
Environmental
The CB and CC mines and associated infrastructure were initially approved under the Iron Ore (Fortescue Chichester Pty Ltd) Agreement Act 2006 (State Agreement) per CB Ministerial Statement 721 and CC Ministerial Statement 707 and subsequent amendments. Scope of these approvals included mine pits, ore processing facilities, tailings storage facilities, above ground landforms, rail, conveyors, camps, roads, water abstraction and injection infrastructure and other infrastructure associated with mining. Significant changes relative to these primary approvals are subject to assessment by both State and Commonwealth entities including the WA Environmental Protection Authority (EPA) and other State authorities and the Department of Agriculture, Water and the Environment (DAWE). Such revision to the Cloudbreak mine was approved by Ministerial Statement 0899 in June 2012 and the Federal Approval EPBC 2010/5696 in November 2012. A revised Christmas Creek Proposal was approved by Ministerial Statement 1033 in August 2016 and EPBC 2013/7055 in January 2017. Operating licences (L8199/2007/2 for CB and L8454/2010/2 for CC) and various Works Approvals issued by the WA Department of Water and Environmental Regulation (DWER) are in place for both sites. The Solomon project was initially referred to the EPA under Part IV of the Environmental Protection Act (EP Act) in July 2010 and State Ministerial approval was granted in April 2011 subject to the conditions of Ministerial Statement (MS) 862. Subsequent project amendments to MS 862 addressed an increase to the railway footprint (2011) and additional bore field clearing (2013). The project was also assessed and approved by the (DoEE) under the Environment Protection and Biodiversity Conservation Act 1999 (EPBC Act). A revised Solomon Proposal was approved by MS 1062 in October 2017 and EPBC 2014/7275 in June 2018. The Solomon project is also subject to regulation by the DWER through Part V of the EP Act and Fortescue holds a number of Works Approvals and Licences for the site. Construction of the mine(s) and associated infrastructure is also subject to assessment and approval by way of Mining Proposals as required under Section 82A(2) of the Mining Act 1978 administered by the Department of Mines, Industry Regulation

45
Criteria Commentary
and Safety. Fortescue also holds a number of licences under the Rights in Water and Irrigation Act 1914 for the abstraction of groundwater issued by WER. Future amendments to existing approvals and licences will be sought on a routine basis as more information is gathered during the course of normal mining and processing operations. The Environmental Review Document (ERD) pertaining to the Eliwana Project, includes a detailed impact assessment and description of proposed mitigation and management measures for the environmental factors identified in the Environmental Scoping Document. The Eliwana Proposals were referred to the Western Australia Environmental Protection Authority (EPA) under Section 38 of the EP Act on the 3rd and 7 July 2017 for the Rail and Mine proposals respectively. The EPA determined both Proposals required assessment under Part IV of the EP Act and set the level of assessment at Public Environmental review (PER). The EPA released its report, recommending the projects be approved, on 29 April and 24 June 2019. The projects were both approved by the WA Minister for the Environment on 14 August 2019, subject to the conditions of MS 1108 and MS 1109. Both Proposals were also referred under Section 68 of the EPBC Act to the DoEE on 23 August 2017. The DoEE determined that both Proposals had the potential to impact upon Matters of National Environmental Significance and were therefore considered to be controlled actions. Both the Rail and Mine proposal were approved by the Commonwealth Minister for the Environment on 25 September 2019 under Approvals EPBC 2017/8025 and EPBC 2017/8024.
Infrastructure
All mine sites are well established with all required infrastructure and services already in place. As the centre of gravity of ore mining operations moves further away from existing OPF’s, additional remote crushing and ore conveying facilities and associated infrastructure will be established on an as-needed basis to offset higher ore haulage costs. The scheduling optimisation process has included the capex required for mine development and transport for Queens deposit development at Solomon and the Kutayi deposit at the Chichesters. The remaining capital costs of construction of the Eliwana mine and associated infrastructure has also been included in the Ore Reserves Schedule.
Costs
The majority of planned capital costs to support operations are sunk. Future capital costs, including sustaining capital are subject to normal annual budget financial analysis standards. Operating costs are derived based on operating history and LOM cost target prediction. Rail freight and port handling costs are internal costs and are forecast based on operating history. Sea freight rates are forecast based on operating history and external sources. OPF treatment costs are based on operating history and LOM cost target prediction. Eliwana operating costs were benchmarked against similar operating Fortescue mine sites. An iron ore fines royalty of 7.5% is payable for non-beneficiated product. For that portion of OPF product that meets the beneficiation criterion the lower royalty of 5% is allowed. The resulting overall average royalty rate is approximately 7.35%. No private royalties are payable.
Revenue factors
Forecast metal prices and exchange rates are based on analysis of internal and external sources. Forecast sales prices and adjustments used to determine Ore Reserves consider market prices for equivalent products, value-in-use assessment plus global industry capacity and consumption trends. The forward price profile is commercially sensitive and is not disclosed. The individual Cloudbreak, Christmas Creek and Firetail BID OPF products are blended at the port to create West Pilbara Fines (WPF), Fortescue Blend (FB) and Super Special Fines (SSF). These products are sold based on Fe content at a price adjustment to the 62% Fe benchmark price.

46
Criteria Commentary
The Kings OPF treats Channel Iron Deposit (CID) plus minor detrital and bedded (DID and BID) ore to produce Kings Fines CID products. The Kings Fines product is sold based on Fe content at a price adjustment to the 62% Fe benchmark price.
Market assessment
The majority of current and future Fortescue iron ore sales are expected to be to Chinese customers with an increasing proportion to other Asian customers. Demand in this market is driven by internal consumption. Fortescue has demonstrated it can compete successfully with other suppliers and adapt products to match changing market requirements. Current Fortescue product blend ratios are maintained over the near term (approx. 5 years) and then determined by schedule optimisation to decide the optimum product ratios to deliver highest Net Present Value (NPV).
Economic
Economic analysis is based on discounted cash flow assessment to derive the NPV of the Ore Reserves plan. The NPV robustness is tested by carrying out a +/-30% sensitivity analysis of the major financial drivers (price, foreign exchange rate, opex, capex and discount rate). These sensitivity analyses demonstrate that the Ore Reserves meet the required internal Fortescue investment criteria and deliver positive NPV outcomes. The details of the economic inputs are commercially sensitive and are not disclosed.
Social
The Cloudbreak project area is within the external boundaries of the Nyiyaparli and Palyku native title determination areas. In 2005, Fortescue entered into comprehensive Land Access Agreements (LAA) with the Nyiyaparli and Palyku Traditional Custodians. The LAAs facilitate the certain grant of all required Fortescue tenure and include comprehensive Aboriginal heritage identification and management procedures. The LAAs also provide the Traditional Custodians with opportunities for training and employment; business opportunities; financial benefits; and consultation on a range of project–related matters. On 15 December 2016, an Indigenous Land Use Agreement (ILUA) between Fortescue and the Nyiyaparli People was registered on the National Native Title Tribunal’s (NNTT’s) Register of Indigenous Land Use Agreements. On 3 November 2017, an ILUA between Fortescue and Palyku People was registered on the NNTT’s Register of Indigenous Land Use Agreements. The Christmas Creek project area is within the external boundaries of the Nyiyaparli native title determination area. In 2005, Fortescue entered into a comprehensive Land Access Agreement with the Nyiyaparli Traditional Custodians (Nyiyaparli LAA). The Nyiyaparli LAA facilitates the certain grant of all required Fortescue tenure and include comprehensive Aboriginal heritage identification and management procedures. The Nyiyaparli LAA also provides the Traditional Custodians with opportunities for training and employment; business opportunities; financial benefits; and consultation on a range of project–related matters. On 15 December 2016, an Indigenous Land Use Agreement (ILUA) between Fortescue and the Nyiyaparli People was registered on the National Native Title Tribunal’s (NNTT’s) Register of Indigenous Land Use Agreements. To ensure compliance with the Aboriginal Heritage Act 1972 (WA)(AHA) Fortescue conducts both archaeological and ethnographic surveys over all land prior to the commencement of ground disturbing works. Within the Christmas Creek mining and resource area heritage surveys have identified places that are highly significant to the Nyiyaparli People; and in some instances, neighbouring Traditional Custodian groups. This includes the ethnographic place Mankarlyirrkurra (ETH-NYI11-001), and Heritage Restricted Zones associated with Kakutungutanta CB10-093 (HRZ-0132) and CB09-

47
Criteria Commentary
292 (HRZ-0005), which should be excluded from the mining resource area into the future. Fortescue Marsh has significance to the Nyiyaparli People and neighbouring Traditional Custodian groups. The creek lines that run through the Christmas Creek mining and resource area towards Fortescue Marsh and the quality/flow of water entering the marsh system are important to the Traditional Custodian groups. In accordance with the Nyiyaparli LAA Fortescue has an obligation to minimise impact to creeks and has committed to avoiding Kandama Creek (Christmas Creek, HRZ-006) and portions of Kakutungutanta Creek (HRZ-0259 and HRZ-0007) which should be excluded from the mining resource area into the future. Wherever possible, when creeks must be temporarily diverted for mining purposes they should be re-established following completion of the project operations. Fortescue has agreed not to undertake exploration or mining on the Fortescue Marsh without the consent of the Nyiyaparli People, and is committed to ensuring the flow and quality of water entering the marsh system is not affected by mining activities. Most notably this is focused on the protection of known ethnographic ‘Yintha’ sites along the Marsh edges, which are fed by creek flows into the Marsh. This is currently managed by consultation with the group and the implementation of various water management methods including monitors, diversions, containments and conveyance. These water management methods must be continued and maintained during the development of Christmas Creek mine to ensure compliance with the Nyiyaparli LAA. The Kutayi deposit is located with the 100% owned Fortescue Mining Lease M46/533. It is also within the Nyiyaparli native title determination area. The Solomon project area intersects both the Eastern Guruma native title determination area and the Yindjibarndi #1 native title determination area. In 2009, Fortescue entered into an LAA with Wintawari Guruma Aboriginal Corporation on behalf of the Eastern Guruma native title holders (Wintawari LAA). The Wintawari LAA facilitates the certain grant of all required Fortescue tenure and includes comprehensive Aboriginal heritage identification and management procedures. The LAAs also provide the Traditional Custodians with opportunities for training and employment; business opportunities; financial benefits; and consultation on a range of project–related matters.
Fortescue does not have an agreement with the Yindjibarndi native title holders over the tenure associated with the Solomon Mineral Resource and Ore Reserve; however, Fortescue conducts regular heritage surveys and consultation with Yindjibarndi people, ensuring legislative compliance. Fortescue meets regularly with Yindjibarndi people to consult on a range of project-related matters and has developed an excellent working relationship with Yindjibarndi people through the Wirlu-Murra Yindjibarndi Aboriginal Corporation (WMYAC). In partnership with the WMYAC, Fortescue has delivered contracts for road maintenance, earthworks, airport transfers & across various operational sites in the Pilbara, including the Solomon project, providing a valuable revenue stream for the community and a variety of job opportunities. Fortescue has further committed $3 million to a cultural project (Gamburlarna Project), driven by Yindjibarndi people & supported by the WA National Trust, which includes community initiatives in Roebourne & on Yindjibarndi country. The Eliwana mining project is within the external boundaries of the Puutu Kunti Kurrama and Pinikura (PKKP) native title determination area.

48
Criteria Commentary
In 2010, Fortescue entered into a comprehensive Land Access Agreement with the PKKP Traditional Custodians (PKKP LAA). The PKKP LAA facilitates the certain grant of all required Fortescue tenure and include comprehensive Aboriginal heritage identification and management procedures. The PKKP LAA also provides the Traditional Custodians with opportunities for training and employment; business opportunities; financial benefits; and consultation on a range of project–related matters.
Other
Approvals status is addressed under the environmental section. There are reasonable grounds to assume that required Government approvals will continue to be granted within the timeframes anticipated in the mine schedules supporting the Ore Reserve reporting. There are no material legal agreements or marketing agreements that are anticipated to impact on the Ore Reserve. This year, Mr Oliver Wang was lead CP, and estimates were compiled under his direction, with Mr Martin Slavik as assisting CP.
Classification
Proven Ore Reserves stated are all derived from Measured Mineral Resources. The majority of Measured Mineral Resources and Proved Ore Reserve are located in areas that have been infill drilled on a close-spaced 25m x 25m grade control (GC) pattern. Probable Ore Reserves are all derived from Indicated Mineral Resources, and no Inferred Mineral Resource has been converted to Ore Reserve. The Competent Person agrees that the classification properly represents the risk associated with the Ore Reserve estimate.
Audits or reviews
No external audits have been performed on the Ore Reserves estimate this Financial year however the internal Fortescue Ore Reserve process includes progressive multi-disciplinary technical peer review and is a sub-set of the annual LOM planning process. No material issues with the input data, assumptions or output from the Ore Reserves Estimation process, were identified during this review. Annual auditing of various aspects of Mineral Resources and Ore Reserves estimation is carried in accordance with the Resources and Reserves Audit Calendar, overseen by the Audit and Risk Management Committee (ARMC) of Fortescue Board of Directors.
Discussion of relative accuracy/ confidence
The Fortescue mine sites contributing to Ore Reserves have been active for a number of years at full mining and processing rates with production data collected and reconciled against Mining model predictions. The reconciliation data is used to measure against and, when necessary, recalibrate the Mining models that the Ore Reserves estimates are derived from. The operating history of the last 12 months of mining in the Chichesters and Solomon areas has been incorporated into the reconciliation process and is reflected in the factors applied to the mining models used for this year’s Ore Reserves estimate. The Ore Reserve estimation techniques utilised for Eliwana deposits are consistent with those applied at the existing operations. Reconciliation of actual production with planning model estimates for individual deposits is generally within 2 percent for tonnes and grades on an annual basis. This result is indicative of a robust Ore Reserve estimation process.
Competent Person’s Statements The information in this report that relates to the Fortescue Ore Reserve is based on information compiled and reviewed by Mr Oliver Wang (lead Competent Person) and Mr Martin Slavik (assisting Competent Person). All Competent Persons are Members of The Australasian Institute of Mining and Metallurgy. Mr Wang and Mr Slavik are shareholders and full-time employees of Fortescue Metals Group Limited. Mr Wang and Mr Slavik have sufficient experience that is relevant to the style of mineralisation and type of deposit under consideration and to the activity being undertaken to qualify as Competent Persons as defined in the 2012 Edition of the ‘Australasian Code for Reporting of Exploration Results, Mineral

49
Resources and Ore Reserves’. Mr Wang and Mr Slavik consent to the inclusion in the report of the matters based on their information in the form and context in which it appears.

50

51
Fortescue Magnetite Mineral Resources and Ore Reserves Reporting as at 30 June 2020
Magnetite Mineral Resources and Ore Reserves The Mineral Resources and Ore Reserves for the Iron Bridge Magnetite Project, which incorporates the North Star, Eastern Limb, Glacier Valley and West Star deposits, were announced on 2 April 2019 (ASX announcement ‘Iron Bridge Magnetite Mineral Resources and Ore Reserves Update: Operating Properties’, released 2 April 2019). There has been no change to the stated Mineral Resources and Ore Reserves and the April 2019 figures remain current. Details of the Mineral Resource and Ore Reserve estimates, including commentary on the JORC Table 1 assessment criteria, can be found in the original announcement dated 2 April 2019. The Company confirms that it is not aware of any new information or data that materially affects the information included in the original market announcement and that all material assumptions and technical parameters underpinning the estimates in the relevant market announcement continue to apply and have not materially changed. The Company confirms that the form and context in which the Competent Person’s findings are presented have not been materially modified from the original market announcement.
Mineral Resources for the Iron Bridge Magnetite Project are estimated to comprise a total of 5,448Mt at 22.7% Davis Tube Recovery (DTR ) mass recovery, 30.4% Fe, 41.1% SiO2, 2.59% Al2O3, 0.103% P, 0.135% S and 7.49% total LOI, as summarised in Table 4. The Mineral Resources are classified as a combination of Measured, Indicated and Inferred Resources and are reported above a 9% mass recovery cut-off based on pit optimisations and mining studies carried out by Fortescue.
Iron Bridge Ore Reserves are based on the onsite processing of fresh magnetite mineralised material into a saleable concentrate product that is pumped by slurry pipeline to port. Ore Reserves for the Iron Bridge project are classified as Probable Reserves and are estimated to be 716Mt at 29.4% DTR mass recovery, to produce a 67.0% Fe, 5.62% SiO2 and 0.29% Al2O3 product, as summarised in Table 5. The Ore Reserve is reported above a 17% mass recovery cut-off grade.

52
Table 4 - Magnetite Mineral Resources as at 30 June 2020
June 2020 June 2019
In-Situ Tonnes
(mt)
DTR mass
recovery %
In-situ Iron Fe %
In-situ Silica SiO2
%
In-situ Alumina
Al2O3 %
In-Situ Tonnes
(mt)
DTR mass
recovery %
In-situ Iron Fe %
In-situ Silica SiO2
%
In-situ Alumina
Al2O3 %
North Star + Eastern Limb
Measured 109 25.0 33.2 40.2 2.06 109 25.0 33.2 40.2 2.06
Indicated 825 24.5 30.3 41.3 2.74 825 24.5 30.3 41.3 2.74
Inferred 2,217 24.2 29.8 41.5 2.84 2,217 24.2 29.8 41.5 2.84
Total 3,150 24.3 30.1 41.4 2.79 3,150 24.3 30.1 41.4 2.79
Glacier Valley
Measured - - - - - - - - - -
Indicated 191 23.7 33.4 39.4 1.73 191 23.7 33.4 39.4 1.73
Inferred 1,480 20.3 31.9 39.6 1.94 1,480 20.3 31.9 39.6 1.94
Total 1,671 20.6 32.0 39.6 1.92 1,671 20.6 32.0 39.6 1.92
West Star
Measured - - - - - - - - - -
Indicated - - - - - - - - - -
Inferred 627 20.6 28.1 43.8 3.36 627 20.6 28.1 43.8 3.36
Total 627 20.6 28.1 43.8 3.36 627 20.6 28.1 43.8 3.36
Total Magnetite Mineral Resources
Measured 109 25.0 33.2 40.2 2.06 109 25.0 33.2 40.2 2.06
Indicated 1,016 24.3 30.9 41.0 2.55 1,016 24.3 30.9 41.0 2.55
Inferred 4,324 22.3 30.3 41.2 2.61 4,324 22.3 30.3 41.2 2.61
Total 5,448 22.7 30.4 41.1 2.59 5,448 22.7 30.4 41.1 2.59
Notes in reference to table 4 • As per the Iron Bridge Project agreements, Fortescue owns 60.72% of the reported Total Magnetite Ore Reserve estimate. • All magnetite Mineral Resources are reported above a 9 per cent Mass Recovery cut-off, based on DTR test work. • All Mineral Resources are reported on a dry-tonnage basis. • Magnetite Mineral Resources are reported inclusive of Ore Reserves. • Tonnage information has been rounded and as a result the figures may not add up to the totals quoted.

53
Table 5 - Magnetite Ore Reserves as at 30 June 2020
June 2020 June 2019
In-Situ Tonnes
(mt)
DTR mass
recovery %
Product Iron Fe %
Product Silica SiO2
%
Product Alumina
Al2O3 %
In-Situ Tonnes
(mt)
DTR mass
recovery %
Product Iron Fe %
Product Silica SiO2
%
Product Alumina
Al2O3 %
North Star and Eastern Limb
Proved - - - - - - - - - -
Probable 595 29.7 67.0 5.62 0.29 595 29.7 67.0 5.62 0.29
Total 595 29.7 67.0 5.62 0.29 595 29.7 67.0 5.62 0.29
Glacier Valley
Proved - - - - - - - - - -
Probable 122 26.2 67.0 5.62 0.29 122 28.2 67.0 5.62 0.29
Total 122 26.2 67.0 5.62 0.29 122 28.2 67.0 5.62 0.29
West Star
Proved - - - - - - - - - -
Probable - - - - - - - - - -
Total - - - - - - - - - -
Total Magnetite Ore Reserves
Proved - - - - - - - - - -
Probable 716 29.4 67.0 5.62 0.29 716 29.4 67.0 5.62 0.29
Total 716 29.4 67.0 5.62 0.29 716 29.4 67.0 5.62 0.29
Notes in reference to table 5 • As per the Iron Bridge Project agreements, Fortescue owns 60.72% of the reported Total Magnetite Ore Reserve estimate. • Magnetite Ore Reserves are derived from Measured and Indicated Mineral Resources reported within a defined pit design. • Magnetite Ore Reserves are based on Mass Recovery expressed as a 17 per cent Davis Tube Recovery (DTR) cut-off. • Magnetite Ore Reserves are reported on an in-situ dry-tonnage basis. • Tonnage information has been rounded and as a result the figures may not add up to the totals quoted.
Related Documents