Fort McMurray Observatory Monthly Magnetic Bulletin BRITISH GEOLOGICAL SURVEY Fort McMurray 15/ 1/FM 2015

Welcome message from author
This document is posted to help you gain knowledge. Please leave a comment to let me know what you think about it! Share it to your friends and learn new things together.
Transcript

FortMcMurrayObservatoryMonthlyMagneticBulletin
BRITISH GEOLOGICAL SURVEY
Fort McMurray
15/11/FMNovember 2015

FORT McMURRAY OBSERVATORY MAGNETIC DATA
1. Introduction The British Geological Survey (BGS) now operate or assist in the operation of six overseas geomagnetic observatories. The most recently established of these, Fort McMurray Observatory, is a joint venture between BGS and Sperry Drilling, Halliburton Group Canada in support of directional drilling programmes. The installation was carried out in December 2014 and the earliest data and data products are available from January 2015. This bulletin is published to provide rapid access to the provisional geomagnetic observatory results. The information is freely available for personal, academic, educational and non-commercial research or use. Magnetic observatory data are presented as a series of plots of one-minute, hourly and daily values, followed by tabulations of monthly values. The operation of the observatory and presentation of data are described in the rest of this section. Enquiries about the data should be addressed to:
Geomagnetism Team Earth Hazards and Systems British Geological Survey
Murchison House, West Mains Road Edinburgh EH9 3LA
Scotland, UK
Tel: +44 (0) 131 667 1000 Fax: +44 (0) 131 668 2683 E-mail: [email protected] Internet: www.geomag.bgs.ac.uk
2. Position Fort McMurray Observatory is situated on Halliburton land, to the south of the town of Fort McMurray in Alberta, Canada. The observatory co-ordinates are:- Geographic: 56° 35’53“N 248° 41’06” E Geomagnetic: 63° 31’41”N 309° 32’49” E Height above mean sea level: 386m The geographical co-ordinates and altitude were determined by a surveying company using a differential GPS and reference station. Data were provided in GPS co-ordinates to UTM 12 NAD83: Ellipsoid GRS1980, and converted to WGS84 by BGS. The geomagnetic co-ordinates are approximations, calculated using the 12th
generation International Geomagnetic Reference Field (IGRF) at epoch 2015.5. On-line access to models (including IGRF), charts and navigational data are available at http://www.geomag.bgs.ac.uk/data_service/models_compass/home 3. The Observatory Operation 3.1 GDAS The observatory operates under the control of the Geomagnetic Data Acquisition System (GDAS), which was developed by BGS staff, installed and became fully operational from December 2014. The data acquisition software, running on QNX operated computers, controls the data logging and the communications. There are two sets of sensors used for making magnetic measurements. A tri-axial linear-core fluxgate magnetometer, manufactured by DTU Space at the Technical University of Denmark, is used to measure the variations in the horizontal (H) and vertical (Z) components of the field. The third sensor is oriented perpendicular to these, and measures variations, which are proportional to the changes in declination (D). Measurements are made at a rate of 1 Hz. In addition to the fluxgate sensors, a GEM Systems GSM-90 Overhauser magnetometer makes measurements of the absolute total field intensity (F) every 5 seconds. The raw unfiltered data are retrieved automatically via Internet connections to the BGS office in Edinburgh in near real-time. The fluxgate data are filtered to produce one-minute values using a 61-point cosine filter and the total field intensity samples are filtered using a 13-point cosine filter. 3.2 Absolute Observations The GDAS fluxgate magnetometers accurately measure variations in the components of the geomagnetic field, but not the absolute magnitudes. Two sets of absolute measurements of the field are made manually twice per month. A fluxgate sensor mounted on a theodolite is used to determine D and inclination (I); the GDAS PPM measurements, with a site difference correction applied, are used for F. The absolute observations are used in conjunction with the GDAS variometer measurements to produce a continuous record of the absolute values of the geomagnetic field

elements as if they had been measured at the
observatory reference pillar.
4. Observatory Results
The data presented in the bulletin are in the form of
plots and tabulations described in the following
sections.
4.1 Absolute Observations
The absolute observation measurements made
during the month are tabulated. Also included are
the corresponding baseline values, which are the
differences between the absolute measurements
and the variometer measurements of D, H and Z (in
the sense absolutevariometer). These are also
plotted (markers) along with the derived
preliminary daily baseline values (line) throughout
the year. Daily mean differences between the
measured absolute F and the F computed from the
baseline corrected H and Z values are plotted in the
fourth panel (in the sense measuredderived). The
bottom panel shows the daily mean temperature in
the fluxgate chamber.
4.2 Summary magnetograms
Small-scale magnetograms are plotted which allow
the month's data to be viewed at a glance. They are
plotted 16 days to a page and show the one-minute
variations in D, H and Z. The scales are shown on
the right-hand side of the page. On disturbed days
the scales are multiplied by a factor, which is
indicated above the panel for that day. The
variations are centred on the monthly mean value,
shown on the left side of the page.
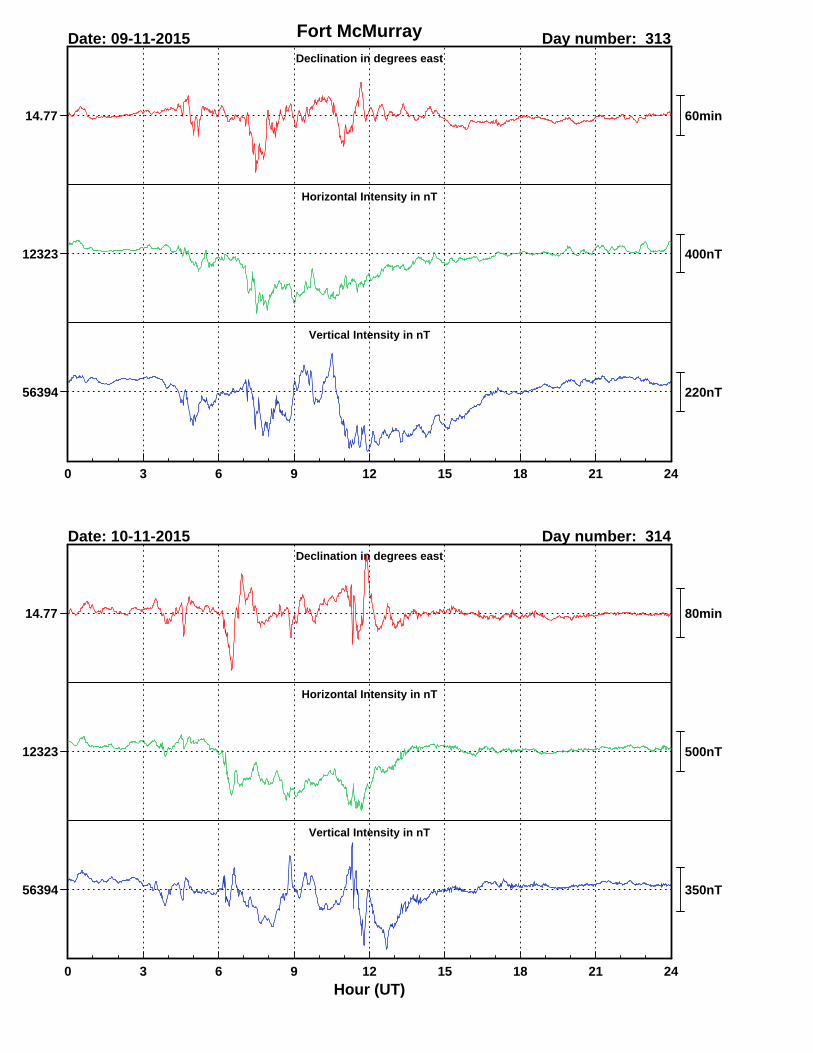
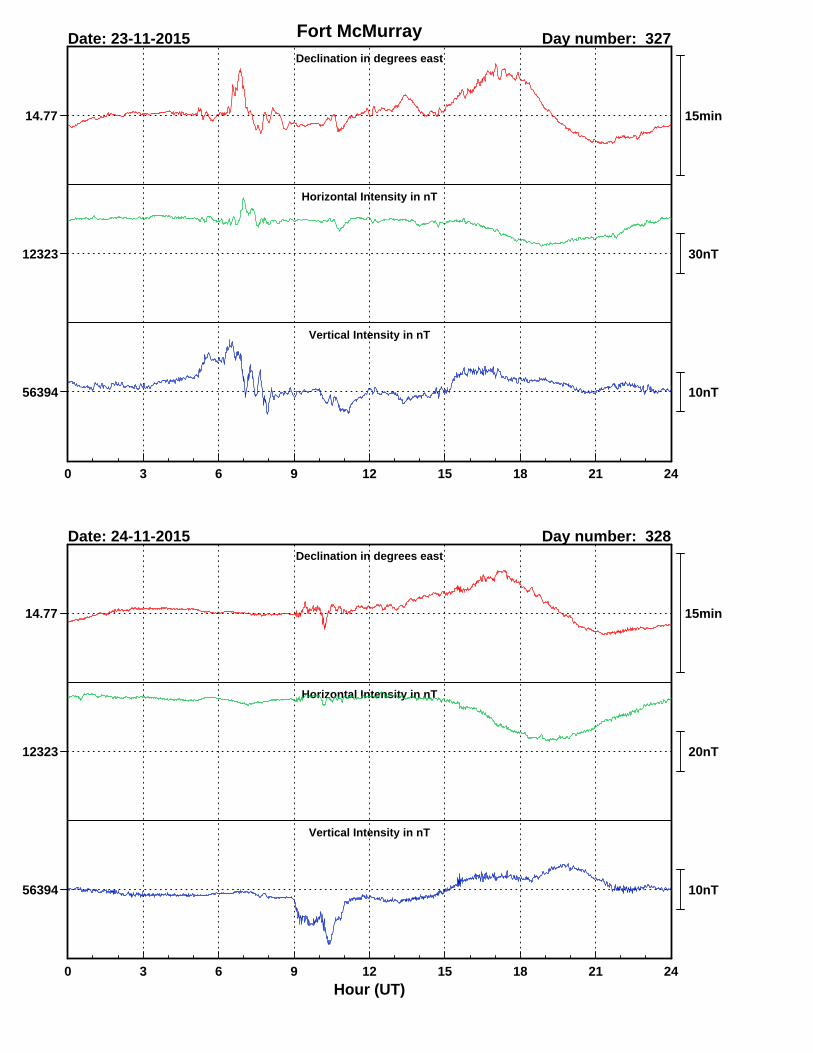
4.3 Magnetograms
The daily magnetograms are plotted using one-
minute values of D, H and Z from the fluxgate
sensors. The magnetograms are plotted to a
variable scale; scale bars are shown to the right of
each plot. The absolute level (the monthly mean
value) is indicated on the left side of the plots.
4.4 Hourly Mean Value Plots
Hourly mean values of D, H and Z for the past 12
months are plotted in 27-day segments
corresponding to the Bartels solar rotation number.
Magnetic disturbances associated with active
regions and/or coronal holes on the Sun may recur
after 27 days: the same is true for geomagnetically
quiet intervals. Plotting the data in this way
highlights this recurrence. Diurnal variations are
also clear in these plots and the amplitude changes
throughout the year highlight the seasonal changes.
Longer term secular variation is also illustrated.
4.5 Daily and Monthly Mean Values
Daily mean values of D, H, Z and F are plotted
throughout the year. In addition, a table of monthly
mean values of all the geomagnetic elements is
provided. These values depend on accurate
specification of the fluxgate sensor baselines. It is
anticipated that these provisional values will not be
altered by more than a few nT or tenths of
arcminutes before being made definitive at the end
of the year.
5. Conditions of Use
The outputs presented in this bulletin are provided
for personal, academic, educational, non-
commercial research or other non-commercial use
and are not for sale or distribution to third parties
without written permission from BGS.
Reproduction of any part of this bulletin should be
accompanied by the statement: 'Reproduced with
the permission of the British Geological Survey
©NERC. All rights Reserved'. Publications making
use of the data should include an acknowledgment
statement of the form: ‘The results presented in this
paper rely on the data collected at Fort McMurray
observatory, operated by Sperry Drilling,
Halliburton Group Canada and the British
Geological Survey.’
Commercial users can contact the geomagnetism
team for information on the range of applications
and services offered. Full contact details are
available at www.geomag.bgs.ac.uk/contactus/staff
© NERC 2015. All rights reserved Edinburgh British Geological Survey 2015

Fort McMurray OBSERVATORY
ABSOLUTE OBSERVATIONS
Declination Inclination Total Field Horizontal Intensity Vertical Intensity
Date Day
Number
Time
(UT)
Absolute
(º)
Baseline
(º)
Time
(UT)
Absolute
(º)
Site
difference
(nT)
Absolute
corrected
(nT)
Absolute
(nT)
Baseline
(nT)
Absolute
(nT)
Baseline
(nT) Observer
03-Nov-15 307 22:18 -26.4536 999.9999 22:34 77.6587 0.5 99999.9 99999.9 99999.9 99999.9 99999.9 SP
04-Nov-15 308 17:45 14.8147 999.9999 17:55 77.6585 0.5 99999.9 99999.9 99999.9 99999.9 99999.9 SP
04-Nov-15 308 18:15 14.7788 999.9999 18:25 77.6629 0.5 99999.9 99999.9 99999.9 99999.9 99999.9 SP
19-Nov-15 323 21:20 14.7150 14.5583 21:29 77.6642 0.5 57739.6 12335.6 12328.6 56406.6 56487.7 RG
19-Nov-15 323 21:40 14.7133 14.5600 21:45 77.6663 0.5 57740.1 12333.6 12324.2 56407.4 56488.6 TM
19-Nov-15 323 21:54 14.7208 14.5667 22:00 77.6648 0.5 57740.7 12335.2 12324.8 56407.7 56488.5 RG
20-Nov-15 324 16:40 14.8948 14.6000 16:52 77.6587 0.5 57735.1 12339.9 12325.3 56401.0 56488.6 RG
20-Nov-15 324 17:03 14.8692 14.6050 17:10 77.6625 0.5 57732.0 12335.6 12325.0 56398.7 56488.6 RG

Fort McMurray 2015Declination : Absolute - Variometer (markers) and Baseline Applied (line)
Horizontal Intensity : Absolute - Variometer (markers) and Baseline Applied (line)
Vertical Intensity : Absolute - Variometer (markers) and Baseline Applied (line)
Total Intensity : Absolute (Proton F) - Baseline Adjusted Variometer (derived F)
Temperature Inside Variometer Hut
Jan Feb Mar Apr May Jun Jul Aug Sep Oct Nov Dec
14.62 10min
12325 20nT
56487 6nT
-0.5 20nT
24.7 30 C

Fort McMurray November 2015
200 nT
1.00o
200 nT
Z 56394
D 14.77
H 12323
1 2 3 4
Z 56394
D 14.77
H 12323
5 Scale x 8 6 Scale x 2 7 Scale x 16 8 Scale x 4
Z 56394
D 14.77
H 12323
9 Scale x 8 10 Scale x 8 11 Scale x 8 12
6 12 18 24
Z 56394
D 14.77
H 12323
13 Scale x 2
6 12 18 24
14 Scale x 2
6 12 18 24
15 Scale x 2
6 12 18 24
16 Scale x 4

Fort McMurray November 2015
200 nT
1.00o
200 nT
Z 56394
D 14.77
H 12323
17 Scale x 2 18 Scale x 4 19 Scale x 4 20 Scale x 2
Z 56394
D 14.77
H 12323
21 22 23 24
Z 56394
D 14.77
H 12323
25 26
6 12 18 24UT
27
6 12 18 24UT
28 Scale x 2
6 12 18 24
Z 56394
D 14.77
H 12323
29
6 12 18 24
30 Scale x 8

Declination in degrees east
0 3 6 9 12 15 18 21 24
Horizontal Intensity in nT
Vertical Intensity in nT
Declination in degrees east
0 3 6 9 12 15 18 21 24Hour (UT)
Horizontal Intensity in nT
Vertical Intensity in nT
14.77
12323
56394
14.77
12323
56394
Fort McMurray Date: 01-11-2015 Day number: 305
Date: 02-11-2015 Day number: 306

Declination in degrees east
0 3 6 9 12 15 18 21 24
Horizontal Intensity in nT
Vertical Intensity in nT
Declination in degrees east
0 3 6 9 12 15 18 21 24Hour (UT)
Horizontal Intensity in nT
Vertical Intensity in nT
14.77
12323
56394
14.77
12323
56394
Fort McMurray Date: 03-11-2015 Day number: 307
15min
40nT
20nT
Date: 04-11-2015 Day number: 308

Declination in degrees east
0 3 6 9 12 15 18 21 24
Horizontal Intensity in nT
Vertical Intensity in nT
Declination in degrees east
0 3 6 9 12 15 18 21 24Hour (UT)
Horizontal Intensity in nT
Vertical Intensity in nT
14.77
12323
56394
14.77
12323
56394
30min
300nT
140nT
Fort McMurray Date: 05-11-2015 Day number: 309
15min
80nT
70nT
Date: 06-11-2015 Day number: 310

Declination in degrees east
0 3 6 9 12 15 18 21 24
Horizontal Intensity in nT
Vertical Intensity in nT
Declination in degrees east
0 3 6 9 12 15 18 21 24Hour (UT)
Horizontal Intensity in nT
Vertical Intensity in nT
14.77
12323
56394
14.77
12323
56394
100mi
900nT
350nT
Fort McMurray Date: 07-11-2015 Day number: 311
30min
160nT
160nT
Date: 08-11-2015 Day number: 312
Declination in degrees east
0 3 6 9 12 15 18 21 24
Horizontal Intensity in nT
Vertical Intensity in nT
Declination in degrees east
0 3 6 9 12 15 18 21 24Hour (UT)
Horizontal Intensity in nT
Vertical Intensity in nT
14.77
12323
56394
14.77
12323
56394
60min
400nT
220nT
Fort McMurray Date: 09-11-2015 Day number: 313
80min
500nT
350nT
Date: 10-11-2015 Day number: 314

Declination in degrees east
0 3 6 9 12 15 18 21 24
Horizontal Intensity in nT
Vertical Intensity in nT
Declination in degrees east
0 3 6 9 12 15 18 21 24Hour (UT)
Horizontal Intensity in nT
Vertical Intensity in nT
14.77
12323
56394
14.77
12323
56394
45min
280nT
100nT
Fort McMurray Date: 11-11-2015 Day number: 315
15min
50nT
50nT
Date: 12-11-2015 Day number: 316

Declination in degrees east
0 3 6 9 12 15 18 21 24
Horizontal Intensity in nT
Vertical Intensity in nT
Declination in degrees east
0 3 6 9 12 15 18 21 24Hour (UT)
Horizontal Intensity in nT
Vertical Intensity in nT
14.77
12323
56394
14.77
12323
56394
30min
90nT
70nT
Fort McMurray Date: 13-11-2015 Day number: 317
30min
80nT
100nT
Date: 14-11-2015 Day number: 318

Declination in degrees east
0 3 6 9 12 15 18 21 24
Horizontal Intensity in nT
Vertical Intensity in nT
Declination in degrees east
0 3 6 9 12 15 18 21 24Hour (UT)
Horizontal Intensity in nT
Vertical Intensity in nT
14.77
12323
56394
14.77
12323
56394
15min
90nT
70nT
Fort McMurray Date: 15-11-2015 Day number: 319
30min
200nT
120nT
Date: 16-11-2015 Day number: 320

Declination in degrees east
0 3 6 9 12 15 18 21 24
Horizontal Intensity in nT
Vertical Intensity in nT
Declination in degrees east
0 3 6 9 12 15 18 21 24Hour (UT)
Horizontal Intensity in nT
Vertical Intensity in nT
14.77
12323
56394
14.77
12323
56394
15min
80nT
80nT
Fort McMurray Date: 17-11-2015 Day number: 321
30min
200nT
140nT
Date: 18-11-2015 Day number: 322

Declination in degrees east
0 3 6 9 12 15 18 21 24
Horizontal Intensity in nT
Vertical Intensity in nT
Declination in degrees east
0 3 6 9 12 15 18 21 24Hour (UT)
Horizontal Intensity in nT
Vertical Intensity in nT
14.77
12323
56394
14.77
12323
56394
15min
200nT
120nT
Fort McMurray Date: 19-11-2015 Day number: 323
15min
40nT
90nT
Date: 20-11-2015 Day number: 324

Declination in degrees east
0 3 6 9 12 15 18 21 24
Horizontal Intensity in nT
Vertical Intensity in nT
Declination in degrees east
0 3 6 9 12 15 18 21 24Hour (UT)
Horizontal Intensity in nT
Vertical Intensity in nT
14.77
12323
56394
14.77
12323
56394
15min
30nT
30nT
Fort McMurray Date: 21-11-2015 Day number: 325
15min
30nT
10nT
Date: 22-11-2015 Day number: 326
Declination in degrees east
0 3 6 9 12 15 18 21 24
Horizontal Intensity in nT
Vertical Intensity in nT
Declination in degrees east
0 3 6 9 12 15 18 21 24Hour (UT)
Horizontal Intensity in nT
Vertical Intensity in nT
14.77
12323
56394
14.77
12323
56394
15min
30nT
10nT
Fort McMurray Date: 23-11-2015 Day number: 327
15min
20nT
10nT
Date: 24-11-2015 Day number: 328

Declination in degrees east
0 3 6 9 12 15 18 21 24
Horizontal Intensity in nT
Vertical Intensity in nT
Declination in degrees east
0 3 6 9 12 15 18 21 24Hour (UT)
Horizontal Intensity in nT
Vertical Intensity in nT
14.77
12323
56394
14.77
12323
56394
15min
30nT
10nT
Fort McMurray Date: 25-11-2015 Day number: 329
15min
30nT
10nT
Date: 26-11-2015 Day number: 330

Declination in degrees east
0 3 6 9 12 15 18 21 24
Horizontal Intensity in nT
Vertical Intensity in nT
Declination in degrees east
0 3 6 9 12 15 18 21 24Hour (UT)
Horizontal Intensity in nT
Vertical Intensity in nT
14.77
12323
56394
14.77
12323
56394
15min
70nT
60nT
Fort McMurray Date: 27-11-2015 Day number: 331
15min
60nT
100nT
Date: 28-11-2015 Day number: 332

Declination in degrees east
0 3 6 9 12 15 18 21 24
Horizontal Intensity in nT
Vertical Intensity in nT
Declination in degrees east
0 3 6 9 12 15 18 21 24Hour (UT)
Horizontal Intensity in nT
Vertical Intensity in nT
14.77
12323
56394
14.77
12323
56394
15min
60nT
60nT
Fort McMurray Date: 29-11-2015 Day number: 333
45min
450nT
120nT
Date: 30-11-2015 Day number: 334

Rotn 15.17
14.51 2474
2475
2476
2477
2478
2479
2480
2481
2482
2483
2484
2485
2486
2487
Dec14
Jan15
Feb
Mar
Apr
May
Jun
Jul
Aug
Sep
Oct
Nov
Fort McMurray Observatory: Declination (degrees)
0 1 2 3 4 5 6 7 8 9 10 11 12 13 14 15 16 17 18 19 20 21 22 23 24 25 26 27Hourly Mean Values Plotted By Bartels Solar Rotation Number

Rotn 12546
12084 2474
2475
2476
2477
2478
2479
2480
2481
2482
2483
2484
2485
2486
2487
Dec14
Jan15
Feb
Mar
Apr
May
Jun
Jul
Aug
Sep
Oct
Nov
Fort McMurray Observatory: Horizontal Intensity (nT)
0 1 2 3 4 5 6 7 8 9 10 11 12 13 14 15 16 17 18 19 20 21 22 23 24 25 26 27Hourly Mean Values Plotted By Bartels Solar Rotation Number

Rotn 56580
56307 2474
2475
2476
2477
2478
2479
2480
2481
2482
2483
2484
2485
2486
2487
Dec14
Jan15
Feb
Mar
Apr
May
Jun
Jul
Aug
Sep
Oct
Nov
Fort McMurray Observatory: Vertical Intensity (nT)
0 1 2 3 4 5 6 7 8 9 10 11 12 13 14 15 16 17 18 19 20 21 22 23 24 25 26 27Hourly Mean Values Plotted By Bartels Solar Rotation Number

Fort McMurray Observatory 2015Daily Mean Declination (deg)
Daily Mean Horizontal Intensity (nT)
Daily Mean Vertical Intensity (nT)
Daily Mean Total Intensity (nT)
Jan Feb Mar Apr May Jun Jul Aug Sep Oct Nov Dec
14.84 20min
12315 275nT
56444 150nT
57772 175nT
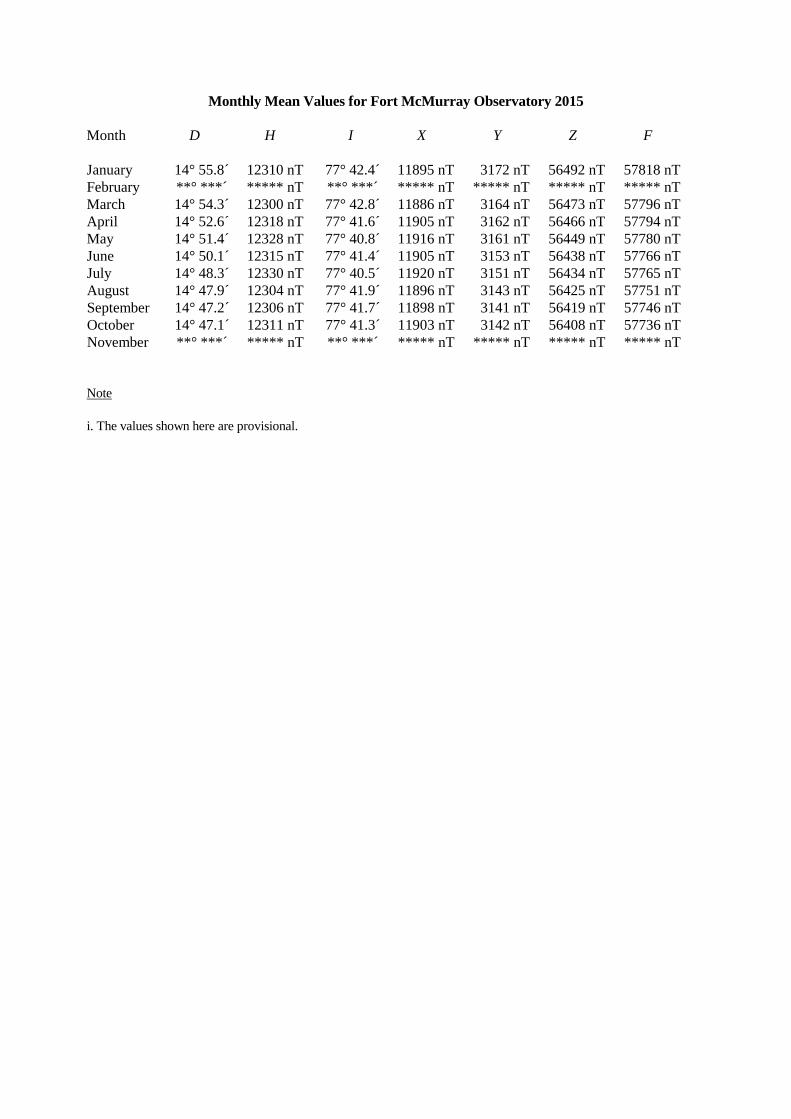
Monthly Mean Values for Fort McMurray Observatory 2015 Month D H I X Y Z F January 14° 55.8´ 12310 nT 77° 42.4´ 11895 nT 3172 nT 56492 nT 57818 nT February **° ***´ ***** nT **° ***´ ***** nT ***** nT ***** nT ***** nT March 14° 54.3´ 12300 nT 77° 42.8´ 11886 nT 3164 nT 56473 nT 57796 nT April 14° 52.6´ 12318 nT 77° 41.6´ 11905 nT 3162 nT 56466 nT 57794 nT May 14° 51.4´ 12328 nT 77° 40.8´ 11916 nT 3161 nT 56449 nT 57780 nT June 14° 50.1´ 12315 nT 77° 41.4´ 11905 nT 3153 nT 56438 nT 57766 nT July 14° 48.3´ 12330 nT 77° 40.5´ 11920 nT 3151 nT 56434 nT 57765 nT August 14° 47.9´ 12304 nT 77° 41.9´ 11896 nT 3143 nT 56425 nT 57751 nT September 14° 47.2´ 12306 nT 77° 41.7´ 11898 nT 3141 nT 56419 nT 57746 nT October 14° 47.1´ 12311 nT 77° 41.3´ 11903 nT 3142 nT 56408 nT 57736 nT November **° ***´ ***** nT **° ***´ ***** nT ***** nT ***** nT ***** nT Note i. The values shown here are provisional.
Related Documents