Submitted by: College of Forestry and Natural Resources University of the Philippines Los Baños Funded by: River Basin Control Office Department of Environment and Natural Resources Climate Change-Responsive Integrated River Basin Management and Development Master Plans for the 8 Clustered River Basins Executive Summary for Cluster 7 River Basin (Ayala, Bolong, Curuan, Manicahan, Tumaga and Vitali-Taguite)

Welcome message from author
This document is posted to help you gain knowledge. Please leave a comment to let me know what you think about it! Share it to your friends and learn new things together.
Transcript
Submitted by:
College of Forestry and Natural Resources
University of the Philippines Los Baños
Funded by:
River Basin Control Office
Department of Environment and Natural Resources
Climate Change-Responsive
Integrated River Basin Management
and Development Master Plans for
the 8 Clustered River Basins
Executive Summary for Cluster 7 River Basin
(Ayala, Bolong, Curuan, Manicahan, Tumaga and
Vitali-Taguite)
i
Executive Summary
Formulation of Climate Change-Responsive Integrated River Basin Management and Development Master Plan for the Cluster 7 River Basin
Table of Contents
1 RATIONALE .................................................................................................................................................... 1
2 PROJECT OBJECTIVES ............................................................................................................................... 1
3 SCOPE AND LIMITATION ......................................................................................................................... 1
4 METHODOLOGY ........................................................................................................................................... 2
5 ASSESSMENT REPORTS ........................................................................................................................... 3
5.1 Geophysical Profile ........................................................................................................................... 3
5.2 Bioecological Profile ......................................................................................................................... 5
5.3 Demographic Profile ........................................................................................................................ 5
5.4 Socio-economic Profile.................................................................................................................... 5
5.5 Infrastructure ...................................................................................................................................... 7
5.6 Land Capability Assessment ......................................................................................................... 9
5.7 Stakeholder Analysis ........................................................................................................................ 9
5.8 Policy and Institutional Assessment......................................................................................... 9
5.9 Vulnerability Assessment ............................................................................................................ 10
5.9.1 Hazard Vulnerability Assessment .................................................................................. 10
5.9.2 Vulnerability of Water Resources .................................................................................. 10
5.9.3 Participatory Risk and Vulnerability Assessment ................................................. 11
6 MANAGEMENT AND DEVELOPMENT PLAN ................................................................................ 11
6.1 Vision ..................................................................................................................................................... 11
6.2 Mission .................................................................................................................................................. 11
6.3 Development Issues and Challenges ...................................................................................... 11
6.3.1 Water Resources Management ....................................................................................... 11
6.3.2 Forest Ecosystem and Biodiversity Management .................................................. 11
6.3.3 Wetland Management.......................................................................................................... 12
6.3.4 Disaster Risk Reduction and Management ................................................................ 12
6.3.5 Economic Development ...................................................................................................... 13
6.3.6 Institutional Development ................................................................................................ 13
6.4 Implementation Plan...................................................................................................................... 13
6.4.1 Initial Identification of Preferred Measures ............................................................. 13
6.4.2 Identified Programs and Projects .................................................................................. 14
6.5 Investment Plan ................................................................................................................................ 16
1
Executive Summary
Formulation of Climate Change-Responsive Integrated River Basin Management and Development Master Plan for the Cluster 7 River Basin
EXECUTIVE SUMMARY
1 RATIONALE
Pursuant to Executive Order (EO) Nos. 510, 816 and 50, the River Basin Control Office (RBCO) was created to develop, among others, a national master plan to address flooding and to provide sustainable water supply for the entire country. The sustainable management of river basins is critical as they are considered as drivers of the Philippine economy. In line with the Philippine Development Plan, the preparation of the river basin master plan used the integrated river basin management approach. The plan intends to address several concerns on watershed conservation, river basin rehabilitation, flood control/mitigation, water security for domestic, irrigation and industrial uses, and livelihood and economic opportunities in the area.
For CY 2016, several river basins were targeted for the preparation of the master plan. A cluster of which is situated in Zamboanga Peninsula, which consists Ayala, Bolong, Curuan, Manicahan, Tumaga and Vitali-Taguite River Basins. In relation with the passage of Republic Act (RA) No. 9729 or the Climate Change Act of 2009 and RA 10121 or the Disaster Risk Reduction Law of 2010, climate change perspectives were incorporated and mainstreamed together with disaster risk reduction issues and measures.
2 PROJECT OBJECTIVES
The objective of this project is to formulate the Integrated River Basin Management and Development Master Plan (IRBMDMP) for the Cluster 7 River Basin (Ayala, Bolong, Curuan, Manicahan, Tumaga, Vitali-Taguite), taking into consideration biological diversity and their capacity to provide goods and services. The plan incorporates the implications of the new climate normals in addressing the concerns of the river basin on:
1. Water Resources Management; 2. Forest Ecosystem and Biodiversity Management; 3. Flood Control/Mitigation, Disaster Risk Reduction and Hazards Management; 4. Wetland Management (including rivers, river deltas, marshlands and coastal
areas); 5. Economic Development; and 6. Institutional Linkages and Organizational Structure for River Basin Management.
3 SCOPE AND LIMITATION
The project formulated the Integrated Management and Development Master Plan for the
Cluster 7 River Basin, taking into consideration potential climate change impacts to
provide a sound basis for management decisions in the sustainable management of the
resources therein. The project consisted of two phases, the scope of which includes:
1. Formulation of river basin profile;
2. Crafting of vision, missions, and goals;
2
Executive Summary
Formulation of Climate Change-Responsive Integrated River Basin Management and Development Master Plan for the Cluster 7 River Basin
3. Identification of strategies, programs and projects;
4. Evaluation of strategies, programs and projects; and
5. Investment and implementation planning.
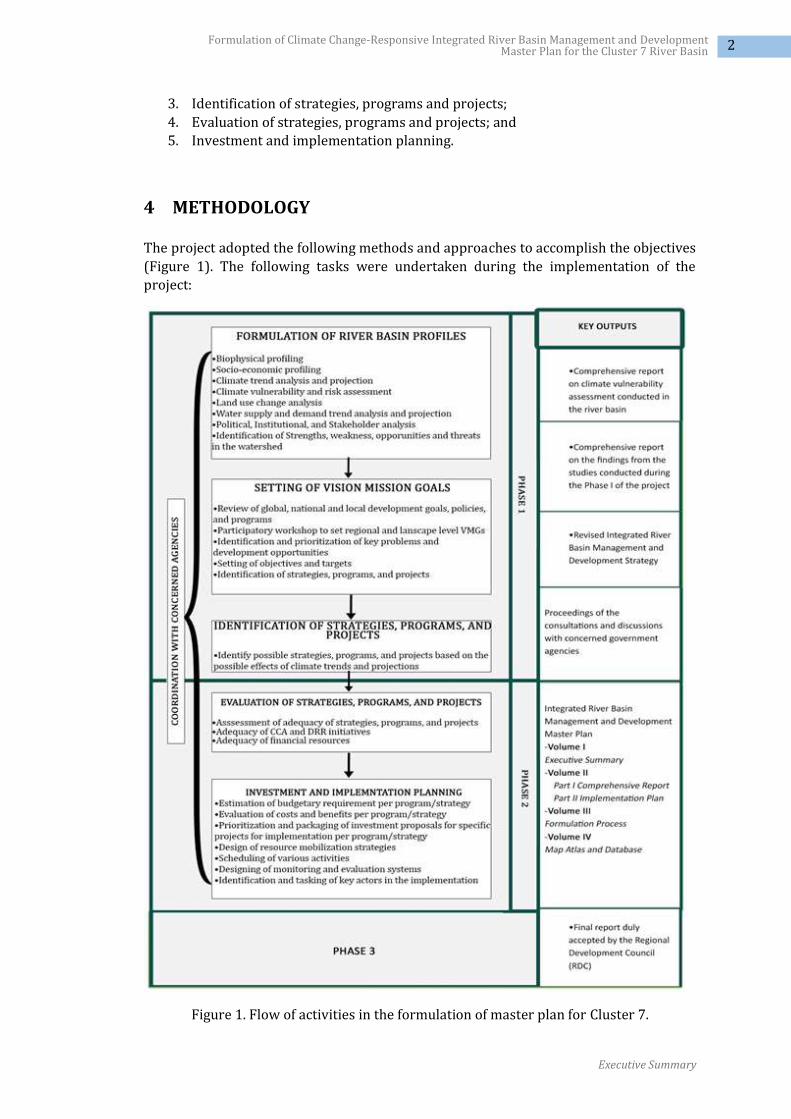
4 METHODOLOGY
The project adopted the following methods and approaches to accomplish the objectives
(Figure 1). The following tasks were undertaken during the implementation of the
project:
Figure 1. Flow of activities in the formulation of master plan for Cluster 7.
3
Executive Summary
Formulation of Climate Change-Responsive Integrated River Basin Management and Development Master Plan for the Cluster 7 River Basin
5 ASSESSMENT REPORTS
5.1 Geophysical Profile
Geographic Location
The Cluster 7 River Basin is located along the Eastern Portion of the Zamboanga Peninsula
and it spreads northward from the peninsula’s southern tip. It is composed of six principal
river basins, namely Ayala, Bolong, Curuan, Manicahan, Tumaga and Vitali-Taguite. The
largest in terms of area is Vitali-Taguite with about 30% of its area belonging to Barangay
Vitali of Zamboanga City, while only about 12% of the river basin belongs to Zamboanga
Del Norte. The five other principal river basins are located within Zamboanga City.
Between these six, 26 minor watersheds were identified. The total area of the Cluster is
98,445 ha.
Climate Trends
The area of the Cluster 7 River Basin falls under Type III of the Modified Corona Climate Classification System, where seasons are not very pronounced. The annual mean normal temperature is 28.3°C. January is the coldest month and April is the warmest. The average annual rainfall in the area is 1,266.5 mm. Meanwhile, the number of rainy days per month in the City varies from 6 to 16 days. Annually, the normal number of rainy days on average is 133 out of 365, which is equivalent to about 36%. In terms of temperature projection for the mid-21st century (2036-2065), an additional increase of up to 1.3°C and 1.7°C were projected for the RCP 4.5 and RCP 8.5 scenarios, respectively. For the late 21st century (2070-2099), it is expected that the cluster will experience an increase of up to 1.7°C for the RCP 4.5 scenario, or up to 3.3°C for the RCP 8.5 scenario. In terms of the rainfall projection for the mid-21st century (2036-2065), the amount will generally decrease by 1 mm to 40.9 mm for the RCP 4.5 scenario. For the RCP 8.5 scenario, the amount will decrease only for two seasons, in DJF and SON. There will be an increase for MMA and JJA. For the late 21st century, the largest decrease will be during the SON season for both the scenarios. An increase is expected during the MAM season.
Topography
Majority or about 79% of the total area of the Cluster 7 River Basin are located in
relatively low elevation (0 to 400 masl elevation range). Only about 1% are in elevation
above 1,000 masl. Meanwhile, about 65% of the total area are in level slopes to moderate
slopes. The most frequent slope class is 8%-18% or moderate slopes, covering about 35%
of the Cluster.
Soils and Geology
There are 13 soil types present in the Cluster 7 River Basin. The most dominant soil type
is undifferentiated mountain soil covering 51% of the total area. It is followed by
Pasonanca loam and Bulacan clay loam, which encompass 15% and 12% respectively. In
terms of geology, there are nine distinct geologic formations underlying the area.
Additionally, there is one fault system that traverses the river basins, namely the
Zamboanga Fault System.
Water Resources
With six principal river basins and 26 minor watersheds, the Cluster consists of numerous
tributaries; however, the only available streamflow records obtained are from Tumaga
4
Executive Summary
Formulation of Climate Change-Responsive Integrated River Basin Management and Development Master Plan for the Cluster 7 River Basin
River. The drainage area is around 210.5 km2. Based on the available data, the annual
average flow is about 5.46 m3/s. By frequency analysis using Log-Pearson Type III, the
80% dependable monthly flow ranges from a low of 1.66 m3/s during March to a high of
4.95 m3/s in October, with an average annual dependable flow of 3.01 m3/s or about
324.34 MCM/yr. In terms of groundwater, the Cluster is comprised of local and less
productive aquifers (43%), rocks without any significant groundwater (36%), and rocks
with limited potential (21%). The NWRB classifies Zamboanga City as one of the areas
with stressed groundwater. Using the latest PAGASA climate projections, it is estimated
that by 2050, groundwater development potential or the total extractable groundwater
from the aquifers in the river basin is about 28.5 MCM/yr.
Land Classification and Land Cover
Most of the Cluster 7 River Basin is classified as forestlands (65%), with only 35% of the
area classified as alienable and disposable. The most dominant land cover in the area is
perennial crops, encompassing about 36% of the Cluster. It is followed by brush/shrubs
(31%), closed forest (10%) and grasslands (9%). In terms of land cover change analysis
from 2010 to 2015, grasslands increased by 4,527 ha and mangrove forests by 832 ha.
Both the closed forests and open forests decreased in 2015 by 1,153 ha and 530 ha,
respectively.
Natural Hazards
About 18% of the area or 17,667 ha of the Cluster 7 River Basin is very highly susceptible
to flooding. Among the barangays largely affected by this hazard are Tumaga, Tolosa,
Sibulao (Caruan), Bunguiao and Curuan.
In terms of landslide, the Cluster has a larger area susceptible to rainfall-induced than
with earthquake-induced. About 71% of the total area are highly susceptible to rainfall-
induced landslide. Meanwhile, about 10% of the Cluster are very highly susceptible to
earthquake-induced landslide, and 33% are classified as highly susceptible.
For storm surge events, about 216 ha are highly susceptible to 2-m inundation (A1 Alert
Level), while 1,413 ha are moderately susceptible. For at least 5-m inundation (A4 Alert
Level), about 4,177 ha are highly susceptible within the Cluster, while 1,379 ha are
moderately susceptible.
About 10,126 ha of the Cluster are classified as susceptible to tsunami. This area includes
the portions of the barangays Ayala, La Paz, Tulungatung, Bolong, Curuan, Buenavista,
Latuan (Curuan), Manicahan, Arena Blanco, Boalan, Divisoria, Guiwan, Mampang,
Mercedes, Pasonanca, Putik, Santa Maria, Talon-talon, Tetuan, Tugbungan Tumaga,
Zambowood, Limaong, Mangusu and Vitali.
The Cluster experienced severe drought impacts in 1982-1983, 1997-1998 and 1987-
1988. These periods were also those recorded as the worst El Niño experiences in the
Philippines between 1977 and 2000. In more recent years, the 2014-2016 El Niño event
significantly affected Zamboanga City. It was reported that out of the 25 irrigation dams
in the area, nine dried up, six were in critical conditions and 10 were below the normal
water level.
In terms of tropical cylones, among those that have affected the area are Typhoon Violet
in 1955 and Typhoon Vinta in 2017. In general, Mindanao has a low occurrence of tropical
cyclones, but despite this, its indirect effects such as rains and strong winds are
experienced.
5
Executive Summary
Formulation of Climate Change-Responsive Integrated River Basin Management and Development Master Plan for the Cluster 7 River Basin
5.2 Bioecological Profile
The importance of the biological diversity of the Cluster 7 River Basin is evidenced by the
presence of several conservation and special interest sites in the area. Among these are
two protected areas, including the Pasonanca Natural Park, one key biodiversity area, and
several wetland areas.
As listed, the Pasonanca Natural Park is dominated by 70 tree species belonging to 30
families. Nine of these species are endemic to the Philippines, while 14 species are listed
as threatened. In terms of faunal diversity, the park is home to numerous species of birds,
mammals, amphibians and reptiles. There are at least 39 bird species, 24 mammal species,
44 amphibian species, and 71 reptile species. Some of which are considered as threatened.
The area is also rich in coastal resources, from seagrasses, corals and fishes to mangrove
forests. Zamboanga City has an approximate coastal length of 208 km. There are eight
species of seagrasses covering 5,436 ha, 4,367 ha of corals, 16 species of mangroves, and
at least 86 species of fishes. The city is likewise considered as the Sardines Capital of the
Philippines.
5.3 Demographic Profile
Based on the 2015 Census, the Cluster 7 River Basin has an estimated population of
715,435. Among the barangays that comprise the river basins, the most populous are
Talon-talon and Mampang with 34,916 and 34,312 respectively. The two barangays are
both in Tumaga river basin, which is the largest in the cluster in terms of estimated
population. The least populous among the six is Manicahan with an estimated population
of only 29,180. The population in the Cluster is expected to continuously increase over
the years, but at a decreasing rate. By 2045, the estimated population is expected to reach
1,086,859. The estimated population density of Zamboanga City is at 609 persons/km2.
The area has an expansive population pyramid, which indicates a younger population. It
also siginifies that the Cluster 7 river basins and watersheds will experience population
growth through time, especially when the younger segment of the population enters their
reproductive stage.
5.4 Socio-economic Profile
Settlement Pattern
In 2015, the urbanization level of Zamboanga City is 85.6%. From 2007 to 2010, the urban
population within the Cluster 7 River Basin increased. This is possibly because urban
areas generally have better access to basic services. Per river basin, more than 50% of
the population of Ayala, Bolong, Manicahan and Tumaga reside in urban barangays. The
river basin with the largest urban population is Tumaga. Only Curuan and Vitali-Taguite
river basins have residents that mostly reside in the rural areas.
6
Executive Summary
Formulation of Climate Change-Responsive Integrated River Basin Management and Development Master Plan for the Cluster 7 River Basin
Cultural Patterns
The population of Cluster 7 is primarily composed of Zamboangeño Chavacano, which comprise 38% of the total population. It is followed by the Tausug, a dominant ethnic group in the Sulu Archipelago, which comprise 22%. Other ethnic groups are Bisaya, Samal, Yakan, Sama Bangingi, Hiligaynon, Ilonggo, Tagalog, Cebuan, Subanen, Ilocano, Badjao, Sama Badjao, Chinese and Sama Laut. In terms of religious affiliation, the most dominant among the population of Zamboanga City is Roman Catholicism comprising 60%, followed by Islam with 35% of the population as members. Other Christian denominations comprise about 4%, among others.
Housing Tenure
About 48% of the households in Zamboanga City own their house. 10% of the households rent their house or room, including lot, and another 6% own a house, but rent the lot. This data on property ownership can be an indicator for household participation, especially in activities on watershed management.
Energy Consumption
Majority or 88% of the households use electricity for lighting. About 9% use kerosene,
while others use other sources, such as LPG, oil, solar panel and solar lamp. About 489
households in the city do not have any source of lighting.
Health
The leading causes of morbidity in the Zamboanga Peninsula include acute respiratory infection, hypertension and ALTRI and pneumonia. In terms of death rate, the number of deaths per 1,000 population in 2017 is 4,391, where 2,537 are male
Literacy and Education
The average literacy rate in Zamboanga City for both sexes is 97%. Most of the population in Cluster 7 are elementary (10%) and high school (15%) graduates or at least have reached these levels; 26% are elementary undergraduates and 15% are high school undergraduates. About 11% of the population or 87,756 are academic degree holders, while 13% are college undergraduates.
Poverty and Subsistence
The 2012 poverty incidence estimate for Zamboanga City was 12.6%, which is lower than
the 26.3% national average. This is likewise an improvement than in 2009, which was
19.9%. Meanwhile, in the two municipalities of Zamboanga del Norte, where some areas
of Vitali-Taguite river basin is located, the poverty incidence estimates are higher. In
2012, Sibuco had a poverty incidence of 67.2%, while Sirawai had 41.5%.
In 2015, the food threshold reported for Zamboanga del Sur, where Zamboanga City is statistically grouped, was Php 13,949. The subsistence incidence estimate among population is 7.5%. The estimate is lower in comparison with the national average for 2015, which was 8.1%.
Human Development Index
Human Development Index (HDI) is a measure for human development, which focuses on three dimensions, namely health, education, and income. The 2012 HDI of the area was valued at 0.56, which is lower than the national estimate of 0.64. This implies that the government needs to improve its delivery of basic services to areas within the Cluster.
7
Executive Summary
Formulation of Climate Change-Responsive Integrated River Basin Management and Development Master Plan for the Cluster 7 River Basin
Employment
The employment rate in the area area is relatively high (95.7%). The underemployment rate is 9.2%. Most of the gainful workers in the area are employed as service and sales workers (54,172 individuals). It is followed by those with elementary occupations (17%) and skilled workers in the agriculture, forestry and fishery sector (17%).
Sectoral Production
Historically, there is an increasing volume of production for corn from 2007 to 2017. For
rice production, the trend was slightly decreasing from 2015 to 2017. For the top five
other crops, the production of coconut decreased, while cassava production increased.
The volume of production for banana Saba and mango remained stable over the years. In
terms of fisheries production, the trend for commercial fisheries is decreasing. In
contrast, production from aquaculture and municipal fisheries have slightly increased
from 2007 to 2012. For tourism, records from 2011 to 2017 have shown that tourist
arrivals in Zamboanga City have increased over the years, especially from domestic
travelers.
5.5 Infrastructure
Educational Facilities
For the school year 2015-2016, there are 21 pre-school facilities within the area, 223 elementary schools and 71 secondary schools. For higher education, there are 18 tertiary schools in the City and there are 34 technical and vocational schools. The student-classroom ratio for elementary is 43:1 and for secondary is 45:1, which are also both within the standard set by DepEd.
Health Facilities
There are 13 medical hospitals within the area. Among these hospitals, six are owned by the government, while seven are privately owned. In addition to the hospitals, there are also rural health units (RHU) in the area. In 2015, Zamboanga City barangays with existing RHUs include Ayala, Calarian, Canelar, Curuan, Guiwan, Labuan, Manicahan, Mercedes, Sangali, Sta. Catalina, Sta. Maria, Talon-Talon, Tetuan, Tumaga, Vitali and Baliwasan.
Roads and Bridges
The total length of national roads in Zamboanga City is 146.12 km. A total of 33.96 km and
18.52 km are described with poor and bad conditions, respectively. The rest are in either
fair or good conidition. The total number of national bridges in Zamboanga City is 49,
which has a total length of 1,475 lm. Over half of these bridges (51%) are in good
condition while others (47%) have fair condition, and only one bridge is described with
poor condition.
Evacuation Centers
There are about 44 evacuation centers within and around the watersheds as listed by DSWD in 2015. Most of the facilities used for evacuation are gyms. Meanwhile, DPWH Region IX listed one evacuation center in Cabatangan, Zamboanga City.
8
Executive Summary
Formulation of Climate Change-Responsive Integrated River Basin Management and Development Master Plan for the Cluster 7 River Basin
Water Supply
About 96% of households in the area have access to improved safe water supply. Majority
(74%) of these households have access to Level 3 water supply, while 14% and 12% have
access to levels 2 and 1 water supply respectively. The water supply for cooking and
drinking in Cluster 7 is usually sourced from own use faucets or community water
systems. The main water distributor in the area is the Zamboanga City Water District.
Dams and Irrigation
There is currently one operational dam located in Manicahan river basin that was
established through a LWUA loan. Other similar structures are located in Bolong river
basin, namely Bonguioa Dam, and the Guiwan Overflow Dam in the Tumaga river basin.
Sanitation Facilities
Presently, the City operates a 10.6-ha sanitary landfill situated at Brgy. Salaan. The said
facility is designed to receive about 200 tons per day of solid waste from the City for 15
years. Its operation started on March 31, 2015. The City also operates a Styro/Plastic
densifier and grinding machine used to recycle about 40 kg of styro, converting them to
about 60 block/pavers per day. Also, there are 31 Materials Recovery Facilities (MRFs)
within and around the area for separating, processing and preparing recyclables to bring
it back into the market.
Communication
There is currently an insufficiency in the number of information and communication
facilities and network in the area. Out of the 175,010 households of Zamboanga City in
2010, only 15,755 have access to internet. Also, major communication lines in the City
only pass through one path, which makes the possibility of complete communication line
issue high in the event of disasters.
Financial Institutions
The financial institutions within and around the Cluster 7 river basins include 120 banks (as of 2015) and 265 pawnshops (as of 2012). The presence of banks in the area plays an important role in socioeconomic development.
Energy
The primary provider of electricity is the National Power Corporation (NPC)
complemented with several other independent power producers. The Zamboanga
Electric Cooperative (ZAMCELCO) is the main power distributor. ZAMCELCO has seven
substations in Zamboanga City. Other power providers in the area include AMORE and
ZAMSURECO 2. In 2014, ZAMCELCO was able to serve 90 barangays. As of 2016, there are
12 power plants in Zamboanga City.
Transportation
In terms of intra-urban transportation, land travel within the city is usually through tricycles, PUVs and private cars. In addition, there are also buses in the area, stationed at the Integrated Bus Terminal at Brgy. Divisoria. The two main entry and exit points are Zamboanga City-Labuan-Limpapa Road and the Pagadian-Zamboanga City Road. For inter-urban transportation, travel methods include land, air and sea, depending on the destination. The city is likewise connected internationally through the Zamboanga
9
Executive Summary
Formulation of Climate Change-Responsive Integrated River Basin Management and Development Master Plan for the Cluster 7 River Basin
International Airport. Other than air travel, the city has a seaport, the port of Zamboanga, which serves as link to neighboring Southeast Asian countries.
5.6 Land Capability Assessment
The land capability zoning output for the observed rainfall scenario summarize the basis
for the allocation of lands. The strict protection areas comprise about 7% of the total land
area in the Cluster. The agroforestry zone covers about 40% of the Cluster or 39,624 ha.
The limited production zone covers about 5%, while the strict protection zone covers 7%
or 6,291 ha. The combination of the two buffer zones only comprises about 0.3%. Lastly,
the unlimited production zone comprises about 48% of the total area or about 46,926 ha.
The 2050 and 2085 land capability zones were also obtained using the rainfall projections
obtained from PAGASA.
5.7 Stakeholder Analysis
Based from the FGDs, there are at least 33 major stakeholders in the Cluster. These
stakeholders were grouped into three categories: user groups, mediating groups, and
external interest groups. Seven of which are classified as user groups, 17, which are
mostly government offices, are placed under mediating groups, and at least nine were
identified as external interest groups.
At least 13 motives that cement alliances were identified. These are water quality, social
responsibility and community participation, economic interests, livelihood, policy and
programs, protected area management, irrigation and water system, 4Ps, National
Greening Program, assistance to LGUs, planting materials and seminars, conflict
resolution, and fertilization program. Meanwhile, sources of conflict include use of land
resources, resistance from the community and problems in terms of social perception,
access to irrigation, water contamination, environmental sanitation and
protection/destruction, land use and river protection, land boundary issues, and
development projects in susceptibe areas.
In terms of importance and influence, 23 stakeholders are identified as both very
important and highly influential. Six are classified as important and less influential. These
six stakeholders are said to be marginalized; thus, they must be included in the various
interventions for the river basin.
5.8 Policy and Institutional Assessment
Many policies encompass the management of the river basin, including the Sustainable
Development Goals (2015-2030), Philippine Development Plan (2011-2016), Mindanao
Strategic Development Framework (2010-2020), Sustainable National Action Plan (2009-
2019), National Climate Change Action Plan (2011-2028), Philippine Strategy for
Sustainable Development (1999), etc. These policies have a goal to improve the quality of
life through poverty alleviation, sustainable development, capacity building, disaster risk
reduction, and climate change adaptation.
10
Executive Summary
Formulation of Climate Change-Responsive Integrated River Basin Management and Development Master Plan for the Cluster 7 River Basin
These frameworks evolved from the water and environment summits and principles such
as the Dublin Principle for water scarcity, Earth Summit in 1992, Agenda 21 and the
adoption of IWRM by GWP. Its main objective is to promote sustainable development of
water resources at all levels and sectors. It further expanded to the Integrated River Basin
development and Management (IRBDM), which is the focus of this project.
Various key government agencies from national and subnational levels play crucial roles
in river basin management and development. The institutional arrangements of these
agencies possess differing relationship in terms of mandates and functions. Nevertheless,
they have pertinent roles to carry out under the components of river basin management
and development framework, namely; water resource management, forest ecosystem and
biodiversity, wetland management, flood management and institutional development.
To implement these management strategies and as a solution to further eliminate the
issue of fragmentation, lack of coordination, inefficiency, overlaps, it is proposed that
there must be a coordinating mechanism that would harmonize the initiatives in the river
basin. This should be accompanied by a coordinating body to facilitate delivery of goods
and services for the stakeholders as well as provide mechanisms for conflict resolution.
5.9 Vulnerability Assessment
5.9.1 Hazard Vulnerability Assessment
The vulnerability of the Cluster 7 River Basin to three hazards, namely, flooding, landslide, and storm surge were assessed. In terms of flooding, around 5% (4,808 hectares) of the entire cluster were classified to be vulnerable. These vulnerable areas are mostly within Zamboanga City, which is situated along the east coast of the Peninsula. Barangays with the largest areas classified as highly vulnerable are Bolong, Cabaluay and Mercedes
In terms of landslide, approximately 4% of the cluster is classified as highly vulnerable in terms of landslide. Most of these highly vulnerable areas are located in Zamboanga City, wherein Vitali has the largest area with 1,339 hectares.
In terms of vulnerability to storm surge, roughly 1% of the Cluster is characterized as
highly vulnerable. This area is just confined to the coastal barangays of Zamboanga City.
The most vulnerable barangays are Mampang and Mercedes.
5.9.2 Vulnerability of Water Resources
It is assumed that the domestic and industrial water demands will be sourced mainly from
groundwater, while the agricultural water demands will be subtracted from the surface
water supply. The estimated agricultural water demands for 2030 and 2050 are still
within but very close to the capacity of the surface water sources at 80% dependable flow.
Under such condition, reservoir type irrigation systems should be studied for
implementation to take advantage of the high streamflow during the rainy season.
If the conservative scenario domestic and industrial water demand projections were
used, it would translate to a water demand of 44.5 MCM/yr in 2030 and 84.5 MCM/yr in
2050. These values are way more than the estimated groundwater availability of 19.5 and
28.5 MCM/yr in 2030 (taken from the present groundwater availability) and 2050,
respectively, based only on 5% recharge from the annual rainfall.
11
Executive Summary
Formulation of Climate Change-Responsive Integrated River Basin Management and Development Master Plan for the Cluster 7 River Basin
5.9.3 Participatory Risk and Vulnerability Assessment
The risk evaluation for the whole river basin was arrived at by assigning a numerical value
for the degree of likelihood and consequences. Using these values, the degree of likelihood
and consequences for each risk event was assessed. Results show that flood and drought
pose the highest risk in Cluster 7, followed by landslide and tsunami. Flood, drough and
landslide were assessed as high-risk events, which calls for high priority control
measures. On the other hand, tsunami was assessed as moderate-risk event.
6 MANAGEMENT AND DEVELOPMENT PLAN
6.1 Vision
The vision statement for the Cluster 7 River Basin was crafted using the keywords from
the inter-agency focus group discussion. It was made in accordance to an integrated river
basin management approach. The stakeholders agreed to the following vision statement:
“A sustainable, well-managed, productive and resilient cluster of watersheds
supporting a balanced ecosystem with empowered communities while sustaining its
multiple uses”
The statement highlights the need for empowered stakeholders in taking care of the
watersheds. Moreover, it recognizes the importance of economic growth and human
development, without compromising the environment.
6.2 Mission
For the Cluster 7 River Basin, the mission statements were likewise crafted during the
focus group discussions. The mission statements for the whole cluster, as listed by the
stakeholders from the inter-agency FGD, are as follows:
• To institutionalize partnerships and collaborations among stakeholders
• To implement research activities
• To conduct reforestation activities
• To provide tourism development activities
• To strengthen the community and promote inclusive development
6.3 Development Issues and Challenges
6.3.1 Forest Ecosystem and Biodiversity Management
For this thematic area, the central problem identified is forest ecosystem degradation. It
is brought about by inadequate vegetation cover, soil erosion, low public awareness and
biodiversity loss. In 2015, the forest cover in the Cluster is estimated to be about 17.83%,
which is a reduction of about 11% or 1,589 ha from the 2010 forest cover. This is also
12
Executive Summary
Formulation of Climate Change-Responsive Integrated River Basin Management and Development Master Plan for the Cluster 7 River Basin
identified as the primary cause for biodiversity loss in the area. This inadequacy in
vegetation cover is a result of various issues, such as land conversion, illegal logging and
forest fires, as well as rapid population growth and poor law enforcement. Primarily, the
effects of the central problem are increased occurrence of risk events, decreased soil
productivity, decreased water supply and environmental pollution.
6.3.2 Water Resources Management
The foremost problem for water resources in Cluster 7 is the threatened water supply.
According to the results of the studies done, this is caused by various issues, such as water
contamination, high water turbidity, decreased groundwater, saltwater intrusion,
decreased streamflow discharge, and lack of investments to water infrastructures and
facilities. Further, these causes are results of other issues that range from rapid
population growth to pollution, deforestation and drought, among others. The NWRB also
classifies Zamboanga City as one of the cities with stressed groundwater. Based from the
projection, the estimated population of the cluster will generally increase from about
715,435 in 2015 to about 1,086,859 by 2045. This scenario leads to greater demand for
water resources. As projected using a conservative scenario, domestic and industrial
demand is expected to reach 44.5 MCM/year in 2030 and 84.5 MCM/year in 2050, which
are more than the estimated groundwater availability of 19.5 MCM/year and 28.5
MCM/year, respectively. In terms of agricultural water demand, the projected values are
still within, but are very close to the capacity of the surface water sources at 80%
dependable flow.
6.3.3 Wetland Management
In terms of wetlands in Cluster 7, the foremost problem identified is wetland degradation.
The causes of which include siltation, wetland conversion, invasive alien species and
pollution. Siltation happens because of riverbank or soil surface erosion. Wetland
conversion, on one hand, is caused by deforestation and illegal settlement. Meanwhile,
unsustainable practices, particularly in agriculture and aquaculture, have resulted to the
introduction of invasive alien species. These practices, together with improper waste
disposal have resulted to environmental pollution, which degrades the wetlands. The
effects of such wetland degradation include biodiversity loss, decreased ecosystem health
and resilience, decreased fishery production and eutrophication. These effects further
lead to a decrease in income, price increase and an increase in household expenses.
6.3.4 Disaster Risk Reduction and Management
The core problem besetting DRRM is the increasing number of people affected by
disasters. This is said to be caused by various issues, which include insufficient facilities
and equipment, insufficient IEC programs and climate change, among others. Other major
causes are the presence of non-adaptive structures, weak zoning implementation and
illegal settlement, which are results of weak law enforcement and rapid population
growth. Among the disasters that affect the area are tsunami, landslide, flooding, drought,
earthquake, heavy rains and tropical cyclones. The increase in the number of people
affected by disasters results to numerous problems that include loss of lives, suspension
of work and classes, damages to infrastructures, increase in health risks and damages to
13
Executive Summary
Formulation of Climate Change-Responsive Integrated River Basin Management and Development Master Plan for the Cluster 7 River Basin
agriculture. All these effects further result to several socioeconomic problems, such as
interruption of social service delivery, increased government spending and increase in
household expenses.
6.3.5 Economic Development
The core problem for the economic aspects of the Cluster is poverty. Its primary cause is
the limited/low income in the area. This is a result of the limited livelihood and
employment opportunities, which is caused by numerous issues in the river basin cluster.
Among these are the insufficient economic development programs, limited investments
because of the lack of incentives, peace and order situation, poor tourism industry, and
damages brought about by climate change impacts. The effects of poverty that must be
addressed are the increase in criminal activities and the limited resources for adaptation,
which can lead to increased vulnerability of the population.
6.3.6 Institutional Development
The core institutional problem for Cluster 7 is the weak capacity of organizations. This
weak capacity is brought about by four major causes, namely unresolved conflicts (i.e.
peace and order situation), weak mechanisms for public consultations, weak inter-agency
coordinating mechanisms and weak technical capacity of public sector agencies. The
effects of this weak organizational capacity are poor enforcement of policies and
inefficiency in the delivery of basic services. Both of which lead to improperly managed
natural resources and hampered development, which can ultimately result to poverty.
6.4 Implementation Plan
6.4.1 Initial Identification of Preferred Measures
PAPs refer to specific programs, activities and projects that are designed to contribute to
the attainment of set targets once implemented fully. The selected preferred measures
and PAPs without saying are climate proofed having been selected based on the future
targets calibrated against the projected influences of ongoing PAPs and climate change on
the future values of each indicator. It is implied that the preferred measures and PAPs
have built in ability to adapt to climate change and reduce disaster risks associated with
extreme rains, temperatures, and winds. The process consisted of six (6) steps that are
briefly described below:
1. Selection of Key Indicators
In order to facilitate the identification and selection of preferred measures and PAPs,
key indicators were chosen from many possible indicators. A total of thirteen
indicators were initially identified. From a long list of 11 indicators, only a total of 9
shortlisted key indicators were eventually chosen. These indicators were Water
Stress Index, Fecal Coliform, Forest Cover, Soil Erosion Rate, Wetland Area (based on
14
Executive Summary
Formulation of Climate Change-Responsive Integrated River Basin Management and Development Master Plan for the Cluster 7 River Basin
Land Cover), Number of Vulnerable Barangays to Hazards, and Poverty Incidence.
Baseline and targets were then determined.
2. Identification of the Current PAPs
If implemented fully and properly as planned originally by concerned agencies, the
current PAPs are expected to contribute positively in the attainment of the desired
targets on improving forest cover, conserving biodiversity, improving water quality
and availability, reducing poverty, DRR/CCA and other key targets of the government
related to the Cluster 7.
3. Estimation of the Reference Case Values of the Key Indicators
The reference case values are the baseline values of the key indicators taking into
consideration climate change and the influence of PAPs currently being implemented.
Using the panel of experts, the reference values of the key indicators were estimated
the results.
4. Estimation of the Gaps
Gaps here refer to the difference between the desired targets and the reference case
values of the key indicators. Positive difference means that the current PAPs will
contribute in the attainment of the desired targets for the key indicators. On the other
hand, negative difference represents the additional increase in the original desired
targets for a key indicator. This implies that the amount of investments required to
attain the adjusted target for a key indicator will be greater to implement enhanced
current PAPs or new additional PAPs.
5. Identification of Preferred Measures
After the adjusted targets for each key indicator were determined, potential measures
with corresponding PAPs were identified by the panel of experts and research staff.
Each of the measures were then rated by the panel on how many percentage points
each of these measures will likely contribute in attaining the desired targets for each
key indicator.
6.4.2 Identified Programs and Projects
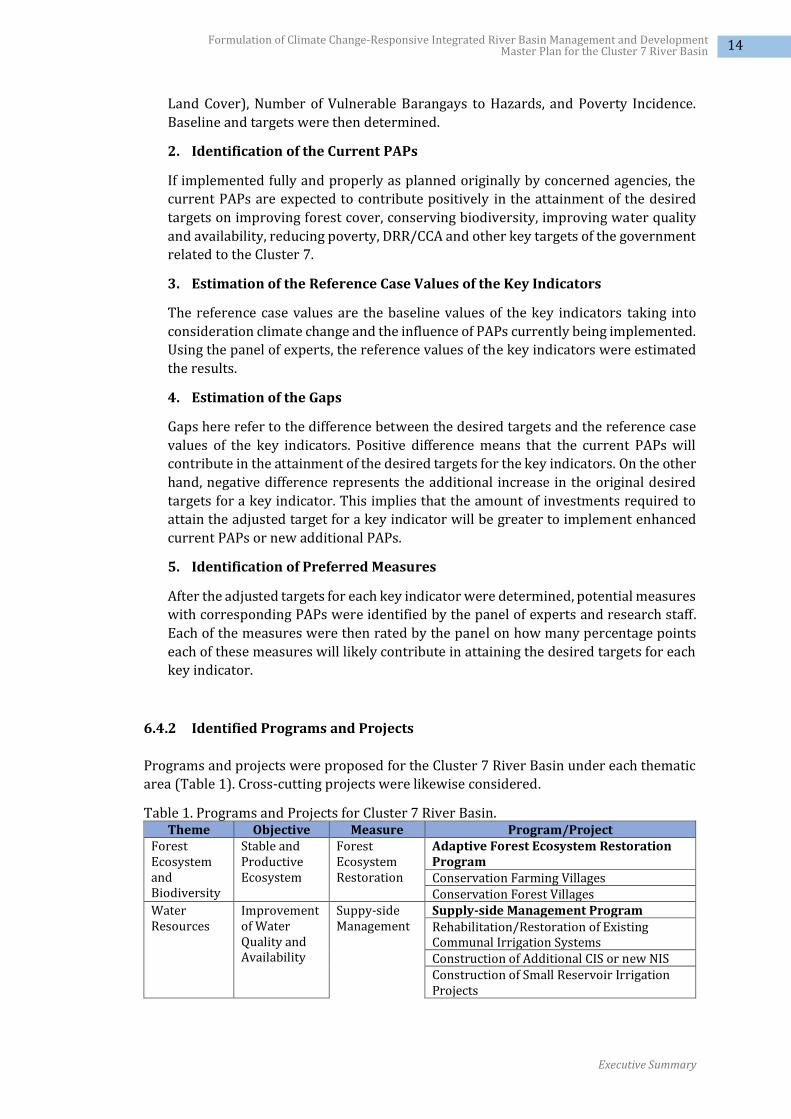
Programs and projects were proposed for the Cluster 7 River Basin under each thematic
area (Table 1). Cross-cutting projects were likewise considered.
Table 1. Programs and Projects for Cluster 7 River Basin. Theme Objective Measure Program/Project
Forest Ecosystem and Biodiversity
Stable and Productive Ecosystem
Forest Ecosystem Restoration
Adaptive Forest Ecosystem Restoration Program Conservation Farming Villages Conservation Forest Villages
Water Resources
Improvement of Water Quality and Availability
Suppy-side Management
Supply-side Management Program Rehabilitation/Restoration of Existing Communal Irrigation Systems Construction of Additional CIS or new NIS Construction of Small Reservoir Irrigation Projects
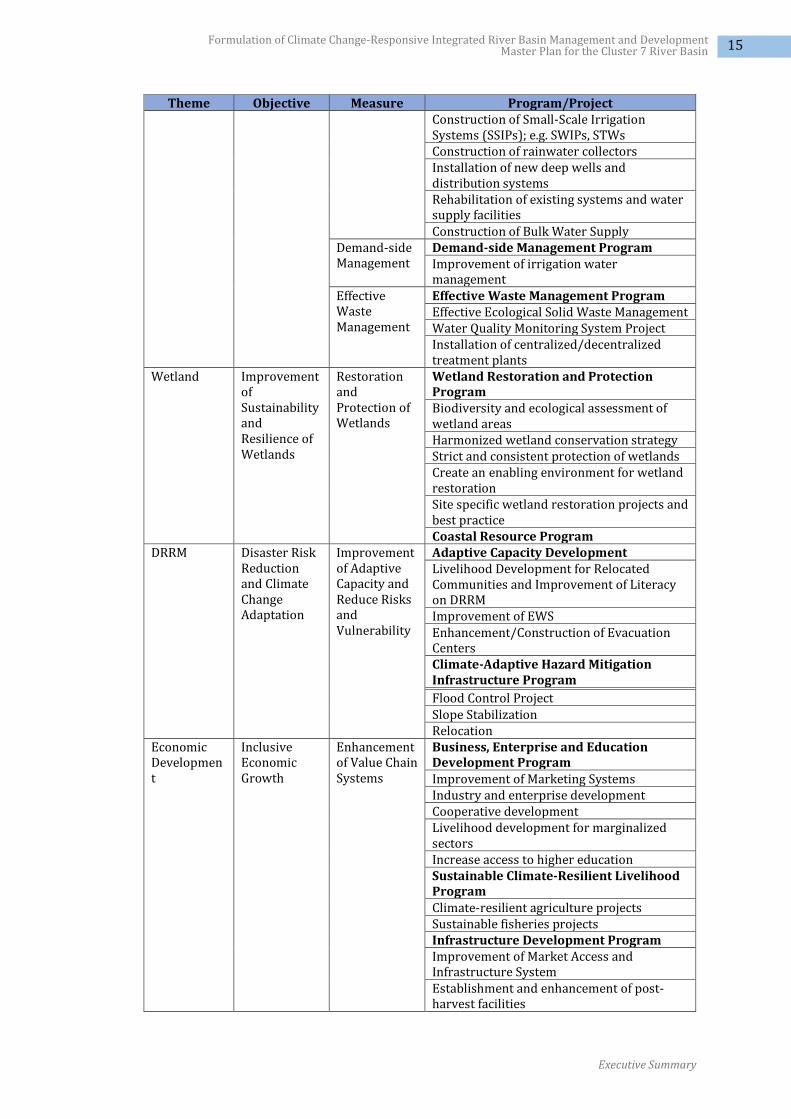
15
Executive Summary
Formulation of Climate Change-Responsive Integrated River Basin Management and Development Master Plan for the Cluster 7 River Basin
Theme Objective Measure Program/Project Construction of Small-Scale Irrigation Systems (SSIPs); e.g. SWIPs, STWs Construction of rainwater collectors Installation of new deep wells and distribution systems Rehabilitation of existing systems and water supply facilities Construction of Bulk Water Supply
Demand-side Management
Demand-side Management Program Improvement of irrigation water management
Effective Waste Management
Effective Waste Management Program Effective Ecological Solid Waste Management Water Quality Monitoring System Project Installation of centralized/decentralized treatment plants
Wetland Improvement of Sustainability and Resilience of Wetlands
Restoration and Protection of Wetlands
Wetland Restoration and Protection Program Biodiversity and ecological assessment of wetland areas Harmonized wetland conservation strategy Strict and consistent protection of wetlands Create an enabling environment for wetland restoration Site specific wetland restoration projects and best practice Coastal Resource Program
DRRM Disaster Risk Reduction and Climate Change Adaptation
Improvement of Adaptive Capacity and Reduce Risks and Vulnerability
Adaptive Capacity Development Livelihood Development for Relocated Communities and Improvement of Literacy on DRRM Improvement of EWS Enhancement/Construction of Evacuation Centers Climate-Adaptive Hazard Mitigation Infrastructure Program Flood Control Project Slope Stabilization Relocation
Economic Development
Inclusive Economic Growth
Enhancement of Value Chain Systems
Business, Enterprise and Education Development Program Improvement of Marketing Systems Industry and enterprise development Cooperative development Livelihood development for marginalized sectors Increase access to higher education Sustainable Climate-Resilient Livelihood Program Climate-resilient agriculture projects Sustainable fisheries projects Infrastructure Development Program Improvement of Market Access and Infrastructure System Establishment and enhancement of post-harvest facilities
16
Executive Summary
Formulation of Climate Change-Responsive Integrated River Basin Management and Development Master Plan for the Cluster 7 River Basin
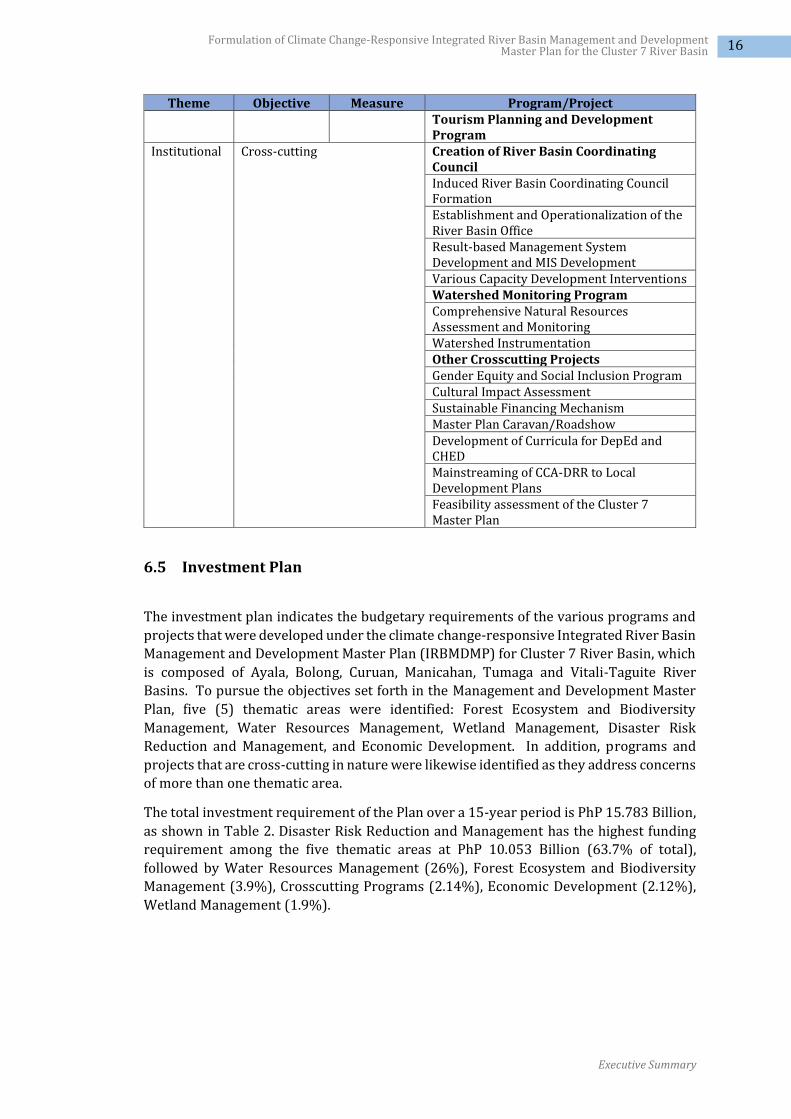
Theme Objective Measure Program/Project Tourism Planning and Development Program
Institutional Cross-cutting Creation of River Basin Coordinating Council Induced River Basin Coordinating Council Formation Establishment and Operationalization of the River Basin Office Result-based Management System Development and MIS Development Various Capacity Development Interventions Watershed Monitoring Program Comprehensive Natural Resources Assessment and Monitoring Watershed Instrumentation Other Crosscutting Projects Gender Equity and Social Inclusion Program Cultural Impact Assessment Sustainable Financing Mechanism Master Plan Caravan/Roadshow Development of Curricula for DepEd and CHED Mainstreaming of CCA-DRR to Local Development Plans Feasibility assessment of the Cluster 7 Master Plan
6.5 Investment Plan
The investment plan indicates the budgetary requirements of the various programs and
projects that were developed under the climate change-responsive Integrated River Basin
Management and Development Master Plan (IRBMDMP) for Cluster 7 River Basin, which
is composed of Ayala, Bolong, Curuan, Manicahan, Tumaga and Vitali-Taguite River
Basins. To pursue the objectives set forth in the Management and Development Master
Plan, five (5) thematic areas were identified: Forest Ecosystem and Biodiversity
Management, Water Resources Management, Wetland Management, Disaster Risk
Reduction and Management, and Economic Development. In addition, programs and
projects that are cross-cutting in nature were likewise identified as they address concerns
of more than one thematic area.
The total investment requirement of the Plan over a 15-year period is PhP 15.783 Billion,
as shown in Table 2. Disaster Risk Reduction and Management has the highest funding
requirement among the five thematic areas at PhP 10.053 Billion (63.7% of total),
followed by Water Resources Management (26%), Forest Ecosystem and Biodiversity
Management (3.9%), Crosscutting Programs (2.14%), Economic Development (2.12%),
Wetland Management (1.9%).
17
Executive Summary
Formulation of Climate Change-Responsive Integrated River Basin Management and Development Master Plan for the Cluster 7 River Basin
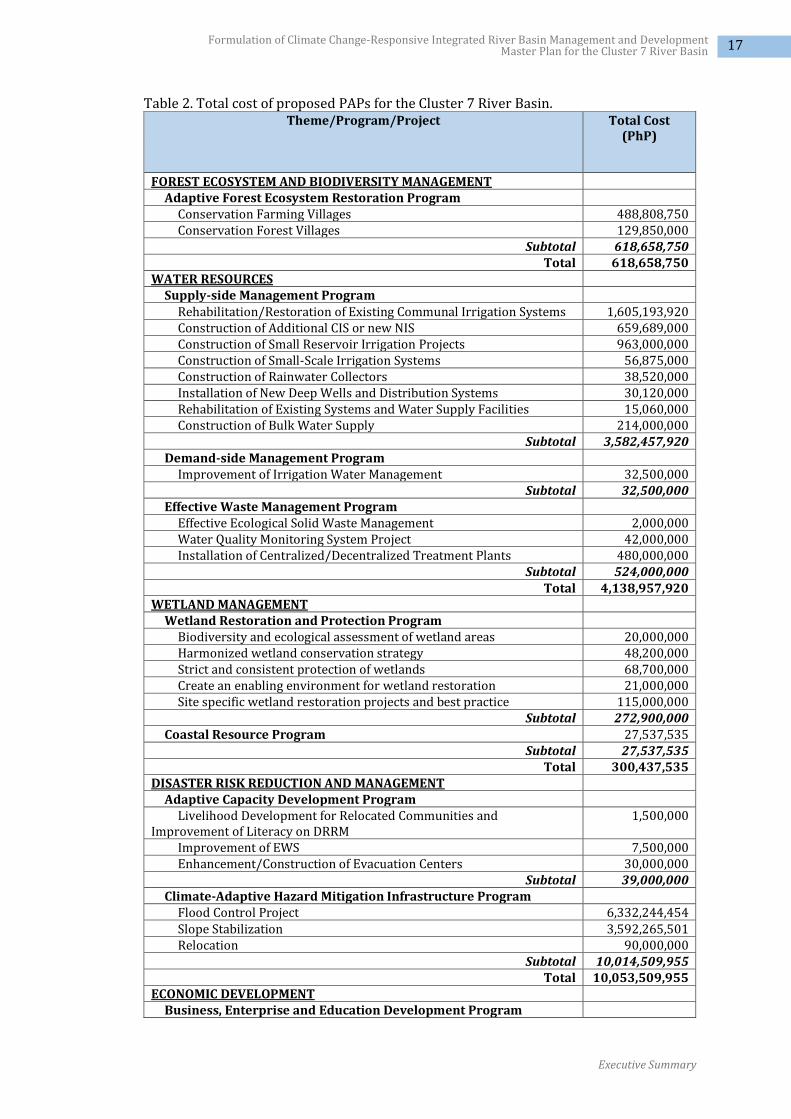
Table 2. Total cost of proposed PAPs for the Cluster 7 River Basin. Theme/Program/Project Total Cost
(PhP)
FOREST ECOSYSTEM AND BIODIVERSITY MANAGEMENT
Adaptive Forest Ecosystem Restoration Program
Conservation Farming Villages 488,808,750 Conservation Forest Villages 129,850,000
Subtotal 618,658,750 Total 618,658,750
WATER RESOURCES
Supply-side Management Program
Rehabilitation/Restoration of Existing Communal Irrigation Systems 1,605,193,920 Construction of Additional CIS or new NIS 659,689,000 Construction of Small Reservoir Irrigation Projects 963,000,000 Construction of Small-Scale Irrigation Systems 56,875,000 Construction of Rainwater Collectors 38,520,000 Installation of New Deep Wells and Distribution Systems 30,120,000 Rehabilitation of Existing Systems and Water Supply Facilities 15,060,000 Construction of Bulk Water Supply 214,000,000
Subtotal 3,582,457,920 Demand-side Management Program
Improvement of Irrigation Water Management 32,500,000 Subtotal 32,500,000
Effective Waste Management Program
Effective Ecological Solid Waste Management 2,000,000 Water Quality Monitoring System Project 42,000,000 Installation of Centralized/Decentralized Treatment Plants 480,000,000
Subtotal 524,000,000 Total 4,138,957,920
WETLAND MANAGEMENT
Wetland Restoration and Protection Program
Biodiversity and ecological assessment of wetland areas 20,000,000 Harmonized wetland conservation strategy 48,200,000 Strict and consistent protection of wetlands 68,700,000 Create an enabling environment for wetland restoration 21,000,000 Site specific wetland restoration projects and best practice 115,000,000
Subtotal 272,900,000 Coastal Resource Program 27,537,535
Subtotal 27,537,535 Total 300,437,535
DISASTER RISK REDUCTION AND MANAGEMENT
Adaptive Capacity Development Program
Livelihood Development for Relocated Communities and Improvement of Literacy on DRRM
1,500,000
Improvement of EWS 7,500,000 Enhancement/Construction of Evacuation Centers 30,000,000
Subtotal 39,000,000 Climate-Adaptive Hazard Mitigation Infrastructure Program
Flood Control Project 6,332,244,454 Slope Stabilization 3,592,265,501 Relocation 90,000,000
Subtotal 10,014,509,955 Total 10,053,509,955
ECONOMIC DEVELOPMENT
Business, Enterprise and Education Development Program
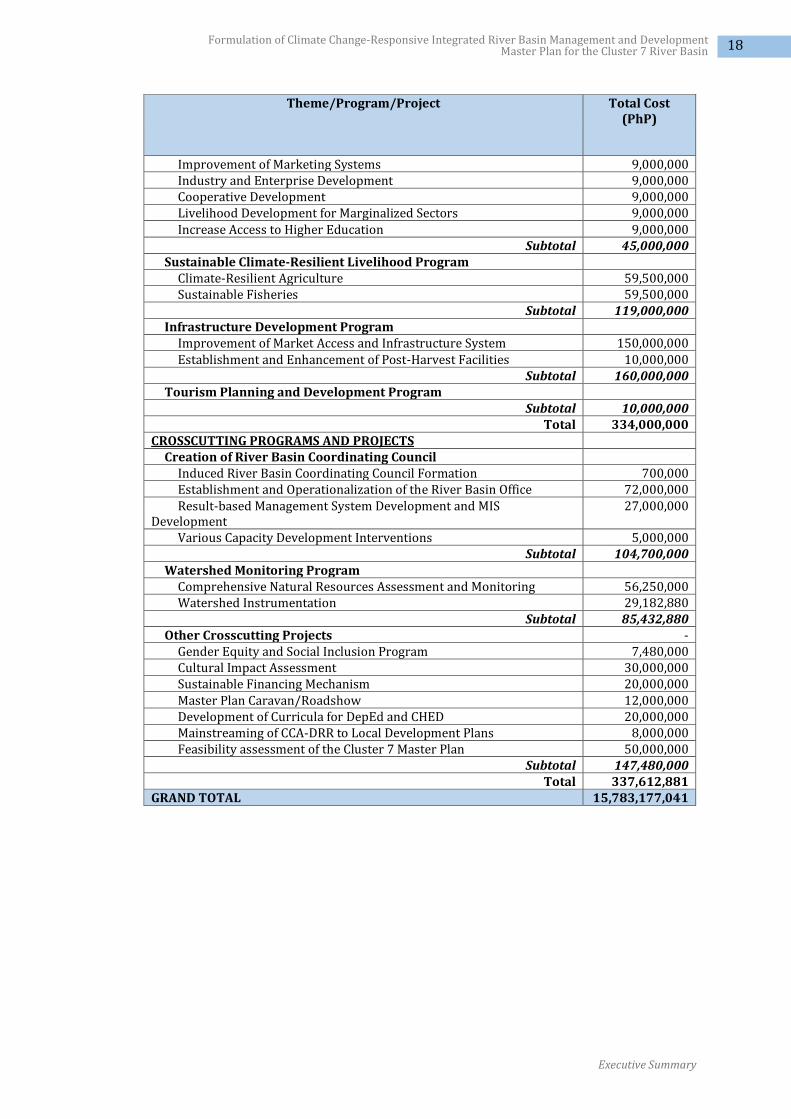
18
Executive Summary
Formulation of Climate Change-Responsive Integrated River Basin Management and Development Master Plan for the Cluster 7 River Basin
Theme/Program/Project Total Cost (PhP)
Improvement of Marketing Systems 9,000,000 Industry and Enterprise Development 9,000,000 Cooperative Development 9,000,000 Livelihood Development for Marginalized Sectors 9,000,000 Increase Access to Higher Education 9,000,000
Subtotal 45,000,000 Sustainable Climate-Resilient Livelihood Program
Climate-Resilient Agriculture 59,500,000 Sustainable Fisheries 59,500,000
Subtotal 119,000,000 Infrastructure Development Program
Improvement of Market Access and Infrastructure System 150,000,000 Establishment and Enhancement of Post-Harvest Facilities 10,000,000
Subtotal 160,000,000 Tourism Planning and Development Program
Subtotal 10,000,000 Total 334,000,000
CROSSCUTTING PROGRAMS AND PROJECTS
Creation of River Basin Coordinating Council
Induced River Basin Coordinating Council Formation 700,000 Establishment and Operationalization of the River Basin Office 72,000,000 Result-based Management System Development and MIS
Development 27,000,000
Various Capacity Development Interventions 5,000,000 Subtotal 104,700,000
Watershed Monitoring Program
Comprehensive Natural Resources Assessment and Monitoring 56,250,000 Watershed Instrumentation 29,182,880
Subtotal 85,432,880 Other Crosscutting Projects -
Gender Equity and Social Inclusion Program 7,480,000 Cultural Impact Assessment 30,000,000 Sustainable Financing Mechanism 20,000,000 Master Plan Caravan/Roadshow 12,000,000 Development of Curricula for DepEd and CHED 20,000,000 Mainstreaming of CCA-DRR to Local Development Plans 8,000,000 Feasibility assessment of the Cluster 7 Master Plan 50,000,000
Subtotal 147,480,000 Total 337,612,881
GRAND TOTAL 15,783,177,041
Related Documents