FORMULATION AND ASSESSMENT OF VERAPAMIL SUSTAINED RELEASE TABLETS A Thesis Submitted to Rhodes University in Fulfilment of the Requirements for the Degree of MASTER OF SCIENCE By Sandile Maswazi Malungelo Khamanga February 2005 Faculty of Pharmacy Rhodes University Grahamstown South Africa

Welcome message from author
This document is posted to help you gain knowledge. Please leave a comment to let me know what you think about it! Share it to your friends and learn new things together.
Transcript

FORMULATION AND ASSESSMENT OF VERAPAMIL SUSTAINED RELEASE
TABLETS
A Thesis Submitted to Rhodes University in
Fulfilment of the Requirements for the Degree of
MASTER OF SCIENCE
By
Sandile Maswazi Malungelo Khamanga
February 2005
Faculty of Pharmacy
Rhodes University
Grahamstown
South Africa

ABSTRACT
The oral route of drug administration is most extensively used due to the obvious ease of
administration. Verapamil hydrochloride is a WHO listed phenylalkylarnine, L-type calcium
channel antagonist that is mainly indicated for cardiovascular disorders such as angina
pectoris, supraventricular tachycardia and hypertension. Due to its relatively short half-life of
approximately 4.0 hours, the formulation of a sustained-release dosage form is useful to
improve patient compliance and to achieve predictable and optimized therapeutic plasma
concentrations.
Direct compression and wet granulation were initially used as methods for tablet
manufacture. The direct compression method of manufacture produced tablets that exhibited
formulation and manufacturing difficulties. Mini-tablets containing veraparnil hydrochloride
were then prepared by wet granulation using Surelease® E-7-19010.and Eudragit® NE 30D as
the granulating agents after which the granules were incorporated with an hydrophilic matrix
material, Carbopol® 974P NF. Granule and powder blends were evaluated using the angle of
repose, loose and tapped bulk density, Can's compressibility index, Hausner's ratio and drug
content. Granules with good flow properties and satisfactory compressibility were used for
further studies.
Tablets were subjected to thickness, diameter and weight variation tests, crushing strength,
tensile strength, friability and content uniformity studies. Tablets that showed acceptable
pharmaco-technical properties were selected for further analysis. Drug content uniformity
and dissolution release rates were determined using a validated isocratic HPLC method.
Initially, USP apparatus 1 and 3 dissolution apparatus were used to determine in-vitro drug
release rates from the formulations over a 22-hour period. USP apparatus 3 was finally
selected as it offers the advantages of mimicking, in part, the changes in the physicochemical
environment experienced by products in the gastro-intestinal tract.
Differences in release rates between the test formulations and a commercially available
product, Isoptin® SR were observed at different pH's using USP apparatus 1. The release of
veraparnil hydrochloride from matrix tablets was pH dependent and was markedly reduced at
higher pH values. This may be due, in part, to the poor solubility of veraparnil hydrochloride
ii

at these pH values and also the possible interaction of verapamil hydrochloride with anionic
polymers used in these formulations.
Swelling and erosion behaviour of the tablets were evaluated and differences in behaviour
were observed which may be attributed to the physico-chemical characteristics of the
polymers used in this study.
In-vitro dissolution profiles were characterized by the difference (j1) and similarity factor (j2)
and also by a new similarity factor, Sct. In addition, the mechanism of drug release from these
dosage forms was mainly evaluated using the Korsmeyer-Peppas model and the kinetics of
drug release assessed using other models, including Zero order, First order, Higuchi, Hixson
Crowell, Weibull and the Baker-Lonsdale model.
Dissolution kinetics were best described by application of the Weibull model, and the
Korsmeyer-Peppas model. The release exponent, n, confirmed that drug release from these
dosage forms was due to the mixed effects of diffusion and swelling and therefore,
anomalous release kinetics are predominant.
In conclusion, two test batches were found to be comparable to the reference product
Isoptin® SR with respect to their in-vitro release profiles.
lll

ACKNOWLEDGEMENTS
I would like to express my sincere thanks to the following people:
My supervisor, Prof R. B. Walker for giving me the opportunity to be part of his Research
Group. Thank you for your support, guidance, assistance throughout the course of my studies.
Thank you for affording me the opportunity to gain invaluable teaching experience during
this time.
The Dean and Head, Prof I. Kanfer and the staff of the Faculty of Pharmacy, for the use of
the facilities in the Faculty.
My colleagues in the Biopharmaceutics Research Laboratory, thank you so much for the
support.
The Dow Chemical Company (Michigan, USA) and Colorcon® (Kent, UK) for their donation
of excipients. Aspen Pharmacare (Port Elizabeth, South Africa) for the donation of verapamil
hydrochloride.
To all those who have encouraged me, taught me, prayed for me and helped make life worth
living, funny, though, I never seem to have enough time to let them know how much I
appreciate them. Thanks.
My mother, KIKI for all that she has meant to me throughout my life, and to my sister and
brothers, I thank you all for your understanding and for supporting me without any
complaints. Without your prayers and efforts I could not have continued with my studies.
You are such a special family, God bless you!
I would like to give thanks to Almighty God for giving me strength, protection and for giving
me light, vision and the understanding that all is possible is His name.
lV

STUDY OBJECTIVES
The population of patients with chronic conditions or complications of other disease is
increasing [1]. Chronically ill patients take a number of medicines to treat their conditions,
which may lead to non-compliance and non-adherence to the prescribed dosage regimen.
Verapamil hydrochloride (VRP) is a World Health Organization (WHO) and South African
Medicines Formulary (SAMF) listed drug that is indicated for the treatment of several
cardiovascular diseases, particularly angina pectoris, supraventricular tachyarrhythmias and
hypertension [2]. These cardiovascular diseases are common and patients with these
conditions require constant monitoring. VRP is available in 120-, 180-, and 240 mg extended
release tablets. It has a short biological half-life and therefore is suitable for formulation as a
sustained-release product in order to reduce the frequency of administration of doses and to
improve patient compliance.
The purposes of this study were therefore:
1. To develop and validate a suitable high performance liquid chromatographic (HPLC)
method for the determination of verapamil hydrochloride.
2. To investigate the possibility of using Surelease® E-7-19010 and Eudragit® NE 30D
as granulating fluids in preparing VRP matrix tablets containing Carbopol® 974P NF
and Methocel® KlOOM as primary matrix polymers.
3. To evaluate the release of VRP from the dosage form developed using an appropriate
dissolution test procedure.
4. To study the drug dissolution kinetics and release mechanisms for the matrix tablets
prepared using Carbopol® 974P NF.
5. To identify key aspects of the formulation that needs further study.
v

TABLE OF CONTENTS
ABSTRACT .... .................................... .......... ........................................................................................... .... ....... ................................. ii
ACKNOWLEDGEMENTS ... ................................. ............................................................................................................... iv
STUDY OBJECTIVES .............................................................................................................................................................. v
TABLE OF CONTENTS ................................................. .................... ................................................ .................................... vi
LIST OF TABLES ....................................................................... ......... .................................. ............................................... ....... xi
LIST OF FIGURES .......................... .... .............. ............................. ............. ....................... .................. ... ................................ xiii
CHAPTER ONE ..... .................. ......... ......... ..................................................................................................................... ................ I REVIEW OF A CALCIUM CHANNEL BLOCKER CANDIDATE ................................................ I
1.1
1.2
1.3
1.4
1.5
1.2.1 1.2.2 1.2.3 1.2.4 1.2.5 1.2.6 1.2.7 1.2.8
1.3.1 1.3.2 1.3 .3
1.5.1 1.5.2 1.5.3 1.5.4 1.5.5
INTRODUCTION ............... .................................... ... ..... .................... ........ .. ................................ ................................ 1
PHYSICO-CHEMICAL PROPERTIES .................... ....................................................................................... 1 Description ...................... ..................................................................................... .................................................. 1 Optical Rotation ............................................................................. ..................................................................... 3 pH of Solution ............................................ ................................................................ ... .................... ................... 3 Solubility (21 °C) ........... ........................... .......................................................................................................... 3 pK3 ......................... . ................................ ................. . .. . ..... ... . . ........... . ....... . ... . . ......................... . .................... . ........... .. 4 Hygroscopicity ................................. .................................................................................................... .. .............. 4 Ultraviolet Absorption Spectrum .................................... .................. ............ ...................................... ....... 4 Melting range ............................................................................... ........................................................ .......... ...... 5
SNYTHETIC PATHWAY .......................................................................... ....... ............ .......................... .... ............ 6 Synthetic Procedure ..................................... .......................................... .......................... ..................... ............ 6 Stereospecificity .............................................................................................................................................. .. .. 7 Structure Activity Relationship .. ......................................................................................... ........... ............ 7
ST ABaiTY .................................................................................................................................................................. .. .. 7
CLINICAL PHARMACOLOGY ................ .................................. .......................... .......... ........................... ......... 8 Mechanism of Action ....................................................... ......... .............. .................. ......... .............. ................ 8 Clinical Use ................................... ..................... ....................... ..... ...... .............................................. .... ............. 1 0 Interactions ................................. ......... ..................................................... ...................... .................... ................. 11 Contraindications ......................................................................... ................ ........................................ ......... ... 12 Precautions ...................................... ........................... .......................................................................................... l3
1.5.5.1 Geriatrics ...... ........ ...................... ... .......................... .................................. ................ .. ....................... l3 1.5.5.2 1.5.5.3 1.5.5.4 1.5.5.5 1.5.5.6 1.5.5.7
Paediatrics ................................................................................................. ......................................... 13 Pregnancy .................................. ................. ............................................... ............ .... .......... .............. 13 Lactation ............................................................................................ .... ............................................. 14 Renal Impairment .................. .................................. ............................... .... ........... ........................ l4 Smoking .... ...... ..... ............... ................................... ......... .......... ............. .... ................................ ......... l4 Effects of Food ................................................................................................................................ IS
vi

1.5.6 1.6
1.7
1.6.1
1.6.2 1.6.3 1.6.4 1.6.5
Adverse Effects .................................................... ...................... .. ..................................................................... 15 CLINICAL PHARMACOKINETICS .............................................................................................................. 16
Dosage and Administration ............ ............... ..................................................... ......................... ................ l6 1.6.1 .1 Overdosage .......................................................................... ............................................................. 17 1.6.1.2 Treatment of Overdosage .......................................................................................... .. ............ .. 17 1.6.1 .3 Guidelines for Use ........................................................................................................................ 17 1.6.1.4 Incompatibility ..................... ................... .................. ..... ....................................... .......................... 18
Absorption ................................................................................................................... .. .......... .. ........................... 18 Distribution ................................................ ............................ ....................... ........................................ ... ............ 18 Metabolism .................................................................. .......... ................... .................................... ....................... 18 Excretion ............................................................................................... ............................. ..................... ... ....... .... 19
CONCLUSION ....... .................................................................................. .................................................................... 20
CHAPTER TWO ..................................... .................... ....... ....................................................................................... ................... 22 THE DEVELOPMENT AND VALIDATION OF AN HPLC METHOD FOR THE IN-VITRO QUANTITATION OF VRP ............... .............................. ........................................................................ 22
2.1
2.2
2.3
2.4
2.2.1 2.2.2 2.2.3 2.2.4 2.2.5
2.3.1 2.3.2
2.5 2.5. 1 2.5.2 2.5.3
2.5.4 2.5.5 2.5.6
INTRODUCTION .................................................. ................ .............................. ..................................... .................. 22
EXPERIMENTAL .............. ................ ............................. .............................................................. ............................. 25 HPLC Apparatus .................................................................................. ............................................ ................. 25 Chemicals and Reagents ........... .......................................................... ...... .................................................... 26 Preparation of Stock So1utions ........................ ................. ........................................................................ .26 Preparation of Buffers .................................................................................................................................... 26 Preparation of Mobile Phase ........................................... .. ......................................................................... 27
METHOD DEVELOPMENT .......................................................... ..... ......... ....................................................... 27 Literature Review ............ .......................... ................................... ..................................................... ............... 27 Introduction ...... ................. ............................ ...................................................................................................... 29
2.3.2.1 Column Choice ............................................................................................... ................................ 29 2.3.2.2 Internal Standard ........ .................................................. ...... .. .................................................. ........ 30 2.3.2.3 2.3.2.4 2.3.2.5 2.3.2.6
Effect of Ion-Pair Reagent Type ............................................................................................ 31 Effect of Organic Solvent Composition ......................... ........... .......... ........... ................... 33 Effect of Buffer Molarity .................................. ................ ...................................... ................... 34 Effect of Buffer pH ........... .. ........... ................. ....................................... ................................ ....... 35
CHROMATOGRAPHIC CONDITIONS ..... .... ......................... ............................. .. ..... ................................ .36
METHOD VALIDATION .................... ................. .. .................. .. ............................................. ............................ 38 Introduction ............................................................ ............................................... .............................................. 38 Linearity and Range ........ .............................................. .................................... ............ ... .............. ................. 38 Precision ............................. ................... ....... .......... .................................... ........................ ................................... 39
2.5.3. 1 Repeatability ...................... ............................... ...... ........ ................................................................. 40 2.5 .3 .2 Intermediate Precision ............................................................. .......... .......................................... 4 1 2.5.3.3 Reproducibility .................................. .... ........................................................ ....... .......................... 42
Accuracy and Bias ................................................................................................................. .... ........ .... .......... 42 Limit of Detection I Limit of Quantitation ....... .......... ........................................ .................. .... ........ ..42 Specificity ............................................................................................................................................................ 43
vii

2.6 CONCLUSION ................................... .......... ................................................................................................................ 44
CHAPTER THREE ............................................................................................................................................................. ....... 45 FORMULATION AND ASSESSMENT OF POWDER BLENDS FOR SUSTAINED RELEASE TABLETS ............................................................................................................................................................... 45
3.1
3.2
3.3
3.4
3.5
3.5
3.1.1
3.2.1 3.2.2 3.2.3 3.2.4 3.2.5
3.3.1 3.3.2 3 .3.3 3.3.4 3.3.5 3.3.6 3.3.7 3.3.8 3.3.9
POWDER RHEOLOGY .................................................................................................................. ........... ............. 45 In traduction ......... ................................................... ............ .................... .................................... ........................ 4 5
EXPERIMENTAL ........................... ................................................................. ............................... ... ........................ 46 Angle of Repose (AOR) .............. .................... ......................... ......................................................... ........... 46 Bulk and Tapped density ............................................................................................................................. .47 Carr's Index (Cl) ........................................................................... ............................... ............. ........ .... .... ...... .48 Hausner Ratio (HR) ............................................................................................................................. .. ........ .49 Kawakita analysis ............................. , ..... ....................................... ............................ ... ................................... 50
EXCIPIENTS ............................................ ....... ........... ......... .............................................. ............................................ 51 Carbo mer .......................................... ................................... ............................................................. ........... ......... 51 Methacrylic Acid Copolymers .. , ..... ................. .................. ....................................................................... 52 Hydroxypropylmethylcellulose (HPMC) ............................. ............................... , .............................. .53 Ethy !cellulose ............................................. ......................... ............................................... , ............................... 54 Dibasic Calcium Phosphate (DCP) .................. ................... ............................................. ...................... .54 Microcrystalline Cellulose (MCC) .......................................................................................................... 54 Lactose Monohydrate .......................................... ................. ............................ .............................................. 55 Talc ................................................................................................................................... ............ .. ......................... 55 Magnesium Stearate ... ..................... ... ........ ........... ................................... ........................... ............................ 55
FORMULATION COMPOSITION ....... ...... ........................................................ ........... , ................................. 56
RESULTS AND DISCUSSION .......... , ............ .... .......................... .................................. ................................... 59
CONCLUSION ..................... ....................................... .......................................................................... ....................... 62
CHAPTER FOUR ........... ........... ............... ..................... .......... ............................................................................................... ..... 63 FORMULATION AND ASSESSMENT OF SUSTAINED RELEASE MATRIX TABLETS ............................................. ............................................. ................... ............................................................. .......... ........ 63
4.1
4.2
4 .1.1 4 .1.2
4.2.1 4.2.2 4 .2.3 4 .2.4
SUSTAINED DRUG DELIVERY ................................................ ........................................ ........... .................. 63 Introduction .............................................................................................................. ......... ...... ... ................... ...... 63 Oral Sustained Release Dosage Forms ................................................................................................. 64
4.1.2.1 Reservoir Devices ........ ................................................................................ ................. ................ 64 4.1.2.2 Osmotic Devices .................................................................................................. .... ...................... 65 4.1.2.3 Matrix Devices ..................... ...... ....... .................... ............................ ...... ........................................ 67
EXPERIMENT .............. ................ .... .............. .... ... ....................................................... .............................................. 70 Proposed Evaluation Design ................................................ ........................ ........ ................ ........... ........... 70 Preliminary Studies ......................................................................................................... ................................ 70 Preparation of the Sustained-Release Test Formulation ......................................... ..................... 72 Method of Manufacture ................................................................................................................................ 72
viii

4.3
4.4
4.2.5
4.2.6
4.3.1 4 .3.2 4.3.3
4.3.4 4.3.5
4.2.4.1 Direct Compression ................... ................................................................................................... 72 4.2.4.1.1 Direct Manufacturing Procedure .. ............................... ........................................................... 73 4.2.4.2 Wet Granulation ............................................................................................................................. 75 4.2.4.2.1 Wet Granulation Procedure .............................................. .. ....................................................... 76
In-Vitro Dissolution Studies ....................................................................................................................... 79 4.2.5 .1 USP Apparatus 1 (Basket) .. ...................................................................................................... 81 4.2.5.2 USP Apparatus 3 (Bio-Dis~ ............................. ................................................. ................ ..... 82
Physical Characterization of Tablets ...................................................................................................... 84 4.2.6.1 Weight Uniformity .................................................................................. ...................................... 84 4.2.6.2 Content Uniformity ....................................... ............................................................................... 84 4.2.6.3 Crushing Strength ................. .......................... ................................................................. .............. 84 4.2.6.4 Tensile Strength ..................... ...... ................................................................................................... 84 4.2.6.5 Friability .......................................................................... ...................... ............................................. 85 4.2.6.6 Water Uptake and Erosion .................................................................................... .................... 85
RESULTS AND DISCUSSION ......... ................................................................................................................ 87 Optimization of the Formulation ................ .................. ............................................................................ 87 pH Dependence of Drug Release ..................................................... ........................................................ 95 In-Depth Investigation of Batches VRP021 , VRP023 and lsoptin® SR. ............................ 98
4.3 .3.1 Effect of Molarity ...................................... .............................. ............................... ....................... 98 4.3.3 .2 Swelling and Erosion ............................................. ............ .......................................................... 99 4.3 .3.3 Effect of Mesh I Screen Sizes ............................. ................................................................. 104
Characterization of Tablets .... .................................................................................................................. 1 OS Effect of Reciprocation Rate ................................................................................................................... l 09
CONCLUSION ....................................... ................................................................... .............. .................................. 111
CHAPTER FIVE ........................................................................................................................................................................ l13 CHARACTERIZATION OF DRUG RELEASE BY MATHEMATICAL MODELLING ...................... ......................................................................................................................................................... 113
5.1
5.2 5.2.1 5.2.2 5.2.3 5.2.4 5.2.5 5.2.6
INTRODUCTION .................................................................................................................................................... l13
MATHEMATICAL MODELS ......................................................................................................................... 114 Exploratory Data Analysis Methods ................................................................................................... l14 Model-Independent Methods .............................................................................................................. .... 115 Mahalanobis Distance ...................................................................................... ........................................... ll7 Analysis of Variance (ANOV A) .... ........................................................................... ............................ ll8 Mixed-Effects Models .................................................................................... ............................................ 118 Model-Dependent Models ........................................ .. ....... ............................. ...... ..................... ............... 119
5.2.6.1 Zero Order .............................................. ............................................... ............................... ................... 119 5.2.6.2 First Order ..................................... ................................................................................................. 120 5.2.6.3 Higuchi Model ............................................................................................................................. 121 5.2.6.4 Baker-Lonsdale Model ................................................................................................ ............ 121 5.2.6.5 5.2.6.6 5.2.6.7 5.2.6.8
Hixson-Crowell Model ...................... ................................ ............................... ................... .... 122 Weibull Model ........................................ ..................................................................................... 122 Hopfenberg Model ....................................................................................... .............................. l23 Korsmeyer-Peppas ... ..................................................................... ........................................... .. 124
ix

5.3
5.4
5.2.7 5.2.8
5.3.1 5.3.2
5.3.3
Other Release Parameters .............................................. ........................................................................... 126 Determination of Goodness of Fit ..................................................................................................... ... l26
RESULTS AND DISCUSSION ...................................... ................................................................................. l27 Similarity and Difference Factors ......................... ..................... ...... ........ ............................................ 127 Mechanism of Release ...................................... .............................................. .......... 130
5.3.2.1 Effect of pH ....... ......... ... .... ........ .. ........................................................ 130 Mathematical Models ...................................................................................... .......... 139
5.3.3.1 Modelling ........................................................................................... 140
CONCLUSION ........................................................ ............................. ............................ 148
CHAPTER SIX ................ ............................................................ ...................................... .............. ........................................ .... 150 CONCLUSION ...................................... ...................... ............................................................................................ .................. .. 150
APPENDIX ONE ......................................................................................................... .............. ................................................ 155 BATCH SUMMARY .... .................................. ................................................................. ....................................................... 155
APPENDIX TWO ................................................................ ............................................. ....................................................... .. 184 BATCH PRODUCTION RECORDS VRP001 ................................................................................................. 184
APPENDIX THREE ................................................... ........................... .................................................................................. 188 BATCH PRODUCTION RECORDS VRP021 ................................................................................................... 188
REFERENCES .................................................................................................... ................... .. .......................... ......................... 196
X

LIST OF TABLES
Table 1.1. Solubility of VRP in a variety of solvents .................................................................................... ..... ............... 4
Table 1.2. Distribution of cations across resting cardiac ventricular muscle membranes ........... .................. 9
Table 2.1. Review of the analytical methods used for the determination of VRP .......................................... .28
Table 2.2. Intra-day precision data for analysis of VRP .............................................................................................. ..41
Table 2.3. Inter-day precision data for analysis of VRP .............................................................................................. ..41
Table 2.4. Accuracy test results of blinded samples ...................................................................................................... ..42
Table 3.1. Relationship between angle of repose, a and powder flow . ........................ ................... .......... ....... ..47
Table 3.2. Interpretation of Carr's index . .... .......................................................................................................................... 49
Table 3.3. Interpretation of Hausner ratio ............................................................................................................................. 50
Table 3.4. Formulation ofVRPOOl- VRP023 .................................................................................................................. 51
Table 3.5. Results of tests on powder blends or granules for formulations VRPOOl - VRP023 ............. 60
_Toc99914345 Table 4.1. Excipients used in formulation studies ....................................................................................................... ..... 71
Table 4.2. Direct compression formula of tablet batch VRPOOl .............................................................................. 72
Table 4.3. Wet granulation formula of tablet batch VRP021 ................................. .................................................... 75
Table 4.4. Wet granulation formula of tablet batch VRP023 . ...... ........ ...... ................................................................ 76
Table 4.5. Summary of general dissolution conditions for basket and reciprocating cylinder dissolution test methods in this study ............................................................................................................ 83
Table 4.6. Mesh screen sizes used in dissolution studies in USP apparatus3 . .... ............................................ 104
Table 4.7. Physical properties of the compressed tablets ............................ ........ ............. .......... ................................ I 07
xi

_Toc99914353 Table 5.1. Interpretation of diffusional release mechanisms from polymers ................................................... I25
Table 5.2. f"h' % AUC (<lift) and Sct values for VRP batches using Isoptin® SR as a reference ........... 129
Table 5.3. Summary of Korsmeyer-Peppas best fit parameters for batches VRP021, VRP023 and Isoptin® SR in dissolution media of different pH using USP Apparatus 1 ................................ 132
Table 5.4. Summary of Korsmeyer-Peppas best fit parameters for batches VRP021 , VRP023 and Isoptin® SR in dissolution media of different pH using USP Apparatus 3 ................................. 138
Table 5.5. Mathematical representation of models used to describe the release profiles of batches VRP021, VRP023 and Isoptin® SR. ................................................................................................................ l39
Table 5.6. Resultant model parameters obtained after fitting dissolution data obtained using USP Apparatus I for batches VRP021, VRP023 and Isoptin® SR ...... ...................................................... l41
Table 5.7. Resultant model parameters obtained after fitting dissolution data obtained using USP Apparatus 3 for batches VRP021, VRP023 and Isoptin® SR ............................................................ l47
xii

LIST OF FIGURES
Figure 1.1. Chemical structure of VRP isomers [(C27H38Nz04, HCl)] (MW = 491. J ) .................................... 2
Figure 1.2. Solubility of VRP as a function of pH ............................... .......... .............................. ................................. ..... 3
Figure 1.3. UV absorption spectrum of VRP in Methanol [9] .................. .... ................... .... ........ ......................... ....... 5
Figure 1.4. Pathway of synthesis of VRP . ...................................................... ........... ............................................................ 6
Figure 2.1. Effect of sulfonic acid chain length on retention time of VRP ....................... ........... ...................... .32
Figure 2.2. Effect of percent acetonitrile on the retention time of VRP ............................. ......... ......................... 33
Figure 2.3. Effect of buffer molarity on retention time . .................................................... ...... ...................................... 34
Figure 2.4. Effect of buffer pH on retention time of VRP . ............. .......... ....................................................... ............ 35
Figure 2.5. Typical chromatogram of CBZ (1) and VRP (2) at 20!-lg/mJ and 50!-lg/mJ respectively, obtained using the chromatographic conditions specified in § 2.4 ..................................... ....... ..... 37
Figure 2.6. Calibration curve constructed after linear regression of peak height ratios versus concentration. Linear regression equation: y = 0.0103x + 0.019 ...... .................. ........................... .39
Figure 4.1. Schematic illustration of the mechanism of drug release from a diffusion-based reservoir tablet. ................. ......... .................. ............................................... .......... .......... ........................................... ............. ........ 65
Figure 4.2. Schematic illustration of the mechanism of drug release from an osmotic-controlled release system designed as a single-unit tablet with a single release orifice ......... .................... 66
Figure 4.3. Schematic illustration of the mechanism of drug release from a diffusion-based matrix tablet . .......................................................... ...................... ................................... ............... .......................... ................... 68
Figure 4.4. Schematic illustration of the mechanism of drug release from an erosion tablet. ............. 69
Figure 4.5. A general schematic for direct compression of VRP . ..... ............................ ................... ........................ 74
Figure 4.6. A general schematic for wet granulation of VRP . ................................. ............................ 78
Figure 4.7. Dissolution proflle of VRP release from batch VRPOOI compared to Isoptin® SR (n = 6) ...... ...... ..... ............................................. ..................... ... .............. .......... ............. .......... .................. ..................... .. 87
Figure 4.8. Dissolution profile of VRP release from batch VRP005 compared to Isoptin® SR (n = 6) ........................................................ ......................................................................... ....... ...... ....................... ......... 88
xiii

Figure 4.9. Dissolution profile of VRP release from batch VRP009 compared to Isoptin® SR (n = 6) ............................................................................... ............................................................................................ 89
Figure 4.10. Dissolution profile of VRP release from batch VRPOll compared to Isoptin® SR (n = 6) ........................................................................................................................................................................... 90
Figure 4.11. Dissolution profile of VRP release from batch VRP016 compared to Isoptin® SR (n = 6) ........................................ ............................................................................................. ...................................... 92
Figure 4.12. Dissolution profile of VRP release from batch VRP020 compared to Isoptin® SR (n =6) ........................................... .................................... ................................................ ......................... ............... ..... 93
Figure 4.13. Dissolution profile ofVRP release from batch VRP021 compared to lsoptin® SR (n =6) ............................................................................................................................................................................ 93
Figure 4.14. Dissolution profile of VRP release from batch VRP022 compared to lsoptin® SR (n =6) ................................................. ................................................................... ..... ......... .......................................... 94
Figure 4.15. Dissolution profile of VRP release from batch VRP023 compared to Isoptin® SR (n =6) ..... ....... ..... ............................................................................................................................... ............................ 94
Figure 4.16. Dissolution profile of VRP release from batch VRP021 and VRP023 at different pH. .... 95
Figure 4.17. Effects of ionic strength on Verapamil release from batches VRP021, VRP023 and Isoptin® SR (n=6) release in pH 7.4 phosphate buffer using USP apparatus 1... .................. 99
Figure 4.18. Schematic of the formation of a rod-like cylinder by 3 mini-tablets . ..................................... 100
Figure 4.19. Swelling indices for batches VRP021 , VRP023 and Isoptin® SR at pH 7.4 (n = 3) . ...... 100
Figure 4.20. Percent erosion for batches VRP021, VRP023 and Isoptin SR (n =3) ................................... ! 01
Figure 4.21. Correlation of matrix swelling and erosion for batches VRP021 , VRP023 and Isoptin® SR product ........................................................................................................................................... 103
Figure 4.22. Influence of the pore size on VRP release from batches VRP021 and VRP023 ............... I 05
Figure 4.23. Effects of Basket rotation speed and reciprocation rate on drug release for batches VRP021, VRP023 and Isoptin® SR (n = 6) ................ ...................................................... .................... 109
Figure 5.1. Mean in-vitro dissolution profiles of tablets of batch VRP021 and Isoptin® SR (n =6) ... 128
Figure 5.2. Mean in-vitro dissolution profiles of tablets of batch VRP023 and lsoptin® SR (n =6) ... 128
Figure 5.3. pH effect on the Kinetic constant of VRP021, VRP023 and Isoptin® SR. ............................... l31
Figure 5.4. pH effect on the Release Exponent (n-value) for batches VRP021 and VRP023 and Isoptin® SR using USP apparatus 1 ........................................................ ........................... ....................... 135
Figure 5.5. pH effect on the shape parameter for batches VRP021, VRP023 and Isoptin® SR using USP apparatus 1 . ............................................................. ..................................... ...... ................ ....... ..................... 144
xiv

Figure 5.6. pH effect on Time Parameter (Td) of batches VRP021, VRP023 and Isoptin® SR using USP apparatus 1 ......................................... ............................... ................................ ................ ........ ......... ...... ...... 145
XV

CHAPTER ONE
REVIEW OF A CALCIUM CHANNEL BLOCKER CANDIDATE
1.1 INTRODUCTION
Recent advances in cardiovascular drug therapy are unparalleled in medical history. As a
result of an increased understanding of the pathophysiology and molecular biology of
cardiovascular diseases, new, more effective cardiovascular drugs have been developed and
their success in preventing and treating cardiovascular disease is well documented [3).
The prevalence of cardiovascular diseases varies with age, race and education, amongst other
variables [4). Therefore, it is essential that today's pharmaceutical scientists keep up-to-date
with the latest developments with respect to manufacturing these 'life saving agents'.
Verapamil hydrochloride is a WHO listed drug that is indicated for the treatment of several
cardiovascular diseases, including angina pectoris, supraventricular tachyarrhythmias and
hypertension, amongst others. These cardiovascular diseases are common and they need
constant monitoring. Verapamil hydrochloride is available as 40-, 80- and 120 mg immediate
release products and as 120-; 180- and 240 mg extended release tablets. It has a short half-life
[2) and is therefore suitable for inclusion in a sustained-release formulation. These products
would reduce the frequency of administration and improve patient compliance.
1.2 PHYSICO-CHEMICAL PROPERTIES
1.2.1 Description
Verapamil hydrochloride (VRP) is a white, practically odourless, crystalline powder [5-7]. It
contains not less than 99.0% and not more than 101.0% of racemic VRP, determined with
reference to the dried substance [5]. The chemical structures of the two VRP isomers are
depicted in Figure 1.1 and the compound is known as;
• 5-[N-(3,4-dimethoxyphenethyl) methylamino)-2-(3,4-dimethoxyphenyl)-2-
isopropylvaleronitrile hydrochloride [7)
• a-[3-[[2-(3,4-Dimethoxyphenyl) ethyl]-methylamino] propyl]-3,4-dimethoxy-a-( 1-
methylethyl) benzeneacetonitrile hydrochloride [8]
• a-isopropyl-a-[(N-methyl-N-homoveratryl)-y-aminopropyl]-3,4-
dimethoxyphenylacetonitrile hydrochloride [8]
1

I N
HCL
(S) verapamil hydrochloride
· HCL
(R) verapamil hydrochloride
where ----j•• indicates a chiral carbon.
Figure 1.1 . Chemical structure of VRP isomers [(C27H38N20 4, HCI)] (MW = 491.1).
2

1.2.2 Optical Rotation
A 1% methanolic solution of VRP exhibited no optical activity when measured at 589 nm in
a 1dm cell at 25°C [9].
1.2.3 pH of Solution
The pH of a 0.1 %aqueous solution of VRP is 4.5-6.0 [5, 10].
1.2.4 Solubility (21 °C)
The solubility of VRP as a function of pH is depicted in Figure 1.2 and Table 1.1 lists the
solubility of the compound in a variety of solvents. The solubility is approximately 80-90
mg/ml in solution of pH 2.3 to 6.4, where the ionized species predominates, which decreases
rapidly in alkaline pH. The solvent used was water and adjusted to the desired pH using 0.1N
NaOH and 0.1N HCI solutions for this study [9].
100
90
80
70
~ 60
C)
.s 50
~ 40 :0
-= 0 IJ) 30
20 -
10
0 ----! - ~ ··---r--·--,- -- r-- - r-- - - ----,
2 3 4 5 6 7 8 -10
pH
Figure 1.2. Solubility of VRP as a function of pH.
3

Table 1.1. Solubility of VRP in a variety of solvents.
Solvent Solubility Reference (mg/ml)
V/ater 83 9, 10 Ethanol 26 9, 10 Propylene glycol 93 9 Ethanol > 100 9, 10 Methanol > 100 9, 10 2-Propanol 4.6 9 Ethylacetate 1.0 9, 10 Dimethyl > 100 9, 10 formamide Methylene > 100 9 chloride Hexane 0.001 9
1.2.5 pKa
Titration of VRP (dissolved in methanol -water) with 0.1N potassium hydroxide (KOH) in
methanol yielded a pKa value of 8.6 on extrapolation to pure water [9] .
1.2.6 Hygroscopicity
A sample of VRP exposed to 79% relative humidity at room temperature for 24 hours,
absorbed 0.47% w/w moisture, indicating that VRP is not hygroscopic [9] .
1.2.7 Ultraviolet Absorption Spectrum
A 0.002% solution of VRP in methanol yielded two wavelengths of maximum absorption,
which occur at 230 nrn (£ = 16 700) and 278 nm (£ = 6 090) [9, 10]. Das Gupta [8] reported
and measured the lamda max of 278 nm for VRP in water.
4

0.7
0 .6
0.5
0.4 (!) (.) c <ll
..0 .... 0
0.3 rJ)
..0 <!
0.2
0 .1
0
200 250 300 250 Wavelength
Figure 1.3. UV absorption spectrum of VRP in Methanol [9).
1.2.8 Melting range
VRP melts over a l-4°C temperature range that occurs between 140-144°C [9].
5

1.3 SNYTHETIC PATHWAY
1.3.1 Synthetic Procedure
HO~CN + - Nl\
j. CH,O"() CN + HO~N/ ~0~ H
~0~ +
~CN ~0
I
~Br 1-
~0~ I ~ I
~0 N~OH +
I
~0
~vi. vii
~0~
~I ~0 N
Figure 1.4. Pathway of synthesis of VRP.
where,
=Hz, 5% Pd /A}z03
iv = NaOH-H20
v1 = Sodium Amide Toluene
vii =Hydrochloric Acid
HCl
u = H2, 20% Pd I C
v = Sodium Amide Toluene
soc~
6

1.3.2 Stereospecificity
The presence of a chiral centre in VRP (Figure 1.1) results in the presence of stereoisomers,
and in all the commercially available formulations, VRP is present as a racemic mixture, i.e.,
R and S enantiomers [6, 7]. Many of the antiarrhythmic drugs introduced onto the market
during the past three decades have a chiral centre in their structures and are consequently
made available as racemates [11]. There is substantial stereoselectivity in one or more of the
pharmacological actions of VRP, with the activity of each enantiomer differing by as much as
20-fold or more for this drug. Biological absorption of chiral VRP appears to be non
stereoselective, however, distribution, metabolism and renal excretion usually favour one
enantiomer over the other [ 11].
1.3.3 Structure Activity Relationship
There is a dearth of structure-activity relationship (SAR) studies on calcium channel
antagonists despite the wealth of data published in the literature [12-15]. Mannhold et al [13]
reported that the methoxy groups on the benzene ring near the asymmetric carbon atom and
the isopropyl group are not essential for the frequency-dependent negative inotropic action of
VRP, but do have a strong influence on the potency of the compound. Both the tertiary amino
nitrogen and the two benzene rings are essential for the frequency-dependent negative
inotropic action of VRP. The molecular importance of the N-methyl group is probably due to
its influence on steric effects in the molecule.
1.4 STABILITY
VRP is stable under high-stress thermal and photo-chemical conditions when exposed in the
solid state. It is also stable under neutral, acidic and basic aqueous reflux conditions.
However, when VRP is dissolved in methanol and subjected to UV irradiation for 2 hours, it
degrades rapidly [9].
VRP, in solutions of different pH, did not decompose after 105 days when stored at 50°C. Q10
values were used to approximate the long term stability of VRP in solution and it was
estimated to be stable for 4.5 years, although 5% w/v decomposition was reported in
solutions of pH 1.4, 6.5 and 7 .3. The optimum pH range of VRP has been reported to be from
3.2 to 5.6 [8].
7

Allen and Erickson [16] studied the stability of an oral liquid dosage form of VRP and
reported that the solutions were stable for up to 60 days when stored at between 5°C and
25°C in the absence of light.
1.5 CLINICAL PHARMACOLOGY
1.5.1 Mechanism of Action
VRP was the first clinically available calcium-channel blocker, and is a congener of
papaverine [17], which is an alkaloid found in the opium poppy and has vasodilator activity
[4].
There are four distinct types of voltage-gated calcium channels, viz. L, N, T and P. The
therapeutic calcium (Ca2+) blockers developed to date have been almost exclusively L-type
channel blockers. It is likely that screening methods used to assess activity are able to
determine L-type channel blockers only, which is the reason that almost all calcium channel
blockers developed to date interact only with the L-channel [4]. However, intensive studies
are currently underway to develop selective blockers of neuronal calcium channels in the
hope that more effective and selective drugs may be discovered for the prevention of brain
injury following stroke [4]. VRP is known to act on the L-voltage-gated calcium channels [4].
Voltage-gated channels are distinguishable mainly on the basis of the voltage range over
which they open, their tendency to close and remain inactive dming maintained
depolarization, their single channel conductance and their prevalence in different types of
tissues [6]. The different types of calcium channel undoubtedly represent distinct membrane
proteins and at present only a fragmentary knowledge of their physiological functions are
understood [6].
The L-type calcium channel is the most dominant type of system found in cardiac and smooth
muscle tissues, which are known to contain several receptors. These receptor regions are
more than likely stereoselective, as marked differences in the R and S stereoisomer-binding
affinity and pharmacologic potency are observed for the R and S enantiomers of VRP
respectively [4].
Two groups of drugs, the dihydropyridines and non-dihydropyridines are known to block the
L-voltage-gated channels. The dihydropyridines tend to have greater effects on the peripheral
8

vasculature than on the heart [11], whereas the non-dihydropyridines have greater effects on
cardiac myocytes, as well as exhibiting pronounced inhibitory effects on the sinus and A V
nodal conducting systems [ 17].
From a functional point of view, cardiac muscles may be divided into three major masses, viz.
the atrial muscle, the ventricular muscle, and the specialised muscular tissue, which is
adapted to conduct excitation throughout the myocardium rather than to contract [18].
The contractile mechanism of smooth muscle, such as those of the skeletal and cardiac
muscle, is dependent on Ca2+ activated myosin ATPase [4, 18]. Coronary dilator drugs appear
to act by depriving the contractile mechanism of Ca2+ ions. VRP acts by blocking the
transport of Ca2+ ions across the plasma membrane of smooth muscle cells, and also blocks
the transport of Ca2+ into cardiac muscle cells, therefore, causing cardiac depression [4, 6, 18,
19].
The distribution of free small ions such as sodium (Na+), calcium (Ca2+) and potassium (K+),
across the membranes of resting cardiac ventricular muscle cells resembles that of other
excitable tissues and their internal: external concentration rates are depicted in Table 1.2.
Table 1.2. Distribution of cations across resting cardiac ventricular muscle membranes.
Ion
Concentration mmol/L)
Internal
18
0.0002
90
External
110
2
2.5
The resting membrane is relatively impermeable to Na+ and Ca2+, but is highly permeable to
K+ [ 18], which results in an unequal distribution of ions between the internal and external
environment. In this instance, K+ is more concentrated in the intracellular fluid, and Na+ and
Ca2+ in the extracellular fluid [18]. Direct measurement of the ventricular fibre resting
potential with rnicroelectrodes reveals that there is a potential of approximately -80 to
-90 m V. When the membrane of a ventricular muscle cell is depolarised, there is a fall in
membrane potential to about -70 m V [ 18]. The rapid upstroke of the action potential is
mainly a consequence of sodium gate opening and the membrane becoming highly permeable
to Na+ ions, which enter the membrane fibres carrying positively charged ions into the cell [4,
9

18]. There is some evidence that a fast Ca2+ current contributes to a small extent to the rapid
rise in the action potential. At the peak of the action potential, the membrane potential is
reversed to a value of approximately +30 mV. The rapid initial inward sodium current is
quickly deactivated, and the sodium gates close, with subsequent membrane repolarization.
However, a secondary slower inward current of Ca2+ gives rise to a plateau of the action
potential and interrupts the repolarization process. The positively charged ions carrying the
secondary slower inward current pass through different channels from those carrying the
initial rapid inward current and the slow inward current is carried mainly by Ca2+ through
specific calcium channels [4, 18].
Inactivation of the secondary slow inward current is followed by an increased permeability of
the membrane to K+ and thus the membrane repolarizes. An action potential, once initiated,
passes emphatically from cell to cell, and travels throughout the whole of the muscle mass at
velocities that range from 0.5 to 4 m/sec in different parts of the myocardium [18].
Metal ions such as manganese (Mn 2+), cobalt (Co2+) and indium (In 3+) also block the entry
of Ca2+ during the plateau phase of the action potential, and produce a considerable
depression of contractility when given in large doses. Therefore, a large intake of these salts
may cause a chronic form of cardiac failure and this has been observed in heavy beer drinkers
when cobalt chloride has been used as a foam-stabilising additive in beer [18].
1.5.2 Clinical Use
VRP is a class IV anti-arrhythmic agent primarily used in the control of supraventricular
tachyarrhythmias, classical and variant angina pectoris and in the management of
hypertension [2, 4, 17, 19, 20]. When VRP is combined with a B-adrenergic antagonist,
therapy is more effective in lowering blood pressure than when either drug is used alone.
However, as might be expected, the combination may have synergistic effects on the PR
interval of an electrocardiogram and, as a consequence, this combination should be avoided
[17].
VRP may be effective in the treatment of sporadic hemiplegic and familial hemiplegic
migraine [21]. Cluster headache is an uncommon, yet well-defined neurovascular syndrome
occurring in both episodic and chronic varieties for which VRP has been reported to be the
cornerstone drug for prophylaxis [22]. It has been used (off label) in post-infarct protection
when beta blockade is contraindicated and in the absence of clinical congestive heart failure
10

[2]. VRP has been shown to be as effective as an angiotensin converting enzyme [ACE]
inhibitor, in reducing albumin secretion and therefore has been successfully used in the
management of diabetic nephropathy when [ACE] inhibitors and angiotensin receptor
blockers [ARB] are contraindicated [23]. In a study by Wisner et al [24], VRP was found to
be effective in the treatment of bipolar disorders in studies in which out-patients including
some pregnant women were subjects, but these findings have not been correlated [25].
1.5.3 Interactions
VRP is known to interact with propranolol and has caused congestive heart failure, severe
bradycardia, arteriovenous block, and ventricular asystole [3, 4, 17].
VRP is a cytochrome P450 (CYP) 3A4 and P-glycoprotein inhibitor [26] and this can affect
the pharmacokinetic profiles of other co-administered drugs such as Rifampicin [27]. It is
extensively metabolised in the liver and interactions may occur with drugs that inhibit or
enhance liver metabolism. Increased plasma concentrations of buspirone [28], simvastatin
[29], carbamazepine, cyclosporine, digoxin, midazolam and theophylline have been rep01ted,
and the plasma concentration of alcohol may also be increased when used in combination
with VRP [7, 19].
VRP is displaced from protein binding sites by cefriaxone, clindamycin [7, 30] and other
highly protein bound agents, such as non-steroid anti-inflammatory agents, warfarin,
phenytoin, sulphonarnides and sulphonylureas [2]. In addition, acute VRP toxicity has also
been reported [7, 30].
Phenorbabitone has an effect on the disposition of VRP's disposition in humans. It is an
hepatic-enzyme inducing drug and has been reported to increase the clearance of oral and
intravenous administered VRP and to reduce oral bioavailability of the compound in healthy
subjects [7, 19].
Dumestre-Toulet et al [31] reported a fatality following co-administering sildenafil and VRP
in one patient. An autopsy revealed that severe artery sclerosis, as well as signs of myocardial
infarct had occurred. This is the first report of a fatal sildenafil-VRP association, probably
caused by hypotension and cardiac dysrrhythmia [31].
11

Grapefruit juice can markedly affect the oral bioavailability of drugs. The absorption of VRP
when administered with grapefruit juice increases peak plasma concentration in humans and
the effect seems to be mediated mainly by suppression of the cytochrome P450 enzyme, CYP
3A4 in the small intestine wall [32-34]. Individuals with proportionally higher baseline CYP
3A4 levels had a higher proportional increase in VRP clearance [32]. The components of
grapefruit that are the most probable cause of the interaction, are the psoralen derivatives
[33], but in-vitro findings support the flavonoid, naringin, or the furanocoumarin, 6'7'
dihydroxybergamottin, as being the active ingredients. However, a recent investigation by
Bailey et al [32] indicated that neither of these substances made a major contribution to
grapefruit juice-drug interactions in humans.
Tannergren et al [35] reported that repeated administration of St John's Wort can cause a
severe herbal-drug interaction with VRP by decreasing the bioavailability of the R- and S
enantiomers. These interactions are thought to be caused by induction of intestinal and
hepatic CYP 3A4 or by induction of the transport P-glycoproteins [P-gp and ABCB1]
through activation of the steroid X-receptor I pregne X-receptor (SXR I PXR). StJohn's Wort
contains a complex mixture of molecules, but the inducing effects are probably mediated by
hyperforin [36], which is also thought to be responsible for the major antidepressant activity
of the extract [37].
1.5.4 Contraindications
VRP is contraindicated in patients with any broad QRS complex tachycardia, sick sinus
syndrome [2, 7, 17, 19], pre-existing AV nodal disease, severe hypotension, Wolf-Parkinson
White syndrome with anterograde conduction, Lown-Ganong-Levine syndrome, myocardial
depression, including those produced by beta blockers, digoxin, quinidine or disopyrarnide
and congestive heart failure [2, 17, 19].
The drug should be used with caution in patients with hypertrophy obstructive
cardiomyopathy, aortic stenosis, bradycardia, hepatic or renal impairment and gastro
intestinal bleeding [2].
VRP has been associated with acute attacks of porphyria and is considered unsafe for use in
porphyric patients [7].
12

1.5.5 Precautions
There are a number of patient groups in which VRP should be used with caution.
1.5.5.1 Geriatrics
Total VRP clearance was decreased in elderly hypertensive patients when compared with that
in young patients, and the elimination half-life was prolonged [2, 7] as a result of decreased
renal clearance [2]. Therefore, lower dosages may be necessary in elderly patients [19].
1.5.5.2 Paediatrics
Pfammatter and Bausersfereld [38] reported in a previous study that paroxysmal
supraventricular tachycardia caused by atrio-ventricular re-entry is the most frequent
arrhythmia in children of all age groups. It represents the most frequent clinical situation
where arrhythmic drug therapy has to be considered in a child [38]. Neonates and infants with
paroxysmal supraventricular tachycardia generally present with signs of acute congestive
heart failure. Intravenous VRP is contraindicated in neonates and infants because of the high
risk of electromechanical dissociation. In children older than 5 years of age and adolescents,
VRP may be administered with the same restrictions as in adult patients [39].
1.5.5.3 Pregnancy
The incidence and severity of tachyarrhythyrnias, including both supraventricular tachycardia
and ventricular tachycardia may increase during pregnancy. The causes of these have been
proposed to be due to haemodynamic, hormonal, autonomic and emotional changes related to
pregnancy, which may also include increases in plasma catecholamine concentrations,
adrenergic receptor sensitivity, atrial stretch and increased end-diastolic volumes due to
intravascular volume expansions [40].
Nifedipine and VRP are the best-studied calcium antagonists in human pregnancy. Although
embryogenesis, the development and integration of embryonic organs, is a highly calcium
dependent process, there are no substantiated data to indicate that calcium channel blockers
cause a significant increase in fetal toxicity in human pregnancy [2, 41]. VRP crosses the
placenta [2, 7, 40] and in the first three months of pregnancy it is considered to be second line
therapy [41].
13

Although VRP administration during the third trimester is generally safe and not considered
teratogenic, it must be used with caution as it has been shown that VRP when used for fetal
supraventricular tachycardia caused fetal atrioventricular block, bradycardia, reduced
contractility and hypotension [40].
1.5.5.4 Lactation
Tan and Lie [40] reported that treatment of tachyarrhythmias during pregnancy and lactation
is complicated by concerns regarding safety and tolerability for the fetus and infant. All
commonly used antiarrhythmic drugs cross the placenta and are excreted in breast milk. Their
plasma concentration in the fetus and infant are partly determined by differences in pH
between their serum and that of the mother. Most antiarrhythmic drugs are alkali compounds
and accumulate in acidic environments [40]. VRP is excreted in breast milk with reported
concentrations in milk [2, 7, 40] varying between 23% and 94% of those in maternal serum
[40]. To date, there have been no documented difficulties with respect to VRP's use when
breastfeeding, however it is not recommended [2].
1.5.5.5 Renal Impairment
Zacharia et al [ 42] studied the pharmacokinetics of VRP and norverapamil (NVRP) in normal
subjects and patients with renal failure undergoing maintenance haemodialysis following IV
infusion. Severe renal failure requiring haemodialysis did not change the time course of VRP
and NVRP plasma concentrations after either IV or oral doses [42]. The terminal elimination
rate constant, clearance, volume of distribution and bioavailability of VRP were not
significantly different between the two groups. In addition, the apparent maximal plasma
concentration, terminal rate constant and area under the curve for NVRP were similar in
patients with renal failure and normal subjects. Therefore, it can be concluded that the plasma
disposition of VRP and NVRP is not affected in patients with impaired renal function [42].
1.5.5.6 Smoking
Smoking increases CYP 1A2 activity and as this enzyme contributes to the biotransformation
of VRP in the liver, the pharmacokinetic parameters of VRP are different in smokers [26, 34].
ss There is a decrease in AUC and Cmax values and therefore patients who are smokers, should
abstain from smoking when being treated with VRP [34].
14

1.5.5.7 Effects of Food
Hoon et al [ 43] studied the effects of food on the bioavailability of a sustained-release (SR)
formulation of VRP. Compared with the conventional immediate-release formulations, SR
VRP had a reduced Cmax. prolonged tmax. and unchanged t112· The AUC was 80% of the
conventional preparation. Therefore, concomitant food administration significantly prolonged
the tmax of SR-VRP [19, 43, 44].
1.5.6 Adverse Effects
Treatment with VRP is generally well tolerated, however, adverse effects associated with the
pharmacological effect of VRP on cardiac conduction can arise and may be severe in patients
with hypertrophic cardiomyopathies [7].The following adverse reactions have been reported
in clinical trials and marketing experience [7, 19]:
Bradycardia, atrioventricular block, worsening heart failure, and transient asystole have been
reported [2, 7, 17, 19].
Central nervous system (CNS) effects include confusion, equilibrium disorders, muscle
cramps, paresthesia, psychotic symptoms and less commonly headaches, nightmares and
insomnia [7, 19].
There has been a report of a patient who had a history of bronchial asthma [7, 19] who
developed symptoms of acute asthma following administration of a modified-release
preparation. The cause may be attributed to the excipients such as alginate used in the product
[7]. The most predominantly reported non-cardiac adverse effect is constipation. Nausea may
occur, but is less frequently reported [2, 7, 17, 19] and there have been isolated reports of
tinnitus [7] and gingival hyperplasia during chronic therapy of VRP [7, 17, 19, 45].
Hypersensitivity reactions such as rash, pruritis, alopecia and urticaria have also been
reported [7, 19] and there have been a few reports of erythema multiforme, Steven-Johnson
syndrome and exfoliate dermatitis [7, 19]. Hypertrichosis, over many parts of the body has
been reported in a male patient following one-month therapy with VRP [7].
There have been reports of increased frequency of urination, spotty menstruation,
oligomenorrhea [19] and recurring impotence in men who were taking VRP [7, 19].
15

Patients have developed elevated serum-prolactin concentrations when treated with VRP [7].
Hyperglycaemia, metabolic acidosis and hyperkalaemia have occurred following
administration of a single dose of modified-release VRP in a non-diabetic patient who had
previously tolerated regular VRP [7].
Elevation of transaminase with and without concomitant elevations in alkaline phosphatase
and bilirubin has been reported during VRP therapy [ 17, 19]. Clinical symptoms of
hepatotoxicity such as malaise, fever, and/or right upper quadrant pain and darkened urine,
have also been reported [ 17, 19]. These reactions may be due to a hypersensitivity reaction
and were reversible on discontinuation of VRP therapy [7] .
1.6 CLINICAL PHARMACOKINETICS
1.6.1 Dosage and Administration
The usual initial adult dose for hypertension, angina or arrhythmias is 80-120 mg three times
a day [2, 19, 20]. In some cases, the dose may be decreased following clinical improvement
[19]. If required, the dose may be increased to a total daily dose of 480 mg [2, 19] and
dosages should be individualized by titration depending on patient tolerance and
responsiveness to VRP [2]. In the treatment of hypertension using slow release tablets, the
usual dosage is 240 rng once daily [2, 3] and the dose may be increased at weekly intervals
[3] to a maximum 240 mg 12 hourly [2, 3, 19].
In the treatment of obstructive hypertrophic cardiomyopathy the usual starting dose is 80-
120 mg three to four times daily and occasionally patients may require doses up to
600-720 mg/day [2, 19].
Lower doses are usually required in elderly patients [2, 3] and in the treatment of patients
with advanced renal or hepatic disease [2]. Constant electrocardiogram (ECG) and blood
pressure monitoring should be carried out during intravenous administration [2, 3] for early
detection of PR interval prolongation, bradycardia and hypotension [2].
16

1.6.1.1 Overdosage
Overdosage with VRP generally produces cardiovascular symptoms such as severe
bradycardia, heart block, profound hypotension [2, 7, 19] and diminished peripheral perfusion
with loss of peripheral pulses, cyanosis and resultant cold hands and feet [7].
1.6.1.2 Treatment of Overdosage
Overdoses of orally administered VRP should be treated by gastric lavage with concomitant
administration of activated charcoal [7 , 19, 46].
It should be noted that VRP is not removed by dialysis [7]. Intravenous infusion of calcium
salts is recommended as the specific antagonist to VRP and may reverse the haemodynamic
and the electrophysiological effects of the drug. If hypotension persists, intravenous
administration of sympathomimetic agents, such as isoprenaline, dopamine or noradrenaline
may also be necessary. Bradycardia may be treated by the administration of atropine,
isoprenaline, or by use of cardiac pacing [7, 19].
Overdosage with modified-release preparations of VRP may result in prolonged toxicity of
delayed onset [7] as drug release and absorption in the intestine may occur over 48 hours
[19]. Extensive elimination measures such as induced vomiting, removal of the contents of
the stomach and the small intestine under endoscopy, intestinal lavage and high enemas are
indicated [19]. The use of charcoal in combination with polyethylene glycol solution (PEG)
reduced the absorption of VRP, even when administered 2 hours after ingesting an overdose
ofVRP [46].
1.6.1.3 Guidelines for Use
Patients should be advised not to crush or chew sustained-release tablets or capsules and if a
dose is missed, it should be taken as soon as possible thereafter [19, 45]. If several hours have
passed or if the time for the next dose is close, patients should not double the dose to catch
up, unless advised by a doctor. If more than one dose is missed, patients are advised' to
contact a health care provider. Patients are also advised to brush and floss their teeth and see
a dentist regularly [30].
17

1.6.1.4 Incompatibility
VRP was found to be incompatible with solutions of nafcillin sodium [7, 47], aminophylline,
and sodium bicarbonate, which is manifested by the formation of a precipitate in alkaline
solutions [7].
1.6.2 Absorption
VRP is weakly basic and is poorly absorbed from neutral and alkaline media [48]. It is
approximately 90% absorbed from the gastrointestinal tract after oral administration, but is
subject to considerable hepatic first-pass metabolism with the result that oral bioavailability is
only approximately 20%- 35% [2- 4, 19, 20, 49, 50]. When administered orally, peak effects
occur within 1-2 hours with conventional immediate release tablets [2, 3, 19] and within 4-8
hours when extended release preparations are used. Following IV administration, therapeutic
effects occur within minutes of dosing and persist for between 30 minutes and 6 hours [3, 7].
1.6.3 Distribution
The steady state hypothetical volume of distribution in healthy adults ranges from 4.5 to
7 l.Jkg, but may increase to 12 Ukg in patients with hepatic cirrhosis [2]. About 90% of the
circulating drug is bound to plasma proteins [2, 7, 19, 20]. VRP crosses the placenta and is
distributed into breast milk [2, 7, 40].
1.6.4 Metabolism
In healthy subjects, orally administered VRP undergoes extensive metabolism in the liver [2,
3, 4, 19, 20, 50, 51]. The pharmacology of VRP [52, 53] is complicated by the fact that the R
and S enantiomers differ in their pharmacodynamic and kinetic properties. S-Verapamil is
pharmacologically more potent than R-verapamil (i.e. up to 20 times more potent in terms of
negative dromotropic effect [54], but is also preferentially metabolized [55, 56]). As a
consequence, serum levels of the S-enantiomer are always lower than those of the less active
R-enantiomer and the R to S serum concentration ratio is approximately 2 after intravenous
administration and 5 after oral administration, respectively [57, 58]. The higher ratio
observed after oral dosing is caused by extensive stereoselective pre-systemic first-pass
metabolism in the gut wall mucosa and liver, which may also be the reason for the low oral
18

bioavailability of about 20% and 50% for the S-verapamil and R-verapamil enantiomers,
respectively [52, 55-57].
Twelve metabolites have been isolated and identified in plasma. All compounds except
NVRP are present in trace amounts only [19, 50]. Although VRP has been marketed for
many years, few studies of its transformation in humans have been reported and only a few of
the oxidative (Phase 1) and glucuronide (Phase 2) metabolites have been identified [49].
Borlack et al [ 49] identified 21 Phase I and 16 Phase II metabolites. All the Phase ll
metabolites (glucuronides) and 11 of the Phase I (oxidative) metabolites had not been
reported previously [49]. NVRP, the primary metabolite, has pharmacological activity similar
to that of the parent compound [20].The therapeutic range in serum varies from 20 to
500 ng/ml depending on the drug form used [50, 51] and there is considerable inter
individual variation in plasma concentrations [50]. To reach such concentrations, the oral
dose should be twelve times higher than the intravenous dose [50]. The activity of class N
anti-arrhythmic drugs such as VRP is usually monitored by observation of their
haemodynamic effects, rather than by therapeutic drug monitoring (TDM) [59].
N-dealkylation is the main metabolic pathway of VRP and yields a secondary amine (22%)
and primary amine (3-4%). The N-demethylated product, NVRP comprises 6% of the urinary
metabolites collected in 48 hours [2]. N-demethylation and N-dealkylation of VRP is
catalysed by CYP 34A [60]. The 0-demethylated products of all these compounds represent
about 16 -17% of the administered dose and are excreted exclusively as inactive conjugates
[2]. VRP exhibits non-linear pharmacokinetics and considerable inter- and intra-patient
variability [60]. A number of possible explanations for this phenomenon have been
suggested, including changes in hepatic blood flow [61], the presence of a deep tissue
.compartment of drug distribution [62] and a reduction in hepatic clearance and first-pass
extraction, possibly due to saturation of metabolic pathways, is frequently cited as the main
reason for variability [56, 62-64].
1.6.5 Excretion
VRP exhibits bi- or tri-phasic elimination kinetics [50] and is reported to have an elimination
half-life of between'6 to 12 hours [2, 6, 7, 19, 20], but increases to as much as 16 hours in
patients with hepatic cirrhosis [2, 19]. In infants, the elimination half-life may increase from
5 to 7 hours [2] , as a result of the saturation of hepatic enzyme systems as plasma VRP levels
19

rise (19]. Approximately 70% of an administered dose is excreted as metabolites in the urine
and 16% or more in the faeces within 5 days of the dose. About 3 to 4% of an administered
dose is excreted in the urine as unchanged drug [2, 7, 19, 20].
Commercially, VRP is used as a racemic mixture with the S-isomer having 3 - 4 fold greater
clearance and a 3-10 fold greater dromotropic effect than the R-isomer following both oral
and intravenous administration [60].
Population analyses of pharmacokinetic data in healthy volunteers and in patients with
hypertension or angina suggest that the S-isomer has a 4-fold smaller AUC compared to that
of the R-isomer when administered as a racemic mixture [60]. The apparent plasma clearance
of both R- and S-enantiomers decreases with increasing dose, which is consistent with a non
linear mechanism for clearance [60].
Clearance of the R- and S-enantiomers has also been found to be greater following
administration of an immediate-release formulation when compared to a sustained-release or
controlled release formulation. This difference in clearance values between formulations may
be a result of input rate differences on stereo-selective clearance [60].
It has been previously shown that N-demethylation and N-dealkylation of VRP is catalysed
by CYP 34A [60] and mucosal CYP 34A enzymes are less abundant in the jejunum and
ileum when compared to the duodenum. Thus, first-pass intestinal metabolism may be
reduced when the drug is absorbed from the more distal sites of the small intestine [60].
1.7 CONCLUSION
Despite the vast amount of work that has been correlated in past years on VRP, it can be
concluded that a deeper understanding of the complex mechanism of action and an
explanation of the potential drug-drug and drug-herb interactions must be determined before
the drug is administered to patients. The availability of the drug in a racemate form
necessitates that the synthetic pathway be properly understood so that the correct ratio of the
enantiomers can be obtained, since the different isomers exhibit different potency in
pharmacological effects and this poses formulation challenges. An understanding of the
importance of stereochemistry in the biological system and the basic phenomena and
concepts associated with the stereochemistry of VRP is necessary. The complex
pharmacokinetics of VRP therefore, require that only competent clinicians may prescribe this
20


A = the width of the peak to the leading edge of the peak at 10% of the peak
height and
B = the width of the peak to the tailing edge of the peak at 10% of the peak
height.
Symmetrical peaks have an As of 1.0 and usable columns produce peaks with As values
of 0.90 to 1.3. Peak asymmetry was measured at 10% of full peak height [66] and the
calculation of column efficiency or number of theoretical plates, N, for these columns
using equations 2.1 or 2.3 was based on the assumption that the peaks obtained were
Gaussian-shaped [66, 71].
During the optimization of the analytical method, an Inertsil® ODS 5 ~m, 15 em x 4.6
rnm (Metachem Technologies Inc. Torrance, CA, USA) and Supelcosil® ODS 5 ~m,
15 em x 4.6 rnm (Alltech, Deerfield, IL, USA) were tested. The chromatographic
conditions used to test the columns are reported in § 2.4. The lnertsil® column had a
plate count number of approximately 6000 and the Supelcosil® column gave N values
of less than 5000. Resolution and retention were affected by the change of these
columns. The Inertsil® column was finally selected as a column of choice for this
study. The peak tailing factor (PTF) calculated at 5% of full peak height for VRP (n = 3) was 1.17 with % RSD = 1.91 and the peak asymmetric factor measured at 10% of
peak full height was 1.33 with % RSD = 1.73. Therefore, chromatographic peaks
obtained when using the lnertsil® column were better in terms of peak shape than those
obtained using the Supelcosil® column.
Lastly, the effects of ion-pair reagent, organic solvent, buffer molarity and eluent pH
were investigated on the retention time of VRP.
2.3.2.2 Internal Standard
Many analysts prefer the use of an internal standard for quantitative analysis [8, 51, 76,
78-80, 82, 83, 87, 88]. The purpose of including an internal standard is to minimise
system and procedure variations, thus eliminating variations in precision as a function
of sample size [68]. This technique minimises error introduced as a result of sample
preparation, apparatus and analytical technique [65, 68, 88]. Lindholm et al [88] and
Hammerstrand [89] reported that the use of an internal standard is one method used to
30

improve the accuracy of an analytical method and it compensates for varying injection
volumes and day to day instrumental changes, thereby promoting method accuracy.
A known compound of fixed concentration is added to the sample of unknown
concentration to give a separate peak in the chromatogram. A plot of ratio of peak
area/height to internal standard peak area/height versus concentration may be used to
generate a calibration curve from which experimental results can be determined by
interpolation. The choice of an internal standard is most important and it must be
resolved completely from all other peaks and should elute near peaks of interest. Other
important considerations are that it must not react with other components and should
not be present in the original sample [65, 68].
To date propranolol [51], imipramine [79], norverapamil [80] and fluoxetine [82] have
been used as internal standards for the analysis of VRP. In this study, metoprolol,
acebutolol and carbamazepine were selected as possible choices for internal standards,
based on their structural similarities to VRP.
Carbamazepine (CBZ) was selected as the internal standard of choice for this assay,
based on chromatographic resolution, peak shape and run time.
2.3.2.3 Effect of Ion-Pair Reagent Type
To try and improve the chromatographic peaks of a basic analyte in terms of
symmetry, ion-pair reagents of different molecular weights were tested for their
suitability for the analysis of VRP. Pentane sulfonic acid (PSA), heptane sulfonic acid
(HSA) and octane sulfonic acid (OSA) were assessed for their ability to improve the
peak shape and retention characteristic.
The sulfonic acid salts are used as ion-pair reagents to try and achieve an optimum
separation by improving the peak shape. Ion-pair reagents with different molecular
weight cause different effects with respect to retention and separation. Figure 2.1
shows the effects of the different sulfonic acids on retention time of VRP. The
separation is more pronounced when a longer sulfonic alkyl chain was used in the
mobile phase due to its hydrophobic nature.
31

The increased retention time for VRP is a result of the ion-pair reagent acting as a
counter-ion for the charged cationic VRP analyte, thus binding it by reversible
association [90]. In effect, the counter-ion neutralises the charge of VRP and decreases
its surface polarity, thus increasing its lipophilicity and potential for binding to a
hydrophobic stationary phase [90]. The retention time (R1) of CBZ remained relatively
unchanged when the sulfonic acid salts were changed as it is a neutral compound and
does not contain basic groups suitable for ion-pair formation.
r·- ------ -- ------
1
9 -------- ---- -l 8 -
.s::. -IL . co I .S::.
()
I 4
4 5
i I L.- --·----
6 7 8 9 10 11
Retention time (min)
1-+--- VRP ~ CBZ - __ · ··----:-_·_· ~--_------- - -- ---- . _j
Figure 2.1. Effect of sulfonic acid chain length on retention time of VRP.
32

2.3.2.4 Effect of Organic Solvent Composition
A mobile phase consisting of 75mM Phosphate buffer: Acetonitrile (68:32, v/v) was
selected after several trials with mobile phases of high ACN content. At high % v/v
ACN (>35%), there was no resolution between CBZ and VRP. When the % v/v ACN
was lowered below 30%, the peaks became somewhat broader and a longer R1 was
achieved. A 32% v/v ACN, the peaks showed reasonable separation. The results
revealed that when the ACN content was lower, the R, increased rapidly (Figure 2.2)
and when ACN content was higher, the R, time decreased. Therefore, it can be
concluded that phosphate buffer: acetonitrile in the proportion (68:32, v/v) is suitable
as a final choice of mobile phase and that for the analysis of CBZ, % v/v ACN has a
marked influence on both the resolution and the retention of VRP.
r--I 36 ·.------ ---- ----- -- -- ----,
' 35
34
~ ·;:: -·c: 33 2 ~ ~
32 > "S ~ 0
31 .
30
29
4 5
l___ . --- -- .
6 7
Retention time (min)
~-=. - VRP :__._CBZ i c ··---- . ·--··
8
Figure 2.2. Effect of percent acetonitrile on the retention time of VRP.
9
I I I
I I
I
10
33

2.3.2.5 Effect of Buffer Molarity
An increase in buffer concentration selectively decreased the R1 of VRP (Figure 2.3),
due to increasing competition of buffer cations for silanol sites which are preferentially
attached to the column. Since increasing the buffer molarity resulted in shorter run
times, a buffer with a molarity of 75mM was selected for use in this study. The results
obtained in this study are in agreement with observations made by Marin et al [91] that
for ionisable compounds an increase in ionic strength can suppress solute and silica
ionization, as well as secondary interactions between them.
80 ·-- - -- -- -- ----- --, 70
60
....... 50 :::!: .§_ > - 40 ·;: (lj
0 30 :::!:
20
10
0
5.5 6 6.5 7 7.5 8 8.5 9
Retention time (min)
Figure 2.3. Effect of buffer molarity on retention time of VRP.
34

2.3.2.6 Effect of Buffer pH
Silica packed columns show optimum stability and performance at pH values above
2.0 [92]. The effect of eluent pH on the R1 of VRP was therefore investigated in a pH
range of 3.0- 4.6 using ACN as the organic modifier. An increase in buffer pH had a
corresponding increase in the R1 of VRP, but the R1 of CBZ remained relatively
unchanged (Figure 2.4). Therefore pH 3.0 was selected as the optimum buffer pH for
the analysis of VRP. It can be concluded from these studies that an increase in pH had
a corresponding effect on the Rt of VRP.
I i
5
4.5 .
4
=a 3.5
3 ·
2.5
2 ~------~----------------~--------~------~ 5.5 6.5 7.5 8.5 9.5 10.5
Retention time (min) - - -- - I
~- ~p~~~
Figure 2.4. Effect of buffer pH on retention time of VRP.
35

2.4 CHROMATOGRAPHIC CONDITIONS
The following conditions were selected for the quantitation of VRP and Figure 2.5
depicts a typical chromatogram of VRP and internal standard CBZ.
Column Inertsil C1s (5 J!m)
Length 150 rnrn
I.D. 4.6 mm
Detector
Pump
Linear UVIS 200 (Instruments Corporation, Reno,NV)
SpectraSERIES PlOO pump (Thermoseparation
Products, San Jose, California, USA)
Injector Waters WISP 710B Autosampler (Waters Associates,
Milford, MA, USA)
Wavelength 278 nm
Sensitivity 0.05 AUFS
Flow rate 1.5 rnl/rnin
Injection volume 10 J!l
Recorder SpectraPHYSICS SP 4600 Integrator (San Jose,
California, USA)
Temperature Ambient
Mobile phase pH 3.0, 75rnM, phosphate buffer: acetonitrile (68:32, v/v)
composition
36

1
2
0 2 3 4 5 6 7 8 9
Time (mins)
Figure 2.5. Typical chromatogram of CBZ (1) and VRP (2) at 20 j.lg/ml and 50 j.lg/ml, respectively, obtained using the chromatographic conditions specified in § 2.4.
37

2.5 METHOD VALIDATION
2.5.1 Introduction
Various protocol guidelines are recommended by bodies such as the International
Conference on Harmonization (ICH), IUP AC, and the Food and Drug Administration
(FDA) for the validation of analytical methods [93]. Prior to use, an analytical method
for routine analysis must first be validated to demonstrate that it is suitable for its
intended purpose [94]. Validation parameters such as selectivity, linearity, accuracy,
precision and recovery must be evaluated in every analytical application. The limit of
quantitation (LOQ), limit of detection (LOD), stability, and ruggedness/robustness
should be investigated, but have been evaluated to a lesser extent in the past [94]. The
LOQ is a very stable characteristic and therefore it should be included in the
calibration curve, however, the LOD is not a very stable characteristic and therefore it
should not be included in the calibration curve. Ruggedness/robustness tests were
rarely performed in many of the citations [94].
Validation is often viewed as a test of the acceptability of a specific method. However,
the real goal of the validation process is to challenge the method and determine limits
of allowed variability for the conditions needed to run the method such that a desired
outcome will be achieved [69]. It is best to prioritize the components of validation
studies and typically, specificity, linearity, accuracy, and precision studies are needed
initially, followed by studies of stability and ruggedness at a later stage [69].
2.5.2 Linearity and Range
The linearity of an analytical method is used to show that test results are either directly,
or by a well-defined mathematical transformation, proportional to the concentration of
an analyte in samples within a given range [88].
Traditionally, the linear correlation co-efficient is used as a measure of the linearity of
a method and according to Lindholm et al [88] and Causey et al [94] its value should
be ~ 0.99. However, according to Bildlingmeyer [95] , a high value for the correlation
co-efficient does not necessarily indicate a linear standard curve [95]. The linear co-
38

efficient should be accompanied by a graph in which the response/sample
concentration is plotted versus the logarithmic sample concentrations [95].
The range of an analytical method is the interval between the upper and lower levels of
analyte (including these levels) that have been demonstrated to be determined with a
suitable level of precision, accuracy and linearity using the method as described [96].
A calibration curve was constructed by plotting (Figure 2.6) the peak height ratios of
VRP/CBZ versus VRP concentration and performing least-squares linear regression
analysis. The calibration curve had a slope of 0.0103 and a y-intercept of 0.0190 with a
correlation co-efficient of 0.9989.
~- - -;_5·-=---~~--- --~- -= =---== =--~--·--=--=--=--==-! I ! I I I 3
i 1 ~ 2.5
~ ~ a: II 2:. 2
0 y = 0.0103x + 0.019 l :; R2 = 0.9989
I. i 1.5
'4i ~
1 .¥
~ ~ i 0.5
I I O K------------~----~
o so no 150 200 250 3oo :
I Conc(ug/m I) I L ______________ - -- __________________ ]
Figure 2.6. Calibration curve constructed after linear regression of peak height ratios versus concentration. Linear regression equation: y = 0.01 03x + 0.019.
The linearity of peak height ratios of VRP to CBZ versus concentrations was studied
from 3.0 ~-tg/ml to 280 ~-tg/ml for VRP.
2.5.3 Precision
The precision of an analytical method is the degree of agreement among individual
tests results when the procedure is applied repeatedly to multiple aliquots of a
homogeneous sample [91, 97], or it may also be considered the reproducibility of
multiple measurements of an homogenous sample. Reproducibility of results using
39

different instruments, analysts, sample preparations, laboratories, data obtained on a
single day or over multiple days may all constitute an assessment of precision.
Different levels of precision are often assessed as part of method development [51, 67,
91].
Precision is usually reported as the percentage relative standard deviation (% RSD).
The measured % RSD can be subdivided into three categories, viz. repeatability (intra
day precision), intermediate precision (inter-day precision) and reproducibility
(between laboratories precision) [98-1 00].
Precision was considered at two levels for this method, viz. repeatability and
intermediate precision and the tolerance for% RSD was set at± 10% for these studies.
2.5.3.1 Repeatability
Repeatability of a method is determined when the analysis is performed in one
laboratory by one analyst using the same equipment on the same day. It has been
suggested [98] that repeatability be tested by the analysis of a minimum of five
determinations at three different concentrations (low, medium and high) in the range of
expected concentrations. However, according to ICH [ 1 00] repeatability should be
assessed by analysis of three determinations at three different concentrations or
through six determinations at 100% of the test concentration.
Intra-assay precision involves multiple measurements of the same sample (different
preparations) by the same analysts under the same conditions [51, 69, 91, 101]. The
intra-day precision obtained for six replicates of standard solutions of VRP with the
internal standard, CBZ, which were analyzed on three different days at three different
concentrations, are shown in Table 2.2.
40

Table 2.2. Intra-day precision data for analysis of VRP.
Concentration Mean concentration Standard deviation Precision
(J.lg/ml) determined (J.lg/ml) (% RSD)
10.00 9.49 0.0035 2.53
100.00 104.97 0.0095 1.22
200.00 202.96 0.0367 1.08
The results reveal that all standard deviation values were within the acceptable range
and the % RSD values were less than or equal to 5%, which are within the limits set in
our laboratory.
2.5.3.2 Intermediate Precision
Intermediate precision, or inter-day variability is the agreement of complete
measurements (including standards) when the same method is applied many times
within the same laboratory [91]. Thus determinations may include full analysis on
different days with the same or different instruments by the same or different analysts,
but would involve multiple preparations of samples and standards.The inter-day
variability of this method was assessed over three days at three different concentrations
for six replicates of VRP standards. Sample preparation was conducted as detailed in §
2.2.3 and the results are depicted in Table 2.3.
Table 2.3. Inter-day precision data for analysis of VRP.
Concentration Mean concentration Standard deviation Precision
(J.lg/ml) determined (J.lg/ml) (% RSD)
10.00 9.58 0.0029 3.76
100.00 97.56 0.0013 2.10
200.00 203.41 0.0057 1.73
The results show that all % RSD values determined were less than or equal to 5%,
which is within the limits set in our laboratory. Therefore, the method may be precise.
41

2.5.3.3 Reproducibility
Reproducibility examines the precision between laboratories and is often determined in
collaborative studies or method transfer experiments [69]; therefore it was not
performed in these studies.
2.5.4 Accuracy and Bias
The accuracy of an analytical method is defined as the closeness of the measured value
to the true value of analytes in the sample [69, 91, 97, 99]. A tolerance of 2% was set
for % RSD for this parameter. This complies with the limits set by a number of
pharmaceutical industries [102]. Bias assesses the influence of the analyst on the
performance of the method. Accuracy and bias were determined by making repeat
measurements of three samples of varying concentration. The FDA [103] recommends
that accuracy studies for drug products be performed at 80, 100 and 120% of the target
concentration. Accuracy studies were performed in triplicate on samples representative
of high, medium and low concentrations. The results are shown in Table 2.4 and reveal
that the largest value obtained for % bias was 2.87%, indicating that no value obtained
deviated by greater than approximately 2.90% of the stated value. Values of% RSD
obtained all complied with the 2% tolerance test, indicating that the method was
accurate for the determination of VRP.
Table 2.4. Accuracy Lest results of blinded samples.
Theoretical Mean concentration SD %RSD %Bias
concentration (Jtg/ml) determined (Jtg/ml)
10.00 10.23 0.0095 1.62 +2.25
100.00 102.96 0.0083 0.44 +2.87
200.00 199.67 0.037 1.08 -0.17
2.5.5 Limit of Detection I Limit of Quantitation
Recent articles in the literature have included much discussion regarding the
determination of the limit of quantitation (LOQ) and limit of detection (LOD) values
42

of an HPLC method [51, 79-82, 91, 97, 104]. Paino and Moore [105] described four
techniques to determine the LOD and LOQ of analytic systems:
i) lowest concentration for which % RSD :55%,
ii) plot of standard deviation versus concentration,
iii) confidence interval of a best-fit line and
iv) signal-to-noise ratio methods.
The LOQ is the lowest amount of analyte in a sample that can be quantitatively
determined with precision and accuracy under the stated experimental conditions [91,
97] and the LOD is the lowest amount of an analyte in a sample that can be detected,
but not quantitated as an exact value [91, 97]. For chromatographic analysis, LOD may
be defined as that concentration giving a peak height response three times greater than
the baseline noise level. Although various methods to estimate the LOD have been
described, an experimental assessment provides the best measure of the operating
limits of the equipment. The LOQ and LOD of the method developed for the analysis
of VRP in this study were determined using a precision of :5 5.0%. By convention, the
LOD value is taken as 0.3 x LOQ [105] and the LOQ was found to be 3.0J..Lg/rnl
(%RSD = 2.27) and LOD based on the above relationship was 1.0J..Lg/rnl.
2.5.6 Specificity
Vessman [106] and Rosing et al [107] pointed out that the specificity of a method is a
measure of the ability of an analytical method to produce a definite response to only
the analyte of interest and no other compounds that may be present in the sample, for
example tablet excipients, related substances or impurities. Specificity was assessed by
comparing chromatograms obtained from analysis of a standard solution containing the
analyte only with a sample mixture obtained by dissolving commercially available
tablets of VRP in the dissolution medium. The chromatographic peaks obtained were
well resolved from the solvent front and there were no interfering peaks from the
excipients. Therefore, the method is deemed to be specific.
43

2.6 CONCLUSION
A reversed phase HPLC method for the in-vitro quantitation of VRP has been
developed, validated and subsequently applied to the assessment of dosage form. The
linearity of the VRP/CBZ peak height ratio versus VRP concentration was
demonstrated. The chromatographic conditions described yielded sharp, symmetrical
peaks with a high degree of resolution. CBZ and VRP were well separated and their Rr
were approximately 5.5 and 7.5 minutes respectively. Optimisation of the analytical
method was achieved by manipulation of mobile phase composition, buffer pH, buffer
molarity, ion-pair reagent type and evaluation of a variety of HPLC columns.
The ion-pair reagents, PSA, HSA and OSA, were investigated. However, due to longer
retention times and poor equilibration of the column, these compounds were not
suitable for use in the routine analysis of VRP and were therefore not used in the final
method.
The mobile phase suggested in this method does not require any of the complicated
components and can easily be prepared.
The HPLC method developed in these studies is an improvement on the method
presented in the USP monograph for VRP, where the latter employs the addition of a
competing amine, 2-arninoheptane and acetate buffer to the mobile phase. The ion-pair
reagent may lead to shortening of the column life and the use of a volatile buffer may
result in an unstable pH. The use of an inorganic buffer, phosphate, in this method
results in a relatively stable pH for the buffer, which leads to consistent results.
The described method is simple, selective, accurate, precise, rapid, sensitive and linear.
It is appropriate for the assessment of in-vitro release and analysis of VRP in
pharmaceutical dosage forms.
44

CHAPTER THREE
FORMULATION AND ASSESSMENT OF POWDER BLENDS FOR
SUSTAINED RELEASE TABLETS
3.1 POWDER RHEOLOGY
3.1.1 Introduction
Since more than 80% of pharmaceutical products are available as solid oral dosage forms,
powder and processing technologies are important factors to be considered in the
pharmaceutical industry. Flowability and compactibility are two essential characteristics
that need prior investigation, to ensure successful tablet manufacture [108].
The ultimate specifications of a finished tablet will be a consequence of the
compressibility, adhesive/cohesive interactions and mechanical properties of the
component materials. Consequently, a poorly compactable drug will result in formulation
challenges and possibly formulation failure [109].
The importance of the flowability of a powder in the production of pharmaceutical
dosage forms is well-documented in the literature [108]. Powder flowability is influenced
by particle size, size distribution, shape, surface texture of particles, surface energy,
chemical composition, moisture content and granulation vessel geometry [ 1 08].
Numerous methods for measuring powder flowability have been developed, largely based
on an empirical understanding of the process. In practice, experimental results of
flowability determinations are not always consistent and may be hard to interpret.
However, they do give an understanding of the behaviour of powders [109, 110].
Commonly used techniques to assess flowability of powders in the pharmaceutical
industry include measurement of the angle of repose (§ 3.2.1), bulk and tapped density
determinations (§ 3.2.2) that are used to calculate Carr's compressibility index (§ 3.2.3)
and the Hausner ratio (§ 3.2.4) of a powder [108, 109]. These values are obtained from
the initial packing density (aerated density) and the final packing density obtained after
tapping the powder in a controlled and defined way (tapped density) [109].
45

Particle compactibility is defined as the ability of a powdered material to be compressed
into a tablet of specified strength. Pharmaceutical compacts are required to possess
sufficient mechanical strength to withstand normal handling and transport. The
mechanical strength of pharmaceutical compacts is characterized by the force required to
fracture a specimen across its diameter, which is usually reported as tablet hardness in the
pharmaceutical industry. The strength of a compact is a reflection of the bonding that has
occurred during compaction [108]. This relates to the type of bonds, a more complicated
concept for a mixture, the number of effective bonds, contact surface area and bond
distribution in the compact. Since virtually all tablets consist of more than one material,
the prediction of the compaction properties of mixtures from those of the individual
components is of obvious interest [108].
3.2 EXPERIMENTAL
3.2.1 Angle of Repose (AOR)
The flowability of powders was determined by measuring the angle of repose of the
blends listed in Table 3.5. The end of a funnel was placed 2 em above a flat glass plate.
Approximately 20 g of powder, the mass depended on the bulk density of the material,
was poured into the funnel. After releasing the powder from the funnel, the top of the
resulting cone reached the end of the funnel. The height of the cone, h and the diameter
of the base, d, were determined and the angle of repose, a , was calculated [ 109,1 10, 111]
using equation 3.1.
where
2h tana=
d
a = angle at the base of the cone
h =height of the cone
d = diameter of the base of the cone
Eq.3.1
46

Table 3.1 shows the relationship between the AOR and powder flow properties. It is
evident that an AOR of less than 25° is indicative of good flow properties whereas an
AOR greater than 40° reflects inadequate or poor flow. Adding a glidant may improve
the flow of blends that have an AOR of 30- 40° [112].
Table 3.1. Relationship between angle of repose, a and powder flow.
Angle of repose (a ) degrees
<25
25 -30
30-40
>40
Flow
Excellent
Good
Passable
Very poor
Alternatively, measuring the angle of the base and the length of the opposite sides of the
cone permits calculation of the AOR using equation 3.2 [112].
where
d a = arc cos [ ( ) ]
l1 + !2
a = angle at the base of the cone,
d = the diameter of the cone and
11 and l2 =the two opposite sides of the cone.
3.2.2 Bulk and Tapped density
Eq. 3.2
The aerated bulk density of the powders was determined by allowing the dispersed
powder to settle in a container under the influence of gravity alone [112]. A powder with
strong structural strength will resist collapse when dispersed in a container and will have
a low bulk density, whilst a structurally weak powder will collapse easily and have a high
bulk density [108,109]. The tapped bulk density of a blend ·is determined by tapping the
container holding the aerated sample. The structure of a cohesive powder will collapse
significantly on tapping while a weak or free-flowing powder has little scope for further
consolidation [109]. The Hausner ratio and Carr's compressibility index have been
47

developed based on this theory [108,109,113] and are used as an important tool for the
characterization properties of powders.
The bulk density of blends was determined by pouring a sample of the powder (20 g) into
a 100 ml graduated A-grade measuring glass cylinder and measuring the volume
occupied by the powder. The cylinder was lightly tapped to dislodge residual powders
from sticking to the wall of the measuring cylinder. The volume was read directly from
the cylinder and used to calculate the bulk density. In order to determine the tapped bulk
density of the powder, the measuring cylinder was tapped for 500 tap cycles after which
the volume was recorded. In all cases, the cylinder was tapped by hand from a height of
2.5 ern on a wooden bench top to attain a constant reading from the cylinder over a period
of less than 10 minutes.
The Carr's compressibility index was then calculated from the bulk and tapped densities
[1 09-111 '113' 114] 0
3.2.3 Carr's Index (CI)
Carr's compressibility index has been reported in literature as useful for the evaluation of
sustained-release and controlled-release blends [1 09-111,113, 114]. Carr's index was
calculated using equation 3.3, and Table 3.2 shows the interpretation of Carr's index for
powder flow.
Cl [ prap - pbulk J = X 100
prap Eq. 3.3
where
CI = Carr's compressibility index,
p rap = tapped density and
pbulk =bulk density.
Lower CI's are associated with low cohesiveness and greater fluidity properties. Such
properties may enhance good tablet manufacture [112]. The addition of a lubricant
enhances powder flow considerably when the CI is above 20%.
48

Table 3.2. Interpretation of Carr's index.
Carr's Index (%) Flow
5-15 Excellent
12- 16 Good
18 - 21 Fair to passable
23-35 Poor
33-38 Very poor
>40 Very very poor
3.2.4 Hausner Ratio (HR)
Hausner ratio has been reported in literature as useful for the evaluation of sustained
release and controlled-release blends [110,111,113]. The Hausner ratio was calculated
using equation 3.4 and Table 3.3 shows the interpretation of Hausner' s ratio for powder
flow.
where
HR =
p tap = tapped density,
pbulk =bulk density.
ptap
pbulk Eq. 3.4
Lower HR values ( < 1.25) are associated with good flow and values greater than 1.5 may
lead to cohesiveness of powder particles, resulting in poor flow. When HR is between
1.25 and 1.5, addition of a glidant improves powder flow [115].
49

Table 3.3. Interpretation of Hausner ratio.
Hausner Ratio
< 1.25
> 1.50
3.2.5 Kawakita analysis
Flow
Good
Poor
Powder flow properties can also be analyzed using Athy-Heckel, Kawakita and Cooper
Eaten analysis [116]. The Kawakita equation is depicted in equation 3.5.
where
P = is the applied pressure,
p p 1 - = - + c a ab
C = is the degree of volume reduction of a powder, the constant,
Eq. 3.5
A = constant, is the total degree of volume reduction for the powder bed and
b = is a constant that is inversely related to the yield strength of the particles.
The constants, a and b, can be evaluated from a plot of the ratio of P and C versus P. This
equation describes the relationship between the degree of volume reduction of the powder
column and the pressure applied to the powder [ 116, 117].
The basis for the Kawakita equation for powder compression is that particles subjected to
a compressive load in a confined space are viewed as a system in equilibrium at all stages
of compression, so that the product of the pressure volume term is a constant [116].
It has been reported [118] that the Kawakita constant, a, which quantifies the maximum
possible volume reduction, due to tapping or applied load should equal Carr's
compressibility index. Thus, the application of the Kawakita equation has no advantage
over the use of Carr's compressibility index as an indicator of possible volume reduction.
50

As the Carr's index gave usable data, the Kawakita constant was not determined in these
studies.
3.3 EXCIPIENTS
AU materials used in this study are generally recognised as safe (GRAS) and appear in
the FDA Inactive Ingredients Guide for inclusion in oral formulations [119].
3.3.1 Carbomer
Carbomers are white-coloured, low density, acidic, hygroscopic powders with a slight
odour [ 119]. They are very high molecular weight synthetic polymers of acrylic acid,
which are chemically cross-linked with either allylsucrose or allylethers or
pentaerythritol. They contain about 56%-68% of carboxylic acid (COOH) groups
calculated on the dry basis [ 119] and have a pKa of 6.0 ± 0.5 [ 120].
Cross-linked carbomer polymers are not soluble in aqueous media, but swell while linear
polymers are soluble in polar solvents such as water [119].
Carbomer polymers may be used as rate controlling agents and may enhance the control
of release properties of dosage forms at lower concentrations than competitive materials.
Carbomer polymers can form strong matrices at low concentrations due to their
inherently cross linked structure [120], which is one of the contributing factors to its
success as a rate controlling polymer.
The polar form of carbomer has a glass transition temperature of 1 05°C. However, the
glass transition temperature drops dramatically as the polymer comes into contact with
water. Plasticization of the carbomer with water causes the polymer chains to start
gyrating. As the radius of gyration becomes greater and the end to end distances increase,
the polymer swells on a macroscopic level. These polymers swell up to 1000 times their
original volume and up to ten times their original diameter in the presence of water to
form a gel, when exposed to a pH environment, controlled above its pKa [120]. ..-- .--.... ,
0 {, . -.'\ '' \'
'I It 1) \,. I ,-1 • • "' ~ •
l ,,, l ;
/
51

It is important to emphasize that as carbomers are already crosslinked, viscosity and
molecular weight are not the primary parameters controlling drug release rates, unlike in
linear, soluble matrix systems [120], such as hydroxypropyl methylcellulose (HPMC) and
sodium carboxymethylcellulose (SCMC), amongst others.
There are currently four carbomer polymers designed for oral application. These are
Carbopol® 934P NF, Carbopol®974P NF, Carbopol®971P NF and Carbopol® 710 NF.
[119,120]. In tablet formulations, carbomers may be used as dry or wet binders or as rate
controlling excipients [ 119].
3.3.2 Methacrylic Acid Copolymers
Eudragit® RS and Eudragit® RL are bio-compatible copolymers synthesized from acrylic
and methacrylic acid esters. The molecular structures of Eudragit® RS and RL differ only
in the extent of the quaternary ammonium substitutions, with Eudragit® RS showing a
lower degree of substitution than Eudragit® RL. Eudragit® RL has I 0% and Eudragit ®RS
has 5% of quartenary ammonium functional groups. The ammonium groups are present
as salts that impart pH- independent permeability of the polymers [119]. Their
permeability to water is unaffected by pH, however, water can permeate more freely into
Eudragit® RL than it can into Eudragit® RS, due to the relative hydrophilicity of the RL
copolymer. The acrylate-methacrylate polymers have been used in the preparation of
matrix tablets for oral sustained release, in tablet coating and in the microencapsulation of
drugs [121].
Methacrylic acid copolymer is a fully polymerized copolymer of methacrylic acid and an
acrylic or methacrylic ester. Three types of polymers, type A (Eudragit® L, Eudragit®
RL), type B (Eudragit® S, Eudragit® RS) and type C (Eudragit® L 30 D-55), have been
defined and these vary in their methacrylic acid ester content and solution viscosity [119].
Typically, the molecular weight of these polymers is in excess of 100 000 mass units.
Solid polymers may be used in direct compression tabletting in proportions of 10-50%
[ 119].
52

Eudragit® NE 30D is a neutral aqueous ester dispersion consisting of polymethacrylic
acid esters. The dispersions are milky-white liquids of low viscosity and have a weak
aromatic odour. This polymer is particularly suitable for granulation processes in the
manufacture of matrix tablets [122].
Eudragit® RL 30D and Eudragit® RS 30D are aqueous dispersions of copolymers of
acrylic acid and methacrylic acid esters with a low content of quaternary ammonium
groups. The dispersions contain 30% w/v polymer [ 119].
3.3.3 Hydroxypropylmethylcellulose (HPMC)
The use of HPMC (Methocel® KlOOM) in sustained-release dosage forms has been
widely reported [110, 123 - 130]. It is _a_ n.on-ionic~_n.oD.::.toxic polymer that has been used
in topical formulations, as well as in tablet manufacture. It has been used as a binder and
as a sustained release matrix-forming excipient [119]. It_is._availabJe..jn _diff~ren.Lgrades,
depending on the degree of substitution and average weight of the polymer [119].
In tablet formulations containing hydrophilic polymers such as HPMC, the release of the
active drug is controlled by the rate of formation of a partially hydrated gel layer of the
tablet surface that is formed upon contact between the polymer and aqueous gastric
media. The release rate is further controlled by the continuous formation of an additional
gel layer [124].
HPMC polymer controlled release dosage forms have been classified as swelling
controlled release systems [110,123-129]. Generally, in swelling controlled matrix
systems, there are two major factors that control the rate of release of drug from matrix.
The factors considered to be important are the rate of aque.o~di.um infiltration into
thLmatrix. and the suhse.qu.en.t.r.elaxatio.Il-Of the polymer, resulting in either hydration or
gelation and swelling of the polymer, respectively. As a result of these simultaneous
processes, two fronts are evident, .~~ (glassy polymer/gel interface) and an
erocU.n.&-fr..QD.L(.gel/medium interface). The distance between the two fronts depends on the
relative rates at which the swelling and eroding fronts move in relation to each other and
is termed the diffusion layer [ 125].
53

3.3.4 Ethylcellulose
Ethylcellulose is an ethyl ether of cellulose, consisting of ~-anhydroglucose units joined
together to form long chain polymers [119]. The main use of ethylcellulose in oral
formulations is as a hydrophilic coating agent for tablets and granules. Ethylcellulose
coatings are used to modify drug release, to mask unpleasant tastes, encapsulate drugs
and to improve the overall stability of formulations. Modified-release tablet formulations
may also be produced using ethylcellulose as a matrix forming material. Ethylcellulose
produces hard tablets with low friability [114, 119].
Surelease® E-7-19010, an aqueous ethylcellulose dispersion, was used as the granulating
fluid in wet granulation formulations. It contains approximately 24.9% w/v total solid
content dispersed in an ammonium hydroxide vehicle, with dibutyl sebacate as a
plasticizer and oleic acid as a stabilizer [131]. It is a stable system, requiring no
preparation or manipulation before use, although dilution or warming of the liquid may
be necessary, depending on the desired application.
Surelease® E-7-19010 was diluted to 15% w/v dispersion prior to use, by adding distilled
water while stirring [131].
3.3.5 Dibasic Calcium Phosphate (DCP)
DCP is widely used as a diluent or filler due to its low hygroscopicity, excellent flow
characteristics, compatibilities, low cost and physical and chemical stability. DCP is
abrasive and a lubricant such as magnesium stearate is required for successful tableting.
Two main particle-size grades of dibasic calcium phosphate dihydrate are used by the
pharmaceutical industry. The milled material is used in wet-granulation and the coarse
grade material is used in direct-compression formulations [119]. The coarse-grade was
used in direct-compression formulae in this study.
3.3.6 Microcrystalline Cellulose (MCC)
MCC is purified, partially depolymerized cellulose that occurs as white, odourless,
tasteless, crystalline powder, composed of particles of different sizes and moisture grades
54

that have different properties and applications [119]. MCC is widely used as a diluent in
oral tablet and capsules formulations prepared by either wet-granulation or direct
compression processes [119]. Emcocel® 90M has a mean particle size of 91 1..1.m and a
moisture content less than 5%. It has an angle of repose of 34.4 °, a bulk and tapped
density of 0.29g/cm3 and 0.35g/cm3, respectively [119] and was used as a diluent in
combination with DCP and lactose monohydrate.
3.3.7 Lactose Monohydrate
Lactose occurs as a white to off-white crystalline powder. It is odourless and sweet
tasting and is widely used as filler or diluent in tablets and capsules. Generally, the grade
of lactose chosen is dependent on the type of dosage form being developed. Direct
compression grades for example, are often used to carry small amounts of drug [119].
Direct-compression grades of lactose are more fluid and more compressible than
crystalline or powdered lactose and are generally composed of spray-dried lactose, which
contains specially prepared pure a.- lactose monohydrate along with a small amount of
amorphous lactose. Various lactose grades are commercially available that have different
physical properties such as particle size distribution and flow characteristics [ 119].
3.3.8 1lalc
Talc is a very fine, white to greyish-white powder. It is commonly referred to as hydrous
magnesium silicate and the composition of talc may vary depending on the geographical
source of the material used. It is used in solid oral dosage formulations as a glidant and
tablet lubricant at 1-10% w/w levels [ 119].
3.3.9 Magnesium Stearate
Magnesium stearate is a mixture of magnesium and a variety of organic acids that
consists chiefly of variable proportions of magnesium stearate and palmitate. It is
primarily used as a lubricant in capsule and tablet manufacturing at concentrations of
between 0.25 and 0.5% w/w. It is hydrophobic and may retard the dissolution of a drug
55

from a solid dosage form and therefore, the lowest possible concentration should be used
in formulations [ 119].
3.4 FORMULATION COMPOSITION
Different formulations were prepared by either dry compression or wet granulation
method. Formulations VRPOOI-VRP023 were prepared and the powder blends or
granules were subjected to a variety of tests prior to tableting. A summary of the
formulation composition is listed in Table 3.4.
Tablets from batches VRP001-VRP019 were prepared by direct compression (DC) and
tablets from batches VRP020-VRP023 were prepared by a wet granulation (WG) method.
56

Table 3.4. Formulation of VRPOOl - VRP023.
FORMULATION(% w/w)
INGREDIENTS VRPOOl VRP002 VRP003 VRP004 VRPOOS VRP006 VRP007 VRP008 VRP009 VRPOIO VRPOll VRP012 VRP013
VRP 33 33 33 33 33 33 33 33 33 33 33 33 33
Carbopol® 974P NF 10 15 10 15 10 10 10 10 10
Carbopol® 971P NF 10 15 10 15
Eudragit® RS PO 7.5 7.5
Eudragit® RL PO 7.5
Eudragit® RS 30D
Eudragit® NE 30D
Methocel® K 1OOM 10 10 10 10
Ethocel® 1 OPF 5 5 7.5
Surelease®
Emcompress® 24.5
Lactose 56 51 56 51 46 41 46 41 24.5 51 48.5 48.5 41
Talc 0.5 0.5 0.5 0.5 0.5 0.5 0.5 0.5 0.5 0.5 0.5 0.5 0.5
M g stearate 0.5 0.5 0.5 0.5 0.5 0.5 0.5 0.5 0.5 0.5 0.5 0.5 0.5
57

Table 3.4 continued.
FORMULATION(% w/w)
INGREDIENTS VRP014 VRP015 VRP016 VRP017 VRP018 VRP019 VRP020 VRP021 VRP022 VRP023
VRP 33 33 33 33 33 33 33 33 33 33
Carbopol® 974P NF 10 10 10 7.5 7.5 10 10 10 10
Eudragit® RS PO 15 15 7.5 7.5 20 7.5 13.5 13.5
Eudragit® RS 30D 20ml
Eudragit® NE 30D 20ml
Methoce1® K lOOM 10
Ethocel® 1 OPF 5 7.5 7.5 7.5 7.5 20 16 16
Sure lease® E-7-1901 0 5ml lOml 20ml
Emcompress® 41 20 20 20 20
Emcocel® 41 20 20 10 10
Lactose 46 30 31 31
Talc 0.5 0.5 0.5 0.5 0.5 0.5
Magnesium stearate 0.5 0.5 0.5 0.5 0.5 0.5 0.5 0.5 0.5 0 .5
58

3.5 RESULTS AND DISCUSSION
The powders or granules of the different formulations were all tested and the angle of
repose, bulk density, tapped bulk density, Carr's compressibility index and Hausner's
ratio determined. A summary of the results of these determinations is listed in Table 3.5.
The results of the angle of repose and compressibility index (%) ranged between 26.00° ±
2.64 to 36.16° ± 2.49 and 8.90 ± 3.44 to 35.56 ± 3.00, respectively. The results of bulk
and tapped density ranged from 0.57 ± 1.25 to 0.74 ± 2.08 and 0.76 ± 2.22 to 0.98 ± 3.10,
respectively. The results of angle of repose indicate good flow properties of all the blends
except for tablets from batches VRP001- VRP003 and VRP009-VRPOll. This was
further supported by lower compressibility and Hauser's ratios for all the blends except
for the blends that initially did not show good flowability in terms of their angle of
repose. All determined results indicate that the blends possessed satisfactory flow
properties and compressibility index and hence, tablet manufacture may be considered
feasible. Tablets from batches VRP001 -VRP003 and VRP009-VRP011, which
theoretically would produce tablets of non-uniform weight due to differences in fill
weight when the powder flows into the tablet die cavity, were the exception in terms of
the results of these tests.
59

Table 3.5. Results of tests on powder blends or granules for formulations VRPOO I - VRP023.
Formulations Angle of Repose (0) LBD (glml) TBD (glml) CI(%) HR
VRPOOI 32.64 ± 5.45 0.64 ± 1.79 0.88 ± 2.10 27.27 ± 3.37 1.38 ± 1.07
VRP002 34.12 ± 2.04 0.61 ± 0.90 0.92 ± 2.07 33.69 ± 3.44 1.51 ± 1.34
VRP003 33.78 ± 2.52 0.58 ± 1.04 0.89 ± 2.40 34.83 ± 2.06 1.22 ± 1.10
VRP004 29.16 ± 3.88 0.73 ± 1.56 0.89 ± 3.06 17.98 ± 2.00 1.17 ± 2.06
VRP005 27.50 ± 1.37 0.71 ± 1.99 0.83 ± 1.21 14.45 ± 3.08 1.17±1.76
VRP006 29.44 ± 2.00 0.59 ± 1.43 0.79 ± 1.08 25.32 ± 3.15 1.34 ± 1.54
VRP007 30.26 ± 1.25 0.66 ± 2.88 0.77 ± 1.00 14.29 ± 2.11 1.17 ± 1.44
VRP008 29.76 ± 1.23 0.67 ± 3.71 0.78 ± 3.02 14.10 ± 3.66 1.16 ± 1.74
VRP009 36.16 ± 2.49 0.58 ±4.89 0.90 ± 3.12 35.56 ± 3.00 1.55 ± 0.89
VRP010 33.74 ± 1.87 0.68 ± 1.36 0.87 ± 2.07 21.83 ± 3.96 1.28 ± 2.21
VRPOll 32.22 ± 1.55 0.71 ± 2.11 0.98 ± 3.10 27.55 ± 3.55 1.38 ± 1.67
VRP012 28.11 ± 1.37 0.63 ± 2.23 0.79 ± 1.05 20.25 ± 3.82 1.25 ± 0.88
VRP013 26.00±2.64 0.57 ± 1.25 0.77 ± 2.04 25.97 ± 2.37 1.35 ± 0.65
VRP014 29.43 ± 0.98 0.72 ± 3.01 0.82 ± 3.01 24.10 ± 2.09 1.14 ± 0.89
VRP015 27.56 ± 1.77 0.63 ± 3.74 0.83 ± 1.00 24.10 ± 3.57 1.32 ± 0.65
VRP016 30.33 ± 1.62 0.66 ± 3.01 0.79 ± 1.01 16.46 ± 2.33 1.12±1.11
NB: all values are expressed as mean ± % RSD
60

Table 3.5 continued.
Fonnulations Angle of Repose (0) LBD (glml) TBD (glml) Cl(%) HR
VRP017 26.26 ± 1.84 0.71 ± 1.04 0.85 ± 2.05 16.47 ± 3.21 1.20 ± 2.34
VRP018 27.45 ± 3.05 0.69 ±2.04 0.78 ± 2.12 11.54 ± 3.67 1.13 ± 3.44
VRP019 26.98 ± 2.04 0.73 ± 3.61 0.79 ± 3.00 8.90 ± 3.44 1.10 ± 2.21
VRP020 27.88 ± 1.82 0.74 ± 2.08 0.84 ± 3.06 11.90 ± 2.05 1.14±4.76
VRP021 27.16 ± 1.04 0.68 ± 4.03 0.79 ± 2.11 14.18 ± 2.32 1.16 ± 2.43
VRP022 28.22 ± 2.02 0.65 ± 3.13 0.76 ± 2.22 14.47 ± 2.04 1.17 ± 2.23
VRP023 30.67 ± 1.52 0.66 ± 2.01 0.76 ± 3.01 12.59 ± 2.41 1.15 ± 2.45
NB: all values are expressed as mean ± % RSD
61

3.5 CONCLUSION
A dosage form of well defined mechanical strength is produced when powders or
granules are compacted. Therefore, a thorough knowledge of powder science is of great
importance in formulation studies. The results of testing reveal that flowability and
compressibility are two critical factors that are essential in ensuring successful tableting.
As a result, granulation procedures (WG) seemed to produce the most appropriate
materials for compaction and thus all subsequent batches (VRPO 19-VRP023) were
prepared using this technique.
Furthermore, this study highlighted the vital importance of knowing the behaviour of
powders or granules well in advance before attempting to tablet these batches.
62

CHAPTER FOUR
FORMULATION AND ASSESSMENT OF SUSTAINED RELEASE
MATRIX TABLETS
4.1 SUSTAINED DRUG DELIVERY
4.1.1 Introduction
The population of patients with chronic conditions or complications of disease is
increasing. These situations necessitate patients having to take drugs for a long period
and or taking a number of different medicines simultaneously. This in turn can lead to an
increase in non-compliance by the patient. Lack of compliance tends to be serious when
using drugs with short biological half-lives because they must be taken more frequently
than long half-life compounds, in order to maintain therapeutic blood levels. One method
to solve such problems is to find a dosage form capable of releasing the drug gradually
over a specific period of time in a controlled manner [132].
There is little or no control over release of drug from immediate-release (IR) dosage
forms, which often results in constantly changing, unpredictable fluctuating blood levels.
In addition, blood level concentrations may fall below the minimum effective
concentration (MEC) or above the maximum therapeutic concentration (MTC) resulting
in ineffective therapy or unwanted or untoward side effects [133].
The oral route is the preferred route of administration for drug delivery as it offers several
advantages over other potential routes due to the potential for better patient compliance
and the flexibility in designing dosage forms [134-136].
VRP is one of many drugs that may be used in the chronic treatment of hypertension and
angina. Successful treatment requires the maintenance of blood pressure at normal
physiological levels, for which a constant and uniform supply of drug is necessary [137].
VRP has a relatively short half-life [2, 7] and the usual oral dosage regimen is 80mg
administered 3 times a day [2, 19, 20] . To reduce the frequency of administration and
improve patient compliance, a sustained release formulation of VRP may be preferable to
63

IR products. The drug has a pKa value of 8.6 [9], is sparingly soluble in water [9, 10] and
is administered as a racemic mixture of the R and S enantiomers [60, 138], hence
judicious selection of release-retarding excipients is necessary to achieve constant in-vivo
release rates and subsequent absorption rates.
4.1.2 Oral Sustained Release Dosage Forms
Various polymers have gained importance in the pharmaceutical industry as both drug
coatings and vehicles of drug carriage that either protect an active agent during its
passage through the body until it is released or by controlling its release, such that a
constant release rate is achieved. A few commonly used technologies cited in literature
include reservoir, osmotic pump and matrix systems [139].
4.1.2.1 Reservoir Devices
A reservoir device approach to control drug release relies on the encapsulation of a drug
within a polymer film or coating. Film coating [114] and micro-encapsulation [140], are
both ideal methods for the production of reservoir type sustained-release dosage forms.
Figure 4.1 depicts a schematic representation of the drug release process from a diffusion
based reservoir tablet at different times. Important considerations include the use of
different additives, polymer functionality and porosity [139]. Of all aspects that need to
be considered, the choice of polymer is an important consideration [139, 141].
In these systems, the drug is encapsulated by a high molecular weight polymer (A). In
order for the drug to be released from the reservoir, partitioning from the reservoir into
the membrane followed by diffusion through the membrane must first occur. Subsequent
partitioning from the membrane in to the dissolution fluids (B) completes the process.
64

A
. . . . . . . . . . . . . . . . . . . . . . . . . . . . . . .. . . . . ·. . . . ... . . . . . . . . . . . . . . . . . . . . . . . . . . . . • • • • • • • • • ~+------ Film . . . . . . . .... . . . . . . . • • • • • • • • • • • coatlng . . . . . . . . . .
Reservoir Drug particle
B • . .
• . . •
•
• . .
Figure 4.1. Schematic illustration of the mechanism of drug release from a diffusion-based reservoir tablet.
4.1.2.2 Osmotic Devices
Osmotic pump devices are similar to reservoir devices but contain an osmotic agent that
generates a suitable osmotic pressure, contained in a tablet and coated with a semi
permeable membrane [139,142]. A small orifice is drilled through the coating by laser or
high speed mechanical drill. This system is in essence a coated tablet with an aperture
that is exposed to an aqueous environment. A soluble drug or the osmotic agent within
the tablet facilitates water uptake through the semi-permeable coating, resulting in the
formation of a saturated aqueous drug solution within the device. Hydrostatic pressure is
subsequently generated within the device, and the active ingredient is forced out of the
device through the orifice that is designed to minimize solute diffusion, whilst preventing
the build-up of a hydrostatic pressure head that has the effect of decreasing the osmotic
pressure and changing the dimensions of the device [139, 143-45].
Figure 4.2 depicts the mechanism of drug release from an osmotic-controlled release
delivery system designed as a single-unit tablet with a single release orifice. The drug is
initially encapsulated within a semi-permeable membrane (A). Following the uptake of
water into the device, a saturated solution is formed within the device resulting in the
build up of pressure which will force the solution out of the device in to the surrounding
medium.
65

A
Drug Layer
= drug dissolution
= solvent
B
. .. . . .......
Push Layer
Figure 4.2. Schematic illustration of the mechanism of drug release from an osmotic-controlled release system designed as a single-unit tablet (A) and as a Push-Pull unit (B).
The solubility of a drug in water plays a critical role in the functioning of osmotic pump
delivery systems. Typically, the solubility of a drug delivered by these pumps should be
at least 10-15% (w/v). The drug is pumped out of the system through the orifice at a
controlled rate, which is the product of influx flow rate of water into the core and
saturation solubility of the drug as shown in equation 4.1 .
where
!!!!!____ = ( !!:!___) Cs dt dt
dm = drug flow rate through an orifice, dt dv
= flow rate of water through an orifice and dt Cs = saturation concentration.
Eq. 4.1
In principle, these delivery systems release drug at a zero order rate until the
concentration of the osmotically active salt or drug in the system decreases to below its
saturation solubility concentration. Deviation from zero order release occurs for the latter
part of the in-vivo life of the product [143]. Primarily, osmotic systems are suitable for
water soluble drugs only and sparingly soluble drugs pose formulation challenges
66

[139,144,145], such as unexpected or uncontrolled release and inefficient drug
dissolution [144].
To overcome this limitation of osmotic devices, an OROS® Push-Pul1101
osmotic system
has been introduced to deliver insoluble drugs [145]. The Push- PullTM system (Figure 4.2,
B) comprises a bilayer or trilayer tablet core consisting of one push layer and one or more
drug layers. The poorly soluble drug is separated from the osmotic agents and suspending
agents by a flexible barrier. The push layer contains the osmotic agent(s) and/or water
swellable polymers [145]. A semi-permeable membrane surrounds the tablet core as in
the simple osmotic device and an orifice drilled in it on the drug layer side.
4.1.2.3 Matrix Devices
Matrix devices are possibly the most common devices used for controlling the rate of
release of drugs. Their abundance is more than likely due to their ease of manufacture
compared to reservoir devices and/or osmotic devices. In addition, there is little danger of
an accidental high dose due to collapse of delivery system. Monolithic devices, usually
consist of an homogeneously dissolved or dispersed therapeutic agent within the polymer
matrix, which is then compressed into a tablet/dosage form [139].
Formulation factors, through which the release rate from a matrix system can be modified
are by control of the amount of drug in the matrix, the porosity of the release unit, the
length and tortuosity of the pores within the release unit, the size of the release unit and
the solubility of the drug, which regulates the concentration gradient [141 ].
Matrix drug delivery systems are usually of two types, viz. diffusionlswellable systems or
dissolution systems. In diffusion controlled systems, drug release involves solvent
penetration, hydration and swelling of the matrix followed by diffusion of the drug
molecules from the hydrated layer of the matrix to the surrounding bulk solution. The
most common examples of excipients used in matrix systems to sustain/prolong or
control drug release include cellulose ethers (e.g., HPMC), methacrylic acid copolymers
and carbomers [135]. Figure 4.3 depicts a schematic mechanism of drug release from a
67

non-eroding diffusion-controlled matrix tablet at different times during dissolution
testing.
A B . . . . . . . . . • • . . . . . . . . .. . . . . . . . . . . . . . . . . . . . . . . . . . . . . . . . . . . . . . . . . . . . . . . . . . . . . . . . . . . . . . . . . . . . . . . . . . . . Matrix Drug
particle
c . . . . . . . . . . .. • .. • . . . • . . • . . .
•• . . . • •
•
: ..... •
. . . .
• • . •
1-
• • • •• . .. .. •. •• • . .... - . . . . ·.· . . . . . . . .....
Figure 4.3. Schematic illustration of the mechanism of drug release from a diffusion-controlled matrix tablet.
Initially (A), drug particles located at the surface of the release unit are dissolved and
released into the dissolution media (B). As the drug is depleted from the surface of the
dosage form, a receding dissolution front is set up within the device (C). Consequently,
as the diffusion distance within the dosage form increases the release rate slows down.
Dissolution control systems alter release rates by control of dissolution/erosion of the
matrix and hence the attainment of constant rate of drug delivery is easily achieved.
Figure 4.4 depicts a schematic of the mechanism of drug release from a
dissolution/erosion tablet at different times. Sodium carboxymethylcellulose (SCMC) and
natural gums have been the most widely used polymers in such dosage forms [135].
68

A
• . . . . . . . . • • • ••
• •
Erodable matrix
• . . •
•
. . . . .
Drug particle
.
B
. • • • . • . • •
• • • • •
• • • . .
c . . . • .
• • . . . • • . . •
• . . . . • • • . • • • • • • • • • . . • . .
Figure 4.4. Schematic illustration of the mechanism of drug release from an erodable tablet.
. . . • •
• . . • . . . . •
In erosion-controlled systems the rate of drug release is controlled by the rate of erosion
of the matrix material in which the drug is dispersed. The matrix is normally a tablet and
initially (A) drug particles located at the surface of the release unit are dissolved and
thereafter, the matrix undergoes erosion. The erosion process involves the continuous
liberation of both drug and matrix excipients from the surface of the tablet (B). Further
erosion of the dosage form (C) results in a continuous reduction in tablet weight during
the course of the release process.
An important stage in the formulation process of a matrix system is the selection of a
suitable polymeric material as the matrix forming component, due to the fact that the
design of these systems has focused on the concept of polymeric hydration to protect the
tablet from rapid disintegration and dissolution in order to delay drug release. Various
types of polymers with different sol-gel transitions have been investigated to develop
swellable delivery systems. Water penetration capacity, polymer swelling rate, drug
dissolution and matrix erosion are the major factors that determine gel layer thickness,
which is capable of preventing matrix disintegration and further rapid water penetration
[134] .
69

4.2 EXPERIMENT
4.2.1 Proposed Evaluation Design
The tablet formulations were prepared by either direct compression or wet granulation
using Carbopol® 974 P NF as the primary matrix polymer for the DC products and either
Surelease® E-7-19010 or Eudragit® NE 30D as the granulating fluids for WG. The
success of the method of manufacture was determined using comparative dissolution
testing of the TEST products versus the commercially available product, Isoptin® SR 240
mg. In addition, physical characteristics such as weight, content uniformity, crushing
strength, tensile strength in addition to friability and water uptake studies were
performed. The suitability of the granules/powder blend in terms of powder properties
such as the angle of repose, bulk density, tapped density, Carr's compressibility index
and Hausner's ratio were assessed and have been reported in § 3.2.1, § 3.2.2, § 3.2.3 and
§ 3.2.4.
4.2.2 Preliminary Studies
Single-unit and multiple-unit monolithic matrix tablets of 7 mm and 11 mm in diameter
were manufactured. The active ingredient VRP was obtained from Aspen-Pharmacare
(Port Elizabeth, South Africa) and was used as the model drug for these investigations.
The other excipients were sourced from different manufacturing companies and are listed
in Table 4.1.
70

Table 4.1. Excipients used in formulation studies.
EXCIPIENTS
Verapamil hydrochloride
Carbo mer
Hydroxypropylmethylcellulose
Ammonio methacrylate
Ammonio methacrylate
Dibasic calcium phosphate USP/Ph.Eur/.JP/BP/
Microcrystalline cellulose
Ethylcellulose NF
Ethylcellulose dispersion
Lactose monohydrate USP/NF/BP/EP/JP
Talc
Magnesium stearate
MARKET/TRADE NAME
Veraparnil HCL
Carbopol® 9711974 P NF
Methocel® KlOOM
Eudragit® RS /RL PO
Eudragit® RS 1NE 30D
Emcompress®
Emcocel® 90M
Ethocel® 10 FP
Sure lease ® E-7 -19010
Super Tab®
Talc
Magnesium stearate
MANUFACTURER/DONOR
Aspen Pharmacare, SA
Noveon, Inc., Brecksville, Cleveland, USA
Colocorn® LTD, Dartford, Kent, UK
Rohm Pharma Polymers, Darmstadt, GmBH
Rohm Pharma Polymers, Darmstadt, GmBH
Penwest Pharmaceutical Co., Mendel, UK
Penwest Pharmaceutical Co., Mendel, UK
Dow Chemical Co., Michigan, USA
Colocorn® LTD, Dartford, Kent,UK
Lactose Co. Hawera, NZ
Aspen Pharmacare, SA
Aspen Pharmacare, SA
71

4.2.3 Preparation of the Sustained-Release Test Formulation
Tablets were manufactured by either direct compression or wet granulation procedures.
All batches were subjected to testing and a summary of the results for each manufactured
batch including observations made during the tabletting process are shown in appendix 1.
An example of a typical executed batch manufacturing record used to record the
manufacturing process for all batches produced either by direct compression or wet
granulation are included in appendix 2 and 3, respectively. Formulations prepared with
different drug/polymer ratios are shown in § 3.4 and Table 3.4. Prior to tabletting, powder
flow properties were assessed in order to ensure that all blends possessed good flow
properties to prevent non-uniform tablet production.
4.2.4 Method of Manufacture
4.2.4.1 Direct Compression
The simplicity of the direct compression process has positioned it as an ideal starting
procedure for tablet manufacture and was used initially in these studies. The initial direct
compression formula for VRP is presented in Table 4.2.
Table 4.2. Direct compression formula of tablet batch VRPOOl.
Formula % (w/w)
Verapamil hydrochloride 33.0
Carbopol® 974P NF 10.0
Lactose monohydrate 56.0
Talc 0.5
Magnesium stearate 0.5
The batches of tablets that were manufactured using direct compression techniques were
VRPOOl to VRP019. The following procedure was adopted in the manufacture of batch
72

VRP001and all other DC batches followed a similar process with minor modifications
where appropriate.
4.2.4.1.1 Direct Manufacturing Procedure
All components, except for the magnesium stearate and talc were individually weighed
using a top-loading electronic balance Model PM 4600 (Mettler, Zurich, Switzerland),
screened (mesh size 20) and blended in a cube blender rotating at 100 rpm for 20
minutes, at a horizontal angle. Magnesium stearate and talc were then weighed, screened
(mesh size 40) and added to the mixture. The blending process was continued for a
further 3 minutes. A schematic diagram depicting this process is shown in Figure 4.5.
The powder blend was fed from a hopper and tablets were prepared on a 16-station rotary
press (Manesty® B3B, England) fitted with 11 mm concave punches. Where necessary,
die cavities were blocked with a solid teflon disc to facilitate the preparation of small
batches. The target weight and hardness of the tablets were 720mg and 1 00-140N (1 0 -
14Kp) respectively. Tablets were de-dusted using a vacuum through a sieve and analyzed
after 24 hours.
Batches VRPOOl - VRP010 were compressed on the rotary press and batches VRPOll -
VRP019 were tabletted using a single punch tablet press (Manesty® F3, England) to
prepare tablets of 7 mm diameter. The breaking load of the 7 mm diameter tablets was
80 -110 N (8.0-11.5 Kp) and the target tablet weight was 250 mg.
73

VRP
Carbopol® 974P NF Lactose Talc Magnesium stearate
Magnesium stearate Talc sieve mesh
size= 44
sieve mesh size = 20
1 f--/ __ --(/
Cube blender: 1 OOrpm, 20minutes
~-----Yv
1 ,__/ __ __./
Cube blender: 1 OOrpm, 3minutes
'--------Y/
Figure 4.5. A general schematic for direct compression of VRP tablets.
74

4.2.4.2 Wet Granulation
Wet granulation is a widely applicable and acceptable method of tablet manufacture
involving weighing and sieving of dry powders, blending with an appropriate granulating
fluid, screening the damp mass, followed by drying and re-screening of the dry granules.
The lubricant is added in a similar way to that in the DC method and the granules are
finally compressed into tablets. Table 4.3 and Table 4.4 depict the wet granulation
formulae of tablet batch VRP021, in which Surelease® E-7-19010 was used as the
granulating fluid and tablet batch VRP023, in which Eudragit® NE 30D dispersion was
the granulating fluid, respectively. Figure 4.6 depicts a schematic diagram of the wet
granulation method of manufacture used in these studies.
Table 4.3. Wet granulation formula of tablet batch VRP021.
Ingredients % (w/w)
(1) VRP
Carbopol® 974P NF
Eudragit® RS
Emcocel® 90M
(2) Surelease® E-7-1901 0
(3) Carbopol® 974P NF
Eudragit® RS
Emcocel® 90M
Emcompress®
( 4) Magnesium stearate
33.0
5.0
7.5
10.0
20.0ml
5.0
6.0
10.0
20.0
0.5
75

Table 4.4. Wet granulation formula of tablet batch VRP023.
Ingredients % (w/w)
(1) VRP 33.0
Carbopol® 974P NF 5.0
Ethocel 10.0
(2) Eudragit® NE 30D 20.0 ml
(3) Carbopol® 974P NF 5.0
Ethocel 6.0
Emcocel® 90M 10.0
Emcompress® 20.0
(4) Magnesium stearate 0.5
The batches of tablets that were manufactured using a wet granulation method were
VRP020 to VRP023. The following description refers primarily to the manufacture of
batch VRP021 for the formulation presented in Table 4.3. However, a similar procedure
was used for the manufacture of batch VRP023.
4.2.4.2.1 Wet Granulation Procedure
The sustained-release test formulations were prepared by blending VRP, Carbopol® 974P
NF, Eudragit® RS and Emcocel® 90M (1 ). The powders were weighed separately using a
top-loading electronic balance Model PM 4600 (Mettler, Zurich, Switzerland), screened
(mesh screen no.20) and granulated with Surelease® E-7-19010 (2), using a Kenwood
planetary mixer (Kenwood, UK) on setting 1. Sure lease® E-7 -19010 dispersion was
diluted to 15% as per manufacture's recommendations. The granulate was then passed
through a sieve (mesh screen no. 20) using an oscillating granulator (Erwerka, GmbH,
Germany) set at 50 rpm. The granules were dried in an oven maintained at 60°C, for 12
hours, after which, they were re-screened (mesh screen no. 20). The weight of the granule
mass was recorded. Carbopol® 974P NF, Eudragit® RS, Emcompress® and Emcocel®
76

90M (3), was weighed, screened (mesh screen no.20) and blended with the granules in a
1 kg capacity cube blender set at a horizontal angle. Blending was effected at 100 rpm for
30 minutes to ensure adequate mixing. The mixture was lubricated with magnesium
stearate (4), which was sieved (mesh screen no. 40) and added to the mixture, which was
blended for a further 3 minutes. The blend was fed from a hopper and tablets were
prepared on a single punch tablet machine (Manesty® F3, England) as presented in the
schematic diagram in Figure 4.5. A set of tablet punches with flat surfaces was used to
prepare tablets with a 7 mm diameter.
After compression, the tablets produced by both dry and wet granulation methods were
evaluated for weight and content uniformity, crushing strength, tensile strength, friability,
swelling index and erosion. The mini-tablets prepared on a single tablet machine were
enclosed in a size 00 capsule prior to dissolution testing and liquid uptake studies.
77

VRP
Carbopol® 974P NF
Eudragit® RS
Emcocel® 90M
oscillating sieve: mesh size = 20
~ /
cube blender: 1 OOrpm, 20minutes
~ /
cube blender: 1 OOrpm, 3 minutes
~ ---;;::
/
/
/
v
sieve mesh size= 20
Dry a11: 40°C 12 hours
sieve mesh size =20
sieve mesh size= 44
Figure 4.6. A general schematic for wet granulation of VRP tablets.
Surelease®-E-7-19010 dispersion
Planetary mixer: speed 1
/
oscillating sieve: mesh size=20
Carbopol® 974P NF Eudragit® RS Emcocel® 90M Emcompress®
Magnesium stearate
78

4.2.5 In-Vitro Dissolution Studies
In- vitro dissolution testing has been recognized as an important quality control test for
drug products because of its potential association with drug bioavailability [146, 147].
The FDA recommends the use of dissolution as a quality control procedure to ensure lot
to-lot uniformity, to detect manufacturing and/or process variables that could result in
variation of product bioavailability, if the test is discriminatory [146].
Furthermore, it can also be employed as a surrogate for assessment of bioequivalence
under certain conditions. In view of the significance of dissolution testing, it is therefore
essential to investigate drug release characteristics from pharmaceutical preparations. In
the development of oral controlled-release products, an ethical or proprietary product,
which has been available on the market for some time and that has an established safety
and efficacy profile in clinical use is usually selected as a reference. The generic
preparation is always formulated so that its dissolution profile is as similar as possible to
that of the proprietary product prior to in-vivo investigations [ 14 7].
Costa and Lobo [148] described dissolution as a process by which a solid of only fair
solubility characteristics will enter into solution. The earliest reference to dissolution was
made by Noyes-Whitney in 1897 [ 149], and it was suggested that the dissolution rate of
solid substances was determined by the diffusion rate of drug through a very thin layer of
saturated solution that forms instantaneously around a solid particle.
Dissolution is the process whereby a solid particle immersed in a liquid undergoes two
consecutive steps. Initially, dissolution of the solid at an interface occurs, forming a
stagnant layer (or film) with a specific thickness (h) around that particle. Further
dissolution results in diffusion of the solute molecules from this stagnant layer to the bulk
of the dissolution fluid. The first step is almost instantaneous, but the second is much
slower and often becomes the rate limiting step in dissolution. The Noyes-Whitney
equation describing dissolution is shown as equation 4.2 and a different version in
equation 4.3.
79
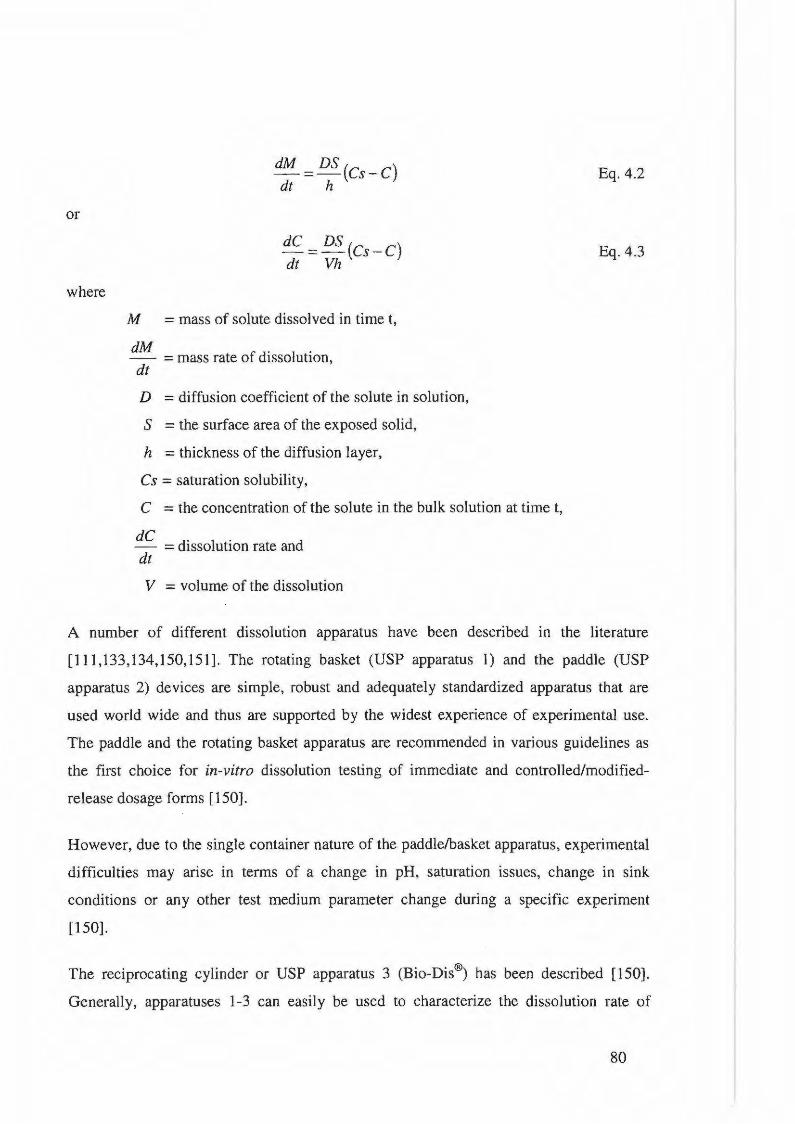
or
where
M = mass of solute dissolved in timet,
dM fd' 1 . -- =mass rate o 1sso ut10n, dt
D = diffusion coefficient of the solute in solution,
S = the surface area of the exposed solid,
h =thickness of the diffusion layer,
Cs = saturation solubility,
C = the concentration of the solute in the bulk solution at time t,
dC d' 1 . d - = 1sso ut10n rate an dt
V = volume of the dissolution
Eq. 4.2
Eq.4.3
A number of different dissolution apparatus have been described in the literature
[111,133,134,150,151]. The rotating basket (USP apparatus 1) and the paddle (USP
apparatus 2) devices are simple, robust and adequately standardized apparatus that are
used world wide and thus are supported by the widest experience of experimental use.
The paddle and the rotating basket apparatus are recommended in various guidelines as
the first choice for in-vitro dissolution testing of immediate and controlled/modified
release dosage forms [ 150].
However, due to the single container nature of the paddle/basket apparatus, experimental
difficulties may arise in terms of a change in pH, saturation issues, change in sink
conditions or any other test medium parameter change during a specific experiment
[150].
The reciprocating cylinder or USP apparatus 3 (Bio-Dis®) has been described [150].
Generally, apparatuses 1-3 can easily be used to characterize the dissolution rate of
80

almost any drug product. If a drug product cannot be accommodated by one of the
apparatus described above, alternative models or appropriate modifications to these
apparatus may be developed. However, superiority of the alternative method or the
modification must be shown when compared to the well established and standardized
equipment [ 150].
The Bio-Dis® dissolution apparatus has had a relatively short history since its proposal
for use as a apparatus by Borst et al [151] for drug release testing of extended-release
products and as an alternative to the basket (USP apparatus 1) and paddle (USP apparatus
2).
The development of USP apparatus 3 was based on the recognition of the need to
establish potential in-vitro in-vivo correlations and the fact that the dissolution results
obtained with USP apparatus 1 and 2 may be significantly affected by shaft wobble,
location, centering and coning [151]. USP apparatus 3 offers the advantages of
mimicking in part the changes in the physicochemical environment experienced by
products in the gastro-intestinal tract [151].
4.2.5.1 USP Apparatus 1 (Basket)
The dissolution behaviour of VRP from both commercially available and
extemporaneously prepared dosage forms was assessed using a fully automated Hanson
Research SR 8 PLUS (Chartsworth, CA, USA) dissolution apparatus fitted with an
Autoplus™ Multifill™ and Maximizer Syringe Fraction Collector, respectively. The
release studies were carried out at 37±0.5°C using USP Apparatus 1 fitted with 8 USP
baskets (40-mesh) rotated at 100 rpm. All dosage forms were placed in the baskets that
were then lowered into 900 ml of degassed phosphate buffer (0.1 M, pH 7.4). The percent
drug released from tablets after a 22-hour tests was determined. Samples (2 ml) were
withdrawn and replaced with 2 ml of fresh medium that has automatically been filtered
through a 1 0 )..lm membrane. Samples were collected at predetermined time intervals after
1, 2, 6, 10, 14 and 22 hours. A summary of the dissolution test conditions for this study is
depicted in Table 4.5.
81

Prior to use, the performance of the Hanson dissolution apparatus was verified by
calibration with USP prednisone and salicylic acid calibrator tablets.
4.2.5.2 USP Apparatus 3 (Bio-Dis®)
In addition, a VanKel® Bio-Dis® dissolution tester (VanKel® Industries, New Jersey,
USA) was also used for dissolution testing of dosage forms. A model VK 750D digitally
controlled water circulation I heater (VanKel® Industries, New Jersey, USA) was used to
maintain the temperature of both dissolution media at 37± 0.5°C. Samples were collected
at predetermined time intervals at 1, 2, 6, 10, 14 and 22 hours and a summary of the
dissolution test conditions for this study is depicted in Table 4.5.
The following parameters were assessed for their impact on drug release rate using this
apparatus. The screen mesh sizes supplied with the Bio-Dis® were labelled as 160, 78, 40
and 20, respectively, corresponding to pore sizes of 74, 177, 405 and 840 f..Lm.
82

Table 4.5. Summary of general dissolution conditions for basket and reciprocating cylinder dissolution test methods in this study.
Parameter USP Apparatus 1 USP Apparatus 3
Dissolution medium
Temperature
Initial volume
Basket I dip speed
Screen size
Filter size
Volume drawn
Dissolution time
Buffers (pH 1.6, 3.4, 4.6, 6.8 and 7.4)
37.0 ± 0.5°C
900 m1
50 I 100 rpm
405 f.tm
0.45f.tm
2ml
22 hours each in pH 1.6, 3.4, 4.6, 6.8
and 7.4
Buffers (pH 1.6, 3.4, 4.6, 6.8 and 7.4)
37.0 ± 0.5°C
180 m1
10 I 20 dpm
405 f.tm top 1177 f.tm bottom
0.45f.tm
2 ml
1 hour each in pH 1.6 and 3.4
4 hours each in pH 4.6, 6.8,
12 hours in pH 7.4
83

4.2.6 Physical Characterization of Tablets
4.2.6.1 Weight Uniformity
The weight of each of 20 randomly selected VRP tablets was determined using a top
loading electronic balance Model AG 135 (Mettler Toledo, Switzerland) and the average
weight of each manufactured batch established (Table 4.7).
4.2.6.2 Content Uniformity
Twenty randomly selected VRP tablets from each batch were weighed and powdered
using a mortar and pestle. An aliquot of powder equivalent to 240 mg of drug was
accurately weighed and transferred into a 100 ml volumetric flask containing
approximately 70 ml mobile phase. The solution was stirred continuously for 1 hour
using a magnetic stirrer (Gallenkamp™, UK) and then made up to volume with mobile
phase. The solution was filtered through a 0.45 J..Lm hydrophilic PVDF (Millipore®
Millex-HV, Millipore Corporation, Bedford, MA, USA) membrane prior to analysis by
HPLC using the chromatographic conditions reported in § 2.4. Individual concentrations
were calculated from a calibration curve, and the average values for tablet uniformity
calculated for each batch of tablets (Table 4.7).
4.2.6.3 Crushing Strength
The crushing strength of the tablets was measured using an Erweka TB 30 hardness tester
(Erweka, GmbH, Heusenstamm, Germany) 24 hours after compaction. Twenty tablets
from each batch were tested and the results are shown in Table 4.7. The tablets were
oriented the same way in relation to the direction of the applied force to facilitate
comparison of the results in all cases.
4.2.6.4 Tensile Strength
The tensile strength of all batches of tablets was calculated using data generated in
diametral-compression tests. The relative value of tensile, compressive and shear stress
84

within a tablet varies, depending on the characteristics of the tablets and the surface
providjng the applied compression [152]. The tensile strength of tablets from each batch
was calculated using equation 4.4 and results are shown in Table 4.7.
where
4.2.6.5
2F cro = trdT
cr0 = maximum radial tensile strength, N/mm2,
F = crushing strength, N,
D =tablet diameter, mm and
T = tablet thickness, mm.
Friability
Eq. 4.4
The friability of all batches of tablets was measured using an Erweka T A3R friabilator
(Erwerka, GmbH, Heusenstamm, Germany). Twenty tablets were de-dusted and weighed
on an electronic top-loading balance Model AE 163 (Mettler, Zurich, Switzerland). The
tablets were allowed to tumble for 4 minutes at 25 rpm or for 100 drops. Tablets were de
dusted, re-weighed and the percent friability of the tablets calculated (Table 4.7).
4.2.6.6 Water Uptake and Erosion
VRP tablets (n = 3) were wejghed individually on a Mettler Model A 163 electronic top
loading balance. The tablets were subjected to dissolution test conditions using USP
apparatus 1. Tablets were withdrawn at 1, 2, 6 10, 14 and 22 hours, placed on petri dishes
and excess surface water removed carefully, using filter paper. The swollen tablets were
re-weighed prior to being dried in an oven at 60°C for 12 hours. After drying, the tablets
were allowed to cool at ambient temperature and then weighed until a constant weight
was achieved (final dry weight). The increase in weight of the wet mass represents the
uptake of the dissolution medium and permits the determination of the swelling index
(Sl) using the method descrjbed in equation 4.5 [153].
85

where
WH-Wi SI=
Wi
Wi = mass of tablet before placing in dissolution media,
WH = mass of tablet after placing in dissolution media (hydrated).
Eq. 4.5
The percentage increase (Q) or the increase in weight of the tablet that is due to the
absorbed medium was calculated using equation 4.6.
Eq. 4.6
where
Wi = mass of tablet before placing in dissolution media,
WH = mass of tablet after placing in dissolution media (hydrated).
Efentakis et al [ 154] established that the degree of erosion (E) of a dosage form may be
estimated using equation 4.7.
where
Wi = mass of tablet before placing in dissolution media,
Wt = final dry weight after erosion.
Eq.4.7
86

4.3 RESULTS AND DISCUSSION
4.3.1 Optimization of the Formulation
Figure 4.7 depicts the percent drug released as a function of time for formulation
VRPOOl and shows the effects of Carbopol® 974P NF the primary matrix polymer, on
drug release rate. The drug release profiles for batches VRP002 - VRP004 are shown in
appendix 1. It is apparent that carbomer polymers in low polymer/drug ratio do not
sustain the release of VRP for a substantial period of time. The release of VRP in the
early stages of the 22-hour run is rapid and similar to that observed when testing
immediate release dosage forms. Formulations VRP001 and VRP002 release> 90% VRP
in 2 hours and batches VRP003 and VRP004 release approximately 60% and 50% of the
drug, respectively. Therefore, these formulations were considered inappropriate for
further development studies, but served as a starting point for identifying potential
formulation compositions for further studies.
I _120 __ _ ------- -- ·-- --- 1 I 1
I I 100
I ~
I ~ eo
en 2 60 I
I ~ ,. ' Q)
>
1 I " ~I 0 20 - ~VRP001 ·1
o ~---------------l_---_- ___ ~o-~-~i~-s_R_: _ ______ 'I L_ o _____ s _____ - 10Th~~ (~rs}ts - __ :_ _____ ]
Figure 4.7. Dissolution profile ofVRP release from batch VRPOOI and lsoptin® SR (n = 6).
87

Sammani et al [ 128] prepared blends of HPMC and carbomers to formulate a matrix
sustained release formulation for diclofenac sodium and thus this polymer combination
was considered for use in an attempt to sustain the release of VRP from
extemporaneously prepared products.
Formulations for batches VRP005 - VRP008 were then developed and manufactured. The
rele~se profile of VRP from tablets of batch VRP005 is depicted in Figure 4.8. Release
profiles depicting VRP release from batches VRP006 - VRP008· are shown in appendix
1 . It is apparent that these blends can to a certain extent sustain the release of VRP and it
is clear therefore, that these blends of carbomer and HPMC are better than carbomer
when used alone. The formulation composition of batches VRP005-VRP008 is able to
delay the release of VRP and > 70% of drug was released in 10 hours as opposed to the
> 90% released in 2 hours from batch VRPOOI.
---· -·---· -----· . --=:1 120
I I
100 I
"0
I Ql
J ::l 80
· .!! I I I QI I lr; I :J 60 ... c *-' GI > 40
II Ia l------1 20 -+--VRP005
-:_-- lsoptin SA
0 0 5 10 15
- ----~:- . -- ~~~J Time (hrs) - - -·· - -- --
Figure 4.8. Dissolution profile of VRP release from batch VRP005 and lsoptin® SR (n = 6).
It has been shown that a combination of an anionic polymer such as carbomer with a non
ionic polymer such as HPMC can produce a synergistic increase in viscosity of a matrix
[ 128, 155]. This effect was thought to be due to the stronger hydrogen bonding between
the carboxyl groups of carbomer and the hydroxyl groups of HPMC, leading to stronger
88

cross-linking between the two polymers [155]. Similar results have been reported in an
earlier study in which diclofenac release from matrices was evaluated [128]. It is likely
therefore, that the increased viscosity of the matrix may have resulted in a greater
resistance to diffusion of VRP through the polymer matrix with a subsequent decrease in
the release rate from this product.
In an attempt to prolong the release of VRP further, formulations VRP009 -VRP014 were
developed and manufactured. Figure 4.9 depicts the release rate data for batch VRP009.
Release profiles for VRP010-VRP014 are presented in appendix 1.
20 ~ --- --l - VRP009
--1_soptin SA _; I
L_ _'_o __ _ 5 10 15 20 25
Time (hrs) J --- --· -··-- -------
Figure 4.9. Dissolution profile of VRP release from batch VRP009 and Isoptin® SR (n = 6).
Modified-release tablet formulations may also be produced using ethylcellulose as a
matrix forming material [119]. The combination of ethylcellulose (5% w/w and 10%
w/w) with carbomer also failed to sustain the release of VRP from batch VRP009 as
more than 50% of the drug had been released after 2 hours. In contrast, the reference
product had released approximately 20% at that time, and therefore, this formulation was
not deemed suitable at the concentrations of matrix forming materials used. However,
when comparing the dissolution profile of batch VRPOOl (Carbopol® 974P NF only) to
batch VRP009, it was observed that the incorporation of ethylcellulose had an influence
89

on the release of VRP. Therefore, there is the probability that blends of Ethocel® with
Carbopol® when used in formulation studies may retard drug release rates,
synergistically.
In an attempt to prolong the release of the drug further, combinations of carbomer and
Eudragit® RS/RL were also evaluated in this study and four formulations, VRP011-
VRP014 were manufactured (mini-tablets). Figure 4.10 shows the release profile of batch
VRPO 11. The profiles for VRPO 12-VRPO 14 are shown in appendix 1.
100
0')
I :I ...
! 0 60 I I
:::(! 0
Cll > !:;
40 3 E :I 0
20 f-_;_=.vRPo;-1 ---1 j -lso~tin SR
0 ~------------~------------~------~ 0 5 10 15 20 25
Tim e (hrs) ~--------------------···· ------- _j
Figure 4.10. Dissolution profile of VRP release from batch VRPOll and to Isoptin® SR (n = 6).
The dissolution release profiles for batches VRPO 11-VRPO 13 were similar to that of the
reference product for the early stages of the dissolution process only, but did not match
the release profile for the entire 22-hour period.
Batch VRP014 in which Eudragit® RS was used as the retarding polymer alone failed to
show any sustained release effect. After 2 hours, approximately 75% of the drug had been
released and was in solution. In this regard, the release rate profile for this formulation
was too fast and thus the formulation was not developed further. In addition the
Eudragit® RS/Ethocel® combination in the concentrations tested cannot be used to sustain
90

VRP release and were in fact no better than the Carbopol®/Ethocel® combination that was
used to prepare batch VRP009.
There was no difference in the percent drug release when Eudragit RS® and Eudragit®
RL were used in batches VRPOll and VRP012, even though Eudragit® RL is more
hydrophilic than Eudragit®RS [121]. Release rate studies of batch VRP015 also revealed
that this composition failed to show any sustained release effect better than batch
VRP014. After approximately 1 hour, 60% of the drug had been released and the
dissolution profile of VRP for this batch is also shown in appendix 1.
Since formulations VRP011-VRP013 had release profiles that were similar to the
reference product, these were selected as the starting point for further formulation
development studies. Batches VRP016 and VRP017 were prepared with the addition of
dibasic calcium phosphate (Emcompress®) or microcrystalline cellulose (Emcocel® 90M)
as the diluents in these formulations instead of lactose. Batch VRP016, in which
Emcompress® was used, showed almost the same release profile as batch VRP017 and
therefore, either of the fillers could be used in formulation of VRP tablets for further
studies. A dissolution rate profile for batch VRP016 is shown in Figure 4.11.
91

"C 41 (/) 80 ::! Qi • a:
l e~ 1 ~ so
~ 41
-~ 40 iii
I ~ ' (,) 20 I !
I I 0 ~----~----------------------~----~ I
[_ . 0 5 15 20 25
Time (hrs) I
J
Figure 4.11. Dissolution profile of VRP release from batch VRP016 compared to Isoptin® SR (n = 6).
Batches VRPO 18 and VRPO 19 were manufactured using a combination of Eudragit® RS
and ethylcellulose as the matrix forming materials at higher concentrations than used
previously in the manufacture of batches VRP013-VRP014. The release patterns
observed for these formulations did not show the potential to match the reference product
even at high concentrations and were therefore not developed further.
Finally, a wet granulation method of manufacture was considered in order to determine
whether this method of manufacture and combination of excipients might sustain the
release of VRP better than from direct compression formulation. Figures 4.12 - 4.15 show
the drug release patterns of batches VRP020-VRP023, respectively. These batches were
manufactured using a granulating dispersion of Surelease® E-7-19010, Eudragit® RS 30D
and Eudragit® NE 30D. Their release profiles were compared to that of Isoptin® SR and
finally formulations VRP021 and VRP023 were adopted for intensive evaluation after
satisfying the relevant pharmaco-technical specifications and similarity of release profile
to Isoptin ® SR.
92

r- ·- - -- - -- -- --- - · --- ··- - ---120
¥>0
"0
I ~ ell 60
I ~ ::I ..
60 ' 0 I o ~
1 .~ ' .!!! 40 . ::J I E
::I
10 20 ---I
I I --+-VRP020
11 --~~~~tin~~-~
I 0
0 5 10 15 20 251
L._ Time (hrs) _j -·- --
Figure 4.12. Dissolution profile ofVRP release from batch VRP020 and to lsoptin® SR (n =6).
- -- ----- ------------- -I 120
I ¥>0 I lal : : I
VJ I tV I £ 60
en 12 Ceo
I ~ ell > ,.-
! .!!! 40 ::I E
18 20
~...:....- vRP021 I --tsoptinSR: ------- J
0 0 5 XI 15 20 25 !
Time (hrs) ---------- - ·· - - -··- -·
__ )
F igure 4.13. Dissolution profile of VRP release from batch VRP021 and to Isoptin® SR (n =6).
93

[-12;;-= ~--·-------·_-_-_-_-_· -----=-----~-----·-_--- ·-
1 1 "0 100
Gl
I ~ 4i 80 a:
12 0
60
I ~ >
1140
1
8 20 ,_.._VRP022 1
I
I I
I I . I I
I I
I --lsoptinSR
0~---------~---------
l ___ o ---·-
l 5 10 15 20 25
Time (hrs) - J
Figure 4.14. Dissolution profile of VRP release from batch VRP022 and to Isoptin® SR (n =6).
- 12o ·-_ _:: __ -::__-_-:::_-==--------~--=--=--·-- ---- I
100
I ~ IV 80 Cl)
j£ Cl :I 60 lo
''* Cl)
I ~ 13
40
E
18 20
I
I 0
0
I --
1- -· -+-VRP023
--lsoptinSR ·--···--
5 15 20 I
25 i
Time (hrs) ----- - --- - -------- J
Figure 4.15. Dissolution profile of VRP release from batch VRP023 and to Isoptin® SR (n =6).
94

4.3.2 pH Dependence of Drug Release
Since VRP is a weakly basic compound, its solubility will vary in different parts of the
gastro-intestinal tract (GIT) due to pH differences in the different regions of the GIT.
Dissolution tests were conducted in two dissolution media of different pH value (1.6 and
7.4) for 22 hours using USP apparatus 1 to determine whether VRP release from batches
VRP021 and VRP023 was pH dependent. The results in Figure 4.16 reveal that drug
release rates are faster in dissolution media of pH 1.6 than dissolution media of pH 7.4
for both formulations tested.
I
'00 I I 'C Q)
I '
(/) Ill Q)
80 Gi a:
II Cl :l ... c 60
*' : I ~ ·.;:
j I ~ 40 :l E :l . I 0
20
I
0 I 0 5 '0 15 20 25
Time (hrs) I --+-VRP021-pH 7.4---··- - - -.-VRP023-pH 7A --J-; j' ~VR0021-pH t6 -liE--VRP023·pH t6
=:::=:==-= - - - -· --. - -- ·------
Figure 4.16. Dissolution profile of VRP release from batch VRP021 and VRP023 at different pH.
At pH 1.6, batches VRP021 and VRP023 released approximately 17% and 14% of total
drug loading at the end of 1 hour. After 2hours, the formulations had released
approximately 31% and 30% VRP, respectively. Following 22 hours of exposure to the
dissolution media, the two batches had released approximately 95% and 100% VRP,
respectively.
Dissolution testing was also conducted at pH 7.4 and tablets from batches VRP021 and
VRP023 had released approximately 10% and 7% of total loading at the end of 1 hour.
95

After 2 hours, the formulations had released approximately 26% and 19% VRP,
respectively. Following 22 hours of exposure to the dissolution media, the two batches
had released approximately 78% and 63% VRP, respectively.
The results in these studies are in agreement with observations made by Streubel et al
[123] in which it was expected that a weakly basic drug would show faster release rates at
a lower pH rather than at a higher pH.
The release rates observed when carbomer is used as the primary rate retarding agent
indicate that the polymer matrix may have acted as a physical barrier in slowing the rate
of release. This barrier may occur due to complex macromolecular changes taking place
within the polymer over time [156]. These changes in turn affect the rate of drug
diffusion through the polymer and consequently the rate of release of VRP from these
tablets.
The carbomer polymer would virtually be un-ionized at pH 1.6 and as a result of its low
solubility, is difficult to hydrate. As the pH increases, the polymer starts to ionize and
swell and the greatest degree of swelling occurs at pH 7-7.5 [157]. Consequently, during
the course of the gastro-intestinal transit, a dosage form is exposed to various pH's
ranging from 1.2 in the stomach to approximately 8.0 in the small and large intestines and
therefore, the amount of drug that is released will depend, to a certain extent, on the
degree of swelling of the carbomer. Therefore, at high pH, the diffusional path length
within the dosage form is much longer and subsequently release rates tend to be slower.
Release rates are also influenced by the lower solubility of VRP as the pH increases to a
more alkaline state.
Dimitrov and Lambov [158] reported that the relative faster release of VRP at lower pH
when compared to higher pH values is a result of more drug being available in the matrix
as a salt form rather than as the base compound. After sometime, the VRP is converted to
the base form as a result of hydrogen cations diffusing into the dosage form at a faster
rate, due to their small size, than the VRP can diffuse out of the dosage form. The
formation of the base is associated with a reduced solubility of VRP and therefore the
96

release process is slower and the release mechanism is complex and confounded by
solubility issues.
It has been reported [159, 160] that at higher pH's, the carboxylic acid functional groups
of carbomer are more likely to be dissociated and that repulsion of molecules due to
negative charges, may cause expansion of the molecules to form a gel layer, which can
slow drug release. Interactions between a negatively charged functional group in the
polymer and a positively charged drug molecule are therefore possible and can increase
at higher pH's such as 6.8 and 7.4 and drug release rates may therefore be reduced due to
expansion of the molecules and the formation of a gel layer. The decrease in VRP release
at higher pH values may be due to the interaction of the dissociated polymer-carboxylic
groups with the basic tertiary amine ofVRP [160].
A potential interaction between a cationic drug, metoclopramide hydrochloride and
anionic ammonium oleate was investigated by Sadeghi et al [114] using dialysis studies.
Formation of a precipitate when metoclopramide hydrochloride was added to the
ammonium oleate solution resulted in slower drug release rates compared to those when
using an anionic drug such as diclofenac. Therefore, another possible explanation that
may account for the slower release of VRP from batch VRP021 is related to a possible
interaction between VRP and a component of Surelease® E-7-19010. Thus due to an
interaction between the cationic VRP and anionic ammonium oleate, present in
Surelease® retardation of release may occur.
The manufacturing procedure for the WG products entails a 12-hour drying process. It is
quite likely that during the drying cycle any ammonia present in the Surelease® used to
granulate the component of batch VRP021 would evaporate. However, any residual
ammonium oleate is likely to remain and thus create the potential for an interaction
between VRP and ammonium oleate.
The potential for the in situ formation of a complex between VRP and a surfactant is an
area that should be further evaluated in future formulation studies in which VRP and
Surelease® are used.
97

4.3.3 In-Depth Investigation of Batches VRP021, VRP023 and Isoptin® SR.
In order to further characterize batches VRP021, VRP023 and Isoptin® SR additional
testing was undertaken. The effect of buffer molarity on drug release rate was evaluated
as were other aspects of the dissolution test method. Swelling and erosion studies were
used as an attempt to facilitate an understanding of the mechanism by which VRP is
released from the dosage form.
4.3.3.1 Effect of Molarity
When the molarity of the dissolution medium was decreased from 0.2M to 0.05M, the
release rate of VRP decreased as shown in Figure 4.17. The effect of molarity on
dissolution rates of chlorpheniramine maleate has been investigated by Neau et al [159].
A high molarity dissolution medium weakens the rigid/cross-linked structure of the
carbomer gels by interfering with repulsive forces that exist between charged polymer
molecules. This loss of the gel-like structure, results in the dosage form and drug being
exposed to the hydrodynamic forces of the dissolution test medium, resulting in an
increased exposed surface area with a subsequent faster drug release rate.
98

120
100
"0 Cll UJ
80 I'll Cll Gi a: en ::3 ... 0 60 :::!! 0
Cll > :;::;
..!!! ::3 40 E ::3 0
20
0~---------------------------------------0 5 15 20 25
Time (hrs)
r _;::_ VRP<i21(o.o5t.i.) . ~vRPo21(o.1M.J - ~v'RP'o21(o2MJ- -
1--VRP023(0.05M) - VRP023(0.1M) ---VRP023(0.2M )
i ~lsoptln.~ (~5 ~ -=-lsoptln SR (0.1~) --=-Is~~~ S~-(~ M~-~
Figure 4.17. Effects of buffer molarity on veraparnil release from batches VRP021, VRP023 and Isoptin® SR (n=6) release in pH 7.4 phosphate buffer using USP apparatus 1.
4.3.3.2 Swelling and Erosion
Measurements of hydration rates of the selected batches (viz. VRP021 , VRP023 and
Isoptin ® SR) were carried out in an attempt to correlate the observed drug release
characteristics with rate of polymer hydration. Visual observation of the mini-tablets
from batches VRP021, VRP023 and the reference product confirmed that swelling was
dominant in these fmmulations and that the polymer developed a highly viscous gel when
exposed to the dissolution media. The degree of swelling increased when the dissolution
medium was pH 7.4 as opposed to pH 1.6. As the hydration and swelling progressed, the
mini-tablets rapidly formed a single rod-like cylinder, thus adhering to one another as
shown in Figure 4.18. Thereafter, lower surface area was exposed than when the mini
tablets were separate entities to the dissolution medium.
99

A B c
uu u •UUU .. EJ~EJ
single units association single rod
Figure 4.18. Schematic of the formation of a rod-like cylinder by 3 mini-tablets.
It has been reported [126] that swelling and erosion may determine the mechanism and
kinetics of drug release. Therefore, this study was conducted to determine the mechanism
of drug release in terms of liquid uptake and erosion. Swelling and liquid uptake profiles
for batches VRP021, VRP023 and Isoptin® SR product are presented in Figure 4.19.
1 -- t2 r----·-~--__ --_ -_ ·-_ -=--- -_---=---=--1
I A2 =0.9796 I I I
I
I I ~ I ~ I ~
I ~ I]
0.8
0 .6
0.4
0.2
I
I R2 =0.8093 I
I I
I I
I I I
0~------------------~-------------- i 0 5 t) 15 20 25
Time (hrs) I
L_ -·· -- -- I r; v"Rro21 • vRi:u23 • ~~pti~ sA - ·-- - -- ·--· -- - -··-' - J
Figure 4.19. Swelling indices for batches VRP021, VRP023 and Isoptin® SR at pH 7.4 (n = 3).
The tablets from batch VRP021 showed the highest rate of swelling when compared to
tablets from batch VRP023 and the reference product. A high degree of swelling results
100

in an incr~ase~ diffusional p~th le~gth within the dosage form,_ r.hr.o.ugh. which ~he_ ~rug
----~u~t pass. The tablets from batch VRP023 had a low swelling rate. This was unexpected
as the excipients used in formulation studies were similar to batch VRP023 except for the
granulating fluid. The low liquid uptake by tablets from batch VRP023 is more than
likely a result of the poor uptake of dissolution medium due to the presence of Eudragit®
NE 30D, which has poor permeability characteristics [121].
The degree of swelling is also an indicati.QILQ{ _tl}e ~':ltes at_ which preparations are able to
ad~orb dissolution media and for both batches swelling was observed to be proportional
to liquid uptake. These results are in agreement with previously reported results [125] in
that anisotropic swelling or swelling in the longitudinal direction rather than in the radial
direction was observed for both formulations. Isoptin® SR showed swelling behaviour
that was intermediate to both batches. In all cases the SI was proportional to the time the
dosage form was exposed to the test medium. Figure 4.20 presents the degree of matrix
erosion as a function of time and is reported as % erosion.
,---~0 -- -- -· __ -_-_-_-__ -=:._-=:._~-------------
• A2 =0.9464
60
! 40 • c:
0 A2 = 0.8971 "iii
, e • i w
;,g , o
i 20
0~------~----------~ I o s m ~ ~ e !
Time (hrs)
I L_ __ _ r-; VAFD21-~ v-Ri=o2s ~ ~pti~·sR" 1
. - · .. - _ _I
Figure 4.20. Percent erosion for batches VRP021 , VRP023 and Isoptin SR (n =3).
101

It is evident that the tablets used in these studies undergo both swelling and erosion
simultaneously. The percent erosion ranged from approximately 5% during the first hour
to about 25% at the end of the run for tablets in batch VRP021, whereas the percent
erosion ranged from about 10% after 1 hour to about 25% at the end of the dissolution
run for batch VRP023. The reference product demonstrated a profound increase in
percent erosion from approximately 15% during the first hour to about 70% at the end of
the test run. It has been reported [161, 162] that when both swelling and erosion occur
simultaneously at the same rate, zero-order release rates can be obtained from such
formulations. Different polymers used, in matrix formulations may have a different
influence on the rate of tablet erosion and swelling due to variations in the disruption of
polymer networks at different times and rates. Since both swelling and erosion is shown
to have been occurring at the same time in these matrices, though at different rates, the
drug release patterns have a tendency to follow a zero-order kinetic release model. Figure
4.21 demonstrates that there is a correlation between matrix swelling and erosion, which
indicates that swelling and erosion occur simultaneously but the rate is different for each
formulation.
This rate of simultaneous swelling and erosion is due to the existing balance between the
increase in diffusion path length caused by swelling and the decrease in path length due
to erosion. However, to verify such a phenomenon, release data need to be modelled by
fitting data to mathematical models that assess drug release characteristics.
Tablets from batch VRP021 showed the highest swelling index of about 1 and a %
erosion of approximately 40% at the end of a 22-hour run. This demonstrates that there
was no balance between the increase in diffusional path length due to swelling with the
decrease in the diffusional path length due to matrix erosion. Tablets from batch VRP023
showed the least swelling and percent erosion. The reference product showed more
erosion of the tablet than swelling after 22 hours of the test, hence erosion might be
predicted to be the dominant factor affecting the release of VRP from Isoptin® SR.
102

r - ., _____ - --- -·--- .. -- --- - ·- - - - --1 I 120 I I
I I
100 • A2 = 0.81l3 I
I
I •
80 I • I ~ A2 =0.7422 l I ~ 60 • , :it • i I 1 (/) ' I ~ • 40
•~ A2 =0.6891 ; I
• 20
I I I i L - - - ---
O OL----10-----20 _____ 30 _____ 40----~~----6-0----7~0--~~~
I ~:-~R~2~ -~~-~23 ~ ~~pti~-s! I __ ·- -· ____ l
%Erosion
Figure 4.21. Correlation of matrix swelling and erosion for batches VRP021, VRP023 and Isoptin® SR product.
It is well known that the swelling of carbomer polymers is due to the partial dissociation
of the acidic carboxyl group in aqueous solution, producing a coil-like structure [86, 119,
121, 122]. Gel formation depends on the electrostatic repulsion between these anionic
carboxyl groups. When the magnitude of dissociation of the carboxyl groups is high,
there is more repulsion, which in tum results in chain relaxation and a greater degree of
swelling of the polymer [122]. This phenomenon was also observed in a study [163] in
which the sustained-release of theophylline from matrix tablets containing Carbopol® 974
was considered to be largely dependent on the gel layer structure. It was concluded that
the gel layer played a critical role in the sustained-release action.
The results of erosion depicted in Figure 4.20 show evidence that drug release from
batches VRP021 and VRP023 is mainly controlled by swelling and by diffusion of the
drug through the polymer matrix rather than by erosion. The high degree of crosslinking
of the carbomer matrix coupled with the low solubility of VRP at high pH values and gel
formation are all contributing factors in controlling drug release in these products.
103

4.3.3.3 Effect of Mesh I Screen Sizes
There have been reports in the literature of the effects of dissolution test conditions
affecting drug release when using USP apparatus 3 [164].
A study of the effect of mesh size was therefore undertaken to determine the effect of
mesh sizes on drug release rates and patterns. Polypropylene screens of a variety of mesh
sizes are available for use with USP apparatus 3. The relevant sizes of mesh used in these
studies are shown in Table 4.6.
Table 4.6. Mesh screen sizes used in dissolution studies in USP apparatus3.
Mesh screen size Pore size (IJ.m)
160
78
40
74
177
405
It was observed that if a 74 j..Lm mesh screen is used as the top screen, all cylinders fail to
drain completely and this occurred throughout the entire period of a test run. These
observations are consistent with data reported in the literature [ 165]. In these studies
[165] dissolution media were found to coat the screen, and the combination of a fine pore
size and the surface tension of the dissolution media created a barrier that prevents air
from penetrating the screen and displacing the media in the cylinder, thus allowing it to
drain.
Replacement of the top screens with a177 ~-tm mesh screen result in better drainage when
compared to data obtained when a 74 ~-tm screen was used because, as the mesh screen
size I pore sizes are larger, air can penetrate through these openings without any difficulty
and subsequently displace liquids that may be retained in these inner-tubes.
The use of a size 405 ~-tm top screen results in the cylinders draining adequately and a
student's t-test was used for comparison of the percent released when 177 ~-tm (mesh) and
405 jlm screens were used as the top screens. In all cases the bottom screen had pores of
177 ~-tm and the results revealed a value of p < 0.05 (a. = 0.05), indicating that there was a
104

significant difference between the percent drug release when screen sizes of 177 J..tm and
405 J..Lm were used as top screens in the inner-tubes.
The percent VRP released was dependent on the mesh size used for the top screens. Two
sizes, 40 and 78 mesh were tested to determine their effect on VRP release at different
rates of 10 and 20 dpm.
Figure 4.22 depicts the release of VRP from batches VRP021 and VRP023 when using
USP apparatus 3. It can be seen that the percent release rate was higher when screen sizes
were increased from 177 J..Lm to 405 J..tm, as a result of the larger pore sizes.
-----I
'C Q) In «< 60 Q)
I Qj · ~ I Cl
:;,
0 ~
lj :;,
40
· E :;, 20 (.)
0 5 10 Time (hrs)15 20 25
Figure 4.22. Influence of the pore size on VRP release from batches VRP021 and VRP023.
4.3.4 Characterization of Tablets
Further evaluation of the batches of tablets (Table 4.7) included determination of
uniformity of thickness, diameter, weight and content. In addition, crushing strength and
friability were also determined. Batches VRP021 and VRP023 satisfied all relevant
pharmacopoeial specifications for such dosage forms. The tensile strength of the mini-
105

tablets was higher than larger tablets due to their small diameter, despite a crushing
strength that was comparable to the 11 mm diameter tablets.
The % RSD for thickness, weight and content for all the tablets (large tablets and mini
tablets) was comparable and in all cases the % RSD was $ 5.0% and therefore, the
precision of manufacture worked well. These tests were used as indications of potential
areas of difficulty in the manufacturing process and it provided an indication of ultimate
product quality.
106

Table 4.7. Physical properties of the Compressed Tablets.
Formulations Thickness Weight Drug Content Crushing Strength Friability Tensile Strength
(mm) (mg) (%) (N) (%) (N/mm2)
VRPOOl 6.67 ± 1.78 724 ± 5.54 89.89 ± 1.34 113 ± 5.21 0.460± 2.17 0.98± 2.45
VRP002 6.70 ± 0.13 701 ±4.56 88.76 ±2.02 76 ± 4.94 8.980 ± 5.26 0.66± 3.56
VRP003 6.50 ± 1.66 650 ± 4.67 90.10 ± 3.12 89 ± 4.91 3.500 ± 4.01 0.80± 3.33
VRP004 6.23 ± 2.47 690 ± 5.32 87.12 ± 5.56 112±3.34 0.120 ± 10.23 1.05 ± 4.34
VRP005 6.67 ± 1.23 710±4.78 95.95 ± 5.34 126 ± 4.68 0.090 ± 1.91 1.10 ± 2.54
VRP006 6.64± 0.89 718 ±4.12 92.12 ± 3.56 124 ± 4.87 0.180 ± 2.45 1.09 ± 3.34
VRP007 6.54 ± 0.94 721 ± 3.23 88.44 ±4.67 121 ± 4.91 0.180 ± 3.43 1.09 ± 1.24
VRP008 6.45 ± 1.26 733 ± 2.34 91.32 ± 5.34 137 ± 4.34 0.210 ± 4.56 1.24 ± 4.45
VRP009 6.01 ± 0.92 740 ± 3.46 93.53 ± 5.21 134 ± 3.54 0.290 ± 1.23 1.30± 3.34
VRPOlO 6.42 ± 0.78 730 ± 4.33 91.32 ± 3.46 112±5.24 0.230 ± 1.78 1.02 ± 4.23
VRP011 5.39 ± 0.92 245±4.23 87.46 ± 2.65 112±2.23 0.270 ± 1.45 1.91± 2.68
VRP012 4.73 ± 1.25 242± 3.76 84.56 ± 4.59 116 ± 4.67 0.280 ± 3.34 2.25 ± 1.57
VRP013 4.63 ± 0.82 220 ± 2.56 84.78 ± 4.61 103 ± 3.67 0.260 ± 2.12 2.04± 1.68
VRP014 4.56 ± 0.87 248 ±4.67 91 .39 ± 4.35 107 ± 5.94 0.230 ± 1.34 2.16 ± 1.78
VRP015 4.89 ± 0.83 234 ± 1.78 96.60 ±4.55 133 ± 6.98 0.260 ± 2.45 2.48± 4.78
NB: all values are expressed as mean± % RSD, n = 20
107

Table 4.7 continued.
Formulations Thickness Weight Drug Content Crushing Strength Friability Tensile Strength
(mm) (mg) (%) (N) (%) (N/mm2)
VRP016 4.78 ± 0.81 246 ±2.23 86.83 ±4.32 131 ± 3.94 0.000 ± 0.00 2.51 ± 4.56
VRP017 4.97± 0.70 236 ± 2.33 92.43 ± 3.67 112 ± 4.45 0.060± 0.34 2.07 ± 2.34
VRP018 4.68 ± 1.21 243 ± 2.26 87.88 ± 5.34 116±3.21 0.010 ± 0.56 2.27 ± 2.12
VRP019 4.82 ± 0.84 237 ± 3.32 91.34 ± 3.33 117±5.77 0.010 ± 1.56 2.19 ± 3.23
VRP020 5.01 ± 0.78 251 ± 1.34 87.56 ± 2.67 142 ± 2.23 0.000± 0.00 2.58± 3.12
VRP021 5.05 ± 0.91 244 ± 4.67 91.04 ± 3.65 138 ± 3.34 0.039 ± 1.45 2.50 ± 1.67
VRP022 4.98 ± 0.87 237 ± 3.46 88.76 ± 3.56 144 ± 4.37 0.020 ± 1.23 2.63 ± 2.45
VRP023 5.40 ± 0.69 233 ±3.33 90.60 ± 1.46 142 ± 4.67 0.060± 1.34 2.39± 1.01
NB: all values are expressed as mean±% RSD, n =20
108

4.3.5 Effect of Reciprocation Rate
The effect of the agitation or dip rate on the dissolution rate of VRP from tablets prepared
in the laboratory is shown in Figure 4.23. As expected, the dissolution rate increased with
the increasing agitation rate.
l -c • Q)
Ill ca
. Q)
I -; • a:
I C'l :I ... 0
I ~ Q)
I ~ :I
I E I :I
0
------100
90
~------------~---80
70
60
50
40
30
20
10
0 0 5 10 15 20
Time (hrs)
r--~-VRPo21-uSP3- -- =.....:::vRP023-USP3 - - -=--=- ~~pt~-SR-US.P3 -l
I I I
25
Ll - VAP021-USP1 - VRP023-USP1 --lsoptinSR-USP1 . -----==-....-:.~-- ---- - -=- -- -- -:-_:_=----'=----·-:=-_:_--=-"--="-'-=- J
Figure 4.23. Effects of basket rotation speed and reciprocation rate on drug release for batches VRP021 , VRP023 and Isoptin® SR (n = 6).
It is vitally important that dissolution test methods are optimized and that appropriate
dissolution media are used when testing particular dosage forms. It has been shown that
USP apparatus 1 method is not convenient when a change of dissolution media is needed
[165]. The reciprocating cylinder (USP apparatus 3) eliminates the manual work required
when changing dissolution media, thus providing an advantage for dissolution testing as
it may mimic the pH gradient encountered in the gastro-intestinal tract. Figure 4.23
presents a comparison of VRP release profiles between the basket (USP apparatus 1) and
the reciprocating cylinder (USP apparatus 3) at pH 7 .4. It was observed that the amount
released at 20dpm was about twice that of the dosage form tested using USP 1 at 1 OOrpm.
109

These results are consistent with work previously published in which a comparison of
dipping rates with USP apparatus 3 and rotation speed using USP apparatus 1 revealed
that a dipping rate of 10 dpm (USP apparatus 3) was equivalent to 100 rpm (USP
apparatus 1) [ 165]. It is obvious that dissolution test parameters have an influence on
drug release rates and these must be optimized prior to performing experimental studies,
in order to maximize the benefit from undertaking these studies.
The rationale behind conducting dissolution testing is that if a drug is to be absorbed
from the gastrointestinal tract, it usually has to dissolve. Dissolution testing has been used
as a quality control tool, but its success in predicting biological availability has not yet
been fully realized, as there are limited examples of successful dissolution tests reflecting
product bioavailability characteristics while there are number of unsuccessful correlations
of dissolution characteristics to bioavailability reported in the literature [166].
Dissolution testing, along with other quality control tests such as assay and content
uniformity provide sufficient assurance of the consistency of batch to batch quality of
products and for a dissolution test to be useful as a quality control tool, it must be
sensitive enough to reflect the influence of manufacturing process changes, as has been
observed in this study.
110
4.4 CONCLUSION
The objective of this study was to develop and evaluate sustained-release tablets
formulations of VRP and to develop a suitable method of manufacture for ensuring
reproducible sustained-release products are produced. A direct compression method was
used to develop sustained-release tablets but the tablets produced did not satisfy
pharmacopoeial specifications and VRP release was faster and complete drug release was
observed after about 6 hours. Surelease®-E-7-19010 and Eudragit® NE 30D were used as
granulating solutions in wet granulation process. Initially, different blends of
formulations were prepared by direct and wet granulation technology. The former
technique involved the compression of a dry blend of powders that comprise the drug.
AJthough simple in terms of the processes involved, this process was found to be
influenced by powder characteristics, and hence it was important to first determine the
powder flowability and compressibilities. The influence of polymer content, polymeric
swelling behaviour, molarity, agitation rate and the pH changes on the release rate of
VRP were investigated.
The VRP release from the prepared formulations was found to be pH dependent and was
markedly reduced at high pH. The resultant release rates may be attributed to the poor
solubility of VRP, the thickness of the gel layer and the interaction between the cationic
drug VRP and carbomer or component of Surelease®-E-7-19010. It is not clear why
Isoptin ® SR did not show 1 00% drug release. The probable reason is more than likely the
poor solubility of the active in the dissolution media and/or interaction with other
excipients, even though the composition (excipients) of Isoptin® SR was not known in
advance.
This study demonstrates that the desired drug release pattern can be obtained by adopting
a systematic approach in designing an optimum formulation. It has also addressed the
effects of instrumental factors such as mesh/screen sizes on drug release profiles on
addition to the effect of reciprocating speed and or agitation rate.
111

In conclusion, sustained release formulations of VRP with satisfactory pharmacotechnical
parameters, viz. crushing strength, friability, weight variation, thickness and diameter that
were within the pharmacopoeia limits were prepared and a wet granulation technique has
been proven to be an appropriate method to produce VRP mini-tablets. This work has
also presented some evidence confirming that carbomer containing matrices
predominantly result in swelling as opposed to erosion and drug release mechanisms can
be predicted based on these phenomena.
Future studies must focus on fully understanding the complex relationship between drug
polymer and other drug-excipient interaction studies, as well as defining the necessary
process parameters to ensure that a predictable, constant drug release pattern is achieved.
112

CHAPTER FIVE
CHARACTERIZATION OF DRUG RELEASE BY
MATHEMATICAL MODELLING
5.1 INTRODUCTION
Mathematical modelling of drug release profiles from controlled drug delivery devices is
a useful technique that may provide a scientific knowledge base relating to mass transport
mechanisms, which are involved in the control of drug release from these systems [ 167].
Siepmann and Peppas [167] reported that when developing a new controlled release
delivery system or elucidating drug release mechanisms, the choice of an appropriate
mathematical model is dependent on the type of drug, excipients and the composition of
the device into which the drug is loaded.
Further reports [ 156, 168] suggest that there are various mechanisms that control drug
release and that diffusion, water triggered transport or swelling, coupled with chain
relaxation and slow erosion of polymer, are the most important mechanisms [156, 167,
168] by which drug release may be controlled.
The occurrence of multi-component transport processes, different types of matrices,
composition, device geometries, drug loading, saturation solubility in the matrix,
diffusion, swelling, polymer dissolution and erosion may complicate the analysis of drug
release from controlled-release delivery systems [ 169].
It has been reported [167] that mathematical approaches covering all possible chemical
and physical processes are not yet available; hence in order to describe drug release there
is a need to identify or develop an adequate mathematical theory for specific type of drug
delivery systems. It is worth noting that other alternative approaches have been reported
recently in the literature recently and these should also be considered and used in
combination with conventional methods of analysis that have already been established
113

[ 169]. These new techniques include the use, for example, of artificial neural network
(ANN) methodology to predict drug release profiles from drug delivery systems [ 169].
5.2 MATHEMATICAL MODELS
There are several reports in the literature that have discussed the comparison of
dissolution data to establish statistical or pharmaceutical equivalence [170]. These
methods for the comparison of in-vitro dissolution profiles can be classified into five
groups:
(i) Methods based on exploratory data analysis [171],
(ii) Model-independent methods [170,172 -174],
(iii) Methods based on analysis of variance CANOVA) [148, 172, 173,175 -177],
(iv) Model-dependent methods [148, 172-174,1 75, 177, 178],
(v) Mixed-effects models [179].
5.2.1 Exploratory Data Analysis Methods
Exploratory data analysis methods, despite not having been endorsed by the FDA and
other regulatory bodies, is the first step in comparing dissolution profile data in a
graphical manner [ 171]. The data are illustrated by plotting the mean dissolution profile
data for each formulation with error bars that extend to twice the standard errors, at each
dissolution time point. The dissolution profiles for two formulations, for example a test
(T) and reference (R) product may be compared by evaluating whether or not the error
bars overlap. The dissolution profiles may be considered to differ significantly from each
other if the error bars at each dissolution time point do not overlap. The rationale for this
is that the error bars at each dissolution time point are considered to be equivalent to a
95% confidence interval and therefore, if the confidence intervals for the two
formulations at a given time point do not overlap, then the mean dissolution profiles at
that time point may be considered significantly different to each other.
114

5.2.2 Model-Independent Methods
Moore and Flanner [ 174] proposed a versatile, model-independent mathematical
approach for calculating the difference (j1) and similarity factors (j2) for the comparison
of drug release profiles. The difference factor,J1, measures the percent error between two
curves over all time points and is calculated using equation 5.1.
where
11
LiRr-Tri ft = r=l X100
n
LRr t=l
n =sampling number,
R, =percent dissolved of the reference product and
T, =percent dissolved of the test product at timet.
Eq. 5.1
The similarity factor, h. is a logarithmic transformation of the sum-squared error of
differences between the TEST (1) and REFERENCE (R) products over all time points,
and is calculated using equation 5.2
where
n = sampling number,
R, = percent dissolved of the reference product,
T = percent dissolved of the test product at time t and
w = is an optional weight factor.
Eq. 5.2
The difference and similarity factors have been included in the FDA guidance on the
dissolution testing of immediate-release solid oral dosage forms [180]. The FDA [180,
181] and the Human Medicines Evaluation Unit of The European Agency for the
Evaluation of Medicinal Products (EMEA) [182] have accepted that two dissolution
profiles will be declared similar if the h value is between 50 and 100. Whilst f 1 values are
115

not used by the regulatory agencies, values of !I between 0-15 indicate similarity or
equivalence of two drug release curves [172].
The main advantages of using the !I and h factors are that they are easy to compute and
they provide a single number to describe the closeness of two dissolution profiles [148,
172].
Yuksen et al [172] reported that because of the sensitivity of the factors to the
measurements after 85% dissolution, the number of sample points be limited to not more
than one, once any of the products had released greater than 85% of its drug loading.
The /I and /2 equations are based on combining the differences at all time points into one
measurement, and these measurements are often estimated by substituting sample means
for the actual means. However, it has been reported [183] that dissolution profiles
correlated at the sample time points are estimates and are complicated in that the
variation of the estimates is difficult to calculate and that the estimate itself may be
biased, with statistical properties that are difficult to derive, and hence, it is not possible
to know what the Type I and Type II error rates are [148, 183, 184].
A relatively new factor, the similarity factor (Sct), was developed by Gobel and Panchal
[ 170]. The parameter determines the percentage difference between two dissolution
profiles. The major advantage of this method is its simplicity and ease of interpretation.
The difference in similarity, Sct is calculated using equation 5.3.
where
Eq. 5.3
n =the number of data points collected during the in-vitro dissolution test
(time and percentage I amount of drug dissolved)
AUC Rr = the area under the dissolution curve of the reference, at time t,
AUC n = the area under the dissolution curve of the test formulation, at timet.
116

The description of in-vitro dissolution profiles using model-independent methods also
includes the calculation of the mean dissolution time (MDT) from the dissolution profile,
and mean residence time (MRT) from the residence profile, or area under the dissolution
curve (AUC) [172]. The AUC is sometimes referred to as dissolution efficiency (DE)
[185].
DE of a pharmaceutical dosage form is defined as the area under the dissolution curve up
to a specific time, t, and is expressed as a percentage of the area of a rectangle described
by 100% dissolution in the same time [121, 185, 186]. The DE may be calculated using
equation 5.4.
I
fy·dt
D.E. = 0 X 100%
Ytoo · t Eq. 5.4
where,
y =the percent drug dissolved at timet.
In this study the !I and h factors were applied to dissolution data as these have been
adopted by the FDA as criteria for the assessment of the similarity between two in-vitro
dissolution profiles [180]. In addition, the Sct factor was calculated due to its simplicity
and ease of interpretation. The Sct values were compared to !I and h factors to determine
if a relationship between these factors exist.
5.2.3 Mahalanobis Distance
The Mahalanobis distance or statistical distance between respective means of a
REFERENCE and the TEST product using a pooled variance-covariance matrix was
determined and it has been reported that this method is a multivariate analogue of the two
one-sided t-test procedure used in the assessment of average bioequivalence [171]. This
method has not been a topic of discussion in any regulatory guidance document, and it
was thus not considered for use in this study.
117
5.2.4 Analysis of Variance (ANOVA)
Statistical methods, unlike mathematical methods, go some way towards taking statistical
properties such as variability and correlation structure of the dissolution profile data into
account, when undertaking a comparison of test and reference drug product dissolution
rate profiles [171]. This method of comparing dissolution profiles takes into account the
variability at each time point of the dissolution profile, yet it ignores the correlation
between the dissolution time points. It is clear that each time point is treated as if it were
independent of the others, which is clearly not the case in dissolution testing [171].
Furthermore, there is an overall risk of incorrectly concluding that the mean dissolution
profiles are different, that is Type I error is much larger than the nominal 5% usually used
to make these decisions. This is a well- known consequence of performing multiple
comparisons, such as t-tests or one-way analyses of variance [171].
Although this method of comparing dissolution profile data is straight-forward, it is also
rather tedious to perform and it is worth noting that these ANOV A methods are not
mentioned in any of the FDA guidance documents on dissolution testing.
ANOVA-based methods do not rely on curve fitting procedures [172], and these analyses
are capable of showing differences between profiles in both level and shape. The latter
characteristic is especially important with respect to learning about differences in the
mechanism of dissolution. The characterization as to whether these are model-dependent
or model-independent methods depend on the data that are used to perform the
calculation. Model-independent methods use the dissolution data in their raw form or as a
simple transform, whereas, model dependent methods depend on mathematical functions
to describe the dissolution profiles.
5.2.5 Mixed-Effects Models
The evaluation of dissolution profiles using mixed effects models has been described by
Adams et al [ 179, 186]. This approach is considered to be superior to any other modelling
techniques since it takes into account the covariance structure of the data. In addition, a
118

distinction can be made between linear mixed effects (LME) and non-linear mixed effects
(NLME) models [ 179, 186] . The LME models make use of sophisticated maximum
likelihood estimation. In this estimation procedure, a distinction is possible between
'maximum likelihood' (ML) and 'restricted maximum likelihood' (REML) [187].
LME models allow for the accurate analysis of dissolution data and are much more
discriminatory than the h factor [ 179] . An example of this mechanistic model applied to
dissolution data was reported by Crowder [ 188]. However the method is reported to be
complicated and difficult to implement [ 179, 186].
The methods based on mixed effects models are not mentioned in any FDA or other
regulatory guidance documents and the extent to which these methods are used in the
assessment of dissolution test results is unknown [171]. Therefore, these studies were not
performed for dissolution data generated in these experiments.
5.2.6 Model-Dependent Models
Although mathematical models have been used extensively to characterize dissolution
profiles [172, 175], such methods are more complicated and require greater caution in
both their application and the interpretation of their outcomes [175].
5.2.6.1 Zero Order
Pharmaceutical dosage forms that release the same amount of drug per unit time in order
to achieve a prolonged and sustained pharmacological action usually conform to zero
order release characteristics and rates [189]. Equation 5.5 depicts the zero-order kinetic
model.
where
Qt = Qo+ Kot Eq. 5.5
Q, = the amount of drug released at time t,
Q0 = is the initial concentration of drug in the solution resulting from a burst
effect,
119

Ko = the apparent dissolution constant or zero-order release constant and
t =time.
Sood and Panchagnula [190] described zero-order systems as those in which the drug
release rate is independent of its concentration when applying this model to the
evaluation of the release from a controlled release system containing Diltiazem. This
model has been used for the linearization of drug release data from double-layered porous
films, in addition to release rate profiles from ethylcellulose, hydroxypropyl cellulose and
polyethylene glycol mixtures [189].
5.2.6.2 First Order
Gibaldi and Feldman [191] proposed the use of a first-order model to evaluate drug
dissolution studies, and equation 5.6 shows a mathematical expression for a first order
model.
where
Qr = the amount of drug released at time t,
Qo = the initial amount of drug in the solution,
K 1 =the first order release constant and
t =time.
Eq. 5.6
Pharmaceutical dosage forms such as those containing water-soluble drugs in porous
matrices, release drug in a manner that is proportional to the amount of drug remaining in
its interior and thus the amount of drug released per unit of time diminishes over time. A
graph of the natural logarithm of the amount of drug released versus time will be linear
[19l].The first-order equation describes drug release from systems in which the release
rate is concentration dependent [190].
120

5.2.6.3 Higuchi Model
Higuchi developed several theoretical models to describe the release of highly and poorly
water soluble drugs that had been incorporated in non-erodable semi-solid and/or solid
matrices [192, 193]. It is possible to reduce the Higuchi model to the expression as
depicted in equation 5.7.
where
Eq. 5.7
Q, = the amount of drug remaining in the pharmaceutical dosage form at time
t,
KH = the Higuchi dissolution constant and
t =time.
Higuchi described drug release as a functional process based on Fick's first law and
determined that the process is square root of time dependent [ 127, 185].
This model has been used for the linearization of drug release data from transdermal
systems [177] and from sustained release matrix tablets [194] containing water soluble
drugs.
5.2.6.4 Baker-Lonsdale Model
Baker and Lonsdale adopted the Higuchi model to describe the controlled-release of a
drug from a spherical matrix [195]. This model has also been used to fit drug release
from solid dispersions and physical mixtures of zolpidem in polyethylene glycol 4000
[196]. The mathematical relationship representing this model is depicted in equation 5.8.
Eq. 5.8
where
Q, = the amount of drug remaining in the pharmaceutical dosage form at time
t,
121

5.2.6.5
Qco = the maximal amount of drug released in infinite time,
Ks =the Baker-Lonsdale dissolution constant and
t =time.
Hixson-Crowell Model
The Hixson-Crowell cube root law is used to describe the release of drug from systems in
which there is a change in surface area and diameter of particles or tablets over time.
When this model is used, it is assumed that the release rate is limited by the dissolution
rate of the drug particles and not by diffusion of the drug that might occur through the
polymeric matrix these particles are made of [ 197]. Equation 5.9 depicts a mathematical
representation of the Hixson-Crowell model.
where
Eq. 5.9
Q0 = the initial amount of drug in the pharmaceutical dosage form,
Qc = the drug amount remaining in the pharmaceutical dosage form at time t,
Ks = a constant incorporating the surface/volume relationship and
t =time.
This expression may be applied to pharmaceutical dosage forms such as tablets in which
dissolution of drug occurs in planes that are parallel to the surface of the tablet and if the
dimensions of the dosage form diminish proportional! y [ 185]. This equation has been
used for the linearization of diltiazem hydrochloride release from modified guar gum
matrix tablets [135].
5.2.6.6 Weibull Model
Langenbucher [ 198] reported that the quantitative interpretation of dissolution rate data is
facilitated by the application of a general mathematical expression that describes the
entire curve in terms of meaningful parameters. The mathematical expression depicted in
equation 5.10 describes the Wei bull model developed by Langenbucher.
122

where
Q, Log [-ln (1- ( - ))] = fJ log t -log a
Qoo Eq. 5.10
Q, = the amount of drug remaining in the pharmaceutical dosage form at time t,
Qoo = the maximal amount of drug that can be released at infinite time
fJ = the shape parameter, and is obtained from the slope of the line,
a = the scale parameter, can be replaced by the more informative dissolution
time, Td and
t =time.
Td represents the time interval necessary for 63.2% of the drug present in a
pharmaceutical dosage form to dissolve or be released from the dosage form [148, 198].
This model can be successfully applied to almost all types of dissolution curves [198-
200] and this function has been used for the linearization of drug release data from
commercially available tablets and capsules [173, 201]. The Weibull shape parameter, fJ, [148] characterizes the dissolution profile as exponential (/J =1 or Case 1), sigmoid, S
shaped, with upward curvature followed by a turning point (/J > 1 or Case 2) or as
parabolic, with a higher initial slope and after that consistent with an exponential function
(/J < 1 or Case 3) [185, 194, 198].
5.2.6.7 Hopfenberg Model
The release of drugs from surface-eroding devices with several geometries was analyzed
by Hopfenberg, who developed a general mathematical equation describing drug release
from slabs, spheres and infinite cylinders displaying heterogeneous erosion [185]. This
relationship is depicted in equation 5.11.
- ' = 1- 1---M ( ko )" lv.foo C7oro
Eq. 5.11
where
123

M, = the released fraction of drug at time t,
Moo
k1 =equal to k0 / C0 r0 ,
ko = the erosion rate constant,
Co =the initial concentration of uniformly distributed drug in the matrix,
r0 =the initial radius of a sphere or cylinder or the half-thickness of a slab and
n = exponent describing the type of device.
The exponent, n, has values of 1 for a slab, 2 for a cylinder, and 3 for a sphere. The
model assumes that time-dependent diffusion resistances internal or external to the
eroding matrix do not influence the release kinetics from these dosage forms.
Karasulu et al [202] used this equation for the linearization of theophylline release from
different geometrically shaped erodable tablets.
The Hopfenberg model was not applied in the study because it yields complex
differential expressions and interpretation of these data is difficult.
5.2.6.8 Korsmeyer-Peppas
A comprehensive, simple, semi-empirical method suitable for analyzing drug release data
from polymeric systems and sometimes referred to as the power law was developed by
Korsmeyer et al [203]. The method has been applied to the analysis of release of drugs of
variable solubility and from a variety of systems [128, 134, 158, 168, 185, 190, 204 -
208]. The mathematical expression of this model is depicted in equations 5.12 and 5.13.
where
Mt n - =Kt or, Moo
M, log ( - ) = n log t + log k
Moo
Eq. 5.12
Eq. 5.13
124

Mt =the released fraction of drug at timet, Moo
k = a kinetic constant incorporating structural and geometrical characteristics
of the device,
n = diffusion exponent of drug release and
t =time.
The exponent n is used to give an indication of the type of release kinetics of a drug from
a dosage form [158, 168, 185]. Table 5.1 shows the interpretation of diffusional release
mechanisms from spherical and cylindrical dosage forms using different polymeric
compaction.
Table 5.1. Interpretation of diffusional release mechanisms from polymers
Release exponent (n) Shape Drug transport mechanism
0.45 cylinder Fickian
0.5 sphere Fickian
0.45 < n < 0.89 cylinder Anomalous
0.5 < n < 1.0 sphere Anomalous
0.89 cylinder Case-II transport
1.0 sphere Case-II transport
> 1.0 cylinder I sphere Super Case-II transport
When n-values are close to 0.5, drug transport occurs by Fickian diffusion only.
Anomalous behaviour corresponds to both diffusion and relaxation and is represented by
n-values of between 0.5 < n < 1.0 [134,158, 168, 185,207, 208]. Ann-value greater than
1.0 indicates that a drug is said to being released in a fashion termed, Case-II transport.
Equation 5.12 or 5.13 generally holds true for the characterization of the initial phases of
a drug release profile, usually, where Mt I Moo< 60% [134, 185, 207].
125

5.2.7 Other Release Parameters
Another parameter often used to characterize drug release profiles is tx%, sampling time.
The tx% parameter corresponds to the time necessary to release a determined percentage
of drug. Pharmacopoeias frequently use this parameter as an acceptance limit for a
specific batch when dissolution testing is a quality control release requirement (e.g., t45 min
~ 80%) [185].
5.2.8 Determination of Goodness of Fit
The co-efficient of determination (R2), the correlation co-efficient, the adjusted co
efficient of determination (R2adjusred), the sum squares of residuals (SSR), the mean square
error (MSE), the Akaike Information Criterion (AIC), and the F-ratio probability are
commonly used as drug-release model selection criteria [185].
It has been reported [177] that when comparing models with a different number of
parameters, the R2adjusred is more meaningful since it takes into account the effects of the
added model parameters in the model studied without over fitting. In this study, the
R \djusred was adopted to determine the best fit for models used to evaluate drug
dissolution or release phenomena. R2
adjusred values greater than 0.950 were considered
acceptable for these comparisons in this study. It is simple, less complicated, and faster to
use than other criteria and it gives a single value that can be used to determine the best
model.
The R 2adjusred is defined in equation 5.14 and was used in these studies.
where,
2 (n-1) ( 2) R adjusted = 1 - { ) 1 - R
n - p
n = number of dissolution data points,
p = number of parameters in the model and
R2 = coefficient of determination.
Eq. 5.14
126

5.3 RESULTS AND DISCUSSION
In order to elucidate the mechanism of drug release from tablets manufactured in our
laboratory, dissolution data were fitted to different models. Initially, the Korsmeyer
Peppas model was used to provide insight into the drug release mechanism. Other
mathematical models were employed to determine which model best described drug
release. Statistical comparisons using the student t-test method were undertaken to
determine if there were differences between the products tested in certain cases.
5.3.1 Similarity and Difference Factors
The in-vitro performance of VRP batches and Isoptin® SR were compared by evaluating
the f 1 and h factors. The fit factors f 1 and h are two indices that compare the dissolution
profiles of a REFERENCE formulation to that of a TEST formulation.
As previously reported by Gohel et al [209], the results derived from the application of h
are superior to those of individual time points and it is always desirable to undertake
dissolution profile comparison rather than to compare percent released at a specific time.
Figures 5.1 and 5.2 depict the mean in-vitro dissolution profiles of the tablets from
batches VRP021 , VRP023 and Isoptin® SR and Table 5.2lists the calculated values forf1
and f2. The values of h obtained for these comparisons are all greater than 50 and values
of f 1 are all less than or equal to 15 for both formulations indicating that they may be
considered similar to the REFERENCE product, Isoptin® SR. In all cases, the tablets
from other batches failed both the j, and h tests.
127

i ---;;o=---=~- =-----=·· --
1
1 100
al (/)
1.; so
· ~ 1 01
i 2
.~---'!=~- -c 60 ~ 0
41 .2: .i 40 :I E :I 0
20 --VRP021
---- rsoptin SA i ' 0 ~------~---------------------------------
0 5 10 15 20 25 ' Time (hrs)
-- J
Figure 5.1. Mean in-vitro dissolution profiles of tablets of batch VRP021 and Isoptin® SR (n =6)
r- ·12o - ----- ----' - --- - ---
I I i '00
,,
~ : : I ~ · <'II so ' 41 I Gi a:
Ol 2 60 c ~ 0
Cll >
:;:: t'll
40
:; E ,a 20
~- VRP023 :
--rsoptin SR
0 25 i 0 5 ll 15 20
l Time (hrs) __ j - ----------
Figure 5.2. Mean in-vitro dissolution profiles of tablets of batch VRP023 and Isoptin® SR (n =6)
128

The Sct values were calculated using AUCR1 and AUCTt values that had been determined
by the trapezoidal rule. The standard data for Sct and percent difference between AUCRt
and AUCTt (% AUC (dift)) are listed in Table 5.2.
Table 5.2. /~./2, % AUC (diff) and Sd values for VRP batches using lsoptin® SR as a reference.
FORMULATION FACTORS
It /2 % AUC (diffl sd
VRPOOI 521.0 7.1 84.7 1.28
VRP002 551 .0 6.0 85.7 1.33
VRP003 51.5 27.2 22.5 1.03
VRP004 33.6 34.3 17.3 0.95
VRP005 34.5 34.3 21.7 0.93
VRP006 24.1 45.6 4.4 0.56
VRP007 25.6 44.7 4.1 0.56
VRP008 23.2 48.8 6.6 0.38
VRP009 39.0 32.8 25.4 0.79
VRPOIO 39.0 33.4 21.5 0.76
VRPOil 34.7 39.6 8.6 0.49
VRP012 39.6 36.4 8.6 0.49
VRP013 39.3 37.1 8.1 0.54
VRP014 70.3 21.2 32.0 1.17
VRP015 151.6 15.1 50.0 1.25
VRP016 32.1 41.6 11.5 0.41
VRP017 34.7 40.2 7.5 0.53
VRP018 38.2 37.5 2.0 0.67
VRP019 35.4 39.5 2.7 0.61
VRP020 31.3 46.4 0.7 0.62
VRP021 15.2 55.7 8.5 0.22
VRP022 32.4 41.5 6.5 0.34
VRP023 12.4 58.1 10.0 0.12
It is evident from Table 5.2 that there seems to be a relationship between the calculated
fz and Sct values determined in this study. Tablets from batches VRP021 and VRP023,
which showed fz values of greater than 50 presented Sct values of less than or equal to
129

0.22. From a practical standpoint, the selection of a limit point to determine similarity
based on this new factor may not provide convincing results, but it has been shown that
when the Sd value is close to zero, the dissolution profiles show similarity and when the
value approaches unity the dissolution profiles may not be similar as observed with
tablets from batches VRP001 -VRP005 and VRP014-VRP015.
The values for % AUC (diff) between TEST and REFERENCE products were also
compared to determine whether or not a relationship exists between h and % AUC (diff)·
Tablets from batches VRP021 and VRP023, which showed h values of greater than 50,
presented % AUC (cliff) values of less than or equal to 10.0 %. A number of batches,
VRP006-VRP008, VRP011-VRP013, VRP017-VRP020 and VRP022 had% AUC (diff) of
less than 1 0.0%, although they were not similar based on h values. Therefore, it is not
possible to correlate% AUC (diff) andh values due to the variable results obtained.
The Sd factor may be used to compare dissolution profiles and seems to be applicable and
it was observed that there is a relationship that exists between the h factor and Sd. The
% AUC (diff) approach simply looks at the difference in area yet there may be differences
in shape if the dissolution profiles do not overlap, resulting in small area differences.
Therefore, inaccurate conclusions that dissolution profiles are similar may be drawn
when in fact they are not using the % AUC Cdiff) approach.
5.3.2 Mechanism of Release
The dependence of drug release mechanism on pH of the dissolution medium was studied
at constant and variable pH's using USP apparatus 1 and 3, respectively.
5.3.2.1 EffectofpH
In order to assess the impact of a constant pH dissolution medium on the kinetic rate
constant, dissolution testing was performed in media of pH 1.6, 4.6, 6.8 and 7.4
individually. Data were fitted to the Korsmeyer-Peppas model and the kinetic constants
calculated. A plot of kinetic constant versus pH is depicted in Figure 5.3 and the best fit
model parameters are listed in Table 5.3.
130

At a pH of 1.6, the average values of K were high and as the pH increased to 4.6, the rate
constants decreased to a minimum value between pH 5.0 and pH 6.0 after-which the
release rate constants increased. However, the opposite effect was seen with the
Isoptin ® SR product.
r-·---··-------·- ·----·- ---------1 20 .
I I
.. 1: C'll .. rn 1: 0
(..) C)
i 1:
~
16
12
8 ·
4
I
I o 2 4 6 8
L Buffer pH I 1
-----·. ·-· .. . .... - - -------.. ---+- VR~21 -vR~23- Jsoptin SR
-- - ------------- -- ---·-··- -- -·---·· - -- - . ----- ·- - . -.
Figure 5.3. pH effect on the Kinetic constant of VRP021, VRP023 and Isoptin ® SR
The lowest average kinetic constant was determined at pH 6.8 for VRP021 and VRP023.
There is a direct relationship between total percent dmg released and the kinetic rate
constant. Therefore, the decrease in kinetic rate constants for batches VRP021 and
VRP023 at higher pH values may be due to the increase in the diffusional path length for
the dmg to diffuse or to the decreased solubility of VRP at these pH's.
The release exponent n was found to have values of between 0.50 and 1.00 for batches
VRP021 , VRP023 and Isoptin® SR formulations at pH's 1.6, 4.6 and 7.4, indicating that
the release mechanism from these dosage forms was non-Fickian at all pH' s. The release
mechanism thus involves a combination of both diffusion and chain relaxation
mechanisms, thus indicating that anomalous transport kinetics are prevalent.
131

Table 5.3. Summary of Korsmeyer-Peppas best fit parameters for batches VRP021, VRP023 and Isoptin® SR in dissolution media of different pH using USP apparatus I
Formulation Mt/~ Time (hrs) pH Kinetic constant Release exponent Coefficient of determination (K) (n) (Rz)
VRP021 0.32 2 1.6 17.60 0.8443 1.0000
0.70 6 17.90 0.7644 0.9982
0.92 10 18.34 0.7219 0.9952
0.95 14 19.05 0.6631 0.9809
0.95 22 20.48 0.5665 0.9281
VRP021 0.08 2 4.6 5.000 0.6781 1.0000
0.20 6 4.869 0.7792 0.9971
0.25 10 4.900 0.7256 0.9935
0.28 14 5.132 0.6811 0.9864
0.40 22 5.176 0.6713 0.9814
VRP021 0.04 2 6.8 1.500 1.4150 1.0000
0.12 6 1.610 1.1460 0.9906
0.18 10 1.667 1.0698 0.9896
0.21 14 1.741 1.0001 0.9833
0.35 22 1.768 0.9838 0.9871
VRP021 0.26 2 7.4 10.50 1.3301 1.0000
0.55 6 11.74 0.9038 0.9640
0.77 10 12.11 0.8389 0.9722
0.78 14 12.76 0.7566 0.9555
0.78 22 13.92 0.6567 0.9124
132

Table 5.3 continued.
Formulation Mt/Ma:. Time (hrs) pH Kinetic constant Release exponent Coefficient of determination (K) (n) (R2)
YRP023 0.29 2 1.6 14.00 1.0506 1.0000
0.60 6 14.67 0.7989 0.9982
0.93 10 14.96 0.7947 0.9952
0.97 14 15.27 0.7408 0.9800
0.97 22 16.72 0.6508 0.9387
VRP023 0.04 2 4.6 2.000 1.0000 1.0000
0.15 6 1.932 1.1317 0.9977
0.22 10 1.985 1.0730 0.9957
0.26 14 2.062 1.0123 0.9899
0.36 22 2.155 0.9614 0.9859
VRP023 0.04 2 6.8 1.000 1.9000 1.0000
0.10 6 1.220 1.2441 0.9401
0.15 10 1.290 1.1 235 0.9518
0.36 14 1.222 1.2088 0.9627
0.42 22 1.263 1.1711 0.9698
YRP023 0.19 2 7.4 7.000 1.4632 1.0000
0.41 6 7.985 0.9637 0.9557
0.60 10 8.233 0.8969 0.9689
0.63 14 8.647 0.8191 0.9594
0.63 22 9.461 0.7159 0.9198
133

Table 5.3 continued.
Formulation M, / M.r Time (hrs) pH Kinetic constant Release exponent Coefficient of determination (K) (n) (R2)
Isoptin® SR 0.25 2 1.6 14.40 0.8188 1.0000
0.55 6 14.67 0.7483 0.9985
0.72 10 14.96 0.7054 0.9955
0.84 14 15.27 0.6735 0.9928
0.95 22 15.83 0.6314 0.9840
Isoplin SR 0.16 2 4.6 7.000 1.1926 1.0000
0.46 6 7.282 1.0426 0.9965
0.67 10 7.491 0.98 11 0.9941
0.72 14 7.861 0.9047 0.9817
0.75 22 8.594 0.8024 0.9490
Isoptin SR 0.17 2 6.8 9.000 0.9175 1.0000
0.46 6 9.018 0.9101 1.0000
0.70 10 9.083 0.8944 0.9997
0.77 14 9.406 0.8391 0.9913
0.77 22 10.20 0.7462 0.9585
Isoptin SR 0.17 2 7.4 7.400 1.1569 1.0000
0.47 6 7.678 1.0223 0.9970
0.77 10 7.726 1.0054 0.9982
0.87 14 8.000 0.9505 0.9928
0.87 22 8.764 0.8458 0.9590
134

It is evident that pH has no effect on the mechanism of drug release from Isoptin ® SR as
can be seen in Figure 5.4. The values for n remained relatively unchanged when the ratio
of drug release was in the region of approximately 60%. The mechanism of release can
still be attributed to anomalous transport kinetics.
r- -1.4··:.::..::.::_-~·=--:
I
1.2
.. c G)
I[ ' )( 0.8 w G) Vl Ill G)
Gi a: 0 .6
0 .4
SuperCase II
NonFickian
Fickian
0.2 ~---~----~-~----~---___.
l __ o ___ ..c..F_~_: __ - -v.:....c __ R __ ~~ ~_. -_tt_·~~· -;- -o:p,T_n_S;
8 '
I
_ ___ _j
Figure 5.4. pH effect on the release exponent (n-value) for batches VRP021 and VRP023 and lsoptin® SR using USP apparatus 1.
Tablets from batch VRP023 showed an increase inn-values when the dissolution medium
was increased to 4.6, and in all cases n-values of greater than 1 were obtained, indicating
that Super-Case II transport was evident. The release mechanism remained relatively
unchanged for tablets from batch VRP021 when the pH was increased to pH 4.6. A
further increase in pH to 6.8 revealed a corresponding increase inn-value for tablets from
batches VRP021 and VRP023. However, values of n for Isoptin® SR approached 1.0 at
all tested pH' s indicating that the mode of release was approaching zero-order and may
not be controlled purely by relaxation of the polymer used in this product. Figure 5.4 also
reveals that when the pH was increased to 7.4, the release can be considered Case-II
transport for the tablets from batch VRP023 and Isoptin® SR. An observed shift from
Super Case-II to a non-Fickian transport mechanism was observed for VRP021 at pH 7.4.
135

It is therefore clear that at pH's 6.8 and 7.4 Isoptin® SR seems to follow zero-order
kinetic release. In this study, pH was shown to play an important role in control of the
release mechanism of VRP from batches VRPP021 and VRP023, however, drug release
from Isoptin® SR was not affected to any great extent. Therefore, during the course of
transit of the dosage form in the gastro-intestinal tract, the release from the product may
show different release mechanisms if the formulation were to reside in one place in the
gastro-intestinal tract for any prolonged period of time.
The complexity of the formulations tested and the components used in sustained release
products is indicative that drug release is controlled by more than one process and the
effects of formulation composition and test methodology on drug release must be
thoroughly investigated in formation development studies.
Dissolution was also performed using a sequence of changing pH using USP apparatus 3.
The values of K, n and R2 following linear regression of dissolution data are listed in
Table 5.4. The kinetic constant, K did not show any appreciable difference between the
batches VRP021 and VRP023, but values obtained for Isoptin® SR tablets were slightly
lower. For all formulations, VRP021, VRP023 and Isoptin ® SR, the n-values fall between
0.50 and 1.00, indicating that the release mechanism was non-Fickian, involving a
combination of either diffusion and chain relaxation mechanisms or anomalous transport
kinetics. It is evident from Table 5.4 that the values of n seem to remain relatively
constant with increase in time, however release profiles did not show Case-II transport or
that zero-order release was occurring.
It is evident that the calculated kinetic constant as depicted in Figure 5.3 was constantly
changing when dissolution testing was undertaken using USP apparatus 1. However, the
kinetic constant remained relatively unchanged for the duration of the dissolution testing
when using USP apparatus 3 as seen in Table 5.4.
The release exponent as described showed an appreciable increase for batches VRP021
and VRP023 when the dissolution medium was increased from pH 1.6 to 6.8 indicating
that both anomalous and Super Case-II transport was occuring. n-Values for Isoptin® SR
136

remained relatively unchanged for the duration of the dissolution testing and transport
was attributed to anomalous transport. When using USP apparatus 3 the release exponent
was found to have values of between 0.5 and 1.0 for all batches tested indicating that the
release from these dosage forms was due to a combination of diffusion, swelling and
erosion.
137

Table 5.4. Summary of Korsmeyer-Peppas best fit parameters for batches VRP021, VRP023 and Isoptin® SR in dissolution media of different pH using USP apparatus 3
Mr Formulation Time (hrs) pH Kinetic constant Release exponent coefficient of determination
M ... (K) (n) (Rz)
VRP021 0.23 2 1.6 15.99 0.6 167 1.0000 0.56 6 4.6 14.93 0.7420 0.9951 0.80 10 6.8 14.52 0.7415 0.9975 0.85 14 7.4 14.51 0.6971 0.9903 0.85 22 7.4 15.00 0.6185 0.9563
VRP023 0.19 2 1.6 13.00 0.5475 1.0000 0.57 6 4.6 12.06 0.8409 0.9794 0.80 lO 6.8 12.11 0.8265 0.9890 0.84 14 7.4 12.56 0.7693 0.9809 0.84 22 7.4 13.59 0.6790 0.9452
Isoptin® SR 0.18 2 1.6 10.00 0.8480 1.0000 0.64 6 4.6 9.490 1.0468 0.9938 0.92 10 6.8 9.700 0.9998 0.9949 0.94 14 7.4 10.04 0.9138 0.9787 0.94 22 7.4 11.32 0.7989 0.9370
138

5.3.3 Mathematical Models
Mathematical models have been used extensively for the parametric representation of
dissolution data. In this study, a summary of the mathematical models used to evaluate
dissolution data is listed in Table 5.5.
Table 5.5. Mathematical representation of models used to describe the release profiles of batches VRP021, VRP023 and lsoptin® SR
Model
Zero-order
First-order
Higuchi
Hixson-Crowell
Baker-Lonsdale
Weibull
Equations
Q, = Qo +Kat
Ln Q1 = Ln Qo + K1 t
Q, = KH t 112
Qo 113 _ Q, 113=Ks t
Qr Log [-ln (1 - ( -))] = j]log t - log a
Q ..
The most important aspect to consider when developing new pharmaceutical products or
evaluating drug release mechanisms is the suitability of the predictive ability and
accuracy of any model chosen to describe the release process.
The criterion used for selecting the most appropriate model was based on goodness of fit
[172, 173,175, 185, 190] as it is a convenient and common metric that is used to
determine the fitting of data to a model and that has been used by pharmaceutical
scientists, despite limitations this parameter may have [175]. In this study, the adjusted
coefficient of determination (R2adjusled) was used to compare models with different
numbers of parameters as variable numbers of model parameters may lead to an
inappropriate decision as a result of over-fitting [185] .
139

5.3.3.1 Modelling
The results of the analysis of dissolution testing in a constant pH dissolution medium
using the models depicted in Table 5.5 are shown in Table 5.6. The results of modelling
were interpreted by considering the R2adjusted value at constant pH's.
After fitting individual unit dissolution data at pH 1.6 to the various models, the highest
R2adjusted values were observed when the release data were fitted to a Weibull function for
tablets from batch VRP021 and Isoptin ® SR. Tablets from batch VRP023 were best fitted
to the Hixson-Crowell model.
At pH 4.6, the highest R2adjusted values were observed when the release data were fitted to
the Wei bull model for tablets from batches VRP021, VRP023 and Isoptin ® SR. At pH
6.8, the highest R2adjusted values were observed when the release data were fitted to the
zero-order model for tablets from batch VRP023 and to the Weibull model for batch
VRP021 and Isoptin® SR. At pH 7.4, the highest R2adjusted values were observed when the
release data were fitted to the Hixson-Crowell model for tablets from batch VRP021 and
to zero-order for tablets from batch VRP023 and Isoptin® SR. These results indicate that
the release pattern the different formulations may change at different pH's if using USP
apparatus 1 .
The Weibull model parameters describe the shape (/3) of the profiles and determines the
63.2% dissolution time (Td). Evaluation of j3 for batch VRP021 revealed there was no
statistically significant difference between values determined at the different pH's (p>
0.05) when using a two side-t-test. Figure 5.5 depicts the effects of pH on the shape
parameter of VRP021 , VRP023 and Isoptin® SR using USP apparatus I. It is evident that
the value of j3 ranged from 0.700 to approximately 1.400. This is indicative of changing
dissolution profiles with changes in medium pH. The shape parameter characterizes the
profile of tablets from batch VRP021 as one with a steeper initial slope (/3 <1) for lower
pH values and that subsequently changes to an S-shaped profile with upward curvature
followed by turning point (/3 > 1) at higher pH values. A similar S-shaped profile was
observed for batch VRP023.
140

Table 5.6. Resultant model parameters obtained after fitting dissolution data obtained using USP apparatus I for batches VRP021, VRP023 and Isoptin(r) SR
Formulation Time pH Zero-order First-order Higuchi Hixson-Crowell Baker-Lonsdale Weibull
YRP021
YRP021
YRP021
YRP021
(hr)
2
6
10
14
22
2
6
10
14
22
2
6
10
14
22
2
6
10
14
22
1.6
4.6
6.8
7.4
1.0000 17.000 1.0000 2.8679 1.0000 28.7790 1.0000 0.2901
0.9957
0.9816
0.9660
0.9066
0.7537
1.0000
0.9796
0.9907
0.9588
0.9289
0.9470
1.0000
0.9766
0.9980
0.9947
0.9747
0.9895
1.0000
0.9878
0.9795
0.9736
0.9082
0.7523
15.500
11.2 10
8.7860
6.8598
4.3422
5.0000
4.0000
3.2169
2.4979
1.9936
1.7307
1.5000
2.0000
2.0301
1.8401
1.5740
1.5599
10.500
13.000
9.1747
7.6221
5.7830
3.6492
0.8729
0.6188
0.5941
0.5592
0.4603
1.0000
0.9090
0.7736
0.7336
0.6995
0.6599
1.0000
0.9457
0.9362
0.8946
0.8461
0.7995
1.0000
0.9402
0.6785
0.6501
0.6063
0.4966
1.7266
0.5534
0.3363
0.2327
0.1396
1.6094
1.0397
0.4 194
0.2660
0. 1916
0. 1305
0.4055
0.6931
0.4080
0.2872
0.2151
0.1534
2.3510
1.6370
0.5464
0.3388
0.235 1
0.1412
0.97 17
0.9623
0.9799
0.9764
0.9222
1.0000
0.9917
0.9477
0.9736
0.9808
0.9843
1.0000
0.8637
0.8820
0.9293
0.9564
0.9403
1.0000
0.8809
0.9428
0.9678
0.9676
0.9150
28.7790 0.9991
28.7790 0.9990
30.3540 0.9994
28.1840 0.9742
23.4560 0.8376
13.7240 1.0000
13.7240 0.9816
13.7240 0.9940
15.4710 0.9664
16.0290 0.9399
16.2140 0.9643
15.1820 1.0000
I 5. I 820 0.9786
15. 1820 0.9979
18.6000 0.9964
20.2940 0.9793
19.8060 0.991 1
23.1040 1.0000
23. 1040 0.9792
23.1040 0.9903
25.3660 0.9969
23.6610 0.9463
19.7400 0.7955
0.2760
0.2532
0.2609
0.2208
0.1467
0.0786
0.0636
0.0539
0.0424
0.0345
0.0315
0.0233
0.0314
0.0323
0.0304
0.0263
0.0275
0.1653
0.2254
0.1804
0.1780
0.1410
0.0902
1.0000
0.9073
0.675 1
0.6184
0.5681
0.4608
1.0000
0.9092
0.8313
0.7974
0.7645
0.7362
1.0000
0.9948
0.9376
0.9161
0.879 1
0.8626
1.0000
0.9717
0.7446
0.7022
0.6479
0.5275
ks
0.2951
0. 1900
0.0649
0.0384
0.0261
0.0156
0.1536
0.0992
0.0449
0.0297
0.0219
0.0155
0.0762
0.0677
0.0381
0.0281
0.0217
0.0165
0.2288
0.1766
0.0645
0.0402
0.0279
0.0168
1.0000
0.9996
0.9949
0.9953
0.9709
1.0000
0.9966
0.9936
0.9886
0.9921
1.0000
0.9919
0.9916
0.9862
0.9903
1.0000
0.9785
0.9891
0.9798
0.9430
f3
0.9723
1.0228
1.0997
1.0729
0.9697
0.7365
0.7343
0.7747
0.8274
0.7010
1.0370
1.0370
1.0713
1.0905
1.0680
1.4663
1.0807
1.0780
1.0026
0.8846
141
5.42
19.21
57.35
7.74

Table 5.6 continued.
Formulation
VRP023
YRP023
VRP023
VRP023
Time pH
(hr)
2
6
10
14
22
2
6
10
14
22
2
6
10
14
22
2
6
10
14
22
1.6
4.6
6.8
7.4
Zero-order
1.0000
0.9996
0.9737
0.9882
0.9422
0.7939
1.0000
1.0000
0.9952
0.9923
0.9751
0.9734
1.0000
0.9231
0.9857
0.9892
0.9139
0.9445
1.0000
0.9774
0.9785
0.9834
0.9355
0.7865
14.000
14.500
9.6506
8.9709
7.2926
4.7590
2.0000
2.0000
2.5422
2.2762
1.9582
1.7105
1.0000
2.0000
1.6968
1.5262
2.315 1
2.0533
7.0000
9.5000
6.7590
5.9360
4.6817
3.0118
First-order
1.0000
0.8768
0.6299
0.6057
0.5902
0.5238
1.0000
1.0000
0.9620
0.9045
0.8524
0.7699
1.0000
0.8500
0.8102
0.8035
0.8776
0.7987
1.0000
0.9666
0.7205
0.7025
0.6616
0.5455
2.6391
1.6836
0.5404
0.3439
0.2422
0.1468
0.693 1
0.6931
0.4309
0.3007
0.2250
0.1528
0.6931
0.6931
0.3944
0.2617
0.2346
0. 1588
1.9459
1.4722
0.5154
0.3315
0.2343
0. 1423
Higuchi Hixson-Crowell
1.0000
0.9365
0.9615
0.9608
0.9719
0.9391
1.0000
0.9459
0.8558
0.9194
0.9502
0.9669
1.0000
0.7567
0.8894
0.9345
0.7769
0.8039
1.0000
0.8541
0.9335
0.9581
0.9683
0.9259
17.6000 1.0000
21.4680 0.9972
24.8640 0.9932
30.3540 0.9757
28.1840 0.9801
23.4560 0.8642
5.00000 1.0000
5.53550 1.0000
8.15850 0.9936
8.38010 0.9942
8.617 10 0.9807
8.11 030 0.9803
1.00000 1.0000
2.49070 0.9216
4.18420 0.9869
4.97490 0.9914
9.58980 0.8913
8.45140 0.9410
7.00000 1.0000
12.4190 0.9695
17.2590 0.9874
19.7560 0.9955
18.8960 0.9565
15.9710 0.81 17
0.2276
0.2504
0.2010
0.2626
0.2399
0.1645
0.0312
0.0314
0.0416
0.0382
0.0334
0.0279
0.0157
0.0314
0.0273
0.0249
0.0408
0.0375
0.1109
0.1601
0.1249
0. 121 2
0.0992
0.0647
Baker-Lonsdale
1.0000
0.9393
0.7029
0.6666
0.6173
0.5036
1.0000
0.9636
0.9545
0.9214
0.8819
0.8208
1.0000
0.9953
0.9143
0.9022
0.9538
0.8941
1.0000
0.9868
0.7950
0.7700
0.7184
0.5897
0.2644
0. 1836
0.0641
0.0395
0.0274
0.0164
0.0905
0.0677
0.0423
0.0310
0.0239
0.0169
0.0596
0.0677
0.0351
0.0258
0.0257
0.0190
0.1848
0.1540
0.0609
0.0400
0.0284
0.0173
1.0000
0.9940
0.9755
0.9837
0.9704
1.0000
0.9969
0.9963
0.9918
0.9903
1.0000
0.9431
0.9555
0.9600
0.9701
1.0000
0.9679
0.9821
0.9757
0.9409
Weibull
1.1832
0.9968
1.1749
1.1932
1.099 1
1.2646
1.1897
1.1 786
1.1152
1.0089
2.0221
1.2707
1.1552
1.2708
1.2494
1.5637
1.0867
1.0583
0.9848
0.8691
6.88
47.00
81.00
11.45
142

Table 5.6 continued.
Formulation Time pH
lsoptin® SR
lsoptin® SR
Isoptinc+ SR
lsoptin" SR
(hr)
6
10
14
10
14
22
6
10
14
10
14
22
6
10
14
10
14
22
6
10
14
10
14
22
1.6
4.6
6.8
7.4
Zero-order First-order
1.0000
0.9944
0.9789
0.9632
0.9472
0.8957
1.0000
0.9948
0.9993
0.9923
0.9492
0.8250
1.0000
0.9988
0.9982
0.9962
0.961 1
0.8 184
1.0000
0.9965
0.9993
0.9997
0.9755
0.8398
14.400
12.700
8.8386
7.0453
5.8765
4.3891
7.0000
8.0000
7.6988
6.8052
5.4598
3.6503
9.0000
8.5000
1.0000
0.8768
0.6299
0.6057
0.5902
0.5238
1.0000
0.9485
0.7726
0.7480
0.7002
0.5847
1.0000
0.9081
7.5663 0.7258
6.6980 0.7 173
5.7177 0.6824
3.7473 0.5687
7.4000
8.2500
7.8494
7.7090
6.5495
4.3549
1.0000
0.9425
0.7634
0.7567
0.7232
0.6023
2.6672
1.6174
0.5259
0.3211
0.2290
0.1454
1.9459
1.3863
0.5413
0.3496
0.2490
0.1534
2.1972
1.4166
0.5254
0.3417
0.2446
0. 1501
2.0000
1.4017
0.5407
0.3599
0.2610
0.1609
Higuchi Hixson-Crowell
1.0000
0.9754
0.9662
0.9821
0.9888
0.9876
1.0000
0.9088
0.8981
0.9400
0.9598
0.9388
1.0000
0.9602
0.9214
0.9439
0.9640
0.9374
1.0000
0.9159
0.9021
0.9229
0.9524
0.9343
14.4000 I .0000
17.3030 0.9976
22.7690 0.9950
23.8590 0.9924
23.7710 0.9925
22.5070 0.9970
7.00000 1.0000
10.5170 0.9922
18.9250 0.9983
22.2130 0.9995
21.7360 0.9737
19.0120 0.8713
9.00000 1.0000
11.4630 0.9997
18.8500 0.9999
22.7470 0.9985
22.5680 0.9835
19.5660 0.8555
7.40000 1.0000
10.8740 0.9942
19.2490 0.9987
24.7630 0.9887
25.5520 0.9927
22.3970 0.8840
0.2344
0.2160
0.1786
0.1601
0.1499
0.1496
0. 1109
0.1310
0.1459
0.1454
0.1229
0.0857
0.1430
0.1398
0.1437
0.1527
0.1339
0.0903
0.1 174
0.1354
0.1488
0.1776
0. 1697
0.1 184
Baker-Lonsdale
1.0000
0.9107
0.7075
0.6673
0.6307
0.5276
1.0000
0.9689
0.8542
0.8103
0.75 16
0.6205
1.0000
0.9354
0.8155
0.7885
0.7367
0.6071
1.0000
0.9649
0.8464
0.8158
0.7601
0.6243
0.2681
0.1738
0.0624
0.0384
0.0274
0.0165
0.1848
0.1410
0.0639
0.0421
0.0301
0.0185
0.21 12
0.1766
0.0645
0.0432
0.0279
0.0168
0.1904
0.143 1
0.0639
0.0429
0.0308
0.0189
1.0000
1.0000
1.0000
0.9998
0.9892
1.0000
0.9993
0.9996
0.9934
0.9698
1.0000
0.9993
0.9996
0.9935
0.9698
1.0000
0.9996
0.9959
0.9973
0.9779
WeibuU
fJ
0.9183
0.9197
0.9189
0.9289
0.9973
1.2646
1.1897
1.1786
1.1152
1.0089
1.2646
1.8976
1.1786
1.1152
1.0871
1.2501
1.2484
1.2501
1.2484
1.1409
6.88
11.00
11 .78
8.41
143

1.6 r------------------
1.4
sigmoid
exponential
I ~ lm 0.8
0.6 , parabolic
0.4 0 2 4 6 8
I Buffer pH I .-- -- ··-- ·- -- - ·- -- -···- .. I
j L-:::- ls_optin_ SA _:----_ :'__ RRJ2~ ---- ls_~tin_ SA 1
L- -· -- - - ---- -- --- ----- -· -------I
·-- J
Figure 5.5. pH effect on the shape parameter for batches VRP021 , VRP023 and Isoptin® SR using USP apparatus I .
Evaluation of the T d values of tablets from batches VRP021, VRP023 and Isoptin ® SR
revealed that · there was a statistically significant difference between the values
obtained at pH's 4.6 and 6.8 (p < 0.05) using USP apparatus 1. It is evident (Figure
5.6) that at pH 1.6 it takes less than 8 hours for all dosage forms to release at least
63.2% of VRP from the dosage forms. As the pH is increased to 4.6, the time taken to
dissolve 63.2% of the drug had not been reached after 22 hours with only about 35-
45% drug released. The predicted T d values if dissolution testing had been allowed to
continue would have been 19.21 and 47.00 hours for VRP021 and VRP023,
respectively. This increase was also observed at pH 6.8 for tablets from batches
VRP021 and VRP023. A pH of 7.4 is higher than the pKa of Carbopol® and the Td
values decreased for tablets from batches VRP021 and VRP023 whereas those for
Isoptin® SR remained slightly less than the values obtained at pH 6.8.
It was expected that the Td value obtained for batch VRP021 at pH 7.4 was going to be
higher as swelling studies (§ 4.3.3.2, Figure 4.19) showed a higher rate of swelling for
tablets from batch VRP021 than for VRP023. A high degree of swelling will result in
an increased diffusional path length through which the drug must pass, which in tum
may prolong drug release. The results obtained for the REFERENCE product,
144

Isoptin® SR were as expected, with Td values remaining relatively constant in all pH's
tested since swelling observed for this formulation was constant at all pH levels.
Q) 30 E
i= 20
10
o . 0 2 3 4 5 6 7 a I
Buffer pH I --· -- -]
l-+-VRP021 - VRRl23 - lsoptin SA -----·- --- --- -· -J
I I
Figure 5.6. pH effect on time parameter (Td) of batches VRP021, VRP023 and Isoptin® SR using USP apparatus 1.
Dissolution testing was also performed using a sequential increase in the pH of the
dissolution media (USP apparatus 3). The results of the analysis of dissolution data
using the models depicted in Table 5.5 are shown in Table 5.7. The results of
modelling were interpreted by considering the R2adjusted value at the different pH's a
product is likely to be exposed to in the gastro-intestinal tract. The highest R2 adjusted
values were observed when the release data were fitted to several models (zero-order,
Hixson-Crowell and Weibull model).
Fitting drug release data to the zero-order model revealed Ko (rate constant) values
between 4.000-15.000, 4.036-13.000 and 4.658-10.000 for batches VRP021, VRP023
and Isoptin® SR, respectively. A two-sided t-test conducted at the 95% level of
significance (a. = 0.05) revealed that there was no statistically significant difference
(p > 0.05) between the Ko values obtained for the different formulations in all cases.
145

A similar trend was observed when the data were fitted to the first-order, Higuchi,
Hixson-Crowell and Baker-Lonsdale models. There were no statistically significant
differences (p > 0.05) between the kinetic constant values obtained for the different
formulations at a 95% level of significance for all products.
In order to assess whether ,8-values for VRP021, VRP023 versus Isoptin® SR obtained
from the Weibull model were significantly different, a comparison of the ,8-values was
performed using a two-sided t-test at 95% level of significance. No significant
differences were observed for these assessments implying that the dissolution profiles
of both VRP021 and VRP023 were similar to Isoptin® SR (p > 0.05) in terms of the
shape parameter. The Td values obtained were compared using a two-sided t-test and
were found to be similar (p> 0.05) for all comparisons.
The drug release data for tablets from batches VRP021 and VRP023 were best fitted to
the zero-order, Hixson-Crowell and Weibull models with average R2adjusted values
higher than 0.970. The drug release data from Isoptin® SR were best fitted to the zero
order model.
146

Table 5.7. Resultant model parameters obtained after fitting dissolution data obtained using USP apparatus 3 for batches VRP021, VRP023 and lsoptin® SR
Formulation Time pH Zero-order First-order Higuchi Hixson-Crowell Baker-Lonsdale Wei bull
(hr) Rz ko Rz k/ Rz kH Rz kHc Rz ks Rz p Td
VRP021 1.6 1.0000 15.000 1.0000 0.2708 1.0000 15.0000 1.0000 0.2448 1.0000 0.2735 1.0000 0.6855
2 3.4 0.9700 11.500 0.8501 1.5677 0.9963 16.0300 0.9773 0.1936 0.8792 0.1665 1.0000 0.6855
6 4.6 0.9865 8.9393 0.6379 0.5266 0.9554 22.8120 0.9970 0.1814 0.7195 0.0625 0.9892 0.9165
10 6.8 0.9853 7.7878 0.6320 0.3314 0.9683 25.8920 0.9984 0.1891 0.6897 0.0392 0.9887 0.9999
14 7.4 0.9405 6.1897 0.6036 0.2337 0.9767 24.9740 0.9782 0.1625 0.6435 0.0274 0.9915 0.9802 6.71
22 7.4 0.7428 3.9967 0.5013 0.1417 0.9350 21.1970 0.8450 0.1086 0.5275 0.0166 0.9692 0.8883
VRP023 1.6 1.0000 13.000 1.0000 0.2565 1.0000 13.0000 1.0000 0.2105 1.0000 0.2549 1.0000 0.5975
2 3.4 0.9567 9.5000 0.8449 1.4722 0.9994 13.3550 0.9634 0.1574 0.8706 0.1529 1.0000 0.5975
6 4.6 09954 9.2892 0.6907 0.5407 0.9151 23.0950 0.9945 0.1892 0.7793 0.0643 0.9706 1.0290
10 6.8 0.9872 8.0058 0.6756 0.3428 0.9510 26.3530 0.9982 0.1933 0.7372 0.0408 0.9833 1.0939
14 7.4 0.9357 6.2862 0.6380 0.2415 0.9638 25.2580 0.9707 0.1622 0.6819 0.0286 0.9855 1.0550 8.08
22 7.4 078494 4.0358 0.5267 0.1464 0.9230 21.3700 0.8326 0.1074 0.5565 0.0173 0.9598 0.9481
Isoptin~ SR 1.6 1.0000 10.000 1.0000 2.3026 1.0000 10.0000 1.0000 0.1602 1.0000 0.2232 1.0000 0.9134
2 3.4 0.9959 9.0000 0.8950 1.4452 0.9712 12.2440 0.9980 0.1486 1.0000 0.2232 1.0000 0.9134
6 4.6 0.9969 10.474 0.7630 0.5781 0.8704 26.0390 0.9870 0.2289 0.9240 0.1491 0.9856 1.2882
10 6.8 09909 9.4593 0.7345 0.371 1 0.9280 30.7040 0.9885 0.2666 0.8445 0.0686 0.9882 1.3931
14 7.4 0.9300 7.3119 0.6828 0.2609 0.9459 29.1960 0.9650 0.2238 0.7759 0.0432 0.9879 1.3358 6.58
22 7.4 0.7748 4.6576 0.5583 0.1579 0.9065 24.6030 0.8288 0.1482 0.7066 0.0301 0.9603 1.1970
147

5.4 CONCLUSION
Drug delivery systems manufactured using matrix polymers have been assessed and the
release characteristics were found to be affected by factors such as the degree of polymer
swelling and the characteristics of the dissolution medium and test parameters.
Mathematical models were used to describe drug release from batches VRP021, VRP023
and lsoptin® SR product.
The selection of an appropriate model for the analysis of drug release provides insight to
the underlying mass transport mechanism of drug release. Mini-tablets were evaluated
using in-vitro dissolution studies in different dissolution media. The !1 and h factors were
used for the selection of the most appropriate formulations. The dissolution profiles of
batches VRP021 and VRP023 were found to be similar to that of Isoptin ® SR using both
USP apparatus 1 and 3.
An exploratory data analysis method was used in the first step to compare the dissolution
profiles graphically. The preferred model selected to assess drug release was the Weibull
model. Model parameters such as time and shape for the test product were compared to
those of the reference product using a two-sided t-test and were found to be similar (p >
0.05). The exponential constant values (n) for all the models fell between 0.50 and 1.00,
indicating that the release mechanism was non-Fickian (in all the formulations), at all
tested pH levels, involving a combination of both diffusion and chain relaxation
mechanisms or anomalous transport kinetics. However, these parameters must be viewed
with caution as the power law does not account for the limited solubility of VRP at
different pH's.
It is evident that there are a number of challenges associated with the formulation of solid
oral dosage forms with drugs of pH dependent solubility. It is imperative therefore, that
sustained release formulations should have a uniform release pattern throughout the
gastro-intestinal tract to avoid any non-uniform release caused by pH dependency and
subsequent associated therapeutic difficulties. In this study, pH was shown to play an
148
. ___./·
important role in controlling of the release mechanism of VRP from batches
manufactured in the laboratory, but Isoptin® SR was not affected by pH to any great
extent. Therefore, during the course of transit of the dosage form in the gastro-intestinal
tract, the release from the product may show different release mechanisms if the
formulation were to reside in one place in the gastro-intestinal tract for a prolonged
period.
The similarity factor, Sd has been tested along with the existing/2 method and was found
to be applicable in comparing dissolution data. Its primary advantage is its simplicity in
calculation and interpretation of results. The second advantage is that the Sd approach is
similar to the h method in that it characterizes the entire dissolution profile and this is
better than a single-point approach such as using tro.
The method of comparing dissolution profiles using % AUC (diff) was evaluated and was
found not to be usable as some of the differences were minimal in certain batches yet the
curves or profiles were not similar when evaluating/2 and Sd values.
What has emerged from this study is that considerable attention must be focused on
understanding mathematical models as these provide useful guidance and insight to drug
release transport from sustained-release delivery systems.
149

CHAPTER SIX
CONCLUSION
Oral administration of drugs has been the most convenient route employed for drug
delivery systems for which the main aim is the maintenance of constant therapeutic
concentrations of drug in the blood. Therapeutic level control is achieved by use of
sustained or modified-release dosage forms.
An HPLC method was developed and validated according to the ICH guidelines. The
method was found to be linear over the concentration range 3.0-280.0 J..l.g/ml. The
precision of the method was measured at two levels, viz. intra-day and inter-day precision
and the % RSD values were less than or equal to 5.0%, which were within the limits set
in our laboratory. The method was accurate with % RSD values obtained complying with
the 2.0% tolerance, set in our laboratory, for this parameter.
Initially, USP apparatus 1 was used to determine in-vitro drug release rates from the
TEST and REFERENCE products over a 22-hour period. However, due to the single
container nature of the basket apparatus, experimental challenges such as change in
solubility, were evident as seen when a change in pH of the dissolution medium was
made. There was a relative faster release of VRP at lower pH compared to higher pH
values, as a result of more drug being available in the matrix as a salt form rather than as
the base compound. Furthetmore, at higher pH values, the carboxylic acid functional
groups of the carbomer are likely to be dissociated and a possible interaction between the
carboxylic acid groups and the tertiary amine of VRP may also contribute to the slow
drug release from these tablets. The release of VRP was significantly influenced by the
pH of the dissolution media and may consequently results in complex release
mechanisms being evident.
USP apparatus 3 was therefore selected as it eliminates manual changing of dissolution
media and offers an advantage of mimicking, in part, the changes in the physicochemical
environment experienced by products in the gastro-intestinal tract [151]. A study of the
effect of inner tube mesh size was undertaken to determine the effects of the pore size on
150

drug release rates. When a smaller pore size was used, the cylinders failed to drain
completely, as the dissolution media was found to coat the screen. The combination of a
fine pore size and the surface tension of the dissolution media created a barrier that
prevented air from penetrating the tube with the result that fresh dissolution media did not
reach the dosage form.
The effect of buffer molarity on drug release was shown to weaken the rigid/cross-linked
structure of carbo mer gels. This loss of the gel structure resulted in the dosage form being
exposed to greater hydrodynamic forces of the test medium thus resulting in increased
exposure of the tablet to the dissolution media, with a subsequent faster drug release rate.
The effect of the agitation or dip rate on the dissolution rate of VRP from tablets was also
evaluated. As expected, the dissolution rate increased with the increasing agitation rate.
Sensitivity, discriminating ability and reproducibility are important characteristics of a
dissolution method. The FDA dissolution guidelines identify the need for a sensitive test,
as this allows for the detection of in-vitro differences prior to the assessment of
performance of product [146]. It is vitally important that dissolution test methods are
optimized and that appropriate dissolution media are used when testing particular dosage
forms.
In response to the challenges of formulating sustained-release dosage forms,
combinations of rate retarding polymers, Carbopol® 974 P NF, Methocel® K 1OOM and
Eudragit® RS were used as matrices for the manufacture of VRP tablets. Since a number
of pharmaceutical products are available as solid oral dosage forms, powder rheology,
flowability and compactibility were two essential characteristics that were investigated to
ensure successful tablet manufacture. In terms of tablet formation, the different
compressibilities and flow properties of powders pose a challenge to manufacturers,
which may result in formulation difficulties due to the selection of inappropriate
excipients.
Large, 11 mm diameter tablets were prepared by both direct compression and wet
granulation techniques, evaluated and compared to Isoptin ® SR. The direct compression
151

method of manufacture using either Carbopol® 974 P NF or Eudragit® RS as the only
polymer resulted in rapid and complete release of VRP, which was observed after
approximately 2 hours. The direct compression method of manufacture produced tablets
that exhibited a large degree of capping and lamination. Powder rheology studies
revealed poor flow properties when using the angle of repose determination. Carr's
compressibility index and the Hausner's ratio further supported the poor flow
characteristics of some of the blends produced using direct compression methods.
Capping and lamination often occurs as a result of excessive compression force, that may
in this case, may have occurred, due to inadequate die filling as a result of poor powder
flow. These formulations were thus considered inappropriate, but served as a useful
starting point for identifying potential composition for further studies.
Blends of Methocel® K lOOM and Carbopol® 974 P NF were then prepared. Results
obtained were not suitable as VRP release was faster and complete drug release was
observed after 6 hours. Whilst not ideal, this combination can sustain the release of VRP
better than when either Carbopol® 974 P NF or Eudragit® RS were used as the primary
release retarding polymers. Values for h of between 35-40 were obtained for the
comparison of test product to Isoptin® SR. After several trials with a combination of the
polymers at different drug/polymer ratios, further development was undertaken by
compressing the blends into mini-tablets of 7 mm diameter. The tablets were incorporated
into a size 00 capsule prior to dissolution testing. The dissolution release rate profiles for
test were similar to that of the reference product for the early stages of the dissolution
process only, but did not match the release profile for the entire 22-hour period. Finally, it
was decided that a wet granulat1on method of manufacture was more appropriate, than
direct compression from a manufacturing perspective, for production of these products.
VRP sustained-release matrix mini-tablets were manufactured using Eudragit® NE 30D
or Surelease® E-7-1901 0 dispersion as the granulating fluid. The tablets were
characterized by determination of crushing strength, friability, thickness, weight variation
and in-vitro release rates. The content of VRP in the tablets was quantitated using HPLC.
The results satisfied the pharmacopoeial specifications for formulations VRP021 and
152

VRP023, which were selected for further evaluation due to their similarity to Isoptin®
SR. Similarity was determined on the basis of h values.
Water uptake studies including swelling and erosion behaviour of the tablets when in
contact with the dissolution medium were undertaken. Swelling and erosion behaviour
dictate the kinetics and mechanism of drug release from these formulations. Although one
process may predominate over the other, as a result of different polymer characteristics.
Both swelling and erosion often occur simultaneously, as was the case in these studies. In
addition, mathematical modelling provided an insight into the mechanism of drug release
from these dosage forms. It was observed that non-Fickian diffusion was the primary
release controlling mechanism. Diffusion of the drug occurs within the polymer and the
rate of release is determined by polymer characteristics such as relaxation of the polymer
chains on contact with dissolution media. Water uptake studies provided a macroscopic
picture of the overall swelling and erosion of tablets that take place yet provided little
detailed information on the nature of the gel layer formed as a consequence of the uptake.
Therefore, future studies using Scanning Electron Microscopy (SEM) and/or textural
analysis will assist in defining the microscopic structure that exists when the polymers
hydrate, which would in turn provide an understanding of how drug transport occurs at a
microscopic level in these dosage forms.
The statistical parameters f 1 and h suggest that the formulations VRP021 and VRP023 are
similar to Isoptin® SR and values ofj1<15 and/2>50 were obtained for both test products.
Determination of similarity using the Sd factor was tested along with the existing h
method. The determination of Sd is based on calculation of the area under the curve by
using the trapezoidal rule and was found to be applicable for comparing dissolution data
in these studies.
The release data generated from in-vitro release studies were fitted to various kinetic
models such as Zero order, First order, Higuchi, Hixson-Crowell, Baker-Lonsdale and the
Weibull function. The release mechanism was determined by using the Korsmeyer
Peppas or Power-law model. The data for formulations were found to fit several different
models and the drug release mechanism was ascribed to an anomalous transport process
153

in which diffusion and swelling or chain relaxation dictate release. However, the data
were best fitted to the Weibull function for batches VRP021 and VRP023. These
observations reveal that the tablets exhibited similar in-vitro release performance to
Isoptin® SR. The release parameters, Tct, and shape parameter, fJ, were calculated and
these were compared to the values obtained for Isoptin® SR using the two-sided student t
test. It was found that there was no significant difference between the TEST products and
Isoptin® SR at a 95% level of confidence.
Despite the apparent complexity of formulations VRP021 and VRP023, this study
proposes the applicability of using polymer combinations such as Carbopol® 974P NF,
Surelease® E-7-19010 and Eudragit® NE 30D in sustaining the release of VRP from
dosage forms prepared from these materials. It has been observed that the use of
Carbopol® 974 PNF in combination with other polymers can sustain the release of VRP
from tablets since carbomers can form strong matrices due to their cross-linked structure.
The formulations developed and assessed in these studies have defined a starting point for
further studies in which the impact of drug-excipient and excipient-excipient interactions
can be assessed. Further investigation using SEM, Differential Scanning Calorimetry, X
Ray Diffraction and Fourier Transform Infrared Analysis will provide insight into the
physical and chemical characteristics of these dosage forms. Furthermore, it would be
useful to determine whether an in-vitro in-vivo correlation exists for these dosage forms
using either USP 1 or USP 3 dissolution test methods and in-vivo bioavailability and or
bioequivalence studies.
154

APPENDIX ONE
BATCH SUMMARY
155

RHODES UNIVERSITY, Faculty of Pharmacy, Grahamstown, SOUTH AFRICA
BATCH SUMMARY
Formulator :Sandile Khamanga
Product :Verapamil Hydrochloride
Batch ID :VRPOOl
Blending Date :04-07-2004
Tableting Date :04-07-2004
Batch Size : 300g
Blending Time (start) 09:00 am
(end) 10: 30am
Formula
Material % (wlw) Added amount (g) Rhodes #
VRP Carbopol® 974P NF
Lactose monohydrate
Talc
Magnesium stearate
Target Weight
Target Hardness
Temperature
Humidity
Blender Used
Tablet Press
Tooling
Dissolution
120
-g 100
l .i • ~ 80
2 ! 0 60 ~ Q)
1 ~ 40 '3 E 20
I "" 1 0
33 99.00 RM000138
10 30.07 RM000121
56 168.11 RM000056
0.5 1.50 RM000300
0.5 1.50 RM000200
:740mg
:100- 140N
:17.3°C
:39.0% RH
Kenwood Chef Classic 5-Quartz standard planetary mixer (electronic
variable speed control
:Manesty® B3B Rotary Press
: 11 mm concave punches
. ., ---, 1
~-------=
Comments I Observations
• no sticking , no surface abrasion
during ejection
• no edge - splitting
• no capping I laminating
• good surface finish was observed
in tablets
I 0
l ____ _ 5 YJ 15
Time (hrs) 20 2~
---- - J • tablet weight and hardness did not
vary
156

RHODES UNIVERSITY, Faculty of Pharmacy, Grahamstown, SOUTH AFRICA
BATCH SUMMARY
Formulator :Sandile K.hamanga
Product :Verapamil Hydrochloride
Batch ID :VRP002
Blending Date :04-07-2004
Tableting Date :04-07-2004
Formula
Material
VRP
Carbopol® 974P NF
Lactose monohydrate
Talc
Magnesium stearate
:740mg
% (w/w)
33
15
51
0.5
0.5
:100- 140N
:14.7°C
:48.0% RH
Batch Size : 300g
Blending Time (start) 12:00 noon
(end) 01:30pm
Added amount (g) Rhodes #
99.10 RM000138
45.07 RM000121
153.06 RM000056
1.50 RM000300
1.51 RM000200
Target Weight
Target Hardness
Temperature
Humidity
Blender Used :Kenwood Chef Classic 5-Quartz standard planetary mixer (electronic
variable speed control)
Tablet Press
Tooling
Dissolution
1-12-0--g '00
, en ! «> 1 ~ eo a:
= 2
I 0 60
<f?-Q)
I ~ 4o : s I 5 20
(.)
i 0
'-- ---·-
5
:Manesty® B3B Rotary Press
: 11 mm concave punches
--- - ----l . I
! i
I I !
--+--VRP002 I I L~~~optin SA_
I
I
'0 15 20 251 Time (hrs)
Comments I Observations
• no sticking , no surface abrasion
during ejection
• no edge - splitting
• capping during friability test
• good surface finish was observed
in tablets
• tablet hardness was not greater
than 80N
157

RHODES UNIVERSITY, Faculty of Pharmacy, Grahamstown, SOUTH AFRICA
BATCH SUMMARY
Formulator :Sandile Khamanga
Product : Verapamil Hydrochloride
Batch ID :VRP003
Blending Date :06-07-2004
Tableting Date :06-07-2004
Formula
Material
VRP
Carbopol® 971 P NF
Lactose monohydrate
Talc
Magnesium stearate
:740mg
% (w/w)
33
10
56
0.5
0.5
:100 - 140N
:14.7°C
:56.0 %RH
Batch Size : 300g
Blending Time (start) 08:30am
(end) lO:OOam
Added amount (g) Rhodes#
99.00 RMOOOI38
30.01 RM000121
168.00 RM000056
1.51 RM000300
1.50 RM000200
Target Weight
Target Hardness
Temperature
Humidity
Blender Used :Kenwood Chef Classic 5-Quartz standard planetary mixer (electronic
variable speed control)
Tablet Press
Tooling
Dissolution
r·-· T2-0 -
'0 Q)
l iS a;
lJO
. a: 80
12 · 0
· 0 60 o · • <I> I *~ , (ij
::; 40 E ::> 10 20
I
I 0
0
L-. ___ -
5
:Manestl B3B Rotary Press
:llmm concave punches
ttime (hrs1
-·-1 I
I i
20 25 1 ___ j
Comments I Observations
• capping of tablets near the apex and
separates from the balance of tablet
• no sticking , no surface abrasion
during ejection
• tablet hardness was between 50 and
1 OON (huge variation)
• high friability
• tablets were brittle
158

RHODES UNIVERSITY, Faculty of Pharmacy, Grahamstown, SOUTH AFRICA
BATCH SUMMARY
Formulator :Sandile Khamanga
Product : V eraparnil Hydrochloride
Batch ID :VRP004
Blending Date :06-07-2004
Tableting Date :06-07-2004
Formula
Material % (w/w)
VRP 33
Carbopol® 971 P NF 15
Lactose monohydrate 51
Talc 0.5
Magnesium stearate 0.5
Target Weight :740mg
Target Hardness : 100 - 140N
Temperature : 14.7°C
Humidity :56.0 %RH
Batch Size : 300g
Blending Time (start) 12:00 noon
(end) 1:30pm
Added amount (g) Rhodes #
99.00 RM000138
45.01 RM000121
153.01 RM000056
1.50 RM000300
1.50 RM000200
Blender Used Kenwood Chef Classic 5-Quartz standard planetary mixer (electronic
variable speed control
Tablet Press :Manesty® B3B Rotary Press
Tooling : llmm concave punches
Dissolution Comments I Observations
'-·- ;;-0 --------------- -, . I
I -g 100
I gJ
I ~ so l g>
I Ci so I ;;e.
I I I
, I
I I
w I
I ~ I ..!!1 40
g I
1
1
8 20
0
..___ ___ _ ' __ v_R_P0-04-~ ___ ___,· 111
~ ~-~~op!_!~~~ l
I 0 5 10 15 20 25 I Time (hrs) I
t_ --- ··- ----- -·--- --- ------- __ ___)
• no sticking , no surface abrasion
during ejection
• no edge splitting of tablets
• no capping I laminating of tablets
• good surface finish
• no variation in tablet weight
• hardness was not greater than 1 OON
159

RHODES UNIVERSITY, Faculty of Pharmacy, Grahamstown, SOUTH AFRICA
BATCH SUMMARY
Formulator :Sandile Khamanga
Product :Verapamil Hydrochloride
Batch ID :VRP005
Blending Date :06-07-2004
Tableting Date :06-07-2004
Batch Size : 300g
Blending Time (start) 3:00pm
(end) 4:30pm
Formula
Material % (w/w) Added amount (g) Rhodes #
VRP
Carbopol® 97 4P NF
Methocel®K 1OOM
Lactose monohydrate
Talc
Magnesium stearate
33
10
10
46
0.5
0 .5
:740mg
:100 - 140N
:13.6° c :52.0 %RH
99.00 RM0001 38
30.03 RM000121
30.01 RM000115
138.00 RM000056
1.50 RM000300
1.50 RM000200
Target Weight
Target Hardness
Temperature
Humidity
Blender Used Kenwood Chef Classic 5-Quartz standard planetary mixer (electronic
variable speed control
Tablet Press
Tooling
:Manesty® B3B Rotary Press
: 11 mm concave punches
Dissolution
I I VO l al l rn
· "' I _!!1 80 J CD
I ~ : c5 60
' -;fl l CD I .2: 40 l eo 1 "5 I § 20 : 0
·-~vRF>Oo5 !
; --lsoptinSR:
0 ,__----~----~---' ' 25 : 0 5 ~ ~ 20 1 Time (hrs) L_- - -- --- - -- - - - -·- .. - --·- -- - -- _..
Comments I Observations
• no sticking , no surface abrasion during
ejection
• powder with good flowability
• no edge splitting of tablets
• good surface finish, no capping I
laminating of tablets
• good surface finish
no variation in tablet weight and hardness
160

RHODES UNIVERSITY, Faculty of Pharmacy, Grahamstown, SOUTH AFRICA
BATCH SUMMARY
Formulator :Sandile Khamanga
Product :Verapamil Hydrochloride
Batch ID :VRP006
Blending Date :07-07-2004
Tableting Date :07-07-2004
Batch Size : 300g
Blending Time (start) 07:30am
(end) 09:00am
Formula
Material % (wlw) Added amount (g) Rhodes #
VRP
Carbopol® 974P NF
Methocel®K 1OOM
Lactose monohydrate
Talc
Magnesium stearate
33
15
10
46
0.5
0.5
:740mg
:100-140N
:14.4°C
:54.0 %RH
99.00 RM000138
45.00 RM000121
30.00 RM000115
138.08 RM000056
1.51 RM000300
1.50 RM000200
Target Weight
Target Hardness
Temperature
Humidity
Blender Used :Kenwood Chef Classic 5-Quartz standard planetary mixer (electronic
variable speed control)
Tablet Press
Tooling
:Manesty® B3B Rotary Press
: 11 mm concave punches
Dissolution
,.-- - - - - . -- - -- ·- - -· --1 120 -------~ I i · ~ I ~
' "* I a: 0>
I 2
' Cl >!!.
I D
Q)
> ! ~ • "5 , § , 0
I I
"KlO
80
60
40
20 j -+-VAP006 I L ~ _!_so~tln~RJ
; I I I
I i I I
I i I ! I
o ~----~------~ I 0 5 "Kl 15 20 25 1
Time (hrs) 1
t • - -·- -- - ·- -·-
Comments I Observations
• no sticking , no surface abrasion during
ejection
• powder with good flowability
• no edge splitting of tablets
• good surface finish
• no capping I laminating of tablets
• good surface finish
• no variation in tablet weight
• maximum hardness reached was 135N
161

RHODES UNIVERSITY, Faculty of Pharmacy, Grahamstown, SOUm AFRICA
BATCH SUMMARY
Formulator :Sandile Khamanga
Product :Verapamil Hydrochloride
Batch ID :VRP007
Blending Date :06-07-2004
Tableting Date :06-07-2004
Batch Size : 300g
Blending Time (start) 11 :00 am
(end) 12:30pm
Formula
Material % (w/w) Added amount (g) Rhodes#
VRP
Carbopol® 971 P NF
Methocel®K 1OOM
Lactose monohydrate
Talc
Magnesium stearate
Target Weight
Target Hardness
Temperature
Humidity
Blender Used
Tablet Press
Tooling
Dissolution
33 99.03 RM000138
10 30.00 RM000121
10 30.00 RMOOOJ15
46 138.02 RM000056
0.5 1.50 RM000300
0.5 1.50 RM000200
:740mg
:100- 140N
:15.8° C
:49.0 %RH
:Kenwood Chef Classic 5-Quartz standard planetary mixer (electronic
variable speed control)
:Manesty® B3B Rotary Press
: llmm concave punches
Comments I Observations
• no sticking , no surface abrasion during
ejection
• powder with good flowability
• no edge splitting of tablets
• good surface finish
• no capping I laminating of tablets
• no variation in tablet weight and
hardness
162

RHODES UNIVERSITY, Faculty of Pharmacy, Grahamstown, SOUTH AFRICA
BATCH SUMMARY
Formulator :Sandile Kharnanga
Product :Veraparnil Hydrochloride
Batch ID :VRP008
Blending Date :06-07-2004
Tableting Date :06-07-2004
% (w/w)
Batch Size : 300g
Blending Time (start) 3:00 pm
(end) 4:30pm
Added amount (g)
VRP RMOOOI38 33 99.00
Carbopol® 971PNF RM000121 15 45.01
Methocel®K lOOM RM000115 10 30.00
Lactose monohydrate RM000056 41 123.00
Talc RM000300 0.5 1.50
Magnesium stearate RM000200 0.5 1.50
Target Weight :740mg
Target Hardness : I 00 - 140N
Temperature : 14.4°C
Humidity :54.0 %RH
Blender Used :Kenwood Chef Classic 5-Quartz standard planetary mixer (electronic
variable speed control)
Tablet Press
Tooling
Dissolution
5
:Manesty® B3B Rotary Press
:11 mm concave punches
.--- --- l --+-VRPOOB I
1- lsoptinSR ---- ·- _ __J
10 15
Time (hrs) 20 251
Comments I Observations
• no sticking , no surface abrasion
during ejection
• powder with good flowability
• no edge splitting of tablets
• good surface finish
• no capping I laminating of tablets
• no variation in tablet weight and
hardness
163

RHODES UNIVERSITY, Faculty of Pharmacy, Grahamstown, SOUTH AFRICA
BATCH SUMMARY
Formulator :Sandile Khamanga
Product :Verapamil Hydrochloride
Batch ID :VRP009
Blending Date :01-08-2004
Tableting Date :01-08-2004
Batch Size : 300g
Blending Time (start) 08:00 am
(end) 09:30am
Formula
Material % (w/w) Added amount (g) Rhodes #
VRP
Carbopol® 974P NF
Ethocel®
Emcompress®
Lactose monohydrate
Talc
Magnesium stearate
Target Weight
Target Hardness
Temperature
Humidity
Blender Used
Tablet Press
Tooling
Dissolution
33 99.01 RM000138
10 30.00 RM000121
5 15.00 RM000115
24.5 73.51 RM000059
73.5 73.50 RM000056
0.5 1.50 RM000300
0.5 1.50 RM000200
:740mg
:100 -140N
:15.6oC
:58.0%RH
:Kenwood Chef Classic 5-Quartz standard planetary mixer (electronic
variable speed control)
:Manesty® B3B Rotary Press
: 1 I mrn concave punches
Comments I Observations
120 -- - --- - --I
"O tl0 I ~ . <1>
i ~ 80
I ~ 0 60
I ~ <1>
-~ «; 40 , ::;
E ::::>
I o 20
I . 0~----------------------l_ ~-- _ ~- ---~ime ~rsf_ I
20 2s I
- - -- -·-!
• sticking of powder particles, adhering to
punch surfaces
• no edge splitting of tablets
•
•
•
capping of tablets (part of tablet not
bonding together).
Tablets separate where the cup or land
meets the band edge
Poor flow properties
164

RHODES UNIVERSITY, Faculty of Pharmacy, Grahamstown, SOUTH AFRICA
BATCH SUMMARY
Formulator :Sandile Khamanga
Product :Verapamil Hydrochloride
Batch ID :VRPOIO
Blending Date :01-08-2004
Tableting Date :01 -08-2004
Batch Size :300g
Blending Time (start) 11 :OOam
(end) l2:30pm
Formula
Material % (w/w) Added amount (g) Rhodes #
VRP Carbopol® 974P NF
Ethocel®
Lactose monohydrate
Talc
Magnesium stearate
33
10
5
51
0.5
0.5
:740mg
:100- 140N
:14.4°C
:52.0 %RH
99.01 RM000138
30.00 RM000121
15.00 RM000115
153.10 RM000056
1.50 RM000300
1.51 RM000200
Target Weight
Target Hardness
Temperature
Humidity
Blender Used :Kenwood Chef Classic 5-Quartz standard planetary mixer (electronic
variable speed control)
Tablet Press
Tooling
:Manesty® B3B Rotary Press
: 11 mm concave punches
Dissolution
"0 I ~ '00
ro
~ ~ 80 a: I
C> 2
' Cl 60
1 ?/!. QJ
I .2: l ]l 40
:::> I E I :::>
0 20
0
lis; ,.
I
I ! I I
r: VRP010 ., I I L: _lsopti~~~
~-------------------~ I 0 5 10 15
Time (hrs) 20 25 1
·-· - _j
Comments I Observations
• sticking of powder particles, adhering
to punch surfaces
• capping of tablets (part of tablet not
bonding together.
• Tablet separates where the cup or land
meets the band edge
• poor flow properties
• variation in tablet weight and hardness
165

RHODES UNIVERSITY, Faculty of Pharmacy, Grahamstown, SOUTH AFRICA
BATCH SUMMARY
Formulator :Sandile Khamanga
Product :Verapamil Hydrochloride
Batch ID :VRP011
Blending Date :08-11-2004
Tableting Date :08-11-2004
Batch Size : 300g
Blending Time (start) 07:30am
(end) 09:00am
Formula
Material % (wlw) Added amount (g) Rhodes #
VRP
Carbopol® 974P NF
Eudragit ®RS
Lactose monohydrate
Talc
Magnesium stearate
33
10
7.5
48.5
0.5
0.5
:250mg
:80- liON
:22.7°C
:62.0 %RH
99.00 RM000138
30.00 RM000121
22.51 RM000023
145.50 RM000056
1.50 RM000300
1.50 RM000200
Target Weight
Target Hardness
Temperature
Humidity
Blender Used :Kenwood Chef Classic 5-Quartz standard planetary mixer (electronic
variable speed control)
Tablet Press
Tooling
Dissolution
:Manesty® F3 Single Press
:7 mrn concave punches
,- - --. 120 - -- - ------· --
- ---·, - ---,1 1 I . t -g10o I I
! I :e--- - ----'"" !I il l a: 80
}' II 1 ~ 40 i 8 20 r·-+-VRPOll. j I
I J --lsoptin SR 1 I
---- _! I 0 ~0 ----------------------- I 5 10 15 20 251.
Time (hrs) - _j
Comments I Observations
• no sticking I no subsurface abrasion during
ejection
• no edge splitting of tablets
• capping of tablets (part of tablet not
bonding together.
• Tablet separates where the cup or land
meets the band edge
• though good surface finish
• no variation in tablet weight and hardness
166

RHODES UNIVERSITY, Faculty of Pharmacy, Grahamstown, SOUTH AFRICA
BATCH SUMMARY
Formulator :Sandile Khamanga
Product :Verapamil Hydrochloride
Batch ID :VRP012
Blending Date :08-11-2004
Tableting Date :08-11-2004
Batch Size : 300g
Blending Time (start) 10:00 am
(end) 11 :30am
Formula
Material % (wlw) Added amount (g) Rhodes #
VRP
Carbopol® 974P NF
Eudragit ®RL
Lactose monohydrate
Talc
Magnesium stearate
33
10
7.5
48.5
0.5
0.5
:250mg
:80- liON
:22.7oC
:63.0 %RH
99.01 RM000138
30.00 RM000121
22.51 RM000022
145.50 RM000056
1.50 RM000300
1.50 RM000200
Target Weight
Target Hardness
Temperature
Humidity
Blender Used :Kenwood Chef Classic 5-Quartz standard planetary mixer (electronic
variable speed control)
Tablet Press
Tooling
Dissolution
------- - ·--120 ---··-
i -o "00 Q)
I "' ra ~ Q)
80 a: 0> ::::>
! a 60
"*-Q)
.~ 40 1 1\i ::::J
E i => I U 20
0 0 5
:Manesty® F3 Single Press
:7 mm concave punches
-- - - -- ~
-- - - --11 : : I:
II I I
~~VAP012 1 I --1soptin sRI I ~---
I 10 15 20 251 Time (hrs) L. _______ -·- --.- ------ - - J
•
• • • •
•
Comments I Observations
no sticking I no surface abrasion during
ejection
no edge splitting of tablets
no capping I laminating of tablets
good surface finish
no variation in tablet weight and
hardness
maximum tablet hardness was 1 05N
167

RHODES UNIVERSITY, Faculty of Pharmacy, Grahamstown, SOUTH AFRICA
BATCH SUMMARY
Formulator :Sandile Khamanga
Product :Verapamil Hydrochloride
Batch ID :VRP013
Blending Date :08-11-2004
Tableting Date :08-11-2004
Batch Size :300g
Blending Time (start) 1 :00 pm
(end) 2:30pm
Formula
Material % (w/w) Added amount (g) Rhodes #
VRP
Carbopol® 974P NF
Eudragit ®RS
Ethocel ®
Lactose monohydrate
Talc
Magnesium stearate
33
10
7.5
7.5
41
0.5
0.5
:250mg
:80 - liON
:22.8°C
:61.0 %RH
99.00 RM000138
30.00 RM000121
22.51 RM000023
22.50 RM000103
123.00 RM000056
1.51 RM000300
1.50 RM000200
Target Weight
Target Hardness
Temperature
Humidity
Blender Used :Kenwood Chef Classic 5-Quartz standard planetary mixer (electronic
variable speed control)
Tablet Press
Tooling
Dissolution
:Manesty® F3 Single Press
:7 mrn concave punches
--- - ----- --- ---- • 120
I I ~ 100 I "' I *
' 80 I a: I
I "" I
I 2 i , o 60 'if!.
I
I I Q)
i -~ I l :ffi 40 :::> I i E :::> I • ,;opcln.s"RI j I (..) 20
I I.=-VRP013 J I
0 I 1 o 5 10 15 20 25 :
Time (hrs) ; L _____ ·------ --- ·-- _ __]
•
• • • •
Comments I Observations
no sticking I no surface abrasion
during ejection
no edge splitting of tablets
no capping / laminating of tablets
good surface finish
no variation in tablet weight and
hardness
• maximum tablet hardness was 1 05N
168

RHODES UNIVERSITY, Faculty of Pharmacy, Grahamstown, SOUTH AFRICA
BATCH SUMMARY
Formulator :Sandile K.hamanga
Product :Verapamil Hydrochloride
Batch ID :VRP014
Blending Date :08-11-2004
Tableting Date :08-11-2004
Batch Size :300g
Blending Time (start) 4:00 pm
(end) 5:30pm
Formula
Material % (wlw) Added amount (g) Rhodes#
VRP
Eudragit ®RS
Ethocel ®
Lactose monohydrate
Talc
Magnesium stearate
33
15
5
41
0.5
0.5
:250mg
:80-llON
:23.ooc
:56.0%RH
99.01 RM000138
45.00 RM000023
15.00 RM000103
123.00 RM000056
1.50 RM000300
1.50 RM000200
Target Weight
Target Hardness
Temperature
Humidity
Blender Used :Kenwood Chef Classic 5-Quartz standard planetary mixer (electronic
variable speed control)
Tablet Press
Tooling
Dissolution
:Manesty® F3 Single Press
:7 nun concave punches
I-- - - - - ·- - -- = -_.:.=_ =·. I 120 ---------
' al100
! l:l Q)
1 Q; 80 : cc 0>
I ~ so <{!. Q)
I ~ 40
I ~ ::::J 20
l o i=+--vRP014 -~ L: _ lsoptin SRI
I 0 i
I o o 5 10 15 20 25
I Time (hrs) I L_ ----- ·---- -·- ·-- -- --- J
•
• • • •
Comments I Observations
no sticking I no surface abrasion
during ejection
no edge splitting of tablets
no capping I laminating of tablets
good powder flow
good surface finish
• hardness values relatively constant
169

RHODES UNIVERSITY, Faculty of Pharmacy, Grahamstown, SOUTH AFRICA
BATCH SUMMARY
Formulator :Sandile Khamanga
Product
Batch ID
: Verapamil Hydrochloride
:VRP015 Batch Size : 500g
Blending Date :08-11-2004
Tableting Date :08-11-2004
Blending Time start) 7:00pm
(end) 8:30pm
Formula
Material
VRP
Carbopol ®974P NF
Eudragit ®RS
Ethocel ®
Lactose monohydrate
SURELEASE E-7-19010
A
Eudragit ®RS
Lactose monohydrate
Magnesium stearate
% (w/w) Added amount (g)
33 198.00
10 60.01
7.5 45.03
7.5 45.50
15 90.00
5ml 30m!
7.5
15
0.1
:250mg
:80-llON
:23.0° c :59.0%RH
462.50
37.51
75.00
0.51
Rhodes #
RM000138
RM000121
RM000023
RM000103
RM000056
RMOOOOJO
RM000023
RM000056
RM000200
Target Weight
Target Hardness
Temperature
Humidity
Blender Used :Kenwood Chef Classic 5-Quartz standard planetary mixer (electronic
variable speed control
Tablet Press
Tooling
Dissolution
:Manesty® F3 Single Press
:7 mm concave punches
Comments I Observations
170

r 120 I I
' ~ 100
l _i Q) 80
i ';, I 5 so
I ~ . 2: 40
I ~ 18 20
I o o s
l_ ·- --·---
~VRPO'l; l
l:-·-=~op!~SR. 10 15 Time (hrs)
20 25 i I _ _____ ___)
•
• • • • •
no sticking I no surface abrasion during
ejection
no edge splitting of tablets
no capping /laminating of tablets
good powder flow
good surface fini sh
hardness values relatively constant
171

RHODES UNIVERSITY, Faculty of Pharmacy, Grahamstown, SOUTH AFRICA
BATCH SUMMARY
Formulator :Sandile K.hamanga
Product :Verapamil Hydrochloride
Batch ID :VRP016
Blending Date :09-11-2004
Tableting Date :09-11-2004
Batch Size :300g
Blending Time (start) 08:00 am
(end) 09:30am
Formula
Material % (wlw) Added amount (g) Rhodes #
VRP
Carbopol® 974P NF
Eudragit ®RS
Ethocel ®
Emcompress®
Talc
Magnesium stearate
Target Weight
Target Hardness
Temperature
Humidity
Blender Used
Tablet Press
Tooling
Dissolution
~ ~
I 100
I -o
I ~ ~ 80
I ~ g>
I ~ 60
~ ~ 1 ~ 40
"' ::; I E : 8 20
33 99.01 RM000138
10 30.00 RM000121
7.5 22.51 RM000023
7.5 22.51 RM000103
41 123.00 RM000059
0.5 1.50 RM000300
0.5 1.50 RM000200
:250mg
:80-llON
:22.6°C
:65.0%RH
:Kenwood Chef Classic 5-Quartz standard planetary mixer (electronic
variable speed control
:Manesty® F3 Single Press
:7 mm concave punches
"l I
I
I •
• • • •
Comments I Observations
no sticking I no surface abrasion
during ejection
no edge splitting of tablets
no capping I laminating of tablets
good surface finish
1---+-- V- R-P016 l : --lsoptinSR
I o ,__ ___ _ _ ' ~---·----=-- · ___ _
tablet weight/ hardness relatively
constant throughout
l __ o __ - ~-- _10_Ti~e-(h_rs~ --·2o-- _2sl • good powder flow properties
172

RHODES UNIVERSITY, Faculty of Pharmacy, Grahamstown, SOUTH AFRICA
BATCH SUMMARY
Formulator :Sandile K.hamanga
Product :Verapamil Hydrochloride
Batch ID :VRP017
Blending Date :09-11 -2004
Tableting Date :09-11-2004
Batch Size : 300g
Blending Time (start) 11:00 am
(end) 12:30 pm
Formula
Material % (w/w) Added amount (g) Rhodes #
VRP
Carbopol® 974P NF
Eudragit ®RS
Ethocel ®
Emcocelw 90M
Talc
Magnesium stearate
33
10
7.5
7.5
41
0.5
0.5
:250mg
:80-110N
:22.1°C
:66.0%RH
99.00 RM000138
30.01 RM000121
22.51 RM000023
22.51 RM000103
123.00 RM000059
1.50 RM000300
1.50 RM000200
Target Weight
Target Hardness
Temperature
Humidity
Blender Used :Kenwood Chef Classic 5-Quartz standard planetary mixer (electronic
variable speed control
Tablet Press
Tooling
Dissolution
:Manesty® F3 Single Press
:7 mm concave punches
r -~0 :=----==------=-----------~-1 ~ "XJO
"' . ca 10 Q)
~ 80
! g> 0
1 O 60
I ~ I ~ 40
:5 E
16 20
I 1 -:--+-- l~optln SA
1
o~~--
L o s 'time (hrsf 2o 25 I ---- -·---- --·- - --- -·;
Comments I Observations
• no sticking I no surface abrasion
during ejection
• no edge splitting of tablets
• no capping I laminating of tablets
• good surface finish
• tablet weight/ hardness relatively
constant throughout
• good powder flow properties
173

RHODES UNIVERSITY, Faculty of Pharmacy, Grahamstown, SOUTH AFRICA
BATCH SUMMARY
Formulator :Sandile Khamanga
Product :Verapamil Hydrochloride
Batch ID :VRP018
Blending Date :09-11-2004
Tableting Date :09-11-2004
Batch Size :300g
Blending Time (start) 1 :00 pm
(end) 2:30pm
Formula
Material % (w/w) Added amount (g) Rhodes #
VRP
Carbopol® 974P NF
Eudragit ~S
Ethocel ®
Lactose Monohydrate
Talc
Magnesium stearate
33
7.5
20
7.5
31
0.5
0.5
:250mg
:80- 110N
:22.0°C
:66.0 %RH
99.00 RM000138
22.51 RM000121
60.00 RM000023
22.51 RM000103
93.00 RM000056
1.51 RM000300
1.51 RM000200
Target Weight
Target Hardness
Temperature
Humidity
Blender Used :Kenwood Chef Classic 5-Quartz standard planetary mixer (electronic
variable speed control
Tablet Press
Tooling
Dissolution
120
:Manesty® F3 Single Press
:7 mm concave punches
-~I
11 ~0 11
' ~ 80 II i ~ I 0 60
I ~ I ' j ~ I I E I I 8 20 r= VAPo18 -1 I 1
O ~-----~~- ~lso=pt_in_SR~-------- 1 0 5 ~ 15 20 251
l Time (hrs) -------- ------ . ·-- - .J
Comments I Observations
• no sticking I no surface abrasion during
ejection
• no edge splitting of tablets
• no capping I laminating of tablets
• good surface finish
• tablet weight/ hardness relatively
constant throughout
• good powder flow properties
174

RHODES UNIVERSITY, Faculty of Pharmacy, Grahamstown, SOUTH AFRICA
BATCH SUMMARY
Formulator :Sandile Khamanga
Product :Verapamil Hydrochloride
Batch ID :VRP019
Blending Date :09-11 -2004
Tableting Date :09-11-2004
Formula
Batch Size : 300g
Blending Time (start) 4:00 pm
(end) 5:30pm
Material % (w/w) Added amount (g) Rhodes#
VRP
Carbopol® 974P NF
Eudragit ®RS
Ethocel ®
Lactose Monohydrate
Talc
Magnesium stearate
33
7.5
7.5
20
31
0.5
0.5
:250mg
:80 - 110N
:22.3°C
:65.0 %RH
99.01 RM000138
22.50 RM000121
22.51 RM000023
60.00 RM000103
93.00 RM000056
1.5 I RM000300
1.51 RM000200
Target Weight
Target Hardness
Temperature
Humidity
Blender Used :Kenwood Chef Classic 5-Quartz standard planetary mixer (electronic
variable speed control
Tablet Press
Tooling
Dissolution
-g no j &l 1 .!!! I ~ 8 0
= 2
I ~ 60 ~~
Q)
> ~ 40
I ~ :::>
(.) 20
:Manesty® F3 Single Press
:7 mm concave punches
II I i
I , _VRP019 l I 1~ tsoptin SR
0 ""o ---5 --10~--15--2-0--251
L. _ _ _ Time (hrs) -------- -------- _j
Comments I Observations
• no sticking I no surface abrasion
during ejection
• no edge splitting of tablets
• no capping I laminating of tablets
• good surface finish
• tablet weight/ hardness relatively
constant throughout
• good powder flow properties
175

RHODES UNIVERSITY, Faculty of Pharmacy, Grahamstown, SOUTH AFRICA
BATCH SUMMARY
Formulator
Product
Batch ID
:Sandile Khamanga
: Verapamil Hydrochloride
:VRP020
Blending Date :10-11-2004
Tableting Date :11-11-2004
Formula
Material
VRP Carbopol ®974P NF
Eudragit ®RS
Emcocel ® 90M
SURELEASE® E-7-19010
A
Carbopol ®974P NP
Eudragit <liRS
Emcocel ® 90M
Emcompress ®90M
Magnesium stearate
% (w/w)
33
5
7.5
10
!Oml
5
6
10
20
0.5
:250mg
:80- 110N
:22.3°C
:59.0% RH
Batch Size 500g
Blending Time (start) 09:00am
-granules dried at 40°C for 12 hours
Added amount (g) Rhodes #
198.00 RM0001 38
30.01 RM000121
45.02 RM000023
60.00 RM000061
60ml RMOOOOJO
292.51
25.00 RM000121
30.03 RM000023
50.00 RM000061
99.98 RM000059
2.50 RM000200
Target Weight
Target Hardness
Temperature
Humidity
Blender Used :Kenwood Chef Classic 5-Quartz standard planetary mixer (electronic
variable speed control
Tablet Press
Tooling
Dissolution
:Manesty® F3 Single Press
:7 mm concave punches
Comments I Observations
176

120 ----
~ 100
(J) <0 Q)
Qi eo a: 0> 2 0 60 <P
l .~ -;;; 40 :;
i §
[_~_o - ~
-------,: ~ -~ I
-+-VRP020 ] I
--lsoptin SRi I
10 15 Time (hrs}
20 25
__ j
• no sticking, but during granulation , the
SURELEASE® E-7 -19010 fluid was too viscous
and processing was slightly difficult
• dried granules were very hard
• no surface abrasion during ejection
• • • •
no edge splitting of tablets
no capping I laminating of tablets
good powder flow
good surface finish
• hardness values relatively constant
177

RHODES UNIVERSITY, Faculty of Pharmacy, Grahamstown, SOUTH AFRICA
BATCH SUMMARY
Formulator :Sandile Khamanga
Product :Verapamil Hydrochloride
Batch ID :VRP021
Blending Date :10-11 -2004
Tableting Date: 11-11-2004
Formula
Material
VRP
Carbopol ®974P NF
Eudragit ®RS
Emcocel ® 90M
SURELEASE® E-7-19010
A
Carbopol <V974P NF
Eudragit ®RS
Emcocel ® 90M
Emcompress ®90M
Magnesium stearate
:250mg
% (w/w)
33
5
7.5
10
20m!
5
6
10
20
0.5
:80 - l l ON
:23.0°C
:54.0% RH
Batch Size 500g
Blending Time (start) 11:00 am
-granules dried at 40°C for 12 hours
Added amount Rhodes#
198.01 RM000138
30.00 RM000121
45.00 RM000023
60.00 RM000061
120ml RM000010
292.50
25.06 RMOOOI21
30.00 RM000023
50.00 RM000061
IOO.D3 RM000059
2.50 RM000200
Target Weight
Target Hardness
Temperature
Humidity
Blender Used :Kenwood Chef Classic 5-Quartz s1andard planetary mixer (electronic
variable speed control
Tablet Press
Tooling
Dissolution
:Manesty® F3 Single Press
:7 mm concave punches
Comments I Observations
j
178

- --- ---- --- --- --- ---- l 120 I • no sticking, but during granulation , the
! SURELEASE® E-7 -19010 fluid was too viscous and . -o 1)0 I Q) .... i ~ !!: processing was slightly difficult Q)
"& 80
dried granules were very hard • • no surface abrasion during ejection
• no edge splitting of tablets and no capping I
I -+-VAP021l j laminating of tablets - lsopt inSR
l -- good powder flow • 1) 15 20 Time (hrs) • good surface finish
- - -• hardness values relatively constant
179

RHODES UNIVERSITY, Faculty of Pharmacy, Grahamstown, SOUTH AFRICA
BATCH SUMMARY
Formulator
Product
Batch ID
:Sandile Khamanga
: Verapamil Hydrochloride
:VRP022
Blending Date :10-11 -2004
Tableting Date: 11-11-2004
Formula
Batch Size 500g
Blending Time (start) 2:00pm
-granules dried at 40°C for 12 hours
Material % (w/w) Added amount (g) Rhodes #
VRP
Carbopo1 ®974P NF
Ethoce1 ®
Eudragit ® RS 30D
A
Carbopo1 ®974P NF
Ethoce1 ®
Emcoce1 ® 90M
Emcompress e 90M
Magnesium stearate
33
5
10
10: !Oml with water
5
6
10
20
0.5
:250mg
:80-110N
:23.8°C
:48.0 o/oRH
198.00 RM000138
30.01 RM000121
60.03 RM000103
120ml RM000024
292.50
25.00 RM000121
30.05 RM000103
50.02 RM000061
100.03 RM000059
2.50 RM000200
Target Weight
Target Hardness
Temperature
Humidity
Blender Used :Kenwood Chef Classic 5-Quartz standard planetary mixer (electronic
variable speed control):
Tablet Press
Tooling
Dissolution
:Manesty® F3 Single Press
:7 mm concave punches
Comments I Observations
180

---120
.., -oo I ~ «<
I -* so a: C> 2 Cl 60
· ~
I ~ 40
I ~ Jc3 20 l-::.;=-VRP022 I
l __ ~'---~so~t in.s~.
5 -o '6 Time (hrs)
- -·- -- - -
-- -
1 • •
II •
• • •
20 25
- -·· _j • • •
granulating fluid sticky
forms a glue-like mass when put in the oven
fluid was too viscous and processing was slightly
difficult
dried granules were very hard
no surface abrasion during ejection
no edge splitting of tablets and no capping I
larmnating of tablets
good powder flow
good surface finish
tablets were spotted and hardness values
relatively constant
181

RHODES UNIVERSITY, Faculty of Pharmacy, Grahamstown, SOUTH AFRICA
BATCH SUMMARY
Formulator
Product
Batch ID
:Sandile Khamanga
:Verapamil Hydrochloride
:VRP023
Blending Date : 10-11-2004
Tableting Date : 11-11 -2004
Formula
Batch Size 500g
Blending Time (start) 5:OOpm
-granules dried at 40°C for 12 hours
Material % (w/w) Added amount (g) Rhodes#
VRP
Carbopol ®974P NF
Ethocel ®
Eudragit ® NE 30D
A
Carbopol ®974P NF
Ethocel ®
Emcocel "' 90M
Emcompress ®90M
Magnesium stearate
33
5
10
IO:IOml with water
5
6
10
20
0.5
:250mg
:80-110N
:23.6°C
:47.0% RH
198.01 RM0001 38
30.00 RM0001 21
60.00 RM000103
120ml RM000124
292.51
25.00 RM0001 21
30.00 RMOOOI 03
50.01 RM000061
100.00 RM000059
2.51 RM000200
Target Weight
Target Hardness
Temperature
Humidity
Blender Used :Kenwood Chef Classic 5-Quartz standard planetary mixer (electronic
variable speed control
Tablet Press
Tooling
Dissolution
:Manesty® F3 Single Press
:7 mm concave punches
Comments I Observations
182

- -·----·-· . - ----- --- - -· ..1 I 120 • granulating fluid sticky
forms a glue-like mass when put in the oven I 100 'I • l -o ~
... I· , Q) ! • dried granules were very hard ' "' I "' , Q) 80 : w
no surface abrasion during ejection ' O: • 0> =>
60 Ci • no edge splitting of tablets #- 't Q) .2: 40 : I • no capping I laminating of tablets n; :; E
good powder flow => j =;:::.:y-R·Pii23 . ; • (.) 20
L~lsopti~ SR , • good surface finish but tablets were spotted 0
0 5 10 15 20 25 produce very hard tablets Time (hrs) • I
··-- -- ·- - --- -- ._. __ _j
183

APPENDIX TWO
BATCH PRODUCTION RECORDS VRPOOl
Only one direct compression record is included for this study. The records for the other
batches, VRP002 - VRP019 are available on request.
184

RHODES UNIVERSITY, Faculty of Pharmacy, Grahamstown, SOUTH AFRICA
BATCH PRODUCTION RECORD
Product name : Verapamil Hydrochloride
Batch
Batch size
: VRPOOI
: 300g
Batch record issued by
Master record issued by
MANUFACTURING APPROVALS
Date: o4- ·- o·1- - z.oo£1-
Date: ./
RHODES UNIVERSITY, Faculty of Pharmacy, Grahamstown, SOUTH AFRICA
BATCH PRODUCTION RECORD Product name : Verapamil Hydrochloride
Batch
Batch size
: VRPOOl
: 300g
MASTER FORMULA AND BATCH FORMULA
Com onent RM#
VRP 33.0 RM000138 '1"1 . DO :1 .J{l-u.- n-
Carbopol®974P NF 10.0 RM000121 :g D . 0"1-:J ..lt....-----a. Lactose Monohydrate 56.0 RM000056 I 1:.'6 • l1 ~ .J<;k ........_ A-
Talc 0.5 RM000300 I .(o 'l J.(t-.,. ''""--- ...... Magnesium stearate 0.5 RM000200 l ".Sll '.\ y~,._-
~ ~ ~ ~
P<J 2/s
185

RHODES UNIVERSITY, Faculty of Pharmacy, Grahamstown, SOUTH AFRICA
BATCH PRODUCTION RECORD
Product name : Verapamil Hydrochloride
Batch
Batch size
: VRPOOl
: 300g
EQIDPMENT VERIFICATION
Description
Sieves Scale Blender
Type Verified By
# 20 mesh ~ ""-- fA
Mettler Model PM6000 .J(.1..._ ~ "'
Kenwood mixer Jsa., """"'- e..
Confirmed By
RHODES UNIVERSITY, Faculty of Pharmacy, Grahamstown, SOUTH AFRICA
BATCH PRODUCTION REPORT Product name : Verapamil Hydrochloride
Batch
Batch size
: VRPOOl
: 300g Date: o4. _ D=i - L.004-
MANUFACTURING DIRECTIONS Step 1.
2.
3.
4.
Procedure Weight Screen separately the following materials through a #20 mesh screen Verapamil hydrochloride Carbopol®974P NF Lactose Monohydrate Place the materials in (1) in a cube blender rotating at lOOrpm for 20min. Screen separately the following materials through a #40 mesh screen Talc Magnesium stearate Mix blends (1) and (3) together and blend for a further 3min
Time Done by Checked by
D q ;Oo .kt.....o...- ..... ~
f)") : 0~ J(l-...Q.,._ ~ ~ 0 '1 •• I 0 h~~ ~
oq ·, ~ ~ ~~a. ~
D'l. '. ).\ J.(l....."'~ .... ~ o'\ ·, ~( 141-..~c.. ~
5. Tablet the blend on a Manesty B3B press Tablet hardness I weight Every 15min, sample 4 tablets to check for oq ·~{ s l1 '2>N ""t2~£1 hardness I weight uniformity / Then calculate for% yield '3....'1-~ 'J X ICO = 9 j . ~ 1 <~jo
!!0 j
186

RHODES UNIVERSITY, Faculty of Pharmacy, Grahamstown, SOUTH FRICA BATCH PRODUCTION RECORD
Product name : Verapamil Hydrochloride
Batch
Batch size
: VRPOOl
: 300g
SIGNATURE AND INITIAL REFERENCE
Full Name (Print)
5ANDfLI: M· 1t..I+A-MA-N5A .:iaL 'fltl W·-oi9ht
Signature Initials Date
04- -o1- 2JD4-
0tt - U1 -UJO'+
rs S/5
187

APPENDIX THREE
BATCH PRODUCTION RECORDS VRP021
Only one wet granulation record is included for this study. The records for the other
batches, VRP020, VRP022 and VRP023 are available on request.
188

RHODES UNIVERSITY, Faculty of Pharmacy, Grahamstown, SOUTH AFRICA
BATCH PRODUCTION RECORD
Product name : Verapamil Hydrochloride
Batch
Batch size
: VRP021
: 500g
MANUFACTURING APPROVALS
Batch record issued by
Master record issued by
Date: 10-11 - WO't
Date: _ __::::/ _ _ _
RHODES UNIVERSITY, Faculty of Pharmacy, Grahamstown, SOUTH AFRICA
BATCH PRODUCTION REPORT
Product name : Verapamil Hydrochloride
Batch
Batch size
: VRP021
: 500g
MASTER FORMULA AND BATCH FORMULA
Comnonent Quantity (%w/w) RM# Amount Disnensed Disnensed Bv
VRP 33.0 RM000138 l 7~·or.s jt.)..._ "'- ~
Carbopol®974P NF 5.0 RM000121 30 · O)•J j(J..__ ""-- _._ Eudragit® RS 7.5 RM000023 4.:( · D{j J.<J..._ (),__ "' Emcocel® 90M 10.0 RM000061 ln . C05 ~~"'-Surelease® E-7-19010 20.0ml RMOOOOlO 1·2.,0 v-vvL .v~~ ...
s l;vvt-b. 0.')-1. 0· ~ -1 --190~0 ( i ~ .. /o \..rj.,J ) I.A. <.t.- t~
Co~-vt.~~ J.-4 ' i OL ""'/..; ~~'1 l cJA- ....J..o !.t ~l~ Jt;
Checked By
~ ~ ~
~
r, 1../~:.
189

RHODES UNIVERSITY, Faculty of Pharmacy, Grahamstown, SOUTH AFRICA
BATCH PRODUCTION REPORT
Product name : Verapamil Hydrochloride
Batch
Batch size
: VRP021
: 500g
EQUIPMENT VERIFICATION
Description Type Verified By Confirmed By
Sieves Scale Blender Pump Tubing Granulator Oven
# 20 and 40 mesh ~ a...._ ..
Mettler Model PM6000 ~ ~ """ Kenwood mixer Masterflex Masterflex LS 14 Erwerka Oscillating Gallenkamp
RHODES UNIVERSITY, Faculty of Pharmacy, Grahamstown, SOUTH AFRICA
BATCH PRODUCTION REPORT
Product name : Verapamil Hydrochloride
Batch
Batch size
: VRP021
: 500g Date: I 0 - II - LOt.? 4-
MANUFACTURING DIRECTIONS Step Procedure Weight 1. Screen separately the following
materials through a #20 mesh
2.
3.
screen. V erapamil hydrochloride Carbopol®974P NF Eudragit® RS Emcocel® 90M
Place the materials in (1) in a cube blender
l 9); -DI {>!
~0. 00
4(-Dv Go · oo
Blend the materials 2 for 3min at low speed, setting speed of 1.
Time Done by Checked by
II ·:. oo ~~ ~ o( \1, 'tOO ~1 ;. i ,(
J~"'--- ..... ..w..... ,..__a...
.Jc_.._ ,.__..""' ..J::.J.---av.- ....._
190

RHODES UNIVERSITY, Faculty of Pharmacy, Grahamstown, SOUTH AFRICA
BATCH PRODUCTION REPORT
Product name : Verapamil Hydrochloride
Batch
Batch size
: VRP021
: 500g Date: lv -il- Z.oo 't
MANUFACTURING DIRECTIONS
Step 4.
5.
Procedure Weight Place the Surelease in a tared 1 ·z.1. ~( '3 measuring cylinder and insert pump tubing.
With blender at speed 1, add Surelease® E-7-19010 at a rate of 7-10 for a total time of 15min. Time started If"_ 1:,( Time completed: H '. (LI, Time taken I '{ rNW\. IM<.!.
Time Done by Checked by
w 1~ .Jet..- =-. .,_ ~·v
Blender speed : ~ 1/. A P
. ~a._ "- < j'(V\-ump settmg :
6.
7.
8.
9.
Amount of Surelease® E-7-19010 added: r~(i ·M/L - I~~ ~~>il ~~ Transfer granules to Erwerka granulator and screen using a #20 mesh screen and 1 OOrpm motor speed. Speed setting: "T'l' ·- S 1 '1' P (1\
Place granules on weighing paper and dry in the oven. Time started Time finished : f)'b ~- ~ i)
/ . Total drying time : r 2..itv-i~ I ~ I'IWI\.I
0 r 0 ."o· c ven temperature 10
Remove dried granules from the oven, and re-screened using the Erwerka granulator (#lOmesh). Speed
Record the weight of granules _,qbtained Acceptable weight : 4"> 3 9
Observed weight 4 1"0 j
t"2 :. 1r[i0-li-L.004-) ~~ .... 2JJvv GO : ;u (u-ii··l.oo'f) .Ja-.-.~ {Svvv
01"': ~o (n- 11- L0<>4)
%yield: 'J;r0/ 1~ .,:.. L..::> () cv- s ·; ..kk. ·- rv · . f" ~ ~ ~ -----------------------------------------------------------------10. Granules transferred to airtight container
until tableting.
191

RHODES UNIVERSITY, Faculty of Pharmacy, Grahamstown, SOUTH AFRICA
BATCH PRODUCTION RECORD
Product name : Veraparnil Hydrochloride
Batch
Batch size
: VRP021
: 500g
SIGNATURE AND INITIAL REFERENCE
Full Name (Print) Signature Initials Date
II - II - 2..;.:>04-
P'l L /b
192

RHODES UNIVERSITY, Faculty of Pharmacy, Grahamstown, SOUTH AFRICA
BATCH PRODUCTION REPORT
Product name : Verapamil Hydrochloride
Batch
Batch size
: VRP021
: 500g
MASTER FORMULA AND BATCH FORMULA
Com11onent (%w/w} RM# Amount Dis11ensed (g) Dis11ensed By Checked By
Verapamil hydrochloride 33.0 L.. c11 .:S'o-1 ?JYVv gramules ..¥-\."cr.......:..
Carbopol®974P NF 5.0 RM000121 25"·D b 'J ~c;w...c ?;'{VV.. Eudragit® RS 6.0 RM000023 1>0 • 00 5 ..J-.~A...~c.. t;'f"'v~ Emcocel® 90M 10.0 RM000061 s.. 0. oos ~~ -st\W Emcompress® 20.0 RM000059 100.05 <:] ~~ ~ Magnesium stearate 0.5 RM000200 '-. ,.(\) g ~~
P!! I I+
RHODES UNIVERSITY, Faculty of Pharmacy, Grahamstown, SOUTH AFRICA
BATCH PRODUCTION REPORT
Product name : Verapamil Hydrochloride
Batch
Batch size
Description
Sieves Scale Blender Tablet press
: VRP021
: 500g
EQUIPMENT VERIFICATION
Type Verified By
# 20 mesh ~ cw-.... (;.
Mettler Model PM6000 k Cwv..-L.
Kenwood mixer Manesty B F3
Confirmed By
193

RHODES UNIVERSITY, Faculty of Pharmacy, Grahamstown, SOUTH AFRICA
BATCH PRODUCTION REPORT
Product name : Verapamil Hydrochloride
Batch
Batch size
: VRP021
: 500g Date: II- I t·~ 1...DO tt-
MANUFACTURING DIRECTIONS
Step 1.
Procedure Weight Time Done by Checked by
2.
3.
4.
5.
6.
7.
8.
Screen the following materilas through a #20mesh screen Carbopol 974P NF Eudragit® RS Emcocel® 90M Emcompress®
Place verapamil hydrochloride granules and material in (1) in a cube blender.
Blend the materials in step 2 Time started I I ', 1<> Time completed: \\ ·. ~0
Time taken QQ \'(y\~
2f·O b5 30 · 00 _5 So · oos ~0 . thl ~
2. 9l ·~~ 2 'b'5'. ~ L:, 9
Blender speed : 1: t6 - s~ -rpr~\ Screen magnesium stearate using a
IO ', -?0 .J4.,~ ...
10 ·• 1[ ~IMN\.G 10: So jLJ,v.. OoJW<-
\D : s-{ ~~
~I ', O.J ~,._,...:..... Q\w
II ~ 1~ ti·- ~ o
J4 ~"' ~
#40 mesh screen ~· S'"o.s \1 :. 4J j.::h CJWw<., CPw Add material in ( 4) to blender and blend for a further 3min. Time started i( •• 'f.{ Time completed \1 .. '1·'l Speed 4-~ ~ S'- 1t) "" Record the weight and yield Expected weight : Sao 3
Obtained weight 4'1-<t9 4-Wk-z>o % yield
Tablet the blend on tablet press according to standard operating procedures. Target hardness : 80- I 1 ON Target weight : 250mg
AI O I>
Every 15rnin, sample 4 tablets to check hardness and weight Store product in airtight containers till ready for in-vitro test
~0/WV\- 1))vv
t)rvw ::; 'i'/ j ~ ·'oVj .JC,y.~
9. Record weight of acceptable tablet obtained and % yield
Ltn!i> l ·~· l.~g ~vou ~ 1912 -lc;;..t-k-11 ;tv'-r~ O!.?_?f_ ••. (i . . j) · · 6 I 7-~l! ob-t-Gv~ -~ 1 ..:." '-'--""'~
194

RHODES UNIVERSITY, Faculty of Pharmacy, Grahamstown, SOUTH AFRICA
BATCH PRODUCTION RECORD
Product name : Verapamil Hydrochloride
Batch
Batch size
: VRP021
: 500g
SIGNATURE AND INITIAL REFERENCE
Full Name (Print) Signature Date S,.:rNI)rU:: krt l'rM wstr
Initials ~~ lo-11- "LGC lf
195

REFERENCES
I . T. Yamada, H. Onishi and Y. Machida. Sustained-Release Ketoprofen Microparticles with
Ethylcellulose and Carboxymethylethylcellulose. Journal of Controlled Release: 75: 271-282,
(2001).
2. South African Medicines Formulary, C.J. Gibbon (ed), South African Medical Association,
Health and Medical Publishing Group, Pinelands, SA, 5th Edition, 2000, pp. 144.
3. Cardiovascular Drug Therapy, Professional Quick Reference, Steven Daly (ed.):
Springhouse Corporation, Pennsylvania, USA, pp. 316-319.
4. Basic and Clinical Pharmacology, Bertram G. Katzung (ed.): Appleton and Lange,
Stamford, USA, 7th Edition, 1998, pp. 186-236.
5. British Pharmacopoeia, The Stationery Office, London, Volume 1, 2002, pp. 1775-1776.
6. Pharmacology, H.P Rang, M.M. Dale, J .M. Ritter: Churchill Livingstone, Longman Group,
London, UK, 3rd Edition, 1987, pp. 289-299.
7. Martindale, Pharmaceutical Press, K.Parfitt (ed.), The Royal Pharmaceutical Society,
London, UK, 32nd Edition, 1999, pp. 989-992
8. V.Das Gupta. Quantitation and Stability of Verapamil Hydrochloride using High
Performance Liquid Chromatography. Drug Development and Industrial Pharmacy. 11(8):
1497-1506, (1985).
9. Analytical Profiles of Drug Substances and Excipients, Klaus Florey (ed.): Academic Press,
Inc., London, UK, Volume 17, 1988, pp. 643-674.
10.The Merck Index, S.Budavari, M.J. O'Neil, A. Smith, P.E. Heckelman, J.F. Kinneary (eds.),
Merck and Co. Inc., Rahway, N.J., USA, lOth Edition, 1983, pp. 9744.
11. R. Mehvar, D.R. Brocks and M. Vakily. Impact of Stereoselectivity on the
Pharmacokinetics and Pharmacodynamics of Antiarrhythmic Drugs. Clinical
Pharmacokinetics: 41(8):533-558, (2002).
12. R.A. Janis and D.J. Triggle. New developments in Ca2+ Channel Antagonists. Journal of
Medicinal Chemistry: 26: 775-785, ( 1983).
196

13. R. Mannhold, R. Steiner, W. Haas and R. Kaufmann. Investigation on the Structure
Activity Relationships of Veraparnil. Naunyn Schmiedebergs Archives of Pharmacology: 302
(2): 217-226, (1978).
14. R. Mannhold, R.Bayer and S. R. Rodenkirchen: 151 Cyprus Conference on New Methods in
Drug Research, Cyprus 17 - 23April 1983, Abstract.
15. F.Gualtieri, E.Teodori, C.Belluci, E.Pesce and G.Piacenza. SAR Studies in the Field of
Calcium (II) Antagonists. Effects of Modifications at the Tetrasubstituted Carbon of
Veraparnil-like Compounds. Journal of Medicinal Chemistry: 28: 1621-1628, (1985).
16. L. V. J r Allen and M.A. Erickson. 3rd Stability of Labetalol Hydrochloride, Metoprolol
Tartrate, Verapamil Hydrochloride, and Spironolactone with Hydrochlorothiazide in
Extemporaneously Compounded Oral Liquids. American Journal of Health System-Pharmacy:
53(19):2304-2309, (1996).
17. Clinical Pharmacology, Brian B. Hoffman, David W. Nierenberg, S.George Carruthers,
Kenneth L. Melman (ed.), Melmon and Morrelli's, McGraw Hill, New York, USA, 4th Edition,
2000, pp. 82-127.
18. Textbook of Pharmacology, W.C. Bowman, M.J. Rand, Blackwell Scientific Publications,
Oxford, London, UK, 2nd Edition, 1980, pp. 22.7-22.24.
19. http://www.mentalhealth.com/drug/p30-i03.htm1 Retrieved 10110/2003
20. Clinical Pharmacology, D.R Laurence, P.N. Bennet, Churchill Livingstone, London, UK,
6th Edition, 1987, pp. 492.
21. W. Yu and S .H. Horowitz. Treatment of Sporadic Hemiplegic Migraine with Calcium
Channel Blocker Veraparnil. Neurology: 60 (1): 120-121(2003)
22. D.W. Dodick and D.J. Capobianco. Treatment and Management of Cluster Headaches.
Current Pain Headache Reports: 5 (1): 83-91, (2001).
23. E.M. Vivian and G.B. Rubinstein. Pharmacological Management of Diabetic Nephropathy.
Clinical Therapeutics: 24 (11): 1741-1756, (2002).
24. K.L. Wisner, K.S. Peindl, J.M. Perl, B.H. Hanusa, C.M. Piontek and S. Baab: Veraparnil
Treatment for Women with Bipolar Disorder. Biological Psychiatry: 51 (9): 745-752, (2002).
197

25. N.A. Levy and P.G. Janicak. Calcium Channel Antagonists for the Treatment of Bipolar
Disorders. Bipolar Disorders: 2 (2): 108-119, (2002).
26. D. Kang, D. Verotta, M.E. Krecic-Sheperd, N.B. Modi, .S.K. Gupta and J.B. Schwartz.
Population Analyses of Sustained-Release Verapamil in Patients: Effects of Sex, Race, and
Smoking. Clinical Pharmacology and Therapeutics: 73 (1): 31-40, (2003).
27. M. Niemi, J.T. Backman, M.F. Fromm, P.J. Neuvonen and K.T. Kivisto. Pharmacokinetic
Interactions with Rifampicin: Clinical Relevance. Clinical Pharmacokinetics: 42 (9): 819-850,
(2003).
28. T.S. Lamberg, K.T. Kivisto and P.J. Neuvonen. Effects ofVerapamil and Diltiazem on the
Pharmacokinetics and Pharmacodynamics of Buspirone: Clinical Pharmacology and
Therapeutics: 63 (6): 640-645, ( 1998).
29. T. Kantola, K.T. Kivisto and P.J. Neuvonen: Erythromycin and Verapamil considerably
increase Serum Simvastatin and Simvastatin Concentrations: Clinical Pharmacology and
Therapeutics: 64 (2): 177-182, (1998).
30. K. Kishore, A. Raina, V. Misra and E. Jonas. Acute Verapamil Toxicity in a Patient with
Chronic Toxicity: Possible Interaction with Ceftriaxone and Clindamycin. Annals of
Pharmacotherapy: 27 (7-8): 877-880, (1993).
31. V. Dumestre- Toulet, V. Cirimele, S. Gromb, T. Belooussoff, D. Lavault, B. Ludes and P.
Kintz. Last Performance with VIAGRA. Post-Morten Identification of Sildenafil and its
Metabolites in Biological Specimens including Hair Sample. Forensic Science International:
126 (1): 71-76, (2002).
32. D.G. Bailey, J. Malcolm, 0 . Arnold and J.D. Spence. Grape Fruit Drug-Interaction. British
Journal of Clinical Pharmacology: 46 (2): 101-110, (1998).
33. U. Fuhr. Drug Interactions with Grapefruit Juice: Extent, Probable Mechanism and Clinical
Relevance. Drug Safety: 18 (4): 251-272, (1998).
34. U. Fuhr, H. Muller-Peltzer, R. Kern, P. Lopez-Rojas, M. Junemann, S . Harder and A.H.
Staib. Effects of Grapefruit Juice and Smoking on Verapamil Concentrations in Steady State.
European Journal of Clinical Pharmacology: 58 (1): 45-53, (2002).
198

35. C.Tannersgren, H. Engman, L. Knutson, M. Hedeland, V. Bondesson and H. Lennernas.
St. John's Wort Decreases the Bioavailability of R-and S-Verapamil through Induction of the
First-Pass Metabolism. Clinical Pharmacology and Therapeutics: 15 (4):298-309, (2004).
36. J.M.Wentworth, M.Agostin, J.Love, J.M. Schwabe and V.K. Chatterjee. StJohn's Wort, a
Herbal Antidepressant, Activates the Steroid X-receptor. Journal of Endocrinology: 166: R11-
R16, (2000).
37. A.Singer, M.Wonnemann and W.E. Muller. Hyperforin. A Major Antidepressant
Constituent of StJohn's Wort, Inhibits Serotonin uptake by Elevating Free Intracellular Na+.
Journal of Pharmacology and Experimental Therapeutics: 290:1363-1368, (1999).
38. J.P. Pfammatter and U. Bausersfereld. Safety Issues in the Treatment of Paediatrics
Supraventricular Tachycardia. Drug Safety: 18 (5): 345-356, (1998).
39. T. Paul, H. Bertram, R. Bukenkamp and G. Hausdorf. Supraventricular Tachycardia in
Infants, Children. Paediatric Drugs: 2 (3): 171-181, (2000).
40. H.L. Tan and K.I. Lie. Treatment ofTachyarrhythmias during Pregnancy and Lactation.
European Heart Journal: 22 (6): 458-464 (2001)
41 . R. Patricia and McElhatton. Pregnancy (3) Drug Use in Pregnancy: Part 1. Pharmaceutical
Journal: 270:253-288, (2003).
42. P.K. Zacharia, T.P. Moyer, H.M. Theobald, R.P. Frantz, S.B. Kurtz, T.J. McCarthy and
R.L. Smith. The Pharmacokinetics of Racemic Verapamil in Patients with Impaired Renal
Function. Journal of Clinical Pharmacology: 1: 45-53, (1991).
43. T.J. Hoon, P.L. McCollan, K.J. Beckman, R.J. Hariman and J.L. Bauman. Impact of Food
on the Pharmacokinetics and Electrocardiographic Effects of Sustained-Release Verapamil in
Normal Subjects. American Journal of Cardiology: 70 (11): 1072-1076, (1992).
44. E.L. Conway, P.A. Phillips, O.H. Drummer and W. Louis. Influence of Food on the
Bioavailability of a Sustained-Release Verapamil Preparation. Joumal of Pharmaceutical
Sciences: 79 (3): 228-231, ( 1990).
45. Patient Drug Information: Facts and Comparisons. BernieR. Olin (ed.), American Nurses
Association, Walter Kluwer Co. Missouri, USA, 1996, pp. 679-680.
199

46. O.Lapatto-Reiniluoto, K.T. Kivistb and P. J. Neuvonen. Activated Charcoal alone and
followed by Whole-Bowel Irrigation in Preventing the Absorption of Sustained-Release Drug.
Clinical Pharmacology and Therapeutics: 170, 255-260, (2001).
47. R. Tucker and J.F. Gentile. Precipitation of Veraparnil with Nafcillin. American Journal of
Hospital Pharmacy: 41(12):2588, (1984).
48. D.L. Munday. Film Coated Pellets containing Verapamil Hydrochloride: Enhanced
Dissolution into Neutral Medium. Drug Development Industrial Pharmacy: 29(5): 575-578,
(2003).
49. J. Borlack, M. Walles, M. Elend, T. Thurn, A. Preiss and K. Levsen. Verapamil.
Identification of Novel Metabolites in Cultures of Primary Human Hepatocytes and Human
Urine by LC-MS (n) and LC-NMR. Xenobiotica: 33 (6): 655-676, (2003).
50. W. Sawicki and S. Janicki. Pharmacokinetics of Verapamil and its Metabolite
Norverapamil from Buccal Drug Formulation. International Journal of Pharmaceutics: 238:
181-189, (2002).
51. W. Sawicki. A Validated Method for the Determination ofVerapamil and Norveraparnil in
Human Plasma. Journal of Pharmaceutical and Biomedical Analysis 25: 689-695, (2001).
52. D. McTavish and E.M. Sorkin. Veraparnil: An Updated Review of its Pharmacodynamic
and Pharmacokinetic Properties, and Therapeutic in Hypertension. Drugs: 38: 19-76, (1989).
53. S.R. Hamann, R.A. Blouin and R.G.Jr McAllister. Clinical Pharmacokinetics of Veraparnil.
Clinical Pharmacokinetics: 9:26- 41, (1984).
54. H. Echizen, M. Manz and M. Eichebaum. Electrophysiological Effects of Dextro- and
Levo-Verapamil on Sinus Node and AV Node Function in Humans. Journal of Cardiovascular
and Pharmacology: 12:543-546, (1988).
55. H. Echizen and M. Eichebaum. Clinical Pharmacokinetics of Verapamil, Nifedipine and
Diltiazem. Clinical Pharmacokinetics: 11:425-449, (1986).
56. M. Eichebaum and A. Somogyi. Inter-and Intra-Subject Variation in the First-Pass
Elimination of Highly Cleared Drugs During Chronic Dosing Studies with Deuterated
Verapamil. European Journal of Clinical Pharmacology: 26:47-53, (1984).
200
57. B. Vogelgesang, H. Echizen, E.Schmidt, M. Eichebaum. Stereo- Selective First-Pass
Metabolism of Highly Cleared Drugs: Studies of the Bioavalibility of L- and D-Verapamil
examined with a Stable Isotope Technique. British Journal of Clinical Pharmacology: 18:733-
740, (1984).
58. H. Echizen, T.Brecht, S.Niedergesass, B. Vogelgesang and M. Eichebaum. The Effects of
Dextra-, Leva-, and Racemic Verapamil on Atrioventricular Conduction in Humans. American
Heart Journal: 109:210-217, (1985).
59. T.J. Campbell and K.M. Williams: Therapeutic Drug Monitoring. Antiarrhythmic Drugs.
British Journal of Clinical Pharmacology: 52 Supplement 1:21 S-34S, (2001 ).
60. S. Gupta, N. B. Modi, G. Sathyan, H. Pai-Ling and L. Aarons. Pharmacokinetics of
Controlled-Release Verapamil in Healthy Volunteers and Patients with Hypertension or
Angina. Biopharmaceutical Drug Disposition: 23: 17-31, (2002).
61. P.A.Meredith, H.L.Elliott, F. Pasanisi, A.W.Kelman, D.J.Sumner and J.L.Reid. Verapamil
Pharmacokinetics and Apparent Hepatic and Renal Blood Flow. British Journal of Clinical
Pharmacology: 20:101-106, (1985).
62. J.B. Schwartz, D.R. Abernethy, A.A. Taylor and J.R. Mitchell. An Investigation of the
cause of Accumulation of Verapamil during Regular Dosing in Patients. British Journal of
Clinical Pharmacology: 19: 512-516, (1985).
63. S.B. Freedman, D.R. Richmond, J.J. Ashley and D.T. Kelly. Veraparnil Kinetics in Normal
Subjects and Patients with Coronary Artery Spasm. Clinical Pharmacology and Therapeutics:
30:644-652, (1981).
64. D.G. Shand, S.C. Hammill, L. Aanonsen and E.L. Pritchett. Reduced Veraparnil Clearance
During Long-Term Oral Administration. Clinical Pharmacology and Therapeutics: 30:701-
706, (1981 ).
65. /ntroduction to HPLC, R.J. Hamilton, P.A. Sewell, Chapman and Hall, London, UK, 2nd
Edition, 1982, pp. 1-12.
66. Practical Skills in Chemistry, J.R.Dean, A.M. Jones, D. Holmes, R. Reed, J. Weyers, A.
Jones, Pearson Education Ltd publishers, Essex, UK, 2002, pp. 205- 208.
201
67. High Performance Liquid Chromatography, J. H. Knox, J. N. Done, A. F. Fell, A. Pryde,
and R. A. Wall, Edinburgh University Press, Edinburgh, Scotland, 1978, pp. 1-138.
68. Maintaining and Troubleshooting HPLC Systems, D.J. Rusner, John Wiley and Sons, New
York, USA, 1981, pp. 4-95.
69. Practical HPLC Method Development. L. R. Snyder, J. J. Kirkland, J. L. Glajch, 2"d
Edition, John Wiley and Sons, New York, USA, 1997, pp. 3-300.
70. R.J. Vervoort, E.Ruyter, A.J . Debetes, H.A. Claessens, C.A. Crammers and G.J. de Jong.
Characterization of Reversed-Phase Liquid Chromatography Stationery Phases for the
Analysis of Basic Pharmaceuticals: Eluent Properties and Comparison of Empirical Test
Methods. Journal of Chromatography A: 931 (1-2): 67-79, (2001).
71. Practical HPLC. C.F. Simpson., Heyden and Son Ltd, 30th Edition, Heyden and Son Ltd,
The Whitefriars Press, London, UK, 1976, pp. 624-641
72. Techniques for the Automated Optimisation of HPLC Separation. John C. Berridge: John
Wiley and Sons, New York, USA, 1985, pp. 1-25.
73. R. Kaliszan, M.P. Marszall, M.J. Markuszewski, T. Baczek and J. Pemak. Suppression of
Deleterious Effects. of Free Silanols in Liquid Chromatography by lmidazolium
Tetrafluoroborate Ionic Liquids. Journal of Chromatography A: 1030 (1 -2):263-271, (2004).
74. J.D. Sunseri, W.T. Cooper and J.G. Dorsey. Reducing Residual Silanol Interactions in
Reversed-Phase Liquid Chromatography. Thermal Treatment of Silica before Derivatization.
Journal of Chromatography: 1011(1-2):23-29, (2003).
75. C. Koppel and A. Wagemann. Plasma Level Monjtoring ofD, L-Verapamil and Three of
its Metabolites by Reversed-Phase High-Performance Liquid Chromatography. Journal of
Chromatography: 570(1): 229-234, (1991).
76. S.C. Cole, R.J. Flanagan, A. Johnston and D.W. Holt. Rapid High-Performance Liquid
Chromatographic Method for the Measurement of Verapamil and Norveraparnil in Blood
Plasma or Serum. Journal of Chromatography: 218: 621-629, (1981).
77. A. Jankowski, A. Marzec and H. Lamparczyk. Comparative Bioavailability of Veraparnil
from Rapidly absorbed and Slow Release Preparations. Journal of Pharmaceutical and
Biomedical Analysis: 10(1 0-12): 1101-1103, (1992).
202

78. G. Stagni and W.R. Gillespie. Simultaneous Analysis of Veraparnil and Norveraparnil
Enantiomers in Human Plasma by High-Performance Liquid Chromatography. Journal of
Chromatography B: Biomedical Sciences and Applications: 667(2):349-54, ( 1995).
79. M.A. Garcia, J.J. Aramayona, M.A. Bregante, L.J. Fraile and C. Solans. Simultaneous
Determination of Veraparnil and Norveraparnil in Biological Samples by High-Performance
Liquid Chromatography using Ultraviolet Detection. Journal of Chromatography B:
Biomedical Sciences and Applications: 693 (2): 377-382, ( 1997).
80. 0. Von Richter, M. Eichelbaum, F. Schonberger and U. Hofmann. Rapid and Highly
Sensitive Method for the Determination of Veraparnil, [2H7] Veraparnil and Metabolites in
Biological Fluids by Liquid Chromatography-Mass Spectrophotometry. Journal of
Chromatography B: Biomedical Sciences and Applications: 738 ( 1 ): 137-147, (2000).
81. E.Watson and P.A. Kapur. High-Performance Liquid Chromatographic Determination of
Veraparnil in Plasma by Fluorescence Detection. Journal of Pharmaceutical Sciences: 70 (7):
800-801, (1981).
82. Y. Ozkan, N. Yilmaz, S. A. Ozkan and I. Biryol: High-Performance Liquid
Chromatographic Analysis of Veraparnil and its Application to Determination in Tablet
Dosage Forms and to Drug Dissolution Studies. IL Farmaco: 55:376-382, (2000).
83. P.M. Lacroix, S.J. Graham and E.G. Lovering. High-Performance Chromatographic
Method for the Assay of Veraparnil Hydrochloride in Raw Materials. Journal of
Pharmaceutical and Biomedical Analysis: 9 (10-12): 811-822, (1991).
84. H.S. Shin, Y.S. Oh-Shin, H.J. Kim and Y.K. Kang. Sensitive Assay for Veraparnil in
Plasma using Gas-Liquid Chromatography with Nitrogen-Phosphorus Detection. Journal of
Chromatography B: Biomedical Sciences and Applications: 677 (2):369-373, (1996).
85. D.R. Abernethy, E.L. Todd and J.R. Mitchell. Veraparnil and Norveraparnil Determination
in Human Plasma by Gas-Liquid Chromatography using Nitrogen-Phosphorus Detection:
Application to Single-Dose Pharmacokinetic Studies. Pharmacology: 29 (5):264-268, (1984).
86. G.Mikus, M.Eichelbaum, C.Fischer, S.Gumulka, U.Klotz and H.Kroemer. Interaction of
Veraparnil and Cimetidine: Stereochemical Aspects of Drug Metabolism, Drug Disposition
and Drug Action. Journal of Pharmacology and Experimental Therapeutics: 253: 1042-1048,
(1990).
203

87. A. Tracqui, C. Tournoud, P. Kintz, M. Villain, C. Kummerlen, P. Sauder and B. Ludes.
HPLC/MS Findings in a Fatality involving Sustained-Release Verapamil. Human and
Experimental Toxicology: 22 (9): 515-521, (2003).
88. J.Lindholm, M. Johansson and T.Fornstedt. Guidelines for Analytical Method
Development and Validation of Biotechnological Synthesis of Drugs Production of a
Hydroxyprogesterone as Model. Journal of Chromatography B: 791: 323-336, (2003).
89. K. Hammarstrand. Internal Standard in Gas Chromatography. Varian Instrument
Applications: 10 (1):10-11, (1976).
90./nstrumental Methods of Analysis. H.W. Willard, L.L. Merritt Jr, J .A. Dean, F.A. Settle Jr.
Wadsworth Publishing Company, Belmont, California, USA, 7th Edition, 1988, pp. 626-644.
91. A. Marin, E. Garcia, A. Garcia and C. Barbas. Validation of an HPLC Quantitation of
Acetaminophen, Phenylephrine and Chlorpheniramine in Pharmaceutical Formulations:
Capsules and Satchets. Journal of Pharmaceutical and Biomedical Analysis: 29: 701-714,
(2002).
92. Waters Chromatography Columns and Supplies Catalogue. Waters Corporation, USA,
1999-2000, pp. 44-55.
93. R. Wood. How to Validate Analytical Methods. Trends in Analytical Chemistry: 18 (9-
1 0):624-632, ( 1999).
94. A.G. Causey, H.M. Hills and L.J. Phillips. Journal of Pharmacy and Biomedical Analysis:
8: 625, (1990).
95. B. Bidlingmeyer, Detector Linearity. Journal of Chromatography Sciences: 31:294,
(1993).
96. United States Pharmacopoeia Incorporating" The National Formulary", United States
Pharmacopoeial Convention, Maryland, 26th Edition, 2003, pp. 2441-2442.
97. G. C. Hokanson: A life Cycle Approach to the Validation of Analytical Methods during
Pharmaceutical Product Development, Part I: The Initial Method Validation Process.
Pharmaceutical Technology: 118-131, (1994).
204

98. Guidance for Industry: Bioanalytical Methods Validation. United States Department of
Health and Human Services, Food and Drug Administration, Center for Drug Evaluation and
Research (CDER), Center for Veterinary Medicine (CVM), May, 2001.
http://www.fda.gov/cder/guidance/4252fnl.pdf. Retrieved 13 /05/ 2003.
99. ICH-Topic Q2A: Text on Validation of Analytical Procedures. International Conference on
Harmonization of Technical Requirements for Registration of Pharmaceuticals for Human Use,
Geneva 1995. http://www.ich.org/pdfiCH/02A.pdf. Retrieved 13 /05/2003.
100. ICH-Topic Q2B: Validation of Analytical Procedures: Methodology. International
Conference on Harmonization of Technical Requirements for Registration of Pharmaceuticals
for Human Use, Geneva 1997. http://ich.org/pdfiCH/Q2B.pdf. Retrieved 13 /05/2003.
101. H. Pappa, R. Farro, P.Z. 0. Vilanova, M . Palacios an M.T. Pzzorno. A New HPLC
Method to Determine Donepezil Hydrochloride in Tablets. Journal of Pharmaceutical and
Biomedical Analysis: 27: 177-182, (2002).
102. G.S Clarke. The Validation of Analytical Methods for Drug Substances and Drug
Products in UK Pharmaceutical Laboratories. Journal of Pharmacy and Biomedical Analysis:
12 (5):643-652, (1994).
103. Reviewer Guidance: Validation of Chromatographic Methods. United States Department
of Health and Human Services, Food and Drug Administration, Center for Drug Evaluation
and Research (CDER), November, 1994. http://fda/cder/guidance/cmc3.pdf. Retrieved
14/05/2003.
104. C.A. Lau-Cam and D. Piemontese. Simplified Reversed HPLC Method with
Spectrophotometric Detection for the Assay of Verapamil in Rat Plasma. Journal of
Pharmaceutical and Biomedical Analysis: 16: 1029-1035, (1998).
105. T.C. Paino and A.D. Moore: Determination of the LOD and LOQ of an HPLC Method
Using Four Different techniques. Pharmaceutical Technology: 86-92 (1999).
106. J. Vessman. Selectivity or Specificity? Validation of Analytical Methods from the
Perspective of an Analytical Chemist in the Pharmaceutical Industry. Journal of Pharmacy and
Biomedical Analysis: 14 (8-10): 867-869, (1996).
205

107. H. Rosing, W.Y. Man, E. Doyle, A. Bult and J.H. Beijnen. Bioanalytical Liquid
Chromatographic Method Validation. A Review of Current Practices and Procedures. Journal
of Liquid Chromatography and Related Technologies: 23(3):329 -354, (2000).
108. Q. Lia, V. Rudolph, B. Weigl and A. Earl. Interparticle Vander Waals Force in Powder
Flowability and Compatibility. International Journal of Pharmaceutics: 280:77-93, (2004).
109. J.S. Kaerger, S. Edge and R. Price. Influence of Particle Size and Shape on Flowability
and Compactibility of Binary Mixtures of Paracetamol and MCC. European Journal of
Pharmaceutical Sciences: 22:173-179, (2004).
110. J. Liu, F. Zhang and J .W. McGinity. Properties of Lipophilic Matrix Tablets containing
Phenylpropanolamine Hydrochloride prepared by Hot-Melt Extrusion. European Journal of
Pharmaceutics and Biopharmaceutics: 52:181-190, (2001).
111. K.R. Reddy, S. Mutalik and S. Reddy. Once-Daily Sustained-Release Matrix Tablets of
Nicorandil: Formulation and In-vitro Evaluation. AAPS Pharmaceutical Science and
Technology: 4 (4), Article 61, l-9, (2003). http://www.aapspharrnscitech.org. Retrieved
21/08/2004.
112. Pharmaceutical Pre-Formulation: The Physicochemical Properties of Drug Substances,
!.Wells, Horwood Limited, Chichester, UK, 1988. pp. 211.
113. V. Kumar, M.L.R. Medina and D.Yang. Preparation, Characterization, and Tableting
Properties of a New Cellulose-based Pharmaceutical Aid. International Journal of
Pharmaceutics: 235:129-140, (2002).
114. F. Sadeghi, J. L. Ford and A. R. Siahboorni. The Influence of Drug Type on the Release
Profiles from Surelease® -Coated Pellets. International Journal of Pharmaceutics: 254:123-
135, (2003).
115. V. Kumar, S. H. Kothari and G. S. Banker. Compression, Compaction, and Disintegration
Properties of Low Crystallinity Celluloses Produced Using Differential Agitation Rates During
their Regeneration from Phosphoric Acid Solutions. AAPS Pharmaceutical Science and
Technology: 2(2) Article 7: 1-7, (2001). http://www.pharmscitech.com. Retrieved 19/07/2004.
116. Y. Zhang, Y. Law and S. Chakrabati. Physical Properties and Compact Analysis of
Commonly used Direct Compression Binders. AAPS Pharmaceutical Science and
206

Technology: 4 (4) Article 62, 1-11, (2003). http://www.aapspharmscitech.org . Retrieved
09/07/2004.
117. F. Nicklasson and G. Alderbom. Analysis of the Pharmaceutical Agglomerates of
Differential Porosity and Composition using the Adams and Kawakita Equations.
Pharmaceutical Research: 17(8):1949-1954, (2000).
118. F. Podzeck and G. L. Amies. The Bulk Volume Changes of Powders by Granulation and
Compression with respect to Capsule Filling. International Journal of Pharmaceutics: 142:97-
102, (1996).
119. The Handbook of Pharmaceutical Excipients. R.C Rowe, P.J. Sheskey and P. J. Weller
(eds.): American Pharmaceutical Association, Washington, USA, 4rd Edition, 2003, pp. 72-73,
89-92, 108-111, 237-241, 287-288, 323-331, 354-457,462-468, 641-643.
120. J. H. Guo. Carbopol®. Drug Delivery Technology: 2004
121. S. Azarmi, J. Farid, A Nokhodchi, S.M.B. Saravi and H.Valizadeh. Thermal Treating as a
Tool for Sustained-Release of Indomethacin from Eudragit® RS and RL Matrices.
International Journal of Pharmaceutics: 246:171-177, (2002).
122. Rohm Information Leaflets. Eudragit®. Sustained-Release Formulations for Oral Dosage
Forms, Basic Info 2, Rohm, PHARMA POLYMERS, 5011095/45546290/02.
123. A. Streubel, J. Siepmann, A Dashevsky and R. Bodmeier. pH-Independent Release of a
Weakly Basic Drug from Water-Insoluble and Soluble Matrix Tablets. Journal of Controlled
Release: 67:101-110, (2000).
124. V. Mahaguna, R.L.Talbert, J.I. Peters, S. Adams, T.D. Reynolds, F.Y.W. Lam and R.O.
Williams III. Influence of Hydroxypropylmethylcellulose Polymer on In-Vitro and In-Vivo
Performance of Controlled-Release Tablets containing A1prazolam. European Journal of
Pharmaceutics and Biopharmaceutics: 56:461-468, (2003).
125. K. Tahara, K. Yamamoto and T. Nishihata. Overall Mechanism behind Matrix Sustained
Release (SR) Tablets prepared with Hydroxypropylmethylcellulose 2910. Journal of
Controlled Release: 35:59-66, (1995).
207

126. C. De Brabander, C. Vervaet and J.P. Remon. Development and Evaluation of Sustained
Release Mini-Matrices Prepared via Hot Melt Extrusion. Journal of Controlled Release:
89:235-247, (2003).
127. K.H. Khanvilkar, Y. Huang and A.D. Moore. Influence ofHydroxylmethylcellulose
Mixture, Apparent Viscosity, and Tablet Hardness on Drug Release using a 23 Full Factorial
Design. Drug Development and Industrial Pharmacy: 28(5):601-608, (2002).
128. S.M. Samani, H. Montaseri and A. Kazemi . The Effect of Polymer Blends on Release
Profiles of Diclofenac Sodium from Matrices. European Journal of Pharmaceutics and
Biopharmaceutics: 55:351-355, (2003).
129. J. Siepmann and N.A. Peppas. Modelling of Drug Release from Delivery Systems based
on Hydroxypropylmethylcellulose (HPMC). Advanced Drug Delivery Reviews: 48:139-157,
(2001 ).
130. B.J. Lee, S.G. Ryu and J.H. Cui. Controlled-Release of Dual Drug-Loaded
Hydroxypropylmethylcellulose Matrix Tablet using Drug-Containing Polymeric Coatings.
International Journal of Pharmaceutics: 188:7 1-80, ( 1999).
131. Surelease®, Aqueous Ethylcellulose Dispersion. Information Sheet I Product Information,
Colorcom®, 200 I , MR/Prodspec I Sure lease E-7 -190 10/12.00-Rev06.0 1.
132. Controlled and Modulated Release Drug Delivery Systems. In: J .Swarbrick and
J.C.Boylan (ed.): Encyclopedia of Pharmaceutical Technology, Marcel Dekker, New York,
USA, 1990, pp. 281-313.
133. R.K. Verma, A.M. Kaushal and S. Garg. Development and Evaluation of Extended
Release Formulations of Isosorbide Mononitrate based on Osmotic Technology. International
Journal of Pharmaceutics: 263: 9-24, (2003).
134. S.A. Bravo, M.C. Lamas and C.J. Salomon. Swellable Matrices for the Controlled
Release of Diclofenac Sodium: Formulation and In-Vitro Studies. Pharmaceutical
Development and Technology: 9 (1) 75-83, (2004).
135. U. S. Toti and T. M. Aminabhavi. Modified Guar-Gum Matrix Tablet for Controlled
Release ofDiltiazem Hydrochloride. Journal of Controlled Release: 95,567-577, (2004).
208

136. A. Ahmed, C. Bonner and T. A. Desai. Bioadhesive Microdevices with Multiple
Reservoirs: A New Platform for Oral Drug Delivery. Journal of Controlled Release:
81(3):291-306, (2002).
137. A. Nissinen, A. Koistinen, J. Tuomi Iehto, S. Sundberg and A. Gordin. Sustained-Release
Verapamil in Hypertension. Results from a Non-Invasive Ambulatory Blood Pressure
Monitoring and Clinical Study. European Journal of Clinical Pharmacology: 31 (3): 255-259,
(I 986).
138. M.M Bhatti, R.Z. Lewanczuk. F.M. Pasutto and R.T Fosrer. Pharmacokinetics of
Verapamil and Norveraparnil Enantiomers after Administration of Immediate and Controlled
Release Formulations to Humans: Evidence Suggesting Input-Rate Determined
Stereoselectivity. Journal of Clinical Pharmacology: 35: 1076-1082, (1995).
139. Review of pharmaceutical Controlled Release Methods and Device. Paul A. Steward,
1995, http://initium.demon.co.uk/rel nf.html . Retrieved I 0/08/2004.
140. M. J. Habib and R. Mesue. Development of Controlled-Release Formulations of
Ketoprofen for Oral Use. Drug Development and Industrial Pharmacy: 21(12):1463-1472,
(1995).
141. Pharmaceutics, Dosage Form Design and Manufacture, M.E. Aulton (ed.): Churchill
Livingstone (Harcourt Publishers), London, UK, 2002, p. 404-421.
142. F. Theeumes. Elementary Osmotic Pump. Journal of Pharmaceutical Sciences: 64:1987-
1991, (1975).
143. D. Prabakaran, P. Singh, P. Kanaujia and S.P. Vyas. Effect of Hydrophilic Polymers on
the Release of Diltiazem Hydrochloride from Elementary Osmotic Pumps. International
Journal of Pharmaceutics: 259:173-179, (2003).
144. X. Li, W. Pan, S. Nie, and L. Wu. Studies on Controlled-Release Effervescent Osmotic
Pump Tablets from Traditional Chinese Medicine Compound Recipe. Journal of Controlled
Release: 96 (3): 359- 367, (2004).
145. L. Liu, G. Khang, J. M. Rhee and H. B. Lee. Monolithic Osmotic Tablet Systems for
Nifedipine Delivery. Journal of Controlled release: 67(1 - 3):309-322, (2000).
209

146. V. P. Shah, M. Gurbarg, A. Noory, S. Dighe and J.P. Skelly. Influence of Higher Rates of
Agitation on Release Patterns of Immediate-Release Drug Products. Journal of
Pharmaceutical Sciences: 81(6):500-503, (1992).
147. K. K. Peh and C. F. Wong. Application of Similarity Factor in Development of
Controlled-Release Diltiazem Tablet. Drug Development and Industrial Pharmacy: 26
(7):723-730, (2000).
148. P. Costa and J.M.S. Lobo. Influence of Dissolution Medium Agitation on Release Profiles
of Sustained-Release Tablets. Drug Development and Industrial Pharmacy: 27(8):8 I 1-817,
(2001).
149. Physical Pharmacy: Physical Chemical Principles in the Physical Sciences: A.N. Martin
Lea & Febiger, Philadelphia, USA, 4th Edition, 1993, pp. 330-332.
150. J.M. Aiache, N. Aoyagi, H. Blune, J . Dressman, H.D. Friedel, L.T. Grady and V. Gray.
FIP Guidance for Dissolution Testing of Solid Oral Products. Dissolution Technology: 4(4):5-
14, (1997).
151. I. Borst, S. U gwu and A. H. Bekett. New and Extended Application for USP Drug Release
Apparatus 3. Dissolution technology: 4 (1):11-16, (1997).
152. J.T. Fell and J.M. Newton. Determination of Tablet Strength by the Diametrai
Compression Test. Journal of Pharmaceutical Sciences: 59(5):688-691 , ( 1970).
153. K.G.H. Desai and T.M.P. Kumar. Preparation and Evaluation of a Novel Buccal Adhesive
System. AAPS Pharmaceutical Science and Technology: 5(3) Article 35:1-9, (2004).
http://aapspharmscitech.org. Retrieved 04110/2004.
154. M. Efentakis, A. Koutlis and M. Vlachou. Development and Evaluation of Oral Multiple
unit and Single-Unit Hydrophilic Controlled-release Systems. AAPS Pharmaceutical Science
and Technology: 1(4) Article 34:1-9, 2000. http://www.pharmscitech.com. Retrieved
24/09/2004.
155. Y.M. Rao, J.K. Veni and G. Jayasagar. Formulation and Evaluation of Diclofenac Sodium
using Hydrophilic Matrices. Drug Development and Industrial Pharmacy: 27:759-766, (2001).
156. L.L. Huang and J.B. Schwartz. Studies on Drug Release from a Carbomer Tablet Matrix.
Drug Development and Industrial Pharmacy: 21(13): 1487-1501 , (1995).
210

157. Controlled Release Tablets and Capsules. Carbopol Technical Bulletin: 17:1-27, (1994).
158. M. Dimitrov and N. Lambov. Study of Verapamil Hydrochloride Release from
Compressed Hydrophilic Polyox-Wsr Tablets. International Journal of Pharmaceutics:
189:105-111' (1999).
159. S.H. Neau, M.Y. Chow and M.J. Durrani. Fabrication and Characterization of Extruded
and Spheronized Beads Containing Carbopol®974 NF Resin. International Journal of
Pharmaceutics: 131:47-55, (1996).
160. S. A. Elkheshem. Interaction of Verapamil Hydrochloride with Carbopol® 934P and Its
Effect on the Release Rate of the Drug and Water Uptake of the Polymer Matrix. Drug
Development and Industrial Pharmacy: 27(9):925-934, (2001).
161. D.K Padmalatha, K.V.Rao Ranga, S.Bajeva, M.Fathi and M. Roth. Zero-Order Release
Formulation of Oxyprenolol Hydrochloride with Swelling and Erosion Control.
Pharmaceutical Research: 6: 313-317, (1989).
162. M. Efentakis and A. Koutlis. Release of Furosemide from Multiple Unit and Single Unit
Preparations Containing Different Viscocity Grades of Sodium Alginate. Pharmaceutical
Development Technology: 6(1):91-98, (2001).
163. M.M. Meshali, G.M.E. Sayed, Y.E. Said and H.M.A. Aleem. Preparation and Evaluation
of Theophylline Sustained-Release Tablets. Drug Development and Industrial Pharmacy:
22(4):373-376, (1996).
164. L.X. Yu, J .T. Wang and A.S. Hussain. Evaluation of USP Apparatus 3 for Dissolution
Testing oflmrnediate-Release Products. MPS Pharmaceutical Science and Technology: 4 (1):
1-5, (2002). http://pharmsci.org. Retrieved 04/10/2004.
165. B.R. Rohrs, D.L. Burch-Clark, M. J. Witt and D.J. Stelzer. USP Dissolution Apparatus 3
(Reciprocating Cylinder): Instrument Parameter Effects on Drug Release from Sustained
Release Formulations. Journal of Pharmaceutical Sciences: 84(8):922-926, ( 1995).
166. S. A. Qurishi and J . Shabnam. Application of a New Device (spindle) for Improved
Characterization of Drug Release (dissolution) of Pharmaceutical Products. European Journal
of Pharmaceutical Sciences: 19:291-297, (2003).
211

167. J. Siepmann and N.A. Peppas. Mathematical Modelling of Controlled Drug Delivery.
Advanced Drug Delivery Preview: 48:137-138, (2001).
168. V. Agarwal and B. Mishra. Design, Development, and Biopharmaceutical Properties of
Buccoadhesive Compacts of Pentazocine. Drug Development and Industrial Pharmacy:
25(6):701-709, (1999).
169. M.A.A. Reis, R.D. Sinisterra and J.C. Belchior. An Alternative Approach Based on
Artificial Neural Networks to Study Controlled Drug Release. Journal of Pharmaceutical
Sciences: 93(2):418-430, (2004).
170. M. C. Gohel and M. K. Panchal. Comparison of In-Vitro Dissolution Profiles Using a
Novel, Model-Independent Approach. Pharmaceutical Technology: 92-100, (2000).
171 . T. O'Hara, A. Dunne, J. Butler and J. Devane. A Review of Methods used to Compare
Dissolution Profile Data. Plasma Sources Science and Technology: 1(5):214-222, (1998).
172. N. Yuksen, A. E. Kanik, and T. Baykara. Comparison of In-Vitro Dissolution Profiles by
ANOVA-Based, Model-Dependent and Model-Independent Methods. International Journal of
Pharmaceutics: 209:57-67, (2000).
173. M. Hurtado y de Ia Pena. Comparison of Dissolution Profiles for Albendazole Tablets
Using USP Apparatus 2 and 4. Drug Development and Industrial Pharmacy: 29(7):777-784,
(2003).
174. J.W. Moore and H.F. Flanner. Mathematical Comparison of Dissolution Profiles.
PharmaceuticaL Technology: 20(6): 64-74, (1996)
175. J. E. Polli, G.S. Rekhi, L.L. Augusburger and V. P. Shah. Methods to Compare
Dissolution Profiles and a Rationale for Wide Dissolution Specification for Metoprolol
Tartrate Tablets. Journal of Pharmaceutical Sciences: 86(6):690-700, (1997).
176. J .W. Mauger, D. Chilko and S. Howard. On the Analysis of the Dissolution Data. Drug
Development and Industrial Pharmacy: 12:969-992, ( 1986).
177. P.Costa and J.M.S. Lobo. Evaluation of Mathematical Models Describing Drug Release
from Estradiol Transdermal Systems. Drug Development and Industrial Pharmacy: 29 ( 1 ):89-
97, (2003).
212

178. P.M. Sathe, Y. Tsong, and V.P. Shah. In-Vitro Dissolution Profile Comparison: Statistics
and Analysis, Model-Dependent Approach. Pharmaceutical Research: 13:1799-1803, (1996).
179. E. Adams, D. Coomans, J. Smeyers-Verbeke and D.L. Massart. Non-linear Mixed Effects
Models for the Evaluation of Dissolution Profiles. International Journal of Pharmaceutics:
240:37-53, (2002).
180. Guidance for Industry: Dissolution Testing oflmmediate -Release Solid Oral Dosage
Forms. US Department of Health and Human Services, Food and Drug Administration, Center
for Drug Evaluation and Research (CDER), August, 1997.
http://fda.gov/cder/guidance/1713bpl.pdf. Retrieved 19111/2004.
181. Guidance for Industry: Immediate Release Solid Oral Dosage Forms. Scale-Up and Post
Approval changes: Chemistry, Manufacturing and Controls. In-Vitro Dissolution Testing and
In-Vivo Bioequivalence Documentation. US Department of Health and Human Services, Food
and Drug Administration, Center for Drug Evaluation and Research (CDER), November, 1995.
http://www.fda.gov/cder/guidance/cmc5.pdf. Retrieved 19/1112004.
182. Note for Guidance on Quality of Modified Release Products: A. Oral Dosage Forms; B.
Transdermal Dosage Forms; European Agency for the Evaluation of Medicinal Products.
Human Medicines Evaluation Unit. Section I (Quality), CPMP/QWP/604/96.July, 1999.
http://www.eu.int/pdfs/humanlqwp/060496en.pdf. Retrieved 1911112004.
183. V. P. Shah, Y. Tsong, P. Sathe and J.P. Liu.ln-Vitro Dissolution Profile Comparison
Statistics and Analysis of the Similarity Factor,A Pharmaceutical Research: 5(6): 889-896,
( 1998).
184. H. L. Ju and S.J. Liaw. On the Assessment of Similarity of Drug Dissolution Profiles-A
Simulation Study. Drug lnform.ation Journal: 31:1273-1289, (1997).
185. P.Costa and J.M.S. Lobo. Modeling and Comparison of Dissolution Proflles. European
Journal of Ph.armaceutical Sciences: 13:123-133, (2001 ).
186. E. Adams, D. Coomans, J. Smeyers-Verbeke and D.L. Massart. Application of Linear
Mixed Effects Models to the Evaluation of Dissolution Profiles. International Journal of
Pharmaceutics: 226: I 07-125, (2001).
187. S. Kuttatharmakul, J. Smeyers-Verbeke, D.L. Massart, D. Coomans and S.
Noack. The Mean and Standard Deviation of Data, some of which are below the
213

Detection Limit: An Introduction to Maximum Likelihood Estimation. Trends in
Analytical Chemistry: 19: 215-222, (2000).
188. M.J. Crowder. Keep Timing the Tablets; Statistical Analysis of Polymer Dissolution Rate.
Applied Statistics: 45(323):334, (1996).
189. M. Donbrow andY. Samuelov. Zero Order Drug Delivery from Double-Layered Porous
Films: Release Rate Profiles from Ethyl Cellulose, Hydroxypropylcellulose and Polyethylene
Glycol Mixtures. Journal of Pharmacy and Pharmacology: 32 (7): 463-470, (1980).
190. A. Sood and R. Panchagnula. Drug Release Evaluation ofDiltiazem CR Preparations.
International Journal of Pharmaceutics: 175:95-107, (1998).
191. M. Gibaldi and S. Feldman. Establishment of Sink Conditions in Dissolution Rate
Determinations- Theoretical Considerations and Application to Non-disintegrating Dosage
Forms. Journal of Pharmaceutical Sciences: 56(1 0): 1238-1242, (1967).
192. T. Higuchi. Rate of Release of Medicaments from Ointment Bases containing Drugs in
Suspension. Journal of Pharmaceutical Sciences: 50(10):874-875, (1961).
193. T. Higuchi. Mechanism of Sustained-Action Medication. Theoretical Analysis of Rate of
Release of Solid Drugs Dispersed in Solid Matrices. Journal of Pharmaceutical Sciences:
52(12):1145-1149, (1963).
194. P. Costa and J .M.S. Lobo. Divisibility of Diltiazem Matrix Sustained Release Tablets.
Pharmaceutical Development and Technology: 6(3):343-351 , (2001).
195. Controlled Release: Mechanisms and Rates. Controlled Release of Biologically Active
Agents. In: Taquary, A.C., Lacey, R.E. (Eds.), Plenum Press, New York, 1974, pp. 15-71.
196. G. Trapani, M. Franco, A. Latrofa, M. R. Pantaleo, M. R. Provenzano, E. Sanna, E.
Maciocco and G. Lisa. Physicochemical Characterization and In-Vivo Properties of Zolpidem
in Solid Dispersions with Polyethylene Glycol4000 and 6000. International Journal of
Pharmaceutics: 184:121-130, ( I 999).
197. P.J.Niebergall, G.Milosovich and J.E.Goyan. Dissolution Rate Studies. II. Dissolution of
Particles under Conditions of Rapid Agitation. Journal of Pharmaceutical Sciences: 52: 236-
241 ' (1963).
214

198. F. Langenbucher. Linearization of Dissolution Rate Curves by the Weibull Distribution.
Journal of Pharmacy and Pharmacology: 24:979-981, (1972).
199. J .A. Goldsmith and N. Randall. On Methods of Expressing Dissolution Rate Data.
Journal of Phannacy and Pharmacology: 30(6):347-349, (1978).
200. G.K. Vudathala and J .A.Rogers. Dissolution of Fludrocortisone from Phospholipid Co
Precipitates. Journal of Pharmaceutical Sciences: 81(3):282-286, ( 1992).
20 I. Y. Tang and K. Gan. Statistical Evaluation of In-Vitro Dissolution of Different Brands of
Ciprofloxacin Hydrochloride Tablets and Capsules. Drug Development and Industrial
Pharmacy: 24(6):549-552, ( 1998).
202. H.Y. Karasulu, G. Ertan and T. Kose. Modelling of Theophylline Release from Different
Geometrical Erodable Tablets. European Journal of Pharmaceutics and Biopharmaceutics:
49(2): 172-182, (2000).
203. R.W. Korsmeyer, R. Gurny, E.M. Doelker, P.Buri and N.A. Peppas. Mechanism of Solute
Release from Porous Hydrophilic Polymers. International Journal of Pharmacy: 15: 25-35,
(1983).
204. M.T. Albarran and L.V. Robles. Assay of Amoxicillin Sustained-Release from Matrix
Tablets Containing Different Proportions of Carbopol® 971 P NF. International Journal of
Pharmaceutics: 273:121-127, (2004).
205. S.F. Su, C.H. Chou, C.F. Kung and J.D. Huang. In-Vitro and In-Vivo Comparison of Two
Diclofenac Sodium Sustained- Release Oral Formulations. International Journal of
Pharmaceutics: 260:39-46, (2003).
206. V. Vigoreaux and E.S. Ghaly. Fickian and Relaxational Contribution Quantification of
Drug Release in a Swellable Hydrophilic Polymer Matrix. Drug Development and Industrial
Pharmacy: 20(16):2519-2526, (1994).
207. T.K. Mandai. The Influence of Binding Solvents on Drug Release from
Hydroxypropylmethylcellulose Tablets. Drug Development and Industrial Pharmacy:
21(12):1389-1397, (1995).
215
' ~ • I
208. P.L.Rigter and N.A. Peppas. A Simple Equation for Description of Solute Release II.
Fickian and Anomalous Release from Swellable Devices. Journal of Controlled Release: 5:
37-42, (1987).
209. M.C. Gohel, T. P. Patel, and S.H. Bariya. Studies in Preparation and Evaluation of pH
Independent Sustained-Release Matrix Tablets of Veraparnil HCL using Directly Compressible
Eudragits®. Pharmaceutical Development and Technology: 8(4): 323-333, (2003).
216
Related Documents


