1 Prefer Calling Sir Obiero Amos @ 0706 851 439 for the Marking Schemes FORM FOUR MATHEMATICS TOPICAL QUESTIONS N/B Marking Schemes are NOT Free of Charge ONLY Questions Are Free of Charge

Welcome message from author
This document is posted to help you gain knowledge. Please leave a comment to let me know what you think about it! Share it to your friends and learn new things together.
Transcript

1
Prefer Calling Sir Obiero Amos @ 0706 851 439 for the Marking Schemes
FORM FOUR MATHEMATICS
TOPICAL QUESTIONS
N/B Marking Schemes are NOT Free of Charge
ONLY Questions Are Free of Charge

2
Prefer Calling Sir Obiero Amos @ 0706 851 439 for the Marking
Schemes
3
Prefer Calling Sir Obiero Amos @ 0706 851 439 for the Marking
Schemes
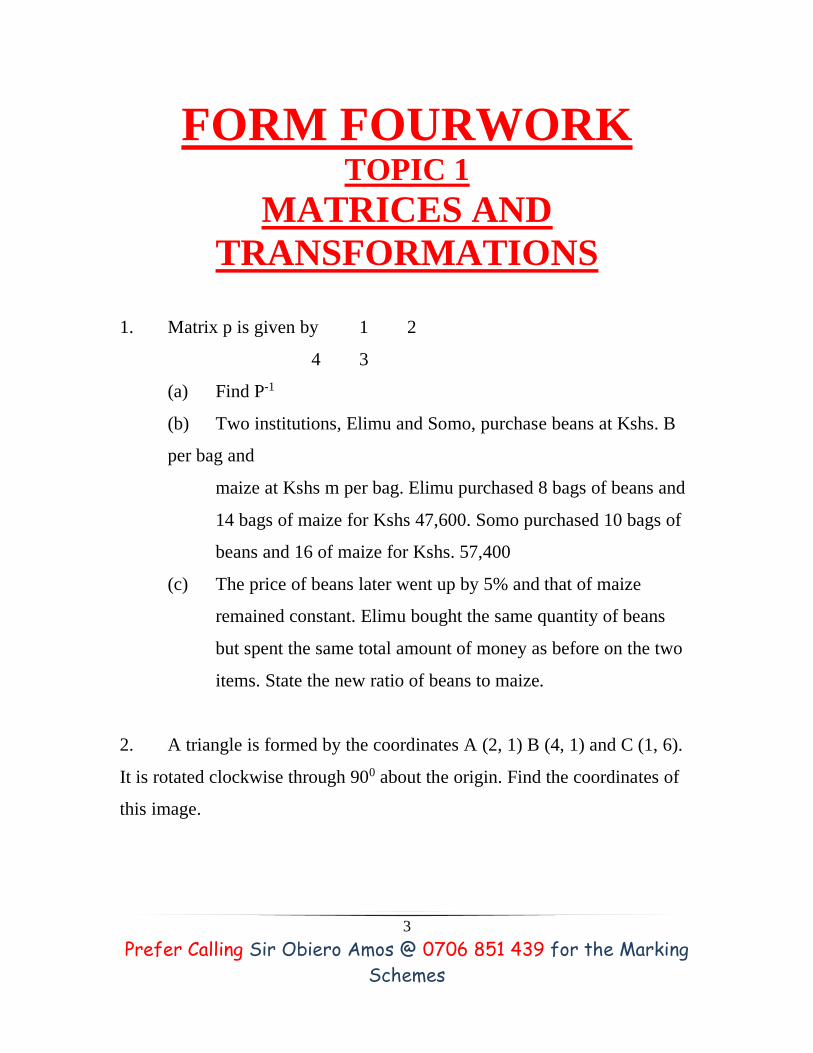
FORM FOURWORK TOPIC 1
MATRICES AND
TRANSFORMATIONS
1. Matrix p is given by 1 2
4 3
(a) Find P-1
(b) Two institutions, Elimu and Somo, purchase beans at Kshs. B
per bag and
maize at Kshs m per bag. Elimu purchased 8 bags of beans and
14 bags of maize for Kshs 47,600. Somo purchased 10 bags of
beans and 16 of maize for Kshs. 57,400
(c) The price of beans later went up by 5% and that of maize
remained constant. Elimu bought the same quantity of beans
but spent the same total amount of money as before on the two
items. State the new ratio of beans to maize.
2. A triangle is formed by the coordinates A (2, 1) B (4, 1) and C (1, 6).
It is rotated clockwise through 900 about the origin. Find the coordinates of
this image.

4
Prefer Calling Sir Obiero Amos @ 0706 851 439 for the Marking
Schemes
3. On the grid provided on the opposite page A (1, 2) B (7, 2) C (4, 4) D
(3, 4) is a trapezium
(a) ABCD is mapped onto A’B’C’D’ by a positive quarter turn. Draw the
image A’B’C’D on the grid
(b) A transformation -2 -1 maps A’B’C’D onto A”B” C”D” Find the
coordinates 0 1 of A”B”C”D”
4. A triangle T whose vertices are A (2, 3) B (5, 3) and C (4, 1) is
mapped onto triangle T1 whose vertices are A1 (-4, 3) B1 (-1, 3) and C1
(x, y) by a
Transformation M = a b
c d

5
Prefer Calling Sir Obiero Amos @ 0706 851 439 for the Marking
Schemes
a) Find the: (i) Matrix M of the transformation
(ii) Coordinates of C1
b) Triangle T2 is the image of triangle T1 under a reflection in the
line y = x.
Find a single matrix that maps T and T2
5. Triangles ABC is such that A is (2, 0), B (2, 4), C (4, 4) and A”B”C”
is such that A” is (0, 2), B” (-4 – 10) and C “is (-4, -12) are drawn on
the Cartesian plane
Triangle ABC is mapped onto A”B”C” by two successive
transformations
R = a b
c d Followed by P = 0 -1
-1 0
(a) Find R
(b) Using the same scale and axes, draw triangles A’B’C’, the
image of triangle ABC under transformation R
Describe fully, the transformation represented by matrix R

6
Prefer Calling Sir Obiero Amos @ 0706 851 439 for the Marking
Schemes
6. Triangle ABC is shown on the coordinates plane below
(a) Given that A (-6, 5) is mapped onto A (6,-4) by a shear with y-
axis invariant
(i) Draw triangle A’B’C’, the image of triangle ABC under
the shear
(ii) Determine the matrix representing this shear
(b) Triangle A B C is mapped on to A” B” C” by a transformation
defined by the matrix -1 0
1½ -1
(i) Draw triangle A” B” C”
(ii) Describe fully a single transformation that maps ABC onto
A”B” C”
7. Determine the inverse T-1 of the matrix 1 2
1 -1

7
Prefer Calling Sir Obiero Amos @ 0706 851 439 for the Marking
Schemes
Hence find the coordinates to the point at which the two lines
x + 2y = 7 and x - y =1
8. Given that A = 0 -1 and B = -1 0
3 2 2 -4
Find the value of x if
(i) A- 2x = 2B
(ii) 3x – 2A = 3B
(iii) 2A - 3B = 2x
9. The transformation R given by the matrix
A = a b maps 17 to 15 and 0 to -8
c d 0 8 17 15
(a) Determine the matrix A giving a, b, c and d as fractions
(b) Given that A represents a rotation through the origin determine
the angle of rotation.
(c) S is a rotation through 180 about the point (2, 3). Determine the
image of (1, 0) under S followed by R.
8
Prefer Calling Sir Obiero Amos @ 0706 851 439 for the Marking
Schemes
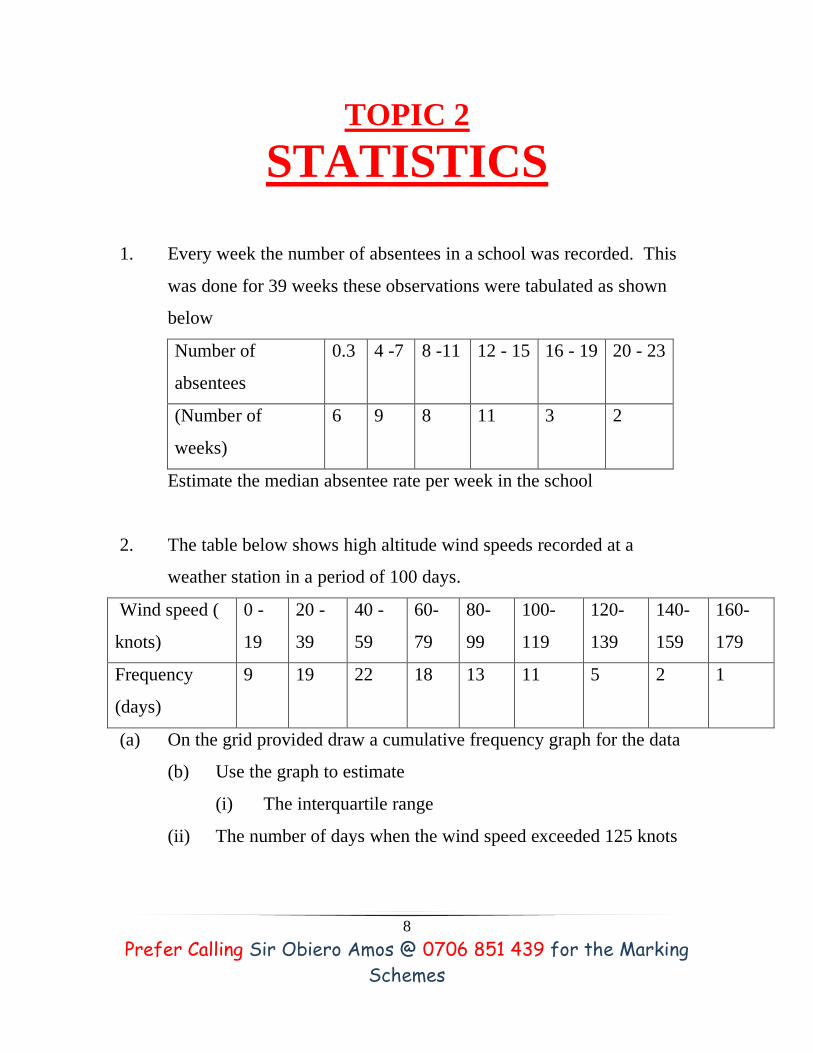
TOPIC 2
STATISTICS
1. Every week the number of absentees in a school was recorded. This
was done for 39 weeks these observations were tabulated as shown
below
Number of
absentees
0.3 4 -7 8 -11 12 - 15 16 - 19 20 - 23
(Number of
weeks)
6 9 8 11 3 2
Estimate the median absentee rate per week in the school
2. The table below shows high altitude wind speeds recorded at a
weather station in a period of 100 days.
Wind speed (
knots)
0 -
19
20 -
39
40 -
59
60-
79
80-
99
100-
119
120-
139
140-
159
160-
179
Frequency
(days)
9 19 22 18 13 11 5 2 1
(a) On the grid provided draw a cumulative frequency graph for the data
(b) Use the graph to estimate
(i) The interquartile range
(ii) The number of days when the wind speed exceeded 125 knots

9
Prefer Calling Sir Obiero Amos @ 0706 851 439 for the Marking
Schemes
3. Five pupils A, B, C, D and E obtained the marks 53, 41, 60, 80 and
56 respectively. The table below shows part of the work to find the
standard deviation.
Pupil Mark x x - a ( x-a)2
A
B
C
D
E
53
41
60
80
56
-5
-17
2
22
-2
(a) Complete the table
(b) Find the standard deviation
4. In an agricultural research centre, the length of a sample of 50 maize
cobs were measured and recorded as shown in the frequency
distribution table below.
Length in cm Number of cobs
8 – 10
11 – 13
14 – 16
17 – 19
20 – 22
23 - 25
4
7
11
15
8
5
10
Prefer Calling Sir Obiero Amos @ 0706 851 439 for the Marking
Schemes
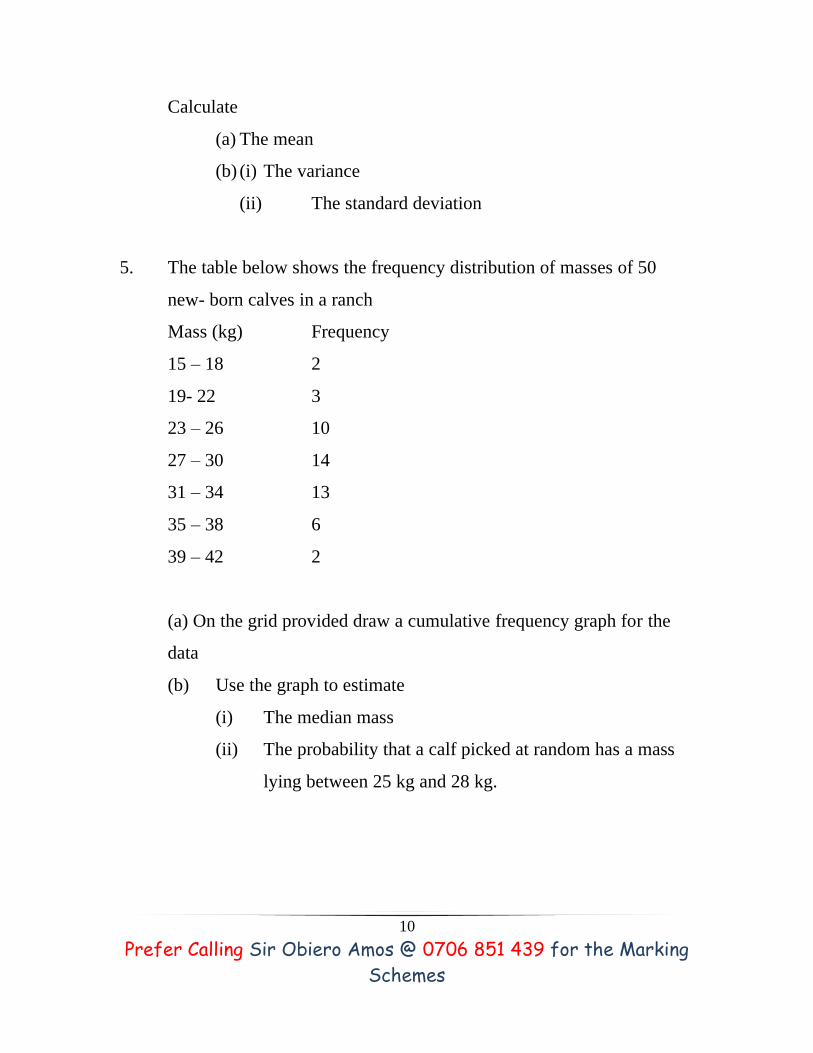
Calculate
(a) The mean
(b) (i) The variance
(ii) The standard deviation
5. The table below shows the frequency distribution of masses of 50
new- born calves in a ranch
Mass (kg) Frequency
15 – 18 2
19- 22 3
23 – 26 10
27 – 30 14
31 – 34 13
35 – 38 6
39 – 42 2
(a) On the grid provided draw a cumulative frequency graph for the
data
(b) Use the graph to estimate
(i) The median mass
(ii) The probability that a calf picked at random has a mass
lying between 25 kg and 28 kg.

11
Prefer Calling Sir Obiero Amos @ 0706 851 439 for the Marking
Schemes
6. The table below shows the weight and price of three commodities in a
given period
Commodity Weight Price Relatives
X 3 125
Y 4 164
Z 2 140
Calculate the retail index for the group of commodities.
7. The number of people who attended an agricultural show in one day
was 510 men, 1080 women and some children. When the information
was represented on a pie chart, the combined angle for the men and
women was 2160. Find the angle representing the children.
8. The mass of 40 babies in a certain clinic were recorded as follows:
Mass in Kg No. of babies.
1.0 – 1.9 6
2.0 – 2.9 14
3.0 -3.9 10
4.0 – 4.9 7
5.0 – 5.9 2
6.0 – 6.9 1
Calculate
(a) The inter – quartile range of the data.
(b)The standard deviation of the data using 3.45 as the assumed mean.
12
Prefer Calling Sir Obiero Amos @ 0706 851 439 for the Marking
Schemes
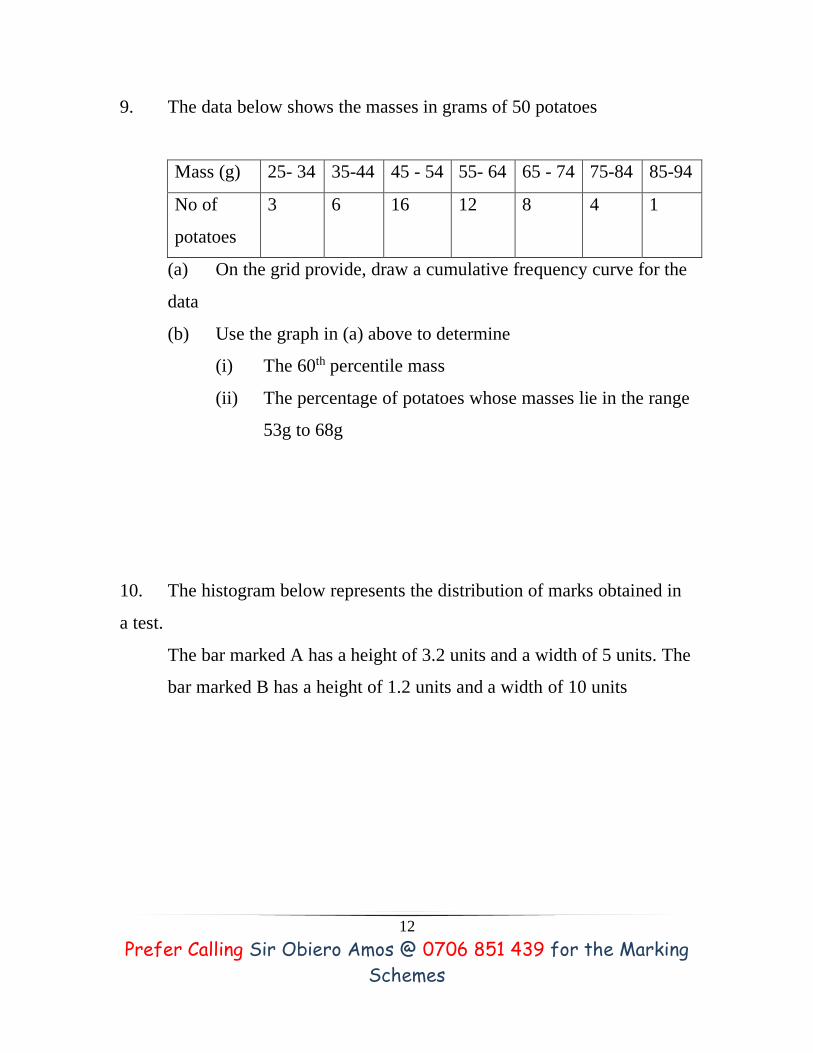
9. The data below shows the masses in grams of 50 potatoes
Mass (g) 25- 34 35-44 45 - 54 55- 64 65 - 74 75-84 85-94
No of
potatoes
3 6 16 12 8 4 1
(a) On the grid provide, draw a cumulative frequency curve for the
data
(b) Use the graph in (a) above to determine
(i) The 60th percentile mass
(ii) The percentage of potatoes whose masses lie in the range
53g to 68g
10. The histogram below represents the distribution of marks obtained in
a test.
The bar marked A has a height of 3.2 units and a width of 5 units. The
bar marked B has a height of 1.2 units and a width of 10 units

13
Prefer Calling Sir Obiero Amos @ 0706 851 439 for the Marking
Schemes
If the frequency of the class represented by bar B is 6, determine
the frequency of the class represented by bar A.
11. A frequency distribution of marks obtained by 120 candidates is to be
represented in a histogram. The table below shows the grouped marks.
Frequencies for all the groups and also the area and height of the
rectangle for the group 30 – 60 marks.
Marks 0-10 10-30 30-60 60-70 70-100
Frequency 12 40 36 8 24
Area of rectangle 180
Height of rectangle 6

14
Prefer Calling Sir Obiero Amos @ 0706 851 439 for the Marking
Schemes
(a) (i) Complete the table
(ii) On the grid provided below, draw the histogram
(b) (i) State the group in which the median mark lies
(ii) A vertical line drawn through the median mark divides
the total area of the histogram into two equal parts
Using this information or otherwise, estimate the median mark
12. In an agriculture research centre, the lengths of a sample of 50 maize
cobs were measured and recorded as shown in the frequency
distribution table below
Length in cm Number of
cobs
8 – 10
11- 13
14 – 16
17- 19
20 – 22
23- 25
4
7
11
15
8
5
Calculate
(a) The mean
(b) (i) The variance
(ii) The standard deviation

15
Prefer Calling Sir Obiero Amos @ 0706 851 439 for the Marking
Schemes
11. The table below shows the frequency distribution of masses of 50
newborn calves in a ranch.
Mass (kg) Frequency
15 – 18
19- 22
23 – 26
27 – 30
31- 34
35 – 38
39 - 42
2
3
10
14
13
6
2
(a) On the grid provided draw a cumulative frequency graph for the
data
(b) Use the graph to estimate
(i) The median mass
(ii) The probability that a calf picked at random has a mass
lying between 25 kg and 28 kg
14. The table shows the number of bags of sugar per week and their
moving averages
Number of bags per
week
340 330 x 343 350 345
Moving averages 331 332 y 346
(a) Find the order of the moving average
(b) Find the value of X and Y axis

16
Prefer Calling Sir Obiero Amos @ 0706 851 439 for the Marking
Schemes
TOPIC 3
LOCI
1. Using ruler and compasses only, construct a parallelogram ABCD
such that AB = 10cm, BC = 7 cm and < ABC = 1050. Also construct
the loci of P and Q within the parallel such that AP ≤ 4 cm, and BC ≤
6 cm. Calculate the area within the parallelogram and outside the
regions bounded by the loci.
2. Use ruler and compasses only in this question
The diagram below shows three points A, B and D
(a) Construct the angle bisector of acute angle BAD
(b) A point P, on the same side of AB and D, moves in such a way
that < APB = 22 ½ 0 construct the locus of P
(c) The locus of P meets the angle bisector of < BAD at C measure <
ABC
3.Use a ruler and a pair of compasses only for all constructions in this
question.
(a) On the line BC given below, construct triangle ABC such that
ABC = 300 and BA = 12 cm

17
Prefer Calling Sir Obiero Amos @ 0706 851 439 for the Marking
Schemes
(b) Construct a perpendicular from A to meet BC produced at D.
Measure CD
(c) Construct triangle A’B’C’ such that the area of triangle A’B’C
is the three quarters of the area of triangle ABC and on the
same side of BC as triangle ABC.
(d) Describe the lucus of A’
4. Use a ruler and compasses in this question. Draw a parallegram
ABCD in which AB = 8 cm, BC = 6 cm and BAD = 750. By
construction, determine the perpendicular distance between AB and
CD.
5. In this question use a ruler and a pair of compasses.
a) Line PQ drawn below is part of a triangle PQR. Construct the
triangle PQR in which < QPR = 300 and line PR = 8 cm
b) On the same diagram construct triangle PRS such that points S and Q
are no the opposite sides of PR<PS = PS and QS = 8 cm
C) A point T is on the a line passing through R and parallel to
QS. If <QTS =900, locate possible positions of T and label
them T1 and T2, Measure the length of T1T2.

18
Prefer Calling Sir Obiero Amos @ 0706 851 439 for the Marking
Schemes
6. (a) ABCD is a rectangle in which AB = 7.6 cm and AD = 5.2 cm.
Draw the rectangle and construct the lucus of a point P within the
rectangle such that P is equidistant from CB and CD ( 3 marks)
(b) Q is a variable point within the rectangle ABCD drawn in (a)
above such that 600 ≤ < AQB≤ 900
On the same diagram, construct and show the locus of point Q,
by leaving unshaded, the region in which point Q lies.
7. The figure below is drawn to scale. It represents a field in the shape
of an equilateral triangle of side 80m
The owner wants to plant some flowers in the field. The flowers must
be at most, 60m from A and nearer to B than to C. If no flower is to be
more than 40m from BC, show by shading, the exact region where the
flowers may be planted.
8. In this question use a ruler and a pair of compasses only
In the figure below, AB and PQ are straight lines

19
Prefer Calling Sir Obiero Amos @ 0706 851 439 for the Marking
Schemes
(a) Use the figure to:
(i) Find a point R on AB such that R is equidistant from P and Q
(ii) Complete a polygon PQRST with AB as its line of symmetry and
hence measure the distance of R from TS.
(b) Shade the region within the polygon in which a variable
point X must lie given that X satisfies the following conditions
1. X is nearer to PT than to PQ
2. RX is not more than 4.5 cm
3. PXT > 900
9. Four points B, C, Q and D lie on same plane. Point B is 42 km due
south – west of town Q. Point C is 50 km on a bearing of 5600 from
Q. Point D is equidistant from B, Q and C.
(a) Using the scale: 1 cm represents 10 km, construct a diagram
showing the position of B, C, Q and D
(b) Determine the
(i) Distance between B and C
(ii) Bearing of D from B
10. The diagram below represents a field PQR
(a) Draw the locus of point equidistant from sides PQ and PR
(b) Draw the locus of points equidistant from points P and R
20
Prefer Calling Sir Obiero Amos @ 0706 851 439 for the Marking
Schemes
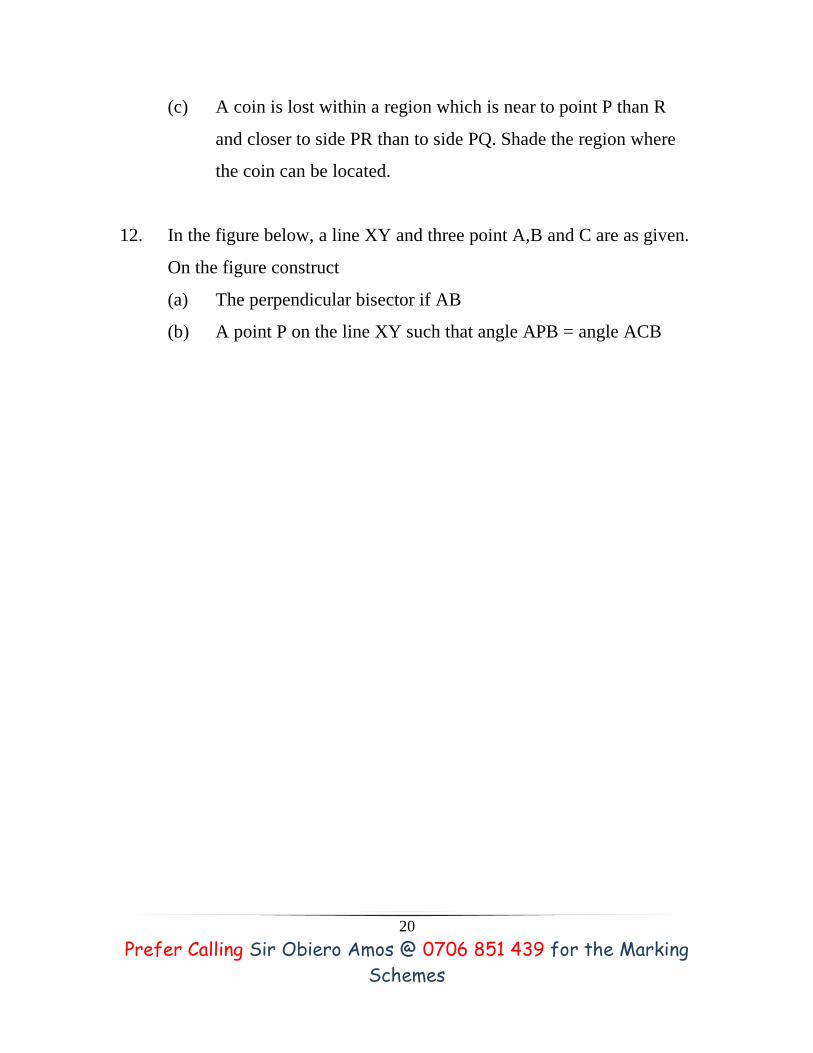
(c) A coin is lost within a region which is near to point P than R
and closer to side PR than to side PQ. Shade the region where
the coin can be located.
12. In the figure below, a line XY and three point A,B and C are as given.
On the figure construct
(a) The perpendicular bisector if AB
(b) A point P on the line XY such that angle APB = angle ACB
21
Prefer Calling Sir Obiero Amos @ 0706 851 439 for the Marking
Schemes
TOPIC 4:
TRIGONOMETRY
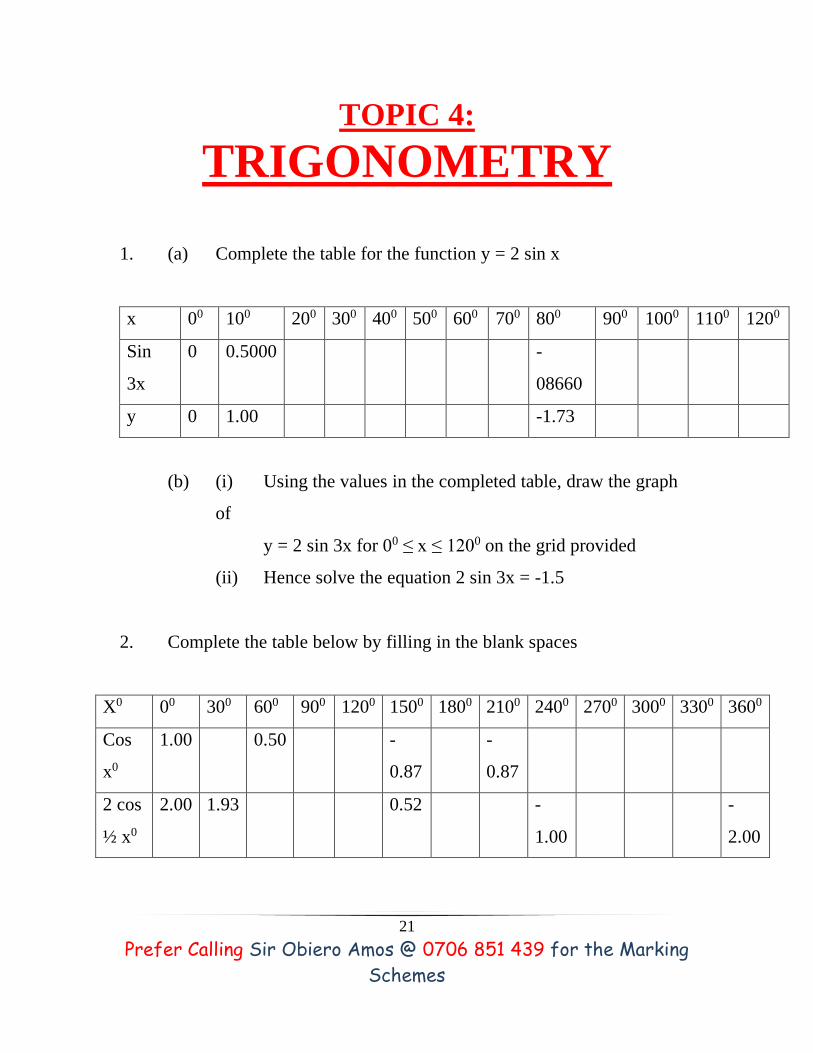
1. (a) Complete the table for the function y = 2 sin x
x 00 100 200 300 400 500 600 700 800 900 1000 1100 1200
Sin
3x
0 0.5000 -
08660
y 0 1.00 -1.73
(b) (i) Using the values in the completed table, draw the graph
of
y = 2 sin 3x for 00 ≤ x ≤ 1200 on the grid provided
(ii) Hence solve the equation 2 sin 3x = -1.5
2. Complete the table below by filling in the blank spaces
X0 00 300 600 900 1200 1500 1800 2100 2400 2700 3000 3300 3600
Cos
x0
1.00 0.50 -
0.87
-
0.87
2 cos
½ x0
2.00 1.93 0.52 -
1.00
-
2.00

22
Prefer Calling Sir Obiero Amos @ 0706 851 439 for the Marking
Schemes
Using the scale 1 cm to represent 300 on the horizontal axis and 4 cm
to represent 1 unit on the vertical axis draw, on the grid provided, the
graphs of y = cosx0 and y = 2 cos ½ x0 on the same axis.
(a) Find the period and the amplitude of y = 2 cos ½ x0
(b) Describe the transformation that maps the graph of y = cos x0
on the graph of y = 2 cos 1/2 x0
1. (a) Complete the table below for the value of y = 2 sin x + cos x.
x 00 300 450 600 900 1200 1350 1500 1800 2250 2700 3150 3600
2
sin
x
0 1.4 1.7 2 1.7 1.4 1 0 -2 -1.4 0
Cos
x
1 0.7 0.5 0 -0.5 -0.7 -0.9 -1 0 0.7 1
y 1 2.1 2.2 2 1.2 0.7 0.1 -1 -2 -0.7 1
(b) Using the grid provided draw the graph of y=2sin x + cos x for
00. Take 1cm represent 300 on the x- axis and 2 cm to represent
1 unit on the axis.
(c) Use the graph to find the range of x that satisfy the inequalities
2 sin x cos x > 0.5

23
Prefer Calling Sir Obiero Amos @ 0706 851 439 for the Marking
Schemes
4. (a) Complete the table below, giving your values correct to 2
decimal places.
b) On the grid provided, draw the graphs of y = tan x and y = sin (
2x + 300) for 00 ≤ x 700
Take scale: 2 cm for 100 on the x- axis
4 cm for unit on the y- axis
Use your graph to solve the equation tan x- sin ( 2x + 300 ) = 0.
5. (a) Complete the table below, giving your values correct to 2 decimal
places
X0 0 30 60 90 120 150 180
2 sin x0 0 1 2 1
1 – cos x0 0.5 1
x 0 10 20 30 40 50 60 70
Tan x 0
2 x + 300 30 50 70 90 110 130 150 170
Sin ( 2x + 300) 0.50 1
24
Prefer Calling Sir Obiero Amos @ 0706 851 439 for the Marking
Schemes
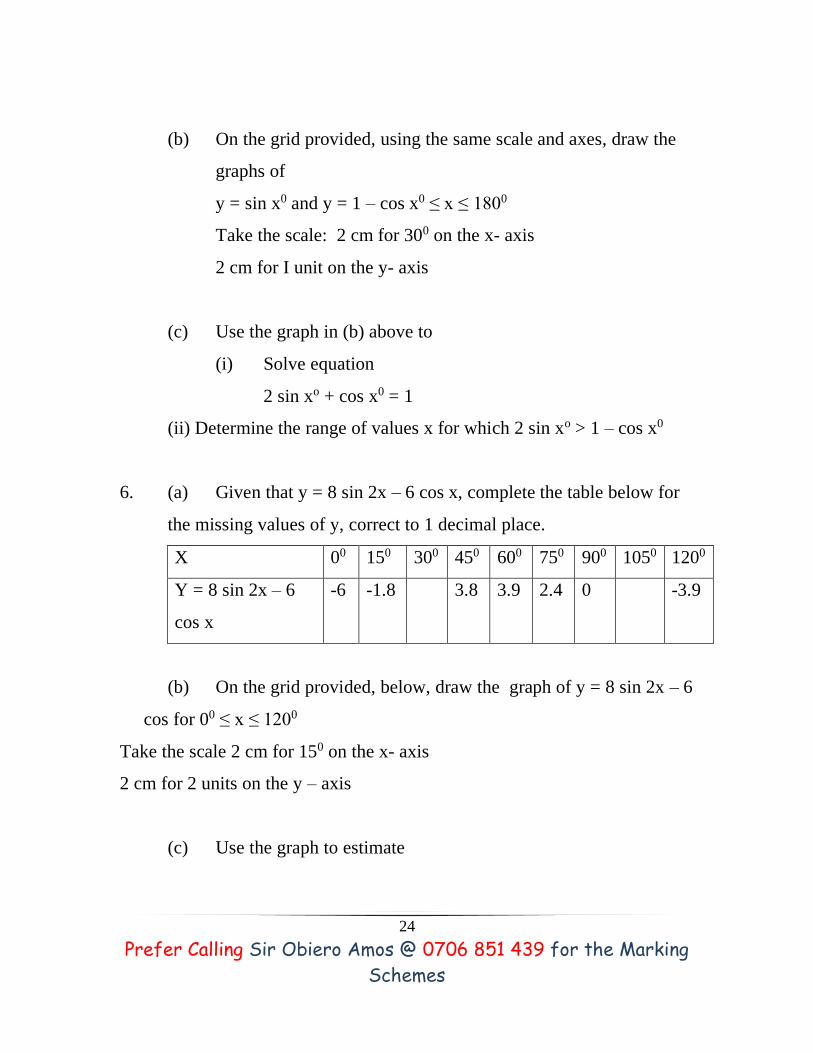
(b) On the grid provided, using the same scale and axes, draw the
graphs of
y = sin x0 and y = 1 – cos x0 ≤ x ≤ 1800
Take the scale: 2 cm for 300 on the x- axis
2 cm for I unit on the y- axis
(c) Use the graph in (b) above to
(i) Solve equation
2 sin xo + cos x0 = 1
(ii) Determine the range of values x for which 2 sin xo > 1 – cos x0
6. (a) Given that y = 8 sin 2x – 6 cos x, complete the table below for
the missing values of y, correct to 1 decimal place.
X 00 150 300 450 600 750 900 1050 1200
Y = 8 sin 2x – 6
cos x
-6 -1.8 3.8 3.9 2.4 0 -3.9
(b) On the grid provided, below, draw the graph of y = 8 sin 2x – 6
cos for 00 ≤ x ≤ 1200
Take the scale 2 cm for 150 on the x- axis
2 cm for 2 units on the y – axis
(c) Use the graph to estimate
25
Prefer Calling Sir Obiero Amos @ 0706 851 439 for the Marking
Schemes
(i) The maximum value of y
(ii) The value of x for which 4 sin 2x – 3 cos x =1
7. Solve the equation 4 sin (x + 300) = 2 for 0 ≤ x ≤ 3600
8.Find all the positive angles not greater than 1800 which satisfy the equation
Sin2 x – 2 tan x = 0
Cos x
9.Solve for values of x in the range 00 ≤ x ≤ 3600 if 3 cos2 x – 7 cos x = 6
10. Simplify 9 – y2 where y = 3 cos θ
y
11. Find all the values of Ø between 00 and 3600 satisfying the equation 5
sin Ө = -4
12. Given that sin (90 – x) = 0.8. Where x is an acute angle, find without
using mathematical tables the value of tan x0
13. Complete the table given below for the functions
y= -3 cos 2x0 and y = 2 sin (3x/20 + 30) for 0 ≤ x ≤ 1800

26
Prefer Calling Sir Obiero Amos @ 0706 851 439 for the Marking
Schemes
X0 00 200 400 600 800 1000 1200 1400 1600 1800
-3cos 2x0 -3.00 -2.30 -0.52 1.50 2.82 2.82 1.50 -0.52 -2.30 -3.00
2 sin (3 x0 +
300)
1.00 1.73 2.00 1.73 1.00 0.00 -1.00 -1.73 -2.00 -1.73
Using the graph paper draw the graphs of y = -3 cos 2x0 and y = 2 sin
(3x/20 + 300)
(a) On the same axis. Take 2 cm to represent 200 on the x- axis and
2 cm to represent one unit on the y – axis
(b) From your graphs. Find the roots of 3 cos 2 x0 + 2 sin (3x/20 +
300) = 0
14. Solve the values of x in the range 00 ≤ x ≤ 3600 if 3 cos2x – 7cos x = 6
15. Complete the table below by filling in the blank spaces
x0 00 300 600 90 10 1500 180 210 240 270 300 330 360
Cosx0 1.00 0.50 -
0.87
-
0.87
2cos
½ x0
2.00 1.93 0.5
27
Prefer Calling Sir Obiero Amos @ 0706 851 439 for the Marking
Schemes
Using the scale 1 cm to represent 300 on the horizontal axis and 4 cm
to represent 1 unit on the vertical axis draw on the grid provided, the
graphs of y – cos x0 and y = 2 cos ½ x0 on the same axis
(a) Find the period and the amplitude of y =2 cos ½ x0
Ans. Period = 7200. Amplitude = 2
(b) Describe the transformation that maps the graph of y = cos x0
on the graph of y = 2 cos ½ x0

28
Prefer Calling Sir Obiero Amos @ 0706 851 439 for the Marking
Schemes
TOPIC 5
THREE DIMENSIONAL
GEOMETRY
1. The diagram below shows a right pyramid VABCD with V as the
vertex. The base of the pyramid is rectangle ABCD, WITH ab = 4 cm
and BC= 3 cm. The height of the pyramid is 6 cm.
(a) Calculate the
(i) Length of the projection of VA on the base
(ii) Angle between the face VAB and the base
29
Prefer Calling Sir Obiero Amos @ 0706 851 439 for the Marking
Schemes
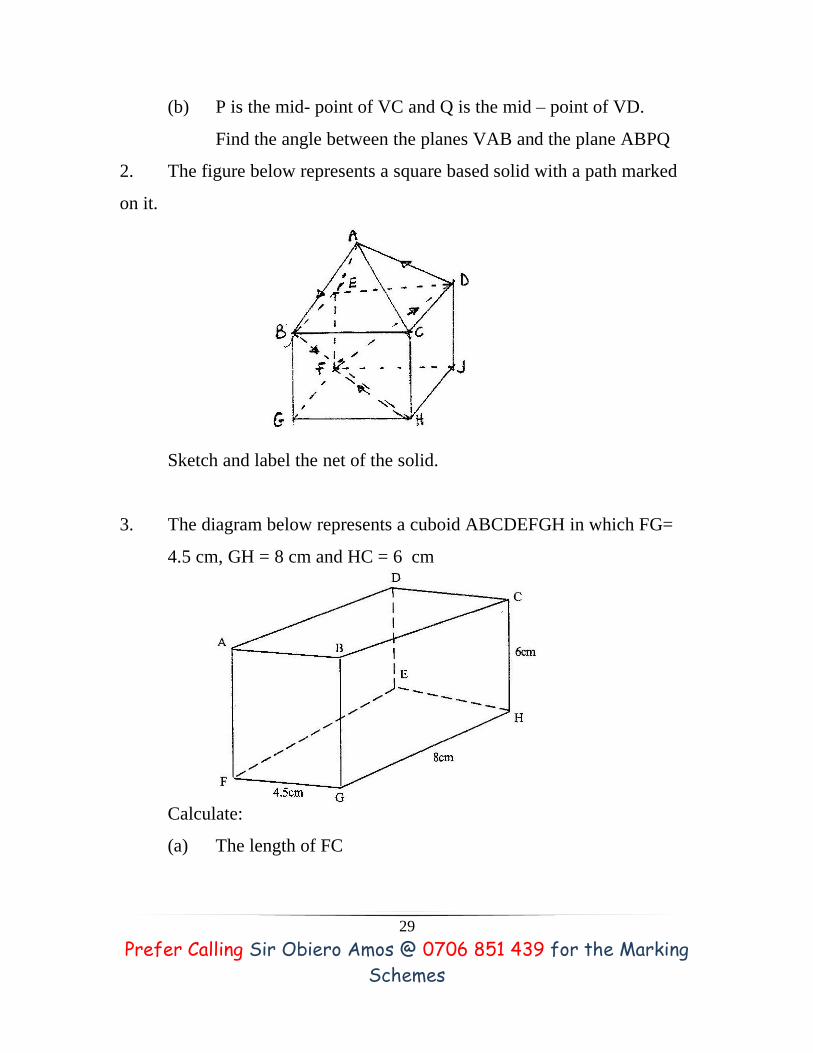
(b) P is the mid- point of VC and Q is the mid – point of VD.
Find the angle between the planes VAB and the plane ABPQ
2. The figure below represents a square based solid with a path marked
on it.
Sketch and label the net of the solid.
3. The diagram below represents a cuboid ABCDEFGH in which FG=
4.5 cm, GH = 8 cm and HC = 6 cm
Calculate:
(a) The length of FC
30
Prefer Calling Sir Obiero Amos @ 0706 851 439 for the Marking
Schemes
(b) (i) The size of the angle between the lines FC and FH
(ii) The size of the angle between the lines AB and FH
(c) The size of the angle between the planes ABHE and the plane
FGHE
4. The base of a right pyramid is a square ABCD of side 2a cm. The
slant edges VA, VB, VC and VD are each of length 3a cm.
(a) Sketch and label the pyramid
(b) Find the angle between a slanting edge and the base
5. The triangular prism shown below has the sides AB = DC = EF = 12
cm. the ends are equilateral triangles of sides 10cm. The point N is the
mid point of FC.
Find the length of:
(a) (i) BN
(ii) EN
(b) Find the angle between the line EB and the plane CDEF
31
Prefer Calling Sir Obiero Amos @ 0706 851 439 for the Marking
Schemes
TOPIC 6:
LATITUDES AND LONGITUDES 1. An aeroplane flies from point A (10 15’S, 370 E) to a point B directly
North of A. the arc AB subtends an angle of 450 at the center of the
earth. From B, aeroplanes flies due west two a point C on longitude
230 W.)
(Take the value of π 22/ 7 as and radius of the earth as 6370km)
(a) (i) Find the latitude of B
(ii) Find the distance traveled by the aeroplane between B
and C
(b) The aeroplane left at 1.00 a.m local time. When the aeroplane
was leaving B, hat was the local time at C?
2. The position of two towns X and Y are given to the nearest degree as
X (450 N, 100W) and Y (450 N, 700W)
Find
(a) The distance between the two towns in
(i) Kilometers (take the radius of the earth as 6371)
(ii) Nautical miles (take 1 nautical mile to be 1.85 km)
(b) The local time at X when the local time at Y is 2.00 pm.
3. A plane leaves an airport A (38.50N, 37.050W) and flies dues North to
a point B on latitude 520N.
(a) Find the distance covered by the plane

32
Prefer Calling Sir Obiero Amos @ 0706 851 439 for the Marking
Schemes
(b) The plane then flies due east to a point C, 2400 km from B.
Determine the position of C
Take the value π of as 22/7 and radius of the earth as 6370 km
4. A plane flying at 200 knots left an airport A (300S, 310E) and flew due
North to an airport B (300 N, 310E)
(a) Calculate the distance covered by the plane, in nautical miles
(b) After a 15 minutes stop over at B, the plane flew west to an
airport C (300 N, 130E) at the same speed.
Calculate the total time to complete the journey from airport C,
though airport B.
5.Two towns A and B lie on the same latitude in the northern hemisphere.
When its 8 am at A, the time at B is 11.00 am.
a) Given that the longitude of A is 150 E find the longitude of B.
b) A plane leaves A for B and takes 31/2 hours to arrive at B
traveling along a parallel of latitude at 850 km/h. Find:
(i) The radius of the circle of latitude on which towns A and B lie.
(ii) The latitude of the two towns (take radius of the earth to be 6371 km)
6. Two places A and B are on the same circle of latitude north of the
equator. The longitude of A is 1180W and the longitude of B is 1330
E. The shorter distance between A and B measured along the
circle of latitude is 5422 nautical miles.

33
Prefer Calling Sir Obiero Amos @ 0706 851 439 for the Marking
Schemes
Find, to the nearest degree, the latitude on which A and B lie
7. (a) A plane flies by the short estimate route from P (100S, 600 W)
to Q (700 N,
1200 E) Find the distance flown in km and the time taken if the
aver age speed is 800 km/h.
(b) Calculate the distance in km between two towns on latitude
500S with long longitudes and 200 W. (take the radius of the
earth to be 6370 km)
8. Calculate the distance between M (300N, 360E) and N (300 N, 1440 W)
in nautical miles.
(i) Over the North Pole
(ii) Along the parallel of latitude 300 N
9. (a) A ship sailed due south along a meridian from 120 N to
10030’S. Taking
the earth to be a sphere with a circumference of 4 x 10⁴ km,
calculate in km the distance traveled by the ship.
(b) If a ship sails due west from San Francisco (370 47’N, 1220 26’W) for
distance of 1320 km. Calculate the longitude of its new position (take the
radius of the earth to be 6370 km and π = 22/7).
34
Prefer Calling Sir Obiero Amos @ 0706 851 439 for the Marking
Schemes
TOPIC 7
LINEAR PROGRAMMING
1. A school has to take 384 people for a tour. There are two types of
buses available, type X and type Y. Type X can carry 64 passengers
and type Y can carry 48 passengers. They have to use at least 7 buses.
(a) Form all the linear inequalities which will represent the above
information.
(b) On the grid [provide, draw the inequalities and shade the
unwanted region.
(c) The charges for hiring the buses are
Type X: Kshs 25,000
Type Y Kshs 20,000
Use your graph to determine the number of buses of each type
that should be hired to minimize the cost.
2. An institute offers two types of courses technical and business
courses. The institute has a capacity of 500 students. There must be
more business students than technical students but at least 200
students must take technical courses. Let x represent the number of
technical students and y the number of business students.
35
Prefer Calling Sir Obiero Amos @ 0706 851 439 for the Marking
Schemes
(a) Write down three inequalities that describe the given conditions
(b) On the grid provided, draw the three inequalities
(c) If the institute makes a profit of Kshs 2, 500 to train one
technical students and Kshs 1,000 to train one business student,
determine
(i) The number of students that must be enrolled in each
course to maximize the profit
(ii) The maximum profit.
3. A draper is required to supply two types of shirts A and type B.
The total number of shirts must not be more than 400. He has to
supply more type A than of type B however the number of types A
shirts must be more than 300 and the number of type B shirts not be
less than 80.
Let x be the number of type A shirts and y be the number of types B
shirts.
(a) Write down in terms of x and y all the linear inequalities
representing the information above.
(b) On the grid provided, draw the inequalities and shade the
unwanted regions
(c) The profits were as follows
Type A: Kshs 600 per shirt
Type B: Kshs 400 per shirt

36
Prefer Calling Sir Obiero Amos @ 0706 851 439 for the Marking
Schemes
(i) Use the graph to determine the number of shirts of each type
that should be made to maximize the profit.
(ii) Calculate the maximum possible profit.
4. A diet expert makes up a food production for sale by mixing two
ingredients N and S. One kilogram of N contains 25 units of protein
and 30 units of vitamins. One kilogram of S contains 50 units of
protein and 45 units of vitamins. The foiod is sold in small bags each
containing at least 175 units of protein and at least 180 units of
vitamins. The mass of the food product in each bag must not exceed
6kg.
If one bag of the mixture contains x kg of N and y kg of S
(a) Write down all the inequalities, in terms of x and representing the
information above ( 2 marks)
(b) On the grid provided draw the inequalities by shading the
unwanted regions ( 2 marks)
(c) If one kilogram of N costs Kshs 20 and one kilogram of S costs
Kshs 50, use the graph to determine the lowest cost of one bag of
the mixture.
5. Mwanjoki flying company operates a flying service. It has two types
of aeroplanes. The smaller one uses 180 litres of fuel per hour while
the bigger one uses 300 litres per hour.

37
Prefer Calling Sir Obiero Amos @ 0706 851 439 for the Marking
Schemes
The fuel available per week is 18,000 litres. The company is allowed
80 flying hours per week.
(a) Write down all the inequalities representing the above information
(b) On the grid provided on page 21, draw all the inequalities in (a)
above by shading the unwanted regions
(c) The profits on the smaller aeroplane is Kshs 4000 per hour while
that on the
bigger one is Kshs. 6000 per hour. Use your graph to determine the
maximum profit that the company made per week.
6. A company is considering installing two types of machines. A and B.
The information about each type of machine is given in the table
below.
Machine Number of
operators
Floor
space
Daily
profit
A 2 5m2 Kshs
1,500
B 5 8m2 Kshs
2,500
The company decided to install x machines of types A and y machines of
type B

38
Prefer Calling Sir Obiero Amos @ 0706 851 439 for the Marking
Schemes
(a) Write down the inequalities that express the following
conditions
i. The number of operators available is 40
ii. The floor space available is 80m2
iii. The company is to install not less than 3 type of A machine
iv. The number of type B machines must be more than one third
the number of type A machines
(b) On the grid provided, draw the inequalities in part (a) above and
shade the unwanted region.
(c) Draw a search line and use it to determine the number of
machines of each type that should be installed to maximize the daily profit.

39
Prefer Calling Sir Obiero Amos @ 0706 851 439 for the Marking
Schemes
TOPIC 8:
CALCULUS
1. The shaded region below represents a forest. The region has been
drawn to scale where 1 cm represents 5 km. Use the mid – ordinate
rule with six strips to estimate the area of forest in hectares.(4 marks)
2. Find the area bounded by the curve y=2x3 – 5, the x-axis and the lines
x=2 and x=4.

40
Prefer Calling Sir Obiero Amos @ 0706 851 439 for the Marking
Schemes
3. Complete the table below for the function y=3x2 – 8x + 10 (1 mk)
x 0 2 4 6 8 10
y 10 6 70 230
Using the values in the table and the trapezoidal rule, estimate the area
bounded by the curve y= 3x2 – 8x + 10 and the lines y=0, x=0 and
x=10.
4. Use the trapezoidal rule with intervals of 1 cm to estimate the area of
the shaded region below

41
Prefer Calling Sir Obiero Amos @ 0706 851 439 for the Marking
Schemes
5. (a) Find the value of x at which the curve y= x- 2x2 – 3 crosses the
x- axis
(b) Find (x2 – 2x – 3) dx
(c) Find the area bounded by the curve y = x2 – 2x – 3, the axis and
the lines x= 2 and x = 4.
42
Prefer Calling Sir Obiero Amos @ 0706 851 439 for the Marking
Schemes
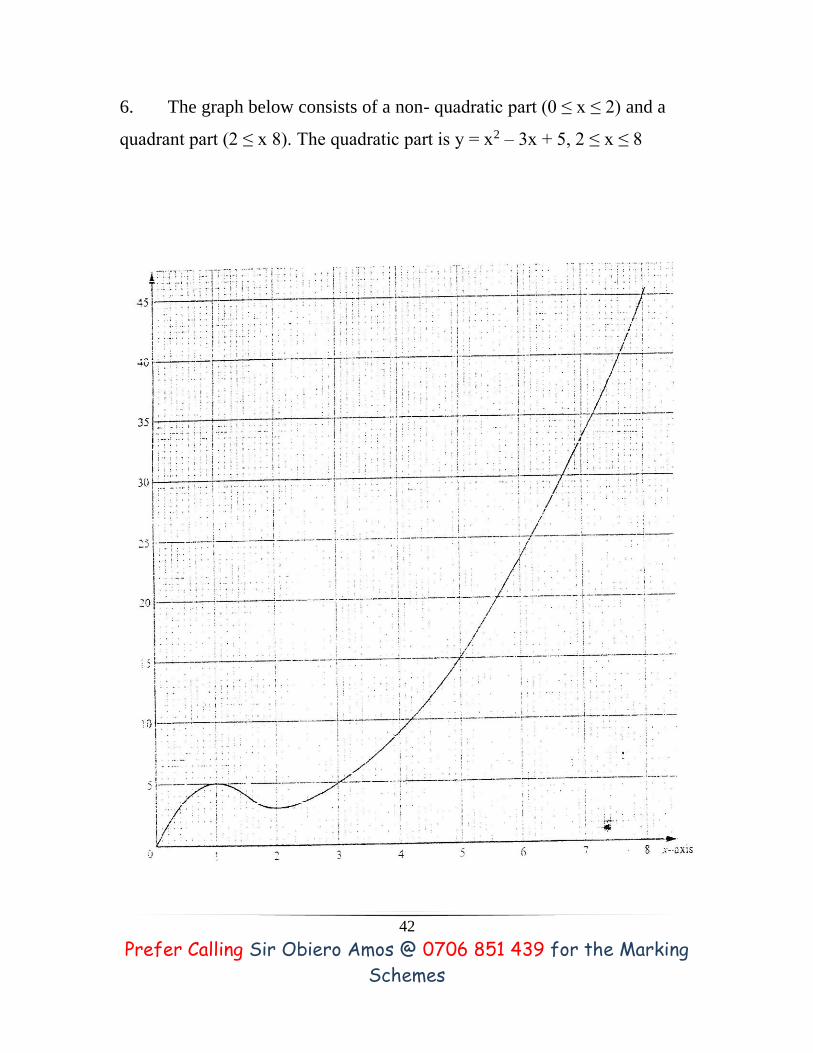
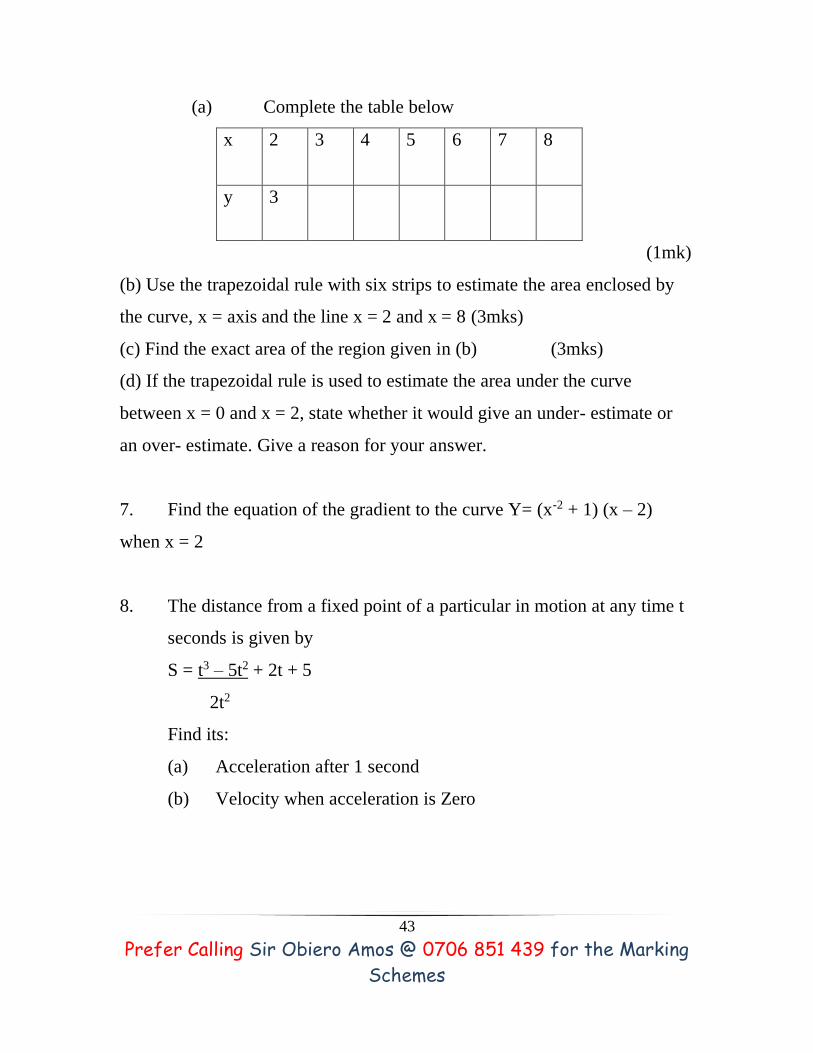
6. The graph below consists of a non- quadratic part (0 ≤ x ≤ 2) and a
quadrant part (2 ≤ x 8). The quadratic part is y = x2 – 3x + 5, 2 ≤ x ≤ 8
43
Prefer Calling Sir Obiero Amos @ 0706 851 439 for the Marking
Schemes
(a) Complete the table below
x 2 3 4 5 6 7 8
y 3
(1mk)
(b) Use the trapezoidal rule with six strips to estimate the area enclosed by
the curve, x = axis and the line x = 2 and x = 8 (3mks)
(c) Find the exact area of the region given in (b) (3mks)
(d) If the trapezoidal rule is used to estimate the area under the curve
between x = 0 and x = 2, state whether it would give an under- estimate or
an over- estimate. Give a reason for your answer.
7. Find the equation of the gradient to the curve Y= (x-2 + 1) (x – 2)
when x = 2
8. The distance from a fixed point of a particular in motion at any time t
seconds is given by
S = t3 – 5t2 + 2t + 5
2t2
Find its:
(a) Acceleration after 1 second
(b) Velocity when acceleration is Zero

44
Prefer Calling Sir Obiero Amos @ 0706 851 439 for the Marking
Schemes
9. The curve of the equation y = 2x + 3x2, has x = -2/3 and x = 0 and x
intercepts. The area bounded by the axis x = -2/3 and x = 2 is shown by the
sketch below.
Find:
(a) (2x + 3 x2) dx
(b) The area bounded by the curve x – axis, x = - 2/3 and x =2
10. A particle is projected from the origin. Its speed was recorded as
shown in the table below
Time (sec) 0 5 10 15 20 25 39 35
Speed
(m/s)
0 2.1 5.3 5.1 6.8 6.7 4.7 2.6
Use the trapezoidal rule to estimate the distance covered by the
particle within the 35 seconds.

45
Prefer Calling Sir Obiero Amos @ 0706 851 439 for the Marking
Schemes
11. (a) The gradient function of a curve is given by dy = 2x2 – 5
dx
Find the equation of the curve, given that y = 3, when x = 2
(b) The velocity, vm/s of a moving particle after seconds is given:
v = 2t3 + t2 – 1. Find the distance covered by the particle in the
interval 1 ≤ t ≤ 3
12. Given the curve y = 2x3 + 1/2x2 – 4x + 1. Find the:
i) Gradient of curve at {1, - 1/2}
ii) Equation of the tangent to the curve at {1, - 1/2}
13. The diagram below shows a straight line intersecting the curve y = (x-
1)2 + 4
At the points P and Q. The line also cuts x-axis at (7, 0) and y axis at (0, 7)
a) Find the equation of the straight line in the form y = mx +c.
b) Find the coordinates of p and Q.
c) Calculate the area of the shaded region.

46
Prefer Calling Sir Obiero Amos @ 0706 851 439 for the Marking
Schemes
14. The acceleration, a ms-2, of a particle is given by a =25 – 9t2, where t
in seconds after the particle passes fixed point O.
If the particle passes O, with velocity of 4 ms-1, find
(a) An expression of velocity V, in terms of t
(b) The velocity of the particle when t = 2 seconds
15. A curve is represented by the function y = 1/3 x3 + x2 – 3x + 2
(a) Find: dy
dx
(b) Determine the values of y at the turning points of the curve
y = 1/3x3 + x2 – 3x + 2
(c) In the space provided below, sketch the curve of y = 1/3 x3 + x2 – 3x + 2
16. A circle centre O, ha the equation x2 + y2 = 4. The area of the circle in
the first quadrant is divided into 5 vertical strips of width 0.4 cm
(a) Use the equation of the circle to complete the table below for
values of y correct to 2 decimal places
X 0 0.4 0.8 1.2 1.6 2.0
Y 2.00 1.60 0
(b) Use the trapezium rule to estimate the area of the circle
47
Prefer Calling Sir Obiero Amos @ 0706 851 439 for the Marking
Schemes
17. A particle moves along straight line such that its displacement S
metres from a given point is S = t3 – 5t2 + 4 where t is time in seconds
Find
(a) The displacement of particle at t = 5
(b) The velocity of the particle when t = 5
(c) The values of t when the particle is momentarily at rest
(d) The acceleration of the particle when t = 2
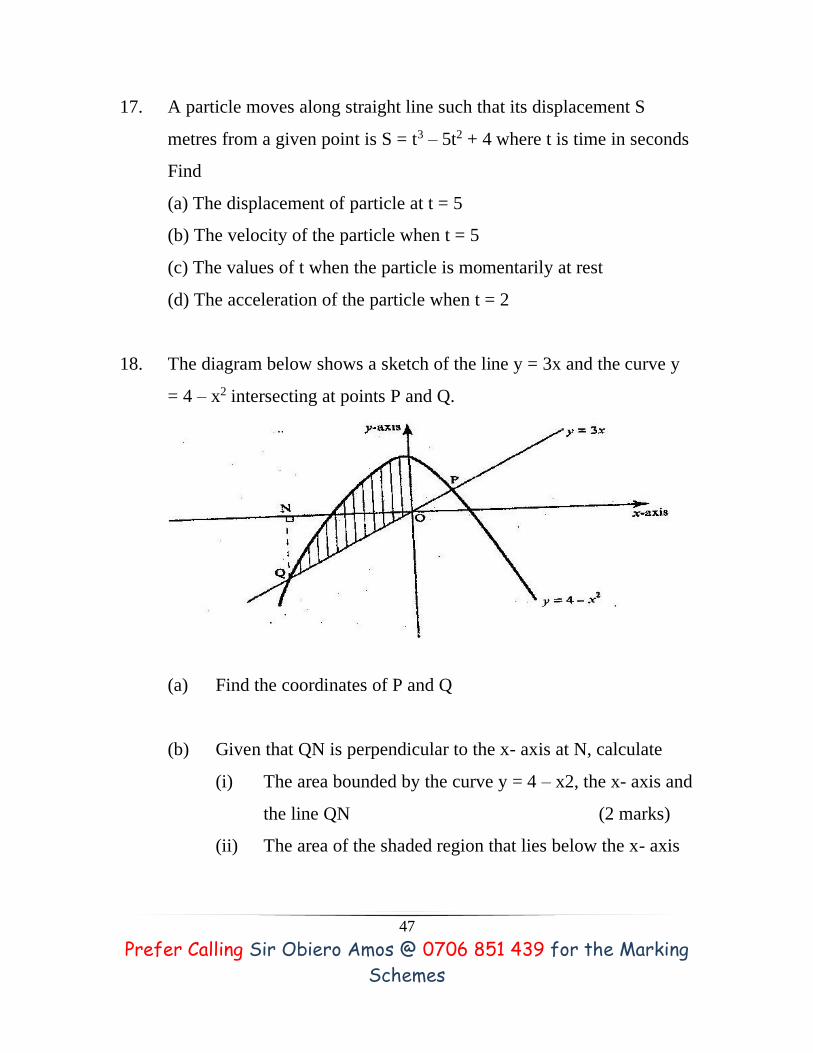
18. The diagram below shows a sketch of the line y = 3x and the curve y
= 4 – x2 intersecting at points P and Q.
(a) Find the coordinates of P and Q
(b) Given that QN is perpendicular to the x- axis at N, calculate
(i) The area bounded by the curve y = 4 – x2, the x- axis and
the line QN (2 marks)
(ii) The area of the shaded region that lies below the x- axis

48
Prefer Calling Sir Obiero Amos @ 0706 851 439 for the Marking
Schemes
(iii) The area of the region enclosed by the curve y = 4-x2, the line
y – 3x and the y-axis
19. The gradient of the tangent to the curve y = ax3 + bx at the point (1, 1) is -5
Calculate the values of a and b.
20. The diagram on the grid below represents as extract of a survey map
showing two adjacent plots belonging to Kazungu and Ndoe.
The two dispute the common boundary with each claiming boundary along
different smooth curves coordinates (x, y) and (x, y2) in the table below,
represents points on the boundaries as claimed by Kazungu Ndoe
respectively.
x 0 1 2 3 4 5 6 7 8 9
y1 0 4 5.7 6.9 8 9 9.8 10.6 11.3 12
y2 0 0.2 0.6 1.3 2.4 3.7 5.3 7.3 9.5 12
(a) On the grid provided above draw and label the boundaries as
claimed by Kazungu and Ndoe.
(b) (i) Use the trapezium rule with 9 strips to estimate the area
of the section of the land in dispute
(ii) Express the area found in b (i) above, in hectares, given
that 1 unit on each axis represents 20 metres
21. The gradient function of a curve is given by the expression 2x + 1. If
the curve passes through the point (-4, 6);

49
Prefer Calling Sir Obiero Amos @ 0706 851 439 for the Marking
Schemes
(a) Find:
(i) The equation of the curve
(ii) The vales of x, at which the curve cuts the x- axis
(b) Determine the area enclosed by the curve and the x- axis
22. A particle moves in a straight line through a point P. Its velocity v m/s
is given by v= 2 -t, where t is time in seconds, after passing P. The
distance s of the particle from P when t = 2 is 5 metres. Find the
expression for s in terms of t.
23. Find the area bonded by the curve y=2x – 5 the x-axis and the lines
x=2 and x = 4.
23. Complete the table below for the function
Y = 3x2 – 8 x + 10
X 0 2 4 6 8 10
Y 10 6 - 70 - 230
Using the values in the table and the trapezoidal rule, estimate the area
bounded by the curve y = 3x2 – 8x + 10 and the lines y – 0, x = 0 and
x = 10
24. (a) Find the values of x which the curve y = x2 – 2x – 3 crosses the
axis
(b) Find (x2 – 2 x – 3) dx

50
Prefer Calling Sir Obiero Amos @ 0706 851 439 for the Marking
Schemes
(c) Find the area bounded by the curve Y = x2 – 2x – 3. The x –
axis and the lines x = 2 and x = 4
25. Find the equation of the tangent to the curve y = (x + 1) (x- 2) when x = 2
26. The distance from a fixed point of a particle in motion at any time t
seconds is given by s = t – 5/2t2 + 2t + s metres
Find its
(a) Acceleration after t seconds
(b) Velocity when acceleration is zero
27. The curve of the equation y = 2x + 3x2, has x = - 2/3 and x = 0, as x
intercepts. The area bounded by the curve, x – axis, x = -2/3 and x = 2
is shown by the sketch below.
(a) Find (2x + 3x2) dx
(b) The area bounded by the curve, x axis x = -2/3 and x = 2
28. A curve is given by the equation y = 5x3 – 7x2 + 3x + 2
Find the
(a) Gradient of the curve at x = 1
(b) Equation of the tangent to the curve at the point (1, 3)

51
Prefer Calling Sir Obiero Amos @ 0706 851 439 for the Marking
Schemes
29. The displacement x metres of a particle after t seconds is given by x =
t2 – 2t + 6, t> 0
(a) Calculate the velocity of the particle in m/s when t = 2s
(b) When the velocity of the particle is zero,
Calculate its
(i) Displacement
(ii) Acceleration
30. The displacement s metres of a particle moving along a straight line
after t seconds is given by s = 3t + 3/2t2 – 2t3
(a) Find its initial acceleration
(b) Calculate
(i) The time when the particle was momentarily at rest.
(ii) Its displacement by the time it comes to rest momentarily
when
t = 1 second, s = 1 ½ metres when t = ½ seconds
(c) Calculate the maximum speed attained

52
Prefer Calling Sir Obiero Amos @ 0706 851 439 for the Marking
Schemes
Related Documents