Form and Orientation Plots Page 9 of 9 Form and Orientation Plots in Calypso General Notes: • After generating a Characteristic, a plot is available when a “Graphic” button appears in the characteristic window. • The graphic will be displayed automatically as part of the Custom Output after a measurement run only if the checkbox next to the “Graphic” button is selected. • Especially with scanning machines, be sure to apply filters and outlier elimination to the selected features. • The default filter settings for round features are usually appropriate. 50 UPR is “normal” for most round features. • The filter settings for planes usually need to be optimized to your part’s geometry. Set the filter wavelength just high enough to eliminate “noise” on your plots. Press this button to view a graphic Check this if you want to print a graphic each run When the Feature Select Button is pressed, the Selection window opens. In the Selection Window, make sure the Filter and Outlier Elimination options are checked and set to appropriate levels. Press the Parameters Button to change the filter settings. Choose the smallest filter setting that is appropriate. Usually the 2.5, 8, or 25 setting will work well, depending on your plane size.

Welcome message from author
This document is posted to help you gain knowledge. Please leave a comment to let me know what you think about it! Share it to your friends and learn new things together.
Transcript

Form and Orientation Plots Page 9 of 9
Form and Orientation Plots in Calypso
General Notes:
• After generating a Characteristic, a plot is available when a “Graphic” button appears in the characteristic window.
• The graphic will be displayed automatically as part of the Custom Output after a measurement run only if the checkbox next to the “Graphic” button is selected.
• Especially with scanning machines, be sure to apply filters and outlier elimination to the selected features.
• The default filter settings for round features are usually appropriate. 50 UPR is “normal” for most round features.
• The filter settings for planes usually need to be optimized to your part’s geometry. Set the filter wavelength just high enough to eliminate “noise” on your plots.
Press this button to view a graphic
Check this if you want to print a graphic each run
When the Feature Select Button is pressed, the Selection window opens.
In the Selection Window, make sure the Filter and Outlier Elimination options are checked and set to appropriate levels.
Press the Parameters Button to change the filter settings.
Choose the smallest filter setting that is appropriate. Usually the 2.5, 8, or 25 setting will work well, depending on your plane size.

Form and Orientation Plots Page 9 of 9
Roundness Plots: • When the “Graphic” Button is pressed in a Roundness Characteristic window, before
a graphic is displayed, you must select the characteristic to plot from the roundness pick list.
• You may select several different roundness plots to show on one graphic.
Form and Orientation Plots Page 9 of 9
Modifying the look of Roundness Plots: • Every graphic plot can be modified by choosing the “Edit” drop down list above the graphic in the plot window. The only option under “Edit” will bring up the Form Plot Attributes window, where many graphic parameters can be changed.
• The Form Plot Attributes window can also be accessed by right clicking anywhere on a plot and choosing “Modify Chart Settings”
• To view “Deviation Lines” on a Roundness Plot, choose the “Edit” drop down, then in the Form Plot Attributes Window, select the “VIEW” tab, then click “Deviation Lines”. These lines are a good way to view data density and are helpful in spotting areas where the Outlier Elimination removed data points.
• To change error magnification on a plot, choose the “Edit” drop down, then in the Form Plot Attributes Window, select the “Magnification” tab and type in the desired value.
Roundness plot with Deviation Lines Roundness plot with High Magnification

Form and Orientation Plots Page 9 of 9
Fourier analysis: • Fourier Analysis is a method used to determine the frequency components of form
error in a round feature. The form is analyzed for the presence of lobing and other form errors regularly occurring at different frequencies around the feature. This is helpful in troubleshooting the manufacturing process of a feature as well as testing for the presence of a form error frequency that could cause vibration in a bearing or shaft.
• To view a Fourier Analysis Chart, create a roundness characteristic and press the “Graphic” Button as usual. Then, change the type of chart from “Multiroundness” to “Fourier analysis” in the plot type drop down.
Roundness Plot of Circle to be analyzed using Fourier. Note the obvious 3-lobe
pattern of form error.
The type of plot was changed from “Multiroundness” to “Fourier analysis”
Fourier Analysis Plot
Note that the frequency of 3 shows the highest amplitude. This corresponds to the 3-lobe pattern seen in the regular roundness plot.
The amplitude for each frequency value is shown in a chart on the side of the plot. This shows the form error of each frequency component of the overall form
error for the feature.

Form and Orientation Plots Page 9 of 9
Flatness Plots: • When the “Graphic” Button is pressed in a Flatness Characteristic window, a 3-D
flatness view is displayed.
• The look of a Flatness Plot can easily be enhanced. With the flatness plot displayed, right click on the plot and choose “Modify Chart Settings”. Inside the Form Plot Attributes Window, you can change the Magnification and Point Style of the plot. To achieve the color-scale look like the plot below, in the Point Style tab, check “Actual Points”, check “Chromatic”, and increase the point magnification to “10”.
Note that the coordinates of the corners of the plane are displayed with the coordinates of the overall high and low points on the plane.
The overall high and low points on the plane are circled.
Form and Orientation Plots Page 9 of 9
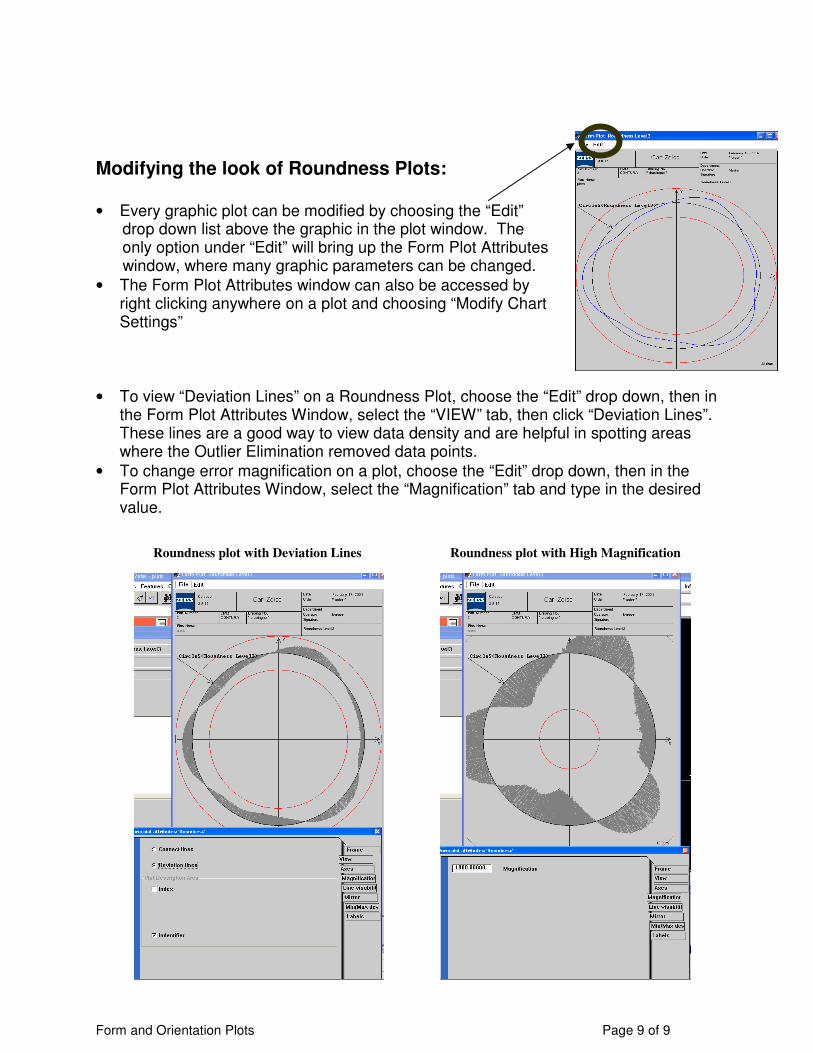
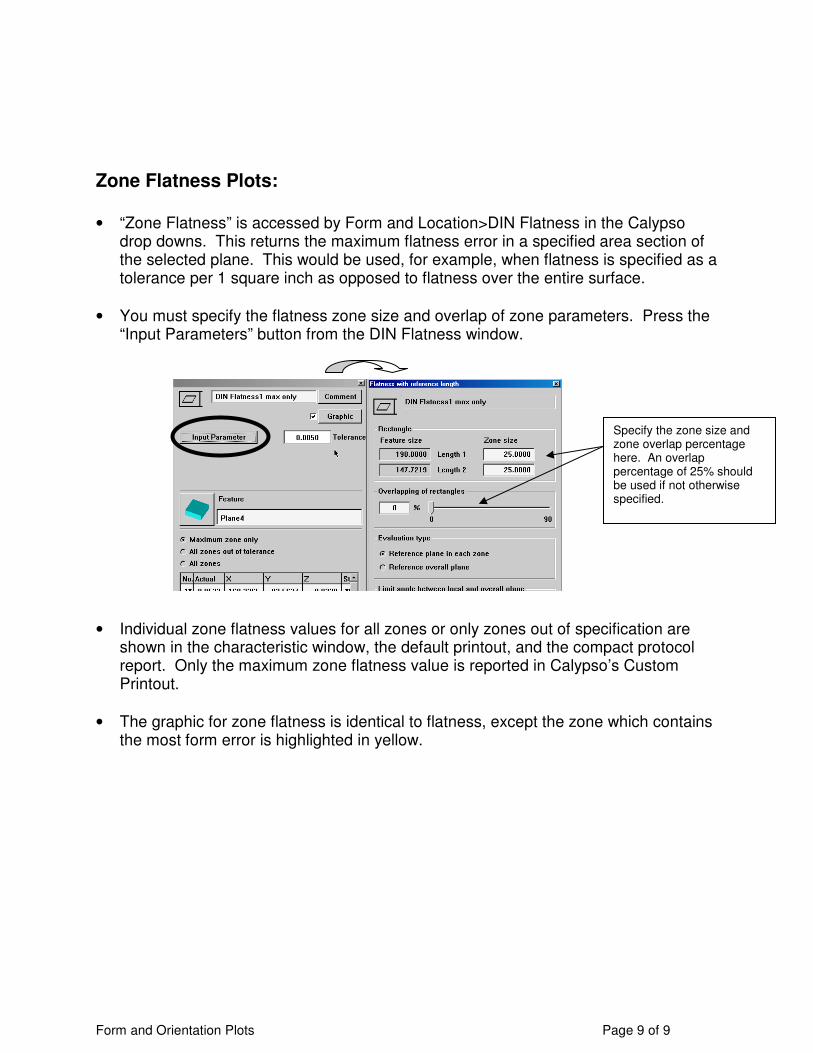
Zone Flatness Plots: • “Zone Flatness” is accessed by Form and Location>DIN Flatness in the Calypso
drop downs. This returns the maximum flatness error in a specified area section of the selected plane. This would be used, for example, when flatness is specified as a tolerance per 1 square inch as opposed to flatness over the entire surface.
• You must specify the flatness zone size and overlap of zone parameters. Press the “Input Parameters” button from the DIN Flatness window.
• Individual zone flatness values for all zones or only zones out of specification are shown in the characteristic window, the default printout, and the compact protocol report. Only the maximum zone flatness value is reported in Calypso’s Custom Printout.
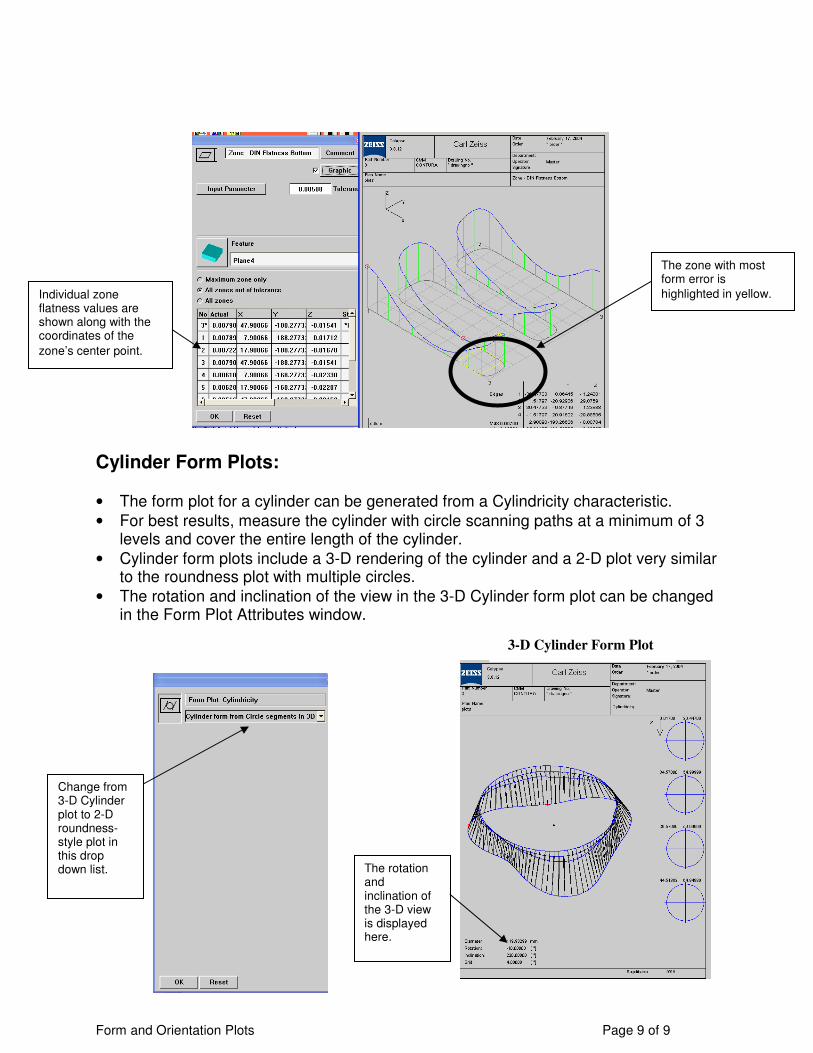
• The graphic for zone flatness is identical to flatness, except the zone which contains the most form error is highlighted in yellow.
Specify the zone size and zone overlap percentage here. An overlap percentage of 25% should be used if not otherwise specified.
Form and Orientation Plots Page 9 of 9
Cylinder Form Plots:
• The form plot for a cylinder can be generated from a Cylindricity characteristic.
• For best results, measure the cylinder with circle scanning paths at a minimum of 3 levels and cover the entire length of the cylinder.
• Cylinder form plots include a 3-D rendering of the cylinder and a 2-D plot very similar to the roundness plot with multiple circles.
• The rotation and inclination of the view in the 3-D Cylinder form plot can be changed in the Form Plot Attributes window.
The zone with most form error is
highlighted in yellow. Individual zone flatness values are shown along with the coordinates of the
zone’s center point.
Change from 3-D Cylinder plot to 2-D roundness-style plot in this drop down list.
3-D Cylinder Form Plot
The rotation and inclination of the 3-D view is displayed here.

Form and Orientation Plots Page 9 of 9
Straightness Plots:
Runout Graphics: • The graphic for Radial Runout is similar
to a roundness plot, but the circle’s form being evaluated is shown relative to the datum feature.
• The graphic for Axial Runout is similar to a flatness plot, but the plane’s form being evaluated is shown relative to the datum feature.
• These plots will help determine what contributes most to the runout result – form error of the feature being evaluated or position and orientation error between the datum and the feature.
• The form plot for a 2-D line can be generated from a Straightness characteristic.
• The horizontal axis notation can be changed from coordinate system units to point numbers in the Form Plot Attributes window.
• Also in the Form Plot Attributes window, like a roundness plot, “deviation lines” can be shown as well as the continuous form shape (“connect lines”). A plot with “connect lines” selected is shown to the right.
Straightness Plot
Roundness Plot – Top OD Radial Runout Graphic – Top OD to Cylinder
Radial Runout Result is
0.038mm.
It is clear from the graphic that the main component of runout error is eccentricity in the X direction.
Radial Runout result is 0.028mm.
Form and Orientation Plots Page 9 of 9
Or
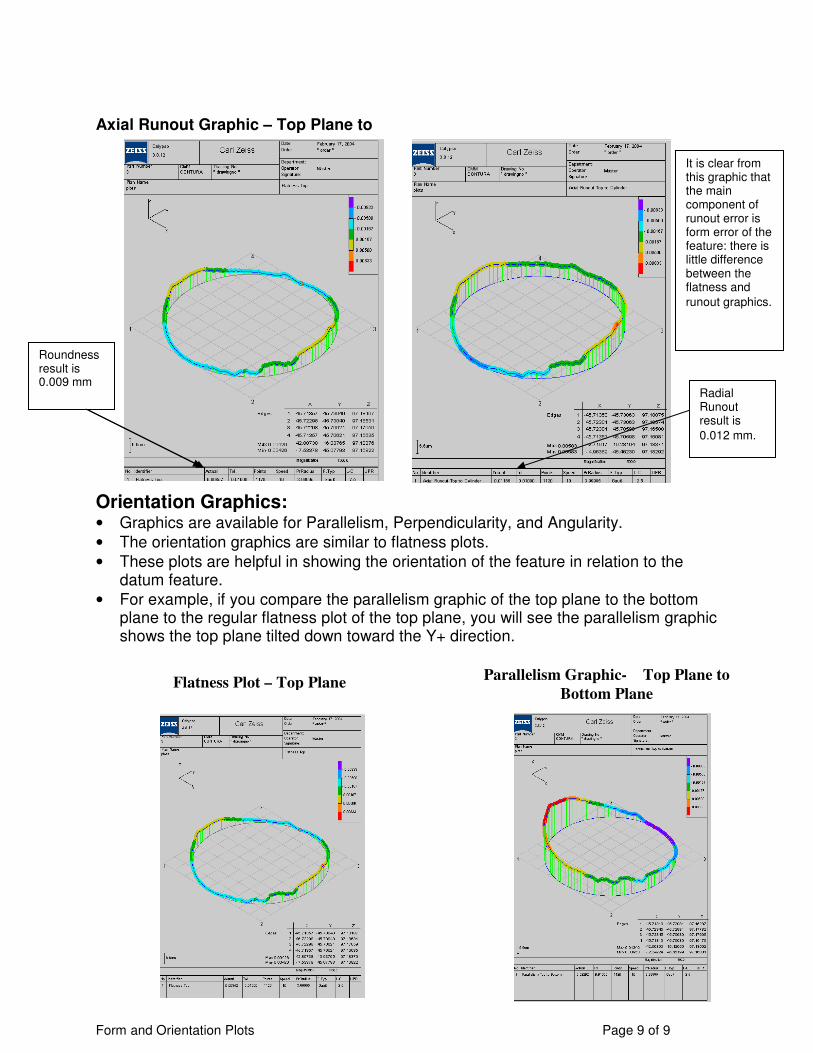
Orientation Graphics: • Graphics are available for Parallelism, Perpendicularity, and Angularity.
• The orientation graphics are similar to flatness plots.
• These plots are helpful in showing the orientation of the feature in relation to the datum feature.
• For example, if you compare the parallelism graphic of the top plane to the bottom plane to the regular flatness plot of the top plane, you will see the parallelism graphic shows the top plane tilted down toward the Y+ direction.
Axial Runout Graphic – Top Plane to Cylinder
Roundness result is 0.009 mm
Radial Runout result is
0.012 mm.
It is clear from this graphic that the main component of runout error is form error of the feature: there is little difference between the flatness and
runout graphics.
Flatness Plot – Top Plane Parallelism Graphic- Top Plane to
Bottom Plane
Related Documents