UNITED STATES SECURITIES AND EXCHANGE COMMISSION Washington, D.C. 20549 FORM 10-K (Mark one) ☒ ANNUAL REPORT PURSUANT TO SECTION 13 OR 15(d) OF THE SECURITIES EXCHANGE ACT OF 1934 For the fiscal year ended January 30, 2021 or ☐ TRANSITION REPORT PURSUANT TO SECTION 13 or 15(d) OF THE SECURITIES EXCHANGE ACT OF 1934 For the transition period from ________ to ________ Commission file number 0-14678 Ross Stores, Inc. (Exact name of registrant as specified in its charter) Delaware 94-1390387 (State or other jurisdiction of incorporation or organization) (I.R.S. Employer Identification No.) 5130 Hacienda Drive, Dublin, California 94568-7579 (Address of principal executive offices) (Zip Code) Registrant’s telephone number, including area code (925) 965-4400 Securities registered pursuant to Section 12(b) of the Act: Title of each class Trading symbol Name of each exchange on which registered Common stock, par value $.01 ROST NASDAQ Global Select Market Securities registered pursuant to Section 12(g) of the Act: Title of each class None Indicate by check mark if the registrant is a well-known seasoned issuer, as defined in Rule 405 of the Securities Act. Yes ☒ No o Indicate by check mark if the registrant is not required to file reports pursuant to Section 13 or Section 15(d) of the Act. Yes ☐ No ☒ Indicate by check mark whether the registrant (1) has filed all reports required to be filed by Section 13 or 15(d) of the Securities Exchange Act of 1934 during the preceding 12 months (or for such shorter period that the registrant was required to file such reports), and (2) has been subject to such filing requirements for the past 90 days. Yes ☒ No o Indicate by check mark whether the registrant has submitted electronically every Interactive Data File required to be submitted pursuant to Rule 405 of Regulation S-T (§232.405 of this chapter) during the preceding 12 months (or for such shorter period that the registrant was required to submit such files). Yes ☒ No o Indicate by check mark whether the registrant is a large accelerated filer, an accelerated filer, a non-accelerated filer, a smaller reporting company, or emerging growth company. See definitions of “large accelerated filer,” “accelerated filer,” “smaller reporting company,” and “emerging growth company” in Rule 12b-2 of the Exchange Act. Large accelerated filer ☒ Accelerated filer o Non-accelerated filer o (Do not check if a smaller reporting company) Smaller reporting company ☐ Emerging growth company ☐ If an emerging growth company, indicate by check mark if the registrant has elected not to use the extended transition period for complying with any new or revised financial accounting standards provided pursuant to Section 13(a) of the Exchange Act. o Indicate by check mark whether the registrant has filed a report on and attestation to its management’s assessment of the effectiveness of its internal control over financial reporting under Section 404(b) of the Sarbanes-Oxley Act (15 U.S.C. 7262(b)) by the registered public accounting firm that prepared or issued its audit report. ☒ Indicate by check mark whether the registrant is a shell company (as defined in Rule 12b-2 of the Act). Yes ☐ No ☒ The aggregate market value of the voting common stock held by non-affiliates of the Registrant as of August 1, 2020 was $31,310,449,079, based on the closing price on that date as reported by the NASDAQ Global Select Market®. Shares of voting stock held by each director and executive officer have been excluded in that such persons may be deemed to be affiliates. This determination of affiliate status is not necessarily a conclusive determination for other purposes. The number of shares of Common Stock, with $.01 par value, outstanding on March 8, 2021 was 356,523,349. Documents incorporated by reference: Portions of the Proxy Statement for the Registrant’s 2021 Annual Meeting of Stockholders, which will be filed on or before June 1, 2021, are incorporated herein by reference into Part III. 1

Welcome message from author
This document is posted to help you gain knowledge. Please leave a comment to let me know what you think about it! Share it to your friends and learn new things together.
Transcript
UNITED STATESSECURITIES AND EXCHANGE COMMISSION
Washington, D.C. 20549
FORM 10-K(Mark one)
☒ ANNUAL REPORT PURSUANT TO SECTION 13 OR 15(d) OF THE SECURITIES EXCHANGE ACT OF 1934
For the fiscal year ended January 30, 2021or
☐ TRANSITION REPORT PURSUANT TO SECTION 13 or 15(d) OF THE SECURITIES EXCHANGE ACT OF 1934
For the transition period from ________ to ________
Commission file number 0-14678
Ross Stores, Inc.(Exact name of registrant as specified in its charter)
Delaware 94-1390387(State or other jurisdiction of incorporation or organization) (I.R.S. Employer Identification No.)
5130 Hacienda Drive, Dublin, California 94568-7579
(Address of principal executive offices) (Zip Code)
Registrant’s telephone number, including area code (925) 965-4400
Securities registered pursuant to Section 12(b) of the Act:Title of each class Trading symbol Name of each exchange on which registered
Common stock, par value $.01 ROST NASDAQ Global Select Market
Securities registered pursuant to Section 12(g) of the Act:Title of each class
None
Indicate by check mark if the registrant is a well-known seasoned issuer, as defined in Rule 405 of the Securities Act. Yes ☒ No o
Indicate by check mark if the registrant is not required to file reports pursuant to Section 13 or Section 15(d) of the Act. Yes ☐ No ☒
Indicate by check mark whether the registrant (1) has filed all reports required to be filed by Section 13 or 15(d) of the Securities Exchange Act of 1934 during the preceding 12months (or for such shorter period that the registrant was required to file such reports), and (2) has been subject to such filing requirements for the past 90 days. Yes ☒ No o
Indicate by check mark whether the registrant has submitted electronically every Interactive Data File required to be submitted pursuant to Rule 405 of Regulation S-T(§232.405 of this chapter) during the preceding 12 months (or for such shorter period that the registrant was required to submit such files). Yes ☒ No o
Indicate by check mark whether the registrant is a large accelerated filer, an accelerated filer, a non-accelerated filer, a smaller reporting company, or emerging growth company.See definitions of “large accelerated filer,” “accelerated filer,” “smaller reporting company,” and “emerging growth company” in Rule 12b-2 of the Exchange Act.
Large accelerated filer ☒ Accelerated filer o Non-accelerated filer o (Do not check if a smaller reporting company)Smaller reporting company ☐ Emerging growth company ☐
If an emerging growth company, indicate by check mark if the registrant has elected not to use the extended transition period for complying with any new or revised financialaccounting standards provided pursuant to Section 13(a) of the Exchange Act. o
Indicate by check mark whether the registrant has filed a report on and attestation to its management’s assessment of the effectiveness of its internal control over financialreporting under Section 404(b) of the Sarbanes-Oxley Act (15 U.S.C. 7262(b)) by the registered public accounting firm that prepared or issued its audit report. ☒
Indicate by check mark whether the registrant is a shell company (as defined in Rule 12b-2 of the Act). Yes ☐ No ☒
The aggregate market value of the voting common stock held by non-affiliates of the Registrant as of August 1, 2020 was $31,310,449,079, based on the closing price on thatdate as reported by the NASDAQ Global Select Market®. Shares of voting stock held by each director and executive officer have been excluded in that such persons may bedeemed to be affiliates. This determination of affiliate status is not necessarily a conclusive determination for other purposes.
The number of shares of Common Stock, with $.01 par value, outstanding on March 8, 2021 was 356,523,349.
Documents incorporated by reference:
Portions of the Proxy Statement for the Registrant’s 2021 Annual Meeting of Stockholders, which will be filed on or before June 1, 2021, are incorporated herein by referenceinto Part III.
1
Ross Stores, Inc.Form 10-K
Table of Contents
PagePART I
Item 1. Business 3
Item 1A. Risk Factors 7
Item 1B. Unresolved Staff Comments 15
Item 2. Properties 15
Item 3. Legal Proceedings 18
Item 4. Mine Safety Disclosures 18
PART II
Item 5. Market for Registrant’s Common Equity, Related Stockholder Matters and Issuer Purchases of Equity Securities 20
Item 6. Selected Financial Data 23
Item 7. Management’s Discussion and Analysis of Financial Condition and Results of Operations 25
Item 7A. Quantitative and Qualitative Disclosures about Market Risk 36
Item 8. Financial Statements and Supplementary Data 37
Item 9. Changes in and Disagreements with Accountants on Accounting and Financial Disclosure 63
Item 9A. Controls and Procedures 63
Item 9B. Other Information 63
PART III
Item 10. Directors, Executive Officers and Corporate Governance 64
Item 11. Executive Compensation 64
Item 12. Security Ownership of Certain Beneficial Owners and Management and Related Stockholder Matters 65
Item 13. Certain Relationships and Related Transactions, and Director Independence 65
Item 14. Principal Accountant Fees and Services 65
PART IV
Item 15. Exhibits, Financial Statement Schedules 66
Signatures 67
Index to Exhibits 69
2
PART I
ITEM 1. BUSINESS
Ross Stores, Inc. and its subsidiaries (“we” or the “Company”) operate two brands of off-price retail apparel and home fashion stores—RossDress for Less (“Ross”) and dd’s DISCOUNTS .
Ross is the largest off-price apparel and home fashion chain in the United States, with 1,585 locations in 40 states, the District of Columbia,and Guam, as of January 30, 2021. Ross offers first-quality, in-season, name brand and designer apparel, accessories, footwear, and homefashions for the entire family at savings of 20% to 60% off department and specialty store regular prices every day. Ross’ target customersare primarily from middle income households.
We also operate 274 dd’s DISCOUNTS stores in 21 states as of January 30, 2021. dd’s DISCOUNTS features more moderately-priced first-quality, in-season, name brand apparel, accessories, footwear, and home fashions for the entire family at savings of 20% to 70% offmoderate department and discount store regular prices every day. The typical dd’s DISCOUNTS store is located in an established shoppingcenter in a densely populated urban or suburban neighborhood and its target customers typically come from households with more moderateincomes than Ross customers.
The merchant, store field, and distribution operations for Ross and dd’s DISCOUNTS are separate. The two chains share certain corporateand support services.
Both our Ross and dd’s DISCOUNTS brands target value-conscious women and men between the ages of 18 and 54. The decisions wemake, from merchandising, purchasing, and pricing, to the locations of our stores, are based on these customer profiles. We believe thatboth brands derive a competitive advantage by offering a wide assortment of product within each of our merchandise categories in organizedand easy-to-shop store environments.
Our mission is to offer competitive values to our target customers by focusing on the following key strategic objectives:
• Maintain an appropriate level of recognizable brands, labels, and fashions at strong discounts throughout the store.
• Meet customer needs on a local basis.
• Deliver an in-store shopping experience that reflects the expectations of the off-price customer.
• Manage real estate growth to compete effectively across all our markets.
We refer to our fiscal years ended January 30, 2021, February 1, 2020, and February 2, 2019 as fiscal 2020, fiscal 2019, and fiscal 2018,respectively, all of which were 52-week years.
Merchandising, Purchasing, and Pricing
We seek to provide our customers with a wide assortment of first-quality, in-season, brand name and designer apparel, accessories,footwear, and home merchandise for the entire family at savings of 20% to 60% below department and specialty store regular prices everyday at Ross, and 20% to 70% below moderate department and discount store regular prices at dd’s DISCOUNTS. We sell recognizablebrand name merchandise that is current and fashionable in each category. New merchandise typically is received from three to six times perweek at both Ross and dd’s DISCOUNTS stores. Our buyers review their merchandise assortments on a weekly basis, enabling them torespond to selling trends and purchasing opportunities in the market. Our merchandising strategy is reflected in our advertising, whichemphasizes a strong value message. Our stores offer a treasure-hunt shopping experience where customers can find great savings everyday on a broad assortment of brand name bargains for the family and the home.
® ®
3
Merchandising. Our merchandising strategy incorporates a combination of off-price buying techniques to purchase advance-of-season, in-season, and past-season merchandise for both Ross and dd’s DISCOUNTS. We believe nationally recognized name brands sold atcompelling discounts will continue to be an important determinant of our success. We generally leave the brand name label on themerchandise we sell.
We have established merchandise assortments that we believe are attractive to our target customers. Although we offer fewer classificationsof merchandise than most department stores, we generally offer a large selection within each classification with a wide assortment ofvendors, labels, prices, colors, styles, and fabrics within each size or item. Our merchandise offerings include, but are not limited to, apparel(including footwear and accessories), small furniture, home accents, bed and bath, beauty, toys, luggage, gourmet food, cookware, jewelryand watches.
Purchasing. We have a large network of merchandise vendors and manufacturers for both Ross and dd’s DISCOUNTS and believe wehave adequate sources of first-quality merchandise to meet our requirements. We purchase the vast majority of our merchandise directlyfrom manufacturers, and we have not experienced difficulty in sourcing sufficient merchandise inventory.
We believe our ability to effectively execute certain off-price buying strategies is a key factor in our success. Our buyers use a number ofmethods that enable us to offer our customers brand name and designer merchandise at strong discounts every day relative to departmentand specialty stores for Ross, and moderate department and discount stores for dd’s DISCOUNTS. By purchasing later in the merchandisebuying cycle than department, specialty, and discount stores, we are able to take advantage of imbalances between retailers’ demand forproducts and manufacturers’ supply of those products.
Unlike most department and specialty stores, we typically do not require that manufacturers provide promotional allowances, co-opadvertising allowances, return privileges, split shipments, drop shipments to stores, or delayed deliveries of merchandise. For most orders,delivery is made to one of our distribution centers. These flexible requirements further enable our buyers to obtain significant discounts onpurchases.
The majority of the apparel and apparel-related merchandise that we offer in all of our stores is acquired through opportunistic purchasescreated by manufacturer overruns and canceled orders both during and at the end of a season. These buys are referred to as “close-out”purchases. Close-outs can be shipped to stores in-season, allowing us to get in-season goods into our stores at great values, or can bestored as packaway merchandise.
Packaway merchandise is purchased with the intent that it will be stored in our warehouses until a later date, which may even be thebeginning of the same selling season in the following year. Packaway purchases are an effective method of increasing the percentage ofprestige and national brands at competitive savings within our merchandise assortments. Packaway merchandise is mainly fashion basicsand, therefore, not usually affected by shifts in fashion trends.
In fiscal 2020, we continued our emphasis on this important sourcing strategy in response to compelling opportunities available in themarketplace. Packaway accounted for approximately 38% and 46% of total inventories as of January 30, 2021 and February 1, 2020,respectively. We believe the strong discounts we offer on packaway merchandise are one of the key drivers of our business results.
Our primary buying offices are located in New York City and Los Angeles, the nation’s two largest apparel markets. We also operate asmaller buying office located in Boston. These strategic locations allow our buyers to be in the market frequently, sourcing opportunities andnegotiating purchases with vendors and manufacturers. These locations also enable our buyers to strengthen vendor relationships—a keyelement to the success of our off-price buying strategies.
At the end of fiscal 2020, we had over 900 merchants for Ross and dd’s DISCOUNTS combined. The Ross and dd’s DISCOUNTS buyingorganizations are separate and distinct, and each includes merchandise management, buyers, and assistant buyers. Ross and dd’sDISCOUNTS buyers have on average eight years of experience, including merchandising positions with other retailers. We expect tocontinue to make additional targeted investments in our merchant organization to further develop our relationships with our manufacturersand vendors. Our ongoing objective is to strengthen our ability to procure the most desirable brands and fashions at competitive discounts.
4
The off-price buying strategies utilized by our experienced team of merchants enable us to purchase Ross merchandise at net prices that arelower than prices paid by department and specialty stores, and to purchase dd’s DISCOUNTS merchandise at net prices that are lower thanprices paid by moderate department and discount stores.
Pricing. We sell brand name merchandise at Ross that is priced 20% to 60% below most department and specialty store regular prices. Atdd’s DISCOUNTS, we sell more moderate brand name merchandise that is priced 20% to 70% below most moderate department anddiscount store regular prices. Our pricing is reflected on most of our price tags which display our selling price as well as the comparable valuefor that item in department and specialty stores for Ross merchandise, or in more moderate department and discount stores for dd’sDISCOUNTS merchandise.
Our pricing strategy at Ross differs from that of a department or specialty store. We purchase our merchandise at lower prices and mark it upless than a department or specialty store. This strategy enables us to offer customers consistently low prices and compelling value. On aweekly basis our buyers review specified departments in our stores for possible markdowns based on the rate of sale, as well as at the endof fashion seasons, to promote faster turnover of merchandise inventory and to accelerate the flow of fresh product. A similar pricing strategyis in place at dd’s DISCOUNTS where prices are compared to those in moderate department and discount stores.
Stores
As of January 30, 2021, we operated a total of 1,859 stores comprised of 1,585 Ross stores and 274 dd’s DISCOUNTS stores. Our storesare located predominantly in community and neighborhood shopping centers in heavily populated urban and suburban areas. Where the sizeof the market and real estate opportunities permit, we cluster Ross stores to benefit from economies of scale in advertising, distribution, andfield management. We do the same for dd’s DISCOUNTS stores.
We believe a key element of our success at both Ross and dd’s DISCOUNTS is our organized, attractive, and easy-to-shop in-storeenvironments which allow customers to shop at their own pace. While our stores promote a self-service, treasure-hunt shopping experience,the layouts are designed to enhance customer convenience in their merchandise presentation, dressing rooms, checkout, and merchandisereturn areas. Our store’s sales area is based on a prototype single floor design with a racetrack aisle layout. A customer can locate desireddepartments by signs displayed just below the ceiling of each department. We enable our customers to select among sizes and pricesthrough prominent category and sizing markers. Our stores have shopping carts and/or baskets available at the entrance for customerconvenience. Cash registers are primarily located at store exits for customer ease and efficient staffing. In response to the health pandemicfrom the novel coronavirus (COVID-19), we implemented enhanced safety protocols for our customers and associates, including socialdistancing measures and capacity restrictions.
We accept a variety of payment methods. We provide refunds or store credit on all merchandise (not used, worn, or altered) returned with areceipt within 30 days. Merchandise returns having a receipt older than 30 days are exchanged or refunded with store credit.
Operating Costs
Consistent with the other aspects of our business strategy, we strive to keep operating costs as low as possible. Among the factors whichhave enabled us to do this are: labor costs that are generally lower than full-price department and specialty stores due to a store design thatcreates a self-service retail format and due to the utilization of labor saving technologies; economies of scale with respect to general andadministrative costs resulting from centralized merchandising, marketing, and purchasing decisions; and flexible store layout criteria whichfacilitate conversion of existing buildings to our formats.
In response to COVID-19, we implemented additional processes and procedures to facilitate social distancing, to enhance cleaning andsanitation activities, and to provide personal protective equipment to our associates, which has increased our operating costs. We expect toincur higher operating costs during the COVID-19 pandemic.
5
Information Systems
We continue to invest in new information systems and technology to provide a platform for growth over the next several years. Recentinitiatives include continued enhancements to our collaboration, cybersecurity, merchandise planning, distribution, store, and human resourcesystems. These initiatives support future growth, the execution and achievement of our plans, ongoing stability and compliance, as well asour ability to work remotely during the COVID-19 pandemic.
Distribution
We operate distribution processing facilities where we receive and ship all of our merchandise to our stores. These distribution centers arelarge, highly automated, and built to suit our specific off-price business model. An additional distribution center in Brookshire, Texas iscurrently under construction and expected to open in 2022. We also operate warehouse facilities for packaway storage.
We utilize a combination of our own, and third-party, cross dock facilities to distribute merchandise to stores on a regional basis. Shipmentsare made by contract carriers to the stores three to six times per week depending on location.
We believe that our distribution centers and warehouses with their current expansion capabilities will provide adequate processing andstorage capacity to support our current store growth. Information on the size and locations of our distribution centers and warehouse facilitiesis found under “Properties” in Item 2.
Advertising
Advertising for Ross Dress for Less relies primarily on television to communicate the Ross value proposition—savings off the same brandscarried at leading department or specialty stores every day. This strategy reflects our belief that television is the most efficient and costeffective medium for communicating our brand position. While television is our primary advertising medium, we continue to grow additionalchannels, including social and digital media, to communicate our brand position. Advertising for dd’s DISCOUNTS is primarily focused onradio, both broadcast and digital, social media, and new store grand openings.
Trademarks
The trademarks for ROSS , Ross Dress For Less , and dd’s DISCOUNTS have been registered with the United States Patent andTrademark Office.
Human Capital
As of January 30, 2021, we had approximately 93,700 total associates, which includes both full- and part-time associates. Additionally, wehire temporary associates, especially during the peak seasons. Our associates are non-union. Management considers the relationshipbetween the Company and our associates to be good.
Our associates play essential roles in delivering great value to our customers. Throughout our organization, we recognize and appreciate theimportance of attracting, retaining, and developing our associates and we have a number of key programs to do so.
Talent development. The professional growth of our associates is important to our success as a business. We identify and enumerate keycompetencies we believe are critical to our ability to execute our business model and deliver the values our customers expect. We utilizethese competencies in the hiring, development, evaluation, and future planning of our teams. We provide training opportunities to helpassociates grow and build their careers. Our associates, managers, and executives may participate in technical and leadership developmentactivities. We support associates interested in leadership roles by offering opportunities to gain experience and build the skills necessary toadvance within the Company. We are proud that many store leaders started their careers with us as retail associates.
Diversity, equality, and inclusion. We care about our associates and the communities we serve. We are committed to building diverseteams and an inclusive culture that respects, values, and celebrates the diversity of
® ® ®
6
backgrounds, identities, and ideas of those who work and shop with us. We are focused on executing strategies to support our commitmentto diversity, equality, and inclusion.
Community and social impact. We provide our associates the opportunity to give back to their communities and make a social impactthrough various programs such as our matching gift program, volunteer time off for eligible associates, and a scholarship program for ourassociates and their dependents.
Competition
We believe the principal competitive factors in the off-price retail apparel and home fashion industry are offering significant discounts onbrand name merchandise, offering a well-balanced assortment that appeals to our target customers, and consistently providing storeenvironments that are convenient and easy to shop. To execute this concept, we continue to make strategic investments in ourmerchandising organization. We also continue to make improvements to our merchandising systems to strengthen our ability to plan, buy,and allocate product based on more local versus regional trends. We operate in an attractive sector of retail that will be facing much lessbrick and mortar competition given the significant number of retail closures and bankruptcies. We believe that we remain well-positionedwithin the off-price retail apparel and home fashion industry to compete based on these factors.
Nevertheless, the retail apparel market is highly fragmented and competitive. We face a challenging macro-economic and retail environmentthat creates intense competition for business from online retailers, department stores, specialty stores, discount stores, warehouse stores,other off-price retailers, and manufacturer-owned outlet stores, many of which are units of large national or regional chains that havesubstantially greater resources. The retail apparel and home-related businesses may become even more competitive in the future.
Available Information
The internet address for our corporate website is www.rossstores.com. Our Annual Reports on Form 10-K, quarterly reports on Form 10-Q,current reports on Form 8-K, Proxy Statements, and any amendments to those reports are made available free of charge on or through theInvestors section of our corporate website, promptly after being electronically filed with the Securities and Exchange Commission. Theinformation found on our corporate website is not part of this report, or any other report or regulatory filing we file with or furnish to theSecurities and Exchange Commission.
ITEM 1A. RISK FACTORS
Our Annual Report on Form 10-K for fiscal 2020, and information we provide in our Annual Report to Stockholders, press releases, and otherinvestor communications, including those on our corporate website, may contain forward-looking statements with respect to anticipated futureevents, including the rapidly developing challenges with and our plans and responses to the COVID-19 pandemic and related economicdisruptions, our future financial performance, operations, competitive position, and our projected growth, that are all subject to risks anduncertainties that could cause our actual results to differ materially from those forward-looking statements and from our prior expectationsand projections. Refer to Management’s Discussion and Analysis for a more complete identification and discussion of “Forward-LookingStatements.”
Our financial condition, results of operations, cash flows, and the performance of our common stock may be adversely affected by a numberof risk factors. Risks and uncertainties that apply to both Ross and dd’s DISCOUNTS include, without limitation, the following:
The COVID-19 pandemic continues to severely and adversely affect our sales and our operations, and we expect it to continue tohave serious adverse effects on our business and our financial performance.The United States and other countries are experiencing a major, prolonged global COVID-19 pandemic, with related, significant disruptionsand restrictions to retail operations and supply chains and to general economic activities, as the affected regions have taken dramaticactions, sometimes including mandatory capacity restrictions, reduced operating hours, and closure of retail operations, in an effort to slowdown the spread of the disease.
As the COVID-19 pandemic continues, many of our customers and associates are being impacted by recommendations and/or mandatesfrom federal, state, and local authorities to stay home (“shelter in place” or “safer at home”), to avoid non-essential social contact andgatherings of people, and to self-quarantine. Following a chain-wide closure from late March 2020 to mid-May 2020, all of our distributioncenters and substantially all of our
7
store locations have been operating since the end of June 2020. While vaccines have become available and a steadily increasing portion ofthe population is being vaccinated, it will take time for those efforts to reach levels that permit a relaxation in the social restrictions. Additionaloutbreaks and spreading of the disease have been occurring in many places across the United States, and while levels of spread have goneup and down in different regions, health officials continue to warn of further potential disruptions and quarantine responses. State and local“work from home” recommendations and mandates have been in effect for many of our corporate offices, and may continue for some time.Store closures and distribution center closures may be required again nationally, regionally, or in specific locations.
The situation continues to be unprecedented and rapidly changing, and has unknown duration and severity. We have a concentration of storelocations in the States of California, Texas, and Florida; together those states include almost fifty percent of our stores, and they have eachreported regional “hot spots” and increasing numbers of cases in recent months, which have already resulted in strict customer capacitylimits, limits to our hours of operations and curfews, and in mandatory store closures, in certain areas. “Stay at home” measures continue todiscourage in-person shopping and to reduce traffic in our stores. More than half of our distribution centers and warehouses are located inCalifornia. A required closure of these facilities would be very disruptive to our ability to supply merchandise to our stores. The temporaryclosure of our stores and distribution centers early in 2020 resulted in a significant loss of sales and profits and had material adverse effectson our financial condition. In addition, the COVID-19 pandemic may potentially adversely affect our ability to adequately staff our distributioncenters, our stores, and our merchant and other support operations. Further, the COVID-19 pandemic has severely impacted multiplecountries, which may also adversely affect our ability to access and ship products from the affected regions.
The prolonged, widespread pandemic has adversely impacted global economies, which has resulted in an economic downturn that mayreduce consumer demand for our products. The extent and duration of the impact from the COVID-19 pandemic on our business andfinancial results will depend largely on future developments, including the duration and spread of the outbreak within the U.S., regionalsurges in infection, the effectiveness of vaccines in controlling the virus or current or future variants of the virus, the response by all levels ofgovernment in their efforts to contain the outbreak and to mitigate the economic disruptions, and the related impact on consumer confidenceand spending, all of which are highly uncertain and cannot be predicted. Such impacts have and are expected to adversely affect ourprofitability, cash flows, financial results, and our capital resources.
We are subject to impacts from the macro-economic environment, financial and credit markets, and geopolitical conditions thataffect consumer confidence and consumer disposable income. The COVID-19 pandemic may have prolonged and significantnegative effects on consumer confidence, shopping behavior, and spending, which may adversely affect our sales and grossmargins.Consumer spending habits for the merchandise we sell are affected by many factors. Currently, the repercussions from the COVID-19pandemic are unknown and present significant risks and uncertainty. There is significant uncertainty over potential changes in consumerbehavior and shopping patterns as the pandemic continues and as different regions experience surges. Other factors include levels ofunemployment, the size and timing of federal stimulus programs, salaries and wage rates, prevailing economic conditions, recession andfears of recession, housing costs, energy and fuel costs, income tax rates and the timing of tax refunds, inflation, consumer confidence infuture economic conditions, consumer perceptions of personal well-being and security, availability of consumer credit, consumer debt levels,and consumers’ disposable income. The COVID-19 pandemic, and other potential, adverse developments in any of these areas could reducedemand for our merchandise, decrease our inventory turnover, cause greater markdowns, and negatively affect our sales and margins. All ofour stores are located in the United States and its territories, so we are especially susceptible to changes in the U.S. economy.
We need to successfully operate under the health and safety measures implemented in our stores and distribution centers, andacross all our operations, to comply with regulatory requirements and with the goal of keeping our customers and associates safefrom the spread of the COVID-19 virus without disruptions to our operations.We have implemented a variety of measures in our stores locations, distribution centers, and other facilities, with the goal of keeping ourassociates, customers, and the communities we serve safe from spreading the COVID-19 virus. These measures include additional cleaningand sanitation of stores and workspaces, return merchandise quarantining, providing associates with personal protective equipment basedon CDC or other federal, state, or local health guidelines, and implementing physical distancing practices, in our stores, distribution centers,and in our other operations. This is very challenging to do, and there is significant risk, incremental costs, and uncertainty regardingrequirements and their implementation. Not only are these measures new and evolving, but they often require change to established habitsand patterns of behavior by large groups of people, who may not fully
8
understand or agree with the requested changes. Whatever measures we adopt, there will also be challenges in effecting consistentcompliance by our customers and our associates. We will need to adapt and change these measures over time and as we learn fromexperience. And despite our efforts and best intentions, incidents of infection will occur at our stores, distribution centers, and/or in our otherfacilities, potentially resulting in serious illness for those affected, including our associates. This may result in required temporary closure ofspecific stores, distribution centers, or other facilities, and in temporary or longer term loss of key personnel during illness, and potentialsupply chain disruptions. We may also face claims (with or without merit) that our retail stores or our other facilities and workplaces areoperating in an unsafe manner or are not in compliance with applicable laws and regulations. Any such incidents may adversely affect ouroperating results, increase our costs, and damage our reputation and competitive position.
Competitive pressures in the apparel and home-related merchandise retailing industry are high.The retail industry is highly competitive and the marketplace is highly fragmented, as many different retailers compete for market share byutilizing a variety of store and on-line formats and merchandising strategies. We expect competition to increase in the future. There are nosignificant economic barriers for others to enter our retail sector. We compete for customers, associates, store locations, and merchandisewith many other local, regional, and national retailers, traditional department stores, upscale mass merchandisers, other off-price retailers,specialty stores, internet and catalog businesses, and other forms of retail commerce. Our retail competitors constantly adjust their pricing,business strategies and promotional activity (particularly during holiday periods) in response to changing market conditions or their ownfinancial condition. The substantial sales growth in e-commerce within the last decade has also encouraged the entry of many newcompetitors, new business models, and an increase in competition from established companies looking for ways to create successful on-lineshopping alternatives. Intense pressures from our competitors, our inability to adapt effectively and quickly to a changing competitivelandscape, or a failure to effectively execute our off-price model, could reduce demand for our merchandise, decrease our inventory turnover,cause us to take greater markdowns, and negatively affect our sales and margins.
Unexpected changes in the level of consumer spending on or preferences for apparel and home-related merchandise couldadversely affect us.Our success depends on our ability to effectively buy and resell merchandise that meets customer demand. We work on an ongoing basis toidentify customer trends and preferences, and to obtain merchandise inventory to meet anticipated customer needs. It is very challenging tosuccessfully do this well and consistently across our diverse merchandise categories and in the multiple markets in which we operatethroughout the United States and its territories. Although our off-price business model provides us certain advantages and may allow usgreater flexibility than traditional retailers have in adjusting our merchandise mix to ever-changing consumer tastes, our merchandisingdecisions may still fail to correctly anticipate and match consumer trends and preferences, particularly in our newer geographic markets.Failure to correctly anticipate and match the trends, preferences, and demands of our customers could adversely affect our business,financial condition, and operating results.
Adverse and/or unseasonable weather may affect shopping patterns and consumer demand for seasonal apparel and othermerchandise, and may result in temporary store closures and disruptions in deliveries of merchandise to our stores.Unseasonable weather and prolonged, extreme temperatures, as well as events such as storms, affect consumers’ buying patterns andwillingness to shop, and may adversely affect the demand for merchandise in our stores, particularly in apparel and seasonal merchandise.Among other things, weather conditions may also affect our ability to deliver our products to our stores or require us to close certain storestemporarily, thereby reducing store traffic. Even if stores are not closed, many customers may be unable to go, or may decide to avoid goingto stores in bad weather. As a result, adverse or unseasonable weather in any of our markets could lead to disappointing sales and cause usto increase our markdowns, which may negatively affect our sales and margins.
In order to achieve our planned gross margins, we must effectively manage our inventories, markdowns, and inventory shortage.As a result of potential changes in shopping behaviors due to the COVID-19 pandemic and potential disruptions to supply chainsand store operations, we are at risk for inventory imbalances and the potential for higher than normal levels of markdowns to sellthrough our inventory, which would negatively affect our gross margins and our operating results.We purchase the majority of our inventory based on our sales plans. If our actual demand is lower than our sales plans, we may experienceexcess inventory levels and need to take markdowns on excess or slow-moving inventory, resulting in decreased profit margins. We alsomay have insufficient inventory to meet customer demand, leading to lost sales opportunities. The COVID-19 pandemic may cause changesin shopping behavior and restrictions on our operations, so that our predictions and sales plans are less accurate, and that may lead us to
9
have higher than usual levels of slow-moving or non-salable inventory at our prior planned price levels. We would need to aggressively andprogressively reduce our selling prices in order to clear out that inventory, which would result in decreased profit margins or losses on salesof that inventory, and adversely affect our results of operations in future periods.
As a regular part of our business, we purchase “packaway” inventory with the intent that it will be stored in our warehouses until a later date.The timing of the release of packaway inventory to our stores varies by merchandise category and by season, but it typically remains instorage less than six months. Packaway inventory is frequently a significant portion of our overall inventory. If we make packaway purchasesthat do not align with consumer preferences at the later time of release to our stores, we could have significant inventory markdowns.Changes in packaway inventory levels could impact our operating cash flow. Although we have various systems to help protect against lossor theft of our inventory, both when in storage and once distributed to our stores, we may have damaged, lost, or stolen inventory (called“shortage”) in higher amounts than we forecast, which would result in write-offs, lost sales, and reduced margins.
We depend on the market availability, quantity, and quality of attractive brand name merchandise at desirable discounts, and onthe ability of our buyers to purchase merchandise to enable us to offer customers a wide assortment of merchandise atcompetitive prices.Opportunistic buying, lean inventory levels, and frequent inventory turns are critical elements of our off-price business strategy. Maintainingan overall pricing differential to department and specialty stores is also key to our ability to attract customers and sustain our sales and grossmargins. Our opportunistic buying places considerable discretion with our merchants, who are in the marketplace continually and who aregenerally purchasing merchandise for the current or upcoming season. Our ability to meet or exceed our operating performance targetsdepends upon the continuous, sufficient availability of high quality merchandise that we can acquire at prices sufficiently below those paid byconventional retailers and that represent a value to our customers. To the extent that certain of our vendors are better able to manage theirinventory levels and reduce the amount of their excess inventory, the amount of high quality merchandise available to us could be materiallyreduced. To the extent that certain of our vendors decide not to sell to us or go out of business, the amount of high quality merchandiseavailable to us could also be materially reduced. Because a significant portion of the apparel and other goods we sell is originallymanufactured in other countries, constraints on the availability of shipping capacity, changes in transportation costs or in U.S. tariffs, traderelationships, or tax policies, and natural disasters, or public health issues such as the current COVID-19 pandemic (or other, futurepandemics), that reduce the supply or increase the relative cost of imported goods, could also result in disruptions to our existing supplyrelationships. Shortages, delays, or disruptions in the availability to us of high quality, value-priced merchandise would likely have a materialadverse effect on our sales and margins.
Information or data security breaches, including cyber-attacks on our transaction processing and computer information systems,could result in theft or unauthorized disclosure of customer, credit card, employee, or other private and valuable information thatwe handle in the ordinary course of our business, disrupt our operations, damage our reputation, and increase our costs.Like other large retailers, we rely on commercially available computer and telecommunications systems to process, transmit, and storepayment card and other personal and confidential information, and to provide information or data security for those transactions. Some of thekey information systems and processes we use to handle payment card transactions and check approvals, and the levels of securitytechnology utilized in payment cards, are controlled by the banking and payment card industry, not by us. Cybercriminals may attempt topenetrate our point of sale and other information systems to misappropriate customer or business information, including but not limited tocredit/debit card, personnel, or trade information. Despite security measures we have in place, and our efforts to prevent, monitor, andmitigate attacks and errors, our facilities and systems (or those of third-party service providers we utilize or connect to) may be vulnerable tosecurity breaches, acts of vandalism, computer viruses, misplaced or lost data, programming and/or human errors, phishing and similarfraudulent attacks, or other similar events. It is also possible that an associate within our Company, or a third party we do business with, maypurposefully or inadvertently cause a security breach involving such information. The increasing sophistication of cybercriminals andadvances in computer capabilities and remote access increases these risks. A breach of our information or data security, a system shut downor other response we may take, or our failure or delay in detecting and mitigating a loss of personal or business information, could result indamage to our reputation, loss of customer confidence, violation (or alleged violation) of applicable laws (including laws relating to consumerdata protection and privacy, and required notifications of data security breaches), and expose us to civil claims, litigation, and regulatoryaction, and to unanticipated costs and disruption of our operations.
10
Disruptions in our supply chain or in our information systems could impact our ability to process sales and to deliver product toour stores in a timely and cost-effective manner.Various information systems are critical to our ability to operate and to manage key aspects of our business. We depend on the integrity,continuous availability, and consistent operations of these systems to process transactions in our stores, track inventory flow, managemerchandise allocation and distribution logistics, generate performance and financial reports, and support merchandising decisions.
We are currently making, and will continue to make, significant technology investments to improve or replace information processes andsystems that are key to managing our business. We must monitor and choose sound investments and implement them at the right pace. Therisk of system disruption is increased whenever significant system changes are undertaken. An excessive rate of technological change coulddetract from the effectiveness of adoption, and could make it more difficult for us to realize benefits from new technology. Poorly targetingopportunities, failing to make good investments, or making an investment commitment significantly above or below our needs could damageour competitive position and adversely impact our business and results of operations. Additionally, the potential problems and interruptionsassociated with implementing technology system changes could disrupt or reduce the efficiency of our operations in the short term. Theseinitiatives might not provide us with the anticipated benefits, or may provide them on a delayed schedule or at a higher cost.
Our information systems, including our back-up systems, are subject to damage or interruption from power outages, computer andtelecommunications failures, computer viruses, internal or external security breaches, catastrophic events such as severe storms, fires,earthquakes, floods, acts of terrorism, and design or usage errors by our employees or by third parties. If our information systems or ourback-up systems are damaged or cease to function properly, we may have to make significant investments to fix or replace them, and wemay suffer interruptions in our operations in the interim. Any material interruption in our computer systems could have a material adverseeffect on our business and results of operations.
A disruption within our logistics or supply chain network could adversely affect our ability to timely and efficiently transport merchandise to ourstores or our distribution centers, which could impair our ability to meet customer demand for products and result in lost sales or increasedsupply chain costs. Such disruptions may result from: public health issues such as the current COVID-19 pandemic (or other, futurepandemics), damage or destruction to our distribution centers, weather-related events, natural disasters, trade restrictions, tariffs, third-partystrikes or ineffective cross dock operations, work stoppages or slowdowns, shipping capacity constraints, supply or shipping interruptions, orother factors beyond our control. Any such disruptions could negatively impact our financial performance or financial condition.
We need to obtain acceptable new store sites with favorable consumer demographics to achieve our planned growth.Successful growth requires us to find appropriate real estate sites in our targeted market areas. We compete with other retailers andbusinesses for acceptable store locations. For the purpose of identifying locations we rely, in part, on consumer demographics. While webelieve consumer demographics are helpful indicators of acceptable store locations, we recognize that this information cannot predict futureconsumer preferences and buying trends with complete accuracy. Time frames for negotiations and store development vary from location tolocation and can be subject to unforeseen delays or unexpected cancellations. We may not be able to open new stores or, if opened, operatethose new stores profitably. Construction and other delays in store openings could have a negative impact on our business and operatingresults. Additionally, we may not be able to renegotiate our current lease terms which could negatively impact our operating results. Newstores may not achieve the same sales or profit levels as our existing stores, and adding stores to existing markets may adversely affect thesales and profitability of other existing stores. If we cannot acquire sites on attractive terms, it could limit our ability to grow or adversely affectthe economics of our new stores in various markets.
To achieve growth, we need to expand in existing markets and enter new geographic markets.Our growth strategy is based on successfully expanding our off-price model in current markets and in new geographic regions. There aresignificant risks associated with our ability to continue to expand our current business and to enter new markets. Stores we open in newmarkets may take longer to reach expected sales and profit levels on a consistent basis and may have higher construction, occupancy,advertising, or operating costs than stores we open in existing markets, thereby affecting our overall profitability. New markets may havecompetitive conditions, consumer tastes, and discretionary spending patterns that are more difficult to predict or satisfy than our existingmarkets. Our limited operating experience and limited brand recognition in new markets may require us to build
11
brand awareness in that market through greater investments in advertising and promotional activity than we originally planned. We may find itmore difficult in new markets to hire, motivate, and retain qualified associates.
Consumer problems or legal issues involving the quality, safety, or authenticity of products we sell could harm our reputation,result in lost sales, and/or increase our costs.Various governmental authorities regulate the quality and safety of merchandise we sell. These regulations and related laws frequentlychange, and the ultimate cost of compliance cannot be precisely estimated. Because of our opportunistic buying strategy, we sometimesobtain merchandise in new categories or from new vendors that we have not dealt with before. Although our vendor arrangements typicallyplace contractual responsibility on the vendor for resulting liability and we generally rely on our vendors to provide authentic merchandise thatmatches the stated quality attributes and complies with applicable product safety and other laws, vendor non-compliance with consumerproduct safety laws may subject us to product recalls, make certain products unsalable, or require us to incur significant compliance costs.
Regardless of fault, any real or perceived issues with the quality and safety of merchandise we offer, particularly products such as food andchildren’s items, issues with the authenticity of merchandise, or our inability, or that of our vendors, to comply on a timely basis with laws andregulatory requirements, could adversely affect our reputation, result in lost sales, inventory write-offs, uninsured product liability or otherlegal claims, penalties or losses, merchandise recalls, and increased costs.
An adverse outcome in various legal, regulatory, or tax matters could damage our reputation or brand and increase our costs.As an ordinary part of our business, we are involved in various legal proceedings, regulatory reviews, tax audits, and/or other legal matters.These may include lawsuits, inquiries, demands, or other claims or proceedings by governmental entities and private plaintiffs, includingthose relating to employment and employee benefits (including classification, employment rights, discrimination, harassment, wage and hour,and retaliation), securities, real estate, tort, commercial, consumer protection, privacy, product compliance and safety, advertising,comparative pricing, product labeling, intellectual property, tax, escheat, and whistle-blower claims. We continue to be involved in a numberof employment-related lawsuits, including class/representative actions which are primarily in California.
We are subject to federal, state, and local rules and regulations in the United States, and to various international laws, which change fromtime to time. These legal requirements collectively affect multiple aspects of our business, including the cost of health care, workforcemanagement and employee benefits, minimum wages, advertising, comparative pricing, import/export, sourcing and manufacturing, dataprotection (including customer and associate data privacy, choice and notification rights), intellectual property, and others. If we fail to comply(or are alleged not to comply) with any of these requirements, we may be subject to fines, settlements, penalties, or other costs. In addition,an adverse outcome (or the adverse publicity from the claims) in any of these matters may damage our reputation or brand. We are alsosubject to the continuous examination of our tax returns and reports by federal, state, and local tax authorities, and these examiningauthorities may challenge positions we take.
Significant judgment is required in evaluating and estimating our tax provisions and reserves for legal claims. Actual results may differ andour costs may exceed the reserves we establish in estimating the probable outcomes. In addition, applicable accounting principles andinterpretations may change from time to time, and those changes could have material effects on our reported operating results and financialcondition.
Damage to our corporate reputation or brands could adversely affect our sales and operating results.Our reputation is partially based on perceptions of various subjective qualities and overall integrity. Any incident that erodes the trust orconfidence of our customers or the general public could adversely affect our reputation and business, particularly if the incident results insignificant adverse publicity or governmental inquiry. Such an incident could also include alleged acts or omissions by or situations involvingour suppliers (or their contractors or subcontractors), the landlord for our stores, or our associates outside of work, and may pertain to socialor political issues or protests largely unrelated to our business. The use of social media platforms, including blogs, social media websites,and other forms of internet-based communications which allow individuals access to a broad audience of consumers and other interestedpersons, continues to increase. The availability of information (whether correct or erroneous) on social media platforms is virtually immediate,as is its impact. Many social media platforms immediately publish the content their subscribers and participants post, often without filters orchecks on accuracy of the content. The opportunity for dissemination of information, including inaccurate information, is seemingly limitlessand readily available. Information concerning our Company may be posted on such platforms at any time. Information posted may beadverse to our interests or may be inaccurate, which could negatively affect our sales,
12
diminish customer trust, reduce employee morale and productivity, and lead to difficulties in recruiting and retaining qualified associates. Theharm may be immediate, without affording us an opportunity for redress or correction.
Our inability to continually attract, train, and retain associates with the retail talent necessary to execute our off-price retailstrategies along with labor shortages, increased turnover, or increased labor costs could adversely affect our operating results.Like other retailers, we face challenges in recruiting and retaining sufficient talent in our buying organization, management, stores,distribution centers, and other key areas. Many of our retail store associates are in entry level or part-time positions with historically highrates of turnover. Our ability to control labor costs is subject to numerous external factors, including prevailing wage rates and health andother insurance costs, as well as the impact of legislation or regulations governing minimum wage or healthcare benefits.
Any increase in labor costs may adversely impact our profitability or, if we fail to pay such higher wages, may result in increased turnover.Excessive turnover may result in higher costs associated with finding, hiring, and training new associates. If we cannot hire enough qualifiedassociates, or if there is a disruption in the supply of personnel we hire from third-party providers, especially during our peak seasons, ouroperations could be negatively impacted.
Because of the distinctive nature of our off-price model, we must also attract, train, and retain our key associates across the Company,especially within our buying organization. The loss of one or more of our key personnel, or the inability to effectively identify a suitablesuccessor for a key role could have a material adverse effect on our business. There is no assurance that we will be able to attract or retainhighly qualified associates in the future, and any failure to do so could have a material adverse effect on our growth, operations, or financialposition.
We must effectively advertise and market our business.Customer traffic and demand for our merchandise is influenced by our advertising and marketing activities, the name recognition andreputation of our brands, and the location of our stores. Although we use marketing and advertising programs to attract customers to ourstores, particularly through television and social media, our competitors may spend more or use different approaches, which could providethem with a competitive advantage. Our advertising and other promotional programs may not be effective or may be perceived negatively, orcould require increased expenditures, any of which could adversely affect sales or increase costs.
We are subject to risks associated with selling and importing merchandise produced in other countries.Risks in importing and selling such merchandise include import duties and quotas, compliance with anti-dumping regulations, economicuncertainties and adverse economic conditions (including inflation, recession, and exchange rate fluctuations), foreign governmentregulations, employment and labor matters, concerns relating to human rights, working conditions, and other issues in factories or countrieswhere merchandise is produced, transparency of sourcing and supply chains, exposure on product warranty and intellectual property issues,consumer perceptions of the safety of imported merchandise, wars and fears of war, political unrest, natural disasters, regulations to addressclimate change, and trade restrictions.
A predominant portion of the apparel and other goods we sell (even when we purchase it domestically, often as excess inventory sold to usby a domestic vendor) is originally manufactured in other countries. In addition, we directly source a portion of the products sold in our storesfrom foreign vendors predominantly in Asia (including China). We also buy products that originate from foreign sources indirectly throughdomestic vendors and manufacturers’ representatives. Although our foreign purchases of merchandise are negotiated and paid for in U.S.dollars, decreases in the value of the U.S. dollar relative to foreign currencies could increase the cost of products we purchase from overseasvendors. When we are the importer of record, we may be subject to regulatory or other requirements similar to those applicable to amanufacturer.
To the extent that our vendors are located overseas or rely on overseas sources for a large portion of their products, any event causing adisruption, delay, or increase in the cost of imports, including the imposition of import or other restrictions, war, acts of terrorism, naturaldisasters, or public health issues such as the current COVID-19 pandemic (or other, future pandemics) could adversely affect our business.The flow of merchandise from our vendors could also be adversely affected by global shipping capacity limitations, or by financial or politicalinstability in any of the countries in which the goods we purchase are manufactured. Trade restrictions in the form of tariffs or quotas, or both,applicable to the products we sell could also affect the importation of those products and could increase the cost and reduce the supply ofproducts available to us. We cannot predict whether any of the countries from which our products are sourced, or in which our products arecurrently manufactured or may be manufactured in the
13
future, will be subject to trade restrictions imposed by the U.S. or foreign governments or the likelihood, type or effect of any such restrictions.
We require our vendors (for both import and domestic purchasing) to contractually confirm that they adhere to various conduct, compliance,and other requirements, including those relating to environmental, employment and labor (including wages and working conditions), health,safety, and anti-bribery standards. From time to time, our vendors, their contractors, or their subcontractors may be alleged to not be incompliance with these standards or with applicable local laws. Although we have implemented policies and procedures to facilitatecompliance with laws and regulations relating to doing business in foreign markets and importing merchandise, and to monitor thecompliance of our suppliers, this does not guarantee that suppliers and other third parties with whom we do business will not violate suchlaws and regulations or our policies. Significant or continuing noncompliance with such standards and laws by one or more vendors couldhave a negative impact on our reputation, could subject us to claims and liability, and could have an adverse effect on our results ofoperations.
Changes in U.S. tax or trade policy regarding apparel and home-related merchandise produced in other countries could adverselyaffect our business.A predominant portion of the apparel and other goods we sell is originally manufactured in other countries. The U.S. government has at timesindicated a willingness to significantly change existing trade policies, including those with China. This exposes us to risks of disruption andcost increases in our established patterns for sourcing our merchandise, and creates increased uncertainties in planning our sourcingstrategies and forecasting our margins. Changes in U.S. tariffs, quotas, trade relationships, or tax provisions that reduce the supply orincrease the relative cost of goods produced in other countries could increase our cost of goods and/or increase our effective tax rate.Although such changes would have implications across the entire industry, we may fail to effectively adapt and to manage the adjustments instrategy that would be necessary in response to those changes. In addition to the general uncertainty and overall risk from potential changesin U.S. laws and policies, as we make business decisions in the face of uncertainty as to potential changes, we may incorrectly anticipate theoutcomes, miss out on business opportunities, or fail to effectively adapt our business strategies and manage the adjustments that arenecessary in response to those changes. These risks could adversely affect our revenues and expenses, increase our effective tax rates,and reduce our profitability.
We may experience volatility in revenues and earnings.Our business has slower and busier periods based on holiday and back-to-school seasons, weather, and other factors. Although our off-pricebusiness is historically subject to less seasonality than traditional retailers, we may still experience unexpected decreases in sales from timeto time, which could result in increased markdowns and reduced margins. Significant operating expenses, such as rent expense andassociate salaries, do not adjust proportionately with our sales. If sales in a certain period are lower than our plans, we may not be able toadjust these operating expenses concurrently, which could adversely affect our operating results.
A pandemic, natural or man-made disaster in California or in another region where we have a concentration of stores, offices, or adistribution center could harm our business.Our corporate headquarters, Los Angeles buying office, nine distribution centers/warehouses, and approximately 23% of our stores arelocated in California. Natural or other disasters, such as the current COVID-19 pandemic (or other, future pandemics), wildfires, earthquakes,hurricanes, tornadoes, floods, or other extreme weather and climate conditions, or fires, explosions, and acts of war or terrorism, or publichealth issues, in any of our markets could disrupt our operations or our supply chain, or could shut down, damage, or destroy our stores ordistribution facilities.
To support our continuing operations, our new store and distribution center growth plans, our quarterly dividends, and anyresumption of our stock repurchase program, we must maintain sufficient liquidity; the COVID-19 pandemic and related economicdisruption are adding significant uncertainty and challenges.We depend upon our operations to generate strong cash flows to support our general operating activities, and to supply capital to finance ouroperations, make capital expenditures and acquisitions, manage our debt levels, and return value to our stockholders through dividends andstock repurchases. The COVID-19 pandemic resulted in a prolonged period during the first half of 2020 in which we temporarily closed allstore locations and distribution centers. Although our store and distribution center operations have remained substantially open since June of2020, there have been ongoing regional restrictions on store operating capacity, ongoing adversity in general economic conditions, andadverse impact on consumer confidence and shopping behavior. While the pandemic continues, further closures or disruptions to ouroperations may be required nationally, regionally, or in specific
14
locations. The situation is unprecedented and rapidly changing, and has unknown duration and severity. If we are unable to generatesufficient cash flows from operations to support our activities, our growth plans and our financial performance would be adversely affected.
We have borrowed on occasion to finance some of our activities. In March 2020, we borrowed $800 million from our revolving credit facility(subsequently repaid in the third quarter of 2020). In April 2020, we completed a $2.0 billion senior notes offering (subsequently werefinanced $775 million in aggregate principal amount of those senior notes with the issuance of $1.0 billion in aggregate principal amount oflower interest rate senior notes). These actions were taken to add to our cash balances in order to provide enhanced financial flexibility dueto uncertain market conditions arising from the impact of the COVID-19 pandemic. If our access to capital is restricted or our borrowing costsincrease, our operations and financial condition could be adversely impacted. In addition, if we do not properly allocate our capital tomaximize returns, our operations, cash flows, and returns to stockholders could be adversely affected.
We are subject to impacts from instances of damage to our stores and losses of merchandise accompanying protests ordemonstrations, which may result in temporary store closures.There have been recent demonstrations and protests in cities throughout the United States. While they have generally been peaceful, insome locations they have been accompanied by violence, damage to retail stores, and the loss of merchandise. While generally subject tocoverage by insurance, the repair of damage to our stores and replacement of lost merchandise may also increase our costs and temporarilydisrupt store operations, and we may incur increased operating costs for additional security. Governmental authorities in affected cities andregions may take actions in an effort to protect people and property while permitting lawful and non-violent protests, including curfews andrestrictions on business operations, which may be disruptive to our operations. These activities, governmental responses, and resultingmedia coverage may also harm consumer confidence and perceptions of personal well-being and security, which may negatively affectshopping behavior and our sales.
ITEM 1B. UNRESOLVED STAFF COMMENTS
Not applicable.
ITEM 2. PROPERTIES
At January 30, 2021, we operated a total of 1,859 stores, of which 1,585 were Ross stores in 40 states, the District of Columbia, and Guam,and 274 were dd’s DISCOUNTS stores in 21 states. All stores are leased, with the exception of two locations which we own.
During fiscal 2020, we opened 50 new Ross stores and closed 11 existing stores. The average approximate Ross store size is 28,000 squarefeet.
During fiscal 2020, we opened 16 new dd’s DISCOUNTS stores, including reopening one store previously temporarily closed due to aweather event, and closed one existing store. The average approximate dd’s DISCOUNTS store size is 23,000 square feet.
During fiscal 2020, no one store accounted for more than 1% of our sales.
We carry fire, flood, wind, and earthquake insurance to help mitigate the risk of financial loss that may result from such events.
Our real estate strategy in 2021 is to primarily open stores in states where we currently operate, to increase our market penetration andleverage overhead and advertising expenses as a percentage of sales in each market. We also expect to continue our store expansion innewer markets in 2021. Important considerations in evaluating a new store location in both newer and more established markets are theavailability and quality of potential sites, demographic characteristics, competition, and population density of the local trade area. In addition,we continue to consider opportunistic real estate acquisitions.
15
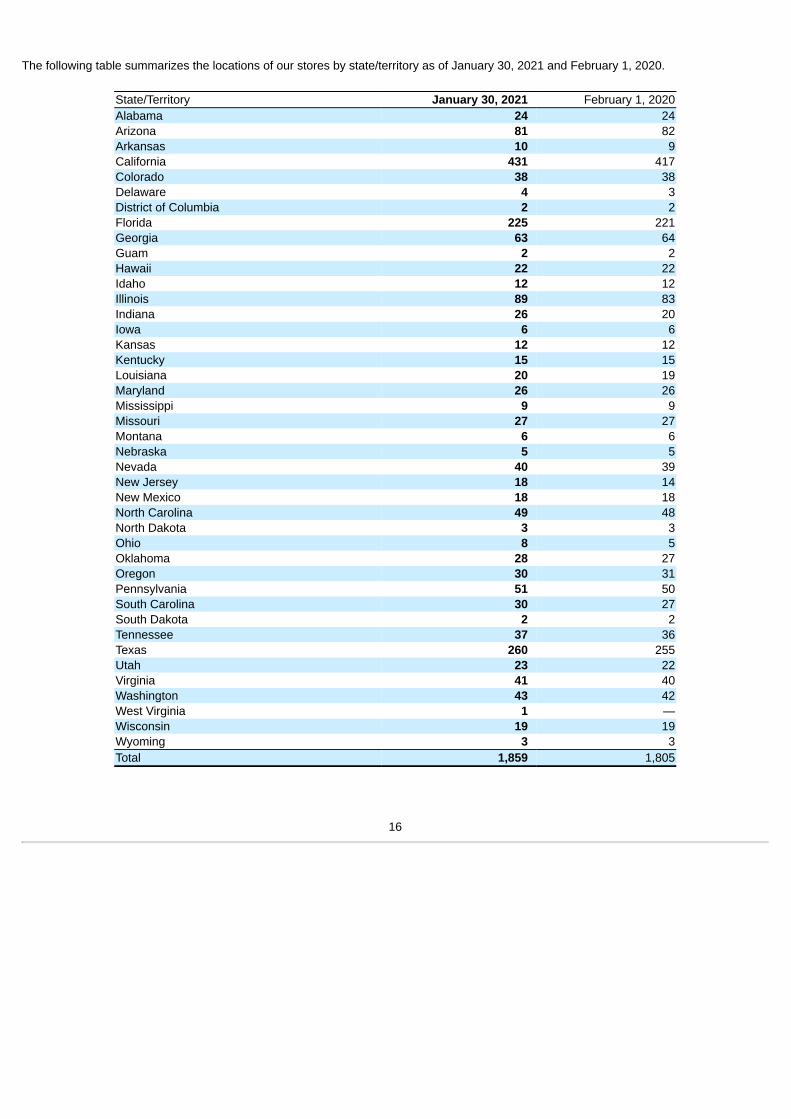
The following table summarizes the locations of our stores by state/territory as of January 30, 2021 and February 1, 2020.
State/Territory January 30, 2021 February 1, 2020Alabama 24 24Arizona 81 82Arkansas 10 9California 431 417Colorado 38 38Delaware 4 3District of Columbia 2 2Florida 225 221Georgia 63 64Guam 2 2Hawaii 22 22Idaho 12 12Illinois 89 83Indiana 26 20Iowa 6 6Kansas 12 12Kentucky 15 15Louisiana 20 19Maryland 26 26Mississippi 9 9Missouri 27 27Montana 6 6Nebraska 5 5Nevada 40 39New Jersey 18 14New Mexico 18 18North Carolina 49 48North Dakota 3 3Ohio 8 5Oklahoma 28 27Oregon 30 31Pennsylvania 51 50South Carolina 30 27South Dakota 2 2Tennessee 37 36Texas 260 255Utah 23 22Virginia 41 40Washington 43 42West Virginia 1 —Wisconsin 19 19Wyoming 3 3Total 1,859 1,805
16
Where possible, we obtain sites in buildings requiring minimal alterations, allowing us to establish stores in new locations in a relatively shortperiod of time at reasonable costs in a given market. At January 30, 2021, the majority of our stores had unexpired original lease termsranging from three to ten years, with three to four renewal options of five years each. The average unexpired original lease term of our leasedstores is approximately six years, or approximately 20 years if renewal options are included. See Note E of Notes to Consolidated FinancialStatements.
See additional discussion under “Stores” in Item 1.
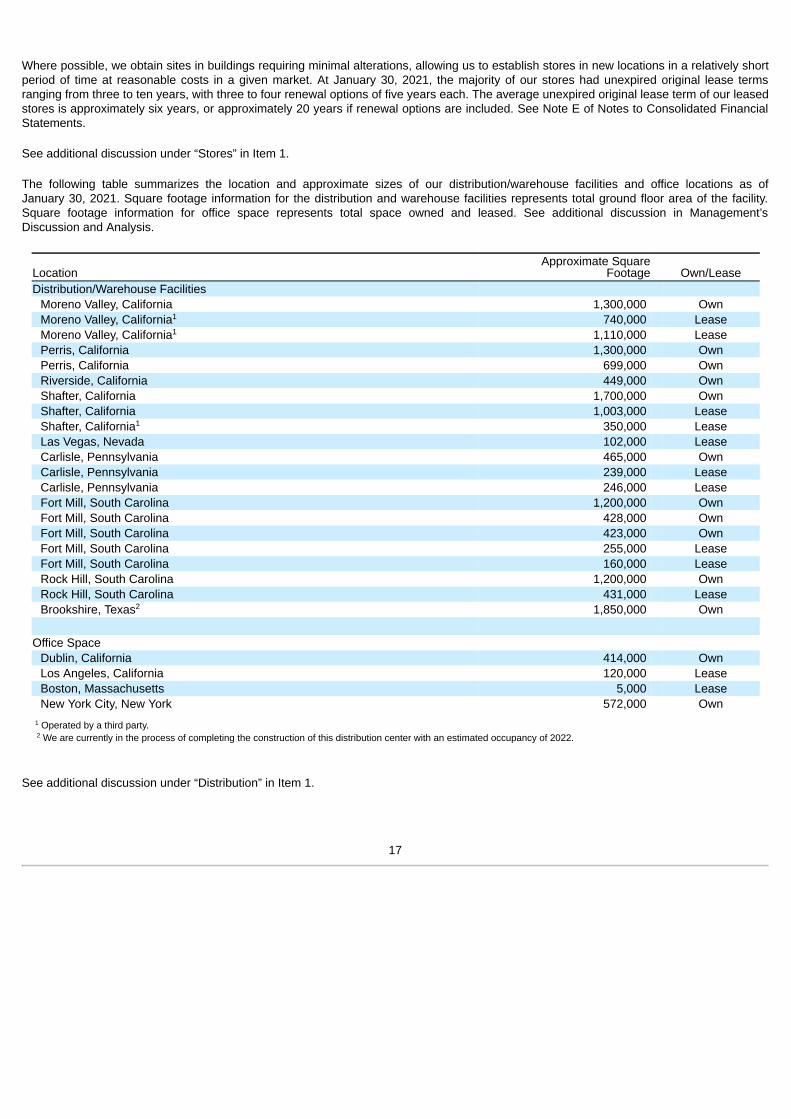
The following table summarizes the location and approximate sizes of our distribution/warehouse facilities and office locations as ofJanuary 30, 2021. Square footage information for the distribution and warehouse facilities represents total ground floor area of the facility.Square footage information for office space represents total space owned and leased. See additional discussion in Management’sDiscussion and Analysis.
LocationApproximate Square
Footage Own/LeaseDistribution/Warehouse Facilities
Moreno Valley, California 1,300,000 OwnMoreno Valley, California 740,000 LeaseMoreno Valley, California 1,110,000 LeasePerris, California 1,300,000 OwnPerris, California 699,000 OwnRiverside, California 449,000 OwnShafter, California 1,700,000 OwnShafter, California 1,003,000 LeaseShafter, California 350,000 LeaseLas Vegas, Nevada 102,000 LeaseCarlisle, Pennsylvania 465,000 OwnCarlisle, Pennsylvania 239,000 LeaseCarlisle, Pennsylvania 246,000 LeaseFort Mill, South Carolina 1,200,000 OwnFort Mill, South Carolina 428,000 OwnFort Mill, South Carolina 423,000 OwnFort Mill, South Carolina 255,000 LeaseFort Mill, South Carolina 160,000 LeaseRock Hill, South Carolina 1,200,000 OwnRock Hill, South Carolina 431,000 LeaseBrookshire, Texas 1,850,000 Own
Office SpaceDublin, California 414,000 OwnLos Angeles, California 120,000 LeaseBoston, Massachusetts 5,000 LeaseNew York City, New York 572,000 Own
Operated by a third party. We are currently in the process of completing the construction of this distribution center with an estimated occupancy of 2022.
See additional discussion under “Distribution” in Item 1.
1
1
1
2
1
2
17
ITEM 3. LEGAL PROCEEDINGS
We have been named in class/representative action lawsuits, primarily in California, alleging violation of wage and hour laws and consumerprotection laws. Class/representative action litigation remains pending as of January 30, 2021.
We are also party to various other legal and regulatory proceedings arising in the normal course of business. Actions filed against us mayinclude commercial, product and product safety, consumer, intellectual property, environmental, and labor and employment-related claims,including lawsuits in which private plaintiffs or governmental agencies allege that we violated federal, state, and/or local laws. Actions againstus are in various procedural stages. Many of these proceedings raise factual and legal issues and are subject to uncertainties.
Like many retailers and other businesses, we have filed a lawsuit as plaintiff against the insurance companies with respect to our claims forinsurance coverage for business interruption, property damage, and other losses that we have experienced as a result of the COVID-19pandemic. Our suit was filed in Alameda County, California in December 2020. The proceedings remain at an early procedural stage, and aresubject to significant uncertainties.
We believe that the resolution of our pending class/representative action litigation and other currently pending legal and regulatoryproceedings will not have a material adverse effect on our financial condition, results of operations, or cash flows.
ITEM 4. MINE SAFETY DISCLOSURES
Not applicable.
18
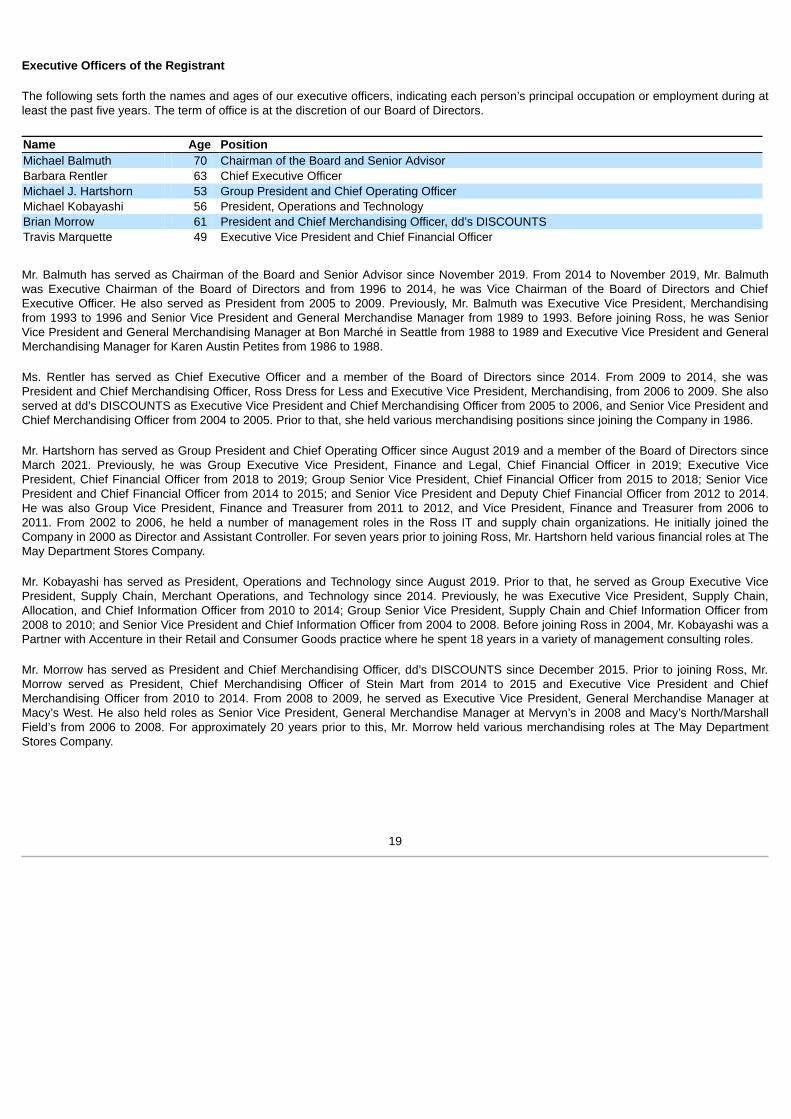
Executive Officers of the Registrant
The following sets forth the names and ages of our executive officers, indicating each person’s principal occupation or employment during atleast the past five years. The term of office is at the discretion of our Board of Directors.
Name Age PositionMichael Balmuth 70 Chairman of the Board and Senior AdvisorBarbara Rentler 63 Chief Executive OfficerMichael J. Hartshorn 53 Group President and Chief Operating OfficerMichael Kobayashi 56 President, Operations and TechnologyBrian Morrow 61 President and Chief Merchandising Officer, dd’s DISCOUNTSTravis Marquette 49 Executive Vice President and Chief Financial Officer
Mr. Balmuth has served as Chairman of the Board and Senior Advisor since November 2019. From 2014 to November 2019, Mr. Balmuthwas Executive Chairman of the Board of Directors and from 1996 to 2014, he was Vice Chairman of the Board of Directors and ChiefExecutive Officer. He also served as President from 2005 to 2009. Previously, Mr. Balmuth was Executive Vice President, Merchandisingfrom 1993 to 1996 and Senior Vice President and General Merchandise Manager from 1989 to 1993. Before joining Ross, he was SeniorVice President and General Merchandising Manager at Bon Marché in Seattle from 1988 to 1989 and Executive Vice President and GeneralMerchandising Manager for Karen Austin Petites from 1986 to 1988.
Ms. Rentler has served as Chief Executive Officer and a member of the Board of Directors since 2014. From 2009 to 2014, she wasPresident and Chief Merchandising Officer, Ross Dress for Less and Executive Vice President, Merchandising, from 2006 to 2009. She alsoserved at dd’s DISCOUNTS as Executive Vice President and Chief Merchandising Officer from 2005 to 2006, and Senior Vice President andChief Merchandising Officer from 2004 to 2005. Prior to that, she held various merchandising positions since joining the Company in 1986.
Mr. Hartshorn has served as Group President and Chief Operating Officer since August 2019 and a member of the Board of Directors sinceMarch 2021. Previously, he was Group Executive Vice President, Finance and Legal, Chief Financial Officer in 2019; Executive VicePresident, Chief Financial Officer from 2018 to 2019; Group Senior Vice President, Chief Financial Officer from 2015 to 2018; Senior VicePresident and Chief Financial Officer from 2014 to 2015; and Senior Vice President and Deputy Chief Financial Officer from 2012 to 2014.He was also Group Vice President, Finance and Treasurer from 2011 to 2012, and Vice President, Finance and Treasurer from 2006 to2011. From 2002 to 2006, he held a number of management roles in the Ross IT and supply chain organizations. He initially joined theCompany in 2000 as Director and Assistant Controller. For seven years prior to joining Ross, Mr. Hartshorn held various financial roles at TheMay Department Stores Company.
Mr. Kobayashi has served as President, Operations and Technology since August 2019. Prior to that, he served as Group Executive VicePresident, Supply Chain, Merchant Operations, and Technology since 2014. Previously, he was Executive Vice President, Supply Chain,Allocation, and Chief Information Officer from 2010 to 2014; Group Senior Vice President, Supply Chain and Chief Information Officer from2008 to 2010; and Senior Vice President and Chief Information Officer from 2004 to 2008. Before joining Ross in 2004, Mr. Kobayashi was aPartner with Accenture in their Retail and Consumer Goods practice where he spent 18 years in a variety of management consulting roles.
Mr. Morrow has served as President and Chief Merchandising Officer, dd’s DISCOUNTS since December 2015. Prior to joining Ross, Mr.Morrow served as President, Chief Merchandising Officer of Stein Mart from 2014 to 2015 and Executive Vice President and ChiefMerchandising Officer from 2010 to 2014. From 2008 to 2009, he served as Executive Vice President, General Merchandise Manager atMacy’s West. He also held roles as Senior Vice President, General Merchandise Manager at Mervyn’s in 2008 and Macy’s North/MarshallField’s from 2006 to 2008. For approximately 20 years prior to this, Mr. Morrow held various merchandising roles at The May DepartmentStores Company.
19
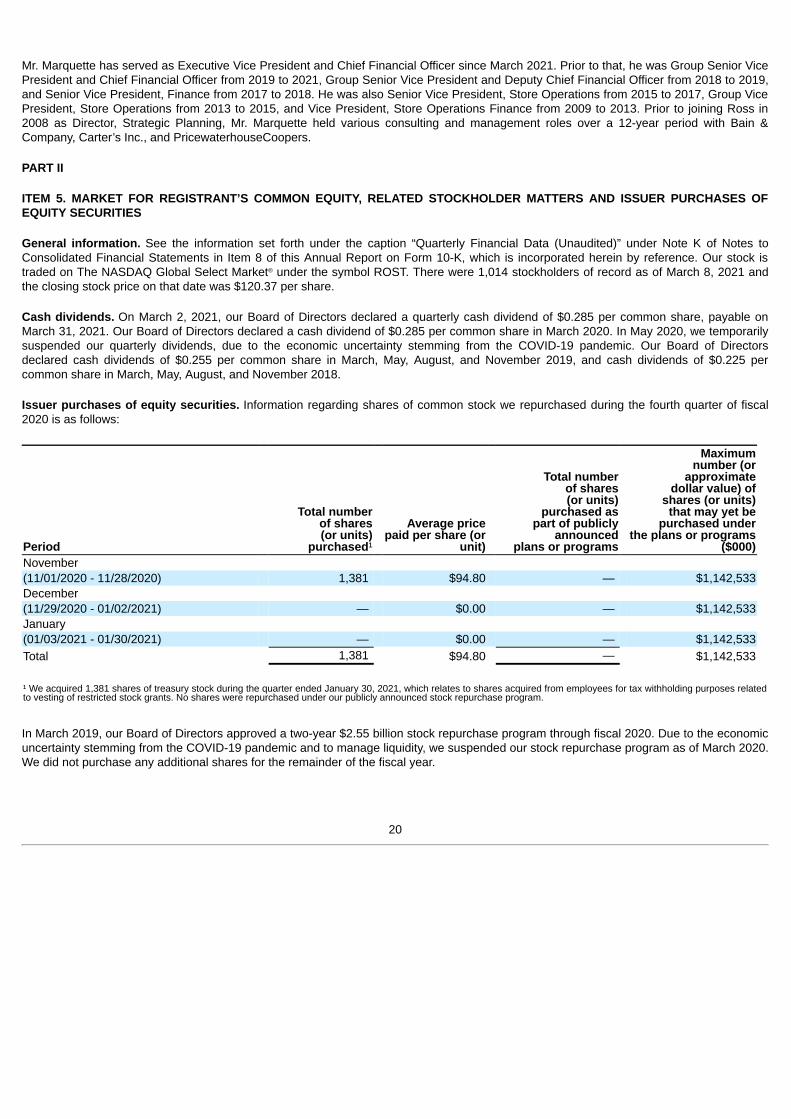
Mr. Marquette has served as Executive Vice President and Chief Financial Officer since March 2021. Prior to that, he was Group Senior VicePresident and Chief Financial Officer from 2019 to 2021, Group Senior Vice President and Deputy Chief Financial Officer from 2018 to 2019,and Senior Vice President, Finance from 2017 to 2018. He was also Senior Vice President, Store Operations from 2015 to 2017, Group VicePresident, Store Operations from 2013 to 2015, and Vice President, Store Operations Finance from 2009 to 2013. Prior to joining Ross in2008 as Director, Strategic Planning, Mr. Marquette held various consulting and management roles over a 12-year period with Bain &Company, Carter’s Inc., and PricewaterhouseCoopers.
PART II
ITEM 5. MARKET FOR REGISTRANT’S COMMON EQUITY, RELATED STOCKHOLDER MATTERS AND ISSUER PURCHASES OFEQUITY SECURITIES
General information. See the information set forth under the caption “Quarterly Financial Data (Unaudited)” under Note K of Notes toConsolidated Financial Statements in Item 8 of this Annual Report on Form 10-K, which is incorporated herein by reference. Our stock istraded on The NASDAQ Global Select Market under the symbol ROST. There were 1,014 stockholders of record as of March 8, 2021 andthe closing stock price on that date was $120.37 per share.
Cash dividends. On March 2, 2021, our Board of Directors declared a quarterly cash dividend of $0.285 per common share, payable onMarch 31, 2021. Our Board of Directors declared a cash dividend of $0.285 per common share in March 2020. In May 2020, we temporarilysuspended our quarterly dividends, due to the economic uncertainty stemming from the COVID-19 pandemic. Our Board of Directorsdeclared cash dividends of $0.255 per common share in March, May, August, and November 2019, and cash dividends of $0.225 percommon share in March, May, August, and November 2018.
Issuer purchases of equity securities. Information regarding shares of common stock we repurchased during the fourth quarter of fiscal2020 is as follows:
Period
Total numberof shares(or units)
purchased¹
Average pricepaid per share (or
unit)
Total numberof shares(or units)
purchased aspart of publicly
announcedplans or programs
Maximumnumber (or
approximatedollar value) of
shares (or units)that may yet be
purchased underthe plans or programs
($000)November (11/01/2020 - 11/28/2020) 1,381 $94.80 — $1,142,533December(11/29/2020 - 01/02/2021) — $0.00 — $1,142,533January(01/03/2021 - 01/30/2021) — $0.00 — $1,142,533Total 1,381 $94.80 — $1,142,533
¹ We acquired 1,381 shares of treasury stock during the quarter ended January 30, 2021, which relates to shares acquired from employees for tax withholding purposes relatedto vesting of restricted stock grants. No shares were repurchased under our publicly announced stock repurchase program.
In March 2019, our Board of Directors approved a two-year $2.55 billion stock repurchase program through fiscal 2020. Due to the economicuncertainty stemming from the COVID-19 pandemic and to manage liquidity, we suspended our stock repurchase program as of March 2020.We did not purchase any additional shares for the remainder of the fiscal year.
®
20
See Note H of Notes to Consolidated Financial Statements for equity compensation plan information. The information under Item 12 of thisAnnual Report on Form 10-K under the caption “Equity compensation plan information” is incorporated herein by reference.
Stockholder Return Performance Graph
The following information in this Item 5 shall not be deemed filed for purposes of Section 18 of the Securities Act of 1934, nor shall it bedeemed incorporated by reference in any filing under the Securities Act of 1933.
The graph below compares total stockholder returns over the last five years for our common stock to the Standard & Poor’s 500 Index (“S&PIndex”) and the Dow Jones Apparel Retailers Index.
We use the Dow Jones Apparel Retailers Index in our performance graph because we believe the retail companies comprising that index arealigned with the segment of the retail industry in which we operate, and it provides a relevant comparison against which to measure our stockperformance.
The cumulative total return listed below assumed an initial investment of $100 and reinvestment of dividends at each fiscal year-end, andmeasures the performance of this investment as of the last trading day in the month of January for each of the following five years. Thesemeasurement dates are based on the historical month-end data available and vary slightly from our actual fiscal year-end date for eachperiod. Data with respect to returns for the S&P Index and the Dow Jones Apparel Retailers Index is not readily available for periods shorterthan one month. The graph is a historical representation of past performance only and is not necessarily indicative of future performance.
21
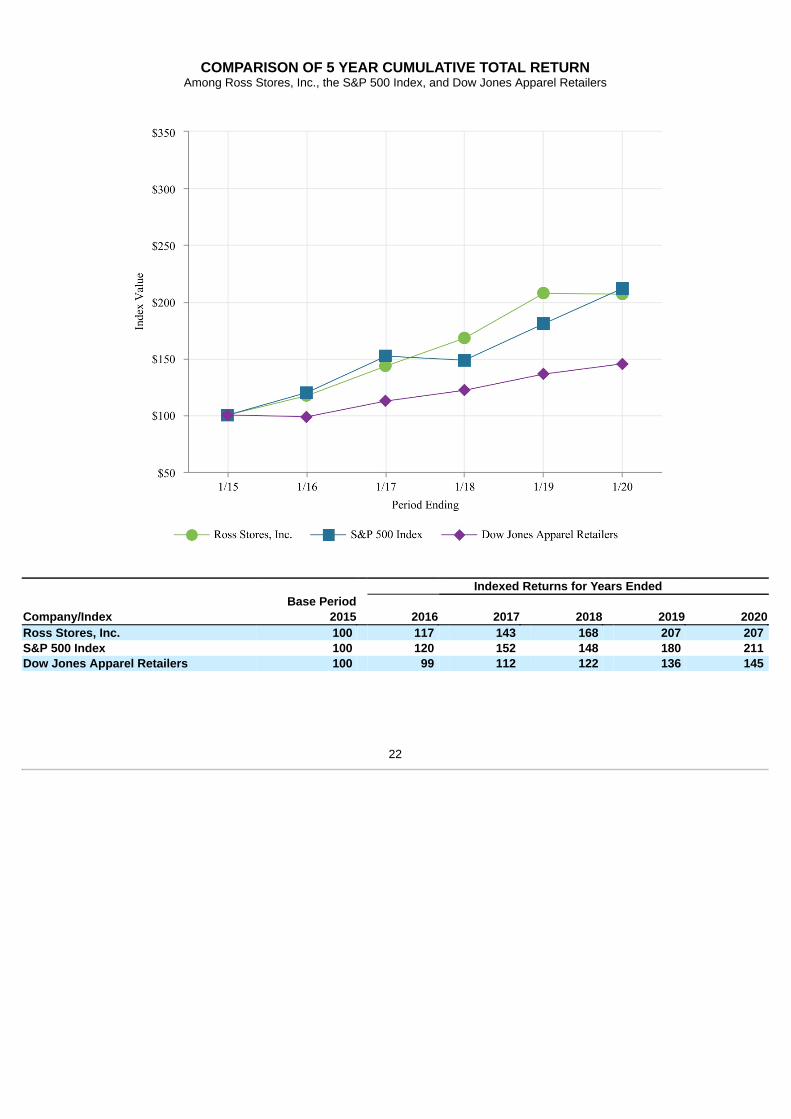
COMPARISON OF 5 YEAR CUMULATIVE TOTAL RETURNAmong Ross Stores, Inc., the S&P 500 Index, and Dow Jones Apparel Retailers
Indexed Returns for Years EndedBase Period
Company/Index 2015 2016 2017 2018 2019 2020Ross Stores, Inc. 100 117 143 168 207 207 S&P 500 Index 100 120 152 148 180 211 Dow Jones Apparel Retailers 100 99 112 122 136 145
22
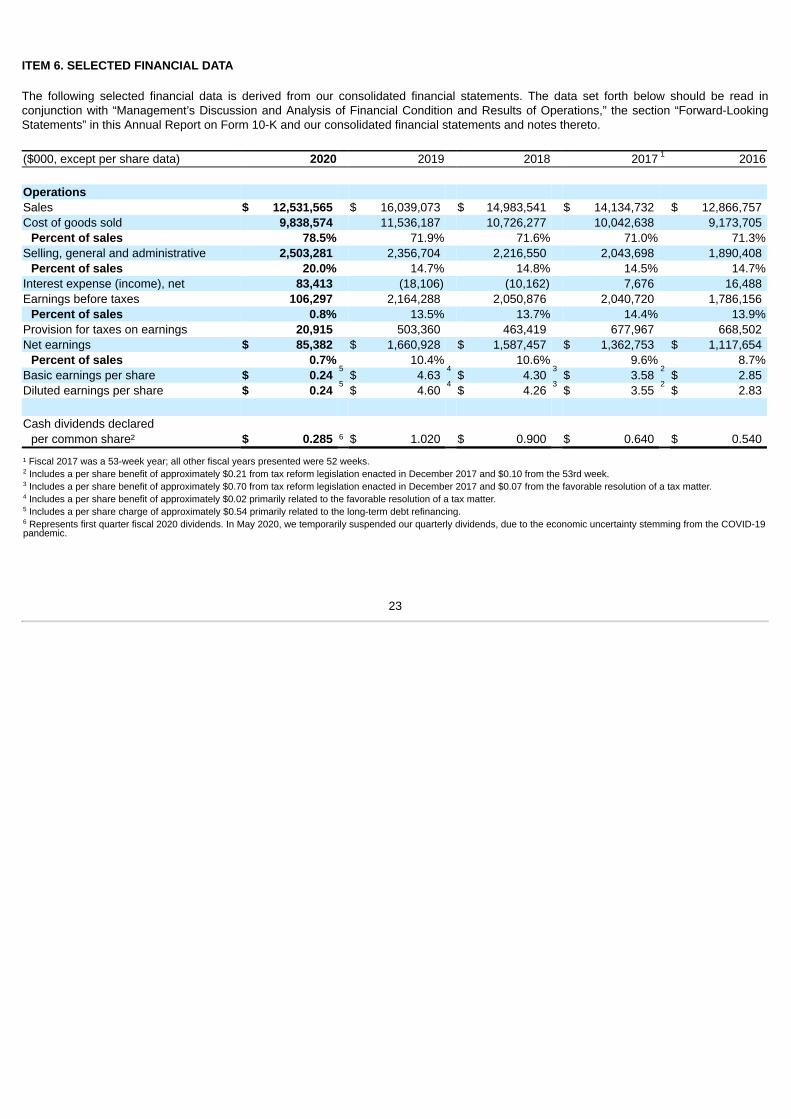
ITEM 6. SELECTED FINANCIAL DATA
The following selected financial data is derived from our consolidated financial statements. The data set forth below should be read inconjunction with “Management’s Discussion and Analysis of Financial Condition and Results of Operations,” the section “Forward-LookingStatements” in this Annual Report on Form 10-K and our consolidated financial statements and notes thereto.
($000, except per share data) 2020 2019 2018 2017 2016
OperationsSales $ 12,531,565 $ 16,039,073 $ 14,983,541 $ 14,134,732 $ 12,866,757 Cost of goods sold 9,838,574 11,536,187 10,726,277 10,042,638 9,173,705
Percent of sales 78.5% 71.9% 71.6% 71.0% 71.3%Selling, general and administrative 2,503,281 2,356,704 2,216,550 2,043,698 1,890,408
Percent of sales 20.0% 14.7% 14.8% 14.5% 14.7%Interest expense (income), net 83,413 (18,106) (10,162) 7,676 16,488 Earnings before taxes 106,297 2,164,288 2,050,876 2,040,720 1,786,156
Percent of sales 0.8% 13.5% 13.7% 14.4% 13.9%Provision for taxes on earnings 20,915 503,360 463,419 677,967 668,502 Net earnings $ 85,382 $ 1,660,928 $ 1,587,457 $ 1,362,753 $ 1,117,654
Percent of sales 0.7% 10.4% 10.6% 9.6% 8.7%Basic earnings per share $ 0.24 $ 4.63 $ 4.30 $ 3.58 $ 2.85 Diluted earnings per share $ 0.24 $ 4.60 $ 4.26 $ 3.55 $ 2.83
Cash dividends declaredper common share² $ 0.285 $ 1.020 $ 0.900 $ 0.640 $ 0.540
¹ Fiscal 2017 was a 53-week year; all other fiscal years presented were 52 weeks. Includes a per share benefit of approximately $0.21 from tax reform legislation enacted in December 2017 and $0.10 from the 53rd week. Includes a per share benefit of approximately $0.70 from tax reform legislation enacted in December 2017 and $0.07 from the favorable resolution of a tax matter. Includes a per share benefit of approximately $0.02 primarily related to the favorable resolution of a tax matter. Includes a per share charge of approximately $0.54 primarily related to the long-term debt refinancing. Represents first quarter fiscal 2020 dividends. In May 2020, we temporarily suspended our quarterly dividends, due to the economic uncertainty stemming from the COVID-19
pandemic.
1
5 4 3 2
5 4 3 2
6
2
3
4
5
6
23
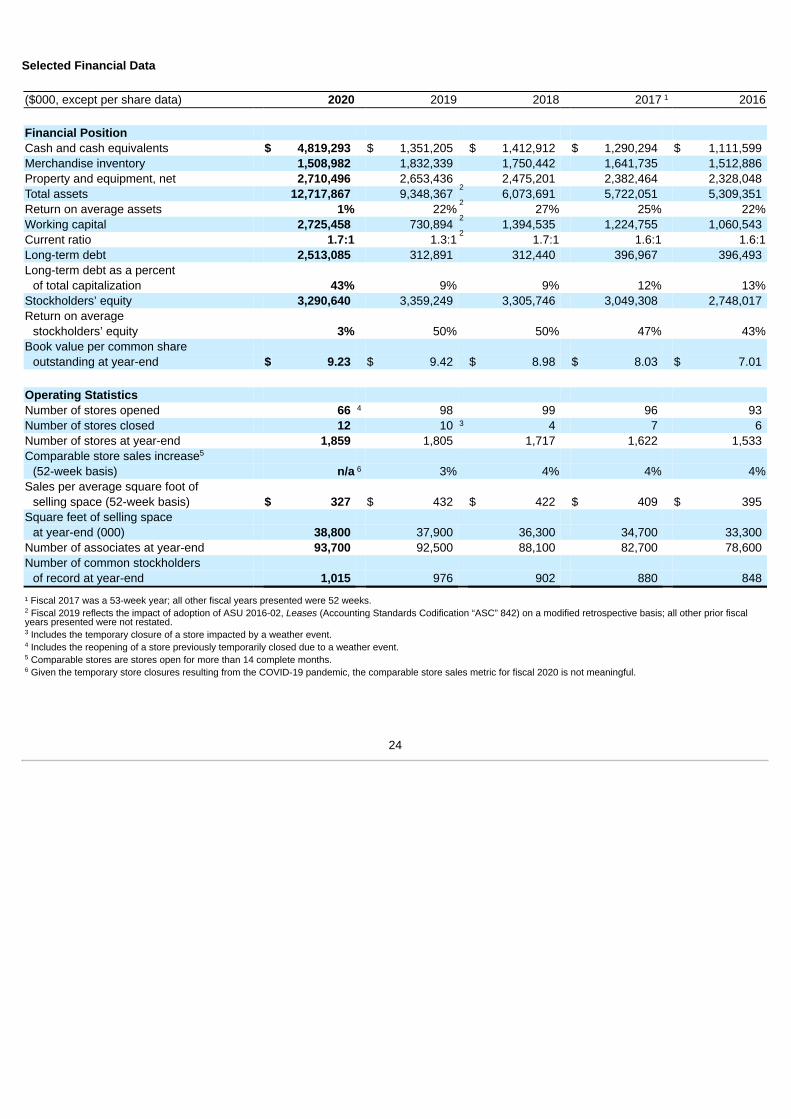
Selected Financial Data
($000, except per share data) 2020 2019 2018 2017 2016
Financial PositionCash and cash equivalents $ 4,819,293 $ 1,351,205 $ 1,412,912 $ 1,290,294 $ 1,111,599 Merchandise inventory 1,508,982 1,832,339 1,750,442 1,641,735 1,512,886 Property and equipment, net 2,710,496 2,653,436 2,475,201 2,382,464 2,328,048 Total assets 12,717,867 9,348,367 6,073,691 5,722,051 5,309,351 Return on average assets 1% 22% 27% 25% 22%Working capital 2,725,458 730,894 1,394,535 1,224,755 1,060,543 Current ratio 1.7:1 1.3:1 1.7:1 1.6:1 1.6:1Long-term debt 2,513,085 312,891 312,440 396,967 396,493 Long-term debt as a percent
of total capitalization 43% 9% 9% 12% 13%Stockholders’ equity 3,290,640 3,359,249 3,305,746 3,049,308 2,748,017 Return on average
stockholders’ equity 3% 50% 50% 47% 43%Book value per common share
outstanding at year-end $ 9.23 $ 9.42 $ 8.98 $ 8.03 $ 7.01
Operating StatisticsNumber of stores opened 66 98 99 96 93 Number of stores closed 12 10 4 7 6 Number of stores at year-end 1,859 1,805 1,717 1,622 1,533 Comparable store sales increase
(52-week basis) n/a 3% 4% 4% 4%Sales per average square foot of
selling space (52-week basis) $ 327 $ 432 $ 422 $ 409 $ 395 Square feet of selling space
at year-end (000) 38,800 37,900 36,300 34,700 33,300 Number of associates at year-end 93,700 92,500 88,100 82,700 78,600 Number of common stockholders
of record at year-end 1,015 976 902 880 848
¹ Fiscal 2017 was a 53-week year; all other fiscal years presented were 52 weeks. Fiscal 2019 reflects the impact of adoption of ASU 2016-02, Leases (Accounting Standards Codification “ASC” 842) on a modified retrospective basis; all other prior fiscal
years presented were not restated. Includes the temporary closure of a store impacted by a weather event. Includes the reopening of a store previously temporarily closed due to a weather event. Comparable stores are stores open for more than 14 complete months. Given the temporary store closures resulting from the COVID-19 pandemic, the comparable store sales metric for fiscal 2020 is not meaningful.
1
2
2
2
2
4
3
5
6
2
3
4
5
6
24
ITEM 7. MANAGEMENT’S DISCUSSION AND ANALYSIS OF FINANCIAL CONDITION AND RESULTS OF OPERATIONS
Overview
Ross Stores, Inc. operates two brands of off-price retail apparel and home fashion stores—Ross Dress for Less (“Ross”) and dd’sDISCOUNTS . Ross is the largest off-price apparel and home fashion chain in the United States with 1,585 locations in 40 states, the Districtof Columbia, and Guam, as of January 30, 2021. Ross offers first-quality, in-season, name brand and designer apparel, accessories,footwear, and home fashions for the entire family at savings of 20% to 60% off department and specialty store regular prices every day. Wealso operate 274 dd’s DISCOUNTS stores in 21 states as of January 30, 2021 that feature a more moderately-priced assortment of first-quality, in-season, name brand apparel, accessories, footwear, and home fashions for the entire family at savings of 20% to 70% offmoderate department and discount store regular prices every day.
Our primary objective is to pursue and refine our existing off-price strategies to maintain and improve both profitability and financial returnsover the long term. In establishing appropriate growth targets for our business, and considering the pace and magnitude of the economicrecovery post the COVID-19 pandemic, we are closely monitoring market share trends for the off-price industry and believe our share gainswill continue to be driven mainly by continued focus on value and convenience by consumers. Our merchandise and operational strategiesare designed to take advantage of the expanding market share of the off-price industry as well as the ongoing customer demand for namebrand fashions for the family and home at compelling discounts every day.
We refer to our fiscal years ended January 30, 2021, February 1, 2020, and February 2, 2019 as fiscal 2020, fiscal 2019, and fiscal 2018,respectively.
Effects of the COVID-19 Pandemic on Our Business
The United States and other countries are experiencing an ongoing, major global health pandemic related to the outbreak of a novel strain ofcoronavirus, COVID-19, that started at the beginning of 2020. Governmental authorities in affected regions have taken, and continue to take,dramatic actions in an effort to slow down the spread of the disease. Like other retailers across the country, we temporarily closed all ourstore locations, our distribution centers, and our buying and corporate offices for a significant part of our first and second fiscal quarters. Wealso instituted “work from home” measures for many of our associates. Our closures took effect March 20, 2020.
All our distribution centers were reopened by the end of May 2020. The vast majority of our store locations were open and operating by theend of June 2020, and remained open throughout the remainder of fiscal 2020. While open, many of our stores were operating on shorterhours and under mandated occupancy restrictions for periods of time as compared to the prior year.
The COVID-19 pandemic and the related economic disruption had a material adverse impact on our results of operations, financial position,and cash flows for fiscal 2020. The consolidated results presented in this report reflect the significant revenue decline and other impacts fromour temporary store closures (for approximately half of the first quarter and 25 percent of the second quarter), mandated occupancyrestrictions, and reduced operating hours. Our core business results improved during the second half of fiscal 2020; however, upsurges ofCOVID-19 in the fourth quarter, especially in California, our largest state, resulted in reduced customer traffic and slowed the pace ofrecovery. While vaccines have become available and a steadily increasing portion of the U.S. population is being vaccinated, it will take timefor those efforts to reach levels that permit a relaxation of the social distancing restrictions. We expect the material adverse effects from thepandemic to continue through fiscal 2021 and potentially beyond.
The temporary closure of all our stores during much of the first two fiscal quarters significantly impacted our ability to sell the seasonalinventory then on hand in a timely manner. As we reopened our stores and resumed operations in the middle of the second quarter, asignificant portion of the merchandise in our stores was aged and out of season. We took deep markdowns to sell through this inventory.During the initial reopenings, sales were ahead of our conservative plans, as we benefited from pent-up consumer demand and aggressivemarkdowns. In the weeks after reopening, sales trends were negatively affected by depleted store inventory levels while we were ramping upour buying and distribution capabilities. During the third quarter, sales improved substantially compared to the second quarter. This wasdriven by several factors, including an improvement in our merchandise assortments, a
®
®
25
later back-to-school season, stronger performance in our larger markets, and our return to more normal store hours. Our fourth quarter salesremained suppressed due to the negative impact from the upsurge in the virus that resulted in reduced customer traffic and more stringentoccupancy and store operating hours restrictions.
The ongoing effect of the COVID-19 pandemic on consumer behavior and spending patterns remains highly uncertain. Despite the initialsurge in customer demand as our stores first reopened, we expect customer demand to be generally suppressed for an extended period oftime. In addition, there have been recent resurgences in the spread of COVID-19 and new virus variants throughout the United States, whichmay also recur in the future, in one or more regions, and which have and could require our stores and distribution centers to temporarilyclose again nationally, regionally, or in specific locations. These closures would negatively impact our future revenue and operations.
In response to the COVID-19 pandemic, we incurred various costs to reopen our stores and distribution centers, and we incurred additionaloperating costs for processes and procedures to facilitate social distancing, to enhance cleaning and sanitation activities, and to providepersonal protective equipment to our associates. These actions, combined with various other actions taken to reduce costs, resulted inapproximately $130 million of additional net costs in fiscal 2020. We expect our operating costs to remain elevated related to our continuingresponse to the COVID-19 pandemic.
To preserve our financial liquidity and enhance our financial flexibility, we borrowed $800 million from our revolving credit facility in March2020, completed a $2.0 billion senior notes offering in April 2020, and entered into a new $500 million 364-day senior revolving credit facilityin May 2020. In the third quarter of fiscal 2020, we refinanced $775 million in aggregate principal amount of higher interest senior notes withthe issuance of $1.0 billion in aggregate principal amount of lower interest rate senior notes. This action resulted in a refinancing charge ofapproximately $240 million in the third quarter, but will significantly reduce our annual interest expense and total cash outlays over the life ofthe debt. In addition to refinancing the senior notes, we took several other actions during the third quarter, to reduce our ongoing debt costs,including repayment of the $800 million revolving credit facility and termination of the undrawn $500 million 364-day senior revolving creditfacility.
We suspended our stock repurchase program in March 2020 and temporarily suspended quarterly dividends in May 2020, and we tookmeasures to reduce our expenses, inventory receipts, and capital expenditures. Beginning April 5, 2020, we implemented temporaryfurloughs for a large portion of our hourly store and distribution center and other associates in our buying and corporate offices who could notwork productively while our stores and distribution centers were closed. Employee health benefits for eligible associates continued during thetemporary furlough at no cost to the impacted associates. We also reduced payroll expenses through temporary salary reductions for seniorexecutives and other personnel, which remained in effect until May 24, 2020, when more than half of our stores had reopened. In conjunctionwith these payroll expense reduction measures, effective April 1, 2020, the non-employee members of our Board of Directors suspended thecash elements of their director compensation, which remained in effect until August 2020.
In May 2020, in connection with the phased reopening of our store and distribution center locations, we began recalling many of ourfurloughed associates, as they were able to resume productive work. As of our third quarter, the majority of these associates had returned towork.
Also in May 2020, we suspended rent payments associated with the leases for our temporarily closed stores. During fiscal 2020, wenegotiated rent deferrals and/or rent abatements for a significant number of our stores. The repayment of the deferrals will be at later dates,primarily in fiscal 2021. We have recorded accruals for rent payment deferrals and have recorded rent abatements as a reduction of variablelease costs.
Given the unprecedented impact the COVID-19 pandemic has had on our business, and the continued uncertainty surrounding the COVID-19 pandemic, including its unknown duration and future severity, the potential for resurgences and new virus variants, and the unknownoverall impact on consumer demand and store productivity, we expect that impacts from the COVID-19 pandemic and the related costincreases and economic disruption may have a material adverse impact on our consolidated results of operations, financial condition, andcash flows in fiscal 2021 and potentially beyond.
26
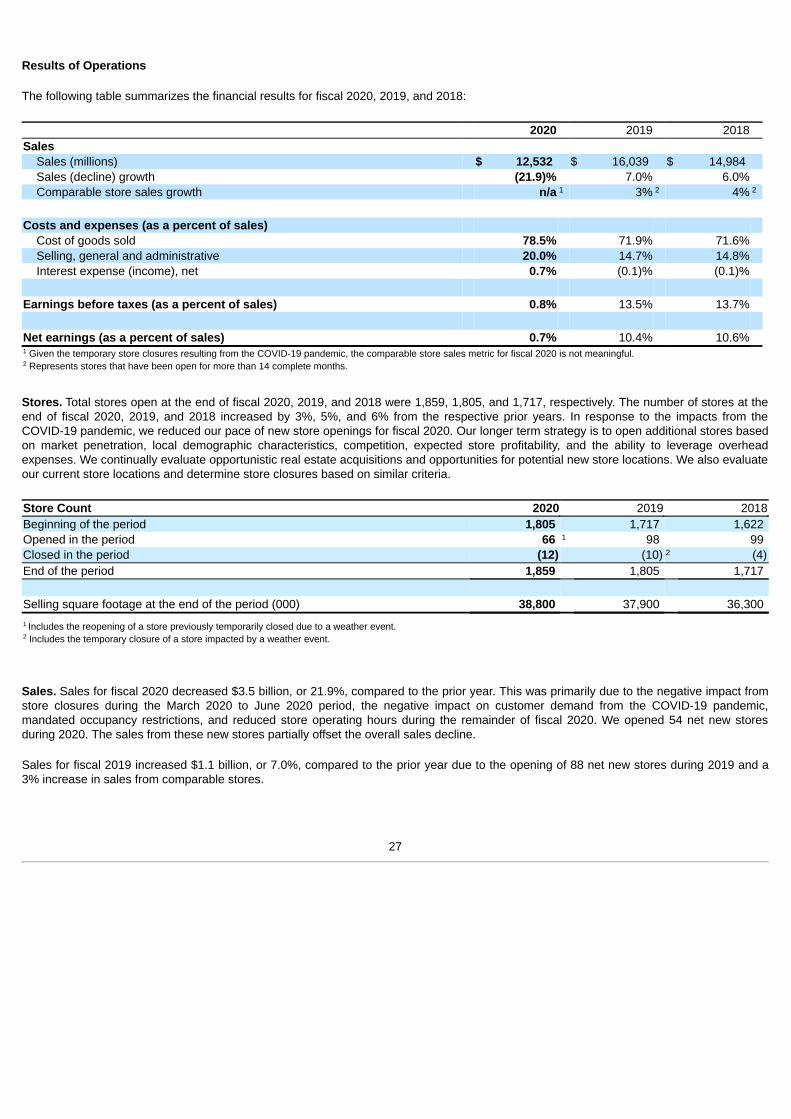
Results of Operations
The following table summarizes the financial results for fiscal 2020, 2019, and 2018:
2020 2019 2018Sales
Sales (millions) $ 12,532 $ 16,039 $ 14,984 Sales (decline) growth (21.9)% 7.0% 6.0%Comparable store sales growth n/a 3% 4%
Costs and expenses (as a percent of sales)Cost of goods sold 78.5% 71.9% 71.6%Selling, general and administrative 20.0% 14.7% 14.8%Interest expense (income), net 0.7% (0.1)% (0.1)%
Earnings before taxes (as a percent of sales) 0.8% 13.5% 13.7%
Net earnings (as a percent of sales) 0.7% 10.4% 10.6% Given the temporary store closures resulting from the COVID-19 pandemic, the comparable store sales metric for fiscal 2020 is not meaningful. Represents stores that have been open for more than 14 complete months.
Stores. Total stores open at the end of fiscal 2020, 2019, and 2018 were 1,859, 1,805, and 1,717, respectively. The number of stores at theend of fiscal 2020, 2019, and 2018 increased by 3%, 5%, and 6% from the respective prior years. In response to the impacts from theCOVID-19 pandemic, we reduced our pace of new store openings for fiscal 2020. Our longer term strategy is to open additional stores basedon market penetration, local demographic characteristics, competition, expected store profitability, and the ability to leverage overheadexpenses. We continually evaluate opportunistic real estate acquisitions and opportunities for potential new store locations. We also evaluateour current store locations and determine store closures based on similar criteria.
Store Count 2020 2019 2018Beginning of the period 1,805 1,717 1,622 Opened in the period 66 98 99 Closed in the period (12) (10) (4)End of the period 1,859 1,805 1,717
Selling square footage at the end of the period (000) 38,800 37,900 36,300
Includes the reopening of a store previously temporarily closed due to a weather event. Includes the temporary closure of a store impacted by a weather event.
Sales. Sales for fiscal 2020 decreased $3.5 billion, or 21.9%, compared to the prior year. This was primarily due to the negative impact fromstore closures during the March 2020 to June 2020 period, the negative impact on customer demand from the COVID-19 pandemic,mandated occupancy restrictions, and reduced store operating hours during the remainder of fiscal 2020. We opened 54 net new storesduring 2020. The sales from these new stores partially offset the overall sales decline.
Sales for fiscal 2019 increased $1.1 billion, or 7.0%, compared to the prior year due to the opening of 88 net new stores during 2019 and a3% increase in sales from comparable stores.
1 2 2
1
2
1
2
1
2
27
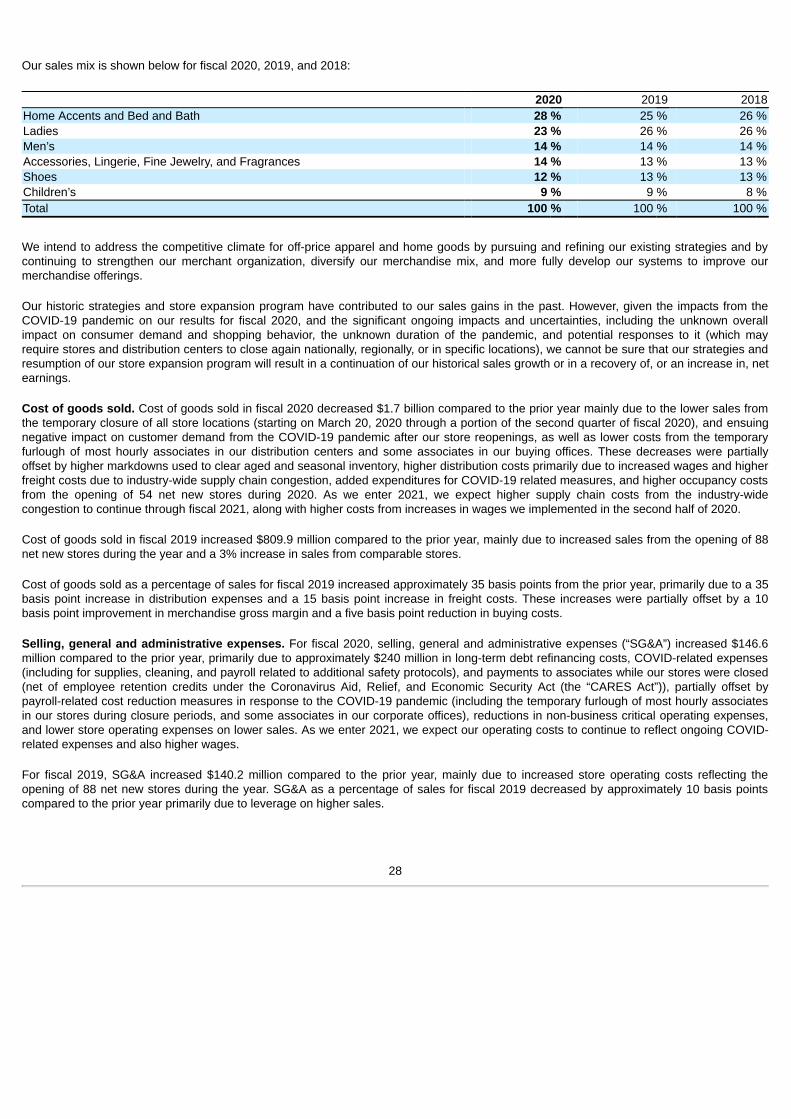
Our sales mix is shown below for fiscal 2020, 2019, and 2018:
2020 2019 2018Home Accents and Bed and Bath 28 % 25 % 26 %Ladies 23 % 26 % 26 %Men’s 14 % 14 % 14 %Accessories, Lingerie, Fine Jewelry, and Fragrances 14 % 13 % 13 %Shoes 12 % 13 % 13 %Children’s 9 % 9 % 8 %Total 100 % 100 % 100 %
We intend to address the competitive climate for off-price apparel and home goods by pursuing and refining our existing strategies and bycontinuing to strengthen our merchant organization, diversify our merchandise mix, and more fully develop our systems to improve ourmerchandise offerings.
Our historic strategies and store expansion program have contributed to our sales gains in the past. However, given the impacts from theCOVID-19 pandemic on our results for fiscal 2020, and the significant ongoing impacts and uncertainties, including the unknown overallimpact on consumer demand and shopping behavior, the unknown duration of the pandemic, and potential responses to it (which mayrequire stores and distribution centers to close again nationally, regionally, or in specific locations), we cannot be sure that our strategies andresumption of our store expansion program will result in a continuation of our historical sales growth or in a recovery of, or an increase in, netearnings.
Cost of goods sold. Cost of goods sold in fiscal 2020 decreased $1.7 billion compared to the prior year mainly due to the lower sales fromthe temporary closure of all store locations (starting on March 20, 2020 through a portion of the second quarter of fiscal 2020), and ensuingnegative impact on customer demand from the COVID-19 pandemic after our store reopenings, as well as lower costs from the temporaryfurlough of most hourly associates in our distribution centers and some associates in our buying offices. These decreases were partiallyoffset by higher markdowns used to clear aged and seasonal inventory, higher distribution costs primarily due to increased wages and higherfreight costs due to industry-wide supply chain congestion, added expenditures for COVID-19 related measures, and higher occupancy costsfrom the opening of 54 net new stores during 2020. As we enter 2021, we expect higher supply chain costs from the industry-widecongestion to continue through fiscal 2021, along with higher costs from increases in wages we implemented in the second half of 2020.
Cost of goods sold in fiscal 2019 increased $809.9 million compared to the prior year, mainly due to increased sales from the opening of 88net new stores during the year and a 3% increase in sales from comparable stores.
Cost of goods sold as a percentage of sales for fiscal 2019 increased approximately 35 basis points from the prior year, primarily due to a 35basis point increase in distribution expenses and a 15 basis point increase in freight costs. These increases were partially offset by a 10basis point improvement in merchandise gross margin and a five basis point reduction in buying costs.
Selling, general and administrative expenses. For fiscal 2020, selling, general and administrative expenses (“SG&A”) increased $146.6million compared to the prior year, primarily due to approximately $240 million in long-term debt refinancing costs, COVID-related expenses(including for supplies, cleaning, and payroll related to additional safety protocols), and payments to associates while our stores were closed(net of employee retention credits under the Coronavirus Aid, Relief, and Economic Security Act (the “CARES Act”)), partially offset bypayroll-related cost reduction measures in response to the COVID-19 pandemic (including the temporary furlough of most hourly associatesin our stores during closure periods, and some associates in our corporate offices), reductions in non-business critical operating expenses,and lower store operating expenses on lower sales. As we enter 2021, we expect our operating costs to continue to reflect ongoing COVID-related expenses and also higher wages.
For fiscal 2019, SG&A increased $140.2 million compared to the prior year, mainly due to increased store operating costs reflecting theopening of 88 net new stores during the year. SG&A as a percentage of sales for fiscal 2019 decreased by approximately 10 basis pointscompared to the prior year primarily due to leverage on higher sales.
1
28
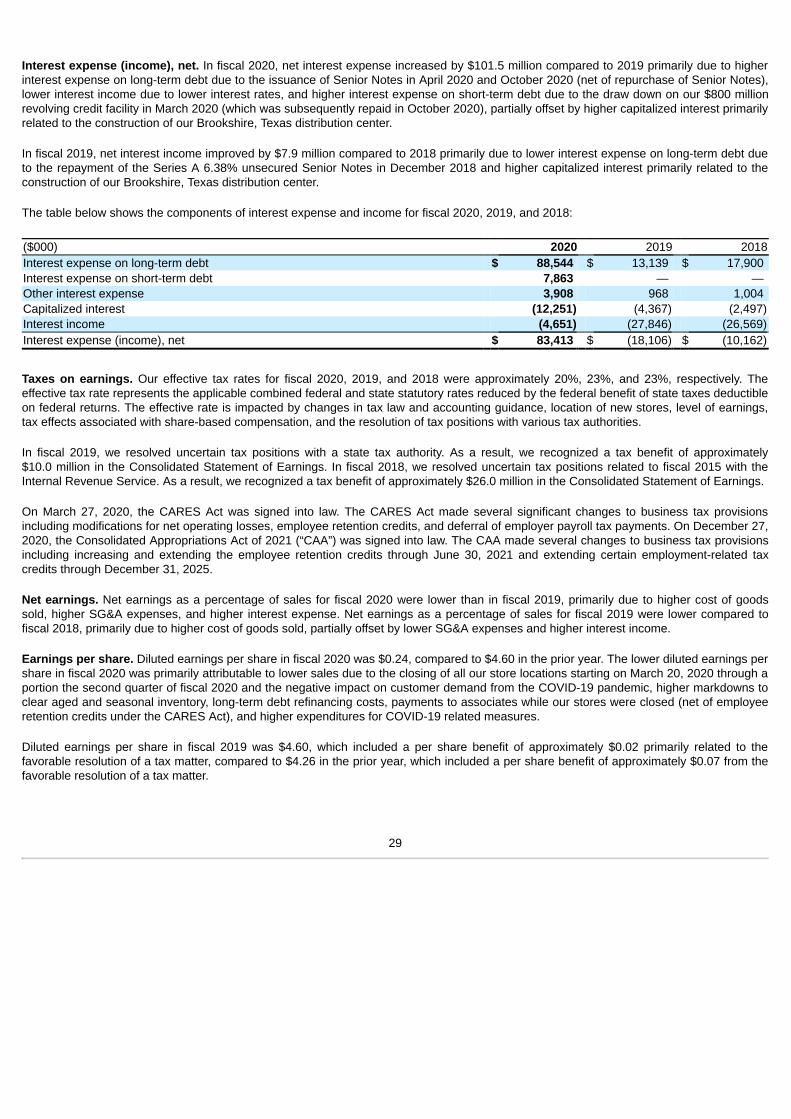
Interest expense (income), net. In fiscal 2020, net interest expense increased by $101.5 million compared to 2019 primarily due to higherinterest expense on long-term debt due to the issuance of Senior Notes in April 2020 and October 2020 (net of repurchase of Senior Notes),lower interest income due to lower interest rates, and higher interest expense on short-term debt due to the draw down on our $800 millionrevolving credit facility in March 2020 (which was subsequently repaid in October 2020), partially offset by higher capitalized interest primarilyrelated to the construction of our Brookshire, Texas distribution center.
In fiscal 2019, net interest income improved by $7.9 million compared to 2018 primarily due to lower interest expense on long-term debt dueto the repayment of the Series A 6.38% unsecured Senior Notes in December 2018 and higher capitalized interest primarily related to theconstruction of our Brookshire, Texas distribution center.
The table below shows the components of interest expense and income for fiscal 2020, 2019, and 2018:
($000) 2020 2019 2018Interest expense on long-term debt $ 88,544 $ 13,139 $ 17,900 Interest expense on short-term debt 7,863 — — Other interest expense 3,908 968 1,004 Capitalized interest (12,251) (4,367) (2,497)Interest income (4,651) (27,846) (26,569)Interest expense (income), net $ 83,413 $ (18,106) $ (10,162)
Taxes on earnings. Our effective tax rates for fiscal 2020, 2019, and 2018 were approximately 20%, 23%, and 23%, respectively. Theeffective tax rate represents the applicable combined federal and state statutory rates reduced by the federal benefit of state taxes deductibleon federal returns. The effective rate is impacted by changes in tax law and accounting guidance, location of new stores, level of earnings,tax effects associated with share-based compensation, and the resolution of tax positions with various tax authorities.
In fiscal 2019, we resolved uncertain tax positions with a state tax authority. As a result, we recognized a tax benefit of approximately$10.0 million in the Consolidated Statement of Earnings. In fiscal 2018, we resolved uncertain tax positions related to fiscal 2015 with theInternal Revenue Service. As a result, we recognized a tax benefit of approximately $26.0 million in the Consolidated Statement of Earnings.
On March 27, 2020, the CARES Act was signed into law. The CARES Act made several significant changes to business tax provisionsincluding modifications for net operating losses, employee retention credits, and deferral of employer payroll tax payments. On December 27,2020, the Consolidated Appropriations Act of 2021 (“CAA”) was signed into law. The CAA made several changes to business tax provisionsincluding increasing and extending the employee retention credits through June 30, 2021 and extending certain employment-related taxcredits through December 31, 2025.
Net earnings. Net earnings as a percentage of sales for fiscal 2020 were lower than in fiscal 2019, primarily due to higher cost of goodssold, higher SG&A expenses, and higher interest expense. Net earnings as a percentage of sales for fiscal 2019 were lower compared tofiscal 2018, primarily due to higher cost of goods sold, partially offset by lower SG&A expenses and higher interest income.
Earnings per share. Diluted earnings per share in fiscal 2020 was $0.24, compared to $4.60 in the prior year. The lower diluted earnings pershare in fiscal 2020 was primarily attributable to lower sales due to the closing of all our store locations starting on March 20, 2020 through aportion the second quarter of fiscal 2020 and the negative impact on customer demand from the COVID-19 pandemic, higher markdowns toclear aged and seasonal inventory, long-term debt refinancing costs, payments to associates while our stores were closed (net of employeeretention credits under the CARES Act), and higher expenditures for COVID-19 related measures.
Diluted earnings per share in fiscal 2019 was $4.60, which included a per share benefit of approximately $0.02 primarily related to thefavorable resolution of a tax matter, compared to $4.26 in the prior year, which included a per share benefit of approximately $0.07 from thefavorable resolution of a tax matter.
29
Financial Condition
Liquidity and Capital Resources
As previously noted, the United States and other countries are experiencing a major global health pandemic related to the outbreak of anovel strain of coronavirus, COVID-19 that started at the beginning of 2020. Governmental authorities in affected regions have taken, andcontinue to take, dramatic actions in an effort to slow down the spread of the disease. Similar to other retailers across the country, wetemporarily closed all store locations, our distribution centers, and our buying and corporate offices, effective March 20, 2020 through May14, 2020, when we began a phased process of resuming operations. All our distribution centers were reopened by the end of May 2020. Thevast majority of our store locations were open and operating by the end of June 2020, and remained open throughout the remainder of fiscal2020, though many of our stores were operating on shorter hours and under mandated occupancy restrictions for periods of time, comparedto the prior year.
To preserve our financial liquidity and enhance our financial flexibility, we borrowed $800 million from our revolving credit facility in March2020, completed a $2.0 billion senior notes offering in April 2020, and entered into a new $500 million 364-day senior revolving credit facilityin May 2020. In the third quarter of fiscal 2020, we refinanced $775 million in aggregate principal amount of higher interest senior notes withthe issuance of $1.0 billion in aggregate principal amount of lower interest rate senior notes. This action resulted in a refinancing charge ofapproximately $240 million in the third quarter, but will significantly reduce our annual interest expense and total cash outlays over the life ofthe debt. In addition to refinancing the senior notes refinancing, we took several other actions during the third quarter, to reduce our ongoingdebt costs, including repayment of the $800 million revolving credit facility and termination of the undrawn $500 million 364-day seniorrevolving credit facility.
We suspended our stock repurchase program in March 2020 and temporarily suspended quarterly dividends in May 2020, and we tookmeasures to reduce our expenses, inventory receipts, and capital expenditures. Beginning April 5, 2020, we implemented temporaryfurloughs for a large portion of our hourly store and distribution center and other associates in our buying and corporate offices who could notwork productively while our stores and distribution centers were closed. Employee health benefits for eligible associates continued during thetemporary furlough at no cost to the impacted associates. We also reduced payroll expenses through temporary salary reductions for seniorexecutives and other personnel, which remained in effect until May 24, 2020, when more than half of our stores had reopened. In conjunctionwith these payroll expense reduction measures, effective April 1, 2020, the non-employee members of our Board of Directors suspended thecash elements of their director compensation, which remained in effect until August 2020.
Also in May 2020, we suspended rent payments associated with the leases for our temporarily closed stores. During fiscal 2020, wenegotiated rent deferrals and/or rent abatements for a significant number of our stores. The repayment of the deferrals will be at later dates,primarily in fiscal 2021. We recorded accruals for rent payment deferrals and recorded rent abatements as a reduction of variable leasecosts.
We ended fiscal 2020 with over $5.6 billion in liquidity, which consists of $4.8 billion unrestricted cash balances and the $800 million availableunder our revolving credit facility.
Historically, our primary sources of funds for our business activities have been cash flows from operations and short-term trade credit. Ourprimary ongoing cash requirements are for merchandise inventory purchases, payroll, operating and variable lease costs, taxes, and forcapital expenditures in connection with new and existing stores, and investments in distribution centers, information systems, and buying andcorporate offices. We also use cash to pay dividends, to repay debt as it becomes due, and to repurchase stock under active stockrepurchase programs.
Due to the COVID-19 pandemic and related economic disruptions, and with the possibility that some of our stores, distribution centers, andother facilities may need to temporarily close again, or continue on reduced operating hours and/or capacity restrictions, as a result ofgovernment mandates, we anticipate potential interruptions to our cash flows from operations. We anticipate that we will be required to relymore on our cash reserves and we expect to carefully monitor and manage our cash position in light of ongoing conditions and levels ofoperations.
30
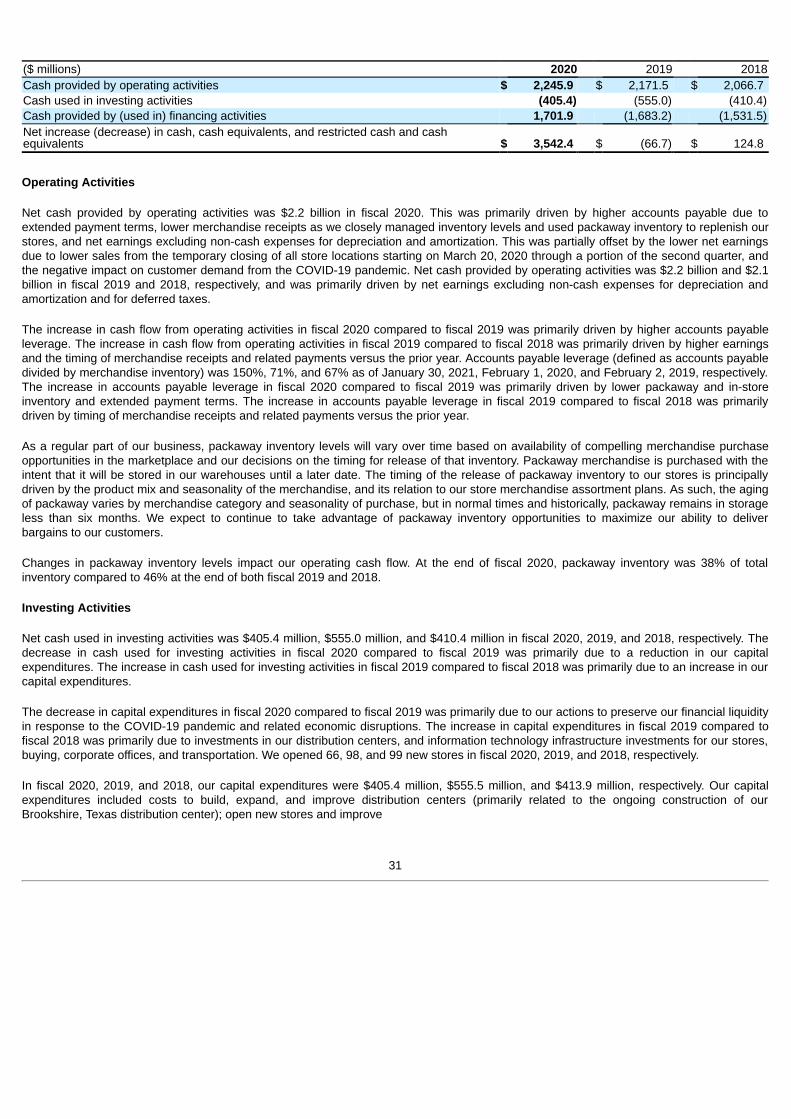
($ millions) 2020 2019 2018Cash provided by operating activities $ 2,245.9 $ 2,171.5 $ 2,066.7 Cash used in investing activities (405.4) (555.0) (410.4)Cash provided by (used in) financing activities 1,701.9 (1,683.2) (1,531.5)Net increase (decrease) in cash, cash equivalents, and restricted cash and cashequivalents $ 3,542.4 $ (66.7) $ 124.8
Operating Activities
Net cash provided by operating activities was $2.2 billion in fiscal 2020. This was primarily driven by higher accounts payable due toextended payment terms, lower merchandise receipts as we closely managed inventory levels and used packaway inventory to replenish ourstores, and net earnings excluding non-cash expenses for depreciation and amortization. This was partially offset by the lower net earningsdue to lower sales from the temporary closing of all store locations starting on March 20, 2020 through a portion of the second quarter, andthe negative impact on customer demand from the COVID-19 pandemic. Net cash provided by operating activities was $2.2 billion and $2.1billion in fiscal 2019 and 2018, respectively, and was primarily driven by net earnings excluding non-cash expenses for depreciation andamortization and for deferred taxes.
The increase in cash flow from operating activities in fiscal 2020 compared to fiscal 2019 was primarily driven by higher accounts payableleverage. The increase in cash flow from operating activities in fiscal 2019 compared to fiscal 2018 was primarily driven by higher earningsand the timing of merchandise receipts and related payments versus the prior year. Accounts payable leverage (defined as accounts payabledivided by merchandise inventory) was 150%, 71%, and 67% as of January 30, 2021, February 1, 2020, and February 2, 2019, respectively.The increase in accounts payable leverage in fiscal 2020 compared to fiscal 2019 was primarily driven by lower packaway and in-storeinventory and extended payment terms. The increase in accounts payable leverage in fiscal 2019 compared to fiscal 2018 was primarilydriven by timing of merchandise receipts and related payments versus the prior year.
As a regular part of our business, packaway inventory levels will vary over time based on availability of compelling merchandise purchaseopportunities in the marketplace and our decisions on the timing for release of that inventory. Packaway merchandise is purchased with theintent that it will be stored in our warehouses until a later date. The timing of the release of packaway inventory to our stores is principallydriven by the product mix and seasonality of the merchandise, and its relation to our store merchandise assortment plans. As such, the agingof packaway varies by merchandise category and seasonality of purchase, but in normal times and historically, packaway remains in storageless than six months. We expect to continue to take advantage of packaway inventory opportunities to maximize our ability to deliverbargains to our customers.
Changes in packaway inventory levels impact our operating cash flow. At the end of fiscal 2020, packaway inventory was 38% of totalinventory compared to 46% at the end of both fiscal 2019 and 2018.
Investing Activities
Net cash used in investing activities was $405.4 million, $555.0 million, and $410.4 million in fiscal 2020, 2019, and 2018, respectively. Thedecrease in cash used for investing activities in fiscal 2020 compared to fiscal 2019 was primarily due to a reduction in our capitalexpenditures. The increase in cash used for investing activities in fiscal 2019 compared to fiscal 2018 was primarily due to an increase in ourcapital expenditures.
The decrease in capital expenditures in fiscal 2020 compared to fiscal 2019 was primarily due to our actions to preserve our financial liquidityin response to the COVID-19 pandemic and related economic disruptions. The increase in capital expenditures in fiscal 2019 compared tofiscal 2018 was primarily due to investments in our distribution centers, and information technology infrastructure investments for our stores,buying, corporate offices, and transportation. We opened 66, 98, and 99 new stores in fiscal 2020, 2019, and 2018, respectively.
In fiscal 2020, 2019, and 2018, our capital expenditures were $405.4 million, $555.5 million, and $413.9 million, respectively. Our capitalexpenditures included costs to build, expand, and improve distribution centers (primarily related to the ongoing construction of ourBrookshire, Texas distribution center); open new stores and improve
31
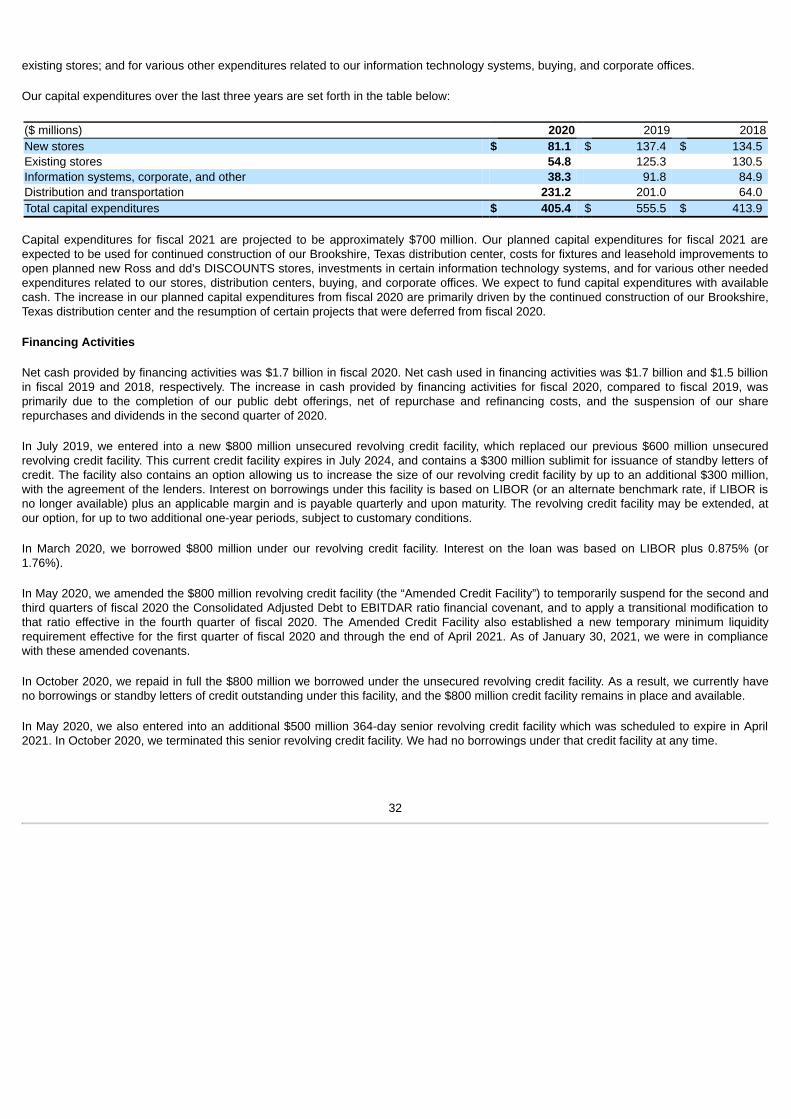
existing stores; and for various other expenditures related to our information technology systems, buying, and corporate offices.
Our capital expenditures over the last three years are set forth in the table below:
($ millions) 2020 2019 2018New stores $ 81.1 $ 137.4 $ 134.5 Existing stores 54.8 125.3 130.5 Information systems, corporate, and other 38.3 91.8 84.9 Distribution and transportation 231.2 201.0 64.0 Total capital expenditures $ 405.4 $ 555.5 $ 413.9
Capital expenditures for fiscal 2021 are projected to be approximately $700 million. Our planned capital expenditures for fiscal 2021 areexpected to be used for continued construction of our Brookshire, Texas distribution center, costs for fixtures and leasehold improvements toopen planned new Ross and dd’s DISCOUNTS stores, investments in certain information technology systems, and for various other neededexpenditures related to our stores, distribution centers, buying, and corporate offices. We expect to fund capital expenditures with availablecash. The increase in our planned capital expenditures from fiscal 2020 are primarily driven by the continued construction of our Brookshire,Texas distribution center and the resumption of certain projects that were deferred from fiscal 2020.
Financing Activities
Net cash provided by financing activities was $1.7 billion in fiscal 2020. Net cash used in financing activities was $1.7 billion and $1.5 billionin fiscal 2019 and 2018, respectively. The increase in cash provided by financing activities for fiscal 2020, compared to fiscal 2019, wasprimarily due to the completion of our public debt offerings, net of repurchase and refinancing costs, and the suspension of our sharerepurchases and dividends in the second quarter of 2020.
In July 2019, we entered into a new $800 million unsecured revolving credit facility, which replaced our previous $600 million unsecuredrevolving credit facility. This current credit facility expires in July 2024, and contains a $300 million sublimit for issuance of standby letters ofcredit. The facility also contains an option allowing us to increase the size of our revolving credit facility by up to an additional $300 million,with the agreement of the lenders. Interest on borrowings under this facility is based on LIBOR (or an alternate benchmark rate, if LIBOR isno longer available) plus an applicable margin and is payable quarterly and upon maturity. The revolving credit facility may be extended, atour option, for up to two additional one-year periods, subject to customary conditions.
In March 2020, we borrowed $800 million under our revolving credit facility. Interest on the loan was based on LIBOR plus 0.875% (or1.76%).
In May 2020, we amended the $800 million revolving credit facility (the “Amended Credit Facility”) to temporarily suspend for the second andthird quarters of fiscal 2020 the Consolidated Adjusted Debt to EBITDAR ratio financial covenant, and to apply a transitional modification tothat ratio effective in the fourth quarter of fiscal 2020. The Amended Credit Facility also established a new temporary minimum liquidityrequirement effective for the first quarter of fiscal 2020 and through the end of April 2021. As of January 30, 2021, we were in compliancewith these amended covenants.
In October 2020, we repaid in full the $800 million we borrowed under the unsecured revolving credit facility. As a result, we currently haveno borrowings or standby letters of credit outstanding under this facility, and the $800 million credit facility remains in place and available.
In May 2020, we also entered into an additional $500 million 364-day senior revolving credit facility which was scheduled to expire in April2021. In October 2020, we terminated this senior revolving credit facility. We had no borrowings under that credit facility at any time.
32
In April 2020, we issued an aggregate of $2.0 billion in unsecured senior notes in four tenors as follows: $700 million of 4.600% Senior Notesdue April 2025, $400 million of 4.700% Senior Notes due April 2027, $400 million of 4.800% Senior Notes due April 2030, and $500 million of5.450% Senior Notes due April 2050.
In October 2020, we accepted for purchase approximately $775 million in aggregate principal amount of senior notes pursuant to cash tenderoffers as follows: $351 million of the 2050 Notes, $266 million of the 2030 Notes, and $158 million of the 2027 Notes. We paid approximately$1.003 billion in aggregate consideration (including transaction costs, and accrued and unpaid interest) and recorded an approximately $240million loss on the early extinguishment for the accepted notes.
In October 2020, we also issued an aggregate of $1.0 billion in unsecured senior notes in two tenors as follows: 0.875% Senior Notes dueApril 2026 (the “2026 Notes”) with an aggregate principal amount of $500 million and 1.875% Senior Notes due April 2031 (the “2031 Notes”)with an aggregate principal amount of $500 million. Cash proceeds, net of discounts and other issuance costs, were approximately $987.2million. We used the net proceeds from the offering of the 2026 and 2031 Notes to fund the purchase of the accepted notes from our tenderoffers.
In June 2020, we amended the covenants associated with the $65 million outstanding Series B unsecured senior notes. The amendedcovenants are consistent with the corresponding covenants in our existing revolving credit facility. As of January 30, 2021, we were incompliance with these covenants.
On December 13, 2018, we repaid at maturity the $85 million principal amount of the Series A 6.38% unsecured Senior Notes.
In March 2019, our Board of Directors approved a two-year $2.55 billion stock repurchase program through fiscal 2020. Due to the economicuncertainty stemming from the severe impact of the COVID-19 pandemic, we suspended our stock repurchase program in March 2020, atwhich time we had repurchased $1.407 billion under the $2.55 billion stock repurchase program. We do not plan on making additionalpurchases until further notice.
In February 2017, our Board of Directors approved a two-year $1.75 billion stock repurchase program through fiscal 2018. In March 2018,our Board of Directors approved an increase in the stock repurchase authorization for fiscal 2018 by $200 million to $1.075 billion, up fromthe previously available $875 million.
We repurchased 1.2 million, 12.3 million, and 12.5 million shares of common stock for aggregate purchase prices of approximately $132million, $1,275 million, and $1,075 million in fiscal 2020, 2019, and 2018, respectively. We also acquired 0.5 million, 0.6 million, and 0.7million shares in fiscal 2020, 2019, and 2018, respectively, of treasury stock from our employee stock equity compensation programs, foraggregate purchase prices of approximately $45.2 million, $60.7 million, and $54.4 million during fiscal 2020, 2019, and 2018, respectively.
On March 2, 2021, our Board of Directors declared a quarterly cash dividend of $0.285 per common share, payable on March 31, 2021,resuming our payment of quarterly dividends. Our most recent prior quarterly dividend was a cash dividend of $0.285 per common sharedeclared by our Board of Directors in March 2020. In May 2020, we temporarily suspended our quarterly dividends, due to the economicuncertainty stemming from the COVID-19 pandemic. Our Board of Directors declared cash dividends of $0.255 per common share in March,May, August, and November 2019, and cash dividends of $0.225 per common share in March, May, August, and November 2018.
During fiscal 2020, 2019, and 2018, we paid dividends of $101.4 million, $369.8 million, and $337.2 million, respectively.
Short-term trade credit represents a significant source of financing for our merchandise inventory. Trade credit arises from customarypayment terms and trade practices with our vendors. We regularly review the adequacy of credit available to us from all sources. Due to theCOVID-19 pandemic and related economic disruptions, we face added uncertainty about the levels of trade credit we can maintain andliquidity available from sales of merchandise.
During fiscal 2020, our liquidity and capital requirements were provided by available cash and cash flows from operations, and our long-termdebt financing. During fiscal 2019 and 2018, our liquidity and capital requirements were provided by available cash and cash flows fromoperations.
33
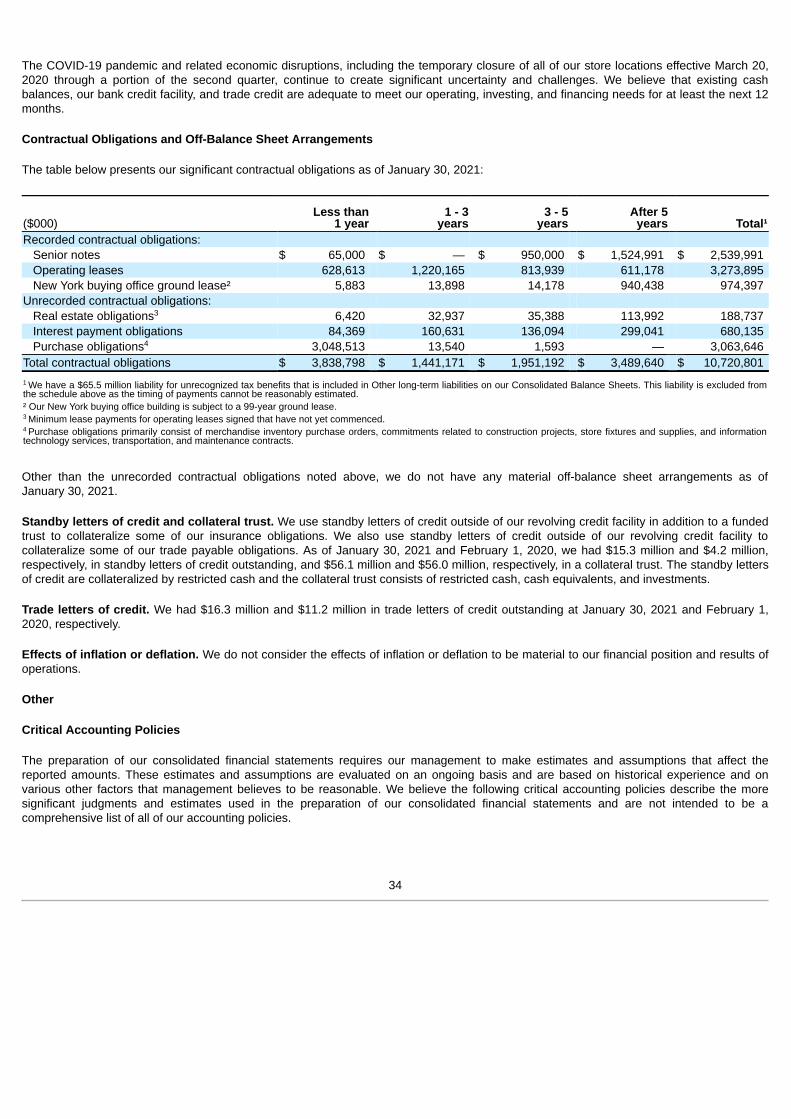
The COVID-19 pandemic and related economic disruptions, including the temporary closure of all of our store locations effective March 20,2020 through a portion of the second quarter, continue to create significant uncertainty and challenges. We believe that existing cashbalances, our bank credit facility, and trade credit are adequate to meet our operating, investing, and financing needs for at least the next 12months.
Contractual Obligations and Off-Balance Sheet Arrangements
The table below presents our significant contractual obligations as of January 30, 2021:
Less than1 year
1 - 3years
3 - 5years
After 5years Total¹($000)
Recorded contractual obligations: Senior notes $ 65,000 $ — $ 950,000 $ 1,524,991 $ 2,539,991 Operating leases 628,613 1,220,165 813,939 611,178 3,273,895 New York buying office ground lease² 5,883 13,898 14,178 940,438 974,397 Unrecorded contractual obligations: Real estate obligations 6,420 32,937 35,388 113,992 188,737 Interest payment obligations 84,369 160,631 136,094 299,041 680,135 Purchase obligations 3,048,513 13,540 1,593 — 3,063,646 Total contractual obligations $ 3,838,798 $ 1,441,171 $ 1,951,192 $ 3,489,640 $ 10,720,801
We have a $65.5 million liability for unrecognized tax benefits that is included in Other long-term liabilities on our Consolidated Balance Sheets. This liability is excluded fromthe schedule above as the timing of payments cannot be reasonably estimated.² Our New York buying office building is subject to a 99-year ground lease.Minimum lease payments for operating leases signed that have not yet commenced.Purchase obligations primarily consist of merchandise inventory purchase orders, commitments related to construction projects, store fixtures and supplies, and information
technology services, transportation, and maintenance contracts.
Other than the unrecorded contractual obligations noted above, we do not have any material off-balance sheet arrangements as ofJanuary 30, 2021.
Standby letters of credit and collateral trust. We use standby letters of credit outside of our revolving credit facility in addition to a fundedtrust to collateralize some of our insurance obligations. We also use standby letters of credit outside of our revolving credit facility tocollateralize some of our trade payable obligations. As of January 30, 2021 and February 1, 2020, we had $15.3 million and $4.2 million,respectively, in standby letters of credit outstanding, and $56.1 million and $56.0 million, respectively, in a collateral trust. The standby lettersof credit are collateralized by restricted cash and the collateral trust consists of restricted cash, cash equivalents, and investments.
Trade letters of credit. We had $16.3 million and $11.2 million in trade letters of credit outstanding at January 30, 2021 and February 1,2020, respectively.
Effects of inflation or deflation. We do not consider the effects of inflation or deflation to be material to our financial position and results ofoperations.
Other
Critical Accounting Policies
The preparation of our consolidated financial statements requires our management to make estimates and assumptions that affect thereported amounts. These estimates and assumptions are evaluated on an ongoing basis and are based on historical experience and onvarious other factors that management believes to be reasonable. We believe the following critical accounting policies describe the moresignificant judgments and estimates used in the preparation of our consolidated financial statements and are not intended to be acomprehensive list of all of our accounting policies.
3
4
1
3
4
34
In many cases, the accounting treatment of a particular transaction is specifically dictated by Generally Accepted Accounting Principles(“GAAP”), with no need for management’s judgment in their application. There are also areas in which management’s judgment in selectingone alternative accounting principle over another would not produce a materially different result. See our audited consolidated financialstatements and notes thereto under Item 8 in this Annual Report on Form 10-K, which contain descriptions of our accounting policies andother disclosures required by GAAP.
Merchandise inventory. Our merchandise inventory is stated at the lower of cost (determined using a weighted-average basis) or netrealizable value. We purchase inventory that can either be shipped to stores or processed as packaway merchandise with the intent that itwill be warehoused and released to stores at a later date. The timing of the release of packaway inventory to our stores is principally drivenby the product mix and seasonality of the merchandise, and its relation to the Company’s store merchandise assortment plans. As such, theaging of packaway varies by merchandise category and seasonality of purchase, but typically packaway remains in storage less than sixmonths. Packaway inventory accounted for approximately 38%, 46%, and 46% of total inventories as of January 30, 2021, February 1, 2020,and February 2, 2019, respectively. Merchandise inventory includes acquisition, processing, and storage costs related to packawayinventory.
Included in the carrying value of our merchandise inventory is a provision for shortage. The shortage reserve is based on historical shortagerates as evaluated through our annual physical merchandise inventory counts and cycle counts. If actual market conditions, markdowns, orshortage are less favorable than those projected by us, or if sales of the merchandise inventory are more difficult than anticipated, additionalmerchandise inventory write-downs may be required.
Lease accounting. As our leases generally do not provide an implicit discount rate; we use the estimated collateralized incrementalborrowing rate based on information available at the lease commencement date in determining the present value of lease payments for usein the calculation of the operating lease liabilities and right-of-use assets. This rate is determined using a portfolio approach based on therisk-adjusted rate of interest and requires estimates and assumptions including credit rating, credit spread, and adjustments for the impact ofcollateral. We believe that this is the rate we would have to pay to borrow an amount equal to the lease payments on a collateralized basisover a similar lease term. Operating lease liabilities and corresponding right-of-use assets include options to extend lease terms that arereasonably certain of being exercised. We do not record a lease liability and corresponding right-of-use asset for leases with terms of 12months or less, and account for lease and non-lease components as a single lease component. Our lease portfolio is comprised of operatingleases with the lease cost recorded on a straight-line basis over the lease term.
Prior to our adoption of Accounting Standards Codification (“ASC”) 842 in the beginning of fiscal 2019, when a lease contained “rentholidays” or required fixed escalations of the minimum lease payments, we recorded rental expense on a straight-line basis over the term ofthe lease and the difference between the average rental amount was charged to expense and the amount payable under the lease wasrecorded as deferred rent. We began recording rent expense on the lease possession date. Tenant improvement allowances were amortizedover the lease term. Changes in deferred rent and tenant improvement allowances were included as a component of operating activities inthe Consolidated Statements of Cash Flows.
Insurance obligations. We use a combination of insurance and self-insurance for a number of risk management activities, includingworkers’ compensation, general liability, and employee-related health care benefits. Our self-insurance and deductible liability is determinedactuarially, based on claims filed and an estimate of claims incurred but not reported. Should a greater amount of claims occur compared towhat is estimated or the costs of medical care increase beyond what was anticipated, our recorded reserves may not be sufficient andadditional charges could be required.
Recent Accounting Pronouncements
See Note A to the Consolidated Financial Statements - Summary of Significant Accounting Policies (Recently issued accounting standardsand Recently adopted accounting standards) for a discussion of recent accounting pronouncements and their impact to our ConsolidatedFinancial Statements.
35
Forward-Looking Statements
Our Annual Report on Form 10-K for fiscal 2020, and information we provide in our Annual Report to Stockholders, press releases, and otherinvestor communications including those on our corporate website, may contain a number of forward-looking statements regarding, withoutlimitation, the rapidly developing challenges and our plans and responses to the COVID-19 pandemic and related economic disruptions,including adjustments to our operations, planned new store growth, new markets, expected sales, projected earnings levels, capitalexpenditures, and other matters. These forward-looking statements reflect our then current beliefs, plans, and estimates with respect tofuture events and our projected financial performance, operations, and competitive position. The words “plan,” “expect,” “target,” “anticipate,”“estimate,” “believe,” “forecast,” “projected,” “guidance,” “looking ahead,” and similar expressions identify forward-looking statements.
Future impact from the ongoing COVID-19 pandemic, and other economic and industry trends that could potentially impact revenue,profitability, operating conditions, and growth remain difficult to predict. Our forward-looking statements are subject to risks and uncertaintieswhich could cause our actual results to differ materially from those forward-looking statements and our previous expectations, plans, andprojections. Refer to Item 1A in this Annual Report on Form 10-K for a more complete discussion of risk factors for Ross and dd’sDISCOUNTS. The factors underlying our forecasts are dynamic and subject to change. As a result, any forecasts or forward-lookingstatements speak only as of the date they are given and do not necessarily reflect our outlook at any other point in time. We disclaim anyobligation to update or revise these forward-looking statements.
ITEM 7A. QUANTITATIVE AND QUALITATIVE DISCLOSURES ABOUT MARKET RISK
We are exposed to market risks, which primarily include changes in interest rates. We do not engage in financial transactions for trading orspeculative purposes.
We occasionally use forward contracts to hedge against fluctuations in foreign currency prices. We had no outstanding forward contracts asof January 30, 2021.
Interest that is payable on our revolving credit facility is based on variable interest rates and is, therefore, affected by changes in marketinterest rates. As of January 30, 2021, we had no borrowings outstanding under our revolving credit facility.
As of January 30, 2021, we have outstanding eight series of unsecured Senior Notes. Interest that is payable on all series of our SeniorNotes is based on fixed interest rates, and is therefore unaffected by changes in market interest rates.
We receive interest on our short- and long-term investments. Changes in interest rates may impact interest income recognized in the future,or the fair value of our investment portfolio.
A hypothetical 100 basis point increase or decrease in prevailing market interest rates would not have a material negative impact on ourconsolidated financial position, results of operations, cash flows, or the fair values of our short- and long-term investments as of and for theyear ended January 30, 2021. We do not consider the potential losses in future earnings and cash flows from reasonably possible, near-termchanges in interest rates to be material.
36
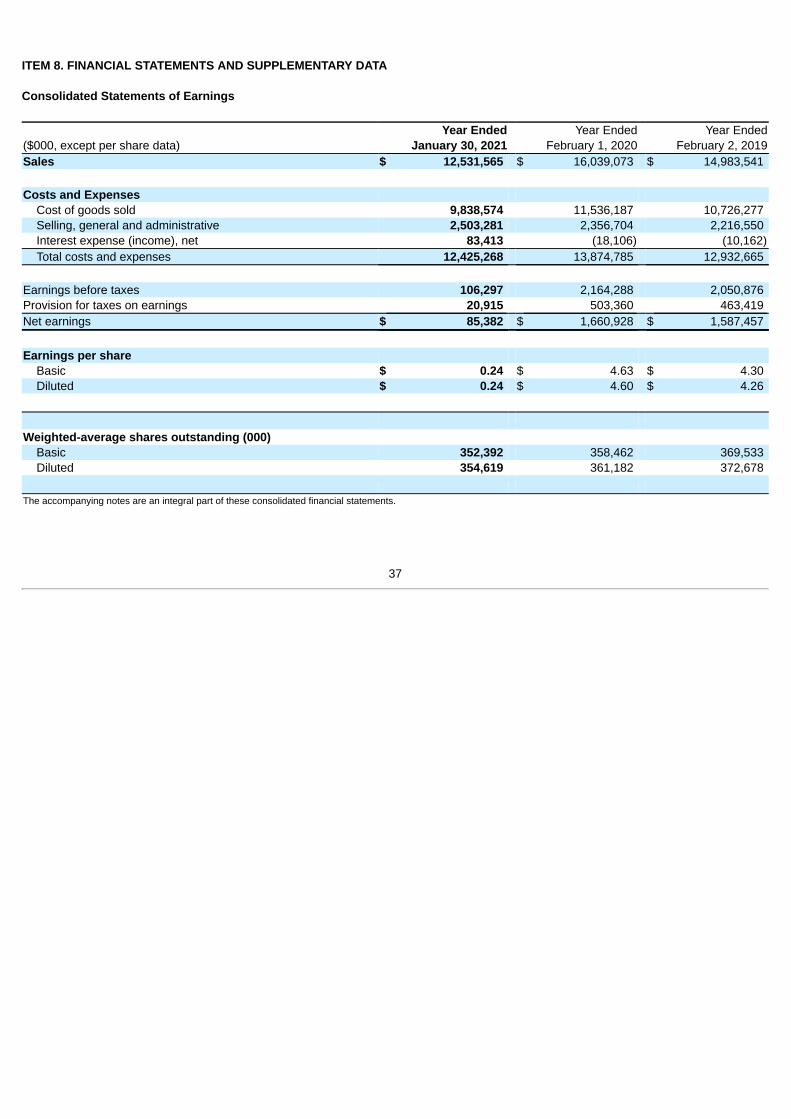
ITEM 8. FINANCIAL STATEMENTS AND SUPPLEMENTARY DATA
Consolidated Statements of Earnings
Year Ended Year Ended Year Ended($000, except per share data) January 30, 2021 February 1, 2020 February 2, 2019Sales $ 12,531,565 $ 16,039,073 $ 14,983,541
Costs and ExpensesCost of goods sold 9,838,574 11,536,187 10,726,277 Selling, general and administrative 2,503,281 2,356,704 2,216,550 Interest expense (income), net 83,413 (18,106) (10,162)Total costs and expenses 12,425,268 13,874,785 12,932,665
Earnings before taxes 106,297 2,164,288 2,050,876 Provision for taxes on earnings 20,915 503,360 463,419 Net earnings $ 85,382 $ 1,660,928 $ 1,587,457
Earnings per shareBasic $ 0.24 $ 4.63 $ 4.30 Diluted $ 0.24 $ 4.60 $ 4.26
Weighted-average shares outstanding (000)Basic 352,392 358,462 369,533 Diluted 354,619 361,182 372,678
The accompanying notes are an integral part of these consolidated financial statements.
37
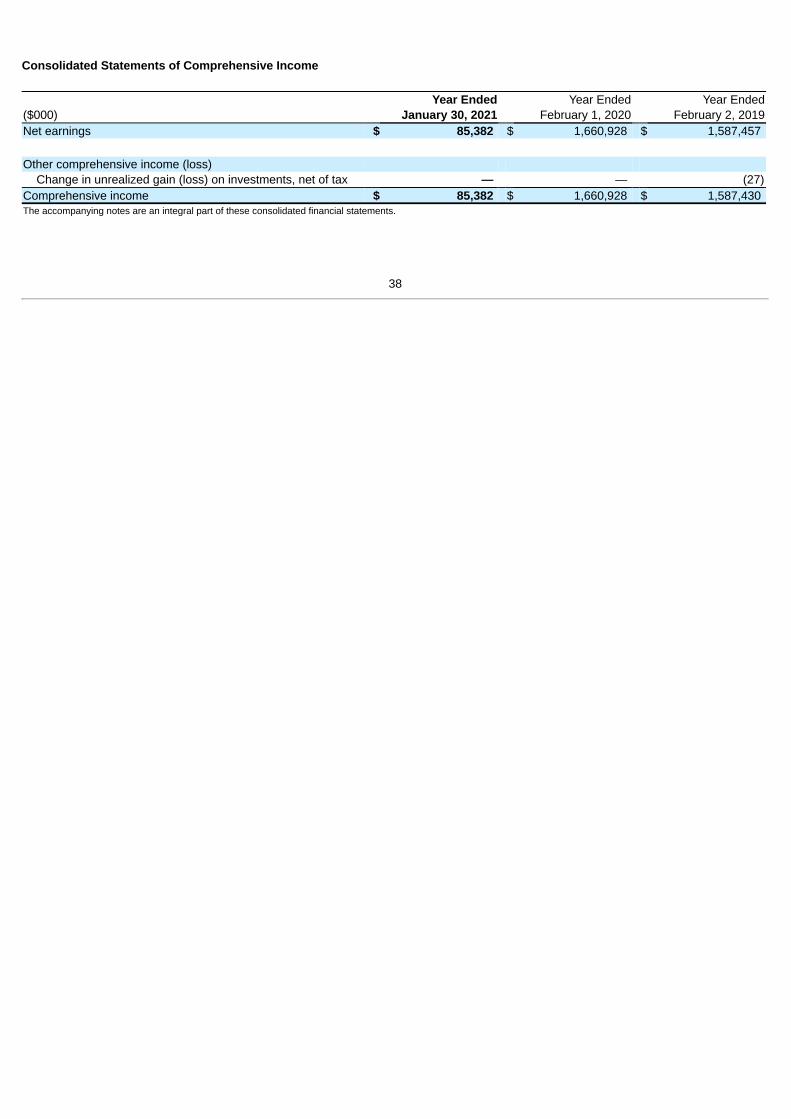
Consolidated Statements of Comprehensive Income
Year Ended Year Ended Year Ended($000) January 30, 2021 February 1, 2020 February 2, 2019Net earnings $ 85,382 $ 1,660,928 $ 1,587,457
Other comprehensive income (loss)Change in unrealized gain (loss) on investments, net of tax — — (27)
Comprehensive income $ 85,382 $ 1,660,928 $ 1,587,430 The accompanying notes are an integral part of these consolidated financial statements.
38
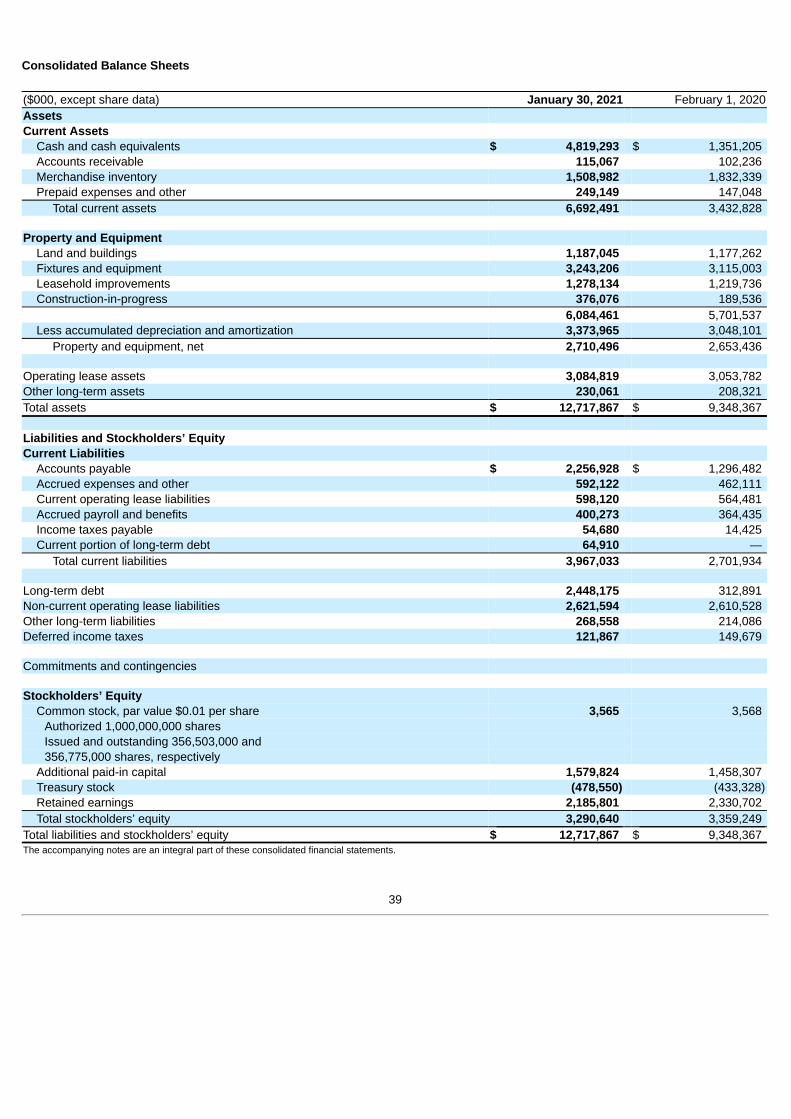
Consolidated Balance Sheets
($000, except share data) January 30, 2021 February 1, 2020AssetsCurrent Assets
Cash and cash equivalents $ 4,819,293 $ 1,351,205 Accounts receivable 115,067 102,236 Merchandise inventory 1,508,982 1,832,339 Prepaid expenses and other 249,149 147,048
Total current assets 6,692,491 3,432,828
Property and EquipmentLand and buildings 1,187,045 1,177,262 Fixtures and equipment 3,243,206 3,115,003 Leasehold improvements 1,278,134 1,219,736 Construction-in-progress 376,076 189,536
6,084,461 5,701,537 Less accumulated depreciation and amortization 3,373,965 3,048,101
Property and equipment, net 2,710,496 2,653,436
Operating lease assets 3,084,819 3,053,782 Other long-term assets 230,061 208,321 Total assets $ 12,717,867 $ 9,348,367
Liabilities and Stockholders’ EquityCurrent Liabilities
Accounts payable $ 2,256,928 $ 1,296,482 Accrued expenses and other 592,122 462,111 Current operating lease liabilities 598,120 564,481 Accrued payroll and benefits 400,273 364,435 Income taxes payable 54,680 14,425 Current portion of long-term debt 64,910 —
Total current liabilities 3,967,033 2,701,934
Long-term debt 2,448,175 312,891 Non-current operating lease liabilities 2,621,594 2,610,528 Other long-term liabilities 268,558 214,086 Deferred income taxes 121,867 149,679
Commitments and contingencies
Stockholders’ EquityCommon stock, par value $0.01 per share 3,565 3,568
Authorized 1,000,000,000 sharesIssued and outstanding 356,503,000 and356,775,000 shares, respectively
Additional paid-in capital 1,579,824 1,458,307 Treasury stock (478,550) (433,328)Retained earnings 2,185,801 2,330,702 Total stockholders’ equity 3,290,640 3,359,249
Total liabilities and stockholders’ equity $ 12,717,867 $ 9,348,367 The accompanying notes are an integral part of these consolidated financial statements.
39
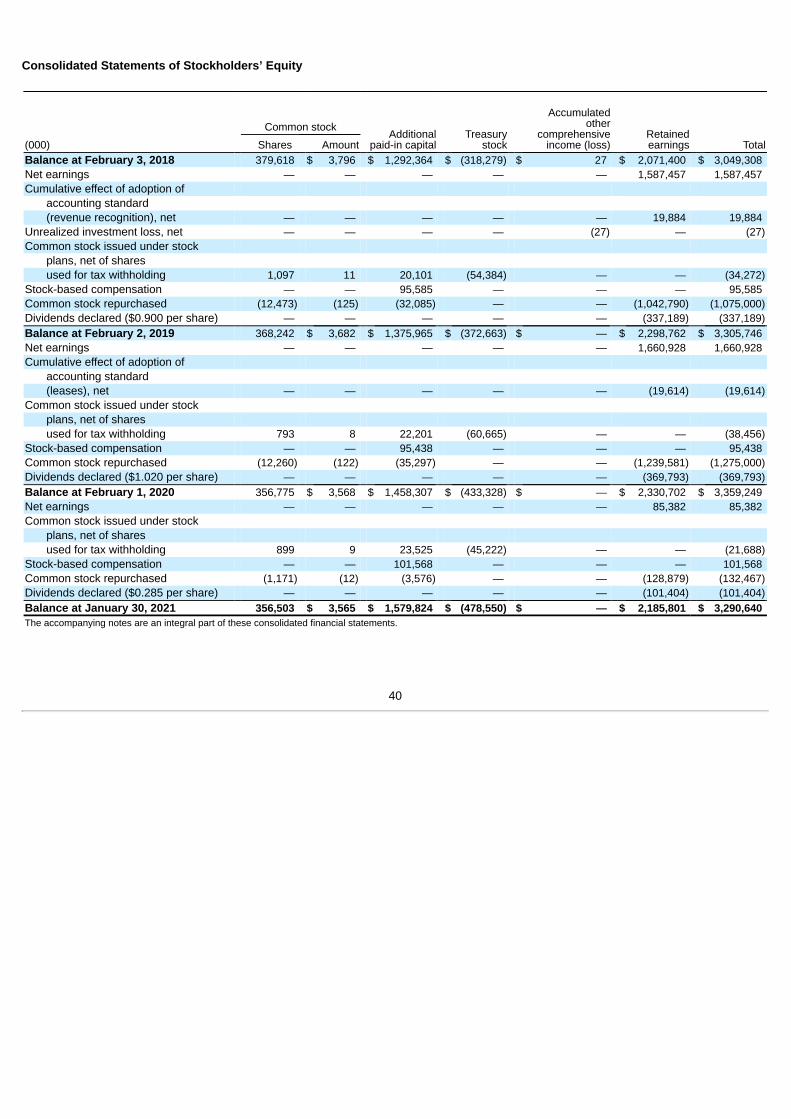
Consolidated Statements of Stockholders’ Equity
Additionalpaid-in capital
Accumulatedother
comprehensiveincome (loss)
Common stockTreasury
stockRetainedearnings(000) Shares Amount Total
Balance at February 3, 2018 379,618 $ 3,796 $ 1,292,364 $ (318,279) $ 27 $ 2,071,400 $ 3,049,308 Net earnings — — — — — 1,587,457 1,587,457 Cumulative effect of adoption of
accounting standard(revenue recognition), net — — — — — 19,884 19,884
Unrealized investment loss, net — — — — (27) — (27)Common stock issued under stock
plans, net of sharesused for tax withholding 1,097 11 20,101 (54,384) — — (34,272)
Stock-based compensation — — 95,585 — — — 95,585 Common stock repurchased (12,473) (125) (32,085) — — (1,042,790) (1,075,000)Dividends declared ($0.900 per share) — — — — — (337,189) (337,189)Balance at February 2, 2019 368,242 $ 3,682 $ 1,375,965 $ (372,663) $ — $ 2,298,762 $ 3,305,746 Net earnings — — — — — 1,660,928 1,660,928 Cumulative effect of adoption of
accounting standard(leases), net — — — — — (19,614) (19,614)
Common stock issued under stockplans, net of sharesused for tax withholding 793 8 22,201 (60,665) — — (38,456)
Stock-based compensation — — 95,438 — — — 95,438 Common stock repurchased (12,260) (122) (35,297) — — (1,239,581) (1,275,000)Dividends declared ($1.020 per share) — — — — — (369,793) (369,793)Balance at February 1, 2020 356,775 $ 3,568 $ 1,458,307 $ (433,328) $ — $ 2,330,702 $ 3,359,249 Net earnings — — — — — 85,382 85,382 Common stock issued under stock
plans, net of sharesused for tax withholding 899 9 23,525 (45,222) — — (21,688)
Stock-based compensation — — 101,568 — — — 101,568 Common stock repurchased (1,171) (12) (3,576) — — (128,879) (132,467)Dividends declared ($0.285 per share) — — — — — (101,404) (101,404)Balance at January 30, 2021 356,503 $ 3,565 $ 1,579,824 $ (478,550) $ — $ 2,185,801 $ 3,290,640 The accompanying notes are an integral part of these consolidated financial statements.
40
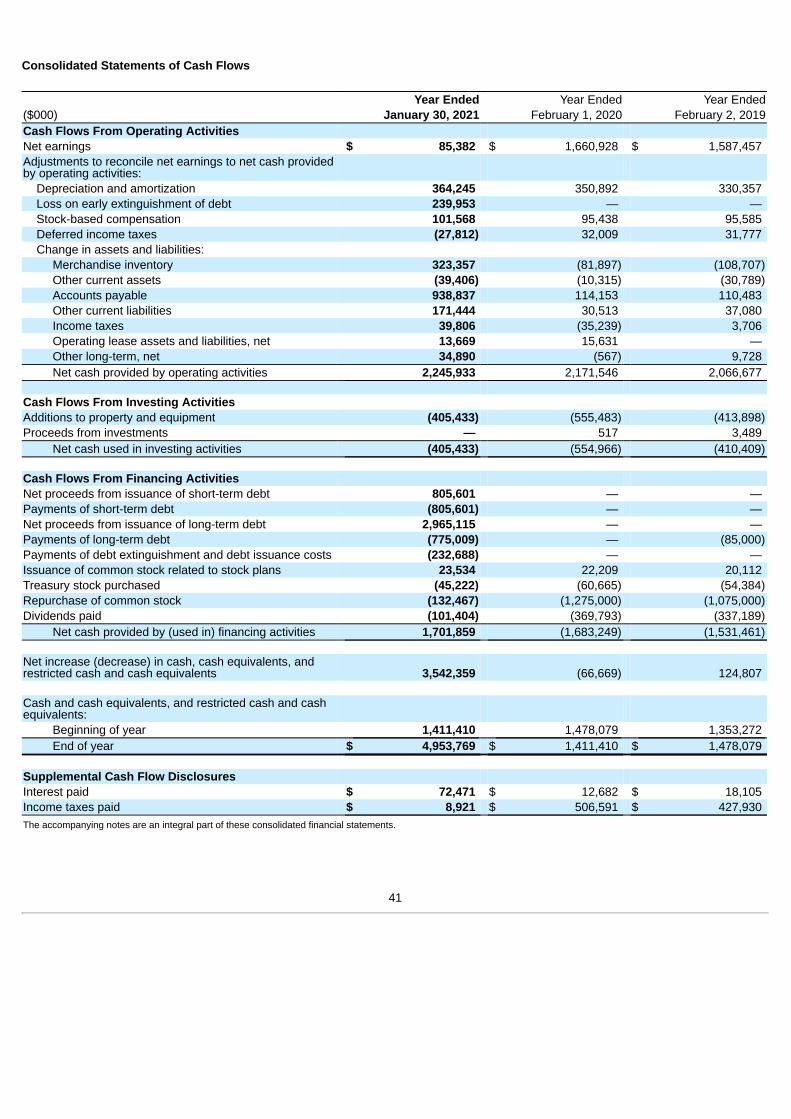
Consolidated Statements of Cash Flows
Year Ended Year Ended Year Ended($000) January 30, 2021 February 1, 2020 February 2, 2019Cash Flows From Operating ActivitiesNet earnings $ 85,382 $ 1,660,928 $ 1,587,457 Adjustments to reconcile net earnings to net cash providedby operating activities:
Depreciation and amortization 364,245 350,892 330,357 Loss on early extinguishment of debt 239,953 — — Stock-based compensation 101,568 95,438 95,585 Deferred income taxes (27,812) 32,009 31,777 Change in assets and liabilities:
Merchandise inventory 323,357 (81,897) (108,707)Other current assets (39,406) (10,315) (30,789)Accounts payable 938,837 114,153 110,483 Other current liabilities 171,444 30,513 37,080 Income taxes 39,806 (35,239) 3,706 Operating lease assets and liabilities, net 13,669 15,631 — Other long-term, net 34,890 (567) 9,728 Net cash provided by operating activities 2,245,933 2,171,546 2,066,677
Cash Flows From Investing ActivitiesAdditions to property and equipment (405,433) (555,483) (413,898)Proceeds from investments — 517 3,489
Net cash used in investing activities (405,433) (554,966) (410,409)
Cash Flows From Financing ActivitiesNet proceeds from issuance of short-term debt 805,601 — — Payments of short-term debt (805,601) — — Net proceeds from issuance of long-term debt 2,965,115 — — Payments of long-term debt (775,009) — (85,000)Payments of debt extinguishment and debt issuance costs (232,688) — — Issuance of common stock related to stock plans 23,534 22,209 20,112 Treasury stock purchased (45,222) (60,665) (54,384)Repurchase of common stock (132,467) (1,275,000) (1,075,000)Dividends paid (101,404) (369,793) (337,189)
Net cash provided by (used in) financing activities 1,701,859 (1,683,249) (1,531,461)
Net increase (decrease) in cash, cash equivalents, andrestricted cash and cash equivalents 3,542,359 (66,669) 124,807
Cash and cash equivalents, and restricted cash and cashequivalents:
Beginning of year 1,411,410 1,478,079 1,353,272 End of year $ 4,953,769 $ 1,411,410 $ 1,478,079
Supplemental Cash Flow DisclosuresInterest paid $ 72,471 $ 12,682 $ 18,105 Income taxes paid $ 8,921 $ 506,591 $ 427,930 The accompanying notes are an integral part of these consolidated financial statements.
41
Notes to Consolidated Financial Statements
Note A: Summary of Significant Accounting Policies
Business. Ross Stores, Inc. and its subsidiaries (the “Company”) is an off-price retailer of first-quality, in-season, name brand and designerapparel, accessories, footwear, and home fashions for the entire family. At the end of fiscal 2020, the Company operated 1,585 Ross Dressfor Less (“Ross”) locations in 40 states, the District of Columbia, and Guam, and 274 dd’s DISCOUNTS stores in 21 states. The Ross anddd’s DISCOUNTS stores are supported by the Company’s headquarters, buying offices, and its network of distribution centers/warehouses.
Segment reporting. The Company has one reportable segment. The Company’s operations include only activities related to off-priceretailing in stores throughout the United States.
Basis of presentation and fiscal year. The consolidated financial statements include the accounts of the Company and its subsidiaries, allof which are wholly-owned. Intercompany transactions and accounts have been eliminated. The Company follows the National RetailFederation fiscal calendar and utilizes a 52-53 week fiscal year whereby the fiscal year ends on the Saturday nearest to January 31. Thefiscal years ended January 30, 2021, February 1, 2020 and February 2, 2019 are referred to as fiscal 2020, fiscal 2019, and fiscal 2018,respectively, and were 52-week years.
Use of accounting estimates. The preparation of consolidated financial statements in conformity with Generally Accepted AccountingPrinciples in the United States of America (“GAAP”) requires the Company to make estimates and assumptions that affect the reportedamounts of assets, liabilities, and disclosures of contingent assets and liabilities at the date of the consolidated financial statements and thereported amounts of revenue and expenses during the reporting period. The Company’s significant accounting estimates include valuationreserves for inventory, packaway inventory costs, useful lives of fixed assets, insurance reserves, reserves for uncertain tax positions,employee retention credits under the Coronavirus Aid, Relief, and Economic Security Act (the “CARES Act”), and legal claims. Given theglobal economic climate and additional, or unforeseen effects, from the COVID-19 pandemic, these estimates are more challenging, andactual results could differ materially from the Company’s estimates.
Purchase obligations. As of January 30, 2021, the Company had purchase obligations of approximately $3.1 billion. These purchaseobligations primarily consist of merchandise inventory purchase orders, commitments related to construction projects, store fixtures andsupplies, and information technology services, transportation, and maintenance contracts.
Cash and cash equivalents. Cash equivalents consist of highly liquid, fixed income instruments purchased with an original maturity of threemonths or less.
Restricted cash, cash equivalents, and investments. Restricted cash, cash equivalents, and investments serve as collateral for certaininsurance and trade payable obligations of the Company. These restricted funds are invested in bank deposits, money market mutual funds,U.S. Government and agency securities, and corporate securities and cannot be withdrawn from the Company’s account without the priorwritten consent of the secured parties. The classification between current and long-term is based on the timing of expected payments of theobligations.
® ®
42
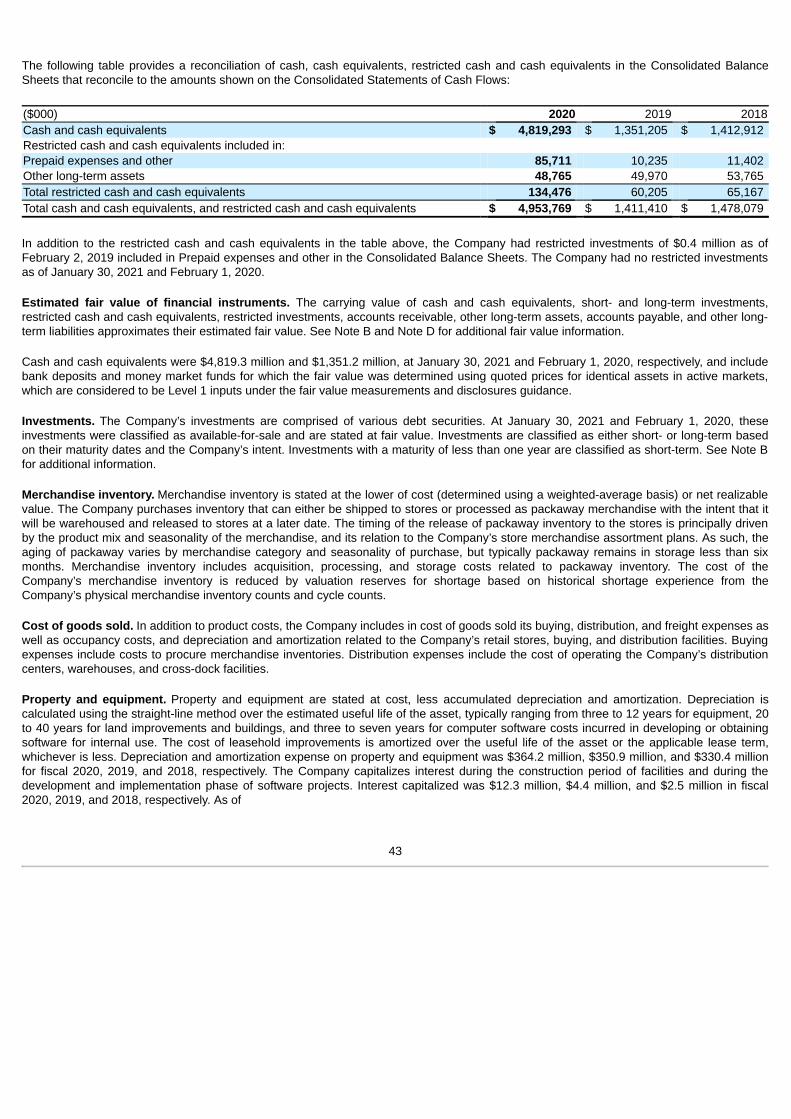
The following table provides a reconciliation of cash, cash equivalents, restricted cash and cash equivalents in the Consolidated BalanceSheets that reconcile to the amounts shown on the Consolidated Statements of Cash Flows:
($000) 2020 2019 2018Cash and cash equivalents $ 4,819,293 $ 1,351,205 $ 1,412,912 Restricted cash and cash equivalents included in:Prepaid expenses and other 85,711 10,235 11,402 Other long-term assets 48,765 49,970 53,765 Total restricted cash and cash equivalents 134,476 60,205 65,167 Total cash and cash equivalents, and restricted cash and cash equivalents $ 4,953,769 $ 1,411,410 $ 1,478,079
In addition to the restricted cash and cash equivalents in the table above, the Company had restricted investments of $0.4 million as ofFebruary 2, 2019 included in Prepaid expenses and other in the Consolidated Balance Sheets. The Company had no restricted investmentsas of January 30, 2021 and February 1, 2020.
Estimated fair value of financial instruments. The carrying value of cash and cash equivalents, short- and long-term investments,restricted cash and cash equivalents, restricted investments, accounts receivable, other long-term assets, accounts payable, and other long-term liabilities approximates their estimated fair value. See Note B and Note D for additional fair value information.
Cash and cash equivalents were $4,819.3 million and $1,351.2 million, at January 30, 2021 and February 1, 2020, respectively, and includebank deposits and money market funds for which the fair value was determined using quoted prices for identical assets in active markets,which are considered to be Level 1 inputs under the fair value measurements and disclosures guidance.
Investments. The Company’s investments are comprised of various debt securities. At January 30, 2021 and February 1, 2020, theseinvestments were classified as available-for-sale and are stated at fair value. Investments are classified as either short- or long-term basedon their maturity dates and the Company’s intent. Investments with a maturity of less than one year are classified as short-term. See Note Bfor additional information.
Merchandise inventory. Merchandise inventory is stated at the lower of cost (determined using a weighted-average basis) or net realizablevalue. The Company purchases inventory that can either be shipped to stores or processed as packaway merchandise with the intent that itwill be warehoused and released to stores at a later date. The timing of the release of packaway inventory to the stores is principally drivenby the product mix and seasonality of the merchandise, and its relation to the Company’s store merchandise assortment plans. As such, theaging of packaway varies by merchandise category and seasonality of purchase, but typically packaway remains in storage less than sixmonths. Merchandise inventory includes acquisition, processing, and storage costs related to packaway inventory. The cost of theCompany’s merchandise inventory is reduced by valuation reserves for shortage based on historical shortage experience from theCompany’s physical merchandise inventory counts and cycle counts.
Cost of goods sold. In addition to product costs, the Company includes in cost of goods sold its buying, distribution, and freight expenses aswell as occupancy costs, and depreciation and amortization related to the Company’s retail stores, buying, and distribution facilities. Buyingexpenses include costs to procure merchandise inventories. Distribution expenses include the cost of operating the Company’s distributioncenters, warehouses, and cross-dock facilities.
Property and equipment. Property and equipment are stated at cost, less accumulated depreciation and amortization. Depreciation iscalculated using the straight-line method over the estimated useful life of the asset, typically ranging from three to 12 years for equipment, 20to 40 years for land improvements and buildings, and three to seven years for computer software costs incurred in developing or obtainingsoftware for internal use. The cost of leasehold improvements is amortized over the useful life of the asset or the applicable lease term,whichever is less. Depreciation and amortization expense on property and equipment was $364.2 million, $350.9 million, and $330.4 millionfor fiscal 2020, 2019, and 2018, respectively. The Company capitalizes interest during the construction period of facilities and during thedevelopment and implementation phase of software projects. Interest capitalized was $12.3 million, $4.4 million, and $2.5 million in fiscal2020, 2019, and 2018, respectively. As of
43
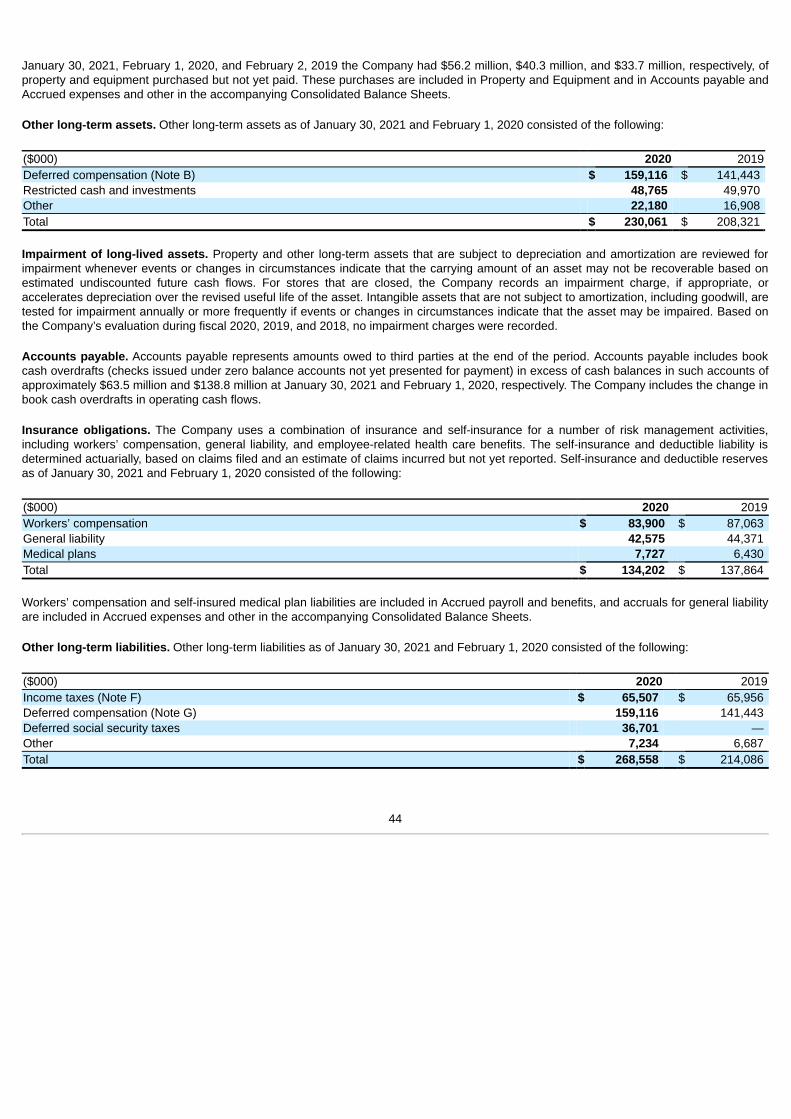
January 30, 2021, February 1, 2020, and February 2, 2019 the Company had $56.2 million, $40.3 million, and $33.7 million, respectively, ofproperty and equipment purchased but not yet paid. These purchases are included in Property and Equipment and in Accounts payable andAccrued expenses and other in the accompanying Consolidated Balance Sheets.
Other long-term assets. Other long-term assets as of January 30, 2021 and February 1, 2020 consisted of the following:
($000) 2020 2019Deferred compensation (Note B) $ 159,116 $ 141,443 Restricted cash and investments 48,765 49,970 Other 22,180 16,908 Total $ 230,061 $ 208,321
Impairment of long-lived assets. Property and other long-term assets that are subject to depreciation and amortization are reviewed forimpairment whenever events or changes in circumstances indicate that the carrying amount of an asset may not be recoverable based onestimated undiscounted future cash flows. For stores that are closed, the Company records an impairment charge, if appropriate, oraccelerates depreciation over the revised useful life of the asset. Intangible assets that are not subject to amortization, including goodwill, aretested for impairment annually or more frequently if events or changes in circumstances indicate that the asset may be impaired. Based onthe Company’s evaluation during fiscal 2020, 2019, and 2018, no impairment charges were recorded.
Accounts payable. Accounts payable represents amounts owed to third parties at the end of the period. Accounts payable includes bookcash overdrafts (checks issued under zero balance accounts not yet presented for payment) in excess of cash balances in such accounts ofapproximately $63.5 million and $138.8 million at January 30, 2021 and February 1, 2020, respectively. The Company includes the change inbook cash overdrafts in operating cash flows.
Insurance obligations. The Company uses a combination of insurance and self-insurance for a number of risk management activities,including workers’ compensation, general liability, and employee-related health care benefits. The self-insurance and deductible liability isdetermined actuarially, based on claims filed and an estimate of claims incurred but not yet reported. Self-insurance and deductible reservesas of January 30, 2021 and February 1, 2020 consisted of the following:
($000) 2020 2019Workers’ compensation $ 83,900 $ 87,063 General liability 42,575 44,371 Medical plans 7,727 6,430 Total $ 134,202 $ 137,864
Workers’ compensation and self-insured medical plan liabilities are included in Accrued payroll and benefits, and accruals for general liabilityare included in Accrued expenses and other in the accompanying Consolidated Balance Sheets.
Other long-term liabilities. Other long-term liabilities as of January 30, 2021 and February 1, 2020 consisted of the following:
($000) 2020 2019Income taxes (Note F) $ 65,507 $ 65,956 Deferred compensation (Note G) 159,116 141,443 Deferred social security taxes 36,701 — Other 7,234 6,687 Total $ 268,558 $ 214,086
44
Lease accounting. As the Company’s leases generally do not provide an implicit discount rate, the Company uses the estimatedcollateralized incremental borrowing rate based on information available at the lease commencement date in determining the present valueof lease payments for use in the calculation of the operating lease liabilities and right-of-use assets. This rate is determined using a portfolioapproach based on the risk-adjusted rate of interest and requires estimates and assumptions including credit rating, credit spread, andadjustments for the impact of collateral. The Company believes that this is the rate it would have to pay to borrow an amount equal to thelease payments on a collateralized basis over a similar lease term. Operating lease liabilities and corresponding right-of-use assets includeoptions to extend lease terms that are reasonably certain of being exercised. The Company does not record a lease liability andcorresponding right-of-use asset for leases with terms of 12 months or less, and accounts for lease and non-lease components as a singlelease component. The Company’s lease portfolio is comprised of operating leases with the lease cost recorded on a straight-line basis overthe lease term.
In response to the COVID-19 pandemic, the Financial Accounting Standards Board (“FASB”) provided relief under Accounting StandardsUpdate (“ASU”) 2016-02, Leases (Accounting Standards Codification “ASC” 842). Under this relief, companies can make a policy election onhow to treat lease concessions resulting directly from the COVID-19pandemic, provided that the modified contracts result in total cash flows that are substantially the same or less than the cash flows in theoriginal contract.
The Company made the policy election to account for lease concessions that result from the COVID-19 pandemic as if they were madeunder enforceable rights in the original contract. Additionally, the Company made the policy election to account for these concessions outsideof the lease modification framework described under ASC 842. The Company recorded accruals for deferred rental payments andrecognized rent abatements or concessions as variable lease costs in the periods incurred. Accruals for rent payment deferrals are includedin Accrued expenses and other in the accompanying Consolidated Balance Sheets.
Prior to the adoption of Accounting Standards Codification “ASC” 842 in the beginning of fiscal 2019, when a lease contained “rent holidays”or required fixed escalations of the minimum lease payments, the Company recorded rental expense on a straight-line basis over the term ofthe lease and the difference between the average rental amount was charged to expense and the amount payable under the lease wasrecorded as deferred rent. The Company began recording rent expense on the lease possession date. Tenant improvement allowances wereamortized over the lease term. Changes in deferred rent and tenant improvement allowances were included as a component of operatingactivities in the Consolidated Statements of Cash Flows.
Revenue recognition. The Company recognizes revenue at the point of sale, net of sales taxes collected and an allowance for estimatedfuture returns as required by ASU No. 2014-09, Revenue from Contracts with Customers (ASC 606). The Company recognizes allowancesfor estimated sales returns on a gross basis as a reduction to sales. The asset recorded for the expected recovery of merchandise inventorywas $10.7 million, $10.7 million, and $10.2 million and the liability recorded for the refund due to the customer was $21.2 million,$20.9 million, and $19.8 million as of January 30, 2021, February 1, 2020, and February 2, 2019, respectively. Sales taxes collected that areoutstanding and the allowance for estimated future returns are included in Accrued expenses and other and the asset for expected recoveryof merchandise is included in Prepaid expenses and other in the Consolidated Balance Sheets.
Sales of stored value cards are deferred until they are redeemed for the purchase of Company merchandise. The Company’s stored valuecards do not have expiration dates. Based upon historical redemption rates, a small percentage of stored value cards will never beredeemed, which represents breakage. As a result of adopting ASC 606, breakage is estimated and recognized as revenue based upon thehistorical pattern of customer redemptions. Breakage was not material to the consolidated financial statements in fiscal 2020, 2019, and2018.
45
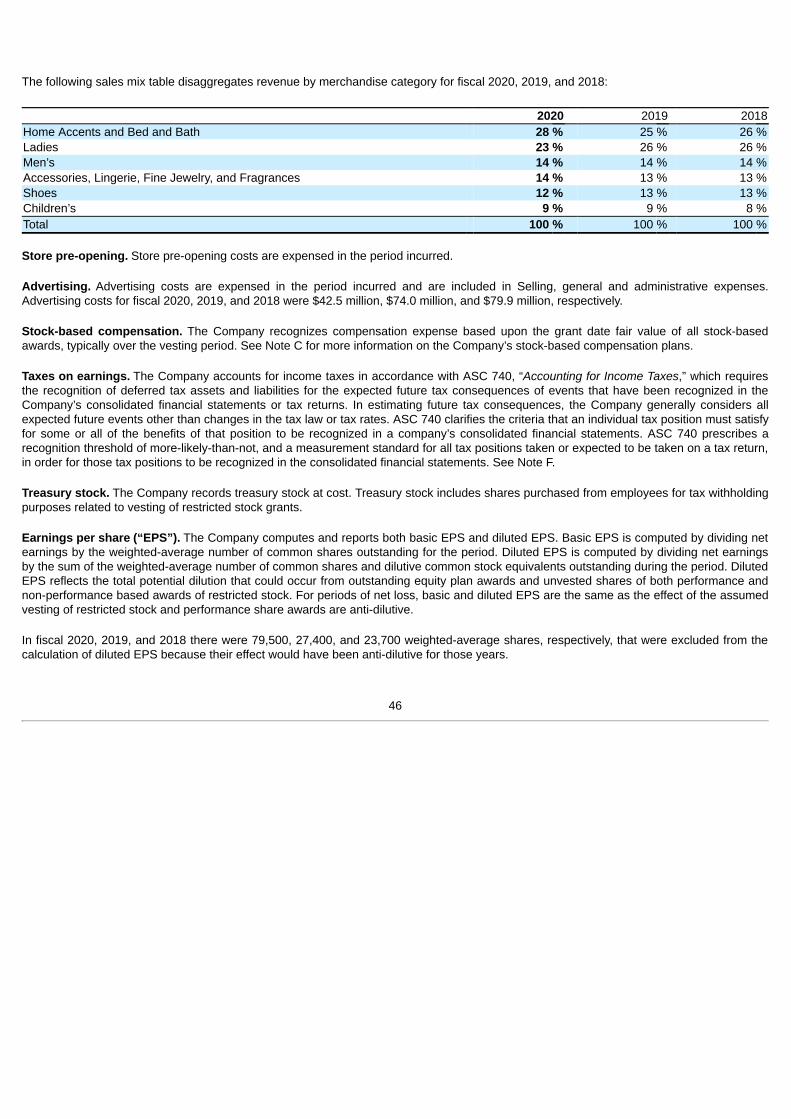
The following sales mix table disaggregates revenue by merchandise category for fiscal 2020, 2019, and 2018:
2020 2019 2018Home Accents and Bed and Bath 28 % 25 % 26 %Ladies 23 % 26 % 26 %Men’s 14 % 14 % 14 %Accessories, Lingerie, Fine Jewelry, and Fragrances 14 % 13 % 13 %Shoes 12 % 13 % 13 %Children’s 9 % 9 % 8 %Total 100 % 100 % 100 %
Store pre-opening. Store pre-opening costs are expensed in the period incurred.
Advertising. Advertising costs are expensed in the period incurred and are included in Selling, general and administrative expenses.Advertising costs for fiscal 2020, 2019, and 2018 were $42.5 million, $74.0 million, and $79.9 million, respectively.
Stock-based compensation. The Company recognizes compensation expense based upon the grant date fair value of all stock-basedawards, typically over the vesting period. See Note C for more information on the Company’s stock-based compensation plans.
Taxes on earnings. The Company accounts for income taxes in accordance with ASC 740, “Accounting for Income Taxes,” which requiresthe recognition of deferred tax assets and liabilities for the expected future tax consequences of events that have been recognized in theCompany’s consolidated financial statements or tax returns. In estimating future tax consequences, the Company generally considers allexpected future events other than changes in the tax law or tax rates. ASC 740 clarifies the criteria that an individual tax position must satisfyfor some or all of the benefits of that position to be recognized in a company’s consolidated financial statements. ASC 740 prescribes arecognition threshold of more-likely-than-not, and a measurement standard for all tax positions taken or expected to be taken on a tax return,in order for those tax positions to be recognized in the consolidated financial statements. See Note F.
Treasury stock. The Company records treasury stock at cost. Treasury stock includes shares purchased from employees for tax withholdingpurposes related to vesting of restricted stock grants.
Earnings per share (“EPS”). The Company computes and reports both basic EPS and diluted EPS. Basic EPS is computed by dividing netearnings by the weighted-average number of common shares outstanding for the period. Diluted EPS is computed by dividing net earningsby the sum of the weighted-average number of common shares and dilutive common stock equivalents outstanding during the period. DilutedEPS reflects the total potential dilution that could occur from outstanding equity plan awards and unvested shares of both performance andnon-performance based awards of restricted stock. For periods of net loss, basic and diluted EPS are the same as the effect of the assumedvesting of restricted stock and performance share awards are anti-dilutive.
In fiscal 2020, 2019, and 2018 there were 79,500, 27,400, and 23,700 weighted-average shares, respectively, that were excluded from thecalculation of diluted EPS because their effect would have been anti-dilutive for those years.
1
46
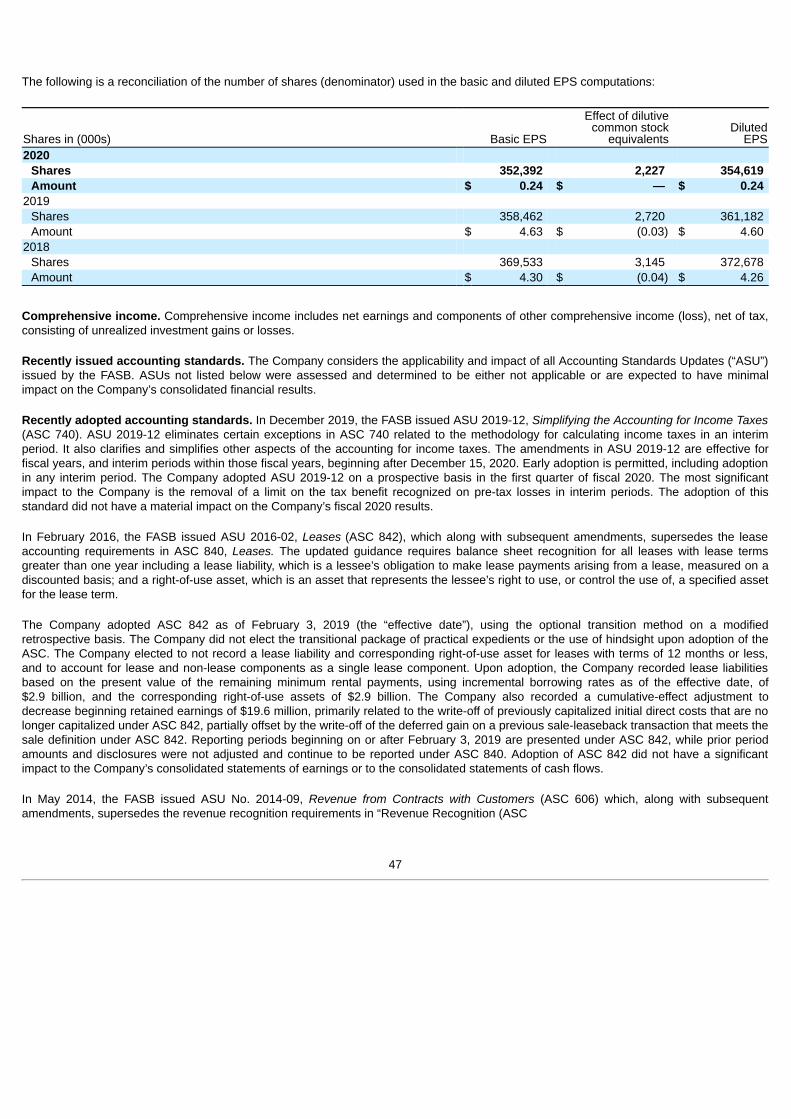
The following is a reconciliation of the number of shares (denominator) used in the basic and diluted EPS computations:
Shares in (000s) Basic EPS
Effect of dilutivecommon stock
equivalentsDiluted
EPS2020
Shares 352,392 2,227 354,619 Amount $ 0.24 $ — $ 0.24
2019Shares 358,462 2,720 361,182 Amount $ 4.63 $ (0.03) $ 4.60
2018Shares 369,533 3,145 372,678 Amount $ 4.30 $ (0.04) $ 4.26
Comprehensive income. Comprehensive income includes net earnings and components of other comprehensive income (loss), net of tax,consisting of unrealized investment gains or losses.
Recently issued accounting standards. The Company considers the applicability and impact of all Accounting Standards Updates (“ASU”)issued by the FASB. ASUs not listed below were assessed and determined to be either not applicable or are expected to have minimalimpact on the Company’s consolidated financial results.
Recently adopted accounting standards. In December 2019, the FASB issued ASU 2019-12, Simplifying the Accounting for Income Taxes(ASC 740). ASU 2019-12 eliminates certain exceptions in ASC 740 related to the methodology for calculating income taxes in an interimperiod. It also clarifies and simplifies other aspects of the accounting for income taxes. The amendments in ASU 2019-12 are effective forfiscal years, and interim periods within those fiscal years, beginning after December 15, 2020. Early adoption is permitted, including adoptionin any interim period. The Company adopted ASU 2019-12 on a prospective basis in the first quarter of fiscal 2020. The most significantimpact to the Company is the removal of a limit on the tax benefit recognized on pre-tax losses in interim periods. The adoption of thisstandard did not have a material impact on the Company’s fiscal 2020 results.
In February 2016, the FASB issued ASU 2016-02, Leases (ASC 842), which along with subsequent amendments, supersedes the leaseaccounting requirements in ASC 840, Leases. The updated guidance requires balance sheet recognition for all leases with lease termsgreater than one year including a lease liability, which is a lessee’s obligation to make lease payments arising from a lease, measured on adiscounted basis; and a right-of-use asset, which is an asset that represents the lessee’s right to use, or control the use of, a specified assetfor the lease term.
The Company adopted ASC 842 as of February 3, 2019 (the “effective date”), using the optional transition method on a modifiedretrospective basis. The Company did not elect the transitional package of practical expedients or the use of hindsight upon adoption of theASC. The Company elected to not record a lease liability and corresponding right-of-use asset for leases with terms of 12 months or less,and to account for lease and non-lease components as a single lease component. Upon adoption, the Company recorded lease liabilitiesbased on the present value of the remaining minimum rental payments, using incremental borrowing rates as of the effective date, of$2.9 billion, and the corresponding right-of-use assets of $2.9 billion. The Company also recorded a cumulative-effect adjustment todecrease beginning retained earnings of $19.6 million, primarily related to the write-off of previously capitalized initial direct costs that are nolonger capitalized under ASC 842, partially offset by the write-off of the deferred gain on a previous sale-leaseback transaction that meets thesale definition under ASC 842. Reporting periods beginning on or after February 3, 2019 are presented under ASC 842, while prior periodamounts and disclosures were not adjusted and continue to be reported under ASC 840. Adoption of ASC 842 did not have a significantimpact to the Company’s consolidated statements of earnings or to the consolidated statements of cash flows.
In May 2014, the FASB issued ASU No. 2014-09, Revenue from Contracts with Customers (ASC 606) which, along with subsequentamendments, supersedes the revenue recognition requirements in “Revenue Recognition (ASC
47
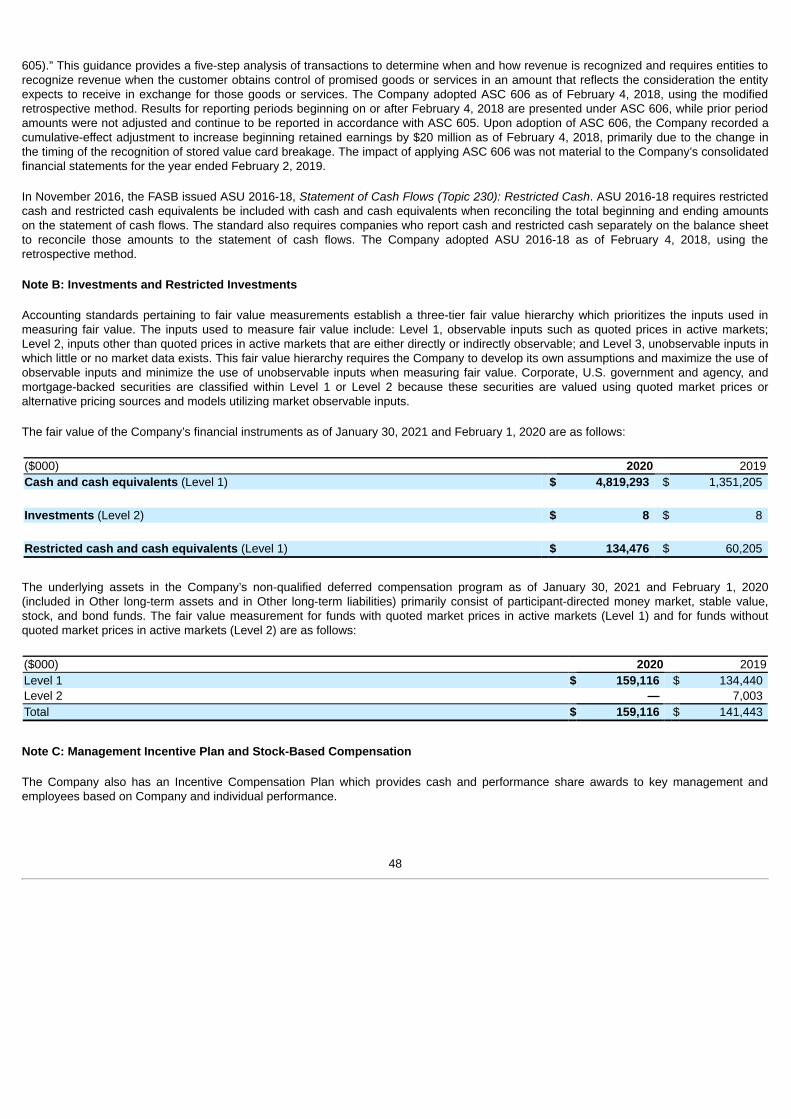
605).” This guidance provides a five-step analysis of transactions to determine when and how revenue is recognized and requires entities torecognize revenue when the customer obtains control of promised goods or services in an amount that reflects the consideration the entityexpects to receive in exchange for those goods or services. The Company adopted ASC 606 as of February 4, 2018, using the modifiedretrospective method. Results for reporting periods beginning on or after February 4, 2018 are presented under ASC 606, while prior periodamounts were not adjusted and continue to be reported in accordance with ASC 605. Upon adoption of ASC 606, the Company recorded acumulative-effect adjustment to increase beginning retained earnings by $20 million as of February 4, 2018, primarily due to the change inthe timing of the recognition of stored value card breakage. The impact of applying ASC 606 was not material to the Company’s consolidatedfinancial statements for the year ended February 2, 2019.
In November 2016, the FASB issued ASU 2016-18, Statement of Cash Flows (Topic 230): Restricted Cash. ASU 2016-18 requires restrictedcash and restricted cash equivalents be included with cash and cash equivalents when reconciling the total beginning and ending amountson the statement of cash flows. The standard also requires companies who report cash and restricted cash separately on the balance sheetto reconcile those amounts to the statement of cash flows. The Company adopted ASU 2016-18 as of February 4, 2018, using theretrospective method.
Note B: Investments and Restricted Investments
Accounting standards pertaining to fair value measurements establish a three-tier fair value hierarchy which prioritizes the inputs used inmeasuring fair value. The inputs used to measure fair value include: Level 1, observable inputs such as quoted prices in active markets;Level 2, inputs other than quoted prices in active markets that are either directly or indirectly observable; and Level 3, unobservable inputs inwhich little or no market data exists. This fair value hierarchy requires the Company to develop its own assumptions and maximize the use ofobservable inputs and minimize the use of unobservable inputs when measuring fair value. Corporate, U.S. government and agency, andmortgage-backed securities are classified within Level 1 or Level 2 because these securities are valued using quoted market prices oralternative pricing sources and models utilizing market observable inputs.
The fair value of the Company’s financial instruments as of January 30, 2021 and February 1, 2020 are as follows:
($000) 2020 2019Cash and cash equivalents (Level 1) $ 4,819,293 $ 1,351,205
Investments (Level 2) $ 8 $ 8
Restricted cash and cash equivalents (Level 1) $ 134,476 $ 60,205
The underlying assets in the Company’s non-qualified deferred compensation program as of January 30, 2021 and February 1, 2020(included in Other long-term assets and in Other long-term liabilities) primarily consist of participant-directed money market, stable value,stock, and bond funds. The fair value measurement for funds with quoted market prices in active markets (Level 1) and for funds withoutquoted market prices in active markets (Level 2) are as follows:
($000) 2020 2019Level 1 $ 159,116 $ 134,440 Level 2 — 7,003 Total $ 159,116 $ 141,443
Note C: Management Incentive Plan and Stock-Based Compensation
The Company also has an Incentive Compensation Plan which provides cash and performance share awards to key management andemployees based on Company and individual performance.
48
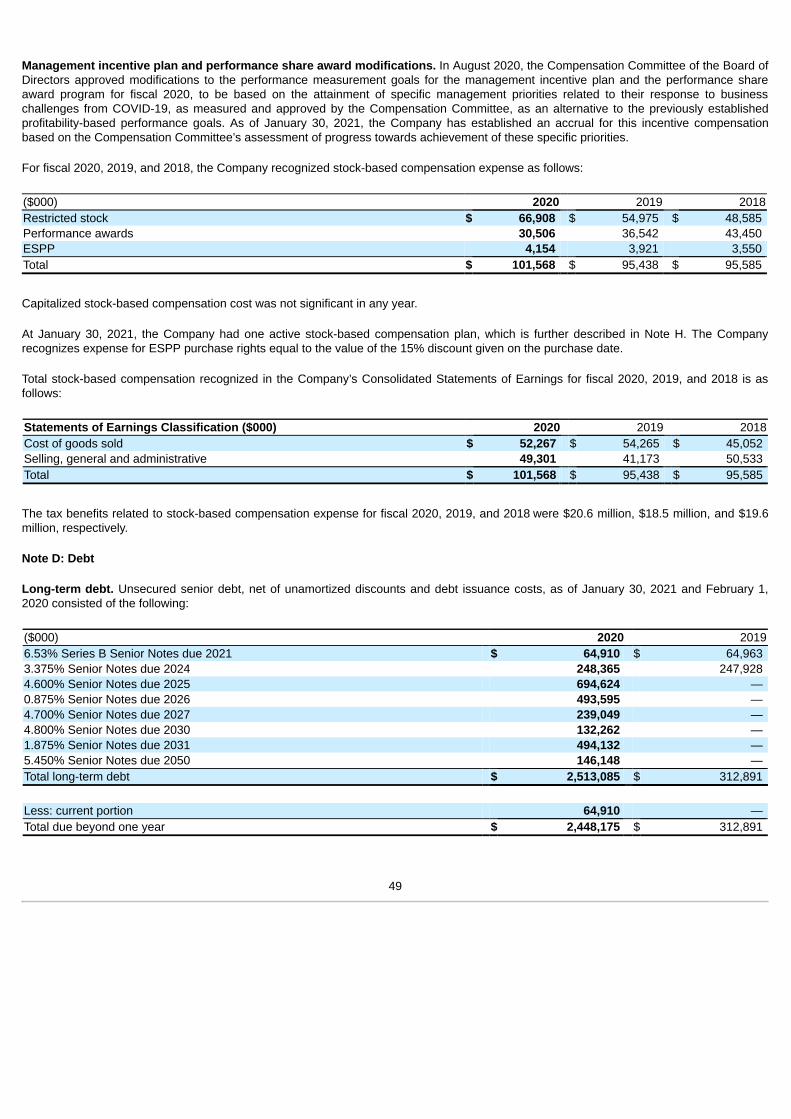
Management incentive plan and performance share award modifications. In August 2020, the Compensation Committee of the Board ofDirectors approved modifications to the performance measurement goals for the management incentive plan and the performance shareaward program for fiscal 2020, to be based on the attainment of specific management priorities related to their response to businesschallenges from COVID-19, as measured and approved by the Compensation Committee, as an alternative to the previously establishedprofitability-based performance goals. As of January 30, 2021, the Company has established an accrual for this incentive compensationbased on the Compensation Committee’s assessment of progress towards achievement of these specific priorities.
For fiscal 2020, 2019, and 2018, the Company recognized stock-based compensation expense as follows:
($000) 2020 2019 2018Restricted stock $ 66,908 $ 54,975 $ 48,585 Performance awards 30,506 36,542 43,450 ESPP 4,154 3,921 3,550 Total $ 101,568 $ 95,438 $ 95,585
Capitalized stock-based compensation cost was not significant in any year.
At January 30, 2021, the Company had one active stock-based compensation plan, which is further described in Note H. The Companyrecognizes expense for ESPP purchase rights equal to the value of the 15% discount given on the purchase date.
Total stock-based compensation recognized in the Company’s Consolidated Statements of Earnings for fiscal 2020, 2019, and 2018 is asfollows:
Statements of Earnings Classification ($000) 2020 2019 2018Cost of goods sold $ 52,267 $ 54,265 $ 45,052 Selling, general and administrative 49,301 41,173 50,533 Total $ 101,568 $ 95,438 $ 95,585
The tax benefits related to stock-based compensation expense for fiscal 2020, 2019, and 2018 were $20.6 million, $18.5 million, and $19.6million, respectively.
Note D: Debt
Long-term debt. Unsecured senior debt, net of unamortized discounts and debt issuance costs, as of January 30, 2021 and February 1,2020 consisted of the following:
($000) 2020 20196.53% Series B Senior Notes due 2021 $ 64,910 $ 64,963 3.375% Senior Notes due 2024 248,365 247,928 4.600% Senior Notes due 2025 694,624 — 0.875% Senior Notes due 2026 493,595 — 4.700% Senior Notes due 2027 239,049 — 4.800% Senior Notes due 2030 132,262 — 1.875% Senior Notes due 2031 494,132 — 5.450% Senior Notes due 2050 146,148 — Total long-term debt $ 2,513,085 $ 312,891
Less: current portion 64,910 — Total due beyond one year $ 2,448,175 $ 312,891
49
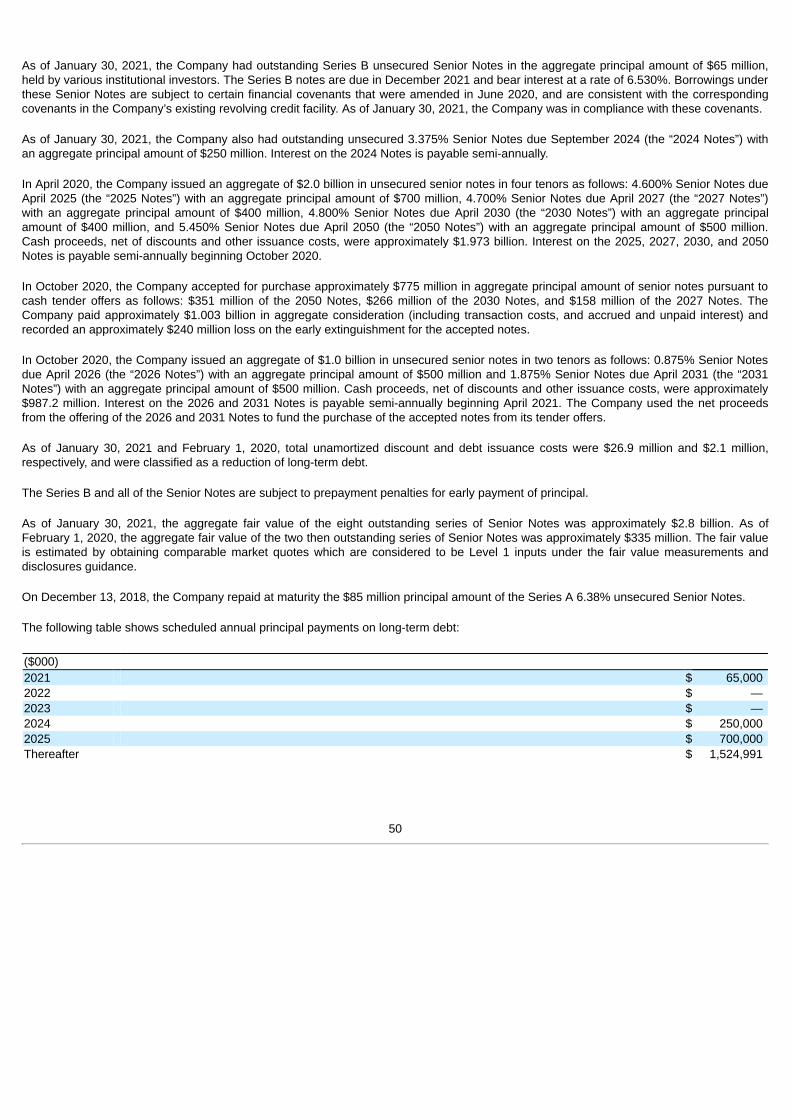
As of January 30, 2021, the Company had outstanding Series B unsecured Senior Notes in the aggregate principal amount of $65 million,held by various institutional investors. The Series B notes are due in December 2021 and bear interest at a rate of 6.530%. Borrowings underthese Senior Notes are subject to certain financial covenants that were amended in June 2020, and are consistent with the correspondingcovenants in the Company’s existing revolving credit facility. As of January 30, 2021, the Company was in compliance with these covenants.
As of January 30, 2021, the Company also had outstanding unsecured 3.375% Senior Notes due September 2024 (the “2024 Notes”) withan aggregate principal amount of $250 million. Interest on the 2024 Notes is payable semi-annually.
In April 2020, the Company issued an aggregate of $2.0 billion in unsecured senior notes in four tenors as follows: 4.600% Senior Notes dueApril 2025 (the “2025 Notes”) with an aggregate principal amount of $700 million, 4.700% Senior Notes due April 2027 (the “2027 Notes”)with an aggregate principal amount of $400 million, 4.800% Senior Notes due April 2030 (the “2030 Notes”) with an aggregate principalamount of $400 million, and 5.450% Senior Notes due April 2050 (the “2050 Notes”) with an aggregate principal amount of $500 million.Cash proceeds, net of discounts and other issuance costs, were approximately $1.973 billion. Interest on the 2025, 2027, 2030, and 2050Notes is payable semi-annually beginning October 2020.
In October 2020, the Company accepted for purchase approximately $775 million in aggregate principal amount of senior notes pursuant tocash tender offers as follows: $351 million of the 2050 Notes, $266 million of the 2030 Notes, and $158 million of the 2027 Notes. TheCompany paid approximately $1.003 billion in aggregate consideration (including transaction costs, and accrued and unpaid interest) andrecorded an approximately $240 million loss on the early extinguishment for the accepted notes.
In October 2020, the Company issued an aggregate of $1.0 billion in unsecured senior notes in two tenors as follows: 0.875% Senior Notesdue April 2026 (the “2026 Notes”) with an aggregate principal amount of $500 million and 1.875% Senior Notes due April 2031 (the “2031Notes”) with an aggregate principal amount of $500 million. Cash proceeds, net of discounts and other issuance costs, were approximately$987.2 million. Interest on the 2026 and 2031 Notes is payable semi-annually beginning April 2021. The Company used the net proceedsfrom the offering of the 2026 and 2031 Notes to fund the purchase of the accepted notes from its tender offers.
As of January 30, 2021 and February 1, 2020, total unamortized discount and debt issuance costs were $26.9 million and $2.1 million,respectively, and were classified as a reduction of long-term debt.
The Series B and all of the Senior Notes are subject to prepayment penalties for early payment of principal.
As of January 30, 2021, the aggregate fair value of the eight outstanding series of Senior Notes was approximately $2.8 billion. As ofFebruary 1, 2020, the aggregate fair value of the two then outstanding series of Senior Notes was approximately $335 million. The fair valueis estimated by obtaining comparable market quotes which are considered to be Level 1 inputs under the fair value measurements anddisclosures guidance.
On December 13, 2018, the Company repaid at maturity the $85 million principal amount of the Series A 6.38% unsecured Senior Notes.
The following table shows scheduled annual principal payments on long-term debt:
($000)2021 $ 65,000 2022 $ — 2023 $ — 2024 $ 250,000 2025 $ 700,000 Thereafter $ 1,524,991
50
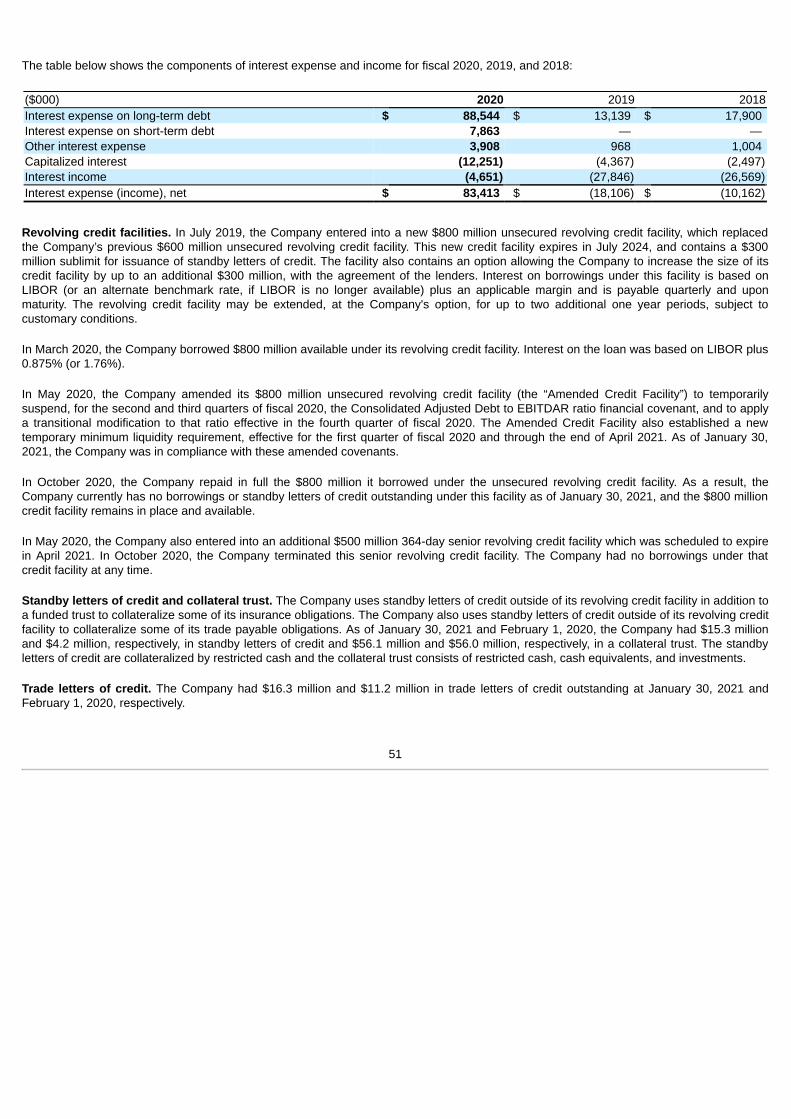
The table below shows the components of interest expense and income for fiscal 2020, 2019, and 2018:
($000) 2020 2019 2018Interest expense on long-term debt $ 88,544 $ 13,139 $ 17,900 Interest expense on short-term debt 7,863 — — Other interest expense 3,908 968 1,004 Capitalized interest (12,251) (4,367) (2,497)Interest income (4,651) (27,846) (26,569)Interest expense (income), net $ 83,413 $ (18,106) $ (10,162)
Revolving credit facilities. In July 2019, the Company entered into a new $800 million unsecured revolving credit facility, which replacedthe Company’s previous $600 million unsecured revolving credit facility. This new credit facility expires in July 2024, and contains a $300million sublimit for issuance of standby letters of credit. The facility also contains an option allowing the Company to increase the size of itscredit facility by up to an additional $300 million, with the agreement of the lenders. Interest on borrowings under this facility is based onLIBOR (or an alternate benchmark rate, if LIBOR is no longer available) plus an applicable margin and is payable quarterly and uponmaturity. The revolving credit facility may be extended, at the Company's option, for up to two additional one year periods, subject tocustomary conditions.
In March 2020, the Company borrowed $800 million available under its revolving credit facility. Interest on the loan was based on LIBOR plus0.875% (or 1.76%).
In May 2020, the Company amended its $800 million unsecured revolving credit facility (the “Amended Credit Facility”) to temporarilysuspend, for the second and third quarters of fiscal 2020, the Consolidated Adjusted Debt to EBITDAR ratio financial covenant, and to applya transitional modification to that ratio effective in the fourth quarter of fiscal 2020. The Amended Credit Facility also established a newtemporary minimum liquidity requirement, effective for the first quarter of fiscal 2020 and through the end of April 2021. As of January 30,2021, the Company was in compliance with these amended covenants.
In October 2020, the Company repaid in full the $800 million it borrowed under the unsecured revolving credit facility. As a result, theCompany currently has no borrowings or standby letters of credit outstanding under this facility as of January 30, 2021, and the $800 millioncredit facility remains in place and available.
In May 2020, the Company also entered into an additional $500 million 364-day senior revolving credit facility which was scheduled to expirein April 2021. In October 2020, the Company terminated this senior revolving credit facility. The Company had no borrowings under thatcredit facility at any time.
Standby letters of credit and collateral trust. The Company uses standby letters of credit outside of its revolving credit facility in addition toa funded trust to collateralize some of its insurance obligations. The Company also uses standby letters of credit outside of its revolving creditfacility to collateralize some of its trade payable obligations. As of January 30, 2021 and February 1, 2020, the Company had $15.3 millionand $4.2 million, respectively, in standby letters of credit and $56.1 million and $56.0 million, respectively, in a collateral trust. The standbyletters of credit are collateralized by restricted cash and the collateral trust consists of restricted cash, cash equivalents, and investments.
Trade letters of credit. The Company had $16.3 million and $11.2 million in trade letters of credit outstanding at January 30, 2021 andFebruary 1, 2020, respectively.
51
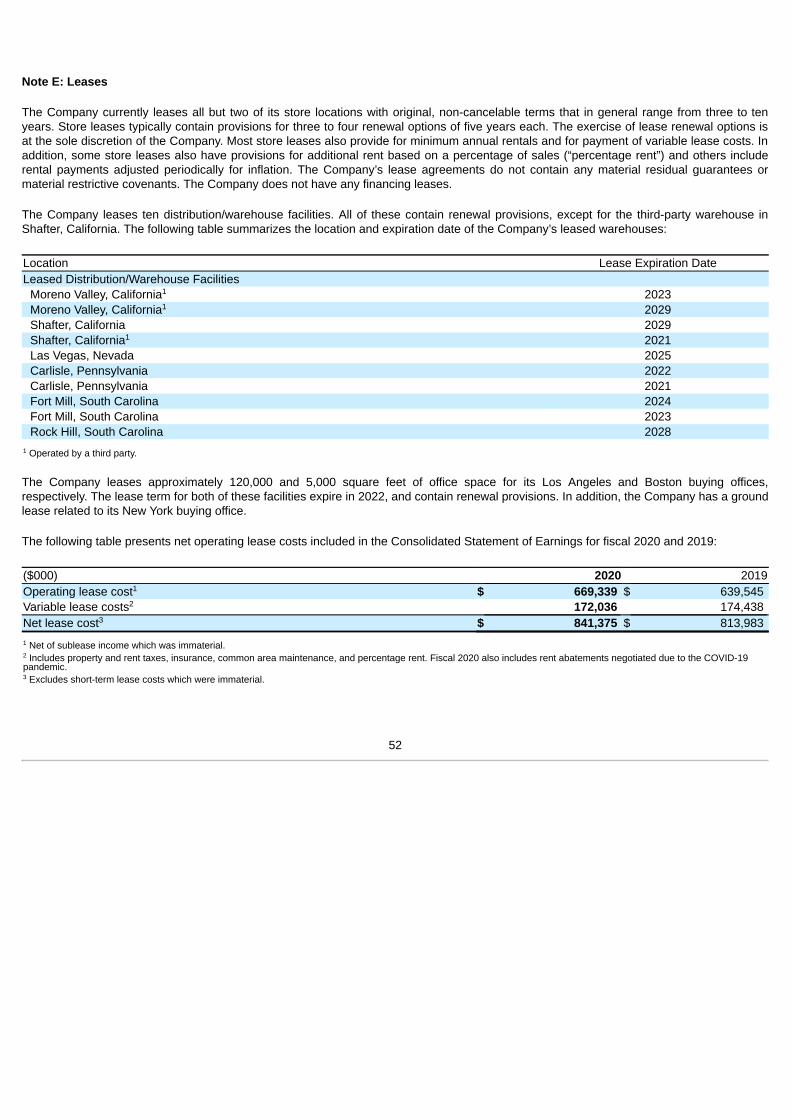
Note E: Leases
The Company currently leases all but two of its store locations with original, non-cancelable terms that in general range from three to tenyears. Store leases typically contain provisions for three to four renewal options of five years each. The exercise of lease renewal options isat the sole discretion of the Company. Most store leases also provide for minimum annual rentals and for payment of variable lease costs. Inaddition, some store leases also have provisions for additional rent based on a percentage of sales (“percentage rent”) and others includerental payments adjusted periodically for inflation. The Company’s lease agreements do not contain any material residual guarantees ormaterial restrictive covenants. The Company does not have any financing leases.
The Company leases ten distribution/warehouse facilities. All of these contain renewal provisions, except for the third-party warehouse inShafter, California. The following table summarizes the location and expiration date of the Company’s leased warehouses:
Location Lease Expiration DateLeased Distribution/Warehouse Facilities
Moreno Valley, California 2023Moreno Valley, California 2029Shafter, California 2029Shafter, California 2021Las Vegas, Nevada 2025Carlisle, Pennsylvania 2022Carlisle, Pennsylvania 2021Fort Mill, South Carolina 2024Fort Mill, South Carolina 2023Rock Hill, South Carolina 2028
Operated by a third party.
The Company leases approximately 120,000 and 5,000 square feet of office space for its Los Angeles and Boston buying offices,respectively. The lease term for both of these facilities expire in 2022, and contain renewal provisions. In addition, the Company has a groundlease related to its New York buying office.
The following table presents net operating lease costs included in the Consolidated Statement of Earnings for fiscal 2020 and 2019:
($000) 2020 2019Operating lease cost $ 669,339 $ 639,545 Variable lease costs 172,036 174,438 Net lease cost $ 841,375 $ 813,983
Net of sublease income which was immaterial. Includes property and rent taxes, insurance, common area maintenance, and percentage rent. Fiscal 2020 also includes rent abatements negotiated due to the COVID-19
pandemic. Excludes short-term lease costs which were immaterial.
1
1
1
1
1
2
3
1
2
3
52
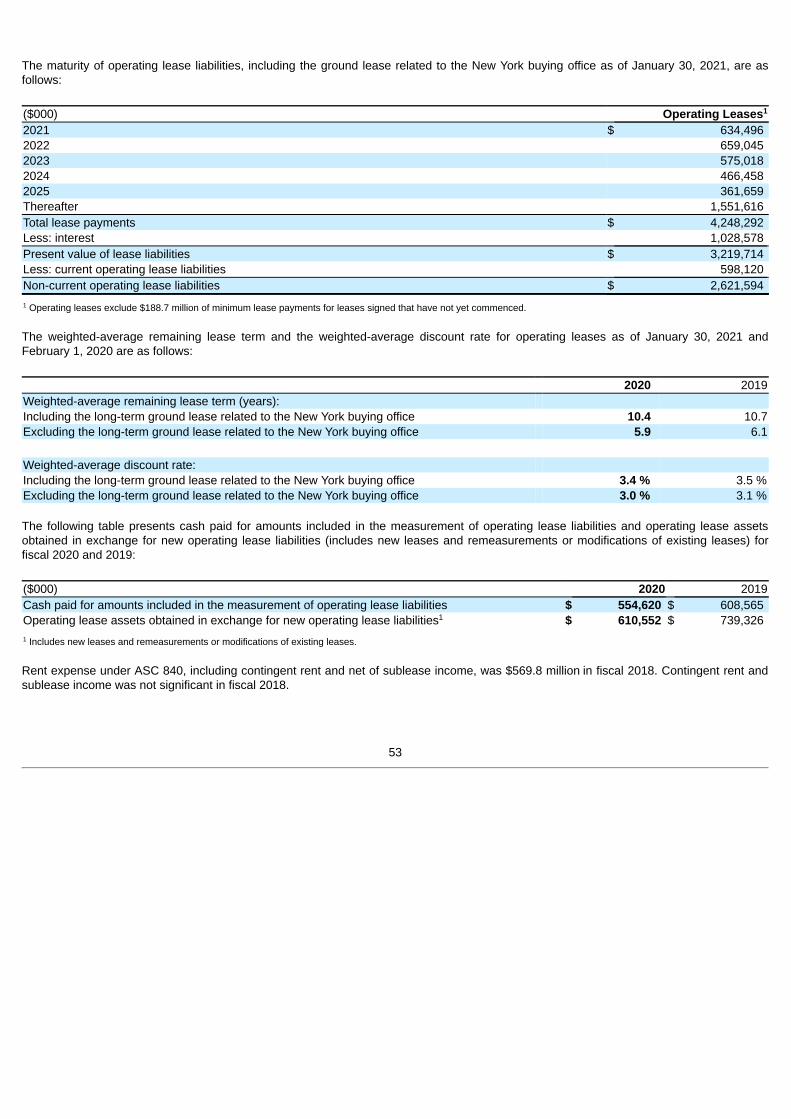
The maturity of operating lease liabilities, including the ground lease related to the New York buying office as of January 30, 2021, are asfollows:
($000) Operating Leases2021 $ 634,496 2022 659,045 2023 575,018 2024 466,458 2025 361,659 Thereafter 1,551,616 Total lease payments $ 4,248,292 Less: interest 1,028,578 Present value of lease liabilities $ 3,219,714 Less: current operating lease liabilities 598,120 Non-current operating lease liabilities $ 2,621,594
Operating leases exclude $188.7 million of minimum lease payments for leases signed that have not yet commenced.
The weighted-average remaining lease term and the weighted-average discount rate for operating leases as of January 30, 2021 andFebruary 1, 2020 are as follows:
2020 2019Weighted-average remaining lease term (years):Including the long-term ground lease related to the New York buying office 10.4 10.7Excluding the long-term ground lease related to the New York buying office 5.9 6.1
Weighted-average discount rate:Including the long-term ground lease related to the New York buying office 3.4 % 3.5 %Excluding the long-term ground lease related to the New York buying office 3.0 % 3.1 %
The following table presents cash paid for amounts included in the measurement of operating lease liabilities and operating lease assetsobtained in exchange for new operating lease liabilities (includes new leases and remeasurements or modifications of existing leases) forfiscal 2020 and 2019:
($000) 2020 2019Cash paid for amounts included in the measurement of operating lease liabilities $ 554,620 $ 608,565 Operating lease assets obtained in exchange for new operating lease liabilities $ 610,552 $ 739,326
Includes new leases and remeasurements or modifications of existing leases.
Rent expense under ASC 840, including contingent rent and net of sublease income, was $569.8 million in fiscal 2018. Contingent rent andsublease income was not significant in fiscal 2018.
1
1
1
1
53
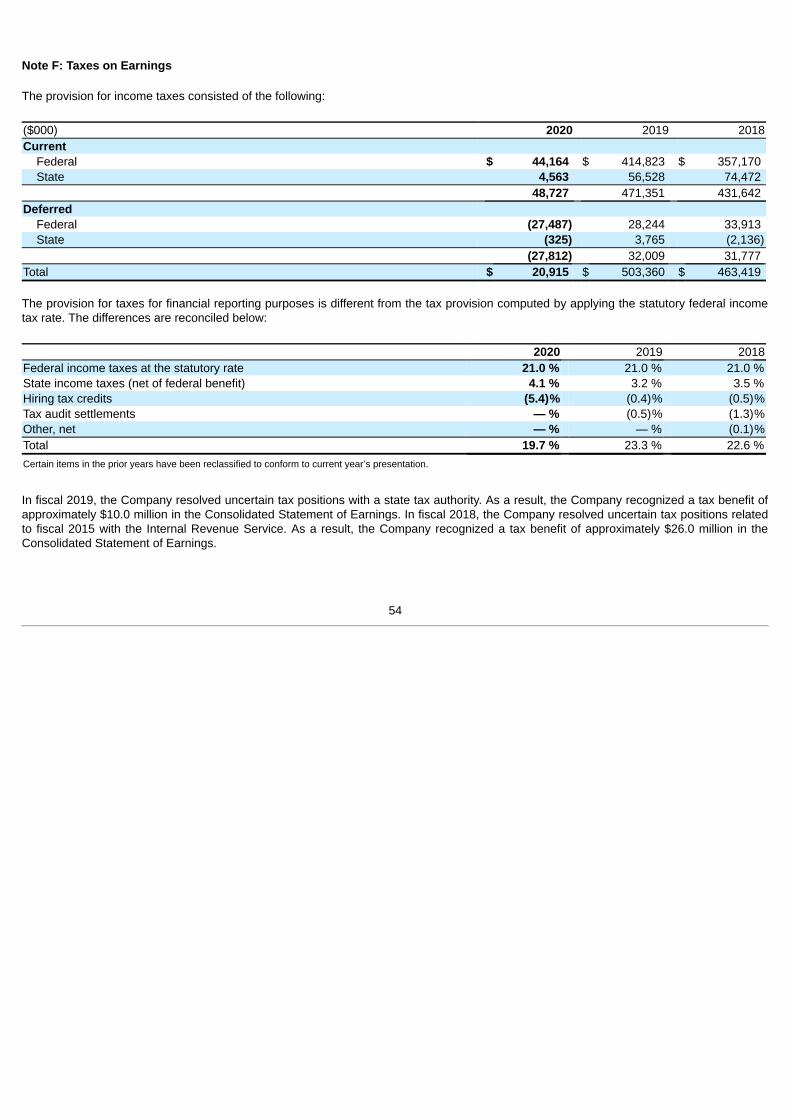
Note F: Taxes on Earnings
The provision for income taxes consisted of the following:
($000) 2020 2019 2018Current
Federal $ 44,164 $ 414,823 $ 357,170 State 4,563 56,528 74,472
48,727 471,351 431,642 Deferred
Federal (27,487) 28,244 33,913 State (325) 3,765 (2,136)
(27,812) 32,009 31,777 Total $ 20,915 $ 503,360 $ 463,419
The provision for taxes for financial reporting purposes is different from the tax provision computed by applying the statutory federal incometax rate. The differences are reconciled below:
2020 2019 2018Federal income taxes at the statutory rate 21.0 % 21.0 % 21.0 %State income taxes (net of federal benefit) 4.1 % 3.2 % 3.5 %Hiring tax credits (5.4)% (0.4)% (0.5)%Tax audit settlements — % (0.5)% (1.3)%Other, net — % — % (0.1)%Total 19.7 % 23.3 % 22.6 %Certain items in the prior years have been reclassified to conform to current year’s presentation.
In fiscal 2019, the Company resolved uncertain tax positions with a state tax authority. As a result, the Company recognized a tax benefit ofapproximately $10.0 million in the Consolidated Statement of Earnings. In fiscal 2018, the Company resolved uncertain tax positions relatedto fiscal 2015 with the Internal Revenue Service. As a result, the Company recognized a tax benefit of approximately $26.0 million in theConsolidated Statement of Earnings.
54
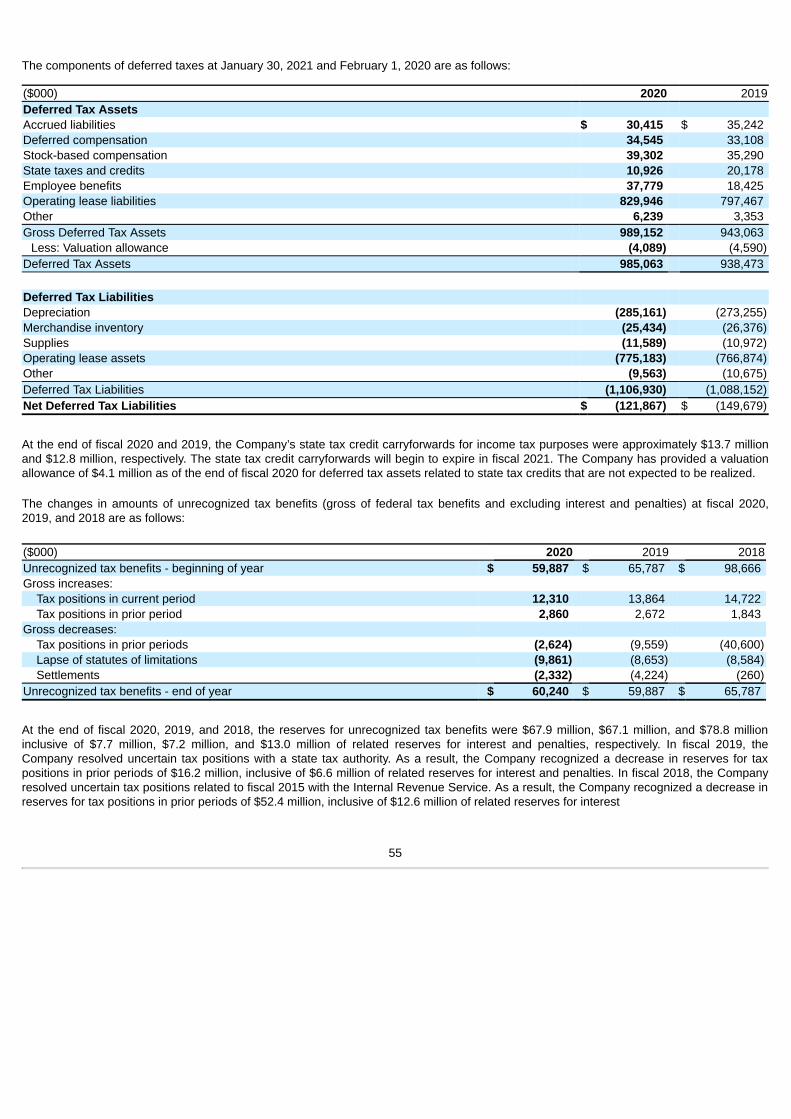
The components of deferred taxes at January 30, 2021 and February 1, 2020 are as follows:
($000) 2020 2019Deferred Tax AssetsAccrued liabilities $ 30,415 $ 35,242 Deferred compensation 34,545 33,108 Stock-based compensation 39,302 35,290 State taxes and credits 10,926 20,178 Employee benefits 37,779 18,425 Operating lease liabilities 829,946 797,467 Other 6,239 3,353 Gross Deferred Tax Assets 989,152 943,063
Less: Valuation allowance (4,089) (4,590)Deferred Tax Assets 985,063 938,473
Deferred Tax LiabilitiesDepreciation (285,161) (273,255)Merchandise inventory (25,434) (26,376)Supplies (11,589) (10,972)Operating lease assets (775,183) (766,874)Other (9,563) (10,675)Deferred Tax Liabilities (1,106,930) (1,088,152)Net Deferred Tax Liabilities $ (121,867) $ (149,679)
At the end of fiscal 2020 and 2019, the Company’s state tax credit carryforwards for income tax purposes were approximately $13.7 millionand $12.8 million, respectively. The state tax credit carryforwards will begin to expire in fiscal 2021. The Company has provided a valuationallowance of $4.1 million as of the end of fiscal 2020 for deferred tax assets related to state tax credits that are not expected to be realized.
The changes in amounts of unrecognized tax benefits (gross of federal tax benefits and excluding interest and penalties) at fiscal 2020,2019, and 2018 are as follows:
($000) 2020 2019 2018Unrecognized tax benefits - beginning of year $ 59,887 $ 65,787 $ 98,666 Gross increases:
Tax positions in current period 12,310 13,864 14,722 Tax positions in prior period 2,860 2,672 1,843
Gross decreases:Tax positions in prior periods (2,624) (9,559) (40,600)Lapse of statutes of limitations (9,861) (8,653) (8,584)Settlements (2,332) (4,224) (260)
Unrecognized tax benefits - end of year $ 60,240 $ 59,887 $ 65,787
At the end of fiscal 2020, 2019, and 2018, the reserves for unrecognized tax benefits were $67.9 million, $67.1 million, and $78.8 millioninclusive of $7.7 million, $7.2 million, and $13.0 million of related reserves for interest and penalties, respectively. In fiscal 2019, theCompany resolved uncertain tax positions with a state tax authority. As a result, the Company recognized a decrease in reserves for taxpositions in prior periods of $16.2 million, inclusive of $6.6 million of related reserves for interest and penalties. In fiscal 2018, the Companyresolved uncertain tax positions related to fiscal 2015 with the Internal Revenue Service. As a result, the Company recognized a decrease inreserves for tax positions in prior periods of $52.4 million, inclusive of $12.6 million of related reserves for interest
55
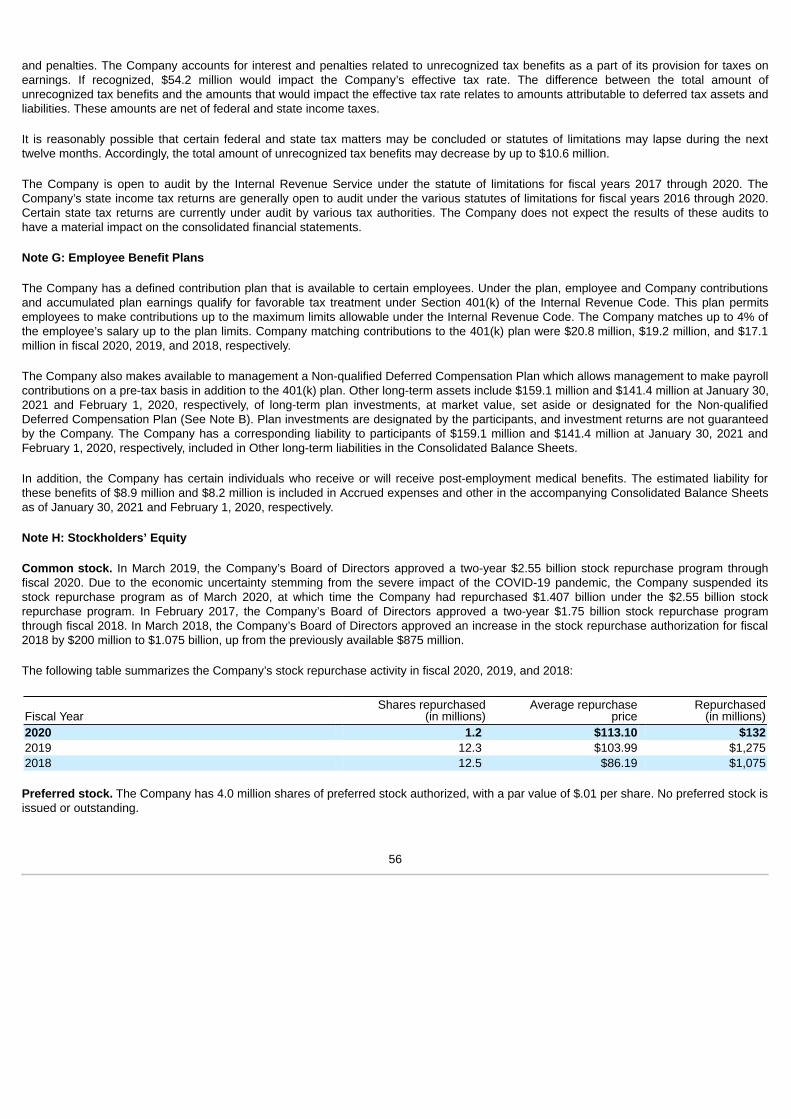
and penalties. The Company accounts for interest and penalties related to unrecognized tax benefits as a part of its provision for taxes onearnings. If recognized, $54.2 million would impact the Company’s effective tax rate. The difference between the total amount ofunrecognized tax benefits and the amounts that would impact the effective tax rate relates to amounts attributable to deferred tax assets andliabilities. These amounts are net of federal and state income taxes.
It is reasonably possible that certain federal and state tax matters may be concluded or statutes of limitations may lapse during the nexttwelve months. Accordingly, the total amount of unrecognized tax benefits may decrease by up to $10.6 million.
The Company is open to audit by the Internal Revenue Service under the statute of limitations for fiscal years 2017 through 2020. TheCompany’s state income tax returns are generally open to audit under the various statutes of limitations for fiscal years 2016 through 2020.Certain state tax returns are currently under audit by various tax authorities. The Company does not expect the results of these audits tohave a material impact on the consolidated financial statements.
Note G: Employee Benefit Plans
The Company has a defined contribution plan that is available to certain employees. Under the plan, employee and Company contributionsand accumulated plan earnings qualify for favorable tax treatment under Section 401(k) of the Internal Revenue Code. This plan permitsemployees to make contributions up to the maximum limits allowable under the Internal Revenue Code. The Company matches up to 4% ofthe employee’s salary up to the plan limits. Company matching contributions to the 401(k) plan were $20.8 million, $19.2 million, and $17.1million in fiscal 2020, 2019, and 2018, respectively.
The Company also makes available to management a Non-qualified Deferred Compensation Plan which allows management to make payrollcontributions on a pre-tax basis in addition to the 401(k) plan. Other long-term assets include $159.1 million and $141.4 million at January 30,2021 and February 1, 2020, respectively, of long-term plan investments, at market value, set aside or designated for the Non-qualifiedDeferred Compensation Plan (See Note B). Plan investments are designated by the participants, and investment returns are not guaranteedby the Company. The Company has a corresponding liability to participants of $159.1 million and $141.4 million at January 30, 2021 andFebruary 1, 2020, respectively, included in Other long-term liabilities in the Consolidated Balance Sheets.
In addition, the Company has certain individuals who receive or will receive post-employment medical benefits. The estimated liability forthese benefits of $8.9 million and $8.2 million is included in Accrued expenses and other in the accompanying Consolidated Balance Sheetsas of January 30, 2021 and February 1, 2020, respectively.
Note H: Stockholders’ Equity
Common stock. In March 2019, the Company’s Board of Directors approved a two-year $2.55 billion stock repurchase program throughfiscal 2020. Due to the economic uncertainty stemming from the severe impact of the COVID-19 pandemic, the Company suspended itsstock repurchase program as of March 2020, at which time the Company had repurchased $1.407 billion under the $2.55 billion stockrepurchase program. In February 2017, the Company’s Board of Directors approved a two-year $1.75 billion stock repurchase programthrough fiscal 2018. In March 2018, the Company’s Board of Directors approved an increase in the stock repurchase authorization for fiscal2018 by $200 million to $1.075 billion, up from the previously available $875 million.
The following table summarizes the Company’s stock repurchase activity in fiscal 2020, 2019, and 2018:
Fiscal YearShares repurchased
(in millions) Average repurchase
priceRepurchased
(in millions)2020 1.2 $113.10 $1322019 12.3 $103.99 $1,2752018 12.5 $86.19 $1,075
Preferred stock. The Company has 4.0 million shares of preferred stock authorized, with a par value of $.01 per share. No preferred stock isissued or outstanding.
56
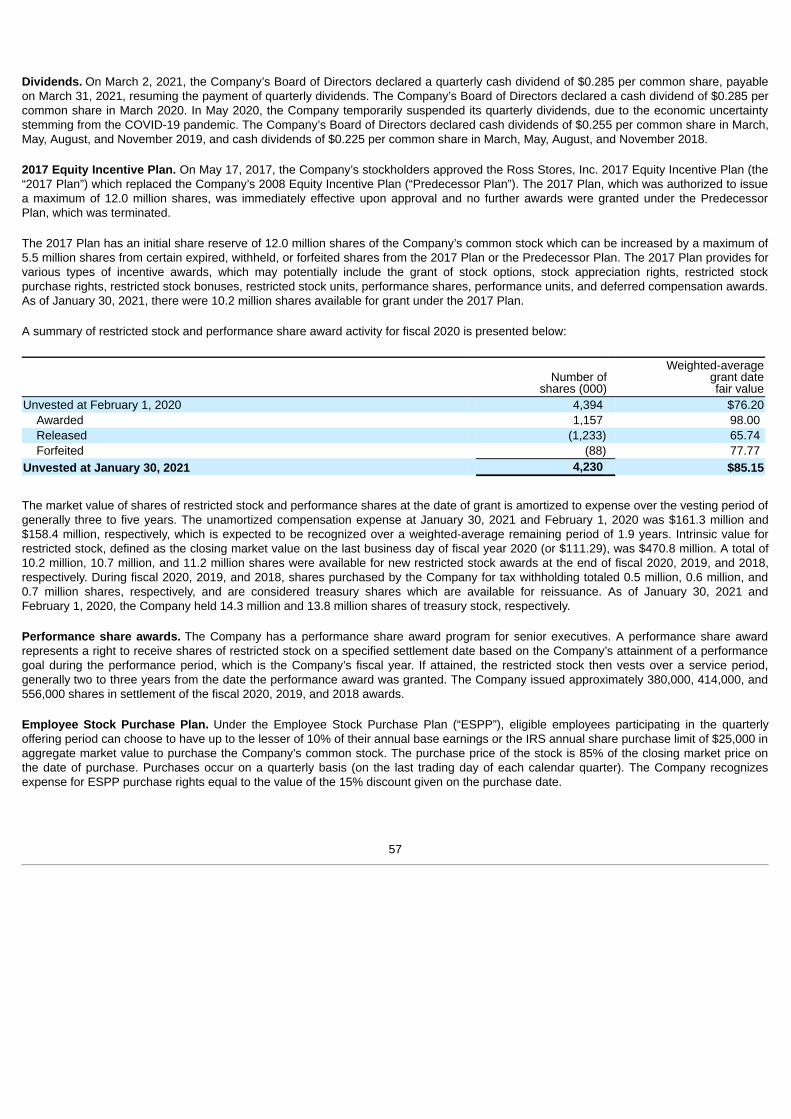
Dividends. On March 2, 2021, the Company’s Board of Directors declared a quarterly cash dividend of $0.285 per common share, payableon March 31, 2021, resuming the payment of quarterly dividends. The Company’s Board of Directors declared a cash dividend of $0.285 percommon share in March 2020. In May 2020, the Company temporarily suspended its quarterly dividends, due to the economic uncertaintystemming from the COVID-19 pandemic. The Company’s Board of Directors declared cash dividends of $0.255 per common share in March,May, August, and November 2019, and cash dividends of $0.225 per common share in March, May, August, and November 2018.
2017 Equity Incentive Plan. On May 17, 2017, the Company’s stockholders approved the Ross Stores, Inc. 2017 Equity Incentive Plan (the“2017 Plan”) which replaced the Company’s 2008 Equity Incentive Plan (“Predecessor Plan”). The 2017 Plan, which was authorized to issuea maximum of 12.0 million shares, was immediately effective upon approval and no further awards were granted under the PredecessorPlan, which was terminated.
The 2017 Plan has an initial share reserve of 12.0 million shares of the Company’s common stock which can be increased by a maximum of5.5 million shares from certain expired, withheld, or forfeited shares from the 2017 Plan or the Predecessor Plan. The 2017 Plan provides forvarious types of incentive awards, which may potentially include the grant of stock options, stock appreciation rights, restricted stockpurchase rights, restricted stock bonuses, restricted stock units, performance shares, performance units, and deferred compensation awards.As of January 30, 2021, there were 10.2 million shares available for grant under the 2017 Plan.
A summary of restricted stock and performance share award activity for fiscal 2020 is presented below:
Number ofshares (000)
Weighted-averagegrant datefair value
Unvested at February 1, 2020 4,394 $76.20Awarded 1,157 98.00 Released (1,233) 65.74 Forfeited (88) 77.77
Unvested at January 30, 2021 4,230 $85.15
The market value of shares of restricted stock and performance shares at the date of grant is amortized to expense over the vesting period ofgenerally three to five years. The unamortized compensation expense at January 30, 2021 and February 1, 2020 was $161.3 million and$158.4 million, respectively, which is expected to be recognized over a weighted-average remaining period of 1.9 years. Intrinsic value forrestricted stock, defined as the closing market value on the last business day of fiscal year 2020 (or $111.29), was $470.8 million. A total of10.2 million, 10.7 million, and 11.2 million shares were available for new restricted stock awards at the end of fiscal 2020, 2019, and 2018,respectively. During fiscal 2020, 2019, and 2018, shares purchased by the Company for tax withholding totaled 0.5 million, 0.6 million, and0.7 million shares, respectively, and are considered treasury shares which are available for reissuance. As of January 30, 2021 andFebruary 1, 2020, the Company held 14.3 million and 13.8 million shares of treasury stock, respectively.
Performance share awards. The Company has a performance share award program for senior executives. A performance share awardrepresents a right to receive shares of restricted stock on a specified settlement date based on the Company’s attainment of a performancegoal during the performance period, which is the Company’s fiscal year. If attained, the restricted stock then vests over a service period,generally two to three years from the date the performance award was granted. The Company issued approximately 380,000, 414,000, and556,000 shares in settlement of the fiscal 2020, 2019, and 2018 awards.
Employee Stock Purchase Plan. Under the Employee Stock Purchase Plan (“ESPP”), eligible employees participating in the quarterlyoffering period can choose to have up to the lesser of 10% of their annual base earnings or the IRS annual share purchase limit of $25,000 inaggregate market value to purchase the Company’s common stock. The purchase price of the stock is 85% of the closing market price onthe date of purchase. Purchases occur on a quarterly basis (on the last trading day of each calendar quarter). The Company recognizesexpense for ESPP purchase rights equal to the value of the 15% discount given on the purchase date.
57
During fiscal 2020, 2019, and 2018, employees purchased approximately 0.3 million, 0.3 million, and 0.3 million shares, respectively, of theCompany’s common stock under the plan at weighted-average per share prices of $81.45, $88.45, and $72.89, respectively. ThroughJanuary 30, 2021, approximately 40.5 million shares had been issued under this plan and 4.5 million shares remained available for futureissuance.
Note I: Related Party Transactions
The Company has a consulting agreement with Norman Ferber, its Chairman Emeritus of the Board of Directors, under which the Companypaid him $2.1 million, $2.1 million, and $1.9 million in fiscal 2020, 2019, and 2018, respectively. In addition, the agreement provides foradministrative support and health and other benefits for him and his dependents, which totaled approximately $0.4 million, $0.4 million, and$0.4 million in fiscal 2020, 2019, and 2018, respectively, along with amounts to cover premiums through May 2022 on a life insurance policywith a death benefit of $2.0 million. Mr. Ferber’s current consulting agreement pays him an annual consulting fee of $2.3 million through May2021 and $1.6 million through May 2022. On termination of Mr. Ferber’s consultancy with the Company, the Company will pay Mr. Ferber$75,000 per year for a period of 10 years.
Robert Ferber, the son of Norman Ferber, is a Vice President, Divisional Merchandise Manager with the Company. The Company paidRobert Ferber compensation including salary and bonus of approximately $248,000, $209,000, and $180,000 in fiscal 2020, 2019, and 2018,respectively.
Note J: Litigation, Claims, and Assessments
Like many retailers, the Company has been named in class/representative action lawsuits, primarily in California, alleging violation of wageand hour laws and consumer protection laws. Class/representative action litigation remains pending as of January 30, 2021.
The Company is also party to various other legal and regulatory proceedings arising in the normal course of business. Actions filed againstthe Company may include commercial, product and product safety, consumer, intellectual property, environmental, and labor andemployment-related claims, including lawsuits in which private plaintiffs or governmental agencies allege that the Company violated federal,state, and/or local laws. Actions against the Company are in various procedural stages. Many of these proceedings raise factual and legalissues and are subject to uncertainties.
In the opinion of management, the resolution of pending class/representative action litigation and other currently pending legal and regulatoryproceedings will not have a material adverse effect on the Company’s financial condition, results of operations, or cash flows.
58
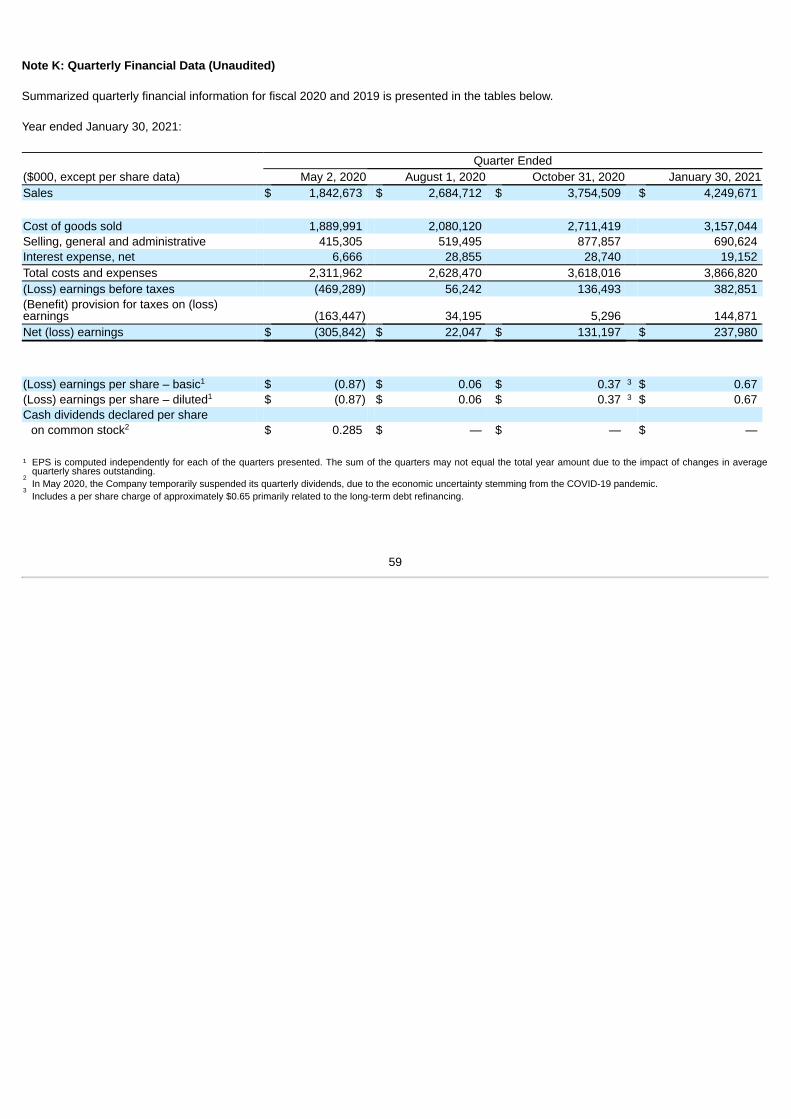
Note K: Quarterly Financial Data (Unaudited)
Summarized quarterly financial information for fiscal 2020 and 2019 is presented in the tables below.
Year ended January 30, 2021:
Quarter Ended($000, except per share data) May 2, 2020 August 1, 2020 October 31, 2020 January 30, 2021Sales $ 1,842,673 $ 2,684,712 $ 3,754,509 $ 4,249,671
Cost of goods sold 1,889,991 2,080,120 2,711,419 3,157,044 Selling, general and administrative 415,305 519,495 877,857 690,624 Interest expense, net 6,666 28,855 28,740 19,152 Total costs and expenses 2,311,962 2,628,470 3,618,016 3,866,820 (Loss) earnings before taxes (469,289) 56,242 136,493 382,851 (Benefit) provision for taxes on (loss)earnings (163,447) 34,195 5,296 144,871 Net (loss) earnings $ (305,842) $ 22,047 $ 131,197 $ 237,980
(Loss) earnings per share – basic $ (0.87) $ 0.06 $ 0.37 $ 0.67 (Loss) earnings per share – diluted $ (0.87) $ 0.06 $ 0.37 $ 0.67 Cash dividends declared per share
on common stock $ 0.285 $ — $ — $ —
¹ EPS is computed independently for each of the quarters presented. The sum of the quarters may not equal the total year amount due to the impact of changes in averagequarterly shares outstanding.In May 2020, the Company temporarily suspended its quarterly dividends, due to the economic uncertainty stemming from the COVID-19 pandemic.Includes a per share charge of approximately $0.65 primarily related to the long-term debt refinancing.
1 3
1 3
2
2
3
59
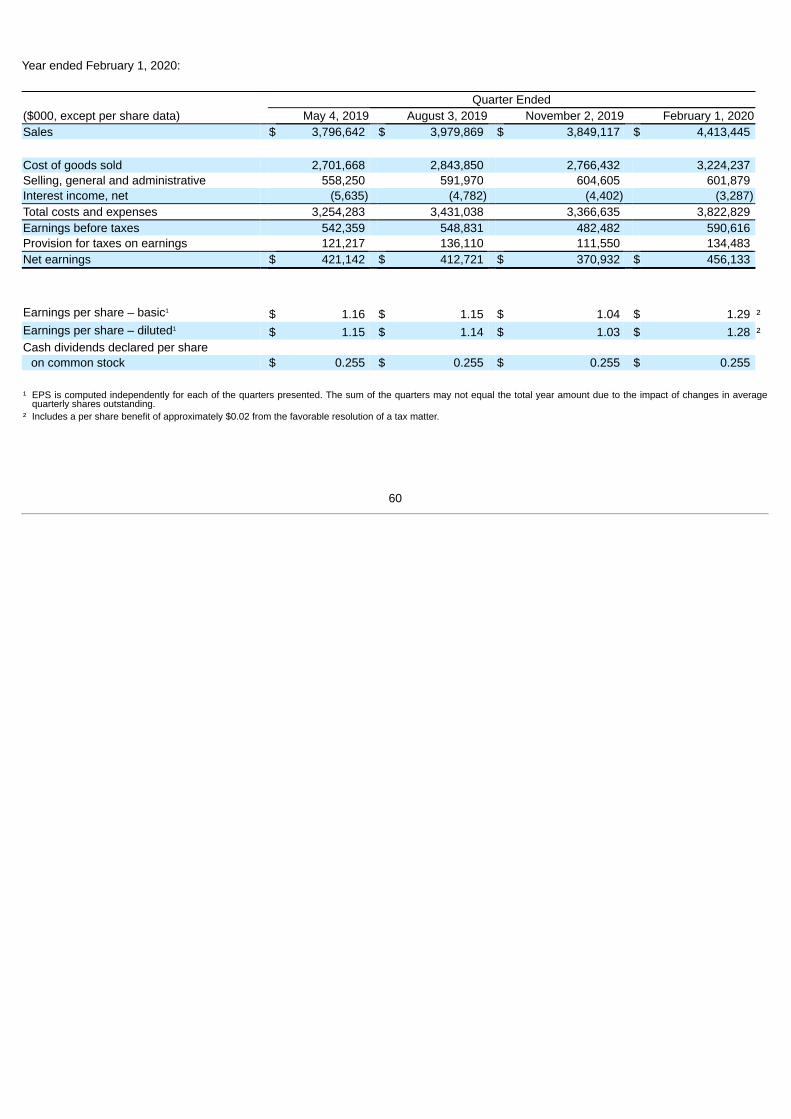
Year ended February 1, 2020:
Quarter Ended($000, except per share data) May 4, 2019 August 3, 2019 November 2, 2019 February 1, 2020Sales $ 3,796,642 $ 3,979,869 $ 3,849,117 $ 4,413,445
Cost of goods sold 2,701,668 2,843,850 2,766,432 3,224,237 Selling, general and administrative 558,250 591,970 604,605 601,879 Interest income, net (5,635) (4,782) (4,402) (3,287)Total costs and expenses 3,254,283 3,431,038 3,366,635 3,822,829 Earnings before taxes 542,359 548,831 482,482 590,616 Provision for taxes on earnings 121,217 136,110 111,550 134,483 Net earnings $ 421,142 $ 412,721 $ 370,932 $ 456,133
Earnings per share – basic $ 1.16 $ 1.15 $ 1.04 $ 1.29 ²Earnings per share – diluted $ 1.15 $ 1.14 $ 1.03 $ 1.28 ²Cash dividends declared per share
on common stock $ 0.255 $ 0.255 $ 0.255 $ 0.255
¹ EPS is computed independently for each of the quarters presented. The sum of the quarters may not equal the total year amount due to the impact of changes in averagequarterly shares outstanding.
² Includes a per share benefit of approximately $0.02 from the favorable resolution of a tax matter.
1
1
60
REPORT OF INDEPENDENT REGISTERED PUBLIC ACCOUNTING FIRM
To the Stockholders and the Board of Directors of Ross Stores, Inc.:
Opinions on the Financial Statements and Internal Control over Financial Reporting
We have audited the accompanying consolidated balance sheets of Ross Stores, Inc. and subsidiaries (the “Company”) as of January 30,2021 and February 1, 2020, and the related consolidated statements of earnings, comprehensive income, stockholders’ equity, and cashflows for each of the fiscal years ended January 30, 2021, February 1, 2020, and February 2, 2019 and the related notes (collectivelyreferred to as the “financial statements”). We also have audited the Company’s internal control over financial reporting as of January 30,2021, based on criteria established in Internal Control - Integrated Framework (2013) issued by the Committee of Sponsoring Organizationsof the Treadway Commission (COSO).
In our opinion, the financial statements referred to above present fairly, in all material respects, the financial position of the Company as ofJanuary 30, 2021 and February 1, 2020, and the results of its operations and its cash flows for each of the fiscal years ended January 30,2021, February 1, 2020, and February 2, 2019, in conformity with accounting principles generally accepted in the United States of America.Also, in our opinion, the Company maintained, in all material respects, effective internal control over financial reporting as of January 30,2021, based on the criteria established in Internal Control - Integrated Framework (2013) issued by COSO.
Change in Accounting Principle
As discussed in Note A to the financial statements, effective February 3, 2019, the Company adopted FASB ASC 842, Leases, using themodified retrospective basis.
Basis for Opinions
The Company’s management is responsible for these financial statements, for maintaining effective internal control over financial reporting,and for its assessment of the effectiveness of internal control over financial reporting, included in the accompanying “Management’s AnnualReport on Internal Control over Financial Reporting.” Our responsibility is to express an opinion on the Company’s financial statements andan opinion on the Company’s internal control over financial reporting based on our audits. We are a public accounting firm registered with thePublic Company Accounting Oversight Board (United States) (PCAOB) and are required to be independent with respect to the Company inaccordance with the U.S. federal securities laws and the applicable rules and regulations of the Securities and Exchange Commission andthe PCAOB.
We conducted our audits in accordance with the standards of the PCAOB. Those standards require that we plan and perform the audit toobtain reasonable assurance about whether the financial statements are free of material misstatement, whether due to error or fraud, andwhether effective internal control over financial reporting was maintained in all material respects.
Our audits of the financial statements included performing procedures to assess the risks of material misstatement of the financialstatements, whether due to error or fraud, and performing procedures that respond to those risks. Such procedures included examining, on atest basis, evidence regarding the amounts and disclosures in the financial statements. Our audits also included evaluating the accountingprinciples used and significant estimates made by management, as well as evaluating the overall presentation of the financial statements.Our audit of internal control over financial reporting included obtaining an understanding of internal control over financial reporting, assessingthe risk that a material weakness exists, and testing and evaluating the design and operating effectiveness of internal control based on theassessed risk. Our audits also included performing such other procedures as we considered necessary in the circumstances. We believe thatour audits provide a reasonable basis for our opinions.
Definition and Limitations of Internal Control over Financial Reporting
A company’s internal control over financial reporting is a process designed to provide reasonable assurance regarding the reliability offinancial reporting and the preparation of financial statements for external purposes in accordance with generally accepted accountingprinciples. A company’s internal control over financial reporting includes those policies and procedures that (1) pertain to the maintenance ofrecords that, in reasonable detail,
61
accurately and fairly reflect the transactions and dispositions of the assets of the company; (2) provide reasonable assurance thattransactions are recorded as necessary to permit preparation of financial statements in accordance with generally accepted accountingprinciples, and that receipts and expenditures of the company are being made only in accordance with authorizations of management anddirectors of the company; and (3) provide reasonable assurance regarding prevention or timely detection of unauthorized acquisition, use, ordisposition of the company’s assets that could have material effect on the financial statements.
Because of its inherent limitations, internal control over financial reporting may not prevent or detect misstatements. Also, projections of anyevaluation of the effectiveness to future periods are subject to the risk that the controls may become inadequate because of changes inconditions, or that the degree of compliance with the policies or procedures may deteriorate.
Critical Audit Matter
Critical audit matters are matters arising from the current-period audit of the financial statements that were communicated or required to becommunicated to the audit committee and that (1) relate to accounts or disclosures that are material to the financial statements and (2)involved our especially challenging, subjective, or complex judgments. We determined that there are no critical audit matters.
/s/DELOITTE & TOUCHE LLP
San Francisco, CaliforniaMarch 30, 2021
We have served as the Company’s auditor since 1982.
62
ITEM 9. CHANGES IN AND DISAGREEMENTS WITH ACCOUNTANTS ON ACCOUNTING AND FINANCIAL DISCLOSURE
None
ITEM 9A. CONTROLS AND PROCEDURES
Disclosure Controls and Procedures
Our management, with the participation of our Chief Executive Officer and Chief Financial Officer, conducted an evaluation of theeffectiveness of our “disclosure controls and procedures,” (as defined in Exchange Act Rule 13a-15(e)), as of the end of the period coveredby this report. Our disclosure controls and procedures are designed to provide reasonable assurance of achieving their objectives. Based onthat evaluation, our Chief Executive Officer and Chief Financial Officer concluded that our disclosure controls and procedures were effectiveat that reasonable assurance level as of the end of the period covered by this report.
It should be noted that any system of controls, however well designed and operated, can provide only reasonable, and not absolute,assurance that the objectives of the system will be met. In addition, the design of any control system is based in part upon certainassumptions about the likelihood of future events.
Management’s Annual Report on Internal Control Over Financial Reporting
Our management is responsible for establishing and maintaining adequate internal control over financial reporting, as defined in ExchangeAct Rule 13a-15(f). Our internal control over financial reporting is designed to provide reasonable assurance regarding the reliability offinancial reporting and the preparation of consolidated financial statements for external purposes in accordance with generally acceptedaccounting principles.
Under the supervision and with the participation of our management, including our Chief Executive Officer and Chief Financial Officer, weconducted an evaluation of the effectiveness of our internal control over financial reporting based on the framework established by theCommittee of Sponsoring Organizations of the Treadway Commission (COSO) as set forth in Internal Control — Integrated Framework(2013). Based on our evaluation under the framework in Internal Control — Integrated Framework (2013), our management concluded thatour internal control over financial reporting was effective as of January 30, 2021.
Our internal control over financial reporting as of January 30, 2021 has also been audited by Deloitte & Touche LLP, an independentregistered public accounting firm, and their opinion as to the effectiveness of our internal control over financial reporting is stated in theirreport, dated March 30, 2021, which is included in Item 8 in this Annual Report on Form 10-K.
Because of its inherent limitations, internal control over financial reporting may not prevent or detect misstatements. It should be noted thatany system of controls, however well designed and operated, can provide only reasonable, and not absolute, assurance that the objectivesof the system will be met. In addition, the design of any control system is based in part upon certain assumptions about the likelihood offuture events. Also, projections of any evaluation of effectiveness to future periods are subject to the risk that controls may becomeinadequate because of changes in conditions, or that the degree of compliance with the policies or procedures may deteriorate.
Quarterly Evaluation of Changes in Internal Control Over Financial Reporting
Our management, with the participation of our Chief Executive Officer and Chief Financial Officer, also conducted an evaluation of ourinternal control over financial reporting to determine whether any change occurred during the fourth fiscal quarter of 2020 that has materiallyaffected, or is reasonably likely to materially affect, our internal control over financial reporting. Based on that evaluation, our managementconcluded that there was no such change during the fourth fiscal quarter.
ITEM 9B. OTHER INFORMATION
None
63
PART III
ITEM 10. DIRECTORS, EXECUTIVE OFFICERS AND CORPORATE GOVERNANCE
Information required by Item 401 of Regulation S-K is incorporated herein by reference to the sections entitled “Executive Officers of theRegistrant” at the end of Part I of this report; and to the sections of the Ross Stores, Inc. Proxy Statement for the Annual Meeting ofStockholders to be held on Wednesday, May 19, 2021 (the “Proxy Statement”) entitled “Information Regarding Nominees and IncumbentDirectors.” Information required by Item 405 of Regulation S-K is incorporated by reference to the Proxy Statement under the section titled“Section 16(a) Beneficial Ownership Reporting Compliance.” Since our last Annual Report on Form 10-K, we have not made any materialchanges to the procedures by which our stockholders may recommend nominees to the Board of Directors. Information required by Item407(d)(4) and (d)(5) of Regulation S-K is incorporated by reference to the Proxy Statement under the section entitled “Information RegardingNominees and Incumbent Directors” under the caption “Audit Committee.”
Our Board of Directors has adopted a Code of Ethics for Senior Financial Officers that applies to our Chief Executive Officer and our ChiefFinancial Officer (who is also our principal accounting officer), along with other of our senior operating and financial executives. This Code ofEthics is posted on our corporate website (www.rossstores.com) under Corporate Governance in the Investors Section. We intend to satisfythe disclosure requirements of Item 5.05 of Form 8-K regarding any future amendments to, or waivers from, our Code of Ethics for SeniorFinancial Officers by posting any changed version on the same corporate website.
ITEM 11. EXECUTIVE COMPENSATION
The information required by Item 402 of Regulation S-K is incorporated herein by reference to the sections of the Proxy Statement entitled“Compensation of Directors” and “Executive Compensation” under the captions “Compensation Discussion and Analysis,” “SummaryCompensation Table,” “All Other Compensation,” “Perquisites,” “Discussion of Summary Compensation,” “Grants of Plan-Based AwardsDuring Fiscal Year,” “Outstanding Equity Awards at Fiscal Year-End,” “Option Exercises and Stock Vested,” “Non-Qualified DeferredCompensation,” and “Potential Payments Upon Termination or Change in Control.”
The information required by Items 407(e)(4) and (e)(5) of Regulation S-K are incorporated herein by reference to the sections of the ProxyStatement entitled “Compensation Committee Interlocks and Insider Participation” and “Compensation Committee Report.”
64
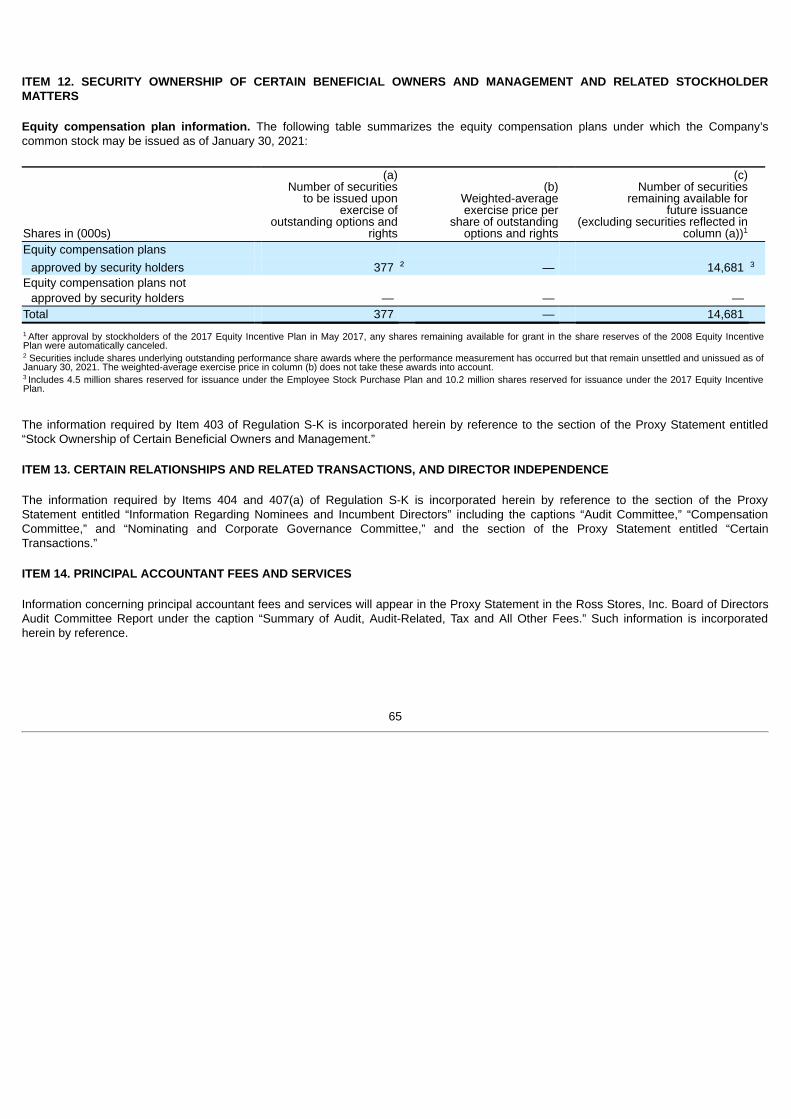
ITEM 12. SECURITY OWNERSHIP OF CERTAIN BENEFICIAL OWNERS AND MANAGEMENT AND RELATED STOCKHOLDERMATTERS
Equity compensation plan information. The following table summarizes the equity compensation plans under which the Company’scommon stock may be issued as of January 30, 2021:
Shares in (000s)
(a)Number of securities
to be issued uponexercise of
outstanding options andrights
(b)Weighted-averageexercise price per
share of outstandingoptions and rights
(c)Number of securities
remaining available forfuture issuance
(excluding securities reflected incolumn (a))
Equity compensation plans approved by security holders 377 ² — 14,681
Equity compensation plans notapproved by security holders — — —
Total 377 — 14,681
After approval by stockholders of the 2017 Equity Incentive Plan in May 2017, any shares remaining available for grant in the share reserves of the 2008 Equity IncentivePlan were automatically canceled. Securities include shares underlying outstanding performance share awards where the performance measurement has occurred but that remain unsettled and unissued as of
January 30, 2021. The weighted-average exercise price in column (b) does not take these awards into account.Includes 4.5 million shares reserved for issuance under the Employee Stock Purchase Plan and 10.2 million shares reserved for issuance under the 2017 Equity Incentive
Plan.
The information required by Item 403 of Regulation S-K is incorporated herein by reference to the section of the Proxy Statement entitled“Stock Ownership of Certain Beneficial Owners and Management.”
ITEM 13. CERTAIN RELATIONSHIPS AND RELATED TRANSACTIONS, AND DIRECTOR INDEPENDENCE
The information required by Items 404 and 407(a) of Regulation S-K is incorporated herein by reference to the section of the ProxyStatement entitled “Information Regarding Nominees and Incumbent Directors” including the captions “Audit Committee,” “CompensationCommittee,” and “Nominating and Corporate Governance Committee,” and the section of the Proxy Statement entitled “CertainTransactions.”
ITEM 14. PRINCIPAL ACCOUNTANT FEES AND SERVICES
Information concerning principal accountant fees and services will appear in the Proxy Statement in the Ross Stores, Inc. Board of DirectorsAudit Committee Report under the caption “Summary of Audit, Audit-Related, Tax and All Other Fees.” Such information is incorporatedherein by reference.
1
3
1
2
3
65
PART IV
ITEM 15. EXHIBITS, FINANCIAL STATEMENT SCHEDULES
(a) The following consolidated financial statements, schedules, and exhibits are filed as part of this report or are incorporated herein asindicated:
1. List of Consolidated Financial Statements.
The following consolidated financial statements are included herein under Item 8:
Consolidated Statements of Earnings for the years ended January 30, 2021, February 1, 2020, and February 2,2019.
Consolidated Statements of Comprehensive Income for the years ended January 30, 2021, February 1, 2020, andFebruary 2, 2019.
Consolidated Balance Sheets at January 30, 2021 and February 1, 2020.
Consolidated Statements of Stockholders’ Equity for the years ended January 30, 2021, February 1, 2020, andFebruary 2, 2019.
Consolidated Statements of Cash Flows for the years ended January 30, 2021, February 1, 2020, and February 2,2019.
Notes to Consolidated Financial Statements.
Report of Independent Registered Public Accounting Firm.
2. List of Consolidated Financial Statement Schedules.
Schedules are omitted because they are not required, not applicable, or such information is included in theconsolidated financial statements or notes thereto which are included in this Report.
3. List of Exhibits (in accordance with Item 601 of Regulation S-K).
Incorporated herein by reference to the list of Exhibits contained in the Exhibit Index within this Report.
66

SIGNATURES
Pursuant to the requirements of Section 13 or 15 (d) of the Securities Exchange Act of 1934, the Registrant has duly caused this Report tobe signed on its behalf by the undersigned, thereunto duly authorized.
ROSS STORES, INC. (Registrant)
By: /s/Barbara RentlerDate: March 30, 2021 Barbara Rentler
Chief Executive Officer
67
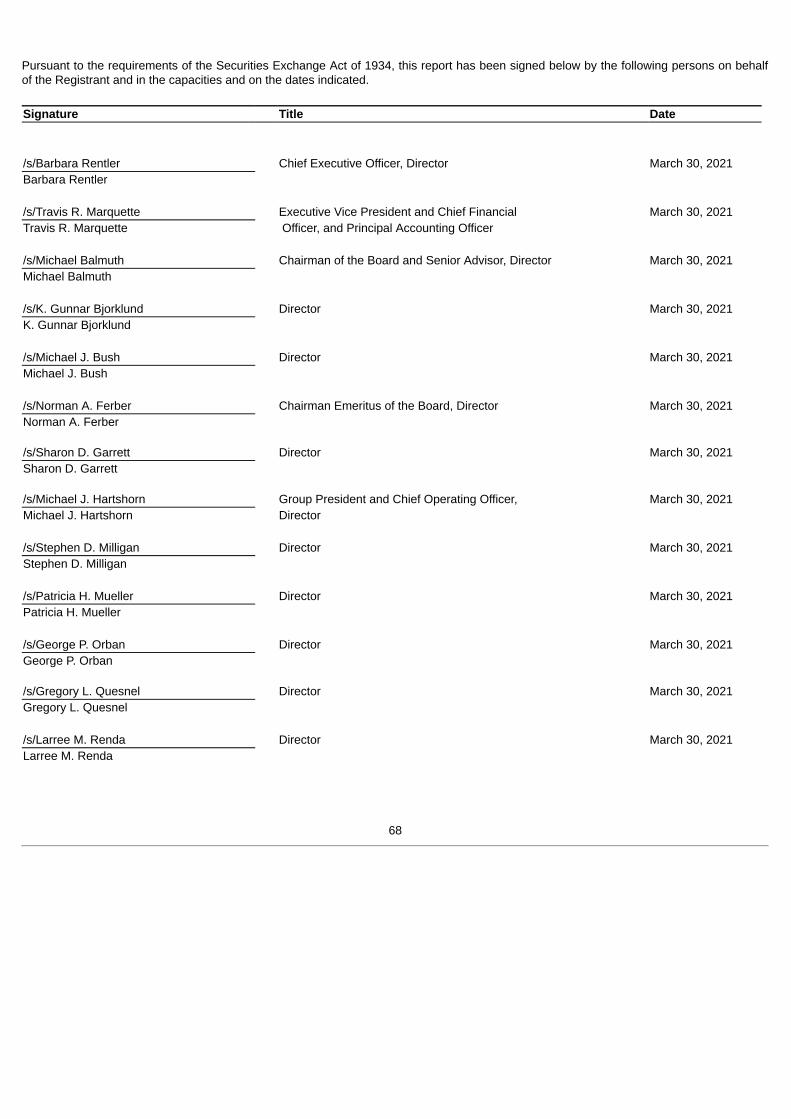
Pursuant to the requirements of the Securities Exchange Act of 1934, this report has been signed below by the following persons on behalfof the Registrant and in the capacities and on the dates indicated.
Signature Title Date
/s/Barbara Rentler Chief Executive Officer, Director March 30, 2021Barbara Rentler
/s/Travis R. Marquette Executive Vice President and Chief Financial March 30, 2021Travis R. Marquette Officer, and Principal Accounting Officer
/s/Michael Balmuth Chairman of the Board and Senior Advisor, Director March 30, 2021Michael Balmuth
/s/K. Gunnar Bjorklund Director March 30, 2021K. Gunnar Bjorklund
/s/Michael J. Bush Director March 30, 2021Michael J. Bush
/s/Norman A. Ferber Chairman Emeritus of the Board, Director March 30, 2021Norman A. Ferber /s/Sharon D. Garrett Director March 30, 2021Sharon D. Garrett /s/Michael J. Hartshorn Group President and Chief Operating Officer, March 30, 2021Michael J. Hartshorn Director
/s/Stephen D. Milligan Director March 30, 2021Stephen D. Milligan
/s/Patricia H. Mueller Director March 30, 2021Patricia H. Mueller
/s/George P. Orban Director March 30, 2021George P. Orban /s/Gregory L. Quesnel Director March 30, 2021Gregory L. Quesnel
/s/Larree M. Renda Director March 30, 2021Larree M. Renda
68
INDEX TO EXHIBITS
ExhibitNumber Exhibit
3.1 Certificate of Incorporation of Ross Stores, Inc. as amended (Corrected First Restated Certificate of Incorporation, dated March17, 1999, together with amendments thereto through Amendment of Certificate of Incorporation dated May 29, 2015)incorporated by reference to Exhibit 3.1 to the Form 10-Q filed by Ross Stores, Inc. for its quarter ended August 1, 2015.
3.2 Amended and Restated Bylaws of Ross Stores, Inc. (as amended March 8, 2017), incorporated by reference to Exhibit 3.2 tothe Form 10-K filed by Ross Stores, Inc. for its fiscal year ended January 28, 2017.
4.1 Description of Common Stock of Ross Stores, Inc., incorporated by reference to Exhibit 4.5 to the Form 10-K filed by RossStores, Inc. for its year ended February 1, 2020.
4.2 Note Purchase Agreement dated October 17, 2006, incorporated by reference to Exhibit 10.2 to the Form 10-Q filed by RossStores, Inc. for its quarter ended October 28, 2006.
4.3 First Amendment to Note Purchase Agreement dated as of June 30, 2020, incorporated by reference to Exhibit 10.1 to theForm 10-Q filed by Ross Stores, Inc. for its quarter ended August, 1 2020.
4.4 Indenture, dated as of September 18, 2014, between Ross Stores, Inc. and U.S. Bank National Association, incorporated byreference to Exhibit 4.1 to the Form 8-K filed by Ross Stores on September 18, 2014.
4.5 Officers’ Certificate, dated as of September 18, 2014, establishing the terms and form of the Notes, incorporated by referenceto Exhibit 4.2 to the Form 8-K filed by Ross Stores on September 18, 2014.
4.6 Form of the 3.375% Senior Notes Due 2024, included in and incorporated by reference to Exhibit 4.2 to the Form 8-K filed byRoss Stores on September 18, 2014.
4.7 Officers’ Certificate, dated as of April 6, 2020, establishing the aggregate amounts, terms and form of the Notes, incorporatedby reference to Exhibit 4.2 to the Form 8-K filed by Ross Stores, Inc. on April 7, 2020.
4.8 Form of 4.600% Senior Notes Due 2025, included in and incorporated by reference to Exhibit 4.2 to the Form 8-K filed by RossStores, Inc. on April 7, 2020.
4.9 Form of 4.700% Senior Notes Due 2027, included in and incorporated by reference to Exhibit 4.2 to the Form 8-K filed by RossStores, Inc. on April 7, 2020.
4.10 Form of 4.800% Senior Notes Due 2030, included in and incorporated by reference to Exhibit 4.2 to the Form 8-K filed by RossStores, Inc. on April 7, 2020.
4.11 Form of 5.450% Senior Notes Due 2050, included in and incorporated by reference to Exhibit 4.2 to the Form 8-K filed by RossStores, Inc. on April 7, 2020.
4.12 Officers’ Certificate, dated as of October 21, 2020 establishing the aggregate amounts, terms and forms of the Notes.,incorporated by reference to Exhibit 4.2 to the Form 8-K filed by Ross Stores, Inc. on October 22, 2020.
4.13 Form of the 0.875% Senior Notes Due 2026, included in and incorporated by reference to Exhibit 4.2 to the Form 8-K filed byRoss Stores, Inc. on October 22, 2020.
69
4.14 Form of the 1.875% Senior Notes Due 2031, included in and incorporated by reference to Exhibit 4.2 to the Form 8-K filed byRoss Stores, Inc. on October 22, 2020.
10.1 Amended and Restated Credit Agreement dated July 1, 2019 among Ross Stores, Inc., various lenders and Bank of America,N.A., as Administrative Agent, incorporated by reference to Exhibit 10.3 to the Form 10-Q filed by Ross Stores, Inc. for itsquarter ended August 3, 2019.
10.2 First Amendment to Amended and Restated Credit Agreement dated as of May 1, 2020 among Ross Stores, Inc., variouslenders, and Bank of America, N.A., as Administrative Agent, incorporated by reference to Exhibit 10.2 to the Form 10-Q filedby Ross Stores, Inc. for its quarter ended May 2, 2020.
10.3 Underwriting Agreement, dated as of April 2, 2020, by and among Ross Stores, Inc., BofA Securities, Inc. and J.P. MorganSecurities LLC, as representatives of the underwriters named therein, incorporated by reference to Exhibit 1.1 to the Form 8-Kfiled by Ross Stores on April 7, 2020.
10.4 Underwriting Agreement, dated as of October 19, 2020, by and among Ross Stores, Inc., J.P. Morgan Securities LLC and BofASecurities, Inc., as representatives of the several underwriters named therein, incorporated by reference to Exhibit 1.1 to theForm 8-K filed by Ross Stores on October 22, 2020.
MANAGEMENT CONTRACTS AND COMPENSATORY PLANS (EXHIBITS 10.5 - 10.45)10.5 Third Amended and Restated Ross Stores, Inc. Non-Qualified Deferred Compensation Plan effective December 31, 2008 (as
amended effective January 1, 2015 and October 1, 2017), incorporated by reference to Exhibit 10.3 filed by Ross Stores, Inc.for its fiscal year ended February 3, 2018.
10.6 Second Amended and Restated Ross Stores, Inc. Incentive Compensation Plan, incorporated by reference to Exhibit 10.2 tothe Form 10-Q filed by Ross Stores, Inc. for its quarter ended October 31, 2020.
10.7 Ross Stores, Inc. 2008 Equity Incentive Plan (as amended through May 21, 2014), incorporated by reference to Exhibit 10.18to the Form 10-K filed by Ross Stores, Inc. for its fiscal year ended January 30, 2016.
10.8 Ross Stores, Inc. 2017 Equity Incentive Plan, incorporated by reference to Exhibit 99 to the Registration Statement on Form S-8 filed by Ross Stores, Inc. on May 17, 2017 (Registration No. 333-218052).
10.9 Amended Ross Stores, Inc. 2017 Equity Incentive Plan, incorporated by reference to Exhibit 10.3 to the Form 10-Q filed byRoss Stores, Inc. for its quarter ended October 31, 2020.
10.10 Form of Restricted Stock Agreement, incorporated by reference to Exhibit 10.2 to the Form 10-Q filed by Ross Stores, Inc. forits quarter ended May 3, 2014.
10.11 Form of Restricted Stock Agreement, incorporated by reference to Exhibit 10.4 to the Form 10-Q filed by Ross Stores, Inc. forits quarter ended July 29, 2017.
10.12 Form of Restricted Stock Agreement, incorporated by reference to Exhibit 10.1 to the Form 10-Q filed by Ross Stores, Inc. forits quarter ended May 5, 2018.
10.13 Form of Restricted Stock Agreement for Nonemployee Director, incorporated by reference to Exhibit 10.5 to the Form 10-Q filedby Ross Stores, Inc. for its quarter ended July 29, 2017.
10.14 Form of Performance Share Agreement, incorporated by reference to Exhibit 10.6 to the Form 10-Q filed by Ross Stores, Inc.for its quarter ended July 29, 2017.
10.15 Form of Performance Shares Grant Agreement, incorporated by reference to Exhibit 10.2 to the Form 10-Q filed by RossStores, Inc. for its quarter ended May 5, 2018.
70
10.16 Form of Indemnity Agreement for Directors and Executive Officers, incorporated by reference to Exhibit 10.26 to the Form 10-Kfiled by Ross Stores, Inc. for its fiscal year ended February 2, 2013.
10.17 Forms of Executive Employment Agreement for Executive Officers, incorporated by reference to Exhibit 10.3 to the Form 10-Qfiled by Ross Stores, Inc. for its quarter ended May 5, 2018.
10.18 Forms of Executive Employment Agreement for Executive Officers, incorporated by reference to Exhibit 10.1 to the Form 10-Qfiled by Ross Stores, Inc. for its quarter ended May 4, 2019.
10.19 Form of Executive Employment Agreement for Executive Officers (CA), incorporated by reference to Exhibit 10.4 to the Form10-Q filed by Ross Stores, Inc. for its quarter ended May 2, 2020.
10.20 Form of Executive Employment Agreement for Executive Officers (NON-CA), incorporated by reference to Exhibit 10.5 to theForm 10-Q filed by Ross Stores, Inc. for its quarter ended May 2, 2020.
10.21 Amended and Restated Independent Contractor Consultancy Agreement effective January 6, 2010 between Norman A. Ferberand Ross Stores, Inc., incorporated by reference to Exhibit 10.47 to the Form 10-K filed by Ross Stores, Inc. for its fiscal yearended January 30, 2010.
10.22 Amended Independent Contractor Consultancy Agreement effective January 30, 2012 between Norman A. Ferber and RossStores, Inc., incorporated by reference to Exhibit 10.52 to the Form 10-K filed by Ross Stores, Inc. for its fiscal year endedJanuary 28, 2012.
10.23 Amendment to Independent Contractor Consultancy Agreement effective February 17, 2015 between Norman A. Ferber andRoss Stores, Inc., incorporated by reference to Exhibit 10.3 to the Form 10-Q filed by Ross Stores, Inc. for its quarter endedMay 2, 2015.
10.24 Amended and Restated Retirement Benefit Package Agreement effective January 6, 2010 between Norman A. Ferber andRoss Stores, Inc., incorporated by reference to Exhibit 10.48 to the Form 10-Q filed by Ross Stores, Inc. for its quarter endedMay 1, 2010.
10.25 Amended Retirement Benefits Package Agreement effective January 30, 2012 between Norman A. Ferber and Ross Stores,Inc., incorporated by reference to Exhibit 10.53 to the Form 10-K filed by Ross Stores, Inc. for its fiscal year ended January 28,2012.
10.26 Amendment to Retirement Benefit Package Agreement effective February 17, 2015 between Norman A. Ferber and RossStores, Inc., incorporated by reference to Exhibit 10.4 to the Form 10-Q filed by Ross Stores, Inc. for its quarter ended May 2,2015.
10.27 Third Amendment to Retirement Benefit Package Agreement effective January 1, 2016 between Norman A. Ferber and RossStores, Inc., incorporated by reference to Exhibit 10.39 to the Form 10-K filed by Ross Stores, Inc. for its fiscal year endedJanuary 30, 2016.
10.28 Amendment to Independent Contractor Consultancy Agreement effective March 1, 2017 between Norman A. Ferber and RossStores, Inc., incorporated by reference to Exhibit 10.2 to the Form 10-Q filed by Ross Stores, Inc. for its quarter ended July 29,2017.
10.29 Amendment to Independent Contractor Consultancy Agreement effective February 1, 2018 between Norman A. Ferber andRoss Stores, Inc., incorporated by reference to Exhibit 10.28 to the Form 10-K filed by Ross Stores, Inc. for its fiscal yearended February 2, 2019.
10.30 Amendment to Independent Contractor Consultancy Agreement effective July 30, 2019 between Norman A. Ferber and RossStores, Inc., incorporated by reference to Exhibit 10.2 to the Form 10-Q filed by Ross Stores, Inc. for its quarter ended August3, 2019.
71
10.31 Amendment to Independent Contractor Consultancy Agreement effective September 24, 2020 between Norman A. Ferber andRoss Stores, Inc., incorporated by reference to Exhibit 10.4 to the Form 10-Q filed by Ross Stores, Inc. for its quarter endedOctober 31, 2020.
10.32 Employment Agreement effective June 1, 2012 between Michael Balmuth and Ross Stores, Inc., incorporated by reference toExhibit 10.1 to the Form 10-Q filed by Ross Stores, Inc. for its quarter ended October 27, 2012.
10.33 First Amendment to Employment Agreement between Michael Balmuth and Ross Stores, Inc. dated March 15, 2015,incorporated by reference to Exhibit 10.2 to the Form 10-Q filed by Ross Stores, Inc. for its quarter ended August 1, 2015.
10.34 Second Amendment to Employment Agreement effective January 1, 2016 between Michael Balmuth and Ross Stores, Inc.,incorporated by reference to Exhibit 10.49 to the Form 10-K filed by Ross Stores, Inc. for its fiscal year ended January 30,2016.
10.35 Third Amendment to the Employment Agreement effective May 18, 2016 between Michael Balmuth and Ross Stores, Inc.,incorporated by reference to Exhibit 10.2 to the Form 10-Q filed by Ross Stores, Inc. for its quarter ended July 30, 2016.
10.36 Fourth Amendment to the Employment Agreement effective April 15, 2017 between Michael Balmuth and Ross Stores, Inc.,incorporated by reference to Exhibit 10.4 to the Form 10-Q filed by Ross Stores, Inc. for its quarter ended April 29, 2017.
10.37 Fifth Amendment to the Employment Agreement effective July 3, 2018 between Michael Balmuth and Ross Stores, Inc.,incorporated by reference to Exhibit 10.1 to the Form 10-Q filed by Ross Stores, Inc. for its quarter ended August 4, 2018.
10.38 Sixth Amendment to the Employment Agreement effective November 23, 2018 between Michael Balmuth and Ross Stores,Inc., incorporated by reference to Exhibit 10.35 to the Form 10-K filed by Ross Stores, Inc. for its fiscal year ended February 2,2019.
10.39 Seventh Amendment to the Employment Agreement effective July 13, 2019 between Michael Balmuth and Ross Stores, Inc.,incorporated by reference to Exhibit 10.1 to the Form 10-Q filed by Ross Stores, Inc. for its quarter ended August 3, 2019.
10.40 Eighth Amendment to the Employment Agreement effective September 24, 2020 between Michael Balmuth and Ross Stores,Inc., incorporated by reference to Exhibit 10.5 to the Form 10-Q filed by Ross Stores, Inc. for its quarter ended October 31,2020.
10.41 Employment Agreement effective March 16, 2019 between Barbara Rentler and Ross Stores, Inc., incorporated by reference toExhibit 10.2 to the Form 10-Q filed by Ross Stores, Inc. for its quarter ended May 4, 2019.
10.42 Employment Agreement effective August 16, 2019 between Michael Hartshorn and Ross Stores, Inc., incorporated byreference to Exhibit 10.1 to the Form 10-Q filed by Ross Stores, Inc. for its quarter ended November 2, 2019.
10.43 Employment Agreement effective March 16, 2020 between Brian Morrow and Ross Stores, Inc., incorporated by reference toExhibit 10.11 to the Form 10-Q filed by Ross Stores, Inc. for its quarter ended May 2, 2020.
10.44 Employment Agreement effective August 16, 2019 between Michael Kobayashi and Ross Stores, Inc., incorporated byreference to Exhibit 10.13 to the Form 10-Q filed by Ross Stores, Inc. for its quarter ended May 2, 2020.
72
10.45 Employment Agreement effective August 16, 2019 between Travis Marquette and Ross Stores, Inc., incorporated by referenceto Exhibit 10.2 to the Form 10-Q filed by Ross Stores, Inc. for its quarter ended November 2, 2019.
21 Subsidiaries.
23 Consent of Independent Registered Public Accounting Firm.
31.1 Certification of Chief Executive Officer Pursuant to Sarbanes-Oxley Act Section 302(a).
31.2 Certification of Chief Financial Officer Pursuant to Sarbanes-Oxley Act Section 302(a).
32.1 Certification of Chief Executive Officer Pursuant to 18 U.S.C. Section 1350.
32.2 Certification of Chief Financial Officer Pursuant to 18 U.S.C. Section 1350.
101.INS XBRL Instance Document. (The instance document does not appear in the Interactive Data File because its XBRL tags areembedded within the Inline XBRL document.)
101.SCH Inline XBRL Taxonomy Extension Schema
101.CAL Inline XBRL Taxonomy Extension Calculation Linkbase
101.DEF Inline XBRL Taxonomy Extension Definition Linkbase
101.LAB Inline XBRL Taxonomy Extension Label Linkbase
101.PRE Inline XBRL Taxonomy Extension Presentation Linkbase
104 Cover Page Interactive Data File. (The cover page interactive data file does not appear in the Interactive Data File because itsXBRL tags are embedded within the Inline XBRL document.)
73

EXHIBIT 21
SUBSIDIARIES & AFFILIATES
Certain subsidiaries and affiliates of the Registrant and their subsidiaries are listed below. The names of certain subsidiaries, whichconsidered in the aggregate would not constitute a significant subsidiary, have been omitted.
Subsidiary Name Domiciled Date of IncorporationRoss Procurement Inc. Delaware November 22, 2004Ross Merchandising Inc. Delaware January 12, 2004Ross Dress For Less, Inc. Virginia January 14, 2004Retail Assurance Group, Inc. Hawaii October 15, 1991Ross Distribution Company, LLC Delaware March 15, 2018

EXHIBIT 23
CONSENT OF INDEPENDENT REGISTERED PUBLIC ACCOUNTING FIRM
We consent to the incorporation by reference in Registration Statements No. 333-06119, No. 333-34988, No. 333-51478, No. 333-56831,No. 333-115836, No. 333-151116, No. 333-210465, and No. 333-218052 on Form S-8, and No. 333-237546 on Form S-3 of our report datedMarch 30, 2021, relating to the consolidated financial statements of Ross Stores, Inc. and subsidiaries (the “Company”), and theeffectiveness of the Company’s internal control over financial reporting, appearing in this Annual Report on Form 10-K of the Company forthe year ended January 30, 2021.
/s/DELOITTE & TOUCHE LLP
San Francisco, CaliforniaMarch 30, 2021
EXHIBIT 31.1
Ross Stores, Inc.Certification of Chief Executive OfficerPursuant to Sarbanes-Oxley Act Section 302(a)
I, Barbara Rentler, certify that:
1. I have reviewed this annual report on Form 10-K of Ross Stores, Inc.;
2. Based on my knowledge, this report does not contain any untrue statement of a material fact or omit to state a material fact necessary tomake the statements made, in light of the circumstances under which such statements were made, not misleading with respect to theperiod covered by this report;
3. Based on my knowledge, the financial statements, and other financial information included in this report, fairly present in all materialrespects the financial condition, results of operations and cash flows of the registrant as of, and for, the periods presented in this report;
4. The registrant's other certifying officer(s) and I are responsible for establishing and maintaining disclosure controls and procedures (asdefined in Exchange Act Rules 13a-15(e) and 15d-15(e)) and internal control over financial reporting (as defined in Exchange Act Rules13a-15(f) and 15d-15(f)) for the registrant and have:
(a) Designed such disclosure controls and procedures, or caused such disclosure controls and procedures to be designed under oursupervision, to ensure that material information relating to the registrant, including its consolidated subsidiaries, is made known to usby others within those entities, particularly during the period in which this report is being prepared;
(b) Designed such internal control over financial reporting, or caused such internal control over financial reporting to be designed underour supervision, to provide reasonable assurance regarding the reliability of financial reporting and the preparation of financialstatements for external purposes in accordance with generally accepted accounting principles;
(c) Evaluated the effectiveness of the registrant's disclosure controls and procedures and presented in this report our conclusions aboutthe effectiveness of the disclosure controls and procedures, as of the end of the period covered by this report based on suchevaluation; and
(d) Disclosed in this report any change in the registrant's internal control over financial reporting that occurred during the registrant'smost recent fiscal quarter (the registrant's fourth fiscal quarter in the case of an annual report) that has materially affected, or isreasonably likely to materially affect, the registrant's internal control over financial reporting; and
5. The registrant's other certifying officer(s) and I have disclosed, based on our most recent evaluation of internal control over financialreporting, to the registrant's auditors and the audit committee of the registrant's board of directors (or persons performing the equivalentfunctions):
(a) All significant deficiencies and material weaknesses in the design or operation of internal control over financial reporting which arereasonably likely to adversely affect the registrant's ability to record, process, summarize and report financial information; and
(b) Any fraud, whether or not material, that involves management or other employees who have a significant role in the registrant'sinternal control over financial reporting.
Date: March 30, 2021 /s/Barbara RentlerBarbara RentlerChief Executive Officer
EXHIBIT 31.2
Ross Stores, Inc.Certification of Chief Financial OfficerPursuant to Sarbanes-Oxley Act Section 302(a)
I, Travis R. Marquette, certify that:
1. I have reviewed this annual report on Form 10-K of Ross Stores, Inc.;
2. Based on my knowledge, this report does not contain any untrue statement of a material fact or omit to state a material fact necessary tomake the statements made, in light of the circumstances under which such statements were made, not misleading with respect to theperiod covered by this report;
3. Based on my knowledge, the financial statements, and other financial information included in this report, fairly present in all materialrespects the financial condition, results of operations and cash flows of the registrant as of, and for, the periods presented in this report;
4. The registrant's other certifying officer(s) and I are responsible for establishing and maintaining disclosure controls and procedures (asdefined in Exchange Act Rules 13a-15(e) and 15d-15(e)) and internal control over financial reporting (as defined in Exchange Act Rules13a-15(f) and 15d-15(f)) for the registrant and have:
(a) Designed such disclosure controls and procedures, or caused such disclosure controls and procedures to be designed under oursupervision, to ensure that material information relating to the registrant, including its consolidated subsidiaries, is made known to usby others within those entities, particularly during the period in which this report is being prepared;
(b) Designed such internal control over financial reporting, or caused such internal control over financial reporting to be designed underour supervision, to provide reasonable assurance regarding the reliability of financial reporting and the preparation of financialstatements for external purposes in accordance with generally accepted accounting principles;
(c) Evaluated the effectiveness of the registrant's disclosure controls and procedures and presented in this report our conclusions aboutthe effectiveness of the disclosure controls and procedures, as of the end of the period covered by this report based on suchevaluation; and
(d) Disclosed in this report any change in the registrant's internal control over financial reporting that occurred during the registrant'smost recent fiscal quarter (the registrant's fourth fiscal quarter in the case of an annual report) that has materially affected, or isreasonably likely to materially affect, the registrant's internal control over financial reporting; and
5. The registrant's other certifying officer(s) and I have disclosed, based on our most recent evaluation of internal control over financialreporting, to the registrant's auditors and the audit committee of the registrant's board of directors (or persons performing the equivalentfunctions):
(a) All significant deficiencies and material weaknesses in the design or operation of internal control over financial reporting which arereasonably likely to adversely affect the registrant's ability to record, process, summarize and report financial information; and
(b) Any fraud, whether or not material, that involves management or other employees who have a significant role in the registrant'sinternal control over financial reporting.
Date: March 30, 2021 /s/Travis R. MarquetteTravis R. MarquetteExecutive Vice President and Chief Financial Officer,and Principal Accounting Officer
EXHIBIT 32.1
Certification of Chief Executive Officer Pursuant to 18 U.S.C. Section 1350,As Adopted Pursuant to Section 906 of the Sarbanes-Oxley Act of 2002
In connection with the annual report of Ross Stores, Inc. (the “Company”) on Form 10-K for the year ended January 30, 2021 as filed with theSecurities and Exchange Commission on the date hereof (the "Report"), I, Barbara Rentler, as Chief Executive Officer of the Company,hereby certify, pursuant to 18 U.S.C. Section 1350, as adopted pursuant to Section 906 of the Sarbanes-Oxley Act of 2002 (“Section 906”),that, to the best of my knowledge:
(1) The Report fully complies with the requirements of Section 13(a) of the Securities Exchange Act of 1934 (15 U.S.C. 78m); and
(2) The information contained in the Report fairly presents, in all material respects, the financial condition and results of operations of theCompany.
Date: March 30, 2021 /s/Barbara RentlerBarbara RentlerChief Executive Officer
EXHIBIT 32.2
Certification of Chief Financial Officer Pursuant to 18 U.S.C. Section 1350,As Adopted Pursuant to Section 906 of the Sarbanes-Oxley Act of 2002
In connection with the annual report of Ross Stores, Inc. (the “Company”) on Form 10-K for the year ended January 30, 2021 as filed with theSecurities and Exchange Commission on the date hereof (the "Report"), I, Travis R. Marquette, as Chief Financial Officer of the Company,hereby certify, pursuant to 18 U.S.C. Section 1350, as adopted pursuant to Section 906 of the Sarbanes-Oxley Act of 2002 (“Section 906”),that, to the best of my knowledge:
(1) The Report fully complies with the requirements of Section 13(a) of the Securities Exchange Act of 1934 (15 U.S.C. 78m); and
(2) The information contained in the Report fairly presents, in all material respects, the financial condition and results of operations of theCompany.
Date: March 30, 2021 /s/Travis R. MarquetteTravis R. MarquetteExecutive Vice President and Chief Financial Officer,and Principal Accounting Officer
Related Documents