Forest Products Annual Market Review 2017-2018

Welcome message from author
This document is posted to help you gain knowledge. Please leave a comment to let me know what you think about it! Share it to your friends and learn new things together.
Transcript

Forest Products Annual Market Review 2017-2018

UNECE/FAO Forest Products Annual Market Review, 2017-2018ii
NOTEThe designations employed and the presentation of material in this publication do not imply the expression of any opinion whatsoever on the part of the secretariat of the United Nations concerning the legal status of any country, territory, city or area, or of its authorities, or concerning the delimitation of its frontiers or boundaries.
DISCLAIMERThe views expressed in this paper are those of the authors and do not necessarily reflect the views or carry the endorsement of the United Nations.
ABSTRACTThe Forest Products Annual Market Review 2017-2018 provides a comprehensive analysis of markets in the UNECE region and reports on the main market influences outside the UNECE region. It covers the range of products from the forest to the end-user: from roundwood and primary processed products to value-added and housing. Statistics-based chapters analyse the markets for wood raw materials, sawn softwood, sawn hardwood, wood-based panels, paper, paperboard and woodpulp. Other chapters analyse policies and markets for wood energy. Underlying the analysis is a comprehensive collection of data. The Review highlights the role of sustainable forest products in international markets. Policies concerning forests and forest products are discussed, as well as the main drivers and trends. The Review also analyses the effects of the current economic situation on forest products markets.
ECE/TIM/SP/46
UNITED NATIONS PUBLICATION
Sales No. E.18.II.E.27
ISBN 978-92-1-117174-7
eISBN 978-92-1-047350-7
ISSN 1020-2269

iiiForeword
Why do the UNECE and the FAO care about forest products markets? Firstly, forests are a key biome on our planet and the aim of maintaining their integrity is crucial to sustainable development. Secondly, forest products are economically important; thus, their production, trade and consumption have strong ramifications for maintaining livelihoods in rural forest areas and providing needed products for urban consumers.
These two aims would appear to be incongruent; preserve the integrity of forests yet provide products that require removing trees with the use of chainsaws, bulldozers and other heavy equipment. However, these two points are not mutually exclusive, and in fact there is a body of scientific evidence indicating that the use of forest products is not only good for the environment at large, but also is good for forests.
We know that wood has a relatively tiny carbon footprint when compared to alternative materials and this is not only the case for embodied carbon within the product but also over the entire lifecycle. Harvested wood accounts for only a moderate share of total tree growth with most of the CO2
emissions returning to the atmosphere through tree mortality. Increasing the utilization rate of trees by using wood to construct buildings and bridges could avoid significant carbon emissions if done in a sustainable manner. Studies indicate much lower emissions for wood compared with steel and concrete. The possibility of increasing timber utilization rates will vary from one country to another, but consider the example of the US, where it is estimated that the current level of timber harvest could be more than doubled and still be well within the threshold of sustainability.1
Of course, the benefits of forest products are not limited to buildings, packaging from wood and woodpulp can reduce the use of plastics, and textiles made from sustainable wood fibre can help mitigate the environmental harm from using fossil fuel-based synthetic fabrics or cotton farmed in dryland regions.
We are also aware of the fact that wood is reusable, recyclable and biodegradable, virtually without peer in other materials. The net result is that the use of wood can be a strong tool for mitigation of climate change - a major threat to forests: increasing the number and severity of wildfires, wind events, as well as increasing the severity of insect epidemics. All these climate change related disturbances result in massive CO
2 emissions, which can be juxtaposed with the sustainable harvest of trees, reducing fire
danger, while providing raw materials for forest products and sequestering carbon dioxide in long-lived forest products.
This publication provides the reader with a concise view on the state of wood-based forest products in the UNECE region. Products that have the potential to provide a solid “wooden” platform for achieving many of the UN Sustainable Development Goals.
1 https://archpaper.com/2017/11/timber-construction-sustainable/
FOREWORD
Hiroto MITSUGI
Assistant Director-General,
Forestry Department of the Food and Agriculture Organization of the United Nations
Olga ALGAYEROVA
Under-Secretary-General of the United Nations,
Executive Secretary of the United Nations Economic Commission for Europe

UNECE/FAO Forest Products Annual Market Review, 2017-2018iv
Overview of forest products markets and policies ................................................................... 11.1 Introduction to the publication........................................................................................................................................................................................................21.2 Economic developments with implications for the forest sector ...............................................................................................................................21.3 Policy and regulatory developments affecting the forest products sector ..........................................................................................................31.4 Summary of regional and subregional markets .....................................................................................................................................................................5
Policies shaping forest products markets .................................................................................102.1 Introduction ...............................................................................................................................................................................................................................................122.2 Trade-related .............................................................................................................................................................................................................................................122.3 Certified forest area ...............................................................................................................................................................................................................................182.4 Carbon-related .........................................................................................................................................................................................................................................202.5 References ...................................................................................................................................................................................................................................................22
Wood raw materials ......................................................................................................................263.1 Introduction ...............................................................................................................................................................................................................................................283.2 Europe ...........................................................................................................................................................................................................................................................293.3 Commonwealth of Independent States ..................................................................................................................................................................................313.4 North America ..........................................................................................................................................................................................................................................323.5 Extra-regional influence on the UNECE ....................................................................................................................................................................................333.6 Wood raw-material costs ...................................................................................................................................................................................................................333.7 References ...................................................................................................................................................................................................................................................37
Sawn softwood ..............................................................................................................................384.1 Introduction ...............................................................................................................................................................................................................................................404.2 Europe ...........................................................................................................................................................................................................................................................404.3 CIS, with a focus on the Russian Federation ..........................................................................................................................................................................424.4 North America ..........................................................................................................................................................................................................................................444.5 Extraregional influences affecting the UNECE region .....................................................................................................................................................464.6 Policy and regulatory influences on the sector ...................................................................................................................................................................484.7 References ...................................................................................................................................................................................................................................................49
Sawn hardwood .............................................................................................................................505.1 Introduction ...............................................................................................................................................................................................................................................525.2 Europe ...........................................................................................................................................................................................................................................................525.3 The CIS subregion ..................................................................................................................................................................................................................................535.4 North America ..........................................................................................................................................................................................................................................545.5 Extraregional influences affecting the UNECE region .....................................................................................................................................................575.6 Policy and regulatory influences .................................................................................................................................................................................................595.7 Innovation in the sector .....................................................................................................................................................................................................................595.8 References .................................................................................................................................................................................................................................................60
1
2
3
4
5
ACKNOWLEDGEMENTS ...................................................................................................................................................................................................................................... viiiCONTRIBUTORS TO THE PUBLICATION .........................................................................................................................................................................................................ixSTATISTICAL CORRESPONDENTS ....................................................................................................................................................................................................................... xDATA SOURCES ...........................................................................................................................................................................................................................................................xiEXPLANATORY NOTES............................................................................................................................................................................................................................................xiiACRONYMS, ABBREVIATIONS AND SYMBOLS ....................................................................................................................................................................................... xiii
CONTENTS

Contents v
Wood-based panels ......................................................................................................................626.1 Introduction ...............................................................................................................................................................................................................................................646.2 Europe ...........................................................................................................................................................................................................................................................646.3 Commonwealth of Independent States, with a focus on the Russian Federation ........................................................................................686.4 North America ..........................................................................................................................................................................................................................................716.5 Extraregional influences affecting the UNECE region .....................................................................................................................................................746.6 References ...................................................................................................................................................................................................................................................76
Paper, paperboard and woodpulp .............................................................................................787.1 Introduction ...............................................................................................................................................................................................................................................807.2 Europe ...........................................................................................................................................................................................................................................................817.3 Commonwealth of Independent States ..................................................................................................................................................................................847.4 North America ..........................................................................................................................................................................................................................................857.5 Extraregional influences affecting the UNECE region .....................................................................................................................................................877.6 Conclusions ................................................................................................................................................................................................................................................897.7 References ...................................................................................................................................................................................................................................................90
Wood energy markets ..................................................................................................................928.1 Introduction ...............................................................................................................................................................................................................................................948.2 Europe ...........................................................................................................................................................................................................................................................948.3 The CIS subregion ..................................................................................................................................................................................................................................968.4 North America ..........................................................................................................................................................................................................................................978.5 Policy, standards and regulatory influences ..........................................................................................................................................................................998.6 Innovation in the sector .................................................................................................................................................................................................................. 1018.7 Wood Charcoal...................................................................................................................................................................................................................................... 1018.8 New study ............................................................................................................................................................................................................................................... 1018.9 References ................................................................................................................................................................................................................................................ 102
Value-added wood products .....................................................................................................1049.1 Introduction ............................................................................................................................................................................................................................................ 1069.2 Wooden furniture trade in major markets ........................................................................................................................................................................... 1069.3 Builders’ joinery and carpentry, and profiled-wood trade.......................................................................................................................................... 1079.4 Parquet and wood flooring .......................................................................................................................................................................................................... 1109.5 Engineered wood products .......................................................................................................................................................................................................... 1109.6 Policy issues affecting markets for value-added wood products ......................................................................................................................... 1149.7 References ................................................................................................................................................................................................................................................ 115
Housing and construction .........................................................................................................11610.1 Introduction ............................................................................................................................................................................................................................................ 11810.2 European construction market ................................................................................................................................................................................................... 11810.3 CIS construction market, with a focus on the Russian Federation ....................................................................................................................... 12310.4 North American construction market .................................................................................................................................................................................... 12310.5 References .............................................................................................................................................................................................................................................. 126
Annexes .........................................................................................................................................138
6
7
8
9
10

UNECE/FAO Forest Products Annual Market Review, 2017-2018vi
LIST OF TABLES
TABLE 1.4.1 Apparent consumption of industrial roundwood, sawnwood, wood-based panels and paper and paperboard, UNECE region, 2013-2017 .................................................................................................................................................................................................................................. 5
TABLE 2.2.1 Clean Energy for all Europeans package ...............................................................................................................................................................................16TABLE 3.2.1 Industrial roundwood balance, Europe, 2016-2018 .......................................................................................................................................................29TABLE 3.2.2 Top five softwood log importers, 2007 and 2017 ............................................................................................................................................................30TABLE 3.3.1 Industrial roundwood balance, CIS, 2016-2018 ................................................................................................................................................................31TABLE 3.4.1 Industrial roundwood balance, North America, 2016-2018 ..........................................................................................................................................32TABLE 3.5.1 Softwood log imports to China, 2013 and 2017 ..............................................................................................................................................................33TABLE 4.1.1 Apparent consumption of sawn softwood in the UNECE region, by subregion, 2016-2017 ...............................................................40TABLE 4.2.1 Sawn softwood balance, Europe, 2016-2018 .....................................................................................................................................................................40TABLE 4.3.1 Sawn softwood balance, CIS subregion, 2016-2018.........................................................................................................................................................42TABLE 4.4.1 Sawn softwood balance, North America, 2016-2018 ....................................................................................................................................................44TABLE 4.5.1 Major importers and exporters of sawn softwoods outside the UNECE region, 2015-2017 ................................................................47TABLE 5.2.1 Sawn hardwood balance, Europe, 2016-2018 ..................................................................................................................................................................52TABLE 5.3.1 Sawn hardwood balance, CIS, 2016-2018 ...........................................................................................................................................................................54TABLE 5.4.1 Sawn hardwood balance, North America, 2016-2018 ..................................................................................................................................................55TABLE 5.5.1 Major importers and exporters of tropical sawn hardwood outside the UNECE region, 2015-2017 ..............................................58TABLE 6.2.1 Wood-based panel balance, Europe, 2016-2018 .............................................................................................................................................................64TABLE 6.2.2 Particle board balance, Europe, 2016-2018 .........................................................................................................................................................................65TABLE 6.2.3 Fibreboard balance, Europe, 2016-2018 ................................................................................................................................................................................66TABLE 6.2.4 OSB balance, Europe, 2016-2018 ...............................................................................................................................................................................................67TABLE 6.2.5 Plywood balance, Europe, 2016-2018 .....................................................................................................................................................................................67TABLE 6.3.1 Wood-based panel balance, CIS, 2016-2018.......................................................................................................................................................................68TABLE 6.3.2 Wood-based panel production, Russian Federation, 2014-2017 ...........................................................................................................................69TABLE 6.4.1 Wood-based panel balance, North America, 2016-2018 ............................................................................................................................................71TABLE 6.4.2 Value of wood-based panel imports, North America, 2014-2017 .........................................................................................................................73TABLE 6.4.3 Value of wood-based panel exports, North America, 2014-2017 ..........................................................................................................................74TABLE 6.5.1 Major importers and exporters of tropical plywood outside the UNECE region, by volume, 2015-2017 ....................................75TABLE 7.2.1 Paper and paperboard balance, Europe, 2016-2018 .....................................................................................................................................................82TABLE 7.2.2 Production and apparent consumption of paper and paperboard, Europe, 2013, 2016 and 2017 ................................................82TABLE 7.2.3 Woodpulp balance, Europe, 2016-2018 ................................................................................................................................................................................83TABLE 7.3.1 Production of chemical woodpulp, paper and paperboard, CIS, 2016-2017 .................................................................................................84TABLE 7.3.2 Paper and paperboard balance, CIS, 2016-2018 ...............................................................................................................................................................84TABLE 7.3.3 Chemical woodpulp balance, CIS, 2016-2017 ...................................................................................................................................................................84TABLE 7.4.1 Paper and paperboard balance, North America, 2016-2018 ..........................................................................................................................................85TABLE 7.4.2 Production and apparent consumption of paper and paperboard, North America, 2013, 2016 and 2017 ...............................85TABLE 7.5.1 Woodpulp balance, Brazil, 2016-2017 .....................................................................................................................................................................................87TABLE 7.5.2 Paper and paperboard balance, Brazil, 2016-2017 ..........................................................................................................................................................87TABLE 7.5.3 Pulp, paper and paperboard exports, Chile, 2016-2017 ..............................................................................................................................................88TABLE 7.5.4 Production and apparent consumption of pulp, paper and paperboard, China, 2017 ...........................................................................89TABLE 7.5.5 Pulp imports, China, 2016-2017 ..................................................................................................................................................................................................89TABLE 7.5.6 Recovered-paper imports, China, 2016-2017 .....................................................................................................................................................................89TABLE 8.2.1 Wood pellet balance, Europe, 2016-2018 .............................................................................................................................................................................94TABLE 8.3.1 Wood pellet balance, CIS, 2016-2018 ......................................................................................................................................................................................96TABLE 8.4.1 Wood pellet balance, North America, 2016-2018 ...........................................................................................................................................................98TABLE 8.4.2 Wood energy product prices, North America, 2016-2017 .........................................................................................................................................98TABLE 9.2.1 Value of furniture imports, and market share of supplying regions, top five importing countries, 2016 and 2017 ...........107TABLE 9.3.1 Value of builders’ joinery and carpentry imports, and market share of supplying regions, top five importing countries, 2016 and 2017 ..................................................................................................................................................................108TABLE 9.3.2 Value of builders’ joinery and carpentry imports, and market share of supplying regions, top five importing countries, 2016 and 2017 ..................................................................................................................................................................110TABLE 9.5.1 Glulam production and consumption, North America, 2016-2018 ..................................................................................................................111TABLE 9.5.2 Wooden I-beam consumption and production, North America, 2016-2018 .............................................................................................112TABLE 9.5.3 Laminated veneer lumber consumption and production in North America, 2016-2018 ...................................................................112TABLE 9.5.4 Cross-laminated timber production, Europe, 2016 and 2020 ...............................................................................................................................113TABLE 10.2.1 Construction spending forecast, Euroconstruct region, 2018-2020 (€ billion) ...........................................................................................119TABLE 10.2.2 Top five Euroconstruct region countries for total housing permits, 2017-2020 ........................................................................................120TABLE 10.2.3 Top five Euroconstruct region countries for total housing starts, 2017-2020 .............................................................................................120TABLE 10.2.4 Top five Euroconstruct region countries for total housing completions, 2017-2020.............................................................................120TABLE 10.2.5 Top five Euroconstruct region countries for new construction and remodelling expenditures, 2017-2020 .........................121TABLE 10.2.6 Civil-engineering construction spending forecast, Euroconstruct region, 2017-2020 .........................................................................122

Contents vii
LIST OF GRAPHS
GRAPH 1.2.1 Major currencies used to trade forest products indexed against the US dollar, January 2017–June 2018 .....................................................3GRAPH 2.2.1 Replies to the European Commission question: “Is there a need to amend the current product scope of the EUTR?” .......................14GRAPH 2.2.2 Imports of tropical logs, sawnwood and plywood by region and certain other markets, 1996-2016 ............................................................14GRAPH 2.2.3 Annual net growth, mortality and harvest on US National Forest timberlands, 1952-2016 ..................................................................................16GRAPH 2.3.1 Number of chain-of-custody certificates issued globally by the FSC and the PEFC, 2010-2018 ........................................................................19GRAPH 3.1.1 Apparent consumption of softwood industrial roundwood in the UNECE region, by subregion, 2013-2018..........................................28GRAPH 3.1.2 Apparent consumption of hardwood industrial roundwood in the UNECE region, by subregion, 2013-2018 ........................................28GRAPH 3.1.3 Top five global trade flows of softwood roundwood, 2013-2017 ..........................................................................................................................................29GRAPH 3.6.1 Global Softwood Sawlog Price Index, 2009-2018 ............................................................................................................................................................................33GRAPH 3.6.2 Softwood sawlog price indices, Germany, Poland, the Russian Federation and Sweden, 2013-2018 ............................................................34GRAPH 3.6.3 Coniferous sawlog cost indices, North America, 2013-2018 .....................................................................................................................................................34GRAPH 3.6.4 Global wood-fibre price indices for softwood and hardwood, 1990-2018 ......................................................................................................................34GRAPH 3.6.5 Coniferous wood-chip price indices, Canada West, US South, Germany and Sweden, 2013-2018 ..................................................................35GRAPH 3.6.6 Coniferous pulplog price indices, Finland, Germany, the Russian Federation and the US South, 2013-2018 ............................................35GRAPH 3.6.7 Wood pellet feedstock price indices, Canada and the US, 2013-2018 ................................................................................................................................36GRAPH 4.2.1 European sawn softwood prices in Japan, Europe and the Middle East, 2013-2018 ................................................................................................41GRAPH 4.2.2 Main European sawn softwood overseas exports, 2015-2017 .................................................................................................................................................42GRAPH 4.3.1 Sawn softwood prices in the Russian Federation, 2013-2018 ..................................................................................................................................................43GRAPH 4.3.2 Russian Federation sawn softwood exports, by market, 2017 .................................................................................................................................................43GRAPH 4.3.3 Russian Federation sawn softwood exports to Europe, 2016 and 2017 ............................................................................................................................44GRAPH 4.3.4 Russian Federation sawn softwood exports to China, by species, 2017 ............................................................................................................................44GRAPH 4.4.1 Quarterly prices for sawn softwood in China, Europe, Japan and the US, 2010-2018 ..............................................................................................46GRAPH 5.2.1 Ten year trend of Croatian non-coniferous sawnwood production, 2007-2017...........................................................................................................53GRAPH 5.2.2 EU hardwood log exports by destination, 2014-2017 ...................................................................................................................................................................53GRAPH 5.3.1 Monthly prices for sawn hardwood in Russian Federation, 2017-2018 ..............................................................................................................................54GRAPH 5.3.2 Sawn hardwood exports by species from Russian Federation in 2017. .............................................................................................................................54GRAPH 5.4.1 US sawn hardwood consumption by segment, 2001-2017 ......................................................................................................................................................55GRAPH 5.4.2 Inflation-adjusted price indices for sawn hardwood product grades, 2000-2018 .......................................................................................................56GRAPH 5.4.3 North American exports, excluding bilateral trade between US and Canada, 2001-2017 .....................................................................................57GRAPH 5.4.4 US and North American Production of Sawn Hardwood, 2000-2018 .................................................................................................................................57GRAPH 6.2.1 Wood-based panel production, Europe, 2017 ...................................................................................................................................................................................65GRAPH 6.3.1 Wood-based panel production, Russian Federation, 2013-2017 ............................................................................................................................................69GRAPH 6.3.2 Monthly prices for wood-based panels, Russian Federation, 2012-2018 ..........................................................................................................................70GRAPH 6.3.3 Fibreboard imports, Russian Federation, 2017 ...................................................................................................................................................................................70GRAPH 6.3.4 Imports of fibreboard, OSB, particle board and plywood, Russian Federation, 2013-2017 ....................................................................................71GRAPH 6.3.5 Plywood exports, Russian Federation, 2017 .........................................................................................................................................................................................71GRAPH 6.3.6 Exports of fibreboard, OSB, particle board and plywood, Russian Federation, 2013-2017.....................................................................................71GRAPH 6.4.1 Structural panel consumption and housing starts, North America, 2013-2017 ...........................................................................................................72GRAPH 6.4.2 Four main end-use markets for OSB and plywood, North America, 2016 and 2017..................................................................................................72GRAPH 6.4.3 Plywood and OSB capacity utilization rates, North America, 2011-2017 ..........................................................................................................................72GRAPH 6.4.4 Wood-based panel prices, North America, 2013-2018 .................................................................................................................................................................73GRAPH 7.1.1 Apparent consumption of paper and paperboard, UNECE region, 2013-2018.............................................................................................................80GRAPH 7.1.2 Production of paper and paperboard, UNECE region, 2013-2018 .........................................................................................................................................81GRAPH 7.1.3 Production of woodpulp, UNECE region, 2013-2018 .....................................................................................................................................................................81GRAPH 7.1.4 Apparent consumption of woodpulp, UNECE region, 2013-2018 ........................................................................................................................................82GRAPH 7.4.1 Apparent consumption of paper and paperboard, North America, 2013-2017 ...........................................................................................................86GRAPH 7.4.2 Production of chemical woodpulp, North America, 2009-2017 .............................................................................................................................................87GRAPH 8.2.1 Total EU28 primary energy production from solid biofuels, and share of imports, 2006-2016 ...........................................................................94GRAPH 8.2.2 Wood pellet prices at Amsterdam, Rotterdam and Antwerp, January 2017-May 2018 ...........................................................................................95GRAPH 8.2.3 Imports by source of wood pellets by EU28 countries, 2012-2017 ......................................................................................................................................96GRAPH 8.3.1 Wood pellet production, Russian Federation (by region), 2012-2017 .................................................................................................................................96GRAPH 8.4.1 Production of fuelwood and wood pellets in Canada, 2000 and 2017 .............................................................................................................................97GRAPH 8.4.2 Export destinations of US wood pellets, 2017 ...................................................................................................................................................................................98GRAPH 9.2.1 Wooden furniture imports, top five importing countries, 2013-2017 ..............................................................................................................................107GRAPH 9.3.1 Builders’ joinery and carpentry imports, top five importing countries, 2013-2017 ..................................................................................................108GRAPH 9.3.2 Profiled-wood imports, top five importing countries, 2013-2017 ......................................................................................................................................109GRAPH 9.5.1 Glulam production in North America, 2010–2018 .......................................................................................................................................................................111GRAPH 9.5.2 I-beam market share of total raised wood-floor area, single-family homes, US, 2010-2018 ..............................................................................111GRAPH 9.5.3 I-beam production, North America, 2010-2018 .............................................................................................................................................................................111GRAPH 9.5.4 Laminated veneer lumber production in North America, 2010-2018 ..............................................................................................................................112GRAPH 10.2.1 Building permits, housing starts and completions, Euroconstruct region, 2002-2020 ..........................................................................................120GRAPH 10.2.2 European construction spending, 2012-2020 .................................................................................................................................................................................122GRAPH 10.2.3 New construction spending, by Euroconstruct subregion and sector, 2017 ..............................................................................................................122GRAPH 10.4.1 Housing starts, North America, 2011-2020 ........................................................................................................................................................................................123GRAPH 10.4.2 US housing permits, starts and completions, 2011-2018 .........................................................................................................................................................124GRAPH 10.4.3 US construction spending, 2011-2018 .................................................................................................................................................................................................124GRAPH 10.4.4 Housing starts, Canada, 2011-2018 ........................................................................................................................................................................................................125

UNECE/FAO Forest Products Annual Market Review, 2017-2018viii
ACKNOWLEDGEMENTS
The Forest Products Annual Market Review is the result of a cooperative effort involving a network of official country correspondents, authors, reviewers, editors, the UNECE/FAO Team of Specialists on Sustainable Forest Products and a team of people working in the Forestry and Timber Section in Geneva and in FAO, Rome. In combination, this network provides an unrivalled source of expertise and knowledge, which is the hallmark of the Review.
Many of the people involved in producing the Forest Products Annual Market Review volunteer their time and expertise; others are supported by companies, universities, industry associations and a variety of other organizations. Without the help of all these people and institutions, it would not be possible to produce this annual publication. This edition could not have been published without the financial support of the government of Finland.
The Review benefits from a longstanding partnership with the Department of Forest Sciences at the University of Helsinki. This year, Kalle Greis and Markus Stolze, undertook market research; prepared price data; generated all the graphics and revised the Graphics Production System; and reviewed and prepared data. Their input has been critical for ensuring the quality of the publication and meeting deadlines. Professor Anne Toppinen at the Department of Forest Sciences facilitated their placement here: we look forward to continuing this mutually beneficial arrangement.
We acknowledge the authors who wrote the chapters and, in so doing, shared their expertise and knowledge. They not only provided much of the market intelligence in their own chapters, they also assisted with data and information used elsewhere in the publication, including the summarized information in the Overview. You can find contact details and affiliations of all authors in the annex.
The authors are as follows:
In the UNECE/FAO Forestry and Timber Section, Alex McCusker collected, validated and produced the statistics; and Paola Deda proofread the chapters. Karen Taylor and Roksolana Shelest dealt with administrative matters.
The project was managed by Florian Steierer. Matt Fonseca reviewed the chapters and provided guidance on content. The chapters were reviewed at FAO by Pierre Bouillon, Thais Juvenal, Arvydas Lebedys, Petri Lehtonen, Alicja Kacprzak, Ekrem Yazici, and Zuzhang Xia.
Final review in Geneva was done by Paola Deda and Roman Michalak, Forestry and Timber Section. Finally, the manuscript was checked by Eoin O’Driscoll, Marketing Consultant, Drima Marketing Research. Alastair Sarre edited the text.
In all, 44 people were directly involved in the preparation of this publication, not including the additional contributors and statistical correspondents listed separately on the following pages.
The manuscript was completed on 15 August 2018.
Orifjon Abidov Christopher Gaston Igor Novoselov
Karen Abt Branko Glavonjić Rupert Oliver
Francisco Aguilar Antti Koskinen Tapani Pahkasalo
Eduard Akim Klaus Kottwitz José Palacín
Delton Alderman Bernard Lombard Houston Sudekum
Vladimir Dmitriev William Luppold Russ Taylor
Ivan Eastin Warren Mabee Michel Valois
Håkan Ekström Frances Maplesden Oleg Vasilyev
Kathryn Fernholz

ixContributors to the publication
CONTRIBUTORS TO THE PUBLICATION
The UNECE/FAO Forestry and Timber Section would like to express its appreciation for the information and assistance received from the following people in preparing the Forest Products Annual Market Review 2017-2018. Authors are acknowledged separately. The base data for the Review were supplied by country statistical correspondents, who are also acknowledged in a separate listing. We regret any omissions.
Kathy Abusow, Sustainable Forestry Initiative (SFI), Canada
Yngve Abrahamsen, Euroconstruct, Swiss Economic Institute, Switzerland
Diego Benedetti, European Sawmilling Organization (EOS), Belgium
Cristina Calderón, AEBIOM - European Biomass Association, Belgium
Jean Christophe Claudon, International Tropical Timber Organization (ITTO), Japan
Ariane Crevecoeur, Confederation of European Paper Industries (CEPI), Belgium
Stefano Dezzuto, Federlegno, Italy
Henric Endoff, AB Global, Sweden
Michael Köhl, Hamburg University, Germany
Joy Knick, Random Lengths Publication Inc, US
Rajmund Lackzo, Eurostat, Luxembourg
Bernard Lombard, Confederation of European Paper Industries (CEPI), Belgium
William Luppold, USDA Forest Service, US
Sundar Mahadevan, American Forest and Paper Association, US
Dan Meyer, Hardwood Publishing Inc, US
Peter Moonen, Canadian Wood Council, Ottawa, Canada
Lech Muszynski, Oregon State University, US
Hanna Price, Programme for the Endorsement of Forestry Certification (PEFC), Switzerland
Olga Rakitova, Infobio, The Bioenergy International and National Bioenergy, Russian Federation
Václav Stránský, Forestry Department, Ministry of Agriculture, Czech Republic
Anne Toppinen, University of Helsinki, Finland
Maria Wolf-Crowther, Eurostat, Luxembourg

UNECE/FAO Forest Products Annual Market Review, 2017-2018x
STATISTICAL CORRESPONDENTS
The national statistical correspondents listed below are the key suppliers of data for this publication. We are grateful for their essential contributions and their significant efforts in collecting and preparing the data. Complete contact information for the correspondents is provided in the publication Forest Products Statistics.2
Natalia Barten, National Statistical Committee, Belarus
Resat Benli, General Directorate of Forestry, Turkey
Simon Bridge, Natural Resources, Canada
Thomas Erhart, Office of Statistics, Liechtenstein
Spela Gale, Statistical Office of the Republic of Slovenia
Branko Glavonjic, Faculty of Forestry, Belgrade State University, Serbia
Sabina Guliyeva, State Statistical Committee, Azerbaijan
Jon Gudmundur Gudmundsson, Statistics Iceland
Johannes Hangler, Forest Policy and Forest Information, Federal Ministry of Agriculture, Forestry, Environment and Water Management, Austria
Sobir Hasanov, State Statistical Committee, Uzbekistan
James L. Howard, Forest Products Laboratory, USDA Forest Service, US
Surendra Joshi, Policy and Analysis Division, Swedish Forest Agency, Sweden
Boro Kovacevic, Agency for Statistics of Bosnia and Herzegovina, Bosnia and Herzegovina
Miroslav Kovalcik, Department of Forest Policy and Economics, National Forest Centre, Slovakia
Ewa Leszczyszyn. Wood Technology Institute, Poland
Graça Louro, Institute of Nature and Forest Conservation, Portugal
Ludmila Lungu, National Bureau of Statistics, Republic of Moldova
Elina Mäki-Simola, Forest Statistics Information Service, Natural Resources Institute Finland
Kohut Mickiewicz, Forestry Department, Belarus
Girgina Nikoleva, National Statistical Institute, Bulgaria
Olivian Nutescu, National Institute of Statistics, Romania
Eoin O’Driscoll, The Forest Service, Department of Agriculture, Fisheries and Food, Ireland
Jan Oldenburger, Probos Foundation, Netherlands
Guilhemine Astrie Pechin, Statistiques forestieres, Ministère de l’Agriculture, de l’alimentation, de la Pêche, de la ruralité et de l’aménagement du territoire, France
Ms. Inna Petrichenko, State Statistics Service of Ukraine
Ewa Ratajczak, Wood Technology Institute, Poland
Madis Raudsaar, Department of Forestry Statistics, Estonian Environment Information Centre, Estonia
Anahit Safyan, International Statistical Cooperation, National Statistical Service, Armenia
Andrea Savvas, Department of Forests, Ministry of Agriculture, Natural Resources and Environment, Cyprus
Gulaiym Shayahmetova, National Statistical Committee, Kyrgyzstan
Trond Steinset, Division for Primary Industry Statistics, Statistics Norway - Statistisk sentralbyrå, Norway
Liga Struve, Ministry of Agriculture, Latvia
Biljana Stefanova, Dissemination, State Statistical Office of the Republic of Macedonia, The former Yugoslav Republic of Macedonia
Maria Torres-Quevedo Garcia de Quesada, Directorate-General of Rural Development and Forest Policy, Ministry of Agriculture and Fisheries, Food and Environment, Spain
Emmanuel Treeby, National Statistics Office, Malta
Novica Tmušić, Ministry of Agriculture and Rural Development, Montenegro
Darius Vizlenskas, Forest Management and Forestry Statistics Department, State Forest Service, Lithuania
Dinko Vusic, Faculty of Forestry, University of Zagreb, Croatia
Sheila Ward, Economics and Statistics, Forestry Commission, UK
Holger Weimar, Federal Research Institute for Rural Areas, Forestry, and Fisheries, “Johann Heinrich von Thünen Institut (vTI)”, Germany
Frank Wolter, Administration de la nature et des forêts, Luxembourg
Arthur Zesiger, Federal Statistical Office, Switzerland
Nino Zurabishvili, National Statistics Office, Georgia
2 Forest Products Statistics is available at: www.unece.org/forests/fpm/onlinedata
xiData sources
DATA SOURCES
The data on which the Forest Products Annual Market Review is based are collected from official national correspondents through the FAO/UNECE/Eurostat/ITTO Joint Forest Sector Questionnaire, distributed in April 2018. Within the 56-country UNECE region, data for the 32 EU and EFTA countries are collected by Eurostat and for other UNECE countries by UNECE/FAO Geneva. All data are validated by UNECE/FAO Geneva.
The statistics for this Review are from the TIMBER database system. Because the database is continually updated, any single publication provides only a snapshot of the database. Data quality differs between countries, products and years. Improving data quality is a continuing task of the secretariat.
With our partner organizations and national correspondents, we strongly believe that the quality of the international statistical base for analysis of the forest products sector is improving steadily. The goal of the partner organizations is to have a complete and current database, validated by national correspondents, available from FAO in Rome, Eurostat in Luxembourg, ITTO in Yokohama and UNECE/FAO in Geneva. We are convinced that the dataset used in the Review is the best available anywhere, as of August 2018.
The data in this publication form only a small part of the total data available. Forest Products Statistics will include all available data for the years 2013-2017. The TIMBER database is available on the website of the joint UNECE Committee on Forests and the Forest Industry and FAO European Forestry Commission at www.unece.org/forests/fpm/onlinedata. More complete trade flow information is available at www.unece.org/forests/fpm/onlinedata/forest-products-trade-flow.
The secretariat is grateful that correspondents provided actual statistics for 2017 or, in the absence of formal statistics, their best estimates. Following a recommendation from the Team of Specialists on Forest Products Statistics, in some cases data from the Timber Forecast Questionnaire have been used – these are marked as national estimates (N). All statistics for 2017 are provisional and subject to revision at a later date. The responsibility for national data lies with the national correspondents. The official data supplied by correspondents account for the great majority of records. In some cases, where no data were supplied, where data lacked internal consistency or when data were confidential, the secretariat estimated figures to keep regional and product aggregations comparable and to maintain comparability over time. Estimates are flagged in this publication, but only for products at the lowest level of aggregation.
Despite the best efforts of all involved, some significant problems remain. Chief among these are differing definitions, especially when these are not specified in the data, and unrecorded removals and production. For wood fuel removals, for example, the officially reported volumes may be as low as 20% of actual removals in some countries. The Joint Wood Energy Enquiry (JWEE) has gone some way towards improving the quality and coverage of data for wood energy. Conversions into the standard units used here are also not necessarily done in a consistent manner. The Joint FAO/UNECE Working Party on Forest Statistics, Economics and Management and its Team of Specialists on Forest Products Statistics is carrying out work to increase awareness of problems in measurement and how to deal with these.
In addition to the official statistics received through the Joint Forest Sector Questionnaire (JFSQ), trade association and government statistics have been used to complete the analysis for 2017 and early 2018. Supplementary information was obtained from experts, including national statistical correspondents, trade journals, the United Nations trade database (COMTRADE) and websites. These sources are given in the text.

UNECE/FAO Forest Products Annual Market Review, 2017-2018xii
EXPLANATORY NOTES
“Apparent consumption” is calculated by adding imports to a country’s production and subtracting exports. Apparent consumption volumes are not adjusted for levels of stock. “Apparent consumption” is synonymous with “demand” and “use” and often referred to as “consumption”. Consumption is a sum of a country’s (or subregion) production, imports and exports.
For ease of reading, the publication mostly provides value data in US dollars (indicated by the sign “$”). Unless specific for a given time period, the applied exchange rate for the euro in 2017 is €0.886 = $1 and for the Russian rouble is 58.14 RUB = $1. Both these exchange rates are based on the annual average rate provided by UNECE (http://w3.unece.org/PXWeb/en).
“Net trade” is the balance of exports and imports and is positive for net exports (i.e. when exports exceed imports) and negative for net imports (i.e. when imports exceed exports). Trade data for the 28 European Union countries include intra-EU trade, which is often estimated by the countries. Export data usually include re-exports. Subregional trade aggregates in tables include trade occurring between countries of the subregion.
For a breakdown of the region into its subregions, please see the map in the annex. The term Commonwealth of Independent States (CIS) is used for reasons of geographic proximity and similarities in economic structure and refers collectively to 12 countries: Armenia, Azerbaijan, Belarus, Georgia*, Kazakhstan, Kyrgyzstan, Republic of Moldova, Russian Federation, Tajikistan, Turkmenistan*, Ukraine* and Uzbekistan (* not member states of the CIS). It is used solely for the reader’s convenience.
The term “softwood” is used synonymously with “coniferous”. “Hardwood” is used synonymously with “non-coniferous” or “broadleaved”. “Lumber” is used synonymously with “sawnwood”. More definitions appear in the electronic annex.
All references to “ton” or “tons” or "tonnes" in this text represent the metric unit of 1,000 kilograms (kg) unless otherwise indicated.
A billion refers to a thousand million (109).
Please note that all volumes of US and Canadian sawn softwood production and trade are given in solid m3, converted from nominal m3.
The use of the term “oven-dry” in this text is used in relation to the weight of a product in a completely dry state: e.g. an oven-dry metric tonne of wood fibre means 1,000 kg of wood fibre containing no moisture at all.
The term “chemical pulp” refers to semi-chemical woodpulp, chemical woodpulp and dissolving grades, unless otherwise indicated.

xiiiAcronyms, abbreviations and symbols
ACRONYMS, ABBREVIATIONS AND SYMBOLS(Infrequently used abbreviations spelled out in the text may not be listed again here)
$ US dollar unless otherwise specified
€ Euro
… Not Available
APA The Engineered Wood Association
BC British Columbia, Canada
BJC builders’ joinery and carpentry
CAD Canadian dollar
CEPI Confederation of European Paper Industries
CETA comprehensive economic and trade agreement
CFDs Contracts for difference
CIF cost, insurance and freight
CIS Commonwealth of Independent States
CLT cross-laminated timber
CoC chain-of-custody
EFTA European Free Trade Association
EPF European Panel Federation
EU European Union
EUTR European Union Timber Regulation
EWPs engineered wood products
FCA free carrier
FLEGT the Forest Law Enforcement, Governance and Trade
FOB free on board
FSC Forest Stewardship Council
GDP gross domestic product
GHG greenhouse gas
ha hectare
HDF High-density fibreboard
IMF International Monetary Fund
ISO The International Organization for Standardization
ITTO International Tropical Timber Organization
LSL laminated strand lumber
LULUCF Land Use Land-use change and forestry
LVL laminated veneer lumber
m.t. metric ton or tonne
m2 square metre
m3 cubic metre
MDF medium-density fibreboard
MENA Middle East North Africa
MW megawatt
MWh megawatt hour
MWth megawatt thermal
OSB oriented strand board
OSL oriented strand lumber
PEFC Programme for the Endorsement of Forest Certification
PEPI-US US pellet Feedstock Price Index
PJ petajoule
PSL parallel stand lumber
REDD Reducing Emissions from Deforestation and Forest Degradation
SBP The sustainable biomass program
SDG UN Sustainable development goals
SFI Sustainable Forestry Initiative
TTIP Transatlantic trade and investment partnership
TWh Terawatt hour
UK United Kingdom of Great Britain and Northern Ireland
UNFCCC United Nations Framework convention on climate change
US United States of America
VAWPs value-added wood products
VPAs Voluntary Partnership Agreements

Chapter 1
OVERVIEW OF FOREST PRODUCTS MARKETS AND POLICIES
Author of economic overview: José Palacín

Chapter 1 Overview of forest products markets and policies
Highlights
For the first time since the 2008 global financial crisis, economic growth was observed in all UNECE member countries in 2017. In the US, the unemployment rate fell below pre-crisis levels.
Forest products are embroiled in trade disagreements, notably between Canada and the US, with some Governments deliberating free trade versus protecting domestic forest-based industries.
The total global certified forest area, with double-counting subtracted, was 431.4 million hectares in mid-2017, up by 3.7 million hectares from December 2016.
An estimated 1.35 billion m3 of roundwood was harvested in the UNECE region in 2017, up by 0.4% from 2016.
Sawn softwood production and consumption increased in 2017 in all three UNECE subregions.
Increased demand, reduced Canadian production, and the imposition of import duties on Canadian sawn softwood to the US led to record-high sawnwood prices in the US in 2017, with a ripple effect on prices in most other major global markets.
The production of sawn hardwood was flat in the UNECE region in 2017, at 41.7 million m3. Sawn hardwood consumption decreased by 3.2%, to 34.4 million m3.
Consumption and production of wood-based panels increased in every UNECE subregion in 2017.
The consumption of paper and paperboard decreased in all three UNECE subregions in 2017 and by 0.9% in the UNECE region as a whole.
Woodpulp production increased in Europe and the CIS in 2017 but fell in North America. Overall, the production of woodpulp increased by 0.3% in the UNECE region.
The production of wood pellets increased in every subregion in 2017, to 28.3 million tonnes, up by 5.9% compared with 2016.
Wood pellet production increased by 21.5% in the CIS in 2017 and by 20% in the Russian Federation. Wood pellet exports from the CIS increased by 31.9% in 2017, to 1.8 million m3.
Global furniture production increased by $20 billion in 2017, to $440 billion. China remained the biggest producer and exporter of furniture and the US was the biggest importer.
The production of cross-laminated timber is expected to increase dramatically by 2020; the potential of this product in construction remains large in the UNECE region.
House prices increased by an average of 5% in advanced economics in 2017 and by 4% in emerging markets. They increased in Europe and North America but declined in the CIS.
Housing starts are expected to increase in North America until at least 2020.
1
UNECE/FAO Forest Products Annual Market Review, 2017-20182
1.1 Introduction to the publication
The 2018 edition of the UNECE/FAO Forest Products Annual Market Review provides a comprehensive review of market developments in the UNECE region in 2017 and the first half of 2018 and of the policies driving those developments. The UNECE region has three subregions: Europe, the Commonwealth of Independent States (CIS) and North America. It stretches from Canada and the United States of America (US) in the west through Europe to the Russian Federation and the Caucasus and Central Asian republics in the east. It encompasses about 1.7 billion hectares of forest, which is almost all the boreal and temperate forests in the Northern Hemisphere and just under half the world’s total forest area.
The Review provides background for the Market Discussion, to be held during the session of the UNECE Committee on Forests and the Forest Industry, which takes place on 5-9 November 2018 in Vancouver, Canada.
This chapter acts as an executive summary, providing an overview of the ensuing nine chapters. Section 1.2, which follows this section, describes the broad macroeconomic situation in the UNECE region.
Chapters 2-10 outline the impacts of the economic situation on particular sectors and geographical regions. Chapter 2 provides background on the policies and market tools influencing the forest products sector, including those related to trade, energy and the environment (e.g. certified forest products, carbon accounting and markets, and green buildings).
The Review presents and analyses the best available annual statistics for the period 2017-2018 collected by the UNECE/FAO Forestry and Timber Section from official country statistical correspondents and expert estimates.
The trends discussed in this publication comprise a mix of data from the UNECE/FAO Timber database (presented for the UNECE region as a whole and for each of the three subregions) and author-provided data, which may be derived from various sources, including the authors’ own market intelligence. A significant effort has been made to reconcile data and trends, but occasionally there are differences between sources. Additionally, there are times when authors may point to trends or data for different geographic aggregations than the standard subregions. References to “Europe”, “the CIS” and “North America” in this publication always pertain to the standard subregions (see the map, “Countries in the UNECE region”, in the annex of this publication).
Electronic annexes3 provide additional statistical information, and the full UNECE/FAO TIMBER database is also available on
3 www.unece.org/forests/fpamr2018-annex
the web.4 These comprehensive statistics, which form the basis of many of the chapters, ensure data transparency in the Review. References at the end of each chapter not only support and give credit for the ideas expressed in the chapter but also provide sources for further reading and research.
The 2018 edition of the Review provides an analysis of markets outside the region. Forest products are increasingly traded globally, with pronounced effects on markets inside the UNECE region.
1.2 Economic developments with implications for the forest sector
The pace of economic activity accelerated in the UNECE region in 2017 amid a stronger world economy. For the first time since the 2008 global financial crisis, economic growth was observed in all UNECE countries, albeit with marked differences. In the US, increased consumption and exports and a turnaround in investment led to relatively rapid growth. In the euro area, a broad-based recovery gained momentum and became more synchronized. In the new EU member countries, output expanded at the fastest rate in a decade, driven by the upturn in the rest of the EU, supportive policies, and increased EU transfers. Data for early 2018, however, suggest a slowdown in the EU as a whole, due partly to temporary factors (e.g. strikes and cold weather). In the CIS, a return to growth in the Russian Federation after a two-year contraction had a positive impact throughout the subregion, supported by better terms of trade and less-volatile macroeconomic conditions.
Continued expansion led to improved labour market dynamics in the UNECE region. In the US, unemployment fell to a level below that observed before the global financial crisis, and the strong momentum for job creation continued in early 2018. Despite falling unemployment, wage growth remains relatively muted. In the euro area, unemployment continued to decline, but the pick-up in earnings was limited. Significant differences exist in the EU as a whole. Labour shortages in particular sectors in some countries are in sharp contrast with double-digit rates of unemployment in others, and there are large differences between age groups. In the CIS, the economic recovery resulted in growing wages, a reduction in involuntary adjustment mechanisms, and falling unemployment.
The improvement in economic conditions has been accompanied by increasing house prices and construction activity. In Europe and the US, the growth of house prices – which are now above previous peaks – accelerated slightly in 2017. In the euro area, house prices rose in early 2018 at rates not seen since before the global financial crisis.
4 www.unece.org/forests/fpm/onlinedata.html

Chapter 1 Overview of forest products markets and policies 3
Although increased overall investment was the main driver of accelerating economic activity in the US in 2017, residential investment continued to trail behind. The growth of building construction picked up in the EU, mainly as a result of sharp increases in new EU member countries. Housing dynamics were supported by an expansion in lending. The health of banking systems in euro-area countries improved, in line with the economic situation. In some EU countries, however, the fast growth of house prices led monetary authorities to introduce constraints on housing loans. Lending to households picked up in the CIS; the banking sector there remained in poor shape, however, thus limiting credit growth.
Despite continued economic expansion, price pressures have remained muted in the US. Authorities tightened monetary policy gradually (amid expectations of higher inflation as the economy powered ahead), raising interest rates three times in 2017 and twice in the first half of 2018. Further rate increases are anticipated in the US in the second half of 2018. In contrast, the European Central Bank has signalled its intention to keep the existing low rates unchanged this year. It has, however, started withdrawing its massive monetary stimulus by reducing net bond purchases because the inflation outlook for the euro area has changed. Higher energy prices and a weaker exchange rate drove headline inflation higher in early 2018 in the euro area (graph 1.2.1). Despite rising interest rates, the nominal trade-weighted dollar exchange rate slid thorough 2017 and early 2018; this trend reversed recently, however, supported by perceptions of growing divergence in monetary policy. In some CIS countries, the weakening of price pressures amid moderate growth allowed a cautious loosening of monetary policies.
In the US, fiscal policy is becoming more expansionary, with investment reacting positively to cuts in corporate income tax. The impact on growth of a fiscal loosening in the US economy, which is already very close to full employment, may be partly offset, however, by a faster-than-anticipated normalization of monetary policy. Differences with the euro area on fiscal policy would have implications for future monetary policy paths. The fiscal position of the euro area continued to improve in 2017 due to the cyclical recovery and persistently low financing costs. Fiscal policy, which has been broadly neutral since 2015, is becoming slightly expansionary. In some countries, the improvement of the economic situation is allowing a reduction in social transfers while increasing public investment. In the CIS, higher oil prices boosted public finances in energy-exporting countries, which have nevertheless embarked on paths of fiscal consolidation.
Economic prospects in the UNECE region remain generally positive, buoyed by improving investment and productivity trends and by growth-supportive policies. Overall, output is expected to increase in 2018 at a similar pace to 2017. There are, however, significant downside risks and sources
of uncertainty that could have a detrimental effect on economic performance. Movements in financial markets have started to reflect a more complicated outlook. After a long period of lax financial conditions, the normalization of monetary policy in advanced countries may reveal hidden fragilities. In some countries, low interest rates have fuelled very rapid increases in house prices. In some others, the need for large external financing is a source of vulnerability that rising interest rates could exacerbate. Geopolitical tensions have not disappeared. The prospect of trade conflicts has emerged, with damaging implications for confidence and investment and potentially large negative spillovers.
1.3 Policy and regulatory developments affecting the forest products sector
Various recent economic and political decisions have direct and indirect implications for the forest sector. Trade agreement negotiations and discussions on tariffs are having an impact, as is continued uncertainty about government positions and policy changes, either proposed or realized.
The Comprehensive Economic and Trade Agreement (CETA) entered into force provisionally in September 2017 with the aim of expanding transatlantic trade between the EU and Canada. No progress has been made in the last year, however, on negotiations for the Transatlantic Trade and Investment Partnership (TTIP) between the EU and the US. Both parties
GRAPH 1.2.1
Major currencies used to trade forest products indexed against the US dollar, January 2017–June 2018
80
90
100
110
120
Inde
x (J
anua
ry 2
017=
100)
Lorem ipsum
Russian Federation BrazilCanada JapanEuro area SwedenChina UKTurkey
Notes: A diminishing index value indicates a weakening of the currency value against the US dollar; an increasing index value indicates a strengthening of the currency value against the US dollar.
Source: IMF, 2018.

UNECE/FAO Forest Products Annual Market Review, 2017-20184
agreed in mid-2017 to set up a joint delegation to increase trade cooperation, but no subsequent activity has been reported.
The Softwood Lumber Agreement between Canada and the US expired in 2015, having been in place since 2006. In April 2017, the US levied 3-24% tariffs on Canadian sawn softwood (antidumping and countervailing duties). The Government of Canada disputes the US allegation that it is subsidizing Canadian forest products and has taken its complaint to the World Trade Organization.
The EU Forest Law Enforcement, Governance and Trade Action Plan, adopted in 2003, is an initiative to address illegal logging and the economic, social and environmental harm it causes through measures in the EU and in countries that export timber and timber products to the EU. The Review highlights some of the outcomes of enforcement of the EU Timber Regulation by member states.
EU tropical sawn hardwood imports reached an all-time low in 2017, at 875,000 m3, a decline of 18% from 2016 and about one-third the volume prevailing before the global financial crisis. The situation is less dire for some other products; nevertheless, the UNECE region is losing significance as an export market for tropical producers.
The US Lacey Act, enacted in 1900, now requires that import declarations accompany certain plants and plant products, including a wide range of forest products. Effective from November 2016, all shipments of plants and plant products entering or leaving the US are subject to Lacey Act declaration requirements.
The Russian government has placed a two-year moratorium (from 1 December 2017) on the public procurement of furniture produced outside Eurasian Economic Union countries (Armenia, Belarus, Kazakhstan, Kyrgyzstan and the Russian Federation). The moratorium could lead to increases in wood-furniture production in the Russian Federation and other Eurasian Economic Union countries.
The US Environmental Protection Agency issued a statement of policy that biomass from managed forests will be treated as carbon neutral when used for energy production at stationary sources. The policy is expected to increase opportunities for investment in biomass energy and reduce uncertainty around biomass regulations.
Another major policy change affecting US forests was the passage of a “wildfire funding fix” to address problems in the US Forest Service budget associated with having to shift funding to fight wildfires, thus reducing the funds available for other management activities. The policy change will allow federal agencies to use disaster funding to pay a portion of wildfire suppression costs.
The US Congress is debating the Agriculture and Nutrition Act, 2018 (also referred to as the Farm Bill), the most significant legislation affecting management and conservation activities in private and family-owned forests in the US (US Congress, 2018). It is estimated that the previous Farm Bill, passed in 2014, has facilitated more than $1.8 billion of investment in forest-owner assistance programmes for activities associated with wildlife habitats, tree planting and reforestation, insect and disease management, the removal of invasive species, water-quality protections, and other conservation measures.
Two EU directives (2009/28/EC on promotion of the use of energy from renewable sources; and 2012/27/EU on energy efficiency) are being revised (the current directives apply until 2020). Decisions on these revisions expected in late 2018 could have a significant impact on renewable energy and energy efficiency in EU member countries.
The European Commission published a proposal for a revised Renewable Energy Directive in late 2016 with the aim of ensuring that renewables constitute at least 27% of final energy consumption in the EU by 2030. The European Parliament, however, considered the 27% target to be too low and endorsed a minimum 35% share of energy from renewable sources in the gross final consumption of energy; and a 12% share of energy from renewable sources in transport.
The world’s two major forest certification schemes – the Forest Stewardship Council (FSC) and the Programme for the Endorsement of Forest Certification – reported a combined certified forest area of 503 million hectares. The two organizations concluded that the area of double-certified forest (i.e. forest certified under both schemes) amounted to 70.1 million hectares in December 2016 and 71.1 million hectares in mid-2017; in both cases, this was 16.5% of the global certified forest area. The total global certified forest area, with double-counting subtracted, was 427.7 million hectares in December 2016 and 431.4 million hectares in mid-2017, with the area of double-certified area increasing by almost 1 million hectares. The FSC reported that, in June 2018, it had more than 200 million hectares of certified land area.
Both the Sustainable Forestry Initiative and the American Tree Farm System have gained access to federal procurement recommendations in the US; previously, only FSC-certified materials were recognized. The revised approach is intended to align with purchasing requirements for federal agencies established in the US Department of Agriculture’s BioPreferred Program, which recognizes the various forest certification programmes equally.
Reported participation in chain-of-custody (CoC) certification continues to grow; however, data on this aspect of certification are known to include overlaps, with companies often holding multiple CoC certificates. The International Organization for

Chapter 1 Overview of forest products markets and policies 5
Standardization is developing a CoC standard (ISO/PC 287) for wood, wood-based products and wood-related materials.
The Sustainable Biomass Program (SBP) reported that it had 139 certificate holders as of March 2018, up by 88% from December 2016. The SBP estimated that there were more than 5 million tonnes of SBP-certified wood pellets and chips in the market in 2017, representing 46% of the EU28’s wood pellet consumption.
On 14 May 2018, the European Council adopted a regulation committing all EU member countries to compensating for their greenhouse gas (GHG) emissions and removals from land use, land-use change and forestry. The regulation is known as a no-debit rule, meaning that all countries commit to offsetting their GHG emissions from land-use change and deforestation that occur between 2021 and 2030. This is also in line with the EU’s 2030 emission-reduction targets (GHG emissions should be cut by at least 40% by 2030) and the Paris Agreement on climate change.
In June 2018, Canada’s Ontario province announced an intention to end the province’s participation in the country’s carbon cap-and-trade agreement. In response, Canada’s federal government indicated it would impose a carbon tax if the province followed through on its intention. Ontario joins Saskatchewan province, which has also expressed opposition to pricing carbon.
1.4 Summary of regional and subregional markets
General conditions in forest products market in the UNECE region were positive in 2017, with consumption increasing in sawnwood (+1.7%) and wood-based panels (+5.2%). Consumption was flat in industrial roundwood (-0.1%) and decreased in paper and paperboard (-0.9%). The consumption of paper and paperboard decreased in every subregion in 2017 (table 1.4.1).
TABLE 1.4.1
Apparent consumption of industrial roundwood, sawnwood, wood-based panels and paper and paperboard, UNECE region, 2013-2017
Thousand 2013 2014 2015 2016 2017Change
(volume) 2016-2017
Change (%) 2016-
2017
Change (%) 2013-
2017
INDUSTRIAL ROUNDWOODEurope m³ 379,526 395,019 401,065 408,587 408,812 225 0.1 7.7
CIS m³ 175,074 181,822 185,471 194,311 196,822 2,511 1.3 12.4
North America m³ 486,764 490,150 494,222 498,494 494,358 -4,136 -0.8 1.6
UNECE region m³ 1,041,364 1,066,991 1,080,758 1,101,392 1,099,992 -1,400 -0.1 5.6
SAWNWOODEurope m³ 96,894 101,368 104,522 107,955 108,889 934 0.9 12.4
CIS m³ 20,356 19,247 17,219 16,674 17,768 1,094 6.6 -12.7
North America m³ 101,090 106,274 112,603 117,570 119,623 2,053 1.7 18.3
UNECE region m³ 218,340 226,889 234,345 242,200 246,280 4,080 1.7 12.8
WOOD-BASED PANELSEurope m³ 66,494 69,001 70,289 73,231 75,272 2,041 2.8 13.2
CIS m³ 17,904 17,530 17,547 17,527 19,323 1,796 10.2 7.9
North America m³ 47,538 49,459 51,580 52,403 56,034 3,631 6.9 17.9
UNECE region m³ 131,936 135,990 139,415 143,161 150,630 7,468 5.2 14.2
PAPER AND PAPERBOARDEurope m.t. 89,485 89,814 88,933 89,402 88,248 -1,154 -1.3 -1.4
CIS m.t. 9,386 9,397 9,106 9,561 9,501 -60 -0.6 1.2
North America m.t. 74,954 76,053 75,651 75,602 75,181 -421 -0.6 0.3
UNECE region m.t. 173,825 175,264 173,690 174,566 172,931 -1,635 -0.9 -0.5
Note: Sawnwood does not include sleepers.
Source: UNECE/FAO, 2018
UNECE/FAO Forest Products Annual Market Review, 2017-20186
1.4.1 Wood raw materials
The total consumption of roundwood – comprising logs for industrial uses and fuel – in the UNECE region was estimated at 1.35 billion m3 in 2017, almost unchanged (up by 0.1%) from 2016. The apparent consumption of logs for industrial purposes trended upward in the UNECE region in the five years to 2017, reaching 1.10 billion m3, 5.6% higher than in 2013. Woodfuel consumption increased by 3.0 million m3 in 2017, to 221.5 million m3.
Of the total volume of roundwood harvested in the UNECE region in 2017, about 17% was used for fuel (224.4 million m3), an increase of 18 million m3 (+8.9%) from 2013. Europe accounted for almost 54% of total woodfuel consumption in the UNECE region in 2017. Estimates of roundwood volumes removed from forests for fuel are highly unreliable, however, because only a few countries have consistent methods for collecting relevant data on this increasingly important end use. Nevertheless, it is clear that a significant share of forest removals is used for energy purposes.
The UNECE region is a net exporter of industrial roundwood (both softwood and hardwood), with total net exports of 29.5 million m3 in 2017. The biggest shipments from countries in the UNECE region were from the Russian Federation to China and Finland and from the US to Canada and China.
Sawlog prices increased in many countries in 2017 due to strong demand for softwood lumber in key markets worldwide (including the US, Europe and China), increasing prices for lumber, and a growing international log trade. With the exception of the US South and Brazil, sawlog prices moved up in the world’s major lumber-producing regions in 2017 and early 2018. The biggest increases were in eastern Europe, the Nordic countries and western North America.
Softwood-fibre costs increased in 2017 and early 2018 for the first time since 2011, thus ending a seven-year declining trend.
1.4.2 Sawn softwood
For the second consecutive year, the three UNECE subregions recorded gains in the consumption and production of sawn softwood, the result of continuing favourable global economic conditions and improving markets worldwide.
Apparent sawn softwood consumption grew by 1.5% in Europe in 2017, with some countries increasing strongly, such as the UK (+9.7%), the Netherlands (+7.8%) and France (+6.4%). Germany is Europe’s largest market for sawn softwood, with a 20% share of consumption, followed by the UK (11%). Europe’s sawn softwood production increased by 1.2% in 2017, to 109.7 million m3. Notable gains were in Germany (+0.9 million m3), Finland (+0.3 million m3) and Poland (+0.2 million m3).
European sawn softwood exports increased by 3.4% (to a total volume of 51.5 million m3) in 2017, compared with growth of 4.1% in 2016. China became Europe’s largest overseas sawn softwood export market in 2017, overtaking Egypt and Japan and compensating for weak demand in the Middle East and North Africa.
Sawn softwood production in the Russian Federation increased by 10.3% in 2017, to 37.8 million m3, accounting for 86% of the CIS subregion’s output of 43.8 million m3. The Russian Federation exported 28.0 million m3 of sawn softwood (+10%) in 2017, a new record. China remained the largest consumer of Russian sawn softwood in 2017, increasing purchases by 20% compared with 2016, to 16.1 million m3. The CIS showed the strongest increase in apparent consumption in the UNECE region (+6.2%).
The economic recovery in North America continued in 2017 for the eighth consecutive year. US housing starts increased to more than 1.2 million units (up by 3.0%), pushing North American apparent sawn softwood consumption to 99.2 million m3 (+2.9%). Canadian sawn softwood production was unchanged in 2017, at 48.2 million m3, but the US increased output by 3.5%, to 57.6 million m3. Combined, North American sawn softwood output amounted to 105.8 million m3 (+1.9%).
A multitude of supply shocks (including reduced Canadian production), as well as import duties on Canadian sawn softwood to the US, created all-time record-high sawnwood prices in the US in 2017 and especially the first half of 2018. This caused a ripple effect on prices in most major global markets, continuing a positive cycle that started in late 2015.
With strong domestic demand in 2017 and no growth in production, Canadian shipments to the US fell by 1.4 million m3 (-5.8%) in 2017, to 22.7 million m3, despite soaring prices. Exports outside of North America declined by 5.0%, to 6.7 million m3.
1.4.3 Sawn hardwood
After five years of growth, the apparent consumption of sawn hardwood decreased by 3.2% in the UNECE region in 2017, to 34.4 million m3. Consumption increased rapidly in the CIS (+11.1%), in contrast to Europe and North America, where it decreased by 3.8% and 3.6%, respectively.
Sawn hardwood production was relatively flat (up by 0.6%) in the UNECE region in 2017, at 41.7 million m3. Production was stable in Europe and North America and increased in the CIS.
Sawn hardwood imports by UNECE countries decreased by 3.2% in 2017, to 6.4 million m3. Sawn hardwood exports amounted to 13.7 million m3, up by 9.6% compared with 2016 and by more than 40% compared with 2013.

Chapter 1 Overview of forest products markets and policies 7
Oak is still highly sought-after, and exports of oak logs increased to China. The strong demand further increased prices for European oak in 2017 and the first half of 2018.
Sawn hardwood exports increased by 6.4% in the CIS subregion, led by a jump of 11.7% in the Russian Federation to almost 1.7 million m3. China remained an important destination for sawn hardwood from the Russian Federation. More than 20% of Canadian sawn hardwood exports went to China in 2017, and more than 65% of US sawn hardwood exports were destined for either China or Viet Nam.
1.4.4 Wood-based panels
The production and consumption of wood-based panels increased in all three UNECE subregions in 2017. In Europe, production increased by 1.6% overall and grew for all types of wood-based panels except veneer sheets.
The production of wood-based panels increased by 12.3% in the CIS in 2017, with an even stronger increase (+15.1%) in exports; apparent consumption was also up (by 10.2%). There were large increases in the production of fibreboard (+19.4%) and OSB (+17.7%) in the CIS, but plywood production contracted slightly in the Russian Federation due to a shortage of raw materials.
The apparent consumption of wood-based panels increased by 6.9% in North America in 2017, led by an increase in net imports (exports grew by 4.5% and imports were up by 17%). Total wood-based panel production in North America increased by 3.0% in 2017, to 48.6 million m3. The consumption of structural wood-based panels increased by 5.5% in North America in 2017, with demand for OSB and plywood increasing by 7.6% and 3.2%, respectively. The consumption of non-structural panels (particle board and medium density fibreboard – MDF) in the North American market increased by 0.9% in 2017, with MDF growing by 2.0% and particle board flat.
The trade (both imports and exports) of wood-based panels increased in all three subregions in 2017. Europe and the CIS have trade surpluses in wood-based panels, but North America has a substantial trade deficit.
1.4.5 Paper, paperboard and woodpulp
The global pulp, paper and paperboard industry experienced a turnaround in 2017, driven by a much tighter supply–demand balance for woodpulp and continued strong demand for packaging and sanitary and household products.
China was the engine of growth in global demand for market pulp in 2017. Tighter rules surrounding imports of recovered paper caused demand for other fibres to grow and prices to rise.
Electronic communication continued to play a major role in the evolution of the pulp and paper segments, with graphic-paper capacity declining due to lower demand. Further rationalization is anticipated in 2018, albeit at a slower pace.
Pulp prices increased in 2017, due mainly to unplanned supply disruptions, and higher prices have continued into 2018. The expansion of bleached hardwood kraft capacity in South America and Asia was by far the most important factor influencing pulp markets in 2017 and the first half of 2018. This was countered by several bouts of unplanned downtime due to major mechanical failures, slow start-ups during the commercialization periods of new pulp lines, and transportation strikes in Brazil and Chile.
As a result of increased input costs for non-integrated producers, prices for graphic paper and sanitary and household items rose throughout 2017.
Global chemical market-pulp capacity grew by 4.5 million tonnes (6.9%) in 2017, with increases mainly in South America and Asia. Unplanned downtime among pulp producers due to mechanical and weather-related issues caused significant supply disruptions in woodpulp production, negating much of the incremental increase in capacity.
Graphic-paper production and apparent consumption continued to decline in almost every market in 2017 as end-users reduced advertising budgets for print media and swung towards electronic communication. The apparent consumption of graphic paper fell in every UNECE subregion as end-users moved increasingly to electronic communication. The ongoing increase in raw-material costs, including pulp, could further exacerbate the reduction in demand for graphic-paper grades.
1.4.6 Wood energy
There was little change in wood energy consumption in the UNECE region in 2017. Nevertheless, the slower-than-

UNECE/FAO Forest Products Annual Market Review, 2017-20188
expected expansion of production capacity, combined with greater demand (especially in the UK, Denmark and the Netherlands) and higher fossil-fuel prices, contributed to significant increases in wood pellet prices in 2017 and early 2018; other factors were production issues in the Russian Federation, forest fires in Portugal, and relatively low year-on-year growth in installed production capacity. Higher fossil-fuel prices and continued interest in replacing older commercial and residential heating units, upgrading existing district heating units and replacing coal-fuelled power plants with biofuels are expected to spur new demand.
Some analysts expect wood pellet demand to reach 45 million tonnes by 2025 for power generation and 24 million tonnes for heating in the residential and commercial sectors. This would mean an increase in pellet consumption above 2017 volumes of about 15 million tonnes for power generation and 14 million tonnes for heating.
The primary production of “solid biofuels (excluding charcoal)” in the EU28 grew to about 3,941 petajoules in 2016, up by 2.5% compared with 2015. Wood pellet consumption was 23.4 million tonnes in Europe in 2017, a 4.6% increase over 2016. Wood pellet production increased by 5.4% and imports by 4.4%.
The production of wood pellets in the CIS increased by 21.5% in 2017. Production grew by 20% in the Russian Federation, to 1.3 million tonnes, due to improvements in logistics and new infrastructure. Wood pellet consumption declined by 5.8% in the CIS in 2017, with all the increase in production exported (wood pellet exports rose by 31.9%, to 1.8 million tonnes).
North America produced 9.6 million tonnes of wood pellets in 2017, up by 3.4% over 2016. Wood energy consumption accounted for about 4.5% of Canada’s total primary energy supply in 2017, which was largely unchanged from 2016.
Wood energy consumption in the US was only about 0.6% higher in 2017 than in 2016, at 2,262 PJ. Wood consumption for energy is expected to remain flat in the US through 2019.
The price of wood pellets increased in Europe in 2017 and early 2018, with prices for industrial wood pellets at Antwerp, Amsterdam and Rotterdam up by 50% in January 2018, year-on-year. The price of wood pellets exported from the Russian Federation was down slightly in 2017 due to increased production capacity. There was little change in prices in North American firewood and pellet markets in 2017.
1.4.7 Value-added wood products
Global furniture production was worth $440 billion in 2017, up by $20 billion from 2016. The value of the global furniture trade in 2017 was estimated at $145 billion, with the US, Germany, France, the UK and Japan the largest importers.
The trend of furniture producers shifting production to lower-cost regions is slowing due to the increased use of automation, increasing costs in previously low-cost regions, and demands from customers for shorter delivery times. China is still by far the biggest producer and exporter in the global furniture market, and the US is the largest furniture importer.
Furniture producers in high-cost countries such as Germany and Italy have started exporting “high-end” furniture products. Prospects for furniture markets seem bright after a positive 2017, and orders were up in the first few months of 2018: for example, orders were 5% higher in the US in February 2018, year-on-year. There are increasing trends towards the online sale of furniture and away from durable hardwood furniture towards low-cost, owner-assembled, semi-disposable furniture.
Markets for builders’ joinery and carpentry (BJC) have grown steadily in the US, with imports doubling from 2011 to more than $2.2 billion in 2017. The increased demand is the result of a strong housing market, economic growth, consumer confidence and good employment figures. BJC imports are also growing in the European market, mainly from neighbouring countries.
Improved housing markets in the UNECE region are causing strong demand for imports of profiled-wood products, although volumes are still well below their peak in 2006.
North American production of glulam, wooden I-beams and laminated veneer lumber (LVL) made consistent gains from 2010 to 2017, mainly the result of increased new-housing construction. The trade flow of glulam and cross-laminated timber (CLT) from Austria to Italy – the biggest trade flow of these products in Europe – fell by 12% in the first three months of 2018, year-on-year.
The production of CLT is still concentrated in Europe and, within Europe, in Germany, Austria and Switzerland (DACH

Chapter 1 Overview of forest products markets and policies 9
countries), which together accounted for about 70% of global production in 2017. European production is projected to increase dramatically to about 1.78 million m3 by 2020. Despite the hype around CLT for the construction of tall wooden structures, most usage in construction in the near future is likely to be for low- and mid-rise buildings.
CLT is increasingly popular in North America, echoing the long-established trend in Europe. As of early 2017, there were two CLT producers in Canada and three in the US, but numerous CLT manufacturing plants are in start-up, under construction or in planning. It is estimated that the potential market for CLT in the US alone could be between 2 million and 10 million m3 – bigger than the entire global market today.
1.4.8 Housing
In many countries, housing (new construction and remodelling) is the largest value-added market for wood products. Housing is considered a primary indicator and catalyst of economic activity for overall economies. Thus, economic projections and house-price analysis may provide insights into housing construction and remodelling markets.
The number of residential buildings put in place in the Russian Federation declined by 3.2% in 2017, even though the area of newly installed residential space of 78.6 million m2 was similar to the area installed in 2016. The goal of the “Housing for Russian Family Programme” is to build 500,000 two-room apartments, beginning in 2018.
Construction spending increased by 1.8% in the euro area and by 0.9% in the EU28 between April 2017 and April 2018. Construction output grew by 3.9% in the Euroconstruct region in 2017, led by residential construction (+10%). Residential remodelling is also looking promising, especially in western and northern Europe. New residential construction accounted for 42.6% of total new construction spending in the Euroconstruct region in 2017 (see footnote in section 10.2.1 for list of countries in the Euroconstruct region), non-residential construction for 34.4% and civil engineering for 23%, a similar breakdown to previous years. The outlook for the construction sector in the Euroconstruct region is positive, with spending projected to grow in all subsectors (new residential, residential remodelling, new non-residential, non-residential remodelling, new civil engineering and civil-engineering remodelling) in 2018 and through to at least 2020.
House construction and sales have been improving in the US from the low-point in 2009, but aggregate new single-family house construction remains well below its historical average. All sectors of the US housing market improved in 2017. Beginner or starter housing remained subdued, however, and the quantity of dwellings being constructed is insufficient to meet increasing demand due to population growth. In Canada, federal, provincial and local governments introduced regulations in 2017 designed to dampen rising prices and valuations, including a nationwide mortgage stress test, a foreign buyer’s tax, and rent controls. By the first quarter of 2018, the effect of these regulations had been a decline of 10% in the average sales price of Canadian houses and a sharp decline in house sales.

Chapter 2
POLICIES SHAPING FOREST PRODUCTS MARKETS
Lead author: Kathryn Fernholz
Contributing authors: Igor Novoselov
11
Highlights
Chapter 2 Policies shaping forest products markets
Negotiations between the EU and the US on the Transatlantic Trade and Investment Partnership did not progress in the last year.
The European Parliament approved the Comprehensive Economic and Trade Agreement between Canada and the EU in February 2017, and Canada ratified it in May 2017.
When the UK leaves the EU, the Forest Law Enforcement, Governance and Trade (FLEGT) licensing scheme and any related FLEGT voluntary partnership agreements that the EU has concluded with third countries will no longer apply to the UK.
The World Trade Organization agreed in April 2018 to examine Canada’s complaints regarding the antidumping and countervailing duties imposed by the US on imports of Canadian softwood lumber.
The US Environmental Protection Agency issued a statement of policy that biomass from managed forests will be treated as carbon neutral when used for energy production in stationary sources.
The US Congress has approved a “wildfire funding fix” to address the problems in the US Forest Service budget associated with having to shift funding to fight wildfires, which has reduced the funds available for other management activities.
EU tropical sawn hardwood imports declined by 18% in 2017, to 875,000 m3, the lowest volume ever recorded. The intensifying enforcement of the EU Timber Regulation has been cited as a factor.
In 2018, for the first time, the area of forest certified by the Forest Stewardship Council (FSC) exceeded 200 million hectares. Forests in the UNECE region account for more than 85% of all forests certified by the FSC.
A federal court in the US has dismissed a lawsuit filed by Resolute Forest Products, Inc., against Greenpeace International that included claims of federal racketeering, defamation and tortious interference.

UNECE/FAO Forest Products Annual Market Review, 2017-201812
2.1 Introduction
A variety of economic and political decisions have direct and indirect consequences for the forest sector. Trade agreement negotiations and discussions on tariffs are having an impact in several world regions, as is continued uncertainty about government positions and policy changes, either proposed or realized. New data are beginning to illustrate the impacts of regulations on the trade of tropical timber, and forest certification programmes continue to show only tepid growth globally.
Diverse actions by governmental organizations and the private sector continue to emerge in response to the uncertain policy and economic climate. These actions, some of which are described in this Review, show that there are many ways of responding to change. This chapter addresses trade policies and enforcement; due diligence and legal wood supplies; government agendas to support forests and forest products; bioenergy; certification; climate change and carbon markets; green building; and deforestation-free policies and actions.
2.2 Trade-related
2.2.1 Transatlantic free trade
The Comprehensive Economic and Trade Agreement (CETA) entered into force provisionally in September 2017. The European Parliament approved the CETA on 15 February 2017 and Canada ratified it on 16 May 2017. National parliaments in the EU must ratify the CETA before it can take full effect (European Commission, 2017). The CETA should result in expanded transatlantic trade, including of value-added forest products (GAC, 2016).
Negotiations between the EU and the US on the Transatlantic Trade and Investment Partnership (TTIP) did not progress in the last year. The two parties agreed on 25 May 2017 to set up a joint delegation to increase trade cooperation, including consideration of the future of the TTIP (EURACTIV, 2017), but no subsequent activities have been reported.
2.2.2 US and Canada forest trade and policy
The Softwood Lumber Agreement between Canada and the US expired on 12 October 2015. In place since 2006, this agreement addressed tariffs on lumber traded between the two countries as part of a decades-long trade dispute covered in earlier editions of this Review. In April 2017, the US government announced tariffs of 3-24% on imported lumber from Canada (Dattu et al., 2017). In April 2018, at the request of Canada, the Dispute Settlement Body of the World Trade Organization agreed to establish two panels
to examine Canada’s complaints regarding antidumping and countervailing duties imposed by the US on imports of Canadian softwood lumber (WTO, 2018).
2.2.3 Brexit
In a referendum in the UK on 23 June 2016, a majority of voters voted in favour of leaving the EU. The UK’s “Brexit” is due to take place on 30 March 2019; the deadline can only be extended beyond that date by unanimous agreement of all EU countries.
Brexit may change the UK’s supply and consumption of wood products. The country is the largest net importer of wood products in the EU, with the great majority of wood coming from other EU countries. Following separation from the EU, the UK may change supply streams to resources from outside the EU and strengthen domestic sourcing. This is only speculation, however, and depends on the modalities of the future relationship between the UK and the EU.
The UK has played an important role in work aimed at preventing illegally sourced wood and wood products from entering or being traded in the EU. The European Commission issued a Note to Stakeholders stating, “As of the withdrawal date, the recognition as monitoring organisations of organisations established in the United Kingdom is no longer valid. They will not be in a position to carry out the tasks set out in Regulation (EU) No 995/2010” (European Commission, 2018a). Thus, when the UK leaves the EU, the Forest Law Enforcement, Governance and Trade (FLEGT) licensing scheme and related FLEGT voluntary partnership agreements (VPAs) concluded between the EU and third countries will no longer apply in the UK.
2.2.4 CIS forest trade and policy
From 1 July 2017, sawnwood producers in the Russian Federation are obliged to enter data on transactions on primary sawmilling products (sawnwood, beams and ties) into the Unified State Automated Information System of Timber Accounting and Timber Transactions, which initially was applied only to the trade of logs. The objective of the system is to provide legality assurance of timber origin and to help decrease illicit timber trade (Ministry of Natural Resources and Environment of the Russian Federation, 2017).
To encourage domestic wood processing, the Russian government approved tariff quotas in December 2017 for roundwood exports of the following Far Eastern coniferous species: Ayan spruce (Picea jezoensis), Khingan fir (Abies nephrolepis) and Dahurian larch (Larix dahurica).5 Effective as of 2018, the tariff applies to roundwood exported outside
5 Harmonized System of the Russian Federation codes 4403239100, 4403239900, 4403249000, 4403259100, 4403259900 and 4403260000.

13Chapter 2 Policies shaping forest products markets
the territory of the Russian Federation. The tariff is 6.5% or €4 per m3 (whichever is greater) up to a volume of 4 million m3 annually. Beyond 4 million m3, the tariff is 25% or €15 per m3 (whichever is greater).6
Exporters who want to be included in the quota need to comply with the rules and regulations in place and must be financially solvent (e.g. not bankrupt, and up to date on taxes and insurance). To get the quota, the share of a company’s processed wood exports in its total export value must not be less than 20% (from 1 January 2018). This percentage increases to 25% from 1 January 2019, to 30% from 1 January 2020 and to 35% from 1 January 2021 (Government of the Russian Federation, 2017b).
The area burnt by fire in the Russian Federation was reduced by half in 2017 and the damage reduced to one-fourth compared with the previous three years, as the forest fire protection system was reoriented towards prevention and protection (Government of the Russian Federation, 2018a). The legal responsibility of tenants, landowners and citizens for maintaining forests in compliance with fire-safety rules has been strengthened (Rossiyskaya Gazeta, 2017).
Additional measures have been taken to increase the attractiveness of investments in wood-processing industries and to improve the efficiency of forest use (e.g. by supporting timber processors and increasing the transparency of forest-leasing procedures) (Government of the Russian Federation, 2017с). For the first time, the issue of using forests for exploration has been fully resolved, with the rights and obligations of tenants and lessors of forest areas defined, including with respect to forest conservation, protection and reproduction (Ministry of Natural Resources and Environment of the Russian Federation, 2018a).
In many regions, new planning approaches are required to make best use of the forest resource. With the aim of making Russian forests financially self-sufficient, “road maps” were agreed in 2017 for the implementation of pilot projects to introduce intensive forest management in the Vologda, Arkhangelsk, Irkutsk and Leningrad regions and in the Republic of Komi. The goal is to have ten pilot regions participating in the introduction of intensive forest management by 2025; the other five regions to be involved are the republics of Buryatia and Karelia and the regions of Perm, Krasnoyarsk and Khabarovsk.
The immediate goals of Russian forest policy are the transfer of forest management and the state forestry register to the federal level and the revision of approaches to the
6 From 1 January 2019, an export duty of 40% (but not less than €27.6/m3) will be applied to shipments above 4 million m3. From 1 January 2020 the duty will be 60% but not less than €36.8/m3, and from 1 January 2021 the duty will be 80% but not less than €55.2/m3.
development of a new payment system for the use of forest resources (Roslesvesti, 2017). In the long term, the government aims to make the forest sector financially self-sufficient and is considering decentralized market mechanisms for the pricing of raw materials.
The Russian government has established new requirements for the implementation of priority forest investments. These will now include projects for the modernization and creation of forest and wood-processing infrastructures (Government of the Russian Federation, 2018b).
A new forest management regulation came into effect in the Russian Federation on 4 May 2018. This provides a mechanism for allocating additional types of specially protected forest areas as National Forest Heritage. Such allocation allows hunting, fishing, ecotourism and the use of non-timber and food resources but prohibits industrial forest management for wood production (Ministry of Natural Resources and Environment of the Russian Federation, 2018b).
In Belarus, a ban on the export of unprocessed roundwood was signed in 2015; roundwood exports were to be allowed only in exceptional cases on approval by the President (e.g. after a strong storm causes damage to large volumes of trees). President Lukashenko allowed the export of 1.8 million m3 of roundwood in 2017 (Belta, 2017; Sb, 2018), the last year in which roundwood exports will be permitted by exclusive decree of the President.
2.2.5 Due diligence and legal wood supply
2.2.5.1 EU Forest Law Enforcement, Governance and Trade Action Plan
The EU FLEGT Action Plan, adopted in 2003, is an initiative to address illegal logging and the economic, social and environmental harm it causes through measures in the EU and in countries that export timber and timber products to the EU. One such measure was the adoption of the EU Timber

UNECE/FAO Forest Products Annual Market Review, 2017-201814
Regulation (EUTR), which prohibits EU businesses from importing or trading illegal timber.
As of May 2018, 15 tropical countries were negotiating or implementing VPAs with the EU (EU FLEGT Facility, 2018); these countries account for 80% of the EU’s tropical timber imports (European Commission, 2016). Six of the countries (Cameroon, the Central African Republic, the Congo, Ghana, Indonesia and Liberia) have signed formal agreements with the EU, and Viet Nam has agreed on its VPA but is yet to sign the formal agreement. The remaining eight countries (Côte d’Ivoire, the Democratic Republic of the Congo, Gabon, Guyana, Honduras, the Lao People’s Democratic Republic, Malaysia and Thailand) are negotiating VPAs but are yet to come to agreement. Excluding Thailand, which started negotiations in 2017, the VPAs have been under negotiation in these countries for an average of nine years. Currently there are seven countries with formal agreement of VPAs and an additional eight countries in the process of negotiating VPAs (EU FLEGT Facility, 2018).
EU countries states are enforcing the EUTR. A Swedish court issued a fine of about €80,000 to a non-compliant operator (finalized in May 2018), and fines have also been issued in Germany, the Netherlands and the UK. Authorities in Denmark, Germany, Sweden and the UK have taken action to stop imports of illegally harvested timber from Myanmar (Client Earth, 2018).
Nearly 400 inspections were made on imported timber between June and November 2017; Germany was the most active EU member country, with more than 100 checks. In the same period, nearly 500 inspections were made of domestic timber, with Slovenia and Lithuania (181 and 161 checks, respectively) the most active. Not all countries inspect domestic timber: of the 28 EU members (“EU28”), only 12 carried out frequent inspections in the period. Some countries noted that they already have highly regulated national legality assurance systems for domestic timber (UNEP, 2018).
In January 2018, the European Commission launched a public consultation process on the need or otherwise to revise the product scope of the EUTR7. The consultation ran until April 2018, and the 221 responses received generally confirmed the need for amendment of the EUTR. Only 19% of respondents thought no amendment of the product scope was required (graph 2.2.1).
7 EUTR includes products with following Harmonized System (HS) codes: 4401, 4403, 4406, 4407, 4408, 4409, 4410 ,4412, 441300, 441400, 4415, 441600, 4418, 47, 48, 940330, 940340, 940350, 940360, 940390, 9406.
More information about codes and what they include is available at: www.wcoomd.org/en/topics/nomenclature/instrument-and-tools/hs-nomenclature-2017-edition/hs-nomenclature-2017-edition.aspx
It was reported recently that EU tropical sawn hardwood imports reached an all-time low in 2017, at 875,000 m3, a decline of 18% from 2016 and about one-third the volume prevailing before the global financial crisis (Global Wood Trade Network, 2018). The situation is less dire for some other products; nevertheless, the UNECE region is losing significance as an export market for tropical producers (graph 2.2.2).
0
5
10
15
20
25
30
1996 2001 2006 2011 2016
Mill
ion
m3
China, India, Japan, Viet Nam UNECE Region
GRAPH 2.2.2
Imports of tropical logs, sawnwood and plywood by region and certain other markets, 1996-2016
Notes: Volumes are in roundwood equivalent of wood in the rough. 1m3
of tropical sawnwood = 2.0m3 of roundwood; 1m3 of tropical plywood =1.8m3 of roundwood.
Source: FAO, 2017.
GRAPH 2.2.1
Replies to the European Commission question: “Is there a need to amend the current product scope of the EUTR?”
Source: European Commission, 2018b
Yes, the scope should be amended by
adding products 67%
No, the product scope should not be amended 19%
Yes, the scope should be
amended by removing 1 or
more categories of products 6%
I don't know 5%
Yes, the scope should be amended by adding and
removing 1 or more categories of products 3%

15Chapter 2 Policies shaping forest products markets
A number of factors are associated with this trend, including shipping problems, delayed tax refunds, overstocking, availability, competition with other regions, substitution with other species and materials, and intensifying enforcement of the EUTR. Producers in Gabon say that, because of the high costs of compliance with the EUTR, they are now much less interested in sales to Europe, and that demand is very firm in other markets (ITTO, 2018).
Some of the abovementioned factors were mentioned in the bankruptcy announcement of the French forestry and wood products group Rougier, a 95-year old tropical hardwood company. Rougier manages more than 2.3 million hectares of forests in Africa, and it has seven factories and numerous employees across Cameroon, the Central African Republic, the Congo and Gabon. The company cited logistical shipping problems at the port in Cameroon and delays in value-added tax refunds from Cameroon, the Congo and Gabon as reasons for the bankruptcy (Gulf Times, 2018).
2.2.5.2 US trade enforcement
The US Lacey Act, enacted in 1900, addresses trafficking in wildlife, fish and plants that have been illegally taken, possessed, transported or sold. After a series of amendments in 2008, the Act now requires that import declarations accompany certain plants and plant products, including a wide range of forest products (USDA, 2015). Effective from November 2016, all plant and plant product shipments entering or leaving the US are subject to Lacey Act declaration requirements (USDA, 2017). Gibson Brands, one of the first companies to be raided under the amended Lacey Act, filed for bankruptcy protection in May 2018 (US Bankruptcy Court for the District of Delaware, 2018).
In October 2017, the US Trade Representative took action to block timber imports from a Peruvian exporter based on illegally harvested timber found in its supply chain. The enforcement action was taken under the US–Peru Trade Promotion Agreement, which includes specific requirements on forest-sector governance. US Customs and Border
Protection has been directed to deny entry of shipments from the company Inversiones Oroza for three years or until its compliance with applicable timber laws has been determined (US Trade Representative, 2017).
In October 2017, a federal court in the US dismissed a lawsuit against Greenpeace. Resolute Forest Products, Inc., a Canadian timber company, and Greenpeace had been engaged in a disagreement since December 2012 stemming from woodland caribou protections, the certification of lands managed by Resolute, and the rights of First Nations peoples (Greenpeace, 2017; Ontario Superior Court of Justice, 2016). The company filed suit in US court against Greenpeace International in May 2016, including claims of federal racketeering, defamation and tortious interference (Adler, 2016; US District Court, 2016).
2.2.6 Wood high on national and international agendas
The Russian government has signed a decree prohibiting the public procurement of foreign furniture for two years from 1 December 2017. The exception will be furniture purchased from Eurasian Economic Union countries (Armenia, Belarus, Kazakhstan and Kyrgyzstan). This initiative could lead to the growth of wood-furniture production in the Russian Federation (Government of the Russian Federation, 2017d).
The US Environmental Protection Agency issued a statement of policy that biomass from managed forests will be treated as carbon neutral when used for energy production at stationary sources (EPA, 2018a). The policy is expected to provide increased opportunities for investment in biomass energy and reduce uncertainty around biomass regulations. Another major policy change affecting US forests was the passage of a “wildfire funding fix” to address problems in the US Forest Service budget associated with having to shift funding to fight wildfires and thus reduce the funds available for other management activities (USDA, 2018). The policy change will allow federal agencies to use disaster funding to pay a portion of wildfire suppression costs. The US Congress is debating the Agriculture and Nutrition Act, 2018 (also referred to as the Farm Bill), the most significant legislation affecting management and conservation activities on private and family-owned forests in the US (US Congress, 2018). It is estimated that the previous Farm Bill, passed in 2014, has facilitated the investment of more than $1.8 billion in forest-owner assistance programmes for activities associated with wildlife habitats, tree planting and reforestation, insect and disease management, the removal of invasive species, water-quality protections, and other conservation measures (AFF, 2018a).
Provisions on forest health in the 2014 version of the Farm Bill have gained relevance because of the apparent deterioration of forest conditions in the US. According to a 2017 US Forest

UNECE/FAO Forest Products Annual Market Review, 2017-201816
The European Commission published a proposal for a revised Renewable Energy Directive in late 2016 with the aim of ensuring that renewables constitute at least 27% of final energy consumption in the EU by 2030 (European Commission, 2018c). The European Council adopted its position on the revised Renewable Energy Directive on 18 December 2017, confirming the targets proposed by the European Commission (European Council, 2017). The European Parliament, however, considered the 27% target to be too low and, in January 2018, it endorsed proposals by the Environment Committee of the European Parliament for more ambitious targets by 2030. These include a 35% improvement in energy efficiency; a minimum 35% share of energy from renewable sources in the gross final consumption of energy; and a 12% share of energy from renewable sources in transport (European Parliament, 2018).
The directives on energy efficiency and the use of energy from renewable sources are two of eight legislative proposals contained in the “Clean Energy for all Europeans” package issued by the European Commission on 30 November 2016 (table 2.2.1).
The goal of the package is to provide a stable legislative framework to facilitate the clean-energy transition (European Commission, 2018d).
Service update of the Resource Planning Act Assessment, forest mortality on US Forest Service lands (about 59 million hectares of forestlands) now exceeds net growth (Healthy Forests, Healthy Communities, 2018). Net forest growth was 48% of mortality in 2016, and the timber harvest comprised just 11% of mortality (graph 2.2.3). This has significant implications for forest health; the vulnerability of forests to fire, pests and diseases; and the possibility of improving forest health through active management, including the harvesting of commercial timber.
The “Good Neighbor Authority”, contained in the 2014 renewal of the Farm Bill, includes provisions to allow the US Forest Service to enter into cooperative agreements or contracts with US states with the aim of restoring forests and capitalizing on the in-place expertise and availability of state-level resources. The process is quite advanced in Idaho, with income-generating timber harvests scheduled. If the programme achieves the aim specified in the State of Idaho’s forest plan, it could produce 100 million board feet (about 600,000 m3) of logs per year, generating $68.5 million in additional wages, 1,300 direct jobs, 300 indirect jobs and $118 million in state-level gross domestic product (Russell, 2017).
2.2.7 Bioenergy, biomass and biofuels
Two EU directives (2009/28/EC on promotion of the use of energy from renewable sources; and 2012/27/EU on energy efficiency) have a significant impact on renewable energy and energy efficiency in EU member countries. The two directives are being revised because they only set out requirements for 2020; decisions are expected later in 2018.
TABLE 2.2.1
Clean Energy for all Europeans package
Note: ACER (Agency for the Cooperation of Energy Regulators) is an EU agency created to make further progress on the completion of the internal energy market for electricity and natural gas.
Source: European Commission, 2018d.
European Commission
Proposal
EU interinsti-tutional
negotiations
European Parliament
adoption
Council adoption
Energy performance in buildings
November 2016
Political agreement April 2018 May
2018
Renewable energy
Political agreement -
Governance Political agreement -
Energy efficiency
Political agreement -
Energyregulation Ongoing -
Energy directive Ongoing -
Risk preparedness - -
ACER* - -
0
20
40
60
80
100
120
Mill
ion
m3
Net Growth Harvest Mortality
GRAPH 2.2.3
Annual net growth, mortality and harvest on US National Forest timberlands, 1952-2016
Source: Healthy Forests, Healthy Communities, 2018

17Chapter 2 Policies shaping forest products markets
• Sustainable forest management and the UN Sustainable Development Agenda 2030The UN Sustainable Development Agenda 2030, agreed to by world leaders in 2015, establishes 17 Sustainable Development Goals (SDGs) that countries should strive to achieve (mostly by 2030). FAO’s “State of the World’s Forests 2018” (FAO, 2018) confirms that forests and trees, when managed sustainably, provide a wide range of beneficial products and services and thereby contribute in numerous ways to meeting the 17 SDGs. Wellmanaged forests and trees provide the elements necessary for human life – air, water, food and shelter. Forest management also contributes to sustainable development by supporting economic opportunities.
• Forests are broad-based enablers for many SDG targetsForests and their sustainable management have significant positive impacts on 28 specific targets in a subset of ten crucial SDGs, especially SDG 6 (clean water), SDG 13 (climate action) and SDG 15 (life on land). There are also important connections between forests and SDG 1 (no poverty), SDG 2 (zero hunger), SDG 5 (gender equality), SDG 7 (affordable and clean energy), SDG 8 (decent work and economic growth), SDG 11 (sustainable cities and communities) and SDG 12 (sustainable consumption and production) (FAO, 2018).
• Forest certification is an important subindicator for SDG 15Forest certification standards constitute a set of periodically updated requirements agreed to by diverse stakeholders, and compliance with those requirements is verified by third-party auditing. Forest certification, therefore, is a tool for assessing sustainable forest management. Forest certification is addressed most directly in SDG 15, the aim of which is to “protect, restore and promote sustainable use of terrestrial ecosystems, sustainably manage forests, combat desertification, and halt and reverse land degradation and halt biodiversity loss”. Target 15.2 includes promoting the sustainable management of all types of forests, with “forest area under independently verified forest management certification schemes” one of four approved subindicators for assessing indicator 15.2.1 (“progress towards sustainable forest management”). The sustainable management practices required to maintain compliance with forest certification programmes can reduce habitat destruction and biodiversity loss (target 15.5), address invasive species (target 15.8) and support the integration of ecosystems and biodiversity values into planning and development processes (target 15.9) (FAO, 2018).
• Forest certification in the UNECE regionForest certification is used in markets for traditional paper and wood-based products. It is also increasingly applied in the provision of a broad range of bioeconomy products, such as biologically based textiles, plastics, chemicals and energy, and ecosystem services such as water quality, carbon sequestration and biodiversity conservation. The uptake of forest certification has been strong in the UNECE region, which hosts 85% (about 365 million hectares) of the forest area certified globally (UNECE, 2018). About one-third of the global industrial roundwood supply in 2016 originated in certified forests (UNECE/FAO 2017).
• Forest certification and SDG targetsAlthough forest certification is referred to specifically in SDG target 15.1, there is evidence that forests and their sustainable management enable the achievement of other SDG targets associated with economic development, social inclusion and biodiversity conservation.
Target 6.6 – “by 2020, protect and restore water-related ecosystems, including mountains, forests, wetlands, rivers, aquifers and lakes” – is supported by best management practices and requirements for water-quality protections, which are addressed in certification programmes.
The responsible achievement of target 7.2 – “by 2030, increase substantially the share of renewable energy in the global energy mix” – is supported by a commitment to the sustainable harvesting (as prescribed by forest certification) of forest-based biomass used for renewable energy.
Several targets of SDG 12 are connected to the work of forest certification programmes in areas such as managing natural resources sustainably and efficiently (target 12.2); encouraging companies to adopt sustainable practices (target 12.6); and promoting sustainable public procurement practices (target 12.7 and indicator 12.7.1). Certification programmes track forest products through production and manufacturing to end-consumers via chains of custody, helping inform consumers about sustainable development (target 12.8). Forest certification organizations can be characterized as verification service innovators (target 12.6).
Forest certification includes the auditing of compliance with laws addressing legal rights to harvest, harvesting activities, and other relevant environmental and social regulations. It is supportive of SDG 16 (peace, justice and strong institutions) and especially SDG target 16.3 on promoting the rule of law. Forest certification can help reduce corruption and bribery (SDG target 16.5). The stakeholder consultation processes that certification schemes have used for standard setting, and their processes for the periodic review and updating of standards, mean that forest certification also supports the development of effective, accountable and transparent institutions (target 16.6) while providing opportunities for inclusive, participatory and representative decision-making (target 16.7).
Forest certification programmes are based on a commitment to stakeholder dialogue and cooperation to ensure sustainable, positive outcomes. They provide, therefore, many strong, positive examples of public, public–private and civil-society partnerships, thereby contributing to target 17.17. Such partnerships operate locally, regionally and internationally.
• UNECE countries provide crucial support for forest certification as a tool of the SDGs Many government procurement programmes in the UNECE region use forest certification to help ensure the legality and sustainability of wood products. They have important roles to play in achieving the SDGs by showing how forest owners, other stakeholders and society at large can work together to obtain long-term economic, social and environmental benefits.
BOX 2.2.1
The contribution of forest certification to the UN Sustainable Development Goals

UNECE/FAO Forest Products Annual Market Review, 2017-201818
2.2.8 United Nations Sustainable Development Goals and forests
In April 2017, the UN General Assembly adopted the UN Strategic Plan for Forests 2017-2030, which includes six Global Goals on Forests (UN, 2017). Many of the goals are relevant to forest products and their relationship with the UN Sustainable Development Goals (SDGs), including on affordable clean energy (SDG 7), growth and infrastructure (SDGs 8 and 9), sustainable cities and communities (SDG 11), responsible consumption (SDG 12), action on climate change (SDG 13) and sustainable forest management (SDG 15). It has been noted that all 17 SDGs can be linked directly and indirectly to forest products and services (Scion, 2017). A recent survey found that four in ten of the world’s largest companies reference the SDGs in their corporate reporting (KPMG, 2017). The most commonly reported goals (i.e. by 55% or more of the reporting companies) were SDG 8 (decent work and economic growth), SDG 13 (climate action) and SDG 3 (good health and well-being). Forest product companies that report progress on the SDGs in their annual reporting include UPM-Kymmene, Sappi and Mondi. SDGs have also been embraced by certification schemes, which see forest certification as a useful tool in accomplishing many of the SDGs (box 2.2.1).
2.3 Certified forest area
The two major certification schemes – the Forest Stewardship Council (FSC) and the Programme for the Endorsement of Forest Certification (PEFC) – released data in January 2018 on their certified forest areas and the extent of double-certified forests (PEFC, 2018), including revisions to previously released numbers. The FSC reported a certified area of 199 million hectares, as of mid-2017, an increase of about 3 million hectares from December 2016. The PEFC reported a certified forest area of 304 million hectares, up by 2 million hectares from December 2016. Thus, the two schemes reported a combined certified forest area of 503 million hectares. The FSC and the PEFC concluded that the area of double-certified forest (i.e. forest certified under both schemes) amounted to 70.1 million hectares in December 2016 and 71.1 million hectares in mid-2017, which, in both cases, was 16.5% of the global certified forest area. The total global certified forest area, with double-counting subtracted, was 427.7 million hectares in December 2016 and 431.4 million hectares in mid-2017. The total global certified area grew by 3.7 million hectares between December 2016 and June 2017, and the area of double-certified area increased by almost 1 million hectares.
Twenty-nine countries had forestlands that were double certified in 2017, some involving substantial areas. Double-certification applied to more than 17 million hectares of forest in Canada; more than 9 million hectares in the Russian Federation; more than 8.8 million hectares in the US; 8 million hectares in
Belarus; 7.2 million hectares in Sweden; and 6.9 million hectares in Poland. Other countries now shown to have overlaps include China, Japan and New Zealand (PEFC, 2018).
The FSC reported that, in June 2018, it had more than 200 million hectares of certified land area (FSC, 2018). The increase from mid-2017 included significant areas in the Russian Federation as well as forests in Belarus, Brazil, Mexico, Ukraine and the US. The extent of overlap with areas certified by PEFC-endorsed programmes has not been disclosed, however. The FSC reported declines in certified forest areas in Cameroon, Canada and Romania. Annual reporting by FSC Canada, for example, indicates that the certified forest area in Ontario province declined by 3.6 million hectares between 2016 and 2017 (FSC Canada, 2018a).
The PEFC reported more than 313 million hectares of certified forest, as of December 2017, up by nearly 12 million hectares (4%) from December 2016 (PEFC, 2016 PEFC, 2017b). The increases were in Asia, Europe, North America and South America, but the extent to which these new areas overlap with FSC-certified areas was not indicated. Declines were reported in Oceania, including a drop of nearly 3 million hectares in Australia (PEFC, 2016; PEFC, 2017b).
2.3.1 Internal developments in certification schemes
The FSC’s international generic indicators were approved in March 2015, and more than 80 countries are now engaged in processes to transfer their national standards from version 4 of the FSC’s Principles and Criteria to version 5. In 30 of the countries, the transfer of standards is being done by certification bodies and will result in interim national standards (FSC, 2018).
The FSC office in Canada began a revision process in 2012 to align with new FSC International requirements and to combine the four existing subnational FSC standards into a single national standard. The first draft of the revised standard

19Chapter 2 Policies shaping forest products markets
was released in 2015; a second draft was released in 2016; and field-testing was conducted in 2017. A final version of the standard has been submitted to FSC International for approval, which should be forthcoming in 2018 (FSC Canada, 2018b). The field-testing process and consultation in 2017 led to a number of revisions in the final version, including efforts to address concerns related to dispute resolution, “free, prior and informed consent” (as it relates to indigenous peoples), and woodland caribou (FSC Canada, 2018c).
FSC US completed its development of supplementary certification requirements for national forests in 2017 (FSC US, 2017). Final approval of the supplementary requirements will represent the completion of a process outlined in the FSC US Federal Lands Policy, which was established in the late 1990s and which has prevented the certification of lands managed by the US Forest Service (Fernholz et al., 2012).
PEFC working groups recently reviewed the PEFC’s standard-setting requirements and endorsement process (PEFC, 2017a). The outcomes were shared in early 2018 and have resulted in significant changes and additions. A notable example is the proposed inclusion of “trees outside forests” – such as trees growing in hedgerows, on farms and in urban areas – as eligible for certification (PEFC, 2018). The opportunity to certify trees more broadly across landscapes may be helpful in increasing the uptake of agroforestry, generating more sustainable and diversified farm income, and increasing awareness of certification among urban populations.
Both the Sustainable Forestry Initiative (SFI) and the American Tree Farm System have gained access to federal procurement recommendations in the US; previously, only FSC-certified materials were recognized. The revised approach is intended to align with purchasing requirements for federal agencies established in the United States Department of Agriculture’s BioPreferred Program, which recognizes the various forest certification programmes equally (EPA, 2018b).
2.3.2 Certified forest production
In August 2017 the FSC announced its intention to increase its market share to 20% by 2020. FSC-certified natural forests and plantations produced an estimated 16% of global timber by volume in 2016 (Global Wood Markets Info, 2017).
2.3.3 Chain-of-custody certification
Reported participation in chain-of-custody (CoC) certification continues to grow; however, data on this aspect of certification are known to include overlaps, with companies often holding multiple CoC certificates. Based on FSC data, the most significant growth in FSC CoC certification in the 12 months to June 2018 was in Asia, where 1,065 certificates were added (constituting 11% growth, year-on-year). The number of FSC CoC certificates increased by 809 (+5%) in
Europe but declined by 242 (-6%) in North America – which was similar to declines in that subregion in the previous three reporting periods (FSC, 2017; FSC, 2018). Globally, the FSC reported approximately 34,000 CoC certificates, as of June 2018, up by 5%, year-on-year. The number of CoC certificates in the PEFC scheme grew by 508 (+5%) in the 12-month period from December 2016 to December 2017, to almost 11,500. This was about double the growth achieved in the previous 12 months (PEFC, 2018) (graph 2.3.1).
The International Organization for Standardization (ISO) is developing a CoC standard (ISO/PC 287) for wood, wood-based products and wood-related materials (such as bamboo and cork). The standard will allow the tracking of different categories of materials in a CoC. In addition to tracking wood from sustainably managed forests, it will allow tracking from verified, specified or recycled origins (ISO, 2018). The standard will be sent to ISO members for approval as a “final draft international standard”. A simple majority is required to accept the standard, after which national standardization entities may publish and implement the standard without further voting.
2.3.4 Certification of woody biomass
The Sustainable Biomass Program (SBP) reported that it had 139 certificate holders as of March 2018, up by 88% from December 2016. The programme has certificate holders in 18 countries (Australia, Belarus, Belgium, Canada, Denmark, Estonia, Germany, Latvia, Lithuania, the Netherlands, Norway, Poland, Portugal, the Russian Federation, Spain, Sweden, the
0
5
10
15
20
25
30
35
40
FSC PEFCN
umbe
r of c
erti�
cate
s (t
hous
and)
GRAPH 2.3.1
Number of chain-of-custody certificates issued globally by the FSC and the PEFC, 2010-2018
Notes: Numbers denote CoC certificates irrespective of the size of individual companies or of production or trade volumes. FSC data are as of June 2018; PEFC data are as of December 2017.
Sources: FSC, 2018; PEFC, 2017b.

UNECE/FAO Forest Products Annual Market Review, 2017-201820
UK and the US). The SBP estimated that there were more than 5 million tonnes of SBP-certified wood pellets and chips in the market in 2017, representing 46% of the EU28’s wood pellet consumption. SBP-certified pellets account for about 40% of the total volume of Canada- and US-produced wood pellets imported by the EU28 (SBP, 2018).
2.3.5 Landscape certification
As reported in the previous edition of the Review, landscape approaches to certification are gaining attention, partly in response to policy developments such as REDD+ and FLEGT-related due diligence and governance, and partly because of growing corporate-sector interest in deforestation-free procurement. There is also increasing recognition that approaches at the scale of individual enterprises or management units are often ineffective and inefficient. Landscape approaches seek measurable indicators that are applicable across landscapes and which give an indication of the general progress being made (ISEAL Alliance, 2016).
The American Forest Foundation (AFF) recently announced an expansion of its efforts on landscape certification through the “Forests in Focus” programme, which has been in development with GreenBlue, a sustainability organization, since 2015. The aim of the programme is to increase the engagement of family-owned forestlands in certification, sustainability and responsible sourcing. It uses a risk assessment to identify needs in supply chains and opportunities for conservation activities to help in achieving sustainable forest management. The programme is viewed as an important complementary strategy to individual audit-based certification programmes, which have a low adoption rate among family forest owners. In 2018, the US Forest Service and several large companies announced participation in the development of Forests in Focus, including Esri, a digital mapping and technology company; Mars, a food company; McDonald’s, a fast-food retailer; and Staples, an office-supplies company (AFF, 2018b).
The SFI has announced a new approach for engaging smallholders and family-owned forestlands in Canada and the US. In April 2018, SFI submitted the SFI Small Lands Group Certification Module to the PEFC for endorsement. This proposed module is comparable in some ways to group certification programmes operated by the FSC and by the American Tree Farm System and other PEFC-endorsed programmes, which allow the aggregation of smallholders, thereby reducing the burden on individual operators through the responsibilities of group managers. The SFI proposal is unique, however, in its reliance on programmes developed through SFI fibre-sourcing certification and additional requirements related to the management of group-certification organizations and sustainable forest management (SFI, 2018). To enable greater efficiency and to operate as a landscape-scale certification approach, the SFI Small Lands Group Certification Module uses “wood and
fibre supply area plans”, which address forest management planning across supply areas and are made available to landowners. Individual harvest plans are required for each harvesting activity in the certified area. The module would apply to landowners with no more than 20,000 acres (8,000 hectares) of land; larger landowners would need to be certified to the SFI standard (SFI, 2018).
2.4 Carbon-related
2.4.1 Climate change and carbon markets
The aim of the Paris Agreement on climate change, an outcome of the 21st Conference of the Parties to the United Nations Framework Convention on Climate Change (UNFCCC), is to accelerate actions to mitigate climate change. The Paris Agreement entered into force on 4 November 2016 after ratification by at least 55 countries representing at least 55% of global greenhouse gas (GHG) emissions. As of June 2018, the Paris Agreement had been ratified by 178 of the 197 parties to the UNFCCC (UNFCCC, 2018). In June 2017, the US indicated an intention to withdraw from the agreement (The Washington Post, 2017), an action that can be formalized in 2020 under the terms of the agreement. The French government has expressed its expectation that any negotiated trade agreements between the EU and other nations would require implementation of the Paris Agreement (Climate Home News, 2018).
The Paris Agreement is built on the commitment of signatories to make “intended nationally determined contributions” (INDCs) to reduce GHG emissions. Responding to explicit recognition in the Paris Agreement that cutting land-based emissions – including from deforestation and by promoting sustainable forest management – is one of the most efficient ways to address climate change, the INDCs of more than 100 countries commit to pursuing actions in the land-use sector.
On 14 May 2018, the European Council adopted a regulation committing all EU member countries to compensating for their GHG emissions and removals from land use, land-use change and forestry (LULUCF). The regulation is known as a no-debit rule, meaning that all countries commit to offsetting their GHG emissions from land-use change and deforestation that occur between 2021 and 2030. This is also in line with the EU’s 2030 emission-reduction targets (GHG emissions should be cut by at least 40% by 2030) and the Paris Agreement. The LULUCF regulation improves the accounting of land management within the EU. This is the first time that the regulation has been incorporated into EU law, although member countries have already made commitments under the Kyoto Protocol for 2020 (European Commission, 2018e).
In June 2018, the government of Canada’s Ontario province announced an intention to end the province’s participation in

21Chapter 2 Policies shaping forest products markets
the country’s carbon cap-and-trade agreement. In response, Canada’s federal government stated an intention to impose a carbon tax if the province follows through on its stated intention. Ontario joins the Province of Saskatchewan, which has also expressed opposition to pricing carbon (iPolitics, 2018).
2.4.2 Green building
The European Council adopted amendments to the Energy Performance of Buildings Directive (Directive 2010/31/EU) on 14 May 2018. This revision is part of the Clean Energy package amendments and complements measures under the energy-efficiency directive as well as EU legislation on the energy efficiency of products (see table 2.2.1). The following two amendments are important for developing green buildings in Europe:
• Long-term renovation strategy. EU member countries committed to establishing a long-term strategy to support the renovation of national stocks of residential and non-residential buildings, both public and private, into highly energy-efficient and decarbonized building stocks by 2050, facilitating the cost-effective transformation of existing buildings into nearly-zero-energy buildings.
• New buildings. EU member countries committed to taking the measures necessary to ensure that new buildings meet minimum energy performance requirements. They further committed to ensuring that the technical, environmental and economic feasibility of high-efficiency systems, if available, is taken into account before the construction of new buildings starts (European Council, 2018).
The Russian Prime Minister has signed a government resolution on subsidies for purchases of prefabricated wooden houses. Credit will be provided at a reduced rate to individuals for the purchase of prefabricated wooden houses from manufacturers, followed by reimbursement to credit institutions at the expense of the federal budget. The adopted decision is aimed at supporting domestic demand for wooden-house construction and wood building products and increasing the production of prefabricated wooden houses (Government of the Russian Federation, 2018c).
2.4.3 Sustainable forestry policies
The EU’s Court of Justice ruled in February 2018 that the Government of Poland broke EU wildlife laws by allowing increased logging in Białowieża Forest, a designated World Heritage Site and Natura 2000 Special Area of Conservation. The case originated in March 2016, when Poland tripled logging limits, maintaining that this was needed to prevent beetle infestations and forest fires. The European Commission launched a legal case after ClientEarth and six other environmental organizations made a formal complaint (UNECE, 2017). The case was referred to the Court of Justice in
July 2017, which issued an injunction banning logging across the entirety of the Białowieża Forest except in circumstances concerning public safety. Poland suspended most logging in January 2018 pending the Court’s final decision. The issued judgment is final, and the parties cannot appeal (IUCN, 2018).
The Russian Minister of Natural Resources and Environment noted that reforestation through replanting now occurs over about 20% of the annual harvest area in the Russian Federation. The government has introduced legislation to ensure that all forestland is reforested, including through replanting. To increase the pace, it will be necessary to develop more seed selection and tree nursery centres. There are five such facilities in the Russian Federation at present, and six more will be built in coming years, with funding from federal and regional budgets and investors (Ministry of Natural Resources and Environment of the Russian Federation, 2018c).
Some companies that have committed to addressing forest impacts in their supply chains have made direct purchases of forestlands. In 2015, the technology company Apple bought 36,000 acres (14,600 ha) of forestland in the eastern US as part of a goal to “supply 100% of the virgin fibers used in its paper and packaging from sustainably managed forests or controlled wood sources” (Apple, 2015). Apple estimated that the annual production of paper fibre from the purchased forest area is equivalent to nearly half the virgin fibre that went into packaging for its iPhones, iPads, iPods, Macs and Apple TVs in 2014. IKEA Group, a home furnishings company, purchased 25,000 acres of forestland in the southeast US in 2018 as “part of a broader strategy to invest in the sustainable production of resources that IKEA Group consumes directly” (IKEA, 2018). The company has also reported owning more than 250,000 acres of forestland in Europe. There are other instances of corporations purchasing forestlands as part of climate-change-mitigation strategies and to offset carbon emissions; the forestland purchases by Apple and IKEA are especially noteworthy, however, because the acquired forests will be managed to supply paper and wood products as part of responsible sourcing initiatives.
The Bonn Challenge was launched in 2011 by the German Government and the International Union for the Conservation of Nature (IUCN), and later endorsed and extended by the New York Declaration on Forests at the 2014 UN Climate Summit. It is a global effort to restore 150 million hectares of the world’s deforested and degraded land by 2020 and 350 million hectares by 2030. Six countries of the CIS, Armenia, Georgia, Kazakhstan, Kyrgyzstan, Tajikistan and Uzbekistan jointly committed to restoring 2.5 million hectares of forest landscapes by 2030. The commitment was made at the first Ministerial Roundtable on Forest Landscape Restoration and the Bonn Challenge in the Caucasus and Central Asia, held on 21-22 June 2018 in Astana, Kazakhstan. The meeting also adopted the Astana Resolution, committing the region to go beyond 2.5 million hectares and to strengthening partnerships and regional cooperation to this end (UNECE, 2018).

UNECE/FAO Forest Products Annual Market Review, 2017-201822
2.5 References
Adler, J. 2016. No peace for Greenpeace. The Washington Post. Available at: www.washingtonpost.com/news/volokh-conspiracy/wp/2016/05/31/no-peace-for-greenpeace
AFF. 2018a. Support forest owners in the Farm Bill. American Forest Foundation (AFF). Available at: www.forestfoundation.org/forests-in-the-farm-bill?utm_source=email&utm_medium=referral&utm_campaign=grasstops
AFF. 2018b. USFS, Esri, Mars, McDonald’s, Staples & others partner with AFF, GreenBlue on sustainability tool. American Forest Foundation (AFF). Available at: www.forestfoundation.org/partnership-building-forest-sustainability
Apple. 2015. Apple buys 36,000 acres of forest to create sustainable eco-friendly product packaging. Available at: https://appleinsider.com/articles/15/04/16/apple-buys-36000-acres-of-forest-to-create-sustainable-eco-friendly-product-packaging
Belta. 2017. Ministerial meeting with the President of Belarus. Available at: www.belta.by/president/ view/lukashenko-trebuet-obespechit-pererabotku-vsej-drevesiny-vnutri-belarusi-229758-2017
Bonn Challenge. 2018. The challenge. Available at: www.bonnchallenge.org/content/challenge
Client Earth. 2018. EUTR News, March 2017 to March 2018. Available at: www.clientearth.org/eutr-news-march-2017-to-march-2018
Climate Home News. 2018. France to Trump: ‘No Paris Agreement, no EU trade agreement’. Available at: www.climatechangenews.com/2018/02/02/france-us-no-paris-agreement-no-trade-agreement-1
Dattu, R., Glossop, R. and Xu, C. 2017. International trade brief: the impact of softwood lumber tariffs on Canadian companies. Osler. Available at: www.osler.com/en/resources/cross-border/2017/international-trade-brief-the-impact-of-softwood
EPA. 2018a. Administrator Pruitt promotes environmental stewardship with forestry leaders and students in Georgia. Available at: www.epa.gov/newsreleases/administrator-pruitt-promotes-environmental-stewardship-forestry-leaders-and-students
EPA. 2018b. Policy update on EPA programmatic treatment of biomass and the forest products industry. Available at: www.epa.gov/sites/production/files/2018-02/documents/2.13.18_letter_from_pruitt_to_sununu_epa_programmatic_treatment_biomass_forest_products_industry.pdf
EU FLEGT Facility. 2018. Voluntary partnership agreements. Available at: www.euflegt.efi.int/vpa
EURACTIV. 2017. EU, US to set up joint task force to make progress on trade in Trump era. Available at: www.euractiv.com/section/economy-jobs/news/eu-us-to-set-up-joint-workforce-to-make-progress-on-trade-in-trump-era
European Commission. 2003. Forest law enforcement, governance and trade (FLEGT). Proposal for an EU Action Plan. Available at: https://eur-lex.europa.eu/legal-content/EN/TXT/PDF/?uri=CELEX:52003DC0251
European Commission. 2016. Backgrounder on the independent evaluation of the EU Forest Law Enforcement, Governance and Trade (FLEGT) Action Plan. Available at: https://ec.europa.eu/europeaid/sites/devco/files/backgrounder-flegt-evaluation_en.pdf
European Commission. 2017. EU-Canada trade agreement enters into force. Available at: http://trade.ec.europa.eu/doclib/press/index.cfm?id=1723
European Commission. 2018a. Notice to stakeholders: Withdrawal of the United Kingdom and EU rules in the field of fight against illegal logging and associated trade. Available at: https://ec.europa.eu/info/sites/info/files/notice_to_stakeholders_brexit_timber.pdf
European Commission. 2018b. Results of public consultation on EU timber regulation. Available at: https://ec.europa.eu/info/sites/info/files/results_timebr_regulation.xls
European Commission. 2018c. Renewable energy directive. Available at: https://ec.europa.eu/energy/en/topics/renewable-energy/renewable-energy-directive
European Commission. 2018d. Clean Energy for All Europeans. Available at: https://ec.europa.eu/energy/en/topics/energy-strategy-and-energy-union/clean-energy-all-europeans

23Chapter 2 Policies shaping forest products markets
European Commission. 2018e. Land use and forestry regulation for 2021-2030. Available at: https://ec.europa.eu/clima/lulucf_en#tab-0-0
European Council. 2017. Promoting renewable energy use – Council adopts its position. Available at: www.consilium.europa.eu/en/press/press-releases2017/12/18/promoting-renewable-energy-use-council-adopts-its-position
European Council. 2018. Energy efficient buildings: Council adopts revised directive. Available at: www.consilium.europa.eu/en/press/press-releases/2018/05/14/energy-efficient-buildings-council-adopts-revised-directive
European Parliament. 2018. MEPs set ambitious targets for cleaner, more efficient energy use. Available at: www.europarl.europa.eu/news/en/press-room/20180112IPR91629/meps-set-ambitious-targets-for-cleaner-more-efficient-energy-use
FAO. 2017. FAO Statistical Database. Production and trade. Available at: www.fao.org/faostat/en/#data/FO
FAO. 2018. State of the World’s Forests. Available at: http://www.fao.org/documents/card/en/c/I9535EN/
Fernholz, K., Howe, J., Bratkovich, S., Bowyer, J. and Stai, S. 2012. Certification for the management of the U.S. National Forest system. Dovetail Partners. Available at: www.dovetailinc.org/report_pdfs/2012/dovetailnfscert0412.pdf
FSC. 2017. FSC facts and figures June 2017. Forest Stewardship Council (FSC). Available at: https://ic.fsc.org/en/facts-and-figures
FSC. 2018. Facts and figures. June 2018. Forest Stewardship Council (FSC). Available at: https://ic.fsc.org/file-download.facts-figures-june-2018.a-7470.pdf
FSC Canada. 2018a. A year of milestones: 2017 Annual report. Forest Stewardship Council (FSC) Canada. Available at: https://ca.fsc.org/en-ca/newsroom/id/874
FSC Canada. 2018b. A look at the latest draft of the National Forest Management Standard. Forest Stewardship Council (FSC) Canada. Available at: https://ca.fsc.org/en-ca/newsroom/technical-updates/id/860
FSC Canada. 2018c. Public summary of significant changes to draft 2 of FSC Canada’s National Forest Stewardship Standard. Forest Stewardship Council (FSC) Canada. Available at: https://ca.fsc.org/preview.heading-to-the-finish-line-en.a-2048.pdf
FSC US. 2017. Supplementary requirements for US Forest Service lands. Forest Stewardship Council (FSC) US. Available at: https://us.fsc.org/en-us/certification/forest-management-certification/federal-lands-certification
GAC. 2016. Canada-European Union: Comprehensive Economic and Trade Agreement (CETA). Global Affairs Canada (GAC). Available at: http://international.gc.ca/trade-commerce/trade-agreements-accords-commerciaux/agr-acc/ceta-aecg
Global Wood Markets Info. 2017. FSC plans to reach global market share of 20% by 2020. Available at: www.globalwoodmarketsinfo.com/fsc-plans-to-reach-global-market-share-of-20-by-2020
Global Wood Trade Network. 2018. Wood products prices in Europe. Available at: www.globalwood.org /market/timber_prices_2018/aaw20180302e.htm
Government of the Russian Federation. 2017a. Governmental regulation from May 12, 2017 No. 911-р. Available at: http://government.ru/docs/all/111509
Government of the Russian Federation. 2017b. Governmental regulation from November 12, 2017 No. 1520, No. 1521. Available at: http://government.ru/docs/30598
Government of the Russian Federation. 2017с. Federal Law from 29.12.2017 No. 471-FZ. Available at: www.kremlin.ru/acts/bank/42700
Government of the Russian Federation. 2017d. Governmental regulation of 5 September 2017 No. 1072. Available at: http://government.ru/docs/29193
Government of the Russian Federation. 2018a. Available at: http://government.ru/info/32197
Government of the Russian Federation. 2018b. Governmental regulation from 23 February 2018 No. 190. Available at: http://static.government.ru/media/files/ZFi6fkVQyAW9n6RmgQG4pDF1MjIKA5IL.pdf
Government of the Russian Federation. 2018c. Governmental regulation from 5 March, 2018. No. 259. Available at: http://government.ru/docs/31727
UNECE/FAO Forest Products Annual Market Review, 2017-201824
Greenpeace. 2017. The day I was treated like a mobster and served a $300 million lawsuit for defending forests. Available at: www.greenpeace.org/usa/stories/the-day-i-was-treated-like-a-mobster-and-served-a-300-million-lawsuit-for-defending-forests
Gulf Times. 2018. African jobs at risk over French wood giant bankruptcy. Available at: www.gulf-times.com/story/584065/African-jobs-at-risk-over-French-wood-giant-bankru
Healthy Forests, Healthy Communities. 2018. Forest mortality exceeds harvest for past 20 years and now exceeds net growth. Available at: http://healthyforests.org/2018/05/data-forest-mortality-now-exceeds-growth-and-harvests-on-americas-national-forest-timberlands
IKEA. 2018. IKEA Group acquires 25,000 acre forest in Alabama. Latest investment furthers the IKEA Group expansion in the U.S. Available at: www.ikea.com/us/en/about_ikea/newsitem/020118-IKEA-Group-aquires-forest-in_alabama
iPolitics. 2018. Ottawa to impose Ontario carbon tax when Ford scraps cap-and-trade. Available at: https://ipolitics.ca/2018/06/15/ottawa-to-impose-ontario-carbon-tax-when-ford-scraps-cap-and-trade
ISEAL Alliance. 2016. Landscape approaches: implications for standards systems and proposed response. Internal strategy report for ISEAL members. Available at: www.isealalliance.org/sites/default/files/ISEAL_Landscape_Approaches_Strategic_Response_Member_Paper.pdf
ISO. 2018. ISO/PC 287. Chain of custody of wood and wood-based products. International Organization for Standardization (ISO). Available at: https://www.iso.org/committee/4952370.html
ITTO. 2018. Tropical Timber Market Report, 22 (12). International Tropical Timber Organization (ITTO). Available at: www.itto.int/files/user/mis/MIS_16-30_Jun2018.pdf
IUCN. 2018. Białowieża forest case: judgement by Court of Justice of the EU. International Union for Conservation of Nature (IUCN). Available at: www.iucn.org/news/world-commission-environmental-law/201805/bia%C5%82owie%C5%BCa-forest-case-judgement-court-justice-eu
ITTO. 2018. Chinese timber companies commit to jointly develop the global green supply chain. Available at: http://www.itto.int/news_releases/id=5622
KPMG. 2017. The road ahead: survey of corporate responsibility reporting 2017. Available at: https://assets.kpmg.com/content/dam/kpmg/xx/pdf/2017/10/kpmg-survey-of-corporate-responsibility-reporting-2017.pdf
Ministry of Natural Resources and Environment of the Russian Federation. 2017. Available at: www.mnr.gov.ru/press/news/proizvoditeli_pilomaterialov_s_1_iyulya_2017_g_budut_obyazany_vnosit_dannye_o_sdelkakh_v_egais_/?sphrase_id=20416
Ministry of Natural Resources and Environment of the Russian Federation. 2018a. Order No. 567 of October 17, 2017 (available at: http://publication.pravo.gov.ru/Document/View/0001201803270042) and order No. 693 of December 20, 2017 (available at: http://publication.pravo.gov.ru/Document/View/0001201803270034).
Ministry of Natural Resources and Environment of the Russian Federation. 2018b. Available at: www.mnr.gov.ru/press/news/s_4_maya_2018_g_v_rossii_vstupit_v_silu_novaya_lesoustroitelnaya_instruktsiya
Ministry of Natural Resources and Environment of the Russian Federation. 2018с. Available at: www.mnr.gov.ru/press/news/stroitelstvo_lesnykh_pitomnikov_mozhet_stat_obyazatelstvom_lesozagotoviteley
Ontario Superior Court of Justice. 2016. Resolute Forest Products Inc. v. Greenpeace. 2016 ONSC 5398. Court File No. DC-15-009. Available at: www.greenpeace.org/ canada/Global/canada/report/2016/10/DecisionCorbettJreDivCourtAppeal-ResoluteForestProductsvGreenpeace.pdf
PEFC. 2016. PEFC global statistics: SFM & CoC certification. Available at: www.pefc.org/images/documents/PEFC_Global_Certificates_-_Dec_2016.pdf
PEFC. 2017a. Changes to standard setting requirements. Programme for the Endorsement of Forest Certification (PEFC). Available at: http://pefc.org/news-a-media/general-sfm-news/2345-join-us-online-as-we-explain-the-changes-to-our-standard-setting-requirements
PEFC. 2017b. PEFC global statistics: SFM & CoC certification. Available at: www.pefc.org/images/documents/PEFC_Global_Certificates_-_Dec_2017.pdf

25Chapter 2 Policies shaping forest products markets
PEFC. 2018. Double certification FSC and PEFC – estimations mid 2017 and corrections 2016. Available at: www.pefc.org/images/documents/News/Double_certification_January_2018.pdf
Roslesvesti. 2017. Available at: http://roslesvesti.ru/ivan-valentik-lesnoe-hozyajstvo-dolzhno-vnov-stat-finansovo-samodostatochnoj-otraslyu
Rossiyskaya Gazeta. 2017. Federal law. Available at: http://kremlin.ru/acts/bank/42236 and https://rg.ru/2017/08/04/gosreestr-dok.html
Russell, B. 2017. Idaho ramps up ‘Good Neighbor Authority’ to boost logging in federal forests. The Spokesman-Review. Available at: www.spokesman.com/stories/2017/sep/22/idaho-ramps-up-good-neighbor-authority-to-boost-lo/
Sb. 2018. не тот лес, который круглый, а тот, что высокой добавленной стоимостью. Available at: www.sb.by/articles/ne-tot-les-kotoryy-kruglyy-a-tot-chto-vysokoy-dobavlennoy-stoimostyu.html
SBP. 2018. Sustainable Biomass Program annual report 2017. Available at: https://sbp-cert.org/docs/SBP-AR2017.pdf
Scion. 2017. Sustainable wood for sustainable development. Available at: www.scionresearch.com/about-us/about-scion/corporate-publications/scion-connections/past-issues-list/scion-connections-issue-26,-december-2017/sustainable-wood-for-sustainable-development
SFI. 2018. SFI Small Lands Certification Module. Available at: https://consultations.pefc.org/gf2.ti/f/919618/35731717.1/ZIP/-/Appl.zip
UN. 2017. General Assembly adopts 2 resolutions establishing six-point framework for halting deforestation, forest degradation. Available at: www.un.org/press/en/2017/ga11911.doc.htmUNECE. 2017. Forest products annual market review 2016-2017. Available at: www.unece.org/index.php?id=47252
UNECE. 2018. 2.5 million ha committed to the Bonn Challenge by the Caucasus and Central Asia. Available at: www.unece.org/info/media/presscurrent-press-h/forestry-and-timber/2018/25-million-ha-committed-to-the-bonn-challenge-by-the-caucasus-and-central-asia/doc.html
UNEP. 2018. Overview of competent authority EU Timber Regulation checks, June–November 2017. Available at: www.unep-wcmc.org/system/dataset_file_fields/files/000/000/519/original/Overview_of_CA_checks_June-Nov2017__FINAL_30_04_2018.pdf
UNFCCC. 2018. Paris Agreement status of ratification. United Nations Framework Convention on Climate Change (UNFCCC). Available at: https://unfccc.int/process/the-paris-agreement/status-of-ratification
US Bankruptcy Court for the District of Delaware. 2018. Notice of first day hearing. Case 18-11025-CSS Doc 21 filed 05/01/18. Available at: https://cases.primeclerk.com/gibson/Home-Index
US Congress. 2018. H.R.2 Agriculture and Nutrition Act of 2018. Available at: www.congress.gov/bill/115th-congress/house-bill/2/text
USDA. 2015. Implementation of revised Lacey Act provisions. Federal Register, 80(25). Available at: www.aphis.usda.gov/plant_health/lacey_act/downloads/APHIS-2008-0119-0288.pdf
USDA. 2017. Animal and plant health inspection service plant protection and quarantine questions and answers. United States Department of Agriculture (USDA). Available at: www.aphis.usda.gov/plant_health/lacey_act/downloads/ftz-faqs.pdf
USDA. 2018. Secretary Perdue applauds fire funding fix in omnibus. United States Department of Agriculture (USDA). Available at: www.usda.gov/media/press-releases/2018/03/23/secretary-perdue-applauds-fire-funding-fix-omnibus
US District Court Southern District of Georgia. 2016. Case 1:16-tc-05000. Document 208. Filed 05/31/16. Available at: www.washingtonpost.com/news/volokh-conspiracy/wp-content/uploads/sites/14/2016/05/complaint.pdf
US Trade Representative. 2017. USTR announces unprecedented action to block illegal timber imports from Peru. Available at: https://ustr.gov/about-us/policy-offices/press-office/press-releases/2017/october/ustr-announces-unprecedented-action
WTO. 2018. WTO establishes two panels to rule on US lumber duties. Available at: www.wto.org/english/news_e/news18_e/dsb_09apr18_e.htm
Washington Post. 2017. Trump announces U.S. will exit Paris climate deal, sparking criticism at home and abroad. Available at: https://www.washingtonpost.com/politics/trump-to-announce-us-will-exit-paris-climate-deal/2017/06/01/fbcb0196-46da-11e7-bcde-624ad94170ab_story.html?utm_term=.19659ae28be5

Chapter 3
WOOD RAW MATERIALS
Author: Håkan Ekström

27Chapter 3 Wood raw materials
Highlights
An estimated 1.35 billion m3 of roundwood was harvested in Europe, the CIS and North America in 2017 for the manufacture of forest products and the generation of energy.
About 1.10 billion m3 of industrial roundwood was consumed in the UNECE region in 2017, comprising 851 million m3 of softwood logs (up by nearly 1% over 2016) and 248 million m3 of hardwood logs (a 3% decline from 2016).
The total timber harvest in Europe was 401 million m3 in 2017, the largest since 2007. The apparent consumption of industrial roundwood in Europe of 409 million m3 in 2017 was the highest volume since before the global financial crisis.
Despite strong internal demand for roundwood, 2017 was Europe’s second-best year (after 2014) for roundwood exports.
The global trade of softwood logs rose for the second consecutive year in 2017; it has been on an upward trajectory for the last ten years. An estimated 84 million m3 of softwood logs were traded internationally in 2017, of which the UNECE region exported 75%.
Substantial investments in forest industries, predominantly sawmilling, have been driving increases in production in Siberia and the Russian Far East, where the harvest volume increased by 30% between 2013 and 2017. Harvests were virtually unchanged over this period in the Russian North West, and they declined in the central regions.
China’s imports of both softwood logs and softwood lumber reached all-time highs in 2017, despite a slowing of the country’s house-construction sector.
Sawlog prices pushed upwards in many countries in 2017 due to strong demand for softwood lumber in key world markets (including China, Europe and the US), increasing prices for lumber, and a growing international log trade.

UNECE/FAO Forest Products Annual Market Review, 2017-201828
3.1 Introduction
An estimated 1.35 billion m3 of roundwood (industrial roundwood plus woodfuel) was harvested in Europe, the CIS and North America in 2017 for the manufacture of forest products and the generation of energy. The UNECE region’s removals of industrial roundwood account for about 60% of all removals globally and for just over 80% of the world’s coniferous industrial roundwood harvest.
An estimated 877 million m3 of coniferous industrial roundwood was harvested in the UNECE region in 2017, up by 1.0% over 2016. It was the fifth consecutive year of increasing production, with total removals increasing by 7.5% since 2013. The biggest increases have been in Europe and the CIS (both about 11% since 2013).
Although total removals of non-coniferous industrial roundwood in the UNECE region have been almost unchanged in recent years, at around 255 million m3, trends have diverged in the three subregions. Removals declined in North America by 6.2% from 2013 to 2017, but they increased over that period in Europe (+3.3%) and the CIS (+7.6%).
Of total roundwood removals in the UNECE region in 2017, about 17% was used for fuel, a share that has been unchanged since 2013. The total harvest of woodfuel in the UNECE region was estimated at 224 million m3 in 2017, with more than half of this total produced and consumed in the European subregion. Data on woodfuel removals from forests are underreported in many countries; the Joint Wood Energy Enquiry of the Joint UNECE/FAO Forestry and Timber Section collects more-accurate data on this aspect (UNECE, 2017), but not annually.
This chapter focuses on the production, consumption, trade and prices of industrial roundwood and wood chips for material use (pulp, paper and wood-based panels) rather than on total roundwood (which would include woodfuel). See Chapter 8 (“Wood energy markets”) of this publication for insights into trends in wood raw materials in the wood energy sector.
The terms roundwood and log are used interchangeably in this chapter. The term “industrial roundwood” excludes roundwood used for fuel (thus, it includes roundwood used to produce wood products such as sawnwood, veneer and pulp). The terms “coniferous” and “softwood” are used interchangeably, as are “non-coniferous” and “hardwood” and “sawnwood” and “lumber”.
The consumption of industrial roundwood in the UNECE region has followed a similar trend to that of production in the last five years, with consumption increasing steadily for softwood logs and remaining fairly flat for hardwood logs (graphs 3.1.1 and 3.1.2). Total consumption was 1.10 billion m3
in 2017, comprising 851 million m3 of softwood logs and 248 million m3 of hardwood logs. The biggest changes between 2013 and 2017 were an increase in demand for industrial roundwood in Europe and the CIS and a decline in the consumption of hardwood logs in North America.
Notes: f = 2017 Committee on Forests and Forest Industry forecast. Industrial roundwood excludes woodfuel.
Source: UNECE/FAO, 2018.
GRAPH 3.1.1
Apparent consumption of softwood industrial roundwood in the UNECE region, by subregion, 2013-2018
90
95
100
105
110
115
120
2013 2014 2015 2016 2017 2018f
Inde
x (2
013
= 10
0)
Europe CIS North America
Notes: f = 2017 Committee on Forests and Forest Industry forecast. Industrial roundwood excludes woodfuel.
Source: UNECE/FAO, 2018.
GRAPH 3.1.2
Apparent consumption of hardwood industrial roundwood in the UNECE region, by subregion, 2013-2018
80
85
90
95
100
105
110
115
120
2013 2014 2015 2016 2017 2018f
Inde
x (2
013
= 10
0)
Europe CIS North America

Chapter 3 Wood raw materials 29
The global trade of softwood logs increased in 2016 and 2017 to reach its second-highest level in ten years. An estimated 84 million m3 of softwood logs were traded internationally in 2017, of which the UNECE region exported 75% (Wood Resources International, 2018b). The UNECE region has long been a net exporter of both softwood and hardwood logs; in 2017, net log exports in the region reached 29.5 million m3, up from 25.2 million m3 in 2016. The major changes in trade in 2016-2017 were increased softwood log shipments from North America to Asia and a decrease in European hardwood log imports from the Russian Federation.
The major global trade flows of coniferous industrial roundwood are from New Zealand, the Russian Federation and the US to China; most of these increased in 2015-2017 (graph 3.1.3). In Europe, the major softwood log trade has been from the Czech Republic to Austria and Germany and from Norway to Sweden (Wood Resources International, 2018b).
3.2 Europe
3.2.1 Industrial roundwood markets
The apparent consumption of industrial roundwood by the forest industry in Europe was 409 million m3 in 2017. Although this represents only a marginal increase over 2016 (table 3.2.1), it is the largest volume since the global financial crisis in 2008 and a considerable rise compared with the ten-year low of 341 million m3 in 2009. Total consumption in 2017 comprised 314 million m3 of coniferous species and
Source: Wood Resources International, 2018b.
GRAPH 3.1.3
Top five global trade flows of softwood roundwood, 2013-2017
0
2
4
6
8
10
12
14
2012 2013 2014 2015 2016 2017
Mill
ion
m3
China from New ZealandChina from Russian FederationChina from the USChina from AustraliaAustria from the Czech Republic
95 million m3 of non-coniferous species. There has been a
substantial increase in industrial log demand in a number of
European countries in the last five years, including Estonia,
France, Latvia, Portugal and Romania.
The total timber harvest in Europe was 401 million m3 in 2017,
the highest since 2007. Removals of coniferous industrial
roundwood increased by 1.2% in the subregion in 2017. The
harvest of non-coniferous industrial roundwood was steady
from 2014 to 2017 at 88-89 million m3, with the production of
hardwood lumber and pulp changing little over the period.
Harvests increased in most log-producing countries in
Europe in 2013-2017, but four stand out for their dramatic
gains: Poland (+19.5%), Turkey (+16.1%), Finland (+12.2%)
and Sweden (7.5%). Belgium, Croatia, Hungary, Switzerland
and the UK were among the few countries in which
industrial roundwood harvests declined over the period. The
major driver of higher timber harvests has been increasing
production in many European sawmills, with markets for
softwood lumber improving in Europe and overseas.
TABLE 3.2.1
Industrial roundwood balance, Europe, 2016-2018 (thousand m3)
Note: f = 2017 Committee on Forests and the Forest Industry forecast.
Source: UNECE/FAO, 2018.
2016 2017 2018fChange
(%) 2016-2017
Removals 396,055 400,973 403,277 1.2
Imports 54,240 52,136 46,918 -3.9
Exports 41,707 44,297 41,045 6.2
Apparent consumption
408,587 408,812 409,151 0.1

UNECE/FAO Forest Products Annual Market Review, 2017-201830
3.2.2 Trade of roundwood
The global trade of softwood logs rose for the second consecutive year in 2017, with Europe accounting for approximately 34% of total imports. Year-on-year changes differed for the world’s top six importing countries, with China, Germany, Austria and Sweden increasing log imports in 2017 compared with 2016, and Japan and the Republic of Korea decreasing their log imports. The softwood log trade has been on an upward trajectory for the last ten years, with lumber production increasing worldwide. Shipments have increased by 36% worldwide and by 29% in Europe since a 20-year low in the global log trade in 2009. The outlook is for continued expansion in lumber demand in the next few years, and the log trade is therefore likely to continue its upward trend.
There were several changes in the world’s top five softwood log importers between 2007 and 2017 (table 3.2.2). China’s share of total worldwide imports increased from 23% to 37% over the period. Germany ascended to second position, with its share of global import volumes doubling. Japan, previously the third-largest importer of softwood logs, fell out of the top five as the country increased its use of domestic forest resources, and Finland also exited the list. Sweden entered the top five in fourth place, above the Republic of Korea, the softwood log imports of which declined by more than 50% over the period.
With high demand for logs and limited increases in domestic harvests, Germany has become a major importer of softwood logs in the past ten years. It imported record-high log volumes in 2016 and 2017 to supply its expanding sawmilling sector, which increased lumber exports by 20% between 2013 and 2017. The two major exporters of sawlogs to Germany are the Czech Republic and Norway, together supplying more than 50% of the import volume in the last five years. In addition to logs for the lumber industry, German pulpmills imported
Sources: FAO, 2018 (for 2007 figures); UNECE/FAO, 2018 (for 2017 figures except the Republic of Korea); COMTRADE, 2018 (for the Republic of Korea).
TABLE 3.2.2
Top five softwood log importers, 2007 and 2017 (million m3)
2007 2017
China 23.2 China 36.9
Republic of Korea 8.1 Germany 8.2
Japan 7.7 Austria 7.9
Austria 7.3 Sweden 5.6
Finland 6.2 Republic of Korea 3.2
approximately 2 million m3 of logs from neighbouring Czech Republic, Estonia, Latvia and Poland in 2016 and 2017.
Finland’s log imports have declined substantially in the last decade, and the Finnish forest industry is now much less reliant than it once was on imported wood raw materials. Finland imported only 1.1 million m3 of softwood logs in 2017, a record low and well down from the all-time high of 8.5 million m3 in 2005. Increased domestic timber harvests, the closure of inefficient manufacturing facilities, and greater wood-use efficiency have all been factors in reducing the country’s need for imported logs and wood chips. The Russian Federation continues to be its dominant log supplier, accounting for 63% of Finland’s total volume of imported softwood logs in 2017.
Sweden’s softwood log imports increased for the second consecutive year in 2017, to 5.6 million m³, with Estonia and Finland especially expanding their market shares. Nevertheless, Sweden’s import volumes fell to their lowest levels in two years in the fourth quarter of 2017 (year-on-year) because of weather-related struggles in sourcing logs around the Baltic Sea. Sweden’s biggest changes in supply in the last five years have been a dramatic decline in logs shipped from Latvia and a sharp increase in pulplog imports from Norway.
Both Finland and Sweden have substantially reduced their reliance on imported hardwood pulplogs in the last decade. In 2008, the two countries imported a combined volume of 10.8 million m3 of hardwood logs, but this had declined to only 5.8 million m3 by 2017.
3.2.3 Consumption of wood fibre by the pulp industry
Pulp production has been stable in Europe in the last five years; consequently, total wood fibre demand has changed little. There has been a slight shift from mechanical pulp to chemical pulp, however, resulting in higher wood-fibre consumption in 2017. Europe’s pulp industry increased fibre

Chapter 3 Wood raw materials 31
use by 1.2% in 2017, to 149 million m3, the largest volume
since 2008 (CEPI, 2018).
The biggest changes in fibre sourcing in the last few years
have been a slight decline in hardwood fibre and a shift
away from softwood logs towards softwood chips sourced
from the sawmilling sector. Hardwood fibre accounted for
almost 27% of the total fibre furnish in 2017 and the shares
of softwood roundwood and residuals were 49% and 24%,
respectively.
3.3 Commonwealth of Independent States
3.3.1 Industrial roundwood markets
Total estimated removals of industrial roundwood in the
CIS were 220.2 million m3 in 2017 (table 3.3.1), comprising
about 168.7 million m3 of conifers and 51.5 million m3 of non-
coniferous species. The accuracy of Russian harvesting data
remains uncertain, however, with the Russian government
acknowledging that “undocumented” timber harvesting
takes place (and therefore is not accounted for in official
estimates). Estimates of the volume of timber logged without
permission vary substantially. However, there is general
consensus that non-documented harvest is declining in the
Russian Federation, the result of stricter controls.
According to UNECE data, about 198 million m3 of industrial
roundwood was harvested in the Russian Federation in 2017,
almost unchanged from 2016 but about 10% higher than
in 2013. The official estimate of the coniferous roundwood
harvest was 150.9 million m3 in 2016 and non-coniferous
roundwood removals were estimated at 46.7 million m3.
Siberia and the Far East are the only regions of the Russian
Federation in which timber harvests have risen in the last five
years (WhatWood, 2018), driven by substantial investments
in forest industry production, predominantly sawmilling. In
the period 2013-2017, the harvest volume increased by 30%
in Siberia and the Far East, was practically unchanged in the
Russian North West, and fell in the central provinces.
A recently enacted federal law in the Russian Federation is
likely to increase the harvest further in the Far East because
companies are now able to apply for cutting rights at the
federal rather than the regional level. In addition to the new
law, the federal government is guaranteeing forest access
to domestic and foreign interests investing in production
capacity in the Far East as part of the new Development
Programme for the Far East.
3.3.2 Trade of roundwood
The Russian Federation is the world’s second-largest exporter
of softwood logs after New Zealand and the largest exporter
of hardwood logs. Russian hardwood log exports trended
upward in the eight years to 2017, to 7.5 million m3, with
more than 90% going to Finland and China. The Russian
Federation’s hardwood log export volume in 2017 was more
than twice the volume in 2008, which was an all-time low.
Russian exports of softwood logs fell by 6.4% in 2017, to 11.9
million m3, the lowest level in more than 20 years. Almost 85%
of the export volume in 2017 went to China.
Although the Chinese forest industry has a history of
importing logs for its raw-material needs due to a lack of
domestic sources, the trend in the last three years has been
towards the import of softwood lumber rather than logs.
Chinese importers have gradually shifted their historical
preference for logs away from the Russian Federation towards
New Zealand.
2016 2017 2018fChange (%) 2016-2017
Removals 219,304 220,219 224,894 0.4
Imports 464 479 479 3.3
Exports 25,457 23,876 23,353 -6.2
Apparent consumption
194,311 196,822 202,020 1.3
TABLE 3.3.1
Industrial roundwood balance, CIS, 2016-2018 (thousand m3)
Note: f = 2017 Committee on Forests and the Forest Industry forecast.
Source: UNECE/FAO, 2018.

UNECE/FAO Forest Products Annual Market Review, 2017-201832
3.4 North America
3.4.1 Industrial roundwood markets
Timber harvests in North America were surprisingly stable in the five years to 2017, with the volume of industrial roundwood removals ranging between 503 million m3 and 511 million m3 annually (table 3.4.1). Canada’s total harvest was 153 million m3 in 2017, comprising 126 million m3 of conifers and 27 million m3 of non-coniferous species.
About 50% of Canada’s timber harvest is in the province of British Columbia. According to the British Columbian Ministry of Forest’s 2015 assessment, the more-than-decade-long pine beetle infestation there has killed more than 730 million m3 of merchantable pine volume (about 54% of the province’s total merchantable pine timber inventory). In the Central Interior, the worst-hit region, beetles have destroyed 80-90% of the pine forests. The same assessment confirmed that the epidemic is now essentially over, projecting that, by 2020, the volume of pine killed in the province will be just less than 740 million m3. Between 1990 and 2006, before the beetle infestation, annual
harvests averaged around 75 million m3. The volume has declined consistently since then, to about 65 million m3 in 2017 – which was 5% less than the harvest in 2016 and the lowest annual volume of timber removals since 2010.
The UNECE/FAO (2018) data on US timber harvest (removals of industrial roundwood) was about 355 million m3 in 2017, practically the same as in the previous four years. This appears to be too low given the high log demand in the US forest industry; it might also be expected that the timber harvest in 2017 would be higher than in 2013 because forest industry production increased significantly over the period. In contrast to the official data, expert analysis based on derived log consumption by the forest industry and net log trade indicates that actual removals of industrial roundwood in 2017 were closer to 396 million m3, 4.2% higher than in 2013 (Wood Resources International, 2018b).
Increases in the production of lumber and oriented strandboard (OSB) are the main reasons for the increased log consumption in the five years to 2017. Softwood lumber production grew by 14% from 2012 to 2016, and hardwood lumber production climbed by 20%. The OSB industry, which has benefited from the improved housing market, increased production by 26% in the five years to 2017.
3.4.2 Trade of roundwood
Canada’s exports of softwood logs declined in 2017 to 7.4 million m3, down from 7.6 million m3 in 2016. Most of the fall was in shipments to Japan, but exports to the US also dropped – to their lowest level in six years. China continued as the major market for Canadian logs, with shipments reaching 3.6 million m3, the second-highest volume on record. Interestingly, although Canadian log exports to China have risen in recent years, Chinese imports of Canadian softwood lumber have declined for four consecutive years.
Less than ten years ago, Canada was a net importer of softwood logs. With declining log imports from the US and a doubling of exports to Asia, however, Canada was a net exporter in 2017, at 2.5 million m3.
Softwood log exports from the US increased by 11.5% in 2017, to 10.8 million m3. China was still the biggest market, followed by Canada, Japan and the Republic of Korea. Historically, US overseas log exports have been from the West Coast. With local sawlog prices in the US South at record lows in real terms, however, timberland owners in that region are increasingly exploring opportunities to export pine logs to overseas markets. Shipments from the US South reached a record high in 2017, accounting for 13% of total US log exports.
2016 2017 2018fChange (%) 2016-2017
Removals 511,280 508,279 510,604 -0.6
Imports 7,433 7,646 7,646 2.9
Exports 20,219 21,567 21,567 6.7
Apparent consumption
498,494 494,358 496,683 -0.8
TABLE 3.4.1
Industrial roundwood balance, North America, 2016-2018 (thousand m3)
Note: f = 2017 Committee on Forests and the Forest Industry forecast.
Source: UNECE/FAO, 2018.

Chapter 3 Wood raw materials 33
3.5 Extra-regional influence on the UNECE
The UNECE region is a net exporter of both softwood logs and
hardwood logs. In 2017, the region exported 24.9 million m3
more softwood logs than it imported, and net exports of
hardwood logs reached 4.6 million m3. China is the major
destination for exported logs from both North America and
the Russian Federation.
With limited domestic forest resources, China continues
to be a major importer of forest products to meet growing
domestic demand for logs, lumber, chips, pulp and paper.
Import volumes of both softwood logs and softwood lumber
reached all-time highs in 2017, despite the slowing of the
house-construction sector. Lumber imports grew much
faster than log imports in 2015-2017, and they were 36%
higher than log imports (roundwood equivalent volume) in
2017. This is a shift from the past when log shipments were
substantially higher than lumber imports. Today, China is
the world’s largest importer of logs and the second-largest
importer of lumber after the US. The reshuffling of China’s log
suppliers in the last five years has been more dramatic than
shifts in its lumber suppliers; moreover, fewer countries are
exporting logs to China compared with the number shipping
lumber.
The biggest change in China’s softwood log imports in
the period 2013-2017 is that Australia has become a major
supplier, with its export volume increasing from 1.6 million m3
in 2013 to 4.2 million m3 in 2017 (table 3.5.1). Another major
change is that New Zealand has taken market share in the
Chinese market from both the Russian Federation and the US.
3.6 Wood raw-material costs
The supply of wood raw materials is by far the largest cost component in the manufacture of wood pulp, lumber, plywood and wood pellets. For example, the cost of logs accounts for an estimated 65-75% of the total cost of softwood lumber production. In the pulp industry, wood-fibre costs averaged 56% of total manufacturing costs in 2017 (Fisher International, 2018).
Wood raw-material costs for lumber and pulp producers increased worldwide in 2017, mainly because of stronger prices for most forest products but also because of increased demand for sawlogs, pulplogs and wood chips.
3.6.1 Sawlog prices
Sawlog prices pushed upward in many countries in 2017 due to strong demand for softwood lumber in key world markets, including China, Europe and the US, rising lumber prices, and a growing international log trade.
The Global Sawlog Price Index, a volume-weighted price index comprising average prices for coniferous sawlogs in 20 of the world’s largest sawlog-consuming regions, jumped by 15% between the first quarter of 2017 and the first quarter of 2018. The index value of $80.51 per m3 was the highest price since late 2014 (graph 3.6.1).
With the exception of the US South and Brazil, sawlog prices increased in the world’s major lumber-producing regions in 2017 and early 2018. The biggest rises were in eastern Europe,
TABLE 3.5.1
Softwood log imports to China, 2013 and 2017 (million m3)
Source: Wood Resources International, 2018b.
2013 2017Change (%) 2013-2017
New Zealand 11.3 13.4 19
Russian Federation 9.3 8.7 -6
US 5.3 4.8 -9
Australia 1.6 4.2 163
Canada 2.7 2.8 4
Other 2.8 3.0 7
Total 32.9 36.9 12
90
100
110
120
130
140
2009 2012 2015 2018
Inde
x (�
rst q
uart
er 2
009
= 10
0)
GRAPH 3.6.1
Global Softwood Sawlog Price Index, 2009-2018
Note: The index is based on delivered sawlog prices in 20 key regions worldwide.
Source: Wood Resources International, 2018a.

UNECE/FAO Forest Products Annual Market Review, 2017-201834
the Nordic countries and western North America (graphs 3.6.2 and 3.6.3); price movements were more modest in Latin America and Oceania.
Prices for softwood sawlogs in the US West have been on an upward trend for almost three years, with Douglas-fir sawlogs commanding prices in the domestic market that are 45% higher in 2018 than they were in 2015. Log export prices have
also gone up since 2015, albeit at a slower pace than the price of logs sold domestically.
The almost universal upward trend in sawlog prices has been driven by a generally strong global economy, which has been generating significant activity in construction sectors and increasing demand for wood products.
Although the prospects are good for the global forest industry in 2018, policies in the works could limit free trade, add trade tariffs and reduce confidence in the global free market. These have the potential to end the high-demand cycle for wood products and terminate the upward trend for log prices.
Higher costs in the first quarter of 2018 for sawlogs in the Baltic states, the Nordic countries, the Czech Republic and Austria all helped the Euro-based European Sawlog Price Index reach its highest point in almost three years. The index increased by 3.4% between the first quarter of 2017 and the first quarter of 2018, to €85.65 per m3, continuing an upward trend that started in early 2016.
3.6.2 Pulpwood prices
Strong pulp markets and record high prices for both softwood and hardwood market pulp resulted in upward price pressure on wood fibre worldwide in much of 2017 and the first half of 2018. The Global Softwood Fiber Price Index rose by 3.4% between the fourth quarter of 2017 and the first quarter of 2018, the second highest quarter-on-quarter increase in
80
90
100
110
120
130
140
150
160
2013 2014 2015 2016 2017 2018
Inde
x (�
rst q
uart
er 2
013
= 10
0)
Canada West US WestUS South Canada East
GRAPH 3.6.3
Coniferous sawlog cost indices, North America, 2013-2018
Notes: Indices are based on delivered log price per m3 under bark in local currencies. “US South” shows the price for pine; “US West” shows the price for hemlock; “Canada West and East” shows prices for mixed conifers.
Source: Wood Resources International, 2018a.
60
70
80
90
100
110
120
$/od
mt
Hardwood Softwood
GRAPH 3.6.4
Global wood-fibre price indices for softwood and hardwood, 1990-2018
Notes: Indices are based on delivered pulpwood and wood chip prices in 18 key regions worldwide. Indices are based on US dollars per oven-dry tonnes (ODMT).
Source: Wood Resources International, 2018b.
80
90
100
110
120
130
2013 2014 2015 2016 2017 2018
Inde
x (�
rst q
uart
er 2
013
= 10
0)
Sweden GermanyRussian Federation Poland
GRAPH 3.6.2
Softwood sawlog price indices, Germany, Poland, the Russian Federation and Sweden, 2013-2018
Note: Indices are based on delivered log price per m3 under bark in local currencies.
Source: Wood Resources International, 2018a.

Chapter 3 Wood raw materials 35
seven years (graph 3.6.4). Softwood fibre prices grew in all 20
key regions that produce pulp worldwide, with the exception
of eastern Canada, where chip prices fell by 14% between the
first quarter of 2017 and the first quarter of 2018.
Price increases for hardwood pulplogs have been more
modest than those for softwood pulplogs, with prices rising
most in Finland, the Russian Federation and Spain. The Global
Hardwood Fiber Price Index reached a three-year high in
quarter 1 of 2018, up by 8.0% compared with the first quarter
of 2017.
Price movements for wood fibre in North America were mixed
in 2017 and early 2018, with substantial increases in the US
West and western Canada and a significant fall in prices for
softwood chips in eastern Canada. The only region in which
wood prices remained practically unchanged was the US
80
90
100
110
120
130
140
150
160
2013 2014 2015 2016 2017 2018
Inde
x (�
rst q
uart
er 2
013
= 10
0)
Canada Wes t US SouthGermany Sweden
GRAPH 3.6.5
Coniferous wood-chip price indices, Canada West, US South, Germany and Sweden, 2013-2018
Note: Indices are based on the delivered wood-chip price per oven-dry metric tonne in local currencies.
Source: Wood Resources International, 2018b.
70
80
90
100
110
120
130
2013 2014 2015 2016 2017 2018
Inde
x (�
rst q
uart
er 2
013
= 10
0)US South Russian FederationFinland Germany
GRAPH 3.6.6
Coniferous pulplog price indices, Finland, Germany, the Russian Federation and the US South, 2013-2018
Note: Indices are based on delivered log price per oven-dry metric tonne in local currencies.
Source: Wood Resources International, 2018b.
South, where the pulp industry continues to enjoy some of the continent’s lowest fibre costs (graph 3.6.5).
Prices for pulplogs and wood chips increased substantially in US dollar terms in Europe in 2017, mainly because of the weakness of the dollar against all of Europe’s major currencies (price changes in local currencies were more modest). The biggest price increases for pulplogs between the first quarters of 2017 and 2018 were in Finland, Germany, Spain and Sweden. In all four countries, softwood fibre costs increased by more than 18% in 2017 (graph 3.6.6). Another factor pushing up fibre costs has been the robust pulp market.
3.6.3 Fibre feedstock prices for pellet manufacturers
Wood-fibre costs for pellet producers in both Canada and the US rose slightly in late 2017 and early 2018, continuing an upward trend that started in early 2017. The lower sawmill operating rates in western Canada resulted in reduced supplies of residues for pellet manufacturers, forcing some to use more costly forest biomass in their feedstock mixes. The total fibre cost for Canadian pellet producers moved slowly upward in 2017 and the first few months of 2018, reaching a three-year high in the first quarter of 2018.
The Pellet Feedstock Price Index for Canada, reported in US dollars, rose by 8.1% in the first quarter of 2018, year-on-year, to $44.21 per oven-dry metric tonne (Wood Resources International, 2018a) (graph 3.6.7). Much of this increase was

UNECE/FAO Forest Products Annual Market Review, 2017-201836
the result of a stronger Canadian dollar against the US dollar.
Pellet feedstock costs in western Canada are likely to increase
overall in 2018 because of the shrinking availability of sawlogs
for the region’s sawmills, a crucial source of biproducts for the
pellet industry.
The almost-two-year falling trend in the US Pellet Feedstock
Price Index (PFPI-US) was interrupted in the third quarter of
2017, and fibre prices started inching upward in the fall. The
increase reflected the greater use of costlier roundwood
by new pellet mills, which continued to ramp up in late
2017. The price rise was partially offset, however, by falling
prices for sawdust and shavings used by a growing number
of pellet mills as supplies from US sawmills increase. The
PFPI-US continued to climb in winter, reaching $63.60 per
over-dry metric tonne in the first quarter of 2018. Lumber
production in the US South will determine the supply of
sawdust and shavings and its consequent impact on the
PFPI-US through 2018. With the supply of sawmill residues
expected to increase, prices for sawdust and shavings
will likely fall, benefiting those pellet mills able to handle
residuals.
30
35
40
45
50
55
60
65
70
75
80
2013 2014 2015 2016 2017 2018
$/od
mt
US Canada
GRAPH 3.6.7
Wood pellet feedstock price indices, Canada and the US, 2013-2018
Note: Indices are based on delivered price per oven-dry metric tonne (odmt) in local currencies.
Source: Wood Resources International, 2018a.

Chapter 3 Wood raw materials 37
3.7 References
CEPI. 2018. Confederation of European Paper Industries (CEPI). Available at: www.cepi.org
COMTRADE. 2018. UN COMTRADE database. New York. Available at: http://comtrade.un.org/db
FAO. 2018. Forestry Production and Trade database. Available at: www.fao.org/faostat/en/#data/FO
Fisher International. 2018. Available at www.fisheri.com
Forest2Market. 2018. Return to Log: How Sawmills Determine a Log’s Value. Available at: https://blog.forest2market.com/return-to-log-how-sawmills-determine-log-value
UNECE/FAO. 2017. Joint wood energy enquiry. Available at: www.unece.org/forests/jwee.html
UNECE/FAO. 2018. TIMBER database. Available at: www.unece.org/trade/timber
WhatWood. 2018. Available at: www.whatwood.ru
Wood Resources International. 2018a. North American Wood Fiber Review. Available at: www.WoodPrices.com
Wood Resources International. 2018b. Wood Resource Quarterly. Available at: www.WoodPrices.com

Chapter 4
SAWN SOFTWOOD
Lead author: Russ Taylor
Contributing authors: Antti Koskinen, Fran Maplesden and Igor Novoselov

Chapter 4 Sawn softwood 39
Highlights
Demand for, and production of, sawn softwood in the three UNECE subregions increased in 2017 for the second consecutive year.
Sawn softwood production increased by a substantial 10.4% in the CIS in 2017 and by much smaller percentages in North America and Europe.
Sawn softwood production increased by 10.3% in the Russian Federation in 2017, to 37.8 million m3, which was more than 86% of the CIS subregion’s output (43.8 million m3).
Exports of Russian sawn softwood set a new volume record in 2017 of 28.0 million m3, an increase of 10% over 2016. Export growth was due largely to China, which remained the largest consumer of Russian sawn softwood in 2017 and increased its purchases by 20% (year-on-year), to 16.1 million m3.
Europe’s sawn softwood production increased by 1.2% in 2017, to 110.0 million m3. Notable gains were in Germany (+0.9 million m3) and Finland (+0.3 million m3).
European sawn softwood exports increased by 3.4% (to 51.5 million m3) in 2017. China increased its imports of European sawn softwood by 64% in 2017, to 3.4 million m3, overtaking Egypt and Japan as Europe’s largest overseas export market for this product and compensating for weak demand in Middle Eastern and African markets.
US housing starts continued to improve in 2017, and apparent consumption of sawn softwood increased by 2.9%, to 99.2 million m3.
Canadian sawn softwood production was unchanged in 2017 at 48.2 million m3, but the US increased output by 3.5%, to 57.6 million m3.
Several supply shocks in Canada, including a severe wildfire season and the imposition of duties on Canadian sawn softwood imports in the US, created all-time record-high sawnwood prices in the US in 2017 and especially the first half of 2018. This caused a ripple effect on prices in most major global markets, continuing a positive cycle that started in late 2015.
Canadian shipments of sawn softwood to the US declined by 1.4 million m3 (-5.8%) in 2017, to 22.7 million m3, despite soaring prices. Canada’s overseas exports also declined – by 5.0%, to 6.7 million m3.
European exports of sawn softwood to the US leapt in 2017, with the volume more than doubling (+130%) to 1.3 million m3.

40 UNECE/FAO Forest Products Annual Market Review, 2017-2018
4.1 Introduction
In 2017, for the second year in a row, the three UNECE subregions recorded gains in consumption and production, the result of continuing favourable global economic trends and improving markets worldwide. The recovery in North America continued for the eighth consecutive year, with sawn softwood consumption increasing by 2.9% in 2017. Consumption increased by less than this in Europe (1.5%) but by more (6.2%) in the CIS subregion (table 4.1.1). Sawn softwood production increased by 1.9% in North America in 2017, 1.2% in Europe and 10.4% in the CIS (led by the Russian Federation’s 10.3% gain).
4.2 Europe
4.2.1 Consumption
The positive trend for sawn softwood continued in the European market in 2017, with consumption increasing by 1.5%, to 96.3 million m3 (table 4.2.1). The market performed much better than forecast in 2017, with the major consumers close to reaching the record high levels achieved before the global financial crisis. Ten countries reported, often minor, declining apparent consumption in 2017, but this was due partly to decreasing levels of stock, which can distort the real market development picture.
The greatest contributor to increasing consumption in Europe was the UK, where consumption increased by 9.7%, to 10.6 million m3. This was the first time since 2007 that the UK’s consumption has exceeded 10 million m3. Germany’s consumption in 2017 was close to the record year of 2008, growing by 2.6% to 19.3 million m3. Consumption in France continued its upward trend in 2017, increasing by 5.6% to
8.2 million m3 (2.9% in 2016). The French market is still more than 2 million m3 smaller than it was in 2005-2008, however.
Consumption in southern Europe is also still well below the record years of the last decade, but it is growing. In Italy, for example, consumption reached 5.0 million m3 in 2017, up by 4.6% over 2016.
Growth rates in consumption were mostly above the European average in Eastern Europe. Both Poland (5.8%) and Slovakia (26.2%) reported strong increases, to 4.5 million m3 and 0.9 million m3, respectively.
The most significant drop in apparent consumption in Europe was in Finland, at -10.9%. Stock levels there decreased significantly, however, meaning, according to the Finnish Forest Industries Federation, that real consumption increased by 6%. (Finnish Forest Industries Federation, 2018).
Sawn softwood consumption declined in Turkey (-3.2%) and Romania (-2.7%) in 2017, resulting in a collective drop of 0.3 million m3 to 6.7 million m3 and 3.1 million m3, respectively.
The ranking among Europe’s largest consumers of sawn softwood was unchanged in 2017. Germany was still easily the largest, at 19.3 million m3 in 2017, followed by the UK and France. The five largest consumers accounted for 51% of consumption in the European subregion in 2017 as well as for 56% of consumption growth.
4.2.2 Production and capacity change
Growth in sawn softwood production slowed somewhat in Europe in 2017, to 1.2% (compared with 3.4% in 2016), with a total production of 110.0 million m3. Production increases were driven by both European demand and overseas exports.
Production grew in each of the subregion’s top five producing countries in 2017. Germany contributed the largest increase, with an additional 0.9 million m3, followed by Finland, up by
2016 2017m³/
capita (2017)
Change (%) 2016-
2017
Europe 94,887 96,320 0.16 1.5
CIS 15,357 16,305 0.06 6.2
North America
96,405 99,230 0.28 2.9
TOTAL 206,649 211,855 0.17 2.5
TABLE 4.1.1
Apparent consumption of sawn softwood in the UNECE region, by subregion, 2016-2017 (thousand m³)
Source: UNECE/FAO, 2018a.
2016 2017 2018fChange
(%) 2016-2017
Production 108,665 109,952 110,821 1.2
Imports 36,003 37,837 37,576 5.1
Exports 49,781 51,470 51,940 3.4
Apparent consumption
94,887 96,320 96,458 1.5
TABLE 4.2.1
Sawn softwood balance, Europe, 2016-2018 (thousand m³)
Note: f = 2017 Committee on Forests and the Forest Industry forecast.
Source: UNECE/FAO, 2018a.

Chapter 4 Sawn softwood 41
0.3 million m3. A new sawmill operation started in Poland in 2017 and production in that country increased by 4.9%, to 4.6 million m3. Production in Sweden increased by 0.3% (to 18.3 million m3) in 2017, despite sawmill closures there; production had been restricted by raw-material supply rather than by capacity.
The only major countries with declines in production in 2017 were Romania (-6.8%) and Turkey (-3.7%), which both also reported reduced consumption. Production in Romania and Turkey dropped by a combined 0.5 million m3.
Sawmilling capacity in Europe is still capable of increasing production. Investment continues to focus on upgrading existing sawmills rather than initiating greenfield operations.
4.2.3 Prices
The declining price trend for European sawn softwood in the Middle East stabilized in 2017 (graph 4.2.1), despite weak demand in the Middle East and North Africa (the MENA region). The price for Scandinavian/Baltic sawnwood (cost, freight and insurance – CIF) declined by 3% (in euros per m3) in 2017 but was up by 1% in the first quarter of 2018, year-on-year. Finnish whitewood cost-and-freight (C&F) prices in Europe continued on an increasing trend, rising by 8% (in euros per m3) in 2017 and continuing to increase in the first quarter of 2018 (by 11%, year-on-year).
The price trend in Japan for European sawn softwood increased in the local currency (yen) in 2017, which was more than enough to compensate for the strengthening of the euro against the yen. Free-on-board (FOB truck, Japanese port) prices (euros per m3) rose by 3% in 2017.
4.2.4 Trade
4.2.4.1 Imports
European imports of sawn softwood grew by 5.1% in 2017, to 37.8 million m3. Around 80% of Europe’s imports are intra-subregional, and extra-subregional imports originate mainly in the Russian Federation, Belarus and Ukraine (UNECE/FAO, 2018b).
Imports into the European Union from Belarus (+45.4%) and Ukraine (+17.6%) increased significantly in 2017 (by 0.6 million and 0.2 million m3, respectively), to a combined total of 3.4 million m3. Imports from the Russian Federation, on the other hand, decreased by 1.5%, to 3.5 million m3 (COMTRADE, 2018; Eurostat, 2018).
The UK is still Europe’s largest importer of sawn softwood, accounting for 19% of all imports in the subregion and contributing 47% of growth in imports in 2017. Imports surged by 0.9 million m3 (+13.8%) in the UK in 2017, and imports also jumped by 14.7% (0.2 million m3) in Belgium, to 1.5 million m3, which was 10% of the subregion’s growth in import. However, most of the wood imported into Belgium is being re-exported. This is reflected by the almost unchanged apparent consumption in the country.
4.2.4.2 Exports
European sawn softwood exports grew by 3.4% (1.7 million m3) in 2017, to 51.5 million m3. Growing intraregional exports in Europe and demand in the main overseas export markets (up by 6% in 2017) drove the increase.
European overseas exports again showed strong regional variation in 2017, even though the overall trend was more positive than in 2016. Combined exports to the Middle
150
200
250
300
350
2013 2014 2015 2016 2017 2018
€/m
3
Japan Europe Middle East
GRAPH 4.2.1
European sawn softwood prices in Japan, Europe and the Middle East, 2013-2018
Notes: Data to March 2018. Japan: European whitewood lamina, KD rough FOB truck port yard. Europe: Finnish whitewood sawfalling, C&F. Middle East: Scandinavian/Baltic whitewood and red pine, sixths, CIF.
Sources: Japan Lumber Report, 2013-2018; Wood Markets, 2005-2018a.

42 UNECE/FAO Forest Products Annual Market Review, 2017-2018
East and North Africa (MENA) region decreased by 15%, to 7.2 million m3 (Woodstat, 2018), with overall demand in most MENA countries declining (graph 4.2.2). This decline was offset by strong demand in China. China became the largest overseas export market for European sawn softwood in 2017, overtaking Egypt and Japan, with exports up by 64%, to 3.4 million m3. Almost half the total volume was exported from Finland, and Sweden was the second-largest supplier.
Sawn softwood exports from Europe to Japan grew by 3.4% in 2017, to 2.8 million m3, with Nordic suppliers leading the way and increasing their market share. European exports to the US took a big leap, with the volume more than doubling (+130%) to 1.3 million m3. Exports to the US are mainly from Germany and Sweden (UNECE/FAO, 2018b).
Trade data indicate similar growth rates for exports to the US in the first quarter of 2018, but exports to China, Japan and the Middle East were down compared with the first quarter of 2017. Exports to North Africa, on the other hand, showed signs of recovery, with 10% growth in quarter 1 of 2018, year-on-year (International Trade Centre, 2018).
4.3 CIS, with a focus on the Russian Federation
4.3.1 Consumption
Apparent sawn softwood consumption increased by 6.2% in the CIS subregion in 2017, to 16.3 million m3 (table 4.3.1).
4.3.2 Production/capacity change
The CIS subregion produced 43.8 million m3 of sawn softwood in 2017, up by 10.4% over 2016. The Russian Federation’s production of 37.8 million m3 was more than 86% of the CIS total.
There were several major acquisitions in the subregion’s sawmill industry in 2017. The ULK Group completed a deal on the purchase of the asset complexes of LPK Sever (formerly Velskiy DOK) and Pomor Timber (formerly Solombalskiy LDK), with the potential to increase ULK Group’s wood-processing capacity to 6 million m3 in the next 3–4 years. The company has four wood-processing enterprises: Ustyansky LPK (with an annual processing volume of 1.5 million m3); Pestovskiy LPK (500,000 m3); Velskiy LPK (500,000 m3); and Solombalskiy LDK (a plant with an annual processing volume of 1.5 million m3 will be built in the next 2–3 years).
Forest depletion and, as a result, a sharp shortage of coniferous sawlogs in the Russian northwest has forced large sawmills to consider the use of small-diameter timber with a minimum butt diameter of 14 cm as raw material and to invest in new small-diameter wood-processing lines. ULK
Group has opened a small-diameter wood-processing plant
with an annual sawlog capacity of 900,000 m3. Usually logs of
this size serve as inexpensive raw materials for the pulp-and-
paper industry, but they are now being used as sawlogs with
the installation of appropriate technology and equipment
(WhatWood, 2018).
In July 2017, Lesozavod-25 (Arkhangelsk region) launched a
third sawnwood line with the capacity to process 550,000 m3
of sawlogs annually; the total sawlog capacity of this mill is
now 1.5 million m3.
The Russian Forest Products Group launched a new sawmill
in the Khabarovsk region in September 2017. Its initial annual
0
2
4
6
8
10
12
14
16
2015 2016 2017
Mill
ion
m3
Africa Middle East Japan China USA
GRAPH 4.2.2
Main European sawn softwood overseas exports, 2015-2017
Sources: Random Lengths, 2018; Woodstat, 2018.
TABLE 4.3.1
Sawn softwood balance, CIS subregion, 2016-2018 (thousand m3)
2016 2017 2018fChange
(%) 2016-2017
Production 39,674 43,790 45,048 10.4
Imports 4,781 4,985 4,985 4.3
Exports 29,099 32,470 33,740 11.6
Apparent consumption
15,357 16,305 16,293 6.2
Note: f = 2017 Committee on Forests and the Forest Industry forecast.
Source: UNECE/FAO, 2018a.

Chapter 4 Sawn softwood 43
capacity of 250,000 m3 could increase to 400,000 m3 in the future (RFP, 2017).
4.3.3 Prices
According to Rosstat (2018), the weighted average price of Russian sawn softwood in 2017 was 8,098 roubles per m3 (US$139 per m3) in the domestic market (up by 37%, year-on-year) and 10,510 roubles per m3 ($180 per m3) in export markets (down by 7%, year-on-year) (graph 4.3.1).
The exchange rate of the Russian rouble strengthened relative to the US dollar and the euro in 2016 and until May 2017. The rouble weakened in the second half of 2017, however, and this had a positive impact on revenue for Russian sawmills. Prices for Russian sawn softwood in China increased in 2017 and the first quarter of 2018 to match peaks in early 2015 and early 2016 (WhatWood, 2018).
4.3.4 Trade
The export volume of Russian sawn softwood set a new record in 2017 of 28.0 million m3 (+10%, year-on-year). This was the highest growth rate in 12 years (export sales had increased by 17% in 2005, year-on-year, to 14.78 million m3). Sales grew by an average of 5.6% per year in 2006-2016. Export growth was due largely to China, which was the largest consumer of Russian sawn softwood in 2017, increasing purchases by 20% (year-on-year), to 16.1 million m3 (although note that China Customs shows a lower annual volume) (graph 4.3.2). China’s share of the total volume of Russian sawn softwood
exports in 2017 was 58% (+4%, year-on-year). Sales of spruce sawnwood from the Russian northwest increased by 26% (year-on-year), to 1.4 million m3.
Exports of pine sawnwood (“redwood”) from the Russian Federation increased by 14% in 2017, to 9.6 million m3. Export sales of sawnwood from Siberian spruce grew dramatically (by 60%), to 2.78 million m3.
With market and financial conditions unstable in Egypt, Russian enterprises reoriented their trade flows to China in the first half of 2017. Supply volumes from the Russian Federation to Egypt between October 2016 and June 2017 were at their lowest levels for five years. The average volume of exports to Egypt in the first half of 2017 was 65,000 m3 per month, compared with an average of 135,000 m3 per month in the previous five years. Demand for Russian sawnwood did not subside in Egypt, but the lack of guaranteed and
GRAPH 4.3.1
Sawn softwood prices in the Russian Federation, 2013-2018
Note: Data to March 2018.
Source: Rosstat, 2018.
0
2
4
6
8
10
12
14
2013 2014 2015 2016 2017 2018
Thou
sand
roub
les/
m3
Export markets Domestic market
GRAPH 4.3.2
Russian Federation sawn softwood exports, by market, 2017 (million m3)
Source: WhatWood, 2018.
China, 16.0 Uzbekistan, 2.2
Egypt, 1.1
Azerbaijan, 0.8
Japan, 0.9
Iran, 0.7
Estonia, 0.6
Finland, 0.6
Germany, 0.5
Kazakhstan, 0.5 Others, 3.8

44 UNECE/FAO Forest Products Annual Market Review, 2017-2018
timely payments, the financial instability of buyers, and the devaluation of the Egyptian pound forced Russian exporters to direct exports to China. A number of large suppliers in Siberia abandoned the Egyptian market as market prices became speculative.
Russian export sales to Egypt showed some growth in the second half of 2017, when Egypt’s economy began to stabilize. The average monthly volume of exports to Egypt almost doubled from the lows of the first half of the year, to 120,000 m3.
Sales to Japan were stable in 2017, at about 900,000 m3. Demand for the main Russian product in the Japanese market – planed pine sawnwood – rose by 1% (year-on-year), to 464,000 m3. Sales of rough spruce sawnwood from the Russian northwest decreased by 17% (year-on-year) in 2017, to 87,500 m3 (WhatWood, 2018).
Demand for Russian sawn softwood in Europe was stable in 2017, at 3.47 million m3. Exports increased by 1.1% to Estonia, to 597,000 m3, but there were substantial decreases to Latvia (-14.5%, to 246,000 m3) and Lithuania (-21.3%, to 112,600 m3). Exports to Finland increased substantially (by 16.3%) in 2017, to 557,600 m3 (graph 4.3.3).
The largest increase in sawn softwood exports from the Russian Federation to China in 2017 was for rough-sawn Siberian spruce, up by 57% to 2.76 million m3. Sales of rough-sawn pine to China increased by 13%, to 9.58 million m3 (graph 4.3.4). Planed timber of all four main softwood species comprised only a small portion (1%, by volume) of total Russian sawn softwood exports to China in 2017.
4.4 North America
4.4.1 Consumption
Demand in North American sawn softwood markets increased steadily in 2017 and the first half of 2018. US housing starts continued to improve but at a slower rate than in previous years, reaching 1.2 million units in 2017 (up by 3.0% compared with 2016; US Census Bureau, 2018). Single-family housing grew quickly (by 8.6%) in 2017, but multifamily starts declined by 9.7%. The high growth in single-family housing is good news for the wood industry because single-family houses consume three times more sawnwood (and structural panels) than do multifamily houses. Indications are
GRAPH 4.3.3
Russian Federation sawn softwood exports to Europe, 2016 and 2017
Source: WhatWood, 2018.
0
100
200
300
400
500
600
Thou
sand
m3
2016 2017
GRAPH 4.3.4
Russian Federation sawn softwood exports to China, by species, 2017
Source: WhatWood, 2018.
0
2
4
6
8
10
Mill
ion
m3
2016 2017
TABLE 4.4.1
Sawn softwood balance, North America, 2016-2018 (thousand m³)
2016 2017 2018fChange
(%) 2016-2017
Production 103,788 105,759 105,351 1.9
Imports 28,031 27,436 27,600 -2.1
Exports 35,413 33,965 33,421 -4.1
Apparent consumption
96,405 99,230 99,530 2.9
Note: f = 2017 Committee on Forests and the Forest Industry forecast.
Source: UNECE/FAO, 2018a.

Chapter 4 Sawn softwood 45
that there will be about 1.30 million housing starts in 2018 and possibly more.
US residential improvement expenditures (an even larger driver of lumber demand than housing) continued to surge in 2017 as a result of rising home equities and the aged US housing stock.
Industry-based promotional efforts such as the Softwood Lumber Board initiative continue to increase wood use (including cross-laminated timber) in taller/larger apartment and non-residential buildings and are attracting interest in North America and worldwide. Such initiatives should lead to further increases in North American sawnwood consumption.
The US economic outlook is relatively healthy, with GDP growth projected to increase in the range of 2.7-2.9% per year through 2020 (Forest Economic Advisors LLC, 2018). Apparent North American sawn softwood consumption was 99.2 million m3 in 2017, up by 2.9% from 2016 (table 4.4.1). Of the total consumption, 81.4 million m3 was in the US (up by 1.5%, year-on-year) and 17.8 million m3 was in Canada (up by 10.1%).
4.4.2 Production/capacity change
US sawn softwood output was 57.6 million m3 in 2017, up by 3.5% over 2016. Production gains were highest in the US South (+5.1%), followed by the Midwest and Northeast regions (+4.2%) and the US West (+3.0%). The ongoing depressed prices for standing timber in the US South are a result of excess and unused growing stock. The US South accounts for more than 50% of US production and, with record lumber prices, sawmills are achieving the highest earnings in the world (Forest Economic Advisors LLC, 2018). The US West continues to face a tight log supply, with strong export demand and log prices keeping coastal log prices high; as a result, sawnwood production is growing only slowly.
Canadian sawn softwood production was unchanged in 2017, at 48.2 million m3. Production in the British Columbia
Interior – Canada’s leading region for sawn softwood production (accounting for 41.2% of national production in 2017) – declined by 4.5% in 2017 (Statistics Canada, 2018), but output in the rest of Canada increased by 4.1%, with the largest gains in Ontario (+12.8%).
Preliminary import duties on Canadian lumber exported to the US started in late January 2017 (retroactively from late April 2017). Permanent duties averaging 20.23% (the “all others” rate) commenced in late December 2017 (US Department of Commerce, International Trade Administration, Enforcement and Compliance, 2018).
4.4.3 Prices
The price of lumber (as measured by the Random Lengths framing lumber composite price index – FLCPI) increased by 57% between the start of 2017 and early June 2018, from US$356 to US$571 per thousand board feet ($222 to $356 per m3). This price spike was tied to steadily increasing demand and the co-occurrence of several supply shocks in British Columbia, which is one of the world’s largest producers of softwood lumber. The run started in early 2017 when the market began pricing in expectations that the US Department of Commerce, International Trade Administration, Enforcement and Compliance (2018) would implement countervailing and antidumping duties on Canadian softwood lumber. More importantly, however, the 2017 wildfire season was so severe that the Canadian government’s senior climatologist called it the “summer of fire”. Between April and November, more than 1,300 fires consumed more than 1.2 million hectares of British Columbian forests, destroying more than 50 million m3 of timber. The fires and dry conditions forced many sawmill owners to halt operations and restricted much of the province’s logging activity.
The slowdown came at an inopportune time because of another, slower-moving supply shock: throughout the late 1990s and early 2000s, the largest infestation of mountain pine beetles on record occurred in British Columbia’s forests, and its consequences for the timber supply are now being felt. The epidemic hit hardest in the heart of British Columbia’s interior logging country, affecting more than 18 million hectares and killing about 54% of the Interior’s merchantable pine and about 20% (10 million m3) of the annual allowable harvest.
Other supply shocks, such as the cold winter weather and rail car and truck shortages, also restricted the delivery of logs to sawmills and sawnwood to customers in the first half of 2018. In combination, the result has been all-time record-high sawnwood prices in the US. The previous annual record for the Random Lengths FLCPI was US$423 per thousand board feet ($264 per m3) in 1997; in 2017, the average was US$413 per thousand board feet ($257 per m3) but it peaked

46 UNECE/FAO Forest Products Annual Market Review, 2017-2018
at US$582 per thousand board feet ($363 per m3) in early June 2018.
As a result of strong US sawnwood prices and tight supplies, prices in most major global markets also increased in US dollar terms in 2017 and into the first half of 2018, continuing a positive cycle that started in late 2015. Japanese prices for imported North American lumber soared to record levels in the second quarter of 2018. European prices were relatively subdued in 2016 but climbed in 2017 and the first half of 2018 (graph 4.4.1).
The demand forecast for sawnwood in the US for the rest of 2018 and into 2019 is positive. With tightening sawnwood supply factors and permanent import duties on Canadian lumber exports now in place, US lumber prices are expected to stay high.
4.4.4 Trade
Preliminary countervailing duties on Canadian lumber came into effect in late April 2017 (retroactive to late January 2017), and antidumping duties applied from late June 2017 (retroactive to late March 2017); final duties commenced in late December 2017. These duties have helped change global sawnwood trade flows and prices because exports from Canada to the US and offshore markets have declined due to strong domestic demand and reduced production. With the subdued Canadian supply expected to continue indefinitely,
US producers are unlikely to make up the entire shortfall, thereby creating opportunities for European exporters to replace Canadian volumes.
Despite very strong demand in China in 2017 (up by 19% in 2017, to over 25 million m3), North American exports to that country were lower for the fourth consecutive year, with financial returns in the US market higher than those in China.
Japan’s sawn softwood imports from all countries increased by 1.7% in 2017, to 6.3 million m3. North American exports to Japan declined by 1.7%, however (to 2.2 million m3).
4.4.4.1 Imports
The US imported 26.7 million m3 of sawn softwood in 2017, down by 2.5% from 2016. Canada continued to dominate US imports, with a 93% share in 2017. Canadian shipments to the US declined by 1.4 million m3 (-5.8%) in 2017, however, to 22.7 million m3, despite strong US sawnwood prices. US imports from Europe soared to 1.3 million m3, up from 550,000 m3 in 2016. European exports to the US could reach 2 million m3 by 2020, especially if import duties remain in place on Canadian sawnwood.
4.4.4.2 Exports
US sawn softwood exports increased by 4.0% in 2017, to 2.9 million m3, with the largest volumes directed to Canada (502,000 m3) and Mexico (490,000 m3).
Canadian sawn softwood exports to all overseas markets declined by 5.0% in 2017, to 6.7 million m3. Only shipments to the Republic of Korea and Taiwan Province of China increased – all other major markets recorded declines.
Total Canadian exports were 15% lower in the first three months of 2018, year-on-year. There were significant declines to the US (-16%) and China (-25%) but an increase of 7% to Japan.
The continuation of positive economic drivers and the potential for a tightening of the sawnwood supply–demand balance suggest an optimistic outlook for sawn softwood markets to the end of 2018 and most likely into 2019. In North America, a sawn softwood supply shortage looms in the face of steady increases in demand. Soaring imports from Europe and other countries at very high prices is a new dynamic creating volatility in the US market.
4.5 Extraregional influences affecting the UNECE region
Outside the UNECE region, China’s sawn softwood imports grew strongly (by 18.7%) in 2017, to 25.1 million m3. China’s sawn softwood imports are destined mainly for housing and construction.
China’s construction industry continued to develop strongly in 2017, although the pace of growth slowed in response
100
150
200
250
300
350
400
450
$/m
3
Japan USA Europe China
GRAPH 4.4.1
Quarterly prices for sawn softwood in China, Europe, Japan and the US, 2010-2018
Notes: Data to June 2018, delivered-to-market prices. Japan: BC W-SPF 2x4, J-grade, C&F; Europe: Swedish spruce 47x100, C&F; US: W-SPF grade #2&Btr, 2x4, delivered to Chicago; China: SPF/Hem-Fir, green, grade #3&Btr 1-7/8x4-12, C&F.
Sources: Wood Markets, 2005-2018a; Wood Markets, 2005-2018b.

Chapter 4 Sawn softwood 47
to intensive government efforts to curb speculation in the housing market, particularly in Tier 1 cities.8 Total investment in domestic real estate increased by 7% in 2017, with investment in residential building up by 9.4%. The industry had been boosted in 2016 by fiscal stimulus in the form of infrastructure investments to sustain economic growth and by the gradual relaxation, by local governments, of real-estate regulations, purchase criteria and credit availability, resulting in a boost in the domestic real-estate market (Shan, 2017). Rising personal incomes, expanding foreign investment, rapid urbanization and population and household growth have been driving demand in China. The steady increase in housing development, however, raised concerns that the property market was overheated, and many top-tier Chinese cities and government agencies introduced measures to curb the pace of growth. Growth in house prices declined in 2017, giving rise to concerns that high household debt could pose a significant risk if house prices decline. In response, local governments have been introducing measures in 2018 to stimulate housing development. Total investment in real-estate development increased by 10.3% in the first four months of 2018, year-on-year, with investment in residential buildings up by 14.2%, accounting for 69.7% of all real-estate development investment (National Bureau of Statistics of China, 2018). With China’s continuing urbanization, residential building activity should continue to grow strongly in the medium to long term.
China’s imports of sawn softwoods in 2017 were predominantly from UNECE sources, particularly the Russian Federation (57%, by volume) and Canada (20%), with the Russian Federation’s exports increasing by 23% in 2017 to record levels. Argentina, Brazil, Chile and New Zealand were the only significant competitors outside the UNECE region.
Japan’s sawn softwood imports in 2017 were similar to 2016, with housing starts relatively steady – although starts of wood-based units rose strongly (by 8.1%). The increase in housing demand was driven partly by the anticipated effects of a further rise in the consumption tax in 2019, which is expected to increase the purchase cost of housing for consumers. In the longer term, housing construction levels are expected to decline in line with a drop in the number of households, with housing activity restricted to the rebuilding of ageing infrastructure. Non-residential construction is also expected to remain static, with population decline and ageing also constraining the availability of labour in the construction sector.
8 Beijing, Shanghai, Guangzhou, Shenzhen, Chengdu, Hangzhou, Wuhan, Tianjin, Nanjing, Chongqing, Xi’an, Changsha, Qingdao, Shenyang, Dalian, Xiamen, Suzhou, Ningbo and Wuxi are Tier 1 cities and China’s wealthiest and populous cities (not including special administrative regions).
Japan’s sawn softwood imports in 2017 were overwhelmingly from North American and EU sources. The Japan Federation of Housing Organizations recently forecast a slight increase in housing starts in 2018, to 961,000 units; however, housing starts declined by 6% in the first four months of 2018, year-on-year. Sawn softwood imports were reportedly down in the first quarter of 2018 due to supply shortages in the US and transportation issues in Canada.
MENA countries – particularly Algeria, Egypt, Saudi Arabia and the United Arab Emirates – provided significant markets for sawn softwood in 2017, although import volumes continued to decline in major importing countries in the region. Egypt – the region’s largest importer – reported a contraction in import volumes of 9.6% in 2017, primarily due to the country’s continued political instability.
The only significant exporters of sawn softwoods outside the UNECE region in 2017 were Chile, Brazil, New Zealand and Australia (in descending order, by volume) (table 4.5.1).
Chile’s export markets are diversified, with significant volumes shipped to Asian, Latin American and Middle Eastern markets. Brazil’s exports of sawn softwoods continued to increase strongly in 2017 in response to sustained sawn softwood demand in the US, the country’s major export market. New
TABLE 4.5.1
Major importers and exporters of sawn softwoods outside the UNECE region, 2015-2017 (thousand m³)
Sources: COMTRADE, 2018; ITTO Statistics Database, 2018; China Customs 2018.
2015 2016 2017 Change (%) 2016-2017
MAJOR IMPORTERS
China 17,466 21,100 25,056 18.7
Japan 5,770 6,099 6,124 0.4
Egypt 5,127 4,390 3,967 -9.6
Republic of Korea
1,625 1,942 1,823 -6.1
Mexico 2,227 3,163 n.a. n.a.
MAJOR EXPORTERS
Chile 3139 3309 3,659 10.6
Brazil 1,266 1,813 2,281 25.8
New Zealand
1,774 1,731 2,142 23.7
Australia 297 270 244 -9.6

48 UNECE/FAO Forest Products Annual Market Review, 2017-2018
Zealand’s major markets in 2017 were predominantly in the Asia-Pacific region – China, the US, Australia, Viet Nam, Thailand and the Republic of Korea (in descending order by volume).
4.6 Policy and regulatory influences on the sector
The nine-year US–Canada Softwood Lumber Agreement expired in mid-October 2015. Based on US trade law procedures, the US Department of Commerce initiated preliminary countervailing and antidumping duties in early 2017. Final duties (five companies received specific duties and the “all others” rate was 20.23%) commenced in late December 2017.
Efforts continue in North America to promote wood as a building material of choice. The Softwood Lumber Board was established in 2011 as a mandatory promotion fund, or “check-off”, authorized under the US Farm Bill.
The Softwood Lumber Board’s role is to strengthen and diversify the demand for softwood lumber. In the last five years the Board has helped increased demand by 2.59 billion board
feet (4.3 million m3). The Board’s impact has grown each year, creating 906 million board feet (1.5 million m3) of increased demand in 2016 alone. The Softwood Lumber Board supports the market by promoting strong and safe building codes for wood, inspiring and educating architects and engineers on the benefits of wood construction, promoting the benefits of softwood lumber products in and around homes, and pursuing new markets for softwood lumber, including mass timber, mid-rise and tall wood construction.
In the European subregion, the most significant policy issue with potential to affect sawn softwood is the looming Brexit, which could significantly affect UK imports of EU sawn softwood. The UK is second only to Germany for imports of forest products (by value). The impacts of Brexit on sawn softwood producers in the EU will depend on the terms of the exit and on changes to the exchange rate of the pound sterling with respect to the euro.
Note: The statistical annex of the Forest Products Annual Market Review 2017-2018 is available at:
www.unece.org/forests/fpamr2018-annex

Chapter 4 Sawn softwood 49
4.7 References
China Customs, 2018. General Administration of Customs People’s Republic of China. Available at: http://english.customs.gov.cn/
COMTRADE. 2018. United Nations Commodity Trade Statistics Database. United Nations Statistics Division. Available at: http://comtrade.un.org/db
Eurostat. 2018. Database. European Commission. Available at: http://ec.europa.eu/eurostat/data/database
Finnish Forest Industries Federation. 2018. Sawmill industry statistics. Available at: https://www.forestindustries.fi/statistics/sawmill-industry/
Forest Economic Advisors LLC (FEA). 2018. Monthly Lumber Advisor. Available at: www.getfea.com
International Trade Centre. 2018. Trade Map (database). Available at: www.trademap.org
ITTO. 2018. Statistics Database. International Tropical Timber Organization (ITTO). Available at: www.itto.int/annual_review_output
Japan Lumber Report. 2013-2018. Various issues. Available at: www.n-mokuzai.com
National Bureau of Statistics of China. 2018. National real estate development and sales in the first four months of 2018. Available at: www.stats.gov.cn/english/PressRelease/201805/t20180516_1599744.html
Random Lengths. 2018. Various issues. Available at: www.randomlengths.com
Rosstat. 2018. Federal Service of State Statistics. Moscow. Available at: www.gks.ru
Russia Forest Products (RFP). 2017. Website. Available at: http://en.rfpgroup.ru/content/sawnwood
Shan, T. 2017. China’s construction industry and its drive towards internationalisation. Available at: http://pwc.blogs.com/growth_markets/2017/02/chinas-construction-industry-and-its-drive-towards-internationalisation.html)
Statistics Canada. 2018. Database. Available at: www.statcan.gc.ca/eng/start
UNECE/FAO. 2018a. TIMBER Database 2017-2018 (database). Available at: www.unece.org/forests/fpm/onlinedata
UNECE/FAO 2018b. FPAMR trade flow annex, 2016-2017. Available at www.unece.org/forests/forestsfpmonlinedata/forest-products-trade-flow
US Census Bureau. 2018. US housing starts. Available at: www.census.gov
US Department of Commerce, International Trade Administration, Enforcement and Compliance. 2018. Available at: www.trade.gov/enforcement
WhatWood. 2018. Monthly Russian Lumber Report, various issues. Available at: http://whatwood.ru/english/tovary/whatwood-monthly-russian-lumber-report
Wood Markets. 2005-2018a. Wood Markets Monthly, various issues. Available at: www.woodmarkets.com/publication/ wood-markets-monthly
Wood Markets. 2005-2018b. China Bulletin, various issues. Available at: www.woodmarkets.com
Woodstat. 2018. Database. Available at: www.woodstat.com/en

Chapter 5
SAWN HARDWOOD
Lead author: William Luppold
Contributing authors: Mathew Bumgardner, Klaus Kottwitz, Fran Maplesden, Igor Novoselov

51Chapter 5 Sawn hardwood
Highlights
Oak is still the most fashionable hardwood species coming from the UNECE region. Birch, on the other hand, is the CIS’s number-one most-exported sawn hardwood species.
Sawn hardwood exports in the UNECE region reached an all-time high in 2017, at 13.7 million m3.
The consumption of sawn hardwood in the UNECE region dropped by 3.2% in 2017 to 34.4 million m3, with both Europe and North America reducing consumption by a combined 1.3 million m3. Only the CIS region showed an increase (+11.1%).
Sawn hardwood production in the UNECE region was relatively flat in 2017, at 41.7 million m3, with slight or no increases in Europe and North America and a rise in the CIS.
European and North American producers are increasingly concerned by a shortage of raw materials caused by increased Chinese demand for hardwood logs (particularly oak).
Apparent sawn hardwood consumption fell by 3.8% in Europe in 2017, to 12.6 million m³. Production was relatively flat and the export volume was its highest since 2007.
The Russian Federation exported 1.27 million m3 of sawn hardwood to China in 2017, an increase of 10.2% over 2016 and the largest quantity of Russian sawn hardwood ever shipped to China.
About 55% of China’s sawn hardwood imports are from tropical countries, and volumes have grown rapidly in recent years.
Outside the UNECE region, trade in tropical sawn hardwood continues to focus on the Asia-Pacific region, with China dominating global imports and Thailand and Malaysia the major exporters.
Hardwood is slowly making inroads into timber construction through high profile architectural and engineering projects. Many hardwoods have superior strength-to-volume ratios compared with those of softwoods.

UNECE/FAO Forest Products Annual Market Review, 2017-201852
5.1 Introduction
The decrease in sawn hardwood consumption continues in the UNECE region in 2017, dropping by 3.2% to 34.4 million m3, the lowest value in the last four years. Sawn hardwood production in the UNECE region was relatively flat, at 41.7 million m3, with slight or no increases in Europe and North America and a rise in the CIS.
Global demand for hardwood remained strong in 2017, enabling sawn hardwood producers to ship record volumes to markets outside the UNECE region, mainly China. Sawn hardwood exports in the UNECE region reached an all-time high in 2017, increasing by 9.6% to 13.7 million m3.
Strong demand for sawn hardwood enabled producers to maintain production. Global demand for hardwood logs was even stronger, with prices up significantly in 2017. European and North American producers are increasingly concerned about a shortage of raw materials caused by increasing Chinese demand for hardwood logs (particularly oak).
Outside the UNECE region, the Asia-Pacific region continued to dominate trade in tropical sawn hardwood in 2017, with China the major global importer and Thailand and Malaysia the biggest exporters.
5.2 Europe
5.2.1 Consumption
The apparent consumption of sawn hardwood fell by 3.8% in 2017, to 12.6 million m³ (table 5.2.1). Apparent consumption in Turkey, the subregion’s largest national market for sawn hardwood, fell by 6.2%.
Hardwood is slowly conquering timber construction through high profile architecture and engineering projects. The American Hardwood Export Council is active and successful
in Europe, promoting wood materials and heat-treated wood products made from red oak and tulip wood.
Many European countries are using research to increase markets for hardwood in construction. There are now glulam beams and cross-laminated timber (CLT) made with beech, including in combination with softwoods as hybrid carriers. Such products will likely only serve niches for the foreseeable future, however.
Furniture consumption – another important source of demand for sawn hardwoods – grew by 2% in the main markets of France, Germany, Poland, Spain and the UK in 2017. Europe continued to lose market share to Asia in both production and consumption. The value of furniture production nearly doubled in Asia and the Pacific between 2008 and 2017, from $122 billion to $239 billion, but changes in production value were comparatively minor in other regions. More than half the world’s furniture production took place in Asia and the Pacific in 2017 (CSIL, 2018). Chapter 9 on value-added wood products provides more in-depth analysis of the furniture market.
In general, parquet consumption continues to grow in the EU, benefiting from an encouraging economic environment and positive trends in the construction sector; nevertheless, Germany – the biggest European market for parquet – reported a significant decline in parquet demand. Consumption in the European Federation of the Parquet Industry (FEP) area was up marginally (by 0.3%) in 2017, at about 79.2 million m2. Germany’s market share was 21.2%, followed by France (10.7%) and Sweden (10.0%) (FEP, 2018).
5.2.2 Production and capacity change
European sawn hardwood production declined by 0.2% in 2017, to 14.0 million m³; on the other hand, production increased by 1.6% in the EU28, to 10.6 million m³. This divergence is explained by a major drop (-6.3%) in production of 169,000 m3 in Turkey, which is not an EU28 country.
TABLE 5.2.1
Sawn hardwood balance, Europe, 2016-2018 (thousand m³)
Note: f = 2017 Committee on Forests and the Forest Industry forecast.
Source: UNECE/FAO, 2018.
2016 2017 2018f Change (%) 2016-2017
Production 13,986 13,952 13,979 -0.2
Imports 4,918 4,924 5,036 0.1
Exports 5,835 6,308 6,339 8.1
Apparent consumption
13,068 12,569 12,676 -3.8

53Chapter 5 Sawn hardwood
Sawn hardwood production in Croatia grew by 89% in the
five years to 2017, to 1.4 million m³, accounting now for 10%
of European production. Croatia’s non-coniferous roundwood
exports declined significantly between 2007 and 2017 (graph
5.2.1).
A continuing shortage of hardwood supply is exacerbated
by heavy dependence on European oak. Thirty percent of
hardwood sawmills in Belgium, France and Germany have
closed in the last ten years (EOS, 2018), with increasing overseas log exports partly to blame (Indufor, 2017).
Graph 5.2.2 provides an overview of the main export destinations of hardwood logs outside the EU, indicating the strong and increasing role of Viet Nam and especially China.
5.2.3 Prices
The strong fashion preference for oak continued to increase European oak prices in 2017 and the first half of 2018. This increasing trend is expected to continue. Log prices are escalating because of increased overseas demand, coupled with export bans in Croatia and Ukraine, which blame infestations of the oak lace bug (Corythucha arcuata). This bug, which is native to North America, was first observed in Europe in 2000 (Bernardinelli, 2000). The roundwood export bans have strengthened the domestic timber industries in Croatia and Ukraine, and other European countries are considering similar measures, which could further reduce the international supply of oak logs (ITTO, 2018a).
5.2.4 Trade
5.2.4.1 Imports
Europe’s total imports of sawn hardwood increased by 0.1% in 2017, to 4.92 million m³, and their dollar value increased by 1.6%, to $3 billion.
5.2.4.2 Exports
Europe’s sawn hardwood exports increased by 8.1% in 2017, to 6.3 million m³, and higher prices meant an even greater increase (8.8%) in the dollar value, to $2.85 billion. Exports of sawn hardwood from Europe reached their highest point (in volume terms) since the peak in 2007, growing significantly in France (+25.5%), Croatia (+11.2%) and Poland (+55.4%) in 2017. The export volume from these three countries increased by 293,000 m3, which was more than 60% of the subregion’s overall increase in exports in 2017.
Belgium (-10.9%) and Slovakia (-21.1%) were the only countries recording significant decreases in sawn hardwood exports in 2017, with a combined reduction of 80,000 m3.
5.3 The CIS subregion
The apparent consumption of sawn hardwood in the CIS increased by 11.1% in 2017, to 1.5 million m3 (table 5.3.1). The Russian Federation, which accounts for about two-thirds of apparent consumption in the subregion, reported an increase of 8.1%, to 1.09 million m3. Sawn hardwood production increased by 8.5% in the CIS in 2017, to 3.7 million m3. The Russian Federation produced 2.76 million m3 of this volume (up by 10.3% over 2016); according to Rosstat data,
0.0
0.2
0.4
0.6
0.8
1.0
1.2
1.4
1.6
2007 2009 2011 2013 2015 2017
Mill
ion
m3
Production of non-coniferous sawnwood
Export of non-coniferous roundwood
GRAPH 5.2.1
Ten year trend of Croatian non-coniferous sawnwood production, 2007-2017
Source: UNECE/FAO, 2018
0.0
0.5
1.0
1.5
Mill
ion
m3
2014 2015 2016 2017
GRAPH 5.2.2
EU hardwood log exports by destination, 2014-2017
Note: Converted from mt using conversion factor 1mt = 0.91m3.
Source: Eurostat, 2018.

UNECE/FAO Forest Products Annual Market Review, 2017-201854
however, Russian sawn hardwood production amounted
to 1.8 million m3 in 2017 (normally Rosstat does not collect
data from small-sized companies). Most of this volume was
produced in the country’s western regions (71%), with the
east (the Siberian and Far Eastern federal districts) accounting
for 29%.
Weighted average prices for sawn hardwood in the Russian
Federation in 2017 were 3,862 roubles ($66.2) per m3 in the
domestic market and 6,368 roubles ($109.2) per m3 for export
sales (graph 5.3.1).
Rovial (in the Tuymen region) launched a wood-processing
complex in 2017 with the capacity to process 60,000 m3 per
year of hardwood and softwood logs. Technomodel (also in
the Tuymen region) announced a project with a capacity of 297,000 m3 hardwood logs per year.
5.3.1.1 Exports
The Russian Federation exported 1.7 million m3 of sawn hardwood in 2017, up by 11.7% over 2016. Exports to China were 1.27 million m3, an increase of 10.2% over 2016 and the largest quantity of Russian sawn hardwood ever shipped to China (WhatWood, 2018). Birch, lime and oak accounted for 80% of all sawn hardwood exports from the Russian Federation in 2017 (graph 5.3.2).
5.4 North America
5.4.1 General overview
Apparent sawn hardwood consumption in North America decreased by 772,000 m3 (-3.6%) in 2017 (table 5.4.1); sawn hardwood imports fell by 188,000 m3 (-12.1%). In 2017 Canadian sawn hardwood consumption declined by 230,000 m3 (-14.1%) and in the US by 542,000 m3 (-2.8%). North American sawn hardwood exports climbed by 593,000 m3 (+13.2%) in 2017, with large increases in both Canada and the US. Sawn hardwood production continued to increase slowly in 2017; nevertheless, it was still well below levels achieved before the global financial crisis in 2008.
Total housing starts in the US increased moderately (by 2.5%) in 2017. Single-family starts jumped by 8.6%, but this was partially offset by a 9.7% decrease in starts for multifamily units (US Census Bureau, 2018). Both single-family and
TABLE 5.3.1
Sawn hardwood balance, CIS, 2016-2018 (thousand m³)
Note: f = 2017 Committee on Forests and the Forest Industry forecast.
Source: UNECE/FAO, 2018.
2016 2017 2018fChange (%) 2016-2017
Production 3,381 3,668 3,772 8.5
Imports 111 109 109 -2.2
Exports 2,176 2,314 2,314 6.4
Apparent consumption
1,317 1,463 1,567 11.1
0
2
4
6
8
10
Thou
sand
rub
les/
m3
Domestic market Exports
GRAPH 5.3.1
Monthly prices for sawn hardwood in Russian Federation, 2017-2018
Source: Rosstat, 2018.
Birch 45%
Lime 21%
Oak 14%
Ash 6%
Poplar and aspen 6%
Beech 1% Cherry 1% Other 6%
GRAPH 5.3.2
Sawn hardwood exports by species from Russian Federation in 2017.
Source: WhatWood, 2018.

55Chapter 5 Sawn hardwood
multifamily housing starts increased in early 2018, along with gross domestic product. Economic growth in the US is now relatively robust, however, North American sawn hardwood production and consumption are expected in remain flat in 2018 (table 5.4.1).
5.4.2 Consumption
The primary North American markets for sawn hardwood are appearance applications (e.g. cabinets, furniture, millwork and flooring), industrial applications (e.g. pallets and sleepers), and other sawn products (e.g. staves, structural building products and musical instruments). Combined consumption in these three market segments has grown since the global financial crisis but remains below the levels achieved in the early 2000s. Moreover, the relative levels of consumption in these individual market sectors have changed.
Historically, North American sawn hardwood consumption in appearance applications exceeded consumption in industrial uses by a wide margin. Since 2007, however, sawn hardwood consumption has been higher for industrial uses than for appearance applications (graph 5.4.1).
This change is the result of several factors. The North American furniture industry declined in the early years of the twenty-first century, causing a downward trend in sawn hardwood consumption in appearance applications. This was partially offset by increased consumption in the cabinet, millwork and flooring industries, with home construction continuing to increase in the US in the early 2000s. The US housing market collapsed in 2006, however, followed by the global financial crisis. These two economic events caused a decline in US domestic sawn hardwood consumption in the appearance market of nearly 50% between 2006 and 2009.
Sawn hardwood consumption by the largest industrial user, pallets, single-handedly exceeded consumption in appearance applications between 2009 and 2012. Industrial consumption increased from 2009 to 2015 but has declined since due to the greater use of sawn softwood for pallets and to inventory adjustment in the sleeper industry.
North American consumption of sawn hardwood in appearance applications will be influenced in the next decade by factors such as growth in home construction and remodelling, substitute products, and disposable income. Home construction and remodelling is important, but a wide range of materials can be used in the production of flooring, millwork and cabinets, with sawn hardwood generally the most expensive. Less-expensive engineered flooring products are similar in appearance to solid wood floors but contain no sawn hardwood. Painted and laminate cabinets can serve the same utilitarian function as more expensive cabinets with sawn hardwood fronts. Thus, while construction products made using sawn hardwood may be preferable, the extent
0
5
10
15
Mill
ion
m3
Appearance Industrial Other
GRAPH 5.4.1
US sawn hardwood consumption by segment, 2001-2017
Source: Luppold and Bumgardner, 2018.
TABLE 5.4.1
Sawn hardwood balance, North America, 2016-2018 (thousand m³)
Note: f = 2017 Committee on Forests and the Forest Industry forecast.
Source: UNECE/FAO, 2018.
2016 2017 2018fChange (%) 2016-2017
Production 24,101 24,110 24,179 0.0
Imports 1,557 1,369 1,399 -12.1
Exports 4,493 5,086 5,204 13.2
Apparent consumption
21,165 20,393 20,374 -3.6

UNECE/FAO Forest Products Annual Market Review, 2017-201856
of income growth among North American consumers will be the primary factor determining the volume of appearance-based sawn hardwood consumed in construction and remodelling.
The decline of the North American furniture industry was due primarily to the lower cost of manufacturing in China and Viet Nam. An emerging business model in the North American furniture market is semi-custom manufacturing, which offers consumers choices in species, finishes and hardware style. This is in contrast to the standardized price-point mechanizing model used in furniture retailing for the last century, in which production cost determined which firms remained in business. The degree to which furniture consumers will trade off added expense for more individualized choices will be influenced by income growth.
5.4.3 Prices
Changes in North American sawn hardwood markets since 2000 are reflected in the relative price movements of three major product groups: high-quality lumber (grade FAS); mid-quality lumber (grade No. 1 common); and the most important sawn industrial product, pallet cants (graph 5.4.2). Real prices for high- and mid-quality sawn hardwood have always been cyclical due to inventory adjustments within the production and distribution system combined with variations in economic growth. What appeared to be a general cyclical downturn in these prices after 2004 became
a multiyear decline not previously seen in the post-Second World War North American sawn hardwood market. Prices for high- and mid-quality sawn hardwood increased in 2010 in conjunction with economic stimulus in the US, but this was short-lived. Prices fell in 2011 and 2012 due to weak domestic markets for sawn hardwood and the liquidation of inventories as sawmills and secondary-processing facilities continued to close.
Prices for high- and mid-quality sawn hardwood shrank by nearly 50% between 2000 and 2012, but prices for pallet cants declined by less than 15% (graph 5.4.2), reflecting changes in relative consumption of these three product groups. The prices of all sawn products increased after 2012 and commenced cyclical patterns that vary in ways that are unique to their respective markets. The real price of pallet cants in mid-2018 exceeded the price in 2000, but prices for high- and mid-quality lumber were still significantly below their levels in 2000.
5.4.4 Trade
5.4.4.1 Imports
Historically, bilateral trade between Canada and the US has strongly influenced North American sawn hardwood imports. In 2003, more than 50% of US imports (on a value basis) were from Canada, and 95% of Canadian imports were from the US. The US primarily imported aspen, maple and other northern hardwood species from Canada and exported a wide variety of temperate species in both air-dried and kiln-dried forms. Much of the lumber imported by the US was consumed within the US, but a large (but unquantified) proportion of the lumber imported by Canada was subject to additional value-added processes and then re-exported.
More than 90% of Canadian sawn hardwood imports (on a value basis) were from the US in 2017, but the Canadian share of the US import market was down to 27% (from 50% in 2003), reflecting decreased demand for sawn hardwood. Historically, the most important tropical sawn hardwood
40
50
60
70
80
90
100
110
120
)001 = 0002( xe
dni ecir
p detalfe
D
FAS No. 1 Common Pallet cants
GRAPH 5.4.2
Inflation-adjusted price indices for sawn hardwood product grades, 2000-2018
Note: Deflated by the US producer price index (US Bureau of Labor Statistics, 2018).
Source: Hardwood Market Report (various years), US Bureau of Labor Statistics 2018

57Chapter 5 Sawn hardwood
products imported by the US have been mahogany and other species used in appearance applications. In 2017, however, the major tropical sawn hardwood products were balsa, which has a variety of specialty uses such as in crafts and modelling, and ipé, used primarily for exterior decking.
5.4.4.2 Exports
Exports are the only component of the North American sawn hardwood market that has exceeded levels achieved before the global financial crisis. Similarly to imports, most Canadian and US exports before the global financial crisis were bilateral. Growth in exports since 2009, however, has been mainly in markets outside North America. Graph 5.4.3 shows the value of North American sawn hardwood exports, excluding bilateral trade.
Although the US is still the major market for Canadian sawn hardwood exports, China received more than 20% of Canada’s export volume in 2017, up from less than 1% in 2000. US exports to China and Viet Nam in 2017 accounted for 64% of total exports, in a value terms, and Canada received 10%. The growth in exports and decline in domestic consumption in appearance applications in the US means that exports accounted for at least 40-50% of higher-quality lumber sales by US sawmills and distribution yards in 2017.
5.4.5 Production and capacity charges
North American sawn hardwood production declined by nearly 50% between 2000 and 2009 as domestic consumption declined and (associated with this) prices for mid- and high-
quality sawn hardwood fell. The US typically produces more than 90% of North American sawn hardwood, and the decline shown in graph 5.4.4 is therefore associated primarily with production in that country. The volume of sawn hardwood produced in the US in 2009 was the lowest since the early 1960s. North American production has increased steadily since 2009 but was still 3.6 million m3 less in 2017 than in 2006, the peak for home construction in the US.
The decline in sawn hardwood production in North America has caused a large reduction in the number of sawmills and in production capacity – although the number of mills producing hardwood sawnwood that have gone out of business since 2007 is unknown. Most of the mills built since the global financial crisis are for the manufacture of staves and industrial products.
5.5 Extraregional influences affecting the UNECE region
Outside the UNECE region, Asia and the Pacific continues to dominate the trade in tropical sawn hardwood, with China the largest importer globally and Thailand and Malaysia the major exporters. About 55% of China’s sawn hardwood imports are from tropical countries; its tropical sawn hardwood imports grew by 29% in 2016 (to 6.6 million m3) and by 1.5% in 2017 (to 6.7 million m3) (table 5.6.1). Growth in Chinese demand for tropical sawnwood is in response to a decline in the availability of tropical logs (with producer countries imposing restrictions on log exports) and rising manufacturing costs in China, which have made tropical
0
1
2
3
4
$ bi
llion
s
GRAPH 5.4.3
North American exports, excluding bilateral trade between US and Canada, 2001-2017
Sources: USDA Foreign Agricultural Service, 2018; Statistic Canada, 2018.
0
5
10
15
20
25
30
35
Mill
ion
m3
US North America
GRAPH 5.4.4
US and North American Production of Sawn Hardwood, 2000-2018
Source: Luppold and Bumgardner, 2018 (US) and UNECE/FAO, 2018 (Canada).
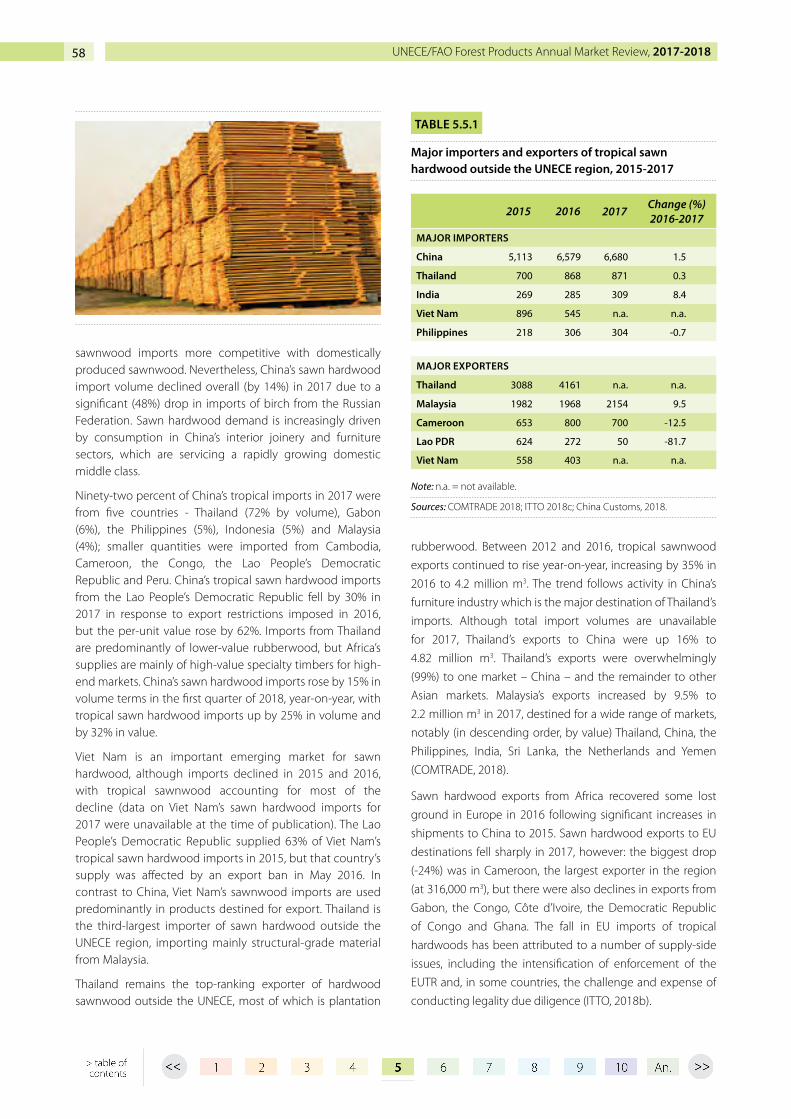
UNECE/FAO Forest Products Annual Market Review, 2017-201858
sawnwood imports more competitive with domestically produced sawnwood. Nevertheless, China’s sawn hardwood import volume declined overall (by 14%) in 2017 due to a significant (48%) drop in imports of birch from the Russian Federation. Sawn hardwood demand is increasingly driven by consumption in China’s interior joinery and furniture sectors, which are servicing a rapidly growing domestic middle class.
Ninety-two percent of China’s tropical imports in 2017 were from five countries - Thailand (72% by volume), Gabon (6%), the Philippines (5%), Indonesia (5%) and Malaysia (4%); smaller quantities were imported from Cambodia, Cameroon, the Congo, the Lao People’s Democratic Republic and Peru. China’s tropical sawn hardwood imports from the Lao People’s Democratic Republic fell by 30% in 2017 in response to export restrictions imposed in 2016, but the per-unit value rose by 62%. Imports from Thailand are predominantly of lower-value rubberwood, but Africa’s supplies are mainly of high-value specialty timbers for high-end markets. China’s sawn hardwood imports rose by 15% in volume terms in the first quarter of 2018, year-on-year, with tropical sawn hardwood imports up by 25% in volume and by 32% in value.
Viet Nam is an important emerging market for sawn hardwood, although imports declined in 2015 and 2016, with tropical sawnwood accounting for most of the decline (data on Viet Nam’s sawn hardwood imports for 2017 were unavailable at the time of publication). The Lao People’s Democratic Republic supplied 63% of Viet Nam’s tropical sawn hardwood imports in 2015, but that country’s supply was affected by an export ban in May 2016. In contrast to China, Viet Nam’s sawnwood imports are used predominantly in products destined for export. Thailand is the third-largest importer of sawn hardwood outside the UNECE region, importing mainly structural-grade material from Malaysia.
Thailand remains the top-ranking exporter of hardwood sawnwood outside the UNECE, most of which is plantation
rubberwood. Between 2012 and 2016, tropical sawnwood
exports continued to rise year-on-year, increasing by 35% in
2016 to 4.2 million m3. The trend follows activity in China’s
furniture industry which is the major destination of Thailand’s
imports. Although total import volumes are unavailable
for 2017, Thailand’s exports to China were up 16% to
4.82 million m3. Thailand’s exports were overwhelmingly
(99%) to one market – China – and the remainder to other
Asian markets. Malaysia’s exports increased by 9.5% to
2.2 million m3 in 2017, destined for a wide range of markets,
notably (in descending order, by value) Thailand, China, the
Philippines, India, Sri Lanka, the Netherlands and Yemen
(COMTRADE, 2018).
Sawn hardwood exports from Africa recovered some lost
ground in Europe in 2016 following significant increases in
shipments to China to 2015. Sawn hardwood exports to EU
destinations fell sharply in 2017, however: the biggest drop
(-24%) was in Cameroon, the largest exporter in the region
(at 316,000 m3), but there were also declines in exports from
Gabon, the Congo, Côte d’Ivoire, the Democratic Republic
of Congo and Ghana. The fall in EU imports of tropical
hardwoods has been attributed to a number of supply-side
issues, including the intensification of enforcement of the
EUTR and, in some countries, the challenge and expense of
conducting legality due diligence (ITTO, 2018b).
TABLE 5.5.1
Major importers and exporters of tropical sawn hardwood outside the UNECE region, 2015-2017
Note: n.a. = not available.
Sources: COMTRADE 2018; ITTO 2018c; China Customs, 2018.
2015 2016 2017Change (%) 2016-2017
MAJOR IMPORTERS
China 5,113 6,579 6,680 1.5
Thailand 700 868 871 0.3
India 269 285 309 8.4
Viet Nam 896 545 n.a. n.a.
Philippines 218 306 304 -0.7
MAJOR EXPORTERS
Thailand 3088 4161 n.a. n.a.
Malaysia 1982 1968 2154 9.5
Cameroon 653 800 700 -12.5
Lao PDR 624 272 50 -81.7
Viet Nam 558 403 n.a. n.a.

59Chapter 5 Sawn hardwood
5.6 Policy and regulatory influences
There is increasing concern in Europe about constraints on sawn hardwood mills due to a shortage of raw materials caused by increased Chinese demand for hardwood logs (particularly oak). Exports of hardwood logs have increased dramatically, mostly to China, which has prompted some European sawmillers to call for government intervention (International Hardwood Conference, 2017). France has regulations on publicly owned logs by way of an “EU label”, which specifies that the logs must be processed in the EU; private forests, which comprise 80% of forestlands in France, are not regulated, however. Private forest owners are not averse to increased competition for their logs (De la Hamaide and Chen, 2018).
There are similar concerns in North America, where China increased imports of red-oak logs by 64% during the first three-quarters of 2017, compared to the same period the previous year, to almost 1.6 million m3. Chinese buyers favour red oak, white oak, hickory and cherry (Woodworking Network, 2017). As of May 2018, there are several outstanding issues with China that have the potential to affect trade in hardwoods (both raw logs and products), including: a ban on hardwood logs imported from the US unless they are fumigated before leaving the US and the possibility that hardwood logs and processed forest products exported from the US to China could be impacted by the ongoing trade dispute between the US and China (Michigan Department of Natural Resources, 2018).
Recent research by Padua University on “global primary tropical timber trade trends of national and regional market legality regulation” shows that the consumption of tropical wood has shifted from developed countries with strict import rules to developing countries with less-restrictive regulations (International Hardwood Conference, 2017).
From 1 July 2017, Russian sawn hardwood producers (alder, ash, aspen, beech, birch, linden, oak, poplar and other hardwood species) have been obliged to enter data on transactions into the Unified State Automated Information System of Timber Accounting and Timber Transactions (Ministry of Natural Resources and Environment of the Russian Federation, 2017). The government has stated that this will become the instrument for timber legality assurance and will help decrease illicit timber trade.
5.7 Innovation in the sector
There is substantial interest in the use of hardwoods in structural applications: hardwoods were once commonly used in construction but have long been supplanted by softwoods. Many hardwoods have superior strength-to-volume ratios compared with softwoods, and their use in products such as structural beams, cross-laminated timber and glue-laminated timber is being investigated. Oak was used recently to produce 23m-long, 4-tonne glulam beams for a roof structure at the Lord’s Cricket Ground in London, UK. Also in the UK, Maggie’s Oldham Centre was built with cross-laminated timber panels made with hardwoods (De Zeen, 2017).
In addition to product advances, innovations in processes are improving the efficiency of sawmills. One of the most promising of these is the use of computed tomography scanning to map and measure internal log defects. This technology allows mills to optimize grade yields and even to determine optimal log uses – such as for veneer, sawnwood or barrel staves.
Note: The statistical annex of the Forest Products Annual Market Review 2017-2018 is available at:
www.unece.org/forests/fpamr2018-annex
UNECE/FAO Forest Products Annual Market Review, 2017-201860
5.8 References
Bernardinelli, I. 2000. Distribution of the oak lace bug, Corythucha arcuata in northern Italy. Redia LXXXIII, 157-162.China Customs. 2018. General Administration of Customs People’s Republic of China. Available at: http://english.customs.gov.cn
COMTRADE. 2018. UN COMTRADE database. New York. Available at: http://comtrade.un.org/db
CSIL. 2018. World furniture outlook. Organized by CSIL Milano. Centre for Industrial Studies (CISL). Available at: www.worldfurnitureonline.com/research-market/world-furniture-outlook-0058524.html
De la Hamaide, S. and Chen, Y. 2018. China’s love affair with oak a mixed blessing for France. Reuters Business News. Available at: www.reuters.com/article/us-france-china-oak/chinas-love-affair-with-oak-a-mixed-blessing-for-france-idUSKCN1J30FU
De Zeen. 2017. dRMM builds Oldham Maggie’s Centre around a courtyard with rippling glass walls. Available at: www.dezeen.com/2017/06/21/drmm-maggies-centre-centre-care-architecture-courtyard-oldham-manchester-uk
EOS. 2018. Annual report. European Organization of the Sawmill Industry (EOS). available at: www.eos-oes.eu/en/sawmill_industry_annual_reports.php
Eurostat. 2018. Comext database. Available at: http://epp.eurostat.ec.europa.eu/newxtweb
FEP. 2018. The European Parquet Market consolidates its positive trend. European Federation of the Parquet Industry (FEP). Available at: www.parquet.net/files/FEP_PRESS_RELEASE_-_June_2018.pdf
Hardwood Market Report. 2018. Various issues. www.hmr.com
Indufor. 2017. European hardwood sawmilling: state of play and industry outlook.
International Hardwood Conference. 2017. Press release: Challenges and potential in focus at International Hardwood Conference. Available at: www.ihc2017.info/wp-content/uploads/2017/12/International-Hardwood-Conference-Press-Release-Full-Report.pdf
ITTO. 2018a. Market Information Service, 1-15 May 2018. International Tropical Timber Organization (ITTO). Available at: www.itto.int/market_information_service
ITTO. 2018b. Market Information Service, 16-31 March 2018. International Tropical Timber Organization (ITTO). Available at: www.itto.int/market_information_service
ITTO. 2018c. Statistical database. International Tropical Timber Organization (ITTO). Available at: www.itto.int/annual_review_output
Luppold, W.G. and Bumgardner, M.S. 2016. US hardwood lumber consumption and international trade from 1991 to 2014. Wood and Fiber Science, 48(3): 162-170.
Luppold, W.G. and Bumgardner, M.S. 2017. Changes in eastern US sawmill employment and estimated hardwood lumber production from 2001 to 2015. Forest Products Journal, 67(7/8): 408-415.
Michigan Department of Natural Resources. 2018. Forest Utilization and Marketing. Newsletter, 28 June 2018. Available at: https://www.michigan.gov/documents/dnr/FRD_MKTUTILIZE_summer_2018_626403_7.pdf
Ministry of Natural Resources and Environment of the Russian Federation. 2017. Available at: www.mnr.gov.ru/press/news/proizvoditeli_pilomaterialov_s_1_iyulya_2017_g_budut_obyazany_vnosit_dannye_o_sdelkakh_v_egais_/?sphrase_id=20416
Rosstat. 2018. Federal Service of State Statistics (Rosstat). Moscow. Available at: www.gks.ru
Statistics Canada. 2018. Canada’s national statistical database. Available at: www.statcan.gc.ca
UNECE/FAO. 2018. TIMBER database. Available at: www.unece.org/forests/fpm/onlinedata
US Bureau of Labor Statistics. 2018. Statistics on affecting inflation. Available at: www.bls.gov
US Census Bureau. 2018. Housing starts in United States. Available at: www.census.gov/construction/nrc
USDA Foreign Agricultural Service. 2018. Global agricultural trade system. Available at: https://apps.fas.usda.gov/gats
WhatWood. 2018. Russian forest sector in 2017-2018. Available at: www.whatwood.ru
Woodworking Network, 2017. Exports of red oak rise dramatically, market tightens. Available at: https://www.woodworkingnetwork.com/wood/pricing-supply/exports-red-oak-rise-dramatically
61Chapter 5 Sawn hardwood
61

Chapter 6
WOOD-BASED PANELS
Lead author: Ivan Eastin
Contributing authors: Orifjon Abidov, Fran Maplesden, Igor Novoselov

63Chapter 6 Wood-based panels
Highlights
MDF consumption set record highs in all three subregions in 2017.
Wood-based panel production increased by 1.6% in Europe in 2017, to 75 million m³, reflecting economic growth in the subregion. Production increased in all segments of the wood-based panel market except wet-process hardboard.
Two-thirds of overall particle board production in Europe was consumed in the furniture sector.
European production of softboard increased in 2017 for the sixth consecutive year. Wood-based panel markets in Europe continued their recovery in 2017, with growth especially strong in structural panels. The subregion’s wood-based panels market is expected to be positive overall in 2018.
The apparent consumption of wood-based panels in the CIS subregion increased by 10.2% in 2017, to 19.3 million m3.
Russian OSB producers continue to explore foreign markets and, for the first time, Russian-produced OSB was exported to the US in 2017.
Plywood production in the Russian Federation decreased by 0.8% in 2017, to 3.7 million m3, due to a shortage of raw materials.
The US Department of Commerce imposed a final antidumping duty of 183% on imported Chinese hardwood plywood, with final countervailing subsidy rates ranging from 23% to 195%.
The imposition of US import duties on Chinese hardwood plywood led to a 549% jump in US imports of Chinese softwood plywood in 2017 and an astronomical 1,581% increase over January 2017 through the first four months of 2018.
North American demand for structural panels is expected to slow overall to 3.7% in 2018, with demand growing by 4.4% for OSB and by 2.3% for plywood.
Malaysia and Indonesia continued to dominate tropical plywood exports in 2017, although Malaysia’s export volume dropped by 13% in response to strengthening domestic demand, rising manufacturing costs, and a stronger ringgit.
In Japan, the major import market for tropical plywood, imports are expected to be affected by government policy aimed at strengthening the competitiveness of the domestic plywood industry.

UNECE/FAO Forest Products Annual Market Review, 2017-201864
6.1 Introduction
This chapter covers both structural (plywood made from cross-laminated veneer, and oriented strandboard – OSB – made from wood strands bonded together) and non-structural panels (particle board and fibreboard). The Harmonized Commodity Description and Coding System for classifying traded products (also called the Harmonized System) classes OSB as particle board. It is treated as a separate product here, however, because OSB and particle board differ in their manufacture and use and in the raw materials used to make them. Fibreboard is the term used for various types of panels made of wood fibre, including:
• high-density fibreboard (HDF) and medium-density fibreboard (MDF), which are both included in the MDF category here;
• wet-process hardboard, which is similar in density to hardboard but made with a wet process; and
• low-density fibreboard, which comprises products such as insulation board, “other board” and softboard (both ridged and flexible).
Trends in the production and consumption of wood-based panels were generally positive in 2017. Panel production in the UNECE region rose by 3.7%, to 147.5 million m3. The apparent consumption of wood-based panels was up even more strongly – by 5.2% – in the region, reaching 150.6 million m3. The consumption of OSB panels was very strong in all the UNECE subregions, rising by 10.8% in Europe, 8.6% in the CIS and 7.6% in North America. MDF consumption set record highs in all three subregions in 2017. The outlook for 2018 is more muted, with panel consumption expected to grow by just 0.7% in the UNECE region as a whole and to decline slightly (by 0.1%) in North America.
6.2 Europe
Economic growth in Europe has been driven recently by higher consumer confidence, favourable financing conditions, and continued improvements in the labour market. Economic growth is expected to continue at a moderate pace in 2018, which bodes well for the wood-based panels industry.
Wood-based panel production increased overall by 1.6% in Europe in 2017 (table 6.2.1) (UNECE/FAO, 2018); it rose for all types of wood-based panels except wet-process hardboard (EPF, 2018).9
6.2.1 Consumption
Particle board. The apparent consumption of particle board in European Panel Federation (EPF) member countries is expected to increase by 3% in 2018 (EPF, 2018).
Two-thirds of overall particle board production in Europe in 2017 was consumed in the furniture sector. The building industry, including doors and flooring applications, consumed 21%, and the remaining 12% was used in applications such as packaging (EPF, 2018).
Fibreboard. The consumption of fibreboard increased by 3.8% in Europe in 2017, to 21.8 million m³ (table 6.2.3). Turkey, Poland and Germany (in descending order, by volume) were the largest consumers of fibreboard panels in Europe in 2017 (UNECE/FAO, 2018).
The European market for MDF is expected to grow by 1.7% in 2018. No decline is projected for any country in the subregion, and significant increases in consumption are expected in Finland (+9.1%) and Spain (+5.4%) (EPF, 2018).
Furniture was by far the largest end-use market for MDF in 2017, commanding 56% of Europe’s production. Sales of MDF increased by 20% for renovation and do-it-yourself applications, reflecting the growing popularity of these segments of the building sector. Laminate flooring and other each had a 12% share of Europe’s MDF market in 2017 (EPF, 2018).
OSB. Building activity continued to increase in Europe in 2017, leading to increases in OSB consumption. Most European
9 Figures and trends provided by the EPF for its 27 member countries differ from those for the European subregion reported in the UNECE/FAO database (39 countries, including Israel, Serbia and Turkey). The EPF reports information for the following 27 European countries: Austria, Belgium, Bulgaria, Croatia, Czech Republic, Denmark, Estonia, Finland, France, Germany, Greece, Hungary, Ireland, Italy, Latvia, Lithuania, Luxembourg, Norway, Poland, Portugal, Romania, Slovakia, Slovenia, Spain, Sweden, Switzerland and the UK. In this chapter, data and trends attributed to the EPF pertain to these countries. The main differences stem from the varying country coverage and the inclusion of veneer sheets in wood-based panels in the UNECE/FAO database.
Note: f= 2017 Committee on Forests and the Forest Industry forecast.
Source: UNECE/FAO, 2018.
TABLE 6.2.1
Wood-based panel balance, Europe, 2016-2018 (thousand m3)
2016 2017 2018fChange
(%) 2016-2017
Production 73,797 74,983 75,676 1.6
Imports 34,353 36,776 37,065 7.1
Exports 34,918 36,488 37,122 4.5
Apparent consumption
73,231 75,272 75,619 2.8

65Chapter 6 Wood-based panels
OSB is traded within Europe and with European Free Trade Association (EFTA) countries (Iceland, Liechtenstein, Norway and Switzerland). Load-bearing panels suitable for structural uses in humid conditions, called OSB/3 panels, continue to be the major production category (comprising 77% of European OSB output in 2017). OSB/2 panels – that is, panels suitable for structural and non-structural uses in dry conditions – constituted 15% of production, and the OSB/4 category (i.e. load-bearing panels suitable for heavy-duty structural uses in dry and humid conditions, where considerable swell resistance and strength are required) accounted for 6%. Eighty-four percent of OSB production in 2017 was sold to the building industry and used in related applications such as subflooring, roof construction and load-bearing applications (walls and ceilings). The remainder (2%) of European OSB production in 2017, categorized as OSB/1 for general purposes in dry conditions, was used for packaging, other uses, flooring, furniture and within the do-it-yourself subsector (in decreasing order of importance) (EPF, 2018).
Plywood. Overall plywood consumption in Europe was 8.7 million m³ in 2017, up by 3.4% over 2016. Expectations are generally positive, with plywood consumption in Europe
expected to grow by 0.2% in 2018 (UNECE/FAO, 2018). The main plywood applications are construction (39%) and furniture (30%), followed by transport (13%), packaging (8%) and other uses (10%) (EPF, 2018).
6.2.2 Production and capacity utilization
Graph 6.2.1 shows that particle board comprised nearly half of all wood-based panel production in Europe in 2017. Fibreboard accounted for 32% and OSB for almost 10%.
Particle board. Following an upturn in 2015 and 2016, European particle board production increased by an additional 0.5% in 2017, to 36.8 million m³ (table 6.2.2). Despite the increases, this was still far below the output peak of 39.4 million m³ in 2007 (UNECE/FAO, 2018).
Significant increases in output were noted in 2017 in Serbia (+17.1%), the Czech Republic (+10.7%), Norway (+7.4%), Slovakia (6.5%) and the UK (+7.1%). In contrast, production decreased in France (-7.2%), Portugal (-5.6%) and Romania (-3.4%) (UNECE/FAO, 2018).
European particle board production capacity increased slightly (by 0.4%) in 2017, and the capacity utilization rate in EPF producer countries increased from 83% in 2016 to 86% in 2017. The only addition of production capacity was in Switzerland.
Particle board production capacity is projected to increase by 4.6% in Europe in 2018, to about 38.2 million m³, with new capacity to be added in Poland and Spain. Projects
TABLE 6.2.2
Particle board balance, Europe, 2016-2018 (thousand m³)
2016 2017 2018fChange
(%) 2016-2017
Production 36,616 36,806 37,021 0.5
Imports 11,826 12,956 12,769 9.6
Exports 12,913 13,820 13,706 7.0
Apparent consumption
35,530 35,942 36,083 1.2
Note: f = 2017 Committee on Forests and the Forest Industry forecast.
Source: UNECE/FAO, 2018.
Particle board, 36.8
Fibreboard, 24.1
OSB, 7.4
Plywood, 5.1
Veneer sheets, 1.6
GRAPH 6.2.1
Wood-based panel production, Europe, 2017 (million m³)
Notes: Total wood-based panel production in Europe in 2017 = 74.8 million m³. “Fibreboard” comprises MDF (74%), hardboard (12%) and insulating board (14%).
Source: UNECE/FAO, 2018.

UNECE/FAO Forest Products Annual Market Review, 2017-201866
in two existing plants, one each in Italy and Slovenia, are also expected to restart production this year, although it is uncertain when these will come online. Despite the new capacity, total particle board capacity in Europe will remain substantially below the 43 million m³ achieved before the global financial crisis (EPF, 2018).
Fibreboard. The production of fibreboard increased by 507,000 m3 (+2.1%) in 2017, to 24.1 million m3 (table 6.2.3). The top five producing countries were Germany, Turkey, Poland, Spain and France (in descending order, by volume), together accounting for about 75% of the subregion’s production.
Europe’s MDF production was flat in 2017, at 17.7 million m3, but production in EPF member countries grew by 1.5%, to 12.3 million m³. MDF production capacity in EPF member countries increased slightly (by 130,000 m3) in 2017, to about 15 million m3, due mainly to an expansion in capacity at a plant in Italy (EPF, 2018). As a result, the capacity utilization rate for EPF member countries in the MDF sector increased slightly to 82%.
EPF member countries produced 522,000 m3 of wet-process hardboard in 2017, a decline of 3.0%. Production
data and other statistics for this product are unreliable for the entire European subregion because the product is often misclassified – the result of confusion between dry-process HDF and wet-process hardboard. Although it was a difficult year for all wet-process hardboard producers, the challenges were most pronounced in southern Europe. The main end-use applications for wet-process hardboard in 2017 were packaging (23%) and furniture (21%). Do-it-yourself applications accounted for 19% of end uses, construction for 13%, automotive for 4% and “other” for 20% (EPF, 2018).
Total installed wet-process hardboard production capacity in EU28 and EFTA10 countries was 707,000 m3 in 2017, down from 742,000 m³ in 2016, and the capacity utilization rate was 73.8%. The decline in production capacity was due to a plant closure at the end of 2016. The main European producers of wet-process hardboard in 2017 were Poland and Bulgaria (EPF, 2018).
European production of softboard (also called insulation board) increased in 2017 for the sixth consecutive year, reaching nearly 4.9 million m3 (up by 7.0%, year-on-year). Rigid softboard accounted for 62% of softboard output in 2017 and flex softboard for the remaining 38% (EPF, 2018).
Installed rigid softboard production capacity in Europe was steady in 2017, at 3.5 million m3. The production capacity of flex softboard was also stable, at 2.2 million m³. For both softboard types, Europe’s main producers were Poland, France and Germany. Poland has the largest production capacity for rigid softboard and Germany is the leader for flexible softboard. Switzerland also has significant rigid-softboard production capacity, although this is now well below the level in 2014. In 2017, softboard sales for both rigid (46%) and flexible (30%) panels, consisted mainly of panels used to insulate walls and ceilings. The market shares for rigid underlays was 9%, the market share for standard boards was 6% and the final 9% is taken up by various other grades of softboard in 2017 (EPF, 2018).
OSB. OSB production increased by 5.1% in Europe in 2017, to 7.4 million m³ (table 6.2.4) (UNECE/FAO, 2018). Romania is Europe’s largest producer of OSB, followed by Germany. Poland became the third-largest OSB producer after an expansion in 2015 (EPF, 2018).
OSB production capacity grew overall in EPF member countries in 2017 due to increases in capacity in Poland and the UK. The capacity utilization rate declined by 2%, however, to 81%. Additional production expansion is expected in Luxembourg in 2018 (EPF, 2018).
10 Official country-supplied data on wet-process hardboard are considered unreliable due to misclassification between it and HDF; on the other hand, producer data supplied to the EPF is considered reliable. Thus, figures reported here are not for the entire European subregion.
TABLE 6.2.3
Fibreboard balance, Europe, 2016-2018 (thousand m³)
Note: f = 2017 Committee on Forests and the Forest Industry forecast.
Source: UNECE/FAO, 2018.
2016 2017 2018fChange
(%) 2016-2017
Production 23,599 24,106 24,152 2.1
Imports 10,090 10,613 10,667 5.2
Exports 12,731 12,960 13,041 1.8
Apparent consumption
20,958 21,759 21,778 3.8

67Chapter 6 Wood-based panels
Plywood. European plywood production increased by 5.1% in 2017, to 5.1 million m3 (table 6.2.5). Finland – the most important producer in the subregion, accounting for more than 24% of total production – recorded a significant increase (+9%) in volume in 2017. Europe’s UNECE members forecast a 0.5% increase in plywood production in 2018 (UNECE/FAO, 2018).
6.2.3 Trade
6.2.3.1 Imports
Particle board. Europe’s particle board imports, including imports between countries within the European subregion, totalled 13.0 million m³ in 2017 (up by 9.6% over 2016). Germany remained the largest European importer, at nearly 2.2 million m³. Poland – the imports of which increased by 29.8% in 2017 – was the second largest, followed by Italy (down by 12.1% over 2016) (UNECE/FAO, 2018).
Imports from non-EU countries were primarily from EFTA countries and other neighbouring countries. EU imports of particle board were primarily from Belarus, Ukraine, Switzerland, the Russian Federation, Norway, Croatia, Turkey and Serbia (in descending order, by volume) (EPF, 2018).
Fibreboard. European imports of fibreboard increased by 5.2% in 2017, to 10.6 million m3. Germany was the main importer, followed by Belgium and the UK; combined, these three countries accounted for more than 30% of European fibreboard imports in 2017. According to EPF (2018) and Eurostat (2018), European MDF imports from non-EU countries in 2017 came mainly from Belarus, Switzerland, the Russian Federation, China, Ukraine and Norway (in descending order, by volume).
OSB. European imports of OSB increased by 9.7% in 2017, to 3.5 million m3. EU imports came from Belarus, the Russian Federation, Ukraine, the US and China (in descending order, by volume) in 2017 (COMTRADE, 2018).
Plywood. The value of extra-EU imports was €1.49 billion in 2017. This was an increase of 7.4% over 2016, although the import volume was steady, at 4.14 million m³. China was the largest supplier to the EU (1.3 million m³), followed by the Russian Federation (1.1 million m³). Although China was the main exporter of tropical plywood to the EU (47% of the total volume), the Russian Federation was the largest supplier of temperate hardwood (42%). Brazil was the largest supplier of softwood plywood to EPF member countries in 2017 (EPF, 2018).
6.2.3.2 Exports
Particle board. Particle board exports from the European subregion increased by 7.0% in 2017, to 13.8 million m³. Austria was the largest exporter, at more than 1.9 million m³ (up by 2.7% over 2016), followed by Germany, at slightly less than 1.9 million m³ (+7.1%), and France, at 1.4 million m3 (-10%). The Czech Republic, Belgium and Romania are also major European exporters, each exporting more than 750,000 m³ in 2017 (UNECE/FAO, 2018).
A greater share of all particle board exports was sent outside the EU in 2017. Extra-EU sales by EPF member countries grew by 16% in 2017 and exports to all major regions increased, including to the US (up by 27%), the Far East (+16%), the Middle East (+7%), Africa (+1%) and Oceania (+11%). Total particle board exports (including between European countries) are expected to increase by 1.1% in 2018 (EPF, 2018).
Fibreboard. Europe’s fibreboard exports increased by 1.8% in 2017, to 13.0 million m3. Exports from EPF member countries were relatively stable, although extra-EU sales of MDF rose by 10% over 2016. Export increases were recorded to the US (up by 31%), the Middle East (+26%) and the Far East (+15%)
TABLE 6.2.4
OSB balance, Europe, 2016-2018 (thousand m³)
Note: f = 2017 Committee on Forests and the Forest Industry forecast.
Source: UNECE/FAO, 2018.
2016 2017 2018fChange
(%) 2016-2017
Production 7,079 7,441 7,441 5.1
Imports 3,190 3,499 3,547 9.7
Exports 4,102 4,106 4,106 0.1
Apparent consumption
6,167 6,835 6,882 10.8
TABLE 6.2.5
Plywood balance, Europe, 2016-2018 (thousand m³)
Note: f = 2017 Committee on Forests and the Forest Industry forecast.
Source: UNECE/FAO, 2018.
2016 2017 2018fChange
(%) 2016-2017
Production 4,830 5,076 5,102 5.1
Imports 7,924 8,341 8,408 5.3
Exports 4,343 4,723 4,771 8.7
Apparent consumption
8,410 8,694 8,740 3.4

UNECE/FAO Forest Products Annual Market Review, 2017-201868
in 2017. These gains helped offset export declines to Africa (-11%), the largest destination, and Oceania (-6%).
According to Eurostat, the main extra-EU destinations for EU MDF exports in 2017 were Ukraine, Morocco, Tunisia, Serbia, Algeria, Norway, Turkey, the Russian Federation, the US, Israel, Canada and Switzerland (in descending order, by volume) (EPF, 2018).
OSB. Most European OSB is traded within Europe and with EFTA member countries, although there is some non-European trade. Following a sharp gain in 2016, exports by EPF member countries to East Asia (the main non-European destination) fell by 10% in 2017. On the other hand, OSB exports by EPF member countries increased to Africa, the Middle East and North America, helping offset the decline in exports to the Far East. Overall, exports outside the European and EFTA regions by EPF member countries increased by 16% in 2017 (EPF, 2018).
Plywood. Europe’s plywood export volume was 4.7 million m3 in 2017, up by 8.7% over 2016. The largest exporter of hardwood and softwood plywood was Finland (with a 22% share), followed by Belgium (8.5%), Spain (8.1%), Germany (7.9%), Latvia (7.5%) and Austria (7.4%) (UNECE/FAO, 2018).
More than half Europe’s hardwood plywood exports comprised birch plywood manufactured in Finland and the Baltic countries, and the main destination was the Republic of Korea. Italy and Spain exported a combined volume of more than 80,000 m³ of primarily poplar plywood. (EPF, 2018).
6.3 Commonwealth of Independent States, with a focus on the Russian Federation
In the European part of the Russian Federation there was a shortage of about 350,000 m3 in annual veneer-log production (WhatWood, 2018a). As a result, plywood production fell in the Russian Federation for the first time since 2009.
Additional pressure on the raw-materials market occurred due to strong demand for veneer logs from China. Russian sales of birch veneer logs to China grew by 23% in 2017, to 1.6 million m3 (WhatWood, 2018a). The Russian government has enacted measures to protect plywood producers and is likely to soon introduce quotas for the export of birch veneer logs.
6.3.1 Consumption
6.3.2 Consumption, production and capacity utilization
The apparent consumption of wood-based panels in the CIS subregion increased by 10.2% in 2017, to 19.3 million m3
(table 6.3.1), and was steady for plywood, at 1.8 million m3. Apparent consumption increased by 11.1% for particle board, to 9.6 million m3, by 8.6% for OSB, to 1.6 million m3, and by 13% for fibreboard, to 5.8 million m3. In the Russian Federation, apparent consumption increased by 9.5% for wood-based panels in 2017, to 11.8 million m3, but decreased for plywood by 2.4%, to 1.3 million m3. There were healthy increases in the Russian Federation’s apparent consumption of particle board, fibreboard and OSB.
The production of wood-based panels increased by 12.3% in the CIS in 2017, to 23.9 million m3. The Russian Federation produced 16.6 million m3, an increase of 10.2% over 2016.
Plywood. Plywood production increased by 1.1% in the CIS in 2017, to 4.2 million m3. The Russian Federation produced 3.7 million m3, a decrease of 0.8% over 2016 (graph 6.3.1; table 6.3.2). The reason for the decline in production was a shortage of raw materials.
There have been several recent major developments in the Russian plywood industry. The Zvezda Group completed the acquisition of Tyumen FZ in early 2018 and announced a 20% increase in plywood production at the plant (to 120,000 m3) by 2020. The first stage of the Murashinsky Plywood Plant (Kirov Region) began production in December 2017. It will produce 60,000 m3 per year, increasing to 120,000 m3 following the opening of the second line. The first stage of production of the Teikovsky Plywood Mill (Ivanovo region, Teikovo) was completed in March 2017. The production capacity of the first stage is 18,000 m3 per year, and the enterprise plans to increase production to 30,000 m3 in 2018 when the second phase is completed. The Segezha Group completed a plywood project in the Kirov region in the first half of 2018 at the Vyatka FC site, where the annual production capacity is expected to reach 182,000 m3.
Several companies have pledged to build greenfield projects and plant upgrades in 2018. Sveza plans to invest 12.2 billion
TABLE 6.3.1
Wood-based panel balance, CIS, 2016-2018 (thousand m³)
Note: f = 2017 Committee on Forests and the Forest Industry forecast.
Source: UNECE/FAO, 2018.
2016 2017 2018f
Change (%) 2016-
2017
Production 21,290 23,910 24,928 12.3
Imports 5,077 5,585 5,585 10.0
Exports 8,840 10,172 10,697 15.1
Apparent consumption
17,527 19,323 19,816 10.2

69Chapter 6 Wood-based panels
roubles in developing its assets in 2018. The Gegezha Group signed an agreement of intent in June 2017 to initiate a 9-billion-rouble investment project to build a plywood plant with an annual production capacity of 100,000 m3; construction is expected to begin in 2018 and production in 2020. In June 2017, the Finnish company UPM publicized plans to invest €50 million to expand the production capacity of the UPM-Kymmene Chudovo plywood plant by 45,000 m3 per year, to 155,000 m3. The ULK Group announced an investment project for the construction of a plywood mill in the Oktyabrsky settlement with a production capacity of 100,000 m3 per year. Finally, in June 2017, Cherepovetsky FMK and the Vologodskiye lesopromyshlenniki group moved to reopen the bankrupt Vokhtozhsky DOK and build a large-format plywood plant (capable of producing large-dimension panels). This plant will have a capacity of 120,000 m3, and production is scheduled to begin in 2021 (WhatWood, 2018a).
Particle board. Particle board production increased by 13.1% in the CIS in 2017, to 11.0 million m3, and by 13.5% in the Russian Federation, to 7.5 million m3. The main growth was provided by Kronospan Bashkortostan, which increased production in an existing mill (WhatWood, 2018d).
OSB. OSB production increased in the Russian Federation by 27% in 2017, to 1.0 million m3, in response to an increase of 8.6% (to 1.6 million m3) in OSB consumption in the CIS subregion in 2017. The main production increase was due to the STOD mill (in Torzhok, Tver region), which reached its full production capacity of 500,000 m3. In 2017, for the first time, the Russian market consumed the same quantity of OSB as plywood (1.3 million m3); this was due to the substitution of low-grade plywood with OSB in low-rise construction in roofing, enclosing structures, walls and ceilings, and temporary structures. DOK Kalevala announced in 2017 that it would expand annual OSB production by 250,000 m3, to 550,000 m3 (WhatWood, 2018c).
Fibreboard. Fibreboard production increased by 19.4% in the CIS subregion in 2017, to 5.8 million m3, and by 11.8% in the Russian Federation, to 3.4 million m3 (table 6.3.2); most (about 88%) was MDF and HDF. The main increase in production was attributed to increases at Asinovsky zavod MDF (Tomsk region) and Egger (Smolensk region). Total production capacity of MDF/HDF in the Russian Federation is 3.965 million m3/year, with capacity utilization at about 74% in 2017. Weak financial sustainability and unstable supplies of wood raw materials have undermined production. It is expected that existing and planned production capacity will be able to meet growing domestic demand for fibreboard, pushing imports out of the market (except for narrow segments) and allowing increased exports (WhatWood, 2018b).
6.3.3 Prices
Plywood. Russian producer prices for plywood (averaged across all regions) increased by 2.3% in 2017, to 24,560
0
1
2
3
4
5
6
7
8
2013 2014 2015 2016 2017
Mill
ion
m3
Particle board Plywo od
Fibreboard OSB
GRAPH 6.3.1
Wood-based panel production, Russian Federation, 2013-2017
Source: UNECE/FAO, 2018.
TABLE 6.3.2
Wood-based panel production, Russian Federation, 2014-2017 (thousand m³)
Source: UNECE/FAO, 2018.
2014 2015 2016 2017
Change (%) 2016-
2017
Plywood 3,540 3,607 3,759 3,729 -0.8
Particle board
6,183 6,591 6,573 7,460 13.5
Fibreboard 2,413 2,722 3,032 3,390 11.8
OSB 360 618 797 1,013 27.1

UNECE/FAO Forest Products Annual Market Review, 2017-201870
roubles per m3 (graph 6.3.2). Export prices dropped by 2%,
to 25,614 roubles per m3, and domestic prices increased by
9.6%, to 23,129 roubles per m3. Average plywood prices in
both the domestic and export markets continued increasing
in the first quarter of 2018 (Rosstat, 2018).
Particle board. Prices for particle board in the Russian Federation grew more in the domestic market in 2017 than in export markets. The average overall price rose by 7.2%, to 9,979 roubles per m3: the average price in the domestic market was 10,340 roubles per m3 (up by 9.8% compared with 2016) and the average price for exported particle board (primarily to Kazakhstan and Uzbekistan) fell by 3.8%, to 7,426 roubles per m3. Particle board prices in the first quarter of 2018 showed moderate increases (Rosstat, 2018).
Fibreboard. The average price of fibreboard in the Russian Federation increased by 34% in 2017, to 84.6 roubles per m2. The average export price rose by 1.9%, to 69.7 roubles per m2, and the average price in the domestic market fell by 39%, to 87.3 roubles per m2. Fibreboard prices fell precipitously in the first quarter of 2018 and are only now beginning to recover (graph 6.3.2) (Rosstat, 2018).
6.3.4 Trade
6.3.4.1 Imports
Plywood. The volume of plywood imports increased by 17.3% in the CIS in 2017, to 495,000 m3, and by 15.8% in the Russian Federation, to (a still very low) 67,000 m3 (mainly from Belarus and China).
OSB. CIS imports of OSB grew by 9.2% in 2017, to 697,000 m3, mainly comprising trade among CIS countries. With Russian and Belarusian OSB plants nearing full production capacity, imports from outside the CIS subregion are negligible.
Particle board. Particle board imports increased by 7.3% in the CIS in 2017, to 2.0 million m3, and by 9.4% in the Russian Federation, to 254,000 m3. About 77% of imported particle board in the Russian Federation was from Belarus (199,000 m3, up by 27.6% from 2016).
Fibreboard. The volume of fibreboard imports increased by 10.9% in the CIS in 2017, to 2.31 million m3, but decreased by 9.5% in the Russian Federation, to 498,000 m3. The main suppliers of Russian imports were Belarus (179,000 m3, down by 0.8%), and China (153,000 m3, up by 4.5%) (graphs 6.3.3 and 6.3.4).
6.3.4.2 Exports
Plywood. Plywood exports increased by 2.9% in the CIS in 2017, to just over 2.9 million m3, and were flat in the Russian Federation, at 2.5 million m3 (graph 6.3.5). Russian plywood exports declined in almost all major markets, with only Poland (+29%) and Finland (+22%) recording increases (WhatWood, 2018a).
Particle board. CIS exports of particle board increased by 15.3% in 2017, to 3.4 million m3. Russian exports grew by 10.3%, to 1.7 million m3, with the majority (57%) going
Belarus 179
China 153
Germany79
Poland 35
Belgium 17
Switzerland10
Other 25
GRAPH 6.3.3
Fibreboard imports, Russian Federation, 2017 (thousand m3)
Note: The total volume of fibreboard imports to the Russian Federation in 2017 was 0.498 million m³.
Source: WhatWood, 2018a.
0
5
10
15
20
25
30
2012 2013 2014 2015 2016 2017 2018
Thou
sand
roub
les
per u
nit*
Plywood Particle board Fiberboard
GRAPH 6.3.2
Monthly prices for wood-based panels, Russian Federation, 2012-2018
Notes: Sales for exports and domestic markets. * Russian wood-based panel prices are in roubles per m³, except fibreboard, which is in roubles per 100 m².
Source: Rosstat, 2018

71Chapter 6 Wood-based panels
to Kazakhstan (446,000 m3) and Uzbekistan (407,500 m3) (WhatWood, 2018d).
Fibreboard. Fibreboard exports increased by 28.3% from the CIS in 2017, to 2.3 million m3, and by 22% from the Russian Federation, to 1.0 million m3. The major markets for Russian fibreboard were Kazakhstan, Romania and Uzbekistan (WhatWood, 2018b).
OSB. OSB exports increased by 29.4% from the CIS subregion in 2017, to about 854,000 m3, and by 68.7% from the Russian
Federation, to 114,000 m3 (50% going to Kazakhstan). The Russian Federation began shipping OSB into the US market for the first time in 2017 (WhatWood, 2018c). Graph 6.3.6 shows trends in Russian wood-panel exports in the five years to 2017.
6.4 North America
6.4.1 Consumption
The consumption of wood-based panels in North America is tied strongly to economic growth and housing starts. GDP growth is robust in the US, rising from 1.5% in 2016 to 2.3% in 2017 and a projected 3.2% in 2018. US housing starts grew from 1.17 million in 2016 to 1.2 million in 2017 and are projected to grow to 1.31 million in 2018. GDP growth in Canada jumped from 1.5% in 2016 to 3.1% in 2017 but is projected to drop to 2.4% in 2018. Housing starts in Canada rose from 198,000 in 2016 to 220,000 in 2017; they are projected to fall to 210,000 in 2018, however, as homebuyers adjust to an overheated housing market. The apparent consumption of wood-based panels increased by 6.9% in North America in 2017, led largely by strong growth in exports and imports (up by 4.5% and 17%, respectively). Total wood-based panel production in North America increased by 3% in 2017, to 48.6 million m3 (table 6.4.1).
The consumption of structural wood-based panels increased by 5.5% in North America in 2017 (graph 6.4.1), with demand for OSB and plywood increasing by 7.6% and 3.2%, respectively. The consumption of wood-based structural panels increased in all four of the major end-use markets
0
200
400
600
800
1000
2013 2014 2015 2016 2017
Thou
sand
m3
Particle board OSB
Fibreboard Plywood
GRAPH 6.3.4
Imports of fibreboard, OSB, particle board and plywood, Russian Federation, 2013-2017
Source: UNECE/FAO, 2018.
Others1190.7
USA 338.6
Egypt 274.7
Germany197.8
Latvia 144.3
Poland111.7
Italy 106.8 United Kingdom105.4
GRAPH 6.3.5
Plywood exports, Russian Federation, 2017 (thousand m3)
Note: The total volume of plywood exports from the Russian Federation in 2017 was 2.47 million m³.
Source: WhatWood, 2018a.
0
500
1000
1500
2000
2500
3000
2013 2014 2015 2016 2017
Thou
sand
m3
Plywood Particle board
Fibreboard OSB
GRAPH 6.3.6
Exports of fibreboard, OSB, particle board and plywood, Russian Federation, 2013-2017
Source: UNECE/FAO, 2018.

UNECE/FAO Forest Products Annual Market Review, 2017-201872
– by 5.7% in the residential construction market, 3.0% in
remodelling, 4.8% in the industrial market, and 1.7% in the
non-residential market (graph 6.4.2) (APA, 2018).
The largest market for OSB in 2017 was residential
construction, which consumed 56% of total production.
The strongest growth in demand was also in the residential
housing sector, up by 9.2% in 2017. Demand for OSB increased
by 4.6% in the remodelling market, by 2.0% in the non-
residential sector and by 2.6% in the industrial market. The
largest market for plywood in 2017 remained the industrial
sector, which consumed 36.2% of total production. Plywood
demand grew in all the major markets – industrial (+6.4%),
non-residential (+1.4%), residential housing (+2.3%) and
repairs and remodelling (+0.5%). North American demand
for structural panels is expected to slow overall to 3.7% in
2018, with demand growing by 4.4% for OSB and by 2.3% for plywood (APA, 2018).
North American consumption of non-structural panels (particle board and MDF) was up by 0.9% in 2017, with MDF increasing by 2.0% and particle board flat. Given that North American housing starts are projected to increase by an additional 100,000 in 2018 (up to just over 1.5 million),
0
5
10
15
20
Mill
ion
m3
Residential housing Remodelling
Industrial Non-residential
GRAPH 6.4.2
Four main end-use markets for OSB and plywood, North America, 2016 and 2017
Notes: Residential, non-residential and industrial are new construction. Converted using 1ft², 3/8 inch basis = 0.000885 m3.
Source: APA, 2018.
0
10
20
30
40
50
60
70
80
90
100
2011 2012 2013 2014 2015 2016 2017
Perc
enta
ge
Plywood OSB
GRAPH 6.4.3
Plywood and OSB capacity utilization rates, North America, 2011-2017
Source: APA, 2018.
0.0
0.2
0.4
0.6
0.8
1.0
1.2
1.4
1.6
0
2
4
6
8
10
12
14
16
18
20
2013 2014 2015 2016 2017
Hou
sing
sta
rts
(mill
ion)
Mill
ion
m3
Plywood OSB Housing starts
GRAPH 6.4.1
Structural panel consumption and housing starts, North America, 2013-2017
Sources: UNECE/FAO, 2018; US Census Bureau, 2018.
TABLE 6.4.1
Wood-based panel balance, North America, 2016-2018 (thousand m3)
Note: f = 2017 Committee on Forests and the Forest Industry forecast.
Source: UNECE/FAO, 2018.
2016 2017 2018f
Change (%) 2016-2017
Production 47,199 48,604 48,754 3.0
Imports 15,891 18,598 18,958 17.0
Exports 10,687 11,169 11,324 4.5
Apparent consumption
52,403 56,034 56,388 6.9

73Chapter 6 Wood-based panels
the production of non-structural wood-based panels is also expected to show stronger growth this year (Composite Panel Association, 2018a, 2018b).
6.4.2 Production and capacity utilization
Production capacity in the North American structural-panel subsector increased by 2.1% in 2017, to 38.4 million m3. Capacity utilization increased from 76.7% in 2016 to 77.8% in 2017 and is expected to grow further in 2018, to 78.3%. North American capacity utilization in the plywood subsector decreased from 79.1% in 2016 to 78.0% (75.5% in the US and 91.5% in Canada) in 2017. Capacity utilization in the OSB subsector was up substantially in North America in 2017, at
77.8% (graph 6.4.3), increasing from 77.2% to 79.8% in the US and from 73.0% to 74.0% in Canada.
North American production capacity for non-structural panels increased by 1.3% in 2017, to about 13.5 million m3 (Composite Panel Association, 2018b), with most of the increase in the US. The capacity utilization rate increased in the particle board subsector from 69.5% in 2016 to 70.3% in 2017, but it decreased in the MDF subsector, from 78.6% in 2016 to 76.3% in 2017.
6.4.3 Prices
Increased demand for most types of wood-based panels in North America helped increase capacity utilization rates in 2017. Not surprisingly, the increase in demand drove up product prices and contributed to substantial price increases (graph 6.4.4).
OSB prices showed strong price growth, increasing by 45.7% between January 2017 and April 2018. Similarly, plywood prices grew by more than 42% between January 2017 and April 2018. Prices for non-structural panels – both particle board and MDF – rose slightly in 2017. Overall, MDF prices increased by 3.5% between January 2017 and April 2018, and particle board prices grew by 1.7% (Random Lengths, 2018).
6.4.4 Trade
6.4.4.1 Imports
The value of North American imports of wood-based panels increased by 8.4% in 2017, to $6.9 billion (table 6.4.2). Imports grew strongly – by 8.4% in the US and 8.3% in Canada. Plywood commanded the largest share of North American wood-based panel imports (48.1%, by value), followed by fibreboard (24.6%), OSB (21.5%) and particle board (5.7%). North American imports increased in 2017 for all four categories of wood-based panels.
Two import flows of wood-based panels to North America are of particular interest because of their overall size and structure. One is China’s domination of plywood imports to the US, with a 41.7% share in 2017, followed by Canada (11.4%), Indonesia (8.3%) and Brazil (7.8%). The other is Canada’s role as the almost-exclusive source of OSB imports to the US: Canada accounted for 99.6% of the US’s OSB imports of $1.53 billion in 2017.
In late 2016, the Coalition for Fair Trade of Hardwood Plywood filed a petition with the US International Trade Administration, accusing 61 Chinese hardwood-plywood manufacturers of below-market pricing. As a result, the US Department of Commerce imposed a final antidumping duty of 183.36% on imported Chinese hardwood plywood, as well as countervailing subsidy rates ranging from 22.98% to 194.9%. The imposition
0
100
200
300
400
500
600
2013 2014 2015 2016 2017 2018
$/th
ousa
nd ft
²
MDF Western plywoodSouthern plywood OSBParticle board
GRAPH 6.4.4
Wood-based panel prices, North America, 2013-2018
Notes: Western plywood (Coast), ½ inch, CD exterior (3-ply); OSB (North Central), 7/16 inch; MDF (East) 5/8 inch; particleboard (West) 5/8 inch industrial.
Source: Random Lengths, 2018.

UNECE/FAO Forest Products Annual Market Review, 2017-201874
of duties caused a fall in US imports of Chinese hardwood plywood of 20.7% in 2017 and 57.8% through to April 2018. US hardwood plywood manufacturers have charged that their Chinese counterparts are attempting to evade the duties by placing softwood veneers on the outside faces of hardwood plywood panels. Indeed, Chinese softwood plywood exports to the US leapt by 549% in 2017, from $15.9 million in 2016 to $103.5 million. They rocketed further skyward in the first four months of 2018, up by an astronomical 1,581% compared with the same period in 2017, from $7.1 million to $120.2 million.
6.4.4.2 Exports
The value of exports of wood-based panels from North America jumped substantially (by 10.7%) in 2017, to $3.2 billion, with Canada accounting for 76.1% of the total (table 6.4.3). The value of exports from North America (including trade between Canada and the US) increased by 15.5% for OSB and by 14.9% for plywood; was relatively flat (+1.4%)
for fibreboard; and decreased (-1.9%) for particle board. The largest markets (by value) for US plywood exports in 2017 were Canada (41.9%), Australia (14.9%), China (12.3%) and Mexico (11.1%). Canada (73.4% by value) and Mexico (15.8%) were the main markets for US fibreboard, and the main markets for US particle board were Canada (61.9% by value) and Mexico (31.3%). Canadian wood-based panel exports went almost exclusively to the US – including 93.3% (by value) of plywood exports, 96.1% of fibreboard exports, 94.4% of particle board exports and 93.5% of OSB exports.
6.5 Extraregional influences affecting the UNECE region
Outside the UNECE region, Japan continues to dominate the plywood import trade, with tropical plywood accounting for about two-thirds of Japan’s plywood imports. It is estimated that 49% of tropical plywood imports in 2017 were sourced
TABLE 6.4.3
Value of wood-based panel exports, North America, 2014-2017 ($ million)
Note: Does not include veneer sheets.
Source: UNECE/FAO, 2018.
2014 2015 2016 2017Change (%) 2016-2017
US
Plywood 385 346 344 415 20.5
Fibreboard 246 219 213 210 -1.6
OSB 79 64 65 55 -14.9
Particle board
116 110 97 90 -7.2
US TOTAL 826 739 719 769 7.0
CANADA
Plywood 243 348 314 342 8.8
Fibreboard 263 291 297 307 3.5
OSB 1,039 1,010 1,314 1,538 17.0
Particle board
258 257 272 272 0.0
CANADA TOTAL
1,803 1,905 2,197 2,459 11.9
NORTH AMERICA
Plywood 628 693 658 757 14.9
Fibreboard 510 510 510 517 1.4
OSB 1,118 1,074 1,379 1,593 15.5
Particle board
373 367 369 362 -1.9
TOTAL 2,629 2,644 2,916 3,228 10.7
TABLE 6.4.2
Value of wood-based panel imports, North America, 2014-2017 ($ million)
Note: Does not include veneer sheets.
Source: UNECE/FAO, 2018.
2014 2015 2016 2017Change (%) 2016-2017
US
Plywood 2,668 3,015 3,117 3,328 6.8
Fibreboard 1,081 1,138 1,178 1,274 8.1
OSB 936 948 1,236 1,452 17.5
Particle board
289 289 321 333 3.9
US TOTAL 4,974 5,390 5,853 6,387 9.1
CANADA
Plywood 354 334 342 411 20.2
Fibreboard 454 411 430 428 -0.5
OSB 36 28 29 38 28.6
Particle board
67 66 65 62 -4.7
CANADA TOTAL
911 839 866 938 8.3
NORTH AMERICA
Plywood 3,022 3,349 3,460 3,739 8.1
Fibreboard 1,535 1,548 1,608 1,701 5.8
OSB 972 976 1,265 1,489 17.7
Particle board
356 355 386 395 2.5
TOTAL 5,885 6,229 6,719 7,325 9.0

75Chapter 6 Wood-based panels
from Malaysia, 44% came from Indonesia, and the remainder was mainly from China and Viet Nam.
Japan’s tropical plywood imports trended downwards between 2013 and 2015 but picked up in 2016 and 2017 in response to steady housing demand and low inventories of imported plywood (table 6.5.1). The expansion in housing demand was influenced by the anticipated effects on house prices of a rise in consumption tax in 2019.
Log shortages and rising manufacturing costs in Indonesia and Malaysia continued to put upward pressure on tropical plywood prices. With weak domestic demand in Japan in early 2016, the gap between the export prices of suppliers and prices in the depressed Japanese domestic market limited the commitment of Japanese buyers to future purchasing.
Exchange rates have continued to have a major effect on demand and prices for imported plywood, with a weak yen in mid-2018 driving up import prices for Malaysian and Indonesian plywood imports. This has accelerated the substitution of imported tropical plywood by imported softwood plywood and domestically produced plywood products.
In the Japanese flooring industry, manufacturers continue to shift to domestic softwoods in response to delays in shipments from Southeast Asian suppliers and to mitigate the risk of exchange-rate fluctuations. It is expected that Japan’s
plywood imports will also be affected by a government policy aimed at strengthening the competitiveness of the domestic plywood industry and expanding the share of domestic products in Japanese consumption. Overall, Japan’s plywood demand is expected to pick up in 2018 in response to construction related to the Tokyo Olympic Games in 2020 and the start of urban redevelopment.
The Republic of Korea’s tropical plywood imports continued to grow strongly (by nearly 25%) in 2017, to 973,000 m3. Plywood demand was driven by significant growth in the domestic housing sector. Government measures were introduced in 2017 to curb the building boom, and further measures were put in place in April 2018 to address concerns about mounting household debt and its potential effect on the Korean economy. Measures include increasing the capital gains tax on owners of multiple homes and imposing fresh mortgage curbs to rein in property speculation. They have helped reduce overall housing demand in 2018, which is expected to dampen plywood demand (Kim Kyung-ho, 2018).
As in previous years, Indonesia and Malaysia were the dominant tropical plywood exporters in 2017. Malaysia’s exports fell by nearly 13% (by volume), however, in response to strengthening domestic demand, an increase in plywood manufacturing costs associated with rising labour and raw-material costs (logs and resins), and the strengthening of the Malaysian ringgit against the US dollar (most Malaysian export pricing is in US dollars). Chronic labour shortages, government harvest restrictions, and an increase in log harvest duties in Sarawak pushed up Malaysia’s plywood export prices in 2017. In contrast to Indonesia, which mainly supplies Japan with floor-base plywood, Malaysia’s exports are predominantly concrete formwork panels, a commodity item with many layers in the distribution chain and relatively unsteady demand.
TABLE 6.5.1
Major importers and exporters of tropical plywood outside the UNECE region, by volume, 2015-2017 (thousand m3)
Source: ITTO, 2018; COMTRADE, 2018.
2015 2016 2017Change
(%) 2016-2017
MAJOR IMPORTERS
Japan 1,511 1,627 1,810 11.2
Republic of Korea
608 780 973 24.7
Taiwan Province of China
377 381 381 0.0
Malaysia 291 216 272 25.9
Mexico 116 124 99 -20.2
MAJOR EXPORTERS
Indonesia 2,338 2,556 2,348 -8.1
Malaysia 2,530 2,506 2,182 -12.9
China 491 606 800 32.0
Viet Nam 307 360 461 28.1

UNECE/FAO Forest Products Annual Market Review, 2017-201876
6.6 References
APA. 2018. Market outlook and regional production. Economic Report E184. APA–The Engineered Wood Association. Available at: www.apawood.org
Composite Panel Association. 2018a. 2018 North American capacity report.
Composite Panel Association. 2018b. Industry snapshot Q4.
COMTRADE. 2018. UN COMTRADE database. New York. Available at: http://comtrade.un.org/db
EPF. 2018. Annual report 2017/2018. European Panel Federation (EPF). Available at: www.europanels.org
ITTO 2018. Statistical database. International Tropical Timber Organization (ITTO), Yokohama, Japan. Available at: www.itto.int/annual_review_output
Kim Kyung-ho. 2018. Restrictive measures deepen housing market polarization. The Korea Herald, 22 January 2018. Available at: www.koreaherald.com/view.php?ud=20180122000595
Random Lengths. 2018. Random Lengths yearbook 2017.
Rosstat. 2018. Federal Service of State Statistics (Rosstat). Moscow. Available at: www.gks.ru
UNECE. 2017. Committee on Forests and the Forest Industry market forecasts. Available at: www.unece.org/forests/fpm/timbercommittee
UNECE/FAO. 2018. TIMBER database. Available at: www.unece.org/forests/fpm/onlinedata
US Census Bureau. 2018. New Residential Construction. Available at: www.census.gov/construction/nrc/index.html
WhatWood. 2018a. Plywood market in Russia 2017-2018. Available at: www.whatwood.ru
WhatWood. 2018b. MDF/HDF market in Russia 2017-2018. Available at: www.whatwood.ru
WhatWood. 2018c. OSB market in Russia 2017-2018. Available at: www.whatwood.ru
WhatWood. 2018d. Particleboard market in Russia 2017-2018. Available at: www.whatwood.ru

77Chapter 6 Wood-based panels

Chapter 7
PAPER, PAPERBOARD AND WOODPULP
Lead author: Michel Valois
Contributing author: Eduard Akim

79Chapter 7 Paper, paperboard and woodpulp
Highlights
Paper and paperboard production rose throughout the UNECE region in 2017, as stronger demand for packaging and tissue grades offset declining capacity in graphic grades.
Woodpulp production rose in the CIS and Europe in 2017 but fell in North America due mainly to capacity closures. Stronger apparent consumption in the packaging, sanitary and household segments was supplied by an increase in imports from South America.
Graphic-paper capacity in the UNECE region fell by 4.9 million tonnes in 2017 and is expected to decline by another 0.5 million tonnes in 2018. Production also fell in 2017, by 2.0 million tonnes (-3.3%).
The apparent consumption of paper and paperboard fell by 0.9% in the UNECE region in 2017, with Europe down by 1.3% and the CIS and North America each declining by 0.6%.
Low graphic-paper prices in 2010-2017 have forced the closure of high-cost capacity. Higher raw-material costs, including for market pulp, forced paper prices up in 2017, and paper exports were down across the UNECE region except in the CIS.
Graphic-paper production and apparent consumption continued to decline in virtually every market in 2017, as end-users reduced advertising budgets for print media and swung towards electronic communication, including the Internet.
The production and apparent consumption of sanitary and household paper increased in Europe, the CIS and North America in 2017.
The production of packaging paper rose in the UNECE region in 2017, aided by stronger apparent consumption and higher exports. Apparent consumption fell in Europe due to weaker economic performance but was up in the CIS and North America due to their stronger economies and exports.
Prices for woodpulp rose in 2017 as a series of unplanned downtimes disrupted supply; this prompted a flurry of buying as consumers tried to bear successive price increases.
Prices for recovered paper are increasing due to heightened demand and tighter scrutiny by Chinese customs agents to prevent contaminants from entering China.

UNECE/FAO Forest Products Annual Market Review, 2017-201880
7.1 Introduction
The global pulp, paper and paperboard industry experienced a turnaround in 2017, driven by a much tighter supply–demand balance for woodpulp and continued strong demand for packaging and sanitary and household products. The production and apparent consumption of graphic paper continued to decline in virtually every market, as end-users reduced their advertising budgets for print media and swung towards electronic communication, including the Internet. The apparent consumption of paper and paperboard fell by 0.9% in the UNECE region in 2017, with Europe down by 1.3% and the CIS and North America each declining by 0.6% (Graph 7.1.1).
Pulp prices began a slow but steady recovery in late 2016 and in 2017 and continued to increase well into 2018. As a result of increased input costs for non-integrated producers, prices for graphic paper and sanitary and household items also rose throughout 2017.
Global chemical market-pulp capacity rose by 4.5 million tonnes (6.9%) in 2017 (Valois Vision Marketing, 2018a), with increases mainly in South America and Asia. Unplanned downtime among pulp producers for mechanical and weather-related reasons caused significant supply disruptions in woodpulp production, however, negating much of the incremental increase in capacity. On the demand side, stricter rules in China on contaminants in imported recovered paper created a demand-side shock that has persisted well into 2018 (Valois Vision Marketing, 2018b). Woodpulp prices
increased steadily due to a much tighter global supply–demand balance.
Consolidation in the global chemical market-pulp subsector in 2017 and 2018 points to a much-needed strategy to increase competitiveness, maximize efficiencies, improve distribution and sales networks and minimize costs to better compete with global trade from low-cost producers.
There was significant overcapacity in the graphic-paper sector throughout the UNECE region in 2017, as consumers continued to shift to electronic communication. Consequently, there were closures and conversions in all regions in both the newsprint and printing-and-writing subsectors. Graphic-paper capacity in the UNECE region fell by 4.9 million tonnes in 2017 and is expected to decline by another 500,000 tonnes in 2018; production fell by 2.0 million tonnes in 2017. Globally, 5.8 million tonnes of graphic-paper capacity was removed from production indefinitely or permanently in 2017, and a further drop of 660,000 tonnes worldwide is expected in 2018 (Valois Vision Marketing, 2018a). North American newsprint capacity was 3.8 million tonnes in mid-2018, down by 3.1 million tonnes from 2014.
Rising fibre costs and successive capacity closures and conversions, along with consolidation in the graphic-paper sector, resulted in price increases in 2017 that had not been witnessed for several years due to chronic overcapacity and falling consumer demand. In addition, the imposition of import duties by the US Department of Commerce on uncoated mechanical and woodfree papers in 2015-2018 caused higher prices in the US market (US Department of Commerce, 2018).
Paperboard machine closures in the UNECE region amounted to 315,000 tonnes in 2017 after years of significant capacity rationalization and improved demand. Globally, closures reached 893,000 tonnes in 2017.
Paper and paperboard production increased moderately in the three subregions, with Europe showing the most significant growth of 1.2% in 2017 over the previous year (graph 7.1.2).
A Finnish state-of-the-art pulp mill capable of producing 1.3 million tonnes of softwood kraft annually – as well as an extensive range of bioproducts and 1.8 TWh of electricity per year – began operating in mid-2017. The investment was the first of its kind in the UNECE region in more than 20 years. Other than this new mill, pulp capacity remained unchanged in the UNECE region in 2017 – but continued to increase outside the region. In Brazil, a large bleached eucalyptus/softwood kraft line, with a production capacity of 1.95 million tonnes, started up in September 2017. Further expansions are expected in Brazil, Chile and Finland in coming years.
The expansion of woodpulp production in 2013-2018 was concentrated in hardwood grades because of their low
Note: f = 2017 Committee on Forests and the Forest Industry forecast.
Source: UNECE/FAO, 2018.
GRAPH 7.1.1
Apparent consumption of paper and paperboard, UNECE region, 2013-2018
0
40
80
120
160
200
85
90
95
100
105
110
115
2013 2014 2015 2016 2017 2018f
Mill
ion
tonn
es
Inde
x (2
013
= 10
0)
Europe North America CISindex index index
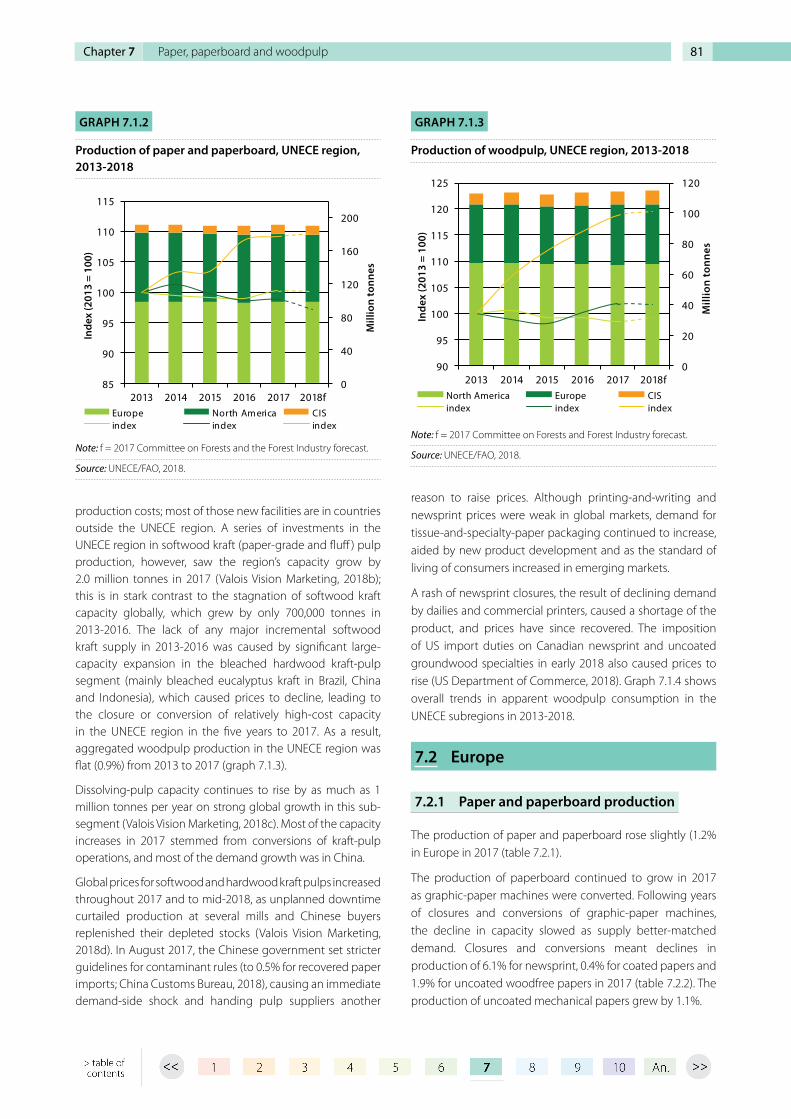
81Chapter 7 Paper, paperboard and woodpulp
production costs; most of those new facilities are in countries outside the UNECE region. A series of investments in the UNECE region in softwood kraft (paper-grade and fluff ) pulp production, however, saw the region’s capacity grow by 2.0 million tonnes in 2017 (Valois Vision Marketing, 2018b); this is in stark contrast to the stagnation of softwood kraft capacity globally, which grew by only 700,000 tonnes in 2013-2016. The lack of any major incremental softwood kraft supply in 2013-2016 was caused by significant large-capacity expansion in the bleached hardwood kraft-pulp segment (mainly bleached eucalyptus kraft in Brazil, China and Indonesia), which caused prices to decline, leading to the closure or conversion of relatively high-cost capacity in the UNECE region in the five years to 2017. As a result, aggregated woodpulp production in the UNECE region was flat (0.9%) from 2013 to 2017 (graph 7.1.3).
Dissolving-pulp capacity continues to rise by as much as 1 million tonnes per year on strong global growth in this sub-segment (Valois Vision Marketing, 2018c). Most of the capacity increases in 2017 stemmed from conversions of kraft-pulp operations, and most of the demand growth was in China.
Global prices for softwood and hardwood kraft pulps increased throughout 2017 and to mid-2018, as unplanned downtime curtailed production at several mills and Chinese buyers replenished their depleted stocks (Valois Vision Marketing, 2018d). In August 2017, the Chinese government set stricter guidelines for contaminant rules (to 0.5% for recovered paper imports; China Customs Bureau, 2018), causing an immediate demand-side shock and handing pulp suppliers another
reason to raise prices. Although printing-and-writing and newsprint prices were weak in global markets, demand for tissue-and-specialty-paper packaging continued to increase, aided by new product development and as the standard of living of consumers increased in emerging markets.
A rash of newsprint closures, the result of declining demand by dailies and commercial printers, caused a shortage of the product, and prices have since recovered. The imposition of US import duties on Canadian newsprint and uncoated groundwood specialties in early 2018 also caused prices to rise (US Department of Commerce, 2018). Graph 7.1.4 shows overall trends in apparent woodpulp consumption in the UNECE subregions in 2013-2018.
7.2 Europe
7.2.1 Paper and paperboard production
The production of paper and paperboard rose slightly (1.2% in Europe in 2017 (table 7.2.1).
The production of paperboard continued to grow in 2017 as graphic-paper machines were converted. Following years of closures and conversions of graphic-paper machines, the decline in capacity slowed as supply better-matched demand. Closures and conversions meant declines in production of 6.1% for newsprint, 0.4% for coated papers and 1.9% for uncoated woodfree papers in 2017 (table 7.2.2). The production of uncoated mechanical papers grew by 1.1%.
Note: f = 2017 Committee on Forests and the Forest Industry forecast.
Source: UNECE/FAO, 2018.
GRAPH 7.1.2
Production of paper and paperboard, UNECE region, 2013-2018
0
40
80
120
160
200
85
90
95
100
105
110
115
2013 2014 2015 2016 2017 2018f
Mill
ion
tonn
es
Inde
x (2
013
= 10
0)
Europe North America CISindex index index
Note: f = 2017 Committee on Forests and Forest Industry forecast.
Source: UNECE/FAO, 2018.
GRAPH 7.1.3
Production of woodpulp, UNECE region, 2013-2018
0
20
40
60
80
100
120
90
95
100
105
110
115
120
125
2013 2014 2015 2016 2017 2018f
Mill
ion
tonn
es
Inde
x (2
013
= 10
0)
North America Europe CISindex index index

UNECE/FAO Forest Products Annual Market Review, 2017-201882
Notes: f = 2017 Committee on Forests and the Forest Industry forecast. Figures for CEPI member countries (18 EU member countries plus Norway) differ slightly from those for the European subregion (39 countries, including Israel and Iceland).
Source: UNECE/FAO, 2018.
TABLE 7.2.1
Paper and paperboard balance, Europe, 2016-2018 (thousand tonnes)
2016 2017 2018fChange (%) 2016-2017
Production 97,663 98,870 98,820 1.2
Imports 56,928 56,590 56,422 -0.6
Exports 65,188 67,212 67,368 3.1
Apparent consumption
89,402 88,248 87,874 -1.3
Production Apparent consumption
2013 2016 2017 Change (%) 2016-2017 2013 2016 2017 Change (%)
2016-2017
Graphic papers 39,568 35,613 35,043 -1.6% 33,713 30,034 29,051 -3.3%
Newsprint 8,299 6,792 6,375 -6.1% 7,993 6,638 6,157 -7.3%
Uncoated mechanical 6,378 6,102 6,168 1.1% 4,973 4,482 4,731 5.6%
Uncoated wood-free 9,361 9,061 8,891 -1.9% 8,626 8,392 8,240 -1.8%
Coated papers 15,531 13,657 13,609 -0.4% 12,121 10,522 9,923 -5.7%
Sanitary and household papers 7,409 7,767 7,799 0.4% 7,295 7,764 7,767 0.0%
Packaging materials 47,569 50,353 52,008 3.3% 44,239 47,561 47,389 -0.4%
Case materials 27,915 29,130 30,211 3.7% 28,207 29,953 29,670 -0.9%
Cartonboard 10,217 11,153 11,542 3.5% 7,614 8,554 8,514 -0.5%
Wrapping papers 5,436 5,467 5,641 3.2% 4,688 4,661 4,807 3.1%
Other papers, mainly packaging
4,000 4,603 4,613 0.2% 3,729 4,393 4,398 0.1%
Other paper and board 4,109 3,929 4,020 2.3% 4,237 4,043 4,041 -0.1%
Total paper and paperboard 98,656 97,663 98,870 1.2% 89,485 89,402 88,248 -1.3%
TABLE 7.2.2
Production and apparent consumption of paper and paperboard, Europe, 2013, 2016 and 2017 (thousand tonnes)
Source: UNECE/FAO, 2018.
The production of sanitary and household papers edged higher (by 0.4%) in the European subregion in 2017, to 7.8 million tonnes, and the production of packaging grades increased by 3.3% (to 52.0 million tonnes) due to
Note: f = 2017 Committee on Forests and the Forest Industry forecast.
Source: UNECE/FAO, 2018.
GRAPH 7.1.4
Apparent consumption of woodpulp, UNECE region, 2013-2018
0
20
40
60
80
100
120
90
95
100
105
110
115
120
125
2013 2014 2015 2016 2017 2018f
Mill
ion
tonn
es
Inde
x (2
013
= 1
00)
Europe North America CISindex index index

83Chapter 7 Paper, paperboard and woodpulp
debottlenecking projects and conversions from newsprint to paperboard. The production of wrapping papers rose by 3.2% in 2017, to 5.6 million tonnes. The production of case materials increased by 3.7%, to 30.2 million tonnes, and cartonboard production grew by 3.5%, to 11.5 million tonnes.
Consolidation in the European paperboard subsector continued in 2017 and 2018 through several deals. Nevertheless, the subregion still lags behind the consolidation wave that hit North America in 2008-2014.
7.2.2 Paper and paperboard consumption and prices
The apparent consumption of paper and paperboard fell by 1.3% in Europe in 2017 (table 7.2.2) due to weaker economic performance and as end-users of graphic paper moved increasingly to electronic communication. The consumption of packaging materials declined by 0.4%, to 47.4 million tonnes, led by a drop of 0.9% in the consumption of case materials, to 29.7 million tonnes, and a decline of 0.5% in cartonboard consumption, to 8.5 million tonnes.
Europe’s apparent consumption of wrapping papers grew by 3.1% in 2017, to 4.8 million tonnes. Graphic-paper consumption was down by 3.3%, led by declines of 7.3% for newsprint and 5.7% for coated papers. The consumption of uncoated wood-free declined by 1.8% in 2017, but the consumption of uncoated mechanical rose by 5.6%. The consumption of sanitary and household papers was steady.
7.2.3 Market and integrated pulp production
Woodpulp production in Europe increased by 1.6% in 2017, to 39.3 million tonnes (table 7.2.3). Imports were up by 5.2%, to 21.8 million tonnes, due mainly to stronger demand for lower-cost hardwood kraft out of South America. The weaker euro
against the US dollar favoured exports, which rose by 3.1%, and apparent consumption grew by 2.8% to 46.4 million tonnes.
Softwood- and hardwood-based pulp prices rose in Europe throughout 2017 and to mid-2018 as the global supply–demand balance tightened following years of excess. Unplanned production downtime around the globe and China’s stricter contaminant rules on recovered-paper imports contributed to the change in market conditions and caused prices to rise. Demand was strong for tissue and certain packaging and specialty grades, but it was weaker for newsprint and for printing and writing.
7.2.4 Use of paper for recycling
The use of paper for recycling in member countries of the Confederation of European Paper Industries (CEPI)11 rose by 1.3% in 2017, to 48 million tonnes, and collection increased by 0.7%, to 56.8 million tonnes. Most of the increase was due to growth in the production capacity of packaging paper and board – which was up by 1.2% in Europe in 2017, to 50.2 million tonnes.
Exports of paper for recycling to non-CEPI countries increased by 0.8% in 2017, to 10.7 million tonnes. The volume going to Asian markets declined from 91.9% in 2016 to 89.4% in 2017 due to China’s stricter contaminant rules for imports.
Paper for recycling comprised 46.4% of the fibre used for papermaking in CEPI countries in 2017. Woodpulp accounted for another 40.1%, and the remainder (13.4%) comprised non-woodpulp and non-fibrous materials (CEPI, 2018).
11 Through its 18 member countries (17 EU members plus Norway), CEPI represents 495 pulp, paper and paperboard companies in Europe.
Note: f = 2017 Committee on Forests and the Forest Industry forecast.
Source: UNECE/FAO, 2018.
TABLE 7.2.3
Woodpulp balance, Europe, 2016-2018 (thousand tonnes)
2016 2017 2018fChange (%) 2016-2017
Production 38,695 39,324 39,324 1.6
Imports 20,710 21,781 21,719 5.2
Exports 14,306 14,754 14,754 3.1
Apparent consumption
45,099 46,351 46,289 2.8
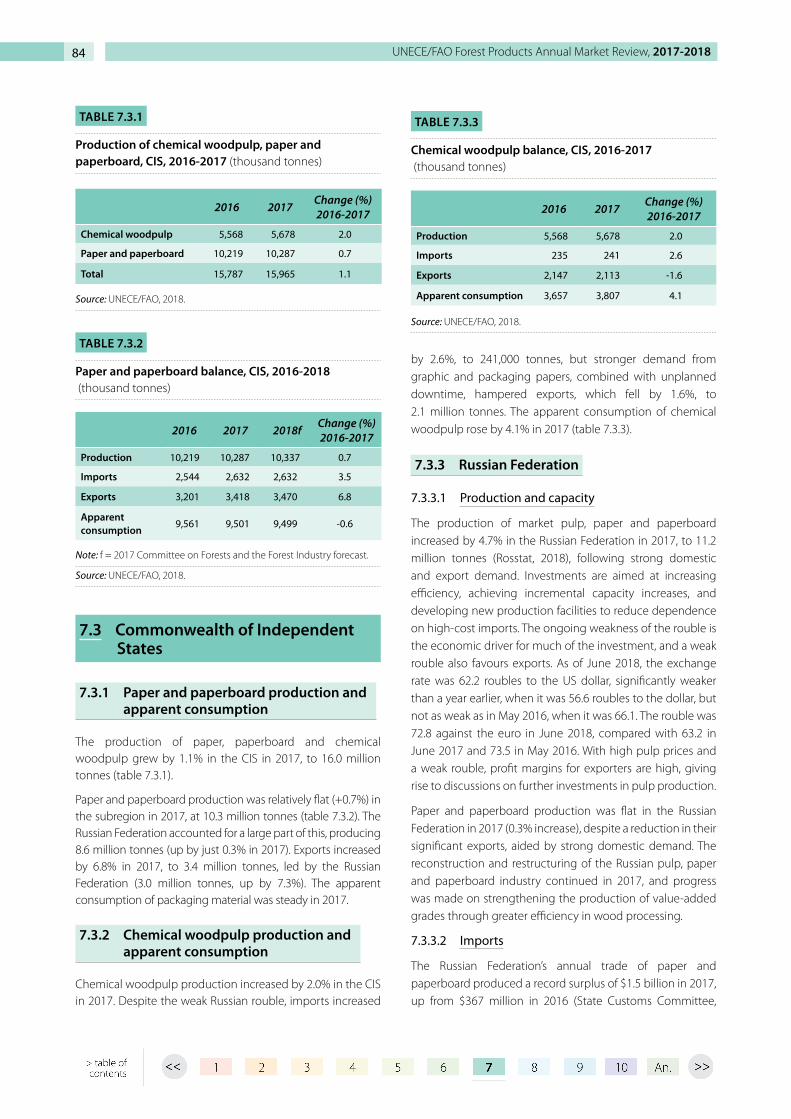
UNECE/FAO Forest Products Annual Market Review, 2017-201884
7.3 Commonwealth of Independent States
7.3.1 Paper and paperboard production and apparent consumption
The production of paper, paperboard and chemical woodpulp grew by 1.1% in the CIS in 2017, to 16.0 million tonnes (table 7.3.1).
Paper and paperboard production was relatively flat (+0.7%) in the subregion in 2017, at 10.3 million tonnes (table 7.3.2). The Russian Federation accounted for a large part of this, producing 8.6 million tonnes (up by just 0.3% in 2017). Exports increased by 6.8% in 2017, to 3.4 million tonnes, led by the Russian Federation (3.0 million tonnes, up by 7.3%). The apparent consumption of packaging material was steady in 2017.
7.3.2 Chemical woodpulp production and apparent consumption
Chemical woodpulp production increased by 2.0% in the CIS in 2017. Despite the weak Russian rouble, imports increased
by 2.6%, to 241,000 tonnes, but stronger demand from graphic and packaging papers, combined with unplanned downtime, hampered exports, which fell by 1.6%, to 2.1 million tonnes. The apparent consumption of chemical woodpulp rose by 4.1% in 2017 (table 7.3.3).
7.3.3 Russian Federation
7.3.3.1 Production and capacity
The production of market pulp, paper and paperboard increased by 4.7% in the Russian Federation in 2017, to 11.2 million tonnes (Rosstat, 2018), following strong domestic and export demand. Investments are aimed at increasing efficiency, achieving incremental capacity increases, and developing new production facilities to reduce dependence on high-cost imports. The ongoing weakness of the rouble is the economic driver for much of the investment, and a weak rouble also favours exports. As of June 2018, the exchange rate was 62.2 roubles to the US dollar, significantly weaker than a year earlier, when it was 56.6 roubles to the dollar, but not as weak as in May 2016, when it was 66.1. The rouble was 72.8 against the euro in June 2018, compared with 63.2 in June 2017 and 73.5 in May 2016. With high pulp prices and a weak rouble, profit margins for exporters are high, giving rise to discussions on further investments in pulp production.
Paper and paperboard production was flat in the Russian Federation in 2017 (0.3% increase), despite a reduction in their significant exports, aided by strong domestic demand. The reconstruction and restructuring of the Russian pulp, paper and paperboard industry continued in 2017, and progress was made on strengthening the production of value-added grades through greater efficiency in wood processing.
7.3.3.2 Imports
The Russian Federation’s annual trade of paper and paperboard produced a record surplus of $1.5 billion in 2017, up from $367 million in 2016 (State Customs Committee,
Source: UNECE/FAO, 2018.
TABLE 7.3.1
Production of chemical woodpulp, paper and paperboard, CIS, 2016-2017 (thousand tonnes)
2016 2017Change (%) 2016-2017
Chemical woodpulp 5,568 5,678 2.0
Paper and paperboard 10,219 10,287 0.7
Total 15,787 15,965 1.1
Note: f = 2017 Committee on Forests and the Forest Industry forecast.
Source: UNECE/FAO, 2018.
TABLE 7.3.2
Paper and paperboard balance, CIS, 2016-2018 (thousand tonnes)
2016 2017 2018fChange (%) 2016-2017
Production 10,219 10,287 10,337 0.7
Imports 2,544 2,632 2,632 3.5
Exports 3,201 3,418 3,470 6.8
Apparent consumption
9,561 9,501 9,499 -0.6
Source: UNECE/FAO, 2018.
TABLE 7.3.3
Chemical woodpulp balance, CIS, 2016-2017 (thousand tonnes)
2016 2017Change (%) 2016-2017
Production 5,568 5,678 2.0
Imports 235 241 2.6
Exports 2,147 2,113 -1.6
Apparent consumption 3,657 3,807 4.1

85Chapter 7 Paper, paperboard and woodpulp
2018). Russian imports of paper and paperboard were worth $2.1 billion in 2017, up by 0.8% from 2016.
7.3.3.3 Exports
Higher pulp prices generated a 12% increase in export revenues in 2017, at $1.1 billion (State Customs Committee, 2018), even though pulp export volumes dropped by 1.8%, to 2.0 million tonnes. Exports of paper and paperboard soared by 47.4% in 2017 to a record $3.6 billion. A weaker rouble made the export of pulp, paper and paperboard very lucrative.
Chinese pulp demand accounted for 80% of incremental volumes traded globally in 2017; the Russian Federation has a strategically advantageous geographical position for serving the Chinese market (Valois Vision Marketing, 2018f ).
The major export destinations in 2017 for Russian pulp, paper and paperboard continued to be China, India, Ireland and Turkey. China received 70% of the Russian Federation’s exports of market pulp (State Customs Committee, 2018).
7.4 North America
7.4.1 Production and apparent consumption
North America’s production of paper and paperboard was flat in 2017 (+0.1%), at 81.9 million tonnes (table 7.4.1). Higher
production levels in packaging materials and sanitary and household papers were offset by the continued closure of high-cost capacity in the graphic-paper segment.
North America’s apparent consumption of paper and paperboard continued its longstanding downward trend in 2017, declining by 0.6% to 75.2 million tonnes (table 7.4.1).
Paper-and-paperboard imports declined by 0.3% in North America in 2017 due to the imposition of antidumping import duties on cut-size office and copy paper and on uncoated
Note: f = 2017 Committee on Forests and the Forest Industry forecast.
Source: UNECE/FAO, 2018.
TABLE 7.4.1
Paper and paperboard balance, North America, 2016-2018 (thousand tonnes)
2016 2017 2018fChange (%) 2016-2017
Production 81,813 81,912 80,605 0.1
Imports 12,123 12,087 12,063 -0.3
Exports 18,335 18,818 18,124 2.6
Apparent consumption
75,602 75,181 74,545 -0.6
Sources: UNECE/FAO, 2018.
TABLE 7.4.2
Production and apparent consumption of paper and paperboard, North America, 2013, 2016 and 2017 (thousand tonnes)
Production Apparent consumption
2013 2016 2017Change (%) 2016-2017
2013 2016 2017Change (%) 2016-2017
Graphic papers 25,377 22,227 20,772 -6.5 23,753 21,635 20,108 -7.1
Newsprint 6,442 4,827 4,251 -11.9 4,177 3,312 2,860 -13.7
Uncoated mechanical 3,790 3,228 2,905 -10.0 3,827 3,321 2,918 -12.1
Uncoated wood-free 8,539 8,428 8,175 -3.0 8,536 8,554 8,153 -4.7
Coated papers 6,605 5,744 5,442 -5.3 7,213 6,447 6,177 -4.2
Sanitary and household papers 7,560 7,578 7,637 0.8 7,672 7,770 7,793 0.3
Packaging materials 46,933 50,248 51,747 3.0 40,708 44,680 45,820 2.6
Case materials 33,337 34,314 35,553 3.6 29,389 30,162 31,043 2.9
Cartonboard 7,172 11,908 12,200 2.5 5,516 10,799 11,179 3.5
Wrapping papers 3,242 1,741 1,745 0.2 2,622 1,489 1,409 -5.4
Other papers, mainly packaging 3,181 2,286 2,248 -1.6 3,182 2,229 2,189 -1.8
Other paper and board 3,037 1,759 1,755 -0.2 2,821 1,518 1,460 -3.8
TOTAL PAPER AND PAPERBOARD 82,906 81,813 81,912 0.1 74,954 75,602 75,181 -0.6
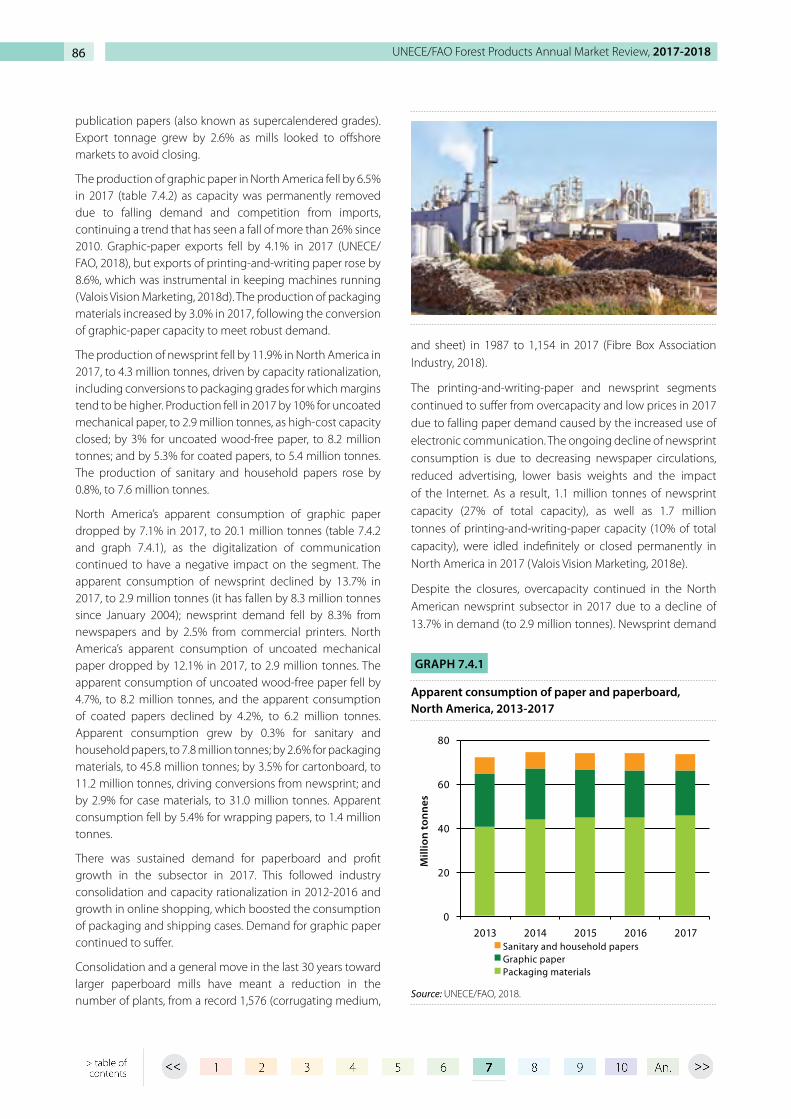
UNECE/FAO Forest Products Annual Market Review, 2017-201886
publication papers (also known as supercalendered grades). Export tonnage grew by 2.6% as mills looked to offshore markets to avoid closing.
The production of graphic paper in North America fell by 6.5% in 2017 (table 7.4.2) as capacity was permanently removed due to falling demand and competition from imports, continuing a trend that has seen a fall of more than 26% since 2010. Graphic-paper exports fell by 4.1% in 2017 (UNECE/FAO, 2018), but exports of printing-and-writing paper rose by 8.6%, which was instrumental in keeping machines running (Valois Vision Marketing, 2018d). The production of packaging materials increased by 3.0% in 2017, following the conversion of graphic-paper capacity to meet robust demand.
The production of newsprint fell by 11.9% in North America in 2017, to 4.3 million tonnes, driven by capacity rationalization, including conversions to packaging grades for which margins tend to be higher. Production fell in 2017 by 10% for uncoated mechanical paper, to 2.9 million tonnes, as high-cost capacity closed; by 3% for uncoated wood-free paper, to 8.2 million tonnes; and by 5.3% for coated papers, to 5.4 million tonnes. The production of sanitary and household papers rose by 0.8%, to 7.6 million tonnes.
North America’s apparent consumption of graphic paper dropped by 7.1% in 2017, to 20.1 million tonnes (table 7.4.2 and graph 7.4.1), as the digitalization of communication continued to have a negative impact on the segment. The apparent consumption of newsprint declined by 13.7% in 2017, to 2.9 million tonnes (it has fallen by 8.3 million tonnes since January 2004); newsprint demand fell by 8.3% from newspapers and by 2.5% from commercial printers. North America’s apparent consumption of uncoated mechanical paper dropped by 12.1% in 2017, to 2.9 million tonnes. The apparent consumption of uncoated wood-free paper fell by 4.7%, to 8.2 million tonnes, and the apparent consumption of coated papers declined by 4.2%, to 6.2 million tonnes. Apparent consumption grew by 0.3% for sanitary and household papers, to 7.8 million tonnes; by 2.6% for packaging materials, to 45.8 million tonnes; by 3.5% for cartonboard, to 11.2 million tonnes, driving conversions from newsprint; and by 2.9% for case materials, to 31.0 million tonnes. Apparent consumption fell by 5.4% for wrapping papers, to 1.4 million tonnes.
There was sustained demand for paperboard and profit growth in the subsector in 2017. This followed industry consolidation and capacity rationalization in 2012-2016 and growth in online shopping, which boosted the consumption of packaging and shipping cases. Demand for graphic paper continued to suffer.
Consolidation and a general move in the last 30 years toward larger paperboard mills have meant a reduction in the number of plants, from a record 1,576 (corrugating medium,
and sheet) in 1987 to 1,154 in 2017 (Fibre Box Association Industry, 2018).
The printing-and-writing-paper and newsprint segments continued to suffer from overcapacity and low prices in 2017 due to falling paper demand caused by the increased use of electronic communication. The ongoing decline of newsprint consumption is due to decreasing newspaper circulations, reduced advertising, lower basis weights and the impact of the Internet. As a result, 1.1 million tonnes of newsprint capacity (27% of total capacity), as well as 1.7 million tonnes of printing-and-writing-paper capacity (10% of total capacity), were idled indefinitely or closed permanently in North America in 2017 (Valois Vision Marketing, 2018e).
Despite the closures, overcapacity continued in the North American newsprint subsector in 2017 due to a decline of 13.7% in demand (to 2.9 million tonnes). Newsprint demand
Source: UNECE/FAO, 2018.
GRAPH 7.4.1
Apparent consumption of paper and paperboard, North America, 2013-2017
0
20
40
60
80
2013 2014 2015 2016 2017
Mill
ion
tonn
es
Sanitary and household papersGraphic paperPackaging materials

87Chapter 7 Paper, paperboard and woodpulp
was down by 9.2% in the first four months of 2018 vs. the
same period of 2017.
North American tissue (sanitary and household papers)
production was flat in 2017, at 7.6 million tonnes. Tissue
capacity is forecast to remain steady in North America in the
short term as the industry consolidates following a period
of strong growth. Producers are looking to reduce costs,
including by consolidating manufacturing operations, while
investing in premium sanitary products.
Domestic North American demand for graphic paper
continued to decline (-7.1%) in 2017. Apparent consumption
has fallen by 3.6 million tonnes since 2013, to 20.1 million
tonnes in 2017, the result of growth in electronic media for
data transmission and information dissemination and lower
budgets for print.
The production of chemical woodpulp was flat (down by
0.2%) in North America in 2017 (graph 7.4.2), despite an
increase in capacity of 11.6% in the segment via conversions
and debottlenecking projects, as well as swing capacity from
graphic grades among integrated mills; the main reason for
the minimal increase in production was unplanned downtime
across all grades. Demand from sanitary and household
papers continued to grow, and exports strengthened. The
apparent consumption and import of chemical pulp was flat
(0.1% and 0.3% respectively) in 2017).
Woodpulp production was 66.1 million tonnes in North
America in 2017, a drop of 0.7% caused by minor closures of
high-cost capacity in the hardwood kraft sector.
7.5 Extraregional influences affecting the UNECE region
7.5.1 South America
7.5.1.1 Brazil
Brazil produced 19.5 million tonnes of pulp (integrated and market pulp) and 10.5 million tonnes of paper and paperboard in 2017, up by 3.8% and 1.4% respectively (tables 7.5.1 and 7.5.2). The country’s pulp production increase was due to the start-up of yet another new pulp line and the final ramp-up of an expansion project.
Dissolving-pulp production grew in Brazil in 2017 due to a major capacity conversion from paper-grade kraft pulping. Additional capacity is expected in 2018 due to greenfield mills (Valois Vision Marketing, 2018c).
Brazil exported 13.2 million tonnes of pulp in 2017, which was 67.7% of the country’s total production (table 7.5.1). This export volume was 2.3% higher than in 2016, when
Source: UNECE/FAO, 2018.
GRAPH 7.4.2
Production of chemical woodpulp, North America, 2009-2017
54
55
56
57
58
59
60
2009 2010 2011 2012 2013 2014 2015 2016 2017
Mill
ion
tonn
es
Source: Ibá, 2018.
TABLE 7.5.1
Woodpulp balance, Brazil, 2016-2017 (thousand tonnes)
2016 2017 Change (%) 2016-2017
Production 18,773 19,492 3.8
Exports 12,901 13,199 2.3
Imports 356 211 -40.9
Apparent consumption
6,228 6,504 4.4
Source: Ibá, 2018.
TABLE 7.5.2
Paper and paperboard balance, Brazil, 2016-2017 (thousand tonnes)
2016 2017 Change (%) 2016-2017
Production 10,335 10,477 1.4
Domestic sales 5,429 5,466 0.7
Exports 2,103 2,114 0.5
Imports 668 758 10.2
Apparent consumption
8,920 9,121 2.3

UNECE/FAO Forest Products Annual Market Review, 2017-201888
12.9 million tonnes (68.7% of that year’s production) were
exported (Ibá, 2018).
Unlike pulp, most paper and paperboard produced in Brazil
is consumed internally. Exports accounted for 20.2% of
production in 2017, down marginally from 20.3% in 2016
(table 7.5.2).
Pulp imports fell by 40.9% in 2017, due mainly to higher
domestic production of specialty fluff pulp and the Brazilian
government’s imposition of import duties on fluff pulp from
the US (table 7.5.2).
7.5.1.2 Chile
Chile’s exports of pulp, paper and paperboard fell by 3.1% in
2017 (table 7.5.4), due mainly to strikes at key ports and in
the transportation sector, which reduced wood deliveries to
pulp mills. Despite a surge in demand from China in 2017,
Chile’s aggregate pulp exports fell by 3.5%; on the other
hand, newsprint exports rose by 1.3% due to paper-machine
closures and conversions to paperboard in Europe and North
America. Chile’s paperboard exports edged lower (by 0.3%)
in 2017.
Chilean bleached radiata pine pulp exports fell by 8.9% in 2017 (table 7.5.3), due mainly to port and transportation strikes in Constitución, a major production centre for this grade. Unbleached radiata pine pulp exports increased by 6.2% due to strong Asian demand, but total pulp exports fell by 3.4%.
Chile’s dissolving-pulp capacity is set to increase in coming years due to a conversion at a major paper-grade kraft-pulp operation (Valois Vision Marketing, 2018c).
7.5.2 Asia
7.5.2.1 China
China’s economic growth rebounded in 2017, and exports of pulp, paper and imported recovered fibres were stronger and at higher prices. A ban on mixed-paper imports and strict enforcement of a new limit of 0.5% on contaminants in other recovered fibres caused a decline in import permits in 2018 of as much as 20% (5.6 million tonnes) (China Customs Bureau, 2018). The uncertainty around the changes, however, meant a drop in actual tonnes of nearly 50% in early 2018, thus pushing up demand for imported virgin pulps. This caused pulp prices to rise in 2017 and early 2018; prices have remained high, as of mid-2018.
China’s pulp production rose by 0.3% in 2017 (table 7.5.4) as imported pulp prices jumped by as much as 50% (Valois Vision Marketing, 2018f ).
China’s apparent consumption of woodpulp rose by 2.6% in 2017, driven mainly by growth in tissue and specialty-paper production. China’s overall paper and paperboard production increased by 2.5% as several new tissue and specialty-paper machines started up (Valois Vision Marketing, 2018d). The country’s apparent consumption of paper and paperboard grew by 4.6% in 2017, with stronger demand from the packaging, tissue and printing-and-writing segments. The only decline was in newsprint production due to closures and conversions to packaging grades. Significant investment continues to be made in the industry, with tissue machines leading the field. Several tissue-machine expansions were announced in 2017 and early 2018.
China’s kraft-pulp imports reached a record 19.2 million tonnes in 2017, up by 13% over 2016 due to stronger domestic consumption and rising prices. Mechanical-pulp imports were 3.7% higher, at 1.8 million tonnes. China’s total pulp imports grew by 12.6% in 2017, to 23.7 million tonnes (table 7.5.5).
China’s recovered-paper imports fell by 8.4% in 2017, to 26.1 million tonnes, as customs officials enforced quality controls (table 7.5.6) (Valois Vision Marketing, 2018f ).
The Chinese government imposed stricter rules on the levels of contaminants permitted in recovered paper in July 2017.
Source: Infor, 2018.
TABLE 7.5.3
Pulp, paper and paperboard exports, Chile, 2016-2017 (thousand tonnes)
2016 2017 Change (%) 2016-2017
Bleached radiata kraft 2,083 1,898 -8.9
Bleached eucalyptus kraft
2,144 2,142 -0.1
Unbleached radiata kraft
426 452 6.2
Newsprint paper 57 57 1.3
Paperboard 467 468 0.3

89Chapter 7 Paper, paperboard and woodpulp
Import permits for old corrugated medium, old newsprint, pulp substitutes, deinked pulp and mixed paper are being issued under strictly enforced rules, causing a decline in volumes.
An estimated 41% of Chinese recovered-paper imports were sourced from the US in 2017 (US Census Bureau, 2018) (table
8.5.6). This was less than in 2016 because of a crackdown on contaminant levels by customs agents. Correspondingly, the proportion of US recovered-paper exports going to China fell from 66.9% in 2016 to 59.1% in 2017 due to tonnages at risk of failing the contaminant criteria.
7.6 Conclusions
In 2017, the pulp, paper and paperboard industry in the UNECE region benefited from capacity rationalization and cost-cutting measures brought on by changing consumption patterns and competitive forces worldwide. Emerging economies in Asia and South America are proving to be formidable sources of low-cost fibre, challenging long-established producers. Demand continued to grow strongly in Asia and especially China, presenting export opportunities for pulp, paper and paperboard producers in the UNECE region.
A rapidly changing global business landscape facilitated by the Internet and online shopping has spurred the paperboard segment. On the other hand, the same trend towards electronic communication has reduced demand for printing-and-writing papers and newsprint.
Improved standards of living in emerging markets continue to generate strong demand growth for sanitary and household products. This has spurred investment in new tissue machines globally that amounted to more than 2.6 million tonnes in 2017, a 5.6% increase in capacity.
The development of new dissolving pulps and the growth of downstream products in the consumer and industrial sectors of the global economy are facilitating huge investments in capacity in the UNECE region and beyond.
Profitability returned to much of the pulp segment of the industry in 2017, aided by responsible supply management (and bouts of significant unplanned downtime, which continued into 2018). Profitability was challenging in the graphic-paper segment in 2017 due to the higher cost of raw materials (fibre, chemicals and energy); nevertheless, rationalization via consolidation, including machine closures, has enabled producers to navigate highly competitive waters in this turbulent time for the industry.
Challenges facing the industry in the UNECE region include industry consolidation, ongoing cost-cutting initiatives, and investments in new products and niche markets, all while managing a rise in global trade tensions.
Note: The statistical annex of the Forest Products Annual Market Review 2017-2018 is available at:
www.unece.org/fpamr2018-annex
Source: China Paper Association, 2018.
TABLE 7.5.4
Production and apparent consumption of pulp, paper and paperboard, China, 2017 (thousand tonnes)
Production Apparent consumption
2017Change (%) 2016-2017
2017Change (%) 2016-2017
Pulp 79,490 0.3 100,510 2.6
Paper and paperboard
111,300 2.5 108,970 4.6
Source: China Customs Bureau, 2018.
TABLE 7.5.5
Pulp imports, China, 2016-2017 (thousand tonnes)
2016 2017 Change (%) 2016-2017
Kraft 17,025 19,242 13.0
Mechanical 1,732 1,796 3.7
Dissolving 2,246 2,603 15.9
Other 67 84 23.8
Total 21,071 23,725 12.6
Sources: China Customs Bureau, 2018; US Census Bureau, 2018.
TABLE 7.5.6
Recovered-paper imports, China, 2016-2017 (million tonnes)
2016Share (%) of total
2017 Share (%) of total
Imports into China 28.5 100 26.1 100
Of which from the US 13.2 46.4 10.8 41.4
US exports 19.7 100 18.3 100
Of which to China 13.2 66.9 10.8 59.1

UNECE/FAO Forest Products Annual Market Review, 2017-201890
7.7 References
CEPI. 2018. CEPI preliminary statistics 2017. Confederation of European Paper Industries (CEPI). Available at: www.cepi.org
China Customs Bureau. 2018. Pulp imports. Available at: www.chinacustomsstat.com
China Paper Association. 2018. Available at: http://enchinappi.org
Fibre Box Association Industry. 2018. Annual report. Available at: www.fibrebox.org
Ibá. 2018. Associação Brasileira de Celulose e Papel (Ibá). Available at: www.iba.org/pt/dados-e-estatisticas/cenarios-iba
Infor. 2018. Chilean customs data. Available at: www.infor.cl
Rosstat. 2018. Federal Service of State Statistics (Rosstat). Available at: www.gks.ru/wps/wcm/connect/rosstat_main/rosstat/en/main/
State Customs Committee. 2018. PPB-express, PPB exports, PPB imports. Pulp, Paper, Board magazine. Russian Association of Pulp and Paper Organizations and Enterprises (RAO Bumprom). Available at: www.bumprom.ru/
UNECE/FAO. 2018. TIMBER database 2017-2018. Available at: www.unece.org/forests/fpm/onlinedata
US Census Bureau. 2018. Available at: www.census.gov
US Department of Commerce. 2018. Available at: www.commerce.gov
Valois Vision Marketing. 2018a. Paper machine closures database. Available at: www.valoisvision.com
Valois Vision Marketing. 2018b. Supply-demand analysis. Available at: www.valoisvision.com
Valois Vision Marketing. 2018c. Dissolving capacity & expansions. Available at: www.valoisvision.com
Valois Vision Marketing. 2018d. Flash report. Available at: www.valoisvision.com
Valois Vision Marketing. 2018e. Pulp mill closures & conversion study 2017. Available at: www.valoisvision.com
Valois Vision Marketing. 2018f. China study. Available at: www.valoisvision.com

91Chapter 7 Paper, paperboard and woodpulp
91

Chapter 8
WOOD ENERGY MARKETS
Lead author: Francisco X. Aguilar
Contributing authors: Karen Abt, Vladimir Dmitriev, Branko Glavonjić,
Warren Mabee, Houston Sudekum, Oleg Vasilyev

93Chapter 8 Wood energy markets
Highlights
Most recent data for the EU28 show a small increase in primary production from “solid biofuels (excluding charcoal)” in 2016, to 3,941 PJ.
EU28 imports of wood pellets from North America and the Russian Federation continued to grow in 2017, as did internal trade. EU28 imports from outside the subregion amounted to 8.7 million tonnes and internal trade was 7.3 million tonnes.
Wood pellet prices increased significantly in 2017 and early 2018, due partly to increased demand in the UK, Denmark and the Netherlands. Spot prices for industrial wood pellets at Amsterdam, Rotterdam and Antwerp grew by more than 50% in the 12 months to January 2018.
Approval of projects in the Dutch sustainable energy production incentive scheme (SDE+), and continued demand in the UK, are expected to drive future growth in European demand for industrial wood pellets for power generation.
Firewood production increased by 17% in the Western Balkans in 2017, reaching a new record of almost 25 million m3. Firewood prices (stacked cubic metre) increased in that subregion from about €20 in 2015 to €60 at the beginning of 2018.
Wood pellet production in the Russian Federation grew by an estimated 20% in 2017, to 1.3 million tonnes. Most production was in the northwest and Siberian regions.
Exports of wood pellets from the Russian Federation grew by 34% in 2017, with many companies becoming certified for quality standard (EN plus) and sustainability (SPB).
Wood energy use was steady in Canada in 2017, but there was a slight decline in wood pellet production due to challenging economics in the wood energy sector. Canada’s carbon pricing strategy and Clean Fuels Standard will likely spur developments in the sector.
The US consumed 2,262 PJ of wood energy in 2017, with only small changes projected through 2019. US exports of wood pellets reached a new high of 5.2 million metric tonnes in 2017, mostly to the UK.
Beyond the UNECE region, expected growth in demand for wood pellets in Japan and the Republic of Korea represents a great opportunity to expand production.
The UNECE/FAO Forestry and Timber Section published a study on wood energy in the UNECE region in early 2018.

UNECE/FAO Forest Products Annual Market Review, 2017-201894
8.1 Introduction
Overall wood energy consumption changed little in 2017; the main year-on-year differences in the sector were associated with prices.
The slower-than-expected expansion of production capacity, combined with greater demand and higher fossil-fuel prices, contributed to a trend that is carrying into 2018. Wood pellet prices increased significantly in 2017 and early 2018, due partly to increased UK, Danish and Dutch demand, production issues in the Russian Federation, fires in Portugal, and relatively low year-on-year growth in installed production capacity (Tovey-Fall, 2018). Global demand for wood pellets was flat in 2017. Higher fossil-fuel prices and continued interest in replacing older commercial and residential heating units, upgrading existing district heating units and replacing coal-fuelled power plants with biofuels are expected to spur new demand.
Some analysts expect wood pellet demand to reach 45 million tonnes by 2025 for power generation and 24 million tonnes for heating in the residential and commercial sectors (Strauss and Walker, 2018). This would mean an increase in pellet consumption above 2017 volumes of about 15 million tonnes for power generation and 14 million tonnes for heating (Strauss and Walker, 2018).
8.2 Europe
8.2.1 Consumption and production
Primary energy production in the EU28 derived from “solid biofuels (excluding charcoal)” was 3,941 PJ in 2016, up by 2.5% from 2015 (Eurostat, 2018b). Total primary energy production from solid biofuels in the EU28 grew by 36% in the ten years from 2006 to 2016. The percentage of imports in total primary energy production from solid biofuels was 8.5% in 2016 (graph8.2.1).
European wood pellet production capacity was estimated at about 24.5 million tonnes per year, as of 2016 (AEBIOM, 2018 Hawkins Wright, 2018). Europe-wide, co- and by-products from the primary wood products industry (e.g. sawdust and shavings) constitute about 85% of the input materials used to make wood pellets (AEBIOM, 2018). More than 80% of the fibres used to manufacture wood pellets come from softwood species (AEBIOM, 2018). European pellet demand topped 24.2 million tonnes in 2018 (table 8.2.1), of which an estimated 13.4 million tonnes will be consumed for heating (Tovey-Fall, 2018).
Italy, Germany, Denmark and Sweden are the leading consumers of wood pellets for heating. Europe’s demand for
industrial wood pellets was a strong 10.7 million tonnes in 2016, and it is expected to exceed 16 million tonnes per year by 2021 (AEBIOM, 2018; Hawkins Wright, 2018). Capacity for power generation from wood pellets in Europe is forecast to more than double from the current level to about 8,000 MW by 2020. Growth will be driven by capacity expansion in the Netherlands and the UK. The qualification of four projects in the Netherlands for the country’s sustainable energy production incentive scheme (SDE+) feed-in tariffs in 2016 could translate into new demand for industrial wood pellets in excess of 3.2 million tonnes per year (Tovey-Fall, 2018). The UK’s demand for industrial wood pellets is driven largely by Drax biomass conversions to generate biopower: Drax’s demand for wood pellets was 6.8 million tonnes in 2017 (Drax, 2018).
0%
2%
4%
6%
8%
10%
0
1000
2000
3000
4000
Shar
e of
impo
rts
PJsolid biofuels % imports
Note: Excluding charcoal.
Source: Eurostat, 2018b.
GRAPH 8.2.1
Total EU28 primary energy production from solid biofuels, and share of imports, 2006-2016
TABLE 8.2.1
Wood pellet balance, Europe, 2016-2018 (thousand m3)
Note: f = 2017 Committee on Forests and the Forest Industry forecast.
Source: UNECE/FAO, 2018.
2016 2017 2018f Change (%) 2016-2017
Production 15,523 16,369 16,931 5.4
Imports 13,966 14,582 14,805 4.4
Exports 7,151 7,596 7,517 6.2
Apparent consumption
22,339 23,355 24,218 4.6

95Chapter 8 Wood energy markets
Wood energy consumption in the Western Balkans12 reached 206.9 PJ in 2017, up by 2% from 2016. Growth is associated with the replacement of oil and coal heaters by households, public and commercial facilities, and the food industry. Wood pellets had the highest growth in consumption, at 19% in 2017, with a record 884,600 tonnes consumed. Serbia has become a major wood pellet consumer, at 262,000 tonnes in 2017, followed by Bosnia and Herzegovina (232,000 tonnes) and Slovenia (165,000 tonnes) (Glavonjić, 2018). Firewood production increased by 17% in the Western Balkans in 2017, reaching a new record of almost 25 million m3.
The consumption of wood chips also continued to increase in the Western Balkans in 2017, reaching 696,000 tonnes, driven by demand from biopower plants in Croatia and from district heating systems in Bosnia and Herzegovina. Croatia is the main wood-chip consumer, at almost 270,000 tonnes, which is 39% of total consumption in the Western Balkans (Glavonjić, 2018). The largest district heating plant in the region using wood chips started operating in Bosnia and Herzegovina in 2017; it has an installed capacity of 49 megawatts thermal (Mwth) and will consume about 80,000 tonnes of wood chips per year.
8.2.2 Prices
Argus Media (2018) reported that cost, insurance and freight (CIF) spot prices for industrial wood pellets at Amsterdam, Rotterdam and Antwerp increased steadily in 2017 and through to May 2018 (graph 8.2.2), with growth highest (above 50%, year-on-year) in January 2018. Hawkins Wright (2018) attributed the upward trend in prices to upcoming new sources of industrial demand and reduced growth in pellet capacity.
Low oil prices have challenged the financial feasibility of wood energy, but recent price increases have improved
12 The Western Balkans comprises Albania, Bosnia and Herzegovina, Croatia, The former Yugoslav Republic of Macedonia, Montenegro and Serbia.
competitiveness. Hawkins Wright (2018) suggested, for
example, that wood pellets were, on average, 8% cheaper
than heating-oil in Germany in the second half of 2017 and
in early 2018.
Firewood prices have increased in all countries in the Western
Balkans since 2016. In Albania, a ten-year ban on logging went
into effect in 2016, causing firewood prices there to increase
rapidly in 2017. Market prices for firewood increased three-
fold in the Western Balkans, from about €20 per stacked m3 in
2015 to around €60 at the beginning of 2018. Market prices
for wood pellets in the Western Balkans were €206-212 per
tonne (including valued-added tax) at end December 2017.
8.2.3 Trade
EU28 imports of wood pellets from outside the subregion
(HS code 440131) reached 8.7 million tonnes in 2017, up from
8.1 million tonnes in 2016. Imports of wood pellets within
the EU28 were estimated at 7.3 million tonnes in 2017, up
substantially from 6.1 million tonnes in 2016 (Eurostat, 2018a)
(graph 8.2.3).
Exports of wood energy from Western Balkan countries
increased by 10.8% in 2017, to 44.2 PJ. Firewood accounted
for 44% (by volume) of wood energy feedstock exports,
followed by wood pellets (26%) and wood chips (18%).
Western Balkan countries exported 2.15 million m3 of
firewood, 777,000 tonnes of wood chips and 677,000 tonnes
of wood pellets in 2017 (Glavonjić, 2018).
-40%
-30%
-20%
-10%
0%
10%
20%
30%
40%
50%
60%
100
110
120
130
140
150
160
170
180
$/to
nne
$/tonne Annual % change
Note: Spot CIF prices within 90 days.
Source: Argus Media, 2018.
GRAPH 8.2.2
Wood pellet prices at Amsterdam, Rotterdam and Antwerp, January 2017-May 2018
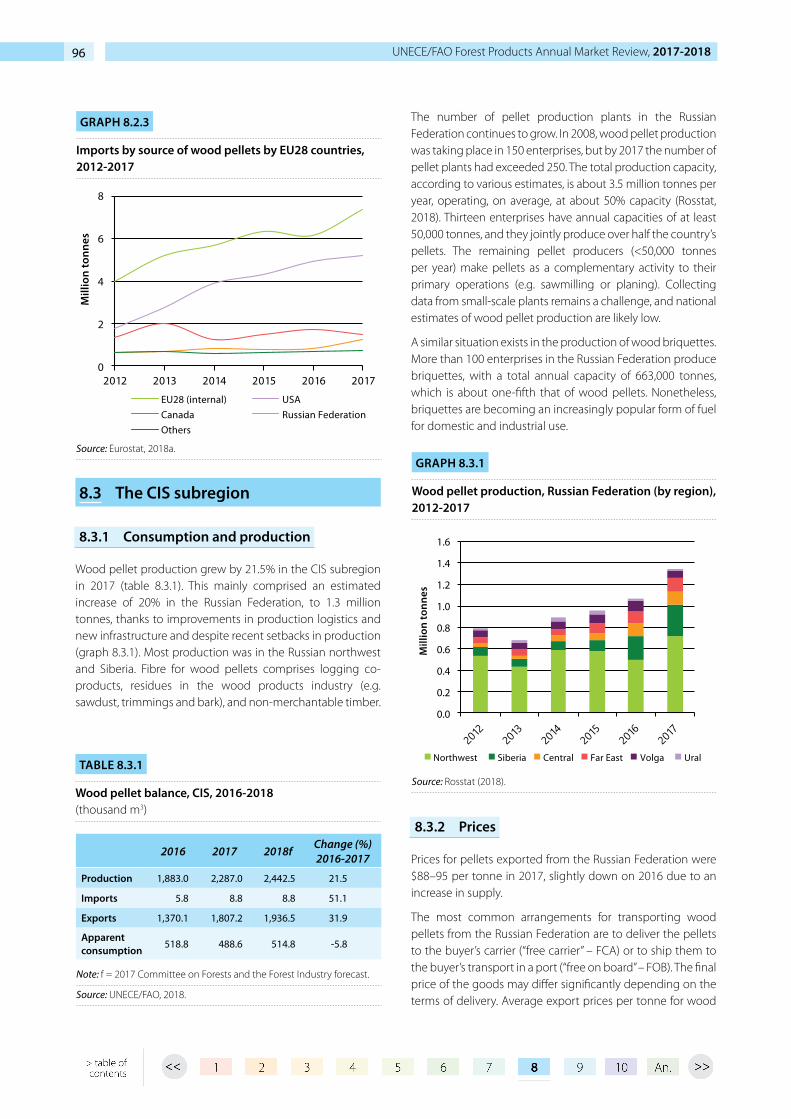
UNECE/FAO Forest Products Annual Market Review, 2017-201896
8.3 The CIS subregion
8.3.1 Consumption and production
Wood pellet production grew by 21.5% in the CIS subregion in 2017 (table 8.3.1). This mainly comprised an estimated increase of 20% in the Russian Federation, to 1.3 million tonnes, thanks to improvements in production logistics and new infrastructure and despite recent setbacks in production (graph 8.3.1). Most production was in the Russian northwest and Siberia. Fibre for wood pellets comprises logging co-products, residues in the wood products industry (e.g. sawdust, trimmings and bark), and non-merchantable timber.
The number of pellet production plants in the Russian Federation continues to grow. In 2008, wood pellet production was taking place in 150 enterprises, but by 2017 the number of pellet plants had exceeded 250. The total production capacity, according to various estimates, is about 3.5 million tonnes per year, operating, on average, at about 50% capacity (Rosstat, 2018). Thirteen enterprises have annual capacities of at least 50,000 tonnes, and they jointly produce over half the country’s pellets. The remaining pellet producers (<50,000 tonnes per year) make pellets as a complementary activity to their primary operations (e.g. sawmilling or planing). Collecting data from small-scale plants remains a challenge, and national estimates of wood pellet production are likely low.
A similar situation exists in the production of wood briquettes. More than 100 enterprises in the Russian Federation produce briquettes, with a total annual capacity of 663,000 tonnes, which is about one-fifth that of wood pellets. Nonetheless, briquettes are becoming an increasingly popular form of fuel for domestic and industrial use.
8.3.2 Prices
Prices for pellets exported from the Russian Federation were $88–95 per tonne in 2017, slightly down on 2016 due to an increase in supply.
The most common arrangements for transporting wood pellets from the Russian Federation are to deliver the pellets to the buyer’s carrier (“free carrier” – FCA) or to ship them to the buyer’s transport in a port (“free on board” – FOB). The final price of the goods may differ significantly depending on the terms of delivery. Average export prices per tonne for wood
0
2
4
6
8
2012 2013 2014 2015 2016 2017
Mill
ion
tonn
es
EU28 (internal) USACanada Russian FederationOthers
Source: Eurostat, 2018a.
GRAPH 8.2.3
Imports by source of wood pellets by EU28 countries, 2012-2017
2016 2017 2018f Change (%) 2016-2017
Production 1,883.0 2,287.0 2,442.5 21.5
Imports 5.8 8.8 8.8 51.1
Exports 1,370.1 1,807.2 1,936.5 31.9
Apparent consumption
518.8 488.6 514.8 -5.8
TABLE 8.3.1
Wood pellet balance, CIS, 2016-2018 (thousand m3)
Note: f = 2017 Committee on Forests and the Forest Industry forecast.
Source: UNECE/FAO, 2018.
0.0
0.2
0.4
0.6
0.8
1.0
1.2
1.4
1.6
Mill
ion
tonn
es
Northwest Siberia Central Far East Volga Ural
Source: Rosstat (2018).
GRAPH 8.3.1
Wood pellet production, Russian Federation (by region), 2012-2017
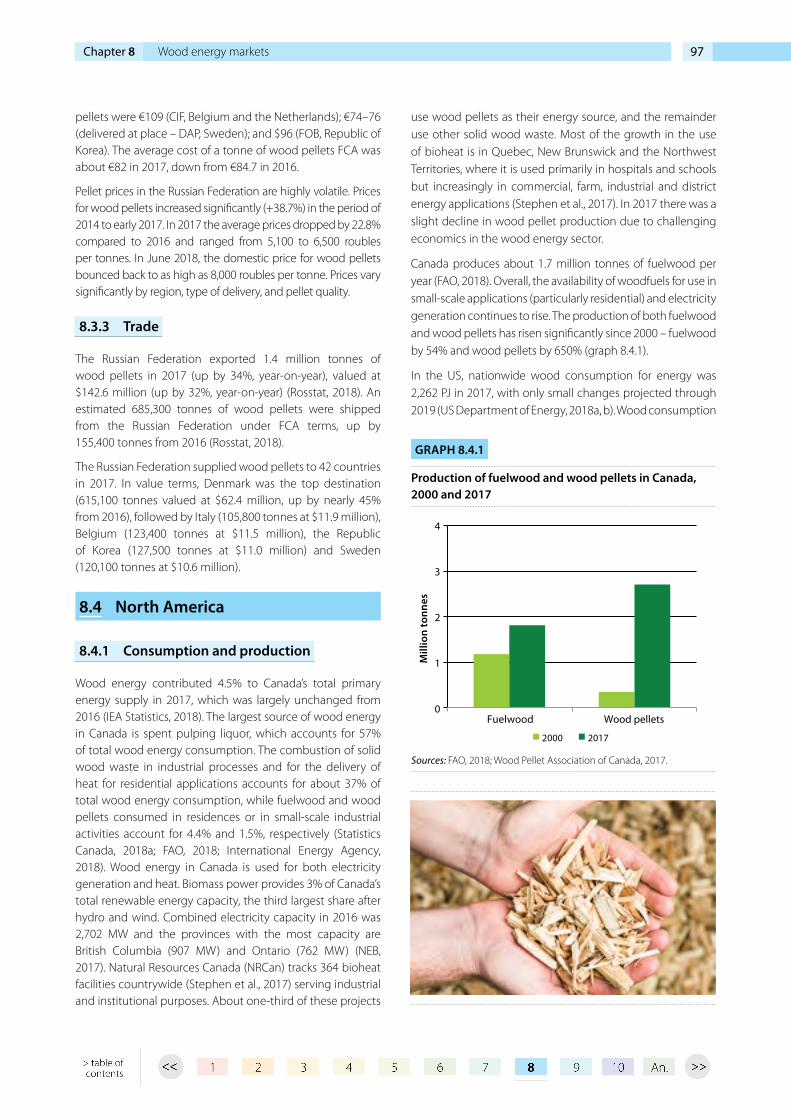
97Chapter 8 Wood energy markets
pellets were €109 (CIF, Belgium and the Netherlands); €74–76 (delivered at place – DAP, Sweden); and $96 (FOB, Republic of Korea). The average cost of a tonne of wood pellets FCA was about €82 in 2017, down from €84.7 in 2016.
Pellet prices in the Russian Federation are highly volatile. Prices for wood pellets increased significantly (+38.7%) in the period of 2014 to early 2017. In 2017 the average prices dropped by 22.8% compared to 2016 and ranged from 5,100 to 6,500 roubles per tonnes. In June 2018, the domestic price for wood pellets bounced back to as high as 8,000 roubles per tonne. Prices vary significantly by region, type of delivery, and pellet quality.
8.3.3 Trade
The Russian Federation exported 1.4 million tonnes of wood pellets in 2017 (up by 34%, year-on-year), valued at $142.6 million (up by 32%, year-on-year) (Rosstat, 2018). An estimated 685,300 tonnes of wood pellets were shipped from the Russian Federation under FCA terms, up by 155,400 tonnes from 2016 (Rosstat, 2018).
The Russian Federation supplied wood pellets to 42 countries in 2017. In value terms, Denmark was the top destination (615,100 tonnes valued at $62.4 million, up by nearly 45% from 2016), followed by Italy (105,800 tonnes at $11.9 million), Belgium (123,400 tonnes at $11.5 million), the Republic of Korea (127,500 tonnes at $11.0 million) and Sweden (120,100 tonnes at $10.6 million).
8.4 North America
8.4.1 Consumption and production
Wood energy contributed 4.5% to Canada’s total primary energy supply in 2017, which was largely unchanged from 2016 (IEA Statistics, 2018). The largest source of wood energy in Canada is spent pulping liquor, which accounts for 57% of total wood energy consumption. The combustion of solid wood waste in industrial processes and for the delivery of heat for residential applications accounts for about 37% of total wood energy consumption, while fuelwood and wood pellets consumed in residences or in small-scale industrial activities account for 4.4% and 1.5%, respectively (Statistics Canada, 2018a; FAO, 2018; International Energy Agency, 2018). Wood energy in Canada is used for both electricity generation and heat. Biomass power provides 3% of Canada’s total renewable energy capacity, the third largest share after hydro and wind. Combined electricity capacity in 2016 was 2,702 MW and the provinces with the most capacity are British Columbia (907 MW) and Ontario (762 MW) (NEB, 2017). Natural Resources Canada (NRCan) tracks 364 bioheat facilities countrywide (Stephen et al., 2017) serving industrial and institutional purposes. About one-third of these projects
use wood pellets as their energy source, and the remainder use other solid wood waste. Most of the growth in the use of bioheat is in Quebec, New Brunswick and the Northwest Territories, where it is used primarily in hospitals and schools but increasingly in commercial, farm, industrial and district energy applications (Stephen et al., 2017). In 2017 there was a slight decline in wood pellet production due to challenging economics in the wood energy sector.
Canada produces about 1.7 million tonnes of fuelwood per year (FAO, 2018). Overall, the availability of woodfuels for use in small-scale applications (particularly residential) and electricity generation continues to rise. The production of both fuelwood and wood pellets has risen significantly since 2000 – fuelwood by 54% and wood pellets by 650% (graph 8.4.1).
In the US, nationwide wood consumption for energy was 2,262 PJ in 2017, with only small changes projected through 2019 (US Department of Energy, 2018a, b). Wood consumption
0
1
2
3
4
Fuelwood Wood pellets
Mill
ion
tonn
es
2000 2017
Sources: FAO, 2018; Wood Pellet Association of Canada, 2017.
GRAPH 8.4.1
Production of fuelwood and wood pellets in Canada, 2000 and 2017

UNECE/FAO Forest Products Annual Market Review, 2017-201898
for energy in 2017 was up only slightly (by about 0.6%) from 2016, with increases in wood use for electricity generation offset by reduced consumption in the residential sector. The industrial sector continues to dominate total wood energy use and per capita wood energy use is falling.
North America produced 9.6 million tonnes of wood pellets in 2017, an increase of more than 3% over 2016 (table 8.4.1). Wood pellet production capacity in 2017 was estimated at 12.3 million tonnes in the US and 3.6 million tonnes in Canada (Hawkins Wright, 2018). In Canada there are currently 42 pellet producers, with more under construction (Canadian Biomass Magazine, 2018a). The US has 86 biomass-densifying facilities that support some 2,000 full-time jobs (US Department of Energy, 2018c). In January 2018, the mix of inputs for pellets was roundwood/pulpwood (18.3%), sawmill residues (14.1%), wood product manufacturing (13.3%) and other residual materials (54.3%) (US Department of Energy, 2018c).
8.4.2 Prices
Overall, prices for wood for wood pellets and firewood saw little or moderate increases to 2016 prices (table 8.4.2).
8.4.3 Trade
Exports of wood pellets from Canada were reported at 2.2 million tonnes in 2017, a drop of about 8.5% from 2016 (Statistics Canada, 2018b). The value of these exports was almost CAD 397 million, about 3% lower than in 2016 (Statistics Canada, 2018b). The top destination for wood pellet exports was again the UK (69%), followed by Japan (11%) and the US (10%). Exports to the UK and Japan were largely unchanged in 2017, but shipments to the US increased by almost 24%, year-on-year (Statistics Canada, 2018b). Part of the lack of growth in overseas exports may be attributed to the bankruptcy of Rentech, a company that had an offtake
2016 2017 2018f Change (%) 2016-2017
Production 9,282 9,600 10,042 3.4
Imports 225 231 231 2.7
Exports 6,432 7,375 7,903 14.7
Apparent consumption
3,074 2,456 2,539 -20.1
TABLE 8.4.1
Wood pellet balance, North America, 2016-2018 (thousand m3)
Note: f = 2017 Committee on Forests and the Forest Industry forecast.
Source: UNECE/FAO, 2018.
United Kingdom
80%
Belgium11%
Denmark7%
All other2%
GRAPH 8.4.2
Export destinations of US wood pellets, 2017
Source: US International Trade Commission, 2018.
unit 2016 price 2017 price
Canada
Bagged wood pellets for domestic use
USD/tonne 207-290 209-293
Wood pellet export price
USD/tonne
FOB131 132
Fuelwood (“firewood”) exports
USD/tonne
FOB130 131
Fuelwood (“firewood”) for domestic use
USD/cord* 256-302 259-304
US
Pellet exportsUSD/tonne
FOB164 168
Pellets for domestic useUSD/tonne
FOB177 165
Domestic wood pellets, retail, spring 2017
USD/tonne
(bulk)256
Domestic wood pellets, retail, spring 2018
USD/tonne
(bulk)271
US Midwest region premium wood pellets
USD/tonne 239-249 287-325
Super premium pellets* USD/tonne 275-297 303-336
TABLE 8.4.2
Wood energy product prices, North America, 2016-2017
Notes: * A cord is a unit of measure of stacked wood (wood, bark and void space) occupying a space of 128 cubic feet (3.625 m3). The solid-wood content of a cord is variable but often assumed to be 66.7% wood, 11.5% bark and 21.8% void.
Sources: Canadian Tire, 2018; Northern Hardwood, 2018; US Department of Energy, 2018b; BT Enterprises, 2018.

99Chapter 8 Wood energy markets
agreement with Drax in the UK that would have increased exports across the Atlantic (Sault Star, 2018).
Japan is a growing market for Canadian wood pellets. The country imported more than 500,000 tonnes of industrial wood pellets in 2017, of which 71% were sourced from Canada (Strauss, 2018). Japan’s biomass generation capacity is forecast to grow from 2,340 MW today to 3,100 MW by 2028 (Tovey-Fall, 2018).
US exports of wood pellets for energy reached a new high of 5.2 million tonnes in 2017, mostly to the UK (US International Trade Commission, 2018) (graph 8.4.2).
The US exported 1.23 million tonnes of wood pellets in the first quarter of 2018, down slightly from 1.26 million tonnes in the first quarter of 2017. Pellet production increased, although some facilities that had planned to start operations in 2017 did not open and some are no longer planned (US Department of Energy, 2018c).
Beyond the UNECE region, expected growth in demand for wood pellets in Japan and the Republic of Korea represents a great opportunity to expand production. One US pellet producer has indicated that it has a contract to supply pellets to Japan. Nevertheless, the Asian markets are still developing, and transportation costs are a challenge for suppliers from the southeastern US states (Voegele, 2018). The port of Norfolk (Virginia) had the highest exports of US wood pellets in 2017, at 1.44 million tonnes, followed by Savannah (Georgia) at 1.33 million tonnes, New Orleans (Louisiana) at 0.83 million tonnes, Tampa (Florida) at 0.69 million tonnes and Charlotte (North Carolina) at 0.55 million tonnes. Regionally, the US South accounted for 99.5% (by weight) of all US wood pellet exports (US International Trade Commission, 2018).
8.5 Policy, standards and regulatory influences
In the EU, political agreement has been reached between negotiators in the European Commission, the European Parliament and the Council for a binding renewable-energy target for the EU of 32% by 2030, with an upwards revision clause by 2023. The European Parliament and the Council now have to formally approve the text of the Directive. Once endorsed by both these co-legislators in coming months, the updated Renewable Energy Directive will be published in the Official Journal of the Union, and it will enter into force 20 days after publication. Member states will have to transpose the new elements of the Directive into national law within 18 months of its entry into force (European Commission, 2018). Solid-biomass risk-based sustainability criteria were also agreed, which will apply to installations with inputs of at least 20 MW. EU member states may choose to implement the sustainability or greenhouse-gas-savings
criteria for facilities under the 20 MW threshold and also add additional sustainability criteria.
The UK’s Renewable Obligation (RO) scheme, which has been in effect since April 2002, requires electricity suppliers to produce a specific proportion of electricity from renewable sources or otherwise be fined. Producers that fulfil the obligation are subsidized for the amount of renewable electricity per MWh produced (DBEIS, 2017a). From 31 March 2017, the RO scheme no longer subsidizes new generating stations, although all generating stations previously accredited by the scheme will continue to receive support until 2037 (DBEIS, 2017a). As part of the UK Electricity Market Reform, new renewable electricity generators can seek financial support through “contracts for difference” (CFDs) (DBEIS, 2017b), which are issued between electricity suppliers and the government-run Low Carbon Contracts Company (LCCC) (DBEIS, 2017b). After three rounds of contract auctions, five biomass-consuming plants are now under contract to receive financial support from the LCCC: three plants were awarded contracts on 23 April 2014 and two were awarded contracts on 11 September 2017 (DECC, 2014; DBEIS, 2017c). On 11 October 2017, the UK government released a statement to confirm that up to GBP 557 million will be made available for less-established technologies, including biomass with combined heat and power (CHP), in the next CFD auction, planned to begin in spring 2019 (DBEIS, 2017d; DBEIS, 2017e). Any future woody-biomass-consuming electricity producers in the UK will likely seek subsidies through the CFD scheme. The UK Department for Business, Energy and Industrial Strategy will also begin implementing changes to efficiency requirements for CFD-eligible biomass CHP plants. The minimum overall efficiency rating will be increased from 35% to 70% gross calorific value.
The Russian Export Center, supported by the Russian government, assists exporters to recover 80% of the costs associated with transport and certifying wood pellets (Exportcenter, 2018). This has helped increase the number of Russian wood pellet companies receiving quality certification according to EN plus (for retail sales) and

UNECE/FAO Forest Products Annual Market Review, 2017-2018100
sustainability certification under the Sustainable Biomass Programme (for industrial sales), thereby expanding exports to Europe. The Russian Federation expects that this will assist the development of wood pellet exports in 2018 and in subsequent years
Canada’s public policies aim to foster a low-carbon economy supported by the Clean Fuels Standard and a carbon-pricing strategy. A regulatory framework for the Clean Fuels Standard has been published, with proposed regulations scheduled for tabling in 2018 and final regulations to be published in mid-2019 (ECCC, 2018a). The Standard will apply to solid, liquid and gaseous fuels and will likely drive uptake of wood energy options towards 2020. The life-cycle greenhouse gas (GHG) emissions of wood energy options and other renewable-energy alternatives will be evaluated, and their contributions to reducing GHG intensity will be published as a series of compliance pathways to meet the Clean Fuels Standard (ECCC, 2018a). The federal government’s strategy will see carbon pricing implemented in 2018 at CAD 10 per tonne, rising by CAD 10 per tonne per year to 2022 (ECCC, 2018b). Provinces and territories without a carbon price will be subject to this pricing scheme. In British Columbia, the carbon tax is CAD 35 per tonne, increasing by CAD 5 per tonne per year to 2021 (BC, 2018). In Alberta, the carbon levy is CAD 30 per tonne, although this rate is expected to rise to match the federal government’s commitment (Alberta, 2018). A joint cap-and-trade programme was in effect in Ontario and Quebec in early 2018, in partnership with the State of California; the median price for carbon in the May 2018 joint auction was CAD 18.97 per tonne (Ontario, 2018). Ontario has announced its intention to leave the cap-and-trade programme, however (Rieti, 2018). As with the Clean Fuels Standard, wood energy options will be treated as a means of reducing GHG emissions under the carbon tax programme; wood energy pathways will be given GHG emission reduction credits, which can be used to reduce the tax burden or to provide credits under cap-and-trade.
Interesting developments in Canada should drive wood energy options in years to come. In 2018, Canada issued
the first call for proposals under the Clean Energy for Rural and Remote Communities programme, targeted at bioheat demonstration and deployment. Proposals were submitted in mid-May 2018 and the selection of projects was to take place through summer 2018. A total of CAD 220 million is to be distributed over five years, with a continuous intake of new proposals (NRCan, 2018). Canada’s largest airport, Toronto’s Pearson International, was the site of a pilot project to blend 230,000 litres of biojet fuel into the airport’s fuel system to demonstrate the feasibility of incorporating bio-based products in existing supply mechanisms (Canadian Biomass Magazine, 2018b).
Changes to public laws, policies and regulations in the US in 2017-2018 could have implications for the future of wood energy production in that country. The Consolidated Appropriations Act, 2018 (US Congress, 2018), includes a requirement that three US executive agencies “… establish clear and simple policies for the use of forest biomass as an energy solution, including policies that ... reflect the carbon-neutrality of forest bioenergy and recognize biomass as a renewable energy source, provided the use of forest biomass for energy production does not cause conversion of forests to non-forest use”. In response, the EPA unilaterally released a policy statement on 23 April 2018 asserting the carbon neutrality of wood energy (US Environmental Protection Agency, 2018). Presumably the US departments of Agriculture and Energy are preparing their own announcements or policy statements. Nonetheless, it is unclear how the policies on the carbon neutrality of wood energy referred to in the Act will influence the use of wood for energy in the US. The US House of Representatives and the US Senate passed their versions of the 2018 Farm Bill, “The Agricultural Improvement Act of 2018”, on 21 and 28 June 2018, respectively. The 2018 Farm Bill includes mandatory funding for Energy Title programmes, comprising a variety of programmes that benefit the bioenergy and biofuels industries. The legislation will now head to conference committee to resolve differences between the two versions of the bill (Voegele, 2018).
The US administration has decided to withdraw from the Paris Agreement on climate change on 7 November 2020 and has commenced the process of replacing the Clean Power Plan (CPP) regulations, which were structured to allow states to use alternative methods to meet emissions goals and thus could have increased the use of wood for energy. Without the CPP and the Paris Agreement, and with additional administration support for fossil-fuel production, there are few incentives for increasing the use of wood for energy. The US Department of Energy projections for wood energy consumption in 2018 and 2019 reflect the imposition of these new policies and thus are little changed.
Outside the UNECE region, renewable-energy targets in Japan could translate into demand for industrial wood

101Chapter 8 Wood energy markets
pellets that could exceed 12 million tonnes per year by 2025 (Strauss, 2018). Expected demand for certified sustainably sourced wood pellets would put Canada and the US in prime positions to supply Japanese demand.
8.6 Innovation in the sector
Two projects in Canada aim to achieve commercial scale for liquid biofuels production. A forest biorefinery project launched in La Tuque, Québec, Bioénergie La Tuque (BELT), began with a technical and economic feasibility study, which is now underway. A detailed economic analysis will follow, leading to the expected construction of a demonstration plant with the capacity to produce 200 million litres of biodiesel per year from forest residues. Neste recently announced a research-and-development collaboration with BELT (FPInnovations, 2017; Neste, 2017).
Also in Québec, the Côte Nord Project is under development by Ensyn, Arbec Forest Products and Groupe Rémabec (Ensyn, 2018). This project was expected to be commissioned in late 2017 (now expected in mid-2018) and could see the production of 40 million litres of biocrude per year for use in heat and electricity generation as well as downstream refining. The development of these projects will continue to accelerate the adoption of technologies that will facilitate new wood-to-energy pathways.
8.7 Wood Charcoal
Charcoal is a major source for cooking fuel and environmental problems in many developing countries of the world. In the UNECE region, charcoal is primarily used for recreational cooking (barbeque) and a few industrial processes. Data on charcoal production are often weak. For these reasons, the analysis in this chapter largely excludes charcoal. However, we have included the following information.
In Europe total wood charcoal production reached 448,000 tonnes in 2017, up 2.5% from 2016. Poland was the biggest producer with 33% share of the Europe’s total wood charcoal production. European wood charcoal consumption volumes remained nearly the same in 2017. The total consumption volume was 113,800 tonnes, 0.7% up from 2016. The largest consumers were Germany, France, and Turkey, accounting for 20%, 9% and 8% of regional consumption.
The total production of wood charcoal in the CIS region was 185,000 tonnes in 2017. Ukraine's production is estimated to amount to 100,000 tonnes, 54% of the total wood charcoal in the CIS subregion. More than 80% of Ukrainian production is destined for export. The consumption of charcoal increased in almost every CIS-member state. The Russian Federation was the biggest consumer with 40,000 tonnes (56%) in the CIS-subregion.
In North America, wood charcoal production and consumption volumes were reported only from the US. Canada has production but does not report it. Wood charcoal production in the US was estimated at 852,000 tonnes and consumption at 946,000 tonnes in 2017.
8.8 New study
Wood Energy in the ECE Region [ECE/TIM/SP/42]
The UNECE/FAO Forestry and Timber Section, with support from the Government of Finland, and the UNECE/FAO Team of Specialists on Wood Energy published a study on wood energy in May 2018.
The study sheds light on the wood-energy situation, the types of woodfuels used, major sources and users, public policy instruments that support (or hinder) the use of wood energy, and how to sustainably source wood. It provides an outlook on how current social, economic and political trends and developments may mould the use of wood for energy and its sustainable production.
The study is available at
www.unece.org/forests/publications.html
UNECE/FAO Forest Products Annual Market Review, 2017-2018102
8.9 References
AEBIOM. 2018. 2017 in Figures’. European Biomass Association (AEBIOM). Available at: www.aebiom.org/library/annual-reports
Alberta, 2018. Carbon levy and rebates in Alberta, Canada. Available at: https://www.alberta.ca/climate-carbon-pricing.aspx
Argus Media. 2018. Wood pellet cost, insurance and freight prices ($ per ton) within 90 days (spot) at Amsterdam Rotterdam, Antwerp (ARA). Available at: www.argusmedia.com/en/bioenergy/argus-biomass-markets
BC, 2018. British Columbia’s Carbon Tax. Available at: https://www2.gov.bc.ca/gov/content/environment/climate-change/planning-and-action/carbon-tax
BT Enterprises. 2018. Price list: pellet fuel. Available at: http://btpellet.com/page/price-list
Canadian Biomass Magazine. 2018a. 2018 Pellet map. Available at: www.canadianbiomassmagazine.ca/images/cbm_pelletmap2018.pdf
Canadian Biomass Magazine. 2018b. Air Canada to introduce biofuel at Toronto-Pearson Airport. 20 April 2018. Available at: www.canadianbiomassmagazine.ca/biofuel/air-canada-to-introduce-biofuel-at-toronto-pearson-airport-6797
Canadian Tire. 2018. Hardwood pellets. Available at: www.canadiantire.ca/en/pdp/hardwood-pellets-40-lb-0642776p.html, accessed on June 29, 2018
DBEIS. 2017a. Digest of United Kingdom energy statistics (DUKES), 2017. Department for Business, Energy & Industrial Strategy (DBEIS). Available at: https://assets.publishing.service.gov.uk/government/uploads/system/uploads/attachment_data/file/643414/DUKES_2017.pdf
DBEIS. 2017b. Contracts for difference policy paper. UK Department for Business, Energy and Industrial Strategy (DBEIS). Available at: www.gov.uk/government/publications/contracts-for-difference/contract-for-difference
DBEIS. 2017c. Contracts for difference second allocation round results. Department for Business, Energy and Industrial Strategy (DBEIS). Available at: www.gov.uk/government/publications/contracts-for-difference-cfd-second-allocation-round-results
DBEIS. 2017d. The clean growth strategy. UK Department for Business, Energy and Industrial Strategy (DBEIS). Available at: www.gov.uk/government/publications/clean-growth-strategy
DBEIS. 2017e. Government confirms up to £557 million for new renewable energy projects. Press release. Available at: www.gov.uk/government/news/government-confirms-up-to-557-million-for-new-renewable-energy-projects
DECC. 2014. Successful projects offered an investment contract. UK Department of Energy and Climate Change. Available at: www.gov.uk/government/publications/increasing-certainty-for-investors-in-renewable-electricity-final-investment-decision-enabling-for-renewables#history
Drax. 2018. 2018 annual report. Available at: www.drax.com/wp-content/uploads/2018/03/Drax-Group-plc-2017-annual-report.pdf
ECCC. 2018a. Clean Fuel Standard. Ottawa, Canada, Environment and Climate Change Canada (ECCC). Available at: www.canada.ca/en/environment-climate-change/services/managing-pollution/energy-production/fuel-regulations/clean-fuel-standard.html
ECCC. 2018b. Pricing carbon pollution in Canada: how it will work. Ottawa, Canada, Environment and Climate Change Canada (ECCC). Available at: www.canada.ca/en/environment-climate-change/news/2017/05/pricing_carbon_pollutionincanadahowitwillwork.html
Ensyn, 2018. The Côte-Nord Project. Available at: http://www.ensyn.com/quebec.html
European Commission. 2018. Statement: Europe leads the global clean energy transition: Commission welcomes ambitious agreement on further renewable energy development in the EU. Available at http://europa.eu/rapid/press-release_STATEMENT-18-4155_en.htm
Eurostat. 2018a. International trade, EU trade since 1988 by HS6. Product 440131. Available at: http://ec.europa.eu/eurostat/web/international-trade-in-goods/data/database
Eurostat. 2018b. Supply, transformation and consumption of renewable energies: annual data. Available at: http://ec.europa.eu/eurostat/web/energy/data/database
Exportcenter. 2018. Available at: www.exportcenter.ru/services/subsidirovanie/kompensatsiya_chasti_zatrat_na_transportirovku_produktsii_/kompensatsiya_chasti_zatrat_na_transportirovku_produktsii/
FAO. 2018. Forestry statistics. Rome. Available at: http://faostat.fao.org/site/626/DesktopDefault.aspx?PageID=626#ancor.
FPinnovations, 2017. BELT and Neste Corporation announce a strategic r&d partnership. Available at: https://fpinnovations.ca/media/news-releases/documents/2017/0117-bioenergy-la-tuque-and-neste-corporation-announce-a-strategic-rd-partnership.pdf

103Chapter 8 Wood energy markets
Glavonjić, B. 2018. Current status of the regional market of woody biomass. 5th RENEXPO, Belgrade. http://renexpo-belgrade.com/en/conference/conference-program/bioenergy-conference/
Hawkins Wright. 2018. Forest Energy Monitor, issue 87. Available at: www.hawkinswright.com/bioenergy/forest-energy-monitor
IEA Statistics, 2018. International Energy Agency: Statistics. Available at: http://www.iea.org/statistics/
International Energy Agency. 2018. Statistics. Available at: www.iea.org/statistics
NEB, 2017. The National Energy Board. Canada’s Renewable Power Landscape: Energy Market Analysis 2017. Available at: https://www.neb-one.gc.ca/nrg/sttstc/lctrct/rprt/2017cndrnwblpwr/2017cndrnwblpwr-eng.pdf
Neste, 2017. Neste and Bioenergy La Tuque to start R&D cooperation on utilizing forest residues in biofuel production. Available at: https://www.neste.us/neste-and-bioenergy-la-tuque-start-rd-cooperation-utilizing-forest-residues-biofuel-production
Northern Hardwood. 2018. Pricing. Available at: www.northernhardwood.ca/pricing.htm
NRCan. 2018. Clean energy for rural and remote communities: bioheat, demonstration & deployment program streams. Available at: www.nrcan.gc.ca/reducingdiesel
Rieti, J. 2018. Doug Ford is officially ending Ontario’s cap-and-trade plan, but what’s next? CBC, 3 July 2018. Available at: www.cbc.ca/news/canada/toronto/doug-ford-ending-cap-and-trade-1.4731954
Ontario, 2018. Climate Change Action Plan. Available at: www.ontario.ca/page/climate-change-action-plan
Rosstat. 2018. Russian trade figures. Russian Federal Statistical Office (Rosstat). Available at: www.gks.ru/wps/wcm/connect/rosstat_main/rosstat/en/main
Sault Star. 2018. Wawa mill bids due Friday. Available at: www.saultstar.com/2018/02/20/wawa-mill-bids-due-friday
Statistics Canada 2018a. Consumption of solid wood waste and spent pulping liquor for energy production. CANSIM Table 128-0018. Available at: www5.statcan.gc.ca/cansim/a26
Statistics Canada 2018b. Canadian International Merchandise Trade Database. Ottawa, Canada. Available at: www5.statcan.gc.ca/cimt-cicm
Stephen, J., Blair, M. and Mabee, W. 2017. Updating and expansion of the Canadian bioheat database. Available at: www.nrcan.gc.ca/sites/www.nrcan.gc.ca/files/energy/TorchLight_Bioheat_Database_Report_accessible_E.pdf
Strauss, W. 2018. The Japanese and South Korean Markets for industrial wood pellets. Argus Biomass, 17–19 April 2018.
Strauss, W. and Walker, S. 2018. Global pellet market outlook in 2018. Available at: www.canadianbiomassmagazine.ca/pellets/increasing-demand-6705
Tovey-Fall, L. 2018. Exploring the changing global supply and demand dynamics of industrial pellets. Argus Biomass, 17-19 April 2018.
UNECE/FAO, 2018. TIMBER Database 2016-2017 (database). Available at: www.unece.org/forests/fpm/onlinedata
US Congress. 2018. Consolidated Appropriations Act, 2018. Available at: www.congress.gov/115/bills/hr1625/ BILLS-115hr1625enr.pdf
US Department of Energy. 2018a. Monthly energy review tables 10a, 10b, 10c. Renewable energy consumption by sector. Available at: www.eia.gov/totalenergy/data/monthly
US Department of Energy. 2018b. Short-term energy outlook. Table 8a: Renewable energy consumption. Available at: www.eia.gov/outlooks/steo/report/renew_co2.php
US Department of Energy. 2018c. Densified biomass report. EIA 63C. Available at: www.eia.gov/biofuels/biomass.
US Environmental Protection Agency. 2018. EPA’s treatment of biogenic carbon dioxide (CO2) emissions from stationary sources that use forest biomass for energy production. Available at: www.epa.gov/sites/production/files/2018-04/documents/ biomass_policy_statement_2018_04_23.pdf
US International Trade Commission. 2018. US exports to all OECD countries. HS code 440131. Available at: https://dataweb.usitc.gov
Voegele, E. 2018. Senate passes 2018 Farm Bill. Available at: www.biomassmagazine.com/articles/15412/senate-passes-2018-farm-bill?utm_source=Biomass&utm_campaign=5b3d1475da-EMAIL_CAMPAIGN_2018_07_03_10_14&utm_medium=email&utm_term=0_53880fe73c-5b3d1475da-94395177
Wood Pellet Association of Canada. 2017. Canadian bioenergy situation and opportunities in Canada’s wood pellet sector. Ottawa, Canada. Available at: www.canadianbiomassmagazine.ca/images/canadian%20bioenergy%20situation%20and%20opportunities%20in%20canadas%20wood%20pellet%20sector.pdf
Chapter 9
VALUE-ADDED WOOD PRODUCTS
Authors: Chris Gaston, Tapani Pahkasalo

105Chapter 9 Value-added wood products
Highlights
The global value of furniture production reached $440 billion in 2017, up by $20 billion from the previous year; $145 billion of production was traded internationally.
More than half the world’s furniture production takes place in Asia, with China easily the largest producer. The US is a large producer of furniture but also the largest furniture importer globally.
Do-it-yourself customers have quickly adopted MDF mouldings, which are cheaper and more stable than finger-jointed mouldings and have a smoother painting surface.
The global shift in furniture production towards lower-cost regions is slowing. This appears to be due to increased automation, demand by customers for shorter delivery times, and increasing costs in previously low-cost regions.
China is challenging the position of Southern Hemisphere producers of softwood mouldings in US markets. Brazil and Chile are still the largest producers, thanks to their solid raw-material base, but China has become a strong player in this market in the last 2–3 years, based almost entirely on imports of New Zealand radiata pine.
Window-frame markets are increasingly shaped by considerations of energy efficiency and environmental performance. Combinations of metal and wood are gaining popularity in window frames in all markets due to their good price–performance ratio and low maintenance.
North American glulam production has shown consistent significant annual gains of about 463,000 m3 from 2010 through to the forecast for 2018.
Despite the hype around the potential of cross-laminated timber (CLT) for very tall buildings, however, most usage will be for low and mid-rise construction, at least until codes and regulations are developed for CLT.
Interest in and the use of CLT continues to grow in the UNECE region, as well as beyond it in countries with traditions of wood construction, such as Japan and Australia.
Most global CLT production is still in Europe; within Europe, the DACH countries (Austria, Germany and Switzerland) accounted for about 70% of global production (about 700,000 m3) in 2017. European production of CLT is forecast to increase dramatically to 1.78 million m3 by 2020.
Estimates of the market potential of CLT in the US range from 2 million m3 to 10 million m3 per year.

UNECE/FAO Forest Products Annual Market Review, 2017-2018106
9.1 Introduction
Value-added wood products are primary wood products that have been further processed into secondary products such as furniture, builders’ joinery and carpentry (BJC), profiled wood, and engineered wood products (EWPs). Demand and market trends are closely linked to drivers such as economic growth, urbanization, family income, trends in housing and construction, fashion and design, demographics as well as structural changes including paradigm changes in consumer preferences. These drivers are highlighted in chapters 1, 2, 8 and 10 and not further discussed in this chapter.
BJC comprises a wide array of wood products, including wooden windows and doors; pre-assembled wooden flooring; posts and beams; shakes and shingles; and products that fall into the category of EWPs. EWPs include I-beams (also called I-joists), with I-shaped cross-sections; finger-jointed sawnwood; glulam (sawnwood glued into beams); laminated veneer lumber (LVL), which is formed by gluing together sheets of veneer and resawing to desired dimensions; and cross-laminated timber (CLT), which comprises panels made up of sawnwood in cross-laminated plies. Profiled wood is wood shaped by machines to create, for example, mouldings, tongue-and-groove, and lap siding.
Most of the value-added products covered in this chapter are highly dependent on residential construction (new and, just as importantly, repairs and renovations) and increasingly on non-residential building construction, including schools, restaurants, stores and warehouses.
New construction and renovation in the UNECE region generally continued to grow in 2017 as economic conditions improved, which bodes well for the consumption of value-added wood products. Some subregions and sectors have not followed this general trend, however. Chapter 10 presents more information on the outlook for construction and renovation.
9.2 Wooden furniture trade in major markets
Global furniture production reached a value of $440 billion in 2017, a $20 billion increase over 2016 (CSIL, 2018). In general, about one-third of global production is exported and two-thirds is consumed in the countries in which production takes place; the value of international furniture trade, therefore, is about $145 billion. More than half of all furniture production is in Asia, with China the largest furniture producer globally. The US is both a large producer of furniture and the world’s largest furniture importer.
There has been a rapid global shift in furniture production to lower-cost-base countries in recent decades but, according to a CSIL analysis, this shift is now slowing (CSIL, 2018). This
appears to be due to increased automation, demand by customers for shorter delivery times, and increasing costs in previously low-cost regions. European and North American furniture production has lost considerable market share since the 1990s, mostly to Asian countries. The move to lower-cost countries has also occurred within subregions: in Europe, for example, furniture manufacturing has grown most rapidly in the Czech Republic, Poland, Portugal and Romania.
Another key trend has been a shift away from traditional long-lasting hardwood furniture, which was viewed as a long-term investment, to low-cost “flat-pack” “semi-disposable” furniture. People are moving more often, and many younger consumers like the flexibility that “temporary” and affordable furniture provides (Coresight Research, 2018).
Nevertheless, furniture manufacturers in Germany and Italy have found export markets for “high-end” products. Global sourcing, specialization and trade agreements have made furniture markets truly global, allowing high-end producers to expand into other markets. China is emerging as a major importer of furniture, focused on high-value and niche products, with Italy being the largest supplier, followed by Germany, Viet Nam and the US.
Orders for new furniture increased again in the first months of 2018 after a good year in 2017. For example, US furniture orders were up by 5% in February 2018 compared with the same month in 2017. Year-to-date orders in 2018 increased by 4% compared with 2017, according to a survey by Smith Leonard PLLC (2018). Inventory levels have grown in recent months, causing concern among some market participants. Production levels will need adjusting if inventories continue to increase, but there are no clear signals that the market is slowing. Market participants see that deliveries, inventories and payment times are normal, and they remain generally optimistic of growth because consumer confidence is high.
The invention of flatpack furniture, disassembled furniture that is assembled by the consumer after purchase was a revolution to the furniture retail market more than 70 years ago. IKEA perfected the system and other companies

107Chapter 9 Value-added wood products
followed this example. However, the furniture sector is on its way to make another great leap towards changing purchase and distribution patterns of furniture.
Buying furniture online is becoming increasingly common. Young urban buyers have little need to see furniture before purchasing. Large e-commerce companies such as Amazon have quickly become significant players in the furniture retail sector. Even though furniture sales accounted for less than 1% of Amazon’s net sales ($178 billion) in 2017 the company is now ranked in the top 20 for US furniture retail volume (Engel, 2018), with an estimated segment turnover of $1.2 billion. Amazon has developed a strategy for its furniture segment, including furniture stores/showrooms, and is building warehouses dedicated to furniture handling (Engel, 2018).
Wooden furniture imports into the US continued growing in 2017 for the eighth straight year, up by more than 10% (more than $2 billion) over 2016. Imports are now twice as high as they were in 2009 at the peak of the global financial crisis. The strength of the US furniture trade reflects the strong state of the economy and housing markets and an increasing standard of living. Adjusting local manufacturing capacity at this speed is not possible, and imports are therefore acting as a valve for changes in demand. Seventy-five percent of total US imports originate from Asia.
Furniture markets in Europe are more stable and also more local: for example, 15% of Germany’s imports, and 20% of France’s imports, are from Asia, while 85% and 75%, respectively, are from other European countries. Growth in European markets has been modest but positive in recent years (graph 9.2.1 and table 9.2.1).
9.3 Builders’ joinery and carpentry, and profiled-wood trade
Markets for BJC have developed strongly in the US in the last seven years, with import volume doubling since 2011 to a value of more than $2.2 billion in 2017. The previous peak of imports in 2006 was higher in nominal value, but
US Germany France UK Japan
2016 2017 2016 2017 2016 2017 2016 2017 2016 2017
Total value of imports 19.7 21.8 6.3 5.4 4.0 4.2 4.2 4.7 2.7 2.7
Of which furniture parts 3.0 3.3 1.3 1.4 0.7 0.8 0.8 0.9 0.5 0.5
Origin (%)
Asia 74.0 74.9 15.3 19.0 21.5 20.8 51.5 49.2 89.3 89.4
North America 9.6 8.8 0.2 0.3 1.1 1.2 1.2 3.9 0.6 0.6
Europe 9.8 9.7 84.4 80.6 76.6 77.2 45.2 43.7 10.0 9.9
Latin America 6.5 6.4 0.2 0.2 0.5 0.5 1.9 1.7 0.1 0.1
Others 0.1 0.1 0.0 0.0 0.2 0.2 0.0 1.4 0.0 0.1
TABLE 9.2.1
Value of furniture imports, and market share of supplying regions, top five importing countries, 2016 and 2017 (value in billion dollars and market share in percentage)
Sources: Eurostat, 2018; Ministry of Trade and Customs Japan, 2018; US International Trade Commission, 2018.
0
2
4
6
8
10
12
14
16
18
20
22
US Germany France UK Japan
$ bi
llion
2013 2014 2015 2016 2017
GRAPH 9.2.1
Wooden furniture imports, top five importing countries, 2013-2017
Sources: Eurostat, 2018; Ministry of Trade and Customs Japan, 2018; US International Trade Commission, 2018.

UNECE/FAO Forest Products Annual Market Review, 2017-2018108
today’s import market seems to be heading in that direction. Stronger housing markets, solid economic and employment figures and increasing consumer confidence have boosted demand for BJC. Half of US imports come from Canada, one-third originates in Asia, and smaller volumes are imported from Latin America and Europe.
The European market for BJC is also growing, although imports are mainly from neighbouring European countries. The majority of UK imports come from EU countries, but Asian producers also have a strong foothold in that market. The manufacture of BJC products is still labour-intensive, and
it is an important economic sector in countries that export large volumes. Even countries with few exports have locally important BJC manufacturers that service local markets. Graph 9.3.1 and table 9.3.1 show BJC import data for the top five importing countries
Window markets are increasingly shaped by energy efficiency and environmental performance, including recycling options. Wood is considered an excellent source of material for window frames because of its aesthetics, stability over a high temperature range, excellent thermal and acoustic insulation qualities and green credentials.
Wood frames account for only about 20% of the European window market, and metal–wood-combination frames account for an additional 5%. The remaining three-quarters of the European window-frame market comprises PVC and metal.
The preferred materials differ significantly among European countries, due mainly to differences in tradition and climate. Southern European countries largely use metal frames for their windows, and Nordic countries have a clear preference for wood. Eastern European countries prefer PVC (about 80% of the market) and, to a lesser extent, metal (less than 10% of the market).
Combinations of metal (typically aluminium) and wood are gaining popularity in all markets due to their good price–performance ratio and low maintenance requirements. The same tendency can be observed in the exterior-door segment, where combining metal and wood not only gives stability but also increases the perceived level of security. The interior-door segment continues to use mainly wood, although plastic doors are appearing on the market. Profiled-wood markets are volatile and can react quickly to changes in demand. Profiled-wood products have a relatively high value-to-weight ratio and are inexpensive to transport internationally. Strong housing markets in the UNECE region are contributing to an increase
0
0.5
1
1.5
2
2.5
US Germany France UK Japan
$ bi
llion
2013 2014 2015 2016 2017
GRAPH 9.3.1
Builders’ joinery and carpentry imports, top five importing countries, 2013-2017
Sources: Eurostat, 2018; Ministry of Trade and Customs Japan, 2018; US International Trade Commission, 2018.
US Germany France UK Japan
2016 2017 2016 2017 2016 2017 2016 2017 2016 2017
Total value of imports 2.1 2.2 1.1 1.2 0.5 0.5 0.9 0.9 1.1 1.5
Origin (%)
Asia 31.8 29.7 8.4 10.1 8.6 9.5 37.1 35.9 93.9 72.2
North America 50.6 51.1 0.2 0.3 0.8 0.5 1.8 1.5 2.4 1.6
Europe 4.8 6.1 91.4 89.4 89.1 88.1 57.5 59.5 2.1 24.5
Latin America 12.3 12.4 0.0 0.0 0.9 1.0 2.0 1.5 0.0 0.0
Others 0.5 0.6 0.0 0.2 0.6 0.9 1.6 1.6 1.6 1.7
TABLE 9.3.1
Value of builders’ joinery and carpentry imports, and market share of supplying regions, top five importing countries, 2016 and 2017 (value in billion dollars and market share in percentage)
Sources: Eurostat, 2018; Ministry of Trade and Customs Japan, 2018; US International Trade Commission, 2018.

109Chapter 9 Value-added wood products
in imports of profiled-wood products, although volumes are still far from their 2006 peak. Changing consumer preferences and, to some extent, a lack of supply from producers are hindering market growth, with the lessons of boom-and-bust markets still in people’s minds. Producers have either gone out of business or have changed their focus to Asian commodity markets, where demand seems more stable. Entry barriers to profiled-wood markets are low (in terms of the investment required), the value-add of the moulding process is high, and supply chains constantly evolve. Large buyers continually reshape their supply chains to keep costs in check because they do not rely on individual suppliers.
Profiled-wood production has increased rapidly in China, thanks to strong local equipment-manufacturing industries and relatively inexpensive labour and imported raw materials. Importantly, the Chinese profiled-wood industry primarily serves the country’s large domestic market, and its designs and dimensions are focused internally. The growth of Chinese construction activity is slowing as the market matures, however, and some volumes of profiled woods are being re-destined to export markets, primarily the US.
There are two main types of wood moulding: solid-wood mouldings, which have been finger-jointed and MDF-based mouldings. The market share of plastic mouldings is small but increasing. The market share of MDF mouldings was about 25% in 2007 and is now 40%, with growth mostly at the expense of solid-wood mouldings, the market share of which declined from 62% in 2006 to 45% in 2016. Imports of solid-wood mouldings by the US now exceed US domestic production (Fridayoffcuts, 2016).
Do-it-yourself customers have quickly adopted MDF mouldings, which are less expensive and more stable than
0
0.2
0.4
0.6
0.8
1
1.2
1.4
US Germany France UK Jap an
$ bi
llion
2013 2014 2015 2016 2017
GRAPH 9.3.2
Profiled-wood imports, top five importing countries, 2013-2017 (value in billion dollars and market share in percentage)
Sources: Eurostat, 2018; Ministry of Trade and Customs Japan, 2018; US International Trade Commission, 2018.
finger-jointed mouldings and have a smoother painting surface. There is also a growing fashion towards wider, flat boards (“craftsman” look), for which MDF mouldings have an advantage due to their unlimited width, stability and designs. Solid-wood mouldings are the only real option for applications for which a natural wood-grain appearance is wanted, but, in painted applications, MDF has clear advantages.
The US import market for softwood mouldings is serviced predominantly by Brazil (36%), Chile (21%), China (18%) and Canada (10%). Remarkably, China has become a very strong player in this market in only the last 2–3 years, based almost entirely on imports of New Zealand radiata pine Logs. The result is that New Zealand has lost market share in the US for pine moulding.
Brazil, Chile and New Zealand are well suited for providing the raw material for the clear pine mouldings market in the US, as they can compete against the more expensive and increasingly scars ponderosa pine mouldings.
Profiled-wood imports to all main markets increased in 2017. Imports to the US grew by 10%, and European gains were in single digits. The market share of Asian producers has increased steadily in the US but declined in all European markets. The US import market is almost twice the combined size of the three largest European import markets for profiled wood (graph 9.3.2). European profiled-wood markets are largely local, and the main importers are other European countries (table 9.3.2).

UNECE/FAO Forest Products Annual Market Review, 2017-2018110
9.4 Parquet and wood flooring
European production of parquet flooring increased by 2.2%
in 2017, to 86.7 million m3. Poland accounted for the largest
production share (19%), followed by Sweden (16%), Austria
(13%) and Germany (10%). The majority (81%) of wood used
in parquet flooring is oak, with the remainder comprising
a wide variety of domestic, tropical and even coniferous
species (FEP, 2018).
In the US in 2016, manufacturers accounted for two-
thirds of domestic sales of wood flooring by value and for
56% by square area. This represents a decline: domestic
manufacturers had about 85% of the US market by value and
square area in 2007. Recently, however, imports have been
comprising a smaller share of the US market, likely due to the
Lacey Act (Hirschhorn, 2017).
9.5 Engineered wood products
EWPs covered in this section are glulam timber/beams,
I-beams (also called I-joists), LVL and CLT. All these products
are highly dependent on new building construction, repairs
and renovations.
Concrete and steel dominate non-residential construction:
even in North America, only one-quarter of this construction
is wood-framed. Nevertheless, there is considerable room for
growth in EWPs, especially with the emergence of products
and systems such as cross-laminated and heavy timber and,
more recently, of wooden buildings of ten storeys and higher.
9.5.1 Glulam timber
9.5.1.1 Europe
Comprehensive data on the production and consumption of glulam in Europe are unavailable, but some information exists on trade and production at the country level.
The top ten producers in Germany and Austria combined produce just under 2 million m3 of glulam per year (Timber-online.net, 2018a). Austria is the largest producer of glulam in Europe, at about 1.5 million m3 per year (2015 figures), and it exports significant amounts of laminated timber products (both glulam and CLT). Italy is the largest importer of Austria’s laminated timber products; in the first three months of 2018, however, exports of glulam and CLT from Austria to Italy fell by 12%, year-on-year (from 110,000 m3 to 97,000 m3) (Timber-online.net, 2018c).
9.5.1.2 North America
Overall production of glulam timber in North America declined from 750,000 m3 in 2006 to 285,000 m3 in 2009 before recovering to 450,000 m3 in 2017 (graph 9.5.1 and table 9.5.1).
New residential construction and remodelling account for 58% of glulam use in North America, with the remainder going to non-residential buildings and industrial uses (APA, 2018).
9.5.2 I-beams
The market for I-beams is more than 85% dependent on new-home construction, mostly for single-family dwellings. Builder surveys indicate that I-beams have had a 44-49%
TABLE 9.3.2
Value of builders’ joinery and carpentry imports, and market share of supplying regions, top five importing countries, 2016 and 2017 (value in billion dollars and market share in percentage)
Sources: Eurostat, 2018; Ministry of Trade and Customs Japan, 2018; US International Trade Commission, 2018.
US Germany France UK Japan
2016 2017 2016 2017 2016 2017 2016 2017 2016 2017
Total value of imports 1.1 1.2 0.3 0.3 0.2 0.2 0.2 0.2 0.3 0.2
Origin (%)
Asia 23.1 25.9 18.8 18.7 10.2 6.9 53.1 44.5 75.9 70.7
North America 13.1 11.3 1.0 0.6 0.5 0.6 3.6 3.7 7.8 13.2
Europe 3.6 4.1 73.7 73.7 68.6 68.0 41.2 50.0 9.0 12.4
Latin America 59.5 57.8 3.7 3.5 19.7 23.4 1.6 1.6 5.1 1.4
Others 0.8 0.8 2.9 3.6 1.0 1.1 0.4 0.2 2.2 2.4

111Chapter 9 Value-added wood products
share of raised wood-floor area (not including concrete floor
area) for the last eight years (graph 9.5.2); the market share
was only 16% in 1992.
Demand for I-beams peaked in 2005 with 297.3 million linear
metres. This was probably the maximum capacity at that
time. I-beam demand and production declined when the
US housing bubble burst, with roughly 115 million linear
metres produced in 2009 in North America. Production has
increased significantly since then and the forecast for 2018 is
254 million linear metres (graph 9.5.3 and table 9.5.2), up by
more than 100 percent since 2009.
The majority (88%) of I-beams is used in new residential
construction, with the balance going to non-residential
building construction, repairs and remodelling (APA, 2018).
0
50
100
150
200
250
300
350
400
450
500
Thou
sand
m3
US Canada
GRAPH 9.5.1
Glulam production in North America, 2010–2018
Notes: f = forecast. Conversion factor: 650 board feet per m3.
Source: APA, 2018.
TABLE 9.5.1
Glulam production and consumption, North America, 2016-2018 (thousand m³)
Notes: f = forecast. Conversion factor: 1 m³ = 650 board feet. Canadian imports are assumed to be minimal.
Source: APA, 2018.
2016 2017 2018f Change (%) 2016-2017
US
Production 395.4 416.9 430.8 5.4
Total consumption 400.0 421.5 436.9 5.4
Residential 230.8 246.2 260.0 6.7
Non-residential 149.2 153.8 156.9 3.1
Industrial, other 20.0 21.5 20.0 7.7
Inventory change -4.6 -4.6 -6.2 0.0
CANADA
Production 35.4 30.8 32.3 -13.0
NORTH AMERICA
Total production 430.8 447.7 463.1 3.9
40
42
44
46
48
50
52
54
56
Perc
enta
ge
GRAPH 9.5.2
I-beam market share of total raised wood-floor area, single-family homes, US, 2010-2018
Note: f = forecast.
Sources: APA, 2018.
0
50
100
150
200
250
300
Mill
ion
linea
r met
res
US Canada
GRAPH 9.5.3
I-beam production, North America, 2010-2018
Notes: f = forecast. Conversion: 1 linear metre = 3.28 linear feet.
Source: APA, 2018.

UNECE/FAO Forest Products Annual Market Review, 2017-2018112
9.5.3 Laminated veneer lumber
Most LVL is destined ultimately for new-home construction. In 2017, 72% of LVL production in North America was used in beams and headers, rim boards and like applications and the balance in I-joist flanges. Rim boards are used on the perimeters of I-beam floor systems to provide fastening points for the I-beams and to assist in distributing wall loads. North American production peaked with the US housing market in 2005, at 2.6 million m3. According to forecasts, 2.4 million m3 of LVL will be produced in 2018, a 135% increase from the trough in 2009 (graph 9.5.4 and table 9.5.3).
LVL is well accepted for use in beams and headers, and consumption should grow as the housing market improves. Like other EWPs, LVL allows the use of longer spans and fewer pieces to carry the same loads as other conventional wood products.
In addition to the EWPs discussed in this chapter, a number of other structural composite lumber products are manufactured in North America, such as parallel strand lumber (PSL), laminated strand lumber (LSL) and oriented strand lumber (OSL). Production volumes of these products are relatively low compared with other EWPs.
9.5.4 Cross-laminated timber
Interest in, and use of, CLT continues to grow, both inside the UNECE region and in countries outside the region with a
tradition of wood construction, such as Japan and Australia. The share of CLT in wood construction is still small, but interest and investment in the product shows no signs of slowing, undoubtedly because CLT can be used for constructing tall buildings, once the exclusive domain of concrete and steel; several wooden buildings more than 300 metres in height are planned. In many areas, however, building codes and regulations are yet to catch up with the structural engineering and resilience capabilities of CLT. Despite the hype around very tall buildings, most of the usage of CLT will likely be for
0
0.5
1
1.5
2
2.5
Mill
ion
m3
US Canada
GRAPH 9.5.4
Laminated veneer lumber production in North America, 2010-2018
Notes: f = forecast. Conversion: 1 m3 = 35.3137 cubic feet.
Source: APA, 2018.
2016 2017 2018f Change (%) 2016-2017
CONSUMPTION
I-beam flanges 561 603 643 7.6
Beams, headers, others 1450 1668 1736 15.0
Total consumption 2011 2271 2379 13.0
PRODUCTION
US 1841 2059 2132 11.8
Canada 170 212 246 25.0
Total production 2011 2271 2379 13.0
TABLE 9.5.3
Laminated veneer lumber consumption and production in North America, 2016-2018 (thousand m³)
Notes: f = forecast. Conversion: 1 m³ = 35.3137 cubic feet.
Source: APA, 2018.
2016 2017 2018fChange (%) 2016-2017
US
Production 147.0 157.9 167.7 7.5
Total consumption 184.8 198.2 214.9 7.3
New residential 161.9 173.5 189.0 7.2
Repairs, remodelling 11.3 11.9 12.5 5.4
Non-residential, other 11.6 12.8 13.4 10.5
CANADA
Production 75.6 82.3 86.6 8.9
Consumption 31.7 35.1 35.1 10.6
Inventory change 2.4 2.7 0.0 12.5
NORTH AMERICA
Total production 222.6 240.2 254.3 7.9
TABLE 9.5.2
Wooden I-beam consumption and production, North America, 2016-2018 (million linear metres)
Notes: f = forecast. Conversion: 1 linear metre = 3.28 linear feet.
Source: APA, 2018.

113Chapter 9 Value-added wood products
low- and mid-rise construction, at least until the necessary codes and regulations are developed.
Compared with other building materials, CLT has excellent acoustic and thermal qualities and an exceptionally light environmental footprint (e.g. it has low embodied carbon and creates very little waste, and the resource is renewable). In addition, CLT is quite resilient to fire and earthquakes. It is lighter than competing materials, which reduces the cost and complexity of foundations and footings and enables construction in areas where the weight of structures is a concern. Global CLT production is expected to exceed 1 million m3 by end 2018.
The cost of constructing buildings in North America appears to be similar for CLT and concrete: a cost comparison showed CLT to be slightly (0.6–1.4%) cheaper (Oregon Best, 2017).
Outside the UNECE region, Japan has embraced a road map for the development of its CLT industry; the country produced about 10,000 m3 of CLT in 2015 and 60,000 m3 in 2016 (Timber-online, 2017a). Among the goals of Japan’s roadmap are: obtaining a 6% share for CLT of buildings up to four stories high; the use of subsidies to offset up to 50% of the investment costs of new CLT plants; an increase in domestic CLT production capacity to 500,000 m3 by 2024 (Timber-online, 2017b); and a reduction in CLT production costs of more than 50% through mechanization and efficiency gains (Eastin, 2016).
New Zealand has been producing CLT commercially since 2013 (Muszynski et al., 2017), and Australia’s first CLT plant started production in mid-2018.
Below, we summarize CLT developments in Europe and North America. For the time being, CLT developments in the CIS are limited to a planned plant near Vologda, which is targeted to begin operations in 2020 (Timber-online, 2018b).
9.5.4.1 Europe
The majority of global CLT production still resides in Europe and, within Europe, in the DACH13 countries, which together
13 Germany, Austria and Switzerland.
accounted for about 700,000 m3 in 2017 (about 70% of global production).
European production is forecast to increase dramatically to 1.81 million m3 by 2020 (Table 9.5.4) through increased capacity in existing facilities and the development of greenfield facilities, many of which are outside the DACH countries.
9.5.4.2 North America
The CLT industry in North America is still small, and it has been focusing on producing CLT for use as platforms in the mining
Company Location 2016 Forecast 2020
Binderholz
Unternberg, Austria; Burgbernheim, Germany; Gruvön, Sweden
145 270
Stora EnsoBad St. Leonhard, Austria; Ybbs, Austria
130 260
KLH Massivholz Katsch an der Mur, Austria 88 210
Hasslacher Norica Timber
Stall im Mölltal, Austria; Magdeburg, Germany
40 120
Legal & General Leeds, UK 120
Pfeifer Holz Schlitz, Germany 100
Mayr-Melnhof Holz Gaishorn, Austria 60 80
Piveteaubois Vendée, France 80
Splitkon Åmot, Norway 60
CLT Plant Kauhajoki, Finland 50
Schilliger Holz Küssnacht, Switzerland 13 50
CLT Finland Hoisko, Finland 5 40
Eugen Decker Morbach, Germany 25 30
Züblin Timber Aichach, Germany 30 30
Cross Timber Systems Jelgava, Latvia 25 25
XLam Dolomiti Castelnuovo, Italy 20 23
Martinsons Bygdsiljum, Sweden 20
Weinberger Holz Reichenfels, Austria 5.5 20
W. u. J. Derix Niederkrüchten, Germany 12.5 15
Misc. producers <10,000 m3/year 81 207
TOTAL 680 1,810
TABLE 9.5.4
Cross-laminated timber production, Europe, 2016 and 2020 (1,000 m3/year)
Note: Production figures are a mix of estimates and reported data for known companies with a current and prospective production of greater than 10,000 m3 as of mid 2017.
Source: Timber-online, 2017c.

UNECE/FAO Forest Products Annual Market Review, 2017-2018114
and oil industries. This is changing, however. Interest in CLT is growing in industry and government and among academic researchers, urban planners and the public, who see the potential of CLT in the construction of large urban buildings.
As of early 2017, there were two CLT producers in Canada and three in the US, but numerous CLT manufacturing plants are now in start-up, under construction or in planning. A company in Oregon is building a veneer-based mass timber plant, which can be used for similar applications as CLT. Plants are now also producing mass plywood panels, dowel laminated timber (DLT) and nail-laminated timber in North America, all of which can be used in the same applications as CLT (Oregon Best, 2017).
As in Europe, a number of prominent buildings have been constructed with CLT in Canada and the US and have garnered public attention. This is especially true in the western part of the subregion, where there is a strong “wood culture”, but interest in both using and producing CLT is now widespread throughout North America.
Production figures for CLT are unavailable for Canada and the US. Nevertheless, given the number of new producers entering the market and the enlargements of existing producers, volumes are clearly increasing rapidly. Estimates of the market potential for CLT in the US range from 2 million m3 to 10 million m3 (Espinoza et al., 2016; Oregon Best, 2017).
9.6 Policy issues affecting markets for value-added wood products
The following ongoing trade-related issues could have an impact on value-added wood products:
• In April 2017, the US government announced antidumping and countervailing duties of 3-24% on imported softwood lumber from Canada (Canadian softwood is often used in the US for producing value-added wood products). These are now under review by the World Trade Organization’s Dispute Settlement Body (US Federal Register, 2017).
• The office of the US Trade Representative announced on 15 June 2018 the imposition of an additional duty of 25% on about $50 billion worth of Chinese imports containing industrially significant technologies (USTR, 2018). Home furnishings are not among the 818 product lines listed.
• The UK’s exit from the EU has the potential to change the trade flows of value-added wood products, leaving mainland EU producers (and UK buyers) uneasy about the future.
• Most building codes in the US don’t allow the construction of wooden buildings over six stories. Until building codes are adjusted, this has implications for the use of CLT in the construction of taller buildings (Urban Green, 2018).

115Chapter 9 Value-added wood products
9.7 References
APA. 2018. APA–The Engineered Wood Association. Available at: www.apawood.org
Coresight Research. 2018. Deep dive: US furniture market 2017 – stores face softer growth and e-commerce competition. Available at: www.fungglobalretailtech.com/research/deep-dive-us-furniture-market-2017-stores-face-softer-growth-e-commerce-competition
CSIL. 2018. World furniture outlook 2018. Milan, Italy, Centre for Industrial Studies (CSIL).
Eastin, I. 2016. Japan CLT roadmap: lessons for North America. Presentation to the UNECE Committee on Forests and the Forest Industry. Available at: www.unece.org/fileadmin/DAM/timber/meetings/20161018/coffi74-item3c-01-eastin.pdf
Engel, C. 2018. Why Amazon is absent from the top 25 ranking. Furniture Today, 21 August 2018. Available at: www.furnituretoday.com/article/545645-why-amazon-absent-top-25-ranking
Espinoza, O., Buelmann, U., Laguarda Mallo, M.F. and Rodriguez Trujillo, V. 2016. Identification of research areas to advance the adoption of cross-laminated timber in North America. BioProducts Business, 1(5): 60-72. Available at: http://biobus.swst.org/index.php/bpbj/article/view/20/7
Eurostat. 2018. External trade. Available at: http://epp.eurostat.ec.europa.eu
FEP. 2018. The European parquet market consolidates its positive trend. European Federation of the Parquet Industry (FEP). Available at: www.parquet.net/files/FEP_PRESS_RELEASE_-_June_2018.pdf
Fridayoffcuts. 2016. U.S. moulding producers struggle with rising imports. 28 October 2016. Available at: http://fridayoffcuts.com/dsp_article.cfm?id=698&date=%7Bts%20%272016-10-28%2000:00:00%27%7D&aid=8182
Hirschhorn, S. 2017. Sourcing of wood flooring supply: are U.S. manufacturers ready to take share from foreign-sourced products? Hardwood Floors, 1 June 2017. Available at: https://hardwoodfloorsmag.com/2017/06/01/sourcing-wood-flooring-supply-u-s-manufacturers-ready-take-share-foreign-sourced-products
Ministry of Trade and Customs Japan. 2018. Trade Statistics of Japan. Imports of commodity by country, 2018. Available at: www.customs.go.jp
Muszynski, L., Hansen, E., Fernando, B.M.S.R., Schwarzmann, G. and Rainer, J. 2017. Insights into global cross-laminated timber industry. Corvallis, USA, Oregon State University.
Oregon Best. 2017. Advanced wood product manufacturing study for cross-laminated timber acceleration in Oregon and SW Washington. Available at: http://oregonbest.org/fileadmin/media/Mass_Timber/Accelerating_CLT_Manufacturing_in_Oregon___SW_Washington__2017__Oregon_BEST_.pdf
Smith Leonard PLLC. 2018. Furniture Insights, April 2018. Available at: www.smith-leonard.com/wp-content/uploads/2018/05/April-2018-Furniture-Insights.pdf
Sumitomo Forestry. 2018. New development concept W350 plan for wooden high-rise building. Available at: http://sfc.jp/english/news/pdf/20180214_e_01.pdf
Timber-online.net 2017a. Triumph of CLT continues. Available at: www.timber-online.net
Timber-online.net 2017b. Several CLT projects in the pipeline. 7 December 2017. Available at: www.timber-online.net
Timber-online.net 2017c. Plus 1 million m3 by 2020. 24 October 2017. Available at: www.timber-online.net
Timber-online.net 2018a. Mayr-Melnhof to take over Hüttemann, Largest European glulam producer in the making. Available at: www.timber-online.net
Timber-online.net 2018b. Plans for CLT factory in Russia. 6 June 2018. Available at: www.timber-online.net
Timber-online.net 2018c. Glulam and CLT exports declined. Available at: www.timber-online.net/holzprodukte/ 2018/06/austrian-laminated-timber-exports-march-2018.html
Urban Green. 2018. Timber buildings: coming soon to a building code near you? Available at: www.urbangreencouncil.org/content/news/timber-buildings-coming-soon-building-code-near-you
US Federal Register. 2017. Certain softwood lumber products from Canada: preliminary affirmative countervailing duty determination, and alignment of final determination with final antidumping duty determination. Available at: www.federalregister.gov/documents/2017/04/28/2017-08673/certain-softwood-lumber-products-from-canada-preliminary-affirmative-countervailing-duty
US International Trade Commission. 2018. Available at: www.usitc.gov
USTR, 2018. United States Trade Representative. USTR Issues Tariffs on Chinese Products in Response to Unfair Trade Practices. Available at: https://ustr.gov/about-us/policy-offices/press-office/press-releases/2018/june/ustr-issues-tariffs-chinese-products

Chapter 10
HOUSING AND CONSTRUCTION
Lead author: Delton Alderman

117Chapter 10 Housing and construction
Highlights
House prices increased by an average of 5% in advanced economies in 2017 and by 4% in emerging markets.
Between the fourth quarter of 2017 and the first quarter of 2018, house prices rose by 4.5% in the euro area and by 4.7% in the EU28.
The median price for new single-family units in the US was $323,100 in 2017, an increase of 5.0% over 2016 ($307,800). The mean price was $384,900, up by 6.7% ($360,900).
The Euroconstruct region’s new-residential-construction subsector grew by more than 10% in 2017, the biggest increase of all the construction subsectors.
Between April 2017 and April 2018, construction spending increased by 1.8% in the euro area (+2.1% in civil engineering and building construction, +1.8%) and 0.9% in the EU28 (1.6% in civil engineering and +0.7% in building construction).
A total of 78.6 million m2 of new residential space was put in place in the Russian Federation in 2017, about the same as in 2016.
The goal of the “Housing for Russian Family Programme” is to build 500,000 two-room apartments, beginning in 2018, and to put in place 120 million m2 of residential space per year, by 2024.
All construction sectors of the US housing market improved in 2017. Beginner or starter housing remains weak, however, and the quantity of dwellings being built is insufficient to match population growth.
The number of US household formations increased in 2017 but remains less than the historical average.
In Canada, federal, provincial and local governments introduced regulations in 2017 designed to dampen rising house prices and valuations, including a nationwide mortgage stress test, a foreign buyer’s tax, and rent controls.
The Canadian housing market is projected to be stable, even with the implemented regulations, new directives to be employed, and the potential of interest rate increases.

UNECE/FAO Forest Products Annual Market Review, 2017-2018118
10.1 Introduction
In many countries, the new construction and remodelling housing markets are the largest value-added markets for wood products, and housing is a primary indicator and catalyst of economic activity for overall economies. Thus, economic projections and house-price analysis may provide insights into house construction and remodelling markets.
Szemere (2018) reported that global real residential property prices increased by 2% between end-2016 and end-2017 and were 7% higher in 2017 than before the global financial crisis. House prices in advanced economies increased by an average of 5% in nominal terms in 2017 and by 3% in real terms. Canadian house prices increased modestly compared with those in the US and the euro area. House prices in emerging market economies increased by an average of 4% in nominal terms in 2017 and by 1% in real terms; BIS (2018) noted that prices decreased noticeably in the Russian Federation. Brondino (2018) reported that house prices rose by 4.5% in the euro area and by 4.7% in the EU28 from the fourth quarter of 2017 to the first quarter of 2018. US existing-house prices increased by an average of 2.9% in 2017 (Federal Reserve Bank of St. Louis, 2018a) and overall US housing prices grew by 5.8% (Mortgage Bankers Association, 2018).
The World Bank (2018a) reported that global growth has eased but remains robust. The growth rate of global GDP was projected at 3.1% in 2018, easing to 2.9% by 2020.
GDP is projected to grow by 2.2% in 2018, 2.0% in 2019 and 1.7% in 2020 for advanced economies; by 2.1% in 2018, 1.7% in 2019 and 1.5% in 2020 in the euro area; and by 2.7% in 2018, 2.5% in 2019 and 2.0% in 2020 in the US (World Bank, 2018a). Canada’s GDP growth is estimated at 2.1% in 2018 and 2.2% in 2019 (IMF, 2018; OECD, 2018). The Russian Federation’s economic recovery continues, but growth prospects are modest (World Bank, 2018b). The World Bank projects that Russian GDP will grow by 1.5-1.8% in 2018-2020, with consumer demand expected to be the primary driver; the country’s poverty rate is forecast to decline slightly. These projections are based on increasing oil prices in the near term and macroeconomic stabilization, which would support economic growth.
10.2 European construction market
10.2.1 Review and outlook
The residential construction sector serves an estimated 474 million persons and 207 million households in the
Euroconstruct region.14 The housing stock is about 235 million units, of which nearly 8% are second homes and 6% are vacant (Euroconstruct, 2017, 2018). An estimated 1.6 million units were completed in 2017, yielding an average of 3.4 new dwellings per 1,000 people (Euroconstruct, 2018). The low number of dwellings started and completed affects the construction sector and many others.
According to the 2017 “State of Housing in the EU” report, housing has become the greatest expense for many Europeans. As in the US, under-building results in constrained inventories and higher prices for new and existing houses. Migration, building regulations, labour shortages and the decreased availability of building lots are additional factors affecting house prices (Housing Europe, 2017). The global trend towards urbanization may also affect future European housing construction. Napoletano et al. (2018) reported that more than half the global population now lives in cities – and 75% of Europeans live in urban centres, up substantially from about 60% in the 1960s.
It may take time for stronger construction growth to occur in Europe. The numbers of building permits and starts have trended downward in recent years, and the outlook for new residential starts is for a decline in the longer term. This contrasts with new housing completions, the number of which is forecast to rise. France, Germany, the UK, Sweden and Spain (in descending order, by share) were estimated to account for 59% of all residential completions in 2017 (Euroconstruct, 2018). Möbert (2018) estimated a 1-million unit deficit in existing housing in Germany, the second-largest housing market in the euro area (as measured by permits and completions) after France.
In addition to lacklustre forecasts, the type of structures built has changed recently, with more flats than 1+2 family
14 The Euroconstruct region comprises 19 countries. The western subregion consists of Austria, Belgium, Denmark, Finland, France, Germany, Ireland, Italy, the Netherlands, Norway, Portugal, Spain, Sweden, Switzerland and the UK. The eastern subregion comprises the Czech Republic, Hungary, Poland and Slovakia.

119Chapter 10 Housing and construction
residential expenditure by 1.6% in 2018, 1.3% in 2019 and 1.2% in 2020 (Euroconstruct, 2018).
10.2.2 Residential construction and remodelling
The total residential construction market (new construction plus renovation) increased by 5.3% in 2017. New residential construction – a vital sector in the euro area – is projected to increase from €336.6 billion in 2018 to €343.4 billion in 2020 (table 10.2.1). Aggregate residential construction volume in 2017 was driven by new housing construction, which had a 10% share of expenditure. New residential construction is forecast to increase by 5.1% in 2018, 1.4% in 2019 and 0.6% in 2020 (table 10.2.1) (Euroconstruct, 2018).
Residential remodelling is forecast to remain the principal construction activity in the euro area, increasing from €407.4 billion in 2018 to €418.4 billion in 2020. Government programmes have historically supported home renovation projects (Euroconstruct, 2018).
An estimated 1.8 million new-housing permits were issued in the Euroconstruct region in 2017. In several countries, the number of building permits issued is a leading economic indicator because it is forward-looking: it is used for gauging future housing supply and economic activity. Table 10.2.2 shows estimates and projections for issued building permits for the top five countries in 2017-2020; graph 10.2.1 shows trends in total permits, starts and completions over the period 2002-2020 (Euroconstruct, 2018).
dwellings15 completed. In Germany, for example, Dorffmeister (2017) projected the quantity of 1+2 family dwellings built to decline due to the aging of the population, declining household size, substantial reductions in state subsidies, and rapid increases in land prices and construction costs.
House construction and sales markets are greatly influenced by government policies in several euro-area countries. In France, for example, 60% of sales in 2016 were associated with public programmes. France has also implemented new directives to spur affordable housing (with a target of 80,000 flats for youth by 2023) and new construction (Yacoubi, 2017). Similarly, the Nordic countries of Denmark, Finland, Norway and Sweden all have programmes for affordable housing and new construction, such as housing allowances and favourable mortgage terms and stipulations for certain groups (e.g. disabled people, students, and people with inadequate resources). Such programmes may partly explain the high completion rates for dwellings in Nordic countries: the rate is 6.6 units per 1,000 people in Finland, 6.5 units in Norway and Sweden, and 3.8 units in Denmark, compared with the aggregate rate for the Euroconstruct region of 3.4 units per 1,000 people (Pajakkala, 2018).
The total value of the Euroconstruct region’s construction industry was estimated at €1,521 billion in 2017. Even though new housing construction remains historically tepid in the Euroconstruct region, output increased by 3.9% in 2017. New residential construction grew by more than 10% (averaging more than 9.7% across 2016 and 2017), leading all construction subsectors in growth. Residential remodelling is also a bright subsector, particularly in western and northern Europe, due to the aging of the housing stock. Looking forward, construction growth is projected in all Euroconstruct countries in 2018 (Euroconstruct, 2018).
New residential construction accounted for 42.6% of total new construction spending in 2017, non-residential construction for 34.4% and civil engineering for the other 23%. Residential remodelling accounted for 55.8% of total construction spending in 2017 (more than 25% of Europe’s total construction market value), non-residential remodelling for 31.9% and civil-engineering remodelling for 18.7% (Euroconstruct, 2018). Grandovska (2018) reported that, between April 2017 and April 2018, construction spending increased by 1.8% in the euro area and by 0.9% in the EU28. The gains in both areas were due to improvements in the civil-engineering and building construction subsectors.
Total spending on civil engineering is forecast to increase by 4.4% in 2018, 4.5% in 2019 and 2.5% in 2020 and total non-
15 1+2 family dwellings are detached or semi-detached single or multi-unit structures for families.
Change (%)
2018e 2019f 2020f2017-2018
2018-2019
2019-2020
New residential construction
336.6 341.3 343.4 5.1 1.4 0.6
Residential remodelling
407.4 411.9 418.4 1.0 1.1 1.6
Non-residential – new
262.2 265.3 267.9 2.8 1.2 1.0
Non-residential – remodelling
235.1 238.5 241.9 1.5 1.5 1.4
Civil engineering – new
182.2 193.0 199.7 1.7 5.9 3.4
Civil engineering – remodelling
139.5 143.1 144.8 1.6 2.5 1.2
TOTAL 1,563 1,593 1,616 2.7 1.9 1.4
TABLE 10.2.1
Construction spending forecast, Euroconstruct region, 2018-2020 (€ billion)
Notes: in 2017 prices; e = estimate; f = forecast.
Source: Euroconstruct, 2018.

UNECE/FAO Forest Products Annual Market Review, 2017-2018120
New housing starts were estimated at 1.4 million units in the Euroconstruct region in 2017, comprising 796,000 flats and 601,000 1+2 family dwellings. Data on starts are used for assessing housing demand and forecasting future construction employment, consumer-based product demand and potential recessions. Table 10.2.3 shows the top five countries in the Euroconstruct region for housing starts in 2017; graph 10.2.1 shows trends in starts in 2002-2020 (Euroconstruct, 2018).
Total completions were estimated at 1.6 million units in 2017, comprising 869,000 flats and 716,000 1+2 family dwellings. Completion data indicate the quantity of houses finished and available for use, sale or rent; as with starts, they can be used in estimating sales for consumer-based products. Table 10.2.4 shows estimates and projections for housing completions in the top five Euroconstruct countries in 2017-2020; graph 10.2.1 shows completion trends for 2002-2020 (Euroconstruct, 2018).
Table 10.2.5 presents estimates and projections for new construction and remodelling valuations for the top five countries in 2017-2020. Germany is top-ranked in both new construction and remodelling (Euroconstruct, 2018).
10.2.3 Top five new-housing-permit countries in focus
Below we present insights into the top five permit-issuing countries – including France and Germany, the traditional
0
500
1000
1500
2000
2500
3000
Thou
sand
s
Building permits Starts Completions
GRAPH 10.2.1
Building permits, housing starts and completions, Euroconstruct region, 2002-2020
Notes: FD = family dwellings; * =estimate; **= forecast.
Source: Euroconstruct, 2004, 2018.
TABLE 10.2.3
Top five Euroconstruct region countries for total housing starts, 2017-2020
Notes: e = estimate; f = forecast. Data for Germany are unavailable.
Source: Euroconstruct, 2018.
2017e 2018f 2019f 2020f
(THOUSAND HOUSING STARTS)
France 427.7 396.0 356.0 371.0
Poland 206.0 230.0 220.0 210.0
UK 191.0 198.0 208.0 210.0
Italy 85.6 87.6 89.0 90.4
Spain 80.8 90.0 100.0 105.0
2017e 2018f 2019f 2020f
(THOUSAND HOUSING COMPLETIONS)
France 363 419 388 351
Germany 260 375 280 275
UK 187 794 199 203
Poland 179 200 210 205
Italy 81 83 86 88
TABLE 10.2.4
Top five Euroconstruct region countries for total housing completions, 2017-2020
Notes: e = estimate; f = forecast.
Source: Euroconstruct, 2018.
2017e 2018f 2019f 2020f
(THOUSAND HOUSING PERMITS)
France 497.7 458.0 405.0 433.0
Germany 300.7 290.0 275.0 270.0
Poland 250.2 225.0 220.0 215.0
Italy 85.4 87.8 89.1 90.5
Sweden 76.5 76.2 67.1 62.9
TABLE 10.2.2
Top five Euroconstruct region countries for total housing permits, 2017-2020
Notes: e = estimate; f = forecast. Data for the UK are unavailable.
Source: Euroconstruct, 2018.

121Chapter 10 Housing and construction
121
TABLE 10.2.5
Top five Euroconstruct region countries for new construction and remodelling expenditures, 2017-2020 (€ billion)
2017e 2018e 2019f 2020f
NEW CONSTRUCTION
Germany 64.1 67.0 68.3 67.3
France 45.5 47.2 45.5 43.8
Italy 51.9 53.7 55.3 56.7
Spain 30.7 33.2 35.5 37.3
UK 21.1 21.3 21.1 20.9
REMODELLING
Germany 121.7 121.0 120.4 120.4
Italy 68.5 69.5 70.2 71.0
France 62.0 62.5 63.4 64.6
UK 40.0 40.5 40.9 42.0
Spain 17.8 18.1 18.6 19.1
Notes: 2017 prices; e = estimate; f = forecast.
Source: Euroconstruct, 2018.
leaders in new construction and remodelling in the Euroconstruct region.
France. According to the European Commission’s European Construction Sector Observatory (ECSC) (ECSC, 2018a), 2017 was a record year for residential construction; nevertheless, housing demand surpassed supply. Spending in the French construction subsector was €36.8 billion in 2017 (23.7% of total spending in real estate). Real estate’s overall contribution to GDP was 11.5% (€243.8 billion), comprising residential investment (the construction of new single-family and multifamily houses; residential remodelling; the production of manufactured homes; and brokers’ fees); housing services spending (rent; owner’s equivalent rent; and utilities); and expenditure on furnishings and durable goods. The outlook for France is positive, with low interest rates expected to increase housing demand.
Germany. Housing demand is strong, with an estimated 350,000 new units needed per year to the end of 2020. Spending in Germany’s construction subsector was €69.6 billion (29.8% of total spending in real estate) in 2016, and real estate’s overall contribution to GDP was 9.8% (€278.6 billion). The residential segment is expected to provide the impetus for Germany’s construction industry, projected to increase by 3.5% in 2018. In sum, the outlook for the German construction sector is robust due to strong demand and low interest rates (ECSC, 2018b).
Poland. ECSC (2018c) reported that Poland’s residential sector is improving as a result of low interest rates and increasing incomes. Housing is also influenced by “Apartments for the Young” and “Family 500+”, two programmes designed to spur demand. Spending in Poland’s construction subsector was €5.1 billion in 2016 (21.6% of total spending in real estate), and real estate’s overall contribution to GDP was 4.7% (€19.2 billion). The outlook for Poland is positive, with low interest rates, rising incomes, and subsidy programmes expected to increase housing demand.
Italy. The number of households in Italy has increased steadily since 2010, and an increasing proportion of the population lives in urban and peri-urban areas. House building has declined incrementally since 2010, however, with only 46,000 building permits issued in 2016 (down by 54% since 2010). The housing market has been rebounding since 2014, due in part to declining house prices and the enforcement of a favourable housing tax code; despite this, the new-residential-construction subsector is the only construction segment forecast to continue a negative investment trend. Spending in Italy’s construction sector was €17.8 billion in 2016 (19.8% of total spending in real estate), and real estate’s overall contribution to GDP was 12.5% (€196.1 billion). There is general uncertainty about the future of Italy’s construction sector (ECSC, 2018d).
Sweden. A lack of housing supply, combined with high demand, has resulted in surging house prices in Sweden (ECSC, 2018e). Thus, the National Board of Housing projects that 600,000 new homes will be needed between 2017 and 2025. The government has introduced an infrastructure bill for 2018-2029 in an effort to increase infrastructure investment, advance mobility and ease the housing shortfall. Spending in Sweden’s construction sector was €18.9 billion in 2016 (31.7% of total spending in real estate), and real estate’s overall contribution to GDP was 7.7% (€31.2 billion). The outlook for residential construction in Sweden is positive, with housing projected to be a driver of the Swedish economy over the next few years. Nevertheless, Euroconstruct (2018) reported

UNECE/FAO Forest Products Annual Market Review, 2017-2018122
that new financial regulations and a large influx of new houses are dampening housing prices and sales.
10.2.4 Non-residential buildings and civil engineering
Non-residential construction accounted for 31.9% of aggregate construction value in the Euroconstruct region in 2017. Overall economic conditions and government funding (e.g. buildings for education and health) influence demand. New non-residential construction is predicted to increase by 1.5% in 2018, 1.2% in 2019 and 1.0% in 2020). It is forecast to comprise the following components in 2020: commercial building construction (20.5%); office buildings (16.7%); industrial buildings (16.4%); miscellaneous construction
(12.2%); educational buildings (11.3%); storage buildings (8.4%); health buildings (7.9%); and agricultural buildings (6.4%) (Euroconstruct, 2018).
The UK, Germany, France, Spain and Poland) were the five largest markets for non-residential construction in 2017 (Euroconstruct, 2018).
The Euroconstruct region’s volume of new civil-engineering construction was less in 2017 than it was in 2007, losing nearly one-third of its GDP value. Civil-engineering renovation was unchanged over the same period. Civil-engineering projects are affected by different factors in different countries. Modest spending increases are forecast through 2020 (table 10.2.6; graph 10.2.2). Germany, France, Italy, the UK, and the Netherlands were the five largest civil-engineering markets in 2017 (Euroconstruct, 2018).
10.2.5 Construction-sector shares and growth: Contrasting western and eastern Europe
In the Euroconstruct’s western subregion, total residential construction expenditure is projected to increase from €718.7 billion in 2018 to €734.4 billion in 2020. Total residential construction spending in the Euroconstruct’s eastern subregion is forecast to increase from €25.2 billion to €27.3 billion over the same period (Euroconstruct, 2018).
New residential leads expenditure in the construction sector in the Euroconstruct’s western subregion (43.4% of total construction spending), followed by new non-residential (33.8%) and new civil engineering (22.8%). Expenditure in the eastern subregion is led by new non-residential (41.8%),
TABLE 10.2.6
Civil-engineering construction spending forecast, Euroconstruct region, 2017-2020 (€ billion)
Notes: 2017 prices; e = estimate; f = forecast.
Source: Euroconstruct, 2018.
New civil-engineering construction
Civil-engineering renovation
Total civil engineering
2017 173.1 135.1 308.2
2018e 182.2 139.5 321.8
2019f 193.0 143.1 336.1
2020f 199.7 144.8 344.5
0
200
400
600
800
€ bi
llion
Non-residential Residential renovation
Civil engineering Total New Non-Residential
GRAPH 10.2.2
European construction spending, 2012-2020
Notes: 2017 prices; e = estimate; f = forecast.
Sources: Euroconstruct, 2018.
22.8 26.8
33.841.8
43.431.4
0
20
40
60
80
100
Western Europe Eastern Europe
Perc
enta
ge
Residential construction Non-residential construction
Civil engineering
GRAPH 10.2.3
New construction spending, by Euroconstruct subregion and sector, 2017
Source: Euroconstruct, 2018.

123Chapter 10 Housing and construction
followed by new residential (31.4%) and new civil engineering (26.8%) (graph 10.2.3) (Euroconstruct, 2018).
10.3 CIS construction market, with a focus on the Russian Federation
10.3.1 Housing construction in the Russian Federation, 2016-2017
An estimated 252,100 residential buildings were put in place in the Russian Federation in 2017, a decline of 3.2% from 2016 (Rosstat, 2018); it amounted to an increase of 78.6 million m2 of residential space, roughly the same as in 2016. An estimated 269,300 buildings (including non-residential) were put in place in 2017, down by 2.9% from 2016. In total, 131.1 million m2 of floor space was installed in 2017, a 2.0% decrease, year-on-year.
About 1.13 million houses were commissioned in the Russian Federation in 2017, up by 2.4% over 2016. It was the country’s fourth-highest number on record for commissioned houses (Rosstat, 2018).
Although the Russian housing market is improving, house prices fell in 2017 (Global Property Guide, 2018), possibly partly due to the robustly expanding construction market. Lasek (2018) reported that house completions rose strongly in October 2017 (by 13.4%) and January 2018 (by 16.3%) (both month-on-month). New housing regulations (scheduled to begin on 1 July 2018), which place stronger financial requirements on construction companies, are thought to have provided the impetus for the increase in housing completions (Lasek, 2018).
The goal of the “Housing for Russian Family Programme” is to build 500,000 two-room apartments, beginning in 2018 (WorldBuild365, 2018a). Accordingly, the Russian government plans to increase residential floor space by an additional 120.0 million m2 per year to 2024 (Radio Free Europe, 2018). This will be a substantial increase over the last four years, when the average was about 80 million m2 per year (Rosstat, 2018).
The Russian Federation’s Ministry of Construction and Ministry of Industry and Trade – in conjunction with other entities – were asked in July 2017 to develop programmes for the building of wooden houses. The initiative includes the construction of wooden buildings higher than three stories (WorldBuild365, 2018b).
Construction output in the Ukraine increased by 17% in 2016 (after a cumulative decline of 42% between 2012 and 2015). During the first quarter of 2017, construction output in the Ukrainian non-residential sector increased by almost 21%, residential construction by 17% and civil engineering also by 17%, compared to the same period the previous year (KHL, 2018).
Kazakhstan is also experiencing solid growth in construction with total spending on buildings rising by 6.8% between January and May of 2016 (to over $2 billion). The residential construction component of this has risen by 9.9% during the same period, which is particularly impressive given that the average floor area has increased by 20% (WorldBuild365, 2018c).
10.4 North American construction market
The US housing market has been improving since its low-point in 2009, and the Canadian market has been steady (graph 10.4.1).
Although the overall US housing market has improved, new single-family house construction remains far below its historical average. In Canada, the primary concern in housing
0
0.2
0.4
0.6
0.8
1
1.2
1.4
1.6
1.8
Mill
ion
units
Total US Canada
GRAPH 10.4.1
Housing starts, North America, 2011-2020
Notes: e = estimate; f = forecast.
Sources: US Census Bureau, 2018a; CMHC, 2018; Mortgage Bankers Association, 2018.

UNECE/FAO Forest Products Annual Market Review, 2017-2018124
is overvaluation: prices are at historic highs, even after adjusting for inflation.
10.4.1 The US housing market
The US housing construction market continued its moderate growth in 2017. New housing starts remain below the 1959-to-2007 average of 1.547 million total units and 1.102 million single-family units. Total housing starts were estimated at a seasonally adjusted annualized rate (SAAR) of 1.287 million in April 2017, a 7.7% increase over April 2016 (graph 10.4.2) (US Census Bureau, 2018a).
US sales of newly constructed single-family houses amounted to 613,000 units (SAAR) in 2017 (US Census Bureau, 2018b). This was well below the 1963-to-2007 average (697,000 units) and similar to the average in 1963-1970, a period in which the civilian non-institutional population averaged 129,349 million, compared with 255,079 million in 2017 (Federal Reserve Bank of St. Louis, 2018b). The number of single-family units being built is insufficient for current population growth and there is a shortage of “starter houses” (which typically cost $200,000 or less). New single-family sales and starts are crucial for the wood products industry, with new single-family units consuming more value-added products than any other wood-consuming sector.
The median price for new single-family units in the US was $323,100 in 2017, an increase of 5.0% over 2016 ($307,800). The mean price was $384,900, up by 6.7% ($360,900). The median size of completed new single-family houses increased slightly in 2017, to 2,426 square feet (225.4 m2), up
from 2,422 square feet (225.0 m2) in 2016. The mean size was 2,631 square feet (244.4 m2), down from 2,640 square feet (245.3 m2) in 2016 (US Census Bureau, 2018b,c).
Sales of existing (i.e. previously owned) homes declined by 3.8% in 2017, to 5.510 million (down from 5.450 million in 2016). The median existing-house sales price in April 2018 was, $243,800 up by 5.7% over April 2017 (when it was $ 230,700) (Mortgage Bankers Association, 2018).
Total private residential construction spending (i.e. single-family + multifamily + remodelling) increased by 12.4% in the US in 2017, to $525 billion. New single-family construction spending increased by 11.4%, to $270.1 billion; multifamily expenditure decreased by 1.9%, to $59.9 billion; and house renovation spending increased by 19.1%, to $194.8 billion (all SAAR; nominal US dollars) (graph 10.4.3). The Joint Center for Housing (2018) estimated that $306 billion was spent on remodelling in the US in 2017 and forecast this to rise to $327.9 billion in 2018 and $341 billion in 2019.
Private non-residential spending increased by 1.3% in the US in 2017, to $437.8 billion, and public expenditure decreased by 3.2%, to $283.2 billion (US Census Bureau, 2018d) (graph 10.4.3).
Historically, US housing construction and sales have been a major component of US GDP. Before the housing crash and the global financial crisis, the contribution of housing to GDP averaged 17-19%. It was 15.9% in 2017, compared with 18.6% in 2005.
0
100
200
300
400
500
$ bi
llion
Non-residential Residential*
Remodelling Public
GRAPH 10.4.3
US construction spending, 2011-2018
Notes: *Private residential spending less remodelling expenditure (seasonally annualized adjusted rate); nominal values; e = estimate (January-April 2018 data).
Source: US Census Bureau, 2018d.
0
0.2
0.4
0.6
0.8
1
1.2
1.4
2011 2012 2013 2014 2015 2016 2017 2018e
Mill
ion
unit
s
Single-family permits Multifamily permitsSingle-family starts Multifamily startsTotal completions
GRAPH 10.4.2
US housing permits, starts and completions, 2011-2018
Notes: e = estimate (January-April 2018 data); SAAR = seasonally annualized adjusted rate.
Sources: US Census Bureau, 2018a; Mortgage Bankers Association, 2018.

125Chapter 10 Housing and construction
Residential investment peaked in 2005 at 6.5% of total GDP and averaged 4.9% from 1963 to 2006. It was only 3.5% of US GDP in the first quarter of 2018, however (US Bureau of Economic Analysis, 2018a,b,c), an additional indication that the new-housing-construction sector has further room to expand (US Bureau of Economic Analysis, 2018).
10.4.2 US construction outlook
The US housing market is improving, with most housing sectors progressing since 2009. According to housing analysts, robust housing construction and sales markets are impeded by deficient inventory of new and existing houses for sale; a lack of available lots for new construction and, in some locations, a lack of construction workers; regulatory burdens; a lack of builder financing; student-loan debts accrued from higher education; shifting attitudes towards house ownership; underemployment; and stagnant-to-declining median incomes. There remains a tendency for millennials (adults born in 1982 or later) to live with their parents. The number of household formations increased in 2017 but is still below the historical average.
The Mortgage Bankers Association (2018) projected new single-family housing starts in the US at 0.92 million units in 2018, 0.99 million units in 2019 and 1.03 million units in 2020. Projections for starts are 1.31 million units in 2018, 1.38 million units in 2019 and 1.41 million units in 2020. The Mortgage Bankers Association (2018) forecast new single-family sales of 0.65 million units in 2018, 0.67 million units in 2019 and 0.70 million units in 2020. Sales of existing houses are projected at 5.56 million units in 2018, 5.77 million units in 2019 and 5.93 million units in 2020.
10.4.3 Canadian housing construction market
Amid considerable unease about Canada’s rapidly escalating housing prices, federal, provincial and local governments
introduced regulations in 2017 to dampen rising prices and
valuations. These included a nationwide mortgage stress test;
a foreign buyer’s tax; and rent controls (Price Waterhouse
Coopers, 2018). By the first quarter of 2018, the effect of the
regulations had been a decline of 10% in the average sales
price for Canadian houses and a sharp drop in house sales
(Evans, 2018). House prices were down by 1.3%, year-on-year,
in June 2018 (CREA, 2018). Dolega and Sondhi (2018) forecast
that existing regulations, additional directives, and increasing
interest rates would hamper the housing market, which,
nevertheless, would remain “sturdy”.
Canadian new-housing starts were estimated at 219,763
units in 2017 and 191,528 in 2018 (CMHC, 2018). On average,
starts are projected at 201,000 units in 2019 and 205,000 units
in 2020 (BMO, 2018; Scotia Bank, 2018; Preston and DePratto,
2018). Of the starts in 2017, 76,843 were single-family; 28,046
were row-house units; 12,291 were semidetached units; and
102,583 were multifamily. Of the estimated starts in 2018,
61,378 are single-detached; 18,808 are row houses; 8,962 are
semidetached units; and 102,380 are multifamily units (graph
10.4.4) (CMHC, 2018). Estimated housing sales in 2017 were
510,489 units; projections are for sales of 459,900 units in
2018 and 474,800 units in 2019 (CREA, 2018).
Cléroux (2018) expected Canada’s GDP growth to slow to about
2% in 2019, with the provinces of Alberta, British Columbia,
Saskatchewan and Ontario the main economic drivers.
0
50
100
150
200
250
Thou
sand
uni
ts
Single-family Multifamily permits
Row Semi-detached
GRAPH 10.4.4
Housing starts, Canada, 2011-2018
Note: f = forecast.
Sources: BMO, 2018: CMHC, 2018; Scotia Bank, 2018; TD Bank, 2018.

UNECE/FAO Forest Products Annual Market Review, 2017-2018126
10.5 References
BIS. 2018. Global real housing prices. Available at: www.bis.org/publ/qtrpdf/r_qt1806z.htm
BMO. 2018. Canadian economic outlook. Available at: https://economics.bmocapitalmarkets.com/economics/forecast/ca/cdamodel.pdf
Brondino, R. 2018. House prices up by 4.5% in the euro area. Available at: http://ec.europa.eu/eurostat/ documents/2995521/9063723/2-10072018-AP-EN.pdf/78da5f86-cff5-4892-8f67-ecdafab88f3b
CREA. 2018. Quarterly forecasts. Canadian real Estate Association (CREA). Available at: www.crea.ca/housing-market-stats/quarterly-forecasts/
Cléroux, P. 2018. 2018 economic outlook: global growth brings good news for Canadian entrepreneurs. Available at: www.bdc.ca/en/blog/pages/2018-economic-outlook-global-growth-brings-good-news-canadian-entrepreneurs.aspx
CMHC. 2018. Housing market outlook. Canada Mortgage and Housing Corporation (CMHC). Available at: www03.cmhc-schl.gc.ca/hmiportal#Profile/1/1/Canada
Dolega, M and R. Sondhi. 2018. Regulation ‘n’ rates: a one-two punch ... not a knock-down blow for Canadian housing market. Available at: https://economics.td.com/canadian-housing-market-regulation-rates
Dorffmeister, L. 2017. Swansong for the construction of 1+2 family homes in Germany. Available at: www.euroconstruct.org/ec/blog/2017_10?utm_source=2017_10_Newsletter&utm_medium=Newsletter&utm_term=Blog_October_17&utm_campaign=2017_10Blog
ECSC. 2018a. European Construction Sector Observatory (ECSC), June 2018 – France. Available at: https://ec.europa.eu/ docsroom/documents/30663/attachments/1/translations/en/renditions/pdf
ECSC. 2018b. European Construction Sector Observatory (ECSC), June 2018 – Germany. Available at: https://ec.europa.eu/ docsroom/documents/30344/attachments/1/translations/en/renditions/pdf
ECSC. 2018c. European Construction Sector Observatory (ECSC), June 2018 – Poland. Available at: https://ec.europa.eu/ docsroom/documents/30668/attachments/1/translations/en/renditions/pdf
ECSC. 2018d. European Construction Sector Observatory (ECSC), June 2018 – Italy. Available at: https://ec.europa.eu/docsroom/documents/30665/attachments/1/translations/en/renditions/pdf
ECSC. 2018e. European Construction Sector Observatory (ECSC), June 2018 – Sweden. Available at: https://ec.europa.eu/docsroom/documents/23752/attachments/1/translations/en/renditions/native
Euroconstruct. 2004. 58th Euroconstruct summary report: outlook for the world’s key construction markets. 58th Euroconstruct Conference. December. Paris, France.
Euroconstruct. 2012. 74th Euroconstruct summary report: outlook for the world’s key construction markets. 74th Euroconstruct Conference. December. Munich, Germany.
Euroconstruct. 2017. 83rd Euroconstruct summary report: European construction: market trends until 2019. 83rd Euroconstruct Conference. June. Amsterdam, the Netherlands.
Euroconstruct. 2018. 85th Euroconstruct summary report: European Construction: market trends until 2050. 85th Euroconstruct Conference. June. Helsinki.
Evans, P. 2018. Sellers blame new mortgage rules as average Canadian house price falls 10% in past year. Available at: www.cbc.ca/news/business/housing-crea-1.4618028
Federal Reserve Bank of St. Louis. 2018a. Existing home sales. Available at: https://fred.stlouisfed.org/series/EXHOSLUSM495S
Federal Reserve Bank of St. Louis. 2018b. Civilian noninstitutional population. Available at: https://fred.stlouisfed.org/series/CNP16OV
Grandovska, B. 2018. Production in construction up by 1.8% in euro area. Available at: http://ec.europa.eu /eurostat/documents/2995521/8990137/4-19062018-AP-EN.pdf/416d7733-28f9-4eca-861a-2081d47c4ab9
Housing Europe. 2017. The state of housing in the EU 2017. Available at: www.housingeurope.eu/resource-1000/the-state-of-housing-in-the-eu-2017
IMF. 2018. World economic outlook. April 2018: cyclical upswing, structural change. International Monetary Fund (IMF). April. Available at: www.imf.org/en/Publications/WEO/Issues/2018/03/20/world-economic-outlook-april-2018
Joint Center for Housing. 2018. Home remodeling expected to remain strong and steady into 2019. Available at: www.jchs.harvard.edu/press-releases/home-remodeling-expected-remain-strong-and-steady-2019

127Chapter 10 Housing and construction
KHL. 2018. International Construction. Regional Report: CIS nations. Available at: https://www.khl.com/international-construction/regional-report-cis-nations-/132041.article
Lasek, M. 2018. Housing completion work gains momentum in anticipation of new laws. Available at: www.ceeconstruction.com/news/297900/housing-completion-work-gains-momentum-in-anticipation-of-new-laws/done
Möbert, J. 2018. The German housing market in 2018. Available at: www.dbresearch.com/PROD/RPS_EN-PROD/PROD0000000000460528/The_German_housing_market_in_2018.pdf
Mortgage Bankers Association. 2018. MBA mortgage finance forecast. June. Available at: www.mba.org/Documents/Research/Mtg%20Fin%20Forecast%20Jun%202018.pdf
Napoletano, S., Sandri, N. and Strube, G. 2018. How innovation is reshaping Europe’s urban environment. Available at: www.mckinsey.com/industries/capital-projects-and-infrastructure/our-insights/how-innovation-is-reshaping-europes-urban-environment
OECD. 2018. OECD economic outlook: stronger growth, but risks loom large. Organisation for Economic Co-operation and Development (OECD). Available at: www.oecd.org/eco/outlook/stronger-growth-but-risks-loom-large-oecd-economic-outlook-may-2018.pdf
Pajakkala, P. 2018. The living conditions in the Nordic countries are the world’s top class – why building of new dwellings there is still the most intensive in Europe. Available at: www.euroconstruct.org/ec/blog/2018_04
Price Waterhouse Coopers. 2018. Emerging trends in real estate® – US and Canada. The outlook for 2018. Available at: www.pwc.com/us/en/industries/asset-wealth-management/real-estate/emerging-trends-in-real-estate.html
Preston, L. and DePratto, B. 2018. Long-term forecast. Available at: https://economics.td.com/ca-long-term-forecast
Radio Free Europe. 2018. Putin’s “State of the Nation” speech. Annotated. Available at: www.rferl.org/a/putin-state-of-nation-speech-annotated/29071013.html.
Rosstat. 2018. Current Statistical Survey Magazine, 1(96). Federal State Statistics Service (Rosstat), Moscow. Available at: www.gks.ru/free_doc/doc_2016/magazine/st_ob1-eng.pdf
Scotia Bank. 2018. Global real estate trends. Available at: www.gbm.scotiabank.com/scpt/gbm/scotiaeconomics63/GRET_2018-05-30.pdf
Szemere, R. 2018. Global developments in residential property prices – fourth quarter of 2016. Bank of International Settlements. Available at: http://www.bis.org/statistics/pp_residential.pdf
TD Bank. 2018. Canadian economic outlook. Available at: https://economics.td.com/domains/economics.td.com/documents/reports/qef/2018-jun/CA_Outlook.htm
US Bureau of Economic Analysis. 2018. Housing’s contribution to gross domestic product (GDP). Table 1.1.10. Available at: www.bea.gov/itable
US Census Bureau. 2018a. New residential construction in April 2017. Available at: www.census.gov/construction/nrc/pdf/newresconst_201804.pdf
US Census Bureau. 2018b New privately owned housing units started in the United States by purpose and design. Available at: www.census.gov/construction/nrc/pdf/quarterly_starts_completions.pdf
US Census Bureau. 2018c. New residential sales in April 2017. Available at: www.census.gov/construction/nrs/pdf/newressales_201804.pdf
US Census Bureau. 2018d. Value of private construction put in place – seasonally adjusted annual rate. Available at: www.census.gov/construction/c30/c30index.html
World Bank. 2018a. Global economic prospects, June 2018. The turning of the tide? Washington, DC. Available at: https://openknowledge.worldbank.org/handle/10986/29801
World Bank. 2018b. The Russian economy: modest growth ahead. 39th issue of the Russia Economic Report. Available at: www.worldbank.org/en/country/russia/publication/rer
WorldBuild365. 2018a. Report reveals growth returning to Russian construction industry. Available at: www.worldbuild365.com/news/opsiupbzg/building-architecture/report-reveals-growth-returning-to-russian-construction-industry
WorldBuild365. 2018b. Wooden skyscrapers coming to Russia? Available at: www.worldbuild365.com/ news/3gqevolhj/building-architecture/wooden-skyscrapers-coming-to-russia
WorldBuild365. 2018c. Construction in Kazakhstan jumps 7%. Available at: https://www.worldbuild365.com/news/9bceqsjkj/building-architecture/construction-in-kazakhstan-jumps-7
Yacoubi, Y. 2017. French government takes legal action to address housing issue. Available at: www.euroconstruct.org/ec/blog/2017_09?utm_source=2017_09_Newsletter&utm_medium=Newsletter&utm_term=Blog_September_17&utm_campaign=2017_09Blog

ANNEXES

129Annexes
COMPONENTS OF WOOD PRODUCTS GROUPS ..................................................................................................................... 130
Roundwood flowchart .........................................................................................................................................................................................................................130
Wood-based panels flowchart ........................................................................................................................................................................................................130
Woodpulp flowchart..............................................................................................................................................................................................................................131
Paper and paperboard flowchart...................................................................................................................................................................................................131
COUNTRIES IN THE UNECE REGION AND ITS SUBREGIONS ................................................................................................. 132
LIST OF AUTHORS .......................................................................................................................................................................... 133
SOME FACTS ABOUT THE COMMITTEE ON FORESTS AND THE FOREST INDUSTRY ...................................................... 134
UNECE/FAO PUBLICATIONS ........................................................................................................................................................ 135

UNECE/FAO Forest Products Annual Market Review, 2017-2018130
COMPONENTS OF WOOD PRODUCTS GROUPS(Based on Joint Forest Sector Questionnaire nomenclature)
The important breakdowns of the major groups of primary forest products are diagrammed below. In addition, many sub-items are further divided into softwood or hardwood. These are: all the roundwood products; sawnwood; veneer sheets; and plywood. Items that do not fit into listed aggregates are not shown. These are wood charcoal; wood chips and particles; wood residues; sawnwood; other pulp; and recovered paper. The sources for pictures used in these diagrams are databanks of Metsä Group (2012), Raunion Saha (2012), Stora Enso (2012) and UPM (2012).
ROUNDWOOD
WOOD-BASED PANELS
Industrial wood in the rough
Plywood Particle board
OSB Hardboard
MDF
Other board
Fibreboard Veneer sheets
Sawlogs and veneer logs
Pulpwood (round & split)
Other industrial roundwood
Wood fuel

131Annexes
WOODPULP
PAPER AND PAPERBOARD
Mechanical Semi-chemical
Sulphate unbleached
Sulphate bleached
Sulphite bleached
Sulphite unbleached
Chemical Dissolving grades
Graphic papers
Household and sanitary paper Other paper and paperboard
Newsprint Case materials
Uncoated mechanical Folding boxboard
Uncoated woodfree Wrapping papers
Coated paper Other papers mainly for packaging
Packaging material

UNECE/FAO Forest Products Annual Market Review, 2017-2018132
COUNTRIES IN THE UNECE REGION AND ITS SUBREGIONS

133Annexes
LIST OF AUTHORS
First name Family name Chapter(s) Affiliation Email address
Orifjon Abidov 6 European Panel Federation, Brussels, Belgium [email protected]
Karen Abt 8Southern Research Station, USDA Forest Service, Research Triangle Park, NC
Francisco Aguilar 8 University of Missouri, Columbia, Missouri, US [email protected]
Eduard Akim 7State Technological University of Plant Polymers, St Petersburg, Russian Federation
Delton Alderman 10USDA Forest Service, Princeton, West Virginia, US
Matthew Bumgardner 5 USDA Forest Service, Delaware, Ohio, US [email protected]
Vladimir Dmitriev 8 Federal Forestry Agency [email protected]
Ivan Eastin 6University of Washington, Seattle, Washington, US
Håkan Ekström 3Wood Resources International LLC, Seattle, Washington, US
Kathryn Fernholz 2 Dovetail Partners, Minneapolis, Minnesota, US [email protected]
Christopher Gaston 9 FPInnovations, Vancouver, Canada [email protected]
Branko Glavonjić 8Faculty of Forestry, Belgrade State University, Belgrade, Serbia
Antti Koskinen 4Pöyry Management Consulting Oy, Vantaa, Finland
Klaus Kottwitz 5 Timber and Sawmill Industry (DeSH) [email protected]
Bernard Lombard 7Confederation of European Paper Industries, Brussels, Belgium
William Luppold 5USDA Forest Service, Princeton, West Virginia, US
Warren Mabee 8 Queens University, Kingston, Ontario, Canada [email protected]
Frances Maplesden 4, 5, 6 Maplesden Consulting, Rotorua, New Zealand [email protected]
Igor Novoselov 2, 4, 5, 6 WhatWood, Moscow, Russian Federation [email protected]
Tapani Pahkasalo 9 Indufor, Helsinki, Finland [email protected]
José Palacín 1United Nations Economic Commission for Europe, Geneva, Switzerland
Houston Sudekum 8 University of Missouri, Columbia, Missouri, US [email protected]
Russ Taylor 4International Wood Markets Group Inc., Vancouver, BC, Canada
Michel Valois 7Valois Vision Marketing, Vancouver, BC, Canada
Oleg Vasilyev 8 Saint Petersburg Forestry Research institute [email protected]

UNECE/FAO Forest Products Annual Market Review, 2017-2018134
SOME FACTS ABOUT THE COMMITTEE ON FORESTS AND THE FOREST INDUSTRY
The UNECE Committee on Forests and the Forest Industries is a principal subsidiary body of the UNECE (United Nations Economic Commission for Europe) based in Geneva. It constitutes a forum for cooperation and consultation between member countries on forestry, the forest industry and forest product matters. All countries of Europe, the Commonwealth of Independent States, the United States of America, Canada and Israel are members of the UNECE and participate in its work.
The UNECE Committee on Forests and the Forest Industries shall, within the context of sustainable development, provide member countries with the information and services needed for policymaking and decision-making with regard to their forest and forest industry sectors, including the trade and use of forest products and, where appropriate, will formulate recommendations addressed to member governments and interested organizations. To this end, it shall:
1. With the active participation of member countries, undertake short-, medium- and long-term analyses of developments in, and having an impact on, the sector, including those developments offering possibilities for the facilitation of international trade and for enhancing the protection of the environment;
2. In support of these analyses, collect, store and disseminate statistics relating to the sector, and carry out activities to improve their quality and comparability;
3. Provide the framework for cooperation e.g. by organising seminars, workshops and ad hoc meetings and setting up time-limited ad hoc groups, for the exchange of economic, environmental and technical information between governments and other institutions of member countries required for the development and implementation of policies leading to the sustainable development of the sector and to the protection of the environment in their respective countries;
4. Carry out tasks identified by the UNECE or the Committee on Forests and the Forest Industries as being of priority, including the facilitation of subregional cooperation and activities in support of the economies in transition of central and eastern Europe and of the countries of the region that are developing from an economic perspective;
5. It should also keep under review its structure and priorities and cooperate with other international and intergovernmental organizations active in the sector, and in particular with the FAO (the Food and Agriculture Organization of the United Nations) and its European Forestry Commission, and with the ILO (the International Labour Organisation), in order to ensure complementarity and to avoid duplication, thereby optimizing the use of resources.
More information about the Committee’s work may be obtained by contacting:
UNECE/FAO Forestry and Timber Section
Forests, Land and Housing Division
United Nations Economic Commission for Europe/
Food and Agriculture Organization of the United Nations
Palais des Nations
CH-1211 Geneva 10, Switzerland
www.unece.org/forests

135Annexes
UNECE/FAO PUBLICATIONS
Forest Products Annual Market Review 2016-2017 ECE/TIM/SP/41
Note: other market-related publications and information are available in electronic format at our website.
Geneva Timber and Forest Study Papers
Forests and Water ECE/TIM/SP/43Wood Energy in the ECE Region ECE/TIM/SP/42Forest Products Annual Market Review 2016-2017 ECE/TIM/SP/41Forest Products Annual Market Review 2015-2016 ECE/TIM/SP/40Forest Products Annual Market Review 2014-2015 ECE/TIM/SP/39Promoting sustainable building materials and the implications on the use of wood in buildings ECE/TIM/SP/38Forests in the ECE Region: Trends and Challenges in Achieving the Global Objectives on Forests ECE/TIM/SP/37Forest Products Annual Market Review 2013-2014 ECE/TIM/SP/36Rovaniemi Action Plan for the Forest Sector in a Green Economy ECE/TIM/SP/35The Value of Forests: Payments for Ecosystem Services in a Green Economy ECE/TIM/SP/34Forest Products Annual Market Review 2012-2013 ECE/TIM/SP/33The Lviv Forum on Forests in a Green Economy ECE/TIM/SP/32Forests and Economic Development: A Driver for the Green Economy in the ECE Region ECE/TIM/SP/31Forest Products Annual Market Review 2011-2012 ECE/TIM/SP/30The North American Forest Sector Outlook Study 2006-2030 ECE/TIM/SP/29European Forest Sector Outlook Study 2010-2030 ECE/TIM/SP/28Forest Products Annual Market Review 2010-2011 ECE/TIM/SP/27Private Forest Ownership in Europe ECE/TIM/SP/26Forest Products Annual Market Review 2009-2010 ECE/TIM/SP/25Forest Products Annual Market Review 2008-2009 ECE/TIM/SP/24Forest Products Annual Market Review 2007-2008 ECE/TIM/SP/23Forest Products Annual Market Review 2006-2007 ECE/TIM/SP/22Forest Products Annual Market Review, 2005-2006 ECE/TIM/SP/21European Forest Sector Outlook Study: 1960 – 2000 – 2020, Main Report ECE/TIM/SP/20Forest policies and institutions of Europe, 1998-2000 ECE/TIM/SP/19Forest and Forest Products Country Profile: Russian Federation ECE/TIM/SP/18
(Country profiles also exist on Albania, Armenia, Belarus, Bulgaria, former Czech and Slovak Federal Republic, Estonia, Georgia, Hungary, Lithuania, Poland, Romania, Republic of Moldova, Slovenia and Ukraine)
Forest resources of Europe, CIS, North America, Australia, Japan and New Zealand ECE/TIM/SP/17
The above series of sales publications and subscriptions are available through United Nations Publications Offices as follows:
Sales and Marketing Section, Room DC2-853
United Nations
2 United Nations Plaza
New York, NY 10017
United States of America
E-mail: [email protected]
Web site: https://shop.un.org/

UNECE/FAO Forest Products Annual Market Review, 2017-2018136
Geneva Timber and Forest Discussion Papers (original language only)
Forecast of the Committee on Forests and the Forest Industry: Forest Products Production and Trade 2016-2018 ECE/TIM/DP/69Forecast of the Committee on Forests and the Forest Industry: Forest Products Production and Trade 2015-2017 ECE/TIM/DP/68ECE Committee on Forests and the Forest Industry and European Forestry Commission: 70 years working in the Service of Forests and people ECE/TIM/DP/67Pilot project on the System for the Evaluation of the Management of Forests (SEMAFOR) ECE/TIM/DP/66Forecast of the Committee on Forests and the Forest Industry: Forest Products Production and Trade 2014-2016 ECE/TIM/DP/64Forecast of the Committee on Forests and the Forest Industry: Forest Products Production and Trade 2013-2015 ECE/TIM/DP/63Competitiveness of the European Forest Sector ECE/TIM/DP/62Forecast of the Committee on Forests and the Forest Industry: Forest Products Production and Trade 2012-2014 ECE/TIM/DP/61Forecast of the Committee on Forests and the Forest Industry: Forest Products Production and Trade 2011-2013 ECE/TIM/DP/60Econometric Modelling and Projections of Wood Products Demand, Supply and Trade in Europe ECE/TIM/DP/59Swedish Forest Sector Outlook Study ECE/TIM/DP/58The Importance of China’s Forest Products Markets to the UNECE Region ECE/TIM/DP/57Good Practice Guidance on Sustainable Mobilisation of Wood: Proceedings from the Grenoble Workshop *ECE/TIM/DP/56Harvested Wood Products in the Context of Climate Change Policies: Workshop Proceedings - 2008 *ECE/TIM/DP/55The Forest Sector in the Green Economy ECE/TIM/DP/54National Wood Resources Balances: Workshop Proceedings *ECE/TIM/DP/53Potential Wood Supply in Europe *ECE/TIM/DP/52Wood Availability and Demand in Europe *ECE/TIM/DP/51Forest Products Conversion Factors for the UNECE Region ECE/TIM/DP/49Mobilizing Wood Resources: Can Europe's Forests Satisfy the Increasing Demand for Raw Material and Energy Under Sustainable Forest Management? Workshop Proceedings - January 2007 *ECE/TIM/DP/48European Forest Sector Outlook Study: Trends 2000-2005 Compared to the EFSOS Scenarios ECE/TIM/DP/47Forest and Forest Products Country Profile; Tajikistan *ECE/TIM/DP/46Forest and Forest Products Country Profile: Uzbekistan ECE/TIM/DP/45Forest Certification – Do Governments Have a Role? ECE/TIM/DP/44International Forest Sector Institutions and Policy Instruments for Europe: A Source Book ECE/TIM/DP/43Forests, Wood and Energy: Policy Interactions ECE/TIM/DP/42Outlook for the Development of European Forest Resources ECE/TIM/DP/41Forest and Forest Products Country Profile: Serbia and Montenegro ECE/TIM/DP/40Forest Certification Update for the UNECE Region, 2003 ECE/TIM/DP/39Forest and Forest Products Country Profile: Republic of Bulgaria ECE/TIM/DP/38Forest Legislation in Europe: How 23 Countries Approach the Obligation to Reforest, Public Access and Use of Non-Wood Forest Products ECE/TIM/DP/37Value-Added Wood Products Markets, 2001-2003 ECE/TIM/DP/36Trends in the Tropical Timber Trade, 2002-2003 ECE/TIM/DP/35Biological Diversity, Tree Species Composition and Environmental Protection in the Regional FRA-2000 ECE/TIM/DP/33Forestry and Forest Products Country Profile: Ukraine ECE/TIM/DP/32The Development of European Forest Resources, 1950 To 2000: a Better Information Base ECE/TIM/DP/31Modelling and Projections of Forest Products Demand, Supply and Trade in Europe ECE/TIM/DP/30Employment Trends and Prospects in the European Forest Sector ECE/TIM/DP/29Forestry Cooperation with Countries in Transition ECE/TIM/DP/28Russian Federation Forest Sector Outlook Study ECE/TIM/DP/27Forest and Forest Products Country Profile: Georgia ECE/TIM/DP/26Forest certification update for the UNECE region, summer 2002 ECE/TIM/DP/25Forecasts of economic growth in OECD and central and eastern European countries for the period 2000-2040 ECE/TIM/DP/24Forest Certification update for the UNECE Region, summer 2001 ECE/TIM/DP/23Structural, Compositional and Functional Aspects of Forest Biodiversity in Europe ECE/TIM/DP/22Markets for secondary processed wood products, 1990-2000 ECE/TIM/DP/21Forest certification update for the UNECE Region, summer 2000 ECE/TIM/DP/20Trade and environment issues in the forest and forest products sector ECE/TIM/DP/19Multiple use forestry ECE/TIM/DP/18Forest certification update for the UNECE Region, summer 1999 ECE/TIM/DP/17

137Annexes
A summary of “The competitive climate for wood products and paper packaging: the factors causing substitution with emphasis on environmental promotions” ECE/TIM/DP/16Recycling, energy and market interactions ECE/TIM/DP/15The status of forest certification in the UNECE region ECE/TIM/DP/14The role of women on forest properties in Haute-Savoie (France): Initial research ECE/TIM/DP/13Interim report on the Implementation of Resolution H3 of the Helsinki Ministerial Conference on the protection of forests in Europe (Results of the second enquiry) ECE/TIM/DP/12Manual on acute forest damage ECE/TIM/DP/7
* signifies electronic publication only
The above series of publications may be requested free of charge through:
UNECE/FAO Forestry and Timber Section
Economic Cooperation, Trade, and Land Management Division
United Nations Economic Commission for Europe
Palais des Nations
CH-1211 Geneva 10, Switzerland
E-mail: [email protected]
Downloads are available at: www.unece.org/forests

UNECE/FAO Forest Products Annual Market Review, 2017-2018138

Fore
st P
rodu
cts
Ann
ual M
arke
t Rev
iew
201
7-20
18
Designed and Printed at United Nations, Geneva – 1825125 (E) – September 2018 – 1,341 – ECE/TIM/SP/46
The Forest Products Annual Market Review 2017-2018 provides a comprehensive analysis of markets in the UNECE region and reports on the main market influences outside the UNECE region. It covers the range of products from the forest to the end-user: from roundwood and primary processed products to value-added and innovative wood products.
Statistics-based chapters of the Review analyse the markets for wood raw materials, sawn softwood, sawn hardwood, wood-based panels, paper, paperboard and woodpulp. Other chapters analyse policies, trade measures, markets for wood energy, value-added wood products and housing. Underlying the analysis is a comprehensive collection of data.
The Review highlights the role of sustainable forest products in international markets. Policies concerning forests and forest products are discussed, as well as the main drivers and trends. The Review also analyses the effects of the current economic situation on forest products markets.
The Review provides a foundation for the Market Discussions held at the annual session of the UNECE Committee on Forests and the Forest Industry, and it also provides valuable and objective information for other policymakers, researchers and investors.
Further information on forest products markets, as well as on the UNECE Committee on Forests and the Forest Industry and the FAO European Forestry Commission, is available at: www.unece.org/forests.
The Review has a statistical annex, which is available at: www.unece.org/fpamr2018.html
Forest Products - Annual M
arket Review 2017-2018
Palais des NationsCH - 1211 Geneva 10, SwitzerlandTelephone: +41(0)22 917 12 34Fax: +41(0)22 917 05 05E-mail: [email protected]: http://www.unece.org
Information ServiceUnited Nations Economic Commission for Europe
UN
ECEU
NITED
NATIO
NS
ISBN 978-92-1-117174-7
Related Documents