Forest Landscape Assessment Tool (FLAT): Rapid Assessment for Land Management Lisa Ciecko, David Kimmett, Jesse Saunders, Rachael Katz, Kathleen L. Wolf, Oliver Bazinet, Jeffrey Richardson, Weston Brinkley, and Dale J. Blahna United States Department of Agriculture Forest Service Pacific Northwest Research Station General Technical Report PNW-GTR-941 September 2016

Welcome message from author
This document is posted to help you gain knowledge. Please leave a comment to let me know what you think about it! Share it to your friends and learn new things together.
Transcript
Forest Landscape Assessment Tool (FLAT): Rapid Assessment for Land ManagementLisa Ciecko, David Kimmett, Jesse Saunders, Rachael Katz, Kathleen L. Wolf, Oliver Bazinet, Jeffrey Richardson, Weston Brinkley, and Dale J. Blahna
United States Department of Agriculture
Forest Service
Pacific Northwest Research Station
General Technical ReportPNW-GTR-941
September 2016
AuthorsLisa Ciecko is a plant ecologist, Seattle Parks and Recreation, 1600 S Dakota Street, Seattle, WA 98108; David Kimmett is a natural lands program/project manager, King County Parks and Recreation Division, King Street Center, 201 S Jackson St., Room 700, Seattle, WA 98104-3855; Jesse Saunders is a resource information forester, American Forest Management, Inc., 11415 NE 128th Street, Suite 110, Kirkland, WA 98034; Rachael Katz is an environmental planner, Tetra Tech, 19803 North Creek Parkway, Bothell, WA 98011; Kathleen L. Wolf is a research social scientist and Jeffrey Richardson is a postdoctoral research associ-ate, University of Washington, School of Environmental and Forest Sciences, Box 352100, Seattle, WA 98195; Oliver Bazinet is an environmental analyst, Seattle Parks and Recreation, 309 Pontius Ave. N, Seattle, WA 98109; Weston Brinkley is principal and owner, Street Sounds Ecology, LLC, Seattle, WA 98107; Dale J. Blahna is a research social scientist, U.S. Department of Agriculture, Forest Service, Pacific Northwest Research Station, 400 N 34th St., Seattle, WA 98103.
Cover: (left) field data collection in a King County, Washington, forest reserve area, photo courtesy of Forterra; (upper right) forested green spaces provide opportuni-ties for active living, and (lower right) field training for FLAT assessment volun-teers, photo courtesy of King County Department of Natural Resources and Parks.
In accordance with Federal civil rights law and U.S. Department of Agriculture (USDA) civil rights regulations and policies, the USDA, its Agencies, offices, and employees, and institutions participating in or administering USDA programs are prohibited from discriminating based on race, color, national origin, religion, sex, gender identity (including gender expression), sexual orientation, disability, age, marital status, family/parental status, income derived from a public assistance program, political beliefs, or reprisal or retaliation for prior civil rights activity, in any program or activity conducted or funded by USDA (not all bases apply to all programs). Remedies and complaint filing deadlines vary by program or incident.
Persons with disabilities who require alternative means of communication for program information (e.g., Braille, large print, audiotape, American Sign Language, etc.) should contact the responsible Agency or USDA’s TARGET Center at (202) 720-2600 (voice and TTY) or contact USDA through the Federal Relay Service at (800) 877-8339. Additionally, program information may be made available in languages other than English.
To file a program discrimination complaint, complete the USDA Program Discrimination Complaint Form, AD-3027, found online at http://www.ascr.usda.gov/complaint_filing_cust.html and at any USDA office or write a letter addressed to USDA and provide in the letter all of the information requested in the form. To request a copy of the complaint form, call (866) 632-9992. Submit your completed form or letter to USDA by: (1) mail: U.S. Department of Agriculture, Office of the Assistant Secretary for Civil Rights, 1400 Independence Avenue, SW, Washington, D.C. 20250-9410; (2) fax: (202) 690-7442; or (3) email: [email protected](link sends e-mail).
USDA is an equal opportunity provider, employer and lender.
Forest Landscape Assessment Tool (FLAT): Rapid Assessment for Land Management
Lisa Ciecko, David Kimmett, Jesse Saunders, Rachael Katz, Kathleen L. Wolf, Oliver Bazinet, Jeffrey Richardson, Weston Brinkley, and Dale J. Blahna
U.S. Department of AgricultureForest ServicePacific Northwest Research Station Portland, Oregon General Technical Report PNW-GTR-941 September 2016
AbstractCiecko, Lisa; Kimmett, David; Saunders, Jesse; Katz, Rachael; Wolf, Kathleen
L.; Bazinet, Oliver; Richardson, Jeffrey; Brinkley, Weston; Blahna, Dale J. 2016. Forest Landscape Assessment Tool (FLAT): rapid assessment for land management. Gen. Tech. Rep. PNW-GTR-941. Portland, OR: U.S. Department of Agriculture, Forest Service, Pacific Northwest Research Station. 51 p.
The Forest Landscape Assessment Tool (FLAT) is a set of procedures and tools used to rapidly determine forest ecological conditions and potential threats. FLAT enables planners and managers to understand baseline conditions, determine and prioritize restoration needs across a landscape system, and conduct ongo-ing monitoring to achieve land management goals. The rapid assessment process presents a cost-effective opportunity for landowners that include local governments, private owners, and nongovernmental organizations to use ecological data to guide decisionmaking and improve environmental outcomes on their lands. This report is an introduction to FLAT, providing an overview of its purpose, methods, and implications for land management in diverse regions. FLAT is executed in three sequential phases: Phase 1—Forest Cover Type Mapping, Phase 2—Field Assess-ment, and Phase 3—Management Prioritization. Overall, FLAT consists of onsite visual estimation (aided by remote sensing) of ecological conditions by a trained field team to produce a forest inventory. In addition to providing baseline data and a framework to prioritize actions, FLAT can be used as a monitoring tool to evaluate changing conditions and inform adjustments in management strategies and priori-ties. To illustrate FLAT implementation, the King County Department of Natural Resources and Parks case study details a pilot project conducted on 24,700 of the more than 26,000 ac of county lands. King County is using the results from FLAT to develop and implement forest stewardship plans and target efforts of its volunteer restoration program. Although the tool was initially used in lowland forests in the Puget Sound region, in concept, FLAT could be expanded and adapted for use in a wide variety of ecosystem types.
Keywords: Forest, assessment, stewardship, planning, ecology, baseline, monitoring, land management.
Executive Summary The Forest Landscape Assessment Tool (FLAT) is a set of procedures and tools designed to provide local government agencies, nongovernmental organizations, land managers, and private landowners with a rapid, systematic, flexible, and inex-pensive environmental evaluation. The technical information produced by FLAT provides a standardized baseline of ecological data.
This data can be used to evaluate forest parcels within the context of the broader landscape, providing information about key forest characteristics and potential threats. FLAT also provides a framework to identify high-ecological value, high-threat areas within a single site and across multiple holdings for poten-tial management action. The results from FLAT provide an essential starting point for developing either a systemwide stewardship plan or management plans for single parcels. In addition to providing baseline data and a framework to prioritize actions, FLAT could also be used as a monitoring tool to evaluate changing conditions and inform adjustments in management strategies and priorities.
FLAT was developed and piloted by the Green Cities Research Alliance. Key FLAT contributors include the USDA Forest Service Pacific Northwest Research Station, King County, Forterra, American Forest Management (formerly Interna-tional Forestry Consultants), and the University of Washington. Work on FLAT began in 2009 to provide a comprehensive forest resource analysis for King County, an important first step toward developing a long-term, systemwide forest steward-ship program on more than 26,000 ac of King County lands.
Based on principles of restoration and landscape ecology, as well as traditional forestry, FLAT is conducted in three broad sequential phases:
Phase 1—Forest Type Mapping: Aerial imagery and boundary data are used in a lab or office to divide a project area into management units (MUs), the unit of observation and measurement for the assessment. Data attributes are also developed during Phase 1 based on local conditions and assessment purposes (e.g., species composition, size and age classes, invasive species, tree-canopy vigor, etc).
Phase 2—Field Assessment: A trained field team visits the project area to collect estimates of each attribute for each MU. Such teams may include professionals, technicians, and volunteer stewards.
FLAT data provide the basis for forest stewardship or management plans.
Phase 3—Management Strategies and Prioritization: The data, which provide a snapshot of ecological conditions in the project area (within and across all MUs), can be used to classify or rank each MU. The assigned values can be viewed spa-tially to provide a mapped, visual representation of landscape conditions. These re-sults can then be used to prioritize where on-the-ground management actions would most improve ecological function and health, contributing to long-term sustainabil-ity of a forest area.
Owing to the success of local conservation efforts, property acquisitions, and various incentives to conserve open space, King County’s resource managers have an extensive inventory of resource lands, but have little condition information to guide management efforts. Seeking to learn more about these diverse holdings and inform management decisions, FLAT was implemented on 24,700 ac of the more than 26,000-ac system.
For the first time, King County managers now have baseline ecological infor-mation about all of their forested parks and natural areas. A key finding was the prominence of red alder (Alnus rubra Bong.) and bigleaf maple (Acer macrophyllum Pursh) on many parcels. Both are relatively short-lived species, and a high percent-age of these trees are 30 to 100 years old. These forests could benefit from active management and restoration, as the health decline of old trees signals the need for tree replacement and hazard management.
FLAT utilizes a straightforward rating scale of 1 to 9 to indicate a balance of species composition value (favoring larger native trees) and degree of health threat, particularly owing to invasive species cover. Overall, more than 5,000 ac of King County forest lands have a rating of 2 or 3, indicating high forest composition value and medium-to-high forest health threat values. In the case of McGarvey Park Open Space, as an example, a large portion of the forest cover is rated as 5 or 6, indicating that there is a medium composition value and medium-to-high presence of forest health threats. The ratings can become the basis for priority setting for both locations of management work, and for on-the-ground actions to conserve or restore forests.
King County is using FLAT results to develop forest stewardship plans for indi-vidual sites, as well as communicate and implement management priorities across the entire parks and open space system. In the future, FLAT may be conducted in recurring intervals to monitor progress and evaluate the effectiveness of restora-tion efforts. As a relatively new tool used in forested lands, FLAT has potential for further development, testing, and refinement.
FLAT can be used for both baseline and monitoring forest assessment.

Resource managers in other communities can learn from King County’s experi-ences and modify the FLAT methods to conduct an assessment that addresses local conditions and priorities. Although currently designed for use in lowland forests of the Puget Sound region, the tool’s basic framework and data variables could be adapted for a wide variety of ecosystem types. Future research could generate indicator and matrix tools that inform management prioritization for additional ecosystem types (such as pine forest or riparian systems). Practitioners may also be interested in applying FLAT as a practical method for general ecosystem monitor-ing focused on a particular ecosystem condition or outcome, such as biodiversity, wildlife habitat, or local effects of climate change.

Contents 1 Introduction 2 Background 2 Importance of Assessment for Decisionmaking and Adaptive Management 4 Overview of FLAT 5 Foundations of FLAT 8 Comparison to Existing Assessment Methods 12 FLAT Methodology 12 Project Considerations and Planning 14 Phase 1: Forest Cover Type Mapping 15 Phase 2: Field Assessment 16 Phase 3: Management Prioritization 19 King County Parks and Open Spaces Case Study 20 Project Process 26 Results 30 Management Implications 32 Conclusions 32 Importance in Land Management 33 FLAT Feasibility 34 Stewardship 35 Limitations 36 Next Steps 37 Acknowledgments 38 References 40 Appendix 1—How to Develop the Assessment Area and Management Units 45 Appendix 2—Necessary Data 47 Appendix 3—Equipment List 48 Appendix 4—King County Data Attributes 50 Appendix 5—Cost Analysis 51 Appendix 6—FLAT Field Manual
1
Forest Landscape Assessment Tool (FLAT): Rapid Assessment for Land Management
Introduction The Forest Landscape Assessment Tool (FLAT) is a set of processes and tools that produces an ecological assessment for environmental land use planning and man-agement. In its pilot use, FLAT has proven to be a flexible, systematic, and low-cost process for land managers and related decisionmakers to achieve a rapid ecological survey of a portfolio of diverse parcels and land holdings.
FLAT can provide landowners with straightforward ecological information regarding the composition and overall health of their forest lands, and to understand potential threats. It is a tool that can readily be used by such landowners as local governments, private owners, and nongovernmental organizations (NGOs) with minimal training and time invested to achieve useful results. The data and rating framework provided by FLAT better prepare land managers and planners to make strategic land management and restoration decisions.
Assessments can potentially be repeated over time as a practical monitoring program to observe forest changes and gauge the effectiveness of management actions. A longer view can help managers understand how and why conditions are changing on the ground and enable them to adjust programs accordingly.
Although the FLAT protocols presented here have been developed for use in lowland forests of the Puget Sound region located along an urban-to-rural landscape gradient, the tool could be adapted for land managers working in other ecosystems as well.
This report provides an overview of the FLAT approach. The following sec-tions will demonstrate its implementation and describe its data outputs, including assessment options. The “Background” section first reviews the importance of ecological assessment for effective land management, then describes FLAT, includ-ing its origins and function relative to other assessment methods. With this under-standing, the “FLAT Methodology” section provides details on important project considerations and how to use FLAT. Additional method details are provided in the appendices. Next, the “King County Parks Case Study” section presents results and insights from a pilot FLAT project, and is one example of how FLAT has been successfully applied to support stewardship goals. The report concludes with discussion of FLAT’s unique advantages, some key limitations, and potential next steps for management application, monitoring, and research.
FLAT is a flexible low-cost tool for rapid ecological field surveys.
2
GENERAL TECHNICAL REPORT PNW-GTR-941
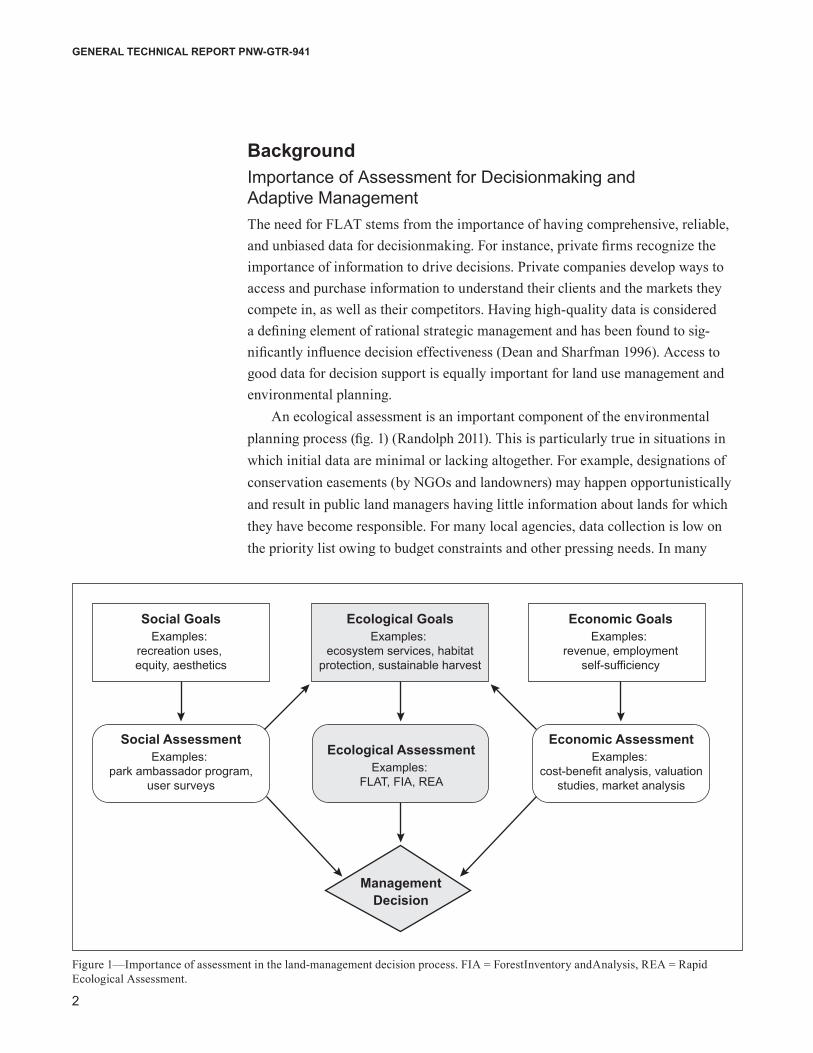
BackgroundImportance of Assessment for Decisionmaking and Adaptive ManagementThe need for FLAT stems from the importance of having comprehensive, reliable, and unbiased data for decisionmaking. For instance, private firms recognize the importance of information to drive decisions. Private companies develop ways to access and purchase information to understand their clients and the markets they compete in, as well as their competitors. Having high-quality data is considered a defining element of rational strategic management and has been found to sig-nificantly influence decision effectiveness (Dean and Sharfman 1996). Access to good data for decision support is equally important for land use management and environmental planning.
An ecological assessment is an important component of the environmental planning process (fig. 1) (Randolph 2011). This is particularly true in situations in which initial data are minimal or lacking altogether. For example, designations of conservation easements (by NGOs and landowners) may happen opportunistically and result in public land managers having little information about lands for which they have become responsible. For many local agencies, data collection is low on the priority list owing to budget constraints and other pressing needs. In many
Social GoalsExamples:
recreation uses, equity, aesthetics
Social AssessmentExamples:
park ambassador program,user surveys
Ecological AssessmentExamples:
FLAT, FIA, REA
Ecological GoalsExamples:
ecosystem services, habitatprotection, sustainable harvest
Economic GoalsExamples:
revenue, employmentself-sufficiency
Economic AssessmentExamples:
cost-benefit analysis, valuationstudies, market analysis
ManagementDecision
Figure 1—Importance of assessment in the land-management decision process. FIA = ForestInventory andAnalysis, REA = Rapid Ecological Assessment.
3
Forest Landscape Assessment Tool (FLAT): Rapid Assessment for Land Management
cases, even if information exists, it may not be comparable in methodology, com-pleteness, or quality across different parcels. This lack of consistent information can make it difficult, if not impossible, to strategically prioritize sites for manage-ment actions or target resource allocations across a system.
For the forested landscapes considered by FLAT, management and plan-ning decisions often address multiple, nested landscape scales. They may start from large, more broadly defined areas and system goals (such as a watershed), then be translated to site-specific plans (Marsh 1978). Some form of assessment ideally takes place at each of these scales so that strategies can be developed to achieve goals:• Across a landscape system, by protecting specific, strategically located
lands with easements, conservation status, or acquisition,• That consider action alternatives, such as restoration, development,
or harvest,• Applied within a parcel or holding, for instance, by prioritizing certain
areas for restoration work, and• To address particular needs of any distinct system having a natural bound-
ary (such as a riparian corridor or wetland).
FLAT is designed primarily for use on the landscape scale to provide key eco-logical information for each of any number of sites within an ecological system or parcel network. The data can be aggregated and analyzed to support a management approach that is successful and sustainable over time. FLAT data can also serve as a starting point for more detailed site-specific plans or monitoring.
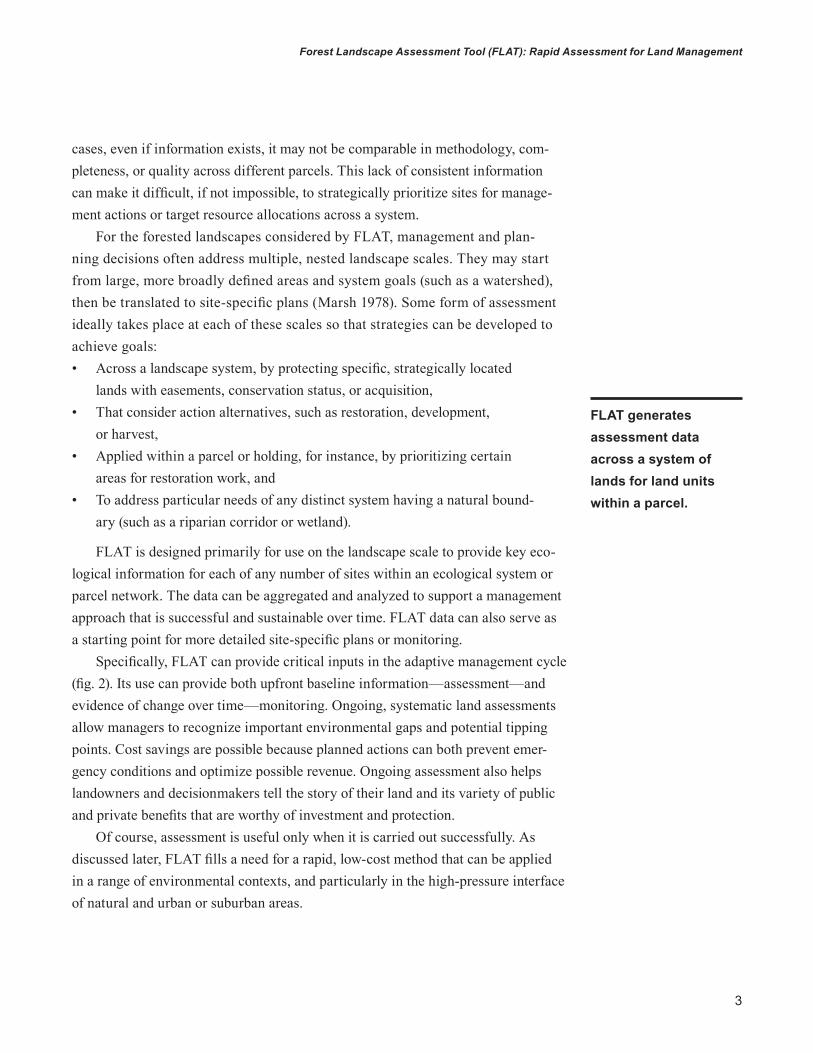
Specifically, FLAT can provide critical inputs in the adaptive management cycle (fig. 2). Its use can provide both upfront baseline information—assessment—and evidence of change over time—monitoring. Ongoing, systematic land assessments allow managers to recognize important environmental gaps and potential tipping points. Cost savings are possible because planned actions can both prevent emer-gency conditions and optimize possible revenue. Ongoing assessment also helps landowners and decisionmakers tell the story of their land and its variety of public and private benefits that are worthy of investment and protection.
Of course, assessment is useful only when it is carried out successfully. As discussed later, FLAT fills a need for a rapid, low-cost method that can be applied in a range of environmental contexts, and particularly in the high-pressure interface of natural and urban or suburban areas.
FLAT generates assessment data across a system of lands for land units within a parcel.
4
GENERAL TECHNICAL REPORT PNW-GTR-941
Overview of FLAT FLAT is an assessment technique that provides land managers and planners with ecological information to: • Make decisions at the broader, systemwide scale, and • Prioritize different parcels or areas within parcels for specific land uses
or actions.
Its advantage over more traditional forestry sampling, measurement, and extrapolation techniques is that it allows a rapid assessment of ecological condi-tions based on visual on-the-ground surveys of management units delineated from remote-sensing data. Although FLAT may not be as precise as more research-oriented sampling techniques, it efficiently provides accurate, practical descriptions of ecological conditions within and across a collection of sites. This “thumb-nail sketch” can be used to target where indepth assessment may be necessary.
Generally, FLAT consists of visual estimates of ecological conditions by trained individuals to produce a forest inventory. Although field teams should follow guidelines to calibrate their estimates, the assessment itself is generally qualitative and relies on carefully prepared estimates rather than precise measurements. FLAT is executed in three phases:
Phase 1: forest cover type mapping—Aerial imagery and boundary data are used to divide each parcel within a project area (such as King County, as described below) into polygons, and to delineate
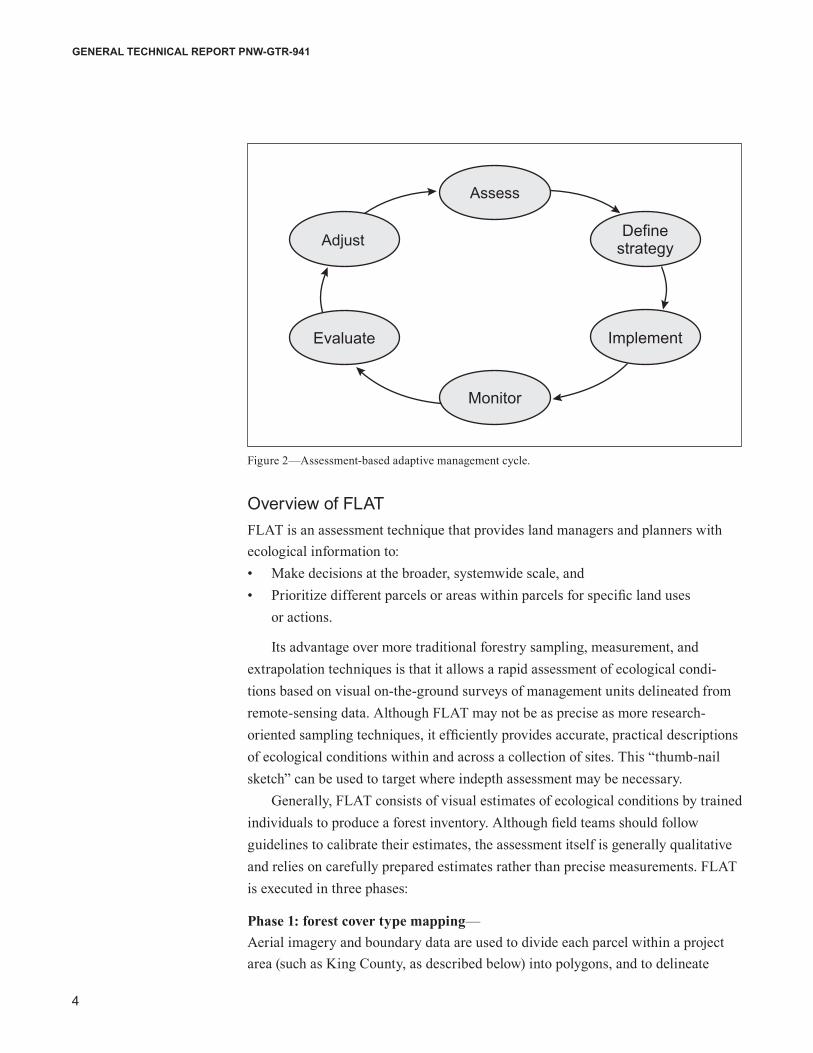
Figure 2—Assessment-based adaptive management cycle.
Assess
Monitor
Definestrategy
Implement
Adjust
Evaluate
5
Forest Landscape Assessment Tool (FLAT): Rapid Assessment for Land Management
management units (MUs). This work is accomplished and recorded using geo-graphic information system (GIS) tools. Management units are the units of observa-tion and measurement for the onsite assessment.
Phase 2: field assessment—Trained field teams visit each MU within the project area to collect data for prede-termined attributes. As an example, collected attributes might include vegetative or built land covers, nonnative species in order of abundance, and tree age-class distribution. A condition rating is also recorded, based on a matrix and flow-chart analysis (described as Tree-iage). Data are collected for each MU and stored (using a GIS or other data management system) for each parcel within the project area. Field teams may also verify the boundaries of MUs in this phase.
Phase 3: management strategies and prioritization—The field procedures of FLAT provide a ranking of landscape conditions of the project area, both across numerous parcels and for subunits (the MUs) within a large parcel. Summary data and rankings are easily compared across the land management area. They can be used to establish management priorities for each MU, or aggregated to develop priorities at larger scales, such as across the entire open space or parks system.
FLAT provides a standardized baseline of ecological condition data. This information can be used to view each MU within the context of an entire land management system, as well as provide a starting point for developing a land-use or stewardship plan for particular parcels. Repeated over time, FLAT could serve as an effective monitoring tool for managers to review and then adapt management priorities and actions based on changing conditions.
This streamlined and systematic approach to ecological assessment applies principles of ecology and forestry to provide quality data that can inform land management priorities.
Foundations of FLATStarting in 2009, FLAT was developed and piloted by the King County Natural Resources and Parks Department, in collaboration with the U. S. Department of Agriculture (USDA) Forest Service and other partners. The resulting comprehen-sive resource analysis was an important first step toward developing a long-term, systemwide forest stewardship program on King County lands. FLAT incorporated the Tree-iage analysis approach that was initially developed in 2005 by the Green Seattle Partnership to prioritize restoration sites.
As its name suggests, the Tree-iage analysis is drawn from the medical practice of triage. Within the medical professions, triage emerged from the demands of war
6
GENERAL TECHNICAL REPORT PNW-GTR-941
casualties, where medical providers were faced with a scarcity of resources and needed to rapidly assess each patient’s condition, and, based on an established sys-tem or plan, determine the patient’s specific treatment or treatment priority (Iserson and Moskop 2007).
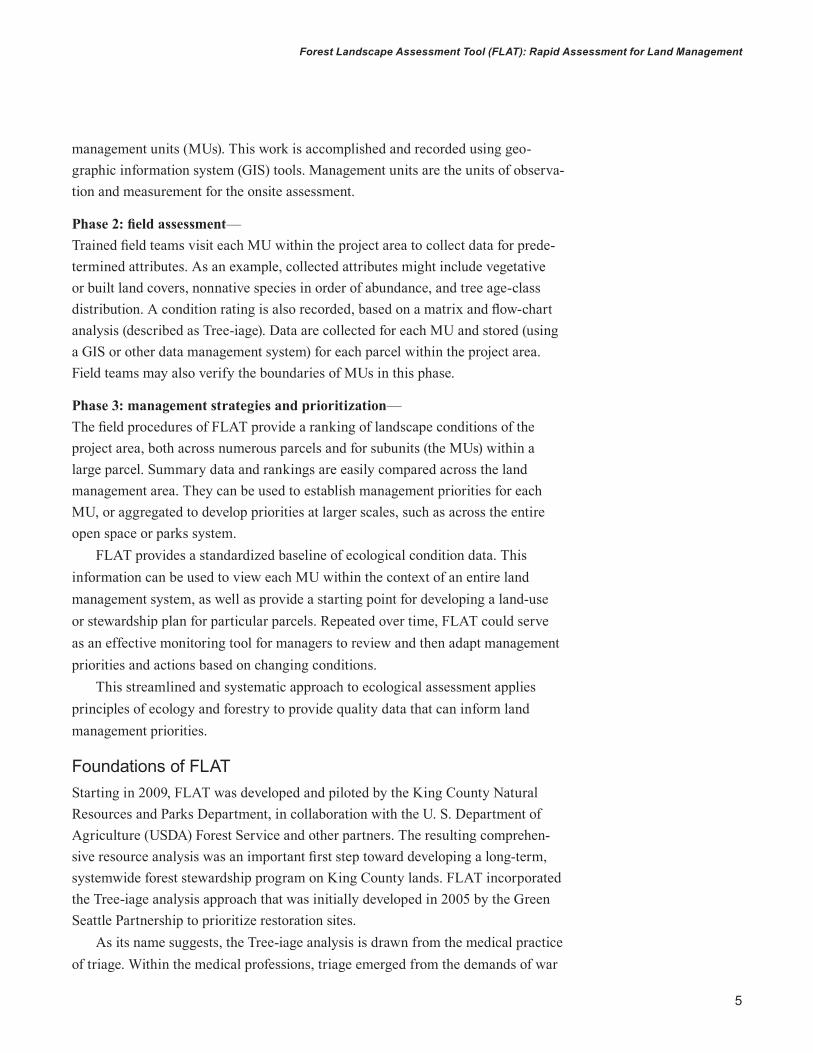
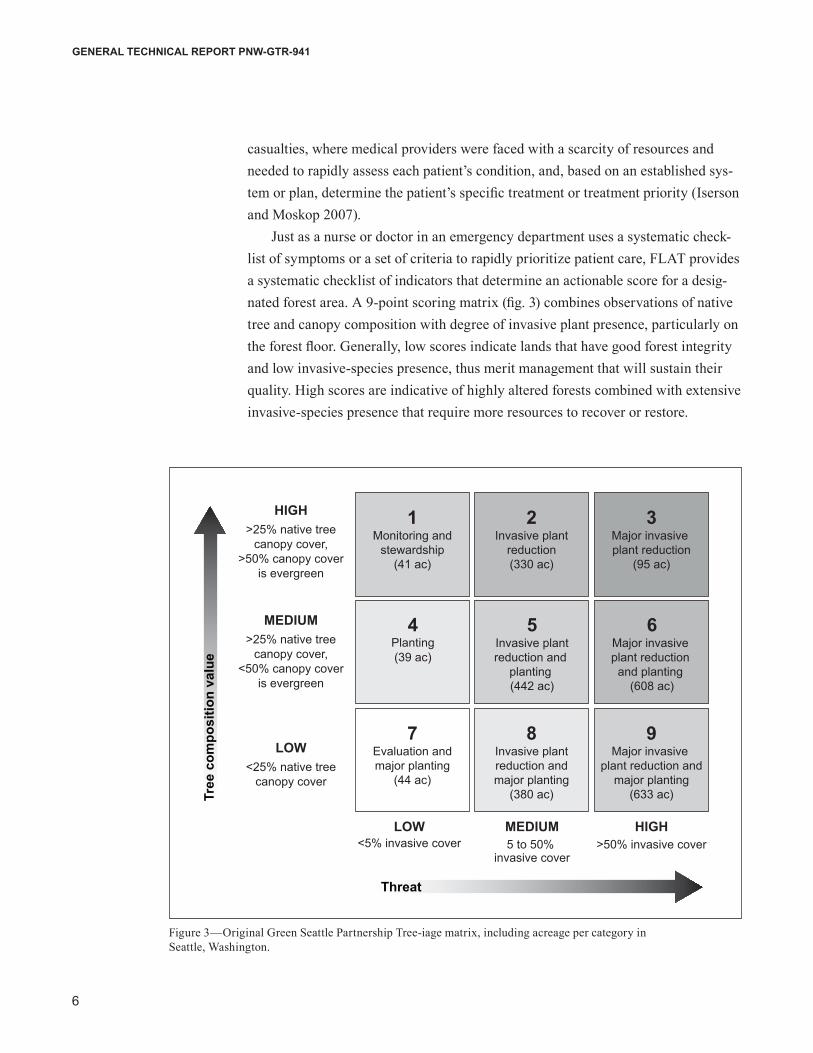
Just as a nurse or doctor in an emergency department uses a systematic check-list of symptoms or a set of criteria to rapidly prioritize patient care, FLAT provides a systematic checklist of indicators that determine an actionable score for a desig-nated forest area. A 9-point scoring matrix (fig. 3) combines observations of native tree and canopy composition with degree of invasive plant presence, particularly on the forest floor. Generally, low scores indicate lands that have good forest integrity and low invasive-species presence, thus merit management that will sustain their quality. High scores are indicative of highly altered forests combined with extensive invasive-species presence that require more resources to recover or restore.
Figure 3—Original Green Seattle Partnership Tree-iage matrix, including acreage per category in Seattle, Washington.
1Monitoring and
stewardship(41 ac)
4Planting(39 ac)
7Evaluation andmajor planting
(44 ac)
2Invasive plant
reduction(330 ac)
5Invasive plantreduction and
planting (442 ac)
8Invasive plantreduction andmajor planting
(380 ac)
3Major invasive plant reduction
(95 ac)
6Major invasive plant reduction and planting
(608 ac)
9Major invasive
plant reduction andmajor planting
(633 ac)
HIGH>25% native tree
canopy cover,>50% canopy cover
is evergreen
MEDIUM>25% native tree
canopy cover,<50% canopy cover
is evergreen
LOW<25% native tree
canopy cover
LOW<5% invasive cover
MEDIUM5 to 50%
invasive cover
HIGH>50% invasive cover
Threat
Tree
com
posi
tion
valu
e
7
Forest Landscape Assessment Tool (FLAT): Rapid Assessment for Land Management
The original Tree-iage matrix was enhanced for use in FLAT to serve more diverse needs and ecological conditions. Modified flowcharts accommodate additional ecosystem types such as wetlands. Additional data attributes include more indicators of forest health, adding new insight for management strategies. New attributes include stocking, crown closure estimates, and forest health indicators. Health indicator measures include low tree-canopy vigor, root rot, mistletoe, bare soils resulting from erosion, and the presence or lack of regenerating trees (canopy species less than 20 ft tall). Further, each visited stand is deemed “plantable” or “not plantable” based on whether site conditions are appropriate for tree seedling establishment.
Tree-iage was first used to evaluate forest condition of open spaces (of up to 100 ac) in highly urban areas in Seattle (fig. 3; Green Seattle Partnership 2006). The tool was exported to several other cities under the regional Green City Partnership model, including Everett, Kent, Tacoma, Kirkland, and Redmond. The development and use of FLAT in King County expanded use of the early tool for assessments of larger parcels (up to 2,500 ac). The FLAT team also prepared fieldwork protocols that are used for data-collection training of park staff and citizen volunteers.
The FLAT process borrows from a number of scientific disciplines. The axes and decision flowcharts of the Tree-iage matrix are based on principles of restora-tion ecology. Restoration ecology involves identifying prior or potential ecological conditions for a site that are then considered as goals or targets of the restoration effort and process. Such conditions (past and future) are shaped by a number of abi-otic factors such as climate, elevation, moisture and precipitation cycles, nutrients, water bodies, fire cycles, and soil or substrate (Clewell and Aronson 2007).
FLAT has been used exclusively within western Washington thus far. The clas-sification matrix and flowcharts therefore assume a desired condition of late-suc-cessional lowland native forests of the Puget Sound basin, characterized by mature conifer trees of mixed age classes and species, mixed with large deciduous trees. The matrix could be adjusted to acknowledge other Pacific Northwest ecosystems (such as shoreline, pine forest, or shrub-steppe) by specifying key ecological condi-tions and species indicators for the vertical and horizontal axes. To adapt FLAT for use in other ecosystems, goals of a desired condition or resource use would inform how the matrix and attributes were set up.
The FLAT process also incorporates knowledge from the field of landscape ecol-ogy, which makes explicit the importance of ecological diversity within the landscape (Turner 2005). When applied to land management, landscape ecology can provide insight on how bordering development, land use, or ecosystem types may influence restoration outcomes or ecosystem development within a particular management unit
FLAT is based on the best practices of foresty, restoration ecology, and landscape ecology.
8
GENERAL TECHNICAL REPORT PNW-GTR-941
(Turner 2005). One of the main products of FLAT is MU-specific information that can be viewed and queried in GIS together with information on neighboring MUs and other relevant spatial data or imagery. This integrated format allows managers to consider a landscape-scale perspective when making management decisions.
FLAT also includes aspects of traditional forestry field methods that were modified to include less data collection concerning timber evaluation. Associated data attributes in the FLAT include estimates of diameter at breast height (dbh) or size class, stocking, age class, and a number of forest health indicators as noted earlier (e.g., root rot, mistletoe, regenerating trees). This provides a critical starting point for developing silvicultural restoration actions that can promote forest stand recovery and long-term resilience. If a parcel is deemed to be suitable for harvest management, more detailed forest mensuration can be done.
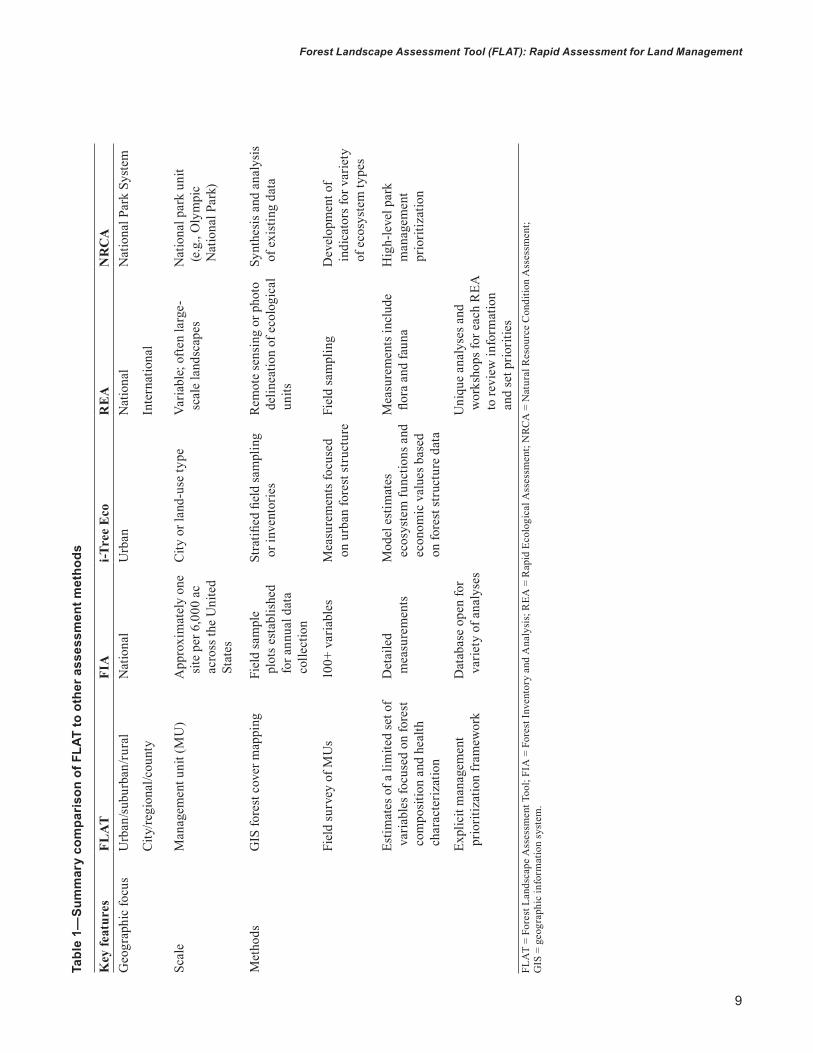
Comparison to Existing Assessment MethodsIn recent years, many approaches to landscape or resource assessment have emerged. The following summary and table 1 provide a comparison of FLAT with other assessment programs.
Forest Inventory and Analysis Forest Monitoring Program (FIA)—Perhaps the most well-known forest inventory protocol is the one used by the Forest Service’s Forest Inventory and Analysis (FIA) program. The FIA consists of “a three-phase sample used to track status and trends in forest extent, cover, growth, mortality, removals, and overall health” for the entire United States. Data collection takes place through stratified random sampling, selecting one site for every 6,000 ac of forest (USDA FS 2014). The FIA has produced a dataset that enables analysis on a scale that is appropriate and useful for national and some statewide manage-ment and decisionmaking.
Because of its plot sampling design, FIA may not provide data at the scale that most local or regional landowners would need to make management decisions. Fur-ther, the extensive range of detailed measurements involved may be much too costly and time-consuming for managers with a limited budget to consider. As an exam-ple, FLAT data variables for King County numbered just 28, while FIA’s urban phase 2 protocol calls for more than a hundred variables to be carefully measured (USDA FS 2015). The advantage of FLAT compared to FIA is its lower cost, greater simplicity, and ability to provide information about each parcel and the management units within them. Nonetheless, in recent years, FIA has been extended to areas that are identified as urban. Urban FIA was launched in 2014, with Baltimore and Austin as the pilot cities. Data-collection protocols have incorporated i-Tree tools, and are being adapted to more directly reflect local community needs.
9
Forest Landscape Assessment Tool (FLAT): Rapid Assessment for Land Management
Tabl
e 1—
Sum
mar
y co
mpa
riso
n of
FLA
T to
oth
er a
sses
smen
t met
hods
Key
feat
ures
FLA
TFI
Ai-T
ree
Eco
RE
AN
RC
AG
eogr
aphi
c fo
cus
Urb
an/su
burb
an/ru
ral
Nat
iona
lU
rban
Nat
iona
lN
atio
nal P
ark
Syst
em
City
/regi
onal
/cou
nty
Inte
rnat
iona
l
Scal
eM
anag
emen
t uni
t (M
U)
App
roxi
mat
ely
one
site
per 6
,000
ac
acro
ss th
e U
nite
d St
ates
City
or l
and-
use
type
Varia
ble;
ofte
n la
rge-
scal
e la
ndsc
apes
Nat
iona
l par
k un
it (e
.g.,
Oly
mpi
c N
atio
nal P
ark)
Met
hods
GIS
fore
st c
over
map
ping
Fiel
d sa
mpl
e pl
ots e
stab
lishe
d fo
r ann
ual d
ata
colle
ctio
n
Stra
tified
fiel
d sa
mpl
ing
or in
vent
orie
sR
emot
e se
nsin
g or
pho
to
delin
eatio
n of
eco
logi
cal
units
Synt
hesi
s and
ana
lysi
s of
exi
stin
g da
ta
Fiel
d su
rvey
of M
Us
100+
var
iabl
esM
easu
rem
ents
focu
sed
on u
rban
fore
st st
ruct
ure
Fiel
d sa
mpl
ing
Dev
elop
men
t of
indi
cato
rs fo
r var
iety
of
eco
syst
em ty
pes
Estim
ates
of a
lim
ited
set o
f va
riabl
es fo
cuse
d on
fore
st
com
posit
ion
and
heal
th
char
acte
riza
tion
Det
aile
d m
easu
rem
ents
Mod
el e
stim
ates
ec
osys
tem
func
tions
and
ec
onom
ic v
alue
s bas
ed
on fo
rest
stru
ctur
e da
ta
Mea
sure
men
ts in
clud
e flo
ra a
nd fa
una
Hig
h-le
vel p
ark
man
agem
ent
prio
ritiz
atio
n
Expl
icit
man
agem
ent
prio
ritiz
atio
n fr
amew
ork
Dat
abas
e op
en fo
r va
riety
of a
naly
ses
U
niqu
e an
alys
es a
nd
wor
ksho
ps fo
r eac
h R
EA
to re
view
info
rmat
ion
and
set p
riorit
ies
FLA
T =
Fore
st L
ands
cape
Ass
essm
ent T
ool;
FIA
= F
ores
t Inv
ento
ry a
nd A
naly
sis;
REA
= R
apid
Eco
logi
cal A
sses
smen
t; N
RCA
= N
atur
al R
esou
rce
Con
ditio
n A
sses
smen
t;
GIS
= g
eogr
aphi
c in
form
atio
n sy
stem
.
10
GENERAL TECHNICAL REPORT PNW-GTR-941
I-Tree Eco—A widely-used inventory and assessment tool that has been used in cities across the world is i-Tree Eco, also developed and supported by the Forest Service. The i-Tree Eco tool is set up to measure and monitor urban forests in order to estimate ecosystem functions and economic values for any metropolitan area. These estimates include urban forest structure and associated ecosystem services, such as carbon storage and sequestration, and air pollution removal, as well as residential building energy effects, rainwater interception, and public health benefits (Nowak et al. 2008). When applied to metropolitan areas or counties, this tool uses random or stratified sampling.
The i-Tree Eco model provides an important baseline for systemwide informa-tion, especially within a city. However, much like FIA, these techniques do not readily describe the status of a specific site. An entire city, or the land-use types within, is the unit of analysis in i-Tree and results can be used to help identify systemwide goals and opportunities. Because FLAT’s unit of observation is a parcel (and even subunits within), it can be more readily used to create plans to meet place-based goals. Thus, although an i-Tree Eco assessment and analysis can be a useful complement to FLAT, its information is not tied as directly to site-specific management needs because of the difference in focus and scale of data collection. It should be noted that i-Tree Canopy and Landscape tools are applicable at the parcel scale, but do not address forest health and stand conditions.
The Nature Conservancy’s Rapid Ecological Assessment—The Rapid Ecological Assessment (REA) was developed by The Nature Conser-vancy to identify priority areas for conservation of biodiversity. In many ways, it is very similar to the FLAT process. In both, orthophotos or other remote-sensing technologies are used to classify and divide landscapes into ecological units, then field-based assessments are used to characterize the biota within these units. The purpose of REA is also to evaluate ecological conditions of specific units to support decisions about management priorities (Sayre et al. 2000).
There are a few key differences between REA and FLAT, however. Meth-odologically, REA field assessments (like FIA and i-Tree) consist of plot-based samples and interpolation of those measures across a much larger area. The REA also includes fauna explicitly in its sampling technique while FLAT focuses exclu-sively on flora. Unlike FLAT, REA was developed for use in lands more remote from human activity. The REA also involves a unique process of technical analyses and workshops in which scientists and managers review the information collected and decide on unit prioritization (Sayre et al. 2000). FLAT, on the other hand, has a predefined framework of matrices and flowcharts that can be used to readily translate assessment data into ecological management priorities.
11
Forest Landscape Assessment Tool (FLAT): Rapid Assessment for Land Management
National Park Service Natural Resource Condition Assessments—The National Park Service (NPS) Natural Resource Condition Assessment (NRCA) serves a similar purpose to FLAT. These reports synthesize preexisting scientific information on a particular park to support the development of management plans and identify what additional information is needed, as well as to develop priorities across the National Park System. Although some of the data may be collected in the field, the majority of report content is expected to come from “existing data from NPS and other sources” (USDI NPS 2009). The NRCA reliance on existing data is one important distinction between it and the FLAT method.
Another important difference stems from the diversity of holdings within the National Park System. The FLAT process can be customized based on a general understanding of the range of ecosystems that natural area managers or planners might encounter, as well as the management challenges that may be present. Within this range, specific indicators as well as flowchart and matrix analyses are created to generate information that is directly helpful to prioritize MUs and management activity. The NRCAs, on the other hand, are a step earlier in the process. The NRCAs are oriented toward identifying which indicators should be used to set priorities going forward for each park across a much wider range of habitats and conditions. The NRCAs might be used to define each park’s prioritization matrix and flowcharts for conducting FLAT. The differences between FLAT and the NRCAs are thus of process timing and scale.
Ecological Integrity Assessment of the Washington Natural Heritage Program—An Ecological Integrity Assessment (EIA) rates the current ecological integrity of an occurrence of a plant association or ecological system. NatureServe and the Natural Heritage Network have developed the EIA as an index of ecological integrity based on metrics of biotic and abiotic condition, size, and landscape context. Each metric is rated by comparing measured values with the expected values under relatively pristine conditions. The ratings are aggregated into a total score or a scorecard matrix. The EIA can be applied to multiple spatial scales (e.g., landscape-or site-scale) and with a variety of data types (e.g., GIS or field-based). The EIAs are developed for ecological systems using a three-level-metrics approach: remote sensing, rapid ground-based, intensive ground-based. In sum-mary, the EIA framework provides a standardized currency of ecosystem integrity across all terrestrial ecosystem types. This information can then be used for setting conservation priorities, identifying restoration strategies, and monitoring the effectiveness of conservation actions.
12
GENERAL TECHNICAL REPORT PNW-GTR-941
The EIA three-level-metrics approach may offer helpful concepts and methods for future updates of FLAT. The EIA is used to evaluate more pristine parcels for wildland conservation or management. FLAT is structured to enable land managers to integrate measures that reflect the local situations of urban and community forest systems. FLAT can be adjusted to reflect the “relative” value of natural parcels concerning desired attributes, whereas the EIA indicates “abso-lute” ecological values. Furthermore, although the EIA is intended to create a common currency of comparison between different ecosystem types, the metrics and methodologies employed in the field are detailed and ecosystem specific. FLAT, on the other hand, uses a consistent set of less detailed metrics in the field, without assuming prior knowledge of the ecosystem type. After FLAT is done, EIA could be used as a next step if more detailed assessment is needed within specific MUs.
Overall, FLAT fills an assessment role that traditional forestry assessments and the other methods discussed above do not address: • Uses methods that are simple and adaptable to project-specific goals.• Provides adequate, reliable, systematic, cost-effective, and local, site-based
information. • Informs decisions about where to initiate healthy forest management, stew-
ardship programs, restoration activities, or stand management for harvest. • Identifies where additional, more precise data may be needed.• May be used to monitor conditions and progress over time.
FLAT MethodologyThis section provides a summary of key project considerations and the basic meth-ods for the three phases of FLAT.
Project Considerations and PlanningBefore starting a FLAT project, managers should review and consider important factors for project planning, including the desired budget, staffing and training needs, equipment requirements, and a potential timeline.
Costs—The cost of executing FLAT will vary considerably depending on the size and nature of the assessment area. By far, the highest cost of the assessment will be the staff or contractor time needed to do fieldwork. Expenses will grow as the size of the assessment area, number of sites, and distances between sites increases. In addition, project planning, forest type mapping and MU delineation, as well as field supply purchases, contribute to the total cost. The cost per acre can be expected to
13
Forest Landscape Assessment Tool (FLAT): Rapid Assessment for Land Management
decrease as field crews and project coordinators become more experienced. Some of these relationships can be illustrated by comparing King County’s costs to those of municipalities that implemented the same or similar programs. Appendix 5 illus-trates the comparative costs in King County and the City of Everett where the same set of attributes data were collected.
Staffing and training— There are four main project responsibilities within the FLAT protocol: forest-cover-type mapping, field assessment, database design and management, and project management and planning. Those considering using FLAT should review what their in-house capabilities are for each of these activities, especially for more special-ized skills such as GIS and data processing, and decide what can be accomplished through training or seeking additional support. Training is most important for those doing field data collection and will help assure consistent and high-quality data. Training should include a walk-through of the protocols at a field site. In addition, it is helpful to pair new field staff with more experienced field staff, which helps to calibrate how estimates are done and improves consistency across field crews. The FLAT Field Manual provides guidance and detailed instructions that can support field staff training (see app. 6).
Equipment—The basic equipment needed to conduct a FLAT assessment include GIS, navigation devices, a field data entry system, plant identification resources, and measurement tools. The actual equipment that is needed or desired will depend on the size of the project and desired application of the collected data. For an equipment list and considerations, see appendix 3.
Timeline—In general, the FLAT timeline starts with a pre-field season to plan the project, pur-chase equipment as needed, train staff, and complete Phase 1 tasks (below). This is a critical time for FLAT projects to ensure that all components of a project are laid out adequately and that the plan for moving forward is understood by decisionmak-ers. The pre-field season is followed by one or more field seasons, most often but not necessarily during summer, to complete the field assessment (Phase 2). Fieldwork is the most time-consuming activity, so will differ based on condition and number of assessment sites. Lastly, post-fieldwork data management, analysis, and reporting should be estimated. Overall, the timeline will vary with the size and complexity of the project, and time requirements will decrease even for large projects as managers gain experience with FLAT implementation. To date, projects have ranged from a few months to a multiyear effort.
14
GENERAL TECHNICAL REPORT PNW-GTR-941
Phase 1: Forest Cover Type MappingDefining the project area— A FLAT project area is determined in several steps using a mapping system, management boundaries, and vegetation cover information. See appendix 1 for detailed procedures. Existing geospatial data are needed, including aerial imagery, parcel boundaries, and other management boundaries, to set up this process. For an explanation of necessary data, along with potential sources and considerations, see appendix 2.
Step 1: Determine which properties will be included in the assessment. This involves establishing initial site boundaries based on existing ownership and management boundaries.
Step 2: Designate land cover type, such as King County designations of forested, other ecosystems, natural (vegetation but <25 percent canopy cover), open water, hardscape, and cultural landscape.
Step 3: Delineate MUs based on forest species associations, geomorphic conditions, and land cover.
The resulting polygons will be the MUs, the unit of measure for the FLAT process. Each MU should be assigned a unique identifier to be used throughout the project. This is especially important on projects having multiple sites (e.g., dispersed parks or land holdings) that are then delineated into MUs. Keeping good records of MUs identifiers and associated data is critical to ensuring that FLAT information is easy to use during the Phase 3 analyses (discussed below), and for using FLAT to monitor changes over time.
Defining the data attributes—Field data collection is done using predefined attributes. The attributes are related to vegetation species, abundance, size and age classes, and identification of restoration opportunities. The list of attributes used during the King County pilot are included as appendix 4. Agencies or organizations using FLAT will have their own manage-ment priorities, so they may add a custom set of assessment attributes.
Defining the data attributes includes determining the level of measurement detail used during the field assessment. For example, forest overstory age classes may be divided into increments of 10 or 30 years. Selecting appropriate attributes and data-collection categories will require the expertise of people who are knowl-edgeable about the ecosystems being assessed, as well as those qualified to develop management priorities.
15
Forest Landscape Assessment Tool (FLAT): Rapid Assessment for Land Management
The attributes that are selected will shape the analysis that is done in Phase 3. Development of flowcharts and criteria that reflect potential management priorities should occur alongside data attribute selection. That is, managers should start the pro-cess of thinking through how their selected data attributes can be used to differentiate MUs and rank areas in order of urgency for management intervention. This can ensure that the most useful data for MUs classification are collected in the field (Phase 2). The actual flowcharts and criteria can then be refined and finalized as part of Phase 3.
Phase 2: Field AssessmentAssessment procedure—The field procedure entails visual estimates of the data attributes defined during Phase 1. Teams of two or more people visit each MU, walk through it, and record an estimate for each data attribute. The following summarizes key processes and considerations. The FLAT Field Manual, found in appendix 6, further describes the field data-collection methods.
Provide attribute estimates for the entire MU—The field team walks through each MU and records an estimated average attribute value for each of the variables se-lected in Phase 1. There may be patches of unusual species or conditions, but a best effort is made to estimate for the entire MU. Teams should be observant, perhaps even keeping notes of what they see. Judgments are made for each attribute and are entered into a data entry device before leaving the MU.
Use measurement tools to calibrate estimates—Some variables, such as dbh, crown closure, age, and height of regenerating trees (e.g., those less than 20 ft in height) can be measured with tools while in the field. It may be helpful to do this once or twice in an MU to calibrate the field team’s estimates. Determing the appro-priate level of accuracy is important, as excessive measurement will slow the rapid assessment process.
Alter MUs as needed—Once in the field and seeing on-the-ground conditions, the crew will consider whether the boundaries of the MUs should be altered, and if so, how. Pervasive differences in composition or age classes for large areas of the MU may necessitate either redrawing boundaries or splitting the MU into multiple, smaller MUs.
Record additional notes and variables—Field teams may find that something im-portant is in the MU that doesn’t necessarily fit into any of the attribute categories. Examples include unanticipated environmental or social hazards, such as homeless encampments or trail damage, which could supplement management decision crite-ria. This information can be captured in the “notes” field in the data entry tool.
16
GENERAL TECHNICAL REPORT PNW-GTR-941
Decide when to leave the road or trail system—Each attribute determination will apply to the entire MU, thus it is important that enough of the MU is observed by the field team. Sometimes this will require leaving trails and traveling on challeng-ing terrain. In other MUs, the view from a trail may be sufficient to make a judg-ment on most, if not all, of the attributes. Teams should be careful to recognize, and average into the MU estimate, any edge effect along trails where vegetation may have been influenced by trail activity or disturbance. If the area is large enough, the road or trail area may become a distinct MU. These decisions are left to the discre-tion of the field team; the desired speed of assessment must be balanced against the assessment’s accuracy.
Check for completeness—Sometimes MUs will be strangely shaped so that the ter-rain or trails will lead teams to travel in and out of a number of MUs. Data may be entered for each MU in order of discovery, but should be checked for completeness before leaving the MU.
Data management—Once the fieldwork is complete with MU attributes recorded using the data entry tools or field forms, the data should be checked and edited if needed, then entered into a database for analysis. The database type can be chosen according to the complexity of the project. For example, a small project could be managed with Microsoft Excel®, while a larger project with many different sites could be set up in Microsoft Access®, a server-based database management system, or a geo-database that includes the spatial information.1
The data from each field site can be compiled into one dataset across the project, then queried using the categories defined for each attribute. This system can help with data quality control, allowing managers to query data and check for discrepancies or abnormal values.
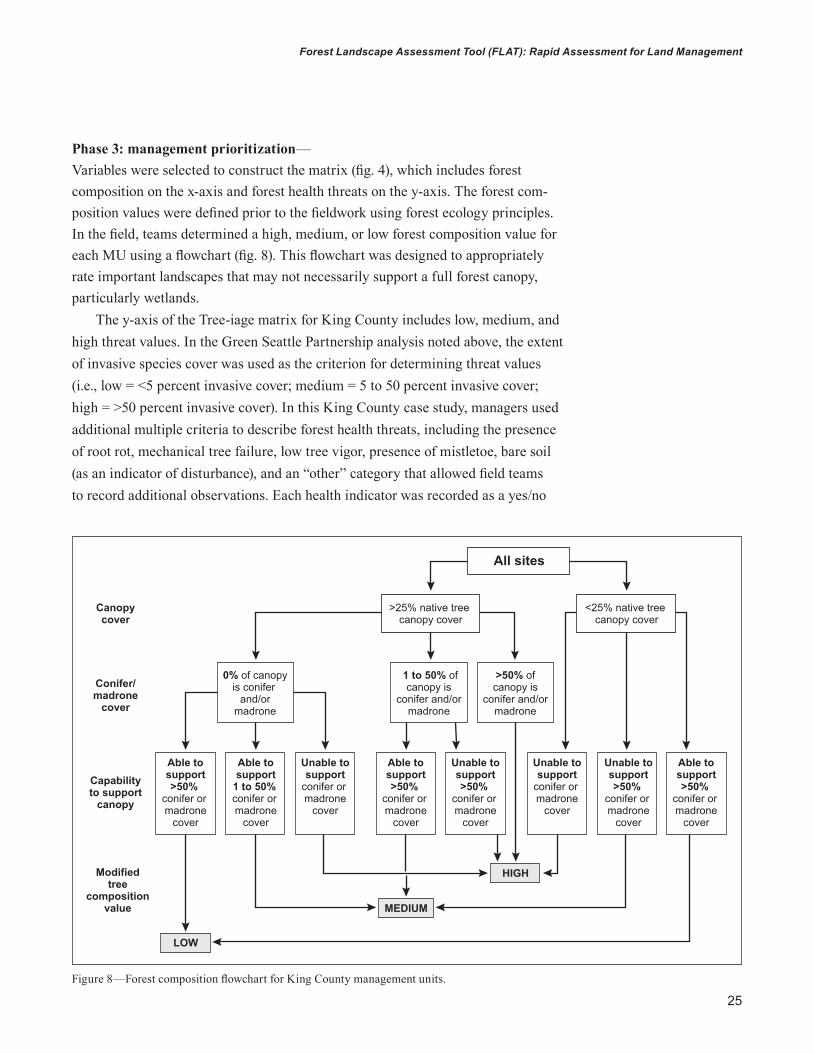
Phase 3: Management PrioritizationThe last phase of FLAT translates the results of the preceding mapping and field assessment efforts into valuable ecological information that can be readily under-stood by landowners, managers, and the general public. Once the summary and analysis processes are done, FLAT provides an advanced snapshot of conditions on the ground and evidence-based input toward determining land management goals and priorities.
1 The use of trade or firm names in this publication is for reader information and does not imply endorsement by the U.S. Department of Agriculture of any product or service.
17
Forest Landscape Assessment Tool (FLAT): Rapid Assessment for Land Management
Summary analysis—The data can be summarized to meet the specific needs of the user at various scales. FLAT provides the opportunity to summarize key characteristics about the parks or open space system, one project parcel within the system, or a subset of MUs chosen for a specific analysis.
Simple queries or formulas can be put to the database to report the number of MU acres representing attributes that were reported in the field data. These basic summaries can be reported as charts or maps (such as land-cover areas). Any attribute(s) can be displayed for the entire system or any subset within.
More specific analysis can be done with vegetation attributes, such as species composition, forest health indicators, invasive species, and so forth. Examples of summary analyses can range from a very basic percentage or total acreage of MUs containing a single vegetation attribute of choice, to a combination of attributes. For example, King County has produced summary statistics about the area of land occupied by different primary overstory species, the percentage of stocking classes found in young regenerating tree species, sites where a health threat indicator was identified, and a type categorization for each MU describing the primary species size and stocking.
There are numerous possible strategies for queries. One can query to show management subunits within the area of a larger parcel, or use one or more key attributes as criteria to identify individual MUs across the entire land base being assessed. The prioritization framework discussed below allows FLAT users to review their project area data and develop clear, ecological management priorities.
Prioritization analysis—Identifying and prioritizing areas in need of management is a key output of the FLAT process. Attributes assessed in the field are used to produce a qualitative value that combines two axes of a matrix. In King County, forest composition (y-axis) and forest threats (x-axis) were used (more detail is provided in the case study section that follows). The matrix combines the multi-attribute information to produce a classification value for each MU (e.g., fig. 4 is the matrix used for the King County project). This is the Tree-iage step of FLAT.
A flowchart can be used to determine MU values for the selected attributes. Generally, the resource composition flowchart and threat criteria are specific to each project’s conditions and priorities; the King County project is but one example (see fig. 8 on p. 25).
Resource composition values and threat values are determined, then combined using the matrix to produce classification values for each MU. This value represents how important taking action may be for a particular MU in relation to other MUs
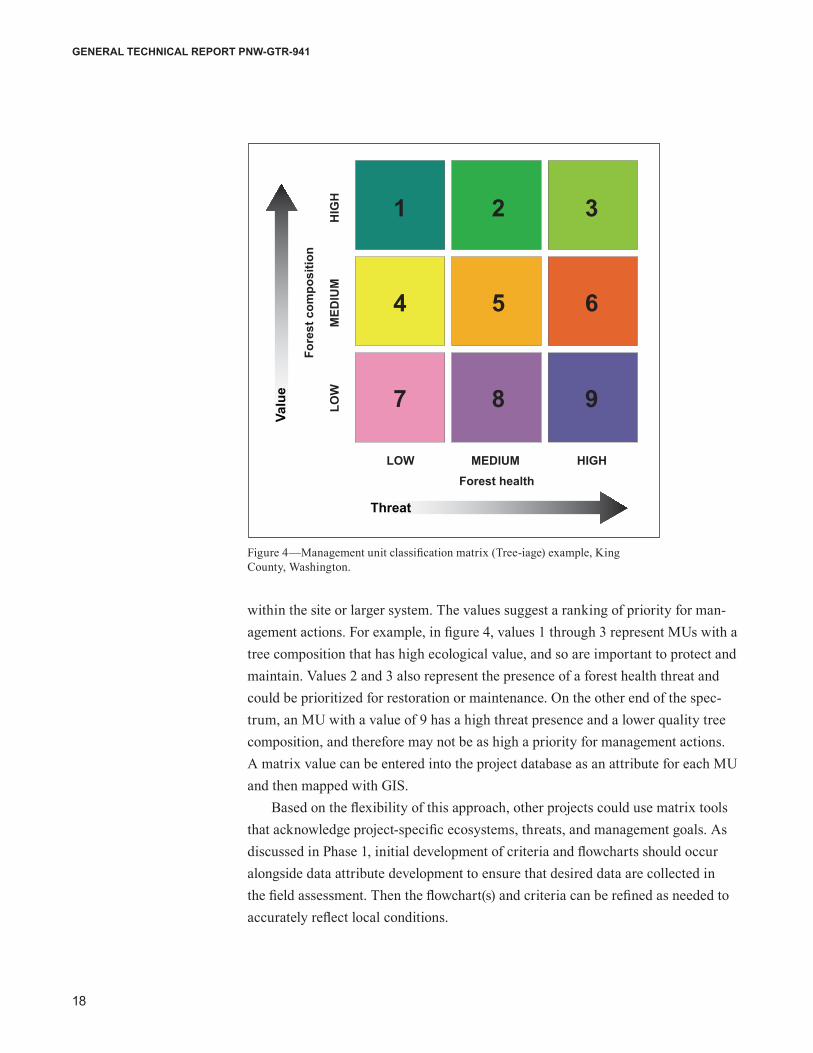
18
GENERAL TECHNICAL REPORT PNW-GTR-941
within the site or larger system. The values suggest a ranking of priority for man-agement actions. For example, in figure 4, values 1 through 3 represent MUs with a tree composition that has high ecological value, and so are important to protect and maintain. Values 2 and 3 also represent the presence of a forest health threat and could be prioritized for restoration or maintenance. On the other end of the spec-trum, an MU with a value of 9 has a high threat presence and a lower quality tree composition, and therefore may not be as high a priority for management actions. A matrix value can be entered into the project database as an attribute for each MU and then mapped with GIS.
Based on the flexibility of this approach, other projects could use matrix tools that acknowledge project-specific ecosystems, threats, and management goals. As discussed in Phase 1, initial development of criteria and flowcharts should occur alongside data attribute development to ensure that desired data are collected in the field assessment. Then the flowchart(s) and criteria can be refined as needed to accurately reflect local conditions.
Threat
Valu
e
Fore
st c
ompo
sitio
n
Forest health
LOW
MED
IUM
HIG
H
LOW MEDIUM HIGH
1
4
7
2
5
8
3
6
9
Figure 4—Management unit classification matrix (Tree-iage) example, King County, Washington.
19
Forest Landscape Assessment Tool (FLAT): Rapid Assessment for Land Management
How the results of the matrix analysis are used in subsequent land management decisions is up to each FLAT user. FLAT provides an ecological input for land management decisionmaking. The combination of field data collection, flowchart processing, and classification of MUs using the matrix can be used to prioritize future management actions and monitoring. Resource managers will also consider other social and economic factors to create a strategic and feasible management approach for their lands. The following section details how FLAT was developed and tested in its pilot application in King County, an example of one way that FLAT has been used.
King County Parks and Open Spaces Case StudyThe King County Natural Resources and Parks Division, Parks and Recreation Division, deployed FLAT for a landscape-scale assessment of county parklands from 2010 to 2013. The implementation of FLAT in King County is an informa-tive case study that demonstrates the entire FLAT process from planning to final results. This case study presents the overall FLAT planning, implementation, and interpretation phases, as well as specific examples of park land assessment within King County.
The heterogeneity of forest lands within King County makes it an ideal case study. Although the west side of King County contains shoreline and pockets of urban forest within the large cities of Seattle and Bellevue, the east side consists predominantly of rural communities, agricultural lands, working forests, and wilderness. A long history of logging coupled with more recent rapid urbanization has created the diverse landscapes of today.
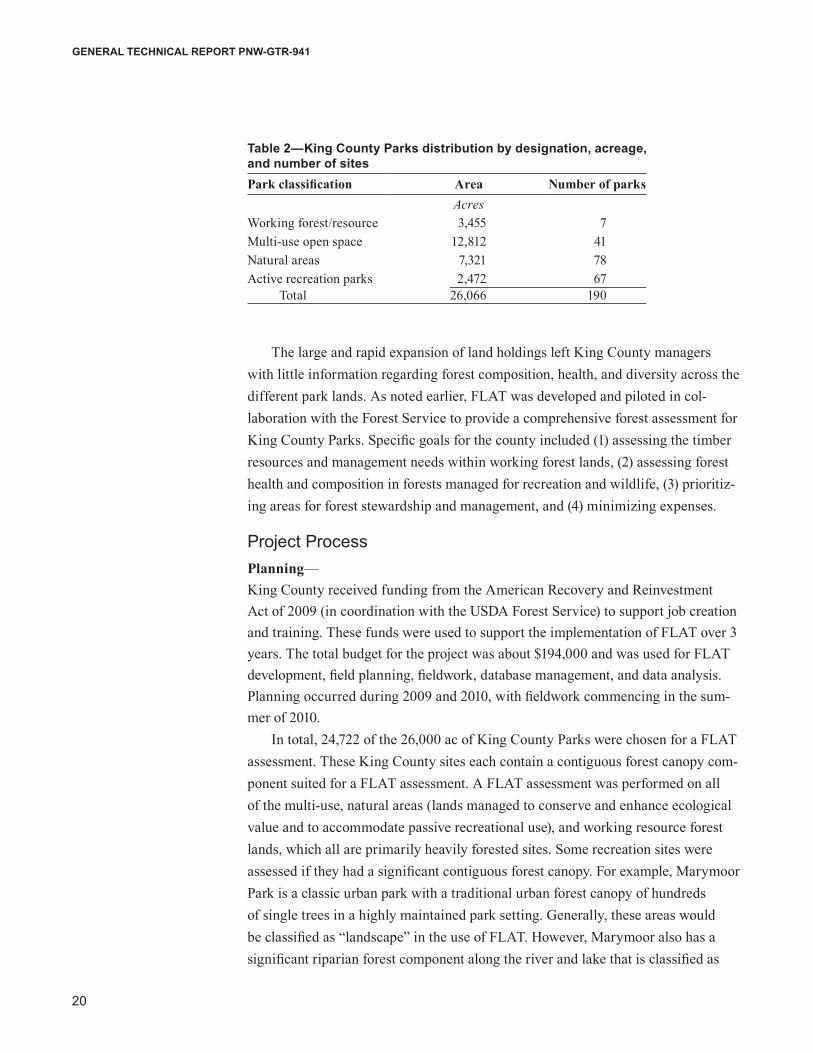
In 1989 and 2007, voters in King County approved measures that provided a combined total of more than $201 million toward open-space acquisition and improvement (Trust for Public Land 2012). In addition, King County (as part of its growth management policy) implemented an incentive program that allows 1 ac of land to be reassigned from rural to urban zoning if an associated 4 ac are dedicated to the county as permanent open space. The resulting rapid land acquisition has led to a diverse portfolio of more than 26,000 ac managed by King County. Holdings differ in terms of the level of previous use and surrounding development and the type of land cover, size, ecosystem type, and biotic composition. King County’s portfolio includes high-use active recreation parks, former agricultural lands and gravel mines, river floodplains, and working forests in the foothills of the Cascade Range, as well as Puget Sound coastline. More than 21,000 of the 26,000 ac are forested. Table 2 shows the number of acres and park sites per park classification.
FLAT was used to open the condition of nearley 25,000 acres of parks and open spaces, including nearly 200 parcels.
20
GENERAL TECHNICAL REPORT PNW-GTR-941
The large and rapid expansion of land holdings left King County managers with little information regarding forest composition, health, and diversity across the different park lands. As noted earlier, FLAT was developed and piloted in col-laboration with the Forest Service to provide a comprehensive forest assessment for King County Parks. Specific goals for the county included (1) assessing the timber resources and management needs within working forest lands, (2) assessing forest health and composition in forests managed for recreation and wildlife, (3) prioritiz-ing areas for forest stewardship and management, and (4) minimizing expenses.
Project Process Planning—King County received funding from the American Recovery and Reinvestment Act of 2009 (in coordination with the USDA Forest Service) to support job creation and training. These funds were used to support the implementation of FLAT over 3 years. The total budget for the project was about $194,000 and was used for FLAT development, field planning, fieldwork, database management, and data analysis. Planning occurred during 2009 and 2010, with fieldwork commencing in the sum-mer of 2010.
In total, 24,722 of the 26,000 ac of King County Parks were chosen for a FLAT assessment. These King County sites each contain a contiguous forest canopy com-ponent suited for a FLAT assessment. A FLAT assessment was performed on all of the multi-use, natural areas (lands managed to conserve and enhance ecological value and to accommodate passive recreational use), and working resource forest lands, which all are primarily heavily forested sites. Some recreation sites were assessed if they had a significant contiguous forest canopy. For example, Marymoor Park is a classic urban park with a traditional urban forest canopy of hundreds of single trees in a highly maintained park setting. Generally, these areas would be classified as “landscape” in the use of FLAT. However, Marymoor also has a significant riparian forest component along the river and lake that is classified as
Table 2—King County Parks distribution by designation, acreage, and number of sitesPark classification Area Number of parks
AcresWorking forest/resource 3,455 7Multi-use open space 12,812 41Natural areas 7,321 78Active recreation parks 2,472 67
Total 26,066 190
21
Forest Landscape Assessment Tool (FLAT): Rapid Assessment for Land Management
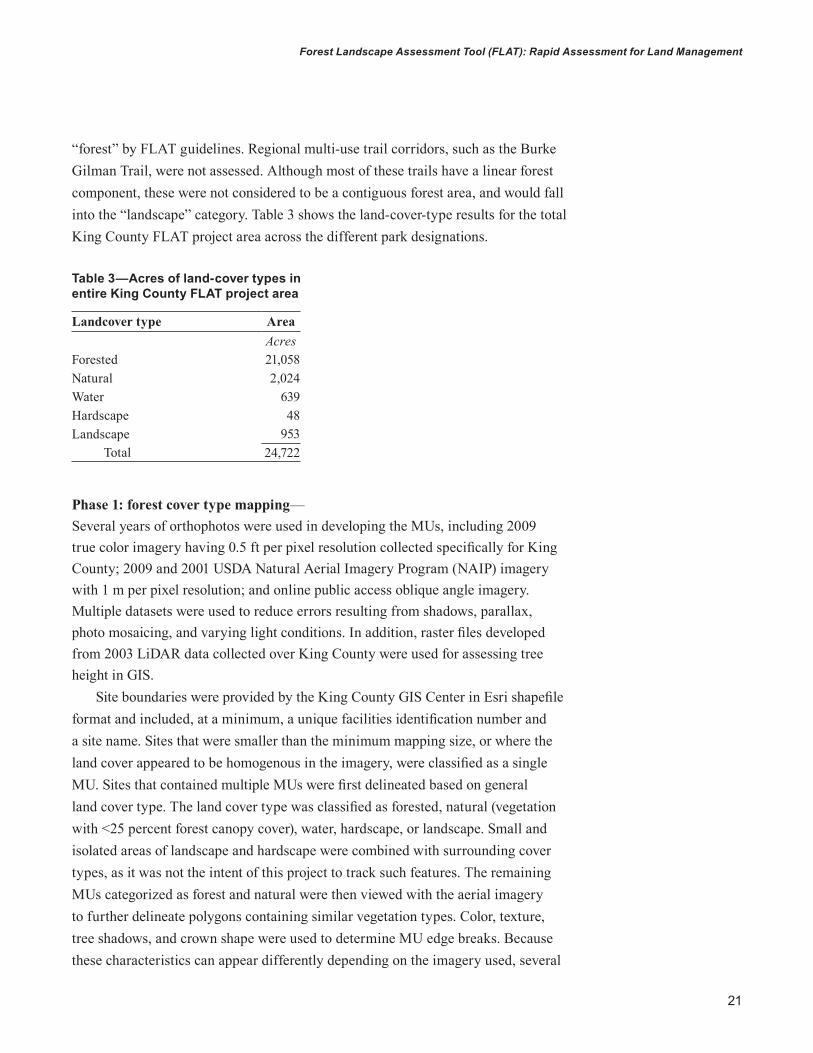
“forest” by FLAT guidelines. Regional multi-use trail corridors, such as the Burke Gilman Trail, were not assessed. Although most of these trails have a linear forest component, these were not considered to be a contiguous forest area, and would fall into the “landscape” category. Table 3 shows the land-cover-type results for the total King County FLAT project area across the different park designations.
Table 2—King County Parks distribution by designation, acreage, and number of sitesPark classification Area Number of parks
AcresWorking forest/resource 3,455 7Multi-use open space 12,812 41Natural areas 7,321 78Active recreation parks 2,472 67
Total 26,066 190Table 3—Acres of land-cover types in entire King County FLAT project area
Landcover type AreaAcres
Forested 21,058Natural 2,024Water 639Hardscape 48Landscape 953
Total 24,722
Phase 1: forest cover type mapping—Several years of orthophotos were used in developing the MUs, including 2009 true color imagery having 0.5 ft per pixel resolution collected specifically for King County; 2009 and 2001 USDA Natural Aerial Imagery Program (NAIP) imagery with 1 m per pixel resolution; and online public access oblique angle imagery. Multiple datasets were used to reduce errors resulting from shadows, parallax, photo mosaicing, and varying light conditions. In addition, raster files developed from 2003 LiDAR data collected over King County were used for assessing tree height in GIS.
Site boundaries were provided by the King County GIS Center in Esri shapefile format and included, at a minimum, a unique facilities identification number and a site name. Sites that were smaller than the minimum mapping size, or where the land cover appeared to be homogenous in the imagery, were classified as a single MU. Sites that contained multiple MUs were first delineated based on general land cover type. The land cover type was classified as forested, natural (vegetation with <25 percent forest canopy cover), water, hardscape, or landscape. Small and isolated areas of landscape and hardscape were combined with surrounding cover types, as it was not the intent of this project to track such features. The remaining MUs categorized as forest and natural were then viewed with the aerial imagery to further delineate polygons containing similar vegetation types. Color, texture, tree shadows, and crown shape were used to determine MU edge breaks. Because these characteristics can appear differently depending on the imagery used, several
22
GENERAL TECHNICAL REPORT PNW-GTR-941
available image sources were reviewed, as listed above. These provided views having different lighting, color balance, and resolution. A canopy height raster file generated from King County LiDAR ground and surface models was also used to provide guidance on stand heights.
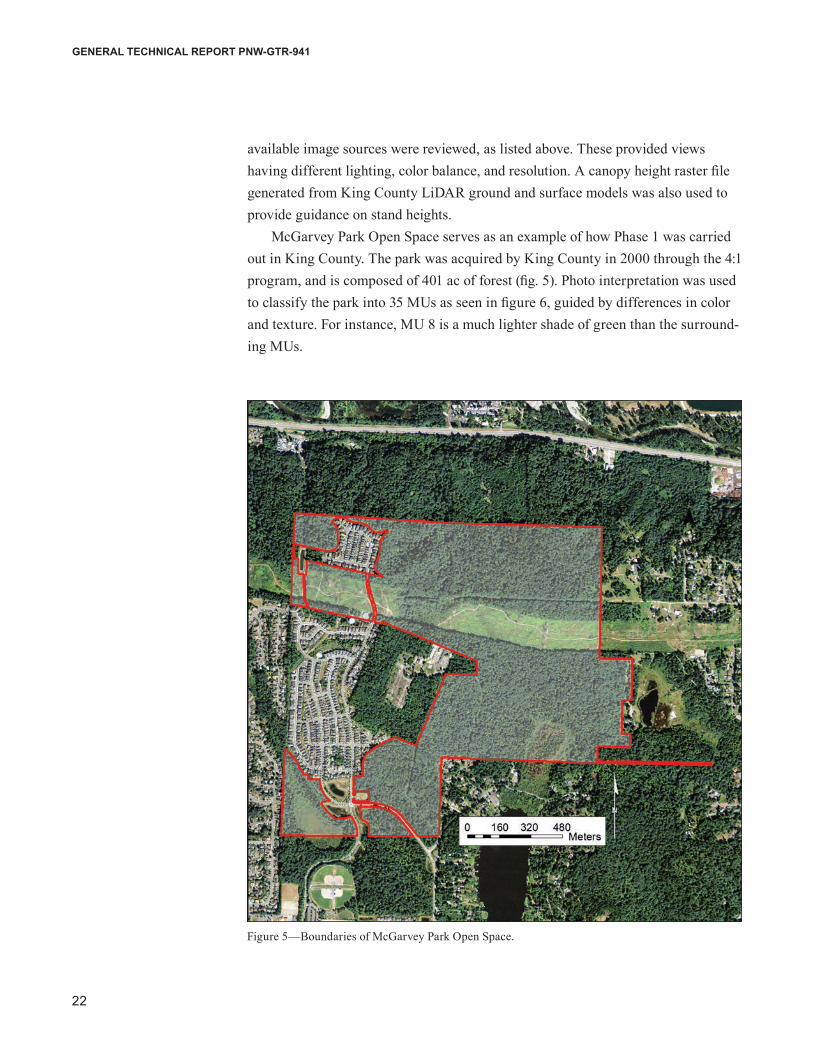
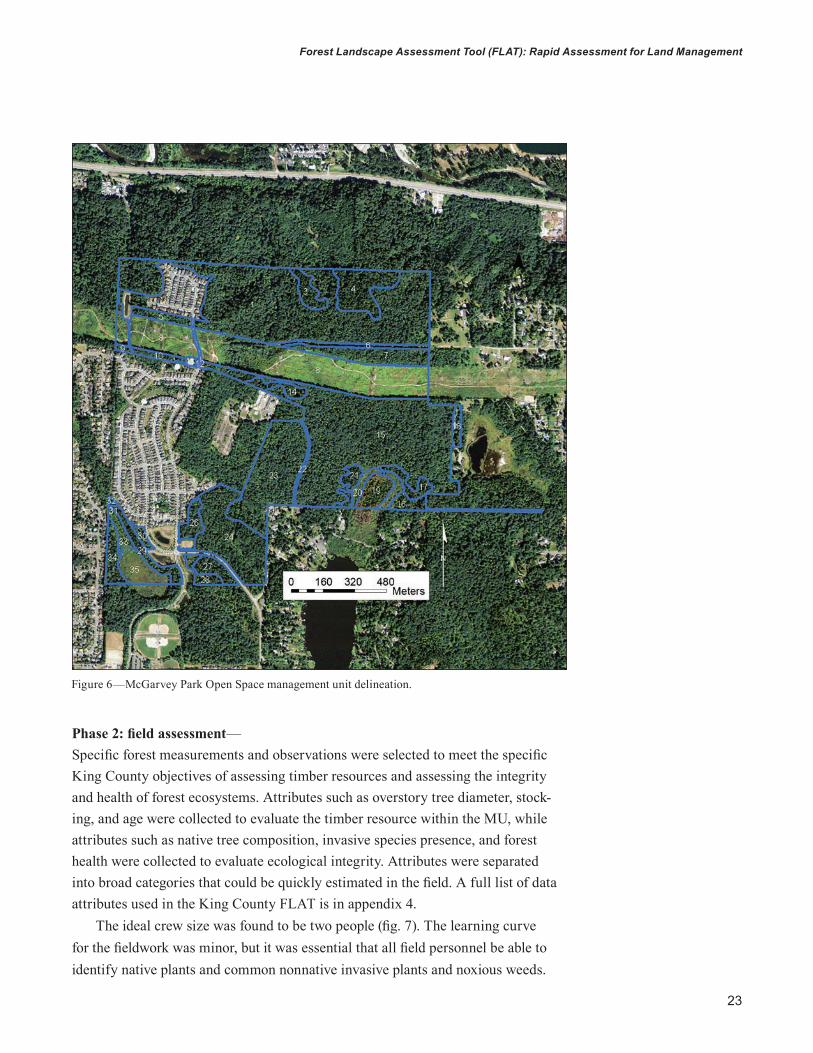
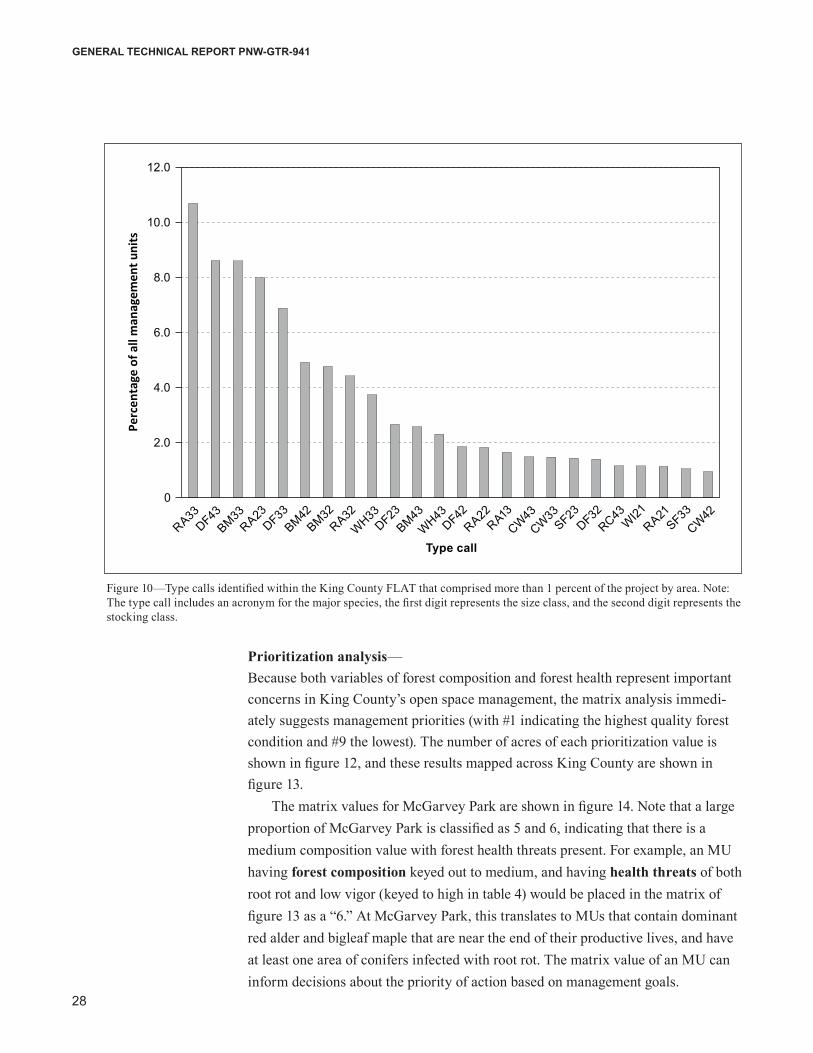
McGarvey Park Open Space serves as an example of how Phase 1 was carried out in King County. The park was acquired by King County in 2000 through the 4:1 program, and is composed of 401 ac of forest (fig. 5). Photo interpretation was used to classify the park into 35 MUs as seen in figure 6, guided by differences in color and texture. For instance, MU 8 is a much lighter shade of green than the surround-ing MUs.
Figure 5—Boundaries of McGarvey Park Open Space.
23
Forest Landscape Assessment Tool (FLAT): Rapid Assessment for Land Management
Phase 2: field assessment—Specific forest measurements and observations were selected to meet the specific King County objectives of assessing timber resources and assessing the integrity and health of forest ecosystems. Attributes such as overstory tree diameter, stock-ing, and age were collected to evaluate the timber resource within the MU, while attributes such as native tree composition, invasive species presence, and forest health were collected to evaluate ecological integrity. Attributes were separated into broad categories that could be quickly estimated in the field. A full list of data attributes used in the King County FLAT is in appendix 4.
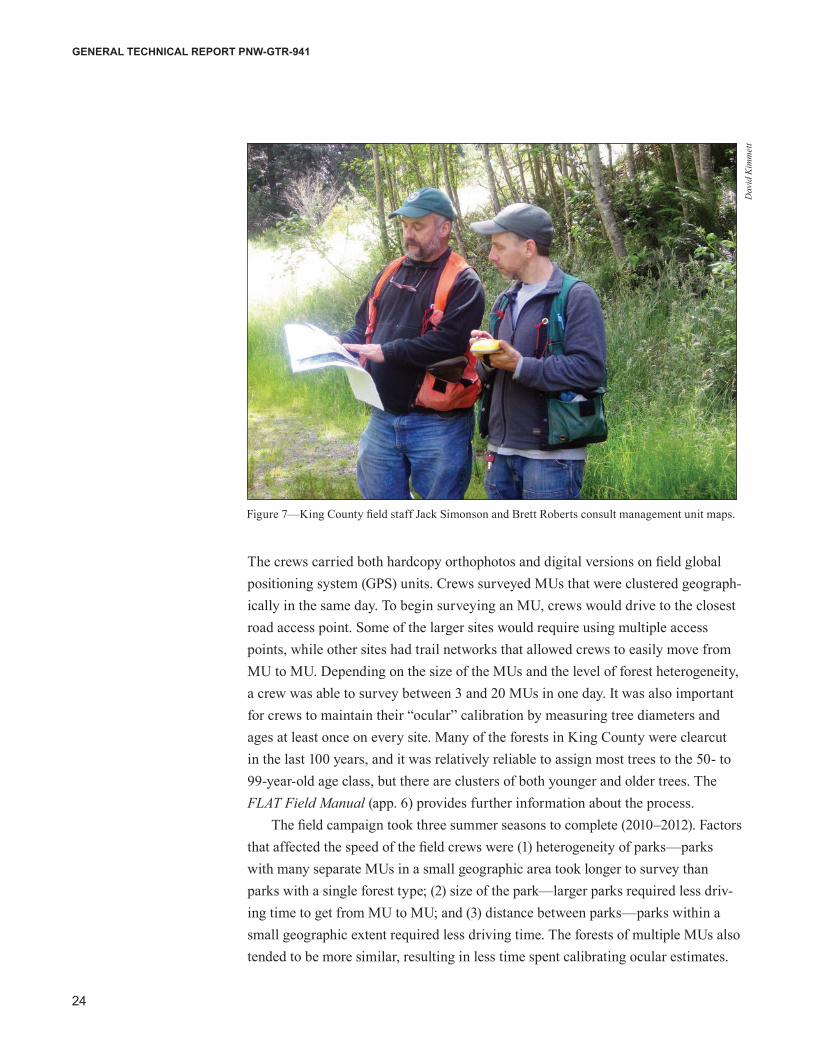
The ideal crew size was found to be two people (fig. 7). The learning curve for the fieldwork was minor, but it was essential that all field personnel be able to identify native plants and common nonnative invasive plants and noxious weeds.
Figure 6—McGarvey Park Open Space management unit delineation.
24
GENERAL TECHNICAL REPORT PNW-GTR-941
The crews carried both hardcopy orthophotos and digital versions on field global positioning system (GPS) units. Crews surveyed MUs that were clustered geograph-ically in the same day. To begin surveying an MU, crews would drive to the closest road access point. Some of the larger sites would require using multiple access points, while other sites had trail networks that allowed crews to easily move from MU to MU. Depending on the size of the MUs and the level of forest heterogeneity, a crew was able to survey between 3 and 20 MUs in one day. It was also important for crews to maintain their “ocular” calibration by measuring tree diameters and ages at least once on every site. Many of the forests in King County were clearcut in the last 100 years, and it was relatively reliable to assign most trees to the 50- to 99-year-old age class, but there are clusters of both younger and older trees. The FLAT Field Manual (app. 6) provides further information about the process.
The field campaign took three summer seasons to complete (2010–2012). Factors that affected the speed of the field crews were (1) heterogeneity of parks—parks with many separate MUs in a small geographic area took longer to survey than parks with a single forest type; (2) size of the park—larger parks required less driv-ing time to get from MU to MU; and (3) distance between parks—parks within a small geographic extent required less driving time. The forests of multiple MUs also tended to be more similar, resulting in less time spent calibrating ocular estimates.
Figure 7—King County field staff Jack Simonson and Brett Roberts consult management unit maps.
Dav
id K
imm
ett
25
Forest Landscape Assessment Tool (FLAT): Rapid Assessment for Land Management
Phase 3: management prioritization—Variables were selected to construct the matrix (fig. 4), which includes forest composition on the x-axis and forest health threats on the y-axis. The forest com-position values were defined prior to the fieldwork using forest ecology principles. In the field, teams determined a high, medium, or low forest composition value for each MU using a flowchart (fig. 8). This flowchart was designed to appropriately rate important landscapes that may not necessarily support a full forest canopy, particularly wetlands.
The y-axis of the Tree-iage matrix for King County includes low, medium, and high threat values. In the Green Seattle Partnership analysis noted above, the extent of invasive species cover was used as the criterion for determining threat values (i.e., low = <5 percent invasive cover; medium = 5 to 50 percent invasive cover; high = >50 percent invasive cover). In this King County case study, managers used additional multiple criteria to describe forest health threats, including the presence of root rot, mechanical tree failure, low tree vigor, presence of mistletoe, bare soil (as an indicator of disturbance), and an “other” category that allowed field teams to record additional observations. Each health indicator was recorded as a yes/no
Figure 8—Forest composition flowchart for King County management units.
All sites
<25% native tree canopy cover
>25% native tree canopy cover
0% of canopy is conifer
and/ormadrone
Unable to support>50%
conifer or madrone
cover
Able to support>50%
conifer or madrone
cover
Able to support
1 to 50% conifer or madrone
cover
Able to support>50%
conifer or madrone
cover
Capabilityto support
canopy
Modifiedtree
compositionvalue
Conifer/madrone
cover
Canopycover
>50% ofcanopy is
conifer and/ormadrone
Unable to support>50%
conifer or madrone
cover
Able to support>50%
conifer or madrone
cover
Unable to support
conifer or madrone
cover
Unable to support
conifer or madrone
cover
1 to 50% ofcanopy is
conifer and/ormadrone
HIGH
LOW
MEDIUM
26
GENERAL TECHNICAL REPORT PNW-GTR-941
observation. To determine if an MU had a low, medium, or high threat value, the number of observed health threat indicators were tallied back at the office. Low is interpreted as no observed health threats, medium as one observed threat, and high as two or more observed health threats (table 4). Other projects may develop a tiered approach, creating a decision tree akin to the forest composition flowchart to differentiate between low, medium, and high threat levels incorporating multiple types of indicators.
Table 4—Methodology used to select management unit threat value
Threat value Observed unhealthy forest valuesLow 0Medium 1High 2 or greater
ResultsAn ArcGIS® geodatabase was assembled from the field data. It was used to produce maps, conduct database queries, and generate summary statistics.
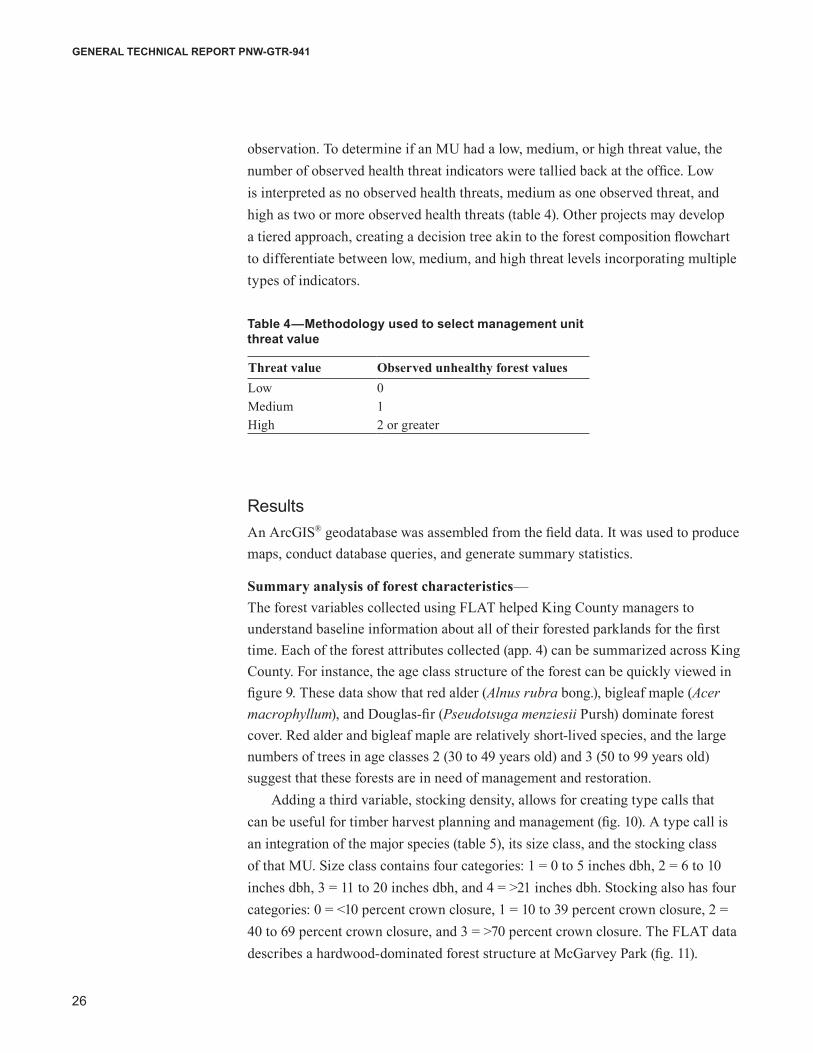
Summary analysis of forest characteristics—The forest variables collected using FLAT helped King County managers to understand baseline information about all of their forested parklands for the first time. Each of the forest attributes collected (app. 4) can be summarized across King County. For instance, the age class structure of the forest can be quickly viewed in figure 9. These data show that red alder (Alnus rubra bong.), bigleaf maple (Acer macrophyllum), and Douglas-fir (Pseudotsuga menziesii Pursh) dominate forest cover. Red alder and bigleaf maple are relatively short-lived species, and the large numbers of trees in age classes 2 (30 to 49 years old) and 3 (50 to 99 years old) suggest that these forests are in need of management and restoration.
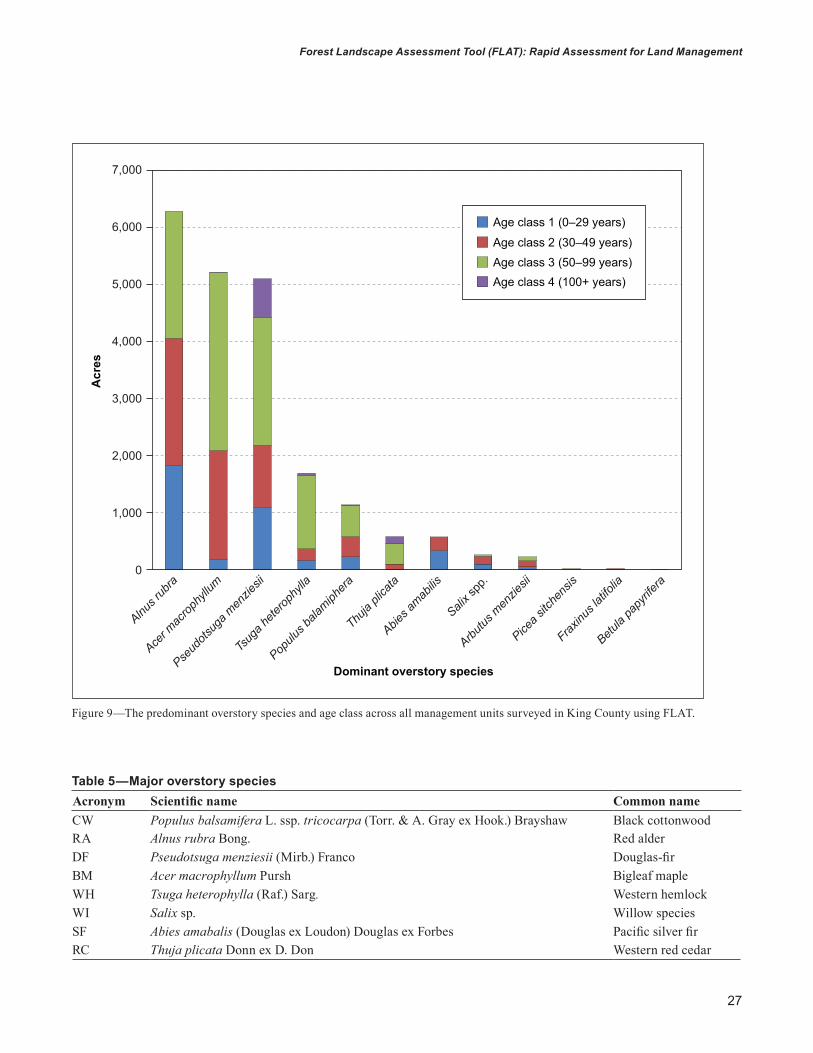
Adding a third variable, stocking density, allows for creating type calls that can be useful for timber harvest planning and management (fig. 10). A type call is an integration of the major species (table 5), its size class, and the stocking class of that MU. Size class contains four categories: 1 = 0 to 5 inches dbh, 2 = 6 to 10 inches dbh, 3 = 11 to 20 inches dbh, and 4 = >21 inches dbh. Stocking also has four categories: 0 = <10 percent crown closure, 1 = 10 to 39 percent crown closure, 2 = 40 to 69 percent crown closure, and 3 = >70 percent crown closure. The FLAT data describes a hardwood-dominated forest structure at McGarvey Park (fig. 11).
27
Forest Landscape Assessment Tool (FLAT): Rapid Assessment for Land Management
Figure 9—The predominant overstory species and age class across all management units surveyed in King County using FLAT.
Acr
es
7,000
6,000
5,000
4,000
3,000
2,000
1,000
0
Age class 1 (0–29 years)
Age class 2 (30–49 years)Age class 3 (50–99 years)Age class 4 (100+ years)
Dominant overstory species
Alnus r
ubra
Acer m
acrop
hyllu
m
Pseud
otsug
a men
ziesii
Tsug
a hete
rophy
lla
Populu
s bala
miphera
Thuja
plica
ta
Abies a
mabilis
Picea s
itche
nsis
Fraxinu
s lati
folia
Betula
papy
rifera
Salix s
pp.
Arbutus
men
ziesii
Table 5—Major overstory speciesAcronym Scientific name Common nameCW Populus balsamifera L. ssp. tricocarpa (Torr. & A. Gray ex Hook.) Brayshaw Black cottonwoodRA Alnus rubra Bong. Red alderDF Pseudotsuga menziesii (Mirb.) Franco Douglas-firBM Acer macrophyllum Pursh Bigleaf mapleWH Tsuga heterophylla (Raf.) Sarg. Western hemlockWI Salix sp. Willow speciesSF Abies amabalis (Douglas ex Loudon) Douglas ex Forbes Pacific silver firRC Thuja plicata Donn ex D. Don Western red cedar
28
GENERAL TECHNICAL REPORT PNW-GTR-941
Prioritization analysis—Because both variables of forest composition and forest health represent important concerns in King County’s open space management, the matrix analysis immedi-ately suggests management priorities (with #1 indicating the highest quality forest condition and #9 the lowest). The number of acres of each prioritization value is shown in figure 12, and these results mapped across King County are shown in figure 13.
The matrix values for McGarvey Park are shown in figure 14. Note that a large proportion of McGarvey Park is classified as 5 and 6, indicating that there is a medium composition value with forest health threats present. For example, an MU having forest composition keyed out to medium, and having health threats of both root rot and low vigor (keyed to high in table 4) would be placed in the matrix of figure 13 as a “6.” At McGarvey Park, this translates to MUs that contain dominant red alder and bigleaf maple that are near the end of their productive lives, and have at least one area of conifers infected with root rot. The matrix value of an MU can inform decisions about the priority of action based on management goals.
Figure 10—Type calls identified within the King County FLAT that comprised more than 1 percent of the project by area. Note: The type call includes an acronym for the major species, the first digit represents the size class, and the second digit represents the stocking class.
0
2.0
4.0
6.0
8.0
10.0
12.0
RA33DF43
BM33RA23
DF33BM42
BM32RA32
WH33
DF23BM43
WH43
DF42RA22
RA13CW43
CW33
SF23DF32
RC43W
I21RA21
SF33CW42
Perc
enta
ge o
f all
man
agem
ent
unit
s
Type call
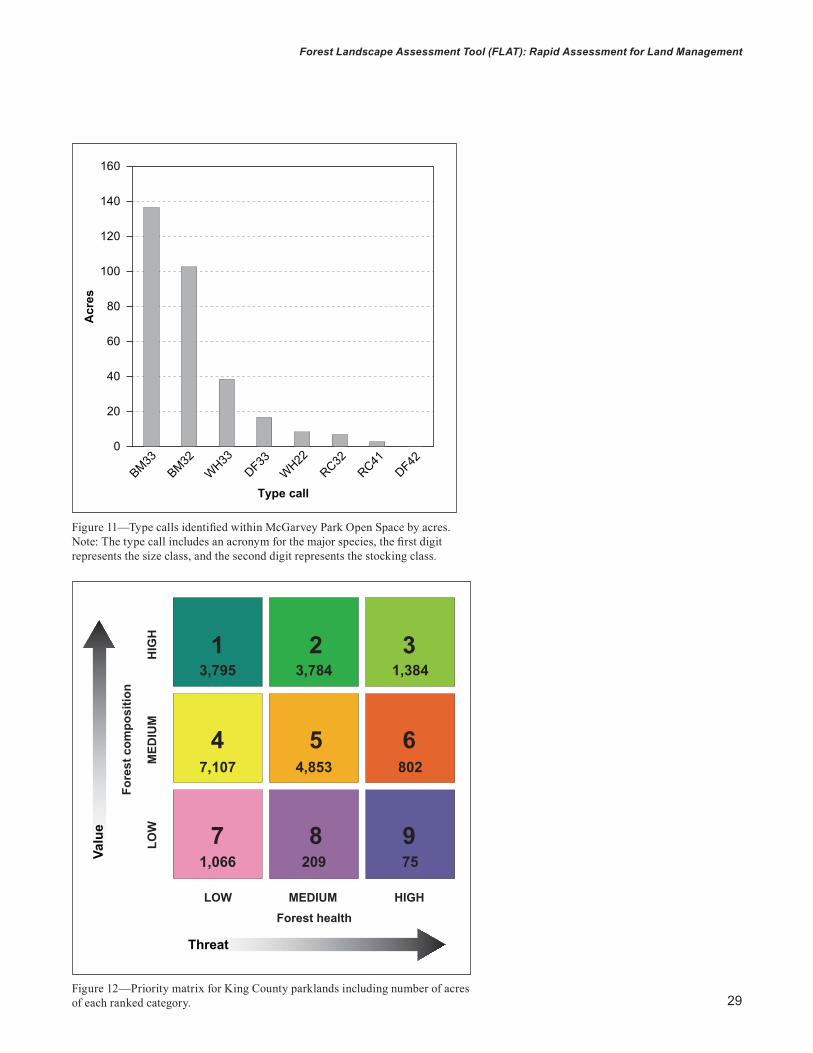
29
Forest Landscape Assessment Tool (FLAT): Rapid Assessment for Land Management
Figure 12—Priority matrix for King County parklands including number of acres of each ranked category.
Figure 11—Type calls identified within McGarvey Park Open Space by acres. Note: The type call includes an acronym for the major species, the first digit represents the size class, and the second digit represents the stocking class.
0
20
40
60
80
100
120
140
160
BM33BM32
WH33
DF33W
H22RC32
RC41DF42
Acr
es
Type call
Threat
Valu
e
Fore
st c
ompo
sitio
n
Forest health
LOW
MED
IUM
HIG
H
LOW MEDIUM HIGH
1
4
7
2
5
8
3
6
9
3,795 3,784 1,384
7,107 4,853 802
1,066 209 75
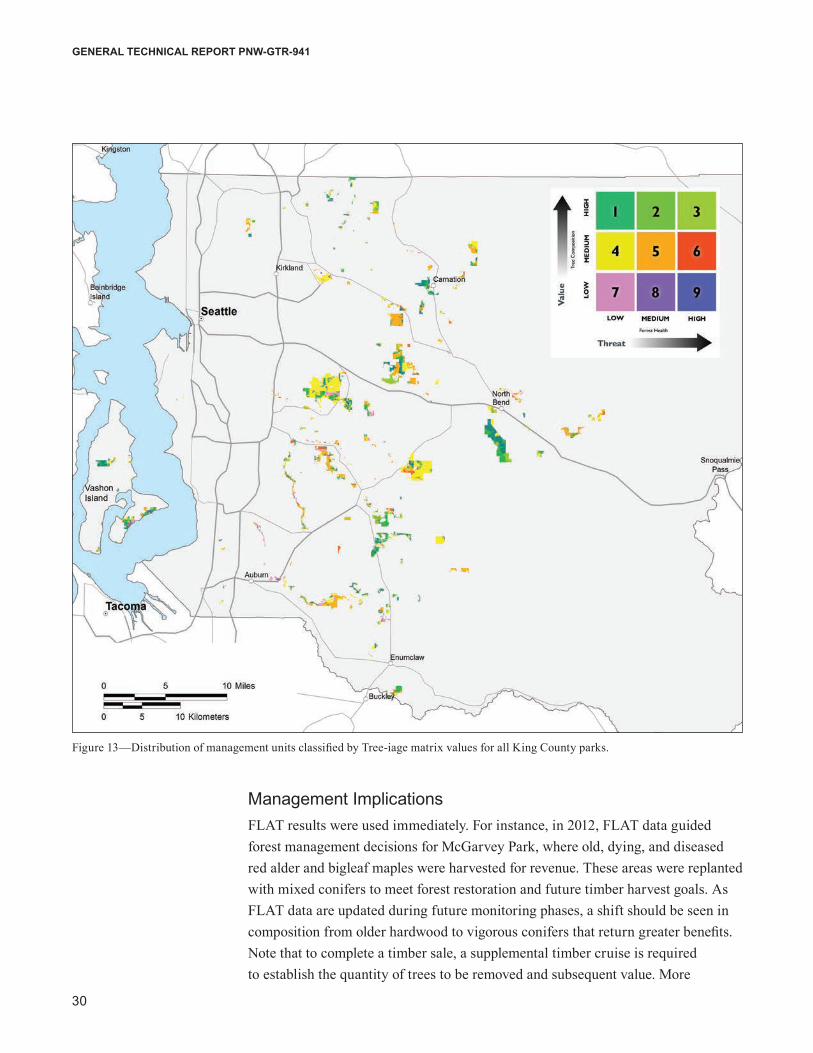
30
GENERAL TECHNICAL REPORT PNW-GTR-941
Management ImplicationsFLAT results were used immediately. For instance, in 2012, FLAT data guided forest management decisions for McGarvey Park, where old, dying, and diseased red alder and bigleaf maples were harvested for revenue. These areas were replanted with mixed conifers to meet forest restoration and future timber harvest goals. As FLAT data are updated during future monitoring phases, a shift should be seen in composition from older hardwood to vigorous conifers that return greater benefits. Note that to complete a timber sale, a supplemental timber cruise is required to establish the quantity of trees to be removed and subsequent value. More
Figure 13—Distribution of management units classified by Tree-iage matrix values for all King County parks.
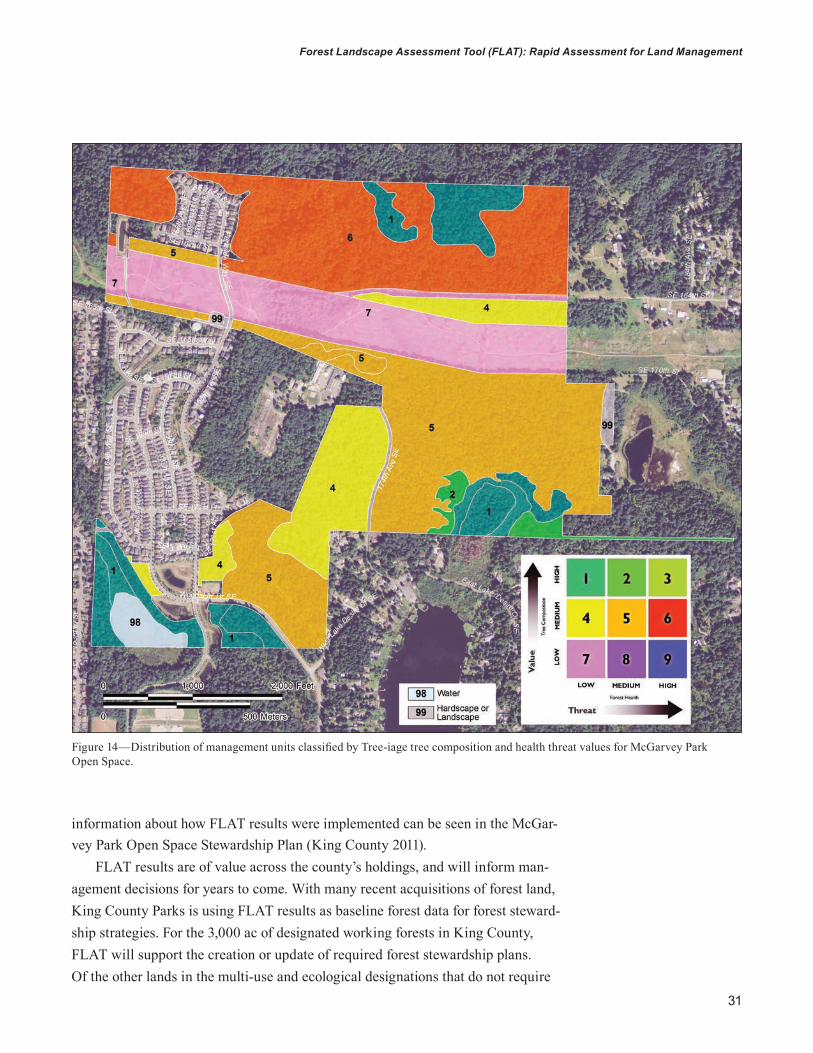
31
Forest Landscape Assessment Tool (FLAT): Rapid Assessment for Land Management
information about how FLAT results were implemented can be seen in the McGar-vey Park Open Space Stewardship Plan (King County 2011).
FLAT results are of value across the county’s holdings, and will inform man-agement decisions for years to come. With many recent acquisitions of forest land, King County Parks is using FLAT results as baseline forest data for forest steward-ship strategies. For the 3,000 ac of designated working forests in King County, FLAT will support the creation or update of required forest stewardship plans. Of the other lands in the multi-use and ecological designations that do not require
Figure 14—Distribution of management units classified by Tree-iage tree composition and health threat values for McGarvey Park Open Space.
32
GENERAL TECHNICAL REPORT PNW-GTR-941
formal stewardship plans, FLAT will provide data to help King County identify specific MUs that need further attention because of forest health threats. Based on the field data collected through FLAT, King County has started to conduct addi-tional site-specific analyses, including actions that target areas of root rot. With the data now in hand, King County managers can continue to assess their lands and designate planning resources strategically.
ConclusionsThe purpose of FLAT is to provide a systematic survey of forested lands that supports the prioritization of future management actions in a landscape system. This information can be used widely to implement landscape-level planning, unit-specific management, and ecological knowledge building.
Importance in Land Management King County and the other municipalities that have implemented FLAT and FLAT-precursors have used the resulting data in a number of ways. Their primary use has been in the planning and budgeting for stewardship and restoration programs. A baseline understanding of the status of each MU gives natural resource managers the ability to estimate the costs of future action as well as determine where and what more detailed or site-specific assessments may need to take place. The rapid assessment process can also alert them to threats or land conditions they may not have anticipated or suspected.
The FLAT data can also be used in conjunction with other spatial data or infor-mation for decisionmaking. As an example, figure 15 shows how the Green Red-mond Partnership used assessment data along with social information to prioritize restoration activities (Green Redmond Partnership 2009). Using GIS, FLAT data can be combined with demographic, ecological, or environmental data to investi-gate trends and identify relationships across a landscape or public lands system.
FLAT was designed to purposefully support adaptive management. FLAT can be iteratively applied and combined with other assessments. Also, as repeated FLAT assessments are conducted and management is carried out, the repeated measures can provide managers with a way to observe the effectiveness of management actions. This application of FLAT has not yet been done in King County. In prin-ciple, by supporting longer term observations of patterns of ecosystem response, FLAT can provide more than just a snapshot survey. As FLAT is a practical and fairly low-cost tool, it may be redone on a periodic basis (perhaps every 5 years) and become a monitoring tool for management assessment and improvement. Because it is straightforward to learn and do, a variety of participants can be involved in a data-collection cycle, from staff to volunteers to local stewardship groups.
Local governments have used FLAT data to plan their forest stewardship and restoration programs.
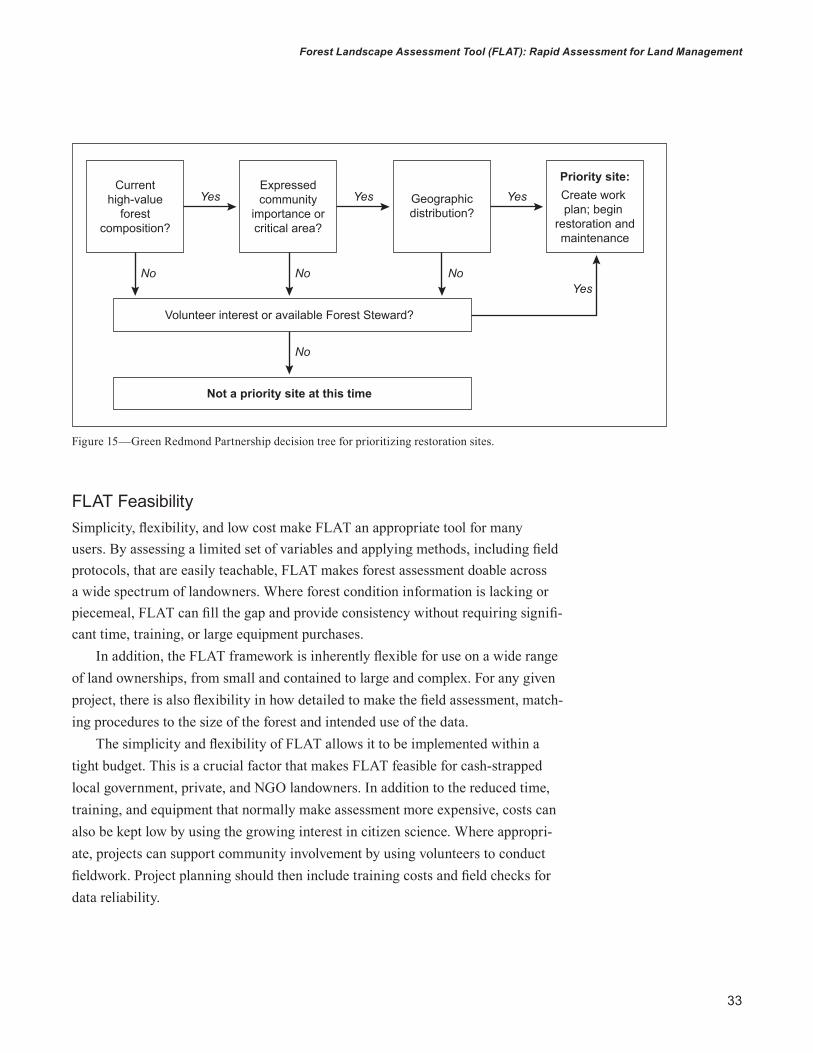
33
Forest Landscape Assessment Tool (FLAT): Rapid Assessment for Land Management
FLAT FeasibilitySimplicity, flexibility, and low cost make FLAT an appropriate tool for many users. By assessing a limited set of variables and applying methods, including field protocols, that are easily teachable, FLAT makes forest assessment doable across a wide spectrum of landowners. Where forest condition information is lacking or piecemeal, FLAT can fill the gap and provide consistency without requiring signifi-cant time, training, or large equipment purchases.
In addition, the FLAT framework is inherently flexible for use on a wide range of land ownerships, from small and contained to large and complex. For any given project, there is also flexibility in how detailed to make the field assessment, match-ing procedures to the size of the forest and intended use of the data.
The simplicity and flexibility of FLAT allows it to be implemented within a tight budget. This is a crucial factor that makes FLAT feasible for cash-strapped local government, private, and NGO landowners. In addition to the reduced time, training, and equipment that normally make assessment more expensive, costs can also be kept low by using the growing interest in citizen science. Where appropri-ate, projects can support community involvement by using volunteers to conduct fieldwork. Project planning should then include training costs and field checks for data reliability.
Currenthigh-value
forestcomposition?
Expressedcommunity
importance orcritical area?
Geographicdistribution?
Priority site:Create work plan; begin
restoration andmaintenance
Yes Yes Yes
Volunteer interest or available Forest Steward?
Not a priority site at this time
No No
No
NoYes
Figure 15—Green Redmond Partnership decision tree for prioritizing restoration sites.
34
GENERAL TECHNICAL REPORT PNW-GTR-941
StewardshipThe landscape assessment of King County’s parks and open spaces revealed that there are natural systems that in some instances are robust and healthy and, in other cases, are in decline or face substantial threats. Ongoing forest resource management is needed across all these conditions, both to restore compromised landscapes and sustain those that are healthy or moving to an improved condition. Forest and landscape management is an intensive activity, involving strategic planning, technical and scientific input, and on-the-ground actions. To carry out these activities, a resource management agency can use its own staff or contracted consultants to do land-based work. Yet fiscal constraints in local government and environmental resource organizations can limit their capacity to address ecosystem needs and recovery.
In the face of limited and declining fiscal and technical resources for ecosystem management, communities and agencies must consider new solutions to restore and sustain natural systems, particularly in urban settings (Wolf et al. 2013). Engage-ment of people and social systems, from individuals to organizations, is another stewardship option (Wolf 2012). Environmental stewardship is an increasingly com-mon response to the decline of natural systems in and around built environments (Romolini et al. 2012). Recent research in multiple U.S. cities suggests that steward-ship may be an effective and viable strategy for ecosystem management (Svendsen and Campbell 2008), particularly in urbanized areas.
There is a great deal of variability in the organizational and administrative structures that support stewardship efforts. At one level, programs and projects may be activated by landscape-scale policies and associated regulations that are promulgated by community planners, agency officials, and policy decisionmakers (Brunckhorst 2002). Other stewardship groups are composed of citizens organized to address a defined ecosystem condition that has direct personal consequences, acting for change through place-based projects and resources. Some groups are formally self-organized and have 501(c)(3) status, some are informal organizations without legal status, and some are membership organizations facilitated by a public entity (Brinkley et al. 2010).
No matter who participates in stewardship, and whatever their motivations, better landscape health outcomes can be promoted using the information provided by a landscape assessment like FLAT. For instance, having full knowledge of parcel conditions can help a stewardship coordinator within an agency to prioritize stew-ardship programs across a landscape system, to ensure that the greatest work effort is assigned to places having the greatest need. In addition, those nonprofit orga-nizations that host stewardship projects can use an assessment to assign volunteer
Stewardship organizations and volunteers can assist with FLAT data collection, contributing to better management of urban forests.
35
Forest Landscape Assessment Tool (FLAT): Rapid Assessment for Land Management
work parties within their activity area, as well as communicate to the public about the high-health parcels that may deserve conservation status. Finally, a “friends of” group of citizen stewards can use assessment information to identify the most important project sites within a park or open space within their community, so that they achieve satisfying outcomes from their self-sufficient efforts. In all these situ-ations, periodic reassessment can help the agency, organization, or group to better understand how their efforts contribute to better ecological health.
Limitations FLAT is a useful tool for planning, budgeting, stewardship, and performance measurement. However, its application does have limitations that are important to consider. The qualitative nature of the field assessment makes the FLAT unsuitable as evidence of compliance with environmental standards or the creation of envi-ronmental impact statements under state or federal law. FLAT would also not be sufficient to develop a sustainable harvest plan, though it can serve as a first step to get a picture of resources on the land.
Another limitation of FLAT is the coarse-grain scale of the data. Management Unit sizes may limit use of FLAT as a tool for understanding fine-scale ecological structures and processes. Most MUs will be larger than the level at which some plant interactions take place. Attempts to scale the MU down to small land areas will greatly increase the number of MUs, increasing cost and time of the assess-ment. FLAT, therefore, does not take into account small pockets or sites within the unit. In theory, a unit with a number of concentrated pockets of invasive species would appear the same as a unit within which a similar proportion of invasive species are found throughout a more dispersed area. Although a classification of heterogeneity could be added, a more detailed assessment will likely be required to understand site-specific details and evaluate what type of action may be neces-sary within an MU. The purpose of FLAT is therefore to determine where these detailed assessments may need to take place.
While FLAT is limited in spatial scale, it is also limited in its scale of possible indicators. As more indicators are added, the speed and simplicity of the assess-ment—two of the primary advantages—will be reduced. For FLAT to retain these qualities, it may be necessary to exclude certain variables or indicators that may be useful in specific management situations. The current FLAT protocols and analysis are a reflection of both the priorities of King County as a pilot user and the need for FLAT to retain its rapid deployment character. Project managers will have to carefully weigh the tradeoffs of including more indicators based on their specific circumstances.
36
GENERAL TECHNICAL REPORT PNW-GTR-941
In addition, the current FLAT protocols do not include wildlife. If managers have a specific species or cohort of species in mind, attributes could be added that indicate habitat suitability or presence.
Next StepsFLAT is a relatively new tool, and as such, has potential for future development, testing, and refinement. Formal testing would enhance the credibility of FLAT. Although it has already been informally tested through application to the satisfac-tion of practitioners, neither its reliability nor accuracy has been systematically evaluated. A reliability test might entail examining whether individuals with similar training and experience using FLAT on the same MU would produce similar results. An accuracy test might compare the results of a FLAT assessment for particular MUs with evaluations that involve random sampling and more traditional forest ecological data collection within those MUs.
As it currently exists, FLAT is designed for use in the lowland forests of the Puget Sound basin and, to a limited degree, in wetlands. Expanding its use to other ecosystem types in other parts of the Pacific Northwest, the Nation, or the world would require revising the measures variables. In principle, however, the basic framework should work for any number of ecosystem types. As discussed in the “FLAT Methodology” section, the system is oriented to a project-specific selection of prioritized data attributes and criteria, in order to best achieve local management goals. Expanding FLAT’s ecosystem range is thus a matter of degree, requiring additional work to develop appropriate data attributes and field test new implemen-tations. Concerns about different land scales and vegetation associations would have to be addressed.
One way that this extension of FLAT might be facilitated would be the develop-ment of a publicly available clearinghouse that catalogs indicators, classification schemes for each indicator, and prioritization systems that have been developed for various ecosystem types. Practitioners planning a FLAT project could then devise a system built on the experiences of others, just as those in the Pacific Northwest can use the King County example as a starting point.
Lastly, future research may explore applying FLAT as a practical method of monitoring ecosystem changes not necessarily tied to natural resource management goals. For example, decisionmakers interested in more general information regard-ing emerging local effects of climate change, or changes in habitat quantity or quality, or shifts in biodiversity, or any number of other topics, may adapt FLAT to focus on such system-level questions.
Although used for forest assessment in this report, FLAT can be adapted for assessment of every ecosystem type in the Pacific Northwest region.
37
Forest Landscape Assessment Tool (FLAT): Rapid Assessment for Land Management
AcknowledgmentsThis work was developed by the Green Cities Research Alliance (GCRA). In 2009, GCRA was initiated by the USDA Forest Service, Pacific Northwest Research Station, to build a program of research about urban ecosystems in the Puget Sound region. The GCRA is an integrated social-ecological research program that engages the social and biophysical sciences to meet the practical needs and concerns of local organizations and agencies. It also is an effort to coordinate science and community partners within the Pacific Northwest region and to link investigations to other U.S. urban areas. The goal of this collaboration is to increase the knowledge necessary to build healthy, sustainable urban environments. The GCRA pairs scientists with practitioners and local decisionmakers to co-design and implement research efforts that provide relevant and practical information. Major collaborators include the University of Washington, King County, Forterra, and the City of Seattle. For more information, visit http://www.fs.fed.us/pnw/research/gcra.
The GCRA’s work on FLAT has been particularly informed and supported by the Green Seattle Partnership, with special thanks to Mark Mead for his efforts on developing the Tree-iage analysis tool. The Green Everett Partnership, Forterra, and American Forest Management have also been instrumental in sharing the FLAT analysis process and database. Additional thanks and acknowledgement goes to Ara Erickson (Forterra, now with Weyerhaeuser Company), Kim Frappier (Forterra, now with the City of Mercer Island), Bill Loeber (King County), and Ted Hitzroth (American Forest Management) for their help in developing FLAT. Project field implementation was provided by the King County Department of Natural Resources and Parks, led by Brett Roberts and Jack Simonson.
Major funding for this project was provided by the American Recovery and Reinvestment Act of 2009 (ARRA) and the USDA Forest Service Pacific Northwest Research Station.
38
GENERAL TECHNICAL REPORT PNW-GTR-941
ReferencesBrinkley, W.; Wolf, K.L.; Blahna, D.J. 2010. Stewardship footprints and potential
ecosystem recovery: preliminary data for Seattle and Puget Sound. In: Laband, D., ed. Emerging issues along urban/rural interfaces III: linking science and society (Proceedings). Atlanta, GA: 24–30. http://www.naturewithin.info/CivicEco/InterfacesIII%20Prcdngs_GCRA.Dec2010.pdf. (December 17, 2015).
Brunckhorst, D. 2002. Institutions to sustain ecological and social systems. Ecological Management and Restoration. 3(2): 108–116.
Clewell, A.F.; Aronson, J. 2007. Ecological restoration: principles, values, and structure of an emerging profession. Washington, DC: Island Press. 232 p.
Dean, J.W., Jr.; Sharfman, M.P. 1996. Does decision process matter? A study of strategic decision-making effectiveness. Academy of Management Journal. 39(2): 368–396.
Green Redmond Partnership. 2009. 20-year forest management plan. Redmond, WA: City of Redmond. http://forterra.org/wp-content/uploads/2015/05/FINAL_GRP_20_YP_InDesign_FORWEB.pdf. (December 17, 2015).
Green Seattle Partnership. 2006. 20-year strategic plan. Seattle, WA: Cascade Land Conservancy and Seattle Parks and Recreation. http://greenseattle.org/ wp-content/uploads/2015/04/GSP_20YrPlan5.1.06.pdf. (April 25, 2016).
Iserson, K.V.; Moskop, J.C. 2007. Triage in medicine, part I: concept, history, and types. Annals of Emergency Medicine. 49(3): 275–281. doi:10.1016/j.annemergmed.2006.05.019.
King County. 2011. McGarvey Park Open Space forest stewardship plan. Seattle, WA: King County Department of Natural Resources and Parks, Water and Land Resources Division. http://your.kingcounty.gov/dnrp/library/2011/kcr2230.pdf. (December 17, 2015).
Marsh, W.M. 1978. Environmental analysis: for land use and site planning. New York: McGraw-Hill, Inc. 292 p.
Nowak, D.J.; Crane, D.E.; Stevens, J.C.; Hoehn, R.E.; Walton, J.T. 2008. A ground-based method of assessing urban forest structure and ecosystem services. Aboriculture & Urban Forestry. 34(6): 347–358.
Randolph, J. 2011. Environmental land use planning and management. Washington, DC: Island Press. 776 p.
39
Forest Landscape Assessment Tool (FLAT): Rapid Assessment for Land Management
Romolini, M.; Brinkley, W.; Wolf, K.L. 2012. What is urban environmental stewardship? constructing a practitioner-derived framework. Res. Note PNW-RN-566. Portland, OR: U.S. Department of Agriculture, Forest Service, Pacific Northwest Research Station. 41 p.
Sayre, R.; Roca, E.; Sedaghatkish, G.; Young, B.; Keel, S.; Roca, R.; Sheppard, S. 2000. Nature in focus: rapid ecological assessment. Washington, DC: Island Press. 202 p.
Svendsen, E.S.; Campbell, L.K. 2008. Urban ecological stewardship: understanding the structure, function and network of community-based urban land management. Cities and the Environment. 1(1): 5.
Trust for Public Land. 2012. TPL LandVote database. https://tpl.quickbase.com/db/bbqna2qct?a=dbpage&pageID=10. (December 17, 2015).
Turner, M.G. 2005. Landscape ecology in North America: past, present, and future. Ecology. 86(8): 1967–1974.
U.S. Department of Agriculture, Forest Service [USDA FS]. 2014. The forest inventory and analysis phase 3 indicators database 6.0: description and user guide. Washington, DC. 203 p. http://www.fia.fs.fed.us/library/database-documentation/. (December 17, 2015).
U.S. Department of Agriculture, Forest Service [USDA FS]. 2015. Urban field data collection procedures. The Forest Inventory and Analysis database: database description and user guide for urban data. Washington, DC. 464 p. http://www.fia.fs.fed.us/library/database-documentation/urban/current/FIADB_user%20guide_urban_10_2015.pdf. (December 17, 2015).
U.S. Department of the Interior, National Park Service [USDI NPS]. 2009. NPS natural resource condition assessments (NRCAs): standards and guidelines. Washington DC. https://www.nature.nps.gov/water/nrca/assets/docs/NRCA_Standards_and_Guidelines_Sept2009.pdf. (December 17, 2015).
Wolf, K.L. 2012. The changing importance of ecosystem services across the landscape gradient. In: Laband, D.N.; Lockaby, B.G.; Zipperer, W., eds. Urban-rural interfaces: linking people and nature. Madison, WI: American Society of Agronomy/Soil Science Society of America/Crop Science Society of America: 127–146.
Wolf, K.L.; Blahna, D.; Brinkley, W.; Romolini, M. 2013. Environmental stewardship footprint research: linking human agency and ecosystem health in the Puget Sound Region. Urban Ecosystems. 16: 13–32.
40
GENERAL TECHNICAL REPORT PNW-GTR-941
Appendix 1: How to Develop the Assessment Area and Management UnitsThe forest-cover-type mapping process defines the boundaries and area for each management unit (MU). This process establishes boundaries based on existing ownership, management goals, and vegetation and land-coverage typing from aerial or satellite photos. This section describes the steps of this process.
STEP 1: Determine Which Properties Will Be Included in the Assessment The project area should be defined in this stage based on relevant management programs and resource information needs (see fig. 16 for an example). It may help to consider if different sites will be managed by different crews or be located in different districts that will affect how management decisions are made, and may change desired assessment boundaries. Thought should also be given to regulatory designations such as wetland or riparian areas that may limit or specify manage-ment actions. Each site should have a unique name and number for identification throughout the project. For small projects, there may only be one site, having a single project area name and boundary.
STEP 2: Designate Land Cover TypeOnce the assessment sites have been chosen and identified by property ownership or management blocks, the next step is to use aerial or satellite imagery to review, then delineate similar conditions within the predesignated site or project areas. The general purpose of this photo-typing is to identify zones based on the major differ-ences in land or forest cover.
Sites should be divided into units that are given one of a number of broad land cover designations. The land cover designations for the King County pilot project are included below in table 6. Some Forest Landscape Assessment Tool (FLAT) users may wish to expand these designations to include types such as wetlands or shoreline, given the particular characteristics of the system they are evaluating.
The boundaries between land cover types should be based on breaks visible in the aerial or satellite photos. It is not necessary to precisely measure the for-est canopy cover to differentiate between, for example, a forested or natural area designation. An estimate should be fine in these cases because the typing will be verified during field data collection (see the FLAT Field Manual in app. 6). The designations can be done largely based on viewing the photos, but some may choose to use software or tools like Feature Analyst.
When in doubt about a land cover type, a convention should be established and applied consistently throughout the process. In some cases, it may make sense to
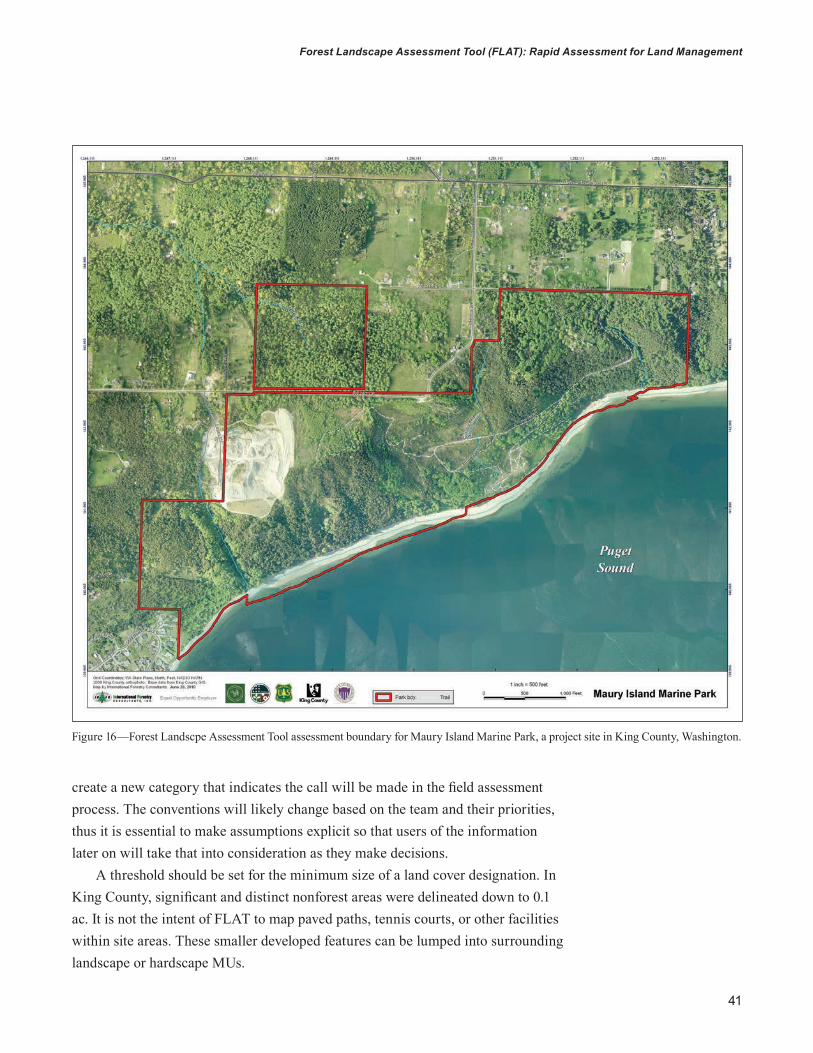
41
Forest Landscape Assessment Tool (FLAT): Rapid Assessment for Land Management
create a new category that indicates the call will be made in the field assessment process. The conventions will likely change based on the team and their priorities, thus it is essential to make assumptions explicit so that users of the information later on will take that into consideration as they make decisions.
A threshold should be set for the minimum size of a land cover designation. In King County, significant and distinct nonforest areas were delineated down to 0.1 ac. It is not the intent of FLAT to map paved paths, tennis courts, or other facilities within site areas. These smaller developed features can be lumped into surrounding landscape or hardscape MUs.
Figure 16—Forest Landscpe Assessment Tool assessment boundary for Maury Island Marine Park, a project site in King County, Washington.
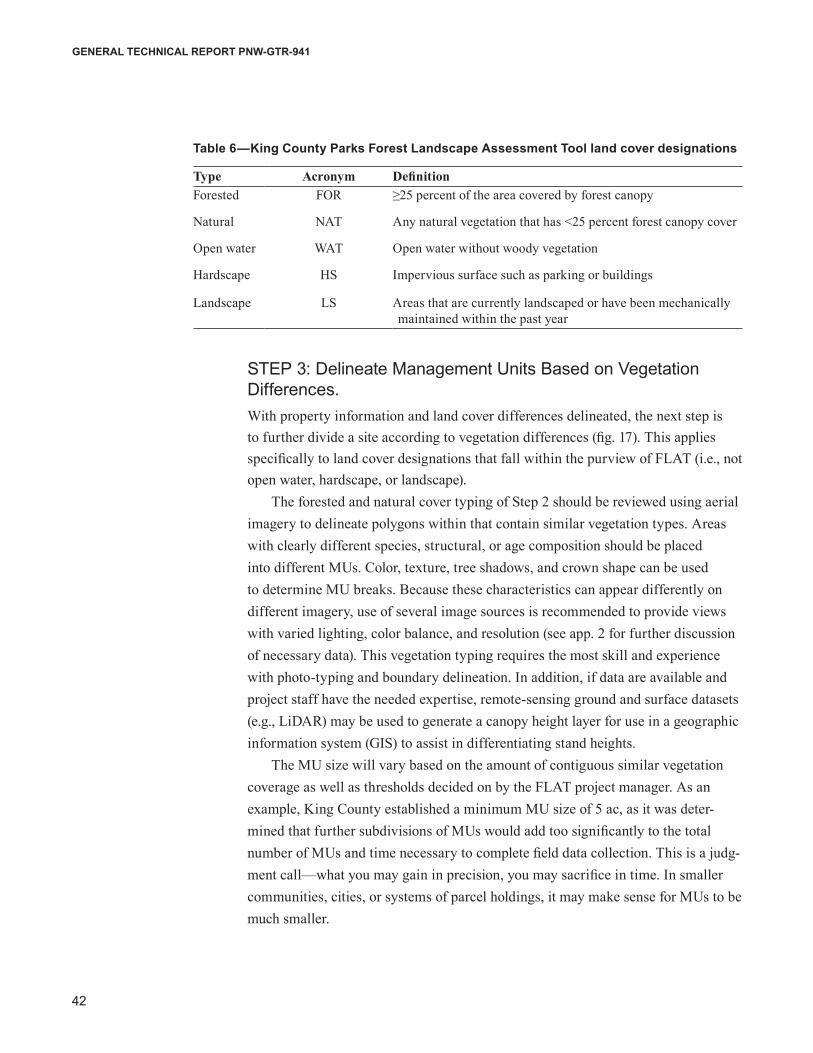
42
GENERAL TECHNICAL REPORT PNW-GTR-941
STEP 3: Delineate Management Units Based on Vegetation Differences.With property information and land cover differences delineated, the next step is to further divide a site according to vegetation differences (fig. 17). This applies specifically to land cover designations that fall within the purview of FLAT (i.e., not open water, hardscape, or landscape).
The forested and natural cover typing of Step 2 should be reviewed using aerial imagery to delineate polygons within that contain similar vegetation types. Areas with clearly different species, structural, or age composition should be placed into different MUs. Color, texture, tree shadows, and crown shape can be used to determine MU breaks. Because these characteristics can appear differently on different imagery, use of several image sources is recommended to provide views with varied lighting, color balance, and resolution (see app. 2 for further discussion of necessary data). This vegetation typing requires the most skill and experience with photo-typing and boundary delineation. In addition, if data are available and project staff have the needed expertise, remote-sensing ground and surface datasets (e.g., LiDAR) may be used to generate a canopy height layer for use in a geographic information system (GIS) to assist in differentiating stand heights.
The MU size will vary based on the amount of contiguous similar vegetation coverage as well as thresholds decided on by the FLAT project manager. As an example, King County established a minimum MU size of 5 ac, as it was deter-mined that further subdivisions of MUs would add too significantly to the total number of MUs and time necessary to complete field data collection. This is a judg-ment call—what you may gain in precision, you may sacrifice in time. In smaller communities, cities, or systems of parcel holdings, it may make sense for MUs to be much smaller.
Table 6—King County Parks Forest Landscape Assessment Tool land cover designations
Type Acronym Definition Forested FOR ≥25 percent of the area covered by forest canopy
Natural NAT Any natural vegetation that has <25 percent forest canopy cover
Open water WAT Open water without woody vegetation
Hardscape HS Impervious surface such as parking or buildings
Landscape LS Areas that are currently landscaped or have been mechanically maintained within the past year
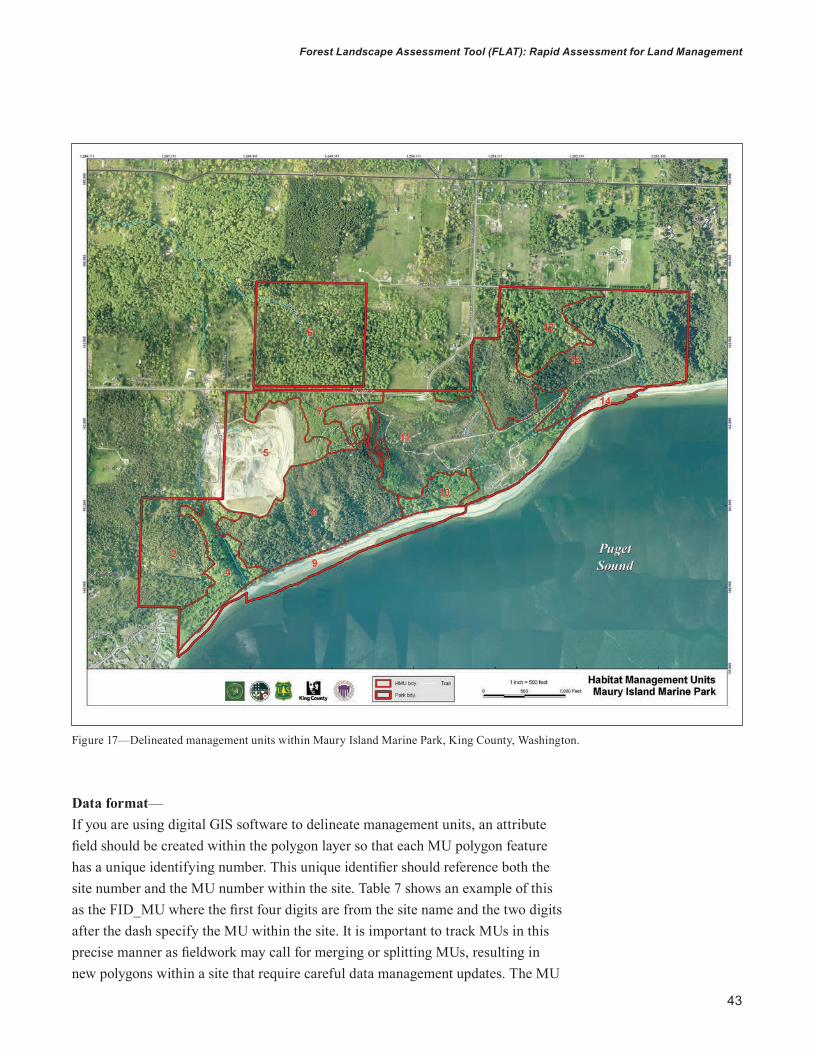
43
Forest Landscape Assessment Tool (FLAT): Rapid Assessment for Land Management
Data format—If you are using digital GIS software to delineate management units, an attribute field should be created within the polygon layer so that each MU polygon feature has a unique identifying number. This unique identifier should reference both the site number and the MU number within the site. Table 7 shows an example of this as the FID_MU where the first four digits are from the site name and the two digits after the dash specify the MU within the site. It is important to track MUs in this precise manner as fieldwork may call for merging or splitting MUs, resulting in new polygons within a site that require careful data management updates. The MU
Figure 17—Delineated management units within Maury Island Marine Park, King County, Washington.
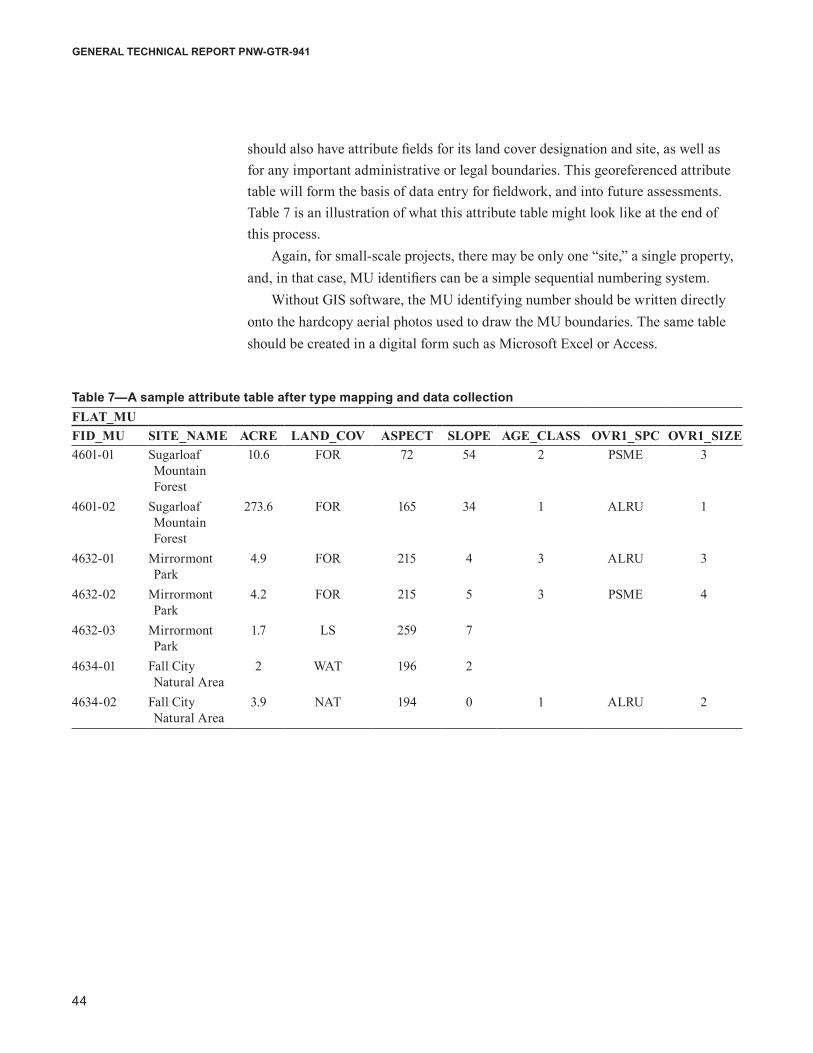
44
GENERAL TECHNICAL REPORT PNW-GTR-941
should also have attribute fields for its land cover designation and site, as well as for any important administrative or legal boundaries. This georeferenced attribute table will form the basis of data entry for fieldwork, and into future assessments. Table 7 is an illustration of what this attribute table might look like at the end of this process.
Again, for small-scale projects, there may be only one “site,” a single property, and, in that case, MU identifiers can be a simple sequential numbering system.
Without GIS software, the MU identifying number should be written directly onto the hardcopy aerial photos used to draw the MU boundaries. The same table should be created in a digital form such as Microsoft Excel or Access.
Table 7—A sample attribute table after type mapping and data collectionFLAT_MUFID_MU SITE_NAME ACRE LAND_COV ASPECT SLOPE AGE_CLASS OVR1_SPC OVR1_SIZE4601-01 Sugarloaf
Mountain Forest
10.6 FOR 72 54 2 PSME 3
4601-02 Sugarloaf Mountain Forest
273.6 FOR 165 34 1 ALRU 1
4632-01 Mirrormont Park
4.9 FOR 215 4 3 ALRU 3
4632-02 Mirrormont Park
4.2 FOR 215 5 3 PSME 4
4632-03 Mirrormont Park
1.7 LS 259 7
4634-01 Fall City Natural Area
2 WAT 196 2
4634-02 Fall City Natural Area
3.9 NAT 194 0 1 ALRU 2
45
Forest Landscape Assessment Tool (FLAT): Rapid Assessment for Land Management
Appendix 2: Necessary Data Aerial ImageryAerial photographs or satellite imagery are important sources of information for initial management unit (MU) delineation and mapping. There are several consider-ations that will help determine your best source of data: • If you are using geographic information system (GIS) software, it is
important that the imagery used be geometrically corrected, or “orthorec-tified,” and geographically referenced so that boundaries drawn using the photos will correspond to the correct places and distances on the surface of the earth.
• Resolution should be high enough to distinguish between different cover-age types, and color makes this interpretation much easier. If tools such as Feature Analyst are being used to aid in the photo typing, there may also be resolution thresholds or requirements.
• Photos should be taken during the summer, when vegetation from both deciduous and evergreen trees and shrubs are visible, as vegetation types will be used to define MU boundaries. In some cases, having multiple image sets at different times of the year will be helpful.
For the King County pilot project, several sets of aerial imagery were used, in part to be able to compare conditions. These included: • King County 2009 natural color ortho photos in 0.5 to 1 ft resolution.
These data displayed significant parallax along mosaic edges, which made typing larger areas more difficult.
• Arc® Online imagery. Arc images can change without notice and there is no control over color balance, and the radiometric settings are more likely to have rectification errors. Overall, there are fewer paral-lax and mosaic issues.
• U. S. Department of Agriculture National Aerial Imagery Program (NAIP) 1 m orthophotos.
ParcelsParcel data are important for delineating MUs. Aerial and satellite imagery can be used to type by natural conditions (such as vegetation cover, or surface water elements), but parcel boundaries are often the basis of management programs. Because the Forest Landscape Assessment Tool (FLAT) is a tool intended to sup-port management decisions, MUs should be informed by ownership and manage-ment jurisdictions. In most cases, parcel data will be the source of legal boundary delineation. Some considerations:
46
GENERAL TECHNICAL REPORT PNW-GTR-941
• Parcel data should include attributes that indicate ownership or manage-ment goals for each feature. At the very least, it is important to determine if a parcel is managed by the organization conducting the FLAT assessment.
• Note that assessor parcel GIS layers often display approximate boundaries. Locations do not always match imagery and other layers. This is usually adequate for the level of mapping used for FLAT.
Other Management Boundaries• Sometimes there may be other management program boundaries that
should be taken into consideration when creating MUs.• If there are existing stewardship plans in effect or additional information
about a specific area, it may make sense to classify MUs to accommodate preexisting documents or delineations.
• Management systems will often be divided into subdistricts or areas, each having their own programs or assigned management staff. This may also be important information for dividing MUs and should be considered along with the parcel and ownership data.
• Legal designations that limit management actions or have additional regula-tory requirements, such as riparian zones or wetlands, should also be indi-cated when delineating MUs.
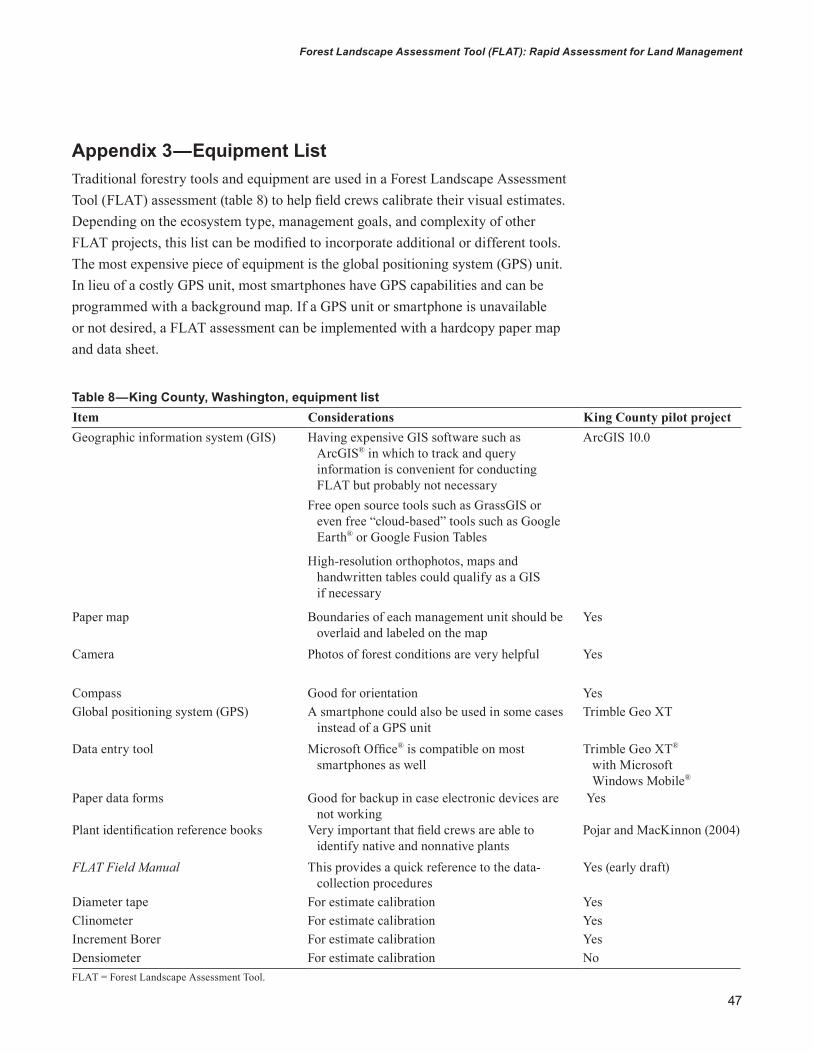
47
Forest Landscape Assessment Tool (FLAT): Rapid Assessment for Land Management
Appendix 3—Equipment List Traditional forestry tools and equipment are used in a Forest Landscape Assessment Tool (FLAT) assessment (table 8) to help field crews calibrate their visual estimates. Depending on the ecosystem type, management goals, and complexity of other FLAT projects, this list can be modified to incorporate additional or different tools. The most expensive piece of equipment is the global positioning system (GPS) unit. In lieu of a costly GPS unit, most smartphones have GPS capabilities and can be programmed with a background map. If a GPS unit or smartphone is unavailable or not desired, a FLAT assessment can be implemented with a hardcopy paper map and data sheet.
Table 8—King County, Washington, equipment listItem Considerations King County pilot projectGeographic information system (GIS) Having expensive GIS software such as
ArcGIS® in which to track and query information is convenient for conducting FLAT but probably not necessary
ArcGIS 10.0
Free open source tools such as GrassGIS or even free “cloud-based” tools such as Google Earth® or Google Fusion Tables
High-resolution orthophotos, maps and handwritten tables could qualify as a GIS if necessary
Paper map Boundaries of each management unit should be overlaid and labeled on the map
Yes
Camera Photos of forest conditions are very helpful Yes
Compass Good for orientation YesGlobal positioning system (GPS) A smartphone could also be used in some cases
instead of a GPS unitTrimble Geo XT
Data entry tool Microsoft Office® is compatible on most smartphones as well
Trimble Geo XT® with Microsoft Windows Mobile®
Paper data forms Good for backup in case electronic devices are not working
Yes
Plant identification reference books Very important that field crews are able to identify native and nonnative plants
Pojar and MacKinnon (2004)
FLAT Field Manual This provides a quick reference to the data-collection procedures
Yes (early draft)
Diameter tape For estimate calibration YesClinometer For estimate calibration YesIncrement Borer For estimate calibration YesDensiometer For estimate calibration NoFLAT = Forest Landscape Assessment Tool.
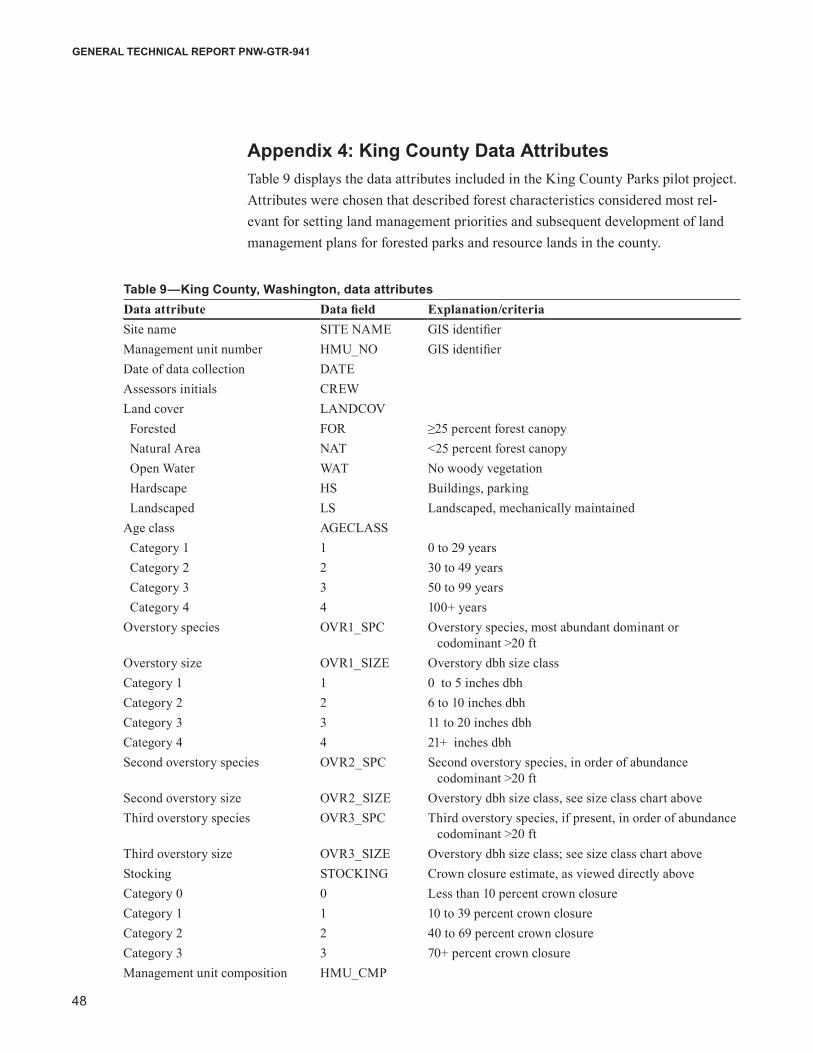
48
GENERAL TECHNICAL REPORT PNW-GTR-941
Appendix 4: King County Data Attributes Table 9 displays the data attributes included in the King County Parks pilot project. Attributes were chosen that described forest characteristics considered most rel-evant for setting land management priorities and subsequent development of land management plans for forested parks and resource lands in the county.
Table 9—King County, Washington, data attributes (continued)Data attribute Data field Explanation/criteria Site name SITE NAME GIS identifierManagement unit number HMU_NO GIS identifierDate of data collection DATEAssessors initials CREWLand cover LANDCOV Forested FOR ≥25 percent forest canopy Natural Area NAT <25 percent forest canopy Open Water WAT No woody vegetation Hardscape HS Buildings, parking Landscaped LS Landscaped, mechanically maintainedAge class AGECLASS Category 1 1 0 to 29 years Category 2 2 30 to 49 years Category 3 3 50 to 99 years Category 4 4 100+ yearsOverstory species OVR1_SPC Overstory species, most abundant dominant or
codominant >20 ftOverstory size OVR1_SIZE Overstory dbh size classCategory 1 1 0 to 5 inches dbhCategory 2 2 6 to 10 inches dbhCategory 3 3 11 to 20 inches dbhCategory 4 4 21+ inches dbhSecond overstory species OVR2_SPC Second overstory species, in order of abundance
codominant >20 ftSecond overstory size OVR2_SIZE Overstory dbh size class, see size class chart aboveThird overstory species OVR3_SPC Third overstory species, if present, in order of abundance
codominant >20 ftThird overstory size OVR3_SIZE Overstory dbh size class; see size class chart aboveStocking STOCKING Crown closure estimate, as viewed directly aboveCategory 0 0 Less than 10 percent crown closure Category 1 1 10 to 39 percent crown closure Category 2 2 40 to 69 percent crown closureCategory 3 3 70+ percent crown closure Management unit composition HMU_CMP
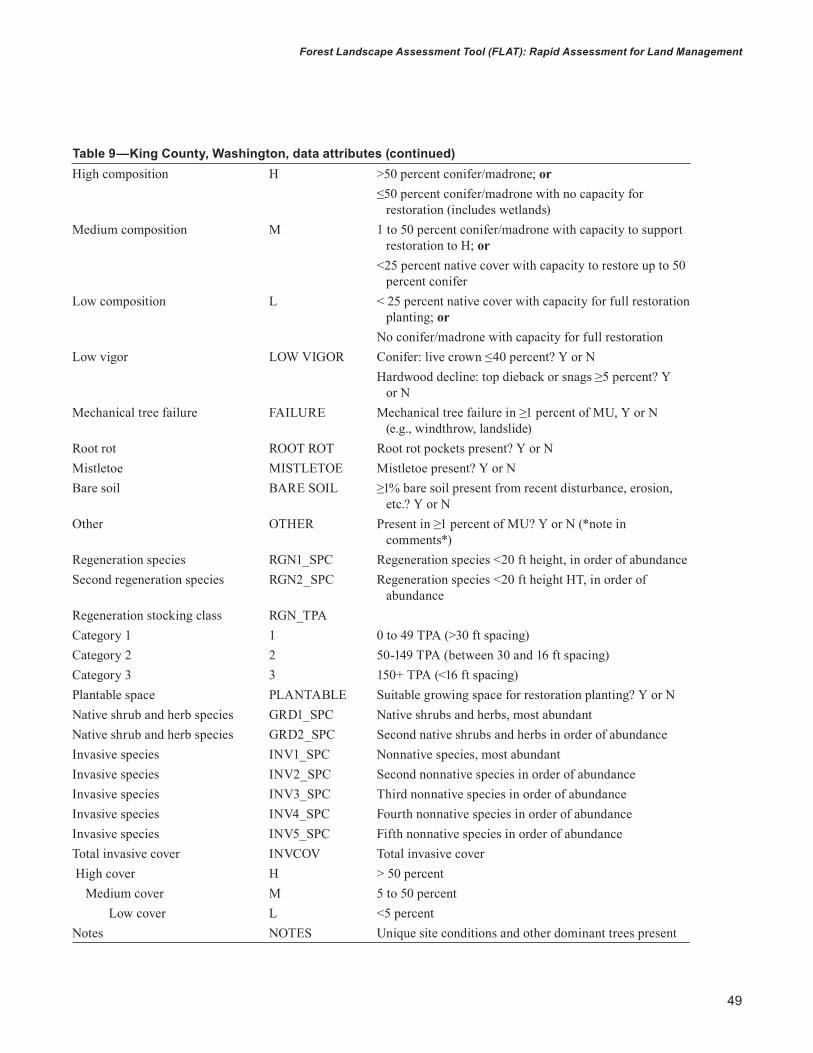
49
Forest Landscape Assessment Tool (FLAT): Rapid Assessment for Land Management
Table 9—King County, Washington, data attributes (continued)High composition H >50 percent conifer/madrone; or
≤50 percent conifer/madrone with no capacity for restoration (includes wetlands)
Medium composition M 1 to 50 percent conifer/madrone with capacity to support restoration to H; or
<25 percent native cover with capacity to restore up to 50 percent conifer
Low composition L < 25 percent native cover with capacity for full restoration planting; or
No conifer/madrone with capacity for full restorationLow vigor LOW VIGOR Conifer: live crown ≤40 percent? Y or N
Hardwood decline: top dieback or snags ≥5 percent? Y or N
Mechanical tree failure FAILURE Mechanical tree failure in ≥1 percent of MU, Y or N (e.g., windthrow, landslide)
Root rot ROOT ROT Root rot pockets present? Y or NMistletoe MISTLETOE Mistletoe present? Y or NBare soil BARE SOIL ≥1% bare soil present from recent disturbance, erosion,
etc.? Y or NOther OTHER Present in ≥1 percent of MU? Y or N (*note in
comments*)Regeneration species RGN1_SPC Regeneration species <20 ft height, in order of abundanceSecond regeneration species RGN2_SPC Regeneration species <20 ft height HT, in order of
abundanceRegeneration stocking class RGN_TPACategory 1 1 0 to 49 TPA (>30 ft spacing)Category 2 2 50-149 TPA (between 30 and 16 ft spacing)Category 3 3 150+ TPA (<16 ft spacing)Plantable space PLANTABLE Suitable growing space for restoration planting? Y or NNative shrub and herb species GRD1_SPC Native shrubs and herbs, most abundantNative shrub and herb species GRD2_SPC Second native shrubs and herbs in order of abundanceInvasive species INV1_SPC Nonnative species, most abundantInvasive species INV2_SPC Second nonnative species in order of abundanceInvasive species INV3_SPC Third nonnative species in order of abundanceInvasive species INV4_SPC Fourth nonnative species in order of abundanceInvasive species INV5_SPC Fifth nonnative species in order of abundanceTotal invasive cover INVCOV Total invasive cover High cover H > 50 percent Medium cover M 5 to 50 percent Low cover L <5 percentNotes NOTES Unique site conditions and other dominant trees present
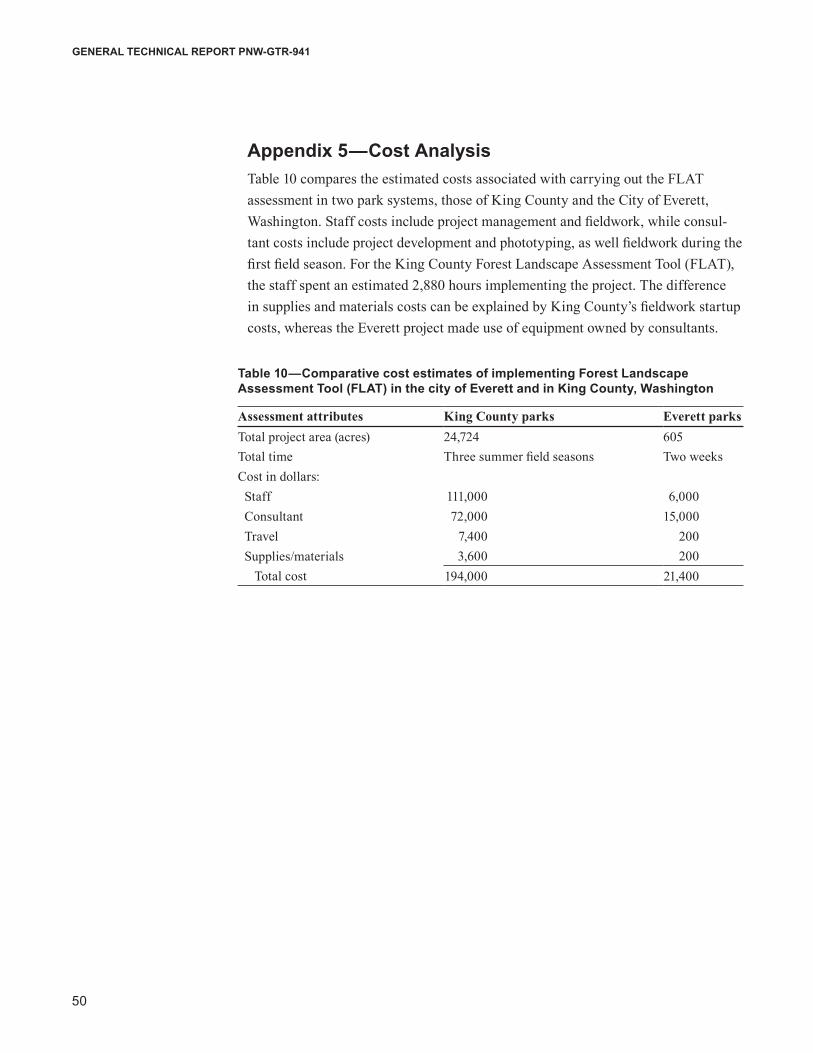
50
GENERAL TECHNICAL REPORT PNW-GTR-941
Table 10—Comparative cost estimates of implementing Forest Landscape Assessment Tool (FLAT) in the city of Everett and in King County, Washington
Assessment attributes King County parks Everett parksTotal project area (acres) 24,724 605Total time Three summer field seasons Two weeksCost in dollars: Staff 111,000 6,000 Consultant 72,000 15,000 Travel 7,400 200 Supplies/materials 3,600 200 Total cost 194,000 21,400
Appendix 5—Cost AnalysisTable 10 compares the estimated costs associated with carrying out the FLAT assessment in two park systems, those of King County and the City of Everett, Washington. Staff costs include project management and fieldwork, while consul-tant costs include project development and phototyping, as well fieldwork during the first field season. For the King County Forest Landscape Assessment Tool (FLAT), the staff spent an estimated 2,880 hours implementing the project. The difference in supplies and materials costs can be explained by King County’s fieldwork startup costs, whereas the Everett project made use of equipment owned by consultants.
51
Forest Landscape Assessment Tool (FLAT): Rapid Assessment for Land Management
Appendix 6— Forest Landscape Assessment Tool (FLAT) Field ManualThis field manual was prepared by the project partners to provide a concise proce-dures manual for reference in the field, and to provide information for field crew training. Readers can cross reference the procedures described in this technical report with this appendix. In addition, a .pdf file of the manual can be downloaded at http://www.naturewithin.info/UF/FLAT_Field_Manual.pdf.
FLAT
Fie
ld M
anu
al
The
Fore
st L
ands
cape
As
sess
men
t Too
l
GREEN
CITIES
RESEARCH
ALLIANCE
Dep
artm
ent o
f Nat
ural
Res
ourc
es a
nd P
arks
Park
s and
Rec
reat
ion
Div
isio
n
Ack
now
led
gem
ents
The
Gre
en
Cit
ies
Res
earc
h
All
ian
ce
was
in
itia
ted
by
the
USD
A F
ore
st S
ervi
ce P
acif
ic
No
rth
wes
t R
esea
rch
Sta
tio
n i
n 2
009
to b
uild
p
rog
ram
of r
esea
rch
ab
ou
t urb
an e
cosy
stem
in
the
Pug
et S
ou
nd
reg
ion
. GC
RA
pai
rs s
cien
tist
s w
ith
pra
ctit
ion
ers
and
loca
l dec
isio
n m
aker
s to
co
-des
ign
an
d im
ple
men
t res
earc
h e
ffo
rts
that
p
rovi
de
rele
van
t an
d p
ract
ical
in
form
atio
n.
The
Fore
st L
and
scap
e A
sses
smen
t To
ol
was
d
evel
op
ed b
y th
e fo
llow
ing
par
tner
s:
K
ing
Co
un
ty P
arks
an
d N
atu
ral R
eso
urc
es
U
SDA
Fo
rest
Ser
vice
PN
W R
esea
rch
Sta
tio
n
A
mer
ican
Fo
rest
Man
agem
ent
Fo
rter
ra
U
niv
ersi
ty o
f Was
hin
gto
n
For
mo
re in
form
atio
n, v
isit
w
ww
.fs.fe
d.u
s/p
nw
/res
earc
h/g
cra
Fun
din
g f
or
this
pro
ject
was
pro
vid
ed b
y th
e 20
09 U
nit
ed S
tate
s A
mer
ican
Rei
nve
stm
ent
and
Rec
ove
ry A
ct (
AR
RA
) co
ord
inat
ed b
y th
e U
SDA
Fo
rest
Ser
vice
Pac
ific
No
rth
wes
t (P
NW
) R
esea
rch
Sta
tio
n.
In a
ccor
danc
e w
ith F
eder
al la
w a
nd U
.S. D
epar
tmen
t of A
gric
ultu
re p
olic
y, th
is in
stitu
tion
is
proh
ibite
d fr
om d
iscr
imin
atio
n on
the
basi
s of
race
, col
or, n
atio
nal o
rigin
, sex
, age
or d
isab
ility
. U
SDA
is a
n eq
ual o
ppor
tuni
ty p
rovi
der a
nd e
mpl
oyer
.
Co
nte
nts
Proj
ect B
ackg
roun
d
2
Sum
mar
y of
the
FLA
T Pr
oces
s
3
Get
ting
Sta
rted
4
Qua
lity
Con
trol
Met
hods
6
Fore
st C
over
Typ
e M
appi
ng
7
Und
erst
andi
ng M
anag
emen
t Uni
t Del
inea
tion
9
Intr
oduc
tion
to F
ield
Pro
cedu
res
10
Dat
a C
olle
ctio
n D
efin
itio
ns a
nd P
roce
dure
s
12
App
endi
x
24
Refe
renc
es
39
Not
es
40
Fron
t cov
er p
hoto
cre
dit:
King
Cou
nty
Park
s and
Nat
ural
Res
ourc
es, R
ing
Hill
For
est
Firs
t edi
tion
- Dec
embe
r 201
3
3
Su
mm
ary
of
the
FLA
T P
roce
ss
At i
ts c
ore,
FLA
T co
nsis
ts o
f vis
ual e
stim
ates
of e
colo
gica
l con
ditio
ns b
y tr
aine
d st
aff to
pro
duce
a fo
rest
inve
ntor
y. W
hile
fiel
d te
ams
may
mak
e so
me
mea
sure
men
ts to
cal
ibra
te th
eir e
stim
ates
, the
ass
essm
ent i
tsel
f is
gene
rally
qua
litat
ive
and
relie
s on
car
eful
ly p
repa
red
estim
ates
rath
er th
an
prec
ise
mea
sure
men
ts.
FLA
T is
exe
cute
d in
thre
e br
oad,
seq
uent
ial p
hase
s. T
hese
incl
ude:
Ph
ase
1 –
Fore
st C
over
Typ
e M
appi
ngA
eria
l im
ager
y an
d bo
unda
ry d
ata
of th
e la
nds
unde
r con
side
ratio
n ar
e us
ed
to d
ivid
e th
e ar
ea in
to p
olyg
ons
and
delin
eate
Man
agem
ent U
nits
(MU
s).
This
wor
k is
acc
ompl
ishe
d an
d re
cord
ed u
sing
Geo
grap
hic
Info
rmat
ion
Syst
em (G
IS) t
ools
. The
se M
Us
beco
me
the
unit
of o
bser
vatio
n an
d m
easu
rem
ent f
or th
e on
-site
ass
essm
ent.
Phas
e 2
- Fie
ld A
sses
smen
tTr
aine
d fie
ld te
ams
visi
t eac
h M
U w
ithin
the
proj
ect a
rea
to c
olle
ct
pred
eter
min
ed a
ttrib
utes
. As
an e
xam
ple,
col
lect
ed a
ttrib
utes
mig
ht in
clud
e la
nd c
over
, non
-nat
ive
spec
ies
in o
rder
of a
bund
ance
, and
tree
age
cla
ss
dist
ribut
ion.
Dat
a is
col
lect
ed fo
r MU
s an
d st
ored
(usi
ng G
IS o
r oth
er d
ata
man
agem
ent s
yste
m) f
or a
ll su
rvey
ed p
arce
ls.
Phas
e 3
- Man
agem
ent P
rior
itiz
atio
nTh
e fie
ld p
roce
dure
s of
FLA
T pr
ovid
e a
rank
ing
of p
arce
l con
ditio
ns, b
oth
acro
ss n
umer
ous
parc
els
and
for s
ubun
its w
ithin
a la
rge
parc
el. S
umm
ary
data
can
be
used
to e
stab
lish
man
agem
ent p
riorit
ies
for e
ach
MU
, and
ag
greg
ated
to d
evel
op p
riorit
ies
at la
rger
sca
les,
suc
h as
the
park
or p
ark
syst
em-s
cale
(as
pres
ente
d in
the
King
Cou
nty
exam
ple
late
r in
this
repo
rt).
This
prio
ritiz
atio
n ap
proa
ch is
bas
ed o
n a
mat
rix a
nd fl
ow-c
hart
ana
lysi
s (c
alle
d Tr
ee-ia
ge) t
hat c
lass
ifies
eac
h M
U u
sing
ratin
gs o
f lan
dsca
pe q
ualit
y th
at a
re e
asily
com
pare
d ac
ross
land
man
agem
ent u
nits
. The
info
rmat
ion
prod
uced
by
the
FLA
T pr
ovid
es a
sta
ndar
dize
d ba
selin
e of
eco
logi
cal d
ata
for a
var
iety
of l
ands
cape
type
s. T
his
info
rmat
ion
can
be u
sed
to v
iew
eac
h M
U w
ithin
the
cont
ext o
f an
entir
e la
nd m
anag
emen
t sys
tem
, as
wel
l as
prov
ide
a st
artin
g po
int f
or d
evel
opin
g a
land
-use
or s
tew
ards
hip
plan
fo
r par
ticul
ar p
arce
ls. R
epea
ted
over
tim
e, F
LAT
serv
es a
s an
effe
ctiv
e m
onito
ring
tool
for m
anag
ers
to re
view
and
then
ada
pt m
anag
emen
t pr
iorit
ies
and
actio
ns b
ased
on
chan
ging
con
ditio
ns.
This
str
aigh
tfor
war
d, s
yste
mat
ic a
ppro
ach
to e
colo
gica
l ass
essm
ent
appl
ies
prin
cipl
es o
f eco
logy
and
fore
stry
to p
rovi
de q
ualit
y da
ta a
nd h
elp
dete
rmin
e la
nd m
anag
emen
t prio
ritie
s. T
he fo
llow
ing
disc
usse
s th
e or
igin
s an
d ba
sis
of F
LAT.
2 2
Pro
ject
Bac
kgro
un
d
The
Fore
st L
ands
cape
Ass
essm
ent T
ool (
FLA
T) w
as d
evel
oped
by
the
Gre
en
Citie
s Re
sear
ch A
llian
ce a
nd c
oord
inat
ed b
y th
e U
SDA
For
est S
ervi
ce P
acifi
c N
orth
wes
t Res
earc
h St
atio
n, in
par
tner
ship
with
Kin
g Co
unty
, For
terr
a an
d th
e U
nive
rsity
of W
ashi
ngto
n.
FLA
T w
as b
uilt
on th
e fr
amew
ork
of th
e Tr
ee-ia
ge to
ol, i
nitia
lly d
evel
oped
in
200
5 by
Gre
en S
eatt
le P
artn
ersh
ip s
taff.
Sim
ilar t
o m
edic
al tr
iage
, the
ap
proa
ch a
llow
s la
nd m
anag
ers
to ra
pidl
y as
sess
land
scap
e co
nditi
ons,
then
pr
iorit
ize
rest
orat
ion
activ
ities
. Usi
ng h
igh,
med
ium
, or l
ow v
alue
s fo
r bot
h fo
rest
can
opy
com
posi
tion
and
fore
st h
ealth
thre
ats,
eac
h M
anag
emen
t U
nit (
MU
) is
assi
gned
one
of n
ine
desc
riptiv
e ca
tego
ries.
The
mod
el a
ssum
es
that
with
out d
istu
rban
ce, n
atur
al a
reas
wou
ld b
e do
min
ated
by
mat
ure,
ev
ergr
een
coni
fer t
rees
, suc
h as
wes
tern
hem
lock
and
Dou
glas
-fir,
with
a
med
ium
- to
high
-den
sity
can
opy,
mix
ed a
ge-c
lass
es, a
nd s
peci
es d
iver
sity
. Th
ese
high
-qua
lity
fore
st s
tand
s, la
ckin
g in
vasi
ve s
peci
es, r
epre
sent
a ty
pica
l Pa
cific
Nor
thw
est l
owla
nd fo
rest
- th
e re
fere
nce
for t
he tr
ee-ia
ge a
naly
sis.
Base
d on
inpu
t fro
m K
ing
Coun
ty D
epar
tmen
t of N
atur
al R
esou
rces
and
Pa
rks,
Am
eric
an F
ores
t Man
agem
ent (
AFM
, for
mer
ly In
tern
atio
nal F
ores
try
Cons
ulta
nts,
Inc.
), an
d Fo
rter
ra, F
LAT
was
dev
elop
ed to
furt
her s
uppo
rt
fore
st m
anag
emen
t nee
ds. M
ore
attr
ibut
es w
ere
adde
d to
refin
e ou
tput
s an
d ne
w fl
owch
arts
cre
ated
to a
ccom
mod
ate
alte
rnat
ive
habi
tats
. The
to
ol w
as a
lso
mod
ified
to in
clud
e a
fore
st h
ealth
val
ue, p
rese
ntin
g a
new
dim
ensi
on to
the
tree
-iage
mat
rix a
naly
sis.
The
add
ition
of t
ype
call
info
rmat
ion
give
s ea
ch M
U a
spe
cies
-sto
ckin
g-de
nsity
cod
e th
at c
an b
e us
ed to
str
atify
MU
's fo
r fut
ure
man
agem
ent.
Thi
s ne
w to
ol c
aptu
res
info
rmat
ion
esse
ntia
l to
deve
lopi
ng m
anag
emen
t str
ateg
ies
for i
ndiv
idua
l M
anag
emen
t Uni
ts, a
s w
ell a
s fo
r dra
ftin
g m
anag
emen
t pla
ns a
t the
par
k or
fo
rest
sca
le.
The
FLA
T to
ol w
as p
ilote
d du
ring
2010
-201
2 fie
ld s
easo
ns a
t 149
site
s co
mpo
sed
of 1
,457
MU
’s, c
over
ing
appr
oxim
atel
y 24
,700
acr
es o
f Kin
g Co
unty
par
klan
ds. F
LAT
was
an
impo
rtan
t firs
t ste
p in
dev
elop
ing
a lo
ng
term
, sys
tem
-wid
e fo
rest
ste
war
dshi
p pr
ogra
m. D
eter
min
ing
the
cond
ition
an
d he
alth
of a
ll fo
rest
land
s w
ill h
elp
guid
e Ki
ng C
ount
y in
mak
ing
criti
cal
fore
st m
anag
emen
t dec
isio
ns.
This
man
ual w
as d
evel
oped
to re
cord
the
FLA
T pr
oces
s an
d pr
otoc
ols
for
futu
re u
se a
t Kin
g Co
unty
Par
ks, a
s w
ell a
s fo
r lan
d m
anag
ers
inte
rest
ed in
an
inno
vativ
e ra
pid
asse
ssm
ent t
ool.
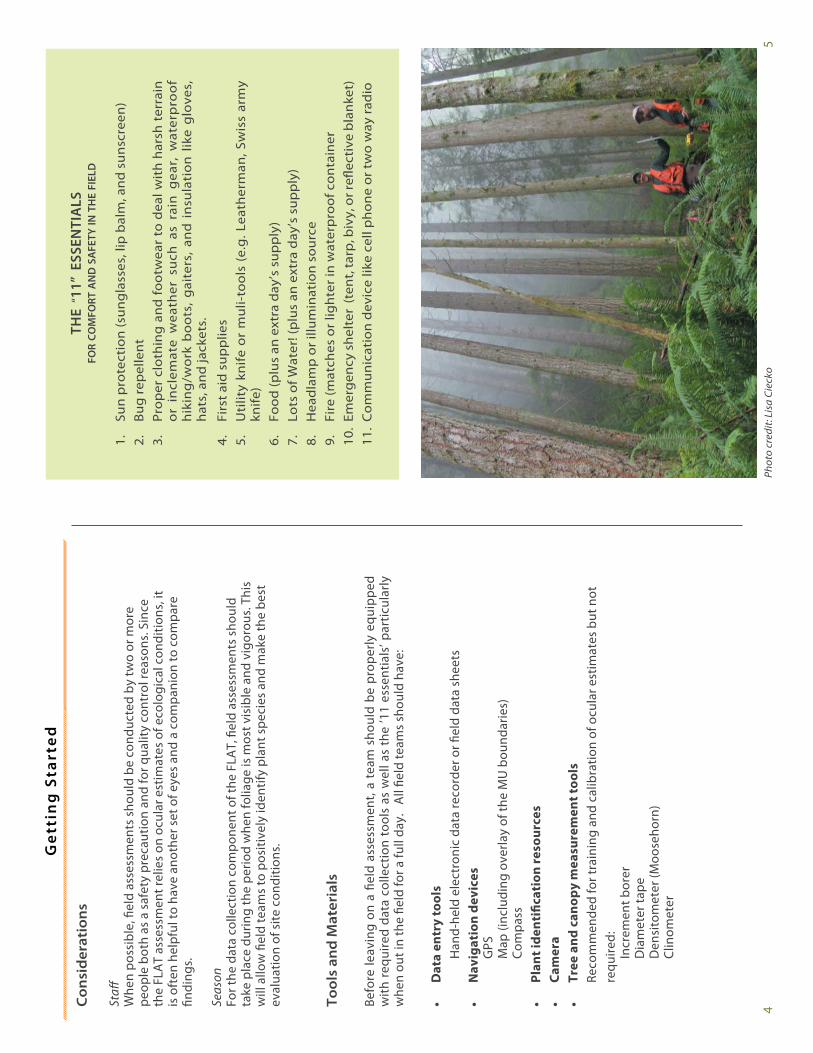
4
Ge
ttin
g S
tart
ed
Con
sid
erat
ion
s
Staff
Whe
n po
ssib
le, fi
eld
asse
ssm
ents
sho
uld
be c
ondu
cted
by
two
or m
ore
peop
le b
oth
as a
saf
ety
prec
autio
n an
d fo
r qua
lity
cont
rol r
easo
ns. S
ince
th
e FL
AT
asse
ssm
ent r
elie
s on
ocu
lar e
stim
ates
of e
colo
gica
l con
ditio
ns, i
t is
oft
en h
elpf
ul to
hav
e an
othe
r set
of e
yes
and
a co
mpa
nion
to c
ompa
re
findi
ngs.
Seas
onFo
r the
dat
a co
llect
ion
com
pone
nt o
f the
FLA
T, fi
eld
asse
ssm
ents
sho
uld
take
pla
ce d
urin
g th
e pe
riod
whe
n fo
liage
is m
ost v
isib
le a
nd v
igor
ous.
Thi
s w
ill a
llow
fiel
d te
ams
to p
ositi
vely
iden
tify
plan
t spe
cies
and
mak
e th
e be
st
eval
uatio
n of
site
con
ditio
ns.
Tool
s an
d M
ater
ials
Befo
re le
avin
g on
a fi
eld
asse
ssm
ent,
a te
am s
houl
d be
pro
perly
equ
ippe
d w
ith r
equi
red
data
col
lect
ion
tool
s as
wel
l as
the
’11
esse
ntia
ls’ p
artic
ular
ly
whe
n ou
t in
the
field
for a
full
day.
A
ll fie
ld te
ams
shou
ld h
ave:
•Dat
aen
tryto
ols
Han
d-he
ld e
lect
roni
c da
ta re
cord
er o
r fiel
d da
ta s
heet
s•
Nav
igat
ionde
vice
s
GPS
Map
(inc
ludi
ng o
verla
y of
the
MU
bou
ndar
ies)
Co
mpa
ss•
Plan
tide
ntifica
tion
reso
urce
s•
Camer
a•
Tree
and
can
opymea
sure
men
ttoo
ls
Reco
mm
ende
d fo
r tra
inin
g an
d ca
libra
tion
of o
cula
r est
imat
es b
ut n
ot
requ
ired:
In
crem
ent b
orer
D
iam
eter
tape
D
ensi
tom
eter
(Moo
seho
rn)
Cl
inom
eter
5
THE
“11”
ESS
ENTI
ALS
for
com
fort
an
d sa
fety
in th
e fie
ld
1.
Sun
pro
tect
ion
(su
ng
lass
es, l
ip b
alm
, an
d s
un
scre
en)
2.
Bug
rep
elle
nt
3.
Pro
per
clo
thin
g a
nd
fo
otw
ear
to d
eal w
ith
har
sh t
erra
in
or
incl
emat
e w
eath
er s
uch
as
rain
gea
r, w
ater
pro
of
hik
ing
/wo
rk b
oo
ts,
gai
ters
, an
d i
nsu
lati
on
lik
e g
love
s,
hat
s, a
nd
jack
ets.
4.
Firs
t ai
d s
up
plie
s5.
U
tilit
y kn
ife o
r m
uli-
too
ls (
e.g
. Lea
ther
man
, Sw
iss
arm
y kn
ife)
6.
Foo
d (p
lus
an e
xtra
day
’s s
up
ply
)7.
Lo
ts o
f Wat
er! (
plu
s an
ext
ra d
ay’s
su
pp
ly)
8.
Hea
dla
mp
or
illu
min
atio
n s
ou
rce
9.
Fire
(mat
ches
or
ligh
ter
in w
ater
pro
of c
on
tain
er10
. Em
erg
ency
sh
elte
r (t
ent,
tarp
, biv
y, o
r refl
ecti
ve b
lan
ket)
11.
Co
mm
un
icat
ion
dev
ice
like
cell
ph
on
e o
r tw
o w
ay r
adio
Phot
o cr
edit:
Lis
a Ci
ecko
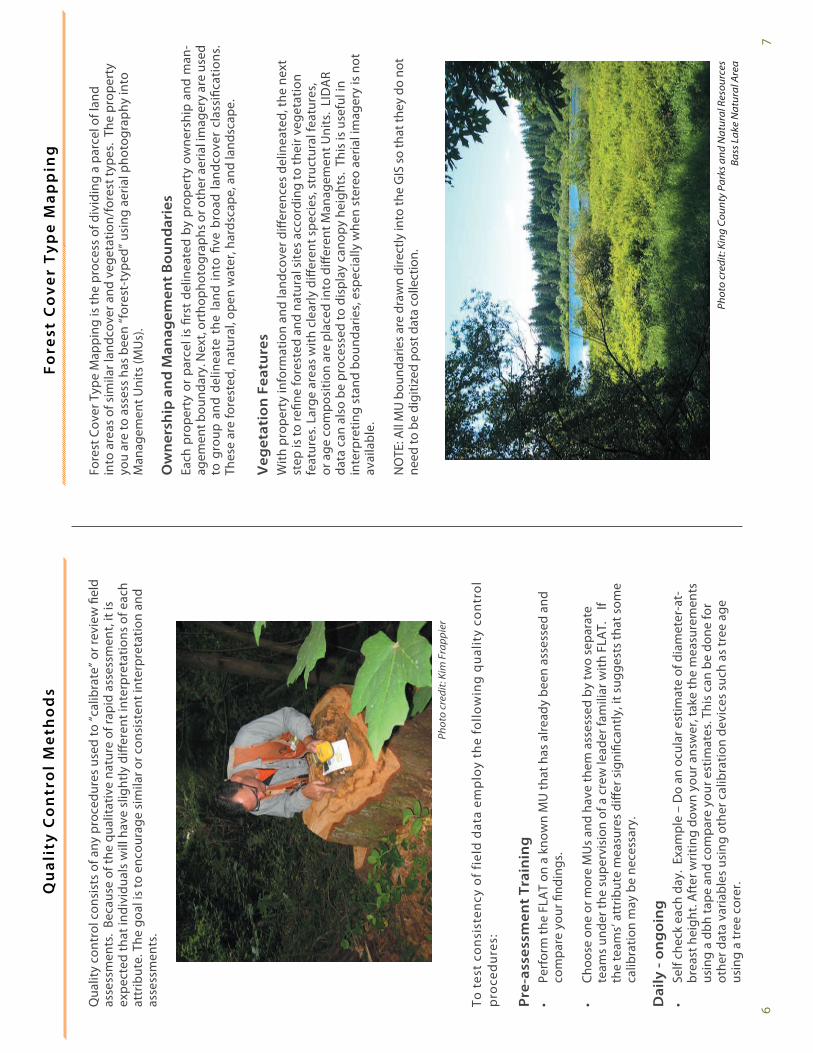
7
Fore
st C
ove
r T
ype
Map
pin
g
Fore
st C
over
Typ
e M
appi
ng is
the
proc
ess
of d
ivid
ing
a pa
rcel
of l
and
into
are
as o
f sim
ilar l
andc
over
and
veg
etat
ion/
fore
st ty
pes.
The
pro
pert
y yo
u ar
e to
ass
ess
has
been
“for
est-
type
d” u
sing
aer
ial p
hoto
grap
hy in
to
Man
agem
ent U
nits
(MU
s).
Ow
ner
ship
an
d M
anag
emen
t Bou
nd
arie
sEa
ch p
rope
rty
or p
arce
l is
first
del
inea
ted
by p
rope
rty
owne
rshi
p an
d m
an-
agem
ent b
ound
ary.
Nex
t, or
thop
hoto
grap
hs o
r oth
er a
eria
l im
ager
y ar
e us
ed
to g
roup
and
del
inea
te t
he la
nd in
to fi
ve b
road
land
cove
r cl
assi
ficat
ions
. Th
ese
are
fore
sted
, nat
ural
, ope
n w
ater
, har
dsca
pe, a
nd la
ndsc
ape.
Veg
etat
ion
Fea
ture
sW
ith p
rope
rty
info
rmat
ion
and
land
cove
r diff
eren
ces
delin
eate
d, th
e ne
xt
step
is to
refin
e fo
rest
ed a
nd n
atur
al s
ites
acco
rdin
g to
thei
r veg
etat
ion
feat
ures
. Lar
ge a
reas
with
cle
arly
diff
eren
t spe
cies
, str
uctu
ral f
eatu
res,
or
age
com
posi
tion
are
plac
ed in
to d
iffer
ent M
anag
emen
t Uni
ts.
LID
AR
data
can
als
o be
pro
cess
ed to
dis
play
can
opy
heig
hts.
Thi
s is
use
ful i
n in
terp
retin
g st
and
boun
darie
s, e
spec
ially
whe
n st
ereo
aer
ial i
mag
ery
is n
ot
avai
labl
e.
NO
TE: A
ll M
U b
ound
arie
s ar
e dr
awn
dire
ctly
into
the
GIS
so
that
they
do
not
need
to b
e di
gitiz
ed p
ost d
ata
colle
ctio
n.
Phot
o cr
edit:
Kin
g Co
unty
Par
ks a
nd N
atur
al R
esou
rces
Ba
ss L
ake
Nat
ural
Are
a
6
Qu
alit
y C
on
tro
l M
eth
od
s
Qua
lity
cont
rol c
onsi
sts
of a
ny p
roce
dure
s us
ed to
“cal
ibra
te” o
r rev
iew
fiel
d as
sess
men
ts.
Beca
use
of th
e qu
alita
tive
natu
re o
f rap
id a
sses
smen
t, it
is
expe
cted
that
indi
vidu
als
will
hav
e sl
ight
ly d
iffer
ent i
nter
pret
atio
ns o
f eac
h at
trib
ute.
The
goa
l is
to e
ncou
rage
sim
ilar o
r con
sist
ent i
nter
pret
atio
n an
d as
sess
men
ts.
To t
est
con
sist
ency
of
fiel
d d
ata
emp
loy
the
follo
win
g q
ualit
y co
ntr
ol
pro
ced
ures
:
Pre
-ass
essm
ent
Trai
nin
g•
Perf
orm
the
FLA
T on
a k
now
n M
U th
at h
as a
lread
y be
en a
sses
sed
and
com
pare
you
r find
ings
.
•Ch
oose
one
or m
ore
MU
s an
d ha
ve th
em a
sses
sed
by tw
o se
para
te
team
s un
der t
he s
uper
visi
on o
f a c
rew
lead
er fa
mili
ar w
ith F
LAT.
If
th
e te
ams’
att
ribut
e m
easu
res
diffe
r sig
nific
antly
, it s
ugge
sts
that
som
e ca
libra
tion
may
be
nece
ssar
y.
Dai
ly -
on
go
ing
•Se
lf ch
eck
each
day
. Ex
ampl
e –
Do
an o
cula
r est
imat
e of
dia
met
er-a
t-br
east
hei
ght.
Aft
er w
ritin
g do
wn
your
ans
wer
, tak
e th
e m
easu
rem
ents
us
ing
a db
h ta
pe a
nd c
ompa
re y
our e
stim
ates
. Thi
s ca
n be
don
e fo
r ot
her d
ata
varia
bles
usi
ng o
ther
cal
ibra
tion
devi
ces
such
as
tree
age
us
ing
a tr
ee c
orer
.
Phot
o cr
edit:
Kim
Fra
ppie
r
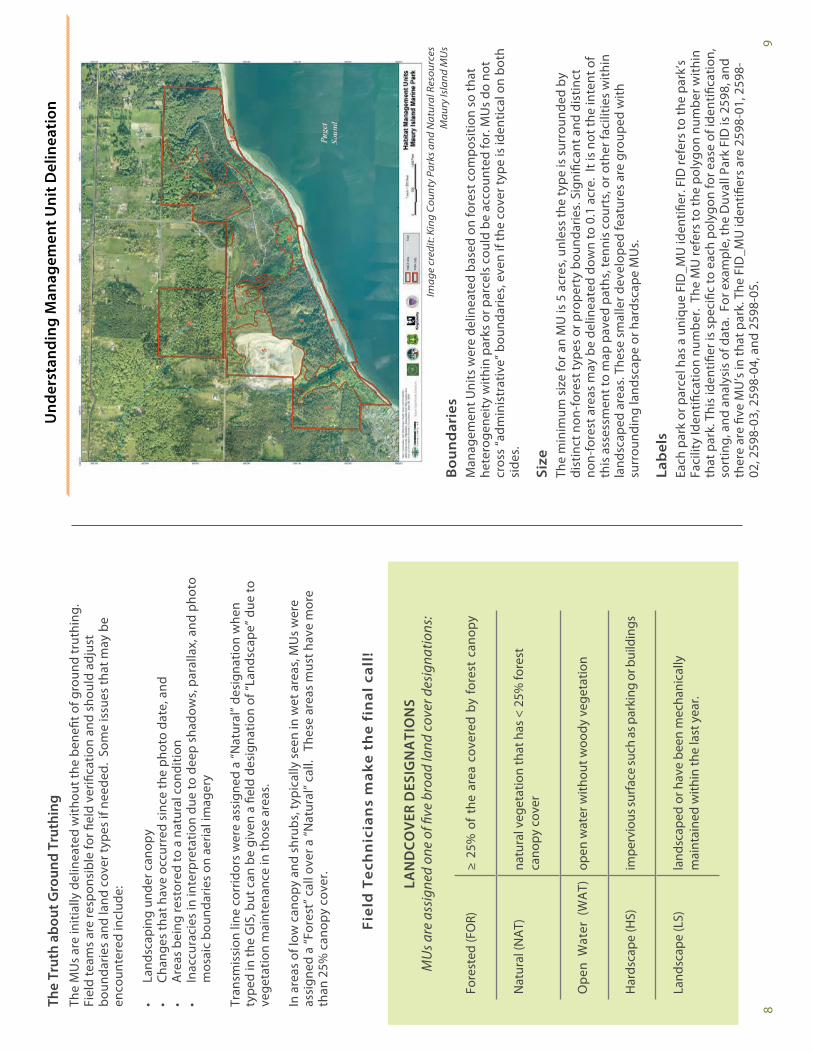
8
LAN
DC
OV
ER D
ESIG
NA
TIO
NS
MU
s are
ass
igne
d on
e of
five
bro
ad la
nd c
over
des
igna
tions
:
Fore
sted
(FO
R)≥
25%
of
the
area
cov
ered
by
fore
st c
anop
y
Nat
ural
(NA
T)na
tura
l veg
etat
ion
that
has
< 2
5% fo
rest
ca
nopy
cov
er
Ope
n W
ater
(W
AT)
op
en w
ater
with
out w
oody
veg
etat
ion
Har
dsca
pe (H
S)im
perv
ious
surf
ace
such
as p
arki
ng o
r bui
ldin
gs
Land
scap
e (L
S)la
ndsc
aped
or h
ave
been
mec
hani
cally
m
aint
aine
d w
ithin
the
last
yea
r.
The
Trut
h ab
out G
roun
d Tr
uthi
ngTh
e M
Us
are
initi
ally
del
inea
ted
with
out t
he b
enefi
t of g
roun
d tr
uthi
ng.
Fiel
d te
ams
are
resp
onsi
ble
for fi
eld
verifi
catio
n an
d sh
ould
adj
ust
boun
darie
s an
d la
nd c
over
type
s if
need
ed.
Som
e is
sues
that
may
be
enco
unte
red
incl
ude:
•La
ndsc
apin
g un
der c
anop
y •
Chan
ges
that
hav
e oc
curr
ed s
ince
the
phot
o da
te, a
nd
•A
reas
bei
ng re
stor
ed to
a n
atur
al c
ondi
tion
•
Inac
cura
cies
in in
terp
reta
tion
due
to d
eep
shad
ows,
par
alla
x, a
nd p
hoto
m
osai
c bo
unda
ries
on a
eria
l im
ager
y
Tran
smis
sion
line
cor
ridor
s w
ere
assi
gned
a “N
atur
al” d
esig
natio
n w
hen
type
d in
the
GIS
, but
can
be
give
n a
field
des
igna
tion
of “L
ands
cape
” due
to
vege
tatio
n m
aint
enan
ce in
thos
e ar
eas.
In a
reas
of l
ow c
anop
y an
d sh
rubs
, typ
ical
ly s
een
in w
et a
reas
, MU
s w
ere
assi
gned
a “F
ores
t” c
all o
ver a
“Nat
ural
” cal
l. T
hese
are
as m
ust h
ave
mor
e th
an 2
5% c
anop
y co
ver.
Fie
ld T
ech
nic
ian
s m
ake
th
e f
inal
cal
l!
9
Und
erst
andi
ng M
anag
emen
t Uni
t Del
inea
tion
Bo
un
dar
ies
Man
agem
ent U
nits
wer
e de
linea
ted
base
d on
fore
st c
ompo
sitio
n so
that
he
tero
gene
ity w
ithin
par
ks o
r par
cels
cou
ld b
e ac
coun
ted
for.
MU
s do
not
cr
oss
“adm
inis
trat
ive”
bou
ndar
ies,
eve
n if
the
cove
r typ
e is
iden
tical
on
both
si
des.
Size
The
min
imum
siz
e fo
r an
MU
is 5
acr
es, u
nles
s th
e ty
pe is
sur
roun
ded
by
dist
inct
non
-for
est t
ypes
or p
rope
rty
boun
darie
s. S
igni
fican
t and
dis
tinct
no
n-fo
rest
are
as m
ay b
e de
linea
ted
dow
n to
0.1
acr
e. I
t is
not t
he in
tent
of
this
ass
essm
ent t
o m
ap p
aved
pat
hs, t
enni
s co
urts
, or o
ther
faci
litie
s w
ithin
la
ndsc
aped
are
as. T
hese
sm
alle
r dev
elop
ed fe
atur
es a
re g
roup
ed w
ith
surr
ound
ing
land
scap
e or
har
dsca
pe M
Us.
Lab
els
Each
par
k or
par
cel h
as a
uni
que
FID
_MU
iden
tifier
. FID
refe
rs to
the
park
’s
Faci
lity
Iden
tifica
tion
num
ber.
The
MU
refe
rs to
the
poly
gon
num
ber w
ithin
th
at p
ark.
Thi
s id
entifi
er is
spe
cific
to e
ach
poly
gon
for e
ase
of id
entifi
catio
n,
sort
ing,
and
ana
lysi
s of
dat
a. F
or e
xam
ple,
the
Duv
all P
ark
FID
is 2
598,
and
th
ere
are
five
MU
’s in
that
par
k. T
he F
ID_M
U id
entifi
ers
are
2598
-01,
259
8-02
, 259
8-03
, 259
8-04
, and
259
8-05
.
Imag
e cr
edit:
Kin
g Co
unty
Par
ks a
nd N
atur
al R
esou
rces
M
aury
Isla
nd M
Us
11
Chec
kfo
rco
mplete
nes
sSo
met
imes
MU
s w
ill b
e st
rang
ely
shap
ed s
o th
at th
e te
rrai
n or
trai
ls w
ill le
ad
team
s tr
avel
ing
in a
nd o
ut o
f diff
eren
t MU
s. D
ata
may
be
ente
red
for e
ach
MU
in o
rder
of d
isco
very
but
sho
uld
be c
heck
ed fo
r com
plet
enes
s be
fore
le
avin
g th
e M
U.
When
tole
aveth
ero
adortrails
yste
mEa
ch a
ttrib
ute
dete
rmin
atio
n w
ill a
pply
to th
e en
tire
MU
, thu
s it
is im
port
ant
that
eno
ugh
of th
e M
U is
see
n by
the
field
team
. Som
etim
es th
is w
ill re
quire
le
avin
g tr
ails
and
trav
elin
g on
cha
lleng
ing
terr
ain.
In o
ther
MU
s th
e vi
ew
from
a tr
ail m
ay b
e su
ffici
ent t
o m
ake
a ju
dgm
ent o
n m
ost,
if no
t all,
of t
he
attr
ibut
es. T
eam
s sh
ould
be
care
ful t
o re
cogn
ize,
and
ave
rage
into
the
MU
es
timat
e, a
ny e
dge
effec
t alo
ng tr
ails
whe
re v
eget
atio
n m
ay h
ave
been
in
fluen
ced
by tr
ail a
ctiv
ity o
r dis
turb
ance
. A g
ood
ques
tion
to a
sk b
efor
e bu
shw
hack
ing
thro
ugh
a si
te m
ay b
e “H
ow m
uch
grea
ter u
nder
stan
ding
of
the
MU
will
I ga
in fr
om th
e tim
e it
will
take
me
to d
o th
is?”
Pre
par
ing
th
e G
PS
un
it o
r d
ata
form
s fo
r fi
eld
ass
essm
ents
•
GIS
sta
ff o
r p
roje
ct l
ead
s sh
ou
ld p
re-l
oad
bac
kgro
un
d i
mag
es o
f ve
get
atio
n o
verl
ayed
wit
h t
he
MU
map
s in
acc
ord
ance
wit
h t
he
har
dw
are
and
so
ftw
are
in u
se.
•
Elec
tro
nic
dat
a co
llect
ion
so
ftw
are
or
spre
adsh
eet
sho
uld
be
pre
-lo
aded
wit
h t
he
init
ial M
U L
and
cove
r co
des
. If u
sin
g a
GPS
wit
h t
he
bac
kgro
un
d lo
aded
, th
e im
age
file
nam
e sh
ou
ld c
orr
esp
on
d t
o t
he
map
nu
mb
er.
•
Info
rmat
ion
on
the
MU
lan
dco
ver d
esig
nat
ion
and
bo
un
dar
ies
mu
st
be
incl
ud
ed e
ith
er o
n t
he
map
, wit
hin
th
e d
ata
entr
y sy
stem
, or
on
field
form
s.
Fiel
d te
ams
will
then
be
able
to g
rou
nd
tru
th th
e la
nd
cove
r des
ign
atio
n as
wel
l as
kno
w w
hen
th
ey h
ave
ente
red
or
exit
ed t
he
MU
.
Sin
ce d
iffer
ent
GPS
un
its
hav
e ve
ry d
iffer
ent
inst
ruct
ion
s, t
his
pro
cess
w
ill b
e d
evic
e sp
ecifi
c.
10
Intr
od
uct
ion
to
Fie
ld P
roce
du
res
The
field
pro
cedu
res
enta
il oc
ular
est
imat
es o
f pre
dete
rmin
ed fo
rest
qu
aliti
es.
Fiel
d te
ams
of o
ne o
r mor
e pe
ople
vis
it ea
ch M
U, w
alk
thro
ugh
it, a
nd re
cord
an
aver
age
attr
ibut
e va
lue
for e
ach
of th
e va
riabl
es li
sted
in
this
fiel
d m
anua
l or d
ata
entr
y sy
stem
. The
fiel
d m
anua
l con
tain
s de
finiti
ons
for e
ach
varia
ble
to b
e as
sess
ed.
As
field
team
s w
alk
thro
ugh
the
MU
, the
y sh
ould
be
obse
rvan
t and
kee
p a
men
tal c
atal
og o
f wha
t the
y se
e.
Thin
gs
to k
eep
in m
ind
wh
ile c
on
du
ctin
g t
he
asse
ssm
ent:
Pro
videat
trib
ute
estim
ates
forth
een
tire
MU
Ther
e m
ay b
e pa
tche
s of
cer
tain
spe
cies
or c
ondi
tions
, but
a b
est e
ffort
sh
ould
be
mad
e to
est
imat
e fo
r the
ent
ire M
U.
This
is w
hy m
any
of th
e at
trib
ute
valu
es w
ill b
e en
tere
d up
on le
avin
g th
e M
U.
Mea
sure
men
tto
olscan
beuse
dtocalib
rate
youres
ti-
mat
esSo
me
attr
ibut
es s
uch
as D
BH, c
row
n cl
osur
e, a
ge, a
nd re
gene
ratio
n tr
ees
(tre
es le
ss th
an 2
0ft i
n he
ight
) can
be
mea
sure
d w
ith to
ols
in th
e fie
ld.
It m
ay b
e he
lpfu
l to
do th
is o
nce
or tw
ice
on a
n M
U to
cal
ibra
te e
stim
atio
ns.
How
ever
, exc
essi
ve m
easu
rem
ent t
akin
g in
the
field
will
slo
w d
own
the
rapi
d as
sess
men
t pro
cess
.
DotheMUboundar
iesnee
dtobealte
red?
Tosplit
orlump?
The
field
team
sho
uld
ask
them
selv
es w
heth
er o
r not
the
boun
darie
s of
the
MU
s sh
ould
be
alte
red,
and
if s
o, h
ow.
Ther
e ar
e of
ten
patc
hes
of d
iffer
ent
vege
tatio
n w
ithin
an
MU
whi
ch is
exp
ecte
d, b
ut p
erva
sive
diff
eren
ces
in c
ompo
sitio
n or
age
cla
sses
for l
arge
are
as o
f the
MU
may
nec
essi
tate
re
draw
ing
boun
darie
s. T
his
may
invo
lve
com
bini
ng o
r lum
ping
sm
alle
r MU
s in
to o
ne la
rger
one
or s
plitt
ing
an M
U in
to m
ultip
le, s
mal
ler M
Us.
AdditionalN
ote
san
dO
bse
rvat
ions
Fiel
d te
ams
may
find
that
ther
e is
som
ethi
ng im
port
ant o
f not
e in
the
MU
th
at d
oesn
’t ne
cess
arily
fit i
nto
any
of th
e at
trib
ute
cate
gorie
s. F
or th
is
reas
on it
is g
ood
to in
clud
e ad
ditio
nal i
nfor
mat
ion
in th
e “n
otes
” fiel
d of
th
e da
ta e
ntry
tool
or d
ata
colle
ctio
n sh
eet.
Exa
mpl
es o
f add
ition
al n
otes
in
clud
e: a
ny n
ew tr
ee o
r pla
nt s
peci
es, p
reva
lenc
e of
a 4
th o
vers
tory
tree
, un
usua
l site
or s
oil c
ondi
tions
, rec
ent d
istu
rban
ces,
and
any
rece
nt o
r on
goin
g la
nd m
anag
emen
t act
iviti
es.
12
Dat
a Co
llect
ion
Defi
niti
ons
and
Proc
edur
es
LAN
DC
OV
ERLa
ndco
ver i
s in
itial
ly a
ssig
ned
in th
e offi
ce b
y th
e G
IS p
rofe
ssio
nal a
nd
need
s to
be
field
ver
ified
.
Ther
e ar
e fiv
e la
ndco
ver c
ateg
orie
s us
ed fo
r the
Kin
g Co
unty
FLA
T as
sess
men
t: Fo
rest
ed, N
atur
al, W
ater
, Har
dsca
pe, a
nd L
ands
cape
. Usi
ng
your
fiel
d m
aps
with
MU
bou
ndar
ies,
ver
ify a
nd re
cord
the
MU
s la
ndco
ver
clas
sific
atio
n.
Ver
ify
and
rec
ord
lan
dco
ver
usi
ng
th
e fo
llow
ing
ca
teg
ori
es
ASP
ECT
AN
D S
LOP
EA
spec
t and
slo
pe a
re p
roce
ssed
in th
e offi
ce th
roug
h av
aila
ble
digi
tal
elev
atio
n m
odel
dat
a in
GIS
for e
ach
MU
. Thi
s is
esp
ecia
lly u
sefu
l for
larg
er
MU
’s w
here
asp
ect a
nd s
lope
var
y th
roug
hout
the
unit.
If a
pro
ject
cal
ls fo
r fie
ld d
eter
min
atio
n th
en p
roce
ed a
s fo
llow
s:
•U
se a
com
pass
to d
eter
min
e th
e pr
edom
inan
t dire
ctio
n of
the
slop
e on
th
e si
te.
•A
spec
t is
ofte
n de
scrib
ed a
s th
e di
rect
ion
in w
hich
wat
er fl
ows
off a
site
•Co
de a
s fo
llow
s: N
, NE,
E, S
E, S
, SW
, W, N
W o
r flat
. •
Det
aile
d in
stru
ctio
ns o
n us
e of
a c
ompa
ss c
an b
e fo
und
in A
ppen
dix
E.
Fore
sted
(FO
R)≥
25%
of t
he a
rea
cove
red
by fo
rest
can
opy
Nat
ural
(NA
T)na
tura
l veg
etat
ion
that
has
< 2
5% fo
rest
can
opy
cove
r
Ope
n W
ater
(W
AT)
op
en w
ater
with
out w
oody
veg
etat
ion
Har
dsca
pe (H
S)im
perv
ious
sur
face
suc
h as
par
king
or
build
ings
Land
scap
e (L
S)la
ndsc
aped
or
have
bee
n m
echa
nica
lly m
aint
aine
d w
ithin
the
last
yea
r.
13
OV
ERST
OR
YO
vers
tory
refe
rs to
tree
s w
hose
folia
ge fo
rms
the
uppe
rmos
t cro
wn
cove
r or
cano
py o
f a fo
rest
sta
nd.
The
fore
st a
sses
smen
t tea
m w
ill c
hara
cter
ize
dom
inan
t or c
o-do
min
ant
over
stor
y tr
ee s
peci
es in
ord
er o
f abu
ndan
ce fo
und
in th
e M
U in
clud
ing
the
size
cla
ss o
f eac
h sp
ecie
s. A
ge c
lass
info
rmat
ion
will
onl
y be
col
lect
ed fo
r the
do
min
ant o
vers
tory
spe
cies
.
The
first
, sec
ond,
and
third
ord
er o
f abu
ndan
ce s
houl
d be
det
erm
ined
by
the
two
dim
ensi
onal
are
a th
at th
e sp
ecie
s w
ould
occ
upy
if lo
okin
g at
the
aeria
l im
age.
Fie
ld te
ams
can
use
the
aeria
l im
ager
y to
hel
p id
entif
y th
e pr
esen
ce in
the
MU
.
Co
llect
th
e fo
llow
ing
ove
rsto
ry d
ata
Ove
rsto
rySpe
cies
1:T
he m
ost a
bund
ant d
omin
ant o
r co-
dom
inan
t ov
erst
ory
spec
ies
grea
ter t
han
20 fe
et in
hei
ght.
•Sp
ecie
s co
de (N
ote:
if th
e tr
ee is
not
list
ed in
the
plan
t lis
t in
Appe
ndix
B,
prov
ide
the
4 di
git s
peci
es c
ode,
com
mon
, and
scie
ntifi
c na
mes
in th
e no
tes
sect
ion)
•A
ge C
lass
•Si
ze C
lass
Ove
rsto
rySpe
cies
2and
3:T
he s
econ
d an
d th
ird m
ost a
bund
ant c
o-do
min
ant o
vers
tory
spe
cies
gre
ater
than
20
feet
in h
eigh
t.
•Sp
ecie
s co
de (N
ote:
if th
e tr
ee is
not
list
ed in
the
plan
t lis
t in
Appe
ndix
B,
prov
ide
the
4 di
git s
peci
es c
ode,
com
mon
, and
scie
ntifi
c na
mes
in th
e no
tes
sect
ion)
•Si
ze C
lass
for e
ach
spec
ies.
Dom
inan
t ver
sus
Co-
dom
inan
t
Do
min
ance
is a
rel
ativ
e d
esig
nat
ion
of t
ree
cro
wn
s an
d is
al
so r
efer
red
to
as
cro
wn
cla
ss. D
om
inan
t tr
ees
are
tho
se w
ith
cro
wn
s ab
ove
th
e g
ener
al le
vel o
f th
e ca
no
py.
Co
-do
min
ance
re
fers
to
tre
es w
ho
se c
row
ns
form
th
e g
ener
al le
vel o
f th
e ca
no
py.
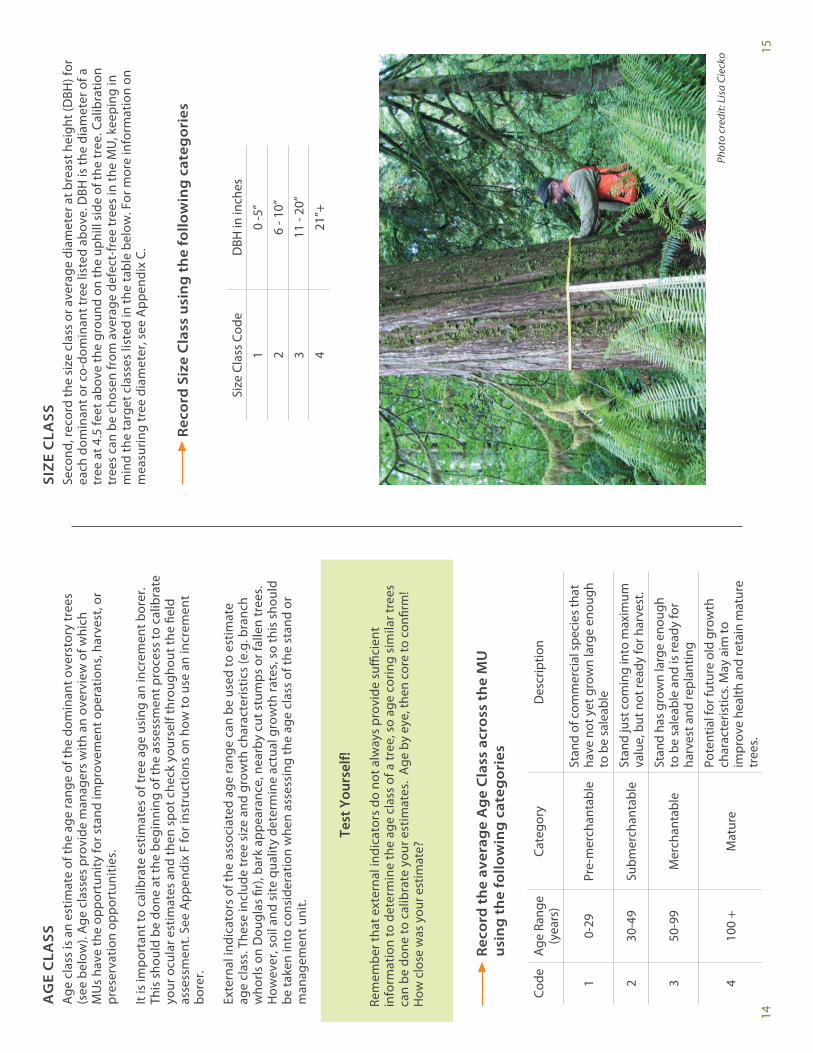
15
SIZ
E C
LASS
Seco
nd, r
ecor
d th
e si
ze c
lass
or a
vera
ge d
iam
eter
at b
reas
t hei
ght (
DBH
) for
ea
ch d
omin
ant o
r co-
dom
inan
t tre
e lis
ted
abov
e. D
BH is
the
diam
eter
of a
tr
ee a
t 4.5
feet
abo
ve th
e gr
ound
on
the
uphi
ll si
de o
f the
tree
. Cal
ibra
tion
tree
s ca
n be
cho
sen
from
ave
rage
def
ect-
free
tree
s in
the
MU
, kee
ping
in
min
d th
e ta
rget
cla
sses
list
ed in
the
tabl
e be
low
. For
mor
e in
form
atio
n on
m
easu
ring
tree
dia
met
er, s
ee A
ppen
dix
C.
Rec
ord
Siz
e C
lass
usi
ng
th
e fo
llow
ing
cat
ego
ries
Size
Cla
ss C
ode
DBH
in in
ches
10
-5”
26
- 10”
311
- 20
”
421
”+
Phot
o cr
edit:
Lis
a Ci
ecko
14
AG
E C
LASS
Age
cla
ss is
an
estim
ate
of th
e ag
e ra
nge
of th
e do
min
ant o
vers
tory
tree
s (s
ee b
elow
). A
ge c
lass
es p
rovi
de m
anag
ers
with
an
over
view
of w
hich
M
Us
have
the
oppo
rtun
ity fo
r sta
nd im
prov
emen
t ope
ratio
ns, h
arve
st, o
r pr
eser
vatio
n op
port
uniti
es.
It is
impo
rtan
t to
calib
rate
est
imat
es o
f tre
e ag
e us
ing
an in
crem
ent b
orer
. Th
is s
houl
d be
don
e at
the
begi
nnin
g of
the
asse
ssm
ent p
roce
ss to
cal
ibra
te
your
ocu
lar e
stim
ates
and
then
spo
t che
ck y
ours
elf t
hrou
ghou
t the
fiel
d as
sess
men
t. Se
e A
ppen
dix
F fo
r ins
truc
tions
on
how
to u
se a
n in
crem
ent
bore
r.
Exte
rnal
indi
cato
rs o
f the
ass
ocia
ted
age
rang
e ca
n be
use
d to
est
imat
e ag
e cl
ass.
The
se in
clud
e tr
ee s
ize
and
grow
th c
hara
cter
istic
s (e
.g. b
ranc
h w
horls
on
Dou
glas
fir)
, bar
k ap
pear
ance
, nea
rby
cut s
tum
ps o
r fal
len
tree
s.
How
ever
, soi
l and
site
qua
lity
dete
rmin
e ac
tual
gro
wth
rate
s, s
o th
is s
houl
d be
take
n in
to c
onsi
dera
tion
whe
n as
sess
ing
the
age
clas
s of
the
stan
d or
m
anag
emen
t uni
t.
Rec
ord
th
e av
erag
e A
ge
Cla
ss a
cro
ss t
he
MU
u
sin
g t
he
follo
win
g c
ateg
ori
es Co
deA
ge R
ange
(y
ears
)Ca
tego
ryD
escr
iptio
n
10-
29Pr
e-m
erch
anta
ble
Stan
d of
com
mer
cial
spe
cies
that
ha
ve n
ot y
et g
row
n la
rge
enou
gh
to b
e sa
leab
le
230
-49
Subm
erch
anta
ble
Stan
d ju
st c
omin
g in
to m
axim
um
valu
e, b
ut n
ot re
ady
for h
arve
st.
350
-99
Mer
chan
tabl
eSt
and
has
grow
n la
rge
enou
gh
to b
e sa
leab
le a
nd is
read
y fo
r ha
rves
t and
repl
antin
g
410
0 +
Mat
ure
Pote
ntia
l for
futu
re o
ld g
row
th
char
acte
ristic
s. M
ay a
im to
im
prov
e he
alth
and
reta
in m
atur
e tr
ees.
Test
You
rsel
f!
Rem
embe
r tha
t ext
erna
l ind
icat
ors
do n
ot a
lway
s pr
ovid
e su
ffici
ent
info
rmat
ion
to d
eter
min
e th
e ag
e cl
ass
of a
tree
, so
age
corin
g si
mila
r tre
es
can
be d
one
to c
alib
rate
you
r est
imat
es.
Age
by
eye,
then
cor
e to
con
firm
! H
ow c
lose
was
you
r est
imat
e?
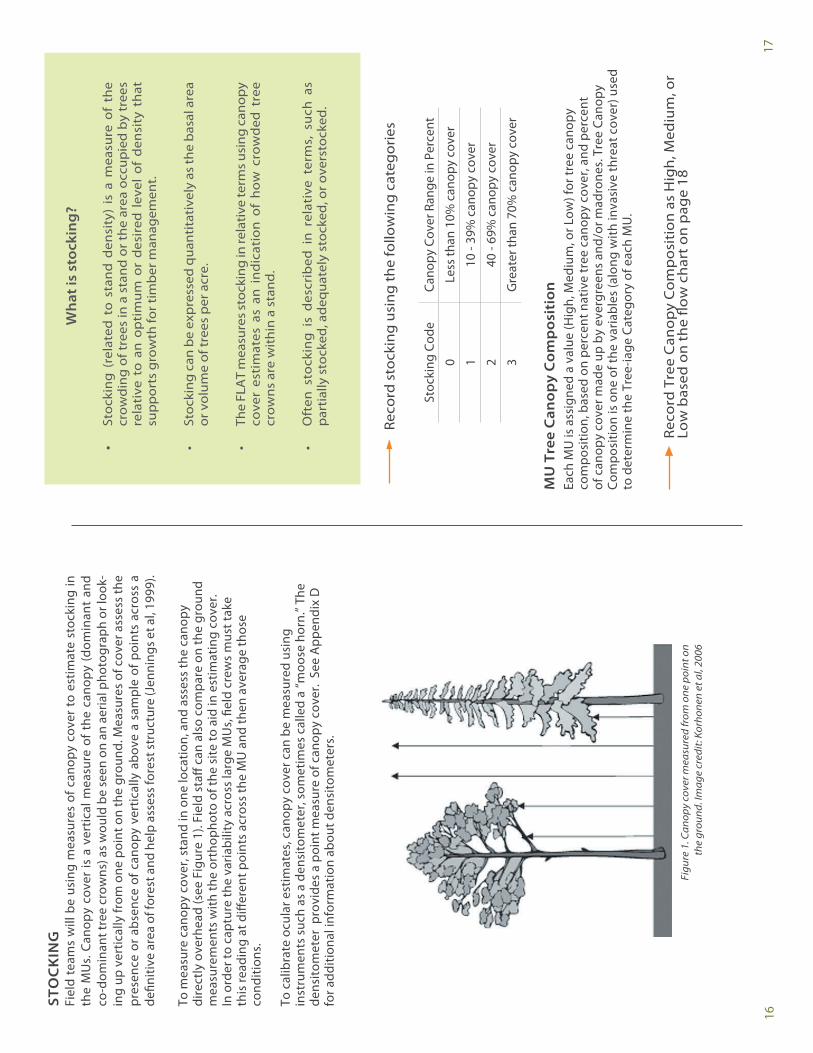
16
STO
CK
ING
Fi
eld
team
s w
ill b
e us
ing
mea
sure
s of
can
opy
cove
r to
est
imat
e st
ocki
ng in
th
e M
Us.
Can
opy
cove
r is
a v
ertic
al m
easu
re o
f the
can
opy
(dom
inan
t an
d co
-dom
inan
t tre
e cr
owns
) as
wou
ld b
e se
en o
n an
aer
ial p
hoto
grap
h or
look
-in
g up
ver
tical
ly fr
om o
ne p
oint
on
the
grou
nd. M
easu
res
of c
over
ass
ess
the
pres
ence
or
abse
nce
of c
anop
y ve
rtic
ally
abo
ve a
sam
ple
of p
oint
s ac
ross
a
defin
itive
are
a of
fore
st a
nd h
elp
asse
ss fo
rest
stru
ctur
e (J
enni
ngs e
t al,
1999
).
To m
easu
re c
anop
y co
ver,
stan
d in
one
loca
tion,
and
ass
ess
the
cano
py
dire
ctly
ove
rhea
d (s
ee F
igur
e 1)
. Fie
ld s
taff
can
also
com
pare
on
the
grou
nd
mea
sure
men
ts w
ith th
e or
thop
hoto
of t
he s
ite to
aid
in e
stim
atin
g co
ver.
In o
rder
to c
aptu
re th
e va
riabi
lity
acro
ss la
rge
MU
s, fi
eld
crew
s m
ust t
ake
this
read
ing
at d
iffer
ent p
oint
s ac
ross
the
MU
and
then
ave
rage
thos
e co
nditi
ons.
To c
alib
rate
ocu
lar e
stim
ates
, can
opy
cove
r can
be
mea
sure
d us
ing
inst
rum
ents
suc
h as
a d
ensi
tom
eter
, som
etim
es c
alle
d a
“moo
se h
orn.
” The
de
nsito
met
er p
rovi
des
a po
int m
easu
re o
f can
opy
cove
r. S
ee A
ppen
dix
D
for a
dditi
onal
info
rmat
ion
abou
t den
sito
met
ers.
Figu
re 1
. Can
opy
cove
r mea
sure
d fr
om o
ne p
oint
on
the
grou
nd. I
mag
e cr
edit:
Kor
hone
n et
al,
2006
17
Rec
ord
sto
ckin
g u
sing
the
follo
win
g c
ateg
orie
s
Stoc
king
Cod
eCa
nopy
Cov
er R
ange
in P
erce
nt
0Le
ss th
an 1
0% c
anop
y co
ver
110
- 39
% c
anop
y co
ver
240
- 69
% c
anop
y co
ver
3G
reat
er th
an 7
0% c
anop
y co
ver
Wh
at is
sto
ckin
g?
•
Sto
ckin
g (
rela
ted
to
sta
nd
den
sity
) is
a m
easu
re o
f th
e cr
owd
ing
of t
rees
in a
sta
nd o
r the
are
a oc
cup
ied
by
tree
s re
lati
ve t
o a
n o
pti
mu
m o
r d
esir
ed l
evel
of
den
sity
th
at
sup
por
ts g
row
th fo
r tim
ber
man
agem
ent.
•
Stoc
king
can
be
exp
ress
ed q
uant
itat
ivel
y as
the
bas
al a
rea
or v
olum
e of
tree
s p
er a
cre.
•
The
FLA
T m
easu
res
stoc
king
in re
lativ
e te
rms
usin
g ca
nop
y co
ver
esti
mat
es a
s an
in
dic
atio
n o
f h
ow
cro
wd
ed t
ree
crow
ns a
re w
ithi
n a
stan
d.
•
Oft
en s
tock
ing
is
des
crib
ed i
n r
elat
ive
term
s, s
uch
as
par
tial
ly s
tock
ed, a
deq
uate
ly s
tock
ed, o
r ove
rsto
cked
.
MU
Tre
e C
ano
py
Co
mp
osi
tio
n
Each
MU
is a
ssig
ned
a va
lue
(Hig
h, M
ediu
m, o
r Low
) for
tree
can
opy
com
posi
tion,
bas
ed o
n pe
rcen
t nat
ive
tree
can
opy
cove
r, an
d pe
rcen
t of
can
opy
cove
r mad
e up
by
ever
gree
ns a
nd/o
r mad
rone
s. T
ree
Cano
py
Com
posi
tion
is o
ne o
f the
var
iabl
es (a
long
with
inva
sive
thre
at c
over
) use
d to
det
erm
ine
the
Tree
-iage
Cat
egor
y of
eac
h M
U.
Rec
ord
Tre
e C
ano
py
Co
mp
osi
tio
n a
s H
igh
, Med
ium
, or
Lo
w b
ased
on
th
e flo
w c
har
t o
n p
age
18
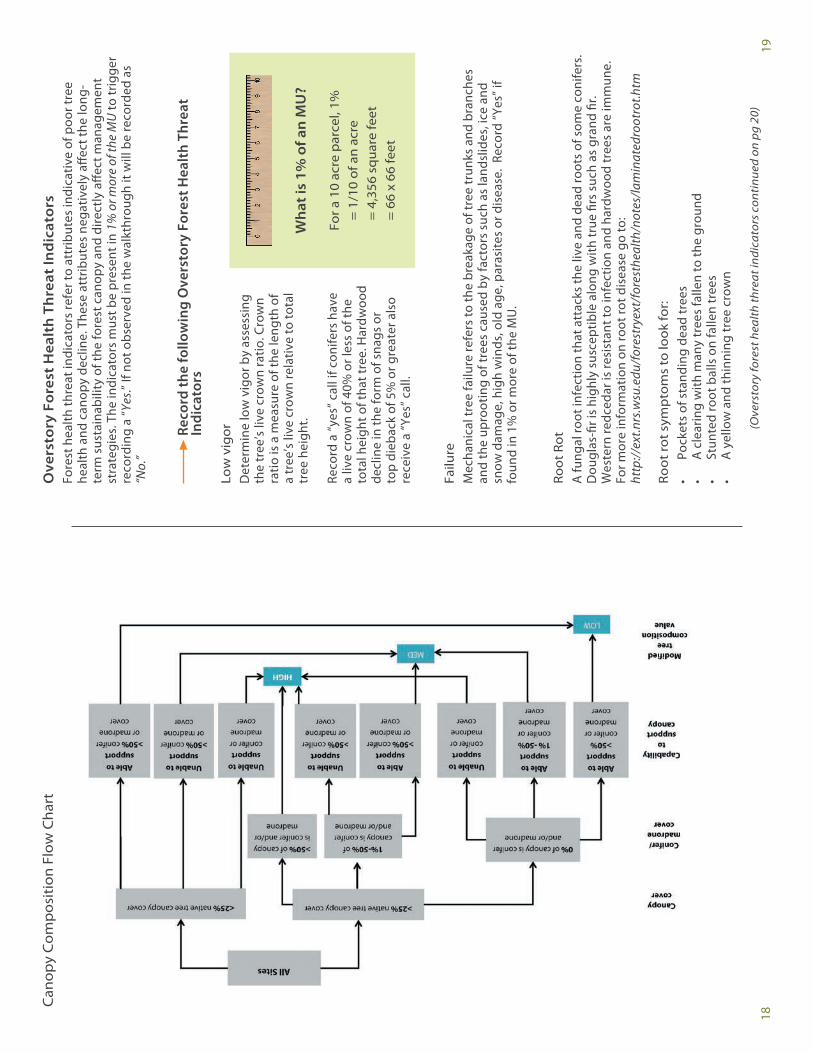
19
Ove
rsto
ry F
ore
st H
ealt
h T
hre
at In
dic
ato
rs
Fore
st h
ealth
thre
at in
dica
tors
refe
r to
attr
ibut
es in
dica
tive
of p
oor t
ree
heal
th a
nd c
anop
y de
clin
e. T
hese
att
ribut
es n
egat
ivel
y aff
ect t
he lo
ng-
term
sus
tain
abili
ty o
f the
fore
st c
anop
y an
d di
rect
ly a
ffect
man
agem
ent
stra
tegi
es. T
he in
dica
tors
mus
t be
pres
ent i
n 1%
or m
ore
of th
e M
U to
trig
ger
reco
rdin
g a
“Yes
.” If
not o
bser
ved
in th
e w
alkt
hrou
gh it
will
be
reco
rded
as
“No.
”
Re
cord
the
follo
win
g O
vers
tory
For
est H
ealt
h Th
reat
Indi
cato
rs
Low
vig
orD
eter
min
e lo
w v
igor
by
asse
ssin
g th
e tr
ee’s
live
cro
wn
ratio
. Cro
wn
ratio
is a
mea
sure
of t
he le
ngth
of
a tr
ee’s
live
cro
wn
rela
tive
to to
tal
tree
hei
ght.
Reco
rd a
“yes
” cal
l if c
onife
rs h
ave
a liv
e cr
own
of 4
0% o
r les
s of
the
tota
l hei
ght o
f tha
t tre
e. H
ardw
ood
decl
ine
in th
e fo
rm o
f sna
gs o
r to
p di
ebac
k of
5%
or g
reat
er a
lso
rece
ive
a “Y
es” c
all.
Failu
re
Mec
hani
cal t
ree
failu
re re
fers
to th
e br
eaka
ge o
f tre
e tr
unks
and
bra
nche
s an
d th
e up
root
ing
of tr
ees
caus
ed b
y fa
ctor
s su
ch a
s la
ndsl
ides
, ice
and
sn
ow d
amag
e, h
igh
win
ds, o
ld a
ge, p
aras
ites
or d
isea
se.
Reco
rd “Y
es” i
f fo
und
in 1
% o
r mor
e of
the
MU
. Ro
ot R
ot
A fu
ngal
root
infe
ctio
n th
at a
ttac
ks th
e liv
e an
d de
ad ro
ots
of s
ome
coni
fers
. D
ougl
as-fi
r is
high
ly s
usce
ptib
le a
long
with
true
firs
suc
h as
gra
nd fi
r. W
este
rn re
dced
ar is
resi
stan
t to
infe
ctio
n an
d ha
rdw
ood
tree
s ar
e im
mun
e.
For m
ore
info
rmat
ion
on ro
ot ro
t dis
ease
go
to:
http
://ex
t.nrs
.wsu
.edu
/for
estr
yext
/for
esth
ealth
/not
es/la
min
ated
root
rot.h
tm
Roo
t rot
sym
pto
ms
to lo
ok fo
r:•
Pock
ets
of s
tand
ing
dead
tree
s•
A c
lear
ing
with
man
y tr
ees
falle
n to
the
grou
nd•
Stun
ted
root
bal
ls o
n fa
llen
tree
s•
A y
ello
w a
nd th
inni
ng tr
ee c
row
n
(Ove
rsto
ry fo
rest
hea
lth
thre
at in
dica
tors
con
tinu
ed o
n pg
20)
W
hat
is 1
% o
f an
MU
?
For a
10
acre
par
cel,
1%
= 1
/10
of a
n ac
re
= 4
,356
sq
uare
feet
= 6
6 x
66 fe
et
18
Can
opy
Com
pos
itio
n Fl
ow C
hart
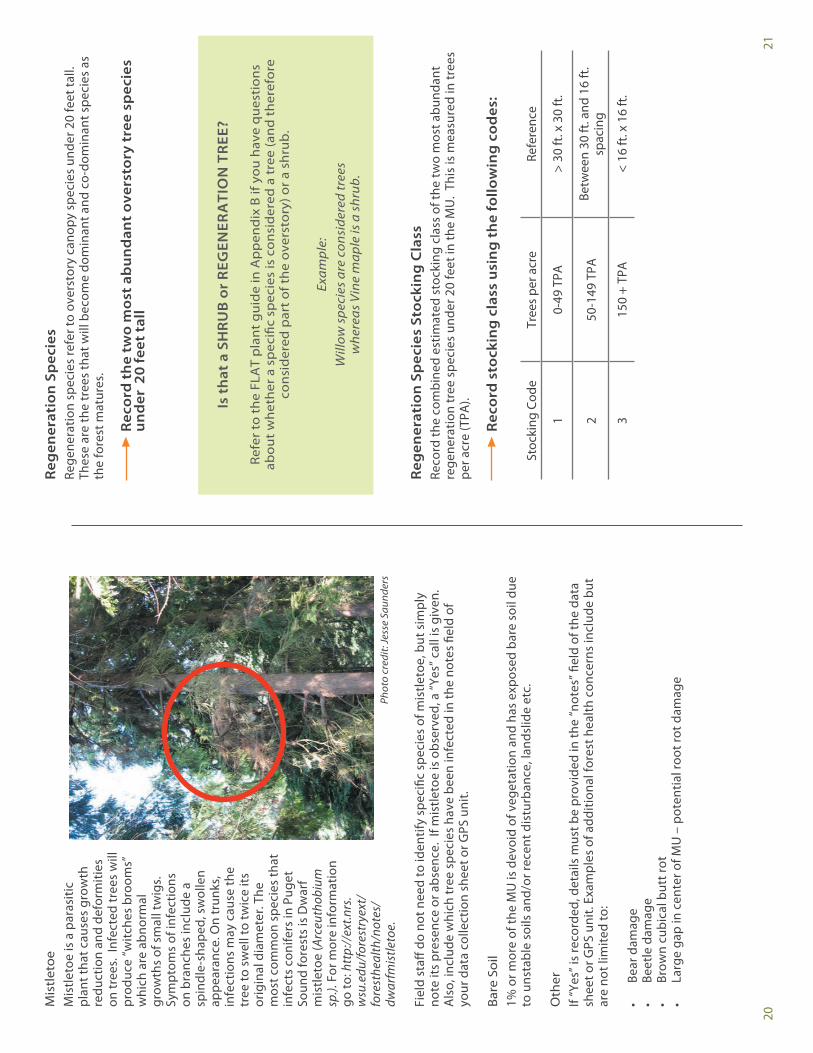
20
Mis
tlet
oe
Mis
tleto
e is
a p
aras
itic
plan
t tha
t cau
ses
grow
th
redu
ctio
n an
d de
form
ities
on
tree
s. I
nfec
ted
tree
s w
ill
prod
uce
“witc
hes
broo
ms”
w
hich
are
abn
orm
al
grow
ths
of s
mal
l tw
igs.
Sy
mpt
oms
of in
fect
ions
on
bra
nche
s in
clud
e a
spin
dle-
shap
ed, s
wol
len
appe
aran
ce. O
n tr
unks
, in
fect
ions
may
cau
se th
e tr
ee to
sw
ell t
o tw
ice
its
orig
inal
dia
met
er. T
he
mos
t com
mon
spe
cies
that
in
fect
s co
nife
rs in
Pug
et
Soun
d fo
rest
s is
Dw
arf
mis
tleto
e (A
rceu
thob
ium
sp
.). F
or m
ore
info
rmat
ion
go to
: htt
p://
ext.n
rs.
wsu
.edu
/for
estr
yext
/fo
rest
heal
th/n
otes
/dw
arfm
istle
toe.
Fiel
d st
aff d
o no
t nee
d to
iden
tify
spec
ific
spec
ies
of m
istle
toe,
but
sim
ply
note
its
pres
ence
or a
bsen
ce.
If m
istle
toe
is o
bser
ved,
a “Y
es” c
all i
s gi
ven.
A
lso,
incl
ude
whi
ch tr
ee s
peci
es h
ave
been
infe
cted
in th
e no
tes
field
of
your
dat
a co
llect
ion
shee
t or G
PS u
nit.
Bare
Soi
l1%
or m
ore
of th
e M
U is
dev
oid
of v
eget
atio
n an
d ha
s ex
pose
d ba
re s
oil d
ue
to u
nsta
ble
soils
and
/or r
ecen
t dis
turb
ance
, lan
dslid
e et
c. O
ther
If
“Yes
” is
reco
rded
, det
ails
mus
t be
prov
ided
in th
e “n
otes
” fiel
d of
the
data
sh
eet o
r GPS
uni
t. Ex
ampl
es o
f add
ition
al fo
rest
hea
lth c
once
rns
incl
ude
but
are
not l
imite
d to
:
•Be
ar d
amag
e•
Beet
le d
amag
e•
Brow
n cu
bica
l but
t rot
•La
rge
gap
in c
ente
r of M
U –
pot
entia
l roo
t rot
dam
age
Phot
o cr
edit:
Jess
e Sa
unde
rs
21
Reg
ener
atio
n S
pec
ies
Rege
nera
tion
spec
ies
refe
r to
over
stor
y ca
nopy
spe
cies
und
er 2
0 fe
et ta
ll.
Thes
e ar
e th
e tr
ees
that
will
bec
ome
dom
inan
t and
co-
dom
inan
t spe
cies
as
the
fore
st m
atur
es.
Rec
ord
th
e tw
o m
ost
ab
un
dan
t o
vers
tory
tre
e sp
ecie
s
un
der
20
feet
tal
l
Reg
ener
atio
n S
pec
ies
Sto
ckin
g C
lass
Reco
rd th
e co
mbi
ned
estim
ated
sto
ckin
g cl
ass
of th
e tw
o m
ost a
bund
ant
rege
nera
tion
tree
spe
cies
und
er 2
0 fe
et in
the
MU
. Th
is is
mea
sure
d in
tree
s pe
r acr
e (T
PA).
Rec
ord
sto
ckin
g c
lass
usi
ng
th
e fo
llow
ing
co
des
:
Stoc
king
Cod
eTr
ees
per a
cre
Refe
renc
e
10-
49 T
PA
> 30
ft. x
30
ft.
250
-149
TPA
Betw
een
30 ft
. and
16
ft.
spac
ing
315
0 +
TPA
<
16 ft
. x 1
6 ft
.
Is t
hat
a S
HR
UB
or
REG
ENER
ATI
ON
TR
EE?
Refe
r to
th
e FL
AT
pla
nt
gu
ide
in A
pp
end
ix B
if y
ou
hav
e q
ues
tio
ns
abo
ut
wh
eth
er a
sp
ecifi
c sp
ecie
s is
co
nsi
der
ed a
tre
e (a
nd
th
eref
ore
co
nsi
der
ed p
art
of t
he
ove
rsto
ry) o
r a
shru
b.
Exam
ple:
Will
ow s
peci
es a
re c
onsi
dere
d tr
ees
w
here
as V
ine
map
le is
a s
hrub
.
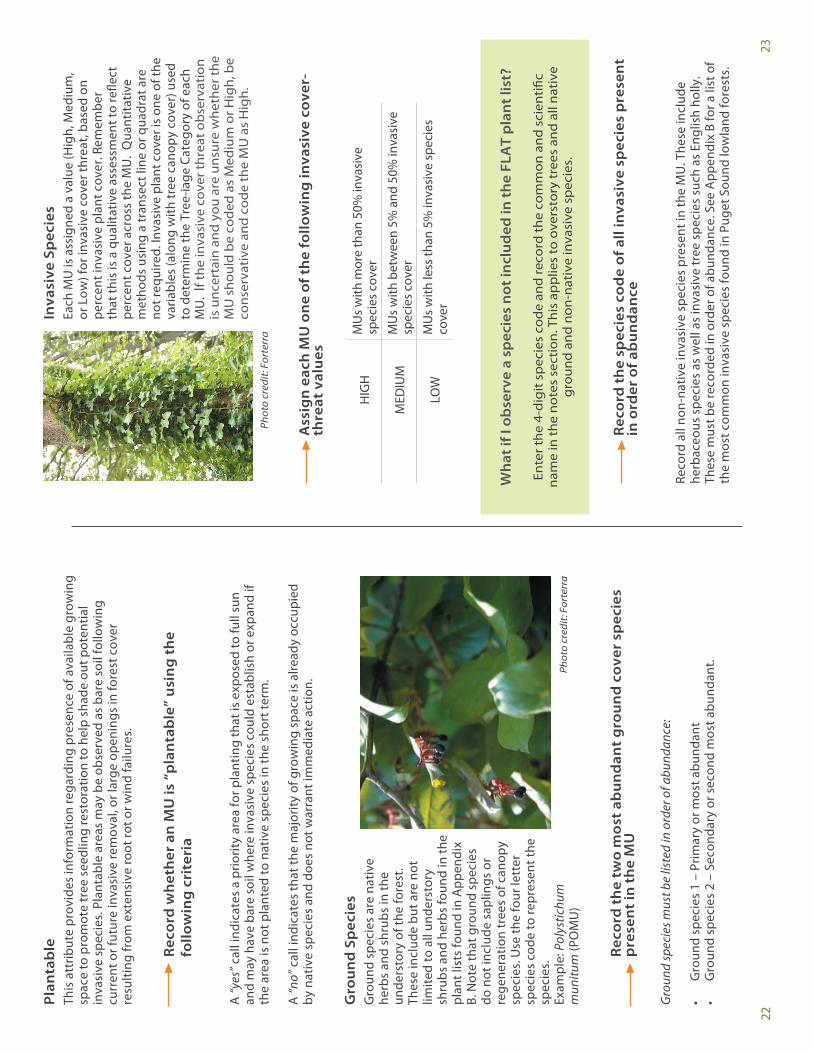
23
Inva
sive
Sp
ecie
s Ea
ch M
U is
ass
igne
d a
valu
e (H
igh,
Med
ium
, or
Low
) for
inva
sive
cov
er th
reat
, bas
ed o
n pe
rcen
t inv
asiv
e pl
ant c
over
. Rem
embe
r th
at th
is is
a q
ualit
ativ
e as
sess
men
t to
refle
ct
perc
ent c
over
acr
oss
the
MU
. Q
uant
itativ
e m
etho
ds u
sing
a tr
anse
ct li
ne o
r qua
drat
are
no
t req
uire
d. In
vasi
ve p
lant
cov
er is
one
of t
he
varia
bles
(alo
ng w
ith tr
ee c
anop
y co
ver)
use
d to
det
erm
ine
the
Tree
-iage
Cat
egor
y of
eac
h M
U.
If th
e in
vasi
ve c
over
thre
at o
bse
rvat
ion
is u
ncer
tain
and
you
are
uns
ure
whe
ther
the
MU
sho
uld
be
cod
ed a
s M
ediu
m o
r Hig
h, b
e co
nser
vati
ve a
nd c
ode
the
MU
as
Hig
h.
Ass
ign
eac
h M
U o
ne
of t
he
follo
win
g in
vasi
ve c
ove
r-
th
reat
val
ues
HIG
HM
Us
with
mor
e th
an 5
0% in
vasi
ve
spec
ies
cove
r
MED
IUM
MU
s w
ith b
etw
een
5% a
nd 5
0% in
vasi
ve
spec
ies
cove
r
LOW
MU
s w
ith le
ss th
an 5
% in
vasi
ve s
peci
es
cove
r
R
eco
rd t
he
spec
ies
cod
e o
f all
inva
sive
sp
ecie
s p
rese
nt
in
ord
er o
f ab
un
dan
ce
Reco
rd a
ll no
n-na
tive
inva
sive
spe
cies
pre
sent
in th
e M
U. T
hese
incl
ude
herb
aceo
us s
peci
es a
s w
ell a
s in
vasi
ve tr
ee s
peci
es s
uch
as E
nglis
h ho
lly.
Thes
e m
ust b
e re
cord
ed in
ord
er o
f abu
ndan
ce. S
ee A
ppen
dix
B fo
r a li
st o
f th
e m
ost c
omm
on in
vasi
ve s
peci
es fo
und
in P
uget
Sou
nd lo
wla
nd fo
rest
s.
W
hat
if I
obse
rve
a sp
ecie
s n
ot in
clu
ded
in th
e FL
AT
pla
nt l
ist?
Ente
r the
4-d
igit
sp
ecie
s co
de
and
reco
rd th
e co
mm
on a
nd s
cien
tific
na
me
in th
e no
tes
sect
ion.
Thi
s ap
plie
s to
ove
rsto
ry tr
ees
and
all
nati
ve
gro
und
and
non
-nat
ive
inva
sive
sp
ecie
s.
Phot
o cr
edit:
For
terr
a
22
Pla
nta
ble
This
att
ribut
e pr
ovid
es in
form
atio
n re
gard
ing
pres
ence
of a
vaila
ble
grow
ing
spac
e to
pro
mot
e tr
ee s
eedl
ing
rest
orat
ion
to h
elp
shad
e ou
t pot
entia
l in
vasi
ve s
peci
es. P
lant
able
are
as m
ay b
e ob
serv
ed a
s ba
re s
oil f
ollo
win
g cu
rren
t or f
utur
e in
vasi
ve re
mov
al, o
r lar
ge o
peni
ngs
in fo
rest
cov
er
resu
lting
from
ext
ensi
ve ro
ot ro
t or w
ind
failu
res.
Rec
ord
wh
eth
er a
n M
U is
“p
lan
tab
le”
usi
ng
th
e
fo
llow
ing
cri
teri
a
A “y
es” c
all i
ndic
ates
a p
riorit
y ar
ea fo
r pla
ntin
g th
at is
exp
osed
to fu
ll su
n an
d m
ay h
ave
bare
soi
l whe
re in
vasi
ve s
peci
es c
ould
est
ablis
h or
exp
and
if th
e ar
ea is
not
pla
nted
to n
ativ
e sp
ecie
s in
the
shor
t ter
m.
A “n
o” c
all i
ndic
ates
that
the
maj
ority
of g
row
ing
spac
e is
alre
ady
occu
pied
by
nat
ive
spec
ies
and
does
not
war
rant
imm
edia
te a
ctio
n.
Gro
un
d S
pec
ies
Gro
und
spec
ies
are
nativ
e he
rbs
and
shru
bs in
the
unde
rsto
ry o
f the
fore
st.
Thes
e in
clud
e bu
t are
not
lim
ited
to a
ll un
ders
tory
sh
rubs
and
her
bs fo
und
in th
e pl
ant l
ists
foun
d in
App
endi
x B.
Not
e th
at g
roun
d sp
ecie
s do
not
incl
ude
sapl
ings
or
rege
nera
tion
tree
s of
can
opy
spec
ies.
Use
the
four
lett
er
spec
ies
code
to re
pres
ent t
he
spec
ies.
Ex
ampl
e: P
olys
tichu
m
mun
itum
(PO
MU
)
Rec
ord
th
e tw
o m
ost
ab
un
dan
t g
rou
nd
co
ver
spec
ies
pre
sen
t in
th
e M
U
Gro
und
spec
ies m
ust b
e lis
ted
in o
rder
of a
bund
ance
:
•G
roun
d sp
ecie
s 1
– Pr
imar
y or
mos
t abu
ndan
t•
Gro
und
spec
ies
2 –
Seco
ndar
y or
sec
ond
mos
t abu
ndan
t. Phot
o cr
edit:
For
terr
a
24
Ap
pe
nd
ix
App
endi
x A
: Tre
e-ia
ge M
atri
x A
naly
sis
Iden
tifyi
ng a
nd p
riorit
izin
g ar
eas
in n
eed
of m
anag
emen
t is
a ke
y ou
tput
of
the
FLA
T pr
oces
s. A
ttrib
utes
ass
esse
d in
the
field
are
use
d to
pro
duce
a
qual
itativ
e va
lue
for t
wo
axes
of a
mat
rix. I
n Ki
ng C
ount
y, fo
rest
com
posi
tion
(y-a
xis)
and
fore
st th
reat
s (x
-axi
s) w
ere
used
. The
mat
rix c
ombi
nes
the
attr
ibut
e in
form
atio
n to
pro
duce
a c
lass
ifica
tion
valu
e fo
r eac
h M
U.
In th
e fig
ure
at th
e rig
ht,
valu
es 1
-3 re
pres
ent M
Us
with
a
tree
com
posi
tion
that
has
hi
gh e
colo
gica
l val
ue, a
nd s
o ar
e im
port
ant t
o pr
otec
t and
m
aint
ain.
Val
ues
2 an
d 3
also
re
pres
ent t
he p
rese
nce
of a
fo
rest
hea
lth th
reat
and
cou
ld
be p
riorit
ized
for r
esto
ratio
n or
m
aint
enan
ce. O
n th
e ot
her e
nd o
f th
e sp
ectr
um, a
MU
with
a v
alue
of
9 h
as a
hig
h th
reat
pre
senc
e an
d a
low
er tr
ee c
ompo
sitio
n,
and
ther
efor
e m
ay n
ot b
e no
t be
as h
igh
a pr
iorit
y fo
r man
agem
ent
actio
ns.
How
the
resu
lts o
f the
mat
rix a
naly
sis
are
used
in s
ubse
quen
t lan
d m
anag
emen
t dec
isio
ns is
up
to e
ach
FLA
T us
er. F
LAT
prov
ides
an
ecol
ogic
al
inpu
t for
land
man
agem
ent d
ecis
ion-
mak
ing.
The
com
bina
tion
of fi
eld
data
co
llect
ion,
flow
cha
rt p
roce
ssin
g, a
nd c
lass
ifica
tion
of M
Us
usin
g th
e m
atrix
ca
n be
use
d to
prio
ritiz
e fu
ture
man
agem
ent a
ctio
ns a
nd m
onito
ring.
25
App
endi
x B:
Com
mon
Pla
nt S
peci
es L
ist
TREE
S
Cod
e
Spec
ies
Scie
ntifi
c N
ame
A
CMA
Bigl
eaf m
aple
Acer
mac
roph
yllu
m
PR
EM
Bi
tter
che
rry
Pr
unus
em
argi
nata
POBA
Blac
k co
tton
woo
d
Popu
lus b
alsa
mife
ra
CR
DO
Blac
k ha
wth
orn
Cr
atae
gus d
ougl
asii
RH
PU
Ca
scar
a
Rh
amnu
s pur
shia
na
PS
ME
D
ougl
as fi
r
Pseu
dots
uga
men
zies
ii
ACG
L
Dou
glas
map
le
Ac
er g
labr
um
Q
UG
A
G
arry
oak
Que
rcus
gar
ryan
a
ABG
R
Gra
nd fi
r
Ab
ies g
rand
is
SAH
O
H
ooke
r’s w
illow
Salix
hoo
keria
na
ABP
R
Nob
le fi
r
Ab
ies p
roce
ra
FRLA
Ore
gon
ash
Fr
axin
us la
tifol
ia
MA
FU
Pa
cific
cra
bapp
le
M
alus
fusc
a
CON
U
Pa
cific
dog
woo
d
Corn
us n
utta
llii
A
RME
Pa
cific
mad
rone
Arbu
tus m
enzi
esii
A
BAM
Paci
fic s
ilver
fir
Ab
ies a
mab
alis
TABR
Paci
fic y
ew
Ta
xus b
revi
folia
SA
LU
Pa
cific
will
ow
Sa
lix lu
cida
BE
PA
Pa
per b
irch
Be
tula
pap
yife
ra
POTR
Qua
king
asp
en
Po
pulu
s tre
mul
oide
s
ALR
U
Re
d al
der
Al
nus r
ubra
PI
CO
Sh
ore
pine
Pinu
s con
tort
a
ALC
R
Sitk
a al
der
Al
nus c
rispa
ssp.
sinu
ata
PI
SI
Si
tka
spru
ce
Pi
cea
sitc
hens
is
SASI
Sitk
a w
illow
Salix
sitc
hens
is
ACC
I
Vine
map
le
Ac
er c
ircin
atum
TS
HE
W
este
rn h
emlo
ck
Ts
uga
hete
roph
ylla
THPL
Wes
tern
redc
edar
Thuj
a pl
icat
a
PIM
O
W
este
rn w
hite
pin
e Pi
nus m
ontic
ola
Q
UA
L
Whi
te o
ak
Q
uerc
us a
lba
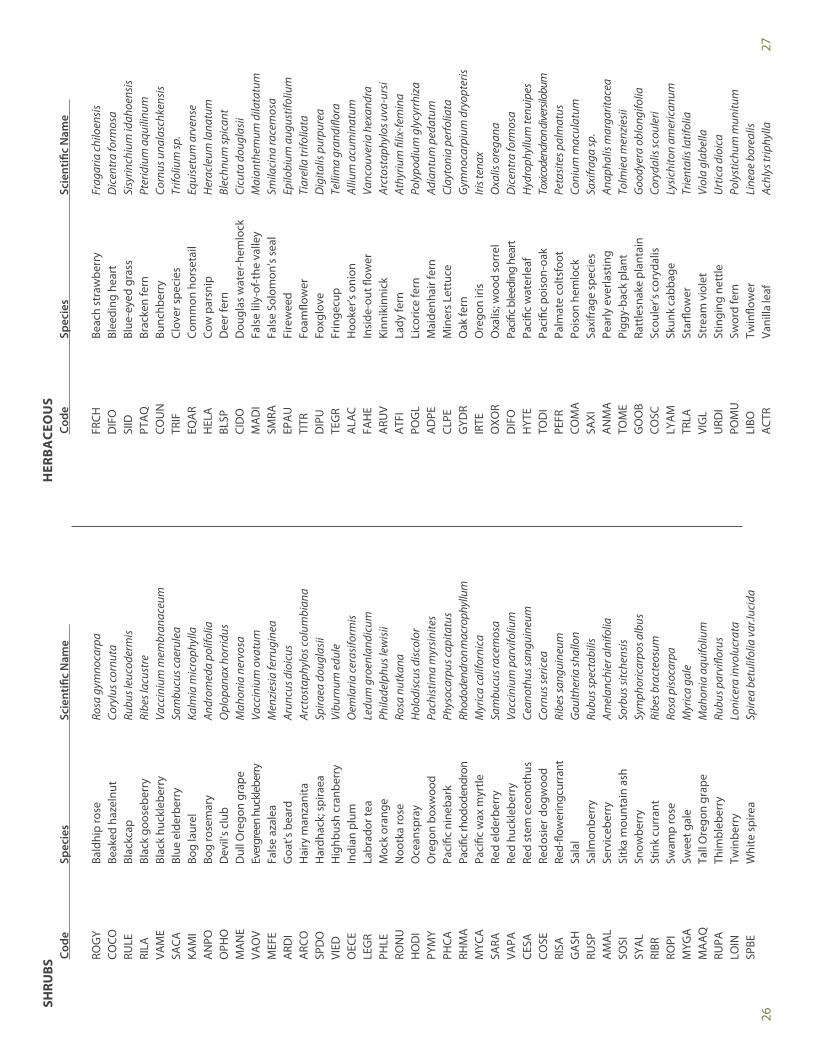
27
HER
BACE
OUS
C
ode
Sp
ecie
s
Sc
ient
ific
Nam
e
FR
CH
Be
ach
stra
wbe
rry
Fr
agar
ia c
hilo
ensi
s
DIF
O
Bl
eedi
ng h
eart
Dic
entr
a fo
rmos
a
SIID
Blue
-eye
d gr
ass
Si
syrin
chiu
m id
ahoe
nsis
PT
AQ
Brac
ken
fern
Pter
idiu
m a
quili
num
CO
UN
Bunc
hber
ry
Co
rnus
una
lasc
hken
sis
TR
IF
Cl
over
spe
cies
Trifo
lium
sp.
EQ
AR
Co
mm
on h
orse
tail
Eq
uise
tum
arv
ense
H
ELA
Cow
par
snip
Her
acle
um la
natu
m
BLSP
Dee
r fer
n
Bl
echn
um sp
ican
t
CID
O
D
ougl
as w
ater
-hem
lock
Ci
cuta
dou
glas
ii
MA
DI
Fa
lse
lily-
of-t
he v
alle
y M
aian
them
um d
ilata
tum
SM
RA
Fa
lse
Solo
mon
’s s
eal
Smila
cina
race
mos
a
EPA
U
Fi
rew
eed
Epilo
bium
aug
ustif
oliu
m
TI
TR
Fo
amflo
wer
Tiar
ella
trifo
liata
D
IPU
Foxg
love
Dig
italis
pur
pure
a
TEG
R
Frin
gecu
p
Telli
ma
gran
diflo
ra
ALA
C
Hoo
ker’s
oni
on
Al
lium
acu
min
atum
FAH
E
Insi
de-o
ut fl
ower
Vanc
ouve
ria h
exan
dra
A
RUV
Ki
nnik
inni
ck
Ar
ctos
taph
ylos
uva
-urs
i
ATF
I
Lady
fern
Athy
rium
filix
-fem
ina
PO
GL
Li
coric
e fe
rn
Po
lypo
dium
gly
cyrr
hiza
AD
PE
M
aide
nhai
r fer
n
Adia
ntum
ped
atum
CL
PE
M
iner
s Le
ttuc
e
Clay
toni
a pe
rfolia
ta
GYD
R
Oak
fern
Gym
noca
rpiu
m d
ryop
teris
IR
TE
O
rego
n iri
s
Iris t
enax
O
XOR
O
xalis
; woo
d so
rrel
O
xalis
ore
gana
D
IFO
Paci
fic b
leed
ing
hear
t D
icen
tra
form
osa
H
YTE
Pa
cific
wat
erle
af
H
ydro
phyl
lum
tenu
ipes
TO
DI
Pa
cific
poi
son-
oak
To
xicod
endr
on d
iversi
lobu
m
PEFR
Palm
ate
colts
foot
Peta
site
s pal
mat
us
CO
MA
Pois
on h
emlo
ck
Co
nium
mac
ulat
um
SAXI
Saxi
frag
e sp
ecie
s
Saxi
fraga
sp.
A
NM
A
Pe
arly
eve
rlast
ing
An
apha
lis m
arga
ritac
ea
TOM
E
Pigg
y-ba
ck p
lant
Tolm
iea
men
zies
ii
GO
OB
Ra
ttle
snak
e pl
anta
in
Goo
dyer
a ob
long
ifolia
CO
SC
Sc
oule
r’s c
oryd
alis
Co
ryda
lis sc
oule
ri
LYA
M
Sk
unk
cabb
age
Ly
sich
iton
amer
ican
um
TRLA
Star
flow
er
Tr
ient
alis
latif
olia
VI
GL
St
ream
vio
let
Vi
ola
glab
ella
U
RDI
St
ingi
ng n
ettle
Urt
ica
dioi
ca
POM
U
Sw
ord
fern
Poly
stic
hum
mun
itum
LI
BO
Tw
inflo
wer
Line
ae b
orea
lis
ACT
R
Vani
lla le
af
Ac
hlys
trip
hylla
26
SHRU
BS
C
ode
Sp
ecie
s
Sc
ient
ific
Nam
e
RO
GY
Ba
ldhi
p ro
se
Ro
sa g
ymno
carp
a
CO
CO
Be
aked
haz
elnu
t
Cory
lus c
ornu
ta
RU
LE
Bl
ackc
ap
Ru
bus l
euco
derm
is
RILA
Blac
k go
oseb
erry
Ribe
s lac
ustr
e
VAM
E
Blac
k hu
ckle
berr
y
Vacc
iniu
m m
embr
anac
eum
SA
CA
Bl
ue e
lder
berr
y
Sam
bucu
s cae
rule
a
KAM
I
Bog
laur
el
Ka
lmia
mic
roph
ylla
A
NPO
Bog
rose
mar
y
Andr
omed
a po
lifol
ia
OPH
O
D
evil’
s cl
ub
O
plop
anax
hor
ridus
MA
NE
D
ull O
rego
n gr
ape
M
ahon
ia n
ervo
sa
VAO
V
Ever
gree
n hu
ckle
berry
Va
ccin
ium
ova
tum
MEF
E
Fals
e az
alea
Men
zies
ia fe
rrug
inea
A
RDI
G
oat’s
bea
rd
Ar
uncu
s dio
icus
A
RCO
Hai
ry m
anza
nita
Arct
osta
phyl
os c
olum
bian
a
SP
DO
Har
dhac
k; s
pira
ea
Sp
iraea
dou
glas
ii
VIED
Hig
hbus
h cr
anbe
rry
Vibu
rnum
edu
le
O
ECE
In
dian
plu
m
O
emla
ria c
eras
iform
is
LEG
R
Labr
ador
tea
Le
dum
gro
enla
ndic
um
PH
LE
M
ock
oran
ge
Ph
ilade
lphu
s lew
isii
RON
U
N
ootk
a ro
se
Ro
sa n
utka
na
H
OD
I
Oce
ansp
ray
H
olod
iscu
s dis
colo
r
PYM
Y
Ore
gon
boxw
ood
Pa
chis
tima
myr
sini
tes
PH
CA
Pa
cific
nin
ebar
k
Phys
ocar
pus c
apita
tus
RH
MA
Paci
fic rh
odod
endr
on
Rhod
oden
dron
mac
roph
yllu
m
M
YCA
Paci
fic w
ax m
yrtle
M
yric
a ca
lifor
nica
SA
RA
Re
d el
derb
erry
Sam
bucu
s rac
emos
a
VAPA
Red
huck
lebe
rry
Va
ccin
ium
par
vifo
lium
CE
SA
Re
d st
em c
eono
thus
Ce
anot
hus s
angu
ineu
m
CO
SE
Re
d os
ier d
ogw
ood
Corn
us se
ricea
RISA
Red-
flow
erin
g cur
rant
Ri
bes s
angu
ineu
m
GA
SH
Sa
lal
Gau
lther
ia sh
allo
n
RUSP
Salm
onbe
rry
Ru
bus s
pect
abili
s
AM
AL
Se
rvic
eber
ry
Am
elan
chie
r aln
ifolia
SOSI
Sitk
a m
ount
ain
ash
Sorb
us si
tche
nsis
SY
AL
Sn
owbe
rry
Sy
mph
oric
arpo
s alb
us
RIBR
Stin
k cu
rran
t
Ribe
s bra
cteo
sum
RO
PI
Sw
amp
rose
Rosa
pis
ocar
pa
MYG
A
Sw
eet g
ale
M
yric
a ga
le
MA
AQ
Tall
Ore
gon
grap
e
Mah
onia
aqu
ifoliu
m
RUPA
Thim
bleb
erry
Rubu
s par
viflo
rus
LO
IN
Tw
inbe
rry
Lo
nice
ra in
volu
crat
a
SPBE
Whi
te s
pire
a
Spire
a be
tulif
olia
var
.luci
da
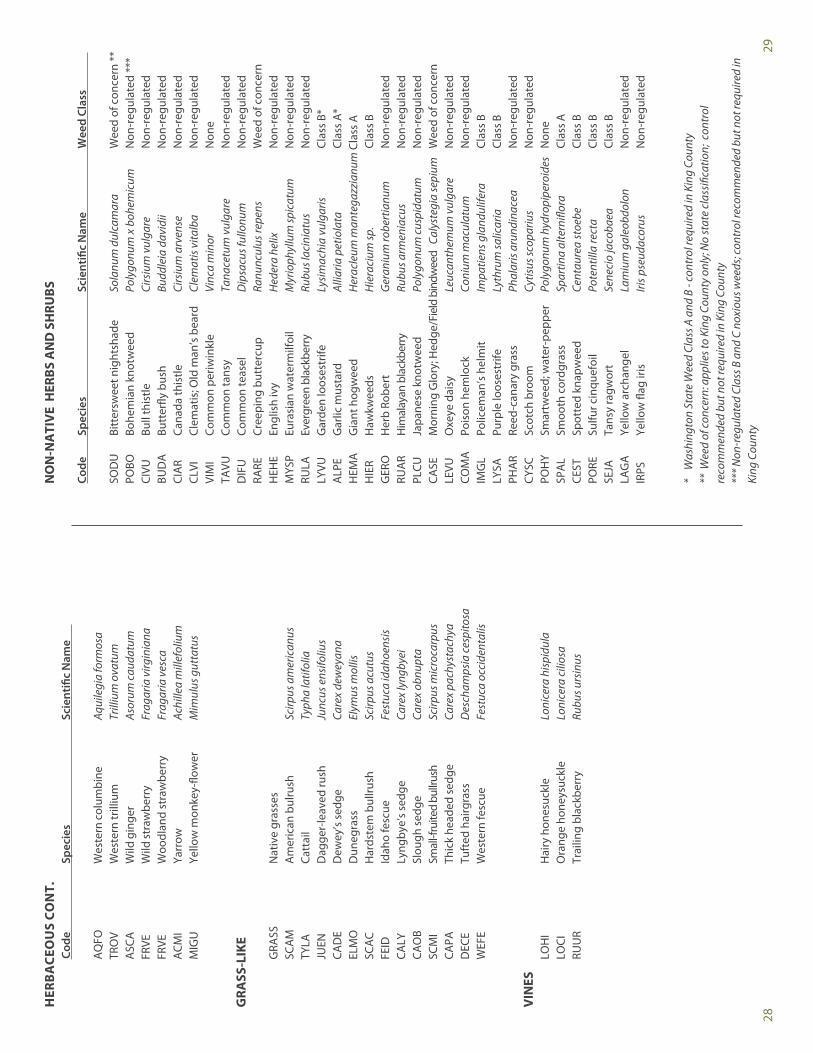
28
HER
BACE
OUSCO
NT.
C
ode
Sp
ecie
s
Sc
ient
ific
Nam
e
A
QFO
Wes
tern
col
umbi
ne
Aqui
legi
a fo
rmos
a
TRO
V
Wes
tern
trill
ium
Trill
ium
ova
tum
A
SCA
Wild
gin
ger
As
orum
cau
datu
m
FRVE
Wild
stra
wbe
rry
Fr
agar
ia v
irgin
iana
FR
VE
W
oodl
and
stra
wbe
rry
Frag
aria
ves
ca
ACM
I
Yarr
ow
Achi
llea
mill
efol
ium
M
IGU
Yello
w m
onke
y-flo
wer
M
imul
us g
utta
tus
GRA
SS-LIK
E
G
RASS
Nat
ive
gras
ses
SC
AM
Am
eric
an b
ulru
sh
Sc
irpus
am
eric
anus
TY
LA
Ca
ttai
l
Ty
pha
latif
olia
JU
EN
D
agge
r-le
aved
rush
Ju
ncus
ens
ifoliu
s
CAD
E
Dew
ey’s
sed
ge
Ca
rex
dew
eyan
a
ELM
O
D
uneg
rass
Elym
us m
ollis
SC
AC
H
ards
tem
bul
lrush
Sc
irpus
acu
tus
FE
ID
Id
aho
fesc
ue
Fe
stuc
a id
ahoe
nsis
CA
LY
Ly
ngby
e’s
sedg
e
Care
x ly
ngby
ei
CA
OB
Sl
ough
sed
ge
Ca
rex
obnu
pta
SC
MI
Sm
all-f
ruite
d bu
llrus
h Sc
irpus
mic
roca
rpus
CA
PA
Th
ick
head
ed s
edge
Ca
rex
pach
ysta
chya
D
ECE
Tu
fted
hai
rgra
ss
D
esch
amps
ia c
espi
tosa
W
EFE
W
este
rn fe
scue
Fest
uca
occi
dent
alis
VIN
ES
LOH
I
Hai
ry h
ones
uckl
e
Loni
cera
his
pidu
la
LO
CI
O
rang
e ho
neys
uckl
e Lo
nice
ra c
ilios
a
RUU
R
Trai
ling
blac
kber
ry
Rubu
s urs
inus
29
NON-N
ATIVEH
ERBS
ANDSHRU
BS
Code
Sp
ecie
s
Sc
ient
ific
Nam
e
Wee
d Cl
ass
SOD
U
Bitt
ersw
eet n
ight
shad
e So
lanu
m d
ulca
mar
a W
eed
of c
once
rn *
*PO
BO
Bohe
mia
n kn
otw
eed
Poly
gonu
m x
boh
emic
um
Non
-reg
ulat
ed *
**CI
VU
Bull
this
tle
Ci
rsiu
m v
ulga
re
N
on-r
egul
ated
BUD
A
Butt
erfly
bus
h
Bu
ddle
ia d
avid
ii
Non
-reg
ulat
edCI
AR
Cana
da th
istle
Cirs
ium
arv
ense
Non
-reg
ulat
edCL
VI
Clem
atis
; Old
man
’s b
eard
Cl
emat
is v
italb
a
Non
-reg
ulat
ed
VIM
I Co
mm
on p
eriw
inkl
e Vi
nca
min
or
N
one
TAVU
Co
mm
on ta
nsy
Ta
nace
tum
vul
gare
N
on-r
egul
ated
D
IFU
Co
mm
on te
asel
Dip
sacu
s ful
lonu
m
Non
-reg
ulat
edRA
RE
Cree
ping
but
terc
up
Ranu
ncul
us re
pens
W
eed
of c
once
rnH
EHE
Engl
ish
ivy
H
eder
a he
lix
N
on-r
egul
ated
MYS
P Eu
rasi
an w
ater
milf
oil
Myr
ioph
yllu
m sp
icat
um
Non
-reg
ulat
edRU
LA
Ever
gree
n bl
ackb
erry
Ru
bus l
acin
iatu
s
Non
-reg
ulat
edLY
VU
Gar
den
loos
estr
ife
Lysi
mac
hia
vulg
aris
Cl
ass
B*A
LPE
Gar
lic m
usta
rd
Al
liaria
pet
iola
ta
Cl
ass
A*
HEM
A
Gia
nt h
ogw
eed
H
erac
leum
man
tega
zzia
num
Cla
ss A
HIE
R H
awkw
eeds
Hie
raci
um sp
.
Clas
s B
GER
O
Her
b Ro
bert
Ger
aniu
m ro
bert
ianu
m
Non
-reg
ulat
edRU
AR
Him
alay
an b
lack
berr
y Ru
bus a
rmen
iacu
s
Non
-reg
ulat
edPL
CU
Japa
nese
kno
twee
d Po
lygo
num
cus
pida
tum
N
on-r
egul
ated
CA
SE
Mor
ning
Glo
ry; H
edge
/Fie
ld b
indw
eed
Cal
yste
gia
sepi
um
Wee
d of
con
cern
LEVU
O
xeye
dai
sy
Le
ucan
them
um v
ulga
re
Non
-reg
ulat
edCO
MA
Po
ison
hem
lock
Coni
um m
acul
atum
N
on-r
egul
ated
IMG
L Po
licem
an’s
hel
mit
Im
patie
ns g
land
ulife
ra
Clas
s B
LYSA
Pu
rple
loos
estr
ife
Ly
thru
m sa
licar
ia
Cl
ass B
PHA
R Re
ed-c
anar
y gr
ass
Ph
alar
is a
rund
inac
ea
Non
-reg
ulat
edCY
SC
Scot
ch b
room
Cytis
us sc
opar
ius
N
on-r
egul
ated
POH
Y Sm
artw
eed;
wat
er-p
eppe
r Po
lygo
num
hyd
ropi
pero
ides
N
one
SPA
L Sm
ooth
cor
dgra
ss
Spar
tina
alte
rnifl
ora
Clas
s ACE
ST
Spot
ted
knap
wee
d
Cent
aure
a st
oebe
Clas
s B
PO
RE
Sulfu
r cin
quef
oil
Po
tent
illa
rect
a
Cl
ass
BSE
JA
Tans
y ra
gwor
t
Sene
cio
jaco
baea
Clas
s B
LAG
A
Yello
w a
rcha
ngel
Lam
ium
gal
eobd
olon
N
on-r
egul
ated
IRPS
Ye
llow
flag
iris
Iris p
seud
acor
us
N
on-r
egul
ated
* W
ashi
ngto
n St
ate
Wee
d Cl
ass A
and
B -
cont
rol r
equi
red
in K
ing
Coun
ty**
Wee
d of
con
cern
: app
lies t
o Ki
ng C
ount
y on
ly; N
o st
ate
clas
sific
atio
n; c
ontr
ol
reco
mm
ende
d bu
t not
requ
ired
in K
ing
Coun
ty**
* Non
-reg
ulat
ed C
lass
B a
nd C
nox
ious
wee
ds; c
ontr
ol re
com
men
ded
but n
ot re
quire
d in
Ki
ng C
ount
y
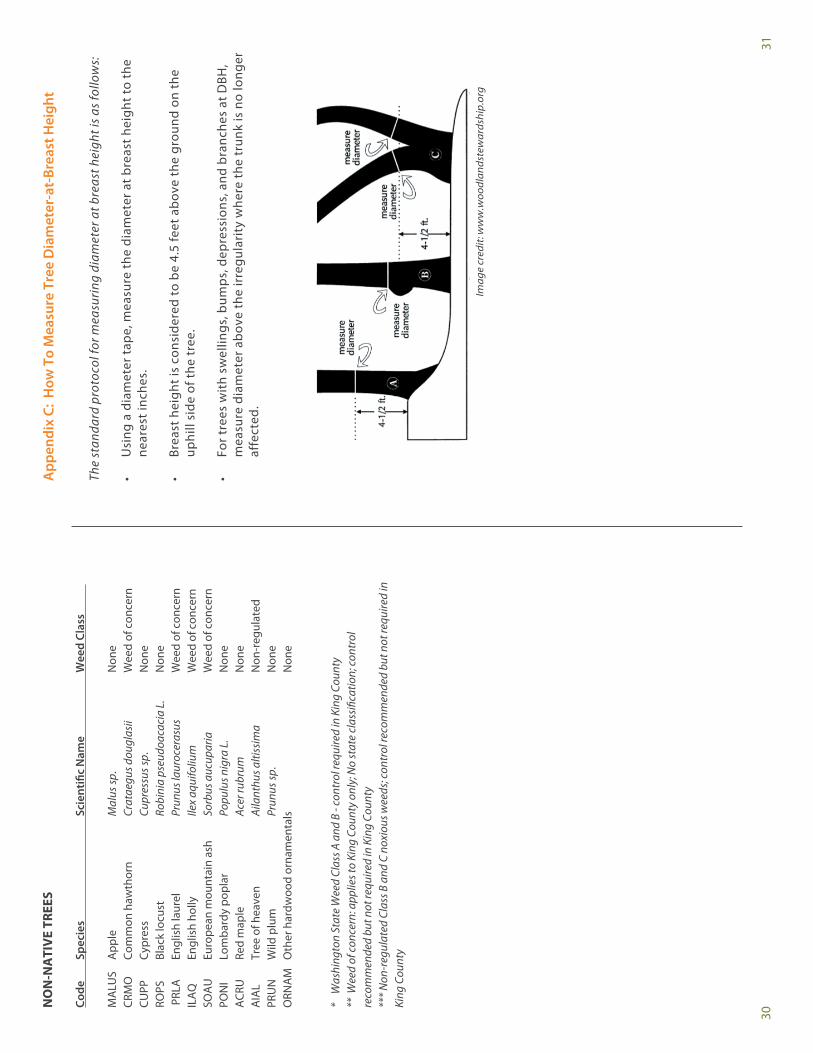
3131
App
endi
x C:
How
To
Mea
sure
Tre
e D
iam
eter
-at-
Brea
st H
eigh
t
The
stan
dard
pro
toco
l for
mea
surin
g di
amet
er a
t bre
ast h
eigh
t is
as fo
llow
s:
•U
sing
a d
iam
eter
tape
, mea
sure
the
diam
eter
at b
reas
t hei
ght t
o th
e ne
ares
t inc
hes.
•Br
east
hei
ght i
s co
nsid
ered
to b
e 4.
5 fe
et a
bove
the
grou
nd o
n th
e up
hill
side
of t
he tr
ee.
•Fo
r tre
es w
ith
swel
lings
, bum
ps, d
epre
ssio
ns, a
nd b
ranc
hes
at D
BH,
mea
sure
dia
met
er a
bove
the
irre
gula
rity
whe
re th
e tr
unk
is n
o lo
nger
af
fect
ed.
Imag
e cr
edit:
ww
w.w
oodl
ands
tew
ards
hip.
org
Imag
e cr
edit:
ww
w.w
oodl
ands
tew
ards
hip.
org
30
NO
N-N
ATI
VE
TREE
S
Code
Sp
ecie
s
Sc
ient
ific
Nam
e
Wee
d Cl
ass
M
ALU
S A
pple
M
alus
sp.
N
one
CRM
O
Com
mon
haw
thor
n Cr
atae
gus d
ougl
asii
Wee
d of
con
cern
CUPP
Cy
pres
s
Cu
pres
sus s
p.
N
one
ROPS
Bl
ack
locu
st
Ro
bini
a ps
eudo
acac
ia L
. N
one
PRL
A
Engl
ish
laur
el
Pr
unus
laur
ocer
asus
W
eed
of c
once
rnIL
AQ
En
glis
h ho
lly
Ile
x aq
uifo
lium
Wee
d of
con
cern
SOA
U
Euro
pean
mou
ntai
n as
h So
rbus
auc
upar
ia
W
eed
of c
once
rnPO
NI
Lom
bard
y po
plar
Popu
lus n
igra
L.
N
one
ACR
U
Red
map
le
Ac
er ru
brum
Non
eA
IAL
Tree
of h
eave
n
Aila
nthu
s alti
ssim
a
Non
-reg
ulat
ed
PRU
N
Wild
plu
m
Pr
unus
sp.
N
one
ORN
AM
O
ther
har
dwoo
d or
nam
enta
ls
Non
e
* W
ashi
ngto
n St
ate
Wee
d Cl
ass A
and
B -
cont
rol r
equi
red
in K
ing
Coun
ty**
Wee
d of
con
cern
: app
lies t
o Ki
ng C
ount
y on
ly; N
o st
ate
clas
sific
atio
n; c
ontr
ol
reco
mm
ende
d bu
t not
requ
ired
in K
ing
Coun
ty**
* Non
-reg
ulat
ed C
lass
B a
nd C
nox
ious
wee
ds; c
ontr
ol re
com
men
ded
but n
ot re
quire
d in
Ki
ng C
ount
y
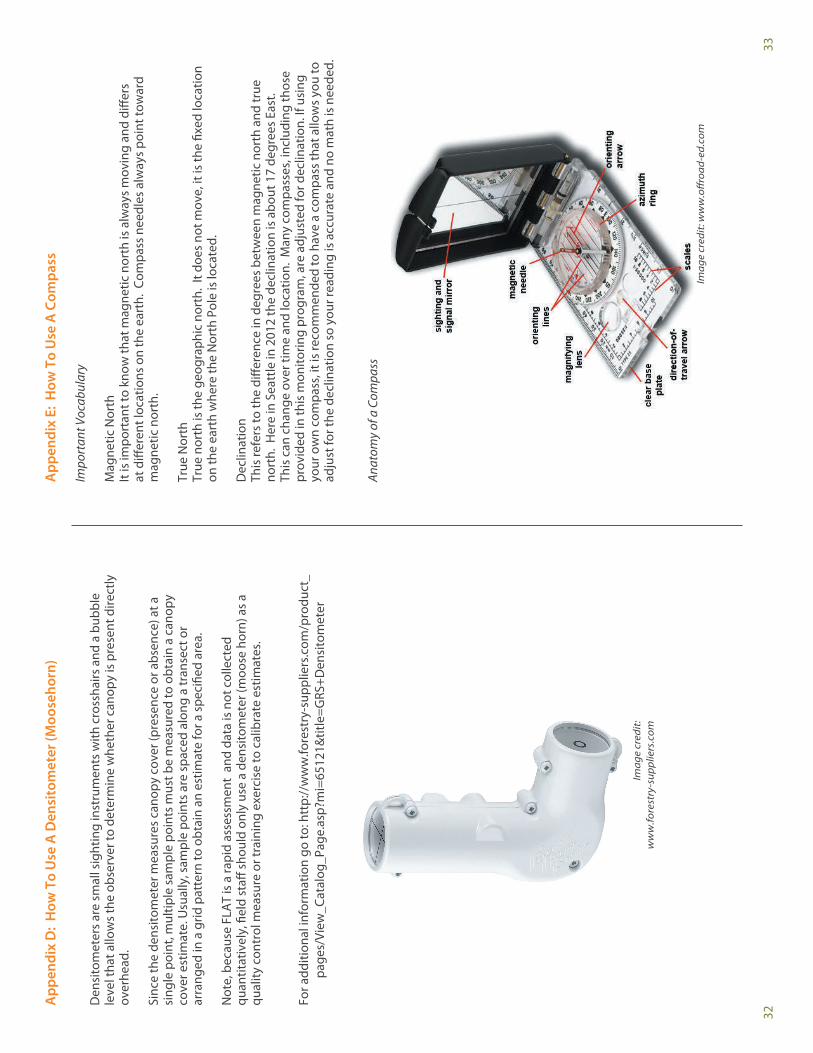
32
App
endi
x D
: H
ow T
o U
se A
Den
sito
met
er (M
oose
horn
)
Den
sito
met
ers
are
smal
l sig
htin
g in
stru
men
ts w
ith c
ross
hairs
and
a b
ubbl
e le
vel t
hat a
llow
s th
e ob
serv
er to
det
erm
ine
whe
ther
can
opy
is p
rese
nt d
irect
ly
over
head
.
Sinc
e th
e de
nsito
met
er m
easu
res
cano
py c
over
(pre
senc
e or
abs
ence
) at a
si
ngle
poi
nt, m
ultip
le s
ampl
e po
ints
mus
t be
mea
sure
d to
obt
ain
a ca
nopy
co
ver e
stim
ate.
Usu
ally
, sam
ple
poin
ts a
re s
pace
d al
ong
a tr
anse
ct o
r ar
rang
ed in
a g
rid p
atte
rn to
obt
ain
an e
stim
ate
for a
spe
cifie
d ar
ea.
Not
e, b
ecau
se F
LAT
is a
rapi
d as
sess
men
t an
d da
ta is
not
col
lect
ed
quan
titat
ivel
y, fi
eld
staff
sho
uld
only
use
a d
ensi
tom
eter
(moo
se h
orn)
as
a qu
ality
con
trol
mea
sure
or t
rain
ing
exer
cise
to c
alib
rate
est
imat
es.
For a
dditi
onal
info
rmat
ion
go to
: htt
p://
ww
w.fo
rest
ry-s
uppl
iers
.com
/pro
duct
_pa
ges/
View
_Cat
alog
_Pag
e.as
p?m
i=65
121&
title
=GRS
+Den
sito
met
er
Imag
e cr
edit:
w
ww
.fore
stry
-sup
plie
rs.c
om
33
App
endi
x E:
How
To
Use
A C
ompa
ss
Impo
rtan
t Voc
abul
ary
Mag
netic
Nor
thIt
is im
port
ant t
o kn
ow th
at m
agne
tic n
orth
is a
lway
s m
ovin
g an
d di
ffers
at
diff
eren
t loc
atio
ns o
n th
e ea
rth.
Com
pass
nee
dles
alw
ays
poin
t tow
ard
mag
netic
nor
th.
True
Nor
thTr
ue n
orth
is th
e ge
ogra
phic
nor
th.
It do
es n
ot m
ove,
it is
the
fixed
loca
tion
on th
e ea
rth
whe
re th
e N
orth
Pol
e is
loca
ted.
Dec
linat
ion
This
refe
rs to
the
diffe
renc
e in
deg
rees
bet
wee
n m
agne
tic n
orth
and
true
no
rth.
Her
e in
Sea
ttle
in 2
012
the
decl
inat
ion
is a
bout
17
degr
ees
East
. Th
is c
an c
hang
e ov
er ti
me
and
loca
tion.
Man
y co
mpa
sses
, inc
ludi
ng th
ose
prov
ided
in th
is m
onito
ring
prog
ram
, are
adj
uste
d fo
r dec
linat
ion.
If u
sing
yo
ur o
wn
com
pass
, it i
s re
com
men
ded
to h
ave
a co
mpa
ss th
at a
llow
s yo
u to
ad
just
for t
he d
eclin
atio
n so
you
r rea
ding
is a
ccur
ate
and
no m
ath
is n
eede
d.
Anat
omy
of a
Com
pass
Imag
e cr
edit:
ww
w.o
ffro
ad-e
d.co
m
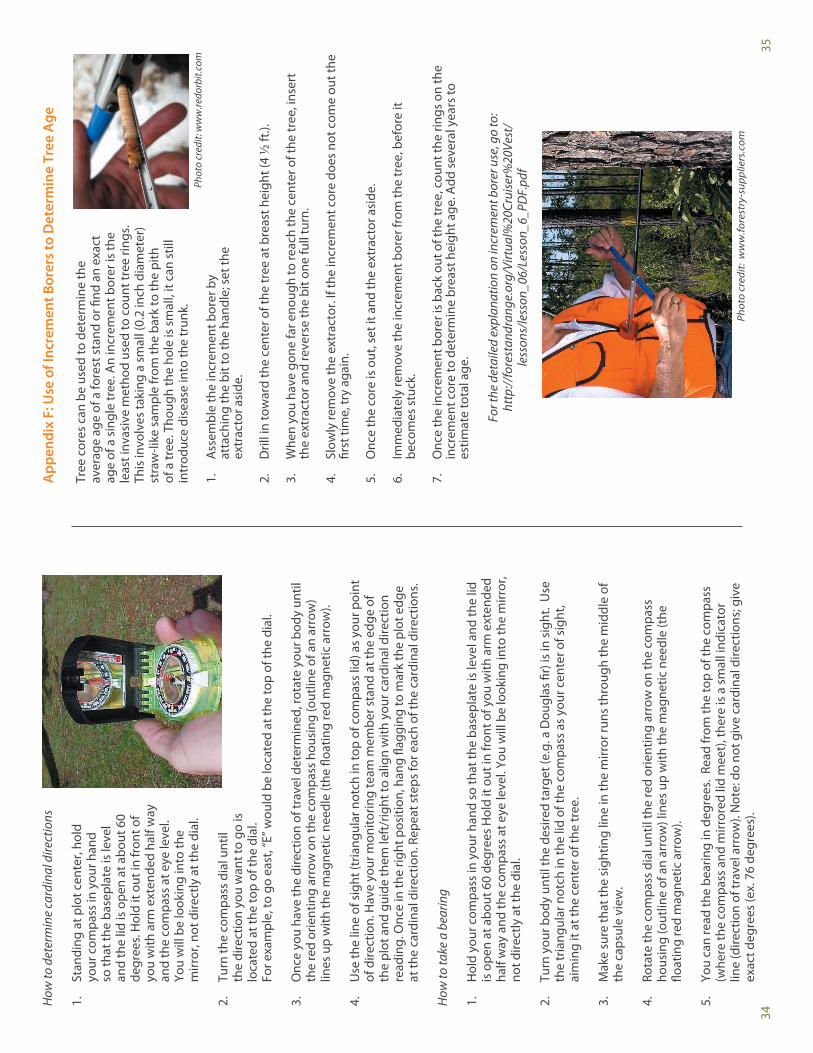
35
App
endi
x F:
Use
of I
ncre
men
t Bor
ers
to D
eter
min
e Tr
ee A
ge
Tree
cor
es c
an b
e us
ed to
det
erm
ine
the
aver
age
age
of a
fore
st s
tand
or fi
nd a
n ex
act
age
of a
sin
gle
tree
. An
incr
emen
t bor
er is
the
leas
t inv
asiv
e m
etho
d us
ed to
cou
nt tr
ee ri
ngs.
Th
is in
volv
es ta
king
a s
mal
l (0.
2 in
ch d
iam
eter
) st
raw
-like
sam
ple
from
the
bark
to th
e pi
th
of a
tree
. Tho
ugh
the
hole
is s
mal
l, it
can
still
in
trod
uce
dise
ase
into
the
trun
k.
1.
Ass
embl
e th
e in
crem
ent b
orer
by
atta
chin
g th
e bi
t to
the
hand
le; s
et th
e ex
trac
tor a
side
.
2.
Dril
l in
tow
ard
the
cent
er o
f the
tree
at b
reas
t hei
ght (
4 ½
ft.).
3.
Whe
n yo
u ha
ve g
one
far e
noug
h to
reac
h th
e ce
nter
of t
he tr
ee, i
nser
t th
e ex
trac
tor a
nd re
vers
e th
e bi
t one
full
turn
.
4.
Slow
ly re
mov
e th
e ex
trac
tor.
If th
e in
crem
ent c
ore
does
not
com
e ou
t the
fir
st ti
me,
try
agai
n.
5.
Onc
e th
e co
re is
out
, set
it a
nd th
e ex
trac
tor a
side
.
6.
Imm
edia
tely
rem
ove
the
incr
emen
t bor
er fr
om th
e tr
ee, b
efor
e it
beco
mes
stu
ck.
7.
Onc
e th
e in
crem
ent b
orer
is b
ack
out o
f the
tree
, cou
nt th
e rin
gs o
n th
e in
crem
ent c
ore
to d
eter
min
e br
east
hei
ght a
ge. A
dd s
ever
al y
ears
to
estim
ate
tota
l age
.
For t
he d
etai
led
expl
anat
ion
on in
crem
ent b
orer
use
, go
to:
http
://fo
rest
andr
ange
.org
/Virt
ual%
20Cr
uise
r%20
Vest
/ le
sson
s/le
sson
_06/
Less
on_6
_PD
F.pd
f
Phot
o cr
edit:
ww
w.re
dorb
it.co
m
Phot
o cr
edit:
ww
w.fo
rest
ry-s
uppl
iers
.com
34
How
to d
eter
min
e ca
rdin
al d
irect
ions
1.
Stan
ding
at p
lot c
ente
r, ho
ld
your
com
pass
in y
our h
and
so th
at th
e ba
sepl
ate
is le
vel
and
the
lid is
ope
n at
abo
ut 6
0 de
gree
s. H
old
it ou
t in
fron
t of
you
with
arm
ext
ende
d ha
lf w
ay
and
the
com
pass
at e
ye le
vel.
Yo
u w
ill b
e lo
okin
g in
to th
e m
irror
, not
dire
ctly
at t
he d
ial.
2.
Turn
the
com
pass
dia
l unt
il th
e di
rect
ion
you
wan
t to
go is
lo
cate
d at
the
top
of th
e di
al.
For e
xam
ple,
to g
o ea
st, “
E” w
ould
be
loca
ted
at th
e to
p of
the
dial
.
3.
Onc
e yo
u ha
ve th
e di
rect
ion
of tr
avel
det
erm
ined
, rot
ate
your
bod
y un
til
the
red
orie
ntin
g ar
row
on
the
com
pass
hou
sing
(out
line
of a
n ar
row
) lin
es u
p w
ith th
e m
agne
tic n
eedl
e (t
he fl
oatin
g re
d m
agne
tic a
rrow
).
4.
Use
the
line
of s
ight
(tria
ngul
ar n
otch
in to
p of
com
pass
lid)
as
your
poi
nt
of d
irect
ion.
Hav
e yo
ur m
onito
ring
team
mem
ber s
tand
at t
he e
dge
of
the
plot
and
gui
de th
em le
ft/r
ight
to a
lign
with
you
r car
dina
l dire
ctio
n re
adin
g. O
nce
in th
e rig
ht p
ositi
on, h
ang
flagg
ing
to m
ark
the
plot
edg
e at
the
card
inal
dire
ctio
n. R
epea
t ste
ps fo
r eac
h of
the
card
inal
dire
ctio
ns.
How
to ta
ke a
bea
ring
1.
Hol
d yo
ur c
ompa
ss in
you
r han
d so
that
the
base
plat
e is
leve
l and
the
lid
is o
pen
at a
bout
60
degr
ees
Hol
d it
out i
n fr
ont o
f you
with
arm
ext
ende
d ha
lf w
ay a
nd th
e co
mpa
ss a
t eye
leve
l. Yo
u w
ill b
e lo
okin
g in
to th
e m
irror
, no
t dire
ctly
at t
he d
ial.
2.
Turn
you
r bod
y un
til th
e de
sire
d ta
rget
(e.g
. a D
ougl
as fi
r) is
in s
ight
. U
se
the
tria
ngul
ar n
otch
in th
e lid
of t
he c
ompa
ss a
s yo
ur c
ente
r of s
ight
, ai
min
g it
at th
e ce
nter
of t
he tr
ee.
3.
Mak
e su
re th
at th
e si
ghtin
g lin
e in
the
mirr
or ru
ns th
roug
h th
e m
iddl
e of
th
e ca
psul
e vi
ew.
4.
Rota
te th
e co
mpa
ss d
ial u
ntil
the
red
orie
ntin
g ar
row
on
the
com
pass
ho
usin
g (o
utlin
e of
an
arro
w) l
ines
up
with
the
mag
netic
nee
dle
(the
flo
atin
g re
d m
agne
tic a
rrow
).
5.
You
can
read
the
bear
ing
in d
egre
es.
Read
from
the
top
of th
e co
mpa
ss
(whe
re th
e co
mpa
ss a
nd m
irror
ed li
d m
eet)
, the
re is
a s
mal
l ind
icat
or
line
(dire
ctio
n of
trav
el a
rrow
). N
ote:
do
not g
ive
card
inal
dire
ctio
ns; g
ive
exac
t deg
rees
(ex.
76
degr
ees)
.
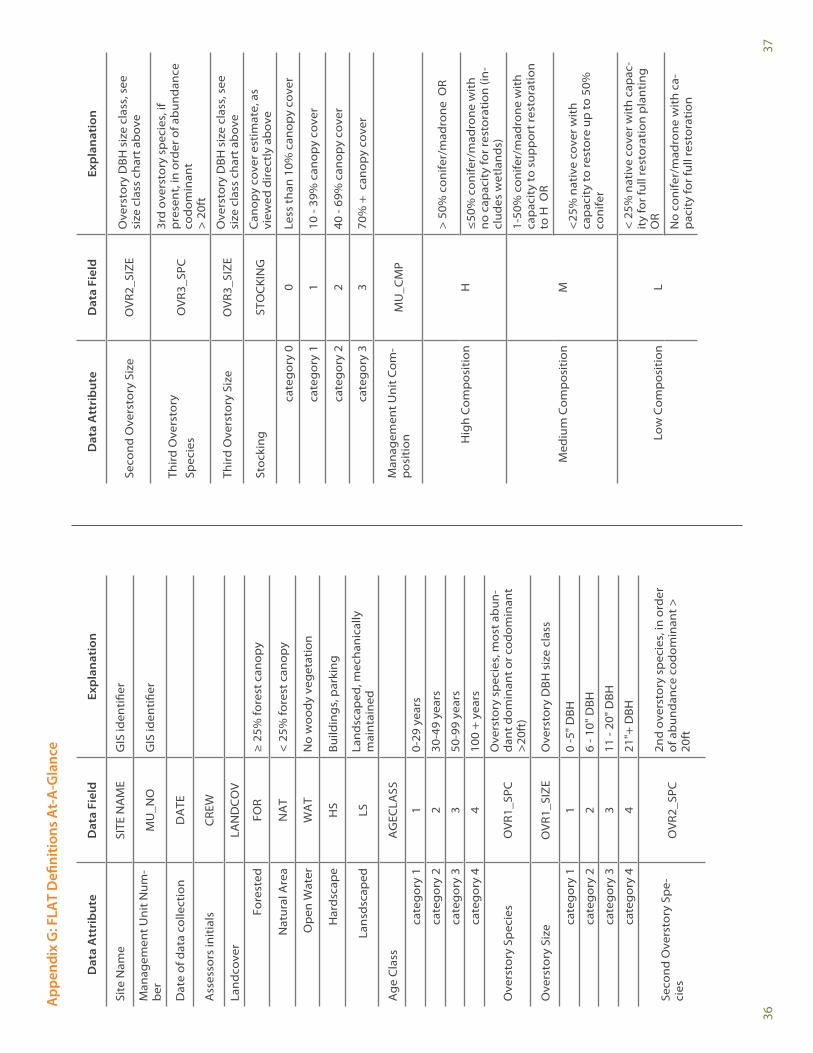
36
Dat
a A
ttri
bu
teD
ata
Fiel
dEx
pla
nat
ion
Site
Nam
eSI
TE N
AM
EG
IS id
enti
fier
Man
agem
ent U
nit N
um-
ber
MU
_NO
GIS
iden
tifie
r
Dat
e of
dat
a co
llect
ion
DA
TE
Ass
esso
rs in
itia
lsC
REW
Land
cove
rLA
ND
CO
V
Fore
sted
FOR
≥ 2
5% fo
rest
can
opy
Nat
ural
Are
aN
AT
< 2
5% fo
rest
can
opy
Op
en W
ater
WA
TN
o w
ood
y ve
get
atio
n
Har
dsc
ape
HS
Build
ing
s, p
arki
ng
Lans
dsc
aped
LS
Land
scap
ed, m
echa
nica
lly
mai
ntai
ned
Ag
e C
lass
AG
ECLA
SS
cate
gor
y 1
10-
29 y
ears
cate
gor
y 2
230
-49
year
s
cate
gor
y 3
350
-99
year
s
cate
gor
y 4
410
0 +
yea
rs
Ove
rsto
ry S
pec
ies
OV
R1_S
PCO
vers
tory
sp
ecie
s, m
ost a
bun
-d
ant d
omin
ant o
r cod
omin
ant
>20
ft)
Ove
rsto
ry S
ize
OV
R1_S
IZE
Ove
rsto
ry D
BH s
ize
clas
s
cate
gor
y 1
10
-5" D
BH
cate
gor
y 2
26
- 10"
DBH
cate
gor
y 3
311
- 20
" DBH
cate
gor
y 4
421
"+ D
BH
Seco
nd O
vers
tory
Sp
e-ci
es
OV
R2_S
PC2n
d o
vers
tory
sp
ecie
s, in
ord
er
of a
bun
dan
ce c
odom
inan
t >
20ft
App
endi
x G
: FLA
T D
efini
tions
At-
A-G
lanc
e
37
Dat
a A
ttri
bu
teD
ata
Fiel
dEx
pla
nat
ion
Seco
nd O
vers
tory
Siz
eO
VR2
_SIZ
EO
vers
tory
DBH
siz
e cl
ass,
see
si
ze c
lass
cha
rt a
bov
e
Thir
d O
vers
tory
Sp
ecie
sO
VR3
_SPC
3rd
ove
rsto
ry s
pec
ies,
if
pre
sent
, in
ord
er o
f ab
und
ance
co
dom
inan
t >
20f
t
Thir
d O
vers
tory
Siz
eO
VR3
_SIZ
EO
vers
tory
DBH
siz
e cl
ass,
see
si
ze c
lass
cha
rt a
bov
e
Stoc
king
ST
OC
KIN
GC
anop
y co
ver e
stim
ate,
as
view
ed d
irec
tly
abov
e
cate
gor
y 0
0Le
ss th
an 1
0% c
anop
y co
ver
cate
gor
y 1
110
- 39
% c
anop
y co
ver
cate
gor
y 2
240
- 69
% c
anop
y co
ver
cate
gor
y 3
370
% +
can
opy
cove
r
Man
agem
ent U
nit C
om-
pos
itio
n M
U_C
MP
Hig
h C
omp
osit
ion
H
> 5
0% c
onife
r/m
adro
ne O
R
≤50
% c
onife
r/m
adro
ne w
ith
no c
apac
ity
for r
esto
rati
on (i
n-cl
udes
wet
land
s)
Med
ium
Com
pos
itio
n M
1-50
% c
onife
r/m
adro
ne w
ith
cap
acit
y to
sup
por
t res
tora
tion
to
H O
R
<25
% n
ativ
e co
ver w
ith
cap
acit
y to
rest
ore
up to
50%
co
nife
r
Low
Com
pos
itio
nL
< 2
5% n
ativ
e co
ver w
ith
cap
ac-
ity
for f
ull r
esto
rati
on p
lant
ing
O
R
No
coni
fer/
mad
rone
wit
h ca
-p
acit
y fo
r ful
l res
tora
tion
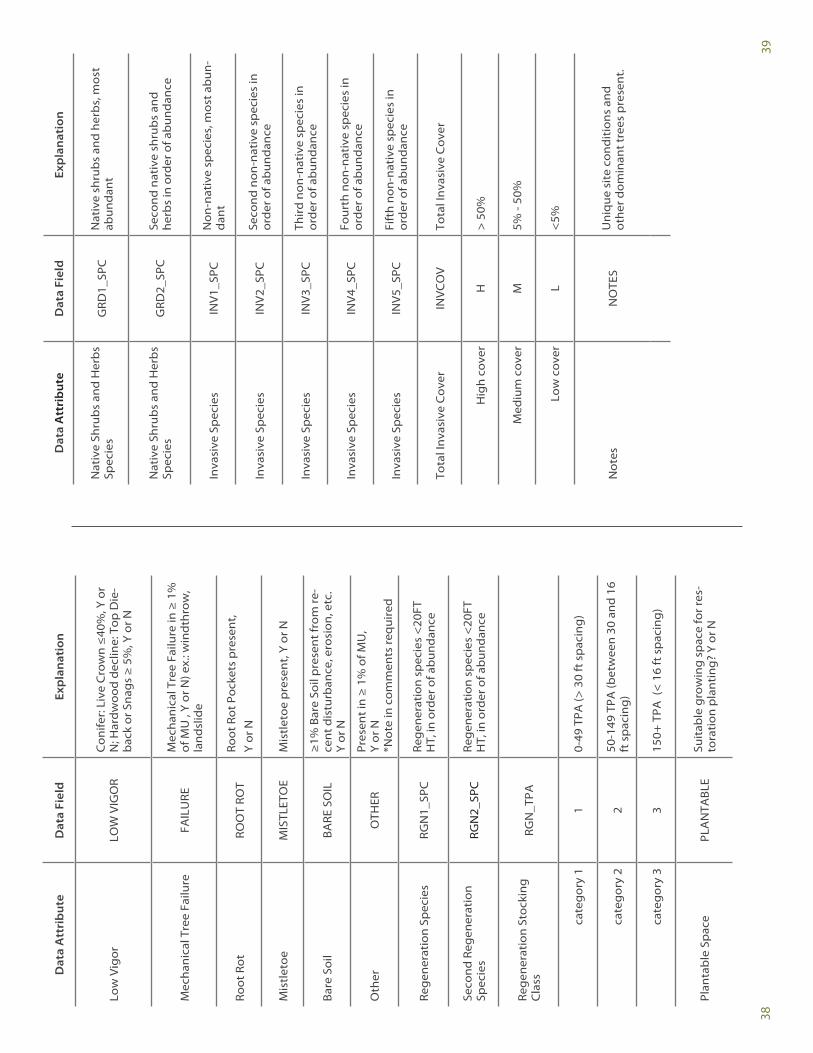
39
Dat
a A
ttri
bu
teD
ata
Fiel
dEx
pla
nat
ion
Nat
ive
Shru
bs
and
Her
bs
Spec
ies
GRD
1_SP
CN
ativ
e sh
rub
s an
d h
erb
s, m
ost
abun
dan
t
Nat
ive
Shru
bs
and
Her
bs
Spec
ies
GRD
2_SP
CSe
cond
nat
ive
shru
bs
and
he
rbs
in o
rder
of a
bun
dan
ce
Inva
sive
Sp
ecie
s IN
V1_
SPC
Non
-nat
ive
spec
ies,
mos
t ab
un-
dan
t
Inva
sive
Sp
ecie
s IN
V2_
SPC
Seco
nd n
on-n
ativ
e sp
ecie
s in
or
der
of a
bun
dan
ce
Inva
sive
Sp
ecie
s IN
V3_
SPC
Thir
d n
on-n
ativ
e sp
ecie
s in
or
der
of a
bun
dan
ce
Inva
sive
Sp
ecie
s IN
V4_
SPC
Four
th n
on-n
ativ
e sp
ecie
s in
or
der
of a
bun
dan
ce
Inva
sive
Sp
ecie
s IN
V5_
SPC
Fift
h no
n-na
tive
sp
ecie
s in
or
der
of a
bun
dan
ce
Tota
l Inv
asiv
e C
over
INV
CO
VTo
tal I
nvas
ive
Cov
er
Hig
h co
ver
H>
50%
Med
ium
cov
erM
5% -
50%
Low
cov
erL
<5%
Not
esN
OTE
SU
niq
ue s
ite
cond
itio
ns a
nd
othe
r dom
inan
t tre
es p
rese
nt.
38
Dat
a A
ttri
bu
teD
ata
Fiel
dEx
pla
nat
ion
Low
Vig
orLO
W V
IGO
RC
onife
r: Li
ve C
row
n ≤
40%
, Y o
r N
; Har
dw
ood
dec
line:
Top
Die
-b
ack
or S
nag
s ≥
5%
, Y o
r N
Mec
hani
cal T
ree
Failu
reFA
ILU
REM
echa
nica
l Tre
e Fa
ilure
in ≥
1%
of
MU
, Y
or N
) ex.
: win
dth
row
, la
ndsl
ide
Root
Rot
ROO
T RO
TRo
ot R
ot P
ocke
ts p
rese
nt,
Y or
N
Mis
tlet
oeM
ISTL
ETO
EM
istl
etoe
pre
sent
, Y o
r N
Bare
Soi
lBA
RE S
OIL
≥1%
Bar
e So
il p
rese
nt fr
om re
-ce
nt d
istu
rban
ce, e
rosi
on, e
tc.
Y or
N
Oth
er
OTH
ERPr
esen
t in
≥ 1
% o
f MU
, Y
or N
*N
ote
in c
omm
ents
req
uire
d
Reg
ener
atio
n Sp
ecie
s RG
N1_
SPC
Reg
ener
atio
n sp
ecie
s <
20FT
H
T, in
ord
er o
f ab
und
ance
Seco
nd R
egen
erat
ion
Spec
ies
RGN
2_SP
CRe
gen
erat
ion
spec
ies
<20
FT
HT,
in o
rder
of a
bun
dan
ce
Reg
ener
atio
n St
ocki
ng
Cla
ssRG
N_T
PA
cate
gor
y 1
10-
49 T
PA (>
30
ft s
pac
ing
)
cate
gor
y 2
250
-149
TPA
(bet
wee
n 30
and
16
ft s
pac
ing
)
cate
gor
y 3
315
0+ T
PA (
< 1
6 ft
sp
acin
g)
Plan
tab
le S
pac
ePL
AN
TABL
ESu
itab
le g
row
ing
sp
ace
for r
es-
tora
tion
pla
ntin
g?
Y or
N
40
Re
fere
nce
s
Arn
ey, J
.D.,
K.S.
Miln
er, a
nd B
.L. K
lein
henz
. 200
8. B
iom
etric
s of
For
est I
nven
tory
, Fo
rest
Gro
wth
, and
For
est P
lann
ing.
Tec
hnic
al R
epor
t No.
12.
For
est B
iom
etric
s Re
sear
ch In
stitu
te.
Jenn
ings
S.B
., N
.D. B
row
n, a
nd D
. She
il. 1
999.
“Ass
essi
ng fo
rest
can
opie
s an
d un
ders
tory
illu
min
atio
n: c
anop
y cl
osur
e, c
anop
y co
ver a
nd o
ther
mea
sure
s.”
Fore
stry
, Vol
72,
No.
1 pp
59-
73.
Korh
onen
, L.,
K.T.
Kor
hone
n, M
. Rau
tiain
en, a
nd P
. Ste
nber
g. 2
006.
“Est
imat
ion
of fo
rest
can
opy
cove
r: A
com
paris
on o
f fiel
d m
easu
rem
ent t
echn
ique
s.” S
ilva
Fenn
ica
40(4
): 57
7–58
8.
Wol
f, K.
et a
l. 20
13 [I
n Pr
ess]
. For
est L
ands
cape
Ass
essm
ent T
ool G
ener
al
Tech
nica
l Rep
ort.
USD
A F
ores
t Ser
vice
PN
W R
esea
rch
Stat
ion.
Mon
itorin
g D
ata
Colle
ctio
n M
etho
ds. 2
013.
Dev
elop
ed b
y th
e G
reen
City
Pa
rtne
rshi
ps fo
r the
Reg
iona
l Sta
ndar
dize
d M
onito
ring
Proj
ect.
Ben
Mea
dow
s. U
RL: w
ww
.ben
mea
dow
s.co
m
The
Nat
iona
l Lea
rnin
g Ce
nter
for P
rivat
e Fo
rest
and
Ran
ge L
ando
wne
rs.
URL
: ww
w.fo
rest
andr
ange
.org
/Virt
ual%
20Cr
uise
r%20
Vest
/less
ons/
less
on_0
6/Le
sson
_6_P
DF.
Woo
dlan
d St
ewar
dshi
p O
nlin
e Re
sour
ce. 2
011.
Uni
vers
ity o
f Min
neso
ta.
URL
: ww
w.w
oodl
ands
tew
ards
hip.
org
No
tes

Pacific Northwest Research Station
Website http://www.fs.fed.us/pnw/Telephone (503) 808–2592Publication requests (503) 808–2138FAX (503) 808–2130E-mail [email protected] address Publications Distribution Pacific Northwest Research Station P.O. Box 3890 Portland, OR 97208–3890

U.S. Department of Agriculture Pacific Northwest Research Station 1220 SW 3rd Ave. P.O. Box 3890 Portland, OR 97208–3890
Official Business Penalty for Private Use, $300
Related Documents