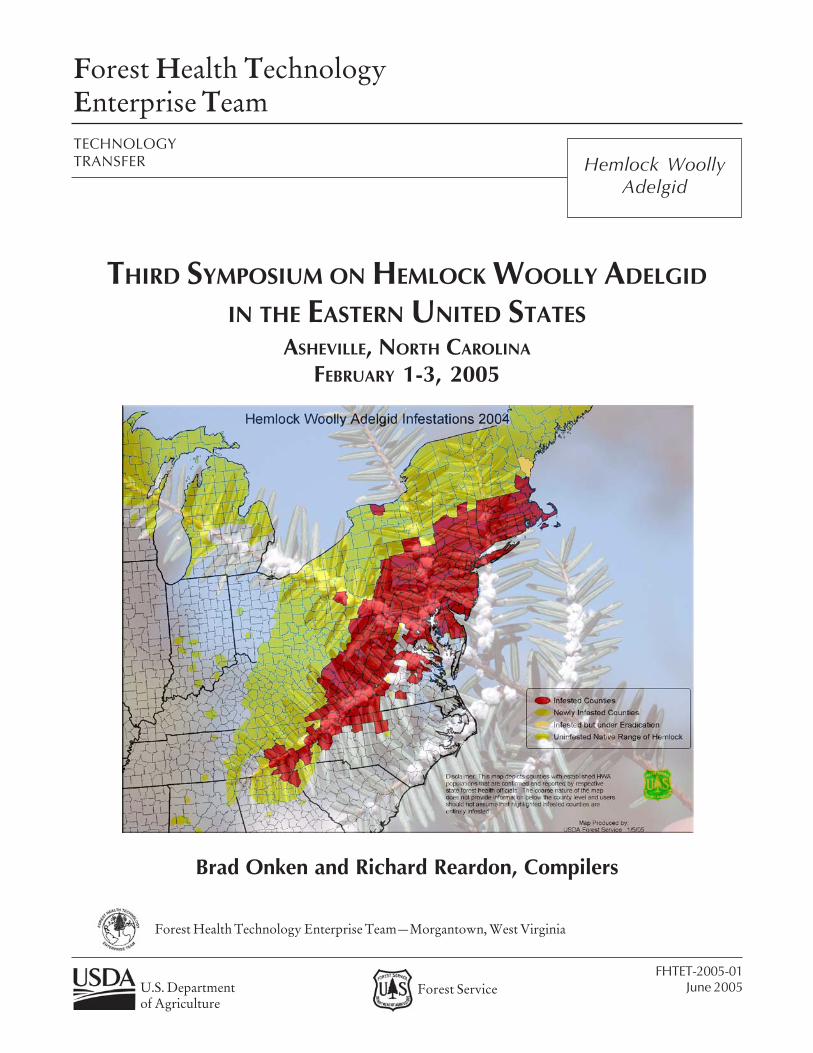
FHTET-2005-01 June 2005 Forest Health Technology Enterprise Team TECHNOLOGY TRANSFER Hemlock Woolly Adelgid Forest Service U.S. Department of Agriculture THIRD SYMPOSIUM ON HEMLOCK WOOLLY ADELGID IN THE EASTERN UNITED STATES ASHEVILLE, NORTH CAROLINA FEBRUARY 1-3, 2005 Brad Onken and Richard Reardon, Compilers Forest Health Technology Enterprise Team—Morgantown, West Virginia

Welcome message from author
This document is posted to help you gain knowledge. Please leave a comment to let me know what you think about it! Share it to your friends and learn new things together.
Transcript
FHTET-2005-01June 2005
Forest Health TechnologyEnterprise TeamTECHNOLOGYTRANSFER Hemlock Woolly
Adelgid
Forest ServiceU.S. Departmentof Agriculture
THIRD SYMPOSIUM ON HEMLOCK WOOLLY ADELGID
IN THE EASTERN UNITED STATESASHEVILLE, NORTH CAROLINA
FEBRUARY 1-3, 2005
Brad Onken and Richard Reardon, Compilers
Forest Health Technology Enterprise Team—Morgantown, West Virginia
Federal Recycling ProgramPrinted on recycled paper.
Most of the abstracts were submitted in an electronic format, and were edited toachieve a uniform format and typeface. Each contributor is responsible for theaccuracy and content of his or her own paper. Statements of the contributors fromoutside of the U.S. Department of Agriculture may not necessarily reflect thepolicy of the Department. Some participants did not submit abstracts, and so theirpresentations are not represented here.
References to pesticides appear in some technical papers represented by theseabstracts. Publication of these statements does not constitute endorsement orrecommendation of them by the conference sponsors, nor does it imply that usesdiscussed have been registered. Use of most pesticides is regulated by state andfederal laws. Applicable regulations must be obtained from the appropriateregulatory agency prior to their use.CAUTION: Pesticides can be injurious to humans, domestic animals, desirableplants, and fish and other wildlife if they are not handled and applied properly.Use all pesticides selectively and carefully. Follow recommended practices givenon the label for use and disposal of pesticides and pesticide containers.
The use of trade, firm, or corporation names in this publication is for the informationand convenience of the reader. Such use does not constitute an official endorsementor approval by the U.S. Department of Agriculture of any product or service to theexclusion of others that may be suitable.
The U.S. Department of Agriculture (USDA) prohibits discrimination in all its programs andactivities on the basis of race, color, national origin, sex, religion, age, disability, political beliefs,sexual orientation, or marital or family status. (Not all prohibited bases apply to all programs.)Persons with disabilities who require alternative means for communication of program information(Braille, large print, audiotape, etc.) should contact USDA’s TARGET Center at 202-720-2600(voice and TDD).
To file a complaint of discrimination, write USDA, Director, Office of Civil Rights, Room 326-W,Whitten Building, 1400 Independence Avenue, SW, Washington, D.C. 20250-9410 or call202-720-5964 (voice and TDD). USDA is an equal opportunity provider and employer.
Third Symposium ON
HEMLOCK WOOLLY ADELGID IN THE EASTERN UNITED STATES
February 1-3, 2005
Renaissance Asheville HotelAsheville, North Carolina
Compiled by:Brad Onken1 and Richard Reardon2
1USDA Forest Service, Forest Health Protection, Morgantown, West Virginia2USDA Forest Service, Forest Health Technology Enterprise Team, Morgantown, West Virginia
For additional copies, contact Brad Onken at (304) 285-1546 (e-mail: [email protected]) orRichard Reardon at (304) 285-1566 (e-mail: [email protected]).
The entire publication is available online at http://na.fs.fed.us/fhp/hwa.
Third Symposium on Hemlock Woolly Adelgid
___________________________________________________________________________________
II
ACKNOWLEDGMENTS
We thank Congressman Taylor for his valuable time and for sharing his thoughts on forest manage-ment issues and concern of the hemlock woolly adelgid in his opening remarks. Special thanks toRusty Rhea, USDA Forest Service Region 8 State and Private Forestry, Forest Health Protection,Fred Hain, North Carolina State University, Department of Entomology, and Brad Onken, USDAForest Service, Northeastern Area, State and Private Forestry, Forest Health Protection, for con-tributions to symposium costs and their leadership in organizing and hosting the symposium. Thanksalso to the USDA Forest Service Forest Health Technology Enterprise Team for providing theleadership and funding to print these manuscripts and abstracts and to Mark Riffe, ITX Interna-tional, for format and design of these proceedings. We acknowledge the hard work and excellentcontributions of the presenters and authors of the posters. Thanks to Robert Turner, SusanSchexnayber, and Sherry Esteb, Southern Appalachian Man and the Biosphere for handling theregistration and website announcements for the symposium and Robert Jetton, North CarolinaState University, for managing the audiovisual equipment. Their hard work was greatly appreci-ated. Finally, we are grateful to the USDA Forest Service-Northeastern Area and R8, -North-eastern Research Station, -Southern Research Station, and -Forest Health Technology EnterpriseTeam for their leadership in addressing the hemlock woolly adelgid issue and providing support formuch of the research and technology development activities presented in these proceedings.
SYMPOSIUM PROGRAM COMMITTEE
Fred Hain (Co-chairman)North Carolina State University
Raleigh, North Carolina
Rusty Rhea (Co-chairman)USDA Forest Service
Region 8, State and Private ForestryAsheville, North Carolina
Richard ReardonUSDA Forest Service
Forest Health Technology Enterprise TeamMorgantown, West Virginia
Brad OnkenUSDA Forest Service
Northeastern Area, State and Private ForestryMorgantown, West Virginia
Kathleen ShieldsUSDA Forest Service
Northeastern Research StationHamden, Connecticut
Dennis SoutoUSDA Forest Service
Northeastern Area, State and Private ForestryDurham, New Hampshire
Third Symposium on Hemlock Woolly Adelgid
___________________________________________________________________________________
III
FOREWORD
Eastern hemlock, Tsuga canadensis (L.) Carriere, and Carolina hemlock, T. caroliniana, are shade-tolerant and long-lived tree species found in eastern North America. Both survive well in the shadeof an overstory, although eastern hemlock has adapted to a variety of soil types and now extendsfrom Nova Scotia across southern Ontario to northern Michigan and northeastern Minnesota, south-ward into northern Georgia and Alabama, and westward from central New Jersey to the Appala-chian Mountains. Carolina hemlock is a relict species limited to a small area in the southern rangeof eastern hemlock.
Hemlock stands create an environment with many unique ecological and aesthetic charac-teristics, although due to their long life, they are susceptible to a number of insect pests, includinghemlock woolly adelgid (Adelges tsugae Annand), elongate hemlock scale (Fiorinia externa), hem-lock looper (Lambdina fiscellaria), and hemlock borer (Melanophila flvoguttata).
In recent years (from the 1980s to the present), hemlock mortality and widespread pre-emptive logging caused by the hemlock woolly adelgid has roused the issue of the future of hem-lock. These hemlock forests will be replaced by hardwood species, and resulting local changes tothe environment will have detrimental impacts for terrestrial and aquatic ecosystems.
In response to this threat to hemlocks in eastern North America, the U.S. Department ofAgriculture Forest Service and numerous state, university, and private organizations have respondedwith the development of a coordinated effort to manage the hemlock woolly adelgid and otherinsect pests associated with hemlock.
There have been two recent symposia addressing all aspects of hemlock woolly adelgid: in1995, First Hemlock Woolly Adelgid Review, Charlottesville, Virginia; and in 2002, HemlockWoolly Adelgid in the Eastern United States Symposium, East Brunswick, New Jersey. The latestmeeting, held in February of 2005, the Third Symposium on Hemlock Woolly Adelgid in the east-ern United States, Asheville, North Carolina, also included the presentation of information on thebiology and impacts of elongate hemlock scale and the balsam woolly adelgid. Articles and ab-stracts in these proceedings represent the range of recent and current studies addressing this ongo-ing concern.
Third Symposium on Hemlock Woolly Adelgid
___________________________________________________________________________________
IV
AGENDA:Third Symposium ON HEMLOCK WOOLLY ADELGID
IN THE EASTERN UNITED STATES
Overview of HWA, BWA, and EHS in North America Fred P. Hain et al.
PRESENTATIONS
An adelgid by any other name: The systematicchallenges of the adelgids (Hemiptera Adelgidae)
Matthew S. Wallace
Impacts (including economic and ecological)
The economic impacts of hemlock woolly adelgid onresidential landscape values in northern New Jersey
Tom Holmes, Elizabeth Murphy, and DeniseRoyle
Impacts of hemlock decline at Delaware Water GapNational Recreation Area (PA & NJ)
Rich Evans
Impacts of balsam woolly adelgid in the southernAppalachians
John Frampton, Kevin M. Potter, and Jill R.Sidebottom
Long-term effects of hemlock forest decline onheadwater stream communities
C.D. Snyder, J.A. Young, R.M. Ross, and D.R.Smith
Survey, Impact, and Detection
A binomial sequential sampling plan for Adelges tsugaeon eastern hemlock
Jeffrey Fidgen, David Legg, and Scott Salom
Sampling for detection and monitoring of hemlockwoolly adelgid within hemlock stands
Scott Costa
A randomized branch sampling method for hemlockwoolly adelgid
Alexander Evans
Using hyperspectral technologies to map hemlockdecline: Pre-visual decline assessment for earlyinfestation detection
Jennifer Pontius, Mary Martin, Lucie Plourde,and Richard Hallett
Operational use of hyperspectral imagery for foresthealth mapping
Richard Hallett, Jennifer Pontius, Mary Martin,and Lucie Plourde
The technology of hyperspectral remote sensing and itsapplications for vegetation
Sarah Green and Jason Cole
Mapping hemlocks via tree-based classification ofsatellite imagery and environmental data
Frank H. Koch, Heather M. Cheshire, andHugh A. Devine
Predicting HWA impacts on forest structure using alandscape scale model of forest disturbance andsuccession
John Waldron, Robert Coulson, Charles Lafon,Fred Hain, Maria Tchakerian, David Cairns,and Kier Klepzig
A GIS-based pest risk assessment for HWA in Vermont B.E. Machin, D.R. Bergdahl, H.B. Teillon, andD. Ruddell
Third Symposium on Hemlock Woolly Adelgid
___________________________________________________________________________________
V
Research and Technology Development
Broad overview of control Rusty Rhea
Assessments of biological control of hemlock woollyadelgid with Sasajiscymnus (Pseudoscymnus) tsugae inConnecticut and New Jersey
C. Cheah, M. Mayer, D. Palmer T. Scudder, andR. Chianese
Overview of HWA biological control activities withLaricobius spp. (Coleoptera: Derodontidae)
S.M. Salom et al.
Experimental releases of Laricobius nigrinus(Coleoptera: Derodontidae) for biological control ofhemlock woolly adelgid
D.L. Mausel, S.M. Salom, and L.T. Kok
An overview of lady beetles collected from hemlock inChina and Japan in relation to their potential asbiological controls for the hemlock woolly adelgid
Guoyue Yu and Michael E. Montgomery
Classical biological control of the elongate hemlockscale, Fiorinia externa: 2004 activities
R.G. Van Driesche, R. Cowles, K. Abell, andS. Lyon
Elongate hemlock scale and its natural enemies in theSouthern Appalachians
P.L. Lambdin, C. Lynch, J.F. Grant, R. Reardon,B. Onken, and R. Rhea
Insect-killing fungi as a component of hemlock woollyadelgid IPM
Scott D. Costa et al.
Management of elongate hemlock scale withentomopathogenic fungi
Bruce L. Parker et al.
Chemical control of hemlock woolly adelgid R.S. Cowles et al.
Potential concerns for tree wound response from steminjection
Kevin T. Smith and Phillip A. Lewis
Resistance of hemlock to Adelges tsugae: Promisingnew developments
Michael E. Montgomery, Anthony F. Lagalante,and Kathleen S. Shields
Ex situ conservation efforts of Carolina hemlock M. Tighe and W. Dvorak
Preserving eastern hemlock [Tsuga canadensis (L.) Carr.]gene pools through ex situ plantings
Belinda D. Esham et al.
Host interactions of the balsam woolly adelgid L.P. Newton and F.P. Hain
Effect of BWA infestation on the chemical compositionof wood and bark
M. Balakshin, E. Capanema, J. Frampton,B. Goldfarb, and J. Kadla
Effects of balsam woolly adelgid infestation on Fraserfir: Preliminary results of metabolite profiling andmicroarray analysis
Cameron Morris, Len van Zyl, John Kadla,John Frampton, Barry Goldfarb, and RossWhetten
Survival and reproduction of hemlock woolly adelgidon the northern frontier
A. Paradis and J.S. Elkinton
Using mitochondrial DNA to determine the nativerange of the hemlock woolly adelgid
Nathan Havill
Third Symposium on Hemlock Woolly Adelgid
___________________________________________________________________________________
VI
POSTERS
Effects of systemic insecticides, a growth regulator, andoil on elongate hemlock scale and associated naturalenemies on eastern hemlock
Rob Ahern
Biological control of HWA in the southernAppalachians
C. Asaro, C.W. Berisford, M. Montogomery,J.R. Rhea, and J. Hanula
Investigating genetic resistance to HWA Susan E. Bentz, A.M. Townsend,Robert J. Griesbach, and Margaret R. Pooler
Streamlining the mass rearing protocols of Laricobiusnigrinus (Coleoptera: Derodontidae) and Sasajiscymnustsugae (Coleoptera: Coccinellidae), predators ofhemlock woolly adelgid
Ernest C. Bernard
Predatory insects and spiders from hemlock branchesinfested with hemlock woolly adelgid
LayLa Burgess, Hugh Conway, andJoseph D. Culin
The Nature Conservancy's response to HWA F. Campbell
Monitoring hemlock using ground-based digitalimaging
Neil Clark and Sang-Mook Lee
Microfeeding sites of hemlock and balsam woollyadelgids: Applications to artificial feeding systemdevelopment
A. Cohen, C. Cheah, J. Strider, and F. Hain
Update on rearing on Sasajisymnus and monitoring offirst release site
Hugh Conway and Joe Culin
Management
Silvicultural options for managing hemlock foreststhreatened by hemlock woolly adelgid
David A. Orwig and David B. Kittredge
Guidelines to minimize the impacts of HWA Jeffery Ward
Guidelines in the state of Maryland: An example Bob Rabaglia
An overview of hemlock woolly adelgid IPM inPennsylvania: 1999-2004
E.M. Blumenthal, A.C. Sior, and T.R. Marasco
Guidelines in the national forests of NC Ruth Berner
Environmental impact of imidacloprid Richard Heintzelman and Nate Royalty
Management strategies for the hemlock woolly adelgidand the balsam woolly adelgid in the Great SmokyMountains National Park
Kristine Johnson, Thomas Remaley, andGlenn Taylor
Don't color us in (yet): Will regulations and researchkeep Vermont adelgid-free?
B. Burns, B. Teillon, S. Pfister, and T. Greaves
Where are we now and where do we need to go? Brad Onken
Third Symposium on Hemlock Woolly Adelgid
___________________________________________________________________________________
VII
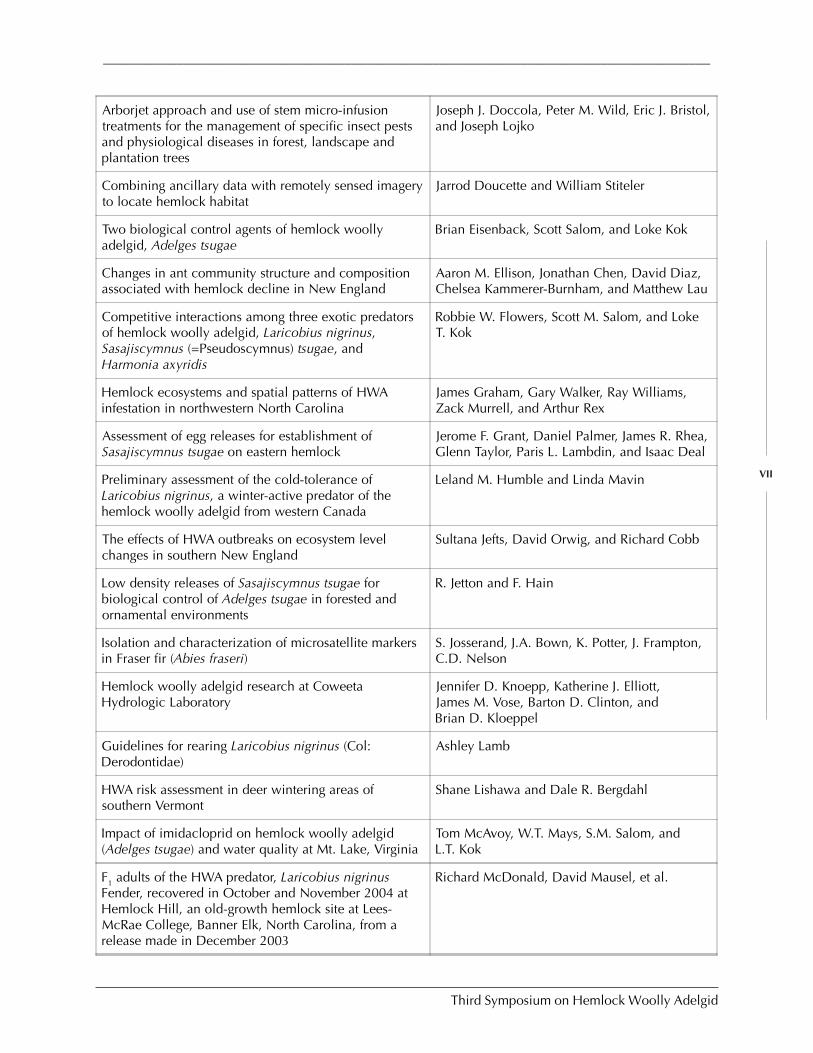
Arborjet approach and use of stem micro-infusiontreatments for the management of specific insect pestsand physiological diseases in forest, landscape andplantation trees
Joseph J. Doccola, Peter M. Wild, Eric J. Bristol,and Joseph Lojko
Combining ancillary data with remotely sensed imageryto locate hemlock habitat
Jarrod Doucette and William Stiteler
Two biological control agents of hemlock woollyadelgid, Adelges tsugae
Brian Eisenback, Scott Salom, and Loke Kok
Changes in ant community structure and compositionassociated with hemlock decline in New England
Aaron M. Ellison, Jonathan Chen, David Diaz,Chelsea Kammerer-Burnham, and Matthew Lau
Competitive interactions among three exotic predatorsof hemlock woolly adelgid, Laricobius nigrinus,Sasajiscymnus (=Pseudoscymnus) tsugae, andHarmonia axyridis
Robbie W. Flowers, Scott M. Salom, and LokeT. Kok
Hemlock ecosystems and spatial patterns of HWAinfestation in northwestern North Carolina
James Graham, Gary Walker, Ray Williams,Zack Murrell, and Arthur Rex
Assessment of egg releases for establishment ofSasajiscymnus tsugae on eastern hemlock
Jerome F. Grant, Daniel Palmer, James R. Rhea,Glenn Taylor, Paris L. Lambdin, and Isaac Deal
Preliminary assessment of the cold-tolerance ofLaricobius nigrinus, a winter-active predator of thehemlock woolly adelgid from western Canada
Leland M. Humble and Linda Mavin
The effects of HWA outbreaks on ecosystem levelchanges in southern New England
Sultana Jefts, David Orwig, and Richard Cobb
Low density releases of Sasajiscymnus tsugae forbiological control of Adelges tsugae in forested andornamental environments
R. Jetton and F. Hain
Isolation and characterization of microsatellite markersin Fraser fir (Abies fraseri)
S. Josserand, J.A. Bown, K. Potter, J. Frampton,C.D. Nelson
Hemlock woolly adelgid research at CoweetaHydrologic Laboratory
Jennifer D. Knoepp, Katherine J. Elliott,James M. Vose, Barton D. Clinton, andBrian D. Kloeppel
Guidelines for rearing Laricobius nigrinus (Col:Derodontidae)
Ashley Lamb
HWA risk assessment in deer wintering areas ofsouthern Vermont
Shane Lishawa and Dale R. Bergdahl
Impact of imidacloprid on hemlock woolly adelgid(Adelges tsugae) and water quality at Mt. Lake, Virginia
Tom McAvoy, W.T. Mays, S.M. Salom, andL.T. Kok
F1 adults of the HWA predator, Laricobius nigrinusFender, recovered in October and November 2004 atHemlock Hill, an old-growth hemlock site at Lees-McRae College, Banner Elk, North Carolina, from arelease made in December 2003
Richard McDonald, David Mausel, et al.
Third Symposium on Hemlock Woolly Adelgid
___________________________________________________________________________________
VIII
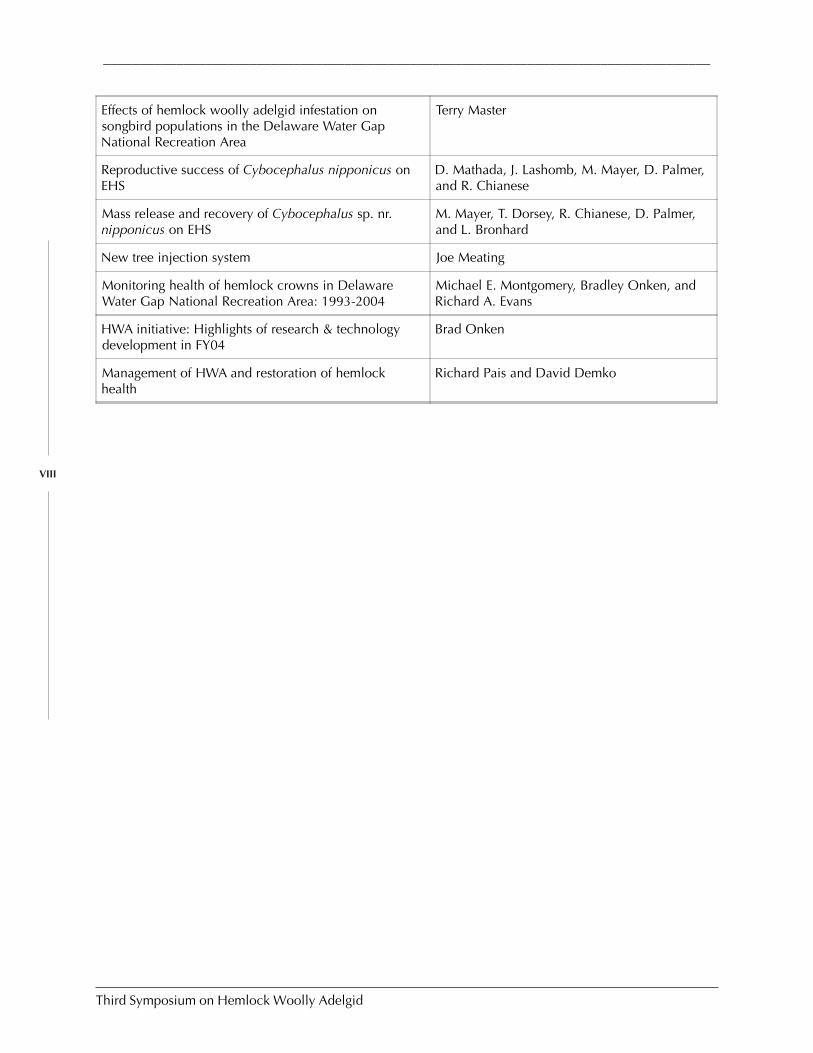
Effects of hemlock woolly adelgid infestation onsongbird populations in the Delaware Water GapNational Recreation Area
Terry Master
Reproductive success of Cybocephalus nipponicus onEHS
D. Mathada, J. Lashomb, M. Mayer, D. Palmer,and R. Chianese
Mass release and recovery of Cybocephalus sp. nr.nipponicus on EHS
M. Mayer, T. Dorsey, R. Chianese, D. Palmer,and L. Bronhard
New tree injection system Joe Meating
Monitoring health of hemlock crowns in DelawareWater Gap National Recreation Area: 1993-2004
Michael E. Montgomery, Bradley Onken, andRichard A. Evans
HWA initiative: Highlights of research & technologydevelopment in FY04
Brad Onken
Management of HWA and restoration of hemlockhealth
Richard Pais and David Demko
Third Symposium on Hemlock Woolly Adelgid
___________________________________________________________________________________
IX
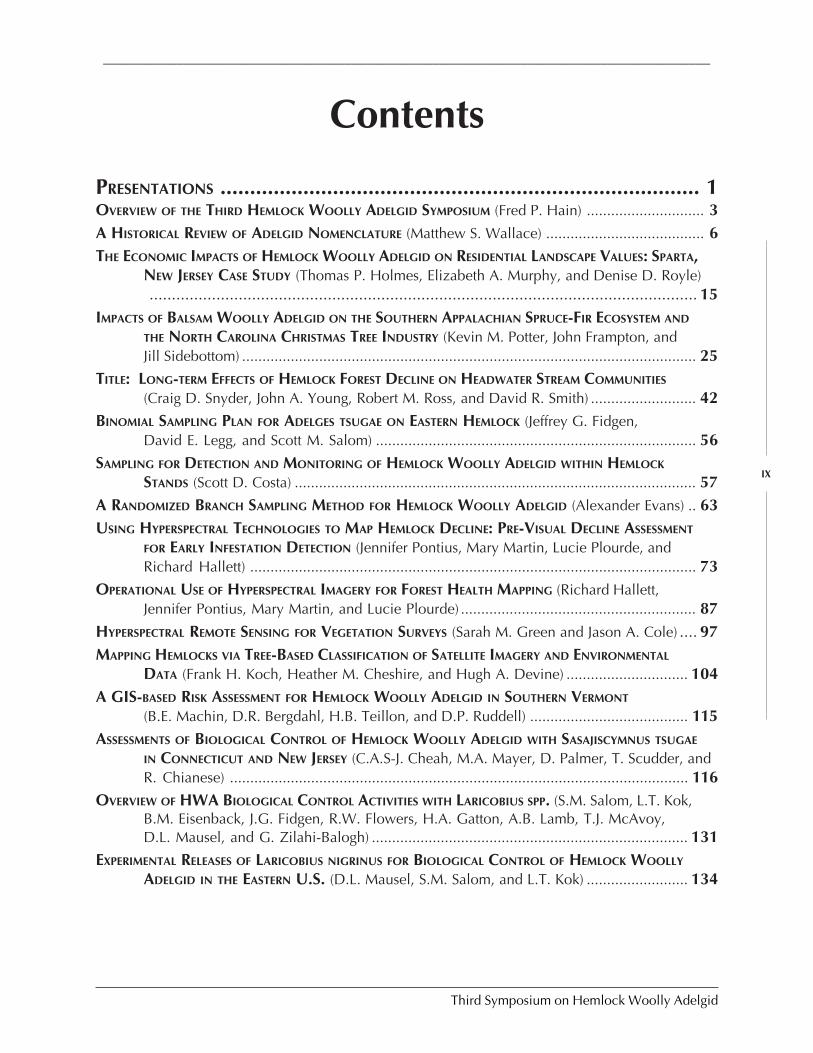
Contents
PRESENTATIONS ................................................................................. 1OVERVIEW OF THE THIRD HEMLOCK WOOLLY ADELGID SYMPOSIUM (Fred P. Hain) ............................. 3A HISTORICAL REVIEW OF ADELGID NOMENCLATURE (Matthew S. Wallace) ....................................... 6THE ECONOMIC IMPACTS OF HEMLOCK WOOLLY ADELGID ON RESIDENTIAL LANDSCAPE VALUES: SPARTA,
NEW JERSEY CASE STUDY (Thomas P. Holmes, Elizabeth A. Murphy, and Denise D. Royle)........................................................................................................................... 15
IMPACTS OF BALSAM WOOLLY ADELGID ON THE SOUTHERN APPALACHIAN SPRUCE-FIR ECOSYSTEM AND
THE NORTH CAROLINA CHRISTMAS TREE INDUSTRY (Kevin M. Potter, John Frampton, andJill Sidebottom) ................................................................................................................ 25
TITLE: LONG-TERM EFFECTS OF HEMLOCK FOREST DECLINE ON HEADWATER STREAM COMMUNITIES
(Craig D. Snyder, John A. Young, Robert M. Ross, and David R. Smith) .......................... 42BINOMIAL SAMPLING PLAN FOR ADELGES TSUGAE ON EASTERN HEMLOCK (Jeffrey G. Fidgen,
David E. Legg, and Scott M. Salom) ............................................................................... 56SAMPLING FOR DETECTION AND MONITORING OF HEMLOCK WOOLLY ADELGID WITHIN HEMLOCK
STANDS (Scott D. Costa) ................................................................................................... 57A RANDOMIZED BRANCH SAMPLING METHOD FOR HEMLOCK WOOLLY ADELGID (Alexander Evans) .. 63USING HYPERSPECTRAL TECHNOLOGIES TO MAP HEMLOCK DECLINE: PRE-VISUAL DECLINE ASSESSMENT
FOR EARLY INFESTATION DETECTION (Jennifer Pontius, Mary Martin, Lucie Plourde, andRichard Hallett) .............................................................................................................. 73
OPERATIONAL USE OF HYPERSPECTRAL IMAGERY FOR FOREST HEALTH MAPPING (Richard Hallett,Jennifer Pontius, Mary Martin, and Lucie Plourde) .......................................................... 87
HYPERSPECTRAL REMOTE SENSING FOR VEGETATION SURVEYS (Sarah M. Green and Jason A. Cole) .... 97MAPPING HEMLOCKS VIA TREE-BASED CLASSIFICATION OF SATELLITE IMAGERY AND ENVIRONMENTAL
DATA (Frank H. Koch, Heather M. Cheshire, and Hugh A. Devine) .............................. 104A GIS-BASED RISK ASSESSMENT FOR HEMLOCK WOOLLY ADELGID IN SOUTHERN VERMONT
(B.E. Machin, D.R. Bergdahl, H.B. Teillon, and D.P. Ruddell) ....................................... 115ASSESSMENTS OF BIOLOGICAL CONTROL OF HEMLOCK WOOLLY ADELGID WITH SASAJISCYMNUS TSUGAE
IN CONNECTICUT AND NEW JERSEY (C.A.S-J. Cheah, M.A. Mayer, D. Palmer, T. Scudder, andR. Chianese) ................................................................................................................. 116
OVERVIEW OF HWA BIOLOGICAL CONTROL ACTIVITIES WITH LARICOBIUS SPP. (S.M. Salom, L.T. Kok,B.M. Eisenback, J.G. Fidgen, R.W. Flowers, H.A. Gatton, A.B. Lamb, T.J. McAvoy,D.L. Mausel, and G. Zilahi-Balogh) .............................................................................. 131
EXPERIMENTAL RELEASES OF LARICOBIUS NIGRINUS FOR BIOLOGICAL CONTROL OF HEMLOCK WOOLLY
ADELGID IN THE EASTERN U.S. (D.L. Mausel, S.M. Salom, and L.T. Kok) ......................... 134
Third Symposium on Hemlock Woolly Adelgid
___________________________________________________________________________________
X
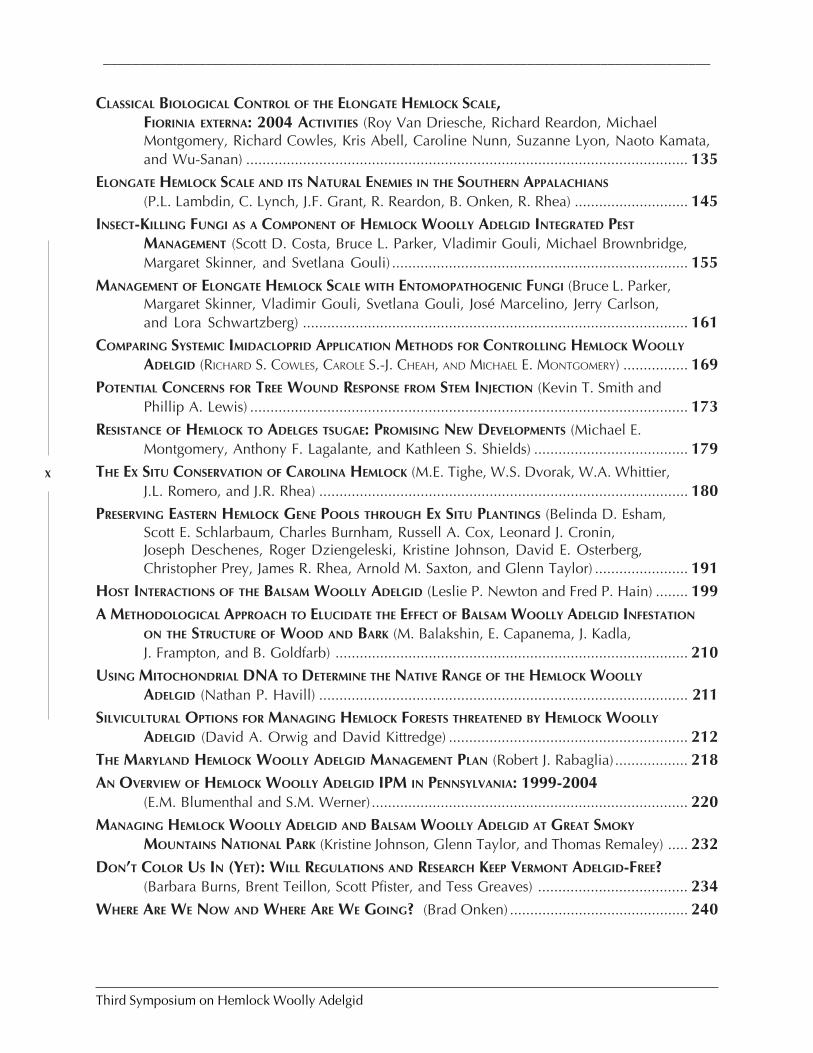
CLASSICAL BIOLOGICAL CONTROL OF THE ELONGATE HEMLOCK SCALE,FIORINIA EXTERNA: 2004 ACTIVITIES (Roy Van Driesche, Richard Reardon, MichaelMontgomery, Richard Cowles, Kris Abell, Caroline Nunn, Suzanne Lyon, Naoto Kamata,and Wu-Sanan) ............................................................................................................. 135
ELONGATE HEMLOCK SCALE AND ITS NATURAL ENEMIES IN THE SOUTHERN APPALACHIANS
(P.L. Lambdin, C. Lynch, J.F. Grant, R. Reardon, B. Onken, R. Rhea) ............................ 145INSECT-KILLING FUNGI AS A COMPONENT OF HEMLOCK WOOLLY ADELGID INTEGRATED PEST
MANAGEMENT (Scott D. Costa, Bruce L. Parker, Vladimir Gouli, Michael Brownbridge,Margaret Skinner, and Svetlana Gouli) ......................................................................... 155
MANAGEMENT OF ELONGATE HEMLOCK SCALE WITH ENTOMOPATHOGENIC FUNGI (Bruce L. Parker,Margaret Skinner, Vladimir Gouli, Svetlana Gouli, José Marcelino, Jerry Carlson,and Lora Schwartzberg) ............................................................................................... 161
COMPARING SYSTEMIC IMIDACLOPRID APPLICATION METHODS FOR CONTROLLING HEMLOCK WOOLLY
ADELGID (RICHARD S. COWLES, CAROLE S.-J. CHEAH, AND MICHAEL E. MONTGOMERY) ................ 169POTENTIAL CONCERNS FOR TREE WOUND RESPONSE FROM STEM INJECTION (Kevin T. Smith and
Phillip A. Lewis) ............................................................................................................ 173RESISTANCE OF HEMLOCK TO ADELGES TSUGAE: PROMISING NEW DEVELOPMENTS (Michael E.
Montgomery, Anthony F. Lagalante, and Kathleen S. Shields) ...................................... 179THE EX SITU CONSERVATION OF CAROLINA HEMLOCK (M.E. Tighe, W.S. Dvorak, W.A. Whittier,
J.L. Romero, and J.R. Rhea) ........................................................................................... 180PRESERVING EASTERN HEMLOCK GENE POOLS THROUGH EX SITU PLANTINGS (Belinda D. Esham,
Scott E. Schlarbaum, Charles Burnham, Russell A. Cox, Leonard J. Cronin,Joseph Deschenes, Roger Dziengeleski, Kristine Johnson, David E. Osterberg,Christopher Prey, James R. Rhea, Arnold M. Saxton, and Glenn Taylor) ....................... 191
HOST INTERACTIONS OF THE BALSAM WOOLLY ADELGID (Leslie P. Newton and Fred P. Hain) ........ 199A METHODOLOGICAL APPROACH TO ELUCIDATE THE EFFECT OF BALSAM WOOLLY ADELGID INFESTATION
ON THE STRUCTURE OF WOOD AND BARK (M. Balakshin, E. Capanema, J. Kadla,J. Frampton, and B. Goldfarb) ....................................................................................... 210
USING MITOCHONDRIAL DNA TO DETERMINE THE NATIVE RANGE OF THE HEMLOCK WOOLLY
ADELGID (Nathan P. Havill) ........................................................................................... 211SILVICULTURAL OPTIONS FOR MANAGING HEMLOCK FORESTS THREATENED BY HEMLOCK WOOLLY
ADELGID (David A. Orwig and David Kittredge) ........................................................... 212THE MARYLAND HEMLOCK WOOLLY ADELGID MANAGEMENT PLAN (Robert J. Rabaglia) .................. 218AN OVERVIEW OF HEMLOCK WOOLLY ADELGID IPM IN PENNSYLVANIA: 1999-2004
(E.M. Blumenthal and S.M. Werner) .............................................................................. 220MANAGING HEMLOCK WOOLLY ADELGID AND BALSAM WOOLLY ADELGID AT GREAT SMOKY
MOUNTAINS NATIONAL PARK (Kristine Johnson, Glenn Taylor, and Thomas Remaley) ..... 232DON’T COLOR US IN (YET): WILL REGULATIONS AND RESEARCH KEEP VERMONT ADELGID-FREE?
(Barbara Burns, Brent Teillon, Scott Pfister, and Tess Greaves) ..................................... 234WHERE ARE WE NOW AND WHERE ARE WE GOING? (Brad Onken) ............................................ 240
Third Symposium on Hemlock Woolly Adelgid
___________________________________________________________________________________
XI
POSTERS ...................................................................................... 245EFFECTS OF SYSTEMIC INSECTICIDES, A GROWTH REGULATOR, AND OIL ON ELONGATE HEMLOCK SCALE
AND ASSOCIATED NATURAL ENEMIES ON EASTERN HEMLOCK (R.G. Ahern, M.J. Raupp, andStacey R. Bealmear) ..................................................................................................... 247
BIOLOGICAL CONTROL OF THE HEMLOCK WOOLLY ADELGID IN THE SOUTHERN APPALACHIANS
(Christopher Asaro, C. Wayne Berisford, Michael E. Montgomery, James Rhea, andJim Hanula) ................................................................................................................... 248
INVESTIGATING GENETIC RESISTANCE OF TSUGA TO HEMLOCK WOOLLY ADELGID (S.E. Bentz,A.M. Townsend, Robert J. Griesbach, and Margaret R. Pooler) ..................................... 252
IDENTIFICATION OF PREDATORY INSECTS AND SPIDERS IN SASAJISCYMNUS TSUGAE REARING BOXES
(LayLa Burgess) ............................................................................................................ 254THE NATURE CONSERVANCY’S RESPONSE TO HWA (Faith T. Campbell) .......................................... 255MONITORING HEMLOCK VITALITY USING GROUND-BASED DIGITAL IMAGING (Neil A. Clark and
Sang-Mook Lee) ........................................................................................................... 262UPDATE ON REARING SASAJISCYMNUS TSUGAE AT THE CLEMSON INSECTARY AND FIELD MONITORING
OF THE FIRST RELEASE SITE (Hugh E. Conway and Joseph D. Culin) ................................. 269ARBORJET APPROACH AND USE OF STEM MICRO-INFUSION TREATMENTS FOR THE MANAGEMENT OF
SPECIFIC INSECT PESTS AND PHYSIOLOGICAL DISEASES IN FOREST, LANDSCAPE AND PLANTATION
TREES (Joseph J. Doccola, Peter M. Wild, Eric J. Bristol, and Joseph Lojko).................... 276EFFECTS OF SYSTEMIC, SUBLETHAL DOSES OF IMIDACLOPRID ON TWO PREDATORS OF HEMLOCK WOOLLY
ADELGID (Brian M. Eisenback, Jeffrey G. Fidgen, Scott M. Salom and Loke T. Kok) ..... 278CHANGES IN ANT COMMUNITY STRUCTURE AND COMPOSITION ASSOCIATED WITH HEMLOCK DECLINE
IN NEW ENGLAND (Aaron M. Ellison, Jonathan Chen, David Díaz, Chelsea Kammerer-Burnham, and Matthew Lau) ........................................................................................ 280
COMPETITIVE INTERACTIONS AMONG TWO BIOLOGICAL CONTROL AGENTS OF HEMLOCK WOOLLY
ADELGID AND AN ESTABLISHED GENERALIST PREDATOR IN SOUTHWESTERN VIRGINIA
(Robbie W. Flowers, Scott M. Salom, and Loke T. Kok) ................................................ 290HEMLOCK ECOSYSTEMS AND SPATIAL PATTERNS OF ADELGES TSUGAE INFESTATION IN NORTHWESTERN
NORTH CAROLINA (James Graham, Gary Walker, Ray Williams, Zack Murrell, andArthur Rex) ................................................................................................................... 293
ASSESSMENT OF EGG RELEASES FOR ESTABLISHMENT OF SASAJISCYMNUS TSUGAE ON EASTERN HEMLOCK
(Jerome F. Grant, Daniel Palmer, James R. “Rusty” Rhea, Glenn Taylor, Paris L. Lambdin,and Isaac Deal) ............................................................................................................ 297
PRELIMINARY ASSESSMENT OF THE COLD TOLERANCE OF LARICOBIUS NIGRINUS, A WINTER-ACTIVE
PREDATOR OF THE HEMLOCK WOOLLY ADELGID FROM WESTERN CANADA (Leland M. Humbleand Linda Mavin) .......................................................................................................... 304
THE EFFECTS OF HWA OUTBREAKS ON ECOSYSTEM LEVEL CHANGES IN SOUTHERN NEW ENGLAND
(Sultana Jefts and David Orwig) ................................................................................... 305EVAULATION OF MICROSATELLITE MARKERS IN FRASER FIR (ABIES FRASERI) (S. Josserand, J.A. Bowen,
K. Potter, J. Frampton, C.D. Nelson) .............................................................................. 307
Third Symposium on Hemlock Woolly Adelgid
___________________________________________________________________________________
XII
HEMLOCK WOOLLY ADELGID RESEARCH AT THE COWEETA HYDROLOGIC LABORATORY (J.D. Knoepp,J.M. Vose, K.J. Elliott, B.D. Clinton, C.R. Ford, and B.D. Kloeppel) ................................ 308
GUIDELINES FOR REARING LARICOBIUS NIGRINUS FENDER (A. B. Lamb, S.M. Salom, and L.T. Kok) . 309HWA RISK ASSESSMENT IN DEER WINTERING AREAS OF SOUTHERN VERMONT (Shane C. Lishawa) . 319IMPACT OF IMIDACLOPRID ON HEMLOCK WOOLLY ADELGID AND WATER QUALITY AT MT. LAKE, VIRGINIA
(Tom McAvoy, Warren T. Mays, Scott M. Salom, and Loke T. Kok) ............................... 324REPRODUCTIVE SUCCESS OF CYBOCEPHALUS SP. NR. NIPPONICUS ENRODY-YOUNGA ON ELONGATE
HEMLOCK SCALE, FIORINIA EXTERNA FERRIS (Deepak Matadha, Mark Mayer,James Lashomb, George Hamilton, Thomas Dorsey, and Robert Chianese) ................. 335
MASS RELEASE AND RECOVERY OF CYBOCEPHALUS SP. NR. NIPPONICUS ON ELONGATE HEMLOCK SCALE,FIORINIA EXTERNA FERRIS (Mark Mayer, Thomas Dorsey, Daniel Palmer,Robert Chianese, and Lauren Bronhard) ....................................................................... 336
MONITORING HEMLOCK CROWN HEALTH IN DELAWARE WATER GAP NATIONAL RECREATIONAL AREA
(Michael E. Montgomery, Bradley Onken, and Richard A. Evans) ................................ 346MANAGEMENT OF HWA AND RESTORATION OF HEMLOCK HEALTH (Richard C. Pais and
David Demko) .............................................................................................................. 349GROWTH AND SURVIVAL OF HEMLOCK WOOLLY ADELGID ON THE NORTHERN FRONTIER (Annie Paradis
and Joe Elkinton) ........................................................................................................... 351DEVELOPMENT OF A MICROSATELLITE LIBRARY FOR THE EASTERN HEMLOCK, TSUGA CANADENSIS
(Kristine Playfoot and Rocky Ward) .............................................................................. 352THE EFFECTS OF HEMLOCK WOOLLY ADELGID INFESTATION ON BREEDING POPULATIONS OF THREE
SPECIES OF EASTERN HEMLOCK DEPENDENT SONGBIRDS IN THE DELAWARE WATER GAP
NATIONAL RECREATION AREA (Beth A. Swartzentruber and Terry L. Master) ..................... 353WINTER MORTALITY IN ADELGES TSUGAE POPULATIONS IN 2003 AND 2004 (Kathleen S. Shields
and Carole A. S-J. Cheah) ............................................................................................. 354BACTERIAL ENDOSYMBIONTS OF ADELGES TSUGAE ANNAND: POTENTIAL TARGETS FOR BIOCONTROL?
(Kathleen S. Shields and Richard T. Hirth) .................................................................... 357STUDY OF THE UTILIZATION OPTIONS FOR DEAD AND DYING EASTERN HEMLOCK IN THE SOUTHERN
APPALACHIANS (Matthew F. Winn and Philip A. Araman) ................................................ 360
LIST OF ATTENDEES ........................................................................ 365

PRESENTATIONS

_____________________________________ Overview of the Third Hemlock Wooly Adelgid Symposium
Presentations Third Symposium on Hemlock Woolly Adelgid
3
OVERVIEW OF THE THIRD HEMLOCK WOOLLY ADELGID SYMPOSIUM
(INCLUDING BALSAM WOOLLY ADELGID AND ELONGATE HEMLOCK SCALE)
Fred P. Hain
Department of Entomology, North Carolina State University
ABSTRACT
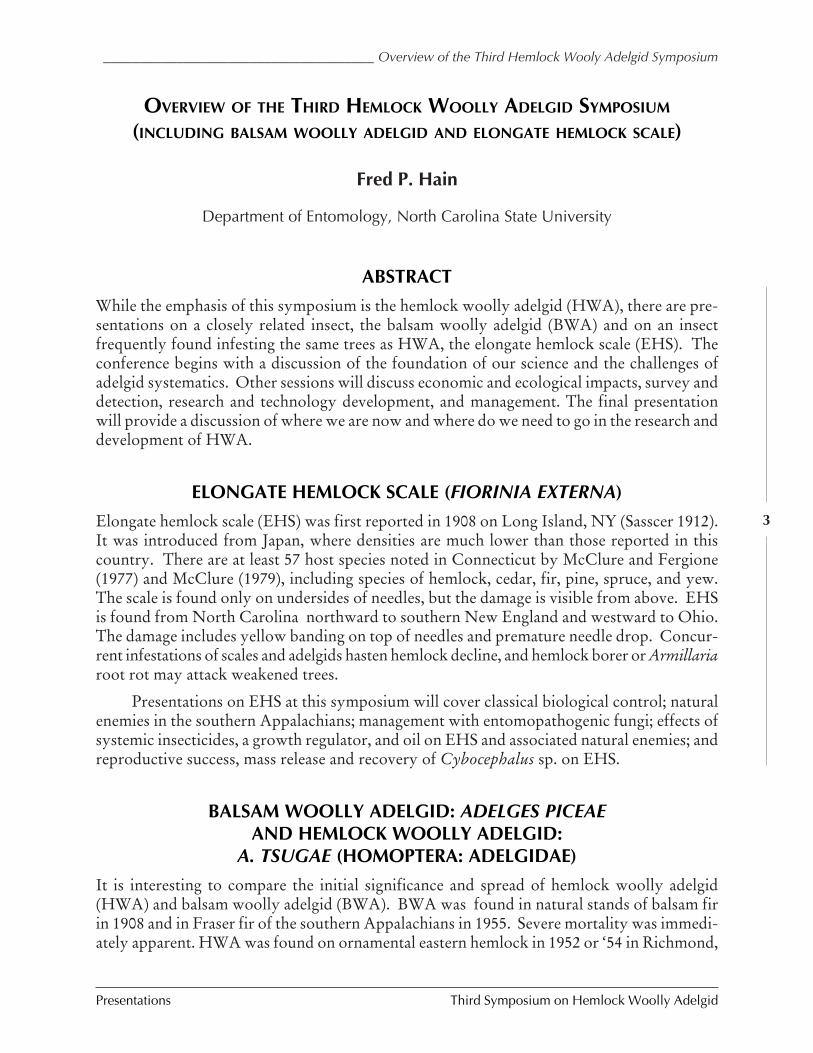
While the emphasis of this symposium is the hemlock woolly adelgid (HWA), there are pre-sentations on a closely related insect, the balsam woolly adelgid (BWA) and on an insectfrequently found infesting the same trees as HWA, the elongate hemlock scale (EHS). Theconference begins with a discussion of the foundation of our science and the challenges ofadelgid systematics. Other sessions will discuss economic and ecological impacts, survey anddetection, research and technology development, and management. The final presentationwill provide a discussion of where we are now and where do we need to go in the research anddevelopment of HWA.
ELONGATE HEMLOCK SCALE (FIORINIA EXTERNA)
Elongate hemlock scale (EHS) was first reported in 1908 on Long Island, NY (Sasscer 1912).It was introduced from Japan, where densities are much lower than those reported in thiscountry. There are at least 57 host species noted in Connecticut by McClure and Fergione(1977) and McClure (1979), including species of hemlock, cedar, fir, pine, spruce, and yew.The scale is found only on undersides of needles, but the damage is visible from above. EHSis found from North Carolina northward to southern New England and westward to Ohio.The damage includes yellow banding on top of needles and premature needle drop. Concur-rent infestations of scales and adelgids hasten hemlock decline, and hemlock borer or Armillariaroot rot may attack weakened trees.
Presentations on EHS at this symposium will cover classical biological control; naturalenemies in the southern Appalachians; management with entomopathogenic fungi; effects ofsystemic insecticides, a growth regulator, and oil on EHS and associated natural enemies; andreproductive success, mass release and recovery of Cybocephalus sp. on EHS.
BALSAM WOOLLY ADELGID: ADELGES PICEAEAND HEMLOCK WOOLLY ADELGID:
A. TSUGAE (HOMOPTERA: ADELGIDAE)
It is interesting to compare the initial significance and spread of hemlock woolly adelgid(HWA) and balsam woolly adelgid (BWA). BWA was found in natural stands of balsam firin 1908 and in Fraser fir of the southern Appalachians in 1955. Severe mortality was immedi-ately apparent. HWA was found on ornamental eastern hemlock in 1952 or ‘54 in Richmond,
Third Symposium on Hemlock Woolly Adelgid Presentations
Hain ________________________________________________________________________________________
4
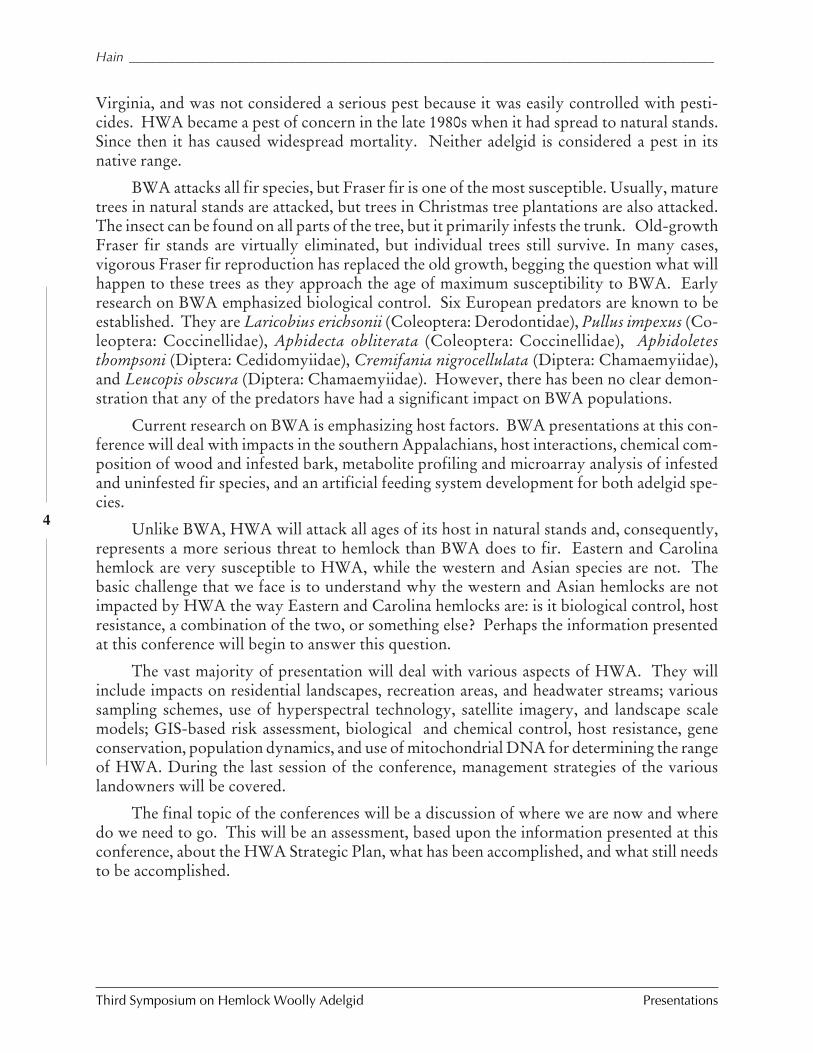
Virginia, and was not considered a serious pest because it was easily controlled with pesti-cides. HWA became a pest of concern in the late 1980s when it had spread to natural stands.Since then it has caused widespread mortality. Neither adelgid is considered a pest in itsnative range.
BWA attacks all fir species, but Fraser fir is one of the most susceptible. Usually, maturetrees in natural stands are attacked, but trees in Christmas tree plantations are also attacked.The insect can be found on all parts of the tree, but it primarily infests the trunk. Old-growthFraser fir stands are virtually eliminated, but individual trees still survive. In many cases,vigorous Fraser fir reproduction has replaced the old growth, begging the question what willhappen to these trees as they approach the age of maximum susceptibility to BWA. Earlyresearch on BWA emphasized biological control. Six European predators are known to beestablished. They are Laricobius erichsonii (Coleoptera: Derodontidae), Pullus impexus (Co-leoptera: Coccinellidae), Aphidecta obliterata (Coleoptera: Coccinellidae), Aphidoletesthompsoni (Diptera: Cedidomyiidae), Cremifania nigrocellulata (Diptera: Chamaemyiidae),and Leucopis obscura (Diptera: Chamaemyiidae). However, there has been no clear demon-stration that any of the predators have had a significant impact on BWA populations.
Current research on BWA is emphasizing host factors. BWA presentations at this con-ference will deal with impacts in the southern Appalachians, host interactions, chemical com-position of wood and infested bark, metabolite profiling and microarray analysis of infestedand uninfested fir species, and an artificial feeding system development for both adelgid spe-cies.
Unlike BWA, HWA will attack all ages of its host in natural stands and, consequently,represents a more serious threat to hemlock than BWA does to fir. Eastern and Carolinahemlock are very susceptible to HWA, while the western and Asian species are not. Thebasic challenge that we face is to understand why the western and Asian hemlocks are notimpacted by HWA the way Eastern and Carolina hemlocks are: is it biological control, hostresistance, a combination of the two, or something else? Perhaps the information presentedat this conference will begin to answer this question.
The vast majority of presentation will deal with various aspects of HWA. They willinclude impacts on residential landscapes, recreation areas, and headwater streams; varioussampling schemes, use of hyperspectral technology, satellite imagery, and landscape scalemodels; GIS-based risk assessment, biological and chemical control, host resistance, geneconservation, population dynamics, and use of mitochondrial DNA for determining the rangeof HWA. During the last session of the conference, management strategies of the variouslandowners will be covered.
The final topic of the conferences will be a discussion of where we are now and wheredo we need to go. This will be an assessment, based upon the information presented at thisconference, about the HWA Strategic Plan, what has been accomplished, and what still needsto be accomplished.
_____________________________________ Overview of the Third Hemlock Wooly Adelgid Symposium
Presentations Third Symposium on Hemlock Woolly Adelgid
5
REFERENCES
McClure, M.S. 1979. Spatial and seasonal distribution of disseminating stages of Fioriniaexterna (Homoptera: Diaspididae) and natural enemies in a hemlock forest. Environ.Entomol. 8:869-873.
McClure, M.S. and M.B. Fergione. 1977. Fiorinia externa and Tsugaspidiotus tsugae(Homoptera: Diaspididae): Distribution, abundance, and new hosts of two destructivescale insects of eastern hemlock in Connecticut. Environ. Entomol. 6:807-811.
Sasscer, E.R. 1912. The genus Fiorinia in the United States. USDA Bureau of Entomol.Tech. Serv. 16:75-82.
Third Symposium on Hemlock Woolly Adelgid Presentations
Wallace _____________________________________________________________________________________
6
A HISTORICAL REVIEW OF ADELGID NOMENCLATURE
Matthew S. Wallace
Department of Biological Sciences, East Stroudsburg University200 Prospect Street
East Stroudsburg, PA 18301-2999
ABSTRACT
Adelgids are known worldwide as pests of various conifers. Despite their pest status, thenomenclature of adelgids is in a state of disarray. Different classification schemes aboundworldwide making information retrieval and communication among biologists, foresters, andtaxonomists tedious and difficult. Historically, different adelgid workers have accepted ei-ther a two-genus or a multiple-genus system (or variations of each). Phylogenetic analyses ofthis small family of insects may help bring clarity to the situation.
KEYWORDS
Adelgids, Adelgidae, Hemiptera, taxonomy, nomenclature.
INTRODUCTION
Adelgids (Hemiptera: Sternorrhyncha: Adelgidae), the pine and spruce aphids, are small, soft-bodied insects that feed exclusively on coniferous plants using piercing-sucking mouthparts.Adelgids are primarily Holarctic in distribution (although found worldwide if counting ex-otic introductions), and 50 species have been described (Carter 1971 and Foottit and Richards1993). According to Foottit and Richards (1993), the distribution of adelgids mirrors closelythe distribution of spruce, a primary to exclusive host to many adelgids.
Adelgids are considered by many workers to be the most primitive members of theaphidoid group of insects (Ghosh 1983), having arisen in the Carboniferous when coniferoustrees dominated the landscape. They are separated from aphids (in a strict sense) by theabsence of cornicles, short antennal segments, reduced wing venation, a glandular body sur-face, and oviparity in both parthenogenetic and sexual forms (Carter 1971 and Ghosh 1983).Adelgids are differentiated from phylloxerans, their closest relatives, by a distinct chitinousovipositor, separated CuA and CuP veins, four to five abdominal spiracles, antennae withthree to five segments, and winged forms having three large sensoria at the tips of the anten-nae (Annand 1928 and Stoetzel 1998). In addition, phylloxerans are only found on deciduoushosts (Stoetzel 1998). Wingless forms of adelgids usually secrete a dense woolly mass fromdorsal wax glands. This woolly mass surrounds the female and protects her and her eggsfrom various environmental elements. Like aphids, adelgids have extremely complex life
________________________________________________ A Historical Review of Adelgid Nomenclature
Presentations Third Symposium on Hemlock Woolly Adelgid
7
cycles involving different hosts (usually spruce) and alternation of sexual and parthenoge-netic generations (Stoetzel 1998).
Numerous adelgid species, most notably the balsam woolly adelgid, Adelges piceaeRatzeburg, the hemlock woolly adelgid, Adelges tsugae Annand, and the pine woolly adelgid,Pineus pini Linnaeus, have attained pest status around the world. The two former specieshave become destructive pests in the United States causing widespread host mortality (McClure1987 and Wallace and Hain 2000). As a result of these threats, numerous studies in recentyears have examined the potential effectiveness of various adelgid natural enemies for use inbiological control, particularly for the hemlock woolly adelgid (Cheah and McClure 1996and 1998, Zilahi-Balogh et al. 2003).
Despite their importance as pests, there exists a great deal of instability and difference ofopinion in adelgid nomenclature and taxonomy. Different workers around the world usevarious classification systems at all taxonomic levels, with the exception of the species group.Even the author and date of the family name is ambiguous. The continued use of differentnames for adelgids worldwide makes retrieval of information and communication amongapplied researchers and forest managers tedious.
Unfortunately, it is very difficult to regulate many of the different classification schemesvia the International Code of Zoological Nomenclature (1999), as the choice of a scheme islargely based on “taxonomic license” and personal preference (Blackman and Eastop 1984).At its heart, the problem comes down to whether one agrees with the lumping of adelgidspecies into two genera or splitting them into more than two genera. Due to their importanceas economic and ecological pests worldwide, universal acceptance of appropriate names foradelgids at all levels—species group, genus group, and family group—should have a highpriority. Furthermore, before detailed searches and examinations of the effectiveness of po-tential natural enemies of pest adelgid species can take place, it is important to know the nameof the adelgid they feed on.
This report reviews the two major published generic classifications of adelgids. It isimportant to understand the history of classification and why authors chose the names theydid in order to make sense of what is happening today.
REVIEW OF CLASSIFICATION SCHEMES
Traditionally, there have been two classification schemes of adelgid genera used world-wide: the North American/Great Britain two-genus system and the German (and others)multiple-genus system. The formation of these two classifications is the result of each systemfocusing on different morphological characters from various life stages to distinguish taxa.The primary difference between them is that the two-genus system distinguishes genera pri-marily on the number of abdominal spiracles in adults while the German system relies on themorphology of the first instar nymphs of the sistens stage (Annand 1928). There have beenmodifications to both systems over time, but workers worldwide citing adelgid names haveprimarily used one of the former schemes.
Third Symposium on Hemlock Woolly Adelgid Presentations
Wallace _____________________________________________________________________________________
8
Along with the different generic name systems, the use of adelgid family group nameshas varied. Workers have frequently created new family level classifications over time withfew of them being accepted universally. Adelgid biologists today use interchangeably thesuperfamily names Adelgoidea (Dolling 1991), Phylloxeroidea (Heie 1980, 1987, and 1999;Heie and Pike 1992; Foottit and Richards 1993; and Maddison 1998), and Aphidoidea(Blackman and Eastop 1994 and Stoetzel 1998). The use of different superfamily names mayadd to the confusion in adelgid nomenclature, but most workers agree that placing adelgids ineither Aphidoidea or Phylloxeroidea is acceptable: it is simply a question of preference.
Although workers have disagreed on what genus, tribe, subfamily, family, and super-family to place adelgids in, they have for the most part agreed on the species names. Forexample, Dreyfusia piceae Ratzeburg, 1843, and Adelges piceae Ratzeburg, 1843, are two dif-ferent generic names used by different workers for the same species.
GENERIC CLASSIFICATION SCHEMES
The first mention of adelgids was by the Dutch botanist Clusius in 1853 when he madeobservations on galls, although the genus Chermes was erected by Linnaeus (1756) (Annand1928). The family group name Adelginae is attributed to Annand (1928). The first majortaxonomic workers of adelgids were the Russian entomologist Cholodkovsky (1896) and theGerman entomologist Börner (1908), both of whom made valuable and independent contri-butions to adelgid biology in the discovery of alternate hosts and in taxonomy (Annand 1928and Carter 1971).
One of the first major monographs on adelgid taxonomy was by Börner in 1908 (Annand1928). Börner placed adelgids in the family Chermesiden and superfamily Aphidoidea. Amajor theme in this work was his disagreement with Cholodkovsky’s definition of how taxo-nomic species should be separated. Börner believed that species should be separated by mor-phological differences rather than relying heavily on their biological differences. Subsequently,Börner synonymized many species (combined many species into one) based on morphologi-cal differences of the nymphal stages. He used chaetotaxy of head and thorax sclerites andgland features of 1st instar nymphs to differentiate adelgid genera (Shaposhnikov 1964).
Börner (1928) modified his existing classification by listing adelgids in the familyAdelgidae. Heie (1980), although citing the year 1930, gives credit to Börner for the author-ship of the family name Adelgidae from Börner’s 1928 publication. Börner, along with hiscounterparts, stopped using the name Chermesidae (or variations thereof) at that time due toconfusion with the use of a similar name for psyllids. Adelgidae, according to Börner, in-cluded the subfamilies Pineinae and Adelginae. Adelginae had two tribes: Dreyfusiini andAdelgini. Pineinae contained Pineus Shimer, 1867, and Pineodes Börner, 1926 (new genus).Dreyfusia Börner, 1908, and Aphrastasia Börner, 1909, were included in the tribe Dreyfusiini.The genera Cholodkovskya Börner, 1909; Adelges Vallot, 1836 (senior synonym ofCnaphalodes Macquart, 1843); Gilletteella Börner, 1928 (new genus); and Sacchiphantes Curtis,1844, were included in the tribe Adelgini. Of noted absence was the genus Chermes Linnaeus,
________________________________________________ A Historical Review of Adelgid Nomenclature
Presentations Third Symposium on Hemlock Woolly Adelgid
9
1756, which Börner also stopped using, similar to the family name Chermesidae. He subse-quently assigned the species in this former genus to new genera, current genera, and the rein-stated genus Sacchiphantes (type species Chermes abietis L.)(Börner 1928). This work wouldprovide the foundation for all subsequent adelgid classifications that followed the multiple-genus classification.
Annand (1928) described the biology and taxonomy of the North American adelgids. Itwas the first work to adopt the two-genus system using Adelges and Pineus. In his work,adelgids are listed in the subfamily Adelginae (formerly Chermesinae) of the superfamilyAphidoidea and family Phylloxeridae. Annand likely placed adelgids in the phylloxeran fam-ily due to their close physical resemblance and similar biology (Carter 1971). Annand be-lieved that the genus Pineus should stand by itself, similar to Börner. However, Annandcombined the remaining current genera in Börner’s classification into the genus Adelges.Adelges Vallot, 1936, is the oldest name of all adelgid genera and therefore has priority inzoological nomenclature (Article 23.1, International Code for Zoological Nomenclature 1999).Annand used the number of spiracles on the adult female abdomen (five pairs in Adelges, fourpairs in Pineus) to distinguish the two genera. He stated that Pineus was likely derived fromAdelges citing the greater number of abdominal spiracles in Adelges as evidence of a primitivecharacter (Annand 1928).
Annand believed Börner had separated genera based on species-level characters result-ing, in his opinion, in the reduction of genus to a rank equivalent to species. He also thoughtthat the genus was an artificial group often based on subjective characters but at the same timea valid phylogenetic entity existing in nature and having definable characters that separated itfrom other such groups. According to Annand, by creating numerous genera for a similarnumber of species, Börner had lessened the practical value of the genus group taxon and itssignificance in elucidating evolutionary relationships (Annand 1928). Furthermore, Annanddetermined that some of Börner’s characters were not applicable to all adelgid life stages. Forexample, Börner based the genus Cnaphalodes on the fused cephalic and prothoracic platesand the absence of glands in the first instar nymph of the sistens generation. However, thesecharacters are not relevant to the progrediens stage. Annand believed generic characters shouldbe based on adult characteristics and rarely nymphal characters. He largely based his “lump-ing” of adelgids into two genera, Adelges and Pineus, on these beliefs.
FURTHER CLASSIFICATIONS
Following the publications of these two major workers, most taxonomic works onadelgids did not follow Annand’s recent work (Silvestri 1939, Börner 1944, Börner and Heinze1957, Heinze 1961, Shaposhnikov 1964, and Steffan 1968). Most workers followed Börner’sclassification or a variation of his scheme. The reason for this is unclear; it could have beendue to workers not knowing about his work, not accepting it, or thinking it was only appli-cable to North American genera.
Third Symposium on Hemlock Woolly Adelgid Presentations
Wallace _____________________________________________________________________________________
10
In 1965, the confusion associated with Chermes and higher-level uses of the name wasput to rest by the International Commission for Zoological Nomenclature. According to aruling by the Commission (International Commission for Zoological Nomenclature, Opin-ion 731, 1955), the generic name Chermes Linnaeus, 1758, and the family group nameChermides Fallen, 1814, were declared invalid due to the confusion associated with their dualuse with psyllid insects. This would make any subsequent use of these names in the literatureinvalid. Apparently, adelgid workers like Annand and Börner realized the confusion longbefore the Commission did—both stopped using these names in their 1928 works. Never-theless, many other adelgid workers did not (Silvestri 1939 and Bodenheimer and Swirski1957).
Carter’s manuscript (1971) on the conifer woolly aphids in Britain was the first to rec-ognize and use the two-genus system of classifying adelgids since Annand (1928). Carterplaced the Adelgidae in the superfamily Aphidoidea as Börner did. Like Annand, Carterbelieved adelgids should be placed into either Pineus or Adelges based on the number ofabdominal spiracles of the adult. Carter subsequently reduced in rank all of Börner’s generato subgenera within Adelges and Pineus and used characters from the antennae (shape, length,and characteristics of the sensoria) and abdominal spiracles of the winged forms to help dis-tinguish adelgid genera.
A few other aphidoid taxonomists have supported Annand and Carter’s classificationfor a number of reasons (Ilharco and van Harten 1987 and Blackman and Eastop 1994). Theybelieved that the separation of Adelgidae by Börner into numerous genera was based on veryslight differences (i.e., differences more appropriate for species) and that splitting of taxa intonumerous lower groups created greater confusion. Foottit and Richards (1993) provideddescriptions and a key for Canadian adelgids, using the two-genus system of Adelges andPineus. They stated that, although current European classifications may have merit, theypreferred the two-genus system of North America and Great Britain. They said to apply theEuropean system to the North American adelgids “would require extensive revision.”
USE OF NAMES TODAY
Unfortunately, classification of adelgids above the species level has become a questionof preference (Blackman and Eastop 1984). There has been little consistency in the adelgidnomenclature; recent and past publications on adelgid biology and taxonomic publicationshave used the various higher-level classification systems interchangeably. Most Europeanauthors have used, and continue to use, Börner’s generic classification (Eichhorn 1989, Alles1994, Roversi and Binazzi 1996, Dragan 1999, and Sato 1999). Eichhorn (1968 and 1969),however, used the genus name Adelges in various publications. Nonetheless, Carter’s andAnnand’s generic classification is followed by many aphid biologists today (Blackman andEastop 1984 and 1994, Heie 1999), by most adelgid applied biologists in the New World(McClure 1987, Cheah and McClure 1996 and 1998, Soria et al. 1996, Wallace and Hain 2000,and Zilahi-Balogh et al. 2003; also see this proceedings), and some in the Old World(Szklarzewicz et al. 2000).
________________________________________________ A Historical Review of Adelgid Nomenclature
Presentations Third Symposium on Hemlock Woolly Adelgid
11
DISCUSSION: CAN THERE BE STABILITY IN THIS SYSTEM?
The use of different classification systems at the generic level in the family Adelgidaecontinues to present day. It has become a problem of personal taxonomic license; just be-cause someone publishes synonymies of certain taxa, it doesn’t mean that everyone will fol-low it. Comparing figures and descriptions of 1st instar nymphs shows that the species enti-ties that each system describe are the same (Annand 1928, Shaposhnikov 1964, and Carter1971), as discussed previously in this paper. Dreyfusia piceae Ratzeburg in Börner’s work isthe same species as Adelges piceae Ratzeburg in Annand’s work. Where the classificationsdisagree is how they should be classified at the generic level.
Consistent classification of adelgids has most likely been hampered by the inherent dif-ficulty in describing the morphological variation in the group and the complexity of their lifecycle. Misidentifications of adelgid species are very common in the literature. Researchers atfirst may have encountered only one stage of the life cycle and named it as a new speciesunaware of the other life stages. It is therefore important to thoroughly document the biol-ogy of the adelgid species in question before assigning it a new name. Furthermore, differentadelgid species use the same host at the same time of year, making it even more of a challengeto distinguish species (Annand 1928). As pointed out by many authors (Annand 1928, Carter1971, and Foottit and Richards 1993) different adelgid workers have historically disagreed onwhat are the informative generic characters for the family. Instability is also a problem in thisfamily because the ratio of workers to adelgid species is so high (Foottit and Richards 1993).Therefore the number of opinions created via taxonomic license is substantial.
Unfortunately, the confusion in adelgid classification is not unique to this family. Peoplearound the world tend to study the taxa unique or endemic to their region, often creating adifferent classification than their peers around the world. These differences are likely due topoor communication among workers and poor means of information retrieval in isolatedareas. Often, workers will also tend to focus on species level problems while ignoring higherlevel classification. The need for rigorous phylogenetic analyses which sample taxa from allregions and that take into account the worldwide fauna is very important in standardizing aclassification that most workers will follow.
With the recent revolution in molecular phylogenetic techniques, it is now possible tocollect and use two kinds of data in phylogenetic analyses: molecular and morphological.The only way to determine which and how many genera the 50 species should group into isby performing a rigorous phylogenetic analysis, preferably using both types of data collec-tion, on all adelgid species. Morphological analyses should include characters from immaturesand all stages and body regions of the adults. Species that cluster together at the tips of aphylogenetic tree are thereby taken as the most closely related. For example, if all the speciesin Adelges and Pineus clustered into two separate natural (monophyletic) groups respectively,it would support Annand and Carter’s reasoning that Adelgidae should be split into twonatural entities. If each of Börner’s genera, with their respective species, clustered separatelywithin the analysis, it would lend support Börner’s multiple genus system. If however, twospecies within Dreyfusia were to fall out on opposite ends of the tree, it would be evidencethat Dreyfusia was not a natural group.
Third Symposium on Hemlock Woolly Adelgid Presentations
Wallace _____________________________________________________________________________________
12
It is important for this systematic research on Adelgidae to continue. Numerous pestadelgids threaten the well-being of forest ecosystems around the world. In order for taxono-mists, applied adelgid biologists, and forest managers to communicate, formulate manage-ment plans, and attempt to solve these problems, they should all be using the same names.
ACKNOWLEDGMENTS
I would like to thank Fred P. Hain for providing me the original “idea” for this manuscript. Iwould also like to thank Manya B. Stoetzel for reviewing an earlier version.
REFERENCES
Alles, D. 1994. Untersuchungen zum generationszyklus der tannenlaus Dreyfusianordmannianae Eckstein (Homoptera: Adelgidae) in Mitteleuropa. Journal of AppliedEntomology 117(3):234-242.
Annand, P.N. 1928. A contribution toward a monograph of the Adelginae (Phylloxeridae)of North America. Stanford University Publication University Series Biological Science6(1):1-146.
Blackman, R.L. and V.F. Eastop. 1984. Aphids on the World’s Crops: an Identification andInformation Guide. Chichester (West Sussex), New York, Wiley. viii + 987 p.
Blackman, R.L. and V.F. Eastop. 1994. Aphids on the World’s Trees: an Identification andInformation Guide. CAB International (and The Natural History Museum),Wallingford. viii + 987 p.
Bodenheimer, F.S. and E. Swirski. 1957. The Aphidoidea of the Middle East. TheWeizmann Science Press of Israel, Jerusalem. 378 pp.
Börner, C.V. 1908. Eine Monographische Studie über die Chermiden. Arbeiten aus derKaiserlichen Biologischen Anstalt für Land- und Forstwirtschaft 6:81-318.
Börner, C.V. 1928. Beiträge zur einem neuen system der Blattläuse, pp. 115-194. In Archivfür klassifikatorische und phylogenetische entomologie, ed. G. Enderlein. Band I. Heft1. Enderlein, Klassifikation der Sarcophagiden. Wien.
Börner, C.V. 1944. III. Aphidoidea. In Fauna von Deutschland, Ein Bestimmungsbuchunserer heimischen Tierwelt, ed. P. Brohmer, pp. 206-220. Verlag von Quelle andMeyer, Leipzig. viii + 584 p.
Börner, C.V. and K. Heinze. 1957. Aphidina-Aphidoidea. In Handbuch derPflanzenkrankheiten, 2. Teil, 4. Lief. Homoptera II, ed. P. Sorauer, pp. 1-355. VerlagPaul Parey, Berlin. 577 p.
Carter, C.I. 1971. Conifer woolly aphids (Adelgidae) in Britain. Forestry CommissionBulletin. 42, 51 p.
________________________________________________ A Historical Review of Adelgid Nomenclature
Presentations Third Symposium on Hemlock Woolly Adelgid
13
Cheah, C. A.S-J. and M.S. McClure. 1996. Exotic natural enemies of Adelges tsugae andtheir potential for biological control. In Proceedings, First Hemlock Woolly AdelgidReview, 1995, Charlottesville, Virginia, ed. S. M. Salom, T. C. Tigner, and R. C. Reardon.FHTET 96-10. U.S. Department of Agriculture, Forest Service:89-102.
Cheah, C.A. S-J. and M.S. McClure. 1998. Life history and development ofPseudoscymnus tsugae (Coleoptera: Coccinellidae), a new predator of the hemlockwoolly adelgid (Homoptera: Adelgidae). Environmental Entomology 27 (6): 1531-1536.
Cholodkovsky, N. 1896. Beiträge zu einer Monographie der Coniferen-Läuse. ibid. 31.
Dolling, W.R. 1991. The Hemiptera. Natural History Museum Publications, Oxford Uni-versity Press, Oxford. ix + 274 p.
Dragan, G.I. 1999. On the bionomics of the silver woolly aphid Dreyfusia nordmannianae(Homoptera: Adelgidae). Vestnik Zoologii 33(6):53-62.
Eichhorn, V.O. 1968. Problems of the population dynamics of silver fir woolly aphids,Genus Adelges (=Dreyfusia), Adelgidae. Z. ang. Ent. 61:157-214.
Eichhorn, V.O. 1969. Investigations on woolly aphids of the genus Adelges An.(Homoptera: Adelgidae) and their predators in Turkey. Commonwealth Institute ofBiological Control, Technical Bulletin No. 12:83-103.
Eichhorn, V.O. 1989. Zum Generations- und Wirtswechsel der Fichtengallenläuse,Sacchiphantes spp. (Homoptera: Adelgidae). Journal of Applied Entomology 108:44-53.
Foottit, R. and W.R. Richards. 1993. The genera of Aphids of Canada (Homoptera:Aphidoidea and Phylloxeroidea). The Insects and Arachnids of Canada, Part 22. Centrefor Land and Biological Resources, Ottawa, Ontario, Research Branch, AgricultureCanada, Publication 1885. 766 p.
Ghosh, A.K. 1983. A review of the family Adelgidae from the Indian subregion(Homoptera: Aphidoidea). Oriental Insects 17:1-34.
Heie, O.E. 1980. The Aphidoidea (Hemiptera) of Fennoscandia and Denmark, I. Generalpart, the families Mindaridae, Hormaphididae, Thelaxidae, Anoeciidae, and Pemphigidae.Fauna Entomologica Scandinavica 9:1-236.
Heie, O.E. 1987. Paleontology and phylogeny, pp. 367-391. In Aphids: their biology,natural enemies, and control, Volume A, ed. A. K. Minks and P. Harrewijn. ElsevierScience Publishers. Amsterday, the Netherlands.
Heie, O.E. and E.M. Pike. 1992. New aphids in Cretaceous amber from Alberta (InsectHomoptera). Canadian Entomologist 124:1027-1053.
Heie, O.E. 1999. Annotated list of aphids recorded from Denmark (Hemiptera:Phylloxeroidea and Aphidoidea). Entomologiske Meddelelser 67:13-36.
Heinze, K. 1961. Pflanzenschädliche Blattlausarten der Familien Lachnidae, Adelgidae undPhylloxeridae, eine systematisch-faunistische Studie. Deutsche EntomologischeZeitschrift. N. F. Band 9, Heft I/II, Juni 1962, 143-227.
Third Symposium on Hemlock Woolly Adelgid Presentations
Wallace _____________________________________________________________________________________
14
International Code of Zoological Nomenclature. 1999. International Code of ZoologicalNomenclature Adopted by the International Union of Biological Sciences. The Interna-tional Trust for Zoological Nomenclature, c/o The Natural History Museum, London.xxix +306 p.
International Commission on Zoological Nomenclature. 1955. The Bulletin of ZoologicalNomenclature 22: Opinion 731.
Ilharco, F.A. and A. Van Harten. 1987. Systematics, pp. 1-76. In Aphids: their biology,natural enemies, and control, Volume A. ed. A. K. Minks and P. Harrewijn. ElsevierScience Publishers. Amsterdam, the Netherlands.
Linnaeus, C. 1756. Systema Naturae. 10th edition.
Maddison, D.R. 1998. The tree of life. http://phylogeny.arizona.edu/tree/phylogeny.html.
McClure, M.S. 1987. Biology and control of hemlock woolly adelgid. Bulletin of the Con-necticut Agricultural Experiment Station 851.
Roversi, P. F. and A. Binazzi. 1996. Life cycle of the Douglas-fir woolly aphid Gilletteellacoweni (Gillette) in central Italy (Homoptera: Adelgidae). Redia 79(2):241-245.
Sato, S. 1999. Galls on tiger-tail spruce made by Aphrastasia tsugae at Mt. Tsurugi. Gensei73:26.
Scklarzewicz, T., A. Wnek, and S.M. Bilinski . 2000. Structure of ovarioles in Adelgeslaricis, a representative of the primitive aphid family Adelgidae. Acta Zoologica 81:307-313.
Shaposhnikov, G. 1964. Suborder Aphidinea- Plant Lice, Volume 1, pp. 616-799. In Keysto the insects of the European USSR, ed. G. Y. Bei-Bienko.
Silvestri, F. 1939. Compendio di Entomologia Applicata (Agraria, Forestrale, Medica,Veterinaria) Portici (Aphidoidea, Vol. 1934, pp. 412-448; Vol. 1939, pp. 449-618).
Soria, S.; J.F. Carrascal, and P. Del Estal. 1996. Adelges (Guilletteella) cooleyi (Guillette) andPineus pini (Maquart), two conifer adelgids new to the Spanish fauna. Boletin de SanidadVegetal Plagas 22(1):37-43.
Steffan, A.W. 1968. Evolution und systematik der Adelgidae (Homoptera: Aphidina).Zoologica Heft 115:1-113.
Stoetzel, M.B. 1998. Antennal and other characters useful in identification of theAphidoidea (Homoptera). Proceedings of the Entomological Society of Washington100(3):589-593.
Wallace, M.S. and F.P. Hain. 2000. Field surveys and evaluation of native and establishedpredators of the hemlock woolly adelgid (Homoptera: Adelgidae). EnvironmentalEntomology 29(3):638-644.
Zilahi-Balogh, G.M.G., S.M. Salom, and L.T. Kok. 2003. Development and reproductivebiology of Laricobius nigrinus, a potential biological control agent of Adelges tsugae.BioControl (Dordrecht) 48(3):293-306.
_____________________ Economic Impacts of Hemlock Woolly Adelgid on Residential Landscape Values
Presentations Third Symposium on Hemlock Woolly Adelgid
15
THE ECONOMIC IMPACTS OF HEMLOCK WOOLLY ADELGID ON RESIDENTIAL
LANDSCAPE VALUES: SPARTA, NEW JERSEY CASE STUDY
Thomas P. Holmes1, Elizabeth A. Murphy2, and Denise D. Royle3
1 USDA Forest Service, Southern Research Station, Forestry Sciences Lab,PO Box 12254, Research Triangle Park, NC 27701
2 Oklahoma State University, Department of Economics and Legal Studies in Business,327 Spears School of Business, Stillwater, OK 74078
3 Virginia Polytechnic Institute and State University, College of Natural Resources,1900 Kraft Drive, Suite 250, Blacksburg, VA 24060
ABSTRACT
In this paper, we provide preliminary estimates of the impacts of the hemlock woolly adelgidon residential property values in Sparta, New Jersey, using the hedonic property value method.The literature on the aesthetic perceptions of forest landscapes is briefly reviewed to provideguidance in formulating economic hypotheses based on the assumption of an informativerelationship between forest aesthetics and economic value. The hedonic property value lit-erature regarding the ornamental and landscape value of trees is also reviewed. The empiricalresults show that healthy and lightly defoliated hemlocks contribute positive value to resi-dential properties, and that moderately defoliated hemlocks reduce property values. Value‘spillovers’, or externalities, are also observed where hemlock health has an impact not onlyon individual parcels containing hemlock resources, but also on neighboring property values.The implications of our results for forest managers are discussed.
INTRODUCTION
The hemlock woolly adelgid (HWA), Adelges tsugae, is an exotic insect causing severe de-cline and mortality to forests of eastern and Carolina hemlock (Tsuga canadensis, Tsugacaroliniana Engelm.) throughout their geographical range. The HWA is currently establishedin 15 eastern states from Georgia to Maine and is perceived as a threat to the remaining stateswith eastern and Carolina hemlock resources. Hemlocks play a unique role in eastern forestlandscapes. Accordingly, the loss and damage of hemlocks may potentially result in enor-mous ecological impacts that may be similar to the dramatic decline of eastern hemlock for-ests approximately 4,800 years ago (Orwig and Foster 1998).
The economic impacts of the spread of the HWA have not been systematically quanti-fied. Quantification of the economic damages due to HWA is important for a variety ofreasons. First, overall estimates of these impacts may be used by policy-makers to justifyexpenditures on control or mitigation of HWA. Second, detailed information on the spatialdistribution of these impacts may assist policy makers in determining how and where funds
Third Symposium on Hemlock Woolly Adelgid Presentations
Holmes et al. _________________________________________________________________________________
16
should be allocated to the management of this forest pest. Contrasting these economic im-pacts with the costs of control allows for policy-makers to evaluate management actions andto establish priorities in terms of targeting control efforts.
It is hypothesized that economic damages from HWA may be large because hemlockforests provide a variety of ecosystem services that are valued by people. Ecosystem servicesderived from hemlock forests include the protection of riparian habitat supporting coldwaterspecies such as trout, the aesthetic value of old growth hemlock stands, particularly on publicland where trees may exceed 500 years of age, and the aesthetic value of ornamental and nativehemlocks in private residential landscapes. The research reported here examines the eco-nomic impact of changes in the health of hemlock stands on the value of residential land-scapes.
The economic valuation of landscape aesthetics is in a formative stage. However, if it isassumed that aesthetic values uncovered in psychological studies of human preferences forlandscape characteristics are related to economic values, then the scientific literature regard-ing what is known about the aesthetic perception of landscapes can provide guidance in thespecification and interpretation of economic models.
In the next section of this paper, we review and summarize the scientific literature re-garding what is known about the perception of scenic beauty of forest stands and, in particu-lar, how changes in forest health may impact forest aesthetics. Then we review the literatureon the economic valuation of the arboreal landscape, which has been focused primarily at theparcel level scale, but which recently has come to include the larger landscape scale. Next, wedescribe the data obtained for a case study of the impact of changes in hemlock health on thevalue of residential properties in a township in northern New Jersey that has experiencedsevere hemlock mortality resulting from HWA infestations. In the subsequent section weprovide an empirical analysis of how hemlock health has impacted private property values inthis township. Finally, we present a summary of our findings and present the implicationsfor forest policy and management.
AESTHETIC PERCEPTION OF FOREST LANDSCAPES
The primary approach to studying the relationship between forest landscapes and aestheticperceptions is based on psycho-physical methods. These methods seek to identify quantita-tive relationships between a visual stimulus (often using photographs) and a perceptual re-sponse. A widely used psycho-physical model is the scenic beauty estimation (SBE) method,as pioneered by Daniel and Boster (1976). This method typically uses linear regression meth-ods to isolate the impact of singular forest attributes on perceptions of scenic beauty. Ribe(1989) provides a good overall review of research on the aesthetics of forestry and forestmanagement, particularly what has been learned using psycho-physical methods.
The perception of what constitutes a scenic landscape may be traced back to antiquityand, in its most primitive form, has been suggested to reflect Arcadian pastoral idylls that seeka peaceful balance between raw nature and human influence (Parsons and Daniel 2002). Someresearchers have hypothesized that aesthetic landscape preferences result from human evolu-
_____________________ Economic Impacts of Hemlock Woolly Adelgid on Residential Landscape Values
Presentations Third Symposium on Hemlock Woolly Adelgid
17
tion in savanna environments, leading to preferences for landscape elements conferring op-portunities for prospect and refuge—that is, the ability to see but not be seen. This perspec-tive is exemplified by prescriptions for silvicultural practices that create well-lit, park-likeforest environments (Brush 1976).
Among the factors influencing the aesthetic perception of forest landscapes, a few areparticularly relevant for our analysis. First, a number of studies have found that species di-versity can increase scenic beauty (Cook 1972, Daniel and Schroeder 1979, Brown and Daniel1984). Because hemlocks are typically a relatively minor species in forest composition, theirpresence contributes to the visual diversity of forest landscapes. Thus, we would anticipatethat, if a monotonic relationship exists between scenic beauty and economic value, the pres-ence of healthy hemlock trees would increase private property values. Conversely, if hem-lock mortality induces the regeneration of more common species, such as black birch (Betulalenta) and other hardwoods (Orwig and Foster 1998, Kizlinski et al. 2002), we would antici-pate that loss of the hemlock component would decrease property values.
Second, psycho-physical research has shown that aesthetic perceptions of forests areinfluenced by forest health. Buhyoff and Leuschner (1978) found that people disliked standsdamaged by southern pine beetle (Dendroctonus frontalis) and that scenic preference valuesdecreased more precipitously when they were informed about the source of the damage.Further, they estimated that the scenic impacts of insect damage increased rapidly up to about10 percent of the visual area, above which additional damage had a relatively small impact onscenic preference. Similar results were obtained in a later replication of the experiment(Buhyoffet al. 1980). These studies suggest that a conservative estimate of economic lossesfrom HWA can be obtained by considering a 10 percent increase in hemlock decline, and thislevel of change is used in the computations below.
Finally, it is noteworthy that Brush (1979), in a study of the perceptions of forest land-owners in Massachusetts for twenty different forest sites, found that old hemlock stands wererated, on average, above all other sites for scenic beauty. Thus, hemlocks may possess uniquescenic attributes not shared by other species.
ECONOMIC VALUE OF ORNAMENTAL TREES AND FOREST LANDSCAPES
A number of methods are available for estimating the economic impacts of changes in foresthealth, including the contingent valuation method, the averting behavior method, and thehedonic property value method. The contingent valuation method asks people how muchthey are willing to pay for changes in environmental quality, and a good review of the appli-cation of this method to forest health problems is contained in the study by Kramer et al.(2003). The averting behavior method investigates how much money homeowners actuallyspend for protection of environmental attributes. This method has been applied to analysisof gypsy moth protection programs by Moeller et al. (1977).
The hedonic property value method uses linear regression to estimate the empirical rela-tionship between real estate prices and environmental attributes after controlling for a suite ofrelevant housing attributes. This method is methodologically similar to psycho-physical
Third Symposium on Hemlock Woolly Adelgid Presentations
Holmes et al. _________________________________________________________________________________
18
measures of landscape amenities where preference ratings or rankings are replaced by prices.Although the hedonic property value model is useful for estimating the private benefits ofenvironmental attributes, the method relies upon market prices for value inference. Otherdimensions of economic value that are not revealed by market prices, such as the value ofecosystem services to future generations, cannot be estimated using hedonic valuation meth-ods.
An early study of this type was conducted by Morales et al. (1976), who examined 60“comparable” houses in three neighborhoods in Manchester, Connecticut. They found thatgood tree cover added an average of about 6 percent to the property value. Anderson andCordell (1988) examined the relationship between the presence of front yard trees and prop-erty values of single-family houses in Athens, Georgia, and found that trees in the front yardincreased housing prices by roughly 3-5 percent relative to houses without trees. Dombrow,et al. (2000) investigated the contribution of mature trees to the market value of single-familyhomes in Baton Rouge, Louisiana, and found that that mature trees contributed about 2 per-cent to housing values.
A recent innovation in conducting hedonic property value studies is to use remote sens-ing data derived from satellite imagery. Geoghegan et al. (1997) used GIS data to test thehypothesis that the value of land parcels in residential areas is affected by the pattern of sur-rounding land uses. Using data obtained within a 30-mile radius of Washington, D.C., theyfound that people in residential areas care about landscape features such as open space, land-scape diversity, and fragmentation. Further, they found that landscape context matters: thatis, the degree to which landscape features are capitalized into property values depends onwhether parcels are located in a highly developed area, a suburban area, or a relatively ruralarea. Paterson and Boyle (2002) examined how property prices in a relatively rural area ofConnecticut (Simsbury and Avon) are affected by the extent of different land use patternswithin a 1-kilometer radius around each property. They found that people enjoy the ameni-ties associated with nearby forestlands, but prefer views of other types of cover, as a view oftoo much forest could lead to a feeling of being “closed-in.” A study by Mansfield et al.(2002) in the Research Triangle Park region of North Carolina used a “greenness” index forforest cover to evaluate the importance of tree cover on property values in this rapidly urban-izing area. Their results showed that houses closer to institutional and private forests hadgreater sales prices and that parcels with a larger proportion of forest cover also had a highervalue.
We were only able to identify one study that used the hedonic price model to examinethe economic losses to residential property value from tree mortality caused by insect damage(Payne and Strom 1975). The valuation method employed was indirect in that it used thehedonic property value technique to estimate a relationship between the number of trees on alot and the value of the lot. Then, using this information, estimated losses were simulated forvarying degrees of potential tree loss from gypsy moth. The method is limited in that it doesnot directly estimate the impact of gypsy moth mortality on property value, and it does notconsider the lost value from trees that are unsightly or unhealthy as a consequence of gypsymoth infestations.
_____________________ Economic Impacts of Hemlock Woolly Adelgid on Residential Landscape Values
Presentations Third Symposium on Hemlock Woolly Adelgid
19
CASE STUDY DATA – SPARTA, NEW JERSEY
In this paper, we report a hedonic property value analysis for the town of Sparta, in SussexCounty, New Jersey Murphy 2005). The 39-square-mile township is located in the north-western New Jersey highlands and has a population of 17,500. The area is know for its manylake communities and is located 45 miles from New York City. Housing data were obtainedfrom the town clerk of Sparta, New Jersey, and a data set was compiled by an independentcomputing firm. The raw data had 5,108 house sale records over the period 1970 to 2003.After cleaning the raw data, there were 3,379 usable observations. Available in the data weresales prices and the date each residential property was sold. Structural housing characteristicscollected for the hedonic estimation include: square footage of living area, number of bed-rooms, number of bathrooms, the size of the parcel in acres, the year the house was built, andwhether the basement and/or attic had been finished. Digital tax parcel maps for Sparta wereprovided by the township’s engineering office. Among the salient housing characteristics,the average sale price was $382,180 (adjusted to constant 2002 dollars), and the average lotsize was just under 1 acre.
Environmental variables were constructed for each individual parcel and three differentspatial scales around each parcel centroid. These variables include measurements of hemlockhealth change, as well as land cover types, publicly owned open space, golf courses, and waterbodies. Various spatial buffers around parcel centroids were examined to investigate the rela-tionship between landscape features and property values across spatial scales. In particular, itis hypothesized that environmental amenities found on any particular parcel will “spillover”and influence the value of neighboring parcels. As there does not seem to be any consensus inprevious spatial hedonic studies as to what buffer zone radius to use, a range of distances werechosen for analysis: 0.1 km, 0.5 km and 1.0 km from the parcel centroid. Land cover vari-ables were measured as the number of pixels falling within individual parcels and respectivespatial buffers and then converted to proportions of the total number of pixels within thosemeasurement units.
The environmental variables were created at the Center for Remote Sensing and SpatialAnalysis, Rutgers University. Landsat satellite data were used to create the environmentalvariables used in this analysis. The level of resolution was 30m, so classification of hemlockland cover does not represent individual trees, but rather represents hemlock stands. Royleand Lathrop (1997 and 2002) previously used Landsat imagery and change detection tech-niques to model and map hemlock canopy condition for over 8,000 ha of hemlock standsthroughout northern New Jersey for the years 1984, 1992, 1994, 1996, 1998, and 2001. Asubset of these data was used in the hedonic property value analysis for Sparta. Four hemlockhealth classes were created: (1) a combination of healthy and lightly defoliated hemlocks (lessthan 25 percent defoliation), (2) moderately defoliated hemlocks (25-50 percent defoliation),(3) severely defoliated hemlocks (50-75 percent defoliation), and (4) dead hemlocks (greaterthan 75 percent defoliation).
In general, hemlock stands in Sparta were patchily distributed and constituted about 3percent of the land area. Although most hemlock stands are thought to have been healthy in1984, the health of hemlock stands declined rapidly during the 1990s. In 1998, only about 30
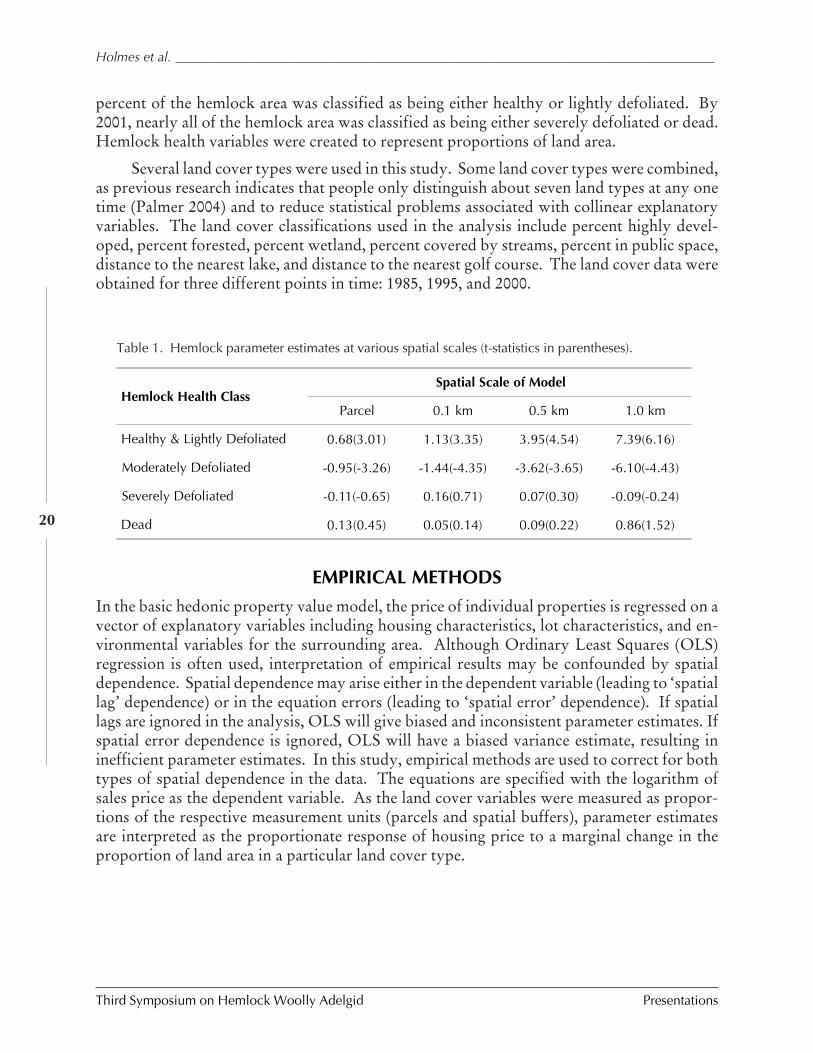
Third Symposium on Hemlock Woolly Adelgid Presentations
Holmes et al. _________________________________________________________________________________
20
percent of the hemlock area was classified as being either healthy or lightly defoliated. By2001, nearly all of the hemlock area was classified as being either severely defoliated or dead.Hemlock health variables were created to represent proportions of land area.
Several land cover types were used in this study. Some land cover types were combined,as previous research indicates that people only distinguish about seven land types at any onetime (Palmer 2004) and to reduce statistical problems associated with collinear explanatoryvariables. The land cover classifications used in the analysis include percent highly devel-oped, percent forested, percent wetland, percent covered by streams, percent in public space,distance to the nearest lake, and distance to the nearest golf course. The land cover data wereobtained for three different points in time: 1985, 1995, and 2000.
EMPIRICAL METHODS
In the basic hedonic property value model, the price of individual properties is regressed on avector of explanatory variables including housing characteristics, lot characteristics, and en-vironmental variables for the surrounding area. Although Ordinary Least Squares (OLS)regression is often used, interpretation of empirical results may be confounded by spatialdependence. Spatial dependence may arise either in the dependent variable (leading to ‘spatiallag’ dependence) or in the equation errors (leading to ‘spatial error’ dependence). If spatiallags are ignored in the analysis, OLS will give biased and inconsistent parameter estimates. Ifspatial error dependence is ignored, OLS will have a biased variance estimate, resulting ininefficient parameter estimates. In this study, empirical methods are used to correct for bothtypes of spatial dependence in the data. The equations are specified with the logarithm ofsales price as the dependent variable. As the land cover variables were measured as propor-tions of the respective measurement units (parcels and spatial buffers), parameter estimatesare interpreted as the proportionate response of housing price to a marginal change in theproportion of land area in a particular land cover type.
Table 1. Hemlock parameter estimates at various spatial scales (t-statistics in parentheses).
Hemlock Health ClassSpatial Scale of Model
Parcel 0.1 km 0.5 km 1.0 km
Healthy & Lightly Defoliated 0.68(3.01) 1.13(3.35) 3.95(4.54) 7.39(6.16)
Moderately Defoliated -0.95(-3.26) -1.44(-4.35) -3.62(-3.65) -6.10(-4.43)
Severely Defoliated -0.11(-0.65) 0.16(0.71) 0.07(0.30) -0.09(-0.24)
Dead 0.13(0.45) 0.05(0.14) 0.09(0.22) 0.86(1.52)
_____________________ Economic Impacts of Hemlock Woolly Adelgid on Residential Landscape Values
Presentations Third Symposium on Hemlock Woolly Adelgid
21
RESULTS
The spatial dependence regression models fit the data well, and the R2 values were roughly 68percent for each of the four models we estimated. Estimates for the hemlock parameters areshown in Table 1. The other parameter estimates in the models are not shown to simplify thepresentation.
The parameter estimates for healthy and lightly defoliated hemlocks were statisticallysignificant at greater than the 1-percent level at all spatial scales and show that healthy hem-lock stands contribute positive economic value to property values in our study area. Al-though we cannot be certain of the reason that healthy hemlocks confer positive values toresidential properties, this result is consistent with findings from the scenic beauty literaturethat species/ structural diversity is a valued component of forest aesthetics. This result is alsoconsistent with the findings reported by Brush (1979) that hemlocks have a special aestheticappeal.
The significance of the parameter estimates in the spatial buffer models indicates thepresence of ‘spillover’ effects (or ‘externalities’). Healthy hemlocks on any particular parcelconvey value not only to that parcel but also to other parcels in the neighborhood. Thisspillover effect is also observed for moderately defoliated hemlocks: moderate hemlock de-cline decreases property values both for the parcel and for lots in a rather large radius aroundthe damaged parcel.
It is important to understand the interpretation of the magnitude of the parameter esti-mates. Due to the way that the model was specified (recall that the dependent variable is thelogarithm of housing price and hemlock variables are measured as proportions), the param-eter estimates show the proportionate change in housing price in response to a proportionatechange in the hemlock variables. Thus, a one percent increase (or decrease) in the area ofhealthy hemlock increases (or decreases) housing price by about 0.7 percent. Similarly, a onepercent increase (or decrease) in the area of moderately defoliated hemlocks decreases (orincreases) housing price by about 0.95 percent. The similarity in the value of the parameterestimates for healthy/lightly defoliated stands compared with the (absolute value of the) pa-rameter estimates for moderately defoliated stands across all spatial scales indicates that theloss of healthy hemlocks is approximately equal to the gain in unhealthy hemlocks.
An estimate of economic damages to houses at risk can be obtained by calibrating theparameter estimates shown in Table 1 for the relevant area in each of the spatial scales. Parcelsclassified as containing moderately defoliated hemlock pixels had, on average, about 20 per-cent of their land area in this land cover classification. In comparison, parcels classified ascontaining moderately defoliated hemlock pixels within 1 km had, on average, about 1 per-cent of their land area in this classification. Thus a 1 percent increase in the area of moderatelydefoliated hemlocks at the parcel level would change the relevant average area in this landcover type from 20 to 21 percent. This represents a 5 percent increase in the relevant averagearea (1 out of 20). Using this frame of reference, a 1 percent increase in the area of moderatelydefoliated hemlock within 1 km of a parcel nearly doubles the relevant average area (1-2
Third Symposium on Hemlock Woolly Adelgid Presentations
Holmes et al. _________________________________________________________________________________
22
percent). Given this perspective, a 10 percent increase in the relevant average area of moder-ately defoliated hemlocks at the parcel level (20-22 percent) reduces property value by about$7,261 per house at risk. A 10 percent increase in the relevant average area of moderatelydefoliated hemlock within 1 km of a parcel (1-1.1 percent) reduces property value by about$2,331 per house at risk. Although the reduction in property value is lower for houses in theneighborhood of damaged parcels, as would be expected, there are a greater number of housesat risk in the neighborhood.
It is somewhat surprising that the parameter estimates for severely defoliated and deadhemlocks were not statistically significant. This might be explained by a number of reasons.Because hemlocks in the study area tend to grow in discrete patches and because areas expe-riencing moderate defoliation tend to be located close to areas with severe defoliation anddead trees, the absence of statistical significance may be due to the statistical problem ofmulticollinearity. This effect may be compounded by the relatively few observations in eachof the hemlock health classes.
DISCUSSION
In this study, we have used remote sensing techniques, concepts drawn from both the land-scape ecology and the forest landscape aesthetics literature, and economic theory and meth-ods to estimate the economic impacts of HWA on property values. This research has allowedus to provide the first estimates of economic damage to private landowners resulting fromthis exotic pest. We emphasize that these damage estimates are valid for a single housingmarket, and it is not obvious how they can be directly applied to other areas. However, if theresults found in our study area are typical of other regions experiencing hemlock decline,then the total economic damages to property owners in the eastern U.S. may be very large. Amore definitive assessment of how typical our study results are of damages in other regionswould require replication of the procedures described here in other housing markets.
Results of our case study make it very clear that forest managers need to either preventinfestations by HWA altogether or to manage stands in such a fashion that they only becomelightly defoliated in order to prevent economic losses to property values. As our resultsshow, economic damages begin to occur when stands become moderately defoliated (25-50percent defoliation). Although hemlocks may be able to survive many years of moderatedecline, particularly in regions where cold winters reduce HWA populations, maintainingstands in these conditions can result in economic losses to residential property values.
While the costs and efficacy of biological control strategies for the HWA are not yetknown with precision, the presence of landscape-level externalities suggests that the forma-tion of neighborhood or community groups to combat this insect may be a viable strategy toprotect housing values in this and similar markets. This sort of complementary group re-sponse would seem to work particularly well for the case of hemlock resource owners, be-cause the resource is often patchily distributed. Further research should be conducted todetermine the viability of HWA control strategies that would take advantage of spatial pat-terns of resources at risk that could capitalize on complementary group behavior at the neigh-borhood or community level.
_____________________ Economic Impacts of Hemlock Woolly Adelgid on Residential Landscape Values
Presentations Third Symposium on Hemlock Woolly Adelgid
23
ACKNOWLEDGMENTS
The authors would like to acknowledge the support for this research provided by WesNettleton, Rusty Rhea, Brad Onken, and others in the USDA Forest Service. We would alsolike to acknowledge the helpful reviews of this paper provided Dr. Robert Huggett, Jr. andDr. Kathleen Bell. Of course, all remaining errors are the responsibility of the authors.
REFERENCES
Anderson, L. M. and H.K. Cordell. 1988. Influence of trees on residential property valuesin Athens, Georgia (U.S.A.): a survey based on actual sales prices. Landscape and UrbanPlanning 15:153-164.
Brown, T.C. and T.C. Daniel. 1984. Modeling forest scenic beauty: concepts and applica-tion to ponderosa pine. Research Paper RM-256. USDA Forest Service, Rocky Moun-tain Research Station, Fort Collins, Colorado.
Brush, R.O. 1979. The attractiveness of woodlands: perception of forest landowners inMassachusetts. Forest Science 25:495-506.
Brush, R.O. 1976. Spaces within the woods: Managing forests for visual enjoyment.Journal of Forestry 74:744-747.
Buhyoff, G.J. and W.A. Leuschner. 1978. Estimating psychological disutility from dam-aged forest stands. Forest Science 24:424-432.
Buhyoff, G.J., W.A. Leuschner, and L.K. Arndt. 1980. Replication of a scenic preferencefunction. Forest Science 26:227-230.
Cook, W.L., Jr. 1972. An evaluation of the aesthetic value of forest trees. Journal ofLeisure Research 4:293-302.
Daniel, T.C. and R.S. Boster. 1976. Measuring landscape esthetics: the scenic beautyestimation method. Research Paper RM-167. USDA Forest Service, Rocky MountainResearch Station, Fort Collins, Colorado.
Daniel, T.C. and H. Schroeder. 1979. Scenic beauty estimation model: predicting per-ceived beauty of forest landscapes. In Our National Landscape. Gen. Tech. Rep. PSW-35. USDA Forest Service, Pacific Southwest Research Station, Berkeley, California.
Dombrow, J. M. R. and C. F. Sirmans. 2000. The market value of mature trees in single-family housing markets. The Appraisal Journal 68:39-43.
Geoghegan, J., L.A. Wainger, and N.E. Bockstael. 1997. Spatial landscape indices in ahedonic framework: and ecological economics analysis using GIS. Ecological Economics23:251-264.
Kizlinski, M.L., D.O. Orwig, D.O., R.C. Cobb, and D.R. Foster. 2002. Direct and indi-rect ecosystem consequences of an invasive pest on forests dominated by eastern hem-lock. Journal of Biogeography 29:1489-1503.
Third Symposium on Hemlock Woolly Adelgid Presentations
Holmes et al. _________________________________________________________________________________
24
Kramer, R.A., T.P. Holmes, and M. Haefele. 2003. Contingent valuation of forest ecosys-tem protection. In Forests in a market economy, ed. E.O. Sills and K.L. Abt. Dordrect,The Netherlands, Kluwer Academic Publishers. Pp. 303-320.
Mansfield, C.A., S.K. Pattanayak, W. McDow, R. McDonald, and P. Halpin. 2002. Shadesof green: measuring the value of urban forests in the housing market” Working Paper,Research Triangle Institute, Durham, North Carolina.
Moeller, G.H., R.L. Marler, R.E. McCay, and W.B. White. 1977. Economic analysis of thegypsy moth problem in the Northeast: III. Impacts on homeowners and managers ofrecreation areas. Research Paper NE-360. USDA Forest Service, Northeast Area,Newtown Square, Pennsylvania.
Morales, D., B.N. Boyce, and R.J. Favretti. 1976. The contribution of trees to residentialproperty value: Manchester, Connecticut. Valuation October/November:26-43.
Murphy, E.A. 2005. Economic Impact of the Hemlock Woolly Adelgid on ResidentialProperty Values. Unpublished Ph.D. dissertation, North Carolina State University,Raleigh, North Carolina.
Orwig, D.A. and D.R. Foster. 1998. Forest response to the introduced hemlock woollyadelgid in Southern New England, USA. Journal of the Torrey Botanical Society 125:60-73.
Palmer, J.F. 2004. Using spatial metrics to predict scenic perception in a changing land-scape: Dennis, Massachusetts. Landscape and urban Planning 69:201-218.
Parsons, R., T.C. Daniel. 2002. Good looking: in defense of scenic landscape aesthetics.Landscape and Urban Planning 60:43-56.
Paterson R. W. and K.J. Boyle. 2002. Out of sight, out of mind? Using GIS to incorporatevisibility in hedonic property value models. Land Economics 78:417-425.
Payne, B. R. and S. Strom. 1975. The contribution of trees to the appraised value of unim-proved residential land. Valuation October/November:36-45.
Ribe, R.G. 1989. The aesthetics of forestry: what has empirical preference research taughtus? Environmental Management 13:55-74.
Royle, D.D. and R.G. Lathrop. 2002. Discriminating Tsuga canadensis hemlock forestdefoliation using remotely sensed change detection. Journal of Nematology 34:213-221.
Royle, D. D. and R.G. Lathrop. 1997. Monitoring hemlock forest health in New Jerseyusing Landsat TM data and change detection techniques. Forest Science 43:327-335.
______________________ Impacts of Balsam Woolly Adelgid in Southern Appalachia and North Carolina
Presentations Third Symposium on Hemlock Woolly Adelgid
25
IMPACTS OF BALSAM WOOLLY ADELGID ON THE SOUTHERN APPALACHIAN
SPRUCE-FIR ECOSYSTEM AND THE NORTH CAROLINA CHRISTMAS TREE INDUSTRY
Kevin M. Potter, John Frampton, and Jill Sidebottom
Department of Forestry and Environmental Resources,North Carolina State University, Raleigh, NC 27695
ABSTRACT
The balsam woolly adelgid, an exotic aphid-like insect from Europe, has wreaked consider-able ecological havoc on the boreal red spruce-Fraser fir ecosystem endemic to the SouthernAppalachians. During the last 50 years, the adelgid has decimated the Fraser fir stands thatexist on a handful of island-like high-elevation ridge systems, and has imposed significanteconomic costs on the regionally important Christmas tree industry. The virtual eliminationof mature fir trees from their natural stands has altered the plant and animal communitiesunique to the red spruce-Fraser fir forest type. While firs appear to have regenerated wellsince the initial wave of adelgid-caused mortality, it is unclear whether future infestations willoccur and, if they do, how they will impact the species. A mathematical model indicates thatFraser fir populations may be large enough, and the species’ life cycle long enough, to avoidthe extensive loss of genetic diversity over time unless the populations experience regularlyrepeated adelgid infestations. Work is under way to identify and propagate Fraser firs resis-tant to adelgid infestation and to conserve the existing genetic diversity of the species. Theseactivities could allow for the eventual reintroduction of firs into their native stands, shouldsuch an effort become necessary.
KEYWORDS
Balsam woolly adelgid, Fraser fir, ecosystem, impact, genetic conservation.
INTRODUCTION
The high-elevation red spruce-Fraser fir forests of North Carolina, Tennessee, and Virginiatogether encompass a unique boreal ecosystem endemic to the southeastern United States.Never very extensive, this forest type has been reduced by poor forest management practices,and could face elimination as a result of global climate change. Currently, the most seriousthreat to its continued existence, however, is an insect that measures less than a millimeter inlength – the balsam woolly adelgid (Adelges piceae Ratz.). During the last 50 years, this exoticinvader from Europe has decimated mature natural stands of Fraser fir (Abies fraseri [Pursh]Poir.), causing significant changes to the spruce-fir ecosystem. It has also posed problems forNorth Carolina’s $100 million annual Christmas tree industry, which relies almost entirelyon plantation-grown Fraser fir.
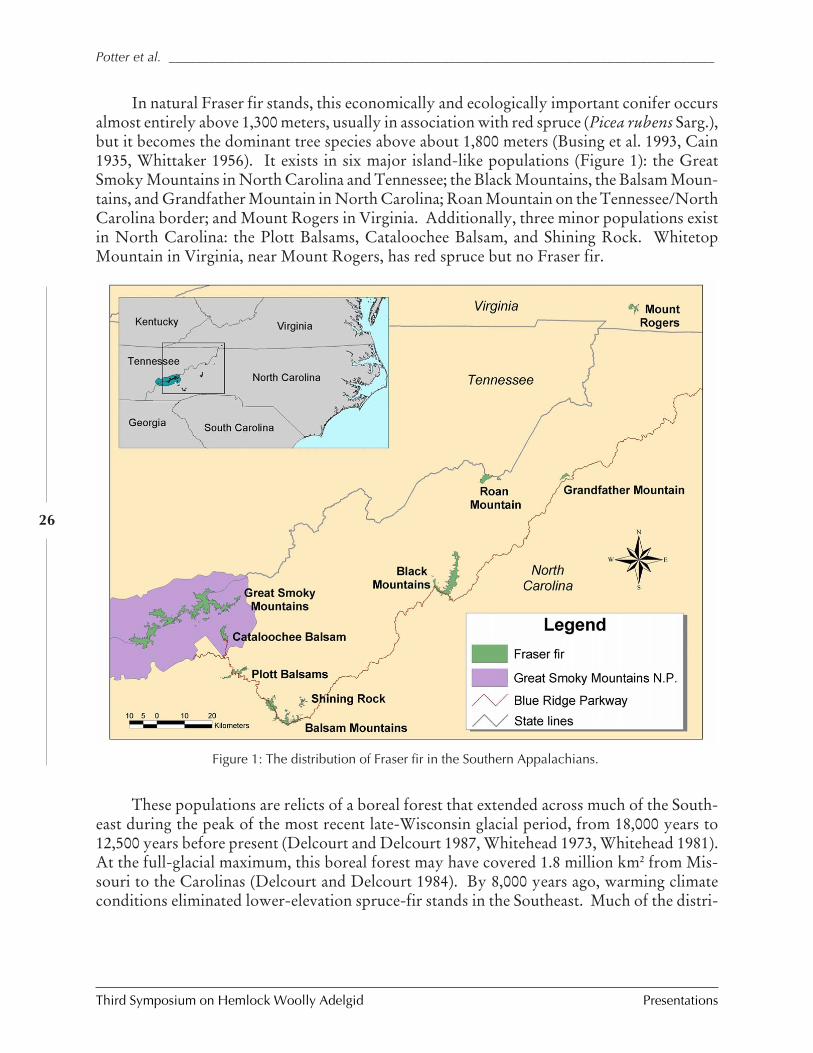
Third Symposium on Hemlock Woolly Adelgid Presentations
Potter et al. __________________________________________________________________________________
26
In natural Fraser fir stands, this economically and ecologically important conifer occursalmost entirely above 1,300 meters, usually in association with red spruce (Picea rubens Sarg.),but it becomes the dominant tree species above about 1,800 meters (Busing et al. 1993, Cain1935, Whittaker 1956). It exists in six major island-like populations (Figure 1): the GreatSmoky Mountains in North Carolina and Tennessee; the Black Mountains, the Balsam Moun-tains, and Grandfather Mountain in North Carolina; Roan Mountain on the Tennessee/NorthCarolina border; and Mount Rogers in Virginia. Additionally, three minor populations existin North Carolina: the Plott Balsams, Cataloochee Balsam, and Shining Rock. WhitetopMountain in Virginia, near Mount Rogers, has red spruce but no Fraser fir.
These populations are relicts of a boreal forest that extended across much of the South-east during the peak of the most recent late-Wisconsin glacial period, from 18,000 years to12,500 years before present (Delcourt and Delcourt 1987, Whitehead 1973, Whitehead 1981).At the full-glacial maximum, this boreal forest may have covered 1.8 million km2 from Mis-souri to the Carolinas (Delcourt and Delcourt 1984). By 8,000 years ago, warming climateconditions eliminated lower-elevation spruce-fir stands in the Southeast. Much of the distri-
Figure 1: The distribution of Fraser fir in the Southern Appalachians.
______________________ Impacts of Balsam Woolly Adelgid in Southern Appalachia and North Carolina
Presentations Third Symposium on Hemlock Woolly Adelgid
27
bution of fir shifted north, following the retreating ice into Canada, New England, and theNorthern Appalachians; the fir species now occurring in those areas is balsam fir (Abiesbalsamea [L.] Miller), which is closely related to Fraser fir.
Since the late nineteenth century, logging and slash fires have dramatically reduced thedistribution of Fraser fir and red spruce in the Southern Appalachians (Pyle 1984, Pyle andSchafale 1988, Saunders 1979). Failed regeneration caused by logging-site degradation mayhave reduced the extent of the highest spruce-fir forests, those above 1,670 meters, to less thanhalf their former historical area, from 14,277 hectares to 6,881 hectares (Saunders 1979). Log-ging and fire in the Great Smoky Mountains, which encompass nearly three-fourths of allFraser fir-red spruce forest (Dull et al. 1988), reduced the forest type across all elevationsfrom 17,910 hectares to 13,370 hectares (Pyle 1984).
With nearly all the Southern Appalachian spruce-fir forest now occurring on publiclands (Dull et al. 1988), poor management practices were no longer a serious concern by the1950s. Since that time, however, the balsam woolly adelgid (BWA) has inflicted severe mor-tality on old-growth Fraser fir forest. Introduced into the northeastern United States in theearly 1900s, probably on imported nursery stock, the adelgid was first detected on MountMitchell in the Black Mountains in 1957, but may have been present in the area as early as1940 (Eager 1984). Within a few years, the infestation spread from the centrally located BlackMountains to all the other populations: Roan Mountain and Mount Rogers by 1962, theGreat Smoky Mountains and Grandfather Mountain by 1963, and the Balsam Mountains by1968 (Amman 1966, Dull et al. 1988, Eager 1984). By the 1980s, reproductively mature Fraserfir trees had experienced 67 percent mortality throughout the species’ range, including 91percent mortality in Great Smoky Mountains National Park (Dull et al. 1988), site of thelargest Fraser fir population.
The adelgid, which has a complex life cycle in its native range, reproduces asexuallythrough parthenogenesis in North America, where the species consists of only females. Hav-ing an egg stage, three larval instar stages, and the adult stage, an adelgid spends its entire lifeimmobile except during the first instar, or “crawler,” stage, during which it is often dispersedby air currents (Eager 1984). Amman (1966) concluded that wind was responsible for mov-ing the adelgid up to distances of 64 kilometers in the Southern Appalachians. The adelgidfeeds by inserting its stylet into cracks in the bark of older fir trees, and remains fixed at thesame location throughout its adult life. The attack of thousands of the insects on a tree resultsin the production of abnormal xylem that conducts water poorly; the tree typically dies withintwo to nine years of infestation (Amman and Speers 1965, Eager 1984, Hollingsworth andHain 1991).
The atmospheric deposition of acidic sulfur and nitrogen compounds from power plantsand other facilities west of the Appalachians may increase the susceptibility of Fraser fir tothe adelgid, although the impact of such pollution remains uncertain even after decades ofresearch. Hain and Arthur (1985) hypothesized that atmospheric deposition, mostly fromfog at high elevations, might predispose fir to adelgid mortality, or could be the final sourceof stress to already infested trees.
Third Symposium on Hemlock Woolly Adelgid Presentations
Potter et al. __________________________________________________________________________________
28
Pesticide application and extensive biological control efforts were both ineffective incombating BWA infestation in Fraser fir natural stands. The application of pesticides, in-cluding Lindane, potassium salt of oleic acid, and insecticidal soap, was of little practical usein controlling BWA at large scales, since the bole of each tree must be sprayed to the point ofsaturation for these chemicals to be effective (Dull et al. 1988, Eager 1984, Johnson 1980).During the 1960s, researchers conducted several biological control experiments that intro-duced dozens of potential BWA predators (Table 1) into infested fir stands in the SouthernAppalachians (Amman 1970, Amman and Speers 1971), the Pacific Northwest (Mitchell andWright 1967), and eastern Canada (Brown and Clark 1960). All the predators failed to reduceBWA populations, however, because of climatic differences between the predators’ new andold environments, poor prey acceptance, ineffective synchronization of predator-prey cycles,poor searching ability by the predators, the high reproductive capacity of the BWA, and therapid death of the host tree (Amman and Speers 1971, Eager 1984, Mitchell and Wright 1967).
ECOLOGICAL IMPACTS OF BALSAM WOOLLY ADELGID INFESTATION
The elimination of most old-growth Fraser fir by the balsam woolly adelgid has dra-matically altered the character of the Southern Appalachian spruce-fir forests, an uncommonecosystem that has considerable ecological, aesthetic, and economic value. In addition to theimportance of Fraser fir to the Christmas tree industry, the spruce-fir forest type is a centralattraction of several popular visitor destinations, including the Blue Ridge Parkway, GreatSmoky Mountains National Park, Mount Mitchell State Park, and the private GrandfatherMountain preserve. It plays an important role in protecting the high-elevation portions forthe watersheds of several major rivers. Perhaps most importantly, the Southern Appalachianspruce-fir ecosystem is rich in rare and endemic animals and plants, including one bird spe-cies, one mammal, six invertebrates, and 12 plants considered at risk of extinction (Table 2).Of these, two are federally listed as endangered and 10 are federal species of concern (South-ern Appalachian Man and the Biosphere 1996).
While three frog species, 13 salamanders, and eight snakes occur in Southern Appala-chian spruce-fir forests, only two species of herpetofauna – the pygmy salamander(Desmognathus wrighti) and the imitator salamander (Desmognathus imitator) – are endemicto this forest type (Mathews and Echternacht 1984). The deterioration of the spruce-fir forestcould result in the loss of these species, but more research is needed in this area. The patchyhigh-elevation spruce-fir forests of the Southern Appalachians have historically hosted a dis-tinctively boreal and unique bird community (Rabenold 1984). This community has changedsignificantly since the onset of the BWA infestation in the Great Smoky Mountains: 10 of 11breeding species declined between 1974 and the 1990s, with some near local extinction. Fiveof the most strongly affected birds – black-capped chickadee (Poecile atricapilla), blue-headedvireo (Vireo solitarius), red-breasted nuthatch (Sitta canadensis), black-throated green war-bler (Dendroica virens), and golden-crowned kinglet (Regulus satrapa) – are canopy- andsubcanopy-nesting species characteristic of spruce-fir forests throughout the Appalachians.Meanwhile, bird species characteristic of open, disturbed forests – chestnut-sided warbler(Dendroica pensylvanica) and eastern towhee (Pipilo erythrophthalmus) – became abundant(Rabenold et al. 1998).
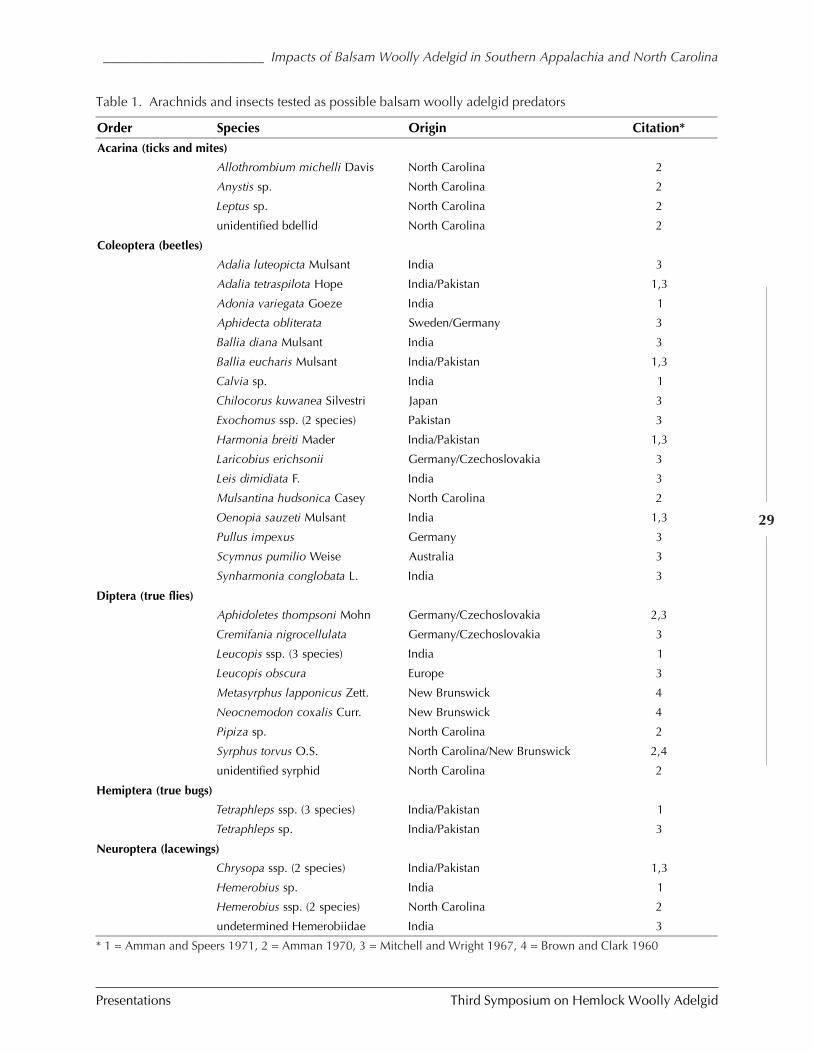
______________________ Impacts of Balsam Woolly Adelgid in Southern Appalachia and North Carolina
Presentations Third Symposium on Hemlock Woolly Adelgid
29
Table 1. Arachnids and insects tested as possible balsam woolly adelgid predators
Order Species Origin Citation*Acarina (ticks and mites)
Allothrombium michelli Davis North Carolina 2
Anystis sp. North Carolina 2
Leptus sp. North Carolina 2
unidentified bdellid North Carolina 2
Coleoptera (beetles)
Adalia luteopicta Mulsant India 3
Adalia tetraspilota Hope India/Pakistan 1,3
Adonia variegata Goeze India 1
Aphidecta obliterata Sweden/Germany 3
Ballia diana Mulsant India 3
Ballia eucharis Mulsant India/Pakistan 1,3
Calvia sp. India 1
Chilocorus kuwanea Silvestri Japan 3
Exochomus ssp. (2 species) Pakistan 3
Harmonia breiti Mader India/Pakistan 1,3
Laricobius erichsonii Germany/Czechoslovakia 3
Leis dimidiata F. India 3
Mulsantina hudsonica Casey North Carolina 2
Oenopia sauzeti Mulsant India 1,3
Pullus impexus Germany 3
Scymnus pumilio Weise Australia 3
Synharmonia conglobata L. India 3
Diptera (true flies)
Aphidoletes thompsoni Mohn Germany/Czechoslovakia 2,3
Cremifania nigrocellulata Germany/Czechoslovakia 3
Leucopis ssp. (3 species) India 1
Leucopis obscura Europe 3
Metasyrphus lapponicus Zett. New Brunswick 4
Neocnemodon coxalis Curr. New Brunswick 4
Pipiza sp. North Carolina 2
Syrphus torvus O.S. North Carolina/New Brunswick 2,4
unidentified syrphid North Carolina 2
Hemiptera (true bugs)
Tetraphleps ssp. (3 species) India/Pakistan 1
Tetraphleps sp. India/Pakistan 3
Neuroptera (lacewings)
Chrysopa ssp. (2 species) India/Pakistan 1,3
Hemerobius sp. India 1
Hemerobius ssp. (2 species) North Carolina 2
undetermined Hemerobiidae India 3
* 1 = Amman and Speers 1971, 2 = Amman 1970, 3 = Mitchell and Wright 1967, 4 = Brown and Clark 1960
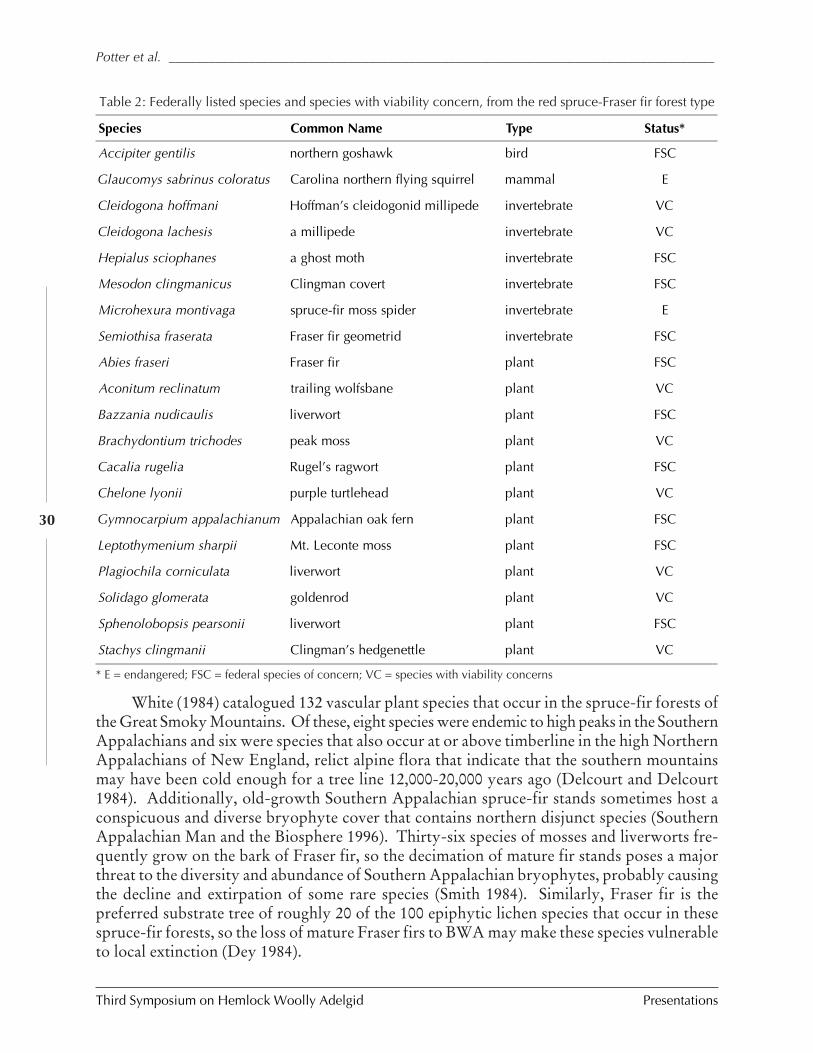
Third Symposium on Hemlock Woolly Adelgid Presentations
Potter et al. __________________________________________________________________________________
30
White (1984) catalogued 132 vascular plant species that occur in the spruce-fir forests ofthe Great Smoky Mountains. Of these, eight species were endemic to high peaks in the SouthernAppalachians and six were species that also occur at or above timberline in the high NorthernAppalachians of New England, relict alpine flora that indicate that the southern mountainsmay have been cold enough for a tree line 12,000-20,000 years ago (Delcourt and Delcourt1984). Additionally, old-growth Southern Appalachian spruce-fir stands sometimes host aconspicuous and diverse bryophyte cover that contains northern disjunct species (SouthernAppalachian Man and the Biosphere 1996). Thirty-six species of mosses and liverworts fre-quently grow on the bark of Fraser fir, so the decimation of mature fir stands poses a majorthreat to the diversity and abundance of Southern Appalachian bryophytes, probably causingthe decline and extirpation of some rare species (Smith 1984). Similarly, Fraser fir is thepreferred substrate tree of roughly 20 of the 100 epiphytic lichen species that occur in thesespruce-fir forests, so the loss of mature Fraser firs to BWA may make these species vulnerableto local extinction (Dey 1984).
* E = endangered; FSC = federal species of concern; VC = species with viability concerns
Species Common Name Type Status*
Accipiter gentilis northern goshawk bird FSC
Glaucomys sabrinus coloratus Carolina northern flying squirrel mammal E
Cleidogona hoffmani Hoffman’s cleidogonid millipede invertebrate VC
Cleidogona lachesis a millipede invertebrate VC
Hepialus sciophanes a ghost moth invertebrate FSC
Mesodon clingmanicus Clingman covert invertebrate FSC
Microhexura montivaga spruce-fir moss spider invertebrate E
Semiothisa fraserata Fraser fir geometrid invertebrate FSC
Abies fraseri Fraser fir plant FSC
Aconitum reclinatum trailing wolfsbane plant VC
Bazzania nudicaulis liverwort plant FSC
Brachydontium trichodes peak moss plant VC
Cacalia rugelia Rugel’s ragwort plant FSC
Chelone lyonii purple turtlehead plant VC
Gymnocarpium appalachianum Appalachian oak fern plant FSC
Leptothymenium sharpii Mt. Leconte moss plant FSC
Plagiochila corniculata liverwort plant VC
Solidago glomerata goldenrod plant VC
Sphenolobopsis pearsonii liverwort plant FSC
Stachys clingmanii Clingman’s hedgenettle plant VC
Table 2: Federally listed species and species with viability concern, from the red spruce-Fraser fir forest type
______________________ Impacts of Balsam Woolly Adelgid in Southern Appalachia and North Carolina
Presentations Third Symposium on Hemlock Woolly Adelgid
31
Before balsam woolly adelgid infestation, the stand composition of old-growth redspruce-Fraser fir forests resulted from a natural disturbance regime dominated by small treefall-created canopy gaps (White et al. 1985). Dramatic Fraser fir mortality, however, quicklyopened up large areas of the forest canopy, altering both overstory and understory dynamicsin the spruce-fir forest community. The live basal area of Fraser fir was reduced considerablyin the Great Smoky Mountains between the 1960s and 1980s as nearly all the firs in the canopydied, while the basal area and density of red spruce stems either increased slightly or remainedthe same (Busing and Clebsch 1988, Busing et al. 1988). Overall, stand basal area decreased 28percent (Busing et al. 1988). The density of live fir has been shown to be positively associatedwith the time since the major wave of mortality in the Great Smoky Mountains (Smith 1997,Smith and Nicholas 1998). At the same time, the opening of the canopy has allowed an in-crease in sub-shrub coverage, most notably blackberry (Rubus canadensis L.) (DeSelm andBoner 1984, Rabenold et al. 1998, Smith 1997), and for a decrease in bryophyte coverage(DeSelm and Boner 1984, Smith 1997). The impact on the herbaceous and shrub layers areless certain, with Smith (1997) seeing an increase in herbaceous and shrub density in openedcanopies, and Rabenold et al. (1998) finding a decline in herbaceous cover and in the abun-dance of shrubs, including hobblebush (Viburnum alnifolium Marshall) and mountain cran-berry (Vaccinium erythrocarpum Michaux).
Fraser fir stands suffering extensive mortality from the balsam woolly adelgid appar-ently have been able to regenerate with vigorous and numerous offspring (Busing and Clebsch1988, Witter and Ragenovich 1986), many of which are now 20 to 30 years old – the age ofviable seed production for open-grown and overstory Fraser fir trees. The question now iswhether these trees will live long enough to produce the next generation of fir before they,too, are severely infested by the adelgid.
Some researchers believe that large numbers of Fraser fir will continue to exist in thehigh-elevation forests of the Southern Appalachians. Based on research at Mount Mitchell inthe 1970s, for example, Witter and Ragenovich (1986) predicted that viable seeds would con-tinue to be produced before the firs are extensively damaged by the balsam woolly adelgid,and that, as a result, Fraser fir should continue to be an important component in the fir,spruce-fir, and spruce-fir-hardwood forest types. Additionally, adelgid populations are cur-rently lower in the Great Smoky Mountains than in the early outbreak years of the 1970s and1980s, and their reproduction rates are lower (Kristine Johnson, personal communication).
Other research may signal cause for concern about the future of Fraser fir. Pauley andClebsch (1990) found that 26 percent of fir seedlings at Mt. Collins in the Great Smoky Moun-tains had adelgid-caused gouting – a number that increased to 39 percent for seedlings olderthan 5 years. Additionally, they noted that blackberry plants may be inhibiting the establish-ment of fir seedlings in areas where the adelgid caused severe overstory fir mortality. As aresult, they note, future fir establishment could be limited to shaded slopes and downed logs,where blackberry is unable to gain the upper hand. In a study of five summits in the GreatSmoky Mountains, Smith and Nicholas (2000) found that firs may be growing faster underthe open canopy caused by adelgid mortality, and therefore may reach reproductive maturityat a younger age. However, they predicted that as Fraser fir continues to regenerate, it will bere-infested by the balsam woolly adelgid. This could initiate a regeneration-mortality cyclethat slowly reduces the size of fir populations because the adelgid may allow few trees to
Third Symposium on Hemlock Woolly Adelgid Presentations
Potter et al. __________________________________________________________________________________
32
reach reproductive maturity, and that results in a decreasing number of even-aged patches indifferent stages of regeneration and mortality (Smith and Nicholas 2000). Interestingly, Fraserfir mortality rates have recently declined, indicating that the initial wave of adelgid-causedmortality is virtually complete, although a new wave of mortality may have begun in the firstgeneration of post-adelgid fir at Mount Mitchell, the first site impacted by the pest (Smith andNicholas 1999).
MODELING THE IMPACTS OF BWA ON FRASER FIR GENETICS
A significant concern for the future of Fraser fir is that the BWA-caused demographicbottleneck could intensify the effects of genetic drift in the smallest Fraser fir populations.Genetic drift is the random fluctuation of allele frequencies as a result of “sampling errors”during reproduction; while it occurs in all populations, its effects over a small number ofgenerations are most evident in very small populations (Hartl and Clark 1997). It can cause aloss of genetic variation within a population, eventually resulting in the fixation of alleles,which occurs with the elimination of heterozygosity in a gene system (Ellstrand and Elam1993). Some of the alleles lost as a result of drift could be low-frequency alleles that mightallow the population to adapt to environmental change. Decreased genetic variation andinbreeding depression, in turn, may increase a population’s risk of extinction from pests,climate change, random events, reduced inbreeding viability, and demographic uncertainty(Barrett and Kohn 1991, Huenneke 1991, Lande 1999). Further, the loss of genetically differ-entiated populations could result in a serious loss of genetic diversity for the species, withfewer small populations remaining to represent its gene pool (Rajora and Mosseler 2001).However, the migration of genes among populations, in the form of long-distance pollendispersal in the case of Fraser fir, may counter the disruptive effects of inbreeding and geneticdrift by transferring genetic variation among populations (Hamrick and Nason 2000).
Predicting the long-term genetic impacts of balsam woolly adelgid infestation on Fraserfir stands is a complicated proposition for two reasons. First, it’s unclear whether BWAinfestations will continue to occur as existing young trees mature to an age at which they aresusceptible to mortality from the adelgid. Second, both infestation-recovery cycles and inter-generational genetic drift occur over many decades, making them difficult to study over thecourse of a single career. To address these challenges, we have developed a mathematicalmodel that allows us to test hypotheses about the impact of differing BWA infestation sce-narios.
Our stage-structured population matrix model for Fraser fir is unique in that it simu-lates genetic dynamics in a long-lived forest tree species with overlapping generations. Thespecific objectives of the stochastic model are: 1) to investigate genetic drift and allele fixationin a two-allele, single-locus gene system in a series of hypothetical fir populations of varyingsizes, initial allele frequencies, and number of BWA infestation bottlenecks, and 2) to com-pare the effect of drift to the impact of natural selection resulting from the presence of ahypothetical BWA-resistance gene in actual Fraser fir populations. We based the stage struc-ture and reproductive characteristics of the modeled Fraser fir populations on field data, in-cluding age class distribution in the Great Smoky Mountains in the 1950s before the intro-duction of BWA (Oosting and Billings 1951) and remote sensing estimates of the spatial ex-
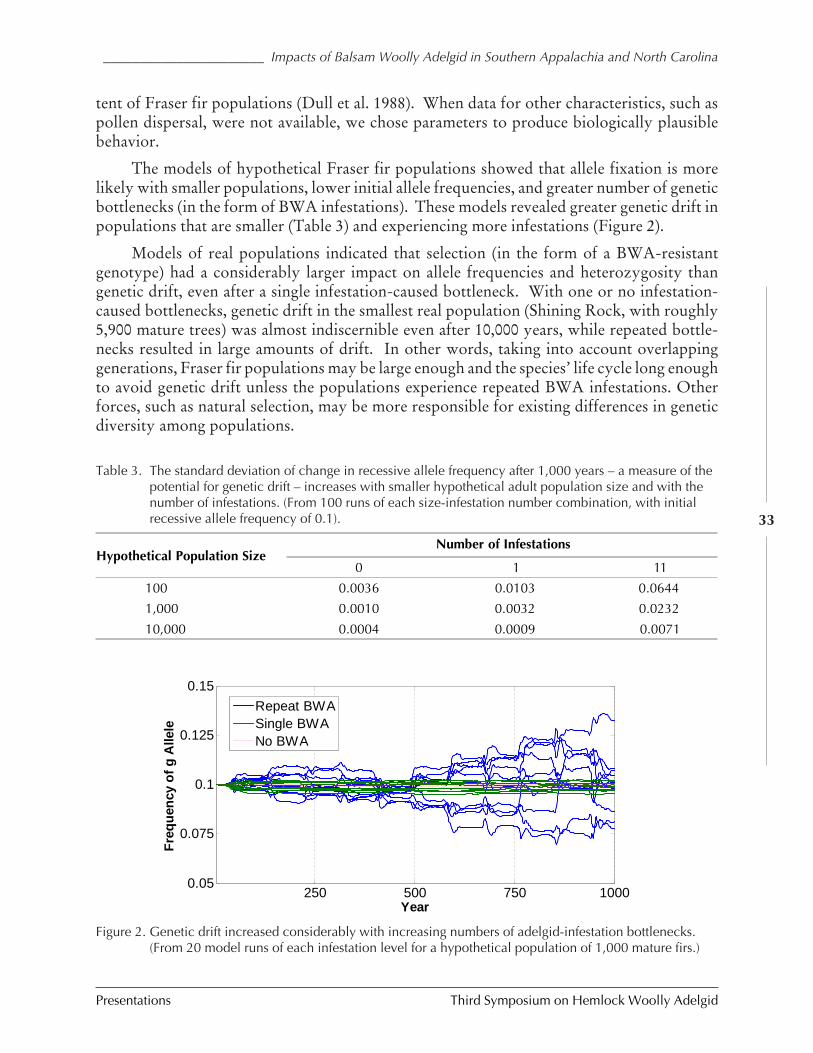
______________________ Impacts of Balsam Woolly Adelgid in Southern Appalachia and North Carolina
Presentations Third Symposium on Hemlock Woolly Adelgid
33
tent of Fraser fir populations (Dull et al. 1988). When data for other characteristics, such aspollen dispersal, were not available, we chose parameters to produce biologically plausiblebehavior.
The models of hypothetical Fraser fir populations showed that allele fixation is morelikely with smaller populations, lower initial allele frequencies, and greater number of geneticbottlenecks (in the form of BWA infestations). These models revealed greater genetic drift inpopulations that are smaller (Table 3) and experiencing more infestations (Figure 2).
Models of real populations indicated that selection (in the form of a BWA-resistantgenotype) had a considerably larger impact on allele frequencies and heterozygosity thangenetic drift, even after a single infestation-caused bottleneck. With one or no infestation-caused bottlenecks, genetic drift in the smallest real population (Shining Rock, with roughly5,900 mature trees) was almost indiscernible even after 10,000 years, while repeated bottle-necks resulted in large amounts of drift. In other words, taking into account overlappinggenerations, Fraser fir populations may be large enough and the species’ life cycle long enoughto avoid genetic drift unless the populations experience repeated BWA infestations. Otherforces, such as natural selection, may be more responsible for existing differences in geneticdiversity among populations.
250 500 750 10000.05
0.075
0.1
0.125
0.15
Year
Fre
qu
ency
of
g A
llele
Repeat BWASingle BWANo BWA
Figure 2. Genetic drift increased considerably with increasing numbers of adelgid-infestation bottlenecks.(From 20 model runs of each infestation level for a hypothetical population of 1,000 mature firs.)
Hypothetical Population SizeNumber of Infestations
0 1 11
100 0.0036 0.0103 0.0644
1,000 0.0010 0.0032 0.0232
10,000 0.0004 0.0009 0.0071
Table 3. The standard deviation of change in recessive allele frequency after 1,000 years – a measure of thepotential for genetic drift – increases with smaller hypothetical adult population size and with thenumber of infestations. (From 100 runs of each size-infestation number combination, with initialrecessive allele frequency of 0.1).
Third Symposium on Hemlock Woolly Adelgid Presentations
Potter et al. __________________________________________________________________________________
34
THE SEARCH FOR GENETIC RESISTANCE
The continued existence of Fraser fir in its natural stands may depend on whether thespecies has genetic resistance to BWA, or the ability to develop it. Trees in the Mount Rogerspopulation, for example, may have this resistance (Eager 1984, Rheinhardt 1984) as they havesuffered less mortality than other populations despite having been exposed to the adelgidsince 1962 (Eager 1984, Nicholas et al. 1992).
If genes for resistance to the balsam woolly adelgid exist in only a few scattered trees inany of the populations, they may be more likely to successfully produce offspring that arealso less susceptible to death from adelgid attack. After several generations, many trees sur-viving in a stand could be resistant if the infestation is severe and continuous enough to killoff the more vulnerable firs. If such resistance exists and if Smith and Nicholas (2000) werecorrect that Fraser fir population size could be diminished by the adelgid, it is interesting tospeculate which would happen first: the extirpation of smaller Fraser fir populations or thedevelopment of populations entirely resistant to the pest. It is unlikely we will know theanswer to that question any time soon.
Efforts are underway by forest geneticists and entomologists at North Carolina StateUniversity to find and breed firs that are resistant to adelgid attack. With help from rangers atGreat Smoky Mountains National Park, North Carolina, state researchers have collectedbranches from old-growth Fraser fir trees that may have survived the initial balsam woollyadelgid attack. These branches were grafted onto fir trees at the North Carolina Division ofForest Resources’ Linville River Nursery and have been transplanted to the N.C. Depart-ment of Agriculture/NC State University Mountain Research Center at Laurel Springs. Whenthey are older, these trees will be further multiplied via grafting and infested with adelgids todetermine whether they are, indeed, resistant.
This project eventually could allow for the reintroduction of adelgid-resistant Fraserfirs into their natural stands. It could also assist Christmas tree producers by facilitating thebreeding of Fraser firs that are naturally less vulnerable to attack by the pest, saving growersthe time and money required to spray their Christmas tree farms with pesticides.
CONSERVING FRASER FIR GENETIC DIVERSITY
Even if all nine major and minor Fraser fir populations survive depredation by the bal-sam woolly adelgid, they may face at least one more serious threat: global climate change. Arecent model (Delcourt and Delcourt 1998) predicts the elimination of Southern AppalachianFraser fir-red spruce forest with a possible global mean temperature increase of 3° C causedby greenhouse warming. Fraser fir is listed in North Carolina as an imperiled species, as aspecies of concern federally, and as a species imperiled and vulnerable to extinction globally(Ameroso and Finnegan 2002). Clearly, the limited distribution of Fraser fir and the threatsto its survival in a natural setting are compelling reasons for the systematic conservation of itsgene pool (Nicholas et al. 1999).
______________________ Impacts of Balsam Woolly Adelgid in Southern Appalachia and North Carolina
Presentations Third Symposium on Hemlock Woolly Adelgid
35
We are developing a gene conservation plan for Fraser fir that would help facilitate therestoration of the species to its natural stands if BWA or climate change makes such actionnecessary and would ensure the continued existence of a genetic resource base for Christmastree breeding. While almost all Fraser fir stands are managed for the continued existence ofthe species, this is no guarantee that it will be able to evolve in response to rapid environmen-tal changes. An ex situ (off-site) conservation plan will help ensure much of the genetic mate-rial of these populations is preserved in the event of their loss and could allow for the evolu-tion of genes that, if introduced into natural Fraser fir populations, would make them betterable to evolve and survive drastic environmental changes (Eriksson et al. 1993).
The plan will integrate existing Christmas tree breeding and gene conservation effortswith additional measures to archive Fraser fir genetic resources and to expand the amount ofgenetic variation included in off-site conservation efforts. Its components are likely to in-clude: 1) a seed bank representing both major and minor Fraser fir populations and seedsgenerated by breeding efforts and in conservation plantings, 2) existing tree breeding ele-ments (provenance and progeny tests, seed orchards, and clone banks), and 3) conservationplantings.
THE IMPACT OF ADELGID ON THE CHRISTMAS TREE INDUSTRY
North Carolina accounts for more than 12 percent of real Christmas trees produced inthe United States and ranks second in the total number of trees harvested and first in thedollars made per tree. Nearly all the Christmas trees grown in the state are Fraser fir. In 1999,1,600 North Carolina growers sold 3.7 million trees worth a reported value of more than $92million (North Carolina Department of Agriculture and Consumer Services 2005). Virtuallyall Fraser fir Christmas trees in western North Carolina have to be treated for BWA one ormore times during a 5- to 10-year rotation. This results in an annual cost to the industryestimated at $1.53 million. This estimate, however, does not include additional costs such aslosses due to BWA damage or increased miticide control costs associated with BWA treat-ments.
Generally, the only Fraser fir Christmas tree plantations escaping BWA infestations arethose isolated from natural stands, other Christmas tree production areas, and Fraser firsgrown as yard trees. Producing Christmas trees near infested yard trees or abandoned Christ-mas tree plantations greatly increases insect pressure. Growers are encouraged to scout forthe BWA yearly, and 68.5 percent of growers did so in 2000. The first and most easily recog-nized symptom of a BWA infestation is the loss of apical dominance in the affected tree,meaning that the tree produces a crooked top rather than a straight one. When trees withcrooked tops are found in the field, the trunk can be examined for the presence of the insect.Growers may also find BWA infestations when they harvest trees: trees infested with BWAproduce hard, red-colored reaction wood, which makes the trees harder to cut down.
Third Symposium on Hemlock Woolly Adelgid Presentations
Potter et al. __________________________________________________________________________________
36
The threshold for treating a Fraser fir plantation is a single infested tree, although cull-ing symptomatic trees may slow the spread in some instances. Several general predators feedon BWA, including the Harmonia ladybeetle, but will not eliminate an infestation. Fraser firis extremely sensitive to adelgids, and even a few of this pest will impact tree quality. With theintroduction of the exotic hemlock woolly adelgid (Adelges tsugae Annand) into the easternUnited States, there is increased interest in predators and parasitoids of adelgids, which couldresult in greater natural controls of the BWA in the future.
In treating a Christmas tree plantation for BWA, insecticides must be applied with ahigh-pressure sprayer using 300 to 800 gallons per acre, depending on tree size and density.The entire tree must be wetted with the insecticide because the adelgids can occur on buds,shoots, and branches in addition to the trunk. Trees are treated from two directions as theapplicator pulls 200 to 300 feet of hose up and down rows. Only two or three rows can betreated at a time. About half the Christmas tree growers own this type of equipment, butothers must hire someone to treat their trees at a cost of $300 to $500 per acre. Because of thecost and difficulty of these treatments, growers hope to achieve up to three years of BWAcontrol with one treatment.
Materials used for control include:
Lindane 20 EC (lindane): Lindane has traditionally been the primary chemical used tocontrol BWA. Lindane was used on 21.7 percent of Christmas tree acres in 1994 and23.8 percent in 2000. It is no longer being manufactured, however, and its use is declin-ing.
Asana XL (esfenvalerate): Asana, the primary replacement for Lindane, was used on 16.6percent of Christmas tree acres in 2000, up slightly from 11.8 percent in 1994. Growershave not felt that they are receiving as long-lasting control with Asana as they had withLindane. Additionally, growers have reported having more problems with hemlock rustmite during the year following Asana applications.
Thiodan 3EC (endosulfan): Because of the concerns associated with Asana, a 24(c) Spe-cial Local Need label was granted for two years for Thiodan 3EC. This chemical cannotbe used within 300 feet of surface water because of concerns about its effects on aquaticlife. In 2000, it was used on 2.2 percent of acres, but that number has since increased.
Horticultural oil: Horticultural oil is currently used on only 0.1 percent of Christmas treeacres. Treatments with oil to control the BWA are only effective during the winter,when no eggs are present. Oils can burn Fraser fir foliage depending on the rate and thetime of year used.
Other Insecticides: Provado 1.6F (imidacloprid), Metasystox-R (oxydemeton-methyl), andLorsban 4E (chlorpyrifos) are labeled for adelgid control, but are not frequently used.Control has not been long-lasting with these materials. Growers are currently inter-
______________________ Impacts of Balsam Woolly Adelgid in Southern Appalachia and North Carolina
Presentations Third Symposium on Hemlock Woolly Adelgid
37
ested in two other synthetic pyrethroids: Astro (permethrin) and Talstar (bifenthrin).Astro has provided up to 18 months of control in pest-control trials.
The use of broad spectrum insecticides for BWA control results in outbreaks of sprucespider mites (Oligonychus ununguis) and hemlock rust mites (HRM) (Nalepella tsugifoliae).Since the mid-1990s, when the use of synthetic pyrethroids such as Asana started to becomemore common for BWA, rust mites have become an increasing problem. In 2000, 20.2 per-cent of growers used insecticides and/or miticides to control HRM, compared to fewer than2 percent in 1994. In fact, if Fraser fir in western North Carolina did not require BWA treat-ment, growers could use more biological control measures for spider mites, rust mites, andthe balsam twig aphid (Mindarus abietinus), which are all cosmetic pests. Many native preda-tors exist for these pests, but their numbers are reduced with BWA control.
CONCLUSIONS
Over the course of a few decades, balsam woolly adelgid has drastically altered a borealrelict ecosystem endemic to the Southeastern United States. While it appears that Fraser firwill remain a part of this forest community, it is uncertain whether repeated adelgid infesta-tion would reduce its genetic diversity and its status as a codominant canopy species in thisecosystem. Additional research is needed to determine whether a second wave of adelgidmortality is beginning, and to quantify the impacts of adelgid infestation on the flora andfauna of the red spruce-Fraser fir forest type. Efforts to locate and propagate adelgid-resis-tant firs and to conserve the genetic diversity of the species could become important in anyfuture plans to restore or augment Southern Appalachian spruce-fir forests in which Fraserfir becomes diminished. These measures could also help reduce the time and financial costsborne by the economically important Christmas tree industry to control adelgids in Fraser firplantations.
REFERENCES
Ameroso, J.L. and J.T. Finnegan, Eds. 2002. Natural Heritage Program List of the RarePlant Species of North Carolina. Raleigh, North Carolina, North Carolina Departmentof Environment and Natural Resources, North Carolina Natural Heritage Program.
Amman, G.D. 1966. Some new Infestations of balsam woolly aphid in North Carolinawith possible modes of dispersal. Journal of Economic Entomology 59(3):508-510.
Amman, G.D. 1970. Phenomena of Adelges piceae populations (Homoptera-Phylloxeridae) in North Carolina. Annals of the Entomological Society of America63(6):1727-1734.
Amman, G. D. and C.F. Speers. 1965. Balsam woolly aphid in the Southern Appalachians.Journal of Forestry 63:18-20.
Amman, G. D. and C.F. Speers. 1971. Introduction and evaluation of predators from Indiaand Pakistan for control of balsam woolly aphid (Homoptera-Adelgidae) in NorthCarolina. Canadian Entomologist 103(4):528-533.
Third Symposium on Hemlock Woolly Adelgid Presentations
Potter et al. __________________________________________________________________________________
38
Barrett, S.C.H. and J.R. Kohn. 1991. Genetic and evolutionary consequences of smallpopulation size in plants: implications for conservation. Genetics and Conservation ofRare Plants. D.A. Falk and K.E. Holsinger, eds. New York, Oxford University Press: 3-30.
Brown, N.R. and R.C. Clark. 1960. Studies of predators of the balsam woolly aphid,Adelges piceae (Ratz.) (Homoptera: Adelgidae) VIII. Syrphidae (Diptera). CanadianEntomologist 92(11):801-811.
Busing, R.T. and E.E.C. Clebsch. 1988. Fraser fir mortality and the dynamics of a GreatSmoky Mountains fir-spruce stand. Castanea 53(3):177-182.
Busing, R.T., E.E.C. Clebsch, C.C. Eagar and, and E.F. Pauley. 1988). Two decades ofchange in a Great Smoky Mountains spruce-fir forest. Bulletin of the Torrey BotanicalClub 115(1):25-31.
Busing, R.T., P.S. White and M.D. MacKenzie. 1993. Gradient analysis of old spruce-firforests of the Great Smoky Mountains circa 1935. Canadian Journal of Botany 71(7):951-958.
Cain, S.A. 1935. Ecological studies of the vegetation of the Great Smoky Mountains. II.The quadrat method applied to sampling spruce and fir forest types. American MidlandNaturalist 16(4): 566-584.
Delcourt, H.R. and P.A. Delcourt. 1984. Late-Quaternary history of the spruce-fir ecosys-tem in the Southern Appalachian region. The Southern Appalachian Spruce-Fir Ecosys-tem: Its Biology and Threats. P.S. White, ed. Atlanta, Georgia, United States Departmentof the Interior, National Park Service: 22-35.
Delcourt, P.A. and H.R. Delcourt. 1987. Long-term Forest Dynamics of the TemperateZone. New York, Springer-Verlag.
Delcourt, P.A. and H.R. Delcourt. 1998. Paleoecological insights on conservation ofbiodiversity: a focus on species, ecosystems, and landscapes. Ecological Concepts inConservation Biology 8(4):921-934.
DeSelm, H.R. and R.R. Boner. 1984. Understory changes in spruce-fir during the first 16-20 years following the death of fir. The Southern Appalachian Spruce-Fir Ecosystem: ItsBiology and Threats. P.S. White, ed. Atlanta, Georgia, United States Department of theInterior, National Park Service: 51-69.
Dey, J.P. 1984. Lichens of the Southern Appalachian Mountain spruce-fir zone and someunanswered ecological questions. The Southern Appalachian Spruce-Fir Ecosystem: ItsBiology and Threats. P.S. White, ed. Atlanta, Georgia, United States Department of theInterior, National Park Service: 139-150.
Dull, C.W., J.D. Ward, H.D. Brown, G.W. Ryan, W.H. Clerke and R.J. Uhler. 1988.Evaluation of Spruce and Fir Mortality in the Southern Appalachian Mountains. Atlanta,Georgia, United States Department of Agriculture, Forest Service, Southern Region: 92.
______________________ Impacts of Balsam Woolly Adelgid in Southern Appalachia and North Carolina
Presentations Third Symposium on Hemlock Woolly Adelgid
39
Eager, C. 1984. Review of the biology and ecology of the balsam woolly aphid in SouthernAppalachian spruce-fir forests. The Southern Appalachian Spruce-Fir Ecosystem: ItsBiology and Threats. P.S. White, ed. Atlanta, Georgia, United States Department of theInterior, National Park Service: 36-50.
Ellstrand, N.C. and D.R. Elam. 1993. Population genetic consequences of small populationsize: implications for plant conservation. Annual Review of Ecology and Systematics24:217-242.
Eriksson, G., G. Namkoong and J.H. Roberds. 1993. Dynamic gene conservation foruncertain futures. Forest Ecology and Management 62(1-4):15-37.
Hain, F.P. and F.H. Arthur (1985). The role of atmospheric deposition in the latitudinalvariation of Fraser fir mortality caused by the balsam woolly adelgid, Adelges piceae(Ratz.) (Hemipt, Adelgidae): A hypothesis. Journal of Applied Entomology 99(2):145-152.
Hamrick, J.L. and J.D. Nason. 2000. Gene flow in forest trees. Forest Conservation Genet-ics: Principles and Practice. A.G. Young, D. Boshier and T.J. Boyle, ed. Collingwood,Australia, CSIRO Publishing: 81-90.
Hartl, D.L. and A.G. Clark (1997). Principles of Population Genetics. Sunderland, Massa-chusetts, Sinauer Associates, Inc.
Hollingsworth, R.G. and F.P. Hain. 1991. Balsam woolly adelgid (Homoptera, Adelgidae)and spruce-fir decline in the Southern Appalachians: Assessing pest relevance in a dam-aged ecosystem. Florida Entomologist 74(2):179-187.
Huenneke, L.F. 1991. Ecological implications of genetic variation in plant populations.Genetics and Conservation of Rare Plants. D.A. Falk and K.E. Holsinger, ed. New York,Oxford University Press: 31-44.
Johnson, K.D. 1980. Fraser fir and the balsam woolly aphid: A problem analysis. Knoxville,Tennessee, Southern Appalachian Research/Resource Managment Cooperative: 62.
Lande, R. 1999. Extinction risks from anthropogenic, ecological, and genetic factors. Ge-netics and the Extinction of Species: DNA and the Conservation of Biodiversity. L.F.Landweber and A.P. Dobson, ed. Princeton, New Jersey, Princeton University Press: 1-22.
Mathews, R.C., Jr. and A.C. Echternacht. 1984. Herpetofauna of the spruce-fir ecosystemin the Southern Appalachian Mountain regions, with emphasis on the Great SmokyMountains National Park. The Southern Appalachian Spruce-Fir Ecosystem: Its Biologyand Threats. P.S. White, ed. Atlanta, Georgia, United States Department of the Interior,National Park Service: 155-167.
Mitchell, R.G. and K.H. Wright. 1967. Foreign predator introductions for control of bal-sam woolly aphid in Pacific Northwest. Journal of Economic Entomology 60(1): 140-147.
Third Symposium on Hemlock Woolly Adelgid Presentations
Potter et al. __________________________________________________________________________________
40
Nicholas, N.S., C. Eager and J.D. Peine. 1999. Threatened ecosystem: high-elevationspruce-fir forest. Ecosystem Management for Sustainability: Principles and Practices. J.D.Peine, ed. Boca Raton, Florida, Lewis Publishers: 431-454.
Nicholas, N.S., S.M. Zedaker and C. Eager. 1992. A comparison of overstory communitystructure in three southern Appalachian spruce-fir forests. Bulletin of the Torrey Botani-cal Club 119(3): 316-332.
North Carolina Department of Agriculture and Consumer Services. 2005. Christmas Trees.www.ncagr.com/markets/commodit/horticul/xmastree/index.htm, January 27, 2005.
Oosting, H.J. and W.D. Billings. 1951. A comparison of virgin spruce-fir forest in thenorthern and southern Appalachian system. Ecology 32(1): 84-103.
Pauley, E.F. and E.E.C. Clebsch. 1990. Patterns of Abies fraseri regeneration in a GreatSmoky Mountains spruce-fir forest. Bulletin of the Torrey Botanical Club 117(4): 375-381.
Pyle, C. 1984. Pre-park disturbance in the spruce-fir forests of Great Smoky MountainsNational Park. The Southern Appalachian Spruce-Fir Ecosystem: Its Biology and Threats.P.S. White, ed. Atlanta, Georgia, United States Department of the Interior, National ParkService: 115-130.
Pyle, C. and M.P. Schafale. 1988. Land use history of three spruce-fir forest sites in South-ern Appalachia. Journal of Forest History 32:4-21.
Rabenold, K.N. 1984. Birds of Appalachian spruce-fir forests: Dynamics of habitat-islandcommunities. The Southern Appalachian Spruce-Fir Ecosystem: Its Biology and Threats.P.S. White, ed. Atlanta, Georgia, United States Department of the Interior, National ParkService: 168-186.
Rabenold, K.N., P.T. Fauth, B.W. Goodner, J.A. Sadowski and P.G. Parker. 1998. Re-sponse of avian communities to disturbance by an exotic insect in spruce-fir forests ofthe southern Appalachians. Conservation Biology 12(1):177-189.
Rajora, O.P. and A. Mosseler 2001. Molecular markers in sustainable management, conser-vation and restoration of forest genetic resources. Genetic Response of Forest Systems toChanging Environmental Conditions. G. Mueller-Stark and R. Schubert, ed. Boston,Kluwer Academic Publishers. Vol. 70 (For. Sci.):187-202.
Rheinhardt, R.D. 1984. Comparative study of composition and distribution patterns ofsubalpine forests in the Balsam Mountains of southwest Virginia and the Great SmokyMountains. Bulletin of the Torrey Botanical Club 111(4):489-493.
Saunders, P.R. 1979. The vegetational impact of human disturbance on the spruce-fir for-ests of the Southern Appalachian Mountains. Department of Forestry and EnvironmentalStudies. Durham, North Carolina, Duke University: 170.
______________________ Impacts of Balsam Woolly Adelgid in Southern Appalachia and North Carolina
Presentations Third Symposium on Hemlock Woolly Adelgid
41
Smith, D.K. 1984. A status report on bryophytes of the Southern Appalachian spruce-firforests. The Southern Appalachian Spruce-Fir Ecosystem: Its Biology and Threats. P.S.White, ed. Atlanta, Georgia, United States Department of the Interior, National ParkService: 131-138.
Smith, G.F. 1997. Southern Appalachian fir and spruce-fir forest community changesfollowing balsam woolly adelgid infestation. Department of Forestry. Knoxville, Tennes-see, University of Tennessee: 128.
Smith, G.F. and N.S. Nicholas. 1998. Patterns of overstory composition in the fir and fir-spruce forests of the Great Smoky Mountains after balsam woolly adelgid infestation.American Midland Naturalist 139(2):340-352.
Smith, G.F. and N.S. Nicholas. 1999. Post-disturbance spruce-fir forest stand dynamics atseven disjunct sites. Castanea 64(2):175-186.
Smith, G.F. and N.S. Nicholas. 2000. Size- and age-class distributions of Fraser fir follow-ing balsam woolly adelgid infestation. Canadian Journal of Forest Research 30(6):948-957.
Southern Appalachian Man and the Biosphere. 1996. The Southern Appalachian Assess-ment. Asheville, North Carolina, USDA Forest Service, Southeastern Forest ExperimentStation.
White, P.S. 1984. The Southern Appalachian spruce-fir ecosystem: an introduction. TheSouthern Appalachian Spruce-Fir Ecosystem: Its Biology and Threats. P.S. White, ed.Atlanta, Georgia, United States Department of the Interior, National Park Service: 1-21.
White, P.S., M.D. Mackenzie and R.T. Busing. 1985. Natural disturbance and gap phasedynamics in Southern Appalachian spruce-fir forests. Canadian Journal of Forest Re-search 15(1): 233-240.
Whitehead, D.R. 1973. Late-Wisconsin vegetational changes in unglaciated eastern NorthAmerica. Quaternary Research 3:621-631.
Whitehead, D.R. 1981. Late Pleistocene vegetational changes in northeastern North Caro-lina. Ecological Monographs 51(4):451-471.
Whittaker, R.H. 1956. Vegetation of the Great Smoky Mountains. Ecological Monographs26(1):1-80.
Witter, J.A. and I.R. Ragenovich. 1986. Regeneration of Fraser fir at Mt. Mitchell, NorthCarolina, after depredations by the balsam woolly adelgid. Forest Science 32(3):585-594.
Third Symposium on Hemlock Woolly Adelgid Presentations
Snyder et al. __________________________________________________________________________________
42
LONG-TERM EFFECTS OF HEMLOCK FOREST DECLINE
ON HEADWATER STREAM COMMUNITIES
Craig D. Snyder, John A. Young, Robert M. Ross, and David R. Smith
United States Geological Survey, Biological Resources DivisionLeetown Science Center
1700 Leetown RoadKearneysville, WV 25430
ABSTRACT
We conducted a comparative study to determine the potential long-term impacts of hemlockforest decline on fish and benthic macroinvertebrate assemblages in headwater streams in theDelaware Water Gap National Recreation Area. Hemlock forests throughout eastern NorthAmerica have been declining due to the hemlock woolly adelgid, an exotic insect pest. Wefound aquatic invertebrate community structure to be strongly correlated with forest com-position. Streams draining hemlock forests were more diverse but less productive than streamsdraining mixed hardwood forests. In addition, there were distinct differences inmacroinvertebrate trophic structure, with predators more common and grazers less commonin hemlock-drained streams. In contrast, forest-type differences in fish assemblage structurewere less pronounced, although trends suggested that species richness was higher in streamsdraining hardwood and functional diversity was higher in hemlock-drained streams. We alsofound important distinctions in terms of fish species composition. Brook trout (Salvelinusfontinalis), an important fishery in the park, were three times more likely to occur and fourtimes more abundant in streams draining hemlock than in those draining hardwood forests.Also, fish trophic structure varied between forest type, with insectivores more common inhardwood-drained streams and piscivores more common in hemlock-drained streams. Analy-sis of stream habitat data indicated that streams draining hemlock forests had more stablethermal and hydrologic regimes. Our findings suggest hemlock decline may result in long-term changes in headwater stream ecosystems that are comparable in scope to effects ob-served in terrestrial ecosystems.
KEY WORDS
Ecological effects, aquatic communities, hemlock forest decline, headwater streams, habitatstability.
INTRODUCTION
Eastern hemlock (Tsuga canadensis) forests have declined substantially in the last two de-cades as a result of the hemlock woolly adelgid (Adelges tsugae). The ecological impact oflosing this important climax forest species is poorly understood, but has the potential for
____________________ Long-term Effects of Hemlock Forest Decline on Headwater Stream Communities
Presentations Third Symposium on Hemlock Woolly Adelgid
43
significant disturbance to biotic communities by changing the energy availability, microcli-mate, and distribution and abundance of habitat. The importance of hemlock to many terres-trial assemblages has been documented (reviewed in McManus et al. 1999). In contrast, theinfluence of hemlock on aquatic assemblages has received little attention, and relatively fewstudies have evaluated the long-term consequences of changing forest composition on streamcommunities (see Molles 1982, Stout et al. 1992).
There have been numerous reports of significant changes in headwater stream habitatand aquatic community structure associated with forest disturbances. However, most ofthese studies have been designed to evaluate the responses of stream ecosystems to the rela-tively short-term changes that take place between the death or removal of existing riparianforests and the maturation of new overstory canopies. Of particular importance during thisperiod is the shift in the stream energy base associated with large changes in the amount andtiming of leaf litter and large woody debris inputs entering the stream and altered light, tem-perature, and hydrologic regimes (Likens et al. 1970). Such changes have been shown to havesignificant effects on available habitat (Naiman et al. 1988), nutrient dynamics (Webster et al.1992), channel morphology (Gregory 1992), and ultimately, the trophic structure and pro-ductivity of aquatic assemblages (Wallace and Gurtz 1986, Sheldon 1988). There is no reasonto believe that similar short-term changes would not accompany the decline of hemlock for-ests in Delaware Water Gap National Recreation Area (DEWA). However, considerably lessis known about the long-term consequences to headwater stream ecosystems of pest-inducedchanges in forest composition.
The objective of this study was to compare macroinvertebrate and fish community struc-ture and stream habitat in streams draining hemlock and mixed hardwood forests in DEWA.We limited the study to headwater catchments so that forest-specific effects could be isolatedfrom other confounding factors that are present in larger watersheds. Results should yieldinformation useful in predicting the long-term consequences of hemlock decline on aquaticassemblages. Since hemlock regeneration following hemlock woolly adelgid-induced mor-tality is poor, and overstory recruitment is largely limited to mixed hardwood species in af-fected stands (Fuller 1998, Orwig and Foster 1998), we believe our predictions reflect realisticassumptions regarding long-term changes in forest composition.
METHODS
STUDY AREA
Delaware Water Gap National Recreation Area (DEWA) is located in northeastern Pennsyl-vania and western New Jersey. The park encompasses 27,742 hectares of forested hills, ra-vines, and bottom lands straddling the Delaware River. Hemlock stands in DEWA are patchilydistributed, occurring largely on relatively cool, moist sites. Though stands containing sig-nificant amounts of hemlock comprise only about 5% of the forested landscape in DEWA(1130 hectares), where they occur, hemlock often dominates, comprising as much as 77% ofthe basal area in stands (Sullivan et al. 1998). Recent evidence suggests that prior to Euro-American settlement hemlock represented a greater component of many northeastern U.S.forests than it does today, and that present-day hemlock stands are often restricted to perma-
Third Symposium on Hemlock Woolly Adelgid Presentations
Snyder et al. __________________________________________________________________________________
44
nent woodlots with reduced disturbance histories (Foster et al. 1998). In DEWA, many hard-wood stands, especially in ravine terrains, are younger on average than hemlock stands andcontain a large number of cut, decayed hemlock stumps, suggesting that hemlock was likelymore abundant in DEWA in the past.
Hemlock woolly adelgid (HWA) infestations were first detected in DEWA in 1989 anda subsequent survey conducted in 1995 indicated that over half of the Park’s hemlock standswere infested (Evans 1995). Nevertheless, at the time of this study, HWA-induced mortalitywas limited to a few small stands, mostly in the south-eastern portion of the Park. Since thisstudy was conducted, impacts from HWA have increased dramatically (R. Evans, personalcommunication).
LANDSCAPE ANALYSIS AND SAMPLING DESIGN
Our approach was to focus the study on smaller, headwater catchments because larger streamsdrained areas containing both hemlock and mixed hardwood forest, making forest-specificcomparison intractable. In addition, most of these larger watersheds were impacted by hu-mans (e.g., impoundments, agriculture, quarries) that could confound our assessment of theinfluence of hemlock. Even after limiting the study to headwater catchments, other possibleconfounding factors remained; we controlled for landscape variability (i.e., terrain and streamsize) through the sampling design and we excluded others (i.e., minimum catchment area,beaver activity) through site selection. Because the primary objective was to detect a forest-type effect, we chose to study the end points represented by streams draining forest that wereeither dominated by hemlock or dominated by mixed hardwood. In this way, we maximizedthe opportunity to detect a forest-type effect if one existed.
We used geographic information systems (GIS) to characterize the landscape in DEWAand to provide the basis for the terrain-based, paired-site sampling design used in this study.Our goal was to sample across the range of landscape variability in the park and control forthe effects of terrain and stream size prior to comparing aquatic invertebrate community mea-sures between forest types. Ultimately, we selected 14 pairs of watersheds that were similarin terrain (defined by channel slope, aspect, solar radiance, channel shape, and elevation) andstream size but varied in forest species composition. Specifically, one watershed in each pairwas comprised mainly of hemlock and the other watershed in each pair was comprised mainlyof mixed hardwood species. See Young et al. (2002) for a complete description of the studydesign and GIS methods used to stratify sampling.
FIELD SAMPLING
Invertebrate sampling was conducted during the early spring of 1997. Sample reaches weredefined by a distance of 80 m for 1st order streams and 160 m for 2nd order streams. Thesedistances represented approximately 40 mean stream widths and encompassed a minimum ofthree riffle-pool sequences. We took a total of twenty 30-second kick samples with a D-framekick net at random locations within each stream reach. See Snyder et al. (2002) for a completedescription of methods used to collect and process macrinvertebrate samples.
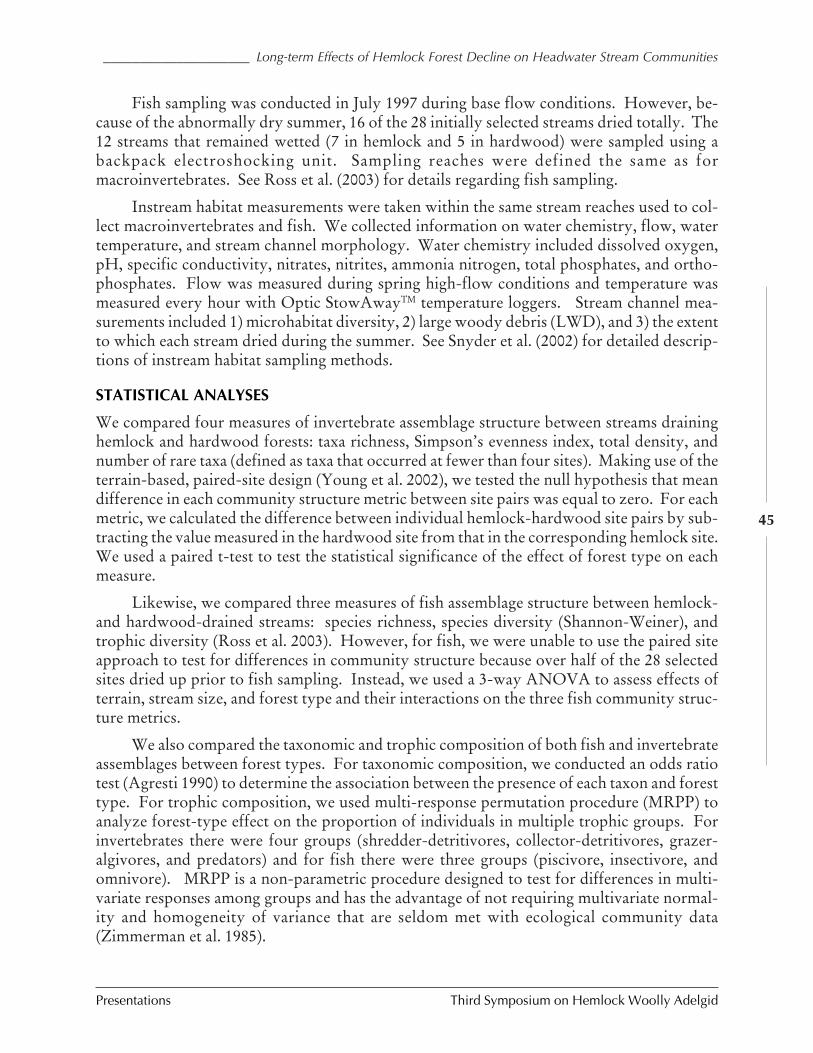
____________________ Long-term Effects of Hemlock Forest Decline on Headwater Stream Communities
Presentations Third Symposium on Hemlock Woolly Adelgid
45
Fish sampling was conducted in July 1997 during base flow conditions. However, be-cause of the abnormally dry summer, 16 of the 28 initially selected streams dried totally. The12 streams that remained wetted (7 in hemlock and 5 in hardwood) were sampled using abackpack electroshocking unit. Sampling reaches were defined the same as formacroinvertebrates. See Ross et al. (2003) for details regarding fish sampling.
Instream habitat measurements were taken within the same stream reaches used to col-lect macroinvertebrates and fish. We collected information on water chemistry, flow, watertemperature, and stream channel morphology. Water chemistry included dissolved oxygen,pH, specific conductivity, nitrates, nitrites, ammonia nitrogen, total phosphates, and ortho-phosphates. Flow was measured during spring high-flow conditions and temperature wasmeasured every hour with Optic StowAwayTM temperature loggers. Stream channel mea-surements included 1) microhabitat diversity, 2) large woody debris (LWD), and 3) the extentto which each stream dried during the summer. See Snyder et al. (2002) for detailed descrip-tions of instream habitat sampling methods.
STATISTICAL ANALYSES
We compared four measures of invertebrate assemblage structure between streams draininghemlock and hardwood forests: taxa richness, Simpson’s evenness index, total density, andnumber of rare taxa (defined as taxa that occurred at fewer than four sites). Making use of theterrain-based, paired-site design (Young et al. 2002), we tested the null hypothesis that meandifference in each community structure metric between site pairs was equal to zero. For eachmetric, we calculated the difference between individual hemlock-hardwood site pairs by sub-tracting the value measured in the hardwood site from that in the corresponding hemlock site.We used a paired t-test to test the statistical significance of the effect of forest type on eachmeasure.
Likewise, we compared three measures of fish assemblage structure between hemlock-and hardwood-drained streams: species richness, species diversity (Shannon-Weiner), andtrophic diversity (Ross et al. 2003). However, for fish, we were unable to use the paired siteapproach to test for differences in community structure because over half of the 28 selectedsites dried up prior to fish sampling. Instead, we used a 3-way ANOVA to assess effects ofterrain, stream size, and forest type and their interactions on the three fish community struc-ture metrics.
We also compared the taxonomic and trophic composition of both fish and invertebrateassemblages between forest types. For taxonomic composition, we conducted an odds ratiotest (Agresti 1990) to determine the association between the presence of each taxon and foresttype. For trophic composition, we used multi-response permutation procedure (MRPP) toanalyze forest-type effect on the proportion of individuals in multiple trophic groups. Forinvertebrates there were four groups (shredder-detritivores, collector-detritivores, grazer-algivores, and predators) and for fish there were three groups (piscivore, insectivore, andomnivore). MRPP is a non-parametric procedure designed to test for differences in multi-variate responses among groups and has the advantage of not requiring multivariate normal-ity and homogeneity of variance that are seldom met with ecological community data(Zimmerman et al. 1985).
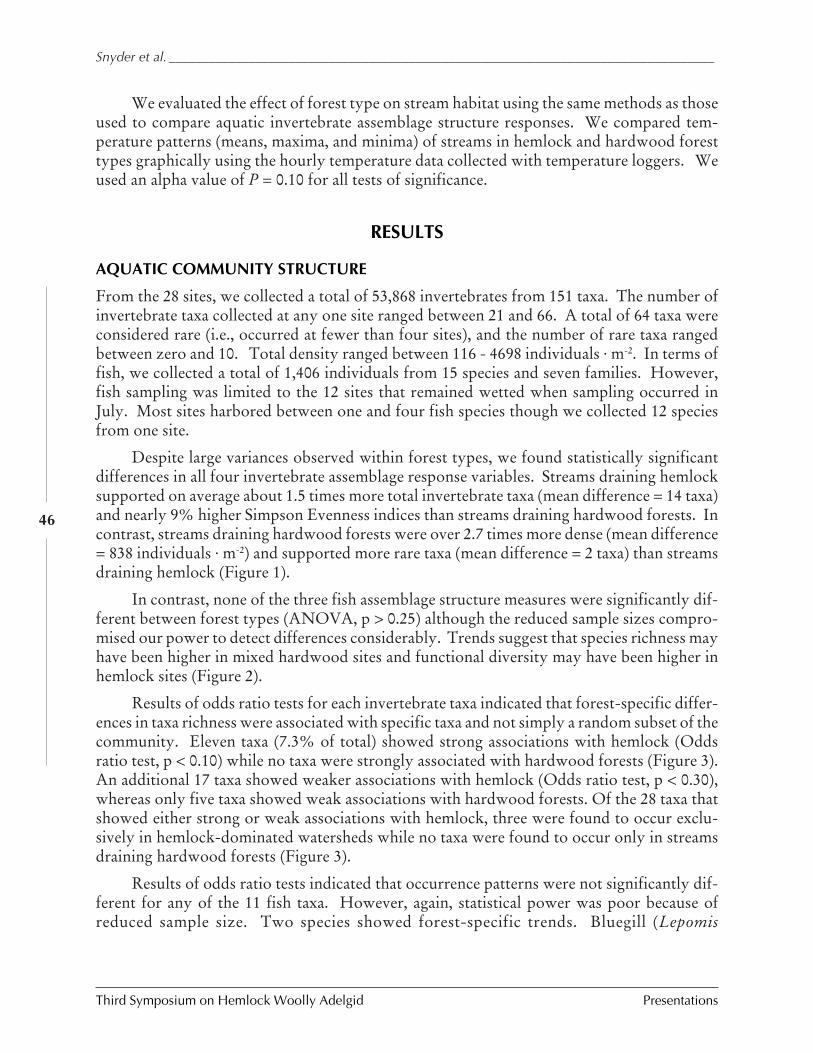
Third Symposium on Hemlock Woolly Adelgid Presentations
Snyder et al. __________________________________________________________________________________
46
We evaluated the effect of forest type on stream habitat using the same methods as thoseused to compare aquatic invertebrate assemblage structure responses. We compared tem-perature patterns (means, maxima, and minima) of streams in hemlock and hardwood foresttypes graphically using the hourly temperature data collected with temperature loggers. Weused an alpha value of P = 0.10 for all tests of significance.
RESULTS
AQUATIC COMMUNITY STRUCTURE
From the 28 sites, we collected a total of 53,868 invertebrates from 151 taxa. The number ofinvertebrate taxa collected at any one site ranged between 21 and 66. A total of 64 taxa wereconsidered rare (i.e., occurred at fewer than four sites), and the number of rare taxa rangedbetween zero and 10. Total density ranged between 116 - 4698 individuals · m-2. In terms offish, we collected a total of 1,406 individuals from 15 species and seven families. However,fish sampling was limited to the 12 sites that remained wetted when sampling occurred inJuly. Most sites harbored between one and four fish species though we collected 12 speciesfrom one site.
Despite large variances observed within forest types, we found statistically significantdifferences in all four invertebrate assemblage response variables. Streams draining hemlocksupported on average about 1.5 times more total invertebrate taxa (mean difference = 14 taxa)and nearly 9% higher Simpson Evenness indices than streams draining hardwood forests. Incontrast, streams draining hardwood forests were over 2.7 times more dense (mean difference= 838 individuals · m-2) and supported more rare taxa (mean difference = 2 taxa) than streamsdraining hemlock (Figure 1).
In contrast, none of the three fish assemblage structure measures were significantly dif-ferent between forest types (ANOVA, p > 0.25) although the reduced sample sizes compro-mised our power to detect differences considerably. Trends suggest that species richness mayhave been higher in mixed hardwood sites and functional diversity may have been higher inhemlock sites (Figure 2).
Results of odds ratio tests for each invertebrate taxa indicated that forest-specific differ-ences in taxa richness were associated with specific taxa and not simply a random subset of thecommunity. Eleven taxa (7.3% of total) showed strong associations with hemlock (Oddsratio test, p < 0.10) while no taxa were strongly associated with hardwood forests (Figure 3).An additional 17 taxa showed weaker associations with hemlock (Odds ratio test, p < 0.30),whereas only five taxa showed weak associations with hardwood forests. Of the 28 taxa thatshowed either strong or weak associations with hemlock, three were found to occur exclu-sively in hemlock-dominated watersheds while no taxa were found to occur only in streamsdraining hardwood forests (Figure 3).
Results of odds ratio tests indicated that occurrence patterns were not significantly dif-ferent for any of the 11 fish taxa. However, again, statistical power was poor because ofreduced sample size. Two species showed forest-specific trends. Bluegill (Lepomis
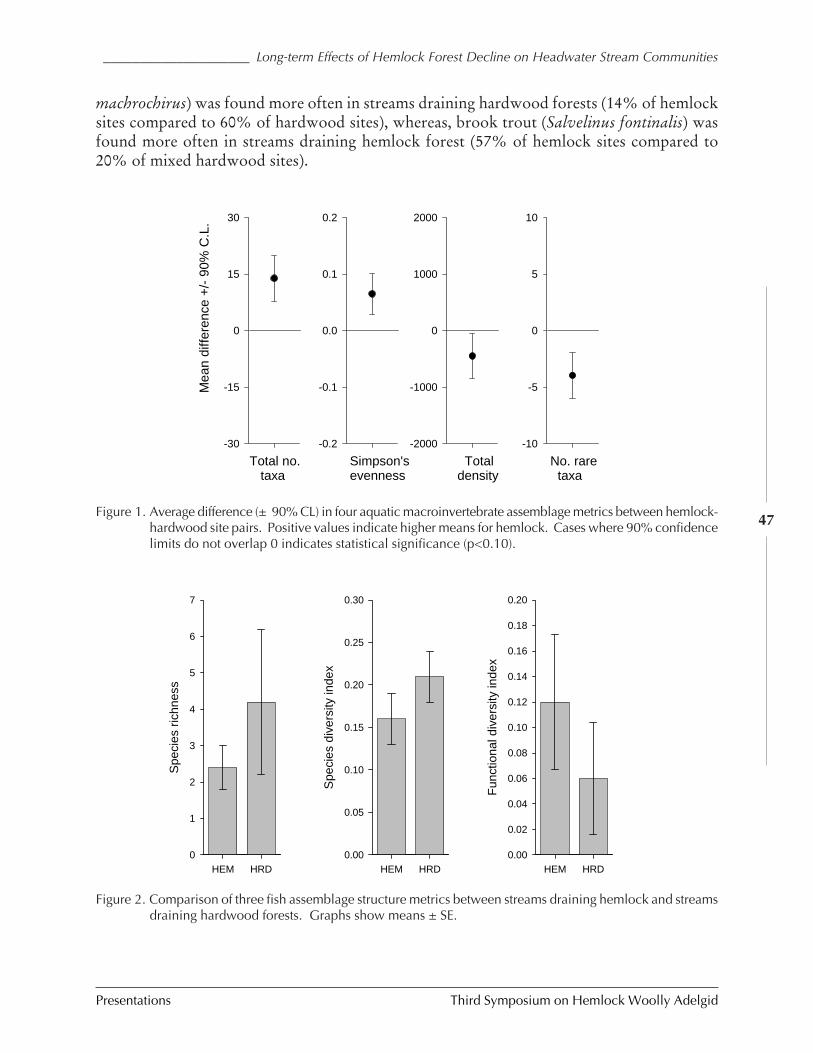
____________________ Long-term Effects of Hemlock Forest Decline on Headwater Stream Communities
Presentations Third Symposium on Hemlock Woolly Adelgid
47
HEM HRD
Spe
cies
ric
hnes
s
0
1
2
3
4
5
6
7
HEM HRD
Spe
cies
div
ersi
ty in
dex
0.00
0.05
0.10
0.15
0.20
0.25
0.30
HEM HRD
Fun
ctio
nal d
iver
sity
inde
x
0.00
0.02
0.04
0.06
0.08
0.10
0.12
0.14
0.16
0.18
0.20
Figure 2. Comparison of three fish assemblage structure metrics between streams draining hemlock and streamsdraining hardwood forests. Graphs show means ± SE.
-30
-15
0
15
30
-0.2
-0.1
0.0
0.1
0.2
-2000
-1000
0
1000
2000
-10
-5
0
5
10
Total no. taxa
Simpson'sevenness
Totaldensity
No. rare taxa
Mea
n di
ffere
nce
+/-
90%
C.L
.
Figure 1. Average difference (± 90% CL) in four aquatic macroinvertebrate assemblage metrics between hemlock-hardwood site pairs. Positive values indicate higher means for hemlock. Cases where 90% confidencelimits do not overlap 0 indicates statistical significance (p<0.10).
machrochirus) was found more often in streams draining hardwood forests (14% of hemlocksites compared to 60% of hardwood sites), whereas, brook trout (Salvelinus fontinalis) wasfound more often in streams draining hemlock forest (57% of hemlock sites compared to20% of mixed hardwood sites).
Third Symposium on Hemlock Woolly Adelgid Presentations
Snyder et al. __________________________________________________________________________________
48
Trophic composition of invertebrate assemblages (i.e., the proportion of individuals ineach of the four trophic groups) also differed between streams draining hemlock and hard-wood forests (ä = 2.18; p = 0.009). Predators comprised a significantly larger fraction andgrazer-algivores a significantly smaller fraction of the invertebrate assemblage in hemlock-drained streams (Figure 4). The proportion of individuals as shredders and collectors did notdiffer between forest types.
We also observed forest-specific differences in trophic composition for fish (Figure 5).On average, insectivores comprised a significantly larger fraction of the fish community inmixed hardwood sites (mean proportion = 0.77) than in hemlock sites (mean = 0.34) (ANOVA,F = 3.39, p = 0.09), whereas piscivores were proportionally more abundant in hemlock sites(mean = 0.61) than in hardwood sites (mean = 0.21) (ANOVA, F = 2.36, p = 0.15).
STREAM HABITAT
Water chemistry was highly variable among DEWA streams, with several variables exceedingan order of magnitude in range. However, mean differences between hemlock-hardwood sitepairs were not significantly different from zero for any of the eight water chemistry variableswe measured. Similarly, forest-type did not affect spring discharge, microhabitat diversity,or the frequency of large wood debris.
Median daily stream temperatures at hemlock sites tended to be cooler in the summer,warmer in the winter, and less variable throughout the year. Perhaps even more important tothe species that inhabit these streams are the extremes in temperatures in which they are ex-posed. In particular, we found that summer daily maxima were lower and summer dailyminima were higher in hemlock-drained streams. For example, summer daily maxima instreams draining hardwood forests exceeded 20oC over 18% of the time compared to less
0.0
0.1
0.2
0.3
0.4
0.5
0.6
0.7
0.8
0.9
P-v
alu
e
HEMLOCKHARDWOOD
Figure 3. Results of odds ratio test to determine taxa-specific associations with vegetation types. For each taxa,ratio of occurrence in streams draining hemlock to that draining hardwood was used, and therefore,positive values indicate a preference for hemlock. Figure 3 shows the significance as a function of theodds ratio. Species with p-values less than 0.1 were deemed strong associates and those with valuesbetween 1.0 and 0.3 were deemed weak associates.
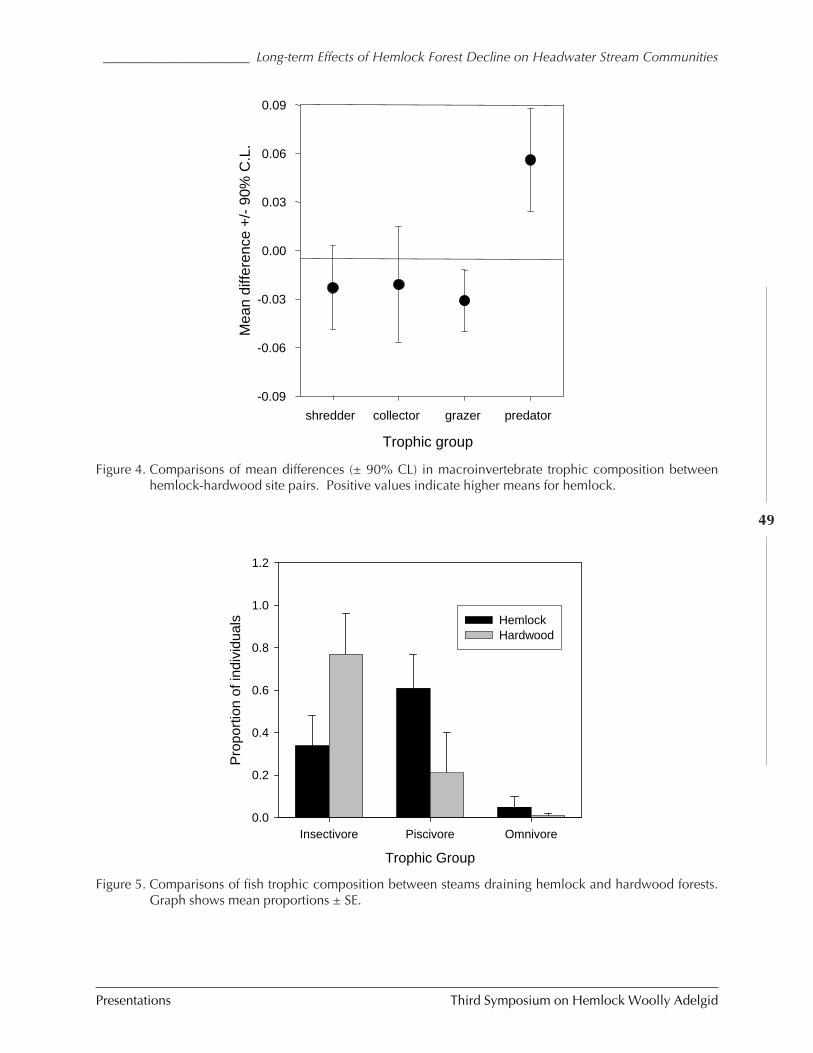
____________________ Long-term Effects of Hemlock Forest Decline on Headwater Stream Communities
Presentations Third Symposium on Hemlock Woolly Adelgid
49
0.09
Mea
n di
ffere
nce
+/-
90%
C.L
.
-0.06
-0.03
0.00
0.03
0.06
-0.09
shredder collector grazer predator
Trophic group
Figure 4. Comparisons of mean differences (± 90% CL) in macroinvertebrate trophic composition betweenhemlock-hardwood site pairs. Positive values indicate higher means for hemlock.
Trophic Group
Insectivore Piscivore Omnivore
Pro
port
ion
of in
divi
dual
s
0.0
0.2
0.4
0.6
0.8
1.0
1.2
HemlockHardwood
Figure 5. Comparisons of fish trophic composition between steams draining hemlock and hardwood forests.Graph shows mean proportions ± SE.
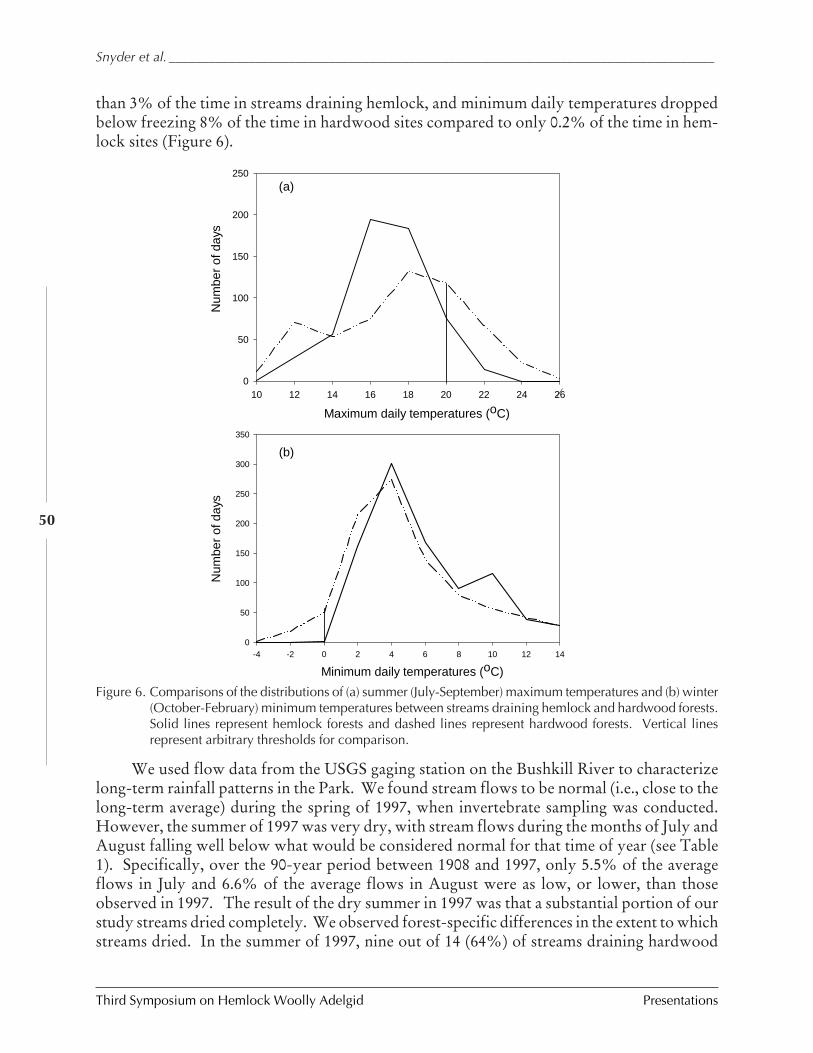
Third Symposium on Hemlock Woolly Adelgid Presentations
Snyder et al. __________________________________________________________________________________
50
than 3% of the time in streams draining hemlock, and minimum daily temperatures droppedbelow freezing 8% of the time in hardwood sites compared to only 0.2% of the time in hem-lock sites (Figure 6).
Figure 6. Comparisons of the distributions of (a) summer (July-September) maximum temperatures and (b) winter(October-February) minimum temperatures between streams draining hemlock and hardwood forests.Solid lines represent hemlock forests and dashed lines represent hardwood forests. Vertical linesrepresent arbitrary thresholds for comparison.
-4 -2 0 2 4 6 8 10 12 140
50
100
150
200
250
300
350
Num
ber
of d
ays
Maximum daily temperatures (oC)
Minimum daily temperatures (oC)
10 12 14 16 18 20 22 24 260
50
100
150
200
250
Num
ber
of d
ays
(a)
(b)
We used flow data from the USGS gaging station on the Bushkill River to characterizelong-term rainfall patterns in the Park. We found stream flows to be normal (i.e., close to thelong-term average) during the spring of 1997, when invertebrate sampling was conducted.However, the summer of 1997 was very dry, with stream flows during the months of July andAugust falling well below what would be considered normal for that time of year (see Table1). Specifically, over the 90-year period between 1908 and 1997, only 5.5% of the averageflows in July and 6.6% of the average flows in August were as low, or lower, than thoseobserved in 1997. The result of the dry summer in 1997 was that a substantial portion of ourstudy streams dried completely. We observed forest-specific differences in the extent to whichstreams dried. In the summer of 1997, nine out of 14 (64%) of streams draining hardwood
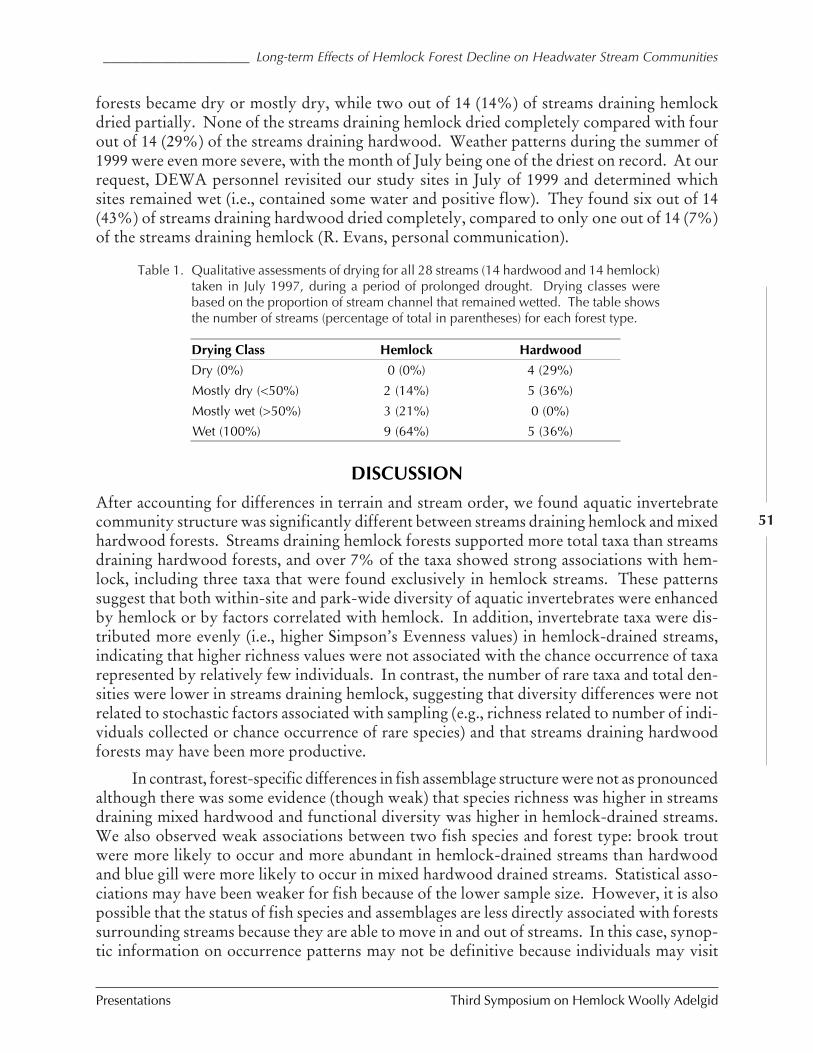
____________________ Long-term Effects of Hemlock Forest Decline on Headwater Stream Communities
Presentations Third Symposium on Hemlock Woolly Adelgid
51
forests became dry or mostly dry, while two out of 14 (14%) of streams draining hemlockdried partially. None of the streams draining hemlock dried completely compared with fourout of 14 (29%) of the streams draining hardwood. Weather patterns during the summer of1999 were even more severe, with the month of July being one of the driest on record. At ourrequest, DEWA personnel revisited our study sites in July of 1999 and determined whichsites remained wet (i.e., contained some water and positive flow). They found six out of 14(43%) of streams draining hardwood dried completely, compared to only one out of 14 (7%)of the streams draining hemlock (R. Evans, personal communication).
Table 1. Qualitative assessments of drying for all 28 streams (14 hardwood and 14 hemlock)taken in July 1997, during a period of prolonged drought. Drying classes werebased on the proportion of stream channel that remained wetted. The table showsthe number of streams (percentage of total in parentheses) for each forest type.
Drying Class Hemlock Hardwood
Dry (0%) 0 (0%) 4 (29%)
Mostly dry (<50%) 2 (14%) 5 (36%)
Mostly wet (>50%) 3 (21%) 0 (0%)
Wet (100%) 9 (64%) 5 (36%)
DISCUSSION
After accounting for differences in terrain and stream order, we found aquatic invertebratecommunity structure was significantly different between streams draining hemlock and mixedhardwood forests. Streams draining hemlock forests supported more total taxa than streamsdraining hardwood forests, and over 7% of the taxa showed strong associations with hem-lock, including three taxa that were found exclusively in hemlock streams. These patternssuggest that both within-site and park-wide diversity of aquatic invertebrates were enhancedby hemlock or by factors correlated with hemlock. In addition, invertebrate taxa were dis-tributed more evenly (i.e., higher Simpson’s Evenness values) in hemlock-drained streams,indicating that higher richness values were not associated with the chance occurrence of taxarepresented by relatively few individuals. In contrast, the number of rare taxa and total den-sities were lower in streams draining hemlock, suggesting that diversity differences were notrelated to stochastic factors associated with sampling (e.g., richness related to number of indi-viduals collected or chance occurrence of rare species) and that streams draining hardwoodforests may have been more productive.
In contrast, forest-specific differences in fish assemblage structure were not as pronouncedalthough there was some evidence (though weak) that species richness was higher in streamsdraining mixed hardwood and functional diversity was higher in hemlock-drained streams.We also observed weak associations between two fish species and forest type: brook troutwere more likely to occur and more abundant in hemlock-drained streams than hardwoodand blue gill were more likely to occur in mixed hardwood drained streams. Statistical asso-ciations may have been weaker for fish because of the lower sample size. However, it is alsopossible that the status of fish species and assemblages are less directly associated with forestssurrounding streams because they are able to move in and out of streams. In this case, synop-tic information on occurrence patterns may not be definitive because individuals may visit
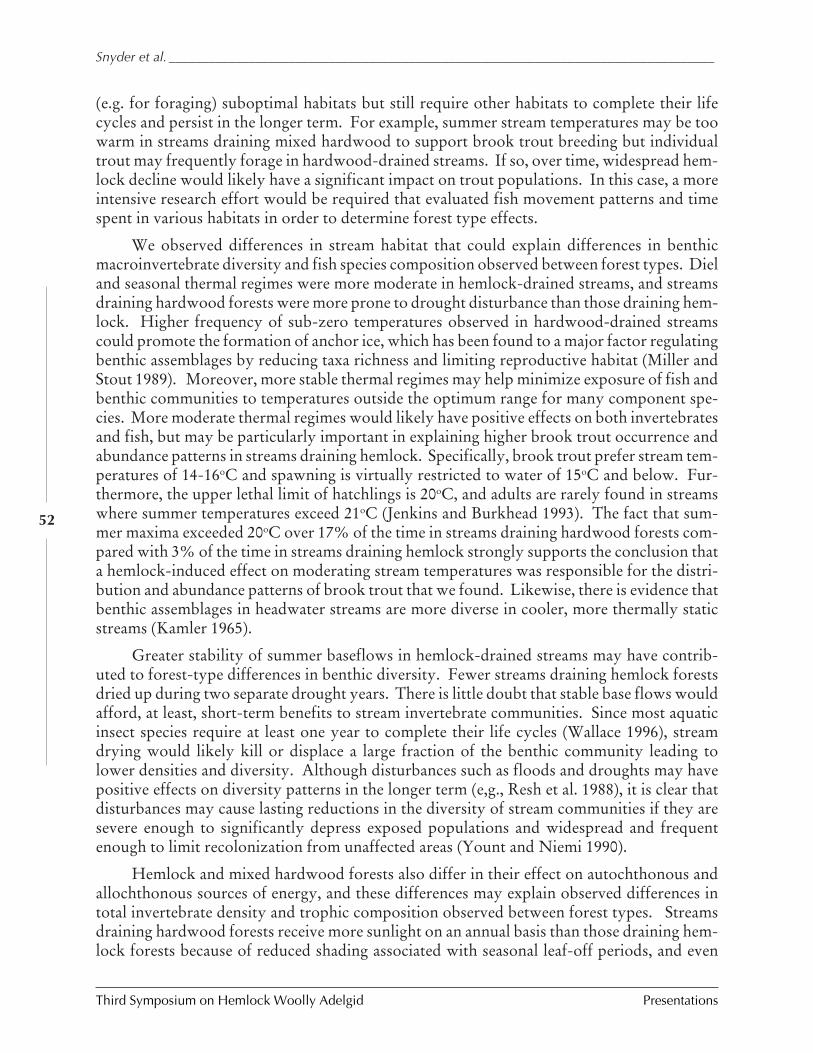
Third Symposium on Hemlock Woolly Adelgid Presentations
Snyder et al. __________________________________________________________________________________
52
(e.g. for foraging) suboptimal habitats but still require other habitats to complete their lifecycles and persist in the longer term. For example, summer stream temperatures may be toowarm in streams draining mixed hardwood to support brook trout breeding but individualtrout may frequently forage in hardwood-drained streams. If so, over time, widespread hem-lock decline would likely have a significant impact on trout populations. In this case, a moreintensive research effort would be required that evaluated fish movement patterns and timespent in various habitats in order to determine forest type effects.
We observed differences in stream habitat that could explain differences in benthicmacroinvertebrate diversity and fish species composition observed between forest types. Dieland seasonal thermal regimes were more moderate in hemlock-drained streams, and streamsdraining hardwood forests were more prone to drought disturbance than those draining hem-lock. Higher frequency of sub-zero temperatures observed in hardwood-drained streamscould promote the formation of anchor ice, which has been found to a major factor regulatingbenthic assemblages by reducing taxa richness and limiting reproductive habitat (Miller andStout 1989). Moreover, more stable thermal regimes may help minimize exposure of fish andbenthic communities to temperatures outside the optimum range for many component spe-cies. More moderate thermal regimes would likely have positive effects on both invertebratesand fish, but may be particularly important in explaining higher brook trout occurrence andabundance patterns in streams draining hemlock. Specifically, brook trout prefer stream tem-peratures of 14-16oC and spawning is virtually restricted to water of 15oC and below. Fur-thermore, the upper lethal limit of hatchlings is 20oC, and adults are rarely found in streamswhere summer temperatures exceed 21oC (Jenkins and Burkhead 1993). The fact that sum-mer maxima exceeded 20oC over 17% of the time in streams draining hardwood forests com-pared with 3% of the time in streams draining hemlock strongly supports the conclusion thata hemlock-induced effect on moderating stream temperatures was responsible for the distri-bution and abundance patterns of brook trout that we found. Likewise, there is evidence thatbenthic assemblages in headwater streams are more diverse in cooler, more thermally staticstreams (Kamler 1965).
Greater stability of summer baseflows in hemlock-drained streams may have contrib-uted to forest-type differences in benthic diversity. Fewer streams draining hemlock forestsdried up during two separate drought years. There is little doubt that stable base flows wouldafford, at least, short-term benefits to stream invertebrate communities. Since most aquaticinsect species require at least one year to complete their life cycles (Wallace 1996), streamdrying would likely kill or displace a large fraction of the benthic community leading tolower densities and diversity. Although disturbances such as floods and droughts may havepositive effects on diversity patterns in the longer term (e,g., Resh et al. 1988), it is clear thatdisturbances may cause lasting reductions in the diversity of stream communities if they aresevere enough to significantly depress exposed populations and widespread and frequentenough to limit recolonization from unaffected areas (Yount and Niemi 1990).
Hemlock and mixed hardwood forests also differ in their effect on autochthonous andallochthonous sources of energy, and these differences may explain observed differences intotal invertebrate density and trophic composition observed between forest types. Streamsdraining hardwood forests receive more sunlight on an annual basis than those draining hem-lock forests because of reduced shading associated with seasonal leaf-off periods, and even
____________________ Long-term Effects of Hemlock Forest Decline on Headwater Stream Communities
Presentations Third Symposium on Hemlock Woolly Adelgid
53
during leaf-on periods hemlock forests filter out more sunlight than mixed hardwood forests(Hadley 2000). Because light appears to be the primary factor limiting primary production inthese forested headwater stream environments (Wellnitz et al. 1996), increases in incidentlight would stimulate more algal production, potentially increasing the total energy inputsand broadening the food base for stream invertebrates (Lamberti and Steinman 1997). Ourobservation that grazing algivores represented a larger fraction of the benthic community inhardwood-drained streams suggests an assemblage response to higher primary production.Smock and MacGregor (1988) showed that similar changes in trophic composition may haveoccurred following changes in forest composition due to the chestnut blight of the early 1900s.
Although there is some evidence that hemlock and other conifers contribute moreallochthonous inputs annually than mixed hardwood forests (Anderson and Sedell 1979, Molles1982), much of that energy is not available as food for aquatic macroinvertebrates (Websterand Benfield 1986), and so hemlock forests may provide less-usable allochthonous energythan mixed hardwood forests. Thus, in addition to more autochthonous-derived energy,greater contributions of high quality leaf litter may also contribute to the higher total abun-dances of benthic invertebrates we observed in hardwood-drained streams.
Taken together, the results of the present study indicate that headwater streams drainedby hemlock and mixed hardwood forests support substantially different benthic communi-ties, and notable differences in fish assemblages, though fish results are less clear. Further,our results suggest that forest-type differences in light and temperature regimes, stability ofsummer baseflows, and quality of allochthonous inputs are proximate causes of observeddifferences in benthic assemblage structure and composition. Based on these associations, wepredict that pest-induced declines in hemlock will have long-term consequences for aquaticassemblages including a reduction in invertebrate diversity, a change in fish and invertebratetrophic structure, and possibly a decline in brook trout populations. Concern over troutfisheries may be even more pronounced in more southern areas where hemlock may be evenmore important in maintaining cooler summer temperatures required by trout.
ACKNOWLEDGMENTS
We thank R. Evans, E. Johnson, A. Ambler, K. High, and J. Schreiner of the Delaware WaterGap National Recreation Area for providing digital maps and logistical support for field work.Funding for the research was obtained through the National Park Service’s Natural ResourcesPreservation Program (NRPP).
REFERENCES
Agresti, A. 1990. Categorical data analysis. John Wiley and Sons, New York, New York.
Evans, R.A. 1995. Hemlock ravines at Delaware Water Gap National Recreation Area:Highly valued, distinctive and threatened ecosystems. Delaware Water Gap NationalRecreation Area 30th Anniversary symposium, Milford, Pennsylvania.
Foster, D.R., G. Motzkin, and B. Slater. 1998. Land-use history as long-term broad-scaledisturbance: regional forest dynamics in central New England. Ecosystems 1:96-119.
Third Symposium on Hemlock Woolly Adelgid Presentations
Snyder et al. __________________________________________________________________________________
54
Fuller, J. L. 1998. Ecological impact of the mid-Holocene hemlock decline in southernOntario, Canada. Ecology 79:2237-2351.
Gregory, K.J. 1992. Vegetation and river channel process interactions, pp. 255-269. InRiver Conservation and Management, ed. P.J. Boon, P. Calow, and G.E. Petts. JohnWiley and Sons Limited, West Sussex, England.
Hadley, J.L. 2000. Understory microclimate and photosynthestic response of saplings inan old-growth eastern hemlock (Tsuga canadensis L.) forest. Ecoscience 7:66-72.
Jenkins, R.E. and N.M. Burkhead. 1993. Freshwater Fishes of Virginia. American Fisher-ies Society, Bethesda, Maryland.
Kamler, E. 1965. Thermal conditions in mountain waters and their influence on the distri-bution of Plecoptera and Ephemeroptera larvae. Komitet Ekologiczny - PolskaAkademia Nauk 13:377-414.
Lamberti, G.A. and A.D. Steinman. 1997. A comparison of primary production in streamecosystems. Pages 95-104 J. R. Webster and J. L. Meyer (editors). Stream organic matterbudgets. Journal of the North American Bentholgical Society 16:3-161.
Likens, G.E., F.H. Bormann, N.M. Johnson, D.W. Fisher, and R.S. Pierce. 1970. Theeffects of forest cutting and herbicide treatment on nutrient budgets in the HubbardBrook watershed-ecosystem. Ecological Monographs 40:23-47.
McManus, K.A., K.S. Shields, and D.R. Souto. 1999. Proceedings: Symposium on sustain-able management of hemlock ecosystems in eastern North America. General TechnicalReport NE-267. U.S. Forest Service, Northeast Area.
Miller, M. C. and J.R. Stout. 1989. Variability of macroinvertebrate community composi-tion in an Arctic and Subarctic stream. High Latitude Limnology 172:111-127.
Molles, M.C. 1982. Trichopteran communities of streams associated with aspen and coni-fer forests: Long-term structural change. Ecology 63:1-6.
Naiman, R.J., H. Décamps, J. Pastor, and C.A. Johnston. 1988. The potential importanceof boundaries to fluvial ecosystems. Journal of the North American Benthological Society7:289-306.
Orwig, D.A. and D.R. Foster. 1998. Forest response to the introduced hemlock woollyadelgid in southern New England, USA. Journal of the Torrey Botanical Society 125:60-73.
Resh, V.H., A.V. Brown, A.P. Covich, M.E. Gurtz, H.W. Li, G.W. Minshall, S.R. Reice,A.L. Sheldon, J.B. Wallace, and R.C. Wissmar. 1988. The role of disturbance in streamecology. Journal of the North American Benthological Society 7:433-455.
Ross, R.M., R.M. Bennett, C.D. Snyder, J.A. Young, D.R. Smith, D. R., and D.P. Lemarie.2003. Influence of eastern hemlock (Tsuga canadensis L.) on fish community structureand function in headwater streams of the Delaware River basin. Ecology of FreshwaterFish 12:60-65.
____________________ Long-term Effects of Hemlock Forest Decline on Headwater Stream Communities
Presentations Third Symposium on Hemlock Woolly Adelgid
55
Sheldon, A.L. 1988. Conservation of stream fishes: patterns of diversity, rarity, and risk.Conservation Biology 2:149-156.
Smock, L.A. and C.M. MacGregor. 1988. Impact of the American chestnut blight onaquatic shredding macroinvertebrates. Journal of the North American BenthologicalSociety 7:212-221.
Snyder, C.D., J.A. Young, D.P. Lemarie, and D.R. Smith. 2002. Influence of easternhemlock (Tsuga canadensis) forests on aquatic invertebrate assemblages in headwaterstreams. Canadian Journal of Fisheries and Aquatic Sciences 59:262-275.
Stout, B.M., III., E.F. Benfield, and J.R.Webster. 1992. Effects of forest disturbance onshredder production in southern Appalachian headwater streams. Freshwater Biology29:59-69.
Sullivan, K, B. Black, C. Mahan, M. Abrams, K.C. Kim, and R. Yahner. 1998. Overstorytree composition of hemlock and hardwood stands in Delaware Water Gap NationalRecreation Area. Center for Biodiversity Research, Environmental Resources ResearchInstitute, Pennsylvania State University, University Park, Pennsylvania.
Wallace, J.B. and M.E. Gurtz. 1986. Response of Baetis mayflies (Ephemeroptera) tocatchment logging. American Midland Naturalist 115:25-41.
Wallace, J.B. 1996. Habitat, life history, and behavioral adaptations of aquatic insects, pp.41-73. In Aquatic insects of North America, ed. R. W. Merritt and K. W. Cummins.Kendall/Hunt Publishing, Dubuque, Iowa.
Webster, J.R. and E.F. Benfield. 1986. Vascular plant breakdown in freshwater ecosys-tems. Annual Review of Ecology and Systematics 17:567-594.
Webster, J.R., S.W. Golladay, E.F. Benfield, E. F., J.L. Meyer, W.T. Swank, and J.B.Wallace. 1992. Catchment disturbance and stream response: An overview of streamresearch at Coweeta Hydrologic laboratory, pp. 231-253. In River Conservation andManagement, ed. P.J. Boon, P. Calow, and G.E. Petts. John Wiley and Sons Limited,West Sussex, England.
Wellnitz, T.A., R.B. Radar, and J.V. Ward. 1996. Importance of light and nutrients instructuring an algal community in a Rocky Mountain stream. Journal of FreshwaterEcology 11:399-413.
Young, J.A., D.R. Smith, C.D. Snyder, and D.P. Lemarié. 2002. A terrain-based paired-site sampling design to assess biodiversity losses from eastern hemlock decline. Environ-mental Monitoring and Assessment 76:167-183.
Yount, J.D. and G.J. Niemi. 1990. Recovery of lotic communities and ecosystems fromdisturbance-A narrative review of case studies. Environmental Management 14:547-569.
Zimmerman, G.M., H. Goetz, and P.W. Mielke, Jr.. 1985. Use of an improved statisticalmethod for group comparisons to study effects of prairie fire. Ecology 66:606-611.
Third Symposium on Hemlock Woolly Adelgid Presentations
Figden et al. __________________________________________________________________________________
56
BINOMIAL SAMPLING PLAN FOR ADELGES TSUGAE ON EASTERN HEMLOCK
Jeffrey G. Fidgen1, David E. Legg2, and Scott M. Salom1
1Department of Entomology, Virginia Tech,Blacksburg, VA 24061-0319
2Department of Renewable Resources, University of Wyoming,Laramie, WY 82071-3354
ABSTRACT
The hemlock woolly adelgid is an exotic insect pest of eastern hemlock, Tsuga canadensis (L.)Carr., and Carolina hemlock, T. caroliniana Engelm., in the eastern United States. Despite asignificant amount of research and management of Adelges tsugae (Homoptera: Adelgindae),no statistically based sampling method exists for this tiny and numerous pest. Binomial se-quential sampling is currently very popular because it is one sampling plan that gives signifi-cant savings of cost and time. We developed an adelgid binomial sequential sampling (HWABSSP) plan for individual hemlock trees at action thresholds of 10% and 30% of new shootsinfested with at least one sistens. The HWA BSSP was validated with 210 datasets (trees)sampled across the eastern United States. Compared to a whole sample method (avgn = 228shoots per tree) that would be used in lieu of the HWA BSSP, the average number of shootsamples inspected to give acceptable levels of accuracy was 81% and 86% lower at the 10%and 30% thresholds, respectively. The plan requires from 12 to 15 minutes to complete pertree.
We also developed a method of assessing A. tsugae infestations in situ with the originalHWA BSSP. This method involves randomly selecting four lower crown branches per treeand counting the number of shoots infested on the first five new shoots on each branch. Thiscount is compared to the HWA BSSP and infestation levels are classified accordingly if thecount is lower or greater than the lower and upper stop sampling boundaries, respectively. Ifthe count remains within the boundary, the number of new shoots infested by at least oneadelgid must be counted on the next five new shoots on the same branches, etc. After eachround of counts, the total value is compared to the appropriate threshold plan and the infes-tation is classified (low, high, or continue sampling) accordingly. If 80 new shoots have beenexamined (20 per branch) without reaching a classification decision, the infestation is classi-fied as indeterminate and should be re-evaluated in six months. We have sampled 48 treeswith this method, and infestations were classified with 100% accuracy. This method re-quired an average of two minutes to classify infestations on individual trees, provided lowercrown branches were accessible and had sufficient new growth.
KEYWORDS
Binomial, sequential sampling, hemlock, Adelges tsugae.
_______________________________ Sampling for Detection and Monitoring of Hemlock Woolly Adelgid
Presentations Third Symposium on Hemlock Woolly Adelgid
57
SAMPLING FOR DETECTION AND MONITORING OF HEMLOCK WOOLLY ADELGID
WITHIN HEMLOCK STANDS
Scott D. Costa
Entomology Research Laboratory, Department of Plant and Soil Science,College of Agriculture and Life Sciences, University of Vermont,
Burlington, VT 05405
ABSTRACT
The hemlock woolly adelgid (Adelges tsugae) has been spreading through eastern UnitedStates for over 50 years, destroying hemlock forests and dramatically changing the landscape.However, the lack of an efficient sampling plan for detecting new infestations and quantify-ing the percentage of infested trees hampers foresters and researchers. A survey of 1,700 treesin 17 sites with a wide range of infestations forms the basis of the hemlock woolly adelgid(HWA) sampling plan. This is a statistically based plan that allows for defined reliability ofpopulation estimates. Yet the plan is relatively straightforward in its execution and is flexibleenough to accommodate various sampling goals: the forest practitioner surveys two ground-level branches per hemlock tree for the presence or absence of white woolly masses of adelgidon 1-meter terminal sections; between eight and 100 trees are sampled depending on howmany positive trees are found. This allows determination of the percentage of trees infested atthe specified precision level (0.25). No sampling plan can ever confirm that a hemlock standis free of HWA. However, after sampling 100 trees and finding no HWA, the conclusionmade with 75% reliability using this plan is that HWA infest less than 2% of the trees. Vari-ous levels of assuredness of detection are outlined relative to sampling effort.
KEYWORDS
Binomial, sampling, detection, monitoring, range.
INTRODUCTION
For over 50 years, the hemlock woolly adelgid (Adelges tsugae) has been spreading througheastern United States (Cheah et al. 2004), and yet no statistically based sampling plan has beendeveloped that allows for the efficient detection and characterization of infestations. A stan-dardized plan would facilitate monitoring of range expansion, aid in directing and gaugingthe success of management efforts, and serve as a valuable research tool. The primary goals ofthe hemlock woolly adelgid sampling plan (HSP) are to determine if HWA are in a forestedstand (detection) and, if present, the level of infestation (characterization). Many sampling
Third Symposium on Hemlock Woolly Adelgid Presentations
Costa _______________________________________________________________________________________
58
plans are created and never widely adopted. For a plan to be adopted, foresters expect the planto be simple, practical, and have a defined reliability.
Routine sampling of branches above the lower crown (outside of arms reach) is ineffi-cient when relatively large numbers of trees must be examined. For this reason, the HSP isbased on sampling lower branches. However, the question might be asked whether or notthese lower branches are representative of HWA presence throughout the canopy. Fidgen(personal communication) examined both lower and mid-crown branches of 78 hemlock treesfor the presence or absence of HWA. He found that, in over 60% of the trees, both crownstrata were infested. When only one stratum was infested, it was invariably the lower crown,which tended to occur with lower density populations. Therefore, sampling lower branches,when available, should give an indication of a trees infestation status. Although countingadelgid on hemlock trees is not impossible under field conditions, routine counting for sam-pling is not practical because of their small size and the presence of multiple life stages.
PLAN DEVELOPMENT
A binomial sampling plan where the presence or absence of HWA white woolly masses isassessed forms the basis of the general sampling plan structure. Development of the HSP wasfacilitated through funding from Harvard Forest Summer Research Program in Ecology. Theintern, Joseph Brown of Holyoke Community College, collected an extensive dataset thatformed the foundation for creating the HSP. A standard statistical approach was taken inwhich progressively larger areas of the lower branches of hemlock trees were sampled (i.e.,five branchlets on each of two branches, a 1-meter terminal section of two lower branches onopposite sides of the tree, and all the lower branches of a tree). Additionally, counts of whitewoolly masses were taken from each of the branchlets examined. This data was collected sothat the proportion of infested trees could be related to the relative size of HWA populationswithin a stand. Four blocks of 25 trees were examined within each of 17 sites for a total of1,700 trees surveyed. Trees within a stand were randomly selected for sampling by taking 25paces in random cardinal directions and selecting the closest available hemlock tree.
A thorough treatment of the foundation data is not the subject of this paper. However,mention of certain results is necessary for clarity and to instill user confidence in the frame-work from which the HSP was developed. Infestation levels within the 17 stands examinedranged from 0 to nearly 100% trees infested, with the three sampling methods providingsimilar results (Figure 1). While sampling of all lower branches tended to indicate higherinfestation levels, the two branch sample was selected to create a more uniform sample amongtrees of different sizes and to give the sampler a finer focus in searching for adelgid whitewoolly masses, especially when densities are low.
A variety of equations were either applied to the data or used to define sampling param-eters. Taylor’s power law (Taylor 1961) analysis of the variance to mean regression of thesummed count data averaged by tree found a significant (P < 0.05) relationship of these pa-rameters (Taylor’s a = 7.96 and b = 1.499 with r2 = 0.96). When the Taylor values were incor-porated into the Wilson and Room (1983) model for predicting percentage trees infested, a
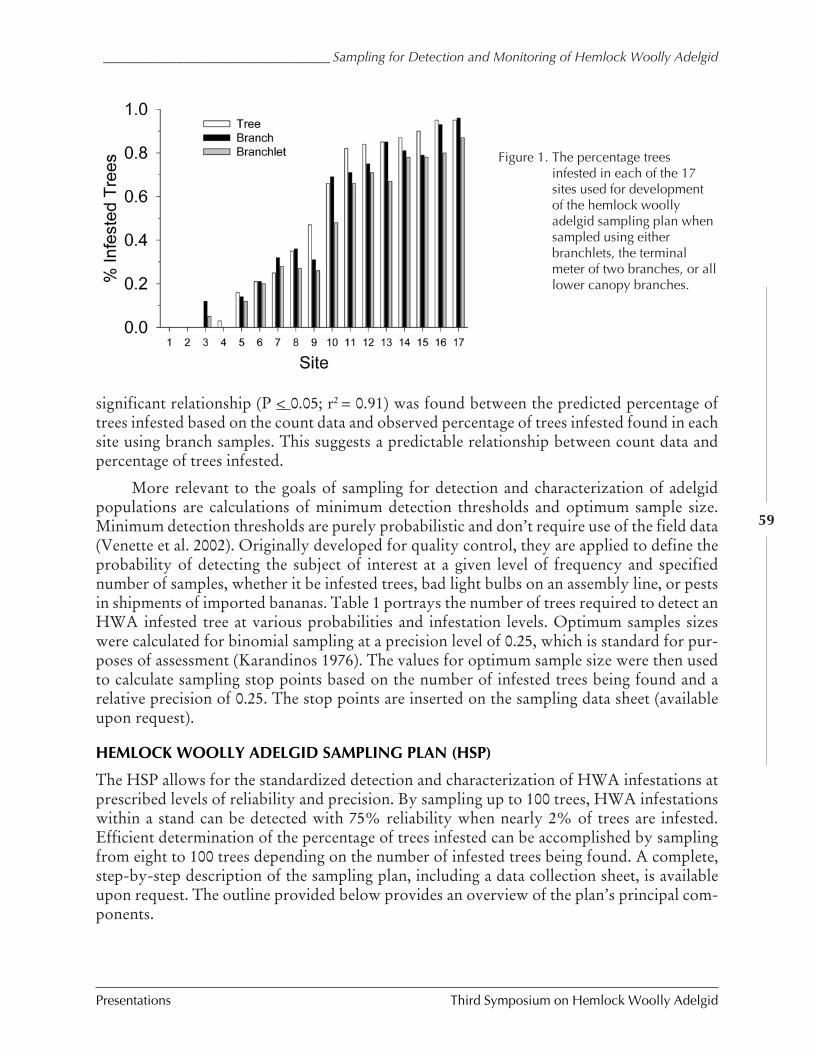
_______________________________ Sampling for Detection and Monitoring of Hemlock Woolly Adelgid
Presentations Third Symposium on Hemlock Woolly Adelgid
59
significant relationship (P < 0.05; r2 = 0.91) was found between the predicted percentage oftrees infested based on the count data and observed percentage of trees infested found in eachsite using branch samples. This suggests a predictable relationship between count data andpercentage of trees infested.
More relevant to the goals of sampling for detection and characterization of adelgidpopulations are calculations of minimum detection thresholds and optimum sample size.Minimum detection thresholds are purely probabilistic and don’t require use of the field data(Venette et al. 2002). Originally developed for quality control, they are applied to define theprobability of detecting the subject of interest at a given level of frequency and specifiednumber of samples, whether it be infested trees, bad light bulbs on an assembly line, or pestsin shipments of imported bananas. Table 1 portrays the number of trees required to detect anHWA infested tree at various probabilities and infestation levels. Optimum samples sizeswere calculated for binomial sampling at a precision level of 0.25, which is standard for pur-poses of assessment (Karandinos 1976). The values for optimum sample size were then usedto calculate sampling stop points based on the number of infested trees being found and arelative precision of 0.25. The stop points are inserted on the sampling data sheet (availableupon request).
HEMLOCK WOOLLY ADELGID SAMPLING PLAN (HSP)
The HSP allows for the standardized detection and characterization of HWA infestations atprescribed levels of reliability and precision. By sampling up to 100 trees, HWA infestationswithin a stand can be detected with 75% reliability when nearly 2% of trees are infested.Efficient determination of the percentage of trees infested can be accomplished by samplingfrom eight to 100 trees depending on the number of infested trees being found. A complete,step-by-step description of the sampling plan, including a data collection sheet, is availableupon request. The outline provided below provides an overview of the plan’s principal com-ponents.
Figure 1. The percentage treesinfested in each of the 17sites used for developmentof the hemlock woollyadelgid sampling plan whensampled using eitherbranchlets, the terminalmeter of two branches, or alllower canopy branches.
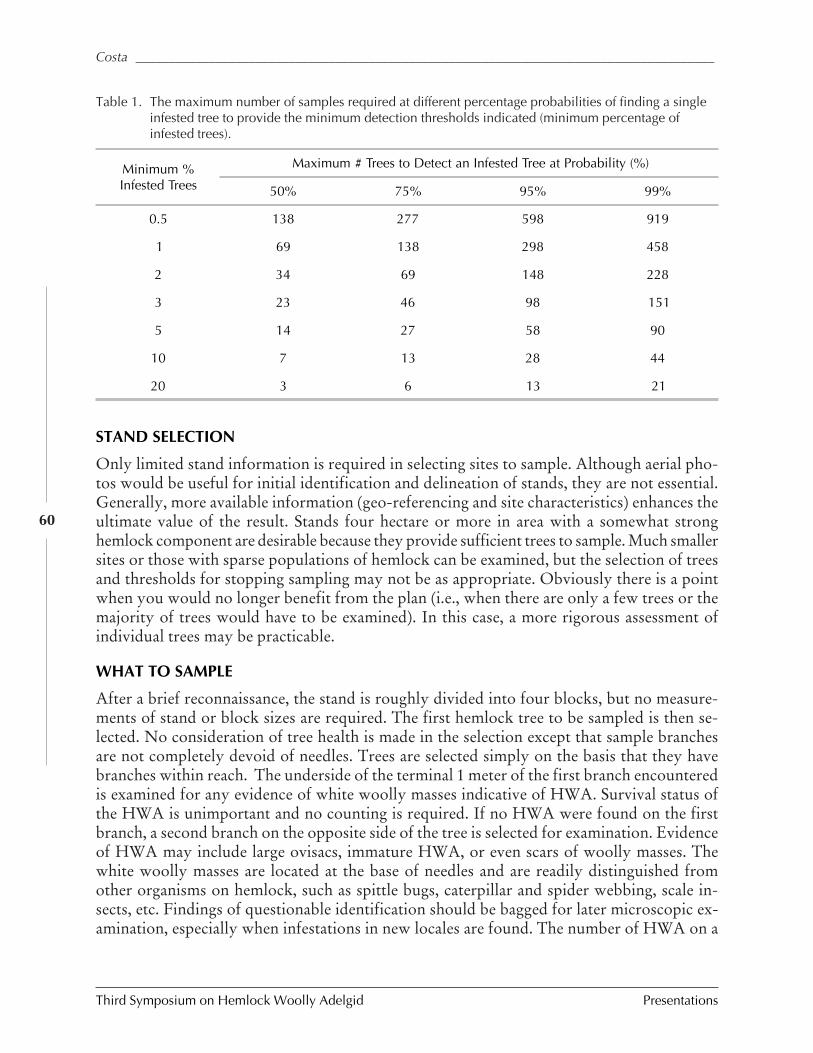
Third Symposium on Hemlock Woolly Adelgid Presentations
Costa _______________________________________________________________________________________
60
STAND SELECTION
Only limited stand information is required in selecting sites to sample. Although aerial pho-tos would be useful for initial identification and delineation of stands, they are not essential.Generally, more available information (geo-referencing and site characteristics) enhances theultimate value of the result. Stands four hectare or more in area with a somewhat stronghemlock component are desirable because they provide sufficient trees to sample. Much smallersites or those with sparse populations of hemlock can be examined, but the selection of treesand thresholds for stopping sampling may not be as appropriate. Obviously there is a pointwhen you would no longer benefit from the plan (i.e., when there are only a few trees or themajority of trees would have to be examined). In this case, a more rigorous assessment ofindividual trees may be practicable.
WHAT TO SAMPLE
After a brief reconnaissance, the stand is roughly divided into four blocks, but no measure-ments of stand or block sizes are required. The first hemlock tree to be sampled is then se-lected. No consideration of tree health is made in the selection except that sample branchesare not completely devoid of needles. Trees are selected simply on the basis that they havebranches within reach. The underside of the terminal 1 meter of the first branch encounteredis examined for any evidence of white woolly masses indicative of HWA. Survival status ofthe HWA is unimportant and no counting is required. If no HWA were found on the firstbranch, a second branch on the opposite side of the tree is selected for examination. Evidenceof HWA may include large ovisacs, immature HWA, or even scars of woolly masses. Thewhite woolly masses are located at the base of needles and are readily distinguished fromother organisms on hemlock, such as spittle bugs, caterpillar and spider webbing, scale in-sects, etc. Findings of questionable identification should be bagged for later microscopic ex-amination, especially when infestations in new locales are found. The number of HWA on a
Minimum %Infested Trees
Maximum # Trees to Detect an Infested Tree at Probability (%)
50% 75% 95% 99%
0.5 138 277 598 919
1 69 138 298 458
2 34 69 148 228
3 23 46 98 151
5 14 27 58 90
10 7 13 28 44
20 3 6 13 21
Table 1. The maximum number of samples required at different percentage probabilities of finding a singleinfested tree to provide the minimum detection thresholds indicated (minimum percentage ofinfested trees).
_______________________________ Sampling for Detection and Monitoring of Hemlock Woolly Adelgid
Presentations Third Symposium on Hemlock Woolly Adelgid
61
tree is lower when fewer trees are infested. A few trees may have many HWA (as in thetypical photos), but most trees will have few or no HWA, particularly when few trees areinfested. Visually scanning along smaller twigs is an useful tactic for espying HWA.
Once the infestation status of the first tree is determined, a list of semi-random cardinaldirections is consulted, the sampler takes 25 paces in the appropriate direction and then se-lects the nearest suitable tree. There is flexibility in selecting trees to cover a stand. The pri-mary objective is to get a representative sample and, in many cases, the size, shape, and lay ofa stand needs to be the guide. However, using a prescribed approach such as cardinal direc-tions and fixed intervals ensures sufficient trees are examined in a time-efficient manner. After25 trees are sampled in a block, the surveyor moves to the next block and samples additionaltrees.
HOW MANY SAMPLES
For simple detection of HWA within a stand, a single tree that is positive for HWA wouldsuffice to establish its presence in an area. However, if no HWA are found, as many as 100trees must be examined, depending on the specified infestation threshold and desired assur-ance of detection (Table 1). Often, data on the level of infestation within a stand are wanted.For estimation of the percentage of trees infested, the HSP calls for sampling from eight to100 trees for the presence or absence of HWA depending on how many positive trees arefound. As the sampler moves from tree to tree, a running tally is made of positive trees found,and this sum is compared with a threshold on the sampling datasheet. Once the threshold isachieved sampling stops. The percentage of trees infested is simply calculated by dividing thenumber of positive trees by the number examined trees and then multiplying by 100.
WHEN TO SAMPLE
This plan is intended for use when HWA with a white woolly coat can be observed. Theoptimal sampling period is from early winter, when HWA begin putting on their woollycoat, until early summer, when HWA sistens settle on new growth. During summer the sistengeneration is in the first instar and lack a woolly coat, and are therefore difficult to see. Theyaestivate until mid fall when they resume growing and develop a woolly coat. The utility ofHSP for sampling during the aestivation period is under investigation.
PLAN ADOPTION
The first workshop for training forestry personnel on use of the HSP was conducted duringthe spring of 2004 in Massachusetts. Representatives from Massachusetts, Maine, New Hamp-shire, New York, and Vermont attended and rated the usefulness of the plan as “high.” How-ever, the success of any sampling plan is gauged by its adoption. Already, the HSP has beenused on at least 97 sites in New York, and the U.S. Forest Service has examined 92 stands inAlleghany National Forest and 50 stands in Monongahela National Forest. The 92 Alleghanystands took three crew members two weeks to complete. A survey of properties associatedwith Harvard Forest, Petersham, Massachusetts, found relatively low populations in standspreviously thought to be uninfested.
Third Symposium on Hemlock Woolly Adelgid Presentations
Costa _______________________________________________________________________________________
62
The availability of a standardized sampling plan offers many opportunities for its incor-poration into activities associated with HWA detection, surveillance, and management. Al-though plan validation and characterization are ongoing, the general utility of the HSP isalready evident, state and federal agencies are collecting geo-referenced data and using hand-held computers for data management. At Harvard Forest and elsewhere, its utility as a re-search tool is becoming evident. Currently, no decision thresholds for initiation of manage-ment are tied to the plans results. The apparent flexibility and straightforwardness of applica-tion of the HSP should allow it to be widely employed.
ACKNOWLEDGEMENTS
I would like to thank Joe Brown for his dedication in working on development of this plan. Iam also indebted to Dave Orwig and Aaron Ellison of Harvard Forest for their encourage-ment and financial support for initial development of the sampling plan and to Brad Onkenand Dennis Souto for their support through the US Forest Service for its continued develop-ment and deployment.
REFERENCES
Cheah, C., M.E. Montgomery, S. Salom, B.L. Parker, S. Costa, and M. Skinner. 2004.Biological Control of hemlock woolly adelgid, tech. coords. R. Reardon and B. Onken.FHTET-2004-04. USDA Forest Service, Forest Health Technology Enterprise Team,Morgantown, West Virginia.
Karandinos, M.G. 1976. Optimum sample size and comments on some published formulae.Bull Entomol Soc. Amer. 22:417-421.
Taylor, L.R. 1961. Aggregation, variance and the mean. Nature 4766:735.
Venette, R.C., R.D. Moon, and W.D. Hutchison. 2002. Strategies and statistics of samplingfor rare individuals. Annual Rev Entomol. 47:143-174.
Wilson, L.T., and P.M. Room. 1983. Clumping patterns of fruit and arthropods in cotton,with implications for binomial sampling. Environ Entomol. 12:50-54.
_____________________________ A Randomized Branch Sampling Method for Hemlock Woolly Adelgid
Presentations Third Symposium on Hemlock Woolly Adelgid
63
A RANDOMIZED BRANCH SAMPLING METHOD FOR
HEMLOCK WOOLLY ADELGID
Alexander Evans
Yale School of Forestry and Environmental StudiesNew Haven, CT 06511
[email protected]; (203) 432-5126
ABSTRACT
An invasive exotic insect, the hemlock woolly adelgid (HWA) (Adelges tsugae Annand) hascaused widespread mortality of eastern hemlock trees (Tsuga canadensis (L.) Carrière) andthreatens to extirpate the species from North American forests. Neither HWA populationdensities nor their distribution in forests is well understood, hampering the ability of forestmanagers to respond to the pest. In addition, standard monitoring methods have inestimablebias and provide limited results. Lacking better information, land managers often have toassume that HWA is evenly distributed and saturates the environment. This paper explains adesign unbiased sampling system appropriate to the biology of HWA and presents results ofsampling HWA densities in New England forests.
KEYWORDS
Monitoring, population density, crown distribution.
INTRODUCTION
An invasive exotic insect, the hemlock woolly adelgid (HWA) (Adelges tsugae Annand) hascaused widespread mortality of eastern hemlock trees (Tsuga canadensis (L.) Carrière) andthreatens to extirpate the species from North American forests (McClure et al. 2001, Orwig etal. 2002). HWA-induced mortality is a concern because hemlocks provide important foreststructure, habitat, economic benefits, and aesthetic values (Beatty 1984, Kelty 1989, DeGraafet al. 1992, p. 92, Snyder et al. 2002). Unfortunately, lack of information about HWA impedesefforts to save forest hemlocks.
Information about the distribution of HWA within tree crowns and stands remains agap in HWA research, in part because sampling methods for HWA are not well established.HWA is difficult to sample because of its small size, tree crown habitat, and lack of attracta-nts. Current sampling for HWA often only includes the lowest portion of the crown addinginestimable bias to population estimates (McClure and Cheah 1999, Adams et al. 2002,Casagrande et al. 2002, Mayer et al. 2002). Before 2005 no studies had produced crown distri-bution estimates (Gray et al. 1998), although new research is underway (see Fidgen et al. andCosta in this volume). Thus far, population estimates have been general at best, and infesta-
Third Symposium on Hemlock Woolly Adelgid Presentations
Evans, A. ____________________________________________________________________________________
64
tion levels are often just assumed from a decline in hemlock health (Bonneau et al. 1999,Orwig et al. 2002, Tingley et al. 2002). Without a good method to sample and monitor popu-lations in the field, it is difficult to measure effectiveness of control efforts, catch new infesta-tions, identify mortality risk factors, or even find resistant stands. This research details a sam-pling system designed for HWA and reports the results of monitoring HWA densities inNew England forests.
METHODS
The goal of this study is to test randomized branch sampling (RBS) to estimate populations ofHWA in a managed forest. The two main areas of interest are differences in HWA densitiesbetween heights within the crown and between nearby stands. Estimates of HWA popula-tions within tree crowns may help future sampling efforts and estimates of differences be-tween stands may aid HWA mitigation efforts. RBS is predicated on a design-based approachrather than a model-based approach to inference (Gregoire et al. 1995, Gregoire 1998). Inother words, estimators generated from RBS of the mean, total, and variance require no as-sumptions about the HWA population sampled and are design unbiased (Gregoire et al. 1995).RBS treats a tree as a series of paths from the ground to each terminal shoot. Under RBS, theresearcher randomly selects a path to a terminal shoot, and the characteristics of interest—theHWA and needles encountered along this path—become part of the sample. The RBS pathcan be terminated at any branching node to allow sampling of entire branches. The path iscreated by a series of random selections at each node. In other words, at each fork in thebranch the researcher randomly chooses which branch to follow. The researcher can adjustthe probability of selecting a branch to increase the likelihood of sampling more of the quan-tity of interest so long as the probabilities at any particular fork sum to one. No design bias isintroduced if the selection remains probabilistic. The inverse of the product of the uncondi-tional selection probabilities for a sample is used to inflate the sample to an estimate for thewhole tree.
RBS provides an operationally efficient mechanism for unbiased estimation of the total,mean, and variance of the quantity sampled. Researchers have used RBS to estimate fruitproduction (Jessen 1955), tree weight (Valentine et al. 1984), total foliar area (Gregoire et al.1995), stem length and surface area (Gregoire 1996), needle mass (Gaffrey and Saborowski1999), tree biomass (Good et al. 2001), coarse woody debris (Gove et al. 2002), and floraldistribution (Chen et al. 2003). This study is a new implementation of RBS to estimate insectpopulations.
I tailored the implementation of RBS in this study to the problem of estimating thenumber of HWA per needle in hemlock crowns. First, I fell the sample trees to permit accessto the full crown. Felling damages the crowns, but comparisons of branches broken in the falland all other branches shows no significant difference. Anecdotally, I have noticed that branchtips, which are the majority of the samples, are flexible enough to avoid damage in felling.After felling the sample tree, I stratify the crown into thirds and take at least three samplesfrom each third.
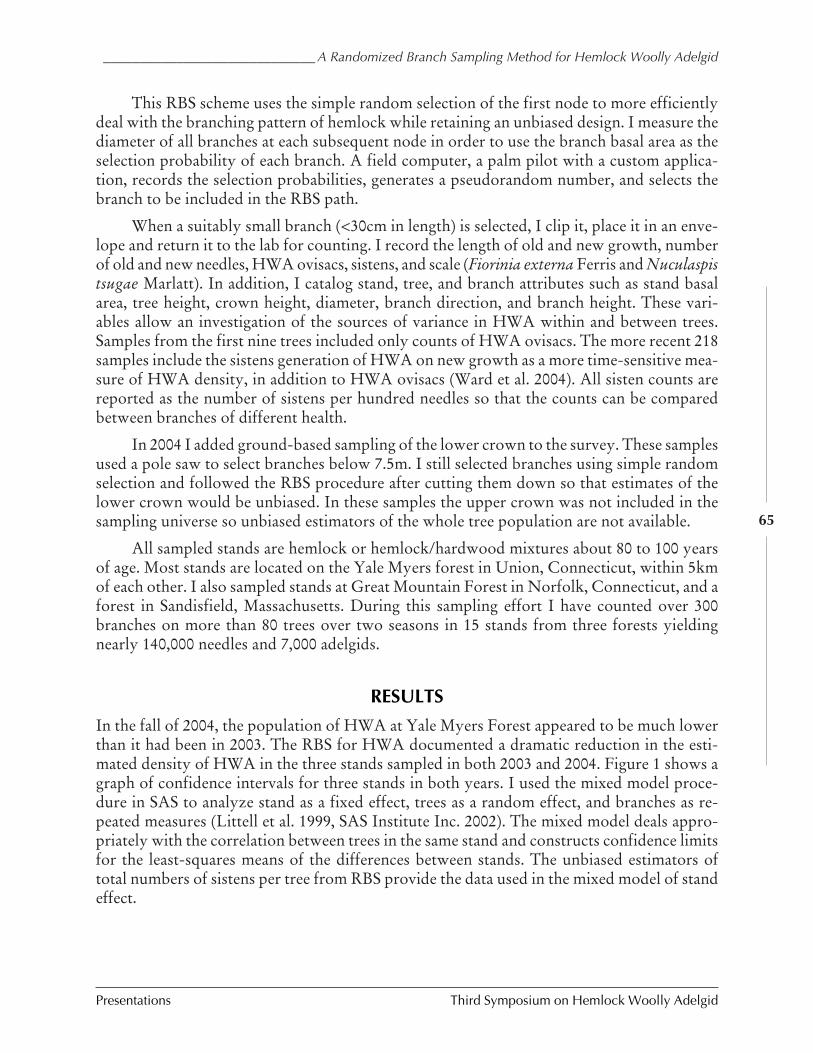
_____________________________ A Randomized Branch Sampling Method for Hemlock Woolly Adelgid
Presentations Third Symposium on Hemlock Woolly Adelgid
65
This RBS scheme uses the simple random selection of the first node to more efficientlydeal with the branching pattern of hemlock while retaining an unbiased design. I measure thediameter of all branches at each subsequent node in order to use the branch basal area as theselection probability of each branch. A field computer, a palm pilot with a custom applica-tion, records the selection probabilities, generates a pseudorandom number, and selects thebranch to be included in the RBS path.
When a suitably small branch (<30cm in length) is selected, I clip it, place it in an enve-lope and return it to the lab for counting. I record the length of old and new growth, numberof old and new needles, HWA ovisacs, sistens, and scale (Fiorinia externa Ferris and Nuculaspistsugae Marlatt). In addition, I catalog stand, tree, and branch attributes such as stand basalarea, tree height, crown height, diameter, branch direction, and branch height. These vari-ables allow an investigation of the sources of variance in HWA within and between trees.Samples from the first nine trees included only counts of HWA ovisacs. The more recent 218samples include the sistens generation of HWA on new growth as a more time-sensitive mea-sure of HWA density, in addition to HWA ovisacs (Ward et al. 2004). All sisten counts arereported as the number of sistens per hundred needles so that the counts can be comparedbetween branches of different health.
In 2004 I added ground-based sampling of the lower crown to the survey. These samplesused a pole saw to select branches below 7.5m. I still selected branches using simple randomselection and followed the RBS procedure after cutting them down so that estimates of thelower crown would be unbiased. In these samples the upper crown was not included in thesampling universe so unbiased estimators of the whole tree population are not available.
All sampled stands are hemlock or hemlock/hardwood mixtures about 80 to 100 yearsof age. Most stands are located on the Yale Myers forest in Union, Connecticut, within 5kmof each other. I also sampled stands at Great Mountain Forest in Norfolk, Connecticut, and aforest in Sandisfield, Massachusetts. During this sampling effort I have counted over 300branches on more than 80 trees over two seasons in 15 stands from three forests yieldingnearly 140,000 needles and 7,000 adelgids.
RESULTS
In the fall of 2004, the population of HWA at Yale Myers Forest appeared to be much lowerthan it had been in 2003. The RBS for HWA documented a dramatic reduction in the esti-mated density of HWA in the three stands sampled in both 2003 and 2004. Figure 1 shows agraph of confidence intervals for three stands in both years. I used the mixed model proce-dure in SAS to analyze stand as a fixed effect, trees as a random effect, and branches as re-peated measures (Littell et al. 1999, SAS Institute Inc. 2002). The mixed model deals appro-priately with the correlation between trees in the same stand and constructs confidence limitsfor the least-squares means of the differences between stands. The unbiased estimators oftotal numbers of sistens per tree from RBS provide the data used in the mixed model of standeffect.
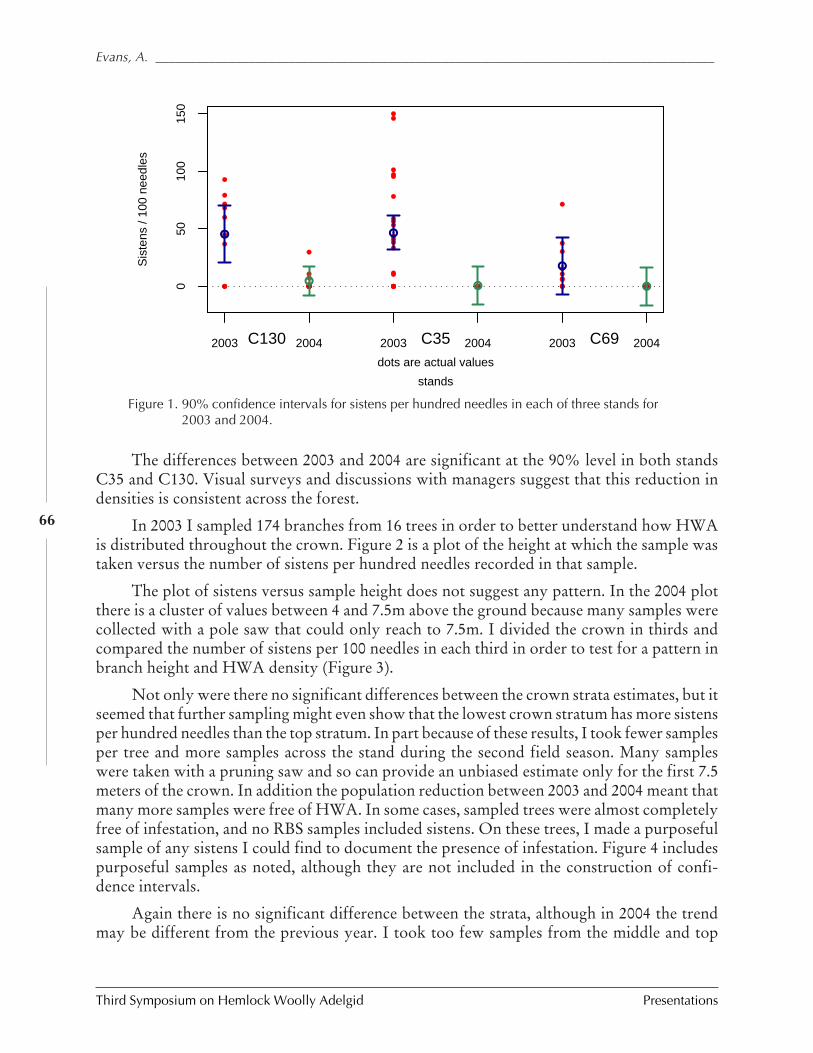
Third Symposium on Hemlock Woolly Adelgid Presentations
Evans, A. ____________________________________________________________________________________
66
The differences between 2003 and 2004 are significant at the 90% level in both standsC35 and C130. Visual surveys and discussions with managers suggest that this reduction indensities is consistent across the forest.
In 2003 I sampled 174 branches from 16 trees in order to better understand how HWAis distributed throughout the crown. Figure 2 is a plot of the height at which the sample wastaken versus the number of sistens per hundred needles recorded in that sample.
The plot of sistens versus sample height does not suggest any pattern. In the 2004 plotthere is a cluster of values between 4 and 7.5m above the ground because many samples werecollected with a pole saw that could only reach to 7.5m. I divided the crown in thirds andcompared the number of sistens per 100 needles in each third in order to test for a pattern inbranch height and HWA density (Figure 3).
Not only were there no significant differences between the crown strata estimates, but itseemed that further sampling might even show that the lowest crown stratum has more sistensper hundred needles than the top stratum. In part because of these results, I took fewer samplesper tree and more samples across the stand during the second field season. Many sampleswere taken with a pruning saw and so can provide an unbiased estimate only for the first 7.5meters of the crown. In addition the population reduction between 2003 and 2004 meant thatmany more samples were free of HWA. In some cases, sampled trees were almost completelyfree of infestation, and no RBS samples included sistens. On these trees, I made a purposefulsample of any sistens I could find to document the presence of infestation. Figure 4 includespurposeful samples as noted, although they are not included in the construction of confi-dence intervals.
Again there is no significant difference between the strata, although in 2004 the trendmay be different from the previous year. I took too few samples from the middle and top
●
●
●
●
●
●
2003 2004 2003 2004 2003 2004C130 C35 C69
●
●
●
●
●
●●●
●
●●
●●●
●
●
●
●
●
●
●
●●●
●
●●
●
●
●
●
●●
●●
●
●
●
●
●
●
●
●
●
●●●●
●
●●●● ●●●●●●●●●●●●●●●●● ●●●●●●●●●●●●●050
100
150
stands
Sis
tens
/ 10
0 ne
edle
s
●
●
●
●
●
●
dots are actual values
Figure 1. 90% confidence intervals for sistens per hundred needles in each of three stands for2003 and 2004.
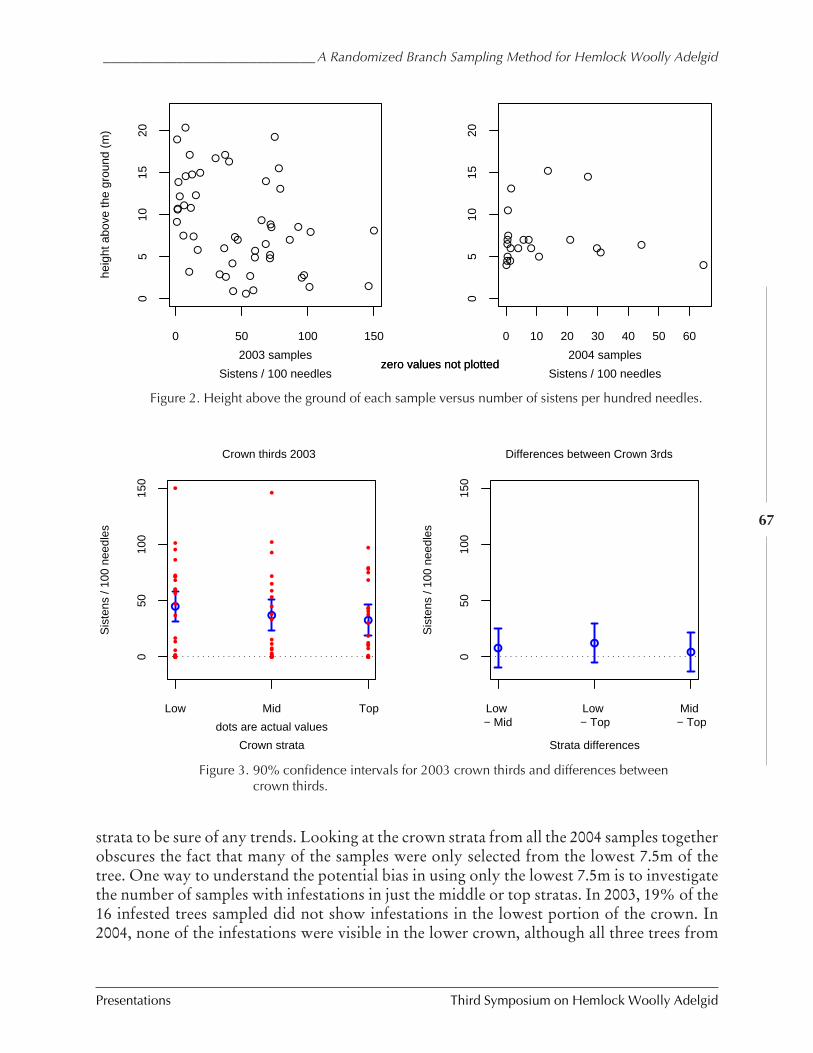
_____________________________ A Randomized Branch Sampling Method for Hemlock Woolly Adelgid
Presentations Third Symposium on Hemlock Woolly Adelgid
67
●●
●●
●
●●
● ●●
●●●●
●●● ●
●●●
● ●●
●●
●
●
●
●
●●
●● ●
●
●
●●
●●
●
●●●●
●
● ●●
●
0 50 100 150
05
1015
20
Sistens / 100 needles
heig
ht a
bove
the
grou
nd (
m)
2003 sampleszero values not plottedzero values not plotted
● ●
●
●
●
●
●●
●●
●
●●●
●●
●
●
●
●
●
●
0 10 20 30 40 50 60
05
1015
20
Sistens / 100 needles
2004 samples
Figure 2. Height above the ground of each sample versus number of sistens per hundred needles.
050
100
150
Crown strata
Sis
tens
/ 10
0 ne
edle
s
●●
●
Low Mid Top
●
●
●
●● ●●●
●
● ●
●
●
●
●
●
●
●
●
●
●
●
●●
●
●
●
●
●
●
●
●
● ●●
●
●●
●
● ●
●
●
●
●
●
●
●
●● ●
●
● ●
●
●
●
●
●●
●●
●
●
●
●
●
●
●
●
●
Crown thirds 2003
dots are actual values
050
100
150
Strata differences
Sis
tens
/ 10
0 ne
edle
s
●●
●
Low Low Mid − Mid − Top − Top
Differences between Crown 3rds
Figure 3. 90% confidence intervals for 2003 crown thirds and differences betweencrown thirds.
strata to be sure of any trends. Looking at the crown strata from all the 2004 samples togetherobscures the fact that many of the samples were only selected from the lowest 7.5m of thetree. One way to understand the potential bias in using only the lowest 7.5m is to investigatethe number of samples with infestations in just the middle or top stratas. In 2003, 19% of the16 infested trees sampled did not show infestations in the lowest portion of the crown. In2004, none of the infestations were visible in the lower crown, although all three trees from
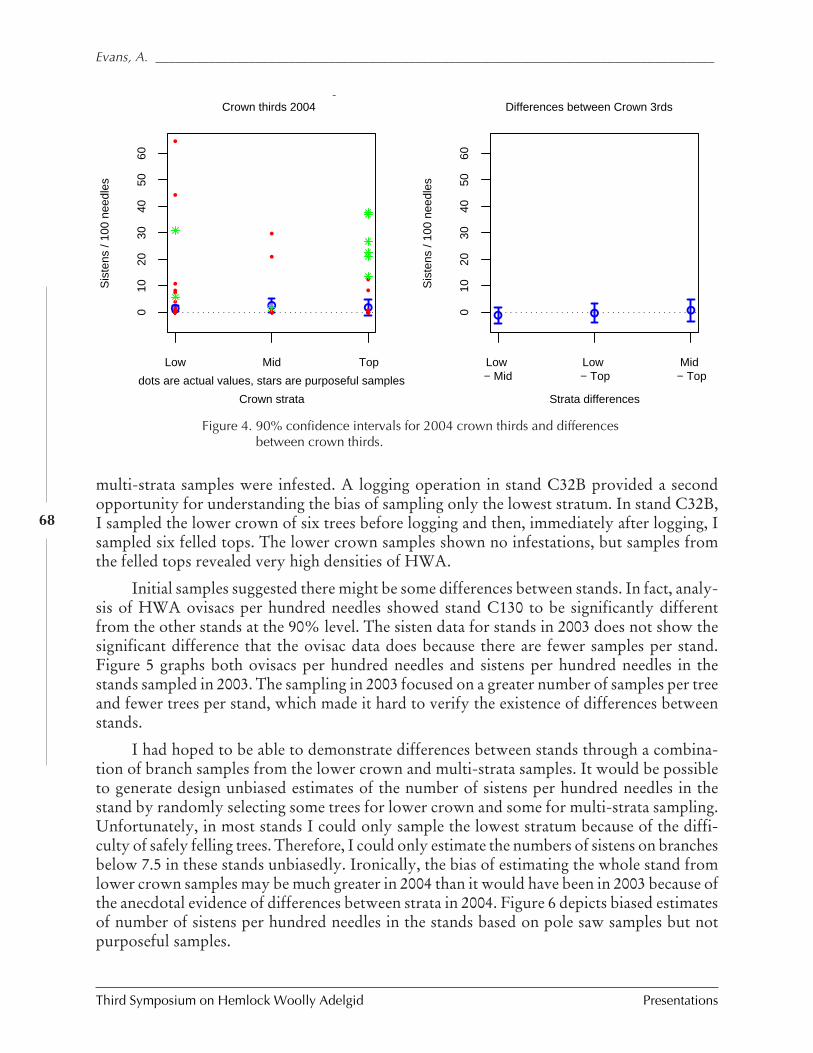
Third Symposium on Hemlock Woolly Adelgid Presentations
Evans, A. ____________________________________________________________________________________
68
multi-strata samples were infested. A logging operation in stand C32B provided a secondopportunity for understanding the bias of sampling only the lowest stratum. In stand C32B,I sampled the lower crown of six trees before logging and then, immediately after logging, Isampled six felled tops. The lower crown samples shown no infestations, but samples fromthe felled tops revealed very high densities of HWA.
Initial samples suggested there might be some differences between stands. In fact, analy-sis of HWA ovisacs per hundred needles showed stand C130 to be significantly differentfrom the other stands at the 90% level. The sisten data for stands in 2003 does not show thesignificant difference that the ovisac data does because there are fewer samples per stand.Figure 5 graphs both ovisacs per hundred needles and sistens per hundred needles in thestands sampled in 2003. The sampling in 2003 focused on a greater number of samples per treeand fewer trees per stand, which made it hard to verify the existence of differences betweenstands.
I had hoped to be able to demonstrate differences between stands through a combina-tion of branch samples from the lower crown and multi-strata samples. It would be possibleto generate design unbiased estimates of the number of sistens per hundred needles in thestand by randomly selecting some trees for lower crown and some for multi-strata sampling.Unfortunately, in most stands I could only sample the lowest stratum because of the diffi-culty of safely felling trees. Therefore, I could only estimate the numbers of sistens on branchesbelow 7.5 in these stands unbiasedly. Ironically, the bias of estimating the whole stand fromlower crown samples may be much greater in 2004 than it would have been in 2003 because ofthe anecdotal evidence of differences between strata in 2004. Figure 6 depicts biased estimatesof number of sistens per hundred needles in the stands based on pole saw samples but notpurposeful samples.
010
2030
4050
60
Crown strata
Sis
tens
/ 10
0 ne
edle
s
● ● ●
Low Mid Top
●●●●●
●
●●●● ●● ●●●●
●
●
●
●●●●● ●●● ●●●●●●●●●●●●
●
● ●●●●●●●●
●
●●
●
●● ●●●●●● ●●●●●●●●●●●●●●●●● ●●●●●● ●●●●●●●●●●●● ●●● ●●●● ●●● ●●●●●● ●●● ●●●●●●●●
●
●●●●●●●●●● ●●
●
●
Crown thirds 2004
dots are actual values, stars are purposeful samples
g
010
2030
4050
60
Strata differences
Sis
tens
/ 10
0 ne
edle
s
● ● ●
Low Low Mid − Mid − Top − Top
Differences between Crown 3rds
Figure 4. 90% confidence intervals for 2004 crown thirds and differencesbetween crown thirds.
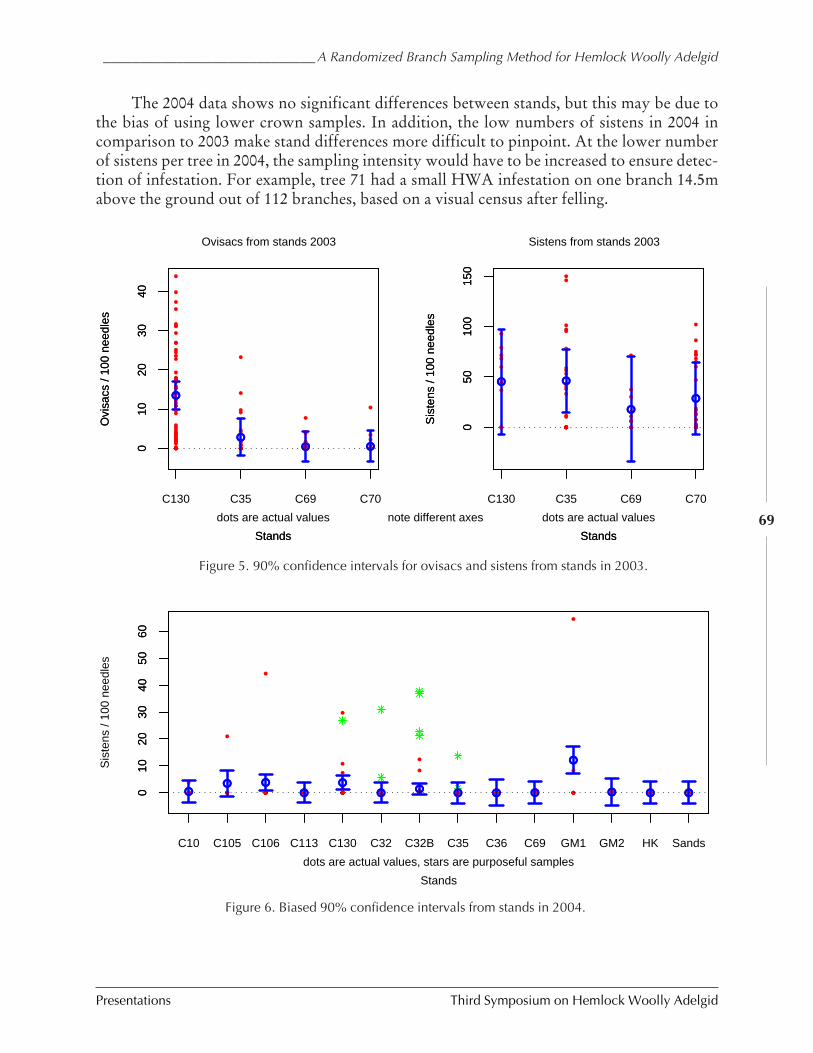
_____________________________ A Randomized Branch Sampling Method for Hemlock Woolly Adelgid
Presentations Third Symposium on Hemlock Woolly Adelgid
69
The 2004 data shows no significant differences between stands, but this may be due tothe bias of using lower crown samples. In addition, the low numbers of sistens in 2004 incomparison to 2003 make stand differences more difficult to pinpoint. At the lower numberof sistens per tree in 2004, the sampling intensity would have to be increased to ensure detec-tion of infestation. For example, tree 71 had a small HWA infestation on one branch 14.5mabove the ground out of 112 branches, based on a visual census after felling.
010
2030
40
Stands
Ovi
sacs
/ 10
0 ne
edle
s
●
●● ●
C130 C35 C69 C70
●
●
●
●
●
●
●
●
●
●●●●●●●●●●
●
●
●●●●●●●●●●●●
●
●●●●●
●
●
●●
●
●
●
●
●
●
●
●
●
●
●●●●
●●●
●
●
●
●
●
●●
●
●●●●●●●●●
●●
●
●
●
●
●
●
●●●●●●
●
●●●
●
●
●●●●●●●●●●●●●●●●●●●●●●●●●●●●●●●●●●
●
●
●
●
●
●
● ●●●●●●●●●●●●●●●●●
●
●
●
●●
●
●
●●●
●
●●●●
●
●010
2030
40
Stands
Ovi
sacs
/ 10
0 ne
edle
s
●
●● ●
Ovisacs from stands 2003
dots are actual values note different axes
050
100
150
Stands
Sis
tens
/ 10
0 ne
edle
s
● ●
●●
C130 C35 C69 C70
●
●
●
●●●●●●
●●
●
●
●
●
●
●
●
●
●
●
●
●●
●
●●
●
●
●
●
●
●●●
●
●●
●●●
●
●
●
●
●
●
●
●●●
●
●●
●
●
●
●
●●
●●
●
●
●
●
●
●
●
●
●
050
100
150
Stands
Sis
tens
/ 10
0 ne
edle
s
● ●
●●
Sistens from stands 2003
dots are actual values
Figure 5. 90% confidence intervals for ovisacs and sistens from stands in 2003.
010
2030
4050
60
Stands
Sis
tens
/ 10
0 ne
edle
s
●● ●
●●
● ● ● ● ●
●
● ● ●
C10 C105 C106 C113 C130 C32 C32B C35 C36 C69 GM1 GM2 HK Sands
●●●●●
●
●●●●●●●●●●
●
●
●
●●●● ●●●●●●●●●●●●●●●●
●
●●●●●●● ●●
●
●●
●
●●●●●●●●●●●● ●●●●●●●●●● ●●●●●●●●●●●●● ●●●●●●●●●●●● ●●●●●●●●● ●●●●●●●●●●●●●●
●
●●●● ●●●●●●●●
●
●
010
2030
4050
60
●● ●
●●
● ● ● ● ●
●
● ● ●
dots are actual values, stars are purposeful samples
Figure 6. Biased 90% confidence intervals from stands in 2004.
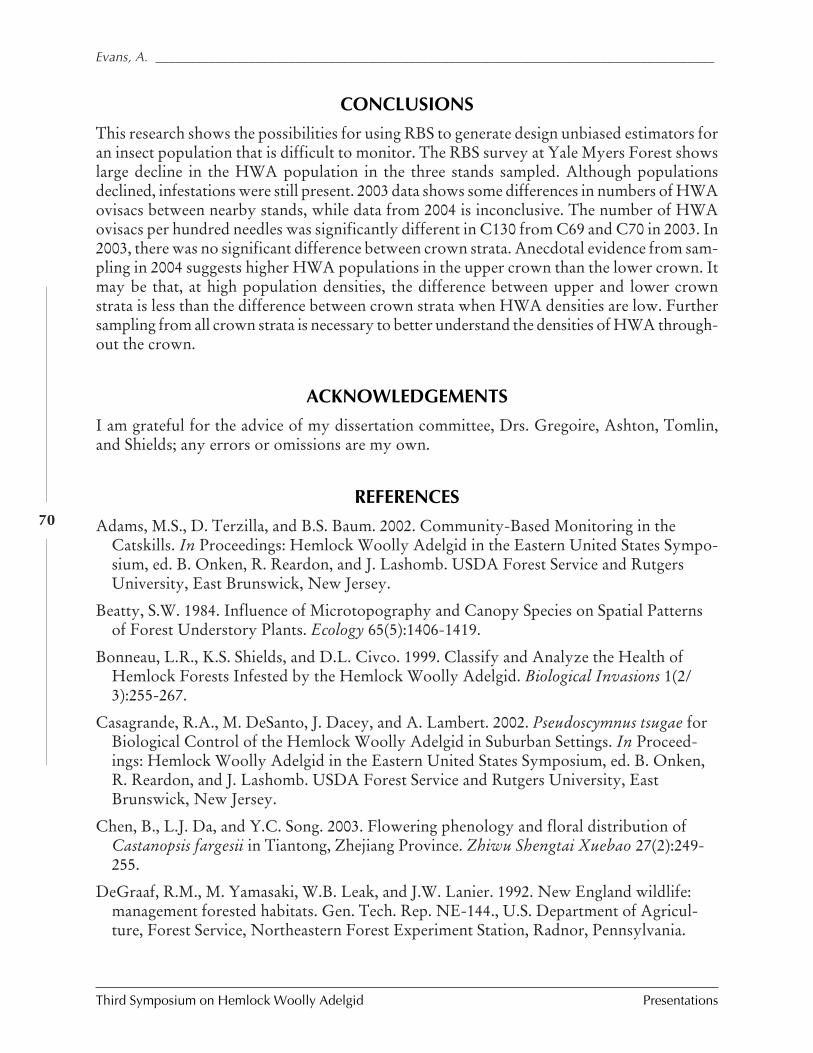
Third Symposium on Hemlock Woolly Adelgid Presentations
Evans, A. ____________________________________________________________________________________
70
CONCLUSIONS
This research shows the possibilities for using RBS to generate design unbiased estimators foran insect population that is difficult to monitor. The RBS survey at Yale Myers Forest showslarge decline in the HWA population in the three stands sampled. Although populationsdeclined, infestations were still present. 2003 data shows some differences in numbers of HWAovisacs between nearby stands, while data from 2004 is inconclusive. The number of HWAovisacs per hundred needles was significantly different in C130 from C69 and C70 in 2003. In2003, there was no significant difference between crown strata. Anecdotal evidence from sam-pling in 2004 suggests higher HWA populations in the upper crown than the lower crown. Itmay be that, at high population densities, the difference between upper and lower crownstrata is less than the difference between crown strata when HWA densities are low. Furthersampling from all crown strata is necessary to better understand the densities of HWA through-out the crown.
ACKNOWLEDGEMENTS
I am grateful for the advice of my dissertation committee, Drs. Gregoire, Ashton, Tomlin,and Shields; any errors or omissions are my own.
REFERENCES
Adams, M.S., D. Terzilla, and B.S. Baum. 2002. Community-Based Monitoring in theCatskills. In Proceedings: Hemlock Woolly Adelgid in the Eastern United States Sympo-sium, ed. B. Onken, R. Reardon, and J. Lashomb. USDA Forest Service and RutgersUniversity, East Brunswick, New Jersey.
Beatty, S.W. 1984. Influence of Microtopography and Canopy Species on Spatial Patternsof Forest Understory Plants. Ecology 65(5):1406-1419.
Bonneau, L.R., K.S. Shields, and D.L. Civco. 1999. Classify and Analyze the Health ofHemlock Forests Infested by the Hemlock Woolly Adelgid. Biological Invasions 1(2/3):255-267.
Casagrande, R.A., M. DeSanto, J. Dacey, and A. Lambert. 2002. Pseudoscymnus tsugae forBiological Control of the Hemlock Woolly Adelgid in Suburban Settings. In Proceed-ings: Hemlock Woolly Adelgid in the Eastern United States Symposium, ed. B. Onken,R. Reardon, and J. Lashomb. USDA Forest Service and Rutgers University, EastBrunswick, New Jersey.
Chen, B., L.J. Da, and Y.C. Song. 2003. Flowering phenology and floral distribution ofCastanopsis fargesii in Tiantong, Zhejiang Province. Zhiwu Shengtai Xuebao 27(2):249-255.
DeGraaf, R.M., M. Yamasaki, W.B. Leak, and J.W. Lanier. 1992. New England wildlife:management forested habitats. Gen. Tech. Rep. NE-144., U.S. Department of Agricul-ture, Forest Service, Northeastern Forest Experiment Station, Radnor, Pennsylvania.
_____________________________ A Randomized Branch Sampling Method for Hemlock Woolly Adelgid
Presentations Third Symposium on Hemlock Woolly Adelgid
71
Gaffrey, D., and J. Saborowski. 1999. RBS, a multistage inventory method for estimatingtree characteristics. I. Estimating needle and branch dry mass of 66-year-old Douglas firtrees. Allgemeine Forst und Jagdzeitung 170(10-11):177-183.
Good, N.-M., M. Paterson, C. Brack, and K. Mengersen. 2001. Estimating tree componentbiomass using variable probability sampling methods. Journal of Agricultural Biologicaland Environmental Statistics 6(2):258-267.
Gove, J.H., M.J. Ducey, H.T. Valentine, and A.C. Dibble. 2002. Multistage point relascopeand randomized branch sampling for downed coarse woody debris estimation. ForestEcology and Management 155(1-3):153-162.
Gray, D.R., R.A. Evans, and S.M. Salom. 1998. Hemlock woolly adelgid (Homoptera:Adelgidae) dispersion and the failure of binomial sampling to estimate population den-sity. Environmental Entomology 27(3):564-571.
Gregoire, T. 1996. Sampling methods to estimate stem length and surface area of tropicaltree species. Forest Ecology and Management 83:229-235.
Gregoire, T.G. 1998. Design-based and model-based interference in survey sampling:Appreciating the difference. Canadian Journal of Forest Research 28(10):1429-1447.
Gregoire, T.G., H.T. Valentine, and G.M. Furnival. 1995. Sampling methods to estimatefoliage and other characteristics of individual trees. Ecology 76(4):1181-1194.
Jessen, R.J. 1955. Determining the Fruit Count on a Tree by Randomized Branch Sampling.Biometrics 11(1):99-109.
Kelty, M.J. 1989. Productivity of New England hemlock/hardwood stands as affected byspecies composition and canopy structure. Forest Ecology and Management 28:237-257.
Littell, R., G. Milliken, W. Stroup, and R. Wolfinger. 1999. SAS System for Mixed Models.SAS Institute Inc., Cary, North Carolina.
Mayer, M., R. Chianese, T. Scudder, J. White, K. Vongpaseuth, and R. Ward. 2002. Thir-teen years of monitoring the hemlock woolly adelgid in New Jersey Forests. In Proceed-ings: Hemlock Woolly Adelgid in the Eastern United States Symposium, ed. B. Onken,R. Reardon, and J. Lashomb. USDA Forest Service and Rutgers University, EastBrunswick, New Jersey.
McClure, M.S., and C.A.S.J. Cheah. 1999. Reshaping the ecology of invading populationsof hemlock woolly adelgid, Adelges tsugae, (Homoptera: Adelgidae) in eastern NorthAmerica. Biological Invasions (1):247-254.
McClure, M.S., S. Salom, and K.S. Shields. 2001. Hemlock Woolly Adelgid. FHTET-2001-03, USDA Forest Service, Morgantown, West Virginia.
Orwig, D.A., D.R. Foster, and D.L. Mausel. 2002. Landscape patterns of hemlock declinein New England due to the introduced hemlock woolly adelgid. Journal of Biogeography29(10-11):1475-1488.
SAS Institute Inc. 2002. SAS OnlineDoc® 9. SAS Institute Inc., Cary, North Carolina.
Third Symposium on Hemlock Woolly Adelgid Presentations
Evans, A. ____________________________________________________________________________________
72
Snyder, C.D., J.A. Young, D.P. Lemarie, and D.R. Smith. 2002. Influence of eastern hem-lock (Tsuga canadensis) forests on aquatic invertebrate assemblages in headwater streams.Canadian Journal of Fisheries and Aquatic Sciences 59(2):262-275.
Tingley, M.W., D.A. Orwig, R. Field, and G. Motzkin. 2002. Avian response to removal ofa forest dominant: consequences of hemlock woolly adelgid infestations. Journal ofBiogeography 29(10-11):1505-1516.
Valentine, H., L. Tritton, and G. Furnival. 1984. Subsampling trees for biomass, volume ormineral content. Forest Science 30(3):673-681.
Ward, J.S., M.E. Montgomery, C.A.S.-J. Cheah, B.P. Onken, and R.S. Cowles. 2004. East-ern Hemlock Forests: Guidelines to Minimize the Impacts of Hemlock Woolly Adelgid.NA-TP-03-04, USDA Forest Service, Northeastern Area State and Private Forestry,Morgantown, West Virginia.
____________________________________ Using Hyperspectral Technologies to Map Hemlock Decline
Presentations Third Symposium on Hemlock Woolly Adelgid
73
USING HYPERSPECTRAL TECHNOLOGIES TO MAP HEMLOCK DECLINE:PRE-VISUAL DECLINE ASSESSMENT FOR EARLY INFESTATION DETECTION
Jennifer Pontius1, Mary Martin2, Lucie Plourde2, and Richard Hallett1
1USDA Forest Service, Northeastern Research Station,Durham, New Hampshire
2Complex Systems Research Center, University of New Hampshire,Durham, New Hampshire
ABSTRACT
Hyperspectral remote sensing technology can help monitor hemlock health across large areasof the landscape. This study examines the capability of a commercially available sensor(Specim’s AISA Eagle) to map hemlock decline due to hemlock wooly adelgid (HWA) infes-tation in the Catskill Mountain area of New York. The AISA Eagle was able to classifyhemlock health at the tree level into an 11-class rating system with a one-class tolerance accu-racy of 88 percent. The ability of this instrument to predict decline below class 4 (whendieback and transparency reach levels first noticeable in the field) is based upon “pre-visual”changes in chlorophyll content and function that are typical of incipient HWA infestationand early stress. This technology will enable land managers to assess and monitor detailedchanges in forest health across the landscape so that integrated pest management programscan be effectively implemented.
KEYWORDS
Forest health, AVIRIS, remote sensing, hemlock woolly adelgid.
INTRODUCTION
One of the most pressing forest health issues currently facing North American forests is thewidespread decline of eastern hemlock (Tsuga canadensis Carriere) due to the hemlock woollyadelgid (HWA), Adelges tsugae Annand. The potentially severe consequences and large scaleof the HWA infestation requires that land managers be familiar with the actual location of thehemlock resource, as well as its health and infestation status.
Most assessments of decline involve time-consuming field based methods. Althoughthese methods are valuable in monitoring gross changes over time, they are not able to iden-tify trees in the very early stages of decline (Sampson et al. 2000) or assess large acreages, bothcrucial to the development of integrated pest management strategies aimed at managing thehemlock resource.
Third Symposium on Hemlock Woolly Adelgid Presentations
Pontius et al. _________________________________________________________________________________
74
Remote sensing technologies are the most viable option to assist land managers in healthassessment and monitoring at a regional scale. To date, remote sensing of forest health hasbeen limited to the classification of coarse defoliation classes using aerial photography ormulti-spectral resolution visible/NIR space-based sensors, such as Landsat Thematic Map-per (TM) (Lambert et al. 1995; Royle and Lathrop 1997 and 2002, Royle et al. 1995). Whenmeasuring decline solely as a function of defoliation, earlier signs of stress such as reductionsin photosynthesis and chlorophyll content are not detected. Instruments with higher spectralresolution are needed to accurately detect such changes in vegetation condition (Treitz andHowarth 1999).
There is mounting evidence that hyperspectral instruments have the capability, not onlyto assess defoliation, but also to identify the early signs of stress—in some cases before visualsymptoms are apparent (Cibula and Carter 1992, Mohammed et al. 1995, Zarco-Tejada et al.2000a and 2000b). This can be explained by the tendency of stressed leaves to undergo reduc-tion in photosynthetic activity and to lose chlorophyll. These changes alter reflectance atchlorophyll-sensitive wavelengths (Vogelmann and Rock 1988, Rock et al. 1988, Vogelmannet al. 1993, Gitelson and Merzlyak 1996, Carter and Knapp 2001).
Chlorophylla and b content are particularly good detectors of stress because of theirdirect role in photosynthesis. Narrow wavebands near 700nm where changes in chlorophyllabsorption are easily detectable have been recommended for early detection of forest damage(Hoque et al. 1990 and 1992) and were able to detect decreased vigor, before visual symptomswere apparent, in pine seedling canopies (Cibula and Carter 1992). Because changes in chlo-rophyll function typically precede changes in chlorophyll content, chlorophyll fluorescencehas also been shown to be a useful tool in identifying pre-visual strain (Zarco-Tejada et al.2000a and 2000b).
Preliminary work by the authors using an ASD FieldSpec Pro FR field spectroradiometer(Analytical Spectral Devices) highlight several indices and wavelengths that are able to trackhemlock stress, including pre-visual symptoms. This work has resulted in the developmentof equations capable of predicting a 10-class hemlock health scale on independent data with96% one-class tolerance accuracy (Pontius et al. In press-a). Additional work by the authorsusing remotely sensed hyperspectral imagery from NASA’s Airborne Visible Infrared Imag-ing Spectrometer (AVIRIS) produced a hemlock abundance map that correctly identifiedhemlock dominated pixels (>50% basal area) with 88% accuracy. Reflectance at a chloro-phyll sensitive wavelength (683nm) coupled with a water band index (R970/900) was able topredict plot level decline with 100 percent one-class tolerance accuracy. The extreme accu-racy at the low (0-4) end of the range indicated that these wavelengths might be used to assessearly decline, before visual symptoms are apparent (Pontius et al., In press-b).
This study was designed to determine if similar hyperspectral techniques from a com-mercially available remote sensing platform could be used to predict early hemlock declinesymptoms in the Catskills State Park, New York. The hyperspectral instrument used in thisstudy was the airborne AISA Eagle, measuring 130 contiguous bands from 400nm – 970nm,with 3nm spectral resolution, and 2m spatial resolution. Our objectives are to: (1) present thekey wavelengths and/or stress indices most strongly correlated with hemlock decline, (2) usethis information to develop a simple linear equation to predict decline using a minimal num-ber of variables, and (3) discuss the potential of commercially available hyperspectral sensors.
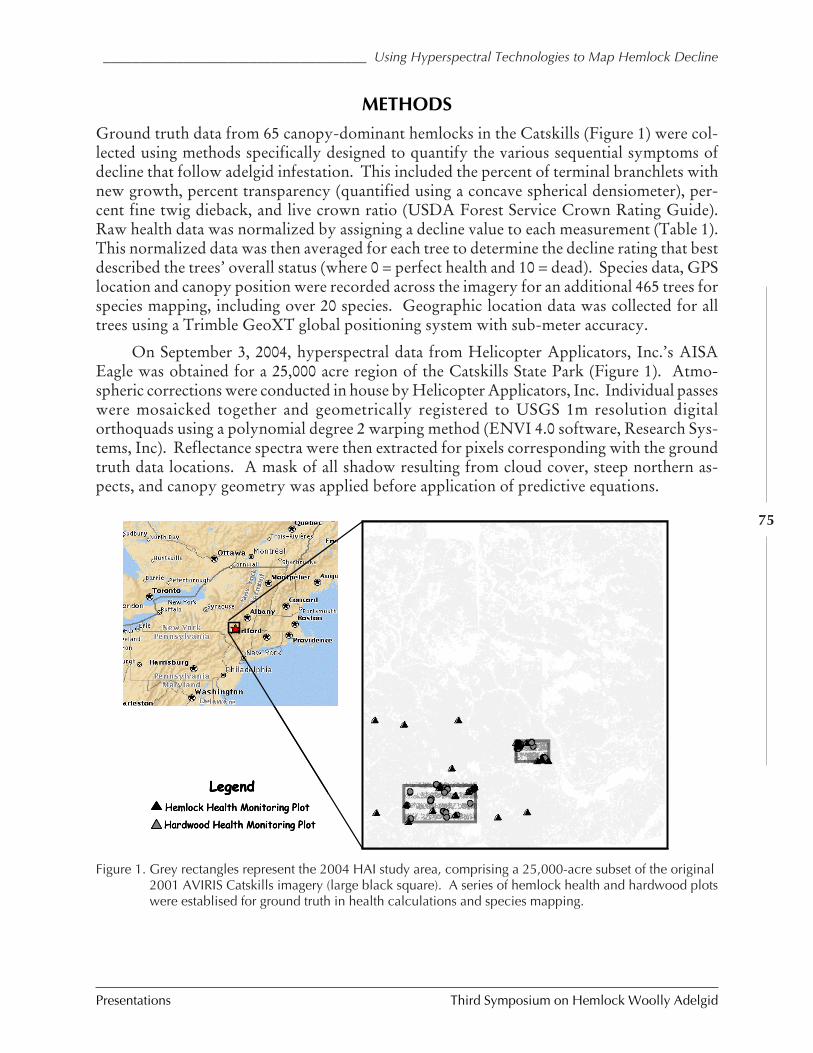
____________________________________ Using Hyperspectral Technologies to Map Hemlock Decline
Presentations Third Symposium on Hemlock Woolly Adelgid
75
METHODS
Ground truth data from 65 canopy-dominant hemlocks in the Catskills (Figure 1) were col-lected using methods specifically designed to quantify the various sequential symptoms ofdecline that follow adelgid infestation. This included the percent of terminal branchlets withnew growth, percent transparency (quantified using a concave spherical densiometer), per-cent fine twig dieback, and live crown ratio (USDA Forest Service Crown Rating Guide).Raw health data was normalized by assigning a decline value to each measurement (Table 1).This normalized data was then averaged for each tree to determine the decline rating that bestdescribed the trees’ overall status (where 0 = perfect health and 10 = dead). Species data, GPSlocation and canopy position were recorded across the imagery for an additional 465 trees forspecies mapping, including over 20 species. Geographic location data was collected for alltrees using a Trimble GeoXT global positioning system with sub-meter accuracy.
On September 3, 2004, hyperspectral data from Helicopter Applicators, Inc.’s AISAEagle was obtained for a 25,000 acre region of the Catskills State Park (Figure 1). Atmo-spheric corrections were conducted in house by Helicopter Applicators, Inc. Individual passeswere mosaicked together and geometrically registered to USGS 1m resolution digitalorthoquads using a polynomial degree 2 warping method (ENVI 4.0 software, Research Sys-tems, Inc). Reflectance spectra were then extracted for pixels corresponding with the groundtruth data locations. A mask of all shadow resulting from cloud cover, steep northern as-pects, and canopy geometry was applied before application of predictive equations.
Hemlock Health Monitoring Plot
Legend
Hardwood Health Monitoring Plot
Hemlock Health Monitoring Plot
Legend
Hardwood Health Monitoring Plot
Hemlock Health Monitoring Plot
Legend
Hardwood Health Monitoring Plot
Figure 1. Grey rectangles represent the 2004 HAI study area, comprising a 25,000-acre subset of the original2001 AVIRIS Catskills imagery (large black square). A series of hemlock health and hardwood plotswere establised for ground truth in health calculations and species mapping.
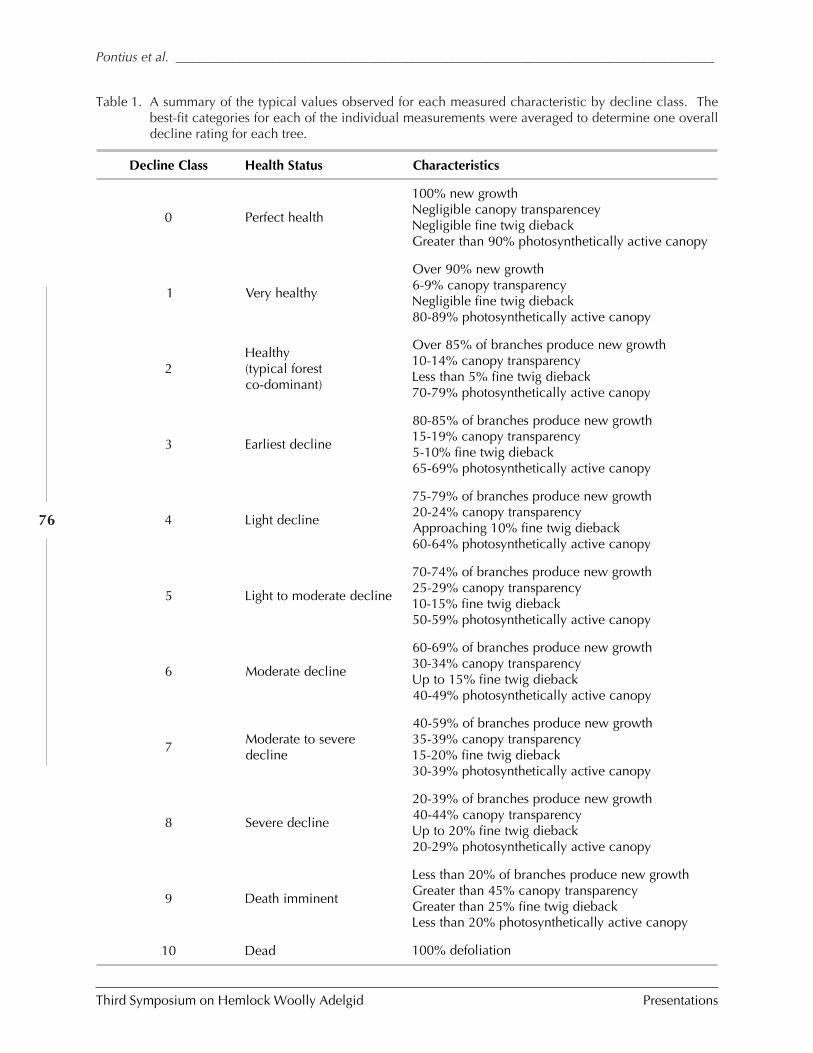
Third Symposium on Hemlock Woolly Adelgid Presentations
Pontius et al. _________________________________________________________________________________
76
Table 1. A summary of the typical values observed for each measured characteristic by decline class. Thebest-fit categories for each of the individual measurements were averaged to determine one overalldecline rating for each tree.
Decline Class Health Status Characteristics
0 Perfect health
100% new growthNegligible canopy transparenceyNegligible fine twig diebackGreater than 90% photosynthetically active canopy
1 Very healthy
Over 90% new growth6-9% canopy transparencyNegligible fine twig dieback80-89% photosynthetically active canopy
2Healthy(typical forestco-dominant)
Over 85% of branches produce new growth10-14% canopy transparencyLess than 5% fine twig dieback70-79% photosynthetically active canopy
3 Earliest decline
80-85% of branches produce new growth15-19% canopy transparency5-10% fine twig dieback65-69% photosynthetically active canopy
4 Light decline
75-79% of branches produce new growth20-24% canopy transparencyApproaching 10% fine twig dieback60-64% photosynthetically active canopy
5 Light to moderate decline
70-74% of branches produce new growth25-29% canopy transparency10-15% fine twig dieback50-59% photosynthetically active canopy
6 Moderate decline
60-69% of branches produce new growth30-34% canopy transparencyUp to 15% fine twig dieback40-49% photosynthetically active canopy
7Moderate to severedecline
40-59% of branches produce new growth35-39% canopy transparency15-20% fine twig dieback30-39% photosynthetically active canopy
8 Severe decline
20-39% of branches produce new growth40-44% canopy transparencyUp to 20% fine twig dieback20-29% photosynthetically active canopy
9 Death imminent
Less than 20% of branches produce new growthGreater than 45% canopy transparencyGreater than 25% fine twig diebackLess than 20% photosynthetically active canopy
10 Dead 100% defoliation
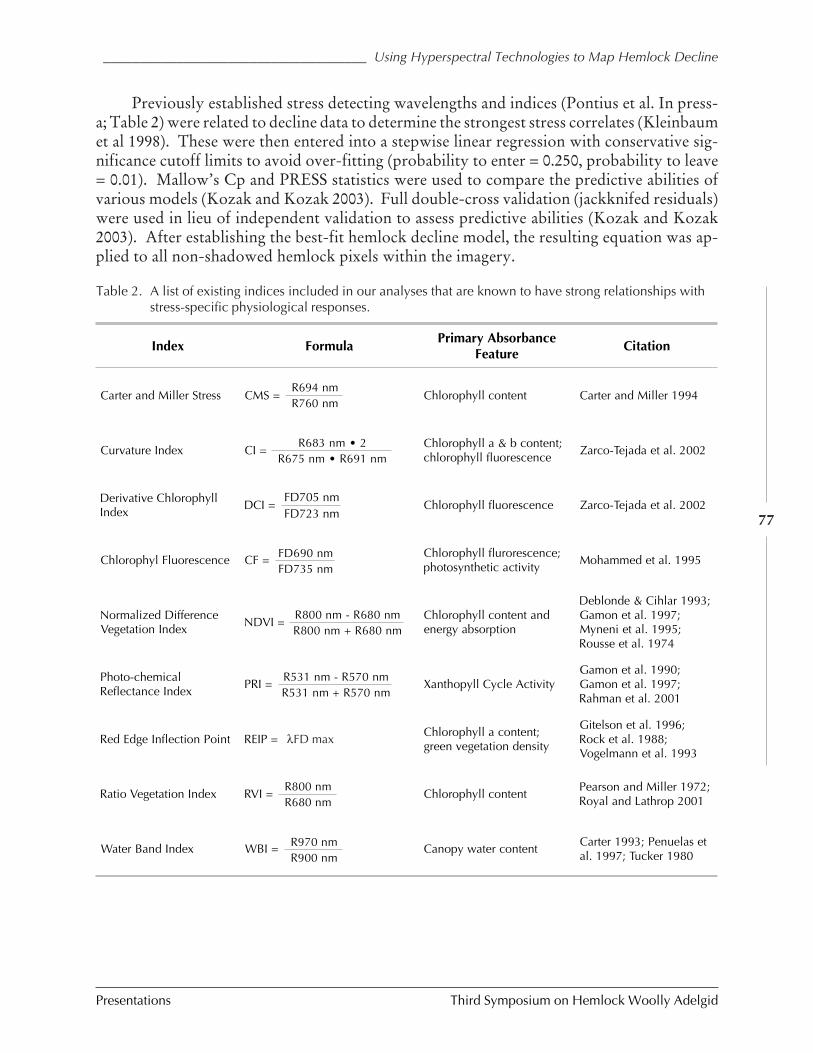
____________________________________ Using Hyperspectral Technologies to Map Hemlock Decline
Presentations Third Symposium on Hemlock Woolly Adelgid
77
Previously established stress detecting wavelengths and indices (Pontius et al. In press-a; Table 2) were related to decline data to determine the strongest stress correlates (Kleinbaumet al 1998). These were then entered into a stepwise linear regression with conservative sig-nificance cutoff limits to avoid over-fitting (probability to enter = 0.250, probability to leave= 0.01). Mallow’s Cp and PRESS statistics were used to compare the predictive abilities ofvarious models (Kozak and Kozak 2003). Full double-cross validation (jackknifed residuals)were used in lieu of independent validation to assess predictive abilities (Kozak and Kozak2003). After establishing the best-fit hemlock decline model, the resulting equation was ap-plied to all non-shadowed hemlock pixels within the imagery.
Table 2. A list of existing indices included in our analyses that are known to have strong relationships withstress-specific physiological responses.
Index FormulaPrimary Absorbance
FeatureCitation
Carter and Miller Stress CMS = Chlorophyll content Carter and Miller 1994
Curvature Index CI =Chlorophyll a & b content;chlorophyll fluorescence
Zarco-Tejada et al. 2002
Derivative ChlorophyllIndex
DCI = Chlorophyll fluorescence Zarco-Tejada et al. 2002
Chlorophyl Fluorescence CF =Chlorophyll flurorescence;photosynthetic activity
Mohammed et al. 1995
Normalized DifferenceVegetation Index NDVI =
Chlorophyll content andenergy absorption
Deblonde & Cihlar 1993;Gamon et al. 1997;Myneni et al. 1995;Rousse et al. 1974
Photo-chemicalReflectance Index
PRI = Xanthopyll Cycle ActivityGamon et al. 1990;Gamon et al. 1997;Rahman et al. 2001
Red Edge Inflection Point REIP =Chlorophyll a content;green vegetation density
Gitelson et al. 1996;Rock et al. 1988;Vogelmann et al. 1993
Ratio Vegetation Index RVI = Chlorophyll contentPearson and Miller 1972;Royal and Lathrop 2001
Water Band Index WBI = Canopy water contentCarter 1993; Penuelas etal. 1997; Tucker 1980
R694 nmR760 nm
R683 nm • 2R675 nm • R691 nm
FD705 nmFD723 nm
FD690 nmFD735 nm
R800 nm - R680 nmR800 nm + R680 nm
R531 nm - R570 nmR531 nm + R570 nm
λFD max
R800 nmR680 nm
R970 nmR900 nm
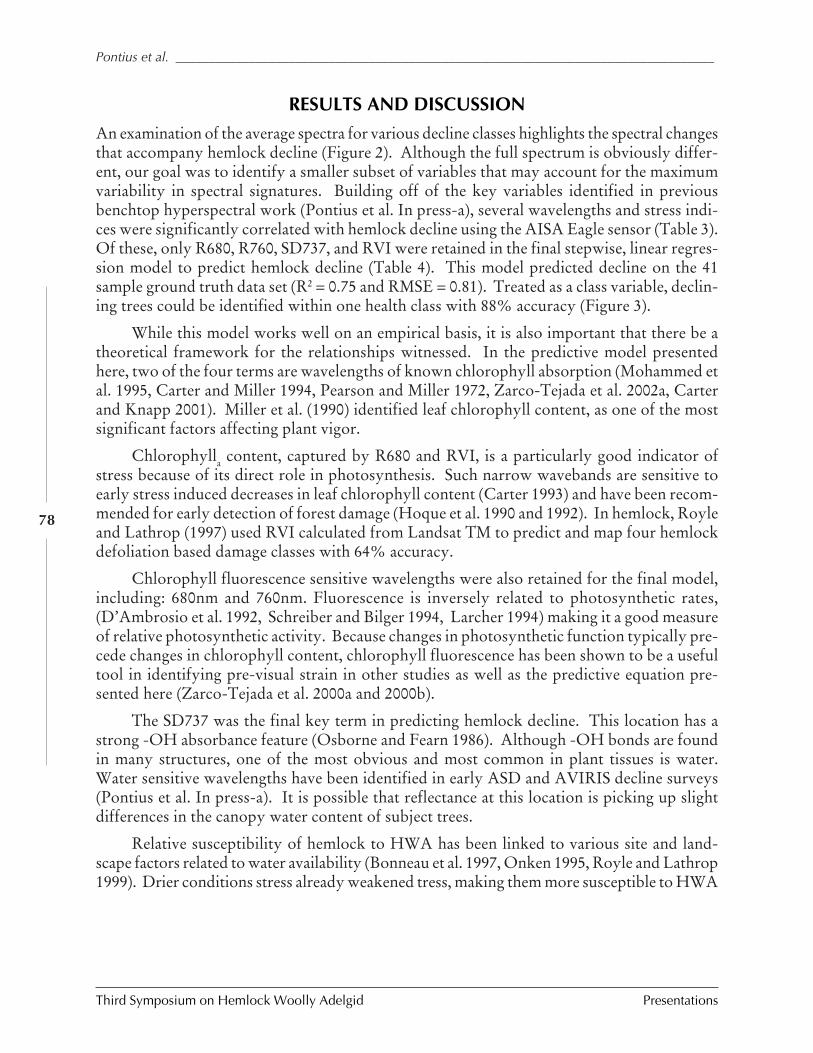
Third Symposium on Hemlock Woolly Adelgid Presentations
Pontius et al. _________________________________________________________________________________
78
RESULTS AND DISCUSSION
An examination of the average spectra for various decline classes highlights the spectral changesthat accompany hemlock decline (Figure 2). Although the full spectrum is obviously differ-ent, our goal was to identify a smaller subset of variables that may account for the maximumvariability in spectral signatures. Building off of the key variables identified in previousbenchtop hyperspectral work (Pontius et al. In press-a), several wavelengths and stress indi-ces were significantly correlated with hemlock decline using the AISA Eagle sensor (Table 3).Of these, only R680, R760, SD737, and RVI were retained in the final stepwise, linear regres-sion model to predict hemlock decline (Table 4). This model predicted decline on the 41sample ground truth data set (R2 = 0.75 and RMSE = 0.81). Treated as a class variable, declin-ing trees could be identified within one health class with 88% accuracy (Figure 3).
While this model works well on an empirical basis, it is also important that there be atheoretical framework for the relationships witnessed. In the predictive model presentedhere, two of the four terms are wavelengths of known chlorophyll absorption (Mohammed etal. 1995, Carter and Miller 1994, Pearson and Miller 1972, Zarco-Tejada et al. 2002a, Carterand Knapp 2001). Miller et al. (1990) identified leaf chlorophyll content, as one of the mostsignificant factors affecting plant vigor.
Chlorophylla content, captured by R680 and RVI, is a particularly good indicator ofstress because of its direct role in photosynthesis. Such narrow wavebands are sensitive toearly stress induced decreases in leaf chlorophyll content (Carter 1993) and have been recom-mended for early detection of forest damage (Hoque et al. 1990 and 1992). In hemlock, Royleand Lathrop (1997) used RVI calculated from Landsat TM to predict and map four hemlockdefoliation based damage classes with 64% accuracy.
Chlorophyll fluorescence sensitive wavelengths were also retained for the final model,including: 680nm and 760nm. Fluorescence is inversely related to photosynthetic rates,(D’Ambrosio et al. 1992, Schreiber and Bilger 1994, Larcher 1994) making it a good measureof relative photosynthetic activity. Because changes in photosynthetic function typically pre-cede changes in chlorophyll content, chlorophyll fluorescence has been shown to be a usefultool in identifying pre-visual strain in other studies as well as the predictive equation pre-sented here (Zarco-Tejada et al. 2000a and 2000b).
The SD737 was the final key term in predicting hemlock decline. This location has astrong -OH absorbance feature (Osborne and Fearn 1986). Although -OH bonds are foundin many structures, one of the most obvious and most common in plant tissues is water.Water sensitive wavelengths have been identified in early ASD and AVIRIS decline surveys(Pontius et al. In press-a). It is possible that reflectance at this location is picking up slightdifferences in the canopy water content of subject trees.
Relative susceptibility of hemlock to HWA has been linked to various site and land-scape factors related to water availability (Bonneau et al. 1997, Onken 1995, Royle and Lathrop1999). Drier conditions stress already weakened tress, making them more susceptible to HWA
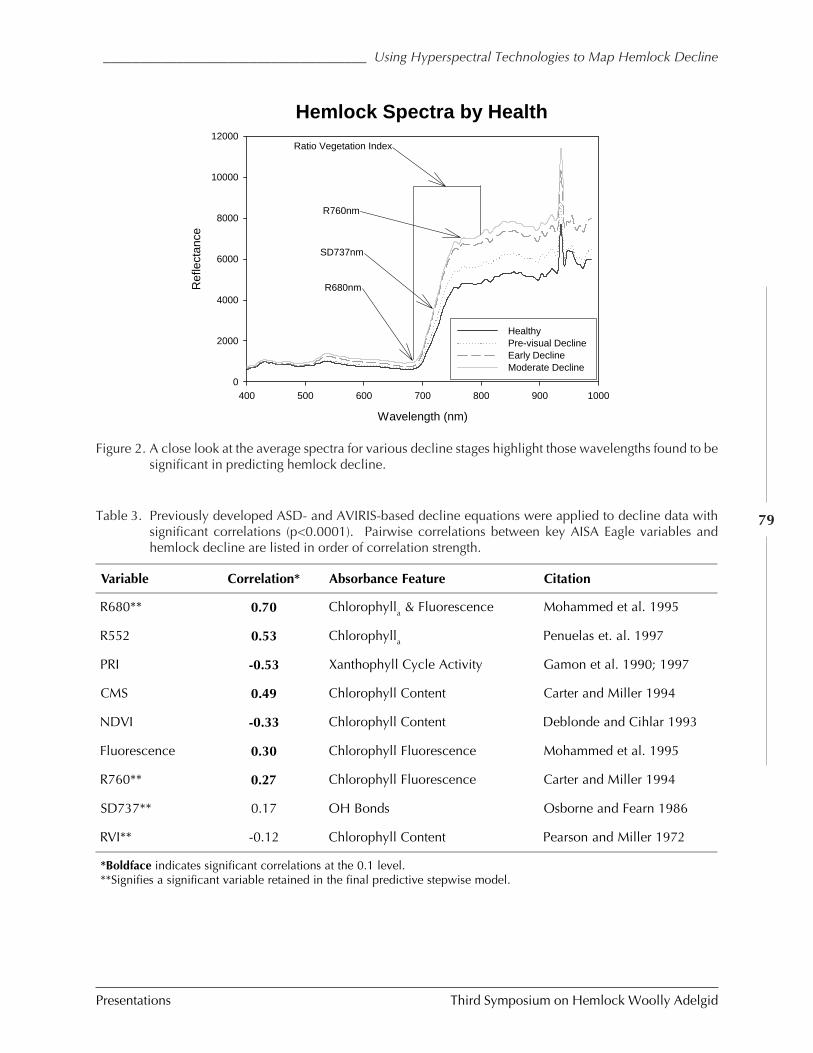
____________________________________ Using Hyperspectral Technologies to Map Hemlock Decline
Presentations Third Symposium on Hemlock Woolly Adelgid
79
Hemlock Spectra by Health
Wavelength (nm)
400 500 600 700 800 900 1000
Ref
lect
ance
0
2000
4000
6000
8000
10000
12000
HealthyPre-visual Decline Early DeclineModerate Decline
R680nm
SD737nm
R760nm
Ratio Vegetation Index
Figure 2. A close look at the average spectra for various decline stages highlight those wavelengths found to besignificant in predicting hemlock decline.
Variable Correlation* Absorbance Feature Citation
R680** 0.70 Chlorophylla & Fluorescence Mohammed et al. 1995
R552 0.53 Chlorophylla Penuelas et. al. 1997
PRI -0.53 Xanthophyll Cycle Activity Gamon et al. 1990; 1997
CMS 0.49 Chlorophyll Content Carter and Miller 1994
NDVI -0.33 Chlorophyll Content Deblonde and Cihlar 1993
Fluorescence 0.30 Chlorophyll Fluorescence Mohammed et al. 1995
R760** 0.27 Chlorophyll Fluorescence Carter and Miller 1994
SD737** 0.17 OH Bonds Osborne and Fearn 1986
RVI** -0.12 Chlorophyll Content Pearson and Miller 1972
*Boldface indicates significant correlations at the 0.1 level.**Signifies a significant variable retained in the final predictive stepwise model.
Table 3. Previously developed ASD- and AVIRIS-based decline equations were applied to decline data withsignificant correlations (p<0.0001). Pairwise correlations between key AISA Eagle variables andhemlock decline are listed in order of correlation strength.
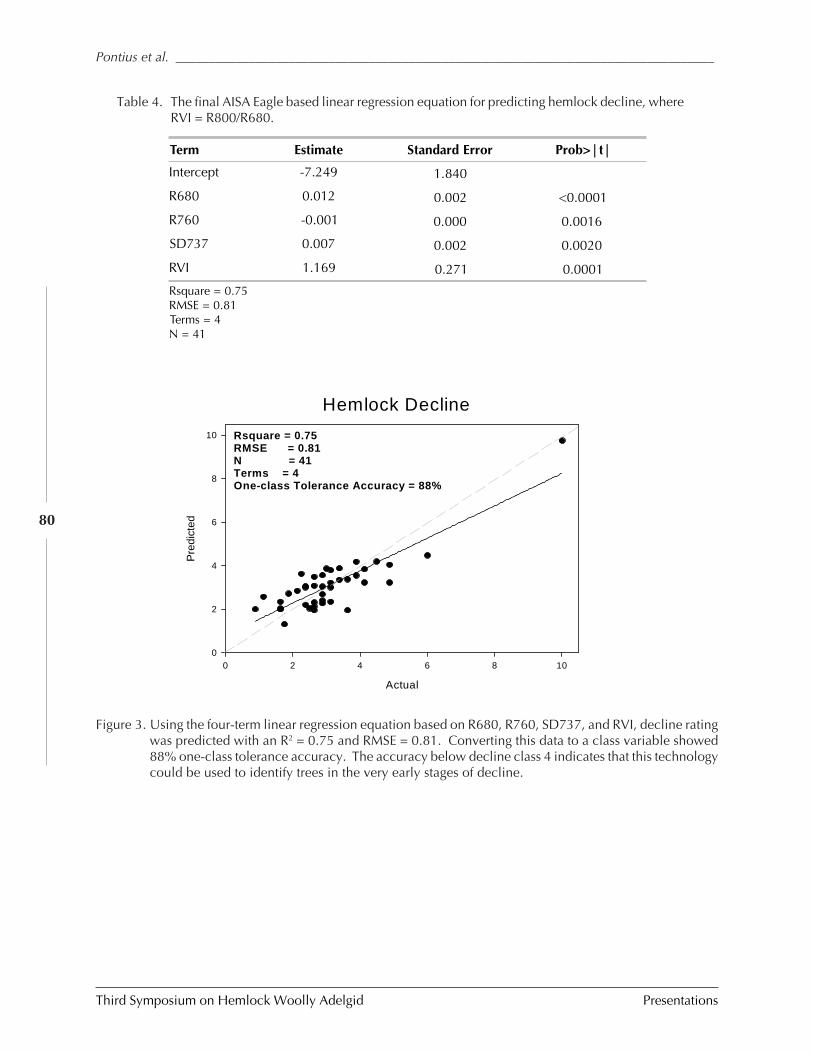
Third Symposium on Hemlock Woolly Adelgid Presentations
Pontius et al. _________________________________________________________________________________
80
Hemlock Decline
Actual
0 2 4 6 8 10
Pre
dict
ed
0
2
4
6
8
10 Rsquare = 0.75RMSE = 0.81N = 41Terms = 4One-class Tolerance Accuracy = 88%
Figure 3. Using the four-term linear regression equation based on R680, R760, SD737, and RVI, decline ratingwas predicted with an R2 = 0.75 and RMSE = 0.81. Converting this data to a class variable showed88% one-class tolerance accuracy. The accuracy below decline class 4 indicates that this technologycould be used to identify trees in the very early stages of decline.
Table 4. The final AISA Eagle based linear regression equation for predicting hemlock decline, whereRVI = R800/R680.
Term Estimate Standard Error Prob>|t|
Intercept -7.249 1.840
R680 0.012 0.002 <0.0001
R760 -0.001 0.000 0.0016
SD737 0.007 0.002 0.0020
RVI 1.169 0.271 0.0001
Rsquare = 0.75RMSE = 0.81Terms = 4N = 41
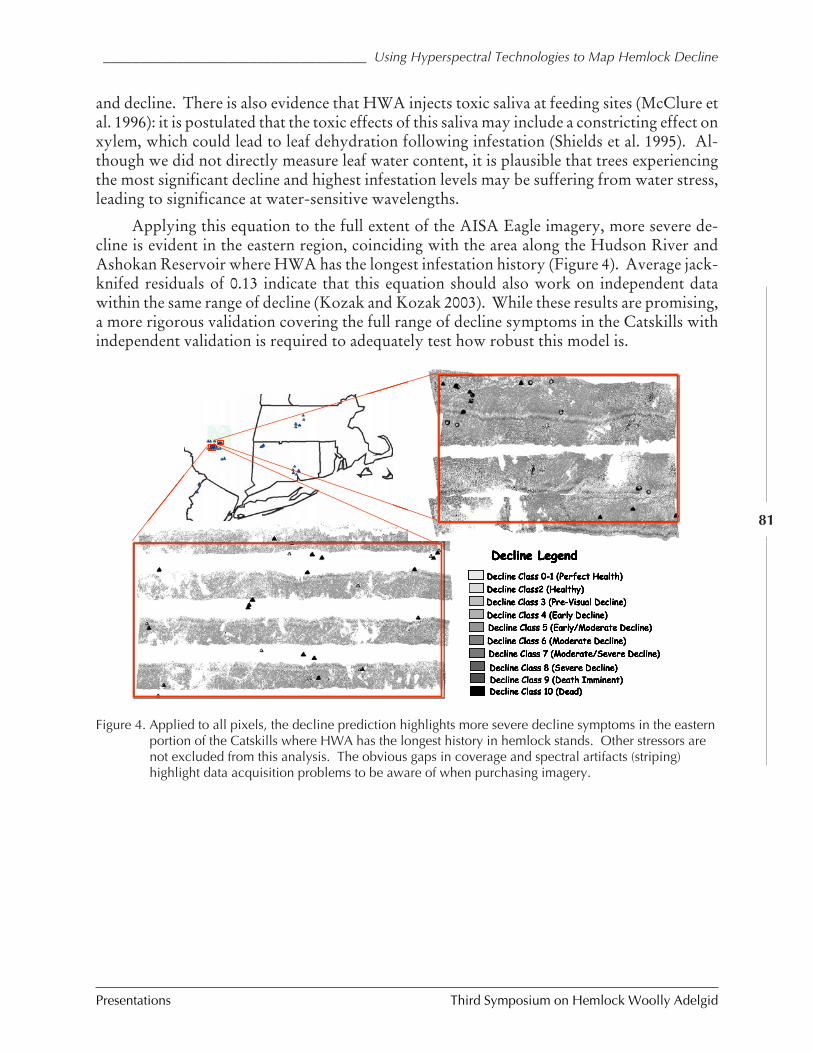
____________________________________ Using Hyperspectral Technologies to Map Hemlock Decline
Presentations Third Symposium on Hemlock Woolly Adelgid
81
and decline. There is also evidence that HWA injects toxic saliva at feeding sites (McClure etal. 1996): it is postulated that the toxic effects of this saliva may include a constricting effect onxylem, which could lead to leaf dehydration following infestation (Shields et al. 1995). Al-though we did not directly measure leaf water content, it is plausible that trees experiencingthe most significant decline and highest infestation levels may be suffering from water stress,leading to significance at water-sensitive wavelengths.
Applying this equation to the full extent of the AISA Eagle imagery, more severe de-cline is evident in the eastern region, coinciding with the area along the Hudson River andAshokan Reservoir where HWA has the longest infestation history (Figure 4). Average jack-knifed residuals of 0.13 indicate that this equation should also work on independent datawithin the same range of decline (Kozak and Kozak 2003). While these results are promising,a more rigorous validation covering the full range of decline symptoms in the Catskills withindependent validation is required to adequately test how robust this model is.
Decline Class 9 (Death Imminent)
Decline Class 0-1 (Perfect Health)
Decline Class2 (Healthy)
Decline Class 4 (Early Decline)
Decline Class 5 (Early/Moderate Decline)
Decline Class 10 (Dead)
Decline Class 7 (Moderate/Severe Decline)
Decline Legend
Decline Class 3 (Pre-Visual Decline)
Decline Class 8 (Severe Decline)
Decline Class 6 (Moderate Decline)
Figure 4. Applied to all pixels, the decline prediction highlights more severe decline symptoms in the easternportion of the Catskills where HWA has the longest history in hemlock stands. Other stressors arenot excluded from this analysis. The obvious gaps in coverage and spectral artifacts (striping)highlight data acquisition problems to be aware of when purchasing imagery.
Third Symposium on Hemlock Woolly Adelgid Presentations
Pontius et al. _________________________________________________________________________________
82
IDENTIFICATION OF PRE-VISUAL DECLINE SYMPTOMS
Early symptoms of stress in forest species include reductions in photosynthetic activity andchlorophyll content (Mohammed et al. 1995). Such changes are not readily detectible fromthe ground in mature stands. This is why most forest health ratings rely on defoliation mea-surements such as transparency or dieback (USDA Forest Service Crown Rating Guide). Upuntil decline class 4, both of these measurements are below what is typically first categorizedas decline in the field (fine twig dieback below 5% and transparency below 15%). Therefore,any results that are successfully able to differentiate between healthy samples (decline class 0)and samples in decline category 4 are most likely picking up changes in chlorophyll contentand function before defoliation symptoms are apparent. Prediction accuracy in the low endof the decline range (0-4) was within a one-class tolerance 92% of the time. These resultsindicate that this technology can be used to detect tree health before visual symptoms areapparent across the landscape.
CROSS-INSTRUMENT APPLICATION
In order for this technology to be applicable on a large spatial and temporal scale, the rela-tionships presented here must also be shown to work on other datasets. The initial selectionof wavelengths for examination with the AISA Eagle imagery was based on results from pre-vious ASD and AVIRIS work. All three instruments demonstrated similar relationships be-tween key wavelengths and decline. We believe this indicates that the work presented herewill prove robust enough for application to other narrow-band sensors from multiple remotesensing platforms.
Because the ratios or pairs of wavelengths used to calculate indices highlight significantfeatures while correcting for geometrical and background effects (Baret and Guyot 1991),cross-instrument application could be direct. Such simple transformations have been closelycorrelated with plant characteristics without the sensitivity to external variables such as sunangle or instrument variability (Pinty et al. 1993). Ongoing work will focus on indices andratios in order to speed processing time.
However, this is not to say that ground truth data will not continue to be necessary inhyperspectral work. The input of known spectra to any predictive model will always in-crease accuracy and ensure that predictions are as robust as possible. In addition, groundtruth data will enable land managers to know the accuracy of their maps and limitations ofpredictive coverages they are using in their management plans.
CONCLUSIONS
These results indicate that a simple four-term linear regression model based on chlorophylla,fluorescence, and water absorption features is able to accurately predict a detailed hemlockdecline rating system (88% one-class tolerance accuracy). The one-class tolerance accuracyat the extreme low end of the decline scale (0, healthy to 4, pre-visual decline) was 92%,indicating that hyperspectral sensors could be used to detect trees in the very early stages ofdecline.
____________________________________ Using Hyperspectral Technologies to Map Hemlock Decline
Presentations Third Symposium on Hemlock Woolly Adelgid
83
There is little evidence that these technologies can diagnose causal agents, as stress maybe related to a variety of factors. However, our ground truth data suggests that most declin-ing hemlocks in this region are currently impacted by HWA. These techniques would pro-vide a much-needed tool for the early detection of stressors such as HWA infestation, andwill allow forest land management agencies to focus biological control efforts on incipientinfestations before trees are severely impacted.
ACKNOWLEDGEMENTS
This work would not have been possible without generous funding from the USDA ForestService, Northeastern Area State and Private Forestry. We would also like to thank Helicop-ter Applicators, Inc. for providing imagery with their newly acquired AISA Eagle. Our tire-less field and lab crew ensured high quality of our ground truth data: Ramona Arechiga,Alexandra Contasta, Garrett Dubois, Amy Ladner, Don Dolliver, Steven Lennartz and ErinQuigley. The support of the following organizations, researchers and land managers was alsokey in locating and accessing appropriate study plots: NY State Department of Environmen-tal Conservation, NY State Department of Environmental Protection, NY State Park System,USDA Forest Service Northeastern Research Station, Michael Montgomery, Jason Denham,and Andrew Poncic.
REFERENCES
Baret, F. and G. Guyot. 1991. Potentials and limits of vegetation indexes for LAI andAPAR assessment. Remote Sensing of Environment 35(2-3):161-173.
Bonneau, L.R., T. ODell, D.L. Civco, S.H. Broderick, and K.S. Sheilds. 1997. The Impactof Hemlock Woolly Adelgid on the Health of Eastern Hemlock: An Update fromConnecticut. Report #97-3. University of Connecticut Cooperative Extension System.
Carter, G.A. 1993. Responses of leaf spectral reflectance to plant stress. American Journalof Botany 80(3):239-243.
Carter, G.A. and R.L. Miller. 1994. Early detection of plant stress by digital imagingwithin narrow stress-sensitive wavebands. Remote Sensing of Environment 50(3):295-302.
Carter, G.A. and A.K. Knapp. 2001. Leaf optical properties in higher plants: Linkingspectral characteristics to stress and chlorophyll concentration. American Journal ofBotany 88(4):677-684.
Cibula, W.G. and G.A. Carter. 1992. Identification of a far red reflectance response toectomycorrhizae in slash pine. International Journal of Remote Sensing 13:925-932.
D’Ambrosio, N., K. Szabo, and H.K. Lichtenthaler. 1992. Increas of the chlorophyllfluorescence ratio F690/F735 during the autumnal chlorophyll breakdown. Radiationand Environmental Biophysics 31(1):51-62.
Third Symposium on Hemlock Woolly Adelgid Presentations
Pontius et al. _________________________________________________________________________________
84
Deblonde, G. and J. Cihlar. 1993. A Multiyear analysis of the relationship between surfaceenvironmental variables and NDVI over the Canadian landmass. Remote Sensing Re-views 7:151-177.
Gamon, J.A., C.B. Field, W. Bilger, O. Bjorkman, A.L. Fredeen, and J. Penuelas. 1990.Remote-sensing of the xanthophyll cycle and chlorophyll fluorescence in sunflowerleaves and canopies. Oecologia 85(1):1-7.
Gamon, J.A., L. Serrano, and J.S. Surfus. 1997. The photochemical reflectance index: anoptical indicator of photosynthetic radiation use efficiency across species, functionaltypes, and nutrient levels. Oecologia 112(4):492-501.
Gitelson, A.A. and M.N. Merzlyak. 1996. Signature analysis of leaf reflectance spectra:algorithm development of remote sensing of chlorophyll. Journal of Plant Physiology148:494-500.
Hoque, E., P.J.S. Hutzler, and H. Hiendl. 1990. Studies on reflective features of Norwayspruce and their possible applications in remote-sensing of forest damage. Toxicologicaland Environmental Chemistry 27(4):209-215.
Hoque, E., P.J.S. Hutzler, and H. Hiendl. 1992. Reflectance, color, and histological fea-tures as parameters for the early assessment of forest damages. Canadian Journal ofRemote Sensing 18:104-110.
Kozak, A. and R. Kozak. 2003. Does cross validation provide additional information inthe evaluation of regression models? Canadian Journal of Forest Research 33:976-987.
Kleinbaum, D.G., L.L. Kupper, K.E. Muller, and A. Nizam. 1998. Applied RegressionAnalysis and Other Multivariable Methods. Cole Publishing Company, Pacific Grove,California.
Lambert, N.J., J. Ardo, B.N. Rock, and J.E. Vogelmann. 1995. Spectral characterizationand regression-based classification of forest damage in Norway spruce stands in theCzech-Republic using Landsat Thematic Mapper data. International Journal of RemoteSensing 16(7):1261-1287.
Larcher, W. 1994. Photosynthesis as a tool for indicating temperatures stress events. InEcophysiology of photosynthesis, ed. E.D. Schulze and M.M.Caldwell. Berlin: Springer-Verlag.
McClure, M.S., S.M. Salom, and K.S. Shields. 1996. Hemlock Woolly Adelgid. USDAForest Service, Morgantown, West Virginia.
Miller, J.R., C.D. Elvidge, B.N. Rock, and J.R. Freemantle. 1990. An airborne perspectiveon vegetation phenology from the analysis of AVIRIS data sets over the Jasper RidgeBiological Preserve. International Geoscience and Remote Sensing Symposium: Remotesensing for the nineties, ed. R. Mills. College Park, Maryland, Institute of Electrical andElectronics Engineers.
Mohammed, G. H., W.D. Binder, and S.L. Gillies. 1995. Chlorophyll fluorescence - areview of its practical forestry applications and instrumentation. Scandinavian Journal ofForest Research 10(4):383-410.
____________________________________ Using Hyperspectral Technologies to Map Hemlock Decline
Presentations Third Symposium on Hemlock Woolly Adelgid
85
Myneni, R.B., F.G. Hall, P.J. Sellers, and A.L. Marshak. 1995. The interpretation of spec-tral vegetation indexes. IEEE Transactions on Geoscience and Remote Sensing 33(2):481-486.
Onken, B.P. 1995. Long-term impact assessment of eastern hemlock forests. In Proceed-ings of the First Hemlock Woolly Adelgid Review, ed. S.M. Salom, T.C. Tigner, andR.C. Reardon. Morgantown, West Virginia, USDA Forest Service.
Osborne, B.G. and T. Fearn,. 1986. Near-Infrared spectroscopy in Food Analysis. NewYork: John Wiley and Sons Inc.
Pearson, L. and L.D. Miller. 1972. Remote mapping of standing crop biomass for estima-tion of the productivity of the short-grass prairie, Pawnee National Grasslands, Colo-rado. In Proceedings of the 8 th International Symposium on Remote Sensing of theEnvironment, Ann Arbor, MI: ERIM.
Penuelas, J., J. Pinol, R. Ogaya, and I. Filella. 1997. Estimation of plant water concentra-tion by the reflectance water index WI (R900/R970). International Journal of RemoteSensing 18(13):2869-2875.
Pinty, B., C. Leprieur, and M.M. Verstraete. 1993. Towards a quantitative interpretationof vegetation indices. Part I. Biophysical canopy properties and classical indices, pp.127-150. In Remote Sensing Reviews 7.
Pontius, J., R.A. Hallett, and M.E. Martin. In press. Assessing hemlock decline usinghyperspectral imagery: signature analysis, indices comparison and algorithm develop-ment. Journal of Applied Spectroscopy.
Pontius, J., M.E. Martin, and R.A. Hallett. In press. Using AVIRIS to assess hemlockabundance and early decline in the Catskills, New York. Remote Sensing of Environ-ment.
Rahman, A.F., J.A. Gamon, D.A. Fuentes, D.A. Roberts, and D. Prentiss. 2001. Modelingspatially distributed ecosystem flux of boreal forest using hyperspectral indices fromAVIRIS imagery. Journal of Geophysical Research-Atmospheres 106(D24):33579-33591.
Rock, B.N., T. Hoshizaki, and J.R. Miller. 1988. Comparison of insitu and airbornespectral measurements of the blue shift associated with forest decline. Remote Sensing ofEnvironment 24(1):109-127.
Rouse, J, R. Hass, J. Schell, D. Deering, and J. Harlan. 1974. Monitoring the vernal ad-vancement and retrogradation of natural vegetation. Greenbelt, Maryland, NationalAeronautics and Space Administration.
Royle, D.D. and R.G. Lathrop. 1997. Monitoring hemlock forest health in New Jerseyusing Landsat TM Data and change detection techniques. Forest Science 43(3):327-335.
Royle, D. and R. Lathrop. 1999. The effects of site factors on the rate of hemlock decline:A case study in New Jersey, p. 103. In Proceedings: Symposium on Sustainable man-agement of hemlock ecosystems in Eastern North America, ed. K.A. McManus, K. S.Shields, and D.R. Souto. Newtown Square, Pennsylvania, USDA Forest Service.
Third Symposium on Hemlock Woolly Adelgid Presentations
Pontius et al. _________________________________________________________________________________
86
Royle, D.D. and R.G. Lathrop. 2002. Discriminating Tsuga canadensis hemlock forestdefoliation using remotely sensed change detection. Journal of Nematology 34(3):213-221.
Royle, D.D., R.G. Lathrop, Jr., and G.P. Koeck. 1995. Mapping hemlock decline innorthern New Jersey using Landsat TM imagery. In Proceedings of the First HemlockWoolly Adelgid Review, ed. S.M. Salom, T.C. Tigner, and R.C. Reardon. Morgantown,West Virginia, USDA Forest Service
Sampson, P.H., G.H. Mohammed, P.J. Zarco-Tejada, J.R. Miller, T.L. Noland, D. Irving,P.M. Treitz, S.J. Colombo, and J. Freemantle. 2000. The bioindicators of forest condi-tion project: a physiological, remote sensing approach. Forestry Chronicle 76(6):941-952.
Schreiber, C. and W.N.C. Bilger. 1994. Chlorophyll fluorescence as a non-destructiveindicator for rapid assessment of in vivo photosynthesis. Ecological Studies 71:49-70.
Shields, K.S., R.F. Young, and G.P. Berlyn. 1995. Hemlock woolly adelgid feeding mecha-nisms . In Proceedings of the First Hemlock Woolly Adelgid Review, ed. S.M. Salom,T.C. Tigner, and R.C. Reardon. Morgantown, West Virginia, USDA Forest Service.
Treitz, P.M. and P.J. Howarth. 1999. Hyperspectral remote sensing for estimating bio-physical parameters of forest ecosystems. Progress in Physical Geography 23(3):359-390.
Tucker, C. J. 1980. Remote sensing of leaf water content in the near infrared. RemoteSensing of the Environment 10:23-32.
Vogelmann, J.E. and B.N. Rock. 1988. Assessing forest damage in high-elevation conifer-ous forests in Vermont and New-Hampshire using Thematic Mapper data. RemoteSensing of Environment 24(2):227-246.
Vogelmann, J.E., B.N. Rock, and D.M. Moss. 1993. Red edge spectral measurements fromsugar maple leaves. International Journal of Remote Sensing 14(8):1563-1575.
Zarco-Tejada, P.J., J.R. Miller, G.H. Mohammed, and T.L. Noland. 2000a. Chlorophyllfluorescence effects on vegetation apparent reflectance: I. Leaf-level measurements andmodel simulation. Remote Sensing of Environment 74(3):582-595.
Zarco-Tejada, P. J., J.R. Miller, G.H. Mohammed, T.L. Noland, and P.H. Sampson. 2000b.Chlorophyll fluorescence effects on vegetation apparent reflectance: II. Laboratory andairborne canopy-level measurements with hyperspectral data. Remote Sensing of Envi-ronment 74(3):596-608.
_____________________________ Operational Use of Hyperspectral Imagery for Forest Health Mapping
Presentations Third Symposium on Hemlock Woolly Adelgid
87
OPERATIONAL USE OF HYPERSPECTRAL IMAGERY FOR FOREST HEALTH MAPPING
Richard Hallett1, Jennifer Pontius1, Mary Martin2, and Lucie Plourde2
1USDA Forest Service, Northeastern Research Station,Durham, New Hampshire
2Complex Systems Research Center, University of New Hampshire,Durham, New Hampshire
ABSTRACT
Hyperspectral remote sensing imagery has been used to map foliar chemistry (N and Ca),forest productivity, species, and tree health at the landscape scale (25,000 acres to 840,000acres). Most of this work has been accomplished by research teams using sensors and tech-niques that are not generally available for use by forest land managers. Recently, hyperspectralremote sensing imagery has become commercially available, making this technology moreaccessible. However, the techniques for processing this imagery and producing usable mapsare complicated and still relatively new. This paper will provide information and guidelines tohelp forest land managers understand, contract for, and utilize hyperspectral remote sensingimagery to produce landscape scale maps of eastern hemlock health.
KEYWORDS
Remote sensing, hyperspectral, species mapping, hemlock health.
INTRODUCTION
The spread of the hemlock woolly adelgid (HWA, Adelges tsugae Annand) across the north-eastern United States continues to threaten the eastern hemlock (Tsuga canadensis Carriere)resource. The potential loss of eastern hemlock from the forest ecosystem forces land manag-ers to consider a wide array of possible treatment and management options. In order for landmanagement agencies to begin to prioritize and design a focused management plan in re-sponse to HWA infestation, it is necessary to efficiently identify the location and health sta-tus of the eastern hemlock resource.
Currently, rough species type maps are created using aerial photography, aerial sketchmaps, and on the ground surveys. In order to track hemlock health and HWA infestationfield surveys are required and detection is limited to sampled plots. Existing remote sensingtechniques using broad-band remote sensing imagery are limited to identifying trees only insevere states of decline. Such survey techniques cannot easily identify incipient infestation orearly health problems.
Remote sensing technology has been available for landscape scale mapping of forestecosystems for several decades. The primary users of this technology have typically been
Third Symposium on Hemlock Woolly Adelgid Presentations
Hallett et al. __________________________________________________________________________________
88
researchers studying ecosystem dynamics at a landscape scale. Hyperspectral remote sensingimagery has been used to map foliar chemistry (N and Ca), forest productivity, species, andtree health at the landscape scale (25,000 acres to 840,000 acres)(Smith et al. 2002, Ollinger etal. 2002, Martin and Aber 1997, Pontius et al.In press-a and -b). Most of this work has beenaccomplished by research teams using sensors and techniques that are not generally available,for use by forest land managers. Recently, hyperspectral remote sensing imagery has becomecommercially available making this technology more accessible to forest land managers. How-ever the techniques for processing this imagery and producing usable maps are complicatedand still relatively new. This paper will provide information and guidelines to help forest landmanagers understand, contract for, and utilize hyperspectral remote sensing imagery to pro-duce landscape scale maps of hemlock health.
USEFUL TERMS
1. Spatial Resolution: Spatial resolution is most often expressed in meters and refers tothe area on the ground represented by a single image pixel. For example, a spatial reso-lution of 1 meter means that a single pixel will contain data from a 1 m by 1 m area on theground. An image taken at 1 meter resolution is sufficient to show individual tree crownsin a forest. A spatial resolution of 20 meters will contain less detail and is appropriate forgaining stand-level information. For airborne instruments, spatial resolution is largelydependent upon the altitude at which the instrument is flown.
2. Spectral Resolution: Number and spectral width (in nanometers) of the bands of re-flected light that can be recorded by the sensor. Many narrow bands covering a broadrange of the spectrum are characteristic of hyperspectral instruments. The spectral reso-lution needed will depend on the questions to be answered. For example, identifyingareas of severe defoliation will require significantly fewer bands than picking up pre-visual decline symptoms in newly infested stands.
3. Geo-registration: Geographic registration or geographic rectification is the spatialreferencing of an image to a geographic coordinate system (e.g., latitude/longitude, UTM,State Plane). Once the image data is collected, it is important to be able to link each pixelin the image to the location it came from on the ground. The accuracy of geo-registra-tion has a direct bearing on the usefulness of the final maps and the accuracy of groundtruth input and validation.
WHAT IS HYPERSPECTRAL IMAGERY?
Hyperspectral remote sensing imagery is characterized by the large number of narrow bandsof reflectance data collected across a broad range of the electromagnetic spectrum. Figure 1shows a typical spectral signature from a vegetated pixel. NASA’s hyperspectral AirborneVisible/Infrared Imaging Spectrometer (AVIRIS) instrument collects data from 400 to 2400nm. Commercial vendors typically utilize hyperspectral sensors that collect data from 400 to1000 nm, although there are some full-range (~400-2500 nm) instruments available. By con-trast, Landsat TM is classified as a multi-spectral instrument because it collects data in 6 broadbands of reflected light.
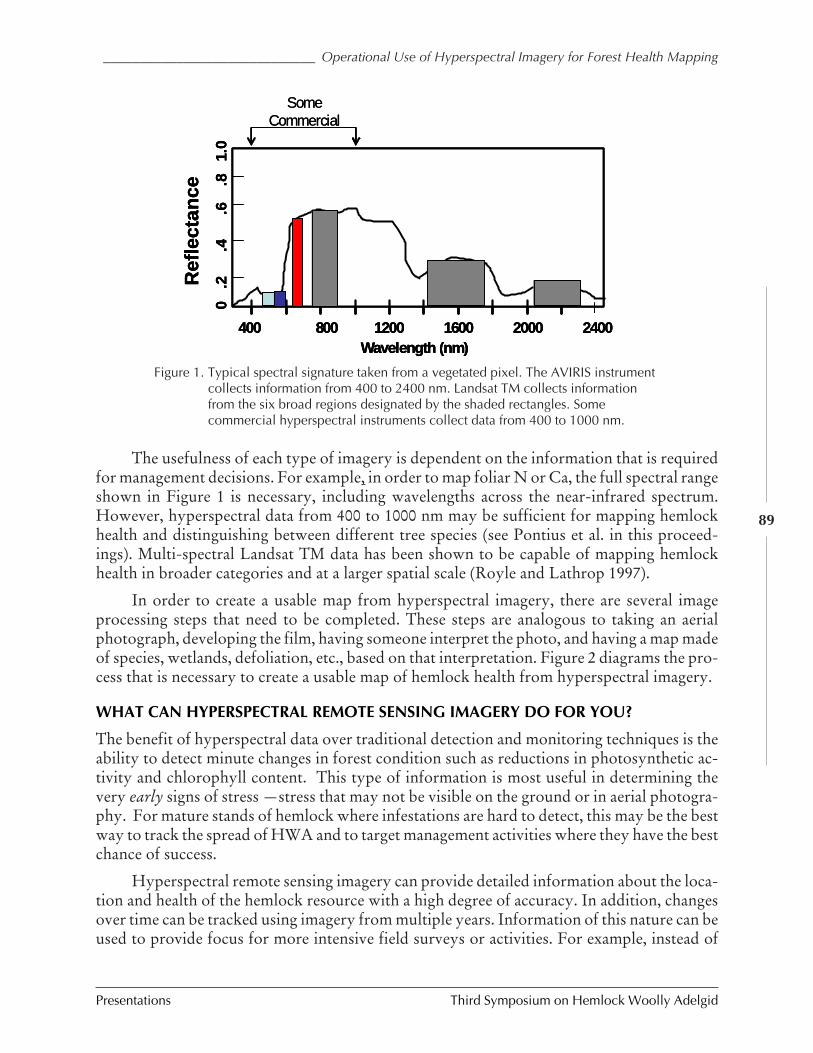
_____________________________ Operational Use of Hyperspectral Imagery for Forest Health Mapping
Presentations Third Symposium on Hemlock Woolly Adelgid
89
The usefulness of each type of imagery is dependent on the information that is requiredfor management decisions. For example, in order to map foliar N or Ca, the full spectral rangeshown in Figure 1 is necessary, including wavelengths across the near-infrared spectrum.However, hyperspectral data from 400 to 1000 nm may be sufficient for mapping hemlockhealth and distinguishing between different tree species (see Pontius et al. in this proceed-ings). Multi-spectral Landsat TM data has been shown to be capable of mapping hemlockhealth in broader categories and at a larger spatial scale (Royle and Lathrop 1997).
In order to create a usable map from hyperspectral imagery, there are several imageprocessing steps that need to be completed. These steps are analogous to taking an aerialphotograph, developing the film, having someone interpret the photo, and having a map madeof species, wetlands, defoliation, etc., based on that interpretation. Figure 2 diagrams the pro-cess that is necessary to create a usable map of hemlock health from hyperspectral imagery.
WHAT CAN HYPERSPECTRAL REMOTE SENSING IMAGERY DO FOR YOU?
The benefit of hyperspectral data over traditional detection and monitoring techniques is theability to detect minute changes in forest condition such as reductions in photosynthetic ac-tivity and chlorophyll content. This type of information is most useful in determining thevery early signs of stress —stress that may not be visible on the ground or in aerial photogra-phy. For mature stands of hemlock where infestations are hard to detect, this may be the bestway to track the spread of HWA and to target management activities where they have the bestchance of success.
Hyperspectral remote sensing imagery can provide detailed information about the loca-tion and health of the hemlock resource with a high degree of accuracy. In addition, changesover time can be tracked using imagery from multiple years. Information of this nature can beused to provide focus for more intensive field surveys or activities. For example, instead of
400 800 1200 1600 2000 2400Wavelength (nm)
Ref
lect
ance
0 .
2
.4
.
6
.8
1.0
Some Commercial
400 800 1200 1600 2000 2400Wavelength (nm)
Ref
lect
ance
0 .
2
.4
.
6
.8
1.0
400 800 1200 1600 2000 2400Wavelength (nm)
Ref
lect
ance
0 .
2
.4
.
6
.8
1.0
Some Commercial
Figure 1. Typical spectral signature taken from a vegetated pixel. The AVIRIS instrumentcollects information from 400 to 2400 nm. Landsat TM collects informationfrom the six broad regions designated by the shaded rectangles. Somecommercial hyperspectral instruments collect data from 400 to 1000 nm.
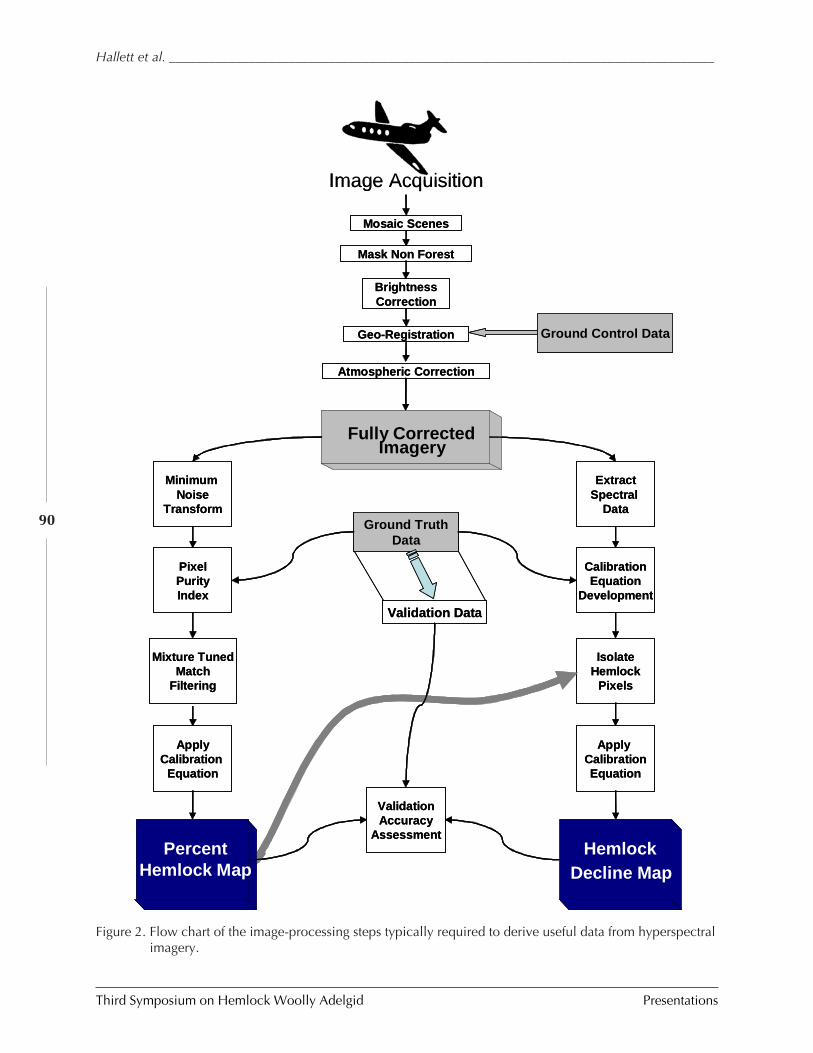
Third Symposium on Hemlock Woolly Adelgid Presentations
Hallett et al. __________________________________________________________________________________
90
Ground Control Data
Image Acquisition
Mosaic Scenes
Mask Non Forest
BrightnessCorrection
Geo-Registration
Atmospheric Correction
Ground TruthData
Fully CorrectedImagery
HemlockDecline Map
Minimum Noise
Transform
PixelPurityIndex
Mixture TunedMatch
Filtering
ApplyCalibration
Equation
ExtractSpectral
Data
CalibrationEquation
Development
IsolateHemlock
Pixels
Apply CalibrationEquation
ValidationAccuracy
Assessment
Validation Data
PercentHemlock Map
Ground Control Data
Image Acquisition
Mosaic Scenes
Mask Non Forest
BrightnessCorrection
Geo-Registration
Atmospheric Correction
Ground TruthData
Fully CorrectedImagery
Fully CorrectedImagery
HemlockDecline Map
HemlockDecline Map
Minimum Noise
Transform
PixelPurityIndex
Mixture TunedMatch
Filtering
ApplyCalibration
Equation
ExtractSpectral
Data
CalibrationEquation
Development
IsolateHemlock
Pixels
Apply CalibrationEquation
ValidationAccuracy
Assessment
Validation Data
PercentHemlock Map
PercentHemlock Map
Figure 2. Flow chart of the image-processing steps typically required to derive useful data from hyperspectralimagery.

_____________________________ Operational Use of Hyperspectral Imagery for Forest Health Mapping
Presentations Third Symposium on Hemlock Woolly Adelgid
91
using field crews to conduct a field plot survey over large areas of the landscape to detect anynew HWA infestation, remote sensing technology could be used to identify areas that appearto be unhealthy. Field crews could then be sent to areas identified as unhealthy to determinewhether the source of the stress is HWA infestation.
The success of bio-control efforts is also dependent on identifying areas of moderateinfestation, where trees are still relatively healthy. Continuous coverages of hemlock healthwould facilitate the location of appropriate release sites for predatory insects. Otherremediation efforts, such as pesticide application are also dependent on locating infested areaswith moderately healthy trees. Being able to provide landscape scale information to thesemanagement activities should improve their success rates.
IS HYPERSPECTRAL IMAGERY RIGHT FOR YOU?
The use of commercial use of hyperspectral imagery by forest land managers is new, andimage acquisition and processing can be quite complicated and expensive. For these reasons,it is advisable to consider the management decisions you are facing in the context of whetherthe maps produced from hyperspectral imagery will provide new information, more detailedinformation, and/or, unique information about the landscape you are managing. In somecases you may find that existing methods and technologies are more efficient and/or costeffective. For example, if you are interested only in areas of severe hemlock decline, thenLandsat TM data, aerial sketchmapping, and aerial photo-interpretation may be more costeffective options. However, if your management strategy depends upon early detection ofdecline and accurate mapping of the hemlock resource, then data products derived fromhyperspectral imagery may be preferable.
WHERE CAN I GET HYPERSPECTRAL IMAGERY?
Hyperspectral data can be obtained from a number of commercial vendors (Table 1). It isimportant to note that the data products provided by these vendors will vary. In some cases,a vendor may provide final data products, such as maps of species or stand/tree health, whereasin other cases, the data product may be image data of surface reflectance in a varying numberof spectral bands, covering a varying spectral range; in the latter case, it will be necessary totransform that spectral data into the data product required for your management decisions.Land managers may choose to transform spectral data into these final products in-house byapplying analysis techniques and algorithms to the imagery or to contract with a third partyto generate these products.
Table 1 includes some key variables that can help evaluate whether the instrument issuitable for your needs. The name of the actual instrument a vendor uses is important becausedifferent vendors may use the same instrument to produce their image data. The spectralrange and resolution are important in determining the suitability of data in generating differ-ent products: the narrower the spectral resolution, the more refined predictions of foresthealth and species mapping will be. To date, the identification of early decline symptoms hasbeen accomplished with up to 10-nm resolution spectra across the visible and near infraredwavelengths (400-800 nm). The location of the company may have a bearing on cost as it canbe expensive to ferry the instrument long distances, although this may be mitigated some-what if the company has other jobs in your area.
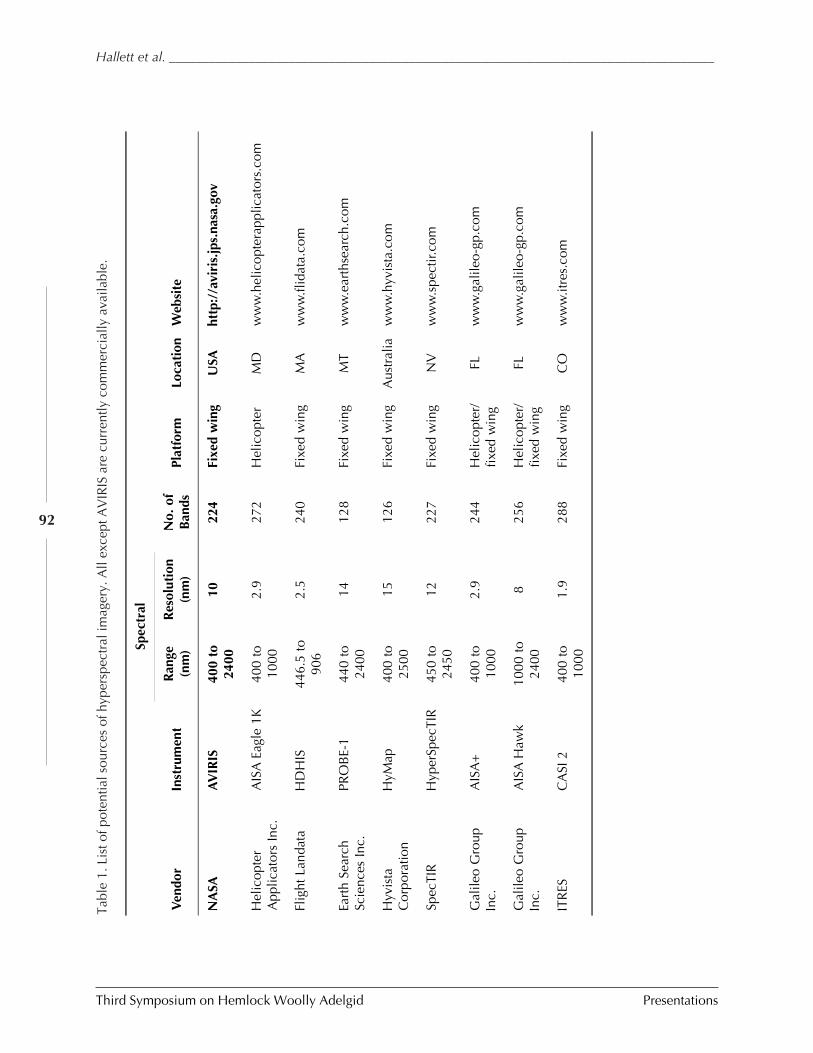
Third Symposium on Hemlock Woolly Adelgid Presentations
Hallett et al. __________________________________________________________________________________
92
Tabl
e 1.
Lis
t of p
oten
tial s
ourc
es o
f hyp
ersp
ectr
al im
ager
y. A
ll ex
cept
AV
IRIS
are
cur
rent
ly c
omm
erci
ally
ava
ilabl
e.
Spec
tral
Ven
dor
Inst
rum
ent
Ran
ge(n
m)
Res
olut
ion
(nm
)N
o. o
fB
ands
Plat
form
Loca
tion
Web
site
NA
SAA
VIR
IS40
0 to
2400
1022
4Fi
xed
win
gU
SAht
tp:/
/avi
ris.
jps.
nasa
.gov
Hel
icop
ter
App
licat
ors
Inc.
AIS
A E
agle
1K
400
to10
002.
927
2H
elic
opte
rM
Dw
ww
.hel
icop
tera
pplic
ator
s.co
m
Flig
ht L
anda
taH
DH
IS44
6.5
to90
62.
524
0Fi
xed
win
gM
Aw
ww
.flid
ata.
com
Eart
h Se
arch
Scie
nces
Inc.
PRO
BE-
144
0 to
2400
1412
8Fi
xed
win
gM
Tw
ww
.ear
thse
arch
.com
Hyv
ista
Cor
pora
tion
HyM
ap40
0 to
2500
1512
6Fi
xed
win
gA
ustr
alia
ww
w.h
yvis
ta.c
om
Spec
TIR
Hyp
erSp
ecTI
R45
0 to
2450
1222
7Fi
xed
win
gN
Vw
ww
.spe
ctir.
com
Gal
ileo
Gro
upIn
c.A
ISA
+40
0 to
1000
2.9
244
Hel
icop
ter/
fixed
win
gFL
ww
w.g
alile
o-gp
.com
Gal
ileo
Gro
upIn
c.A
ISA
Haw
k10
00 to
2400
825
6H
elic
opte
r/fix
ed w
ing
FLw
ww
.gal
ileo-
gp.c
om
ITR
ESC
ASI
240
0 to
1000
1.9
288
Fixe
d w
ing
CO
ww
w.it
res.
com
_____________________________ Operational Use of Hyperspectral Imagery for Forest Health Mapping
Presentations Third Symposium on Hemlock Woolly Adelgid
93
SPATIAL RESOLUTION
Imagery collected from an airborne platform can have variable spatial resolution. Flying closerto the ground will yield a more detailed image, sometimes reaching resolutions of less than 1meter.
Careful consideration should be given to the level of detail that is required to answeryour specific management question. It may not always be better to have a higher level ofdetail in your image: high spatial resolution images can be more expensive to collect becausea smaller area on the ground is covered with each pass of the instrument, and so require morepasses (and expense) to capture the area of interest. In addition, the data collected can be moredifficult and time-consuming to process not only because of increased data dimensionality,but also because of the increased pixel variation (e.g., individual pixels that capture gaps in thecanopy, variation in canopy structure, etc).
The size of the area to be mapped will also have a bearing on the level of detail necessary.For example, if you are mapping 100,000 acres, you may not need or want information forevery tree (which is what 1-2 meter spatial resolution will yield): a map created with 20-meterspatial resolution will be sufficient for assessment of tree health and species abundance overlarge areas of the landscape. On the other hand if you are collecting imagery from urban areaswhere information on individual trees is essential, highly detailed spatial data (e.g., 1- to 4-mresolution) are necessary to accurately map vegetated and non-vegetated areas.
CONTRACTING FOR HYPERSPECTRAL IMAGE ACQUISITION AND PROCESSING.
There are several items that you may need to provide a vendor. These vary with the dataproduct provided by the vendor, and include the following:
1. Boundary mapA map of the area that you want flown. The map should be provided to the vendor’sspecifications. Some vendors require an Arc shapefile while others may only need thecoordinates of the corners of the area to be flown.
2. Ground reference dataAny hyperspectral imagery should have a set of ground truth data as input for the cre-ation of predicted health and species mapping layers. This allows the image processor totrain on areas of known infestation, health, and species composition and is necessary inorder to maximize the utility of the imagery. In order to collect accurate ground refer-ence data, you or the vendor will need a high-precision GPS unit capable of 1- to 2-meter accuracy
a. Calibration and validation plot data (60 plots per image)
Calibration and validation data are field plot measurements collected for specieshealth or abundance. The plots should be spread evenly across the area to be flown.They should cover the full range of health or species abundance found in the area.The data collection should take place concurrent with the image acquisition inorder to ensure identical conditions.
If a vendor provides image data that needs to be processed into a final product,you must collect calibration and validation data. For example, forty plots could
Third Symposium on Hemlock Woolly Adelgid Presentations
Hallett et al. __________________________________________________________________________________
94
be used to calibrate the imagery during the processing phase (e.g., transform thehyperspectral data into the final product) while an additional 20 plots would beused for validating the final product. We recommend this number of plots to en-sure the creation of robust prediction equations.
If a vendor provides a final data product, such as species maps or health assess-ment maps, you may still need to provide the vendor with plot-level data forprocessing the imagery, as well as for reporting an estimate of accuracy for thefinal product (validation).
b. Ground control points (50 per image)
These plots are used to geographically register the image so it is possible to relatedata from a point on the image to the same point on the ground. If the vendordoes not collect ground control data, you will need to provide it yourself. Groundcontrol points are field targets, such as road intersections that can be easily lo-cated on the image. For high spatial resolution imagery, isolated tree canopiesmay be used, while lower spatial resolution imagery would be limited to largeroad intersections, buildings, or cover type changes. A precise location on theground is obtained using a high precision GPS unit (1-2 meter accuracy) and canbe linked to pixels in image processing and GIS software programs. Fifty plots areoften sufficient, while for some images, more or fewer plots are required. To en-sure accurately geo-referenced data, these targets should be evenly distributedthroughout the geographic extent of the image.
Alternatively, ground control points can be obtained through the use of a geo–registered digital ortho quad (DOQ) maps of your area from the United StatesGeological Survey. These can be used to extract latitude and longitude for pointson the ground that corresponds to points visible in the image. Although easier,this method will yield less accurate results because there is some inherent errorassociated with the DOQ locational data. Ideally, ground control points ob-tained in the field would be used in conjunction with registration to DOQ imag-ery to provide the highest level of accuracy across an entire image.
3. Image processing and/or GIS software
Whether you will be processing the hyperspectral image data or receiving a final dataproduct, you will likely need to be familiar with image processing and/or geographicinformation systems (GIS) software. This will facilitate the viewing and use of the finalproduct.
In order to protect both the land-manager and vendor, a detailed contract should be devel-oped. In developing this contract the following items be considered:
1. Complete image data coverage of the specified area
2. Spatial resolution requirements
3. Image data pre-processing
_____________________________ Operational Use of Hyperspectral Imagery for Forest Health Mapping
Presentations Third Symposium on Hemlock Woolly Adelgid
95
• All airborne image data collection is influenced by the atmospheric conditions atthe time of flight. It is therefore necessary to convert imagery to reflectance usingan atmospheric correction. Multiple programs currently exist (e.g., ACORN andATREM) that are capable of transforming calibrated at-sensor radiance data toreflectance with minimal inputs, such as date and time of flight, altitude, humid-ity, etc.
• Depending on the sensor, and resolution, other pre-processing steps may be nec-essary, such as a view angle correction for scanning spectrometers or shadow re-moval for high spatial resolution imagery (Figure 2).
4. Documentation of spectral and radiometric instrument calibration procedures and re-sults
• This ensures that the instrument is being maintained properly and the data ob-tained from these procedures can help with image processing.
5. Image collection to meet following requirements:
• Close to solar noon (i.e. ± 2 hours)
• Collection under cloudless conditions is optimal. Given that portions of the im-age covered by clouds and their shadows are unusable, you should negotiate ac-ceptable conditions in the contract.
6. Image geo-registration negotiated with vendor
• At a minimum, a vendor should provide you with imagery that has had inertialnavigation system (INS) correction. This corrects for the flight variables, such asroll, pitch and yaw, and must be performed for the imagery to be in a useableform. While this INS correction creates an image similar to an aerial photo, itdoes not assign geographic coordinates to the imagery: this requires a full geo-registration, which is offered by some vendors, or can be completed in-house. Inareas of severe terrain, an orthorectification may also be required to maximize theaccuracy or registration. If a vendor is to provide full geo-registration, the ex-pected accuracy should be stated in the contract. Typically one can expect regis-tration accuracy to within 2-3 pixels.
7. Image format
• The format of the product delivered to you (whether reflectance data or a finalprediction coverage) should be negotiated with vendor and match your in-housedata-handling capabilities.
8. Final product with at least 80% accuracy
• If the vendor is to provide a final prediction coverage to you, comparisons toyour validation ground truth data should meet some specified accuracy level. It isnot uncommon for hyperspectral sensors to predict health ratings and speciesclassification with greater than 80% accuracy.
Third Symposium on Hemlock Woolly Adelgid Presentations
Hallett et al. __________________________________________________________________________________
96
CONCLUSION
Hyperspectral remote sensing imagery is commercially available and has proven applicabilityfor forest land managers who are making management decisions based upon the location andhealth of the hemlock resource. However, acquiring and processing this imagery is compli-cated, requires a high level of technical expertise, and can be expensive. Issues to considerbefore contracting for hyperspectral imagery include the added value of the expected maps,the level of spatial detail required, and the feasibility of utilizing digital mapping information.Careful attention needs to be given to insuring the spatial and informational accuracy of thefinal maps. Finally, it should be noted that even though remote sensing technology can pro-duce detailed information for large contiguous areas of the landscape it does not eliminate theneed for collecting field-based plot data.
REFERENCES
Martin, M.E. and J.D. Aber. 1997. High spectral resolution remote sensing of forestcanopy lignin, nitrogen, and ecosystem processes. Ecological Applications 7:431-443.
Martin, M.E., M.L. Smith, S.V. Ollinger, R.A. Hallett, C.L. Goodale, and J.D. Aber. 1999.Applying AVIRIS at the Sub-Regional Scale: Forest Productivity and Nitrogen andCation Cycling, pp. 275-280. In Summaries of the Eighth JPL Airborne Earth ScienceWorkshop.
Ollinger, S.V., M.L. Smith, M.E. Martin, R.A. Hallett, C.L. Goodale, and J.D. Aber. 2002.Regional variation in foliar chemistry and soil nitrogen status among forests of diversehistory and composition. Ecology 83:339-355.
Pontius, J., R.A. Hallett, and M.E. Martin. In press-a. Assessing hemlock decline usinghyperspectral imagery: signature analysis, indices comparison and algorithm develop-ment. Journal of Applied Spectroscopy.
Pontius, J., M.E. Martin, and R.A. Hallett. In press-b. Using AVIRIS to assess hemlockabundance and early decline in the Catskills, New York. Remote Sensing of Environ-ment.
Royle D. and R. Lathrop. 1997. Monitoring hemlock forest health in New Jersey usingLandsat TM data and change detection techniques. Forest Science 43:327-335.
Smith, M.L., S.V. Ollinger, M.E. Martin, J.D. Aber, R.A. Hallett, and C.L. Goodale. 2002.Direct estimation of aboveground forest productivity through hyperspectral remotesensing of canopy nitrogen. Ecological Applications 12:1286-1302.
_________________________________________ Hyperspectral Remote Sensing for Vegetation Surveys
Presentations Third Symposium on Hemlock Woolly Adelgid
97
HYPERSPECTRAL REMOTE SENSING FOR VEGETATION SURVEYS
Sarah M. Green and Jason A. Cole
Helicopter Applicators, Inc.1670 York Road, Gettysburg, PA 17325
ABSTRACT
Hemlock woolly adelgid (HWA), Adelges tsugae, and other forest pests, including invasivesspecies, are a problem for our forests and ecosystems. Surveying and monitoring these prob-lems are done at great cost in both money and time. With the use of hyperspectral remotesensing, vegetation identification and stress can be analyzed remotely, saving time and sur-veying a larger area. Hyperspectral Remote Sensing is the process of gathering spectral signa-tures remotely. Everything has its own signature, similar to that of a fingerprint, making eachunique. Helicopter Applicators Incorporated utilizes an AISA Eagle 1K sensor system togather and analyze these spectral signatures.
Helicopter Applicators Incorporated (HAI) was established in 1974 as an aerial applica-tion company and has since branched into the field of remote sensing. The AISA Eagle 1Khas a wider swath ability, which allows it to be flown higher and thereby gather more data inless time and at the same or better resolution than other sensors. With customized hardwareand software, HAI offers a full end product.
To demonstrate this, Helicopter Applicators was involved with two vegetation manage-ment projects in 2004. HAI flew 400 linear miles in the Kiski-Conemaugh Watershed forinvasives identification. West Virginia University gathered spectra via a handheld spectrom-eter. The mission was to search for 13 invasives species and then compare results to volunteerdata throughout the watershed. HAI conclusively located mile-a-minute weed (Polygonumperfoliatum), tree of heaven (Sumac) (Allanthus altissima), garlic mustard (Alliaria petiolata),purple loosestrife (Lythrum salicarla), Norway maple (Acer platanoides), and common reed(Phragmites australis).
The second mission was in the Catskill Mountains in New York in cooperation withThe University of New Hampshire (UNH). HAI flew two polygons to determine easternhemlock (Tsuga canadensis) locations and hemlock health, based on GPS ground truthing byUNH. Results are still pending, but preliminary results are encouraging, with both classifica-tion and health distributions being qualitatively appropriate.
Despite the lack of conclusive results from these two missions, both have shown thathyperspectral imaging will be valuable for detection and delineation, especially with the bandsand flexibility of this sensor flown by Helicopter Applicators Inc.
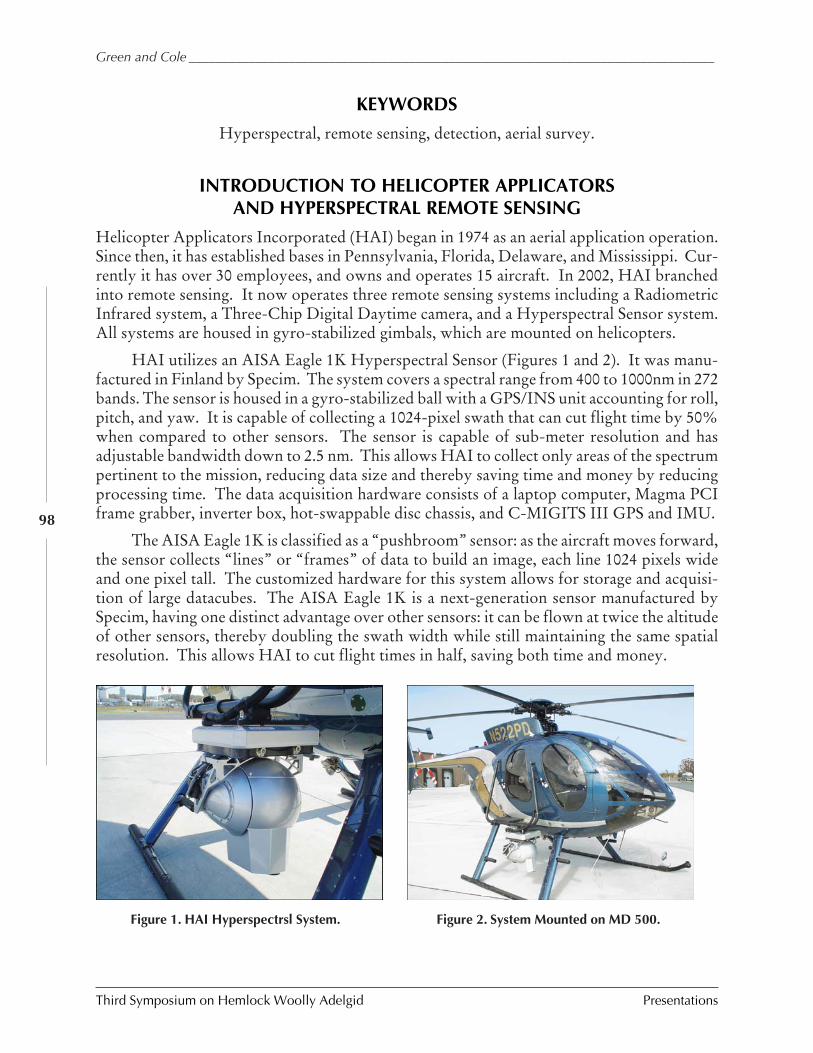
Third Symposium on Hemlock Woolly Adelgid Presentations
Green and Cole _______________________________________________________________________________
98
KEYWORDS
Hyperspectral, remote sensing, detection, aerial survey.
INTRODUCTION TO HELICOPTER APPLICATORSAND HYPERSPECTRAL REMOTE SENSING
Helicopter Applicators Incorporated (HAI) began in 1974 as an aerial application operation.Since then, it has established bases in Pennsylvania, Florida, Delaware, and Mississippi. Cur-rently it has over 30 employees, and owns and operates 15 aircraft. In 2002, HAI branchedinto remote sensing. It now operates three remote sensing systems including a RadiometricInfrared system, a Three-Chip Digital Daytime camera, and a Hyperspectral Sensor system.All systems are housed in gyro-stabilized gimbals, which are mounted on helicopters.
HAI utilizes an AISA Eagle 1K Hyperspectral Sensor (Figures 1 and 2). It was manu-factured in Finland by Specim. The system covers a spectral range from 400 to 1000nm in 272bands. The sensor is housed in a gyro-stabilized ball with a GPS/INS unit accounting for roll,pitch, and yaw. It is capable of collecting a 1024-pixel swath that can cut flight time by 50%when compared to other sensors. The sensor is capable of sub-meter resolution and hasadjustable bandwidth down to 2.5 nm. This allows HAI to collect only areas of the spectrumpertinent to the mission, reducing data size and thereby saving time and money by reducingprocessing time. The data acquisition hardware consists of a laptop computer, Magma PCIframe grabber, inverter box, hot-swappable disc chassis, and C-MIGITS III GPS and IMU.
The AISA Eagle 1K is classified as a “pushbroom” sensor: as the aircraft moves forward,the sensor collects “lines” or “frames” of data to build an image, each line 1024 pixels wideand one pixel tall. The customized hardware for this system allows for storage and acquisi-tion of large datacubes. The AISA Eagle 1K is a next-generation sensor manufactured bySpecim, having one distinct advantage over other sensors: it can be flown at twice the altitudeof other sensors, thereby doubling the swath width while still maintaining the same spatialresolution. This allows HAI to cut flight times in half, saving both time and money.
Figure 1. HAI Hyperspectrsl System. Figure 2. System Mounted on MD 500.
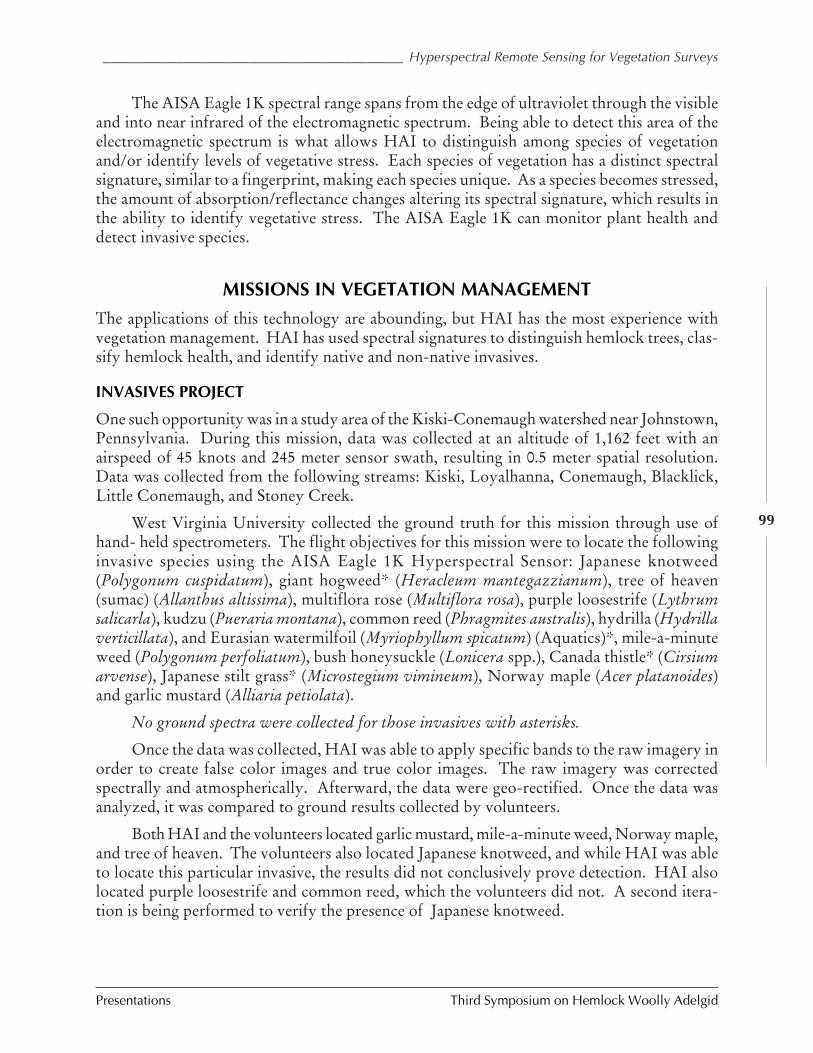
_________________________________________ Hyperspectral Remote Sensing for Vegetation Surveys
Presentations Third Symposium on Hemlock Woolly Adelgid
99
The AISA Eagle 1K spectral range spans from the edge of ultraviolet through the visibleand into near infrared of the electromagnetic spectrum. Being able to detect this area of theelectromagnetic spectrum is what allows HAI to distinguish among species of vegetationand/or identify levels of vegetative stress. Each species of vegetation has a distinct spectralsignature, similar to a fingerprint, making each species unique. As a species becomes stressed,the amount of absorption/reflectance changes altering its spectral signature, which results inthe ability to identify vegetative stress. The AISA Eagle 1K can monitor plant health anddetect invasive species.
MISSIONS IN VEGETATION MANAGEMENT
The applications of this technology are abounding, but HAI has the most experience withvegetation management. HAI has used spectral signatures to distinguish hemlock trees, clas-sify hemlock health, and identify native and non-native invasives.
INVASIVES PROJECT
One such opportunity was in a study area of the Kiski-Conemaugh watershed near Johnstown,Pennsylvania. During this mission, data was collected at an altitude of 1,162 feet with anairspeed of 45 knots and 245 meter sensor swath, resulting in 0.5 meter spatial resolution.Data was collected from the following streams: Kiski, Loyalhanna, Conemaugh, Blacklick,Little Conemaugh, and Stoney Creek.
West Virginia University collected the ground truth for this mission through use ofhand- held spectrometers. The flight objectives for this mission were to locate the followinginvasive species using the AISA Eagle 1K Hyperspectral Sensor: Japanese knotweed(Polygonum cuspidatum), giant hogweed* (Heracleum mantegazzianum), tree of heaven(sumac) (Allanthus altissima), multiflora rose (Multiflora rosa), purple loosestrife (Lythrumsalicarla), kudzu (Pueraria montana), common reed (Phragmites australis), hydrilla (Hydrillaverticillata), and Eurasian watermilfoil (Myriophyllum spicatum) (Aquatics)*, mile-a-minuteweed (Polygonum perfoliatum), bush honeysuckle (Lonicera spp.), Canada thistle* (Cirsiumarvense), Japanese stilt grass* (Microstegium vimineum), Norway maple (Acer platanoides)and garlic mustard (Alliaria petiolata).
No ground spectra were collected for those invasives with asterisks.
Once the data was collected, HAI was able to apply specific bands to the raw imagery inorder to create false color images and true color images. The raw imagery was correctedspectrally and atmospherically. Afterward, the data were geo-rectified. Once the data wasanalyzed, it was compared to ground results collected by volunteers.
Both HAI and the volunteers located garlic mustard, mile-a-minute weed, Norway maple,and tree of heaven. The volunteers also located Japanese knotweed, and while HAI was ableto locate this particular invasive, the results did not conclusively prove detection. HAI alsolocated purple loosestrife and common reed, which the volunteers did not. A second itera-tion is being performed to verify the presence of Japanese knotweed.
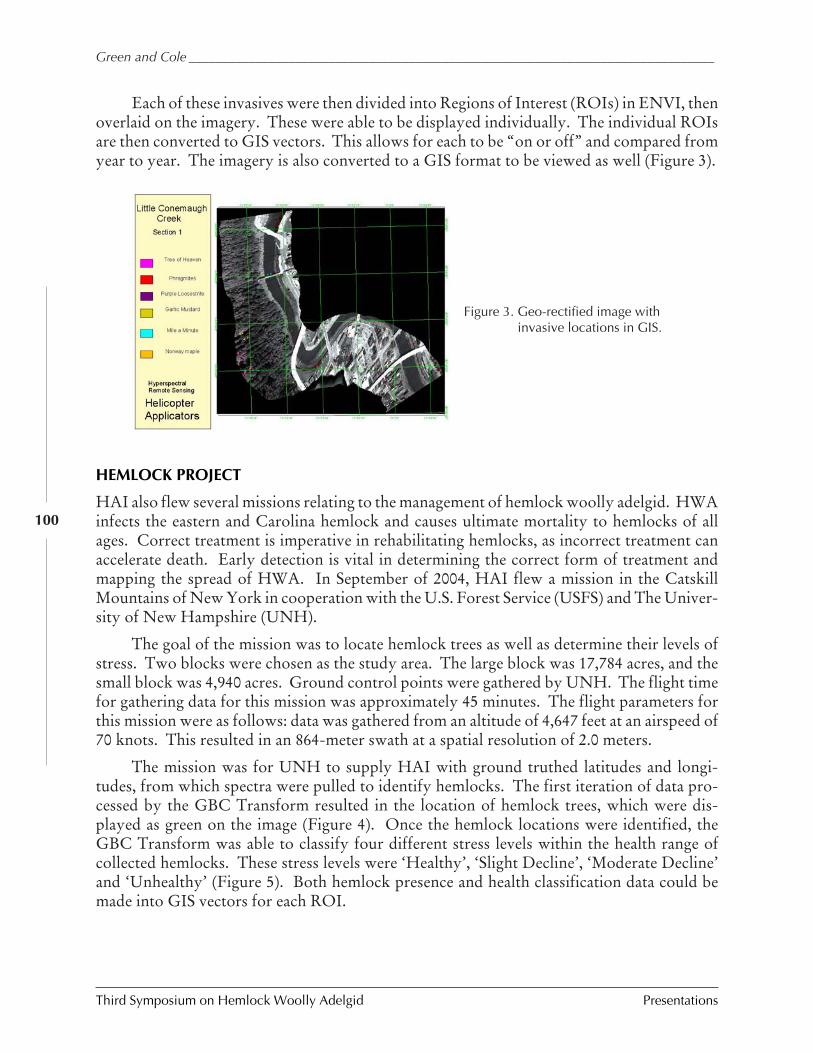
Third Symposium on Hemlock Woolly Adelgid Presentations
Green and Cole _______________________________________________________________________________
100
Each of these invasives were then divided into Regions of Interest (ROIs) in ENVI, thenoverlaid on the imagery. These were able to be displayed individually. The individual ROIsare then converted to GIS vectors. This allows for each to be “on or off” and compared fromyear to year. The imagery is also converted to a GIS format to be viewed as well (Figure 3).
Figure 3. Geo-rectified image withinvasive locations in GIS.
HEMLOCK PROJECT
HAI also flew several missions relating to the management of hemlock woolly adelgid. HWAinfects the eastern and Carolina hemlock and causes ultimate mortality to hemlocks of allages. Correct treatment is imperative in rehabilitating hemlocks, as incorrect treatment canaccelerate death. Early detection is vital in determining the correct form of treatment andmapping the spread of HWA. In September of 2004, HAI flew a mission in the CatskillMountains of New York in cooperation with the U.S. Forest Service (USFS) and The Univer-sity of New Hampshire (UNH).
The goal of the mission was to locate hemlock trees as well as determine their levels ofstress. Two blocks were chosen as the study area. The large block was 17,784 acres, and thesmall block was 4,940 acres. Ground control points were gathered by UNH. The flight timefor gathering data for this mission was approximately 45 minutes. The flight parameters forthis mission were as follows: data was gathered from an altitude of 4,647 feet at an airspeed of70 knots. This resulted in an 864-meter swath at a spatial resolution of 2.0 meters.
The mission was for UNH to supply HAI with ground truthed latitudes and longi-tudes, from which spectra were pulled to identify hemlocks. The first iteration of data pro-cessed by the GBC Transform resulted in the location of hemlock trees, which were dis-played as green on the image (Figure 4). Once the hemlock locations were identified, theGBC Transform was able to classify four different stress levels within the health range ofcollected hemlocks. These stress levels were ‘Healthy’, ‘Slight Decline’, ‘Moderate Decline’and ‘Unhealthy’ (Figure 5). Both hemlock presence and health classification data could bemade into GIS vectors for each ROI.
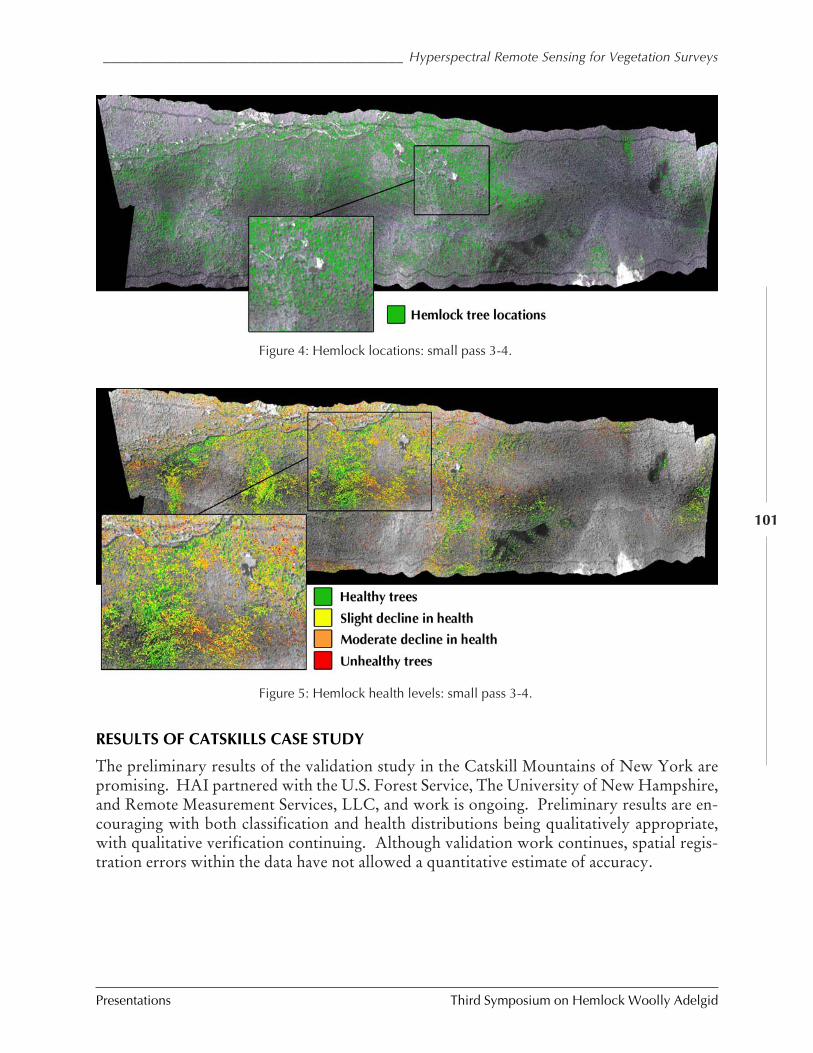
_________________________________________ Hyperspectral Remote Sensing for Vegetation Surveys
Presentations Third Symposium on Hemlock Woolly Adelgid
101
RESULTS OF CATSKILLS CASE STUDY
The preliminary results of the validation study in the Catskill Mountains of New York arepromising. HAI partnered with the U.S. Forest Service, The University of New Hampshire,and Remote Measurement Services, LLC, and work is ongoing. Preliminary results are en-couraging with both classification and health distributions being qualitatively appropriate,with qualitative verification continuing. Although validation work continues, spatial regis-tration errors within the data have not allowed a quantitative estimate of accuracy.
Figure 5: Hemlock health levels: small pass 3-4.
Figure 4: Hemlock locations: small pass 3-4.
Third Symposium on Hemlock Woolly Adelgid Presentations
Green and Cole _______________________________________________________________________________
102
METHODS AND PROCESSING SOFTWARE
HAI utilizes proprietary processing software designed by Dr. James Sokolowski of RemoteMeasurement Services (RMS),LLC, known as Hyperspectral Data Processing Software(HyDaPS). HyDaPS is designed for high–volume cubes, which is important for hyperspectralprocessing. This software calibrates radiance, atmospheric and spectral corrections, and pro-duces reflectance cubes. HAI also utilizes CaliGeo, geo-rectification software, designed bySpecim. CaliGeo performs radiometric correction, and geo-rectification. This software alsoadjusts for elevation through the use of Digital Elevation Models (DEM) or WGS84 PlanarSurface elevation. The GBC transform, also a proprietary software designed by Dr.Sokolowski, is used for analysis. This software was specifically designed for the analysis ofvegetation. It is capable of differentiating species from species, classifying within a species,and delineating spectral signatures.
In order to perform hyperspectral flights and determine pricing, HAI is given GIS vec-tors to create a flight plan for the pilot. These vectors are imported into the aircraft’s AgNavcomputer system and display the appropriate flight lines. Once these flight lines are estab-lished, a data collection flight is performed. After the data is collected, it is transferred tocomputers in HAI’s processing lab where HyDaPS correction is performed on the data. Nextthe imagery is geo-rectified with CaliGeo. Imagery spectra are then analyzed by the GBCtransform to produce requested results. Finally, new GIS vectors from ENVI ROI’s arecreated, allowing HAI to offer the possibility of a complete end-product.
Prior to each data collection flight, flight parameters are inserted into a “Flight Calcula-tions” spread sheet. This performs the necessary calculations in order to determine resolu-tion, altitude, speed, swath, frame rate, approximate flight time, and amount of data to becollected.
PREVIOUS EXPERIENCE
In a relatively short time, HAI gained substantial experience in the field of HyperspectralRemote Imaging. HAI has conducted the following data-collection missions:
• October 2003: Perry County, Pennsylvania, Hemlock Study• November 2003: Perry County, Pennsylvania, Hemlock Study• November 2003: Appoquinimick Creek, Deleware, Phragmites Study• March 2004: Perry County, Pennsylvania, Hemlock Study• May 2004: Department of Defense, Chicken Little Sensor Week, Classified• June 2004: Kennedy Space Center, Florida (Indian River Lagoon), Submerged Vegeta-
tion• June 2004: City of Houston and EPA, Water Pollution Survey• June 2004: Department of Homeland Security, Texas, Target Identification• August 2004: Kiski-Conemaugh Watershed, Pennsylvania, Invasive Species Study• September 2004: Catskills, New York, Hemlock Study
_________________________________________ Hyperspectral Remote Sensing for Vegetation Surveys
Presentations Third Symposium on Hemlock Woolly Adelgid
103
CONCLUSIONS AND FUTURE DEVELOPMENTS
In conclusion, Helicopter Applicators, Incorporated, is proud to be able to offer hyperspectralremote sensing. Based on our experience, we can provide a complete end-product that in-cludes sub-meter image resolution, classification of vegetation health, differentiation of veg-etation species and analysis of data. These full end products of hyperspectral remote sensingcan help forest health administrations to identify potential health threats to the forest andtake appropriate action. Through the identification of invasives, eradication efforts can beplanned. With regards to health levels, proper treatment and priority sites may be estab-lished.
HAI is currently completing enhancements to its remose sensing capabilities, includingupgrading computer systems for faster processing and upgrading the gimbal system to allowfor more accurate data collection. New methods are also being implemented for the collec-tion of ground spectra, as accurate ground truthing is imperative: one such method is for HAIto receive ground coordinates of the species from which spectral cubes can be gathered aeri-ally. This will be more accurate then trying to pull spectra from coordinates in processeddata. To further accuracy, HAI is working in cooperation with Research Systems Incorpo-rated (RSI) in order to develop new geo-processing software that will allow for geo-rectifica-tion and geo-referencing of high volume cubes. The software will also allow the output ofGIS shapefiles, which will allow for identification of individual species and comparison fromyear to year. Helicopter Applicators strives to keep pace with ever-changing technologicaladvancements in order to meet the needs of the customer.
ACKNOWLEDGEMENTS
HAI would like to extend our appreciation to Brad Onken for the opportunity to performhyperspectral work throughout 2004 and for the opportunity to make this presentation at the3rd Save Our Hemlocks Symposium. HAI also appreciates the support from Mike Blumenthal,Don Eggen, and Denise Royle, and would like to thank Jennifer Pontius, Rich Hallett, andMary Martin of New Hampshire for their cooperation and extra efforts with the CatskillsStudy Area. Special acknowledgement goes to Dr. James Sokolowski at Remote Measure-ment Services for his continued efforts and analyses. Ground truthing was possible throughthe efforts of the University of New Hampshire, the University of West Virginia, and MichaelStrager.
REFERENCES
McClure, M.S. 1998. Hemlock Woolly Adelgid, Adelges tsugae. The Connecticut Agricul-tural Experiment Station.
Royle, D. 2002. Discriminating Tsugae canadensis hemlock forest defoliation using re-motely Sensed change detection. Journal of Nematology 34(3):213-221.
Sokolowski, J. 2003-2005. Personal correspondence and interviews.

Third Symposium on Hemlock Woolly Adelgid Presentations
Koch et al. ___________________________________________________________________________________
104
MAPPING HEMLOCKS VIA TREE-BASED CLASSIFICATION OF SATELLITE IMAGERY
AND ENVIRONMENTAL DATA
Frank H. Koch1, Heather M. Cheshire2, and Hugh A. Devine3
1Department of Forestry and Environmental Resources, North Carolina State University,USDA FS Forest Health Monitoring Program, Forestry Sciences Laboratory,
3041 Cornwallis Road, Research Triangle Park, NC 27709
(919) 549-4010; [email protected]
2Department of Forestry and Environmental Resources,North Carolina State University
3Department of Parks, Recreation, and Tourism Management,North Carolina State University
ABSTRACT
Within the last few years, the hemlock woolly adelgid (HWA) has made significant inroadsinto the southern Appalachians. Since the region’s native hemlock species are not resistant,timely application of control measures is critical to minimizing hemlock mortality. Unfortu-nately, hemlock stands in the region are incompletely mapped, and general characteristics oftheir distribution present serious mapping challenges. One approach for improving classifi-cation is to integrate medium-resolution satellite imagery (Landsat, ASTER) and ancillaryenvironmental data. We tested such an approach using images from eastern and western studyareas in Great Smoky Mountains National Park. First, we created maps for masking out non-evergreen pixels via unsupervised classification (i.e., cluster busting) of winter images. Wethen applied the masks to corresponding summer images so we could separate hemlock andnon-hemlock evergreens under optimal image conditions. We extracted a large (>14,000)random sample of points from the masked images, stratifying the sample according to anaerial photoraphy-derived vegetation map of the park. At each sample point, we recorded thevegetation label as well as image data and values for a suite of topographic, environmental,and proximity variables recorded in a geographic information system (GIS). We applied aseries of tree-based classifications to this training data set to create a set of decision rules thatmost accurately retains the input class of sample points. Our most successful tree had 79 total“leaves” (i.e., distinct decision-rule pathways). We applied these decision rules to the imagesto develop hemlock maps of the study area. Thematic accuracy assessment of these maps,based on field survey and photo-derived points, indicated 85% overall accuracy in the easternstudy area and 69% success at capturing hemlocks in a partial assessment of the western studyarea. Additional accuracy assessment may offer an opportunity to refine the rules. However,our decision rules can currently be applied elsewhere in the southern Appalachian region formanagement planning purposes.
__________ Mapping Hemlocks via Tree-based Classification of Satellite Imagery and Environmental Data
Presentations Third Symposium on Hemlock Woolly Adelgid
105
KEYWORDS
HWA, Landsat, ASTER, tree-based classification, southern Appalachians.
INTRODUCTION
Hemlock woolly adelgid (HWA), Adelges tsugae Annand, is a non-native pest threateningthe southern Appalachians. In the past few years, it has made significant inroads into theregion, particularly in the Great Smoky Mountains and along the Blue Ridge Parkway. HWAaffects both hemlock species native to the region, eastern hemlock (Tsuga canadensis [L.]Carr.) and Carolina hemlock (T. caroliniana Engelm.). Neither is resistant, though biologicalcontrol via introduced predator insects holds promise as a method for combating HWA innatural stands. Unfortunately, any counter-measure faces a couple of significant challenges.First, to understand HWA’s likely distribution as it spreads throughout the southern Appa-lachians, the distribution of its host species must be characterized. Second, there must besome way to predict where HWA is most likely to appear next, allowing managers to priori-tize their HWA management strategies. Here, we present an approach to the first challengeof mapping hemlocks in the region.
In the northeastern U.S., satellite images have been used successfully for several HWA-related mapping efforts (e.g., Bonneau et al. 1999a and 1999b, Royle and Lathrop 1997 and2002). These studies have employed time series of Landsat TM data to characterize change inhemlock health through time with considerable accuracy. However, HWA is a relatively re-cent arrival in the southern Appalachians, so adelgid-induced damage is likely indistinguish-able in multispectral satellite imagery. More basically, simply mapping hemlocks from satel-lite imagery is difficult. Hemlocks are generally found in isolated stands, often in moist val-leys, coves, steep ravines, or on north-facing bluffs (Delcourt and Delcourt 2000) and aredistributed throughout heterogeneous forests that include other evergreen species from whichhemlocks are difficult to separate (Royle and Lathrop 1997).
Nevertheless, given a large region to survey, satellite imagery is still the most feasibletool for hemlock mapping. Incorporation of ancillary data in tree-based classification offersan alternative to the limited distinguishing power of traditional, spectral-based classification.A growing body of literature has highlighted several different approaches for tree-based meth-ods (Murthy 1998). All start with a sample of data representing each level in the class ofinterest (e.g., the vegetation classes in a vegetation map) and containing values for a number ofcontinuous or categorical variables. This input training sample is subjected to statistical par-titioning techniques that identify key variables and split values to most accurately capture theclasses of the input training sample points. The resulting product is a tree of decision rulesthat can then be implemented in GIS or image processing software as an “expert classifier”.Tree-based classification approaches have a number of advantageous features. They are typi-cally non-parametric, so conditions of normality are not critical. Furthermore, theyalgorithmically select variables to be included in the final tree and ignore any extraneousvariables. While the commonly used classification and regression tree (CART) method islimited to binary (i.e., two-way) splits, other methods, such as chi-squared automated inter-action detection (CHAID), allow for a greater number of splits (Murthy 1998). To develop
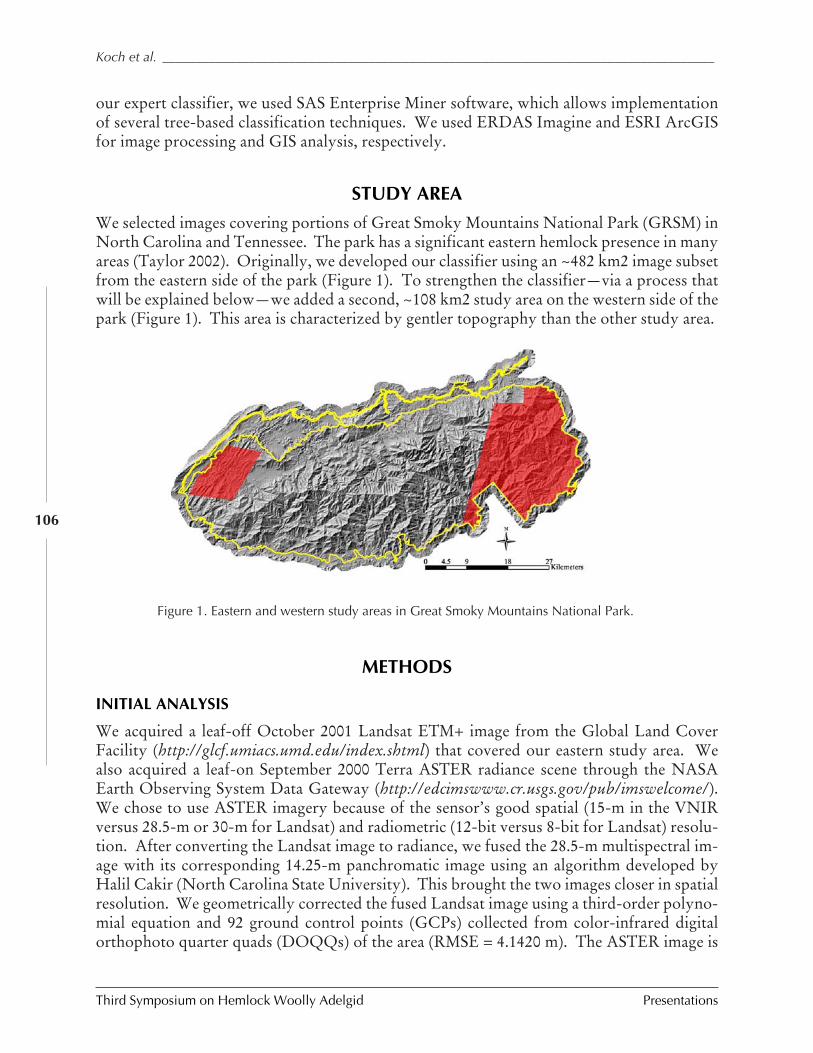
Third Symposium on Hemlock Woolly Adelgid Presentations
Koch et al. ___________________________________________________________________________________
106
our expert classifier, we used SAS Enterprise Miner software, which allows implementationof several tree-based classification techniques. We used ERDAS Imagine and ESRI ArcGISfor image processing and GIS analysis, respectively.
STUDY AREA
We selected images covering portions of Great Smoky Mountains National Park (GRSM) inNorth Carolina and Tennessee. The park has a significant eastern hemlock presence in manyareas (Taylor 2002). Originally, we developed our classifier using an ~482 km2 image subsetfrom the eastern side of the park (Figure 1). To strengthen the classifier—via a process thatwill be explained below—we added a second, ~108 km2 study area on the western side of thepark (Figure 1). This area is characterized by gentler topography than the other study area.
Figure 1. Eastern and western study areas in Great Smoky Mountains National Park.
METHODS
INITIAL ANALYSIS
We acquired a leaf-off October 2001 Landsat ETM+ image from the Global Land CoverFacility (http://glcf.umiacs.umd.edu/index.shtml) that covered our eastern study area. Wealso acquired a leaf-on September 2000 Terra ASTER radiance scene through the NASAEarth Observing System Data Gateway (http://edcimswww.cr.usgs.gov/pub/imswelcome/).We chose to use ASTER imagery because of the sensor’s good spatial (15-m in the VNIRversus 28.5-m or 30-m for Landsat) and radiometric (12-bit versus 8-bit for Landsat) resolu-tion. After converting the Landsat image to radiance, we fused the 28.5-m multispectral im-age with its corresponding 14.25-m panchromatic image using an algorithm developed byHalil Cakir (North Carolina State University). This brought the two images closer in spatialresolution. We geometrically corrected the fused Landsat image using a third-order polyno-mial equation and 92 ground control points (GCPs) collected from color-infrared digitalorthophoto quarter quads (DOQQs) of the area (RMSE = 4.1420 m). The ASTER image is
__________ Mapping Hemlocks via Tree-based Classification of Satellite Imagery and Environmental Data
Presentations Third Symposium on Hemlock Woolly Adelgid
107
actually a combination of two separate image files, a 15-m resolution, three-band image in thevisible and near infrared (VNIR), and a 30-m resolution, six-band image in the short-waveinfrared (SWIR), merged into a single 15-m image. Though automatically subjected to pre-liminary geometric correction upon import to ERDAS Imagine, we further corrected themerged ASTER image using a fourth-order polynomial and 80 GCPs (RMSE = 6.4694 m).This better aligned the ASTER image with the Landsat image. We clipped each image to fitour eastern study area.
A major obstacle when using remotely sensed data of mountainous regions is the highlyvariable level of ground illumination and radiance due to topographic relief, which can resultin loss and alteration of image information (Jensen 1996). A number of topographic normal-ization equations have been proposed that correct pixel values using models of the Earth’ssurface to account for terrain-induced variation. Based on the recommendations in severalstudies, we topographically normalized both images using the C-correction method (Teilletet al. 1982). We calculated coefficients for the C-correction equation by regressing imageradiance values on illumination values, which were based on a digital elevation model (DEM)as well as the solar azimuth and elevation at the time of image capture.
The leaf-off Landsat image served as a means to mask out all non-evergreen pixels in thestudy area. We separated the image into evergreen and non-evergreen vegetation classes viacluster busting (Jensen 1996). The cluster busting process required several iterations of unsu-pervised classification, where each new iteration focused only on pixels that could not beclearly distinguished at the previous iteration. The results of all iterations were merged into asingle evergreen/non-evergreen map. When assessed based on DOQQs, this map had an overallaccuracy greater than 85%. After resampling this map from 14.25-m to 15-m resolution, weused it to remove all non-evergreen pixels from the ASTER image.
Summer (or leaf-on) images offer good spectral conditions for species separation, andhave less topographic shadowing than winter images (Jensen 1996). We used the masked AS-TER image to separate hemlock and non-hemlock evergreen classes. To do this, we created atraining data set suitable for application in tree-based classification. Our guiding source forthe set was a GIS-based vegetation map for GRSM developed primarily from large-scale(1:12,000) aerial photographs (Welch et al. 2002). This map represented the best availablesource of information on hemlock distribution. It provided four classes of hemlock presence,recorded as unique polygons: dominant, co-dominant, secondary component, and inclusion.In a GIS, we generated a large random sample of points for each of these classes, as well as arandom sample of points from areas outside the hemlock polygons but still in the maskedASTER image (i.e., a non-hemlock evergreen class). Notably, large samples are required fortree-based classifiers to perform well (Murthy 1998). Making sure no image pixel was sampledby more than one point, we scaled the sample sizes to match the proportion of the image eachclass occupied: ~1,000 points for the co-dominant class, ~1,500 points for the dominant, sec-ondary component, and inclusion classes, and ~3,000 points for the non-hemlock evergreenclass. For each sample point, we extracted a number of variables derived from individualraster data layers in the GRSM GIS database (Table 1). We also recorded pixel data from theASTER image. To minimize potential image-specific bias in the pixel values, we used nor-malized band ratios rather than per-band pixel values.
Third Symposium on Hemlock Woolly Adelgid Presentations
Koch et al. ___________________________________________________________________________________
108
We used SAS Enterprise Miner to analyze the input training sample. Accepting that atree fit to five different classes would be unwieldy, we simplified the training sample by com-bining the dominant with the co-dominant and the secondary component with the inclusionclass. (We used additional trees to subdivide these classes in later iterations, but have notreported on them here.) Exploiting the flexibility of the software, we tested trees with 2-, 3-,4-, and 5-way splits, then chose the one with the lowest misclassification rate. Tree-basedclassifiers are susceptible to over-fitting of the training data and thus can be less successful atclassifying subsequent data sets (Murthy 1998). To avoid over-fitting, we employed auto-matic pruning of the trees based on Chi-squared testing at a significance level of α = 0.20. Wealso set a minimum of 10 data points for any output node. Although all four trees tested hadvery similar misclassification rates, the 3-split tree performed the best, with an initial sampleaccuracy of 61% and 75 “leaves” (i.e., distinct decision rule pathways). This initial sampleaccuracy is only a partial reflection of the tree accuracy once applied in the expert classifier,but may be seen as a minimum accuracy threshold under the strictest assessment conditions(i.e., not accounting for mitigating factors such as image resolution and the positional accu-racy of field data). Table 1 shows which of the eligible input variables were included in thetree.
The “leaves” from the 3-split tree were imported into the Expert Classifier module ofERDAS Imagine. This module allowed us to construct a set of rules for assigning everyevergreen pixel in the study area to an output class based on raster layers for each inputvariable. We created a final output map by merging the expert classifier result with the non-evergreen pixels identified in the cluster-busted Landsat image.
ENHANCED ANALYSIS
As previously noted, tree-based classifications are susceptible to over-fitting of the trainingdata. While we employed automatic pruning, a single training data set may not represent thefull variation of conditions for a phenomenon of interest. To enhance the success of ourclassifier, we developed supplementary training data points using a study area in the westernportion of GRSM. This area is quite different from the eastern study area topographically,but is typical of certain portions of the southern Appalachians.
Our processing methods for the western study area were similar to those for the east.We procured two ASTER radiance images, captured in June 2000 (leaf-on) and November2003 (leaf-off). The images were geometrically corrected with polynomial equations (39 GCPsand RMSE = 6.1546 for June 2000; 24 GCPs and RMSE = 4.6436 for November 2003), clippedto the study area extent, and topographically normalized via C-correction. We generated anevergreen/non-evergreen mask from the November 2003 image via several iterations of clus-ter busting, and then applied this mask to the June 2000 image. From the remaining evergreenportion of the image, we generated random sample points in proportion to the area eachhemlock class occupied in the western study area: ~800 points from dominant, ~1,500 pointsfrom co-dominant, ~50 points from secondary component, and ~500 from inclusion, as wellas 2,800 points from non-hemlock evergreen areas. For each sample point, we extracted val-ues for the input variables from raster layers in the GRSM GIS database. We then combinedthese sample points with our eastern area training data set, yielding a substantially larger setof more than 14,000 sample points across five classes.
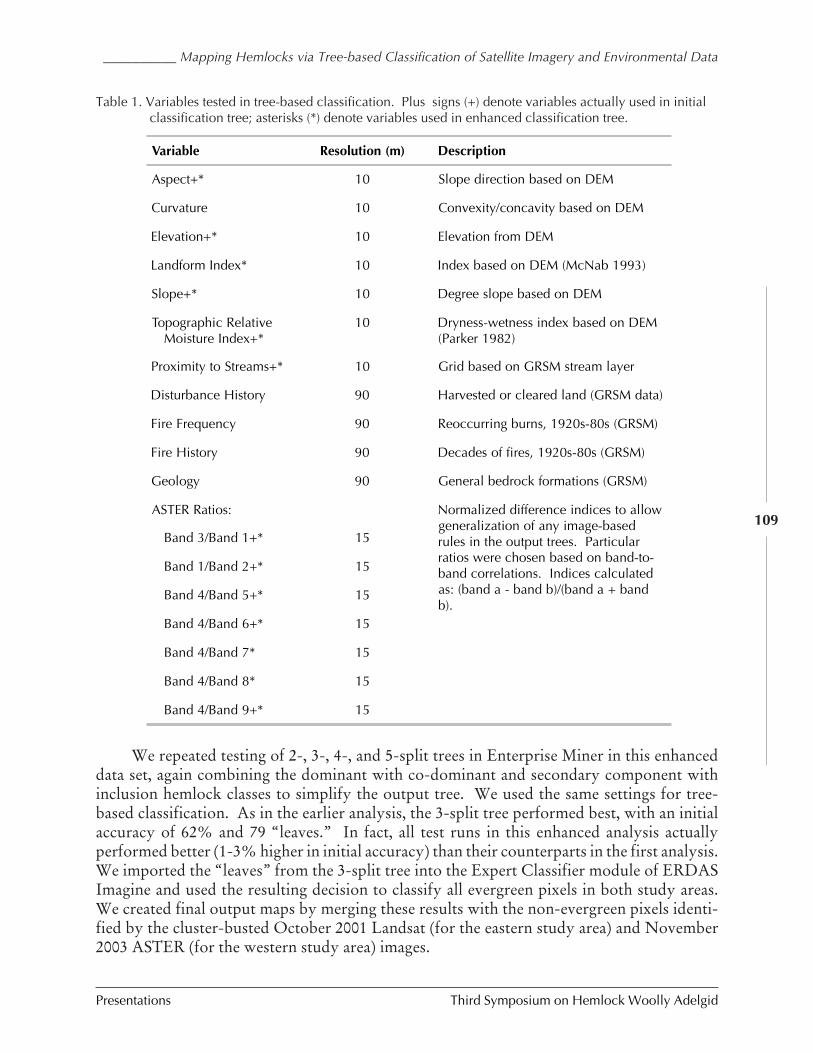
__________ Mapping Hemlocks via Tree-based Classification of Satellite Imagery and Environmental Data
Presentations Third Symposium on Hemlock Woolly Adelgid
109
Variable Resolution (m) Description
Aspect+* 10 Slope direction based on DEM
Curvature 10 Convexity/concavity based on DEM
Elevation+* 10 Elevation from DEM
Landform Index* 10 Index based on DEM (McNab 1993)
Slope+* 10 Degree slope based on DEM
Topographic Relative Moisture Index+*
10 Dryness-wetness index based on DEM(Parker 1982)
Proximity to Streams+* 10 Grid based on GRSM stream layer
Disturbance History 90 Harvested or cleared land (GRSM data)
Fire Frequency 90 Reoccurring burns, 1920s-80s (GRSM)
Fire History 90 Decades of fires, 1920s-80s (GRSM)
Geology 90 General bedrock formations (GRSM)
ASTER Ratios: Normalized difference indices to allowgeneralization of any image-basedrules in the output trees. Particularratios were chosen based on band-to-band correlations. Indices calculatedas: (band a - band b)/(band a + bandb).
Band 3/Band 1+* 15
Band 1/Band 2+* 15
Band 4/Band 5+* 15
Band 4/Band 6+* 15
Band 4/Band 7* 15
Band 4/Band 8* 15
Band 4/Band 9+* 15
Table 1. Variables tested in tree-based classification. Plus signs (+) denote variables actually used in initialclassification tree; asterisks (*) denote variables used in enhanced classification tree.
We repeated testing of 2-, 3-, 4-, and 5-split trees in Enterprise Miner in this enhanceddata set, again combining the dominant with co-dominant and secondary component withinclusion hemlock classes to simplify the output tree. We used the same settings for tree-based classification. As in the earlier analysis, the 3-split tree performed best, with an initialaccuracy of 62% and 79 “leaves.” In fact, all test runs in this enhanced analysis actuallyperformed better (1-3% higher in initial accuracy) than their counterparts in the first analysis.We imported the “leaves” from the 3-split tree into the Expert Classifier module of ERDASImagine and used the resulting decision to classify all evergreen pixels in both study areas.We created final output maps by merging these results with the non-evergreen pixels identi-fied by the cluster-busted October 2001 Landsat (for the eastern study area) and November2003 ASTER (for the western study area) images.
Third Symposium on Hemlock Woolly Adelgid Presentations
Koch et al. ___________________________________________________________________________________
110
ACCURACY ASSESSMENT
We completed an accuracy assessment of the eastern study area maps—for the original andenhanced classifiers—using 170 reference points gathered from field surveys or by viewingthe CIR DOQQs where appropriate. Based on these data, we were only able to judge hem-lock presence/absence, so we simplified our assessment to three classes (hemlock, non-hem-lock evergreen, and non-evergreen). We examined map pixel values within a 22.5-meter ra-dius of each reference point (approximately equivalent to a 3 x 3 pixel window). If the mapclass of the reference point corresponded to any pixel falling within the window, then theclassification was judged to be correct. We chose this approach to accommodate positionalaccuracy limitations of the image geometric correction process (± 7.5 m RMSE) and the refer-ence data points, which were largely recorded with recreational grade GPS units (± 15 m).For each map, we created error matrices and calculated an overall value for Cohen’s kappastatistic. Cohen’s Kappa statistic indicates how much of an improvement a classificationeffort is over a completely random classification of the same area (Jensen 1996). It can rangefrom 0 to 1, with 0 being the least possible improvement and 1 being the most. We did nothave enough field data to perform a full accuracy assessment of the western study area. How-ever, we did have a small set (n = 32) of hemlock survey points that provided some indicationof how the enhanced classifier might perform in this sort of region. We used the same 22.5-mradius window for judging accuracy.
RESULTS
The original and enhanced error matrices (Tables 2 and 3) for the eastern study area are simi-lar, with identical overall accuracies (85.3%; 90% confidence interval of 80.5 to 90.1%). Kappavalues for the two matrices were nearly identical: 0.765 for the original and 0.767 for theenhanced classifier. More specifically, the two classifiers performed similarly in mappinghemlocks: the enhanced classifier yielded a higher producer’s accuracy but a lower user’saccuracy for the hemlock class. The partial accuracy assessment for the western study areaindicated that 22 out of 32 hemlock survey points were correctly identified, for an accuracy of69%. Of the ten misclassified points in the western area, one was mistakenly labeled as non-evergreen; the remaining nine were classified as non-hemlock evergreen.
The hemlock presence maps (Figures 2 and 3) reflected very different levels of hemlockpresence. In the western study area, hemlocks appear to be limited to narrow riparian corri-dors, while they are more broadly distributed in the eastern study area.
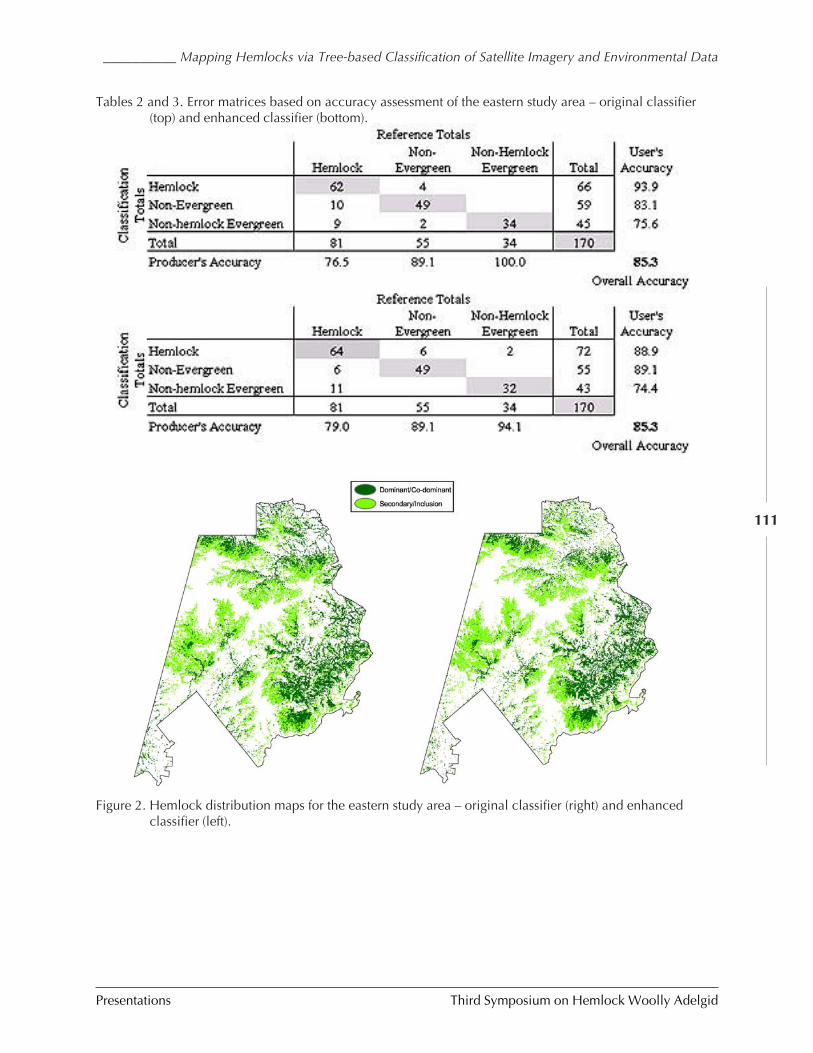
__________ Mapping Hemlocks via Tree-based Classification of Satellite Imagery and Environmental Data
Presentations Third Symposium on Hemlock Woolly Adelgid
111
Tables 2 and 3. Error matrices based on accuracy assessment of the eastern study area – original classifier(top) and enhanced classifier (bottom).
Figure 2. Hemlock distribution maps for the eastern study area – original classifier (right) and enhancedclassifier (left).
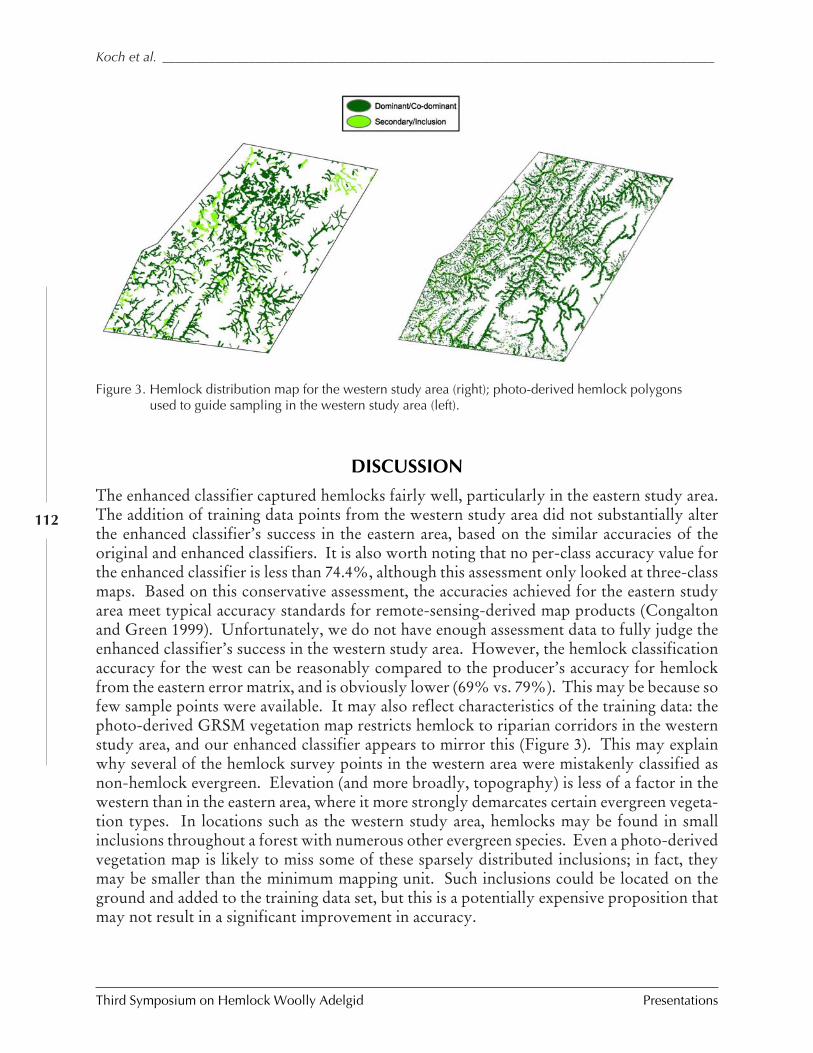
Third Symposium on Hemlock Woolly Adelgid Presentations
Koch et al. ___________________________________________________________________________________
112
Figure 3. Hemlock distribution map for the western study area (right); photo-derived hemlock polygonsused to guide sampling in the western study area (left).
DISCUSSION
The enhanced classifier captured hemlocks fairly well, particularly in the eastern study area.The addition of training data points from the western study area did not substantially alterthe enhanced classifier’s success in the eastern area, based on the similar accuracies of theoriginal and enhanced classifiers. It is also worth noting that no per-class accuracy value forthe enhanced classifier is less than 74.4%, although this assessment only looked at three-classmaps. Based on this conservative assessment, the accuracies achieved for the eastern studyarea meet typical accuracy standards for remote-sensing-derived map products (Congaltonand Green 1999). Unfortunately, we do not have enough assessment data to fully judge theenhanced classifier’s success in the western study area. However, the hemlock classificationaccuracy for the west can be reasonably compared to the producer’s accuracy for hemlockfrom the eastern error matrix, and is obviously lower (69% vs. 79%). This may be because sofew sample points were available. It may also reflect characteristics of the training data: thephoto-derived GRSM vegetation map restricts hemlock to riparian corridors in the westernstudy area, and our enhanced classifier appears to mirror this (Figure 3). This may explainwhy several of the hemlock survey points in the western area were mistakenly classified asnon-hemlock evergreen. Elevation (and more broadly, topography) is less of a factor in thewestern than in the eastern area, where it more strongly demarcates certain evergreen vegeta-tion types. In locations such as the western study area, hemlocks may be found in smallinclusions throughout a forest with numerous other evergreen species. Even a photo-derivedvegetation map is likely to miss some of these sparsely distributed inclusions; in fact, theymay be smaller than the minimum mapping unit. Such inclusions could be located on theground and added to the training data set, but this is a potentially expensive proposition thatmay not result in a significant improvement in accuracy.
__________ Mapping Hemlocks via Tree-based Classification of Satellite Imagery and Environmental Data
Presentations Third Symposium on Hemlock Woolly Adelgid
113
We intend to collect additional points in both the eastern and western study areas toexpand our accuracy assessment. Ultimately, though, the enhanced classifier will be bestserved by testing it with data from other parts of the southern Appalachian region. Despiteour best efforts, the enhanced classifier may still be over-fitted to the GRSM training data.This can be easily remedied. Though our classifier has too many rules to depict here, its firstsplit logically stratifies the input data into three classes based on elevation. Subsequent splitsdivide these three elevation-based classes into ever-smaller groups. Notably, any of thesefiner splits can be manually pruned from the classifier if they are found to be problematicthrough testing in other parts of the southern Appalachians.
During the testing process and afterwards, the classifier we have described can be usedto map hemlock distribution throughout the region. The classifier’s rules use topographicand proximity variables that can be calculated from readily available DEMs and stream data.ASTER imagery can be procured for free or at a nominal cost through the Earth ObservingSystem Data Gateway. While the ASTER sensor has only been in service since 1999, much ofthe southern Appalachian region has already been covered, and it is possible to request satel-lite tasking that would capture any areas that have not been covered.
The approach outlined here is only one component of an HWA “early warning system”that we have been developing for the southern Appalachians. We have also been working onGIS-based models to predict what areas in the region are at most risk of early HWA infesta-tion. These models yield probability maps that can be used to rank areas at the highest risk ofHWA infestation. By overlaying these risk probability maps with classifier-derived maps ofhemlock distribution, forest managers can target specific areas for their HWA control efforts,substantially reducing the territory they must cover.
ACKNOWLEDGEMENTS
We would like to thank Kris Johnson, Scott Kichman, Keith Langdon, Mike Jenkins, TomRemaley, and the many others at GRSM who provided data and general information used inthis project. We would also like to thank Chris Ulrey at the Blue Ridge Parkway, as well asnumerous people at NCSU and the USDA-FS. This paper describes one component of aproject funded by an Evaluation Monitoring grant from the USDA-FS Forest Health Moni-toring Program.
REFERENCES
Bonneau, L.R., K.S. Shields, and D.L. Civco. 1999a. Using satellite images to classify andanalyze the health of hemlock forests infested by the hemlock woolly adelgid. BiologicalInvasions 1:255-267.
Bonneau, L.R., K.S. Shields, and D.L. Civco. 1999b. A technique to identify changes inhemlock forest health over space and time using satellite image data. Biological Invasions1: 269-279.
Third Symposium on Hemlock Woolly Adelgid Presentations
Koch et al. ___________________________________________________________________________________
114
Congalton, R.G. and K. Green. 1999. Assessing the Accuracy of Remotely Sensed Data:Principles and Practices. Boca Raton, Forida: Lewis Publishers. 137 p.
Delcourt, H.R. and P.A. Delcourt. 2000. Eastern deciduous forests, pp. 357-396. In NorthAmerican Terrestrial Vegetation, ed. M.G. Barbour and W.D. Billings. CambridgeUniversity Press.
Jensen, J.R. 1996. Introductory Digital Image Processing: A Remote Sensing Perspective.Upper Saddle River, New Jersey: Prentice Hall. 318 p.
McNab, W.H. 1993. A topographic index to quantify the effect of mesoscale landform onsite productivity. Canadian Journal of Forest Research 23:1100-1107.
Murthy, S.K. 1998. Automatic construction of decision trees from data: a multi-disciplinarysurvey. Data Mining and Knowledge Discovery 2:345-389.
Parker, A.J. 1982. The topographic relative moisture index: An approach to soil-moistureassessment in mountain terrain. Physical Geography 3:160-168.
Royle, D.D. and R.G. Lathrop. 1997. Monitoring hemlock forest health in New Jerseyusing Landsat TM data and change detection techniques. Forest Science 43(3):327-335.
Royle, D.D. and R.G. Lathrop. 2002. Discriminating Tsuga canadensis hemlock forestdefoliation using remotely sensed change detection. Journal of Nematology 34(3):213-221.
Taylor, G. 2002. Hemlock resources in Great Smoky Mountains National Park, pp. 34-35.In Symposium on the Hemlock Woolly Adelgid in Eastern North America, February 5-7, 2002, ed. B. Onken, R. Reardon, and J. Lashomb. East Brunswick, New Jersey.
Teillet, P.M., B. Guindon, and D.G. Goodenough. 1982. On the slope-aspect correction ofmultispectral scanner data. Canadian Journal of Remote Sensing 8:84-106.
Welch, R., M. Madden, and T. Jordan. 2002. Photogrammetric and GIS techniques for thedevelopment of vegetation databases of mountainous areas: Great Smoky MountainsNational Park. ISPRS Journal of Photogrammetry and Remote Sensing 57(1-2):53-68.
_____________________A GIS-based Risk Assessment for Hemlock Woolly Adelgid in Southern Vermont
Presentations Third Symposium on Hemlock Woolly Adelgid
115
A GIS-BASED RISK ASSESSMENT FOR HEMLOCK WOOLLY ADELGID
IN SOUTHERN VERMONT
B.E. Machin1, D.R. Bergdahl2, H.B. Teillon3, and D.P. Ruddell4
1Redstart Forestry2University of Vermont
3State of Vermont, Department of Forests, Parks, and Recreation4Antioch New England
ABSTRACT
A pilot-phase geographic information system (GIS)-based risk assessment was developed forsouthern Vermont as part of a coordinated effort to reduce the spread of hemlock woollyadelgid. The model incorporated a literature search, interviews, and historical documentationin identifying: 1) factors associated with the risk of HWA introduction and establishment(“susceptibility”), and 2) potential impact of HWA infestations (“vulnerability/ resistance”).
Results indicated that although cold temperatures may currently be a limiting factor fornorthward spread of HWA, cold hardiness zones in which the pest is already establishedextend well into Vermont. Hemlock is ubiquitous in the state, presenting ample opportunityfor natural spread, and historical introductions of the insect highlight risk factors such asnurseries and seasonal residences in conjunction with potential movement corridors. In addi-tion to compilation of these susceptibility factors in a GIS database, a spatially referencedresistance index was created based on soil moisture, slope aspect, and site productivity.
The resulting pest risk assessment model can help focus prevention, monitoring, earlydetection and rapid response efforts. Susceptibilty factors are being used to help prioritizesurveying efforts and incorporating the results of those efforts. Results obtained for the vul-nerability/resistance index are untested for generality and require application to a more ex-tensive area for validation, but information garnered offers a means for quantification throughstatistical correlation with field data. The model is easily modified and will continue to incor-porate advances in research, with a goal of closing the loop between research and applicationby making the results accessible to land managers and forestry practitioners.
Third Symposium on Hemlock Woolly Adelgid Presentations
Cheah et al. __________________________________________________________________________________
116
ASSESSMENTS OF BIOLOGICAL CONTROL OF HEMLOCK WOOLLY ADELGID WITH
SASAJISCYMNUS TSUGAE IN CONNECTICUT AND NEW JERSEY
C.A.S-J. Cheah1, M.A. Mayer2, D. Palmer2, T. Scudder2, and R. Chianese2
1Valley Laboratory, Connecticut Agricultural Experiment Station,153 Cook Hill Road, Windsor, CT 06095
2 New Jersey Department of Agriculture, Division of Plant Industry,Phillip Alampi Beneficial Insect Laboratory, P.O. Box 330, Trenton, NJ 08625
ABSTRACT
The health of hemlocks in S. tsugae release sites in Connecticut and New Jersey are comparedto non-release sites in an attempt to assess the efficacy of introductions of Sasajiscymnus(=Pseudoscymnus) tsugae (Coleoptera: Coccinellidae) for hemlock woolly adelgid controland management and to remediate hemlock decline. Foliage transparency emerged as an im-portant variable for assessing hemlock crown conditions. In Connecticut, mean foliage trans-parency was significantly better in release than in non-release sites. Significant improvementsin foliage transparency of hemlocks were recorded in S. tsugae release sites but not in non-release sites from 2003 to 2004 in New Jersey. Foliage transparency and hemlock mortality inSkyland release sites were significantly lower than in comparable non-release sites. Patternsof hemlock health, S. tsugae recoveries, and the impact and interaction of abiotic and bioticfactors such as drought, winter mortality of adelgids, and concurrent elongate hemlock scaleinfestations are also discussed.
KEYWORDS
Adelges tsugae, hemlock woolly adelgid, Sasajiscymnus (Pseudoscymnus) tsugae, foliagetransparency, eastern hemlock, biological control.
INTRODUCTION
While New Jersey is approximately 1.5 times the land area of Connecticut, both states sharealmost equivalent forest cover and some of the most densely populated areas in the U.S. For-ests cover nearly 1.9 million acres in Connecticut, and eastern hemlocks, Tsuga canadensisCarriere, are concentrated in Litchfield County, in the northwestern corner of the state(Wharton et al. 2004), where hemlock stands of more than 1000 acres predominate (Hurlock,personal communication). New Jersey has 1.8 million acres of forested land of which 26,000acres comprise eastern hemlock stands, also located primarily in the northwestern corner ofthe state in Sussex, Passaic, Warren and Morris counties (Anonymous 2001). Portions of thenorthwestern corner of Connecticut are also linked geologically to the northwestern cornerof New Jersey. Both the New Jersey Highlands and the Housatonic Highlands in Connecti-
_______________ Assessments of biological control of hemlock woolly adelgid with Sasajiscymnus tsugae
Presentations Third Symposium on Hemlock Woolly Adelgid
117
cut are part of the Highlands Province, composed of the oldest Precambrian metasedimentaryrocks (Stoffer 2003). Climatically, the Highlands and Skylands regions of New Jersey liewithin USDA Zone 6a (minimum winter temperatures between –5 to -10°F) and 6b (0 to –5°F), which is similar to much of central and southern Connecticut. The northwestern andnortheastern corners of Connecticut are part of Zone 5b, where minimum winter tempera-tures range between –10 to –15 °F.
Connecticut and New Jersey also share a common history with some of the first exten-sive areas of hemlock decline associated with the initial invasion and spread of Adelges tsugaeAnnand, hemlock woolly adelgid (HWA), in the mid to late 1980s (Ward et al. 1992). In NewJersey, the Highlands region has been heavily infested with HWA since the late 1980s whilethe northernmost high elevation parts of Sussex and Warren counties, known as the Skylandsregion, has only more recently been heavily infested, as of the late 1990s. In Connecticut,northwestern Litchfield county is also the most recently infested, while much of the rest ofthe state has experienced adelgid infestations since the late 1980s. The two states have alsocooperated closely in biological control implementations involving Sasajiscymnus (formerlyPseudoscymnus) tsugae Sasaji and McClure, originally imported from southern Honshu, Ja-pan, beginning with the shipment of a starter colony of S. tsugae from the Connecticut Agri-cultural Experiment Station in 1997 to the New Jersey Philip Alampi Beneficial Insect Labo-ratory. Research on S. tsugae in Connecticut, funded by the USDA Forest Service, has con-tinued with studies on the biology and behavior of S. tsugae, and hemlock health assessmentsand monitoring of S. tsugae release sites. In New Jersey, the Philip Alampi Laboratory hasalso mass-reared S. tsugae for releases and starter colones in other affected states while alsomaintaining an extensive release program in New Jersey’s infested hemlock stands. To date,298,160 S. tsugae have been released in 70 sites in New Jersey from 1998-2004, while 172,020have been released in 21 sites in Connecticut from 1995-2002. Many of the release sites se-lected in Connecticut had moderate to high pre-release adelgid populations, as did releasesites in New Jersey—in particular, sites in the Highland region. Although the establishment,field reproduction, synchrony of life cycles with A. tsugae and overwintering ability of S.tsugae has been previously documented in Connecticut (Cheah and McClure 2000 and 2002)and New Jersey (Mayer et al. 2002a), recovery rates have not been consistently high. Thus,much of the ensuing discussion will center on recent comparative assessments of hemlockhealth in S. tsugae release and non-release sites in the two states.
This paper seeks to identify patterns and summarize encouraging results from the re-lease programs in Connecticut and New Jersey after 6-9 years of monitoring and assessmentsof S. tsugae release sites and to highlight important factors influencing the recovery of hem-locks in adelgid-infested stands.
METHODS
CONNECTICUT
In 2003 and 2004, annual summer evaluations of hemlock health in selected release sites wereexpanded to include a minimum of 10 to 15 trees per site. Trees evaluated were representativeof the age classes at each site and comprised mostly intermediate and co-dominant hemlocks.
Third Symposium on Hemlock Woolly Adelgid Presentations
Cheah et al. __________________________________________________________________________________
118
At a few sites, the number of trees rated exceeded this as transects to 200m were also includedin site evaluations. In addition, fall 2003- winter 2004 surveys (n = 15 trees/site) was con-ducted in northwestern Connecticut in 28 hemlock stands by the Connecticut AgriculturalExperiment Station plant inspectors. All hemlock health ratings followed the standard For-est Inventory Analysis (formerly Forest Health Monitoring) criteria of live crown ratio, crowndensity, foliage transparency, percentage crown dieback, and live branches (5% classes). Inaddition, crown estimates of new shoot production and the overall level of adelgid infesta-tions were estimated with binocular inspection in classes of 0, <10%, 11-50%, 51-75%, and>75% (after Tigner, unpublished). Levels of elongate hemlock scale, Fiorinia externa Ferris,infestation were also rated visually as none, very light, light, medium, high or very high. Ateach S. tsugae release site, adelgid-infested hemlock tip samples from healthy branches in thelower crown from a minimum of 10 trees were randomly selected during site visits in lateFebruary through April, 2003 and 2004, for estimates of winter mortality of the A. tsugaesistens. Counts were made under a dissecting microscope to determine the proportion of liveand dead adelgids (minimum of 1,000 adelgids/site) per sample. Soil types for each releaseand non-release site and corresponding woodland suitability groups, which estimate site qualityfor forest growth, were determined from county-level soil survey maps for all seven Con-necticut counties, compiled by the USDA Soil Conservation Service in cooperation with theConnecticut Agricultural Experiment Station and the Storrs Agricultural Experiment Stationfrom 1966-1983. Woodland suitability groups ranged from 1 to 11: 1 being the best site and11, the poorest. This ranking was used as a method to account for possible site differencesbefore statistical comparisons.
Sampling for predators at selected release sites continued with lower crown sampling ofinfested branches using 1 meter2 beating sheets to catch dislodged debris and insects. Thirtyinfested hemlock tips per site (18-24”) were also sampled randomly at 1.5-5m intervals fromfive selected release sites and surroundings that showed patchy and limited resurgence ofadelgids in 2004 and inspected under dissecting microscopes for signs of predation.
NEW JERSEY
Crown ratio, foliage transparency ratings and assessments of hemlock mortality were con-ducted in 2003 and 2004 at 23 selected S. tsugae release sites according to the above ForestInventory Analysis (Forest Health Monitoring) criteria (Mayer et. al 2002a). In 2003 and2004, hemlock crown ratings performed at 38 matching non-release sites were also conductedfor comparisons. These non-release sites consisted of the most proximal non-release hemlockstands that had similar topographical and hemlock characteristics to those of release stands.All sites rated (n = 20 trees/site) were classified by region (Highland or Skyland) to accountfor differing histories, intensity, and duration of HWA infestation for statistical analyses.Predator sampling of the lower crown was also conducted at release sites as described above.In addition, a bucket truck was used to sample at increasing heights in the crown in oneSkyland site in 2001 to investigate distribution of S. tsugae four weeks after initial release incomparison to a simultaneous lower crown survey.
_______________ Assessments of biological control of hemlock woolly adelgid with Sasajiscymnus tsugae
Presentations Third Symposium on Hemlock Woolly Adelgid
119
STATISTICAL ANALYSES
Statistical analyses on Connecticut and New Jersey data were performed using the NumberCruncher Statistical System 2000 computer program (Hintze 1998). Range estimates for newshoot production, adelgid and scale infestations from Connecticut sites were transformedinto ranks for statistical comparisons (0-4 for new shoot production and adelgid levels, and 0-5 for elongate hemlock scale infestations). Data were checked for normality and equal vari-ances, and where appropriate, the Equal Variance T-Test or the Aspin-Welch Unequal Vari-ance T-Test was used. Non-parametric statistical analyses (the Mann-Witney U-Test and theWilcoxon Signed-Rank paired t-test) were used for comparisons of non-normal distributionsof foliar transparency and hemlock mortality. Linear regressions were also performed toinvestigate relationships between variables.
RESULTS
CONNECTICUT
Eleven release sites were rated for crown health and infestation levels in 2003 and 16 in 2004(Table 1). Foliar transparency ratings in 2003 and 2004 were not significantly related to wood-land suitability groups. Foliar transparencies in 2003 and 2004 were similar (p > 0.05) as werelevels of new shoot production. In 2003 and 2004, average levels of new growth were be-tween 50 and 75% of the crown in release sites. Foliage transparency in 2004 was significantlycorrelated to new growth in 2004 (Figure 1a; r2 = 0.2783, p = 0.0357). Levels of adelgid inrelease sites in 2003 were low (<10%) in eight sites, while in three sites, there was patchyresurgence (10-50%). In 2004, 14 sites had <10% levels of HWA while only two sites showedvery patchy resurgence. Comparisons of mean HWA levels in release sites in 2003 and 2004showed no overall increase in 2004 and remained low overall. Both winters of 2003 and 2004were severe and resulted in heavy mortality of the adelgid in S. tsugae release sites. Meanoverwintering mortality of HWA in S. tsugae release sites in 2003 was 83.1 ± 7.7% and 87.7 ±10.9% in 2004, which accounted for much of the subsequent depression of adelgid popula-tions in release sites. Release sites were also infested with F. externa. In 2004, 31% of siteshad high elongate hemlock scale infestations, 56% of sites had light to moderate infestations,and only 12.5% of sites had negligible scale infestations. In 2004, foliage transparency inrelease sites was slightly correlated to ratings of scale infestations, although the relationshipwas not significant (Figure 1b; r2 = 0.2235, p = 0.0644). There was also no significant relation-ship between scale infestations and foliage transparency in 2003.
In non-release sites surveyed in fall 2003 and early winter 2004, foliar transparencies insites that had indications of adelgid infestation were also not related to woodland suitabilitygroups (p > 0.05) (Table 2). Seven of the 28 sites surveyed in pristine areas of high elevationsand remote locale were identified as having negligible adelgid or scale infestation. Foliartransparencies from 105 trees from these seven sites were used to develop a baseline mean
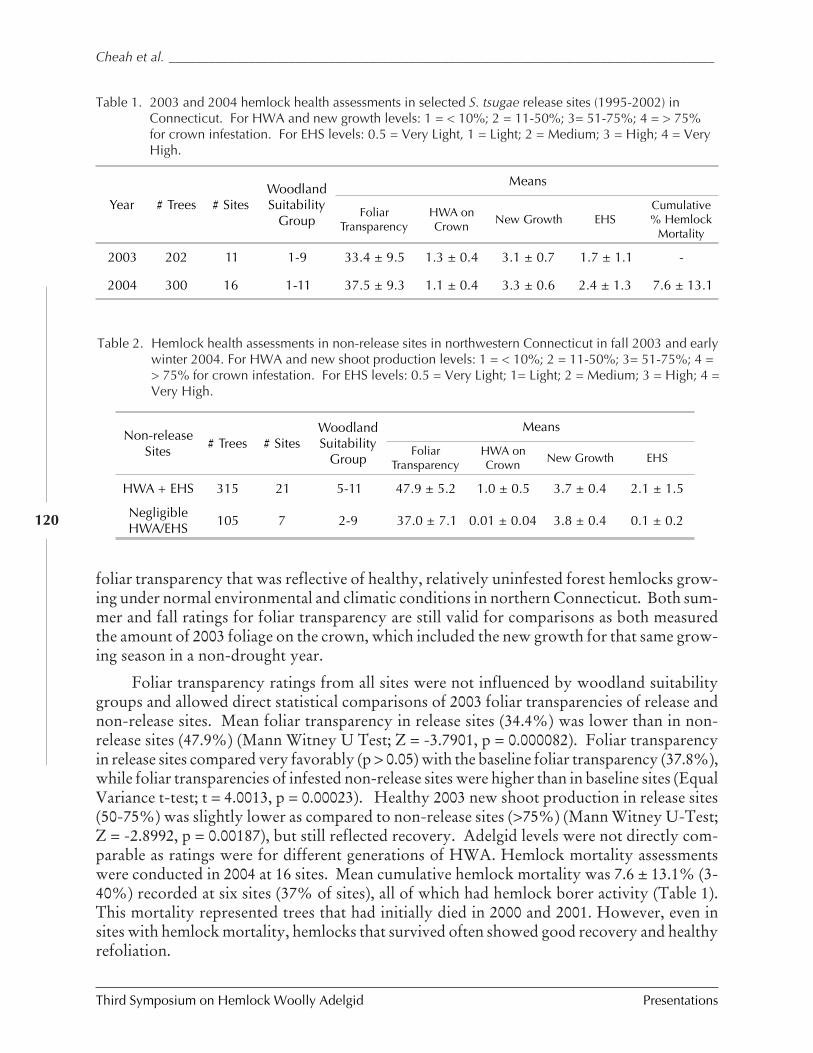
Third Symposium on Hemlock Woolly Adelgid Presentations
Cheah et al. __________________________________________________________________________________
120
Year # Trees # SitesWoodlandSuitability
Group
Means
FoliarTransparency
HWA onCrown
New Growth EHSCumulative% Hemlock
Mortality
2003 202 11 1-9 33.4 ± 9.5 1.3 ± 0.4 3.1 ± 0.7 1.7 ± 1.1 -
2004 300 16 1-11 37.5 ± 9.3 1.1 ± 0.4 3.3 ± 0.6 2.4 ± 1.3 7.6 ± 13.1
Table 1. 2003 and 2004 hemlock health assessments in selected S. tsugae release sites (1995-2002) inConnecticut. For HWA and new growth levels: 1 = < 10%; 2 = 11-50%; 3= 51-75%; 4 = > 75%for crown infestation. For EHS levels: 0.5 = Very Light, 1 = Light; 2 = Medium; 3 = High; 4 = VeryHigh.
Table 2. Hemlock health assessments in non-release sites in northwestern Connecticut in fall 2003 and earlywinter 2004. For HWA and new shoot production levels: 1 = < 10%; 2 = 11-50%; 3= 51-75%; 4 => 75% for crown infestation. For EHS levels: 0.5 = Very Light; 1= Light; 2 = Medium; 3 = High; 4 =Very High.
Non-releaseSites
# Trees # SitesWoodlandSuitability
Group
Means
FoliarTransparency
HWA onCrown New Growth EHS
HWA + EHS 315 21 5-11 47.9 ± 5.2 1.0 ± 0.5 3.7 ± 0.4 2.1 ± 1.5
NegligibleHWA/EHS 105 7 2-9 37.0 ± 7.1 0.01 ± 0.04 3.8 ± 0.4 0.1 ± 0.2
foliar transparency that was reflective of healthy, relatively uninfested forest hemlocks grow-ing under normal environmental and climatic conditions in northern Connecticut. Both sum-mer and fall ratings for foliar transparency are still valid for comparisons as both measuredthe amount of 2003 foliage on the crown, which included the new growth for that same grow-ing season in a non-drought year.
Foliar transparency ratings from all sites were not influenced by woodland suitabilitygroups and allowed direct statistical comparisons of 2003 foliar transparencies of release andnon-release sites. Mean foliar transparency in release sites (34.4%) was lower than in non-release sites (47.9%) (Mann Witney U Test; Z = -3.7901, p = 0.000082). Foliar transparencyin release sites compared very favorably (p > 0.05) with the baseline foliar transparency (37.8%),while foliar transparencies of infested non-release sites were higher than in baseline sites (EqualVariance t-test; t = 4.0013, p = 0.00023). Healthy 2003 new shoot production in release sites(50-75%) was slightly lower as compared to non-release sites (>75%) (Mann Witney U-Test;Z = -2.8992, p = 0.00187), but still reflected recovery. Adelgid levels were not directly com-parable as ratings were for different generations of HWA. Hemlock mortality assessmentswere conducted in 2004 at 16 sites. Mean cumulative hemlock mortality was 7.6 ± 13.1% (3-40%) recorded at six sites (37% of sites), all of which had hemlock borer activity (Table 1).This mortality represented trees that had initially died in 2000 and 2001. However, even insites with hemlock mortality, hemlocks that survived often showed good recovery and healthyrefoliation.
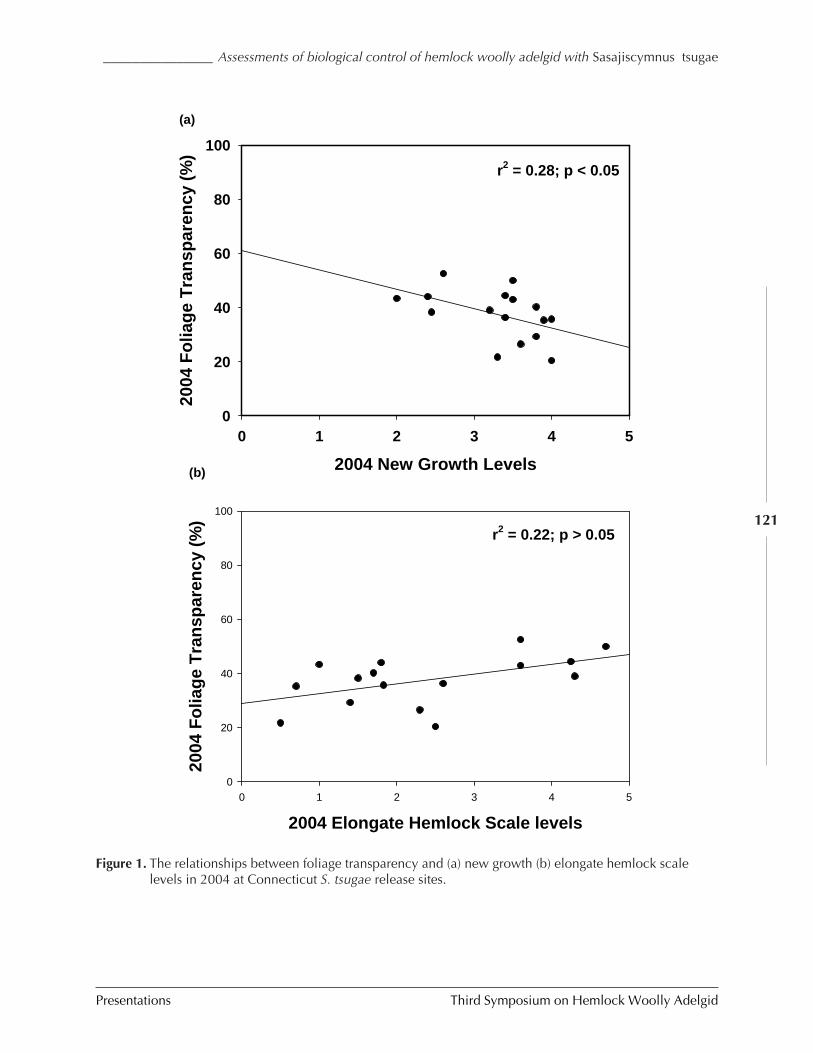
_______________ Assessments of biological control of hemlock woolly adelgid with Sasajiscymnus tsugae
Presentations Third Symposium on Hemlock Woolly Adelgid
121
2004 Elongate Hemlock Scale levels
0 1 2 3 4 5
2004
Fo
liag
e T
ran
spar
ency
(%
)
0
20
40
60
80
100
2004 New Growth Levels
0 1 2 3 4 5
2004
Fo
liag
e T
ran
spar
ency
(%
)
0
20
40
60
80
100
r2 = 0.28; p < 0.05
r2 = 0.22; p > 0.05
(a)
(b)
Figure 1. The relationships between foliage transparency and (a) new growth (b) elongate hemlock scalelevels in 2004 at Connecticut S. tsugae release sites.
Third Symposium on Hemlock Woolly Adelgid Presentations
Cheah et al. __________________________________________________________________________________
122
In four selected sites where S. tsugae had been recovered in previous years, trends infoliage transparency, HWA, and new growth levels on the crown through 2004 are shown inFigures 2(a)- (c). In these sites, mean HWA levels have not risen beyond 50% of the crownover the site. In combination with severe winter mortality in 2003 and 2004, adelgid levels atrelease sites have remained very low, at less than 10% on the crown. Foliage transparencieshave also improved through 2004 from the higher transparencies observed in 2002. Crownlevels of new growth have also surged in 2004 at all sites, even in northern sites such as BurrPond State Park, which had shown severe defoliation and decline just the year before.
Predator surveys were conducted at a few sites where there was very patchy and lightresurgence of adelgids by dislodging insects from lower crown branches into a collectingsheet and by branch tip sample collection for examination under a dissecting microscope.Ground surveys in late June and July at five sites did not recover any S. tsugae stages. How-ever, examination of adelgid-infested foliage samples revealed one pre-pupating S. tsugae larva,in a web of dead needles, recovered in early June 2004. Dispersal had occurred from the topof the knoll approximately 700-1000m from the original 1999 release area in northeasternConnecticut. This was the first recovery at this site since recoveries of adults and larvae of S.tsugae in 2000. To date, recoveries of S. tsugae adults and larvae have been made in 13 Con-necticut sites (65% of release sites) ranging from 1-6 years after the initial release.
NEW JERSEY
In New Jersey, foliar transparencies and hemlock mortality in release sites were compared byregion (Table 3). Mean 2003 foliar transparency in Highland release sites (n = 11; 76%) washigher than in Skyland sites (n = 12; 65.8%) (Equal Variance T-Test; t = 2.5877; p = 0.00859).Hemlock mortality in Highland sites in 2003 was also higher than in Skyland sites (Mann-Witney U-Test; Z = -2.6434, p = 0.00410). In 2004, this trend was repeated with higher meanfoliar transparency in Highland as compared to Skyland sites (Mann Witney U-Test; t =3.2643, p = 0.00055). However, within regions, Highland sites showed significant improve-ments in foliar transparency from 2003 to 2004 (Paired t-test; t = 3.6829, p = 0.00253), as didSkyland sites (Paired t-test; t = 6.3358, p = 0.00003).
Non-release sites were also compared by region (Table 3). Mean 2003 foliar transpar-ency in Highland sites was higher than in Skyland sites (Equal variance t-test; t = 2.5877, p =0.00859). In 2004, foliar transparency was also higher in Highland than in Skyland non-release sites (Mann Witney U- Test; Z = 3.2643, p = 0.00055). There were no differences inhemlock mortality between Highland and Skyland non-release sites (Mann Witney U-Test;Z = -1.4902, p = 0.1361). Within regions, foliar transparency in Highland sites did not differfrom 2003 to 2004 (Equal Variance T-test; t = 1.1751, p = 0.12256). Foliar transparency inSkyland sites also showed no differences from 2003 to 2004 (Equal Variance T-test; t = 0.5395,p = 0.59433).
Comparisons were made of foliar transparencies and hemlock mortality between S. tsugaerelease and non-release sites by region. Mean 2003 foliar transparency in release sites in theHighland region was similar to that in non-release sites (Equal Variance T-test; t = 0.4913, p= 0.62617). Mean 2003 foliar transparencies also showed no differences between Skylandrelease and non-release sites (Equal Variance T- Test; t = -0.2692, p = 0.79071). In 2004, foliar
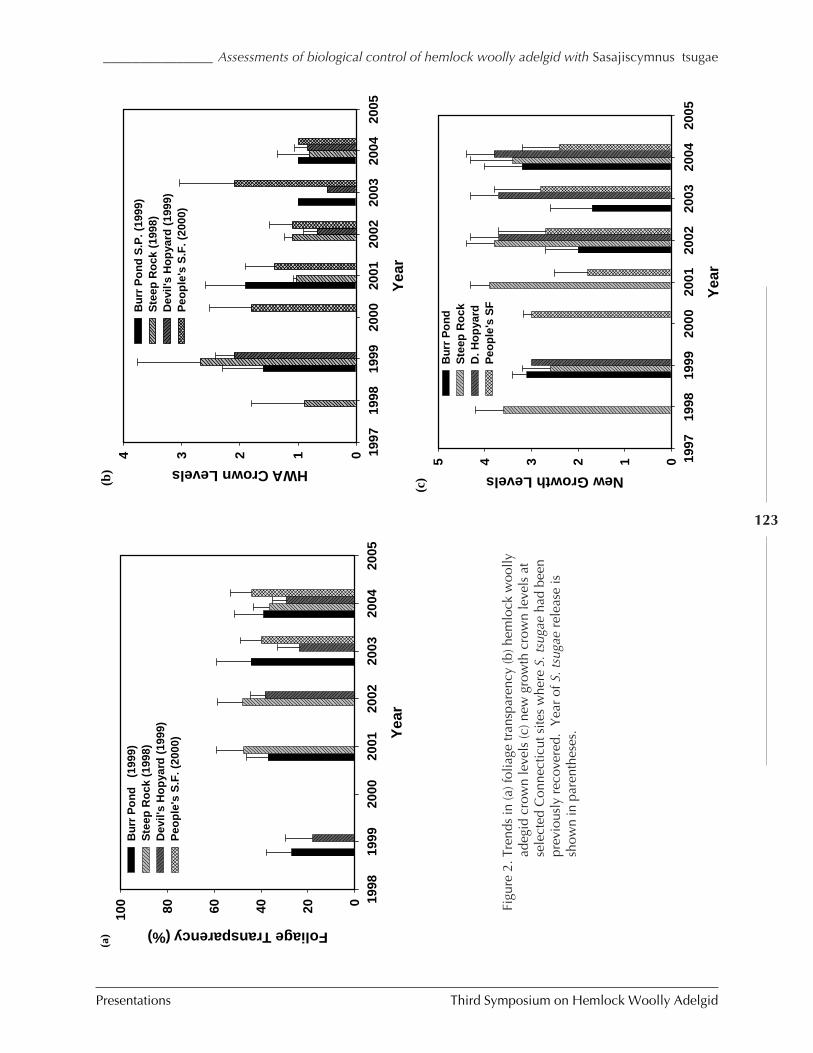
_______________ Assessments of biological control of hemlock woolly adelgid with Sasajiscymnus tsugae
Presentations Third Symposium on Hemlock Woolly Adelgid
123
(a)
Yea
r
1998
1999
2000
2001
2002
2003
2004
2005
Foliage Transparency (%)
020406080100
Bu
rr P
on
d
(199
9)S
teep
Ro
ck (
1998
)D
evil'
s H
op
yard
(19
99)
Peo
ple
's S
.F. (
2000
)
(b)
Yea
r
1997
1998
1999
2000
2001
2002
2003
2004
2005
HWA Crown Levels
01234B
urr
Po
nd
S.P
. (19
99)
Ste
ep R
ock
(19
98)
Dev
il's
Ho
pya
rd (
1999
)P
eop
le's
S.F
. (20
00)
(c)
Yea
r
1997
1998
1999
2000
2001
2002
2003
2004
2005
New Growth Levels
012345B
urr
Po
nd
S
teep
Ro
ckD
. Ho
pya
rdP
eop
le's
SF
Figu
re 2
.Tre
nds
in (a
) fol
iage
tran
spar
ency
(b) h
emlo
ck w
oolly
adeg
id c
row
n le
vels
(c) n
ew g
row
th c
row
n le
vels
at
sele
cted
Con
nect
icut
site
s w
here
S. t
suga
e ha
d be
enpr
evio
usly
rec
over
ed.
Yea
r of
S. t
suga
e re
leas
e is
show
n in
par
enth
eses
.
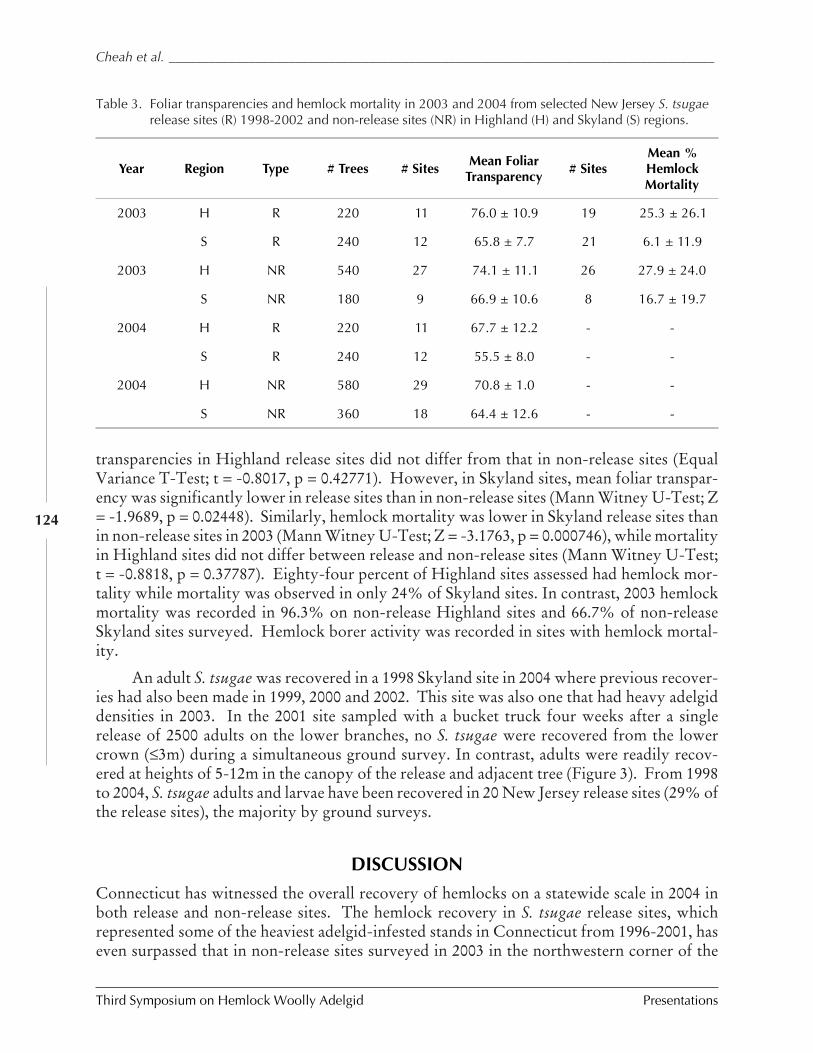
Third Symposium on Hemlock Woolly Adelgid Presentations
Cheah et al. __________________________________________________________________________________
124
transparencies in Highland release sites did not differ from that in non-release sites (EqualVariance T-Test; t = -0.8017, p = 0.42771). However, in Skyland sites, mean foliar transpar-ency was significantly lower in release sites than in non-release sites (Mann Witney U-Test; Z= -1.9689, p = 0.02448). Similarly, hemlock mortality was lower in Skyland release sites thanin non-release sites in 2003 (Mann Witney U-Test; Z = -3.1763, p = 0.000746), while mortalityin Highland sites did not differ between release and non-release sites (Mann Witney U-Test;t = -0.8818, p = 0.37787). Eighty-four percent of Highland sites assessed had hemlock mor-tality while mortality was observed in only 24% of Skyland sites. In contrast, 2003 hemlockmortality was recorded in 96.3% on non-release Highland sites and 66.7% of non-releaseSkyland sites surveyed. Hemlock borer activity was recorded in sites with hemlock mortal-ity.
An adult S. tsugae was recovered in a 1998 Skyland site in 2004 where previous recover-ies had also been made in 1999, 2000 and 2002. This site was also one that had heavy adelgiddensities in 2003. In the 2001 site sampled with a bucket truck four weeks after a singlerelease of 2500 adults on the lower branches, no S. tsugae were recovered from the lowercrown (≤3m) during a simultaneous ground survey. In contrast, adults were readily recov-ered at heights of 5-12m in the canopy of the release and adjacent tree (Figure 3). From 1998to 2004, S. tsugae adults and larvae have been recovered in 20 New Jersey release sites (29% ofthe release sites), the majority by ground surveys.
DISCUSSION
Connecticut has witnessed the overall recovery of hemlocks on a statewide scale in 2004 inboth release and non-release sites. The hemlock recovery in S. tsugae release sites, whichrepresented some of the heaviest adelgid-infested stands in Connecticut from 1996-2001, haseven surpassed that in non-release sites surveyed in 2003 in the northwestern corner of the
Year Region Type # Trees # Sites Mean FoliarTransparency
# SitesMean %HemlockMortality
2003 H R 220 11 76.0 ± 10.9 19 25.3 ± 26.1
S R 240 12 65.8 ± 7.7 21 6.1 ± 11.9
2003 H NR 540 27 74.1 ± 11.1 26 27.9 ± 24.0
S NR 180 9 66.9 ± 10.6 8 16.7 ± 19.7
2004 H R 220 11 67.7 ± 12.2 - -
S R 240 12 55.5 ± 8.0 - -
2004 H NR 580 29 70.8 ± 1.0 - -
S NR 360 18 64.4 ± 12.6 - -
Table 3. Foliar transparencies and hemlock mortality in 2003 and 2004 from selected New Jersey S. tsugaerelease sites (R) 1998-2002 and non-release sites (NR) in Highland (H) and Skyland (S) regions.
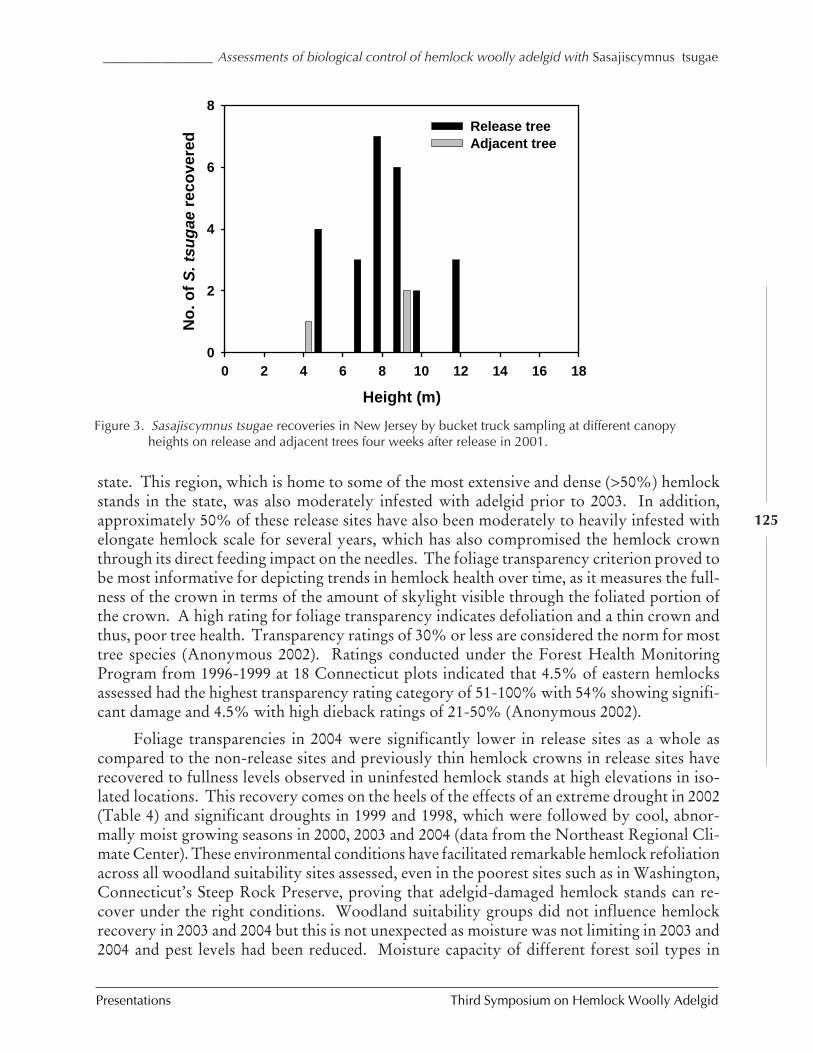
_______________ Assessments of biological control of hemlock woolly adelgid with Sasajiscymnus tsugae
Presentations Third Symposium on Hemlock Woolly Adelgid
125
state. This region, which is home to some of the most extensive and dense (>50%) hemlockstands in the state, was also moderately infested with adelgid prior to 2003. In addition,approximately 50% of these release sites have also been moderately to heavily infested withelongate hemlock scale for several years, which has also compromised the hemlock crownthrough its direct feeding impact on the needles. The foliage transparency criterion proved tobe most informative for depicting trends in hemlock health over time, as it measures the full-ness of the crown in terms of the amount of skylight visible through the foliated portion ofthe crown. A high rating for foliage transparency indicates defoliation and a thin crown andthus, poor tree health. Transparency ratings of 30% or less are considered the norm for mosttree species (Anonymous 2002). Ratings conducted under the Forest Health MonitoringProgram from 1996-1999 at 18 Connecticut plots indicated that 4.5% of eastern hemlocksassessed had the highest transparency rating category of 51-100% with 54% showing signifi-cant damage and 4.5% with high dieback ratings of 21-50% (Anonymous 2002).
Foliage transparencies in 2004 were significantly lower in release sites as a whole ascompared to the non-release sites and previously thin hemlock crowns in release sites haverecovered to fullness levels observed in uninfested hemlock stands at high elevations in iso-lated locations. This recovery comes on the heels of the effects of an extreme drought in 2002(Table 4) and significant droughts in 1999 and 1998, which were followed by cool, abnor-mally moist growing seasons in 2000, 2003 and 2004 (data from the Northeast Regional Cli-mate Center). These environmental conditions have facilitated remarkable hemlock refoliationacross all woodland suitability sites assessed, even in the poorest sites such as in Washington,Connecticut’s Steep Rock Preserve, proving that adelgid-damaged hemlock stands can re-cover under the right conditions. Woodland suitability groups did not influence hemlockrecovery in 2003 and 2004 but this is not unexpected as moisture was not limiting in 2003 and2004 and pest levels had been reduced. Moisture capacity of different forest soil types in
Height (m)
0 2 4 6 8 10 12 14 16 18
No
. of
S. t
sug
ae r
eco
vere
d
0
2
4
6
8
Release tree Adjacent tree
Figure 3. Sasajiscymnus tsugae recoveries in New Jersey by bucket truck sampling at different canopy
heights on release and adjacent trees four weeks after release in 2001.
Third Symposium on Hemlock Woolly Adelgid Presentations
Cheah et al. __________________________________________________________________________________
126
State Climate Division Severe/ Extreme Drought Period Duration (in months)
NJ Northern 7/1999 - 8/1999 2
Northern 12/2001- 5/2002 6
CT Northwest 1/2002 - 4/2002 4
Central 2/2002 - 4/2002 3
Coastal 7/1999 - 8/1999 2
Coastal 1/2002 - 4/2002 4
Table 4. Periods of two months or more of severe and extreme droughts in northern New Jersey andConnecticut (data from the Northeast Regional Climate Center).
Connecticut is probably much more of a factor affecting tree health and growth in droughtyears (Lunt 1948).
Although severe winter mortality in 2003 and 2004 statewide has significantly depressedadelgid populations in subsequent seasons, the continued trend in low adelgid levels is re-markable for its lack of resurgence. Figure 4 shows the dramatic fluctuations in average win-ter temperatures in Connecticut, New Jersey, and the Northeast region as a whole from 1990to 2004. While severe winters in 1994 and 1996 (ranked 15 and 39, respectively, since 1896;Northeast Regional Climate Center) were followed by the explosive expansion of HWA inConnecticut, this expected resurgence of HWA has not occurred (ranked 26 and 41 respec-tively). Significantly, adelgid resurgence also did not occur to any marked extent in 2002 inrelease sites (Figure 2b) following the warmest winter on record (Northeast Regional ClimateCenter) where there was negligible winter mortality of HWA. Although there had also beena severe winter drought in 2002, healthy new growth, favorable to adelgid colonization, wasalso at high levels in monitored trees (Figure 2c) in 2002, so poor hemlock health was not alimiting factor for recolonization by A. tsugae.
Could the low levels of HWA be partially attributable to the establishment and impactof S. tsugae, acting in concert with other native natural enemies as part of a complex? Figure5 shows the recoveries of S. tsugae in (a) Connecticut and (b) New Jersey in the years follow-ing the initial release. Recoveries of S. tsugae adults and larvae were readily recorded in thefirst two years after release using ground surveys. Although recoveries of S. tsugae from lowercrown sampling have diminished in time, the New Jersey bucket truck study has showedquite conclusively that shortly after release, beetles display a tendency to move upward intothe crown and well out of reach of current sampling procedures. Similar results were ob-tained in another bucket truck survey in Connecticut in June 2001. No S. tsugae were de-tected in a lower crown ground survey a week before but larvae and an adult were recoveredat 12- 20m in the hemlock canopy in the year following release (Cheah and McClure 2002).The winters of 2003 and 2004 have also been severe in northwestern New Jersey. One Skylandrelease site recorded 89% mortality in 2004 (Shields and Cheah unpub.) resulting in very lowadelgid levels in subsequent seasons. Concurrently, it is not unexpected that S. tsugae andother predators have been hard to find in recent years. Dieback of lower hemlock crown
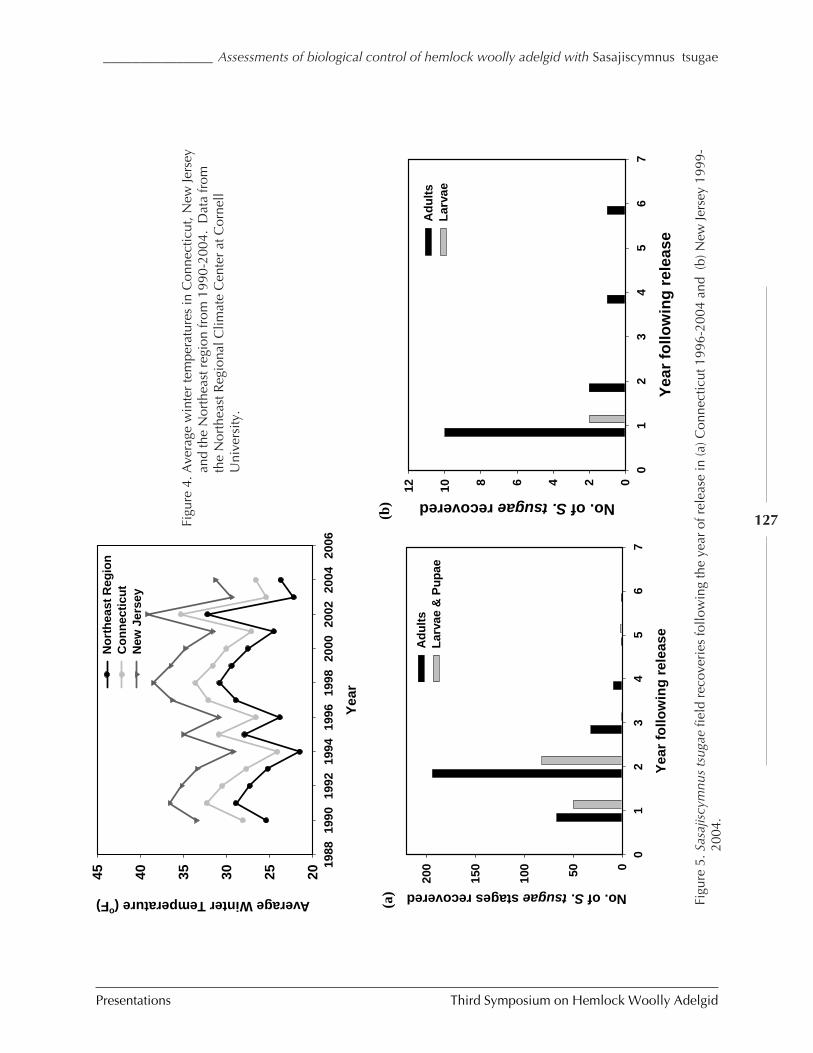
_______________ Assessments of biological control of hemlock woolly adelgid with Sasajiscymnus tsugae
Presentations Third Symposium on Hemlock Woolly Adelgid
127
Yea
r
1988
1990
1992
1994
1996
1998
2000
2002
2004
2006
Average Winter Temperature (oF)
202530354045N
ort
hea
st R
egio
nC
on
nec
ticu
tN
ew J
erse
y
(a)
Yea
r fo
llow
ing
rel
ease
01
23
45
67
No. of S. tsugae stages recovered
050100
150
200
Ad
ult
sL
arva
e &
Pu
pae
(b)
Yea
r fo
llow
ing
rel
ease
01
23
45
67
No. of S. tsugae recovered
024681012
Ad
ult
sL
arva
e
Figu
re 4
.Ave
rage
win
ter
tem
pera
ture
s in
Con
nect
icut
, New
Jers
eyan
d th
e N
orth
east
regi
on fr
om 1
990-
2004
. D
ata
from
the
Nor
thea
st R
egio
nal C
limat
e C
ente
r at
Cor
nell
Uni
vers
ity.
Figu
re 5
.Sas
ajis
cym
nus
tsug
ae fi
eld
reco
veri
es fo
llow
ing
the
year
of r
elea
se in
(a) C
onne
ctic
ut 1
996-
2004
and
(b)
New
Jers
ey 1
999-
2004
.
Third Symposium on Hemlock Woolly Adelgid Presentations
Cheah et al. __________________________________________________________________________________
128
branches in New Jersey sites has also restricted the ability to sample for predators. Adelgidpopulation rebound should result in better recoveries of S. tsugae. However, more efficientand better methods of sampling for S. tsugae higher up in the crown need to be developed formonitoring their establishment and impact. The role of S. tsugae in biological control of HWAcannot be discounted simply on the basis of the lack of recovery data for the factors outlinedabove. Since foliage transparency primarily measures the upper foliated crown, it is reason-able to hypothesize that this healthier portion of the hemlock crown may also house preda-tors such as S. tsugae.
Previous assessments of HWA damage to hemlock stands in New Jersey have shownthat foliage transparency was directly related to the density of adelgid infestation, and thattransparencies of >60% have marked a threshold where tree mortality increased significantly(Mayer et al. 2002b). However, adelgid-damaged hemlock stands in New Jersey S. tsugaerelease sites in both Highland and Skyland regions are showing signs of reversing this trendwith initial recovery from 2003 – 2004. This improvement in foliage transparency is mostevident in the Skyland sites. Skyland release sites have had a more recent history of adelgidpopulation explosion and the initiation of recovery in these sites has occurred at a greater ratethan in Highland sites. The Highland region has been heavily infested with HWA and elon-gate hemlock scale since the late 1980s, a decade more than the Skyland region and has suf-fered extensive decline from 1984 to 1994 (Royle and Lathrop 2002). In contrast, non-releasesites in both regions have not shown improvements in foliage transparencies from 2003 to2004. Most significantly, comparisons between release and comparable non-release stands inSkyland sites indicated that hemlock recovery, in terms of foliage transparency improvement,was very significantly higher in release sites in 2004. This trend has not yet been detected inHighland sites where foliage transparencies remained similar in release and non-release sitesin 2003 and 2004. Hemlock mortality in Skyland release sites was also significantly lowerthan in non-release sites. Releases of S. tsugae appear to be correlated to the reduction ofhemlock mortality, at least in the healthier Skyland sites. All release and non-release sites inNew Jersey have also been infested with elongate hemlock scale since the late 1980s or earlier.In addition, this northern region suffered extreme drought lasting two months in the summerof 1999 and six months extending into the spring of 2002 (Table 5), and these additionalstressors on hemlock, of greater magnitude in New Jersey than in Connecticut, have prob-ably contributed to the greater loss of foliage and hemlock decline in affected stands. As aresult, recovery is expected to progress at a slower rate. However, the data appears to indicatethat establishment of S. tsugae in Highland and Skyland release sites in New Jersey, togetherwith favorable environmental conditions, has helped improve declining hemlock crowns, atrend that has not been paralleled in surveyed non-release sites.
SUMMARY and CONCLUSIONS
Connecticut’s eastern hemlock stands, which have been under siege in the last two decadesfrom hemlock woolly adelgid, other pests and drought episodes, have shown recent trends inremarkable recovery from a period of decline and damage in the mid-late 1990s. This trend isalso correlated with the release of the introduced S. tsugae for biological control of hemlock
_______________ Assessments of biological control of hemlock woolly adelgid with Sasajiscymnus tsugae
Presentations Third Symposium on Hemlock Woolly Adelgid
129
woolly adelgid. This improvement in hemlock health at S. tsugae release sites has also oc-curred at a greater rate than in non-release stands. The ability of affected hemlocks to recoverand reverse the trend in defoliation and mortality in just a few years with the intervention ofmore favorable environmental conditions for hemlock growth is testimony to the species’resilience. In New Jersey, this pattern of recovery has been a little slower to emerge butrecent evaluations indicate it is on the right course. The key questions that remain concerningthe effectiveness of the introduced biological control agent, S. tsugae, is not whether we candetect the beetles numerically with current inadequate procedures, but whether adelgid popu-lations will continue to remain depressed at the current low levels, when winters are notlimiting, and whether hemlock decline can be reversed and mortality halted. A prudent strat-egy might be to augment and reintroduce S. tsugae into hemlock stands that show any resur-gence of the adelgid, especially after severe winters, as overwintering mortality of S. tsugaehas not been assessed to date.
ACKNOWLEDGMENTS
We sincerely thank the following for their significant assistance in field surveys and hemlockassessments, laboratory S. tsugae colony production, and much more: Mary Frost, JasonParent, John Winiarski, Richard Horvath, Victoria Smith, Peter Trenchard, Steven Sandrey,Jeff Fengler, Timothy Abbey (Connecticut Agricultural Experiment Station); Richard Chan-dler and Eddie Thornton (Weaver High School, Hartford, Connecticut); Jennifer Sheppard,Judith Sullivan, David Lesage, Amy Diercks, Jeffrey White and Daniel Klein at the NewJersey Department of Agriculture’s Phillip Alampi Beneficial Insect Laboratory. Special thanksto Dr. Louis Magnarelli, Director, and Dr. Richard Cowles of the Connecticut AgriculturalExperiment Station, and Hutch Perry, for their encouragement; Huber Hurlock and the For-estry Division, Bureau of Natural Resources of the Connecticut Department of Environmen-tal Protection at Pleasant Valley, Connecticut, and Carol Youell, Philip Royer and Jim Starkey,Natural Resources Management, the Metropolitan District Commission, Connecticut, fortheir cooperation. This research has been funded by the USDA Forest Service NortheasternArea State and Private Forestry, the Forest Health Technology Enterprise Team and theNortheastern Research Station.
REFERENCES
Anonymous. 2001. New Jersey 2001 Forest Health Highlights. Available online atwww.fs.fed.us/na/morgantown/fhp/fhh/fhh2001/nj2001.pdf
Annonymous. 2002. Forest Health Monitoring in Connecticut 1996-1999. NortheasternResearch Station publication NE-INF-153-02.
Cheah, C.A.S.-J. and M.S. McClure. 2000. Seasonal synchrony of life cycles between theexotic predator, Pseudoscymnus tsugae (Coleoptera: Coccinellidae) and its prey, thehemlock woolly adelgid, Adelges tsugae (Homoptera: Adelgidae).
Third Symposium on Hemlock Woolly Adelgid Presentations
Cheah et al. __________________________________________________________________________________
130
Cheah, C.A.S.-J. and McClure, M.S. 2002. Pseudoscymnus tsugae in Connecticut forests:The first five years, pp. 150-165. In Proceedings of Hemlock Woolly Adelgid in theEastern United States Symposium, Feb. 5-7, 2002, East Brunswick, New Jersey, ed. B.Onken, R. Reardon, and J. Lashomb. Rutgers University, New Brunswick, New Jersey.
Hintze, J.L. 1998. NCSS 2000 statistical system for Windows. Number Cruncher Statisti-cal Systems Publication, Kaysville, Utah.
Lunt, L.A. 1948. The forest soils of Connecticut. Bulletin 523 of the Connecticut Agricul-tural Experiment Station, New Haven, Connecticut.
Mayer, M., T. Scudder, R. Chianese, J. Sheppard, and D. Palmer. 2002a. Releases ofPseudoscymnus tsugae (Coleoptera: Coccinellidae) on the hemlock woolly adelgid,Adelges tsugae (Homoptera: Adelgidae) in New Jersey. Annual Report 2002 New JerseyDepartment of Agriculture, Phillip Alampi Beneficial Insect Laboratory.
Mayer, M., R. Chianese, T. Scudder, J. White, K. Vongpaseuth, and R. Ward. 2002b.Thirteen years of monitoring hemlock woolly adelgid in New Jersey forests, pp. 50-60.In Proceedings of Hemlock Woolly Adelgid in the Eastern United States Symposium,Feb. 5-7, 2002, East Brunswick, New Jersey, ed. B. Onken, R. Reardon, and J. Lashomb.Rutgers University, New Brunswick, New Jersey.
Northeast Regional Climate Center at Cornell University. Monthly summaries online athttp://met-www.cit.cornell.edu/nrcc-home.html.
Royle, D.D. and R.G. Lathrop. 2002. Using Landsat imagery to quantify temporal andspatial patterns in hemlock decline, pp. 67-72. In Proceedings of Hemlock WoollyAdelgid in the Eastern United States Symposium, Feb. 5-7, 2002, East Brunswick, NewJersey, ed. B. Onken, R. Reardon, and J. Lashomb.
Stoffer, P. 2003. Geology of the New York city region: a preliminary regional field-tripguidebook. U.S.Geological Survey. Online at http://3dparks.wr.usgs.gov/nyc/index.html.
Ward, R., M. Mayer, and R. Chianese. 1992. The effect of the hemlock woolly adelgid,Adelges tsugae (Homoptera:Adelgidae) in New Jersey forests. Annual Report 1992, NewJersey Department of Agriculture, Trenton, New Jersey.
Wharton, E.H., R.H. Widmann, C.L. Alerich, C.H. Barnett, J. Andrew, T.W. Lister, D.Smith, and F. Boorman. 2004. The forests of Connecticut. Resource Bulletin NE-160.USDA Forest service Northeastern Research Station. 35 p.
_______________________________ Overview of HWA Biological Control Activities with Laricobius spp.
Presentations Third Symposium on Hemlock Woolly Adelgid
131
OVERVIEW OF HWA BIOLOGICAL CONTROL ACTIVITIES WITH LARICOBIUS SPP.
S.M. Salom, L.T. Kok, B.M. Eisenback, J.G. Fidgen, R.W. Flowers, H.A.Gatton, A.B. Lamb, T.J. McAvoy, D.L. Mausel, and G. Zilahi-Balogh1
Department of Entomology, Virginia Tech,Blacksburg, VA 24061
1Greenhouse and Processing Crops Research Centre, Ag. Canada.Harrow, ONT N0R 1G0
CANADA
ABSTRACT
Laricobius nigrinus, a little known Derodontid beetle, is consistently found associated withhemlock woolly adelgid (HWA) in western hemlock seed orchards in British Columbia(Humble 1994). It turns out that Laricobius spp. are prey-specific predators of Adelgidae(Zilahi-Balogh 2004). In collaboration with Forestry Canada, we began studying the poten-tial of L. nigrinus as a biological control agent for HWA in the eastern U.S. Field studiesconducted in British Columbia showed that the phenology of the predator and the prey werehighly synchronized (Zilahi-Balogh et al. 2003):
1. Predator adults are present and active in the winter to feed on developing HWA sistens.2. Predator eggs are laid in HWA ovisacs, where hatching larvae feed on HWA eggs.3. Predator larvae drop from the tree into to the soil to pupate and eclose into adults,
where they aestivate at the same time and for the same duration as do HWA.4. The predator adults and HWA sistens emerge from aestivation at the same time.
Laricobius nigrinus adults and larvae both feed almost exclusively and survive only onHWA (Zilahi-Balogh et al. 2002), making them virtually risk free when released. In field-cages, L. nigrinus can survive the winter and significantly impact HWA sistens and progrediensdensities (Lamb et al. 2005). In these cages, egg densities increase when adult L. nigrinusfemales are added, but impact on HWA density does not (Lamb et al. unpublished data),suggesting optimal predator densities are fairly low.
Rearing this predator is challenging (Lamb et al., this issue), yet most issues have beenworked out. One of the last major hurdles has been to overcome the early emergence of adultpredators in the insectary. Without adequate food, mortality of emerging predators was veryhigh. Lamb et al. (unpublished data) determined that aestivating adults held at a relativelywarm temperature for this insect (19°C), followed by exposure to cooler temperatures (13°C),enables us to extend their dormant period until adequate food (i.e., developing HWA sistens)becomes available.
Third Symposium on Hemlock Woolly Adelgid Presentations
Salom et al. __________________________________________________________________________________
132
Beginning in 2003, L. nigrinus has been released in numerous sites ranging from Massa-chusetts to Georgia. David Mausel is studying the colonization, establishment, and spread ofthe predator (Mausel et al. this proceedings). He is also testing optimal release strategies thatcan be used on a large scale as more beetles become available.
Recovery of F1 and F2 beetles has already been obtained from some sites. One releasesite was a field insectary in Virginia Tech’s Kentland Farms. Established in 2001 (Kok andSalom 2002), this 0.4 ha plantation of young eastern hemlocks infested with HWA, a sitewhere 252 beetles were released in November, 2003. In January 2005, 25 F1 adults wererecovered from branches of release trees on a day when temperatures rose to as high as 18°C.
Other ongoing projects with L. nigrinus include an evaluation of potential competitiveinteractions involving Sasjiscymnus tsugae, and Harmonia axyridis in lab and field studies(Flowers et al. in this proceedings). We are also investigating the residual effects of imidaclopridtreatments for HWA on L. nigrinus and S. tsugae (Eisenback et al. in this proceedings).
Work with other Laricobius spp. include our foreign exploration efforts in China, wheretwo new species were discovered in 2002 (Gatton et al. 2004). Development, reproductivebiology, and host-range testing studies for one of these species, L. sp. n. kangdingensis isbeing carried out in quarantine (Gatton 2004). Our goal is to get this predator released fromquarantine and added to the complex of predators currently being released to control HWA.
REFERENCES
Gatton, H. 2004. A new species of Laricobius predator of hemlock woolly adelgid fromChina, p. 25. In Hemlock woolly Adelgid Biological Control Committee Meeting.Annapolis, Maryland, comp. R. Reardon and B. Onken. FHTET-2004-08. USDAForest Service, Morgantown, West Virginia.
Gatton, H.A., T.J. McAvoy, G. Zilahi-Balogh, L.T. Kok, and S.M. Salom. 2004. Summaryof foreign exploration efforts for the hemlock woolly adelgid at Virginia PolytechnicInstitute and State University, p. 32. In Hemlock woolly Adelgid Biological ControlCommittee Meeting. Annapolis, Maryland, comp. R. Reardon and B. Onken. FHTET-2004-08. USDA Forest Service, Morgantown, West Virginia.
Humble, L.H. 1994. Recovery of additional exotic predators of balsam woolly adelgid,Adelges piceae (Ratzeburg) (Homoptera: Adelgidae), in British Columbia. Can. Ent.126:1101-1103.
Lamb, A.B., S.M. Salom, and L.T. Kok. 2005. Survival and reproduction of Laricobiusnigrinus Fender (Coleoptera: Derodontidae), a predator of hemlock woolly adelgid,Adelges tsugae Annand (Homoptera: Adelgidae), in field cages. Biol. Control 32:200-207.
Zilahi-Balogh, G. 2004. Evaluating host range of Laricobius nigrinus for introduction intothe eastern United States for biological control of hemlock woolly adelgid, pp. 224-239.In Assessing Host Ranges for Parasitoids and Predators used for Classical BiologicalControl: A Guide to Best Practice, ed. R.G. Van Driesche and R. Reardon. FHTET-2004-03. USDA Forest Service, Morgantown, West Virginia.
_______________________________ Overview of HWA Biological Control Activities with Laricobius spp.
Presentations Third Symposium on Hemlock Woolly Adelgid
133
Zilahi-Balogh, G.M.G., L.T. Kok and S.M. Salom. 2002. Host specificity tests ofLaricobius nigrinus Fender (Coleoptera: Derodontidae), a biological control agent of thehemlock woolly adelgid, Adelges tsugae (Homoptera: Adelgidae). Biol. Control 24:192-198.
Zilahi-Balogh, G.M.G., L.M. Humble, A.B. Lamb, S.M. Salom, and L.T. Kok. 2003. Sea-sonal abundance and synchrony between Laricobius nigrinus (Coleoptera:Derodontidae) and its prey, the hemlock woolly adelgid (Homoptera: Adelgidae) inBritish Columbia. Can. Ent. 135:103-115.
Third Symposium on Hemlock Woolly Adelgid Presentations
Mausel et al. _________________________________________________________________________________
134
EXPERIMENTAL RELEASES OF LARICOBIUS NIGRINUS FOR BIOLOGICAL CONTROL
OF HEMLOCK WOOLLY ADELGID IN THE EASTERN U.S.
D.L. Mausel, S.M. Salom, and L.T. Kok
Virginia Tech, Department of Entomology, 217 Price Hall, Blacksburg, VA 24061
ABSTRACT
Laricobius nigrinus Fender (Coleoptera: Derodontidae) from the Pacific Northwest was re-leased for biological control of the Asian hemlock woolly adelgid (HWA), Adelges tsugaeAnnand (Hemiptera: Adelgidae) in the eastern U.S. To date, 7,350 adults have been releasedat 19 sites in eight states, from Massachusetts to Georgia. The emphasis is on small-scaleaccretive releases to determine whether such releases will result in establishment. There wereten releases in 2003-20004 and nine releases in 2004-2005 consisting of open release treat-ments of 75, 150, 300, and 1,200 adults in the fall/winter, 300 adults in the spring, and 300adults in the fall/winter and spring. Beetles were released at a density of 30, 35, 40, or 80beetles on either 2, 5, 10, or 15 trees depending on the release size. Sampling of L. nigrinus,HWA, and tree health will continue for three years post release. At each site, 30-cm branchsections were marked at the four cardinal points of release and control trees and % HWAinfested new shoots (i.e. presence/absence), amount of new shoot growth, and amount ofshoot dieback were recorded and re-measured annually. Live crown ratio, crown transpar-ency, crown vigor, tree profile photographs, and site characteristics were also recorded. Stan-dardized L. nigrinus sampling procedures included beat sheets in the fall/spring and hostcollection in the spring. In spring 2004, host collection was conducted in Tennessee andNorth Carolina to recover progeny of the release beetles. Three and 15 adults were rearedfrom Tennessee and North Carolina samples, respectively. In fall 2004, beat sheet samplingwas conducted at the 10 release sites from 2003/2004 and F1 adults were recovered in NorthCarolina (3) and Virginia (1).
_________________________________________ Classical Biological Control of Elongate Hemlock Scale
Presentations Third Symposium on Hemlock Woolly Adelgid
135
CLASSICAL BIOLOGICAL CONTROL OF THE ELONGATE HEMLOCK SCALE,FIORINIA EXTERNA: 2004 ACTIVITIES
Roy Van Driesche1, Richard Reardon2, Michael Montgomery3, RichardCowles4, Kris Abell1, Caroline Nunn1, Suzanne Lyon1, Naoto Kamata5, and
Wu-Sanan6
1PSIS, Division of Entomology, University of Massachusetts,Amherst, MA 01003
2USDA Forest Service, Forest Health Technology Enterprise Team,180 Canfield Street, Morgantown, WV 26505
3USDA Forest Service, Northeastern Research Station,Hamden, CT 06514
4Connecticut Agricultural Experiment Station, Valley Lab,Windsor, CT 06095
5Kanazawa University, Kanazawa,Ishikawa, Japan
6Beijing Forestry University,Beijing, People’s Republic of China
ABSTRACT
In 2004, a new project on classical biological control of a hemlock pest, Fiorinia externa Ferris(elongate hemlock scale) (Homoptera: Diaspididae), was funded by USDA-Forest Service(FHTET) with work centered at the University of Massachusetts/Amherst. The objectives ofthe project are to (1) assess current pattern of scale abundance, parasitism, and survival ineastern North America, (2) test the previously proposed hypothesis that host-parasitoidasynchrony accounts for low parasitism and high scale abundance in the northeastern U. S.,(3) locate, study, and import new species of parasitoids from Japan and perhaps China asclassical biological control agents, and (4) assess host ranges of new parasitoids, followed bytheir release and an evaluation of their impact on scale density. In 2004, a regional scale surveywas conducted, field sites with scale were located, a laboratory scale colony was established,and one trip to Japan made during which scale and parasitoids were found at three locations.
KEYWORDS
Elongate hemlock scale, Fiorinia externa, classical biological control, hemlock.
Third Symposium on Hemlock Woolly Adelgid Presentations
Van Driesche et al. ____________________________________________________________________________
136
INTRODUCTION
The elongate hemlock scale (EHS), Fiorinia externa Ferris, is an armored scale native to Japanthat was first recorded in North America on Long Island, New York, in 1908 (Ferris, 1942).Records of EHS exist from Georgia north through Virginia, Maryland, Pennsylvania, NewYork, New Jersey, Connecticut, Massachusetts, and Rhode Island, and west to Ohio (Scalenet2005). This scale feeds on a wide range of conifers, including species of hemlock, cedar, fir,pine spruce and yews (McClure 1977 and 1979). Scales are found only on the undersides ofneedles and crawlers settle principally on the new growth. Scale densities in the United Statesvary widely, but values from 21 to 164 scales per 100 needles have been reported (McClureand Fergione 1977, McClure 1978). It is possible to find sites with higher densities, but aver-age densities for hemlock stands selected at random have not otherwise been reported. InJapan, densities are much lower: on forest hemlocks, McClure (1986) noted densities as 0.0 to0.15 scales per 100 needles.
In Japan there is a “landscape” effect on scale density as scales are about 12- to 24-foldmore abundant (2.2-3.9/100 needles) on planted hemlocks in landscapes such as temples orparks than in forests (McClure, 1986). In Connecticut, this “landscape” effect either does notexist or is at most much weaker than in Japan, with EHS densities on planted hemlocks beingonly 1.1- to 4.2-fold higher than on forest hemlocks (McClure and Fergione 1977, McClure1978). Finally, data from Japan (McClure 1986) suggest that the species identity of hemlockaffects scale density very little. Scale density on the eastern North American hemlock Tsugacanadensis Carriere, planted in Japan, was 2.9 scales/100 needles, a value that was within therange of scale densities found on native Japanese hemlocks (2.2-3.9) planted in similar land-scape settings.
The life-stage phenologies of EHS and its principal parasitoid, Encarsia citrina(Crawford), in Connecticut and Japan were determined by McClure (1978 and 1986). In Ja-pan, there is good synchrony between second generation E. citrina adults and EHS secondinstar nymphs (the only stage in which the parasitoid oviposits). In Connecticut, synchronybetween these stages was poor. McClure hypothesized that this lack of synchrony in thesecond generation led to low or fluctuating levels of parasitism in Connecticut instead of theconsistently high (>90%) levels seen in Japan. McClure attributed this lack of synchrony toeffects of climate, which caused EHS in Connecticut to have less than two full generations peryear—in contrast to Japan, where there were two complete generations per year. By exten-sion, this hypothesis predicts better control of EHS south of Connecticut, where two fullgenerations per year occur.
DESCRIPTION OF PLANNED PROJECT
The first goal of this research is to determine if the predicted contrast between the northernand southern parts of the U.S. range of EHS is borne out (i.e., if EHS densities are lower andE. citrina parasitism higher in the middle Atlantic states vs. southern New England). Thesecond goal of our research is to study the parasitoids associated with EHS in Japan anddetermine 1) if the E. citrina in Japan is genetically different or not from the population inNew England and 2) determine if another parasitoid might be associated with EHS that ovi-
_________________________________________ Classical Biological Control of Elongate Hemlock Scale
Presentations Third Symposium on Hemlock Woolly Adelgid
137
posits in the adult female scale or perhaps in both the second stage female and the adult female(this would be desirable because the adult female is present for much longer and for parasi-toids attacking this stage, synchrony issues would be much less critical). In pursuit of such anadult-attacking parasitoid, we plan also to examine populations of Fiorinia japonica (Kuwana)in China to see if parasitoids associated with that species might also attack EHS, includingadult scales. To meet these broad goals, the following specific objectives were developed forthe project:
Obj. 1. Survey EHS density and parasitism from Maryland to Massachusetts.
Obj. 2. Match climates of the northeast U.S. to areas in Japan and China.
Obj. 3. Hire a collector to find Fiorinia species on conifers in northern Honshu orHokkaido.
Obj. 4. Ship dead Japanese parasitoids to the U.S. for preliminary identification; use mo-lecular tools to compare and distinguish between Japanese and U.S. populations ofEncarsia citrina.
Obj. 5. Hire a collector in China to locate potential Fiorinia-collection sites.
Obj. 6. Develop an EHS colony for use in Ansonia FS quarantine lab.
Obj. 7. Collect live parasitoids from Japan and/or China and ship them to quarantine.
Obj. 8. Assess the impact of parasitoids on EHS in Japan and China.
Obj. 9. Start quarantine colonies of all parasitoids recovered.
Obj. 10. Confirm identity of all parasitoids, estimate likely host ranges, submit petitionsfor releases, and initiate releases.
Obj. 11. Establish parasitoids at field sites in Connecticut and Massachusetts.
Obj. 12. Initiate the field assessment of impacts of introduced parasitoids.
INITIAL RESULTS (FOR 2004)
Work in 2004 addressed Objectives 1-6 only; no work was done on Objective 2. For Objec-tives 1, 3, 4, 5, and 6, we made the following progress:
Objective 1. Survey EHS density and parasitism from Maryland to Massachusetts. Eightpotential EHS survey areas (Figure 1) were identified, four coastal and four inland, stretch-ing from Massachusetts (42 to 42.5 NL) to Maryland-West Virginia (39-39.5 NL). Dur-ing the survey, hemlock was not found in two of the four coastal zones that we sampled(1: the mid-New Jersey area, and 2: the southern New Jersey-Baltimore, Maryland area).This left six survey regions from which data were collected. These zones were visited inspring of 2004 (April and May) before new hemlock branch growth occurred. Samples forscale density and parasitism were thus based exclusively on needles formed in spring of2003. Since scales do not fall off needles, a count of scales in early spring of 2004 beforenew needles were formed provided a summary of the total numbers of scale crawlers thatsettled in 2003 and how many scales died of parasitism, summed over all scale generationsin 2003.
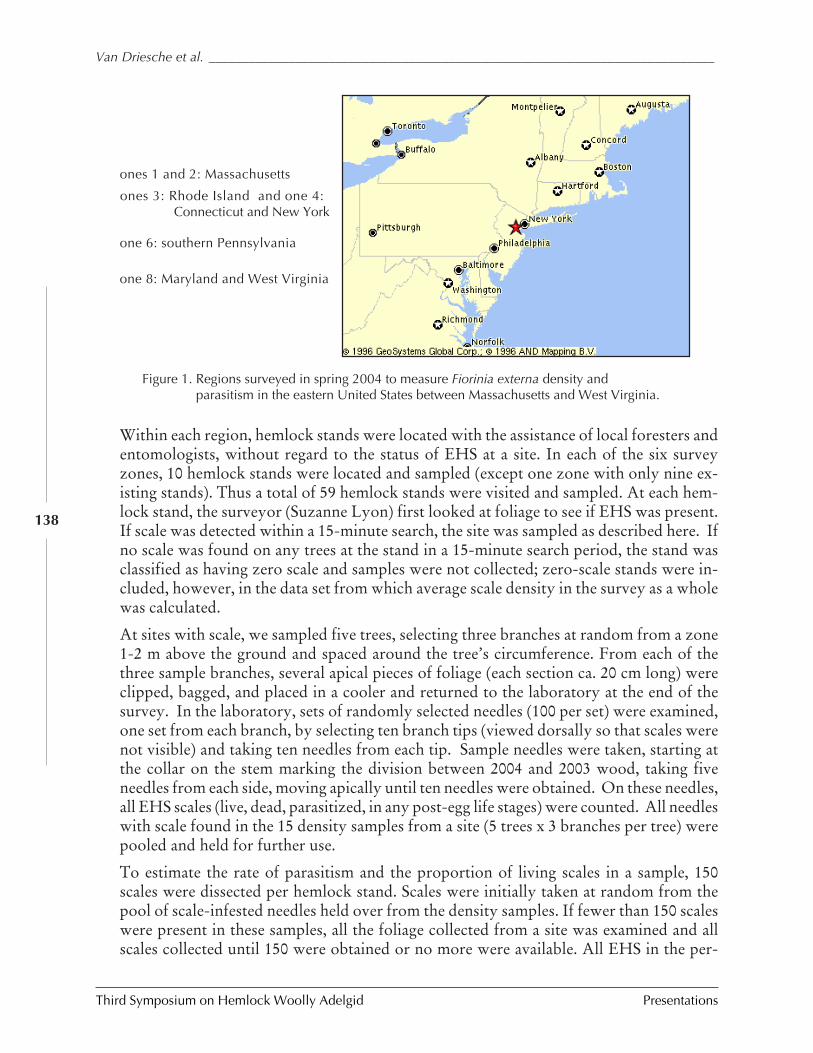
Third Symposium on Hemlock Woolly Adelgid Presentations
Van Driesche et al. ____________________________________________________________________________
138
Within each region, hemlock stands were located with the assistance of local foresters andentomologists, without regard to the status of EHS at a site. In each of the six surveyzones, 10 hemlock stands were located and sampled (except one zone with only nine ex-isting stands). Thus a total of 59 hemlock stands were visited and sampled. At each hem-lock stand, the surveyor (Suzanne Lyon) first looked at foliage to see if EHS was present.If scale was detected within a 15-minute search, the site was sampled as described here. Ifno scale was found on any trees at the stand in a 15-minute search period, the stand wasclassified as having zero scale and samples were not collected; zero-scale stands were in-cluded, however, in the data set from which average scale density in the survey as a wholewas calculated.
At sites with scale, we sampled five trees, selecting three branches at random from a zone1-2 m above the ground and spaced around the tree’s circumference. From each of thethree sample branches, several apical pieces of foliage (each section ca. 20 cm long) wereclipped, bagged, and placed in a cooler and returned to the laboratory at the end of thesurvey. In the laboratory, sets of randomly selected needles (100 per set) were examined,one set from each branch, by selecting ten branch tips (viewed dorsally so that scales werenot visible) and taking ten needles from each tip. Sample needles were taken, starting atthe collar on the stem marking the division between 2004 and 2003 wood, taking fiveneedles from each side, moving apically until ten needles were obtained. On these needles,all EHS scales (live, dead, parasitized, in any post-egg life stages) were counted. All needleswith scale found in the 15 density samples from a site (5 trees x 3 branches per tree) werepooled and held for further use.
To estimate the rate of parasitism and the proportion of living scales in a sample, 150scales were dissected per hemlock stand. Scales were initially taken at random from thepool of scale-infested needles held over from the density samples. If fewer than 150 scaleswere present in these samples, all the foliage collected from a site was examined and allscales collected until 150 were obtained or no more were available. All EHS in the per-
Figure 1. Regions surveyed in spring 2004 to measure Fiorinia externa density andparasitism in the eastern United States between Massachusetts and West Virginia.
ones 1 and 2: Massachusetts
ones 3: Rhode Island and one 4:Connecticut and New York
one 6: southern Pennsylvania
one 8: Maryland and West Virginia
_________________________________________ Classical Biological Control of Elongate Hemlock Scale
Presentations Third Symposium on Hemlock Woolly Adelgid
139
centage-parasitism samples were dissected and were classified as parasitized if a parasitoidexit hole was found, if a parasitoid pupa was present, or if upon dissection of the scalebody a parasitoid egg or larva was detected.
The number of scales per 100 needles across all 59 hemlock stands sampled was deter-mined by averaging scale numbers over all branches in the study, including three zero-density branches credited for each zero-scale site. The average percentage-parasitism andpercentage-live scale (in samples of 150 scales per hemlock stand) over all 59 stands wascalculated. All three parameters were then graphed versus collection site latitude (Figure2).
Scale density per 100 needles was highest in inland Connecticut (at 46.5 scales per 100needles), dropping to 0.0 scales in samples taken from sites further north (in Massachu-setts) and from 0.7 (Pennsylvania) to 5.3 (Maryland + West Virginia) at sites further south.In Connecticut and Massachusetts, scale density was negligible at coastal sites (0 to 0.4).In Pennsylvania and Maryland-West Virginia, hemlocks were not found at coastal sites.
Parasitism rates were generally low, averaging 9.5% across all 59 sites. Parasitism wasgreatest (14%) at coastal Connecticut sites and lowest at inland Pennsylvania sites (4%).Because no EHS scales were found in samples in Massachusetts, it was not possible toestimate parasitism rates.
The percentage of live scales was greatest in the southern part of the sampled range (42%,Maryland + West Virginia; 38%, Pennsylvania) and decreased to 27-28% in New York-Connecticut-Massachusetts. One site in Connecticut (Tunxis State Forest) sampled onMay 29, 2004, had only 4.4% live scale.
Objective 3. Hire collector to find Fiorinia species on conifers in northern Honshu orHokkaido. Naoto Kamata was hired to conduct surveys in Japan for EHS. In August of2004, assistants provided by Dr. Kamata accompanied Suzanne Lyon, who visited sites inthe Nagano Prefecture (Mt. Manza, Mt. Shirane, Kamikochi, the Norikura Kogen High-lands, and Mt. Kiso Koma) to look for hemlocks and EHS. Hemlocks infested with EHSwere found at three sites: Kamikochi, the Norikura Kogen Highlands, and Mt. Kiso. Scaledensity was extremely low at all sites. Counts were not made, but only two to three scaleswere found per tree when small trees were entirely searched. The most promising sitevisited was Mt. Kiso. Scales were found on Tsuga diversifolia Masters at 1,400-1,700-melevation and held for rearing. Of the approximately 30 EHS collected, five adult parasi-toids were obtained and are being held for taxonomic identification and molecular com-parison with parasitoids reared from EHS in Connecticut and Massachusetts. It is verylikely that other parasitoids died during rearing if they were younger than the pupal stagewhen the hemlock needles were picked, which kills the host scale. Sampling in March orNovember would likely give a better estimate of the true rate of parasitism.
Objective 4. Ship dead Japanese parasitoids to the U.S. for preliminary identification;use molecular tools to compare and distinguish Japanese and U.S. populations ofEncarsia citrina. Five parasitoid adults were reared from the approximately 30 elongatehemlock scales collected in the August, 2004, trip, suggesting a minimum of 16% parasit-ism. These parasitoids are currently at the University of Massachusetts-Amherst in 100%
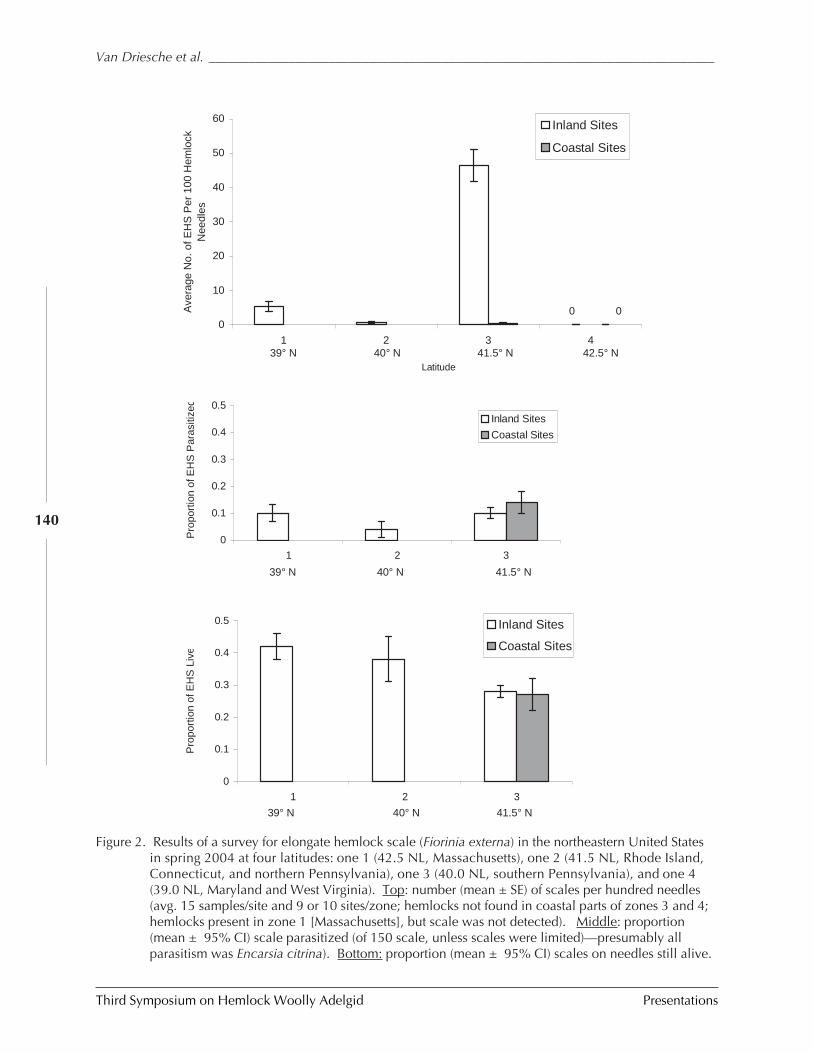
Third Symposium on Hemlock Woolly Adelgid Presentations
Van Driesche et al. ____________________________________________________________________________
140
0
0
10
20
30
40
50
60
1 2 3 4
Latitude
Ave
rage
No.
of E
HS
Per
100
Hem
lock
N
eedl
es
Inland Sites
Coastal Sites
0 0
39° N 40° N 41.5° N 42.5° N
0
0.1
0.2
0.3
0.4
0.5
1 2 3
Pro
port
ion
of E
HS
Par
asiti
zed
Inland Sites
Coastal Sites
39° N 40° N 41.5° N
0
0.1
0.2
0.3
0.4
0.5
1 2 3
Pro
port
ion
of E
HS
Liv
e
Inland Sites
Coastal Sites
39° N 40° N 41.5° N
Figure 2. Results of a survey for elongate hemlock scale (Fiorinia externa) in the northeastern United Statesin spring 2004 at four latitudes: one 1 (42.5 NL, Massachusetts), one 2 (41.5 NL, Rhode Island,Connecticut, and northern Pennsylvania), one 3 (40.0 NL, southern Pennsylvania), and one 4(39.0 NL, Maryland and West Virginia). Top: number (mean ± SE) of scales per hundred needles(avg. 15 samples/site and 9 or 10 sites/zone; hemlocks not found in coastal parts of zones 3 and 4;hemlocks present in zone 1 [Massachusetts], but scale was not detected). Middle: proportion(mean ± 95% CI) scale parasitized (of 150 scale, unless scales were limited)—presumably allparasitism was Encarsia citrina). Bottom: proportion (mean ± 95% CI) scales on needles still alive.
_________________________________________ Classical Biological Control of Elongate Hemlock Scale
Presentations Third Symposium on Hemlock Woolly Adelgid
141
alcohol and will be used when more specimens are available for identification and mo-lecular comparisons.
Also, in support of eventual importation to quarantine of live parasitoids from Japan, weapplied for and received a permit to import live Fiorinia spp. scale and its parasitoids fromJapan and China into quarantine. This permit is being held by Kathleen Shields at theAnsonia quarantine laboratory and is ready for use when needed.
Objective 5. Hire a collector in China to locate potential Fiorinia collection sites. Theoccurrence of EHS in China is uncertain as the few existing records may bemisidentifications. Consequently, Dr. Wu Sanan of the Beijing Forestry University (ascale taxonomist), the collector hired to search for EHS in China, searched in two ways.One search was based on looking for EHS on hemlocks in parks, temples, or other suchsites where hemlock are sometimes planted, as scales at such locations are often muchmore abundant than on the same tree species in natural settings. This approach was car-ried out in six locations, including Chengdu Botanical garden (Chengdu City, SichuanProvince), the campus of Sichuan University (Chengdu City), the campus of the SichuanAgricultural University (Ya’an City, Sichuan Province), Qichengshan Forestry Park(Dujiangyan City, Sichuan Province), the Dendrological Garden at the Sichuan ForestrySchool (Dujiangyan City, Sichuan Province), and the Jiuzaigou Forestry Park (JiuzaigouCounty, Sichuan Province). Specimens of Tsuga (hemlock) were found only at the lasttwo sites, and no EHS were detected at either site.
The other approach was to find populations of a related scale, Fiorinia japonica. Threesites were examined: (1) Beijing, (2) Zhengzhou City (Henan Province), and (3) YanglingCity (Shaanxi Province). At the first site, in a July 25, 2004 collection, about 5% of thescale from Cedrus deodara (Roxb.) G. Don. had parasitoid emergence holes. At the sec-ond site, no evidence of parasitism was found. At the third site (Yangling City), a highdensity population of F. japonica was found on Picea asperata Mast. Parasitoids were notreared from the collected scale but a few did have parasitoid emergence holes.
Objective 6. Develop an EHS colony for use in Ansonia FS quarantine lab. To set up alaboratory colony of parasitoid-free EHS on small plants, we tried several approaches in2004. First we dug small EHS-infested hemlocks (25-50 cm) in Tunxis State Forest inConnecticut, a site that had high densities of EHS. Efforts to transfer crawlers to new,non-infested hemlock seedlings (dug in Westhampton, Massachusetts) were made in threeways. First, we tried tying the foliage of infested seedlings from Connecticut loosely tothat of clean seedlings so that crawlers would move over onto the clean trees. Some did,but most settled on their natal branches. In a second attempt, we used EHS-infested firbranches from a Christmas tree plantation in southwest Connecticut. We tried tyingthese branches very closely to young hemlock. We also tried placing infested needles inpaper cones (about 1 inch deep), which were pinned to branches. We assumed crawlerswould crawl up the paper cone onto foliage. We thought this would solve the problem ofcrawlers settling too soon. However, both of these attempts failed because (1) crawlerssettling on the hemlock were scarce and (2) mites and thrips from the field material werenumerous and the hemlocks were contaminated by these arthropods. A fourth attempt is
Third Symposium on Hemlock Woolly Adelgid Presentations
Van Driesche et al. ____________________________________________________________________________
142
currently underway that, while more laborious, is expected to work. Individual femalescales with eggs present will be removed from infested foliage and glued onto foliage offraser fir (about 25 cm tall), which is an excellent host for EHS and shaped to fit well insmall cages.
PLANS FOR 2005
Objective 1. Survey EHS density and parasitism in the eastern United States. While our2004 results partially support the McClure hypothesis (scale density was lower in thesouthern regions, but parasitism was not higher), the survey needs to be repeated in 2005at new sites and extended further south. We plan to repeat such a survey in March-May of2005 covering a region from northern GA to Massachusetts.
Objective 2. Match climates in the northeast U.S. to areas in Japan and China. We needto compare northern Honshu and Hokkaido to Connecticut-Massachusetts to see howimportant it might be to get parasitoids from Hokkaido. Finding EHS in Hokkaido willrequire finding it on some non-hemlock host, as hemlocks do not occur on that island.Mike Montgomery and Roy Van Driesche will work together with Kris Abell, the gradu-ate student, to make these comparisons.
Objectives 3 and 4. Collect Fiorinia species on conifers in northern Honshu or Hokkaido.Suzanne Lyon and Kris Abell will work with Naoto Kamata to collect more EHS fromknown sites in Honshu and to find new EHS populations further north. Rearing anddissection of scales from these collections will provide parasitoid adults for taxonomicidentification and, through the dissections, information on what host stages each parasi-toid species attacks. Encarsia citrina specimens will be used for DNA work to determineif they differ from their counterparts already present in the United States. Live specimensof all species will be shipped to the United States to initiate rearing colonies in U.S. quar-antine.
Objective 5. Collect parasitoids from other Fiorinia species in China. Dr. Wu-Sanan willcontinue to collect parasitoids from F. japonica and determine if these are different speciesfrom those found in Japan on F. externa. Material from China will be shipped as parasit-ized scales to the U.S. quarantine laboratory in Connecticut to establish parasitoid colo-nies for study. Dr. Wu-Sanan will search for F. externa on Abies or Cephalotaxus species.
Objective 6. Develop an EHS colony for use in the Ansonia FS quarantine lab. We willtransfer EHS eggs inside female scale covers onto small (20 cm), pesticide-free Fraser fir(greenhouse grown stock from a Connecticut nursery). This species is an excellent hostfor EHS. These small potted fir trees will be infested by gluing scales with eggs onto firneedles. Scales will be collected by searching foliage of EHS-infested hemlock branchescut from trees at field sites in Connecticut.
_________________________________________ Classical Biological Control of Elongate Hemlock Scale
Presentations Third Symposium on Hemlock Woolly Adelgid
143
DISCUSSION
There are two central questions to answer about a proposed classical biological control pro-gram against elongate hemlock scale: (1) Is it possible? and (2) Is it worth doing? We havebegun to answer the second question by surveys aimed at establishing the average density ofthe scale throughout the infested range. In the 2004 survey, elongate hemlock scale was foundat high densities primarily in Connecticut. However, heavily infested sites certainly do existin other states. Dense infestations in the city of Philadelphia in the 1990s were observed byone of the authors (Michael Montgomery), which were believed to have caused a generaldecline of hemlock in the city. Such high density patches may be of local importance. Furthersurvey work is still needed to determine if the picture that emerged in our 2004 survey isvalid. Another concern relative to the importance of this pest is whether it acts synergisticallywith hemlock woolly adelgid (Adelges tsugae Annanad). While it is possible to find these twoinsects sometimes infesting the same trees, it is not clear at this time if one predisposes the treeto build up in density of the other. Separate Forest Service-funded research on this point isunderway by Joe Elkinton of the University of Massachusetts (see Paradis and Elkinton inthis volume).
As to the second question of whether or not classical biological control of EHS is fea-sible, prospects seem good. Many species of armored scales have been successfully controlledby introduction of parasitoids from their native ranges. Data from Japan show EHS there tobe at vastly lower density than in Connecticut and show that the change in hemlock speciesbetween countries is not sufficient to explain this increase in density. Sheared specimens ofthe Japanese hemlock T. diversifolia in Connecticut have been observed to become heavilyinfested with elongate hemlock scale (Michael Montgomery, pers. obs.).
Two options are immediately apparent that need to be investigated. First, E. citrina inJapan may not be the same species as that name is applied to in the United States. Crypticspecies have frequently been discovered in the past when separate populations of seeminglycosmopolitan species of parasitoids are closely compared. Use of molecular tools now makessuch comparisons quicker and more robust. However, even if the U. S. and Japanese E.citrina populations are found to be the same, another option exists: to import new species ofparasitoids. Of greatest interest would be any species able to attack adult female scales, whichcurrently are not attacked in the United States by any parasitoid species. Since this life stageis present for the greatest length of time in the field, a parasitoid attacking it would have fewor no problems from a failure of synchrony between parasitoid adults and vulnerable scalestages.
Further work will be required to determine the true importance of this pest and to findthe parasitoids associated with it in Japan. However, this effort integrates well with efforts tofind additional hemlock woolly adelgid predators in Japan and so the cost of pursuing a projectagainst this pest is somewhat reduced by the overlapping needs of the two projects.
Third Symposium on Hemlock Woolly Adelgid Presentations
Van Driesche et al. ____________________________________________________________________________
144
ACKNOWLEDGMENT
We thank the US Forest Service-FHTET for financial support for this project. We thankvarious foresters and others for help in locating hemlock stands. We thank the Tunxis StateForest managers and the Jones Family Farm, Shelton, Connecticut, for access to plant mate-rial.
REFERENCES
Ferris, G.F. 1942. Atlas of the scale insects of North America. Stanford University, Califor-nia.
McClure, M.S. 1977. Ecology and control of Fiorinia externa Ferris (Homoptera:Diaspididae) on eastern hemlock. Journal of the New York Entomological Society 85:187-188.
McClure, M.S. 1978. Seasonal development of Fiorinia externa, Tsugaspidiotus tsugae(Homoptera: Diaspididae), and their parasite, Aspidiotiphagus citrinus (Hymenoptera:Aphelinidae): Importance of parasite-host synchronism to the population dynamics oftwo scale pests of hemlock. Environmental Entomology 7:863-870.
McClure, M.S. 1979. Self-regulation in populations of the elongate hemlock scale, Fioriniaexterna (Homoptera: Diaspididae). Oecologia 39:25-36.
McClure, M.S. 1986. Population dynamics of Japanese hemlock scales: a comparison ofendemic and exotic communities. Ecology 67:1411-1421.
McClure, M.S. and M.B. Fergione. 1977. Fiorinia externa and Tsugaspidiotus tsugae(Homoptera: Diaspididae): distribution, abundance, and new host of two destructiveinsects of eastern hemlock in Connecticut. Environmental Entomology 6:807-811.
Scalenet. 2005. http://198.77.169.79/atalogs/diaspidi/Fioriniaexterna.htm (last accessedJanuary 12, 2005).
______________________ Elongate Hemlock Scale and its Natural Enemies in the Southern Appalachians
Presentations Third Symposium on Hemlock Woolly Adelgid
145
ELONGATE HEMLOCK SCALE AND ITS NATURAL ENEMIES INTHE SOUTHERN APPALACHIANS
P.L. Lambdin1, C. Lynch1, J.F. Grant1, R. Reardon2, B. Onken3, R. Rhea4
1Department of Entomology, University of Tennessee,Knoxville, TN 37996
2USDA Forest Service, Forest Health Technology Enterprise Team,180 Canfield Street, Morgantown, WV 26505
3USDA Forest Service, Northeastern Area Forest Health Protection,180 Canfield Street, Morgantown, WV 26505
4USDA Forest Service, Forest Health Protection,200 Weaver Boulevard, Asheville, NC 28804
ABSTRACT
The development and distribution of the elongate hemlock scale, Fiorinia externa, and itsnatural enemies on eastern hemlock, Tsuga canadensis, were evaluated from forest and urbansites established in eastern Tennessee and western North Carolina. This species is wide-spread throughout the area and has two overlapping generations annually. A heavy infesta-tion level ranging from 3.7 to 4 on a scale of 0 to 4 was found on eastern hemlocks at four sites.The density of F. externa ranged from 2.6 to 7.0 individuals per needle.
The hymenopteran parasitoid, Encarsia citrina, parasitized the elongate hemlock scaleat all sites. Parasitism rates were variable among the forest and urban sites. Parasitism at theurban sites ranged from 17.9% to 41.3%, while the rate at the forest sites ranged from 20% to23.9% over the season. Eight predators (neuropterans Coniopteryx sp. and Hemerobius stigmaand the coccinellids Chilocorus stigma, Harmonia axyridis, Rhyzobius lophanthae, Scymnillushorni, and two unidentified lady beetle species) were collected and evaluated in feeding be-havior, survival, development, and reproduction tests using various densities of the elongatehemlock scale.
KEYWORDS
Elongate hemlock scale, eastern hemlock, biological control, Fiorinia externa.
INTRODUCTION
The Southern Appalachian ecosystem represents a sensitive forest system currently sig-nificantly impacted by invasions of exotic insect pests. This region includes some of thelargest remaining remnants of eastern hemlock, Tsuga canadensis (L.) Carriere, in the world
Third Symposium on Hemlock Woolly Adelgid Presentations
Lambdin et al. ________________________________________________________________________________
146
with about 3,820 ha located within the Great Smoky Mountains National Park (GRSM) inTennessee and North Carolina. The exotic hemlock woolly adelgid, Adelges tsugae Annand,is a pernicious pest causing destruction to eastern hemlocks throughout the eastern U.S. andnow threatens the eastern hemlocks in eastern Tennessee and western North Carolina. Also,the exotic elongate hemlock scale (EHS), Fiorinia externa Ferris, has become a significant pestof eastern hemlock in several areas, often co-existing with the hemlock woolly adelgid (McClure1980b). EHS was first described in 1942 (Ferris 1942) from material collected earlier in Balti-more, Maryland, and Queens, New York (Davidson and McComb 1958, Takagi 1963, Talericoet al. 1967). This exotic species is now established in 14 states throughout the eastern U.S. aswell as Canada, Asia, and Europe. EHS was recently discovered infesting eastern hemlocksin the GRSM and in Knox Co., Tennessee (Buck 2004). The host range of EHS includesspecies of Abies, Cedrus, Picea, Pinus, Pseudotsuga, Taxus, and Tsuga, with the latter taxacontaining common hosts of EHS in the eastern U.S. (Kosztarab 1996, McClure and Fergione1977). Although scale insect populations normally occur at low levels, changes in conditionsand management practices that impact the natural enemy complex often enhance populationoutbreaks (Rebek and Sadof 2003, Sheffer and Williams 1987). EHS are small, cryptic scaleinsects capable of inflicting substantial damage to the host tree resulting in loss of plant vigor,dieback, needle drop, or death. Its waxy covering allows EHS to maintain a favorable humid-ity level, prevents rapid temperature changes, and functions as a protective barrier againstchemical applications and natural enemies (Lambdin 2004).
The majority of information on the seasonal development of EHS and the impact ofbeneficial control agents was developed for populations in the northeastern U.S. (McClure1977b, 1978b, and 1981). Several differences exist in the recorded information on EHS for thenorthern states compared to more southern distribution regarding their overwintering hab-its, number of generations annually, synchrony of parasitoid to host, and degree of parasit-ism. EHS is reported to have only one complete generation annually in Connecticut (McClure1980b and 1981), although an occasional partial generation is reported to occur in warmeryears (McClure 1978b and 1980b). However, it has two generations annually in Maryland(Davidson and McComb 1958) and Virginia (Kosztarab 1996). This scale insect is reported tooverwinter as immatures, adult females, eggs, or in all stages (Kosztarab 1996, McClure 1977band 1978b, Stimmel 1980). McClure (1977b) reported that EHS overwintered in the egg stageand later (McClure 1978a, Kosztarab 1996) as eggs and fertilized adult females. Also, McClure(1980b) noted that EHS was able to out-compete Nuculaspis tsugae (Marlatt), a second exoticspecies occurring on eastern hemlock in Connecticut. However, in Tennessee, N. tsugae hasnot been reported, but the native hemlock scale, Abgrallaspis ithacae (Ferris), has been docu-mented on the needles of eastern hemlock (Lambdin and Watson 1980), and is commonlyfound throughout the region. While nitrogen fertilization of hemlock trees enhanced EHSpopulation size (McClure 1977a, 1980a), the survival, development rate, and fecundity ofEHS were reported to be negatively correlated to an increase in population size (McClure1979b, 1980a, and 1980b). Control of EHS by insecticides or insecticidal soaps is limited toareas accessible to equipment required for application. Also, chemical applications that didnot completely cover the tree were found to result in a resurgence of the EHS, which had aresulting faster developmental and fecundity rate than on unsprayed trees (McClure 1977a).
______________________ Elongate Hemlock Scale and its Natural Enemies in the Southern Appalachians
Presentations Third Symposium on Hemlock Woolly Adelgid
147
NATURAL ENEMIES
Biological control is a proven tool for managing certain species of herbivorous pests. How-ever, a limited understanding of invasive pests and their natural enemy complex often hindersour ability to use them effectively. Recorded beneficials impacting populations of EHS in-clude the parasitoids: Encarsia citrina (Craw), Aphytis aonidiae (Mercet), and Prospaltella sp.;and as predators: the mirids, Atractotomus magnicornis buenoi Drake and Phytocorus sp., aconiopterygid, Conwentzia pineticola Enderlein, and coccinellids Chilocorus stigma (Say) andC. kuwanae Silvestri (Davidson and McComb 1958, McClure 1979a and 1979b). The parasi-toid E. citrina was reported to reduce populations of EHS up to 72% in Connecticut forests(McClure 1978a, 1978b, 1981, and 2003). When EHS and N. tsugae co-existed on the samehost plant, McClure (1981) reported EHS out-competes its competitor by increasing theirdensity and by a host shift by E. citrina that parasitizes N. tsugae. Also, the combination ofparasitoids of E. citrina and A. aonidiae were reported to provide up to 96% control of EHSwhere two generations annually occur (McClure 1978a, 1979a, 1986) to only 2-55% parasit-ism in Connecticut and New York where only one generation per year occurs. Also, C.kuwanae, an egg predator of Unaspis euonymi (Comstock) recently introduced from Asiaand successfully established in several parts of the U.S. (Drea and Hendrickson 1988, Lambdin1995, Nalepa 1992, Van Driesche et al. 1998), is reported to feed on EHS.
OBJECTIVES
The objectives of this project were: (1) assess the densities, distribution, and development ofEHS populations on eastern hemlock in forest and urban areas, and (2) identify and assessintroduced and established natural enemies of EHS.
METHODOLOGY
OBJECTIVE 1
EHS-infested eastern hemlock trees at forest and urban sites in eastern Tennessee and Asheville,North Carolina were sampled monthly from June to December, 2004. Sites were selectedwith assistance from Rusty Rhea (USDA Forest Service, Asheville, North Carolina), BillHascher (Biltmore Estates, Asheville, North Carolina), and Charles Limebarger (Director,Lynnhurst Cemetery, Knoxville, Tennessee). In eastern Tennessee, one urban site at LynnhurstCemetery in Knoxville consisted of over 362 EHS-infested trees. In western North Carolina,one urban site was located on the grounds at the USDA Forest Service Headquarters and oneurban and one forest site was located at the Biltmore Estates in Asheville. An infestationrating for EHS (0 = none, 1 = sporadic [1-3 limbs], 2 = light [4-6 limbs], 3 = moderate [7-10limbs], and 4 = heavy [11+ limbs]) on eastern hemlock was conducted for each tree sampled.At the Lynnhurst and Biltmore forest and urban sites, infested trees were divided into fourblocks, each consisting of ca. 50 trees, while the site at the USDA Forest Service Headquartersin Asheville, North Carolina, consisted of three heavily-infested trees. To assess density anddevelopment of EHS at each site, four branch samples (15-20 cm long, representing each
Third Symposium on Hemlock Woolly Adelgid Presentations
Lambdin et al. ________________________________________________________________________________
148
cardinal direction) were taken monthly from each of three trees per block, placed into plasticbags, labeled, and taken to the laboratory and processed. Data were recorded from 100 needles(50 from new growth and 50 from old growth) per cardinal direction for each tree per blockthat included stage of development, number of live and dead specimens per stage, and loca-tion on new or old growth needles.
To determine development time and number of generations of EHS, specimens from 12branch samples (15-20 cm long) (one sample per tree per site) were removed every three tofive days throughout the development period for each generation and monthly during theover-wintering period. Specimens were observed under a stereoscope, and data recorded fordate, tree, block, site, number of specimens per stage, mortality per stage, and fecundity, andentered into Excel files for statistical analysis.
OBJECTIVE 2
Parasitoids were obtained and identified from collections of EHS on 100 needles from each offour branch samples (15-20 cm long from each of the four cardinal directions) from threetrees in four blocks at each site, taken to the laboratory, and observed with a stereoscope todetermine the number of live and dead parasitoids of male and female EHS. Parasitoid exitholes on the dorsum of the EHS were counted as an indicator of successful parasitoid emer-gence. From the remaining samples, 100 randomly selected EHS specimens from each sitewere processed, cleared in Essigs Aphid Fluid, mounted on slides, and examined for parasi-toids. Also, two samples per tree (30 cm long) for five trees from five blocks per site werecollected, taken to the laboratory, and placed into Plexiglas emergence cages to capture emergingparasitoids to establish the number of emerging parasitoids for each tree per site. Selectednewly-emerged parasitoids were processed and observed using an electron microscope toevaluate morphological structures to identify the species. Data recorded included: numberand date of emergence, parasitism rates per tree per block per site, seasonality numbers, andpercent survivorship of parasitoids. Analysis of variance was performed to assess differencesamong trees and sites for numbers of EHS and parasitoids obtained, number of parasitoidsemerging per host, development period, and survivorship of parasitoids from lab tests.
Established predators were obtained from four beat sheet samples from three trees atfive blocks per site. Direct observations (at least one hour per site on each sampling date) ofthe foliage were conducted to determine predators associated with EHS. Predators collectedwere returned to the laboratory and maintained in 3.8L glass jars with moistened filter paperinserted to maintain humidity and ventilated by lids covered with polyester mesh. EHS-in-fested cuttings were placed in Floralife® floral-foam blocks (from Hummert International)with the base wrapped in Parafilm. These species will be evaluated in the future for predatorycapabilities against EHS.
RESULTS
From May through December, 2004, 724 samples representing 168,253 EHS specimens onover 64,620 needles were collected to assess the density and distribution of EHS and searchfor potential biological control agents.
______________________ Elongate Hemlock Scale and its Natural Enemies in the Southern Appalachians
Presentations Third Symposium on Hemlock Woolly Adelgid
149
EHS BIOLOGY AND DEVELOPMENT
EHS has two complete overlapping generations per year at sites within the southern Appala-chians. The spring peak for crawler emergence occurred in June, while the fall peak occurredin late October into November. Fall peak emergence for males occurred in August, coinci-dent to the highest number of adult females. Gravid adult females were most numerous inlate May and October-November. In this dimorphic species, females have three stages ofdevelopment, while males have additional prepupal and pupal stages. Each female produced12-16 eggs, which hatched over time.
Crawlers settled on the underside of needles on either side of the mid-vein. They tendedto settle under the linear waxy filament produced by the needle to protect the stomates, whichcontinued to develop over the dorsum of the immatures, disrupting the outline of their bod-ies. Crawlers insert their stylets into the stomata to extract nutrients from the needle. Upondeveloping into the second instar stage, both male and female lose their legs and eyes, and theantennae are reduced to one-segment. Females produce a grayish-brown waxy covering ortest, while males produce a white test with parallel sides. Upon ecdysis, the adult femaleretains the exuviae of the second instar and continues development within this pupillarialcasing. Males complete their prepupal and pupal stages within the test produced during theirsecond stage. Upon maturity, winged adult males back out of their test through a flap locatedon the posterior end of the test. Males do not feed and live only 24 to 72 hours upon emer-gence. Although capable of flight, males tend to walk across the needles seeking out femalesfor mating.
EHS POPULATION DENSITY
EHS infestation rating on host trees at the study sites ranged from 3.7 at the Lynnhurst urbansite to 4.0 at the other three sites implying a well-established, heavy population. Several of thetrees are exhibiting dieback and a few have died from these heavy infestations. While as manyas 12 specimens were observed on EHS-infested needles, only 2.5 to 7 specimens survived tomaturity. Data from samples evaluated from the four cardinal directions of the host trees atthe four sites were variable depending upon site. However, the lowest numbers of EHS persite generally occurred on the northern side of the host tree, while the highest numbers oc-curred on the western side (Figure 1).
EHS NATURAL ENEMIES
Encarsia citrina was the only parasitoid of EHS recovered and represents the first documen-tation of this species in Tennessee. Newly-emerged specimens were processed and observedusing an electron microscope. This endoparasitoid was widely distributed in both urban andforest sites in eastern Tennessee and western North Carolina. Parasite emergence holes weredocumented on male and female host tests, although the former represented less than 1% ofthe parasitism rate. In field samples, the parasitism rate was highly variable at the varioussites. Successful emergence of parasitoids as evidenced by exit holes in the host at the threeurban sites ranged from 16 to 33%, while the rates at the forest site ranged from 20 to 22%throughout the observation period (Figure 2). An additional 2.0, 6.5, and 8.3% of the hosts atthe USDA Forest Service, Biltmore Estate urban, and Lynnhurst urban sites, respectively,
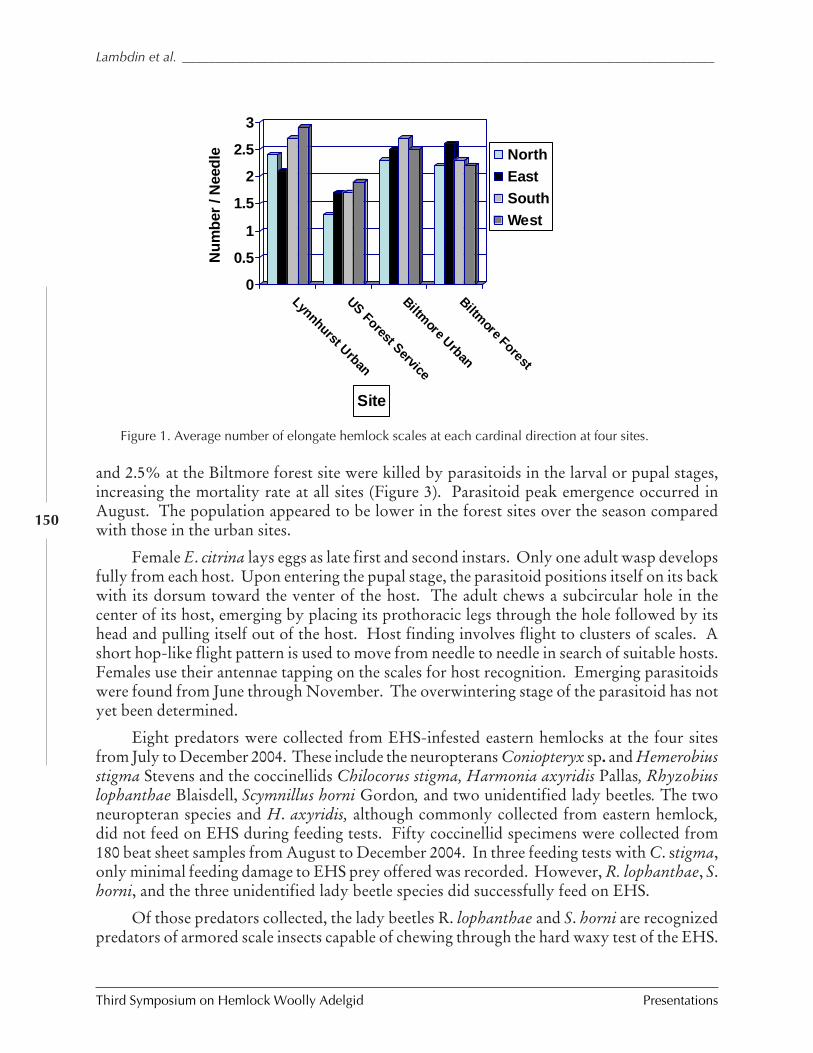
Third Symposium on Hemlock Woolly Adelgid Presentations
Lambdin et al. ________________________________________________________________________________
150
and 2.5% at the Biltmore forest site were killed by parasitoids in the larval or pupal stages,increasing the mortality rate at all sites (Figure 3). Parasitoid peak emergence occurred inAugust. The population appeared to be lower in the forest sites over the season comparedwith those in the urban sites.
Female E. citrina lays eggs as late first and second instars. Only one adult wasp developsfully from each host. Upon entering the pupal stage, the parasitoid positions itself on its backwith its dorsum toward the venter of the host. The adult chews a subcircular hole in thecenter of its host, emerging by placing its prothoracic legs through the hole followed by itshead and pulling itself out of the host. Host finding involves flight to clusters of scales. Ashort hop-like flight pattern is used to move from needle to needle in search of suitable hosts.Females use their antennae tapping on the scales for host recognition. Emerging parasitoidswere found from June through November. The overwintering stage of the parasitoid has notyet been determined.
Eight predators were collected from EHS-infested eastern hemlocks at the four sitesfrom July to December 2004. These include the neuropterans Coniopteryx sp. and Hemerobiusstigma Stevens and the coccinellids Chilocorus stigma, Harmonia axyridis Pallas, Rhyzobiuslophanthae Blaisdell, Scymnillus horni Gordon, and two unidentified lady beetles. The twoneuropteran species and H. axyridis, although commonly collected from eastern hemlock,did not feed on EHS during feeding tests. Fifty coccinellid specimens were collected from180 beat sheet samples from August to December 2004. In three feeding tests with C. stigma,only minimal feeding damage to EHS prey offered was recorded. However, R. lophanthae, S.horni, and the three unidentified lady beetle species did successfully feed on EHS.
Of those predators collected, the lady beetles R. lophanthae and S. horni are recognizedpredators of armored scale insects capable of chewing through the hard waxy test of the EHS.
Figure 1. Average number of elongate hemlock scales at each cardinal direction at four sites.
0
0.5
1
1.5
2
2.5
3
Nu
mb
er /
Nee
dle
Lynnhurst Urban
US Forest Service
Biltmore Urban
Biltmore Forest
Site
NorthEastSouthWest
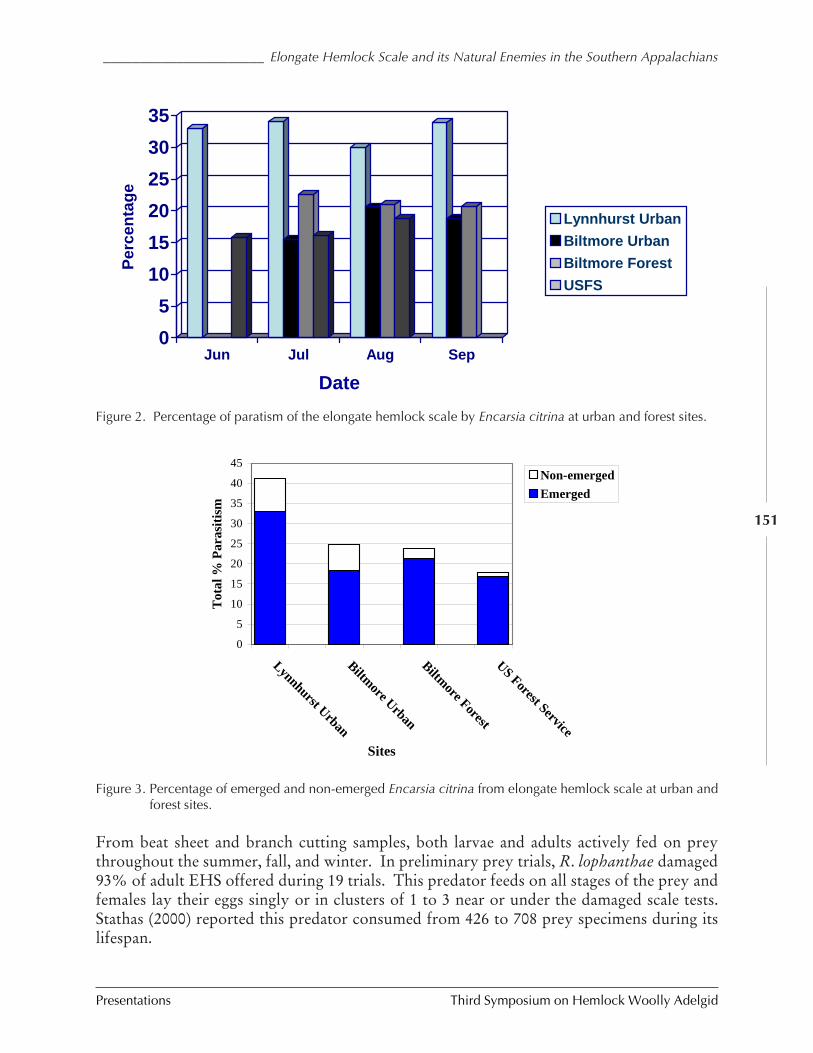
______________________ Elongate Hemlock Scale and its Natural Enemies in the Southern Appalachians
Presentations Third Symposium on Hemlock Woolly Adelgid
151
0
5
10
15
20
25
30
35P
erce
nta
ge
Jun Jul Aug Sep
Date
Lynnhurst Urban
Biltmore Urban
Biltmore Forest
USFS
Figure 2. Percentage of paratism of the elongate hemlock scale by Encarsia citrina at urban and forest sites.
0
5
10
15
20
25
30
35
40
45
Lynnhurst U
rban
Biltm
ore Urban
Biltm
ore Forest
US Forest Service
Sites
Tota
l %
Para
siti
sm
Non-emerged
Emerged
Figure 3. Percentage of emerged and non-emerged Encarsia citrina from elongate hemlock scale at urban andforest sites.
From beat sheet and branch cutting samples, both larvae and adults actively fed on preythroughout the summer, fall, and winter. In preliminary prey trials, R. lophanthae damaged93% of adult EHS offered during 19 trials. This predator feeds on all stages of the prey andfemales lay their eggs singly or in clusters of 1 to 3 near or under the damaged scale tests.Stathas (2000) reported this predator consumed from 426 to 708 prey specimens during itslifespan.
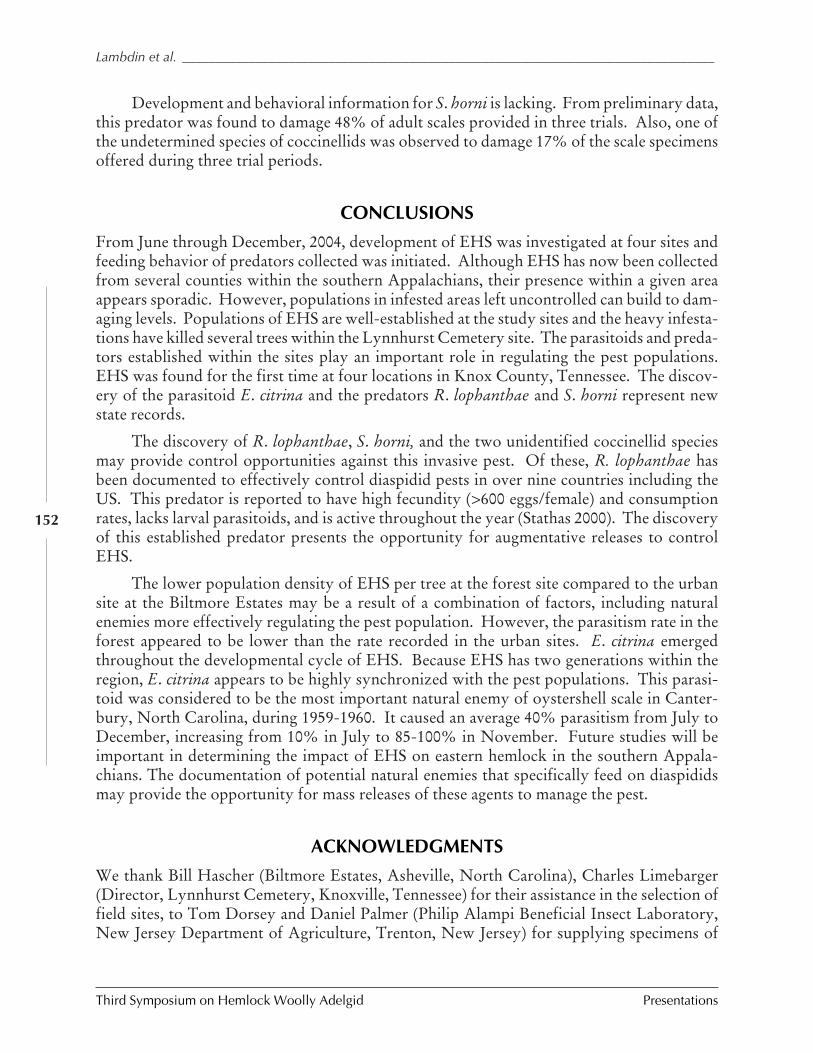
Third Symposium on Hemlock Woolly Adelgid Presentations
Lambdin et al. ________________________________________________________________________________
152
Development and behavioral information for S. horni is lacking. From preliminary data,this predator was found to damage 48% of adult scales provided in three trials. Also, one ofthe undetermined species of coccinellids was observed to damage 17% of the scale specimensoffered during three trial periods.
CONCLUSIONS
From June through December, 2004, development of EHS was investigated at four sites andfeeding behavior of predators collected was initiated. Although EHS has now been collectedfrom several counties within the southern Appalachians, their presence within a given areaappears sporadic. However, populations in infested areas left uncontrolled can build to dam-aging levels. Populations of EHS are well-established at the study sites and the heavy infesta-tions have killed several trees within the Lynnhurst Cemetery site. The parasitoids and preda-tors established within the sites play an important role in regulating the pest populations.EHS was found for the first time at four locations in Knox County, Tennessee. The discov-ery of the parasitoid E. citrina and the predators R. lophanthae and S. horni represent newstate records.
The discovery of R. lophanthae, S. horni, and the two unidentified coccinellid speciesmay provide control opportunities against this invasive pest. Of these, R. lophanthae hasbeen documented to effectively control diaspidid pests in over nine countries including theUS. This predator is reported to have high fecundity (>600 eggs/female) and consumptionrates, lacks larval parasitoids, and is active throughout the year (Stathas 2000). The discoveryof this established predator presents the opportunity for augmentative releases to controlEHS.
The lower population density of EHS per tree at the forest site compared to the urbansite at the Biltmore Estates may be a result of a combination of factors, including naturalenemies more effectively regulating the pest population. However, the parasitism rate in theforest appeared to be lower than the rate recorded in the urban sites. E. citrina emergedthroughout the developmental cycle of EHS. Because EHS has two generations within theregion, E. citrina appears to be highly synchronized with the pest populations. This parasi-toid was considered to be the most important natural enemy of oystershell scale in Canter-bury, North Carolina, during 1959-1960. It caused an average 40% parasitism from July toDecember, increasing from 10% in July to 85-100% in November. Future studies will beimportant in determining the impact of EHS on eastern hemlock in the southern Appala-chians. The documentation of potential natural enemies that specifically feed on diaspididsmay provide the opportunity for mass releases of these agents to manage the pest.
ACKNOWLEDGMENTS
We thank Bill Hascher (Biltmore Estates, Asheville, North Carolina), Charles Limebarger(Director, Lynnhurst Cemetery, Knoxville, Tennessee) for their assistance in the selection offield sites, to Tom Dorsey and Daniel Palmer (Philip Alampi Beneficial Insect Laboratory,New Jersey Department of Agriculture, Trenton, New Jersey) for supplying specimens of
______________________ Elongate Hemlock Scale and its Natural Enemies in the Southern Appalachians
Presentations Third Symposium on Hemlock Woolly Adelgid
153
Cybocephalus nipponicus for use in comparative tests, and to Robert Gordon (Northern PlainsEntomology, Willow City, North Dakota) for his assistance in identifying the coccinellidscollected. We are also grateful to the U. S. Forest Service for their financial support of thisproject.
REFERENCES
Buck, S.E. 2004. Insect fauna associated with eastern hemlock, Tsuga canadensis (L.) in theGreat Smoky Mountains National Park. M.S. Thesis. University of Tennessee, Knoxville,Tennessee. 79 pp.
Davidson, J. and C. McComb. 1958. Notes on the biology and control of Fiorinia externaFerris. Journal of Economic Entomology 51:405-406.
Drea, J.J. and R.M. Hendrickson. 1988. Exotic predators. American Nurserymen 168:66-71.
Ferris, G. 1942. Atlas of the scale insects of North America, Series I-IV, Diaspididae, Vol.IV:385-448. Stanford, Calif., Stanford Univ. Press.
Lambdin, P. 2004. The Scale Insects, pp. 1958-1967. In Encyclopedia of Entomology, ed.J. Capinera, Vol. 3 (P-Z), pp. 1619-2580. Kluwer Academic Publishers, Boston.
Lambdin, P.L. and K. Watson. 1980. New collection records for scale insects of Tennessee.Journal of the Tennessee Academy Science 55:77-81.
Lambdin, P.L. 1995. Release, development, and establishment of Chilocorus kuwanaeSilvestri for control of Unaspis euonymi (Comstock) in Tennessee. Journal of IsraelEntomology 24:327-330.
McClure, M.S. 1977a. Resurgence of the scale, Fiorinia externa (Homoptera: Diaspididae),on hemlock following insecticide application. Environmental Entomology 6:480-484.
McClure, M.S. 1977b. Parasitism of the scale insect, Fiorinia externa (Homoptera:Diaspididae), by Aspidiotiphagus citrinus (Hymenoptera: Eulophidae) in a hemlockforest [Tsuga canadensis]: density dependence. Environmental Entomology 6:551-555.
McClure, M.S. 1978a. Two parasitic wasps have potential for controlling hemlock scales.Frontier Plant Science 30:2-3.
McClure, M.S. 1978b. Seasonal development of Fiorinia externa, Tsugaspidiotus tsugae(Homoptera: Diaspididae), and their parasite, Aspidiotiphagus citrinus (Hymen:Aphelinidae): importance of parasite-host synchronism to the population dynamics oftwo scale pests of hemlock, Tsuga canadensis. Environmental Entomology 7:863-870.
McClure, M.S. 1979a. Spatial and seasonal distribution of disseminating stages of Fioriniaexterna (Hom.: Diaspididae) and natural enemies in a hemlock forest. EnvironmentalEntomology 8:869-873.
McClure, M.S. 1979b. Self-regulation in populations of the elongate hemlock scale,Fiorinia externa (Homoptera: Diaspididae). Oecologia 39:25-36.
McClure, M.S. 1980a. Foliar nitrogen: a basis for host suitability for elongate hemlockscale, Fiorinia externa (Homoptera: Diaspididae). Ecology. 61:72-79.
Third Symposium on Hemlock Woolly Adelgid Presentations
Lambdin et al. ________________________________________________________________________________
154
McClure, M. 1980b. Competition between exotic species: scale insects on hemlock. Ecol-ogy 61:1391-1401.
McClure, M.S. 1981. Effects of voltinism, interspecific competition and parasitism on thepopulation dynamics of the hemlock scales, Fiorinia externa and Tsugaspidiotus tsugae(Homoptera: Diaspididae). Ecological Entomology 6:47-54.
McClure, M.S. 1986. Population dynamics of Japanese hemlock scales: a comparison ofendemic and exotic communities. Ecology 67:1411-1421.
McClure, M.S. 2003. The elongate hemlock scale, Fiorinia externa Ferris (Homoptera:Diaspididae): a new look at an old nemesis, pp. 248-253. In Proceedings of HemlockWoolly Adelgid in the Eastern United States Symposium, Feb. 5-7, 2002, EastBrunswick, New Jersey, ed. B. Onken, R. Reardon, and J. Lashomb. Rutgers Univer-sity, New Brunswick, New Jersey.
McClure, M.S. and M.B. Fergione. 1977. Fiorinia externa and Tsugaspidiotus tsugae(Homoptera: Diaspididae): distribution, abundance, and new hosts of two destructivescale insects of eastern hemlock in Connecticut. Environmental Entomology 6:807-811.
Nalepa, C.A. 1992. Pollen and nectar feeding by Chilocorus kuwanae (Silvestri) (Co-leoptera: Coccinellidae). Proceedings of the Entomological Society of Washington 94:596-597.
Rebek, E.J. and S.C. Sadof. 2003. Effects of pesticide applications on the euonymus scale(Homoptera: Diaspididae) and its parasitoid, Encarsia citrina (Hymenoptera:Aphelinidae). Journal of Economic Entomology 96:446-452.
Sheffer, B.; Williams, M. 1987. Factors influencing scale insect populations in southernpine monocultures. Florida Entomology 70:65-69.
Stathas, G. 2000. Rhyzobius lophanthae prey consumption and fecundity. Phytoparasitica28(3):1-9.
Stimmel, J. 1980. Seasonal history and occurrence of Fiorinia externa Ferris in Pennsylva-nia (Homoptera: Diaspididae). Proceedings of the Entomological Society of Washington82:700-706.
Takagi, S. 1963. Discovery of Fiorinia externa Ferris in Japan (Homoptera: Coccoidea).Insecta Matsumurana 26:115-117.
Talerico, R. C. McComb, and W. Garrett. 1967. Fiorinia externa Ferris, A scale insect ofhemlock. USDA Forest Service Pest Leaflet.107:1-5.
Van Driesche, R., K. Idoine, M. Rose, and M. Bryan. 1998. Release, establishment andspread of Asian natural enemies of euonymous scale (Homoptera: Diaspididae) in NewEngland. Florida Entomologist 81:1-9.
_______________________________ Insect-killing Fungi as a Component of Integrated Pest Management
Presentations Third Symposium on Hemlock Woolly Adelgid
155
INSECT-KILLING FUNGI AS A COMPONENT OF HEMLOCK WOOLLY ADELGID
INTEGRATED PEST MANAGEMENT
Scott D. Costa, Bruce L. Parker, Vladimir Gouli, Michael Brownbridge,Margaret Skinner, and Svetlana Gouli
Entomology Research Laboratory, Department of Plant and Soil Science,College of Agriculture and Life Sciences, University of Vermont,
Burlington, VT 05405
ABSTRACT
The goal of this project is to develop formulations of insect-killing fungi for application tohemlock forests as part of a hemlock woolly adelgid (HWA) integrated pest managementprogram. Previous studies have identified two strains of Beauveria bassiana and a single strainof Verticillium lecanni with potential for use against hemlock woolly adelgid. Laboratory andfield studies were conducted to develop ultra-low volume (ULV) formulations for delivery offungal conidia. These studies lead to the development of prototype formulations of conidia inoil- and whey-based carriers. The target density of 1x10¹⁰ conidia/ml formulation was achievedwhile maintaining sufficient fluidity for spray application. The formulations were used in asmall scale forest trial and delivered with an ULV sprayer onto hemlock branches infestedwith hemlock woolly adelgid. Appropriate controls were included. No significant difference(P > 0.05) in droplet densities on upper and lower needle surfaces was found within spraytreatments. Nearly 50% of the droplets were in the 100-125 micron size range with the conidiain whey formulation. An unexpected delay of field applications in fall 2004 allowed HWA tomolt to a stage that contains a protective woolly coat, which prevented any significant dem-onstration of field efficacy. Conidia formulated in whey appeared to be persisting at nearly 5weeks post-treatment, and indications of fungal outgrowth from whey droplets were ob-served. Fungal growth in whey droplets could recycle fungi in the environment and facilitatedevelopment of disease outbreaks. Future research is slated to optimize oil-and-whey basedformulations for fungal delivery, persistence, and efficacy against HWA under field condi-tions.
INTRODUCTION
The hemlock woolly adelgid (HWA) is an invasive pest that is devastating hemlock forests inEastern United States. A concerted effort is underway to develop insect-killing fungi andother biological agents for use in integrated pest management of HWA (Cheah et al. 2004).The dramatic declines in gypsy moth populations in North America due to the fungusEntomophaga miamaiga highlight the potential of insect-killing fungi for forest pest manage-ment (Hajek et al. 1990). Initially, we directed our research on insect-killing fungi toward
Third Symposium on Hemlock Woolly Adelgid Presentations
Costa et al. ___________________________________________________________________________________
156
collecting numerous isolates and then identifying those with the most insect killing activity(Reid 2003). We also examined their suitability for mass production in anticipation of pro-ducing enough fungi for widespread application. Subsequent research examined fungal effi-cacy against HWA in the field on single hemlock branches to assess the rate and timing offungal application (Cheah et al. 2004). Lab and field trials examined the non-target effects ofthe fungi on Sasajiscymnus tsugae, an introduced predatory beetle of HWA.
The results to date are encouraging for the development of insect-killing fungi as a man-agement tool for HWA. We are actively researching three isolates, a Verticillium lecanni andtwo of Beauveria bassiana, because of their positive profiles for efficacy, mass productionpotential, and compatibility with S. tsugae. Field trials between spring 2001 and fall 2003indicated that significant reductions in adelgid populations occur with fall application of fun-gal conidia. These fungi, when applied at twice the field application rate, did not negativelyaffect the predatory beetle, S. tsugae (Cheah et al. 2004). Currently we are optimizing formu-lations for ultra-low volume (ULV) delivery, further studying non-target effects and examin-ing fungal persistence. The ability of applied fungi to persist in the environment and havelasting effects on HWA population dynamics influences the selection of deployment strate-gies for widespread applications.
MATERIALS AND METHODS
A forest trial was conducted in late fall 2004 to examine the spray characteristics of oil- andwhey-based formulations and assess their influence on the efficacy of insect-killing fungiagainst forest populations of HWA. Three fungi (Beauveria bassiana: CA-603 and GA082;Verticillium lecanii: arsef-6010) were tested in oil formulations and CA-603 was also incor-porated into whey (exact components of these formulations are not currently being released).All treatments were delivered using ULV applications of formulated fungal conidia (1x10¹⁰
condia/ml). There were “no spray” and blank spray (oil and whey) controls. In a hemlockforest in central Massachusetts (Mount Tom Reservation, Holyoke), 1-meter-long brancheswith greater than 20 branchlets infested with HWA were selected and tagged for treatment. Acompletely randomized design was used. A pre-spray count of the density, survival, and lifestages of HWA sistens was made. This was accomplished by randomly selecting fivebranchlets/branch that were positive for the presence of HWA and returning the specimensto the lab for microscopic (20-40x) examination.
One milliliter of formulated material was applied with a hand-held ULV sprayer to eachof five branches per treatment on October 28, 2004. Post-treatment samples taken as de-scribed above were collected five weeks after treatment for comparison to pre-treatment countsto ascertain treatment effects on survival and population density. The data were analyzed fortreatment effects using GLM-ANOVA in SAS (SAS 2002) (± = 0.05 for all analysis).
Hemlock foliage was collected directly after spray treatment and examined microscopi-cally to determine the number of droplets on upper and lower leaf surfaces and size distribu-tions of droplet deposits. This was done for the CA-603 treatments formulated in oil and
_______________________________ Insect-killing Fungi as a Component of Integrated Pest Management
Presentations Third Symposium on Hemlock Woolly Adelgid
157
whey and for their respective blank controls. Ten needles were examined per replication withina treatment for the number of droplets within a 0.625 mm2 microscopic field. Droplet sizewas examined on a single needle from each replication within a treatment. Droplets sizes wereclassified in 25 mm increments ranging from 25 to 300 mm by counting the number of drop-lets within each class. The data on the number of droplets were analyzed for treatment effectsusing GLM-ANOVA, whereas the distribution of in each size class was examined using Chi-square analysis (SAS 2002). Preliminary examinations of persistence were made from foliageduring the post-treatment HWA assessment. This was accomplished by examination of fungiisolated from hemlock needles onto nutritive agar and visual examination of leaf imprintstaken using adhesive tape.
RESULTS AND DISCUSSION
No significant differences (P > 0.05) in droplet densities on upper and lower needle surfaceswere found within spray treatments (Figure 1). This is a critical finding as HWA are typicallylocated on lower surfaces and therefore difficult to reach with standard spray applications.The total number of droplets found was influenced by the formulation applied, with the oilwithout conidia having the highest number of droplets. There were significant differences inthe distribution of droplet size classes among oil and whey formulations and their controls(Figure 2). For instance, oil without conidia produced a larger proportion of small dropletsthat probably accounts for the higher number of droplets overall in this treatment. In the caseof both oil and whey formulations, when conidia were added, the size of droplets tended toincrease. With conidia in whey, nearly 50% of the droplets were in the 100-125 micron sizeclass, and there were none of the larger droplets (>225 microns) found with the oil and conidiaformulation, which are indicative of clumping.
Figure 1. The number of droplets observed on the upper and lower surfaces of hemlockneedles after ULV applications of oil and whey formulations with and withoutconidia of Beauveria bassiana. Oil+C and Whey+C are the formulations withconidia. Capital letters indicate significant differences in total counts amongformulations. No significant difference was found between needle surfaces.
Third Symposium on Hemlock Woolly Adelgid Presentations
Costa et al. ___________________________________________________________________________________
158Data on HWA density and survival taken before treatment applications found no sig-
nificant differences (P > 0.05) in either average density (overall avg. 4.36 live HWA/cm, SE ±0.24) or mortality (overall avg. 11.8%, SE ± 1.2) of HWA field populations among groups oftrees slated for treatment This indicates the overall uniformity of HWA populations withinthe study site before treatment. However, an unexpected delay of field applications in fall2004 allowed nearly the entire HWA population (98.4%, SE ± 0.5) to break aestivation andmolt to a stage that develops a woolly coat. Nearly five weeks post-treatment, there were nosignificant differences (P > 0.05) in either average density (overall avg. 4.17 live HWA/cm, SE± 0.31) or mortality (overall avg. 12.1%, SE ± 1.7) of HWA populations among fungal treat-ments and the controls. Our previous studies found that fungal applications made with higher-volume formulations during periods when HWA contain a woolly coat were ineffective (un-published data). This circumstance may have precluded any significant demonstration of fieldefficacy. Our current strategy is to shift applications six weeks earlier in the year to betteravoid the resumption of HWA development in late fall and take advantage of temperaturesmore favorable for fungal infection.
Conidia formulated in whey appeared to be persisting at nearly five weeks post–treat-ment and indications of fungal outgrowth from whey droplets were observed (Figure 3). Nosimilar outgrowth was observed on needles treated with oil. Fungal growth in whey dropletscould recycle fungi in the environment and facilitate development of disease outbreaks. Fu-ture research is slated to optimize whey based formulations for fungal delivery, persistenceand efficacy against HWA under field conditions. The compatibility of oil- and whey-basedfungal formulations with predatory beetles, adult Sasajiscymnus tsugae, will also be exam-ined.
Figure 2. The Frequency of size class distributions of droplets on hemlock needlesafter ULV applications of oil and whey formulations with and withoutconidia of Beauveria bassiana. Data from both surfaces are combined.There is significant difference in the distribution of size classes amongthe formulation treatments.
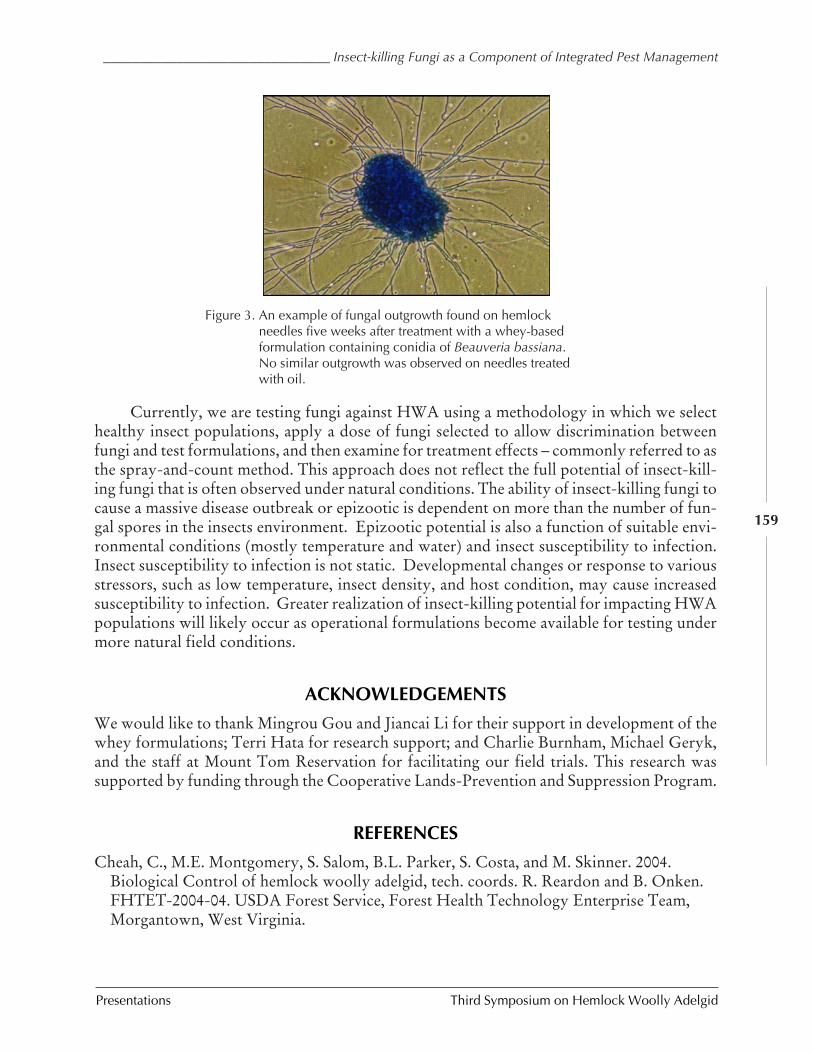
_______________________________ Insect-killing Fungi as a Component of Integrated Pest Management
Presentations Third Symposium on Hemlock Woolly Adelgid
159
Currently, we are testing fungi against HWA using a methodology in which we selecthealthy insect populations, apply a dose of fungi selected to allow discrimination betweenfungi and test formulations, and then examine for treatment effects – commonly referred to asthe spray-and-count method. This approach does not reflect the full potential of insect-kill-ing fungi that is often observed under natural conditions. The ability of insect-killing fungi tocause a massive disease outbreak or epizootic is dependent on more than the number of fun-gal spores in the insects environment. Epizootic potential is also a function of suitable envi-ronmental conditions (mostly temperature and water) and insect susceptibility to infection.Insect susceptibility to infection is not static. Developmental changes or response to variousstressors, such as low temperature, insect density, and host condition, may cause increasedsusceptibility to infection. Greater realization of insect-killing potential for impacting HWApopulations will likely occur as operational formulations become available for testing undermore natural field conditions.
ACKNOWLEDGEMENTS
We would like to thank Mingrou Gou and Jiancai Li for their support in development of thewhey formulations; Terri Hata for research support; and Charlie Burnham, Michael Geryk,and the staff at Mount Tom Reservation for facilitating our field trials. This research wassupported by funding through the Cooperative Lands-Prevention and Suppression Program.
REFERENCES
Cheah, C., M.E. Montgomery, S. Salom, B.L. Parker, S. Costa, and M. Skinner. 2004.Biological Control of hemlock woolly adelgid, tech. coords. R. Reardon and B. Onken.FHTET-2004-04. USDA Forest Service, Forest Health Technology Enterprise Team,Morgantown, West Virginia.
Figure 3. An example of fungal outgrowth found on hemlockneedles five weeks after treatment with a whey-basedformulation containing conidia of Beauveria bassiana.No similar outgrowth was observed on needles treatedwith oil.
Third Symposium on Hemlock Woolly Adelgid Presentations
Costa et al. ___________________________________________________________________________________
160
Hajek, A.E., R.A. Humber, J.S. Elkinton, B. May, S.R.A. Walsh, and J.C. Silver. 1990.Allozyme and RFLP analyses confirm Entomophaga miamaiga responsible for 1989epizootics in North American gypsy moth populations. Proc. Natl. Acad. Sci. USA.87:6979-6982.
Reid, William. 2003 Isolation and characterization of entomopathogenic fungi associatedwith hemlock woolly adelgid. Master’s Thesis. University of Vermont, Burlington,Vermont. 99 p.
SAS. 2002. Version 9.1 Online Documentation. SAS Institute, Cary, North Carolina.
____________________________ Management of Elongate Hemlock Scale with Entomopathogenic Fungi
Presentations Third Symposium on Hemlock Woolly Adelgid
161
MANAGEMENT OF ELONGATE HEMLOCK SCALE
WITH ENTOMOPATHOGENIC FUNGI
Bruce L. Parker1, Margaret Skinner1, Vladimir Gouli1, Svetlana Gouli1,José Marcelino1, Jerry Carlson2, and Lora Schwartzberg2
1 Entomology Research Laboratory, University of Vermont661 Spear St., Burlington, VT 05405-0105
2 New York State Department of Environmental Conservation625 Broadway, Albany, NY 12233
ABSTRACT
The artificial dissemination of entomopathogenic fungi, under suitable environmental condi-tions, may be an important tool for management of an insect pest and, if established, a sea-sonal control method to maintain the pest population under an economic threshold level.Recently two entomopathogenic fungi were discovered parasitizing the elongate hemlockscale (EHS), Fiorinia externa Ferris (Homoptera: Diaspididae). One was found to cause anepizootic within the population of the scale. Exploratory activities in New York showed theexpanding range of the epizootic. To assess the potential and viability of this fungus, a set ofbiological parameters were measures from 26 of the 66 fungal isolates obtained from EHS.Unique growth and sporulation characteristics were found. Both were higher at 25oC (rangeof growth conditions between 15, 20, and 25oC [± 1oC] spanning 20 days). Conidial germina-tion occurred after 8 hours at 10oC, but it was significantly higher after 6 hours at 25 and 30oC(range of growth conditions between 10, 15, 20, 25 and 30oC [± 1oC] spanning 24 hours).High viability for mass production was observed.
KEYWORDS
Hemlock, Fiorinia externa, entomopathogenic fungi, productivity, fungal growth rate.
INTRODUCTION
The eastern or Canada hemlock, Tsuga canadensis (L.) Carrière, plays a key role in forestecosystems by maintaining their stability. It is particularly important along streams and creekswhere their shade provides shelter and sustains aquatic ecosystems and a unique microclimatefor forest and wildlife (Howe and Mossman 1995, Wydeven and Hay 1995, Crow 1995,Howard et al. 2000). Hemlock is second only to sugar maple in terms of abundance in thenorthern forest (Curtis 1959). The present decline of the hemlock forest is due to biotic andabiotic factors often acting together. The primary threat consistently reported is the hemlockwoolly adelgid (HWA), Adelges tsugae Annand (Homoptera: Adelgidae), found infestinghalf of the range of hemlock along the eastern seaboard (Knauer et al. 2002). The elongate
Third Symposium on Hemlock Woolly Adelgid Presentations
Parker et al. __________________________________________________________________________________
162
hemlock scale (EHS), Fiorinia externa Ferris (Homoptera: Diaspididae), is becoming impor-tant not only as a secondary pest enhanced by an initial stress from HWA but as a parallelstress factor in hemlock decline. A rapid spread of EHS within the area of HWA has beenobserved. Their highest abundance is within a 300-km radius of New York City (Danoff-Burg and Bird 2002). EHS is present in Pennsylvania, Virginia, Massachusetts, Connecticut,Maryland, New Jersey, Rhode Island, Washington D.C., southern New England and west-ern Ohio (Garrett and Langford 1969, Johnson and Lyon 1988, Hoover 2003, USDA 2004).Strong correlations have been found between HWA and scale infestation levels (Johnson andLyon 1988, Danoff-Burg and Bird 2002).
The EHS maybe is a greater problem than HWA, despite its secondary role. Its uniqueshield-like cover or scale provides protection for the eggs and the adult from contact insecti-cides, natural enemies and adverse conditions. Losses are soon replaced even with mortalityrates of 95% (Baranyovits 1953, Johnson and Lyon 1988). The EHS has probably causedmore decline of hemlock in terms of rapid tree mortality than HWA (Greg Hoover, pers.comm.).
A chemical approach to the management of EHS or HWA is not environmentally viablein a forest situation, so alternative measures have been developed: mainly the use of intro-duced predators. One major factor when considering the use of predators in an open environ-ment is the necessity for a rapid predator population build up before the trees become irre-versibly damaged by the pest. In addition, sometimes it is difficult to maintain the populationof the predator in levels capable of controlling the pest. The elapse time between the releaseand achieved biological control is large, sometimes spanning many years.
Scale insects are particularly susceptible to attack by fungi because only one stage ismobile. Quantitative evidence of the importance of entomopathogenic fungi on arthropodpopulations has been extensively reviewed (Samson et al. 1988), and their impact on armoredscales (Homoptera: Diaspididae) has been reported (Helle 1990a and 1990b). An epizooticcaused by a “black” fungus within the EHS population in the Mianus River Gorge Preservein Bedford, New York, was first reported by McClure (2002). Another parasitic ‘white fun-gus’ has been recently isolated from EHS at the Entomology Research Laboratory (ERL),University of Vermont.
Because the white fungus was found only occasionally and it was believed that the causeof the epizootic was the black fungus, major emphasis was placed on the latter. This funguswas found in a wide range of EHS sites and was easily cultured, producing high concentra-tions of spores and different pigmentation when cultured, ranging from whitish-pink to darkblack (Gouli et al. 2004). It was first identified by Drs. Svetlana and Vladimir Gouli (ERL) asHypocrella sp., and the species was verified as the anamorph Aschersonia marginata Ellis andEver (Ascomycota: Hypocreales: Clavicipitaceae) by Dr. Zengzhi Li, Head of theEntomogenous Fungal Branch of the Mycological Society of China. Doubts concerning theidentification still remain because Aschersonia spp. mainly grows in tropical or sub-tropicalclimates, which are different from that in the northeastern US. It has subsequently beenidentified as Fusarium merismoides by Drs. Humber and Rossman, Cornell Univ. andMyriangium sp. by Dr. Nigel Hywel-Jones, National Center for Genetic Engineering andBiotechnology, Thailand. DNA analysis is being done currently to clarify identification ofthis fungus.
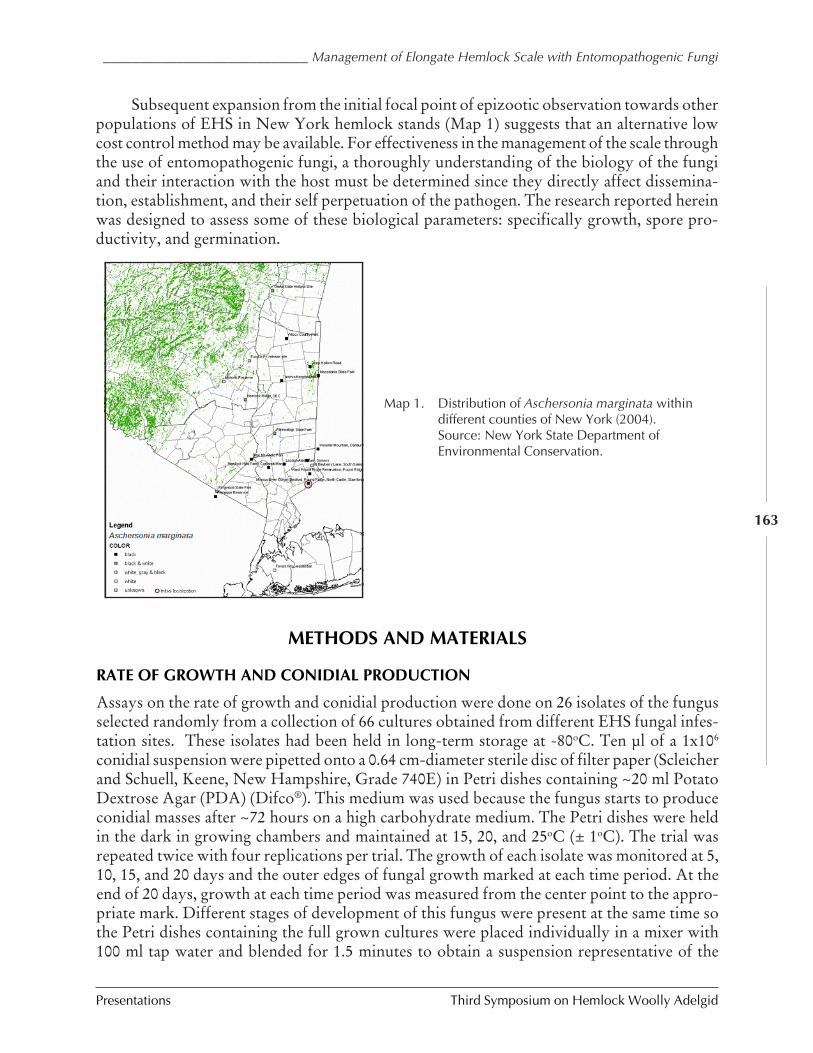
____________________________ Management of Elongate Hemlock Scale with Entomopathogenic Fungi
Presentations Third Symposium on Hemlock Woolly Adelgid
163
Subsequent expansion from the initial focal point of epizootic observation towards otherpopulations of EHS in New York hemlock stands (Map 1) suggests that an alternative lowcost control method may be available. For effectiveness in the management of the scale throughthe use of entomopathogenic fungi, a thoroughly understanding of the biology of the fungiand their interaction with the host must be determined since they directly affect dissemina-tion, establishment, and their self perpetuation of the pathogen. The research reported hereinwas designed to assess some of these biological parameters: specifically growth, spore pro-ductivity, and germination.
Map 1. Distribution of Aschersonia marginata withindifferent counties of New York (2004).Source: New York State Department ofEnvironmental Conservation.
METHODS AND MATERIALS
RATE OF GROWTH AND CONIDIAL PRODUCTION
Assays on the rate of growth and conidial production were done on 26 isolates of the fungusselected randomly from a collection of 66 cultures obtained from different EHS fungal infes-tation sites. These isolates had been held in long-term storage at -80oC. Ten µl of a 1x10⁶
conidial suspension were pipetted onto a 0.64 cm-diameter sterile disc of filter paper (Scleicherand Schuell, Keene, New Hampshire, Grade 740E) in Petri dishes containing ~20 ml PotatoDextrose Agar (PDA) (Difco®). This medium was used because the fungus starts to produceconidial masses after ~72 hours on a high carbohydrate medium. The Petri dishes were heldin the dark in growing chambers and maintained at 15, 20, and 25oC (± 1oC). The trial wasrepeated twice with four replications per trial. The growth of each isolate was monitored at 5,10, 15, and 20 days and the outer edges of fungal growth marked at each time period. At theend of 20 days, growth at each time period was measured from the center point to the appro-priate mark. Different stages of development of this fungus were present at the same time sothe Petri dishes containing the full grown cultures were placed individually in a mixer with100 ml tap water and blended for 1.5 minutes to obtain a suspension representative of the
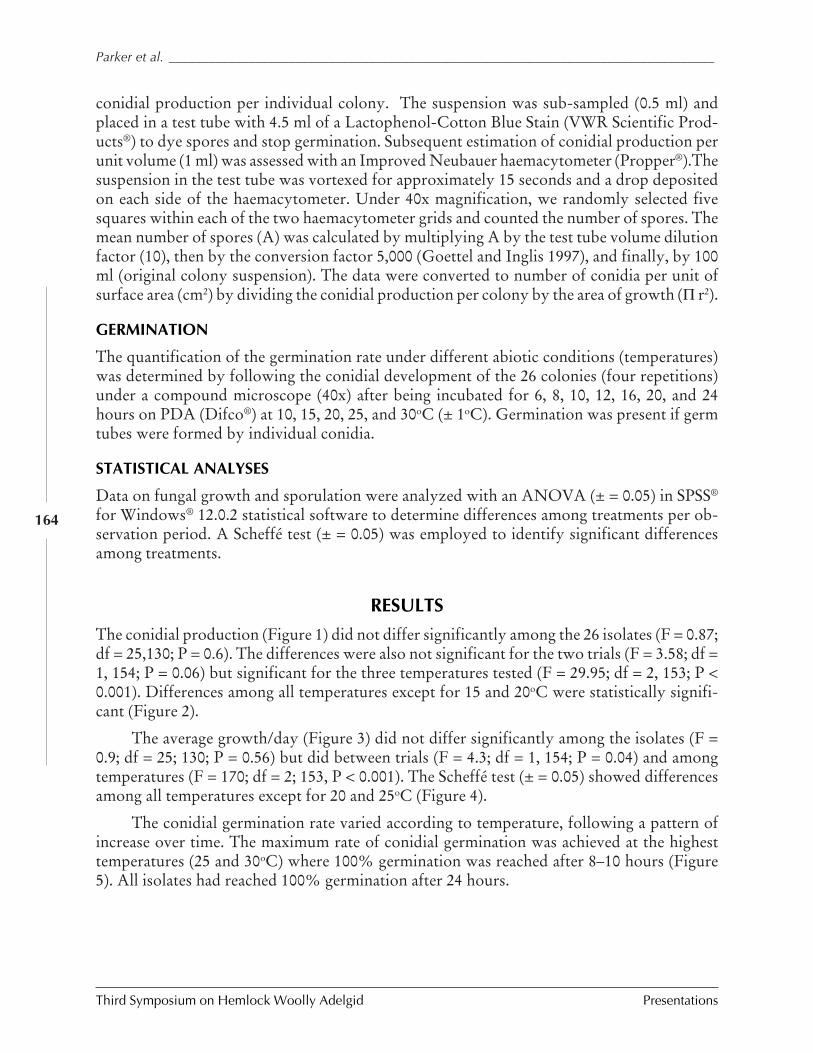
Third Symposium on Hemlock Woolly Adelgid Presentations
Parker et al. __________________________________________________________________________________
164
conidial production per individual colony. The suspension was sub-sampled (0.5 ml) andplaced in a test tube with 4.5 ml of a Lactophenol-Cotton Blue Stain (VWR Scientific Prod-ucts®) to dye spores and stop germination. Subsequent estimation of conidial production perunit volume (1 ml) was assessed with an Improved Neubauer haemacytometer (Propper®).Thesuspension in the test tube was vortexed for approximately 15 seconds and a drop depositedon each side of the haemacytometer. Under 40x magnification, we randomly selected fivesquares within each of the two haemacytometer grids and counted the number of spores. Themean number of spores (A) was calculated by multiplying A by the test tube volume dilutionfactor (10), then by the conversion factor 5,000 (Goettel and Inglis 1997), and finally, by 100ml (original colony suspension). The data were converted to number of conidia per unit ofsurface area (cm2) by dividing the conidial production per colony by the area of growth (Π r2).
GERMINATION
The quantification of the germination rate under different abiotic conditions (temperatures)was determined by following the conidial development of the 26 colonies (four repetitions)under a compound microscope (40x) after being incubated for 6, 8, 10, 12, 16, 20, and 24hours on PDA (Difco®) at 10, 15, 20, 25, and 30oC (± 1oC). Germination was present if germtubes were formed by individual conidia.
STATISTICAL ANALYSES
Data on fungal growth and sporulation were analyzed with an ANOVA (± = 0.05) in SPSS®
for Windows® 12.0.2 statistical software to determine differences among treatments per ob-servation period. A Scheffé test (± = 0.05) was employed to identify significant differencesamong treatments.
RESULTS
The conidial production (Figure 1) did not differ significantly among the 26 isolates (F = 0.87;df = 25,130; P = 0.6). The differences were also not significant for the two trials (F = 3.58; df =1, 154; P = 0.06) but significant for the three temperatures tested (F = 29.95; df = 2, 153; P <0.001). Differences among all temperatures except for 15 and 20oC were statistically signifi-cant (Figure 2).
The average growth/day (Figure 3) did not differ significantly among the isolates (F =0.9; df = 25; 130; P = 0.56) but did between trials (F = 4.3; df = 1, 154; P = 0.04) and amongtemperatures (F = 170; df = 2; 153, P < 0.001). The Scheffé test (± = 0.05) showed differencesamong all temperatures except for 20 and 25oC (Figure 4).
The conidial germination rate varied according to temperature, following a pattern ofincrease over time. The maximum rate of conidial germination was achieved at the highesttemperatures (25 and 30oC) where 100% germination was reached after 8–10 hours (Figure5). All isolates had reached 100% germination after 24 hours.
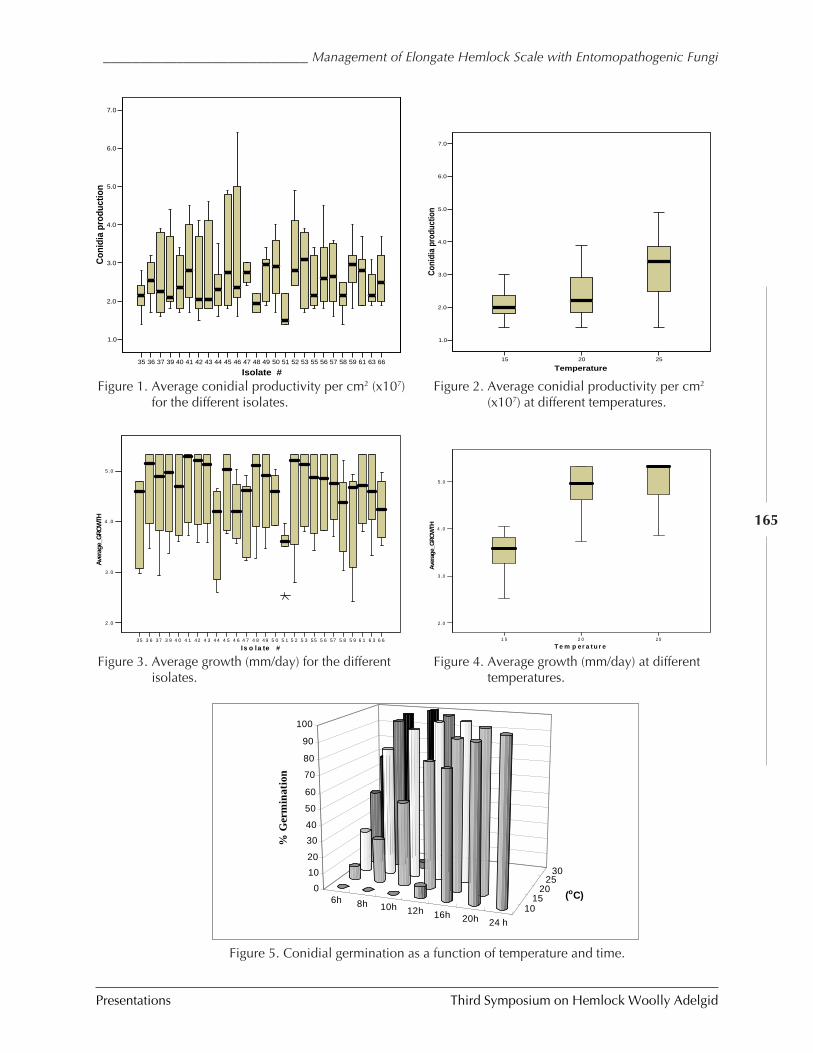
____________________________ Management of Elongate Hemlock Scale with Entomopathogenic Fungi
Presentations Third Symposium on Hemlock Woolly Adelgid
165
35 36 37 39 40 41 42 43 44 45 46 47 48 49 50 51 52 53 55 56 57 58 59 61 63 66
Isolate #
1.0
2.0
3.0
4.0
5.0
6.0
7.0
Con
idia
pro
duct
ion
35 36 37 39 40 41 42 43 44 45 46 47 48 49 50 51 52 53 55 56 57 58 59 61 63 66
Isolate #
1.0
2.0
3.0
4.0
5.0
6.0
7.0
Con
idia
pro
duct
ion
35 36 37 39 40 41 42 43 44 45 46 47 48 49 50 51 52 53 55 56 57 58 59 61 63 66
Isolate #
1.0
2.0
3.0
4.0
5.0
6.0
7.0
Con
idia
pro
duct
ion
35 36 37 39 40 41 42 43 44 45 46 47 48 49 50 51 52 53 55 56 57 58 59 61 63 66
Isolate #
1.0
2.0
3.0
4.0
5.0
6.0
7.0
Con
idia
pro
duct
ion
15 20 25
Temperature
1.0
2.0
3.0
4.0
5.0
6.0
7.0
Con
idia
pro
duct
ion
15 20 25
Temperature
1.0
2.0
3.0
4.0
5.0
6.0
7.0
Con
idia
pro
duct
ion
15 20 25
Temperature
1.0
2.0
3.0
4.0
5.0
6.0
7.0
Con
idia
pro
duct
ion
15 20 25
Temperature
1.0
2.0
3.0
4.0
5.0
6.0
7.0
Con
idia
pro
duct
ion
35 3 6 37 3 9 4 0 4 1 42 4 3 44 4 5 4 6 4 7 4 8 49 5 0 5 1 5 2 5 3 55 5 6 57 5 8 5 9 6 1 6 3 6 6
Is o la te #
2 .0
3 .0
4 . 0
5 .0
Aver
age_
GRO
WTH
35 3 6 37 3 9 4 0 4 1 42 4 3 44 4 5 4 6 4 7 4 8 49 5 0 5 1 5 2 5 3 55 5 6 57 5 8 5 9 6 1 6 3 6 6
Is o la te #
2 .0
3 .0
4 . 0
5 .0
Aver
age_
GRO
WTH
35 3 6 37 3 9 4 0 4 1 42 4 3 44 4 5 4 6 4 7 4 8 49 5 0 5 1 5 2 5 3 55 5 6 57 5 8 5 9 6 1 6 3 6 6
Is o la te #
2 .0
3 .0
4 . 0
5 .0
Aver
age_
GRO
WTH
35 3 6 37 3 9 4 0 4 1 42 4 3 44 4 5 4 6 4 7 4 8 49 5 0 5 1 5 2 5 3 55 5 6 57 5 8 5 9 6 1 6 3 6 6
Is o la te #
2 .0
3 .0
4 . 0
5 .0
Aver
age_
GRO
WTH
1 5 2 0 25
T e m p er a t u r e
2 .0
3 .0
4 .0
5 .0
Aver
age_
GRO
WTH
1 5 2 0 25
T e m p er a t u r e
2 .0
3 .0
4 .0
5 .0
Aver
age_
GRO
WTH
1 5 2 0 25
T e m p er a t u r e
2 .0
3 .0
4 .0
5 .0
Aver
age_
GRO
WTH
1 5 2 0 25
T e m p er a t u r e
2 .0
3 .0
4 .0
5 .0
Aver
age_
GRO
WTH
6h 8h 10h 12h 16h 20h 24 h
1015
2025
30
0
10
20
30
40
50
60
70
80
90
100
% G
erm
ina
tion
(oC)6h 8h 10h 12h 16h 20h 24 h
1015
2025
30
0
10
20
30
40
50
60
70
80
90
100
% G
erm
ina
tion
(oC)
Figure 1. Average conidial productivity per cm2 (x107)for the different isolates.
Figure 2. Average conidial productivity per cm2
(x107) at different temperatures.
Figure 3. Average growth (mm/day) for the differentisolates.
Figure 4. Average growth (mm/day) at differenttemperatures.
Figure 5. Conidial germination as a function of temperature and time.
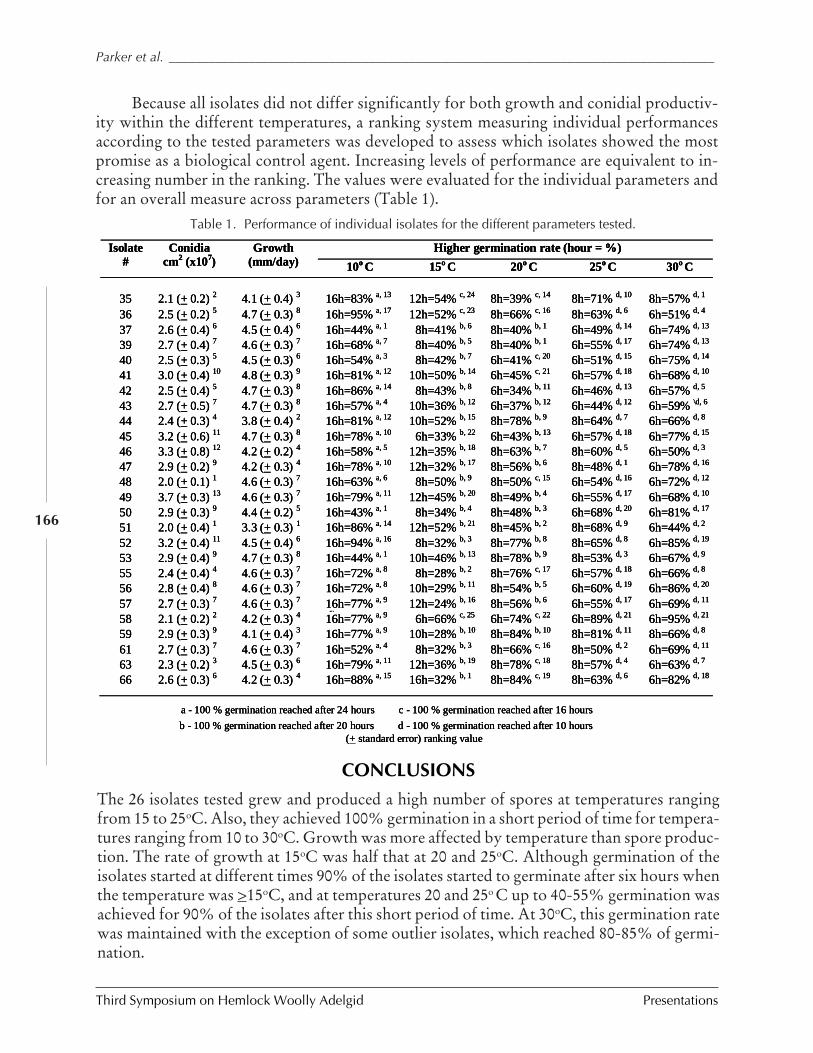
Third Symposium on Hemlock Woolly Adelgid Presentations
Parker et al. __________________________________________________________________________________
166
Because all isolates did not differ significantly for both growth and conidial productiv-ity within the different temperatures, a ranking system measuring individual performancesaccording to the tested parameters was developed to assess which isolates showed the mostpromise as a biological control agent. Increasing levels of performance are equivalent to in-creasing number in the ranking. The values were evaluated for the individual parameters andfor an overall measure across parameters (Table 1).
CONCLUSIONS
The 26 isolates tested grew and produced a high number of spores at temperatures rangingfrom 15 to 25oC. Also, they achieved 100% germination in a short period of time for tempera-tures ranging from 10 to 30oC. Growth was more affected by temperature than spore produc-tion. The rate of growth at 15oC was half that at 20 and 25oC. Although germination of theisolates started at different times 90% of the isolates started to germinate after six hours whenthe temperature was >15oC, and at temperatures 20 and 25o C up to 40-55% germination wasachieved for 90% of the isolates after this short period of time. At 30oC, this germination ratewas maintained with the exception of some outlier isolates, which reached 80-85% of germi-nation.
Higher germination rate (hour = %) Isolate #
Conidia cm
2 (x10
7)
Growth (mm/day) 10o C 15o C 20o C 25o C 30o C
35
2.1 (+ 0.2) 2
4.1 (+ 0.4) 3
16h=83% a, 13
12h=54% c, 24
8h=39% c, 14
8h=71% d, 10
8h=57% d, 1
36 2.5 (+ 0.2) 5 4.7 (+ 0.3) 8 16h=95% a, 17 12h=52% c, 23 8h=66% c, 16 8h=63% d, 6 6h=51% d, 4 37 2.6 (+ 0.4) 6 4.5 (+ 0.4) 6 16h=44% a, 1 8h=41% b, 6 8h=40% b, 1 6h=49% d, 14 6h=74% d, 13
39 2.7 (+ 0.4) 7 4.6 (+ 0.3) 7 16h=68% a, 7 8h=40% b, 5 8h=40% b, 1 6h=55% d, 17 6h=74% d, 13
40 2.5 (+ 0.3) 5 4.5 (+ 0.3) 6 16h=54% a, 3 8h=42% b, 7 6h=41% c, 20 6h=51% d, 15 6h=75% d, 14
41 3.0 (+ 0.4) 10 4.8 (+ 0.3) 9 16h=81% a, 12 10h=50% b, 14 6h=45% c, 21 6h=57% d, 18 6h=68% d, 10
42 2.5 (+ 0.4) 5 4.7 (+ 0.3) 8 16h=86% a, 14 8h=43% b, 8 6h=34% b, 11 6h=46% d, 13 6h=57% d, 5 43 2.7 (+ 0.5) 7 4.7 (+ 0.3) 8 16h=57% a, 4 10h=36% b, 12 6h=37% b, 12 6h=44% d, 12 6h=59% \d, 6
44 2.4 (+ 0.3) 4 3.8 (+ 0.4) 2 16h=81% a, 12 10h=52% b, 15 8h=78% b, 9 8h=64% d, 7 6h=66% d, 8 45 3.2 (+ 0.6) 11 4.7 (+ 0.3) 8 16h=78% a, 10 6h=33% b, 22 6h=43% b, 13 6h=57% d, 18 6h=77% d, 15
46 3.3 (+ 0.8) 12 4.2 (+ 0.2) 4 16h=58% a, 5 12h=35% b, 18 8h=63% b, 7 8h=60% d, 5 6h=50% d, 3 47 2.9 (+ 0.2) 9 4.2 (+ 0.3) 4 16h=78% a, 10 12h=32% b, 17 8h=56% b, 6 8h=48% d, 1 6h=78% d, 16
48 2.0 (+ 0.1) 1 4.6 (+ 0.3) 7 16h=63% a, 6 8h=50% b, 9 8h=50% c, 15 6h=54% d, 16 6h=72% d, 12
49 3.7 (+ 0.3) 13 4.6 (+ 0.3) 7 16h=79% a, 11 12h=45% b, 20 8h=49% b, 4 6h=55% d, 17 6h=68% d, 10
50 2.9 (+ 0.3) 9 4.4 (+ 0.2) 5 16h=43% a, 1 8h=34% b, 4 8h=48% b, 3 6h=68% d, 20 6h=81% d, 17
51 2.0 (+ 0.4) 1 3.3 (+ 0.3) 1 16h=86% a, 14 12h=52% b, 21 8h=45% b, 2 8h=68% d, 9 6h=44% d, 2 52 3.2 (+ 0.4) 11 4.5 (+ 0.4) 6 16h=94% a, 16 8h=32% b, 3 8h=77% b, 8 8h=65% d, 8 6h=85% d, 19
53 2.9 (+ 0.4) 9 4.7 (+ 0.3) 8 16h=44% a, 1 10h=46% b, 13 8h=78% b, 9 8h=53% d, 3 6h=67% d, 9 55 2.4 (+ 0.4) 4 4.6 (+ 0.3) 7 16h=72% a, 8 8h=28% b, 2 8h=76% c, 17 6h=57% d, 18 6h=66% d, 8 56 2.8 (+ 0.4) 8 4.6 (+ 0.3) 7 16h=72% a, 8 10h=29% b, 11 8h=54% b, 5 6h=60% d, 19 6h=86% d, 20
57 2.7 (+ 0.3) 7 4.6 (+ 0.3) 7 16h=77% a, 9 1\
12h=24% b, 16 8h=56% b, 6 6h=55% d, 17 6h=69% d, 11
58 2.1 (+ 0.2) 2 4.2 (+ 0.3) 4 16h=77% a, 9 6h=66% c, 25 6h=74% c, 22 6h=89% d, 21 6h=95% d, 21
59 2.9 (+ 0.3) 9 4.1 (+ 0.4) 3 16h=77% a, 9 10h=28% b, 10 8h=84% b, 10 8h=81% d, 11 8h=66% d, 8 61 2.7 (+ 0.3) 7 4.6 (+ 0.3) 7 16h=52% a, 4 8h=32% b, 3 8h=66% c, 16 8h=50% d, 2 6h=69% d, 11
63 2.3 (+ 0.2) 3 4.5 (+ 0.3) 6 16h=79% a, 11 12h=36% b, 19 8h=78% c, 18 8h=57% d, 4 6h=63% d, 7 66 2.6 (+ 0.3) 6 4.2 (+ 0.3) 4 16h=88% a, 15 16h=32% b, 1 8h=84% c, 19 8h=63% d, 6 6h=82% d, 18
a - 100 % germination reached after 24 hours c - 100 % germination reached after 16 hoursb - 100 % germination reached after 20 hours d - 100 % germination reached after 10 hours
(+ standard error) ranking value
Table 1. Performance of individual isolates for the different parameters tested.
____________________________ Management of Elongate Hemlock Scale with Entomopathogenic Fungi
Presentations Third Symposium on Hemlock Woolly Adelgid
167
Different conclusions on the most promising isolates can be reached depending on theparameters used (Table 1). Isolates 41, 45, and 58 had the highest rankings when consideringall the tested parameters together (growth, productivity, and germination). If trying to assessthe best isolates to grow under northeastern U.S. environmental conditions, isolates 35, 36,and 45 provided better germination at lower temperatures with good productivity and rate ofgrowth.
Based on these positive results concerning major features required for the potential useof entomopathogenic fungi for insect pest management (high spore productivity, growth,and germination), mass production is critical. Subsequent research will focus in this area andin assessing the virulence of these different strains against the EHS and other pests such as theHWA.
ACKNOWLEDGMENTS
Dr. Scott D. Costa provided valuable advice on preparation of some parts of this manuscript.This research was supported in part by the USDA Forest Service (Project 04-CA-11244225-286).
REFERENCES
Baranyovits, F. 1953. Some aspects of the biology of armoured scales. Endeavour, Vol. 12:202-209.
Crow, T.R. 1995. The social, economic, and ecological significance of hemlock in the LakeStates, pp. 11-17. In Hemlock Ecology and Management. Proceedings of a RegionalConference on Ecology and Management of Eastern Hemlock, Sept. 27-28, 1995, IronMountain, Michigan.
Curtis, J.T. 1959. The Vegetation of Wisconsin. The Univ.of Wisconsin Press. 645 p.
Danoff-Burg, J.A. and S. Bird. 2002. Hemlock Woolly Adelgid and Elongate HemlockScale: Partners in crime?, pp. 254-268. In Proceedings of Hemlock Woolly Adelgid inthe Eastern United States Symposium, Feb. 5-7, 2002, East Brunswick, New Jersey, ed.B. Onken, R. Reardon, and J. Lashomb. Rutgers University, New Brunswick, NewJersey.
Garrett, W.T. and G.S. Langford. 1969. Control of Fiorinia externa on hemlock in Mary-land. J. Econ. Entomol. 62 (6): 1449-1450.
Goettel, M.S. and G.D. Inglis. 1997. Fungi: Hyphomycetes, pp. 213-249. In Manual ofTechniques in Insect Pathology. Academic Press.
Gouli, S., B. Parker, and V. Gouli. 2004. Biological properties of a new entomopathogenicfungus Aschersonia marginata, p. 85. In Society for Invertebrate Pathology. 37th AnnualMeeting. 7th Intern. Conf. on Bacillus thuringiensis, 1-6 August 2004, Helsinki, Finland.(Book of Abstracts).
Third Symposium on Hemlock Woolly Adelgid Presentations
Parker et al. __________________________________________________________________________________
168
Helle, W. 1990a. Armored Scale Insects. Their Biology, Natural Enemies and Control.[Series title: World Crop Pests, Vol. 4A: The Armored Scale Insects], ed. D. Rosen.Amsterdam, The Netherlands: Elsevier. 384 p.
Helle, W. 1990b. Armored Scale Insects: Their Biology, Natural Enemies and Control.[Series title: World Crop Pests, Vol. 4B: The Natural Enemies], ed. D. Rosen.Amsterdam, The Netherlands: Elsevier. 690 pp.
Hoover, G.A. 2003. Elongate Hemlock Scale. Entomological Notes: www.ento.psu.edu/extension/factsheets/pdfs/elongateHemlockScale.pdf. The Penn. State Univ.
Howard, T., P. Sendak, and C. Codrescu. 2000. Eastern Hemlock: A Market Perspective,pp. 161-166. In Proc. of the Sustainable Management of Hemlock Ecosystems in EasternNorth America Symposium. June 22-24, 1999, Durham, New Hampshire.
Howe, R.W. and M. Mossman. 1995. The Significance of Hemlock for Breeding Birds inthe Western Great Lakes Region, pp. 125-140. In Hemlock Ecology and Management.Proc. of a Regional Conf. on Ecology and Management of Eastern Hemlock, September27-28, 1995, Iron Mountain, Michigan.
Johnson, W.T. and H.H. Lyon. 1988. Insects That Feed on Trees and Shrubs. 2nd Edition.Cornell Univ. Press. 556 p.
Knauer, K., J. Linnane, K. Shields. and R. Bridges. 2002. An Initiative for Management ofHemlock Woolly Adelgid. In Proceedings of Hemlock Woolly Adelgid in the EasternUnited States Symposium, Feb. 5-7, 2002, East Brunswick, New Jersey, ed. B. Onken, R.Reardon, and J. Lashomb. Rutgers University, New Brunswick, New Jersey.
McClure, M.S. 2002a. The Elongate Hemlock Scale, Fiorinia externa Ferris (Homoptera:Diaspididae): A new Look at an Old Nemesis, pp. 248-253. In Proceedings of HemlockWoolly Adelgid in the Eastern United States Symposium, Feb. 5-7, 2002, EastBrunswick, New Jersey, ed. B. Onken, R. Reardon, and J. Lashomb. Rutgers Univer-sity, New Brunswick, New Jersey.
USDA 2004. Forest Insects and Diseases Conditions in the United States 2003. USDA,Forest Service Pub. 142 p.
Samson, R.A., H.C. Evans, and J.P. Latge. 1988. Atlas of Entomopathogenic Fungi. Ber-lin; Springer Verlag. 187 p.
Wydeven, A.P. and R.W. Hay. 1995. Mammals, Amphibians and Reptiles of HemlockForests in the Lake Superior Region, pp. 115-123. In Hemlock Ecology and Manage-ment. Proc.of a Regional Conf. on Ecology and Management of Eastern Hemlock,September 27-28, 1995, Iron Mountain, Michigan.
________________________________________ Comparing Systemic Imidacloprid Application Methods
Presentations Third Symposium on Hemlock Woolly Adelgid
169
COMPARING SYSTEMIC IMIDACLOPRID APPLICATION METHODS FOR
CONTROLLING HEMLOCK WOOLLY ADELGID
Richard S. Cowles1, Carole S.-J. Cheah1, and Michael E. Montgomery2
1Connecticut Agricultural Experiment Station2Northeastern Research Station, USDA Forest Service
INTRODUCTION
Several studies have shown imidacloprid to have excellent activity for controlling hemlockwoolly adelgid (HWA) in a landscape environment (Cowles and Cheah 2002, Doccola et al.2003, Webb et al. 2003). This study was undertaken to determine which imidacloprid appli-cation method would provide the best control of HWA in forests. The methods comparedwere Kioritz soil injection with (1) placement near the trunk or (2) placement near the trunkand out to the drip line, (3) drench near the base of the trunk with Bayer Tree and ShrubInsect Control, and trunk injection with the (4) Arborjet, (5) Wedgle, and (6) Mauget sys-tems. Along with the untreated check, these treatments were part of a 7 × 2 factorial design,which included a comparison of fall vs. spring application timing.
METHOD
Trees were chosen for this study based on the presence of moderate populations of HWA, theavailability of lower branches from which adelgid populations could be observed, and a dis-tance of at least 50 m between study trees. Six replicates were located at five sites in Connecti-cut: Shenipsit State Forest in Somers, Nathan Hale State Forest in Coventry, Tunxis StateForest in East Hartland, Sequassen Boy Scout Camp in New Hartford, and the MashantucketPequot Reservation in Ledyard, for a total of 84 study trees. Insecticides were applied be-tween October 1–29, 2002, and between May 28 – June 6, 2003. The Kioritz-injectedimidacloprid treatments used Merit 75W and 1 g of active ingredient per 2.5 cm DBH. BayerAdvanced Tree and Shrub Insect Control (68 ml of product per 2.5 cm DBH, providing 1 ga.i.) was diluted in 3.8 liters of water and drenched outwards from the trunk of the tree to adistance of 45 cm. Trunk injection applications were made of Mauget’s Imicide (3 ml of 10%formulation per 15 cm circumference), Wedgle’s Pointer (1 ml of 12% formulation every 10cm circumference), and Arborjet’s Imajet (6 ml of 5% formulation every 24 cm circumfer-ence) while following each manufacturer’s recommended method. The targeted dosages forthe Mauget, Wedgle, and Arborjet systems were 0.15, 0.09, and 0.1 g a.i./2.5 cm DBH, respec-tively. The application rate in the fall with the Wedgle System could not be confirmed, asthere is no component to the application device that permits monitoring of active ingredientplacement in the tree. Therefore, plugging of the needle orifice (a common occurrence) led tosqueezing the handles without actually placing any product in the tree. Two modifications ofthe Wedgle method were required for successful springtime trunk injections. To preventplugging of the needle orifice, a 7/64” hole was drilled into the center of the hole left by the
Third Symposium on Hemlock Woolly Adelgid Presentations
Cowles et al. _________________________________________________________________________________
170
bark corer. The injection plug was then inserted as before, and the needle inserted throughthe plug into the small diameter hole. Unlike the fall application, the application in the springresulted in easily observable separation of the bark at the cambium layer where imidaclopridsuspension was being deposited. Weighing the insecticide reservoir bottle before and afterapplication with a portable electronic centigram balance allowed determination of the amountof product injected into each tree. Calibration marks on the Wedgle device were found to notcorrectly represent the volume of liquid being injected into the tree, so additional pressuriza-tions (four per injection site) were used to compensate.
Cold temperatures during the winter resulted in HWA mortality at study sites in nearbyuntreated trees of 85-95%. Therefore, mortality was not evaluated for the overwinteringgeneration but delayed until July 7-15, when following (progrediens) stage had developed.Mortality was also assessed in late November, 2003, and mid-December, 2004. In July, shootswith adelgids were brought back to the laboratory in a cooler and evaluated under a dissect-ing microscope. Adelgids were probed to determine whether there was movement of legs ormouthparts, and the numbers of living and dead adelgids were counted from a sample of 100individuals per tree. In the November and December assessments, five shoots were cut fromthe lower canopy, and five shoots from a height of 20-30 feet. Adelgids were counted on eachshoot, up to a total of ten adelgids per shoot. The total for the ten samples then constituted a1-100 infestation rating.
We used an immunological method to measure imidacloprid residues (EnviroLogix,2003) to compare with mortality data. Sap from hemlock branches was expressed from 20-50cm long shoots on May 2-6, July 7-15, and August 20-27, 2003, using a hyperbaric chamberpressurized with nigrogen to ~200 p.s.i. with nitrogen. Sap collected with a pipette requiredno additional clean-up procedure before being tested with the EnviroLogix ELISA kit. Vol-umes of 250 – 700 µl were obtained for each sample with 100 µl required for imidaclopriddetermination. Sap samples were kept frozen once they were brought to the lab.
RESULTS AND DISCUSSION
Site variability and natural mortality affected adelgid survival and obscured insecticide treat-ment effects in the July assessment. Adelgid mortality ranged from an average of 64% for theWedgle-treated trees to 80% for the Kioritz, near-trunk imidacloprid placement. Adelgids inthe untreated check trees experienced 69% mortality.
November, 2003, and December, 2004, evaluations of adelgid populations determinedthat fall and spring application timing did not significantly differ. The November 2003 evalu-ations determined that soil applications resulted in an average population suppression of 79%relative to the untreated check. The Kioritz near-trunk placement of Merit in the fall of 2002resulted in 100% mortality of adelgids as measured 13 months later. Suppression of adelgidswith the soil applications improved further over the next year, resulting in an average of98.5% reduction compared to the untreated check. Four of the six treatment combinationsfor soil application resulted in non-detectable HWA populations on the treated trees 18-26months post-treatment.
________________________________________ Comparing Systemic Imidacloprid Application Methods
Presentations Third Symposium on Hemlock Woolly Adelgid
171
In contrast to the soil applications of imidacloprid, trunk injections did not result insignificant reductions in adelgid populations, either in the 2003 or 2004 evaluations. Of thetrunk injection methods, the Mauget system resulted in populations that were intermediate invalue and not significantly different from either the untreated check or the soil applicationtreatments.
The ELISA assay of sap indicated that soil-based application of imidacloprid resulted ingood mobilization and persistence in branches. With the Mauget system injections, a rela-tively short-lived, highly concentrated peak of imidacloprid was found in sap of some branches.Residues from the other two trunk injection methods were of low concentration.
The Mauget System allows visual monitoring of uptake of the formulated product intothe tree—however, on many occasions the 3 ml capsules did not empty into the tree and hadto be removed in spite of the lack of uptake. Capsules are pressurized, so any material nottaken into the tree was lost onto the bark of the tree when the feeder tube was removed,making accurate measurement of uptake impossible. Uptake was very poor in the spring,and better, but variably successful, in the fall.
The Arborjet System provided the most complete feedback to operators regarding themovement of insecticide into the tree at the time of injection. Both the ability of the tree toaccept the formulated product and the volume of product applied are easily monitored: thefirst through the pressure gauge attached to the injection needle, and the second through theinjection reservoir calibrated in milliliters.
The imidacloprid test kits have proved to be an effective method for analysis of residuesfrom hemlock sap. Concentrations can be quantified from 0.5 - 5 ppb, requiring considerabledilution and repeat testing for higher concentration samples. Non-specific binding results invalues of imidacloprid from sap ranging up to 5 ppb, so at least a 1:10 dilution is required andquantitation of imidacloprid below 5 ppb is not possible with this method. The results haveto be considered as semi-quantitative for imidacloprid because some of its metabolites arealso detected (though to a lesser degree than the parent compound). It is adaptable for analy-sis of tissue (needle and twig) samples and the results can be read with a relatively inexpensivescanner and image measurement software.
SUMMARY
Trunk injection methods were less effective for control of HWA than near-trunk soil place-ment of imidacloprid. Efficacy of injections might be improved if the resulting short dura-tion of mobilization in sap is timed to closely match peak feeding activity of adelgids (e.g.,mid-April). The soil applications resulted in long-term moderate concentrations ofimidacloprid in the sap, which may be responsible for the reliable, highly effective suppres-sion of HWA populations. The ability of soil application of imidacloprid to provide mul-tiple-year control of HWA must be balanced with the cost of this treatment and its potentialto harm non-target aquatic organisms. Analyses of hemlock tissue foliage on untreated treesin this study determined that significant lateral and down-slope movement of imidacloprid
Third Symposium on Hemlock Woolly Adelgid Presentations
Cowles et al. _________________________________________________________________________________
172
can occur when imidacloprid is applied in water-saturated forest soil (data not shown). In-secticide treatment should be considered a stop-gap measure to preserve trees that are ofexceptional value until such time that biological control becomes established.
ACKNOWLEDGMENTS
We would like to thank Rose Hiskes and Mary Frost for technical assistance, and Brad Onkenand the US Forest Service Forest Health Management program for supporting this research.This work was funded through grant #03-CA-11244225-187, awarded by the NortheasternArea State and Private Forestry, USDA Forest Service.
DISCLAIMER
Use of a product name does not imply endorsement of the product to the exclusion of othersthat may also be suitable.
REFERENCES
Cowles, R.S. and C.A.S.-J. Cheah. 2002. Systemic control of hemlock woolly adelgid,1999. Arthropod Management Tests 27: G47.
Doccola, J.J., P.M. Wild, I. Ramasamy, P. Castillo, and C. Taylor. 2003. Efficacy ofArborjet VIPER microinjections in the management of hemlock woolly adelgid. J.Arboric. 29:327–330.
Envirologix. 2003. www.envirologix.com/library/ep006spec.pdf.
Webb, R. E., Frank, J. R. and M. J. Raupp. 2003. Eastern hemlock recovery from hemlockwoolly adelgid damage following imidacloprid therapy. J. Arboric. 29:298–302.
________________________________ Potential Concerns for Tree Wound Response from Stem Injection
Presentations Third Symposium on Hemlock Woolly Adelgid
173
POTENTIAL CONCERNS FOR TREE WOUND RESPONSE FROM STEM INJECTION
Kevin T. Smith1 and Phillip A. Lewis2
1USDA Forest Service, Northeastern Research Station,271 Mast Road, Durham, NH 03824
2USDA Animal and Plant Health Inspection Service,Pest Survey, Detection and Exclusion Laboratory,
Building 1398, Otis ANGB, MA 02542
ABSTRACT
Stem injection of imidacloprid is an available component of management strategies for hem-lock woolly adelgid. Preliminary observations of similar treatments of maple and ash showthat the injury sustained by injection warrants investigation of the wound response in easternhemlock. Such investigations need adequate experimental controls to identify the role ofphytoxicity of the active ingredient and the carrier formulation, delivery pressure, seasonal-ity, and tree condition. External indicators such as bark cracks tend to underestimate theamount of cambial dieback. Evaluation of the wound response requires tree dissection. Wesuggest that the unintended consequences of treatment such as injection injury be consideredand incorporated into the management decision process.
KEYWORDS
Stem injection, tree injection, compartmentalization, imidacloprid.
INTRODUCTION
Hemlock woolly adelgid (HWA), Adelges tsugae Annand, is an aphid-like insect pest that cankill mature eastern hemlock, Tsuga canadense (L.) Carr., trees within a few years of infesta-tion. HWA is one of a growing list of introduced insect pests that threaten wild, managed,and urban forests in the eastern United States. Because of the widespread occurrence andimportance of eastern hemlock, diverse strategies to manage HWA are being tested, includingpest exclusion, roguing of infested individuals, biological control through the release of preda-tors and parasitoids, and the application of chemical insecticides. Although some combina-tion of cultural practices and biological control may eventually protect susceptible forestsfrom HWA, chemical insecticides will likely continue to be used over the next years to reduceHWA severity and spread.
The direct injection of chemical treatments into trees through stem injection has a longhistory. In recent years, concern over spray drift and the runoff from sprays and soil applica-tions of insecticides has renewed attention to stem injection. Imidacloprid (a chloro-nicotinylinsecticide) in various formulations is the primary insecticide being injected to control HWA
Third Symposium on Hemlock Woolly Adelgid Presentations
Smith and Lewis ______________________________________________________________________________
174
and other introduced, invasive pests. Stem injections are part of tests or control strategies forHWA in Pennsylvania, Massachusetts, and Connecticut. The appeal of stem injection lies inthe expectation of the delivery of effective doses into targeted tissues (such as branchlets inthe case of HWA) throughout the tree translocation system with few or no nontarget effectsand a high degree of social acceptance. That appeal, coupled to the potential commercial prof-itability of the technique suggests that stem injection will continue to be considered as a treat-ment option for trees infested or threatened by HWA.
The biological tradeoff with stem injection is that the tree is wounded in the course oftreatment (Smith 1988). Although the size of the mechanical wound made during injectionmay be small, the treatment chemical and the application pressures can greatly increase theseverity of wound-initiated discoloration and cambial dieback associated with an injection(Shigo et al. 1977).
Tests of efficacy of chemical formulation and injection methods generally focus on therecovery of the treatment chemical or its metabolites from the targeted plant part with someattention given to comparisons of infestation intensity and growth recovery. Rarely do testsof efficacy of injected pesticides include evaluation of the effects of tree injury and woundresponse, particularly for recently introduced injection technology.
Should the wound response of hemlock injected with imidacloprid or other insecticidesbe investigated? No critical dissection studies of injected eastern hemlock stems have beenpublished at this time. However, observations of injected and dissected red maple (Acer rubrumL.), sugar maple (Acer saccharum Marsh.), and white ash (Fraxinus americana L.) may focusattention on what should be looked for in future field trials of various injection techniques inhemlock.
METHODS
Sugar maple and white ash dissected for this study were part of a larger trial of the systemicdistribution of imidacloprid administered by stem injection at the Mount Greylock StateReservation in Lanesborough, Massachusetts. Trees selected for injection in 2002 were 30-40cm DBH and growing along the access roadway at the reserve. Injections were made byprofessional applicators experienced in the methods used. Although the trees were vigorousand apparently healthy, they were likely under moisture stress at the time of injection, mak-ing them less than ideal sample trees for testing. Trees were injected in mid August whilefollowing the manufacturer recommendations in effect at the time using one of two steminjection methods. The two methods represent two different types of injection schemes. Forboth systems, injection sites were usually located at the trunk flare, 10-30 cm above groundline. With the Arborjet Viper System (Arborjet Inc., Winchester, Massachusetts), each injec-tion site was prepared by drilling an 8-mm-diameter hole along the stem radius to a depth ofabout 4 cm into the sapwood. The hole was snugly fitted with a proprietary brass injectionport (a prototype of the current plastic Arborplug). Injection sites were distributed along aspiral around the circumference of the lower stem. The number of injection sites was calcu-lated as one-half the stem diameter at DBH, in inches. A proprietary 5% imidacloprid solu-
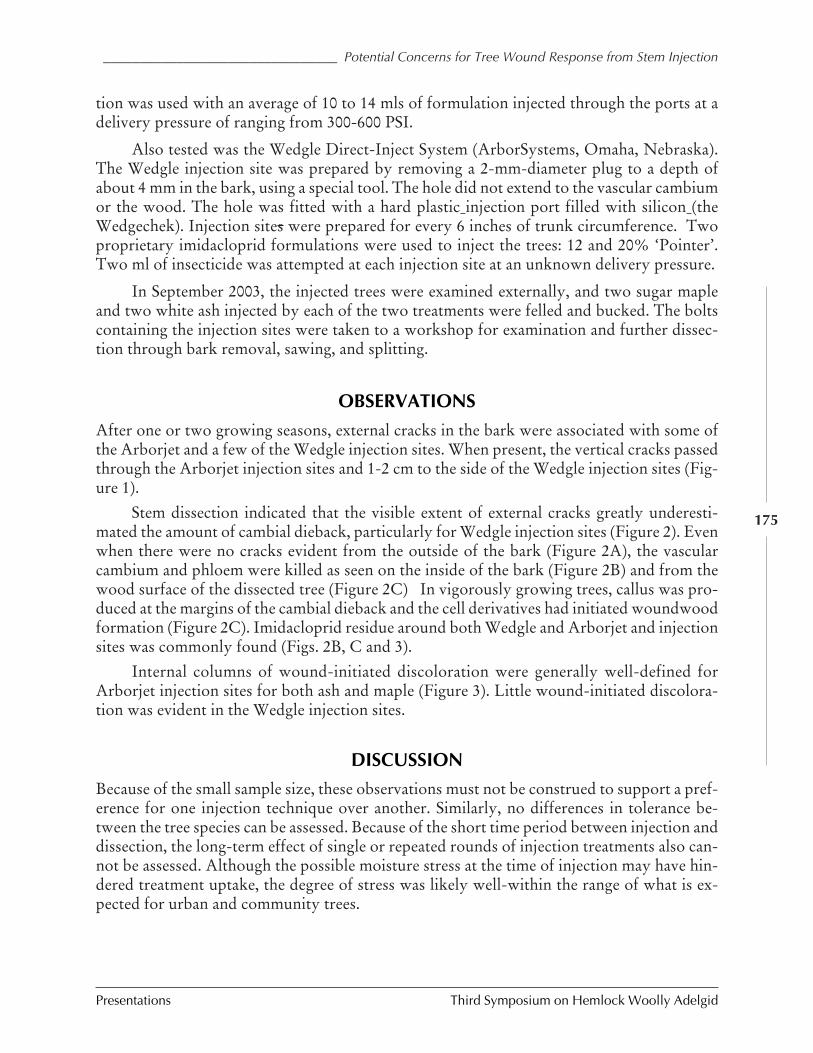
________________________________ Potential Concerns for Tree Wound Response from Stem Injection
Presentations Third Symposium on Hemlock Woolly Adelgid
175
tion was used with an average of 10 to 14 mls of formulation injected through the ports at adelivery pressure of ranging from 300-600 PSI.
Also tested was the Wedgle Direct-Inject System (ArborSystems, Omaha, Nebraska).The Wedgle injection site was prepared by removing a 2-mm-diameter plug to a depth ofabout 4 mm in the bark, using a special tool. The hole did not extend to the vascular cambiumor the wood. The hole was fitted with a hard plastic injection port filled with silicon (theWedgechek). Injection sites were prepared for every 6 inches of trunk circumference. Twoproprietary imidacloprid formulations were used to inject the trees: 12 and 20% ‘Pointer’.Two ml of insecticide was attempted at each injection site at an unknown delivery pressure.
In September 2003, the injected trees were examined externally, and two sugar mapleand two white ash injected by each of the two treatments were felled and bucked. The boltscontaining the injection sites were taken to a workshop for examination and further dissec-tion through bark removal, sawing, and splitting.
OBSERVATIONS
After one or two growing seasons, external cracks in the bark were associated with some ofthe Arborjet and a few of the Wedgle injection sites. When present, the vertical cracks passedthrough the Arborjet injection sites and 1-2 cm to the side of the Wedgle injection sites (Fig-ure 1).
Stem dissection indicated that the visible extent of external cracks greatly underesti-mated the amount of cambial dieback, particularly for Wedgle injection sites (Figure 2). Evenwhen there were no cracks evident from the outside of the bark (Figure 2A), the vascularcambium and phloem were killed as seen on the inside of the bark (Figure 2B) and from thewood surface of the dissected tree (Figure 2C) In vigorously growing trees, callus was pro-duced at the margins of the cambial dieback and the cell derivatives had initiated woundwoodformation (Figure 2C). Imidacloprid residue around both Wedgle and Arborjet and injectionsites was commonly found (Figs. 2B, C and 3).
Internal columns of wound-initiated discoloration were generally well-defined forArborjet injection sites for both ash and maple (Figure 3). Little wound-initiated discolora-tion was evident in the Wedgle injection sites.
DISCUSSION
Because of the small sample size, these observations must not be construed to support a pref-erence for one injection technique over another. Similarly, no differences in tolerance be-tween the tree species can be assessed. Because of the short time period between injection anddissection, the long-term effect of single or repeated rounds of injection treatments also can-not be assessed. Although the possible moisture stress at the time of injection may have hin-dered treatment uptake, the degree of stress was likely well-within the range of what is ex-pected for urban and community trees.
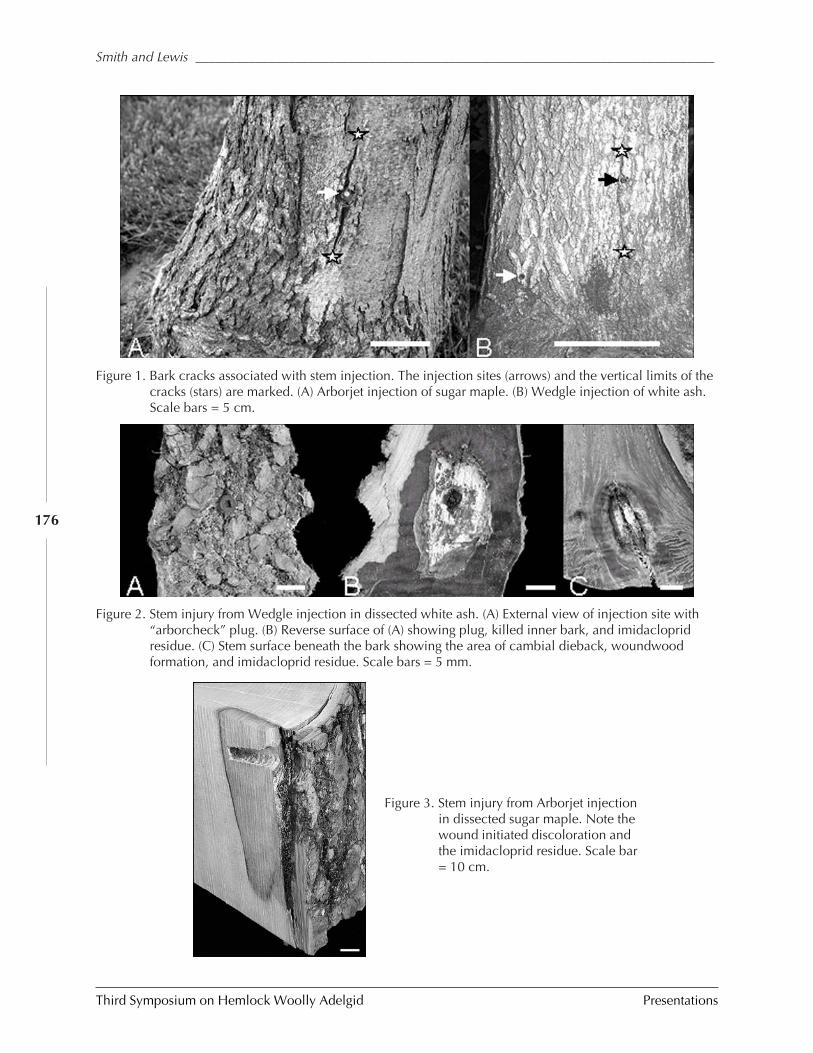
Third Symposium on Hemlock Woolly Adelgid Presentations
Smith and Lewis ______________________________________________________________________________
176
Figure 3. Stem injury from Arborjet injectionin dissected sugar maple. Note thewound initiated discoloration andthe imidacloprid residue. Scale bar= 10 cm.
Figure 1. Bark cracks associated with stem injection. The injection sites (arrows) and the vertical limits of thecracks (stars) are marked. (A) Arborjet injection of sugar maple. (B) Wedgle injection of white ash.Scale bars = 5 cm.
Figure 2. Stem injury from Wedgle injection in dissected white ash. (A) External view of injection site with“arborcheck” plug. (B) Reverse surface of (A) showing plug, killed inner bark, and imidaclopridresidue. (C) Stem surface beneath the bark showing the area of cambial dieback, woundwoodformation, and imidacloprid residue. Scale bars = 5 mm.
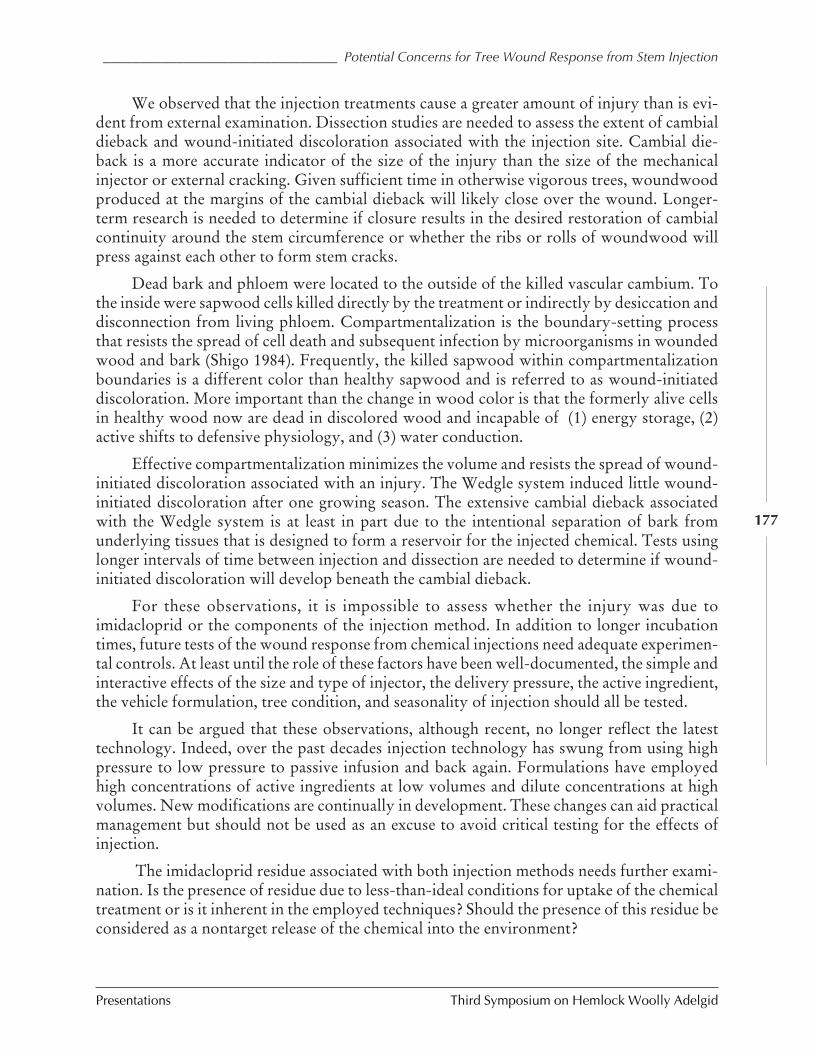
________________________________ Potential Concerns for Tree Wound Response from Stem Injection
Presentations Third Symposium on Hemlock Woolly Adelgid
177
We observed that the injection treatments cause a greater amount of injury than is evi-dent from external examination. Dissection studies are needed to assess the extent of cambialdieback and wound-initiated discoloration associated with the injection site. Cambial die-back is a more accurate indicator of the size of the injury than the size of the mechanicalinjector or external cracking. Given sufficient time in otherwise vigorous trees, woundwoodproduced at the margins of the cambial dieback will likely close over the wound. Longer-term research is needed to determine if closure results in the desired restoration of cambialcontinuity around the stem circumference or whether the ribs or rolls of woundwood willpress against each other to form stem cracks.
Dead bark and phloem were located to the outside of the killed vascular cambium. Tothe inside were sapwood cells killed directly by the treatment or indirectly by desiccation anddisconnection from living phloem. Compartmentalization is the boundary-setting processthat resists the spread of cell death and subsequent infection by microorganisms in woundedwood and bark (Shigo 1984). Frequently, the killed sapwood within compartmentalizationboundaries is a different color than healthy sapwood and is referred to as wound-initiateddiscoloration. More important than the change in wood color is that the formerly alive cellsin healthy wood now are dead in discolored wood and incapable of (1) energy storage, (2)active shifts to defensive physiology, and (3) water conduction.
Effective compartmentalization minimizes the volume and resists the spread of wound-initiated discoloration associated with an injury. The Wedgle system induced little wound-initiated discoloration after one growing season. The extensive cambial dieback associatedwith the Wedgle system is at least in part due to the intentional separation of bark fromunderlying tissues that is designed to form a reservoir for the injected chemical. Tests usinglonger intervals of time between injection and dissection are needed to determine if wound-initiated discoloration will develop beneath the cambial dieback.
For these observations, it is impossible to assess whether the injury was due toimidacloprid or the components of the injection method. In addition to longer incubationtimes, future tests of the wound response from chemical injections need adequate experimen-tal controls. At least until the role of these factors have been well-documented, the simple andinteractive effects of the size and type of injector, the delivery pressure, the active ingredient,the vehicle formulation, tree condition, and seasonality of injection should all be tested.
It can be argued that these observations, although recent, no longer reflect the latesttechnology. Indeed, over the past decades injection technology has swung from using highpressure to low pressure to passive infusion and back again. Formulations have employedhigh concentrations of active ingredients at low volumes and dilute concentrations at highvolumes. New modifications are continually in development. These changes can aid practicalmanagement but should not be used as an excuse to avoid critical testing for the effects ofinjection.
The imidacloprid residue associated with both injection methods needs further exami-nation. Is the presence of residue due to less-than-ideal conditions for uptake of the chemicaltreatment or is it inherent in the employed techniques? Should the presence of this residue beconsidered as a nontarget release of the chemical into the environment?
Third Symposium on Hemlock Woolly Adelgid Presentations
Smith and Lewis ______________________________________________________________________________
178
How might these findings be different for eastern hemlock? Previous studies indicatethat the tracheid system in conifers can require higher injection pressures for treatment up-take (Sanchez-Zamora and Fernandez-Escobar 2004 ), causing greater injury. Compartmen-talization in conifers usually involves enhanced biosynthesis of terpenes and resin produc-tion, which can complicate the assessment of effectiveness of compartmentalization.
We suggest that stem injection as well as other measures to control or manage HWA beconsidered using a treatment matrix that contains the overlapping dimensions of efficacy,consequences of inaction, the frequency of repeated treatments, direct economic cost, avail-ability of alternative treatments, social acceptance, and unintended consequences of treat-ments to include the tree wound response.
ACKNOWLEDGEMENTS
We thank Kenneth A. Gooch (Massachusetts Bureau of Forestry, Pittsfield, Massachusetts)for his assistance with the tree dissections.
REFERENCES
Shigo, A.L. 1984. Compartmentalization: a conceptual framework for understanding howtrees grow and defend themselves. Annual Review of Phytopathology 22:189-214.
Shigo, A.L. W.E. Money, and D. Dodds. 1977. Some internal effects of Mauget tree injec-tions. Journal of Arboriculture 3:213-220.
Sanchez-Zamora, M.A. and R. Fernandez-Escobar. 2004. Uptake and distribution of trunkinjections in conifers. Journal of Arboriculture 30:73-79.
Smith, K.T. 1988. Wounding, compartmentalization, and treatment tradeoffs. Journal ofArboriculture 14:226-229.
__________________________ Resistance of Hemlock to Adelges tsugae: Promishing New Developments
Presentations Third Symposium on Hemlock Woolly Adelgid
179
RESISTANCE OF HEMLOCK TO ADELGES TSUGAE:PROMISING NEW DEVELOPMENTS
Michael E. Montgomery1, Anthony F. Lagalante2, and Kathleen S. Shields1
1USDA Forest Service, Northeastern Center for Forest Health Research
51 Mill Pond Road, Hamden, CT 06514
2Villanova University, Department of Chemistry,800 Lancaster Avenue, Villanova, PA 19085
ABSTRACT
Hemlock (Tsuga) species native to western North America and Asia are considered to havesome degree of resistance to feeding by hemlock woolly adelgid, Adelges tsugae Annand. Wecompared the resistance of seven hemlock species growing in arboreta in the northeasternU.S. to Adelges tsugae Annand by artificially infesting trees with A. tsugae ovisacs and subse-quently counting the number of progrediens (same generation) and sistens (next generation)that developed. Based on this assessment, the most resistant species was T. chinensis (Franch.)E. Pritz, followed (in declining order) by T. diversifolia (Maxim.) Mast and T. mertensiana(Bong.) Carrière; T. sieboldii Carrière and T. heterophylla (Raf.) Sarg.; and lastly, T. canadensis(L.) Carrière and T. caroliniana Engelm. Aphids and other insect families in the Aphidoidea,which includes adelgids, are known to have a limited tolerance to some terpenoids. Analysisof terpenoids from the hemlock species under study showed that three interspecific group-ings were evident: 1) T. canadensis and T. caroliniana, 2) T. chinensis, T. sieboldii, T. diversifolia,and T. heterophylla, and 3) T. mertensiana. Analysis of terpenoids in T. canadensis tissuesshowed that terpenoid concentrations are lower in the tissues in which A. tsugae feeds (theleaf cushion) than in the needles, and terpenoid concentrations are higher in developing needlesand leaf cushions than in the respective tissues after they have matured. Terpenoid profiles inTsuga may correspond to the relative susceptibility/resistance of species to A. tsugae and theinsect may decrease its exposure to certain terpenoids by feeding in the leaf cushion and avoidingdeveloping tissues.
Third Symposium on Hemlock Woolly Adelgid Presentations
Tighe et al. ___________________________________________________________________________________
180
THE EX SITU CONSERVATION OF CAROLINA HEMLOCK
M.E. Tighe1, W.S. Dvorak1, W.A. Whittier1, J.L. Romero2, and J.R. Rhea3
1Camcore, North Carolina State University, Raleigh, NC 27695-7626
2 formerly of Camcore, North Carolina State University, Raleigh, NC 27695-7626
3Forest Health Protection, USDA Forest Service, Asheville, NC 28802
ABSTRACT
Carolina hemlock (Tsuga caroliniana Engelm.) is a species represented by several small tomoderately sized, isolated populations in the Appalachian Mountains and upper Piedmontfrom northeastern Georgia to southern Virginia. Over the last several years, there has beengreat concern about the destruction of Carolina hemlock by the hemlock woolly adelgid(HWA), Adelges tsugae Annand, a pest introduced from Asia into the United States in 1926.Conservation approaches are needed to protect dwindling populations of Carolina hemlockas forest entomologists attempt to find ways to limit the future damage caused by the HWA.In a collaborative effort between Camcore, North Carolina State University (NCSU) and theUS Forest Service, seeds of 64 trees from nine populations of Carolina hemlock in North andSouth Carolina were collected in 2003 as part of ex situ conservation attempt to move thespecies to more protected areas where HWA is not present. Floramap®, a climatic model thatpredicts where new populations of a species should survive, indicated that central Chile andsouthern Brazil were potential planting locations. In preparation for seed transport overseas,a small fumigation experiment was conducted. Results indicate that Carolina hemlock seedfumigated at the application rate of 2.5g/m3 aluminum phosphide for six days at 17-20°C doesnot harm seed germination and is an acceptable method for seed treatment. With respect tosowing seeds in nurseries in Latin America, research at NCSU suggests that Carolina hem-lock should be germinated on moist paper, not moist sand, and that length of stratification at4.5° C (0 to 90 days) has little affect on germination rates. Plans to enlarge the existing geneticbase for ex situ conservation failed in 2004 because of poor cone crops in natural stands, but asecond attempt will be made to sample additional populations in Virginia, Georgia and Ten-nessee in 2005. Under this worst-case scenario, genetic material of hemlock from Latin Americacould someday be returned to the US to repopulate lost Carolina hemlock stands once thetechnology to control the insect has improved.
KEYWORDS
Ex situ conservation, stratification, germination, fumigation, Camcore.
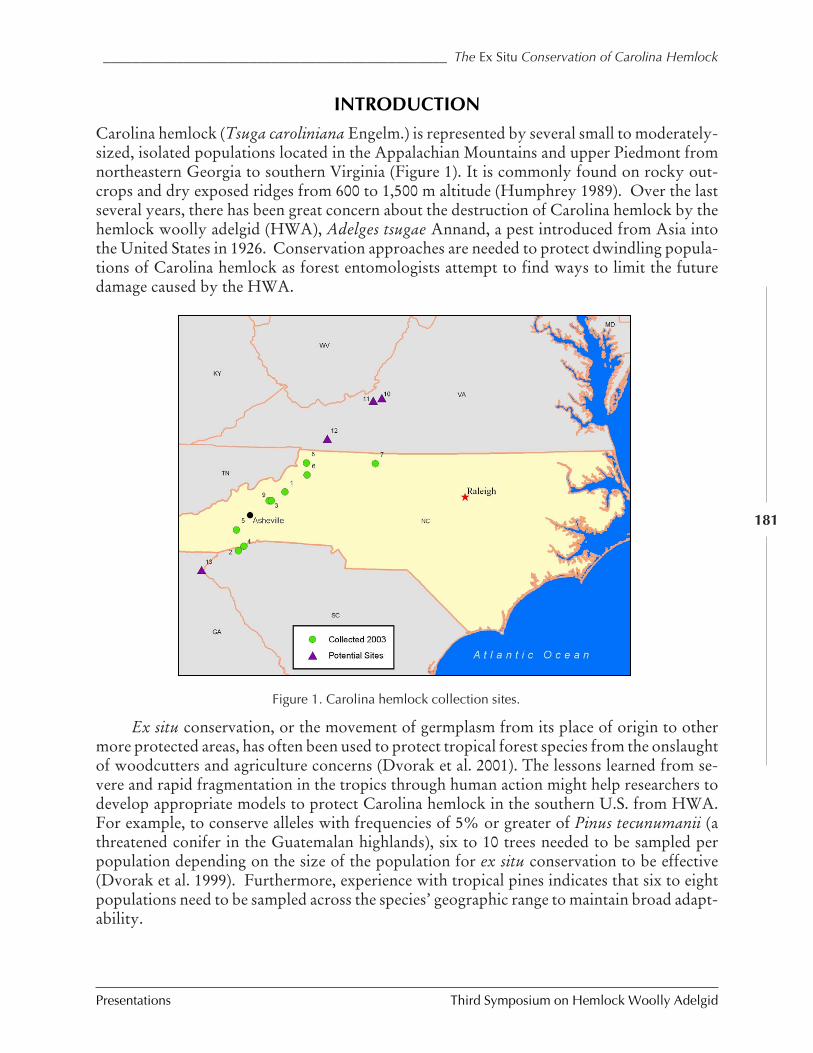
_______________________________________________ The Ex Situ Conservation of Carolina Hemlock
Presentations Third Symposium on Hemlock Woolly Adelgid
181
INTRODUCTION
Carolina hemlock (Tsuga caroliniana Engelm.) is represented by several small to moderately-sized, isolated populations located in the Appalachian Mountains and upper Piedmont fromnortheastern Georgia to southern Virginia (Figure 1). It is commonly found on rocky out-crops and dry exposed ridges from 600 to 1,500 m altitude (Humphrey 1989). Over the lastseveral years, there has been great concern about the destruction of Carolina hemlock by thehemlock woolly adelgid (HWA), Adelges tsugae Annand, a pest introduced from Asia intothe United States in 1926. Conservation approaches are needed to protect dwindling popula-tions of Carolina hemlock as forest entomologists attempt to find ways to limit the futuredamage caused by the HWA.
Figure 1. Carolina hemlock collection sites.
Ex situ conservation, or the movement of germplasm from its place of origin to othermore protected areas, has often been used to protect tropical forest species from the onslaughtof woodcutters and agriculture concerns (Dvorak et al. 2001). The lessons learned from se-vere and rapid fragmentation in the tropics through human action might help researchers todevelop appropriate models to protect Carolina hemlock in the southern U.S. from HWA.For example, to conserve alleles with frequencies of 5% or greater of Pinus tecunumanii (athreatened conifer in the Guatemalan highlands), six to 10 trees needed to be sampled perpopulation depending on the size of the population for ex situ conservation to be effective(Dvorak et al. 1999). Furthermore, experience with tropical pines indicates that six to eightpopulations need to be sampled across the species’ geographic range to maintain broad adapt-ability.
Third Symposium on Hemlock Woolly Adelgid Presentations
Tighe et al. ___________________________________________________________________________________
182
Because of the rapid progression of the HWA and the urgent need to protect dwindlinggene pools of Carolina hemlock in the southern U.S., Camcore (an international tree conser-vation and domestication program at North Carolina State University) and the US ForestService have embarked upon a collaborative program to move representative seed samples ofCarolina hemlock to Latin America where the HWA is not present. The goal of the ex situconservation efforts is to plant small field conservation banks as a future source of geneticmaterial to be utilized if the HWA is found to be unstoppable in the U.S. Under this worst-case scenario, genetic material of hemlock from Latin America could someday be returned tothe U.S. to repopulate lost Carolina hemlock stands once the technology to control the insecthas improved.
For this progressive ex situ conservation approach to work, a reasonably sized geneticbase needs to be sampled from native populations of Carolina hemlock, good species-sitematches need to be made in the new environment, and the knowledge of nursery and fieldsilviculture must be of a sufficiently high level to successfully grow the species in an exoticenvironment. This paper explores these issues and summarizes initial Camcore/USDA For-est Service efforts to develop a workable ex situ conservation program for Carolina hemlock.
MATERIALS AND METHODS
Information about potential Carolina hemlock collection sites was gathered from personnelat the U.S. Forest Service and numerous professional foresters throughout the region. Prior-ity in the first year of collection (2003) was given to natural stands in North and South Caro-lina. A total of 64 trees in nine populations were sampled (Table 1). Trees were selected withina stand based on availability of cones. A distance of 50 meters was kept between selected treeswhenever possible. Selected trees were measured for height and diameter, and then clearlymarked with numbered aluminum identification tags. The geographical coordinates for eachtree were recorded with a GPS receiver to allow further research or future recollection. Eachtree was then rated for cone abundance (High or Low), crown class (Suppressed, Intermedi-ate, Co-dominant, or Dominant), and adelgid presence (None, Low, Medium, or High). Thecones were harvested from the lower branches of the trees with a pole pruner and placed inclearly marked cotton bags for transport to NCSU. Upon arrival, cones were transferredinto large, lightweight cotton bags and placed in a dry, well-ventilated greenhouse chamberto promote cone opening. After approximately 3 weeks, seeds were extracted from the conesusing a research-capacity shaker box, dewinged, and cleaned from debris with a standard seedblower. Seed was then transferred to a laboratory refrigerator and stored at 4.5°C.
To ensure that seeds of Carolina hemlock could be shipped internationally for ex situconservation without problems, two experiments were initiated to better determine seed han-dling methods. These dealt with a) stratification and seed germination and b) aluminum phos-phide fumigation. There was great concern about the response of Carolina hemlock seeds tofumigation prior to international seed shipment, a phytosanitary requirement of many coun-tries in Latin America where the seeds could be sent. The two experiments are describedbelow.
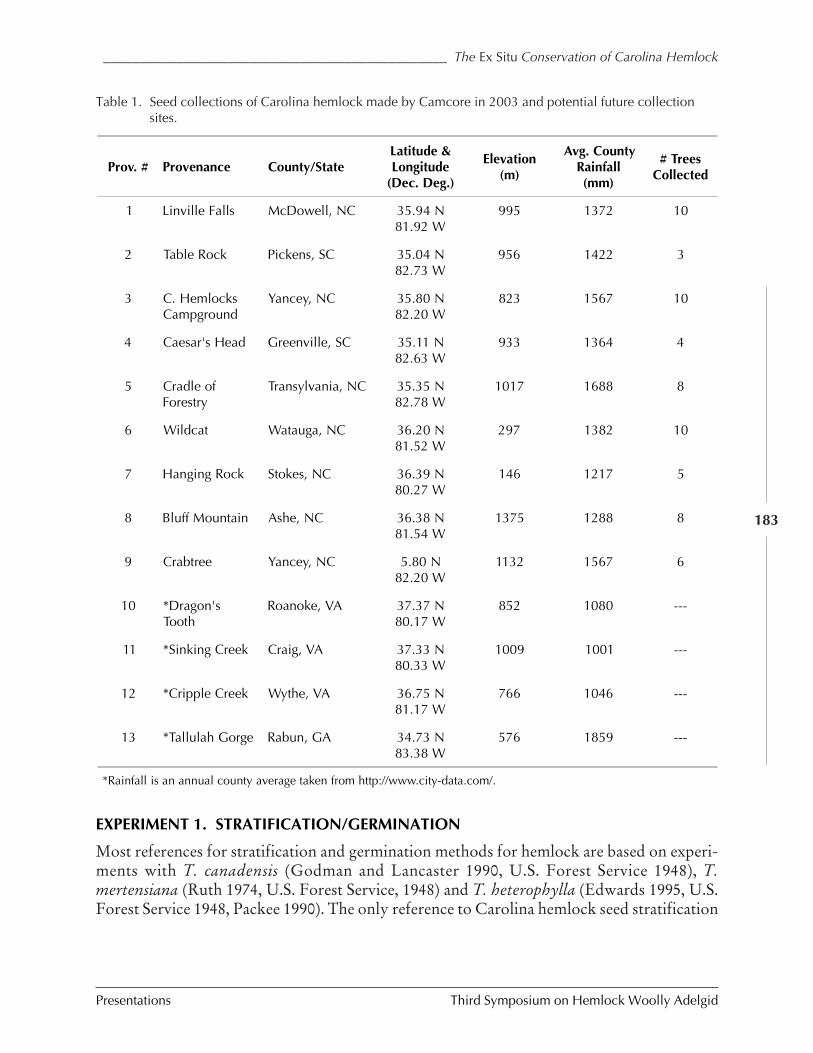
_______________________________________________ The Ex Situ Conservation of Carolina Hemlock
Presentations Third Symposium on Hemlock Woolly Adelgid
183
Table 1. Seed collections of Carolina hemlock made by Camcore in 2003 and potential future collectionsites.
Prov. # Provenance County/StateLatitude &Longitude
(Dec. Deg.)
Elevation(m)
Avg. CountyRainfall(mm)
# TreesCollected
1 Linville Falls McDowell, NC 35.94 N81.92 W
995 1372 10
2 Table Rock Pickens, SC 35.04 N82.73 W
956 1422 3
3 C. HemlocksCampground
Yancey, NC 35.80 N82.20 W
823 1567 10
4 Caesar's Head Greenville, SC 35.11 N82.63 W
933 1364 4
5 Cradle ofForestry
Transylvania, NC 35.35 N82.78 W
1017 1688 8
6 Wildcat Watauga, NC 36.20 N81.52 W
297 1382 10
7 Hanging Rock Stokes, NC 36.39 N80.27 W
146 1217 5
8 Bluff Mountain Ashe, NC 36.38 N81.54 W
1375 1288 8
9 Crabtree Yancey, NC 5.80 N82.20 W
1132 1567 6
10 *Dragon'sTooth
Roanoke, VA 37.37 N80.17 W
852 1080 ---
11 *Sinking Creek Craig, VA 37.33 N80.33 W
1009 1001 ---
12 *Cripple Creek Wythe, VA 36.75 N81.17 W
766 1046 ---
13 *Tallulah Gorge Rabun, GA 34.73 N83.38 W
576 1859 ---
*Rainfall is an annual county average taken from http://www.city-data.com/.
EXPERIMENT 1. STRATIFICATION/GERMINATION
Most references for stratification and germination methods for hemlock are based on experi-ments with T. canadensis (Godman and Lancaster 1990, U.S. Forest Service 1948), T.mertensiana (Ruth 1974, U.S. Forest Service, 1948) and T. heterophylla (Edwards 1995, U.S.Forest Service 1948, Packee 1990). The only reference to Carolina hemlock seed stratification
Third Symposium on Hemlock Woolly Adelgid Presentations
Tighe et al. ___________________________________________________________________________________
184
found for this study suggests that treating seed for 30 days @ 4°C on a moist paper towel,then sowing on a 1:1 coarse sand-potting soil medium, and covering pots with plastic filmimproves germination (Brown 2002). Recommendations from the past research listed aboveguided us in the development of seed treatments for Carolina hemlock.
For the stratification experiment, media (sand, paper, 24-hour water, or none) and daysin stratification (0, 1, 30, 60, or 90) were evaluated in order to determine the most effectivegermination method. A seedlot of commercial seed of western hemlock (Tsuga heterophylla)from British Columbia, Canada, was included as a control. The addition of western hemlockraised the total number of “provenances” to 10 (nine Carolina hemlock provenances pluswestern hemlock). After cone collection, seed was extracted and separated by mother tree,and provenance bulk seed packets were prepared. To create the provenance bulks, equalnumbers of seed were pooled from all trees collected in one population (e.g., Linville Falls) toreach 160 seeds. This seed was then divided into sixteen provenance bulk packets of 10 seedseach. These 16 packets were then separated into two groups of eight to comprise two replica-tions. Each provenance bulk seed packet (e.g., Linville Falls) was stored at 4.5°C and receivedone of the treatments listed below:
Replication 1—8 packetsControl (no moisture) Moist paper 30 days Moist paper 60 days Moist paper 90 days24-hr. water treatment Moist sand 30 days Moist sand 60 days Moist sand 90 days
Replication 2—8 packetsControl (no moisture) Moist paper 30 days Moist paper 60 days Moist paper 90 days24-hr. water treatment Moist sand 30 days Moist sand 60 days Moist sand 90 days
All seed received cold treatment during storage. Twenty provenance bulk seed packets(10 “provenances” x two replications) received moist sand, and 20 seed packets received moistpaper at the beginning of the experiment. Thirty and 60 days later, 20 more packets receivedthe same treatments (10 “provenances” x two replications at each time marker). Upon comple-tion of sand and paper stratification, an additional 20 packets were placed in water stratifica-tion for 24 hours, while the remaining 20 packets received no treatment (controls) other thanunmoistened cold stratification.
Following stratification, seed was sown and germination data were recorded and pro-cessed. Seed was removed from bags and planted in germination trays with a 1:1 coarse sand/MetromixTM media and dusted with vermiculite. Trays were watered and assessed for germi-nation daily for four weeks. Germination data were summed by provenance and treatment,then formatted and arcsine-transformed using SAS® Version 8e to normalize their distribu-tion and satisfy ANOVA prerequisites (SAS Handbook 1999). Western hemlock data wasremoved from the dataset to prevent biased results. The data from the stratification mediastudy were analyzed using PROC MEANS and PROC GLM at the ± = .05 level.
EXPERIMENT 2. FUMIGATION
Phytosanitary restrictions in many countries require that seeds be fumigated prior to ship-ment when originating in the U.S. due to specific pathogen risks. After a literature searchproved ineffective regarding fumigation effects on the germination of Carolina hemlock seed,a preliminary study was initiated at Camcore to expose hemlock seed to the various fumiga-
_______________________________________________ The Ex Situ Conservation of Carolina Hemlock
Presentations Third Symposium on Hemlock Woolly Adelgid
185
tion treatments required for shipment to Latin America and to evaluate their effect on seedgermination.
Generally, phytosanitary requirements for shipment of seeds to Latin America require adosage of 2.5g/m3 of aluminum phosphide or methyl bromide, but differ in the temperatureand duration of treatment. The four approved protocols meeting the strictest requirementsfor seed shipment to Latin America range along a gradient from the most severe of four daysat 26°C to the lightest treatment of seven days at 15°C commonly used for sensitive seed.Due to limitations at the fumigation facility, however, the lightest treatment (seven days at15°C) was not evaluated for this study. The protocols tested are listed in Table 2.
Seed was selected from three of the nine Carolina hemlock provenances collected, rep-resenting provenance bulks with high, medium, and low germination in previous tests. Four100-seed provenance bulks were made from each of the three Carolina hemlock provenanceschosen. Each 100-seed bulk had equal representation from all families collected from eachprovenance in 2003. A Tsuga heterophylla control of known germination rate from BritishColumbia, Canada, was added for comparison. Control packets of T. heterophylla containedonly 58 instead of 100 seeds due to limited seed availability.
After fumigation, seed was assessed for germination at NCSU. The seed was cold wa-ter-stratified for 24 hours, and then placed in germination trays under 24-hour illuminationwith 100 seeds per dish (only 58/dish for T. heterophylla). Germination was assessed daily,and seedlings were transplanted into ray leach tubes after germination for uses in adelgidscreening studies at Camcore.
FLORAMAP® TOOL AND SITE SELECTION PROCESS
To help determine where Carolina hemlock could be planted outside of its natural range forex situ conservation, the FloraMap® climatic model was used. FloraMap® was developed atthe Center for Tropical Agriculture (CIAT) by Jones and Gladkov (1999) to locate new popu-lations of native agriculture species. This model uses monthly average temperature, monthlydiurnal temperature, and average monthly precipitation from sites of known natural popula-tions to predict where similar climates and new populations might possibly occur. The ad-vantage of using Floramap® over other climatic models is that is has an extensive climaticdatabase for Latin America and Africa.
For our purposes we used Floramap® to predict where Carolina hemlock could beplanted and grown successfully rather than as a tool to identify where other populationsmight be found. The latitude/longitude coordinates of the 13 known Carolina hemlock popu-lations in the Appalachian Mountains and Upper Piedmont were entered into the database(Table 1) with temperature weighted slightly higher than rainfall; 1.13 to 0.90, respectively.Temperature was considered more important than rainfall because the species needs a coldperiod in order to produce seeds while precipitation is not a limiting factor in southern SouthAmerica. FloraMap® produced a worldwide map denoting pixels (18 sq. km) where the spe-cies had a 30% or greater probability of occurring (surviving).
Third Symposium on Hemlock Woolly Adelgid Presentations
Tighe et al. ___________________________________________________________________________________
186
RESULTS AND DISCUSSIONS
STRATIFICATION AND GERMINATION EXPERIMENT
Stratification media was found to significantly (p = 0.0105) affect germination in Carolinahemlock (Figure 2). The Paper vs. Sand treatments were significantly different (p = 0.0002).Seed stratified in sand had statistically lower germination than with the other media. Nosignificant differences were seen among Paper, 24-hour water, and Control stratification me-dia. Our results indicated that Carolina hemlock seed should not be germinated in moistsand.
Results also suggested stratification length had little effect on germination results (Fig-ure 3). The control treatment received no additional inputs beyond cold storage, as comparedto the treatment durations of 24-hr., 30 days, 60 days, or 90 days for the other treatments, butprovided statistically similar germination results. Based on these data, cold storage (4.5° C)of seed after collection will provide similar germination results, and additional stratification isnot necessary.
FUMIGATION EXPERIMENT
Germination percentages of Carolina hemlock seed subjected to different fumigation rates ofaluminum phosphide at 8 weeks are reported in Table 2.
Our results indicate that if Carolina hemlock seed must be fumigated using one of theseprotocols, the application rate of 2.5g/m3 aluminum phosphide for six days at 17-20°C shouldbe used. This method was clearly the least damaging to seed germination percentages com-pared to the controls. It must be noted, however, that the additional protocol for seven daysat 15°C was not evaluated for this study due to temperature control constraints, and thetrends here suggest that germination percentages for this treatment may exceed the results forsix days at 17-20°C.
FLORAMAP® SITE MATCHING
The FloraMap® model predicted that Carolina hemlock could be moved to the west coast ofOregon and Washington of the United States, areas in central Chile, and very restricted areasin southern Brazil. Eastern hemlock has been successfully established in trial plots on thewest coast of the U.S., and so the prediction of successful movement of Carolina hemlock tothat region seems to make sense.
Predictions for potential planting sites for Carolina hemlock in Brazil include the pla-teau region of Santa Catarina State from approximately 25 to 26° S latitude. The elevation ofthe plateau averages approximately 800 m, and the area receives approximately 50 frosts perwinter depending on the location. Average rainfall is between 1,500 and 1,800 mm per yearand relatively evenly distributed. The area is one of the most productive regions for growingPinus taeda (loblolly pine) in the world.
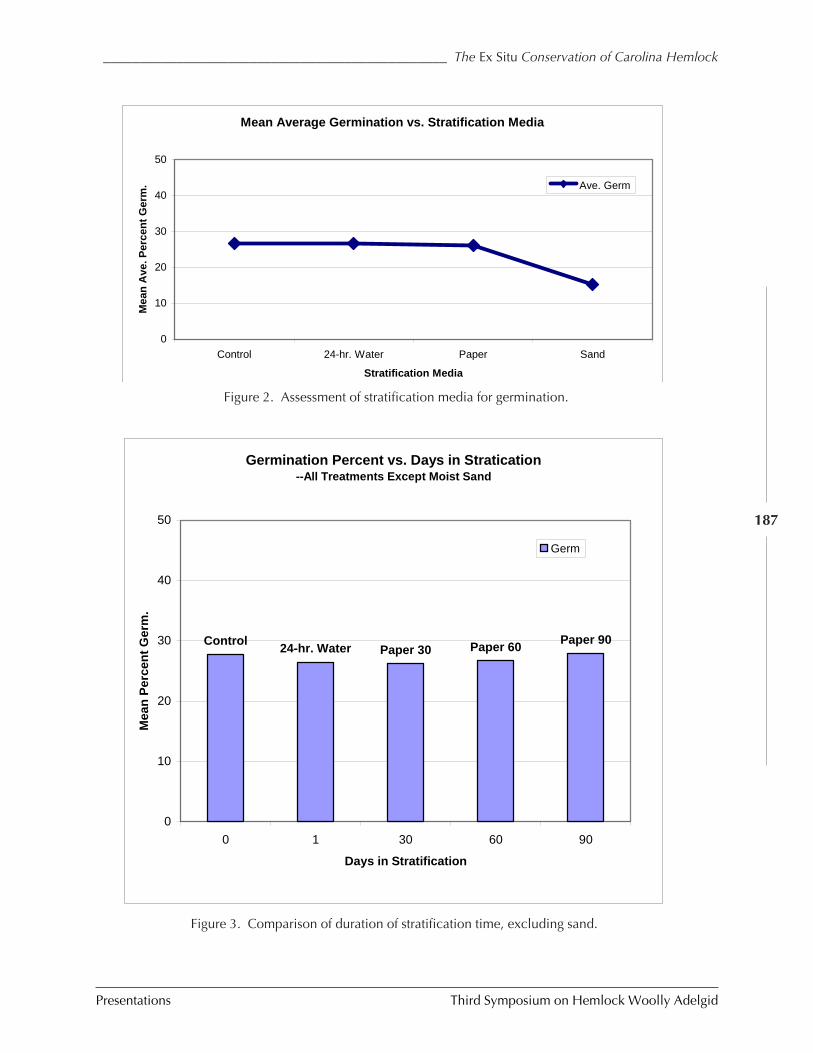
_______________________________________________ The Ex Situ Conservation of Carolina Hemlock
Presentations Third Symposium on Hemlock Woolly Adelgid
187
Mean Average Germination vs. Stratification Media
0
10
20
30
40
50
Control 24-hr. Water Paper Sand
Stratification Media
Mea
n A
ve. P
erce
nt
Ger
m. Ave. Germ
Figure 2. Assessment of stratification media for germination.
Germination Percent vs. Days in Stratication--All Treatments Except Moist Sand
Control24-hr. Water Paper 30 Paper 60
Paper 90
0
10
20
30
40
50
0 1 30 60 90
Days in Stratification
Mea
n P
erce
nt
Ger
m.
Germ
Figure 3. Comparison of duration of stratification time, excluding sand.
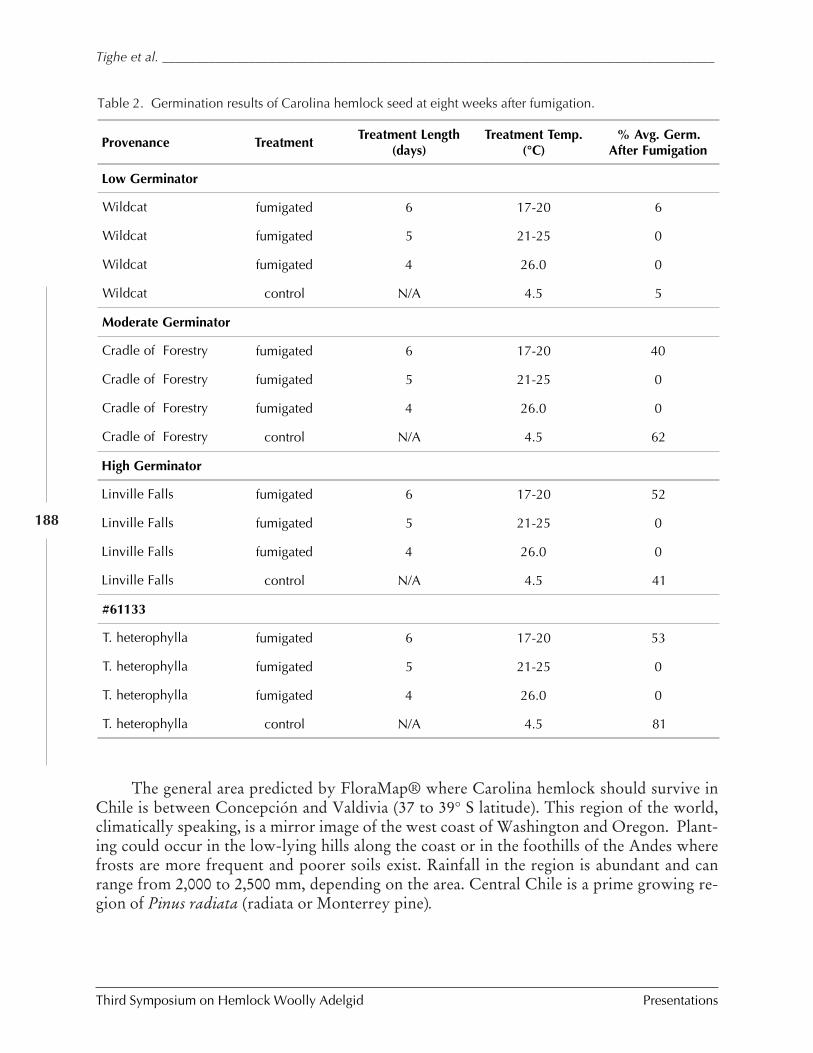
Third Symposium on Hemlock Woolly Adelgid Presentations
Tighe et al. ___________________________________________________________________________________
188
The general area predicted by FloraMap® where Carolina hemlock should survive inChile is between Concepción and Valdivia (37 to 39° S latitude). This region of the world,climatically speaking, is a mirror image of the west coast of Washington and Oregon. Plant-ing could occur in the low-lying hills along the coast or in the foothills of the Andes wherefrosts are more frequent and poorer soils exist. Rainfall in the region is abundant and canrange from 2,000 to 2,500 mm, depending on the area. Central Chile is a prime growing re-gion of Pinus radiata (radiata or Monterrey pine).
Table 2. Germination results of Carolina hemlock seed at eight weeks after fumigation.
Provenance TreatmentTreatment Length
(days)Treatment Temp.
(°C)% Avg. Germ.
After Fumigation
Low Germinator
Wildcat fumigated 6 17-20 6
Wildcat fumigated 5 21-25 0
Wildcat fumigated 4 26.0 0
Wildcat control N/A 4.5 5
Moderate Germinator
Cradle of Forestry fumigated 6 17-20 40
Cradle of Forestry fumigated 5 21-25 0
Cradle of Forestry fumigated 4 26.0 0
Cradle of Forestry control N/A 4.5 62
High Germinator
Linville Falls fumigated 6 17-20 52
Linville Falls fumigated 5 21-25 0
Linville Falls fumigated 4 26.0 0
Linville Falls control N/A 4.5 41
#61133
T. heterophylla fumigated 6 17-20 53
T. heterophylla fumigated 5 21-25 0
T. heterophylla fumigated 4 26.0 0
T. heterophylla control N/A 4.5 81
_______________________________________________ The Ex Situ Conservation of Carolina Hemlock
Presentations Third Symposium on Hemlock Woolly Adelgid
189
EX SITU CONSERVATION EFFORTS
Our goal is to successfully collect seeds from at least 10 trees in every known population ofCarolina hemlock in the eastern U.S., which means re-sampling some stands in North andSouth Carolina and initiating seed collections in outlier regions in Georgia, Tennessee, andVirginia. Ideally, we would like to plant this material on two sites: one in Brazil and the otherin Chile. We believe a sample of 150 trees from approximately 15 populations would ad-equately conserve the genetic diversity of the species. Assessments of population genetic di-versity of Carolina hemlock are being initiated at North Carolina State using molecular markersin a collaborative effort between Camcore and the NCSU Christmas Tree Genetics Program.The number of samples needed per population may be adjusted as we learn more about howgenetic diversity is structured between and within populations of Carolina hemlock.
Camcore has identified industrial members in both Brazil (Klabin-Santa Catarina) andChile (BioForest-Arauco) who are willing to assist agencies in the U.S. in the ex situ conser-vation efforts for Carolina hemlock. These Camcore members in Latin America are experts inplantation forestry of P. taeda and P. radiata, respectively. However, because Carolina hem-lock requires different types of nursery and silvicultural protocols than the pines, success willdepend on all partners working closely together to ensure that the best technologies are inplace to grow this threatened conifer. If in situ conservation and pest management plans aresuccessful in the southeastern U.S., the Carolina hemlock material conserved in Brazil andChile will never need to be re-introduced into the U.S. However, based on the local experi-ence with American chestnut, the success of seed collections in the U.S. and the subsequentestablishment of field trials in Brazil and Chile might be the only hope for Carolina hemlockin the southeastern U.S. in the future.
ACKNOWLEDGEMENTS
The authors wish to thank:
USFS Forest Health Protection programThe Nature ConservancySouth Carolina State Park ServicePat McMillan, Clemson UniversityJohn Peterson, Virginia Tech UniversityKirsten Cassingham, U.S. Geological SurveyKitt Payn (Camcore, NCSU)Gary Hodge (Camcore, NCSU)Robert Jetton, Dept. of Entomology and Forestry, NCSUSteve Covington, U.S. Forest Service
Third Symposium on Hemlock Woolly Adelgid Presentations
Tighe et al. ___________________________________________________________________________________
190
REFERENCES
Brown, James D. 2002. Anecdotal Notes on Site Characteristics and Culture of CarolinaHemlock, Tsuga caroliniana. Author may be contacted at: Forest Health MonitoringProgram Coordinator, USDA Forest Service, R-8 Forest Health Protection, 1720Peachtree Rd. NW, Suite 862S, Atlanta, GA 30309.
Dvorak, W.S., G. R. Hodge, and J. L. Romero. 2001. Results of twenty years of researchon Pinus tecunumanii by the CAMCORE Cooperative. Forest Genetic Resources. Vol.29. FAO, Rome, Italy.
Dvorak, W.S., J. Hamrick, and G.R. Hodge. 1999. Assessing the sampling efficiency of exsitu gene conservation in natural pine populations in Central America. Forest Genetics6(1):21-28.
Edwards, D.G. 1995. Effect of Stratification and Temperature on the Germination ofMountain Hemlock. Theme: Forest Tree Seeds: Production, Quality and Germination,Part 3. Canadian Forest Service, Pacific Forestry Centre, Victoria, B.C., Canada.
Edwards, D.G.W. 1973. Effects of Stratification on Western Hemlock Germination. Can.J. For. Res. 3:522-527.
Godman, R.M. and K. Lancaster. 1990. Eastern Hemlock: Tsuga canadensis (L) Carr. InSilvics of North America: 1. Conifers; 2. Hardwoods. Agriculture Handbook 654, techcoords. Russel M. Burns and Barbara H. Honkala. U.S. Department of Agriculture,Forest Service, Washington, DC. Vol.2, 877 p.
Humphrey, L.D. 1989. Life History Traits of Tsuga caroliniana Engelm. (Carolina Hem-lock) and Its Role in Community Dynamics. Castanea 54(3): 172-190.
Jones, P.G. and A. Gladkov. 1999. FloraMap. A computer tool for predicting the distribu-tion of plants and other organisms in the wild. CIAT. Cali, Colombia.
Packee, E.C. 1990. Western Hemlock: Tsuga heterophylla (Raf.) Sarg. In Silvics of NorthAmerica: 1. Conifers; 2. Hardwoods. Agriculture Handbook 654, tech coords. Russel M.Burns and Barbara H. Honkala. U.S. Department of Agriculture, Forest Service, Wash-ington, DC. Vol.2, 877 p.
Ruth, Robert H. 1974. Tsuga (Endl.) Carr. Hemlock, pp. 819-827. In Seeds of woodyplants in the United States. Agric. Handb. 450, ed. C.S. Schopmeyer. U.S. Departmentof Agriculture, Forest Service, Washington, D.C.
SAS Handbook, 1999. SAS Statistical Package Version 8e for Windows. SAS Corporation,Cary, North Carolina.
U.S. Forest Service. 1948. Woody-Plant Seed Manual. USDA Forest Service Misc. Pub.No. 654. U.S. Government Printing Office, Washington, D.C.
_______________________________ Preserving Eastern Hemlock Gene Pools Through Ex Situ Plantings
Presentations Third Symposium on Hemlock Woolly Adelgid
191
PRESERVING EASTERN HEMLOCK GENE POOLS THROUGH EX SITU PLANTINGS
Belinda D. Esham1, Scott E. Schlarbaum1, Charles Burnham3, Russell A. Cox4,Leonard J. Cronin5, Joseph Deschenes6, Roger Dziengeleski5,
Kristine Johnson7, David E. Osterberg5, Christopher Prey6, James R. Rhea8,Arnold M. Saxton2, and Glenn Taylor7
1Department of Forestry, Wildlife and Fisheries and 2Animal Science;University of Tennessee, Knoxville;
3Massachusetts Department of Conservation and Recreation;4Tennessee Department of Agriculture, Division of Forestry;
5Finch, Pruyn & Company, Inc.;6United States Military Academy, West Point, New York, Natural Resources Branch;
7National Park Service, Great Smoky Mountains National Park;8USDA Forest Service, State and Private Forestry, Forest Health Protection
ABSTRACT
Preservation of host species germplasm is a critical component in the overall response todestruction by serious exotic forest pests such as hemlock woolly adelgid. In 1995 and 1996,seed collections of eastern hemlock, Tsuga canadensis (L.) Carr., were made in the GreatSmoky Mountains National Park (in Tennessee and North Carolina), New York, and Massa-chusetts to establish ex situ plantations of eastern hemlock. The seedlings were grown incontainers for three to four years or in containers for two years and transplant beds for twoyears. In the late winter of 2000, four plantations were established New York (3) and Massa-chusetts (1). A single plantation was established in the Cumberland Mountains in Tennesseein 2001. Two plantations in upstate New York failed after two continuous years of droughtcoupled with deer browse. The third New York planting, on the U.S. Military Academy, hasgood survival and growth, probably related to protection from deer browse. The Massachu-setts plantations are surviving, but are infested with hemlock woolly adelgid. Survival andgrowth are satisfactory in the Tennessee plantation. Challenges in seed collection, nurseryproduction, and planting hemlocks were discussed. The surviving plantations will be eventu-ally managed for seed production to restore locally adapted hemlocks to areas where thespecies has been decimated by the hemlock woolly adelgid.
KEYWORDS
Eastern hemlock, hemlock woolly adelgid, ex situ plantings, germplasm preservation.
Third Symposium on Hemlock Woolly Adelgid Presentations
Esham et al. __________________________________________________________________________________
192
INTRODUCTION
The Tsuga (Endl.) Carr. genus consists of about 10 species of evergreen, conifer trees nativeto North America, Japan, China, Taiwan, and the Himalayas. In the United States, easternhemlock, Tsuga canadensis (L.) Carr., has a wide range, occurring naturally from New En-gland to the Georgia mountains and as far west as eastern Minnesota. The species is the mostshade-tolerant of all the forest tree species in North America (Godman and Lancaster 1990).For this reason, the species often persists in the under-story or mid-story of the forest foryears. Eastern hemlock can take 250-300 years to reach maturity and can live up to 800 years.Approximately 2.3 million acres in eastern North America are dominated by hemlock forests(McWilliams and Schmidt 1999). The trees have a wide variety of habitats, but are mostcommonly associated with moist forest coves and mountain streams in the southern Appala-chian mountains.
Eastern hemlock plays an important ecological role in the eastern forest. It provides adense and valuable habitat for wildlife such as white-tailed deer (Odcoileus virginianusZimmermann), ruffed grouse (Bonasa umbellus L.) and wild turkeys (Meleagris gallopavoL.). Several breeding birds are thought to depend on the presence of hemlock for their sur-vival, including blackburnian warbler (Dendroica fusca Lath.), black-throated green warbler(Dendroica virens Lath.), and blue-headed vireo (Vireo solitarius Wilson). Eastern hemlockshades mountain streams, which helps maintain the cool temperatures essential for streamhealth and the presence of certain aquatic species, such as brook trout. Evans (2004) reportedthat “the average number of aquatic macroinvertebrate taxa found in hemlock streams was37% greater than that found in hardwood streams (55 versus 40 taxa). Fifteen macroinvertebratetaxa were strongly associated with hemlock streams, and three taxa were found only in hem-lock streams.”
In the southern Appalachian mountain region, hemlock glades are critical habitat formany salamander species. This region is considered to be the largest center for salamanderdiversity in the world. Downed hemlocks provide excellent habitat for salamanders, both inrotting wood and under exfoliating bark. Fallen trees are not only beneficial to salamanders,Ducey and Gove (1999) speculate that coarse woody debris may play an integral role in re-generation of eastern hemlock. Losses of older growth, large trees might not only reduce theseed source, but also reduce the conditions favorable for seed germination and survival. Eco-nomically, eastern hemlock was once used as a source of tannin for leather (Godman andLancaster 1990) and has been important in the pulp and paper industry in modern times.Hemlock is also an important ornamental tree species, often grown by the nursery industry.
Eastern and Carolina (Tsuga caroliniana Engelm.) hemlock populations are currentlythreatened by the exotic insect, hemlock woolly adelgid (Adelges tsugae Annand.). Althoughthis adelgid was introduced into the United States approximately 75 years ago from Asia(Annand 1924) it has only become problematic to hemlock populations in eastern forests.The adelgid has caused extensive mortality to eastern hemlock over a large extent of its range.In the United States it has been detected from northeastern Georgia to southeastern Maineand west to eastern Tennessee. It damages trees by inserting piercing, sucking mouthpartsinto the base of needles and extracting plant fluids. There is also speculation that adelgidsinsert toxic salivary secretions while feeding. Adelgid activity causes needles to turn brown
_______________________________ Preserving Eastern Hemlock Gene Pools Through Ex Situ Plantings
Presentations Third Symposium on Hemlock Woolly Adelgid
193
and drop. Severe infestations can cause death in as few as four years, but trees can oftenpersist for much longer periods of time. The influence of other insects, fungal pathogens, andenvironmental factors can exacerbate the impact of the adelgid.
Unlike most other coniferous species utilized for pulp and timber, very little is knownabout hemlock genetics and diversity (cf. Campbell and Schlarbaum 2002). Aside from somegenetic plantations in New England that were established in the 1950s (Olson et al. 1959),eastern hemlock has not been included in tree improvement efforts. Correspondingly, noseed orchards have been established.
Although field studies on eastern hemlock genetics have been limited, there have beenecological and biochemical studies on genetic variability in the species. Kessell (1979) ad-dressed the genetic basis for eastern hemlock’s distribution. He found two distinct ecotypesof eastern hemlock, a “high response” and a “low response” type, based on external morphol-ogy. The high response hemlock is highly moisture sensitive and demonstrates high growthrates and tolerance to low temperatures. The low response hemlock can also be found onmoist sites, but is more common on drier slopes. It has a slower growth rate, low sensitivityto moisture, and high sensitivity to temperature. In the northern portion of the range of thetree, the two forms are distinct with very little intermixing. However, in the Allegheny andSouthern Appalachian mountains, the forms introgress to produce a multitude of intermedi-ate types, although these populations still have individuals corresponding to the “high” and“low” response eco-types.
Zabinski (1992) tested disjunct populations of eastern hemlock for isozyme variation,but found very few genetic differences. Based on the morphological evidence of Kessell (1979),she recommended that further research on eastern hemlock include a more comprehensivesurvey of genetic variation that encompasses a range of morphological and physiological dif-ferences.
Schaberg et al. (2003) studied rare alleles in eastern hemlock and found that rare alleleseither decreased or increased depending on silvicultural treatment. When trees were selec-tively cut (small and poor form trees were removed), rare alleles decreased. When trees werediameter-limit cut, rare alleles increased. This indicates that if some rare alleles are lost, thespecies’ ability to adapt to environmental changes could be affected. Alternately, if rare alle-les increase then the fitness of the stand is compromised.
The threats posed to native trees by exotic, invasive organisms are well recognized, yetmost conservation efforts focus on pest management. In the southern Appalachian region,gene conservation or preservation has been minimal (cf. Schlarbaum, et al. 1999; Campbelland Schlarbaum, 2002). American chestnut [Castanea dentata (Marsh.) Borkh.], floweringdogwood (Cornus florida L.), American beech (Fagus grandifolia Ehrh.), and butternut (Juglanscinerea L.) are all examples of tree species that have been severely impacted by an exoticorganism without systematic efforts toward genetic conservation.
A complete solution to an exotic pest problem involves conservation or preservation ofgermplasm (Schlarbaum et al. 1999). Reintroduction of a species after the pest problem iscontrolled should use locally adapted genotypes. Ex situ preservation of germplasm is one
Third Symposium on Hemlock Woolly Adelgid Presentations
Esham et al. __________________________________________________________________________________
194
method to ensure the availability of locally adapted seedlings. With forest tree species, ex situplantations are desirable because of delay in reproductive maturation in many tree species.An existing plantation that is managed for seed production will provide seeds in the volumesneeded for reintroduction much quicker than seedlings from stored seed.
In 1995, a cooperative project was formed to collect seeds of eastern hemlock from dif-ferent locations to subsequently establish ex situ plantations for eventual conversion to seed-ling seed orchards. The seeds from the orchards will be used in reintroduction of localgenotypes into areas where hemlock populations had been extirpated by hemlock woollyadelgids.
MATERIALS AND METHODS
COOPERATORS
Initial contacts of interested parties were made by the USDA Forest Service, State and PrivateForestry, Forest Health Protection, in Asheville, North Carolina. Participants included: theUniversity of Tennessee’s Tree Improvement Program (UT-TIP); Finch, Pruyn & Co., Inc.(FP); U.S. Military Academy (USMA) at West Point, New York; Massachusetts Departmentof Conservation and Recreation (MDCR); and Great Smoky Mountains National Park(GSMNP). The UT-TIP coordinated the seed collection, growing of experimental material,plantation design and analyses, and distribution of plantations. Finch, Pruyn & Co., Inc.,provided the funding to initiate the project.
SEED COLLECTION
Seed collections of eastern hemlock were made in proximity of Glens Falls, New York (FP),West Point, New York (USMA), Amherst, Massachusetts (MDCR), various locations in easternTennessee, and in the Great Smoky Mountains National Park. Open-pollinated progenywere collected in the 1995 and 1996 fall seasons. The cones were sent to the UT-TIP and air-dried. Seeds were extracted and processed according to the Woody Plant Seed Manual (USDAForest Service 1974). The seeds were germinated the spring seasons following the year ofcollection. The seeds were sown in small planting trays and lightly covered with vermiculite.When the resulting seedlings reached the cotyledon stage, they were transplanted into Cone-TainersTM or Root-TrainersTM each containing approximately 5 cu. in. of commercial soil mixand medium grade pearlite enriched with organic matter.
SEEDLING PRODUCTION
Seedlings from the 1995 collection were grown for two years in containers and then trans-planted to the East Tennessee State Nursery near Delano, Tennessee. At the nursery, theseedlings were placed in a transplant bed for one year and then moved to another transplantbed for an additional year. The seedlings from the 1996 collection were grown in containersfor three to four years.
_______________________________ Preserving Eastern Hemlock Gene Pools Through Ex Situ Plantings
Presentations Third Symposium on Hemlock Woolly Adelgid
195
PLANTATION ESTABLISHMENT
Four plantations were established with a combination of transplanted seedlings and contain-erized seedlings in 2000. Two plantations were established in open fields by FP near GlensFall, New York; one planting was established in a black birch/ eastern hemlock forest byMDCR near Amherst, Massachusetts; and one planting was established under a forest canopyon the reservation surrounding the U.S. Military Academy. A fifth plantation was estab-lished in 2001 on a cleared field, using stock grown in Cone-TainersTM, in the CumberlandMountains of eastern Tennessee on the University of Tennessee’s Cumberland Forest Ex-periment Station (UT-TIP). The fifth plantation was established at a later date, as the site wasnot ready for planting in 2000.
The FP plantation had tree mats placed around each seedling to prevent competitionthat were periodically mowed. The USMA plantation was fenced to protect against deerbrowse and rub. The UT-TIP plantation was mowed after establishment and herbicide sprayedaround the trees to control competing vegetation. The MACR plantation received no main-tenance.
STATISTICAL DESIGN AND ANALYSES
The experimental design for the plantations was an incomplete block using three tree rowplots. All plantations received a mixture of seed sources. The number of families varied ateach location.
Only the USMA and UT plantations were measured for survival and height growth.The USMA plantation was measured in 2002, 2003, and 2004, while the UT-TIP plantationwas measured only in 2004. The MDCR plantation was observed annually (except for 2003)for attack by hemlock woolly adelgid and identification of potential resistant trees. A mixedmodel analysis (SAS 2002) was conducted on data from both plantations. For the USMAplantation, the two types of seedlings (transplanted and container) were first nested withinfamily in growth and survival analyses and then combined in a second group of analyses.Analyses to detect differences among seed sources were also conducted. The UT plantationwas analyzed to detect family differences in survival and growth.
RESULTS AND DISCUSSION
NURSERY GROWTH
Eastern hemlock seedlings grew relatively slowly in comparison to various pine species, ne-cessitating a longer nursery period before plantation establishment. It was observed that theseedlings in Cone-TainersTM were generally smaller and less dense than seedlings grown inRoot-TrainersTM. The seedlings from the 1995 collection were transplanted to nursery bedsdue to increased size. Similar treatment of the seedlings from the 1996 collection did notoccur due to lack of resources. The seedlings did respond favorably to transplanting andwere much larger and more robust than the containerized seedlings at planting.
Third Symposium on Hemlock Woolly Adelgid Presentations
Esham et al. __________________________________________________________________________________
196
The variety of containers used and uneven treatment (i.e., transplant vs. containerized)of the seedlings was due to the project’s primary objective of germplasm preservation ratherthan genetic improvement. Additionally, the resources supporting this project were verylimited, and the seedlings were placed in whatever containers were available at the time.
FIELD STUDIES/FUTURE PLANS
The FP plantations initially had good survival and satisfactory growth. A two-year droughtcoupled with deer browse, however, reduced the survival to approximately 10 percent in eachplantation. Surviving trees are generally under 1 foot in height due to repeated deer browse.Tree shelters will be erected around the surviving trees to salvage what is left of the planta-tion.
The MDCR plantation was not browsed by deer, but became quickly infested withhemlock woolly adelgid. The majority (85-95%) of the hemlock overstory at this site wasinfested with the pest. Seedlings, both bare root and in plugs, from various locations werereceived and out-planted in black birch/eastern hemlock forest in Amherst, Massachusetts.The survival rate of containerized seedlings (90.9%) was different than transplanted seedlings(58%). As of December, 2004, the containerized seedlings had 32 seedlings that were notinfested (12.0%), and the transplanted seedlings had only 7 seedlings (13.7%) that were notinfested with hemlock woolly adelgid.
It is unknown why the survival rate of the containerized seedlings was higher than thatof the transplanted seedlings. It is interesting to note that the percentage of seedlings thathave not been infested is approximately the same for both types of seedlings. Data on annu-ally infestation was not available for this paper, but it will be analyzed in the future to see ifany family was more susceptible to early infestation. The plantation will continued to beobserved for adelgid infestation and a decision to protect the study will be made when it isclear that there are no genotypes resistant to hemlock woolly adelgid.
Analyses of the USMA plantation revealed no difference in survival and growth amongthe seed sources. Family (seedling type) and family differences were both evident in survival,but not growth. A net loss of growth occurred between 2002 and 2003, probably due todrought.
The USMA plantation will continued to be maintained and eventually converted into aseedlings seed orchard. Hemlock woolly adelgids have not yet attacked the plantation, andprotection will be afforded when it occurs.
The UT-TIP plantation showed no family differences in survival or height. Deer browsehas been moderate, but portions of the plantation have suffered minor damage from all-ter-rain vehicles. The plantation will be maintained and protected against hemlock woolly adelgiduntil approximately age 10. At that time, the plantation will be converted into a seedling seedorchard and all non-GSMNP genotypes will be removed.
_______________________________ Preserving Eastern Hemlock Gene Pools Through Ex Situ Plantings
Presentations Third Symposium on Hemlock Woolly Adelgid
197
CONCLUSIONS
Ex situ germplasm preservation in plantations is an expensive venture, particularly when ap-proached by widely separated cooperators. The slow growth of the eastern hemlock seed-lings caused an extended nursery phase that required constant maintenance in the growingseason. If creating seed orchards that will provide seed for reintroduction efforts is the pri-mary objective, then grafting local genotypes from different watersheds would be a moreefficient approach to seed production: grafts would produce seeds much earlier than seed-lings. In addition, a grafted orchard could be established on a grid, making maintenance andseed collection easier than in a thinned genetic plantation.
REFERENCES
Annand, P.N. 1924. A new species of Adelges (Hemiptera, Phylloxeridae). Pan-PacificEntomologist 1:79-82.
Campbell, F.T. and S.E. Schlarbaum. 2002. Fading forests II: trading away NorthAmerica’s natural heritage. Healing Stones Foundation. 128p.
Ducey, M.J. and J.H. Gove. 1999. Downed wood as seedbed: measurement and manage-ment guidelines, pp. 34-42. In Proceedings of sustainable management of hemlock eco-systems in eastern North America, ed. K. Shields. Gen. Tech. Rep. NE-267. Radnor,Pennsylvania: U.S. Department of Agriculture, Forest Service, Northeastern ResearchStation.
Evans, R.A. 2004. Hemlock woolly adelgid and the disintegration of eastern hemlockecosystems. Park Science 22(2): 53-56.
Godman, R.M. and K. Lancaster. 1990. Tsuga canadensis (L.) Carr, pp. 604-612. In Silvicsof North America, Volume 1: Conifers. Agricultural Handbook 654. U.S. Department ofAgriculture, Forest Service, Washington, D.C.
Kessell, S.R. 1979. Adaptation and dimorphism in eastern hemlock, Tsuga canadensis (L.)Carr. The American Naturalist 113(3):333-350.
McWilliams, W.H.; Schmidt, T.L. 1999. Composition, structure, and sustainability ofhemlock ecosystems in Eastern North America, pp. 5-10. In Proceedings of sustainablemanagement of hemlock ecosystems in eastern North America, ed. K. Shields. Gen.Tech. Rep. NE- 267. Radnor, Pennsylvania: U.S. Department of Agriculture, ForestService, Northeastern Research Station.
Olson, J. S., F.W. Stearns, and H. Nienstaedt. 1959. Eastern Hemlock Seeds and Seedlings:Response to Photoperiod and Temperature. Bulletin 620, The Connecticut AgriculturalExperiment Station, New Haven. 70 p.
Third Symposium on Hemlock Woolly Adelgid Presentations
Esham et al. __________________________________________________________________________________
198
Schaberg, P.G., G.J. Hawley, D.H. DeHayes, and S.E. Niensohn. 2003. Silvicultural man-agement and the manipulation of rare alleles, pp. 67-74. In Proceedings of the sympo-sium of the North American forest commission, Forest genetic resources and silvicultureworking groups, and the International Union of Forest Research Organizations(IUFRO).
SAS Institute, Inc. 2002. SAS/Stat Users Guide, Version 9.1. Cary, North Carolina.
Schlarbaum, S.E. R.L. Anderson, and F.T. Campbell. 1999. Control of pests and pathogens.In Ecosystem management for sustainability, Principles and practices illustrated by aregional biosphere reserve cooperative, ed. J.D. Peine. Florida: ERE Press LLC. 500 p.
U. S. Department of Agriculture, Forest Service. 1974. Seeds of woody plants in the UnitedStates. U. S. Dep. Agric., Handb. 450. 883 p.
Zabinski, C. 1992. Isozyme variation in eastern hemlock. Can. J. For. Res. 22:1838-1842.
_______________________________________________Host Interactions of the Balsam Woolly Adelgid
Presentations Third Symposium on Hemlock Woolly Adelgid
199
HOST INTERACTIONS OF THE BALSAM WOOLLY ADELGID
Leslie P. Newton and Fred P. Hain
Department of Entomology, College of Agriculture and Life Sciences,North Carolina State University, Raleigh, NC 27695
ABSTRACT
The balsam woolly adelgid (BWA), Adelges piceae Ratz., has caused immense damage to na-tive and planted fir stands for the past century. This paper highlights the current understand-ing of the initiation of damage by the insect and the host responses to the insect. Althoughmost native North American firs (Abies spp.) are highly susceptible to the adelgid, other firsexhibit a range of resistance and some can tolerate even heavy infestations. Possible mecha-nisms for resistance are discussed.
INTRODUCTION
The balsam woolly adelgid (BWA), Adelges piceae Ratz. (Hemiptera: Adelgidae), an incon-spicuous insect that feeds on true firs, has caused considerable damage in North American firstands for the last century. Native stands of mature Fraser fir (Abies fraseri [Pursh] Poir.) inthe southern Appalachians have come close to elimination (Dull et al. 1988), and the adelgidhas altered the composition of the surviving stands (Jenkins 2003). The balsam fir (Abiesbalsamea [Linn.] Mill.) forests of New England and Canada and the mixed fir forests of thePacific Northwest have been continually plagued by the insect for almost 100 years and thenatural stands of Fraser fir in the Southern Appalachians for over 50 years. Grand fir (Abiesgrandis [Dougl.] Lindl.) is gradually being eliminated from low elevation landscapes in thePacific Northwest and subalpine fir (Abies lasiocarpa [Hook.] Nutt.) is being removed as apioneer tree species in the Cascades (Mitchell and Buffam 2001).
Accidentally introduced into Maine and Nova Scotia around the turn of the 20th Cen-tury, (Balch 1952), most likely on imported nursery stock of European silver fir (Abies albaMill.), BWA had become established on balsam fir in Maine by 1908 (Kotinsky 1916). Theadelgid was first reported on Fraser fir in the Southern Appalachians on Mount Mitchell in1957 (Speers 1958) and quickly spread throughout the natural range of Fraser fir. On theWest Coast, it was first reported on ornamental firs near San Francisco (Annand 1928). In thePacific Northwest, it was first reported on grand fir in the Willamette Valley of Oregon (Keen1952). There, the most frequent hosts are Pacific silver fir (A. amabilis [Dougl.] Forbes) andsubalpine fir at high elevations and grand fir in valleys (Mitchell et al. 1961). The adelgid wasreported in British Columbia on Pacific silver fir and on Vancouver Island on grand fir by thelate 1950s (Silver 1959).
Third Symposium on Hemlock Woolly Adelgid Presentations
Newton and Hain _____________________________________________________________________________
200
SUBSPECIES OF THE BWA
Three geographic subspecies of A. piceae Ratz. have been identified in North America (Foottitand Mackauer 1983). Adelges piceae piceae (Ratzeburg 1844) has been observed in BritishColumbia, the Pacific Northwest, and in the native Fraser fir range in the Southern Appala-chians. This subspecies corresponds morphologically to Pschorn-Walcher and Zwolfer’s formatypica (1956) and the ‘intermediate group’ of Foottit and Mackauer (1980). Adelges piceaecanadensis (Merker and Eichhorn 1956) is found on balsam fir in Quebec and the maritimeprovinces of Canada, and in the northeastern United States. Adelges piceae occidentalis, subsp.nov. has been observed on Pacific silver fir and grand fir in British Columbia and may be theresult of a single introduction. The subspecies are based on the morphological differences offirst instars and adults between the three subspecies (e.g., body shape, length, dorsal plates,fusion of pleural and mesial plates, shape of pore fields of mesial plates, number and range ofwax pores, etc.).
LIFE HISTORY OF ADELGES PICEAE
In North America, A. piceae exhibits an anholocyclic mode of generation on fir and does notmigrate to spruce (Picea), as it does in its native range. The sistens form is wingless anddevelops on the stem (lenticels, crevices in bark, or callus tissue), branches, or bases of buds(Crystal 1925, Balch 1952). The number of sistens generations per year depends upon tem-perature and host condition. There is only one hiemosistens generation per year and as manyas three or four aestivosistens generations. The sistens—both hiemosistens and aestivosistens—develop through four stages after emerging from the egg: first instar (crawler, neosistens),second and third instar, and adult. The progrediens form, which never overwinters and rarelyenters into any period of diapause, can be wingless (aptera) or winged (alata) and develops onthe needles of fir (Crystal 1925, Balch 1952, Varty 1956). The progrediens form, observedonly in the subspecies A. piceae canadensis in North America (Foottit and MacKauer 1983),arises from the first eggs laid by the hiemosistens, differs morphologically from the sistens,and has a shorter embryonic developmental period than the sistens (Eichhorn 1969).
INITIATION OF DAMAGE TO INDIVIDUAL TREES
Balch (1952) described the process of feeding, a summary of which follows. Adelges piceaehas piercing-sucking mouthparts (stylets) and feeds on parenchyma tissue within the outer1.5 mm of bark or on twigs at the base of buds. The stylets are inserted through the phellem(epidermis) into the phelloderm (cortex), probing between cells, until a suitable feeding sitecan be located. Salivary secretions, which can flow into intercellular spaces, are exuded fromthe tip of the maxillae to form a sheath that lines the path of the stylets. The neosistens insertsits stylets full length before entering diapause. Feeding occurs through repeated partial with-drawal and reinsertion of the stylets in a new direction. The stylets are withdrawn and com-pletely renewed at each molt, with the new stylets inserted near the original point of entry.
_______________________________________________Host Interactions of the Balsam Woolly Adelgid
Presentations Third Symposium on Hemlock Woolly Adelgid
201
The tracks are branched and affect tissue in a 360o pattern. Aphids feed in a similar patternand are able to assess feeding sites by intermittently ejecting and sucking back up a waterysaliva along with soluble material from the host; this watery saliva is diffused into surround-ing tissue and can be transported within the host plant (Miles 1965 and 1999). Because of theclose relationship between aphids and adelgids, and the many similarities in feeding patternsand capabilities, it is likely that adelgids also secrete the watery saliva, which is then trans-ported through the tree.
The adelgid’s salivary secretions appear to create a chemical imbalance within the treeand disrupt the development of normal tissue. Auxin-like compounds (Balch et al. 1964) andpectinase (Adams and McAllan 1958, Forbes and Mullick 1970) have been found in adelgidsaliva. Additionally, the gel-like stylet sheath may often form a barrier around damaged partsof parenchyma cells, preventing the disintegration and rupture of cell vacuoles, which wouldnormally be followed by the production of autotoxic defensive compounds in surroundingcells (Miles 1999). The stylet sheath can also slow down or prevent the production of thephenolics that arise from and promote necrosis by adsorbing and immobilizing the phenolics(Miles 1999).
RESPONSE OF ABIES SPECIES TO ADELGES PICEAE ATTACK
All Abies species are susceptible, in varying degrees, to some species of adelgid throughoutthe world, and susceptibility to A. piceae attack varies widely. Firs native to North America(subalpine fir, balsam fir, and Fraser fir) are highly susceptible. Some western species (grandfir, sacred fir [Abies religiosa (H.B.K.) Schlecht. et Cham], and noble fir [Abies procera Rehd.])and firs native to central Europe tolerate infestation (Varty 1956, Mitchell 1966), while someAsian species (Veitch fir [Abies veitchii Lindl.] and Momi fir [Abies firma Sieb. et Zucc.])appear to be immune to attack, at least in North America (Hall et al. 1971).
Adelgid infestations follow a general trend. The initial infestation begins with a fewlarge trees, generally with deep fissures, and then spreads to nearby trees. The populationpeaks and when many trees have been killed or are damaged, the population diminishes. Thissecond period may go on for an indefinite period of time and is characterized by increasinggout and gradual dying of trees. Some trees may nevertheless recover. The first outbreak isgenerally the most severe (Balch 1952), but the infestations can persist for decades, and manystands are gradually succumbing to the stress (Mitchell and Buffam 2001). Stem attack isgenerally observed in continental climatic zones and twig attack in maritime zones (Greenbank1970, Schooley and Bryant 1978). Mass stem infestations can cause tree mortality within twoto three years. With a crown infestation, the tree will suffer branch dieback and generaldeterioration, and it can take as long as 10 to 20 years for mortality to occur (Bryant 1974).
Some species exhibit a ‘bottom-up’ pattern of infestation, wherein the infestation beginson the lower portion of the stem and works upwards towards the crown over time (e.g., ingrand fir [Mitchell 1966] and Fraser fir [Amman and Talerico 1967]). Others exhibit a ‘top-down’ pattern, with the infestations beginning in the crown and working downward (e.g., inbalsam fir [Greenbank 1970]). All ages of fir in plantations are susceptible, particularly with
Third Symposium on Hemlock Woolly Adelgid Presentations
Newton and Hain _____________________________________________________________________________
202
Fraser fir, while in natural stands, older, mature trees are more susceptible. This begs thequestion as to whether there is something in younger trees—physical or chemical—that pro-tects them from severe infestations.
Infestations are generally classified as “stem” or “crown” infestations. The damage,both microscopic and macroscopic, is fairly consistent among all susceptible firs. With acrown infestation, gouting is apparent. Growth of wood and bark is stimulated at the pointof stylets insertion and both hypertrophy and hyperplasia occur. An enlargement of paren-chyma cells (up to six or seven times the size of normal cells), including cell walls and nuclei,occurs and these large cells are continually produced, causing swelling of the twigs and in thebark (Balch 1952). Pock-like swellings are often observed on the bark of young trees (Rudinsky1956). The number of rays increase (Doerksen and Mitchell 1965), as do the number of pa-renchyma strands (Smith 1967). Large reductions in carbohydrate reserves of needles andtwigs have been observed (Puritch and Talmon-De L’Armee 1971). Increasing numbers ofthese enlarged parenchyma cells disrupt the phloem channels and interfere with the metabolicpathways in the bark (Bryant 1971). Bud growth often ceases and the twig begins to die backfrom the ends—a flattened top is often observed in infested trees (Balch 1952, Mitchell 1967).In fact, this loss of apical dominance (observed in stem infestations as well as crown infesta-tions) is often the first symptom looked for in Fraser fir Christmas tree plantations whenscouting for A. piceae infestation (Sidebottom 2004). In addition to gouting, the number andlength of branches and the length of the stem are often reduced in a crown infestation (Balch1952, Schooley 1974).
With a stem infestation, although the stylets of the adelgid can be up to 5 mm from thevascular cambium, xylem production is often compromised resulting in abnormal wood called‘rotholz’ or ‘redwood’. Rotholz is anatomically similar to compression wood in conifers(Balch 1952). These resultant tracheids are circular rather than rectangular (Timell 1986); areshort, thick walled, and highly lignified with small lumens (Doerksen and Mitchell 1965);have a reduced number of conducting pits (Puritch and Petty 1971), higher specific gravity,and greater fibril angle (Foulger 1968); and often have encrusted pit membranes such as thosefound in heartwood (Puritch and Johnson 1971). Traumatic resin ducts may form in thexylem (Saigo 1976). Sapwood permeability in grand fir has been reduced to 5% of that ofnormal sapwood (Puritch 1971). Ultimately, these changes throw the tree into physiologicaldrought, reducing the flow of water within the tree and compromising photosynthesis, tran-spiration, and respiration (Puritch 1973). Heavy infestations can result in tree mortality inone to two years (Balch 1952). Adelgid infestation appears to contribute to premature heart-wood formation (Puritch 1977). Rotholz production has also been associated with a signifi-cant increase in the proportional area of heartwood (Hollingsworth et al. 1991) and higherpercentages of latewood (Doerksen and Mitchell 1965, Smith 1967).
The changes that take place in the bark of the fir trees initially create a more favorableenvironment for adelgid development, and in the early stages of an infestation fecundity is atits peak; as the trees weaken and the population begins to dwindle, fecundity also decreases(Pschorn-Walcher and Zwolfer 1958, Amman 1970).
_______________________________________________Host Interactions of the Balsam Woolly Adelgid
Presentations Third Symposium on Hemlock Woolly Adelgid
203
HOST RESPONSES THAT MAY AID IN RESISTANCE
Some responses to adelgid attack may aid in the resistance or tolerance to infestation. Manyconifers have the ability to form a secondary periderm, consisting of necrophylactic tissue,around a wound (Mullick 1975, Hain et al. 1991). This wound healing mechanism can isolatean area of bark occupied by the adelgid and can effectively protect the underlying bark fromfurther attack for years (Balch 1952, Mullick 1971). It has been hypothesized that the forma-tion of the protective secondary periderm may be inhibited or compromised by chemicalssecreted by the adelgid’s stylets (Mullick 1975, 1977), though subsequent research has bothsupported (Hay and Eagar 1981) and failed to support (Arthur and Hain 1985) this hypoth-esis.
Juvabione or juvabione-like compounds may be produced in response to adelgid attack,as has been evidenced in grand fir and Pacific silver fir (Puritch and Nijholt 1974) and Fraserfir (Fowler et al. 2001). Juvabione-like compounds, which were first discovered in 1965—thefamous ‘paper factor’ of Slama and Williams (1965) isolated from paper towels producedfrom balsam fir fiber (most likely adelgid-infested balsam fir)—mimic insect juvenile hor-mones and have been shown to inhibit or disrupt normal development in a number of insects,including A. piceae (Fowler 1999). It is possible that, in mature firs that exhibit some resis-tance or tolerance to BWA, there is a rapid accumulation of chemicals (monoterpenes andjuvabione-like sesquiterpenoids) at the site of attack that may interfere with adelgid develop-ment. Younger trees or seedlings may be protected by a naturally high accumulation ofjuvabione-related compounds.
Some firs, particularly grand fir, produce copious amounts of resin in response to wounds.This may serve as a means of resistance, as grand fir is one of the more resistant species ofAmerican firs, with only 20-30% mortality associated with adelgid infestation (Mitchell 1966).Many conifers have evolved resin-based defenses, such as oleoresin—a mixture of terpenoidsconsisting of a terpentine and rosin fraction—to deter insect pests and their symbiotic fungalpathogens. True firs store only small amounts of primary resin in bark blisters, but respondto wounding by producing oleoresins in nonspecialized, adjacent tissues. But increased resinproduction may be only a short-term solution to BWA. For example, in A. grandis, after twoto five years of adelgid feeding, a portion of bark below the surface dies, the bark turns black,and this is accompanied by a heavy resin flow. This discourages further attack, but after a fewyears, the resin hardens and the bark develops fissures, whereupon the adelgids are able toreinfest the same areas (Mitchell 1966).
OTHER FACTORS THAT MAY AID RESISTANCE
The onset of water stress (physiological drought), one of the chief factors in susceptibility todamage, differs among fir species, and those exhibiting a more rapid onset are more suscep-tible to intense damage (Varty 1956, Mitchell 1967). It follows that species or individual treeswithin a species that exhibit high levels of drought resistance would also be more resistant ortolerant of BWA.
Third Symposium on Hemlock Woolly Adelgid Presentations
Newton and Hain _____________________________________________________________________________
204
Production of thick outer bark, as found in European silver fir, has been associated withresistance to or recovery from adelgid attack (Pschorn-Walcher and Zwolfer 1958, Schooleyand Bryant 1978).
The texture of the bark may also be an important factor in resistance or susceptibility.Rough or flaky bark may be more preferable for A. piceae for a number of reasons, includingthe interception of airborne eggs and crawlers, stereotropism (the insect is stimulated to growor change in response to touch), and more easily accessible nutritive areas (e.g., lenticels andbark crannies) composed of young parenchyma (Varty 1956). In fact, lenticel developmenthas been observed to be ‘the best single predictor’ for BWA population levels on Fraser fir inthe Great Smoky Mountains (Hay and Eagar 1981).
Some provenances of Fraser fir appear to respond to adelgid infestation differently thanothers. For example, BWA infestation was not discovered on Mount Rogers until 1979, al-though there was evidence that some trees had been under attack for up to 17 years (Hanemanet al. 1981), and high mortality was not observed until the 1990s. Mount Rogers’ trees be-come heavily infested but do not appear to suffer rapid mortality (Hollingsworth and Hain1991, Nicholas et al. 1992). The fir trees on Mount Rogers have been shown to be geneticallydifferent (unique allele frequencies) from other natural populations of Fraser fir (Ross 1988),but these differences have not been correlated with susceptibility to adelgid infestation (Hainet al. 1991). Nonetheless, Mount Rogers trees have been shown to form lower levels of rotholzand higher levels of secondary periderm in response to adelgid attack when compared to treesfrom Mount Mitchell (Hollingsworth and Hain 1992). It has been suggested that these treesmay possess the ability to develop secondary periderm more rapidly than those in other loca-tions—this characteristic may aid in adelgid tolerance (Hay and Eagar 1981). Additionally,the trees on Mount Rogers may be less likely to suffer water stress when infested partly dueto environmental factors (deep soil, little wind) (Hollingsworth and Hain 1994).
Within the natural range of Fraser fir, although the majority of mature fir trees havebeen killed, there are remnant populations that have survived multiple decades of adelgidattack. It remains to be seen as to whether these trees have survived as a result of geneticresistance or whether the environment (most are at the highest elevations) plays a more im-portant role.
Among and within all Abies species, even those highly susceptible to BWA, trees havebeen observed time and again to tolerate and even recover from adelgid attack. It is not anuncommon occurrence for balsam fir to recover from adelgid attack after a few years with areplacement of the original leaders and relatively small stem deformities from gouting (Balchand Carroll 1956, Schooley 1976, Schooley and Bryant 1978). Although Mount Mitchell Fraserfirs suffered high mortality during the initial wave of infestation, have been shown to behighly susceptible to adelgid damage (Dull et al. 1988), and individual trees cored at MountMitchell showed production of rotholz at some point, the trees were uninfested and other-wise appeared healthy (Hain et al. 1991).
_______________________________________________Host Interactions of the Balsam Woolly Adelgid
Presentations Third Symposium on Hemlock Woolly Adelgid
205
CONTINUING THE RESEARCH
Much of the current research focuses on understanding interactions between adelgid, hosttree, and the environment. Putative genetic resistance—even within a highly susceptible spe-cies such as Fraser fir—is believed to exist, and studies are underway to begin the process ofscreening across and within Abies species for host resistance to BWA. Bark and wood chemi-cals associated with resistance are being isolated, and studies into the genetic components ofresistance continue. The adelgid itself continues to be studied and a method of artificiallyrearing the insect is currently being developed. Biological control continues to be an area ofinterest, particularly in Christmas tree plantations at lower elevations.
Balsam woolly adelgid research is as critical now as ever. The insect is a tremendousproblem in Christmas tree plantations and costs growers thousands upon thousands of dol-lars each year. Native stands of Fraser fir exist only in small island populations at the highestelevations in southern Virginia, western North Carolina and eastern Tennessee. Most maturetrees were killed during the initial phase of adelgid infestation, but fortunately, many areaswere repopulated with young natural seedlings. These regenerated stands have now reachedthe age wherein they become more susceptible to adelgid attack. The adelgids have continuedto exist at low levels in the native stands, and the question arises as to whether the regeneratedfirs are more resistant to the adelgid than their predecessors. Adelgid populations should beevaluated to determine whether they are increasing, and the compounding effects of air pollu-tion on the physiology of both tree and adelgid should be further assessed.
Researchers continue to delve into the interactions between the balsam woolly adelgidand its host species, advancing the understanding of both insect and host genetics and physi-ology. The hope remains that host resistance mechanisms can be identified and that, betweenthe inherent resistance in some trees and the breeding or nurturing of resistance in others, thebalsam woolly adelgid can be better tolerated in plantations and natural stands and that Fraserfir will remain an important component in the high elevation ecosystems of the SouthernAppalachians.
REFERENCES
Adams, J.B. and J.W. McAllan. 1958. Pectinase in certain insects. Canadian Journal ofZoology 36: 305-308.
Amman, G.D. and R.L. Talerico. 1967. Symptoms of infestation by the balsam woollyaphid displayed by Fraser fir and bracted balsam fir. USDA Forest Service ResearchNote SE-85. 4 p.
Amman, G.D. 1970. Phenomena of Adelges piceae populations (Homoptera: Phylloxeridae)in North Carolina. Annals of the Entomological Society of America 63(6):1727-1734.
Annand, P.W. 1928. A Contribution Toward a Monograph of the Adelgidae(Phylloxeridae) of North America. Stanford University Press, Palo Alto, California. 146p.
Arthur, F.H. and F.P. Hain. 1985. Effects of selected chemicals on non-suberized impervi-ous tissue (NIT) formation in Fraser fir. Journal of Entomological Science 20(3):305-311.
Third Symposium on Hemlock Woolly Adelgid Presentations
Newton and Hain _____________________________________________________________________________
206
Balch, R.E. 1952. Studies of the balsam woolly aphid, Adelges piceae (Ratz.) and its effecton balsam fir, Abies balsamea (L.) Mill. Canadian Department of Agriculture Publication867. 76 p.
Balch, R.E. and W.J. Carroll. 1956. The balsam woolly aphid. Canadian Department ofAgriculture, Forest Biology Division, Publication 977. 7 p.
Balch, R.E., J. Clarke, and J.M. Bonga. 1964. Hormonal action in products of tumors andcompression wood (in Abies balsamea) by an aphid (Adelges piceae). Nature 202:721-722.
Bryant, D.G. 1974. A review of the taxonomy, biology and importance of the adelgid pestsof true firs. Canadian Forest Service, Newfoundland Forest Research Centre, Informa-tion Report N-X-111. 50 p.
Bryant, D.G. 1971. Balsam woolly aphid Adelges piceae (Homoptera: Phylloxeridae) sea-sonal and spatial development in crowns of balsam fir, Abies balsamea. Canadian Ento-mologist 103:1411-1420.
Crystal. 1925. The genus Dreyfusia in Britain and its relation to the Silver fir. Phil. Trans.London Roy. Soc., Ser. B., CCXIV:29-61.
Doerksen, A.H. and R.G. Mitchell. 1965. Effects of the balsam woolly aphid upon woodanatomy of some western true firs. Forest Science 11:181-188.
Dull, C.W., J.D. Ward, H.D. Brown, G.W. Bryan, W.H. Clerke, and R.J. Uhler. 1988.Evaluation of spruce and fir mortality in the Southern Appalachian mountains. USDAForest Service Southern Region Protection Report R8-PR 13.
Eichhorn, O. 1969. Problems of the determination of morphs in the genus Dreyfusia C.B.(Homoptera: Adelgidae), p. 437-446. In Proceedings of the 148th Annual Meeting of theSuisse Society of Natural Sciences in Einsiedeln (Sept. 27-29, 1969).
Foottit, R.G. and Mackauer, M. 1983. Subspecies of the balsam woolly aphid, Adelgespiceae (Homoptera: Adelgidae), in North America. Ann. Entomol. Soc. Am. 7:299-304.
Foottit, R.G. and M. Mackauer. 1980. Morphometric variation between populations of thebalsam woolly aphid, Adelges piceae (Ratzeburg) (Homoptera: Adelgidae), in NorthAmerica. Can. J. Zool. 58:1494-1503.
Forbes, A.R. and D.B. Mullick. 1970. The stylets of the balsam woolly aphid, Adelgespiceae (Homoptera: Adelgidae). The Canadian Entomologist 102:1074-1082.
Foulger, A.N. 1968. Effect of aphid infestation on properties of grand fir. Forest ProductsJournal 18(1): 43-47.
Fowler, G. 1999. The Potential of Juvabione as a Host Resistance Mechanism against theBalsam Woolly Adelgid (Adelges piceae [Ratzeburg]). Ph.D. Dissertation, North Caro-lina State University Department of Entomology. 118 p.
Fowler, G., J. Zhang, F.P. Hain, and J.F. Manville. 2001. The distribution pattern of twojuvenile hormone related compounds in Fraser fir and the induced response to a balsamwoolly adelgid infestation. Canadian Journal of Forest Research 31(10):1701-1707.
_______________________________________________Host Interactions of the Balsam Woolly Adelgid
Presentations Third Symposium on Hemlock Woolly Adelgid
207
Greenbank, D.O. 1970. Climate and the ecology of the balsam woolly aphid. The Cana-dian Entomologist 102:546-578.
Hain, F.P., R.G. Hollingsworth, F.H. Arthur, F. Sanchez, and R.K. Ross. 1991. Adelgidhost interactions with special reference to the balsam woolly adelgid in North America.In Forest Insect Guilds: Patterns of Interaction with Host Trees, ed. Y.N. Baranchikov,W.J. Mattson, F.P. Hain, and T.L. Payne. U.S. Dept. Agric. For. Serv. Gen. Tech. Rep.NE-153: 271-287.
Hall, J., P. Singh, and H.O. Schooley. 1971. Survival and growth of some exotic firs inNewfoundland. For. Chron. 47:279-291.
Haneman, D.M., H.L. Lambert, and D.D. Johnston. 1981. Detection and evaluation of thebalsam woolly aphid infestations on Mount Rogers, Virginia, 1980. Forest Insect andDisease Management (US Forest Service, Southeast), Report #81-1-12.
Hay, R.L. and C. Eagar. 1981. Stem morphology and physiology of Fraser fir in relation tobalsam woolly aphid attack preference. Final Contract Report for Regional Chief Scien-tist, Southeast Regional Office, National Park Service. 60 p.
Hollingsworth, R.G. and F.P. Hain. 1991. Balsam woolly adelgid (Homoptera: Adelgidae)and spruce-fir decline in the Southern Appalachians: assessing pest relevance in a dam-aged ecosystem. Florida Entomologist 74(2):179-187.
Hollingworth, R.G. and F.P. Hain. 1992. Balsam woolly adeglid (Homoptera: Adelgidae)effects on wood and bark structure of Fraser fir and silver fir. Environ. Entomol.21(5):1103-1109.
Hollingsworth, R.G. and F.P. Hain. 1994. Effect of drought stress and infestation by thebalsam woolly adelgid (Homoptera: Adelgidae) on abnormal wood production in Fraserfir. Can. J. For. Res. 24:2295-2297.
Hollingsworth, R.G., U. Blum, and F.P. Hain. 1991. The effect of adelgid-altered wood onsapwood conductance of Fraser fir Christmas trees. IAWA (Int. Assoc. Wood Anat.)Bull. New Ser. 12: 235-239.
Jenkins, M.A. 2003. Impact of the balsam woolly adelgid (Adelges piceae Ratz.) on an Abiesfraseri (Pursh) Poir. dominated stand near the summit of Mount LeConte, Tennessee.Castanea 68(2): 109-118.
Keen, F.P. 1952. Insect enemies of western forests. USDA Misc. Pub. 273 (revised). Wash-ington, D.C. 280 p.
Kotinsky, J. 1916. The European fir trunk louse, Chermes (Dreyfusia) piceaea Ratz. Proc.Entomol.Soc. Wash. 18: 14-16.
Merker, E. and O. Eichhorn. 1956. (Grouping in the genus Adelges.) DieNaturwissenschaften 43: 453-454. (In German.)
Miles, P.W. 1965. Studies on the salivary physiology of plant-bugs: the saliva of aphids.Journal of Insect Physiology 11:1261-1268.
Miles, P.W. 1999. Aphid saliva. Biol. Review 74:41-85. Cambridge Philosophical Society.
Third Symposium on Hemlock Woolly Adelgid Presentations
Newton and Hain _____________________________________________________________________________
208
Mitchell, R.G., N.E. Johnson and J.A. Rudinsky. 1961. Seasonal history of the balsamwoolly aphid (Adelges piceae) in the Pacific Northwest. Can. Ent. 93:794-798.
Mitchell, R.G. 1966. Infestation characteristics of the balsam woolly aphid in the PacificNorthwest. U.S. Dept. Agric. Serv. Res. Pap. PNW-35. 18 p.
Mitchell, R.G. 1967. Translocation of dye in grand and subalpine firs infested by the balsamwoolly adelgid. USDA Forest Service Research Note PNW-46. 17 p.
Mitchell, R.G. and P.E. Buffam. 2001. Patterns of long-term balsam woolly adelgid infesta-tions and effects in Oregon and Washington. Western Journal of Applied Forestry16(3):121-126.
Mullick, D.B. 1971. Natural pigment differences distinguish first and sequent periderms ofconifers through a cryofixation and chemical techniques. Canadian Journal of Botany49:1703-1711.
Mullick, D.B. 1975. A new tissue essential to necrophylactic periderm formation in thebark of four conifers. Canadian Journal of Botany 53(21):2443-2457.
Mullick, D.B. 1977. The non-specific nature of defense in bark and wood during wound-ing, insect and pathogen attack, pp. 395-441. In Recent Advances in Phytochemistry,Vol. 11, ed. F.A. Loewus and V.C. Runeckles. New York: Plenum Publishing.
Nicholas, N.S., S.M. Zedaker, and C. Eagar. 1992. A comparison of overstory communitystructure in 3 Southern Appalachian spruce-fir forests. Bulletin of the Torrey BotanicalClub 119(3):316-332.
Pschorn-Walcher, H. and H. Zwölfer. 1956. The predator complex of the white-fir woollyaphids. (Dreyfusia: Adelgidae). Zeitschrift fur Angewandte Entomologie 39:63-75.
Pschorn-Walcher, H. and H. Zwölfer. 1958. Preliminary investigations on the Adelgespopulations (Hemiptera: Adelgidae) living on the trunk of the silver fir. Zeitschrift furAngewandte Entomologie 42:241-277. (In German.)
Puritch, G.S. 1971. Water permeability of the wood of grand fir (Abies grandis [Doug.]Lindl.) in relation to infestation by the balsam woolly aphid Adelges piceae (Ratz.). J.Exptl. Bot. 22:936-45.
Puritch, G.S. 1973. Effect of water stress on photosynthesis, respiration and transpirationof four Abies species. Can. J. For. Res. 3:293-298.
Puritch, G.S. 1977. Distribution and phenolic composition of sapwood and heartwood inAbies grandis and the effects of the balsam woolly aphid. Canadian Journal of ForestResearch 7(1):54-62.
Puritch, G.S. and R.P.C. Johnson. 1971. Effects of infestation by the balsam woolly aphid,Adelges piceae (Ratz.) on the ultrastructure of bordered-pit membranes of grand fir,Abies grandis (Doug.) Lindl. J. Exp. Bot. 22:953-958.
Puritch, G.S. and W.W. Nijholt. 1974. Occurrence of juvabione-related compounds ingrand fir and Pacific silver fir infested by balsam woolly aphid. Can. J. Bot. 52:585-587.
_______________________________________________Host Interactions of the Balsam Woolly Adelgid
Presentations Third Symposium on Hemlock Woolly Adelgid
209
Puritch, G.S. and J.A. Petty. 1971. Effect of balsam woolly aphid, Adelges piceae (Ratz.),infestation on the xylem of Abies grandis (Doug.) Lindl. J. Exp. Bot. 22:946-952.
Puritch, G.S. and M. Talmon-De L’Armee. 1971. Effect of balsam woolly aphid, Adelgespiceae, infestation on the food reserves of grand fir, Abies grandis. Can. J. Bot. 49:1219-1223.
Ross, R.J. 1988. Patterns of Allelic Variation in Natural Populations of Abies fraseri(Pursh.) Poir. Ph.D. Thesis, North Carolina State University, Raleigh, North Carolina.119 p.
Rudinsky, J.A. 1956. Notes on the balsam woolly aphid. Presented by Pacific NorthwestForest and Range Experiment Station at annual meeting of Northwest Forest Pest ActionCouncil, 10/29/56 in Portland, Oregon. Weyerhaeuser Timber Company. 12 p.
Saigo, R.H. 1976. Anatomical changes in the secondary phloem of grand fir (Abies grandis)induced by the balsam woolly adelgid (Adelges piceae). Canadian Journal of Botany54:1903-1910.
Schooley, H.O. 1974. Balsam woolly aphid damage to the crowns of balsam fir trees. Can.For. Serv. Nfld. Inf. Rep. N-X-121. 27 p.
Schooley, H.O. 1976. Recovery of young balsam fir trees damaged by balsam woollyaphid. For. Chron. 52:143-4.
Schooley, H.O. and D.G. Bryant. 1978. The balsam woolly aphid in Newfoundland.Canada Forest Service, Newfoundland Forest Research Centre, Inf. Rep. N-X-160. 72 p.
Sidebottom, J. 2004. Christmas Tree Notes: Balsam Woolly Adelgid. North CarolinaCooperative Extension Service CTN-020. 4 p.
Silver, G.T. 1959. The balsam woolly aphid, Adelges piceae (Ratz.) in British Columbia. Bi-Mon. Progress Report, Can. Dept. Forest. 15(1):3.
Slama, K. and C.M. Williams. 1965. Juvenile hormone activity for the bug Pyrrhocorisapterus. Proc. Natl. Acad. Sci. USA 54:411-414.
Smith, F.H. 1967. Effects of balsam woolly aphid (Adelges piceae) infestation on cambialactivity in Abies grandis. American Journal of Botany 54:1215-23.
Speers, C.F. 1958. The balsam woolly aphid in the Southeast. Journal of Forestry 56:515-516.
Timell, T.E. 1986. Compression Wood in Gymnosperms. Volume 3. Ecology of compres-sion wood formation, silviculture and compression wood, mechanism of compressionwood action, compression wood in the lumber and pulp and paper industries, compres-sion wood induced by the balsam woolly aphid, opposite wood. Springer-Verlag. p.1339-2150.
Varty, I.W. 1956. Adelges insects of silver firs. For. Comm., Edinburgh, Bull. 26. 75 p.
Third Symposium on Hemlock Woolly Adelgid Presentations
Balakshin et al. _______________________________________________________________________________
210
A METHODOLOGICAL APPROACH TO ELUCIDATE THE EFFECT OF BALSAM
WOOLLY ADELGID INFESTATION ON THE STRUCTURE OF WOOD AND BARK
M. Balakshin, E. Capanema, J. Kadla, J. Frampton, and B. Goldfarb
College of Natural Resources, North Carolina State University,Raleigh, North Carolina, USA
Traditional analytical methods used in wood chemistry require a significant amount of timeand labor to obtain comprehensive information. Better understanding of the mechanisms ofpest-host interaction requires new methodological developments to elucidate changes in thechemical structures in components of various parts of the tree (wood, bark, foliage) triggeredby infestation. This paper reports development of a rapid and informative approach to eluci-date the structures of lignin and polyphenolics with nuclear magnetic resonance (NMR) spec-troscopy and its application to track the effect of balsam woolly adelgid (BWA) infestationon the chemical composition of Fraser fir wood and bark. Components of wood and barkhave been characterized by wet chemistry methods, correlation 2D NMR techniques (HMQC,HMBC, TOCSY), and quantitative 13C and 1H NMR.
In response to infestation, Fraser fir produces reddish wood (rotholz) with a high den-sity and low conductivity that is eventually responsible for the tree death. The rotholz woodhas a ~15% higher amount of lignin and much higher amount of galactans than that of unifestedtrees. Rotholz lignin has higher amounts of p-hydroxyphenyl (H) units and aliphatic Ohiogroups and lower amount of interunit linkages, implying that it is less crosslinked. The de-gree of condensation of the rotholz lignin is not higher than that of normal wood.
Chemical analysis of inner and outer bark samples from infested A. fraseri, unifested A.fraseri, and resistant A. veitchii showed a tendency toward lower amounts of lipophilic ex-tractives and higher amounts of low molecular mass phenols and polyphenols in the bark ofthe infested trees as compared to the bark of the uninfested trees. An NMR approach devel-oped for comparative analysis of ethanol- and water-soluble fractions allows for the charac-terization of the phenolic compounds without tedious chromatographic separation. Thesefractions consist predominantly of flavanoids and condensed tannins with small amounts ofphenylpropanoids and lignans. The bark polyphenolics of the infested trees contain muchhigher amounts of p-hydroxyphenyl moieties and lower amount of guaiacyl (G) aromaticmoieties than that of uninfested Fraser fir. The amount of H-moieties in bark polyphenolicsof the resistant Veitch fir is also high, but this does not result in a decrease in the G-unitcontent, in contrast to infested Fraser fir.
_____________ Using Mitochondrial DNA to Determine the Native Range of the Hemlock Woolly Adelgid
Presentations Third Symposium on Hemlock Woolly Adelgid
211
USING MITOCHONDRIAL DNA TO DETERMINE THE NATIVE RANGE OF THE
HEMLOCK WOOLLY ADELGID
Nathan P. Havill
Department of Ecology and Evolutionary Biology,Yale University, New Haven, CT 06520
ABSTRACT
The history of the introduction and spread of the hemlock woolly adelgid (HWA), Adelgestsugae (Hemiptera: Adelgidae), is well know for eastern North America where is it causingserious decline of eastern and Carolina hemlocks. However, while it is assumed that theseinsects were introduced from somewhere in Asia, we do not know their precise geographicorigin. Adelgids can also be found on other hemlock species in western North America andeast Asia, but these trees are not significantly damaged, suggesting the existence of differentvarieties of HWA.
The purpose of this study is to use molecular methods to clarify the relationship amonghemlock adelgids worldwide, and therefore determine the geographic origin of the introduc-tion to eastern North America. Three mitochondrial genes (COII, ND1, and cytB), provid-ing a total of over 1,500 base pairs of DNA, were sequenced for adelgid samples collectedfrom hemlock in multiple locations in eastern and western North America, China, and Japanto identify their differences.
Phylogenetic analyses indicate that the source of A. tsugae in eastern North Americawas a population of adelgids living on Tsuga seiboldii that occurs in the south and at lowerelevations in Japan. Adelgids collected in China appear to represent a separate lineage, as doadelgids collected from the other Japanese hemlock species, T. diversifolia. It is unclear whetheradelgids collected on T. heterophylla in western North America represent a native popula-tion, or were introduced from an un-sampled population in Japan.
These results indicate that molecular methods can be used to successfully pinpoint theorigin of introduced insect pests. In addition, these results can be used to facilitate quarantineefforts by helping to prevent the introduction of other non-native adelgid genotypes, and canhelp direct resistance breeding and biological control programs.
KEYWORDS
Mitochondrial DNA, phylogeny, native range.
Third Symposium on Hemlock Woolly Adelgid Presentations
Orwig and Kitteredge __________________________________________________________________________
212
SILVICULTURAL OPTIONS FOR MANAGING HEMLOCK FORESTS THREATENED BY
HEMLOCK WOOLLY ADELGID
David A. Orwig1 and David Kittredge2
1Harvard Forest, Harvard University,P.O. Box 68, Petersham, MA 01366
2 Department of Natural Resources Conservation, Holdsworth Hall,University of Massachusetts-Amherst, Amherst, MA 01003
ABSTRACTThe introduced hemlock woolly adelgid (HWA), Adelges tsugae, continues to migrate northinto New England, causing widespread hemlock decline and mortality, and an increase inhemlock removal. This outbreak has led to management dilemmas about pre-salvage andsalvage logging in hemlock stands: should they be cut down or not? Regardless of the deci-sion made, there is a critical need to review the available options and clearly determine theappropriate goals first, especially if HWA has not reached your forest yet. Although thereare various chemical and biological control options for HWA that are effective in ornamentalsituations, they are not practical or effective at larger scales of stands to landscapes. Thispaper describes silvicultural options available to help landowners manage their hemlock for-ests infested with or threatened by HWA.
KEYWORDSSilviculture, salvage logging, forest management, hemlock forests.
HWA INFORMATIONHWA is widely distributed throughout the eastern United States and moves from 10 to 20miles per year, transported primarily by wind, birds, and humans. In New England, adelgidmovement has been primarily in a northeasterly direction. Tree health and the timing andseverity of HWA impacts are influenced by several site and forest factors, including elevation,latitude, topographic position (ridgetop, side slope, hollow, wetland, riparian area etc.), andstructure. For example, research has shown that hemlock trees are just as likely to be infestedwith HWA whether they occur in a hemlock-dominated system or in mixtures with hard-woods or other conifer species (Orwig et al. 2002). It appears that no sites are immune fromHWA damage once the insects are firmly established, although hemlock trees growing onridgetops, on exposed drier sites, or infested with any other secondary pests like scale insectsoften succumb more quickly to HWA infestation (Bonneau et al. 1999, McClure et al. 2000,Orwig et al. 2002). In addition, extreme cold winter temperatures (below – 5oF or – 20oC) cancause severe HWA population reductions that may temporarily slow the spread and impactof HWA across the landscape (Parker et al. 1998, 1999, Skinner et al. 2003).
___________________________________________ Silvicultural Options for Managing Hemlock Forests
Presentations Third Symposium on Hemlock Woolly Adelgid
213
SILVICULTURAL OPTIONS
We often desire to manage forests in a way that is most “natural”; however, the current HWAoutbreak is novel and many would argue not natural. Harvesting options and related costsdiffer depending on the unique structure of hemlock in a particular forest and whether themanagement goal is aesthetics, wildlife habitat, water quality protection, public safety, futuresuccessional dynamics, timber revenue, or a combination of these goals. Pre-emptive cuttingof uninfested forests is not recommended unless maximizing timber revenue is the main ob-jective, because many questions exist regarding the future dynamics of hemlock and HWA,and cutting could remove potentially resistant hemlock genes. Once a decision has beenmade to cut hemlock, Best Management Practices (BMPs) should be used to protect forestsoils and water quality (Kittredge and Parker 1989, Ward et al. 2004; see also below) duringharvesting operations.
For infested hemlock-dominated forests, silvicultural options include:
Do nothing: Infested hemlock trees will die gradually over 4- 12 years depending on site character-istics, and the amount of light reaching the ground will gradually increase. Hemlock mortalitywill typically result in hardwood establishment, primarily black birch (Betula lenta) (Orwig andFoster 1998, Orwig et al. 2002). In Massachusetts and northern New England, white pine (Pinusstrobus), yellow birch (Betula alleghaniensis), oak (Quercus), and maple (Acer) species may alsoreplace hemlock. In addition, herbaceous plants like ferns and sedges (Carex spp.) may establishwith the death of hemlock (Orwig 2002). Branches, treetops, and boles will fall over a period of8 to 15+ years, with little or no scarification (soil disturbance). The dead standing and downedwood will provide valuable wildlife habitat for a variety of bird, mammal, and invertebrate spe-cies (Brooks 2001, Tingley et al. 2002). In public areas, doing nothing may require fencing tolimit access to hazard trees along trails, roads, and vistas.
Light selection cut/shelterwood cut: This option removes 20 to 50% of the tree basal area, includingthe dying and heavily damaged hemlock trees throughout the stand or in 0.5- to 1-acre open-ings. Since more light enters the stand through this treatment than the Do nothing option,raspberry (Rubus spp.), black birch, and white pine will be stimulated (Kizlinksi et al. 2002), andthey can be enriched with plantings (see below). Skid roads and landings used in this treatmentcan be used for subsequent cuts and/or salvage.
High intensity cutting: This option involves removing more than 50% of the tree basal area and isused if the stand is heavily damaged and/or recovering timber value is the main goal. High lightreaches the forest floor, often leading to regeneration of black birch and several weedy species,including raspberry, pokeweed (Phytolacca Americana), hay-scented fern (Dennstaedtiapunctilobula), and—sometimes—invasive species (Kizlinksi et al. 2002, Orwig and Kizlinski 2002).Heavy cutting may also lead to more abundant slash and damage or mortality of residual trees.In many cases, more valuable hardwood species are also removed to increase the value of thetimber sale (Brooks 2004), leading to hardwood sprouts from the stumps. The decision to re-move species other than hemlock needs to be carefully considered prior to cutting activity. Ifcutting is done without any regeneration present on steep slopes or near streams, it may poserisks of erosion and nutrient export to streams until newly established vegetation takes up nutri-ents and impedes overland flows.
Third Symposium on Hemlock Woolly Adelgid Presentations
Orwig and Kitteredge __________________________________________________________________________
214
For hemlock-hardwood or hemlock-conifer mixes (with or without planting) silvicul-tural options include:
Do nothing: As with hemlock dominated forests, infested hemlock trees will gradually die over 4 to12 years, and the stand will convert to a hardwood dominated stand or a mix of hardwoods andwhite pine. The dead standing and downed wood will provide valuable wildlife habitat for avariety of bird, mammal, and invertebrate species. Often no understory changes will occur ifhemlock is a minor component of stand.
Cut hemlock in groups or throughout stand: This option will speed up the conversion to hardwoodstands or will facilitate white pine and hemlock regeneration, especially if the stand is not in-fested or only lightly infested.
If cutting infested hemlock for timber revenue or removing hazard trees is the objective,cutting should begin by the time hemlocks have lost 50 to 75% of foliage, since it is unlikelythat they will recover with continued HWA infestation, and they become more hazardous tocut if severely damaged or dead.
PLANTING OPTIONS
Tree planting is not necessary, since trees and other vegetation will reproduce abundantly ontheir own in the brighter environment caused by hemlock mortality. There are no speciesthat can adequately replace hemlock. However, many species have been planted on sites thathave lost or will lose their hemlocks due to HWA or logging (Ward et al. 2004). If conifertrees are desirable, consider planting native species like white pine, red pine (Pinus resinosa),or white or red spruce (Picea glauca and Picea rubens). The exotic Norway spruce (Piceaabies) has been planted because of its full crown of dark green foliage. If promoting desirablehardwoods is the goal, then various oak species could be planted. If planting in areas of highdeer densities (i.e., greater than 20-25/mile2), seedling shelters and/or fencing may be requiredto allow the young trees to become established. When planting in logged areas, be aware thatblack birch and raspberry species will directly compete with any species planted, so plantingshould immediately follow logging.
HWA/HEMLOCK BEST MANAGEMENT PRACTICES (BMPS)
To reduce the chance that logging activities will spread HWA, consider:
Time of year — HWA has two generations per year and has mobile crawler stages in both latespring and early summer from March through June (McClure 1989). Examine the foliage andlogs for the presence of HWA during this time as the pest may be transported on machinery thatis moved from site to site, including personal vehicles. If possible, harvest in fall and winter toreduce the risk of transporting the pest and minimize soil disturbance.
Machinery — If harvesting during the months of March through June, power wash logging equip-ment to remove HWA.
State Quarantines — Vermont, New Hampshire, and Maine currently have quarantines that pre-vent transportation of hemlock seedlings, nursery stock, logs, lumber, bark, and chips into their
___________________________________________ Silvicultural Options for Managing Hemlock Forests
Presentations Third Symposium on Hemlock Woolly Adelgid
215
states except to pre-approved locations or under specific conditions. Contact individual StateForest Health specialists listed below for details.
Location — Know where your logging is with respect to HWA. Has HWA been identified in thetown where logging is taking place? Is it nearby? To find out the current distribution of HWAin your state contact the forest health specialists listed at the end of this paper.
SUMMARY
In conclusion, a variety of silvicultural alternatives are available for forest landowners withhemlock threatened by HWA. The options range from doing nothing to directly influencingvegetation succession with a variety of cutting methods and supplemental plantings, depend-ing on landowner objectives, overall hemlock health, and stand conditions. All options andassociated costs should be considered carefully when planning the appropriate managementstrategies to effectively meet the desired goals.
ACKNOWLEDGEMENTS
We would like to acknowledge the many landowners who granted unrestricted access tostudy sites including Harvard University’s Arnold Arboretum, the Metropolitan DistrictCommission’s Quabbin Reservoir, The Massachusetts Department of Conservation and Rec-reation, and W.D. Cowls, Inc. We appreciate the efforts of Peter Del Tredici, Richard Schulhof,and Bob Cook of the Arnold Arboretum and many loggers and foresters, especially BruceSpencer and Steve Ward, who made us aware of many hemlock harvests and for logisticalsupport. Janice Stone and Brian Hall provided technical assistance, and Laura Barbash, HeidiLux, and Amanda Park provided valuable field assistance. Dennis Souto, A. Ellison, B. Colburnand many researchers at the Harvard Forest provided critical comments on earlier versions ofthis manuscript. This research was financially supported by the USDA (Focus Funding Grant#01 – DG-11244225-037), the National Science Foundation (Grant # DEB-0236897), TheArnold Arboretum, and the Harvard Forest Long-Term Ecological Research Program.
REFERENCES
Bonneau, L.R., K.S. Shields, and D.L. Civco. 1999. Using satellite images to classify andanalyze the health of hemlock forests infested by the hemlock woolly adelgid. BiologicalInvasions 1:255-267.
Brooks, R.T. 2001. Effects of the removal of overstory hemlock from hemlock-dominatedforests on eastern redback salamanders. Forest Ecology and Management 149:197-204.
Brooks, R. T. 2004. Early regeneration following the presalvage cutting of hemlock fromhemlock-dominated stands. Northern Journal of Applied Forestry 21:12-18.
Kittredge, D.B. and M.L. Parker. 1989. Massachusetts Best Management Practices: TimberHarvesting Water Quality Handbook. Cooperative Extension, University of Massachu-setts and Massachusetts Department of Environmental Management. 46p.
Third Symposium on Hemlock Woolly Adelgid Presentations
Orwig and Kitteredge __________________________________________________________________________
216
Kizlinski, M.L., D.A. Orwig, R.C. Cobb, and D.R. Foster. 2002. Direct and indirectecosystem consequences of an invasive pest on forests dominated by eastern hemlock.Journal of Biogeography 29: 1489-1503.
McClure, M.S. 1989. Evidence of a polymorphic life cycle in the hemlock woolly adelgid,Adelges tsugae (Homoptera: Adelgidae). Annals of the Entomological Society of America82: 50-54.
McClure, M.S., C.A.S.-J. Cheah, and T.C. Tigner. 2000. Is Pseudoscymnus tsugae thesolution to the hemlock woolly adelgid problem?: an early perspective, pp. 89-96. InProceedings: symposium on sustainable management of hemlock ecosystems in easternNorth America, ed. by K.A. McManus, K.S.Shields, and D.R. Souto. USDA Gen. Tech.Rep. 267. Newtown Square, Pennsylvania.
Orwig, D.A. 2002. Stand dynamics associated with chronic hemlock woolly adelgidinfestations in southern New England, pp. 36-46. In Proceedings: Hemlock WoollyAdelgid in the Eastern United States Symposium, ed. R.C. Reardon, B.P. Onken, and J.Lashomb. New Jersey Agricultural Experiment Station Publication, New Brunswick,New Jersey.
Orwig, D.A. and D.R. Foster. 1998. Forest response to the introduced hemlock woollyadelgid in southern New England, USA. Journal of the Torrey Botanical Society 125:59-72.
Orwig, D.A. and M.L. Kizlinski. 2002. Vegetation response following hemlock woollyadelgid infestation, hemlock decline, and hemlock salvage logging, pp. 106-117. InProceedings: Hemlock Woolly Adelgid in the Eastern United States Symposium, ed.R.C. Reardon, B.P. Onken, and J. Lashomb. New Jersey Agricultural ExperimentStation Publication, New Brunswick, New Jersey.
Orwig, D.A., D.R. Foster, and D.L. Mausel. 2002. Landscape patterns of hemlock declinein New England due to the introduced hemlock woolly adelgid. Journal of Biogeogra-phy 29: 1475-1487.
Parker, B.L, M. Skinner, S. Gouli, T. Ahikaga, and H.B. Teillon. 1998. Survival of hem-lock woolly adelgid (Homoptera:Adelgidae) at low temperatures. Forest Science 44:414-420.
Parker, B.L, M. Skinner, S. Gouli, T. Ahikaga, and H.B. Teillon. 1999. Low lethal tem-perature for hemlock woolly adelgid (Homoptera: Adelgidae). Environmental Entomol-ogy 28:1085-1091.
Skinner, M., B.L. Parker, S. Gouli, and T. Ashikaga. 2003. Regional responses of hemlockwoolly adelgid (Homoptera: Adelgidae) to low temperatures. Environmental Entomol-ogy 32:523-528.
Tingley, M.W., D.A. Orwig, G. Motzkin, D.R. Foster, and R. Field. 2002. Avian responseto removal of a forest dominant: consequences of hemlock woolly adelgid infestations.Journal of Biogeography 29:1505-1516.
___________________________________________ Silvicultural Options for Managing Hemlock Forests
Presentations Third Symposium on Hemlock Woolly Adelgid
217
Ward, J.A., C.A.S.-J. Cheah, M.E. Montgomery, B.P. Onken, and R.S. Cowles. 2004.Eastern hemlock forests: guidelines to minimize the impacts of hemlock woolly adelgid.U.S. Department of Agriculture Forest Service, NA-TP-03-04, Morgantown, WestVirginia.
STATE FOREST HEALTH COOPERATORS
CONNECTICUT : Connecticut Agricultural Experiment Station, P.O. Box 1106, 123Huntington Street, New Haven, CT 06504-1106
MAINE: Maine Department of Conservation, Maine Forest Service, 22 State House Sta-tion, Augusta, ME 04333-0022
MASSACHUSETTS: Massachusetts Department of Conservation and Recreation, Divi-sion of Forests and Parks, Region 4 Headquarters, P.O. Box 484, Amherst, Massachusetts01004-0484
NEW HAMPSHIRE: NH Dept. of Resources and Economic Development, Division ofForests and Lands, P.O. Box 1856, 172 Pembroke Rd., Concord, NH 03302-1856
NEW YORK: New York Dept. of Environmental Conservation, Division of Lands andForests, 625 Broadway, Albany, NY 12233-4253
RHODE ISLAND: Rhode Island Dept. of Environmental Management, Division of For-est Environment, 1037 Hartford Pike, North Scituate, RI 02857-1030
VERMONT: Forest Resource Protection, VT Dept. of Forests, Parks and Recreation, 103S. Main Street, 10 South, Waterbury, VT 05671-0602
For more information on HWA and various control methods, see: http://www.fs.fed.us/na/morgantown/fhp/hwa/hwasite.html.
For information about hemlock timber value, see: http://forest.fnr.umass.edu/stumpage.html.
Third Symposium on Hemlock Woolly Adelgid Presentations
Rabaglia _____________________________________________________________________________________
218
THE MARYLAND HEMLOCK WOOLLY ADELGID MANAGEMENT PLAN
Robert J. Rabaglia
Forest Pest Management, Maryland Department of Agriculture50 Harry S Truman Pkwy, Annapolis MD 21401
Hemlocks are a limited resource in Maryland. Although they are relatively common orna-mental trees in the Baltimore-Washington urban area, most natural stands of hemlock arefound only in the northern and western parts of the state. Hemlocks are normally restrictedto riparian areas, and it is estimated that they occur on approximately 50,000 acres in Mary-land. Several stands in Garrett and other western counties are valued for their ecologicaluniqueness and recreational opportunities.
Hemlock woolly adelgids (HWA), Adelges tsugae, have been in Maryland since at leastthe mid-1980s. The first infestations in the state were found in the suburban ornamentalhemlocks in the Baltimore-Washington area, and natural stands in the area became infestedby 1990. The infestation steadily moved westward and native stands in Frederick and Wash-ington Counties became infested in the early to mid-1990s. Infested hemlocks in AlleganyCounty were found in 1999, and the first infested hemlock in Garrett County (the mostwestern Maryland county) was found in December, 2001.
In areas where HWA has been recorded for 10-15 years, it has resulted in mostly lightmortality, but significant hemlock decline. Areas that experienced drought in the late 1990sor have significant infestations of elongate hemlock scale have had the most decline and mor-tality.
During the past 15 years the Maryland departments of Agriculture and Natural Re-sources hve been involved in various HWA management activities. Statewide delimiting sur-veys were conducted in the early 1990s, impact plots were established, there have been severalreleases of biocontrol organisms, and several trees were injected with an insecticide.
Some high use recreation areas, such as Cunningham Falls State Park, have experiencedhemlock mortality and decline. In 2003, a team was assembled to initiate a hemlock manage-ment and restoration plan for the Park. More than 50 trees in the Park were injected withimidacloprid, and approximately 50 hazard trees were felled.
In 2003, the Hemlock Woolly Adelgid Task Force was assembled to develop a moreunified approach to statewide HWA management. The Task Force included members fromthe Maryland Department of Agriculture–Forest Pest Management (MDA), Maryland De-partment of Natural Resources, Maryland Forest Service, Wildlife and Heritage Program,Fisheries, State Parks, USDA Forest Service, and U.S. National Parks Service. After severalmeetings, the Task Force developed a Maryland Hemlock Woolly Adelgid Management Planto slow the damage and minimize the impacts of HWA. The objectives of the Plan are toidentify HWA infested stands, prioritize stands of highest resource value, and recommendactions in the highest priority stands. Additionally, the Plan is to serve as request for envi-ronmental review from the Department of Natural Resources to expedite approval of treat-ment options.
______________________________________ The Maryland Hemlock Woolly Adelgid Management Plan
Presentations Third Symposium on Hemlock Woolly Adelgid
219
The first step in the Management Plan is to identify the resource. The experience andknowledge of MDA and other professionals was used to inventory the known hemlock standsthroughout the state. MDA staff ground-checked many of the hemlock stands to estimatethe hemlock component and describe its health. The Task Force then met to prioritize thehemlock stand treatment based on the recreation, fisheries, wildlife, heritage, and forestryvalue of each stand. In addition, each stand was assessed for hemlock health and HWA infes-tation levels. A priority rank was then assigned to each of 150 stands across Maryland. Eachstand was digitized into a GIS, and information on rank, hemlock health, HWA levels wasadded to a database.
By the fall of 2004, the Management Plan was approved by a Department of NaturalResources Management Team. The top ranking 75 stands were then surveyed by MDA staffto assess HWA levels and assess the need for treatment. Two treatment options were selectedfor stands during the fall of 2004. Part of Rocky Gap State Park was chosen as a site forLaricobius beetle release. This part of the Park is inaccessible for other treatment types and isin a designated Wildlands Area. During the fall and early winter of 2004, approximately 150trees in 15 stands were treated with imidacloprid. These trees were injected using the ArborJetTree IV system using the IMAJet formulation.
In 2005, additional treatments are scheduled for the high priority sites. Tree injections,soil treatments, and biocontrol releases are treatment options being considered for these sites.
Third Symposium on Hemlock Woolly Adelgid Presentations
Blumenthal and Werner ________________________________________________________________________
220
AN OVERVIEW OF HEMLOCK WOOLLY ADELGID IPM IN PENNSYLVANIA:1999-2004
E.M. Blumenthal and S.M. Werner
Pennsylvania Department of Conservation and Natural Resources-Forestry
ABSTRACT
Since being introduced into the state in 1969, 42 of Pennsylvania’s 67 counties have beeninfested with the hemlock woolly adelgid. In 2004, Pennsylvania’s Department of Conserva-tion and Natural Resources (DCNR) has been using a variety of integrated pest managementtechniques to manage this destructive insect. We implemented a monitoring program in 2004that provides township level, georeferenced data on hemlock condition in Pennsylvania. Wehave had an active biocontrol program for hemlock woolly adelgid since 1999. To date wehave released over 186,985 predatory Sasajiscymnus tsugae beetles and 600 Laricobius nigrinusbeetles for use against hemlock woolly adelgid. We have confirmed overwintering and repro-duction success of S. tsugae in the field. We have identified 86 high value hemlock areas onstate forest and state park land that will be chemically treated with imidacloprid in spring2005. Pre-treatment data was collected on treatment and control trees at eight of the sites infall 2004. These sites will be used to evaluate the efficacy of chemical treatments in 2005 and2006. Pennsylvania DCNR is also attempting to manage the introduced elongate hemlockscale. We have released 82,000 predatory Cybocephalus nipponicus beetles against this insectsince 2003. Our future plans include expanding biocontrol efforts, using remote sensing inuninfested areas, and collaborating with others on hemlock resistance.
KEYWORDS:
Adelges tsugae, Sasajiscymnus tsugae, Laricobius nigrinus, imidacloprid, Cybocephalusnipponicus.
INTRODUCTION
Hemlock forest, as classified by Forest Inventory and Analysis (FIA), covers approximately293,000 acres in Pennsylvania. Hemlock woolly adelgid (HWA) currently occurs in 42 ofPennsylvania’s 67 counties, with the current leading edge cutting through the Ridge and Val-ley Province in the central part of the state (Figure 1). In 2004, Pennsylvania’s DCNR devel-oped an integrated pest management plan that outlines our strategies to manage this destruc-tive insect (Appendix 1). Some of the IPM techniques we use to combat the hemlock woollyadelgid include host monitoring using the General Hemlock Survey, biological control, andchemical control of high value hemlocks on state land using imidacloprid.
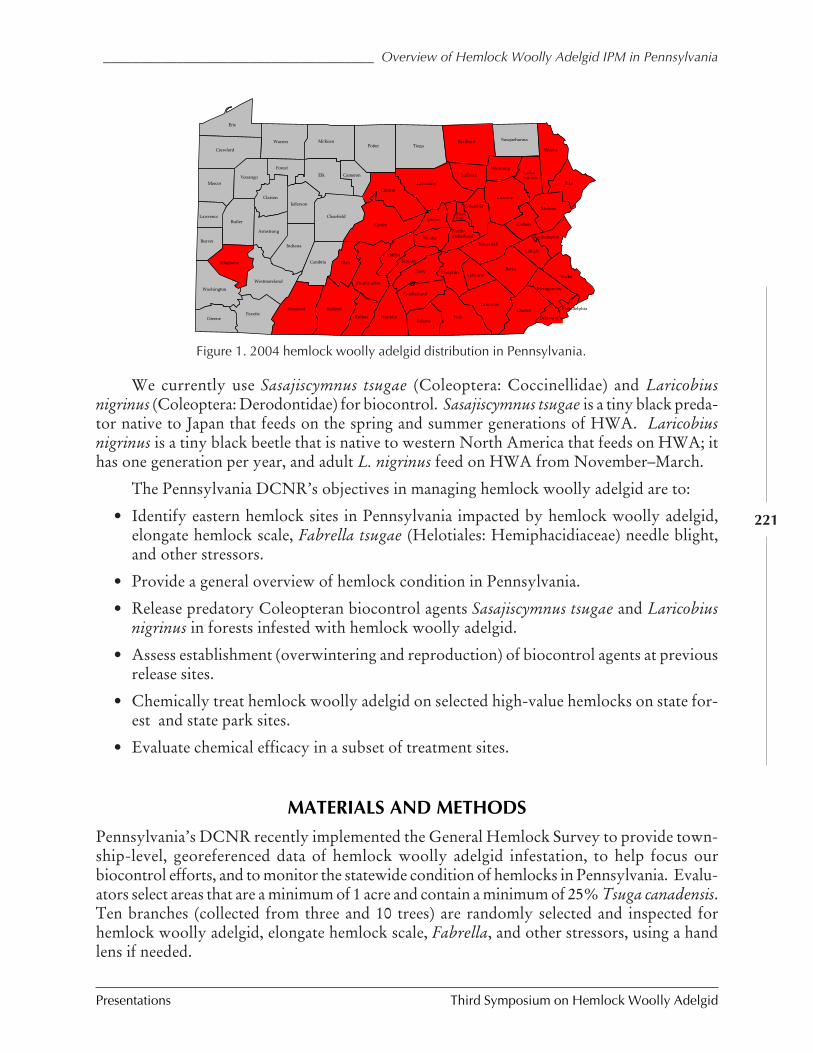
_____________________________________ Overview of Hemlock Woolly Adelgid IPM in Pennsylvania
Presentations Third Symposium on Hemlock Woolly Adelgid
221
We currently use Sasajiscymnus tsugae (Coleoptera: Coccinellidae) and Laricobiusnigrinus (Coleoptera: Derodontidae) for biocontrol. Sasajiscymnus tsugae is a tiny black preda-tor native to Japan that feeds on the spring and summer generations of HWA. Laricobiusnigrinus is a tiny black beetle that is native to western North America that feeds on HWA; ithas one generation per year, and adult L. nigrinus feed on HWA from November–March.
The Pennsylvania DCNR’s objectives in managing hemlock woolly adelgid are to:
• Identify eastern hemlock sites in Pennsylvania impacted by hemlock woolly adelgid,elongate hemlock scale, Fabrella tsugae (Helotiales: Hemiphacidiaceae) needle blight,and other stressors.
• Provide a general overview of hemlock condition in Pennsylvania.
• Release predatory Coleopteran biocontrol agents Sasajiscymnus tsugae and Laricobiusnigrinus in forests infested with hemlock woolly adelgid.
• Assess establishment (overwintering and reproduction) of biocontrol agents at previousrelease sites.
• Chemically treat hemlock woolly adelgid on selected high-value hemlocks on state for-est and state park sites.
• Evaluate chemical efficacy in a subset of treatment sites.
MATERIALS AND METHODS
Pennsylvania’s DCNR recently implemented the General Hemlock Survey to provide town-ship-level, georeferenced data of hemlock woolly adelgid infestation, to help focus ourbiocontrol efforts, and to monitor the statewide condition of hemlocks in Pennsylvania. Evalu-ators select areas that are a minimum of 1 acre and contain a minimum of 25% Tsuga canadensis.Ten branches (collected from three and 10 trees) are randomly selected and inspected forhemlock woolly adelgid, elongate hemlock scale, Fabrella, and other stressors, using a handlens if needed.
Figure 1. 2004 hemlock woolly adelgid distribution in Pennsylvania.
Erie
Warren McKean Potter Tioga
Bradford Susquehanna
WayneCrawford
Mercer Venango Forest
Elk Cameron Clinton Lycoming
Sullivan
Wyoming
Pike
Lawrence Butler
Clarion
Armstrong
Jefferson Clearfield
Centre Union
Beaver Allegheny
Washington
Greene
Westmoreland
Fayette
Indiana Cambria Blair
Huntingdon
Somerset Bedford Fulton
Mifflin Juniata
Perry
Franklin Cumberland
Snyder
Dauphin
North-umberland
Columbia
Luzerne
Schuylkill
Lebanon
AdamsYork
Lancaster
Chester
Berks
Carbon
Monroe
Northampton
Lehigh
Bucks
Montgomery
Delaware
Philadelphia
Lacka-wanna
Mon-tour
Third Symposium on Hemlock Woolly Adelgid Presentations
Blumenthal and Werner ________________________________________________________________________
222
Pennsylvania DCNR has been releasing Sasajiscymnus tsugae for biocontrol against hem-lock woolly adelgid since 1999. Beetles are received from the Philip Alampi Beneficial InsectLaboratory in New Jersey in exchange for infested foliage we provide them. We also pur-chase beetles from EcoScientific Solutions in Scranton, Pennsylvania. Qualifying release sitesare relatively healthy stands infested with hemlock woolly adelgid in central, southern, east-ern, and northern areas in Pennsylvania. We usually try to focus releases along the leadingedge of HWA infestation. Beating sheet evaluations are used to determine overwintering andreproductive success of these beetles in the field for at least three years post-release.
Pennsylvania DCNR participated in predator efficacy investigations of Scymnussinuanodulous (Coleoptera: Coccinellidae) in 1999, in collaboration with the ConnecticutAgricultural research Station (CAES). This involved providing weekly shipments of HWAto CAES in Hamden, Connecticut, and participating in branch bagging experiments.
Our Laricobius nigrinus release activities are part of a collaboration with Virginia Poly-technic Institute that began in 2003. The release site includes 15 release trees located inHuntingdon County, Pennsylvania, at N 40.6548, W 77.7371. There is also a nearby controlsite containing 10 similar trees at N 40.6707, W 77.7080. The release and control areas havehealthy hemlocks with low-density infestations of hemlock woolly adelgid. Beating sheetevaluations and sticky panel traps in hemlock canopies have been used in an attempt to re-cover previously released beetles.
We have identified 86 high value hemlock areas on state forest and state park land thatwill be treated with imidacloprid in spring 2005. Most sites will be treated through a state-approved contractor, while DCNR personnel will treat a small subset of sites. Trees locatedon adequate soil that are more than 50 feet from a stream or lake will be treated using soilinjections, while those that are closer to water will be treated using stem injections. We willevaluate hemlock condition before and after chemical treatment at eight of the treatment sites(four soil and four trunk injection sites) between 2004-2006.
Pennsylvania DCNR has been releasing Cybocephalus nipponicus (Coleoptera:Nitidulidae) for biocontrol against the elongate hemlock scale since 2003. We receive beetlesfrom the Philip Alampi Beneficial Insect Laboratory in New Jersey. We compared scaledensities at a control and release tree at one site in Lycoming County Pennsylvania to providepreliminary information on the effectiveness of C. nipponicus.
RESULTS
The DCNR surveyed 1,988 sites in 2004 as part of the General Hemlock Survey. Abundantnew growth was observed on 80% of hemlocks surveyed, probably due to ample rainfallreceived during the past two years. 54% of hemlocks surveyed were in light decline, 33%were healthy, 10% were in moderate decline and 3% were in severe decline. HWA was foundat 721 sites, while 258 sites contained elongate hemlock scale, 501 sites contained spider mites,and 78 sites contained spittlebugs. Townships with the highest populations of HWA werelocated in central and eastern Pennsylvania.
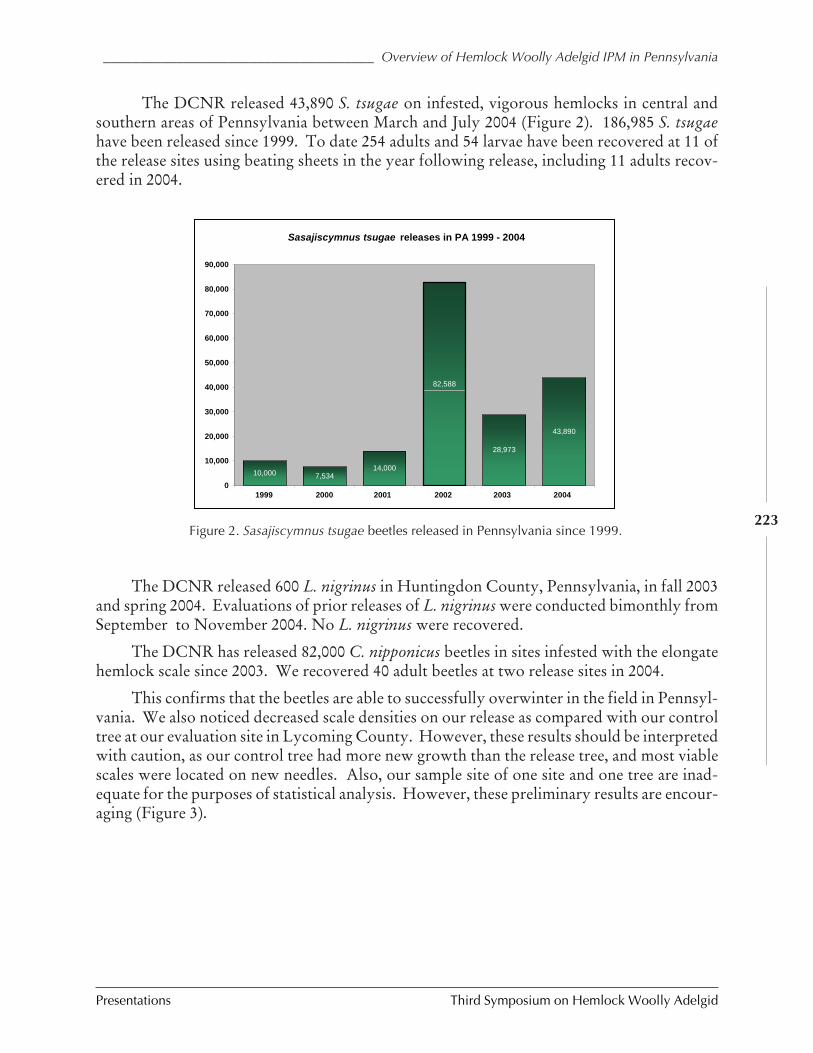
_____________________________________ Overview of Hemlock Woolly Adelgid IPM in Pennsylvania
Presentations Third Symposium on Hemlock Woolly Adelgid
223
The DCNR released 43,890 S. tsugae on infested, vigorous hemlocks in central andsouthern areas of Pennsylvania between March and July 2004 (Figure 2). 186,985 S. tsugaehave been released since 1999. To date 254 adults and 54 larvae have been recovered at 11 ofthe release sites using beating sheets in the year following release, including 11 adults recov-ered in 2004.
The DCNR released 600 L. nigrinus in Huntingdon County, Pennsylvania, in fall 2003and spring 2004. Evaluations of prior releases of L. nigrinus were conducted bimonthly fromSeptember to November 2004. No L. nigrinus were recovered.
The DCNR has released 82,000 C. nipponicus beetles in sites infested with the elongatehemlock scale since 2003. We recovered 40 adult beetles at two release sites in 2004.
This confirms that the beetles are able to successfully overwinter in the field in Pennsyl-vania. We also noticed decreased scale densities on our release as compared with our controltree at our evaluation site in Lycoming County. However, these results should be interpretedwith caution, as our control tree had more new growth than the release tree, and most viablescales were located on new needles. Also, our sample site of one site and one tree are inad-equate for the purposes of statistical analysis. However, these preliminary results are encour-aging (Figure 3).
Sasajiscymnus tsugae releases in PA 1999 - 2004
10,000 7,53414,000
82,588
28,973
43,890
0
10,000
20,000
30,000
40,000
50,000
60,000
70,000
80,000
90,000
1 2 3 4 5 61999 2001 2002 2003 20042000
Figure 2. Sasajiscymnus tsugae beetles released in Pennsylvania since 1999.
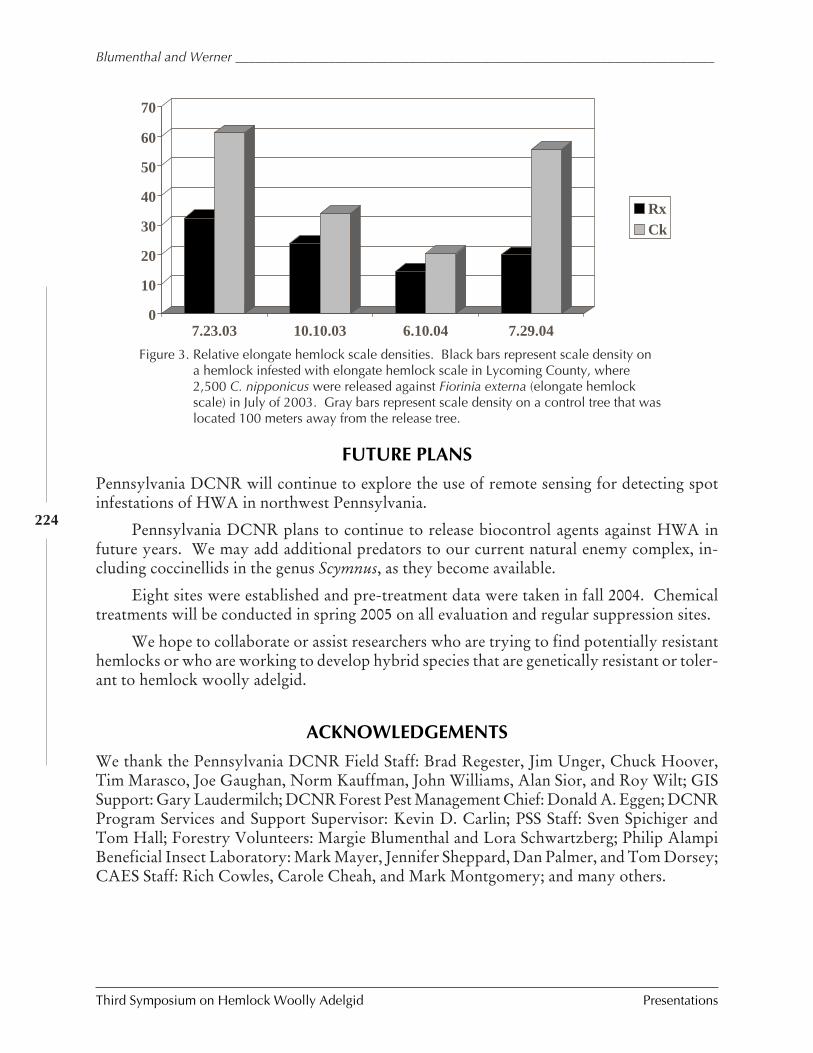
Third Symposium on Hemlock Woolly Adelgid Presentations
Blumenthal and Werner ________________________________________________________________________
224
FUTURE PLANS
Pennsylvania DCNR will continue to explore the use of remote sensing for detecting spotinfestations of HWA in northwest Pennsylvania.
Pennsylvania DCNR plans to continue to release biocontrol agents against HWA infuture years. We may add additional predators to our current natural enemy complex, in-cluding coccinellids in the genus Scymnus, as they become available.
Eight sites were established and pre-treatment data were taken in fall 2004. Chemicaltreatments will be conducted in spring 2005 on all evaluation and regular suppression sites.
We hope to collaborate or assist researchers who are trying to find potentially resistanthemlocks or who are working to develop hybrid species that are genetically resistant or toler-ant to hemlock woolly adelgid.
ACKNOWLEDGEMENTS
We thank the Pennsylvania DCNR Field Staff: Brad Regester, Jim Unger, Chuck Hoover,Tim Marasco, Joe Gaughan, Norm Kauffman, John Williams, Alan Sior, and Roy Wilt; GISSupport: Gary Laudermilch; DCNR Forest Pest Management Chief: Donald A. Eggen; DCNRProgram Services and Support Supervisor: Kevin D. Carlin; PSS Staff: Sven Spichiger andTom Hall; Forestry Volunteers: Margie Blumenthal and Lora Schwartzberg; Philip AlampiBeneficial Insect Laboratory: Mark Mayer, Jennifer Sheppard, Dan Palmer, and Tom Dorsey;CAES Staff: Rich Cowles, Carole Cheah, and Mark Montgomery; and many others.
Figure 3. Relative elongate hemlock scale densities. Black bars represent scale density ona hemlock infested with elongate hemlock scale in Lycoming County, where2,500 C. nipponicus were released against Fiorinia externa (elongate hemlockscale) in July of 2003. Gray bars represent scale density on a control tree that waslocated 100 meters away from the release tree.
0
10
20
30
40
50
60
70
7.23.03 10.10.03 6.10.04 7.29.04
Rx
Ck
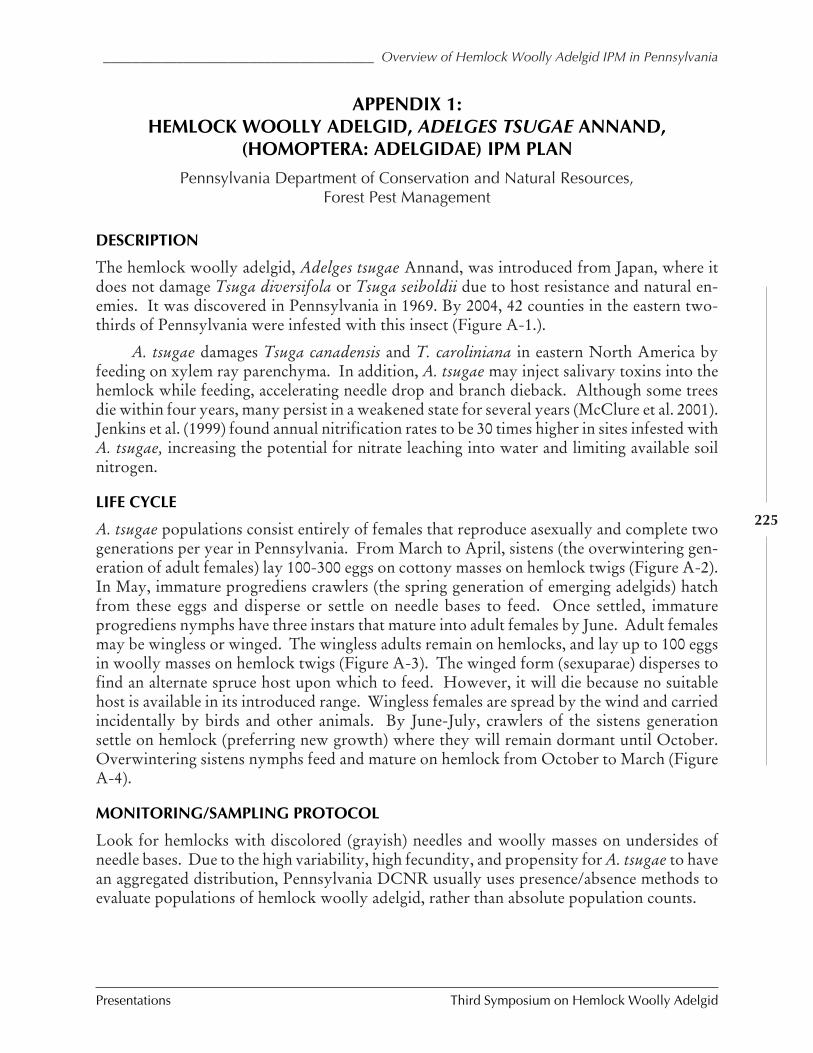
_____________________________________ Overview of Hemlock Woolly Adelgid IPM in Pennsylvania
Presentations Third Symposium on Hemlock Woolly Adelgid
225
APPENDIX 1:HEMLOCK WOOLLY ADELGID, ADELGES TSUGAE ANNAND,
(HOMOPTERA: ADELGIDAE) IPM PLAN
Pennsylvania Department of Conservation and Natural Resources,Forest Pest Management
DESCRIPTION
The hemlock woolly adelgid, Adelges tsugae Annand, was introduced from Japan, where itdoes not damage Tsuga diversifola or Tsuga seiboldii due to host resistance and natural en-emies. It was discovered in Pennsylvania in 1969. By 2004, 42 counties in the eastern two-thirds of Pennsylvania were infested with this insect (Figure A-1.).
A. tsugae damages Tsuga canadensis and T. caroliniana in eastern North America byfeeding on xylem ray parenchyma. In addition, A. tsugae may inject salivary toxins into thehemlock while feeding, accelerating needle drop and branch dieback. Although some treesdie within four years, many persist in a weakened state for several years (McClure et al. 2001).Jenkins et al. (1999) found annual nitrification rates to be 30 times higher in sites infested withA. tsugae, increasing the potential for nitrate leaching into water and limiting available soilnitrogen.
LIFE CYCLE
A. tsugae populations consist entirely of females that reproduce asexually and complete twogenerations per year in Pennsylvania. From March to April, sistens (the overwintering gen-eration of adult females) lay 100-300 eggs on cottony masses on hemlock twigs (Figure A-2).In May, immature progrediens crawlers (the spring generation of emerging adelgids) hatchfrom these eggs and disperse or settle on needle bases to feed. Once settled, immatureprogrediens nymphs have three instars that mature into adult females by June. Adult femalesmay be wingless or winged. The wingless adults remain on hemlocks, and lay up to 100 eggsin woolly masses on hemlock twigs (Figure A-3). The winged form (sexuparae) disperses tofind an alternate spruce host upon which to feed. However, it will die because no suitablehost is available in its introduced range. Wingless females are spread by the wind and carriedincidentally by birds and other animals. By June-July, crawlers of the sistens generationsettle on hemlock (preferring new growth) where they will remain dormant until October.Overwintering sistens nymphs feed and mature on hemlock from October to March (FigureA-4).
MONITORING/SAMPLING PROTOCOL
Look for hemlocks with discolored (grayish) needles and woolly masses on undersides ofneedle bases. Due to the high variability, high fecundity, and propensity for A. tsugae to havean aggregated distribution, Pennsylvania DCNR usually uses presence/absence methods toevaluate populations of hemlock woolly adelgid, rather than absolute population counts.
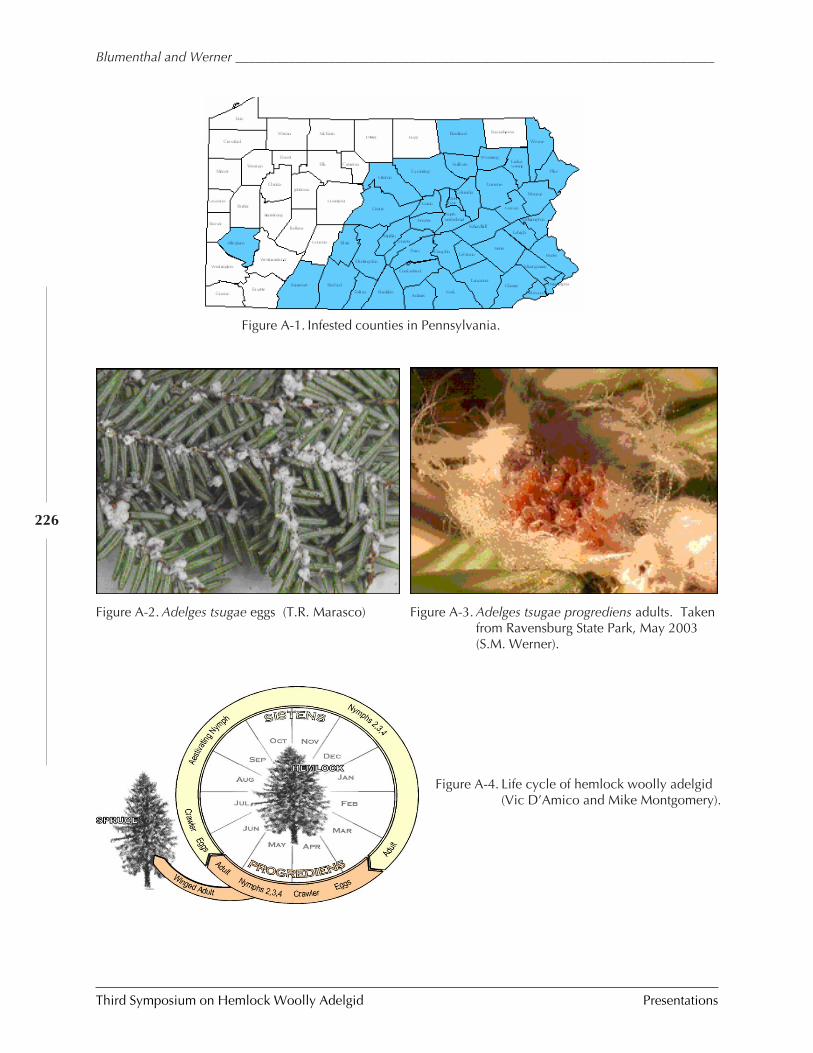
Third Symposium on Hemlock Woolly Adelgid Presentations
Blumenthal and Werner ________________________________________________________________________
226
Figure A-4. Life cycle of hemlock woolly adelgid(Vic D’Amico and Mike Montgomery).
Figure A-1. Infested counties in Pennsylvania.
Figure A-2. Adelges tsugae eggs (T.R. Marasco) Figure A-3. Adelges tsugae progrediens adults. Takenfrom Ravensburg State Park, May 2003(S.M. Werner).
_____________________________________ Overview of Hemlock Woolly Adelgid IPM in Pennsylvania
Presentations Third Symposium on Hemlock Woolly Adelgid
227
Pennsylvania DCNR uses the following method to compare control and treatment treesin our chemical suppression program. The distal 25 shoots of four vigorous branches areselected from the lower crown of a hemlock and tagged with cable ties on each control andtreatment tree. All selected branches possess new growth and are infested with live adelgids,as confirmed by the presence of new wool on the branches. Samples targeting sistens oncurrent year’s growth will be taken in fall 2004. The same branches, if possible, will be re-evaluated in fall 2005 and fall 2006. On each branch, the number of shoots with new growth,the number of dead shoots, and the number of shoots infested with at least one live hemlockwoolly adelgid will be assessed. The presence of other stressors, including Fiorinia externa,hemlock borer, and hemlock looper, will also be noted for each tree. The vigor, transparency,and live crown ratio will also be recorded for each tree, each time that A. tsugae evaluationsare made.
In some cases, it may be necessary to obtain branch samples from tall trees using ashotgun or pole-pruning. Advantages of shotgun sampling are the ability to sample in higherin the canopy where new growth is present. However, it is not possible to count the numberof terminals as fragments of branches rather than whole branches are often obtained usingthis method. Both methods have the disadvantage of being destructive sampling methods,which prevent the evaluator from repeatedly measuring the same branch over time.
Remote sensing technologies are also being evaluated for monitoring A. tsugae. Penn-sylvania DCNR and Denise Royle, Rutgers University, are working on expanding the algo-rithm she developed for using Landsat imagery to detect changes in hemlock health in thearea from New Jersey to Pennsylvania. Royle and Lathrop (1997) quantified impacts of A.tsugae on hemlock health in the New Jersey Highlands using Landsat Thematic Mapper dataand a model to compare vegetative index differences in near infrared/red reflectance values.Royle found that, from 1984 to 1994, 47% of the hemlock remained healthy to lightly defoli-ated, 44% underwent moderate decline, and 9% died. Pennsylvania DCNR and the USDAForest Service are exploring the use of remote sensing to detect new infestations of A. tsugaealong the leading edge of infestations and in isolated patches.
MANAGEMENT/CONTROL
Biocontrol Recommended in forest situations, on smaller vigorous trees with moderate toheavy Adelges tsugae populations.
Sasajiscymnus tsugae (Coleoptera: Coccinellidae) A tiny, black beetle discovered by Mark McClurein Japan in 1992, S. tsugae larvae and adults are only known to prey upon hemlock woollyadelgid, balsam woolly adelgid, and pine bark adelgid. Each larva consumes about 500 eggs or50-100 nymphs (Cheah and McClure 1998). Adults can live for over a year and consume 50adelgids/week. S. tsugae females lay up to 300 eggs in March and April, during peak egg layingof adelgids. The beetles have a second generation in June around the same time as the secondadelgid generation. Adult S. tsugae survive on dormant young adelgids during the summer.Pennsylvania DCNR obtains S. tsugae from EcoScientific Solutions (Scranton, Pennsylvania)and the New Jersey Department of Agriculture (NJDA), which rear S. tsugae on foliage sent tothem from Pennsylvania. Releases of S. tsugae are focused on Tsuga canadensis along the lead-ing edge of the A .tsugae infestation in Pennsylvania, on trees that are relatively healthy, andthus have some chance of recovery. At least 2,000 S. tsugae are released at sites on sunny days in
Third Symposium on Hemlock Woolly Adelgid Presentations
Blumenthal and Werner ________________________________________________________________________
228
May through July. Beating sheet evaluations are used to confirm adult and larval establishmentat release sites for at least three years following release. As of 2004, we have released 186,985 S.tsugae beetles in Pennsylvania.
Laricobius nigrinus (Coleoptera: Derodontidae) This beetle is found in western North America,where it preys on Adelges tsugae on western hemlock, Tsuga heterophylla. The genus Laricobiusfeeds only on woolly adelgids. Laricobius nigrinus has one generation per year, with adultsfeeding on HWA sistens in the fall and winter. Adults lay an average of 100 eggs around March15 on A. tsugae sistens ovisacs. Each larva consumes up to 250 A. tsugae eggs until mature,when L. nigrinus enters the soil to pupate. Adults remain dormant in the soil until fall. Hostspecificity tests found that L. nigrinus preferred to feed on A. tsugae over most other woollyadelgids, and it was only able to complete its development on A. tsugae (Zilahi-Balogh 2002).Six hundred L. nigrinus were released in central Pennsylvania in 2003-2004.
Scymnus spp. Several species in this genus are being investigated for release.
Scymnus (Neopullus) sinuanodulus A univoltine coccinellid native to China, this beetle has a hostrange restricted to adelgids. Adults lay 130-200 eggs in early spring and feed on all stages ofadelgid. Larval S. sinuanodulus grow faster and experience lower mortality on adelgid eggs thanon nymphs (Lu and Montgomery 2001).
Scymnus ningshanensis Similar to P. tsugae, S. ningshanensis is found to have greater numericalresponse in terms of egg laying. Differentiating between males and females is problematic.
Scymnus campodromus Mike Montgomery is investigating this potential predator. It’s eggs dia-pause.
Diapterobates humeralis An oribatid mite that regulates A. tsugae in Japan (McClure 1995a), D.humeralis doesn’t eat eggs but dislodges them when feeding on their wool. But D. humeralis isnot a good candidate for biocontrol due to low reproductive potential and long generations.
In general, our goal in biocontrol is to pick candidates for release that are effective and asspecialized as possible. All organisms go through a testing and approval process with USDA.We may collaborate with that agency in the future to evaluate potential nontarget effects (i.e.,on native prey or native competitors) of these biocontrol agents once released into the field.
Chemical Control Practical on an individual tree level for private landowners and publicareas with specific high-value trees (e.g., state parks and high use recreational areas).
Imidacloprid For use on large trees after infestation has occurred. Fairly high cost (about 79 centsto $1 per inch of tree dbh) prohibits forest-wide use. Shown to be effective against A. tsugae,especially trees with little new growth and no dieback (Steward and Horner, 1994, Webb et al.2003). Trees under drought stress and those with needle loss and dieback will have difficultytransporting and distributing this systemic insecticide to their canopies (McClure et al. 2001).The 75WP (wettable powder) formulation (Merit) may be applied at mid-concentration (1oz /inch tree dbh) using a Kioritz injector around the base of the tree in areas at least 50’ away fromwaterways (which has advantage of not wounding the tree bark); the chemical is absorbed throughthe roots, affording at least six months of control. Direct tree bole injections of 5% concentra-tion applied at the rate of ½-1 mL/inch tree dbh should be used for trees closer than 50’ towaterways as part of a “best management practice.” Preliminary research suggests that soilinjection treatments made in the autumn and bole injections made in spring are optimally effec-tive.
_____________________________________ Overview of Hemlock Woolly Adelgid IPM in Pennsylvania
Presentations Third Symposium on Hemlock Woolly Adelgid
229
1% Horticultural oil More practical for single trees than large areas. May be used to drench treesoften < 30’ high in April or September and June. This option works by drying and suffocatingadelgids and other soft-bodied insects, and is less toxic than conventional insecticides.
WARNING: avoid nitrogen fertilization of infested hemlock! McClure (1991) found five timesas many A. tsugae on fertilized vs. unfertilized hemlocks, and the percentage of surviving nymphsand female egg production was more than twice as high. Results were similar whether fertiliza-tion occurred at infestation or 6 months later, indicating that no increased resistance was con-ferred from fertilization.
Silvicultural Maintain stand vigor by watering area beneath crown dripline during periodsof drought to ensure that the tree receives 1 inch of water per week. Selectively remove largetrees when heavily infested that act as “reservoirs” for adelgid spread. Replant decimatedareas with natives, such as eastern white pine or resistant species, such as the western hemlock(T. heterophylla), which resembles T. canadensis in growth form, appearance, and utility(McClure 1995b). Hemlock is known to inhibit its own regeneration through allelopathy.Hemlock litter extracts reduced seed germination by 74% and caused 100% mortality in 6day old seedlings, but no mortality in seedlings 2 weeks or older (Ward and McCormick1982).
Cultural A. tsugae crawlers often spread through phoresy or “hitchhiking” on birds, plants,mammals, humans, and by wind. Because of this, caution must be used when moving mate-rial from infested areas, especially from Mar-June. Spraying infested branches with water inApril-June can dislodge eggs and crawlers. Clipping heavily infested branches can also re-duce tree populations (McClure 1995b).
Host Tolerance/Resistance/Hybridization It is suspected that one of the reasons A. tsugaeis so damaging to eastern hemlock is that there is a lack of evolved host tolerance or resistanceto this insect’s feeding, relative to Asian or even western species of hemlock. One approachto this problem is to identify Tsuga canadensis in the field that seem to be surviving A. tsugaeinfestations better than others. This assumes a certain level of intraspecific genetic variationin T. canadensis. However, Zabinski (1992) found eastern hemlock to have unexpectedly lowgenetic variation among seventeen populations examined throughout its range, with the pro-portion of polymorphic loci being only 0.10 and the number of alleles per locus (among 10loci examined) being 1.1, significantly lower than many other gymnosperms. Low geneticvariation may indicate a population bottleneck during the Pleistocene. Other researchershave found significant differences in photosynthesis, respiration and transpiration among twodisjunct populations of eastern hemlock (Eickmeier et al. 1975).
Another option is attempting to hybridize T. canadensis with a more tolerant or resis-tant host. Susan Bentz and Margaret Pooler at the National Arboretum in Washington DChas been involved with hybridization experiments. Attempts to hybridize T. canadensis withthree Asian species have been unsuccessful (Bentz et al. 2002). Also, attempts to hybridize T.canadensis with the morphologically similar western hemlock (T. heterophylla) or mountainhemlock (T. mertensia) have been unsuccessful because these species are not well adapted tothe east coast climate. Brian Maynard at the University of Rhode Island is also testing T.heterophylla. His thought is that the seed source for western hemlock has been taken from
Third Symposium on Hemlock Woolly Adelgid Presentations
Blumenthal and Werner ________________________________________________________________________
230
coastal areas and is not cold hardy north of zone 6. Maynard is targeting seed collected fromhigh elevations in Idaho and southeastern British Columbia.
OTHER FACTORS:
Elevation Hemlock woolly adelgid is not known to occur at elevations over 1,980 feet in itsnative range (McClure and Cheah 1999). Observations suggest that this is also true in someareas of Pennsylvania.
Weather
Drought Because hemlock is a shallow-rooted species, it is vulnerable to drought and windthrow.Drought can intensify impacts of A. tsugae and other stressors. Drought stress over the past fiveyears in Pennsylvania has noticeably increased hemlock decline in several areas. Pollen recordsshow that summer drought in eastern North America that occurred between 5,700 and 5,100years ago was a major contributing factor in a decline in hemlock that lasted over 1,000 yearsduring that period.
Wind Aerial distribution enhances adelgid dispersal, carrying eggs and nymphs at least 1 km awayfrom infested areas. Adelges tsugae crawlers are active earlier in the spring than F. externa whenwinds are stronger and more frequent. Exposure to higher winds (along with its parthenogenicmode of reproduction) is suspected to contribute to A. tsugae spreading more rapidly than F.externa (McClure 1989).
Heavy rain Precipitation can also affect A. tsugae survival by dislodging eggs and nymphs fromtrees (McClure 1989).
Snowfall/Cold Temperatures High winter mortality can occur in conditions of extremely lowtemperatures, temperature flux, and high snowfall in North America. Conversely, mild wintersin the northeast have resulted in explosive adelgid populations the following seasons.
Negative density dependent feedback (McClure): Like many invasive species, A. tsugae can pre-vent hemlock from producing new growth, and thus ultimately harms its own future survivalthrough increased production of sexuparae and lower fecundity of sistens on old growth.
Other Hemlock Pests: Arthropods—such as elongate hemlock scale (Fiorinia externa[Homoptera: Diaspidae]), Agrallaspis ithacae, and Nucleolaspis tsuga), hemlock borer(Melanophila fulvogatta [Coleoptera: Elateridae]), hemlock looper (Lambdina fiscellaria),hemlock needleminer, spider mites, and spittlebugs—and diseases such as Fabrella needlecast, can further weaken trees affected by hemlock woolly adelgid.
LITERATURE CITED:
Bentz, S.E., L.G.H. Riedel, M.R. Pooler, and A.M. Townsend. 2002. Hybridization andself-compatibility in controlled pollinations of eastern North American and Asian hem-lock (Tsuga) species. J. of Arboriculture 28:200-205.
Cheah, C.A.S.J. and M.S. McClure, 1998. Life history and development of Pseudoscymnustsugae (Coleoptera: Coccinellidae) a new predator of the hemlock woolly adelgid(Homoptera: Adelgidae). Environ. Entomol. 27:1531-1536.
_____________________________________ Overview of Hemlock Woolly Adelgid IPM in Pennsylvania
Presentations Third Symposium on Hemlock Woolly Adelgid
231
Eckmeier, W., M. Adams, and D. Lester. 1975. Two physiological races of Tsugacanadensis in Wisconsin. Can. J. Bot. 53:940-951.
Jenkins, J.C., J.D. Aber, and C.D. Canham. 1999. Hemlock woolly adelgid impacts oncommunity structure and N cycling rates in eastern hemlock forests. Can. J. For. Res.29:630-645.
Lu, W. and M.E. Montgomery. 2001. Oviposition, development, and feeding of Scymnus(Neopullus) sinuanodulus (Coleoptera: Coccinellidae): A predator of Adelges tsugae(Homoptera: Adelgidae). Annals of Entomol. Soc. America 94:64-70.
McClure, M.S., 1989. Importance of weather to the distribution and abundance of intro-duced adelgid and scale insects. Agric. For. Meteorol., 47:291-302.
McClure, M.S. 1991. Nitrogen fertilization increases susceptibility to hemlock woollyadelgid. J. Arboric. 17 (8):227-230.
McClure, M.S. 1995a. Diapterobates humeralis (Oribatida: Ceratozetidae): an effectivecontrol agent of hemlock woolly adelgid (Homoptera: Adelgidae) in Japan. Environ.Entomol. 24 (5):1207-1215.
McClure, M.S. 1995b. Managing Hemlock Woolly Adelgid in Ornamental Landscapes.Conn Ag Exp Stn, Bulletin 925, May 1995.
McClure, M.S. and C.A.S.J. Cheah. 1999. Reshaping the ecology of invading populations ofhemlock woolly adelgid, Adelges tsugae (Homoptera: Adelgidae), in eastern NorthAmerica. Biol. Invasions 1:247-254.
McClure, M.S., S.Salom, and K.S. Shields. 2001. Hemlock woolly adelgid. USFS-FTET-2001-03. Morgantown, West Virginia. 14 pp.
Royle, D.D. and R.G. Lathrop, 1997. Monitoring hemlock forest health in New Jerseyusing Landsat TM data and change detection techniques. For Sci. 43 (3):327-335.
Steward, V.B. and T.A. Horner. 1994. Control of hemlock woolly adelgid using soilinjections of systemic insecticides. J. Arboric. 20:287-288.
Ward, H.A. and L.H. McCormick. 1982. Eastern hemlock allelopathy. For. Sci. 28:681-686.
Webb, R.E., J.R. Frank, and M. J. Raupp. 2003. Eastern hemlock recovery from hemlockwoolly adelgid damage following imidacloprid therapy. J. Arboric. 29 (5):298-302.
Zabinski, C. 1992. Isozyme variation in eastern hemlock. Can. J. For. Res. 22:1838-1842.
Zilahi-Balogh, G.M.G., L.T. Kok, and S.M. Salom. 2002. Host specificity of Laricobiusnigrinus Fender (Coleoptera: Derodontidae), a potential biological control agent ofhemlock woolly adelgid, Adelges tsugae Annand (Homoptera: Adelgidae). Biol. Control24:192-198.
Third Symposium on Hemlock Woolly Adelgid Presentations
Johnson et al. _________________________________________________________________________________
232
MANAGING HEMLOCK WOOLLY ADELGID AND BALSAM WOOLLY ADELGID AT
GREAT SMOKY MOUNTAINS NATIONAL PARK
Kristine Johnson, Glenn Taylor, and Thomas Remaley
ABSTRACT
Great Smoky Mountains National Park (GRSM) was established in 1935 to protect 525,000acres of the Blue Ridge Mountains in western North Carolina and east Tennessee. It is thelargest area in the eastern US managed as wilderness and the most heavily visited NationalPark. While about 80% of the Park’s forests were at least selectively logged (including severalbillion board feet of hemlock), some of the most extensive old growth forests in the eastremain, and a majority of the remote higher elevations were spared (Pyle 1985, Stupka 1964).A 1994 study verified 726 acres of old growth hemlock, with ages over 400 years and treeheights over 160 feet (Johnson 1995 and Yost et al. 1994). Fire suppression has caused anincrease in hemlock in the understory of several forest types, including cove and pine-oak,over the past 30 years (Jenkins and White 2002). Hemlocks are a key species as habitat formany upland birds, invertebrates and mammals and shade miles of riparian areas (Shriner2002).
The Park contains the largest remaining area (48,721 acres) of the southern Appalachianred spruce/Fraser fir forest type (USDA Forest Service 1988). The balsam woolly adelgid(BWA) was discovered in the northeastern section of the Park in 1962; initial managementconsisted of clearcutting dozens of acres in an attempt to confine the infestation, such as wasdone to control southern pine beetle. BWA had spread throughout the range of fir in the Parkby 1985, when the National Park Service and USDA Forest Service began a program of insec-ticidal soap spraying in two accessible areas, Clingman’s Dome and Balsam Mountain Road.Remnant fir stands have been mapped and bark samples evaluated for juvabione, a juvenilehormone-related compound thought to inhibit BWA reproduction. A genotype preservationplantation was established in cooperation with the University of Tennessee, and a 2001 studydelineated remnant stands surviving on several peaks (Kloster 2001). Soap spraying continueson Balsam Mountain Road, and BWA is annually monitored at four locations.
Hemlock woolly adelgid (HWA) was discovered in the Park in April, 2002, near FontanaLake. The Park had already begun documenting pre-infestation baseline conditions with the1994 old growth survey and cooperative studies with entomologists at the University of Ten-nessee and North Carolina State University to inventory invertebrates associated with hem-lock (Johnson et al. 1999). A new vegetation map prepared by the University of Georgia(Welch et al. 2002) provided detailed maps of various forest types, which became an impor-tant tool in surveying hemlock stands for HWA. This new map shows a total hemlock re-source of 87,473 acres in all forest types with a hemlock association, including 5,000 acres ofpure hemlock.
______________________________ Managing HWA and BWA at Great Smoky Mountains National Park
Presentations Third Symposium on Hemlock Woolly Adelgid
233
Management priorities were established according to tools available (insecticidal soapand oil, systemic insecticides, and biological control), importance of hemlock resources, andaccessibility. While the remote old growth stands are the most valuable ecologically, they arethe most difficult to treat logistically, and biological control agents are the best possibility formaintaining a viable forest. Roadside and developed areas (campgrounds, picnic areas, andvisitor centers) are relatively easy to manage using insecticides. Biological control has beenused at a total of 30 sites, and 900 acres of hemlock were treated for HWA with insecticides infiscal year 2004.
REFERENCES
Jenkins, M.A. and P.S. White. 2002. Cornus florida L. mortality and understory composi-tion changes in western Great Smoky Mountains National Park. The Journal of theTorrey Botanical Society 129(3):194–206.
Johnson, K.D, F.P. Hain, K.S. Johnson, and F. Hastings. 1999. Hemlock Resources at Riskin the Great Smoky Mountains National Park. Proceedings: Symposium on sustainableManagement of Hemlock Ecosystems in North America. USDA-USFS publicationGTR-NE-276
Johnson, K.S. 1995. Eastern Hemlock Forest Delineation in Great Smoky MountainsNational Park. In-house publication- Resources Management and Science Division,Great Smoky Mountains National Park, Gatlinburg, Tennessee. 39 p.
Kloster, M. 2001. Delineation of Surviving Fraser Fir Stands. Great Smoky MountainsNational Park report.
Pyle, C. 1985. Vegetation Disturbance History of Great Smoky Mountains National Park:An Analysis of Archival Maps and Records. Research/Resources Management ReportSER-77 NPS, Southeast Region. 69 p.
Shriner, S. 2002. Personal communication regarding hemlock in vegetation monitoringpoints in Great Smoky Mountains National Park for a Ph.D. dissertation at NorthCarolina State University Department of Zoology.
Stupka, A. 1964. Trees, Shrubs and Woody Vines of the Great Smoky Mountains NationalPark. University of Tennessee Press, Knoxville Tennessee.186 p.
USDA Forest Service. 1988. Evaluation of Spruce and Fir Mortality in the Southern Appa-lachian Mountains. Protection Report R8-PR 13 October 1988.
Welch, R., M. Madden, and T. Jordan. 2002. Photogrammetric and GIS techniques for thedevelopment of databases of mountainous areas: Great Smoky Mountains National Park.ISPRS Journal of Photogrammetry and Remote Sensing 57:53-68
Yost, E.C., K.S. Johnson, and W.F. Blozan. 1994. Old Growth project: stand delineationand disturbance rating. National Park Service, Great Smoky Mountains National Park,Technical Report NPS/SERGSM/NATR. 102 p.
Third Symposium on Hemlock Woolly Adelgid Presentations
Burns et al. ___________________________________________________________________________________
234
DON’T COLOR US IN (YET): WILL REGULATIONS AND RESEARCH
KEEP VERMONT ADELGID-FREE?
Barbara Burns1, Brent Teillon2, Scott Pfister3, and Tess Greaves4
1 Vermont Division of Forestry100 Mineral St., Suite 304
Springfield, VT 05156
2 University of Vermont, Entomology Research Laboratory661 Spear St.
Burlington VT 05405
3 Vermont Agency of Agriculture, Food, and Markets116 State St.
Montpelier, VT 05620
4 Vermont Division of Forestry29 Sunset Dr., Suite 1Morrisville, VT 05661
ABSTRACT
Vermont is currently free of hemlock woolly adelgid, although natural spread into the state isexpected. Recent introductions on nursery stock have demonstrated that inspections in thestate of origin cannot reliably exclude the insect and have highlighted the danger of propagat-ing trees outside of the region where they are to be planted. When hemlock woolly adelgidbecomes established in Vermont, cold is expected to reduce its impact. Because we do notanticipate “the next chestnut blight,” research promises to help us maintain hemlock as aviable species. Recommended actions are to 1) develop reliable survey protocols to delineateinfested counties in affected states, including standards for quality assurance, 2) identify strat-egies to promote local propagation of nursery trees, 3) continue to emphasize biocontrolefforts, focusing on a broad spectrum of agents, and ensuring that safeguards are followedand made widely known, 4) use new technology to produce forest type maps so hemlockstands can be located, and 5) continue research on factors associated with susceptibility andvulnerability and develop management strategies to maintain the values hemlock provides.
_____________________________________ Will Regulations and Research Keep Vermont Adelgid-free?
Presentations Third Symposium on Hemlock Woolly Adelgid
235
DODGING THE BULLET:THE HISTORY OF HEMLOCK WOOLLY ADELGID IN VERMONT
Hemlock woolly adelgid, Adelges tsugae (Homoptera: Adelgidae), is not known to occur inVermont, although it has spread naturally within ten miles of the state line in Massachusetts.Cold temperatures may have held the insect back, but spread into the state is expected given aperiod of mild winters. Hemlock occurs statewide and accounts for over 5% of Vermont’strees (USDA Forest Service 2005).
Hemlock woolly adelgid has been introduced via hemlock nursery stock as Vermont isa net importer of hemlock transplants (USDA 1998). The risk of introduction via this path-way was recognized in 1988, when a state quarantine was enacted. Hemlock nursery stockfrom infested states was admissible only with a declaration that the trees were free from hem-lock woolly adelgid (State of Vermont 1988).
In July 1990, hemlock woolly adelgid was detected on tublings that had been planted ina high elevation clearing in the town of Stockbridge. Prior to planting, they had been held inNew Jersey near infested trees. Eradication surveys were done twice a year for six years, andall hemlocks located on the site were burned. Live adelgids were found on tublings in 1991,but none were found in subsequent years. This eradication is considered a success, in partbecause the site is at 2,500 feet elevation, in cold hardiness zone 4, and no native hemlocksoccur nearby.
No other introductions are known until May 2004, when infested trees were reported tohave come into the state through a wholesale nursery in Hartford, New Hampshire. Thisnursery had received five hemlock shipments from North Carolina and one from Pennsylva-nia. All had been certified by state inspectors to be free of hemlock woolly adelgid and weretherefore legally imported to Vermont. As a first step in eradicating this introduction, all 413trees remaining at the wholesale nursery were cut and burned on site.
In subsequent tracing, it was found that 100 trees from the same wholesale nursery werestill at retail nurseries, and 160 had been planted in the landscape. An emergency order, issuedby the state, required that all of these trees be removed and destroyed by June 25. The chanceof a successful statewide eradication was good, since trees had been on-site for only a fewweeks. The impact of alternatives, such as no action or a more limited action, could be great,since potentially infested trees had been planted statewide. The state provided no compensa-tion for the trees removed, but landscapers were compensated for their labor if they chose toremove trees for their clients.
Fourteen hemlocks from the wholesale nursery had been sold cash-and-carry from re-tail nurseries. An attempt was made to find these trees through mass media. Although none ofthe fourteen were located, many requests were received for tree inspections. These includedone for a recent planting of hemlocks from a New Hampshire nursery that proved infested.These trees, and another planting from the same nursery were destroyed.
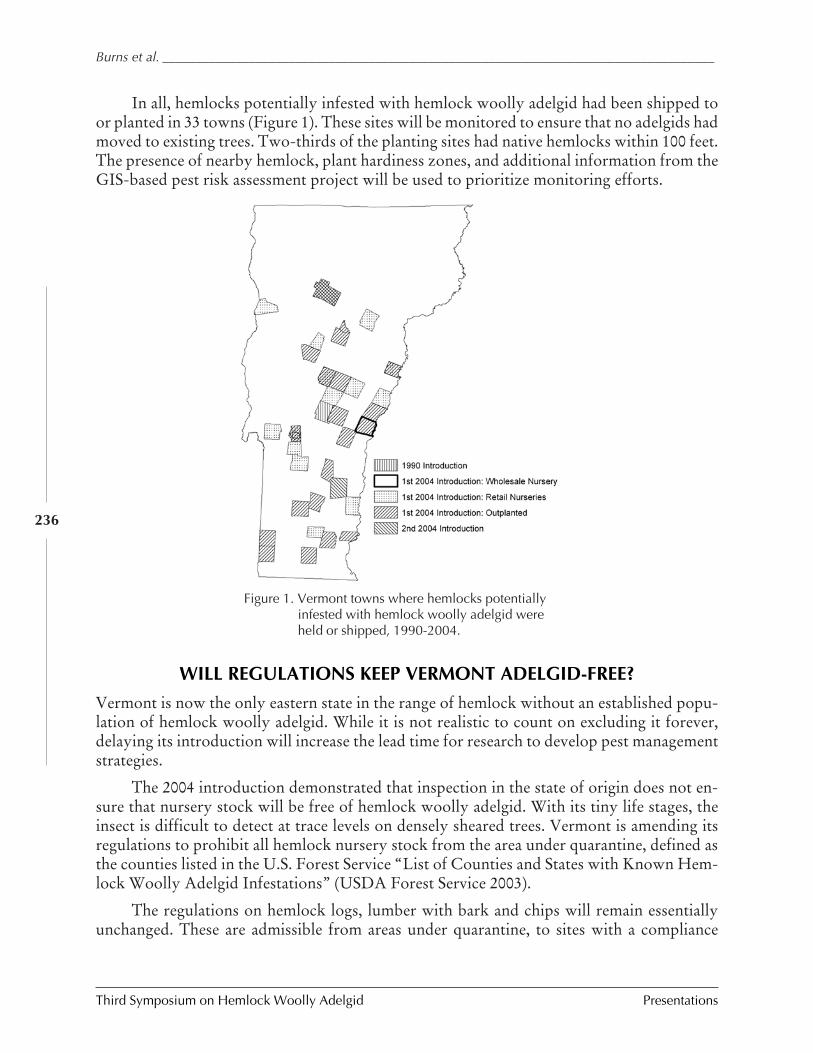
Third Symposium on Hemlock Woolly Adelgid Presentations
Burns et al. ___________________________________________________________________________________
236
Figure 1. Vermont towns where hemlocks potentiallyinfested with hemlock woolly adelgid wereheld or shipped, 1990-2004.
In all, hemlocks potentially infested with hemlock woolly adelgid had been shipped toor planted in 33 towns (Figure 1). These sites will be monitored to ensure that no adelgids hadmoved to existing trees. Two-thirds of the planting sites had native hemlocks within 100 feet.The presence of nearby hemlock, plant hardiness zones, and additional information from theGIS-based pest risk assessment project will be used to prioritize monitoring efforts.
WILL REGULATIONS KEEP VERMONT ADELGID-FREE?
Vermont is now the only eastern state in the range of hemlock without an established popu-lation of hemlock woolly adelgid. While it is not realistic to count on excluding it forever,delaying its introduction will increase the lead time for research to develop pest managementstrategies.
The 2004 introduction demonstrated that inspection in the state of origin does not en-sure that nursery stock will be free of hemlock woolly adelgid. With its tiny life stages, theinsect is difficult to detect at trace levels on densely sheared trees. Vermont is amending itsregulations to prohibit all hemlock nursery stock from the area under quarantine, defined asthe counties listed in the U.S. Forest Service “List of Counties and States with Known Hem-lock Woolly Adelgid Infestations” (USDA Forest Service 2003).
The regulations on hemlock logs, lumber with bark and chips will remain essentiallyunchanged. These are admissible from areas under quarantine, to sites with a compliance
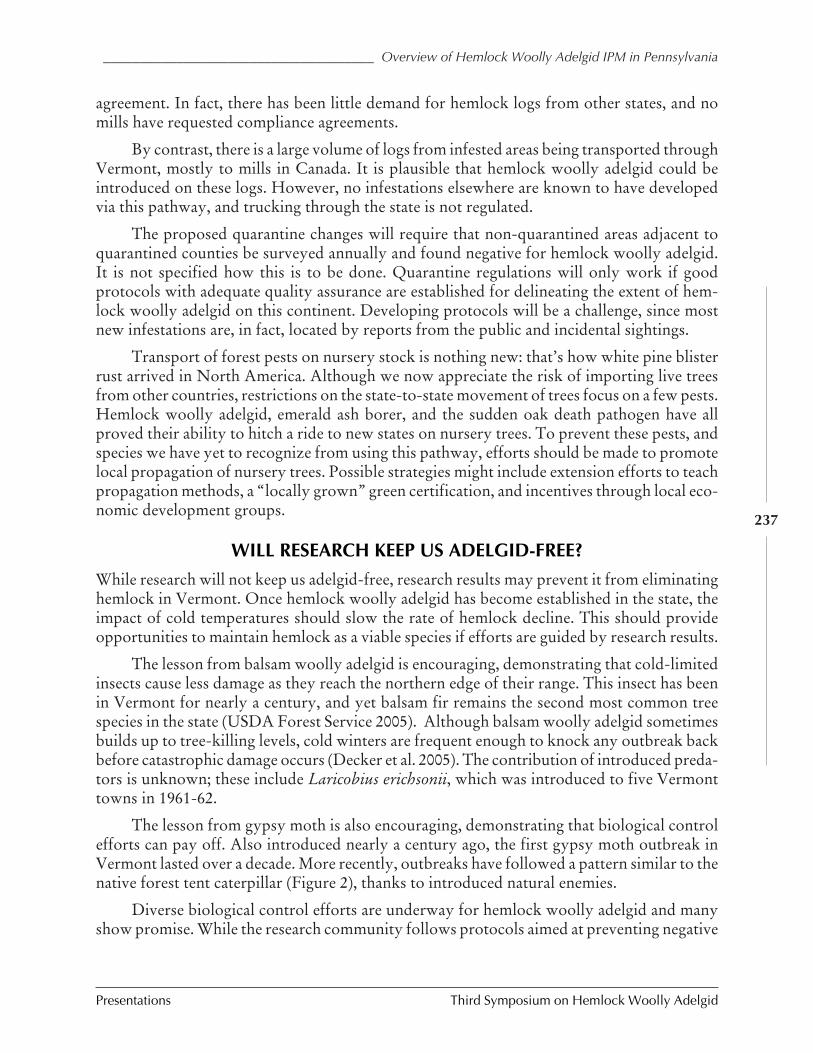
_____________________________________ Overview of Hemlock Woolly Adelgid IPM in Pennsylvania
Presentations Third Symposium on Hemlock Woolly Adelgid
237
agreement. In fact, there has been little demand for hemlock logs from other states, and nomills have requested compliance agreements.
By contrast, there is a large volume of logs from infested areas being transported throughVermont, mostly to mills in Canada. It is plausible that hemlock woolly adelgid could beintroduced on these logs. However, no infestations elsewhere are known to have developedvia this pathway, and trucking through the state is not regulated.
The proposed quarantine changes will require that non-quarantined areas adjacent toquarantined counties be surveyed annually and found negative for hemlock woolly adelgid.It is not specified how this is to be done. Quarantine regulations will only work if goodprotocols with adequate quality assurance are established for delineating the extent of hem-lock woolly adelgid on this continent. Developing protocols will be a challenge, since mostnew infestations are, in fact, located by reports from the public and incidental sightings.
Transport of forest pests on nursery stock is nothing new: that’s how white pine blisterrust arrived in North America. Although we now appreciate the risk of importing live treesfrom other countries, restrictions on the state-to-state movement of trees focus on a few pests.Hemlock woolly adelgid, emerald ash borer, and the sudden oak death pathogen have allproved their ability to hitch a ride to new states on nursery trees. To prevent these pests, andspecies we have yet to recognize from using this pathway, efforts should be made to promotelocal propagation of nursery trees. Possible strategies might include extension efforts to teachpropagation methods, a “locally grown” green certification, and incentives through local eco-nomic development groups.
WILL RESEARCH KEEP US ADELGID-FREE?
While research will not keep us adelgid-free, research results may prevent it from eliminatinghemlock in Vermont. Once hemlock woolly adelgid has become established in the state, theimpact of cold temperatures should slow the rate of hemlock decline. This should provideopportunities to maintain hemlock as a viable species if efforts are guided by research results.
The lesson from balsam woolly adelgid is encouraging, demonstrating that cold-limitedinsects cause less damage as they reach the northern edge of their range. This insect has beenin Vermont for nearly a century, and yet balsam fir remains the second most common treespecies in the state (USDA Forest Service 2005). Although balsam woolly adelgid sometimesbuilds up to tree-killing levels, cold winters are frequent enough to knock any outbreak backbefore catastrophic damage occurs (Decker et al. 2005). The contribution of introduced preda-tors is unknown; these include Laricobius erichsonii, which was introduced to five Vermonttowns in 1961-62.
The lesson from gypsy moth is also encouraging, demonstrating that biological controlefforts can pay off. Also introduced nearly a century ago, the first gypsy moth outbreak inVermont lasted over a decade. More recently, outbreaks have followed a pattern similar to thenative forest tent caterpillar (Figure 2), thanks to introduced natural enemies.
Diverse biological control efforts are underway for hemlock woolly adelgid and manyshow promise. While the research community follows protocols aimed at preventing negative
Third Symposium on Hemlock Woolly Adelgid Presentations
Burns et al. ___________________________________________________________________________________
238 Figure 2. Gypsy moth and forest tent caterpillar population levels inVermont, 1890-1988. From Parker et al., 1989.
consequences from introduced biocontrol agents, the public remains skeptical. Existing safe-guards are not widely known. More transparency in this process would help.
While waiting for hemlock woolly adelgid, existing research results can be used to lo-cate hemlock and prioritize stands for treatment. New technology promises that forest typemaps can be produced at a resolution useful on the ground. Like many states, Vermont wouldneed assistance in turning this promise into reality.
Once stands are located, risk assessment maps being developed will allow us to incorpo-rate the expected impact of hemlock woolly adelgid into forest management plans. Contin-ued research into factors associated with susceptibility and vulnerability would help refinethese maps. And as hemlock woolly adelgid becomes established, we will benefit from theresults of research into strategies which will help us increase stand resistance, maintain crownclosure and prevent mortality where possible, and, where necessary, schedule salvage andmanage stand conversion.
_____________________________________ Overview of Hemlock Woolly Adelgid IPM in Pennsylvania
Presentations Third Symposium on Hemlock Woolly Adelgid
239
ACKNOWLEDGMENTS
The authors gratefully acknowledge contributions from many individuals in the Ver-mont Division of Forestry and the Vermont Division of Plant Industry, diagnostic assistancefrom the University of Vermont and the New Hampshire Department of Agriculture, andfinancial and technical support from the US Forest Service, Forest Health Protection.
REFERENCES
Decker, K., B.S. Burns, R.S. Kelley, T. Hanson, and S. Wilmot. 2005. Forest insect anddisease conditions in Vermont, Calendar Year 2004. Vermont Division of Forestry,Waterbury, Vermont.
Parker, B.L., K.E. McGrath, S. Mouton, and H.B. Teillon. 1989. History of the majorforest insect pests in Vermont. A joint VT Agr. Exp. Station and State of VT publication,RR57. University of Vermont, Burlington, Vermont. 32 pp.
State of Vermont. 1988. Vermont Department of Agriculture and Department of Forests,Parks and Recreation Joint Quarantine #2 - Hemlock Woolly Adelgid, Adopted Decem-ber 16, 1988. Retrieved 2/11/2005 from http://www.vermontagriculture.com/CAPS/industry/hwaquar.htm.
USDA Forest Service. 2003. List of State and Counties with Known HWA Infestations(updated 12/31/2003). 7 p. Retrieved 2/11/2005 from http://www.fs.fed.us/na/morgantown/fhp/hwa/hwatable_web/hwatable2.pdf.
USDA Forest Service. 2005. Forest Inventory Mapmaker Version 1.7. Retrieved 2/11/2005from http://www.ncrs2.fs.fed.us/4801/fiadb/fim17/wcfim17.asp.
US Department of Agriculture. 1998. Census of Horticultural Specialties, Nursery PlantsSold by State: 1998. 45p. Retrieved 2/11/2005 from http://www.nass.usda.gov/census/census97/horticulture/table32.pdf.
Third Symposium on Hemlock Woolly Adelgid Presentations
Onken ______________________________________________________________________________________
240
WHERE ARE WE NOW AND WHERE DO WE NEED TO GO?
Brad Onken
USDA Forest Service Northeastern Area Forest Health Protection
ABSTRACT
The Hemlock Woolly Adelgid Management Initiative is an integrated pest management (IPM)plan that develops and implements management strategies that reduce hemlock woolly adelgid(HWA) impacts. This symposium is one product of the HWA Initiative. The manuscriptsand posters presented represent a significant increase in our knowledge and demonstrate howthis information is used to implement management actions in the field. I commend the au-thors of both oral and poster presentations for their efforts and sharing this information.
The spread and impact of HWA continues at an alarming rate, particularly in the South,and we cannot afford complacency. We need effective management tools for resource manag-ers faced with the onslaught and aftermath of this devastating pest. We will continue to assessour knowledge, focus on critical data gaps, and accelerate efforts to implement promisingmanagement strategies. As part of the HWA Initiative and in response to the informationprovided at this symposium, the following areas of research, technology development, andmanagement are currently planned or will be considered for further action in the near future.
KEYWORDS
Hemlock woolly adelgid, HWA Management Initiative, management tools, research, tech-nology development.
BIOLOGICAL CONTROL
Biological control is an important component of the HWA Initiative and is crucial to mini-mize hemlock impacts in forest ecosystems.
PLANNED ACTIVITIES:
1. Continue to rear, release, and evaluate for establishment and efficacy Laricobius nigrinus,Scymnus sinuanodulus, and Sasajiscymnus tsugae.
2. Accelerate foreign exploration efforts in China and Japan to locate additional naturalenemies and streamline the overseas screening process to expedite the shipment of prom-ising species for further evaluation and, if appropriate, their release and establishment.
3. Evaluate the environmental and ecological factors influencing establishment and spreadof biological control agents.
4. Continue to evaluate the role pathogens play in controlling HWA populations and as-sess their potential as a management tool.
__________________________________________ Where Are We Now and Where Do We Need to Go?
Presentations Third Symposium on Hemlock Woolly Adelgid
241
PROPOSED ACTIVITIES:
1. Test the hypothesis that a complex of natural enemies is needed to effectively reduce andmaintain HWA below damaging thresholds.
2. Accelerate efforts to develop an artificial diet suitable for rearing HWA predators.
CHEMICAL CONTROL
Chemical treatment of individual trees or a group of trees is costly and labor-intensive, butcurrent technology does offer a short-term alternative for protecting high-value trees.
PLANNED ACTIVITIES:
1. Prepare a risk assessment covering the use of imidacloprid in forest environments.
2. Develop cost-effective methods to detect and quantify imidacloprid parent compoundsand its metabolites.
3. Continue to evaluate more cost-efficient means of applying chemical treatments.
4. Continue to provide technical and financial assistance to state and federal agencies tosuppress HWA infestations on public lands.
PROPOSED ACTIVITY:
• Evaluate hemlock wound response to trunk-injected systemic treatments.
HOST RESISTANCE AND GENETIC PRESERVATION
Many areas have been severely impacted by HWA infestations, and resource managers arenow facing rehabilitation and restoration decisions. The genetic diversity of eastern hemlockand Carolina hemlock may be threatened by the continued spread of HWA.
PLANNED ACTIVITIES:
1. Initiate seed collections of eastern hemlock species throughout their range to preservegenetic diversity and provide for reestablishment, if needed.
2. Establish suitable locations for planting collected Carolina hemlock seed outside of thegeneral HWA-infested area.
3. Identify genetic and/or chemical host resistance mechanisms.
PROPOSED ACTIVITY:
• Determine whether existing hemlock species or cultivars have resistance to HWA andcan occupy niches currently occupied by eastern hemlock.
Third Symposium on Hemlock Woolly Adelgid Presentations
Onken ______________________________________________________________________________________
242
SILVICULTURAL MANAGEMENT
Recommendations for silvicultural management of hemlock in advance of and following HWAinfestations are limited. Preemptive cutting of eastern hemlock prior to infestation has be-come a common practice in New England.
PLANNED ACTIVITY:
• Determine whether improving tree vigor through various thinning practices in advanceof an infestation can reduce hemlock mortality following an infestation.
PROPOSED ACTIVITY:
• Establish demonstration areas where existing mitigation, restoration, and rehabilitationmanagement strategies can be evaluated.
BIOLOGY
HWA has an extremely complex biology affected by various physiological and ecologicalfactors. Understanding how these factors affect HWA populations may offer new opportu-nities for management.
PLANNED ACTIVITIES:
1. Continue to assess how winter mortality affects HWA establishment and impacts acrossthe Northeast.
2. Continue regional assessment of HWA genetics.
3. Continue assessment of bacterial endosymbiont diversity associated with HWA.
4. Assess tree and pest response to micronutrient applications.
PROPOSED ACTIVITY:
• Determine the role of microsporidia and fungal pathogens in HWA populations andnatural enemies
IMPACT ASSESSMENTS
Eastern hemlock occurs in a broad geographical area scattered throughout the East in forestsdominated by hemlock, other conifers, and mixed hardwoods. Currently, few resource man-agers have adequate inventories or maps of existing hemlock resources, thus making impactassessments difficult.
__________________________________________ Where Are We Now and Where Do We Need to Go?
Presentations Third Symposium on Hemlock Woolly Adelgid
243
PLANNED ACTIVITY:
• Continue assessment of hyperspectral and other remote sensing technologies and theirutility for mapping and measuring changes in hemlock health.
SURVEY AND MONITORING
Many state forest health specialists have limited knowledge of hemlock resource locations,and detecting new or low-level infestations is difficult because of the small size of the insectand its feeding habits and dispersal patterns.
PLANNED ACTIVITIES:
1. Standardize survey methods to detect and monitor HWA populations.
2. Continue to provide technical and financial assistance to state and federal cooperators.
3. Provide annual regional summaries of hemlock conditions and county-level HWA in-festations.
PROPOSED ACTIVITY:
• Determine the utility of hyperspectral technology to detect low-level infestations byfocusing on year-to-year changes in spectral reflectance and tree stress.
INTERACTIONS WITH OTHER PESTS
The elongate hemlock scale (EHS) is another exotic pest that threatens eastern hemlock. Inmany areas, EHS populations have surged on hemlocks previously stressed by HWA, caus-ing further hemlock decline and mortality.
PLANNED ACTIVITIES:
1. Continue assessment of the EHS range and impacts throughout the East.
2. Determine the extent and impact of existing EHS natural enemies.
3. Evaluate the existing natural enemy complex of EHS in its home range (Asia) and clas-sical biological control opportunities in the eastern U.S.
4. Evaluate entomopathogens and their potential for biological control of EHS.
5. Evaluate interactions between EHS and HWA and their impact on hemlock health.
6. Evaluate potential insecticides and application methods for EHS.
Third Symposium on Hemlock Woolly Adelgid Presentations
Onken ______________________________________________________________________________________
244
PUBLIC AWARENESS AND INFORMATION TRANSFER
PLANNED ACTIVITIES:
1. Continue to update the HWA website with new information and useful publications.
2. Provide funding to state and federal agencies to support public awareness activities.
3. Publish and distribute proceedings of the Third Symposium on HWA in the EasternUnited States.
4. Update, print, and distribute the “HWA Pest Alert” to state and federal cooperators.

POSTERS

_______________________________________________________________________________________ Ahern
Posters Third Symposium on Hemlock Woolly Adelgid
247
EFFECTS OF SYSTEMIC INSECTICIDES, A GROWTH REGULATOR, AND OIL
ON ELONGATE HEMLOCK SCALE AND ASSOCIATED NATURAL ENEMIES
ON EASTERN HEMLOCK
R.G. Ahern, M.J. Raupp, and Stacey R. Bealmear
ABSTRACT
Several species of armored scale, including Fiorinia externa (elongate hemlock scale), Nuculaspistsugae, and Aspidiotus cryptomeriae (cryptomeria scale) attack, disfigure, and kill Tsugacanadensis in the eastern United States. Damage to trees in forest and urban landscapes resultsin significant economic loss and threatens to eliminate unique sources of germplasm. Ourobjective was to evaluate practical methods of chemical control for elongate hemlock scale. Inaddition, we were also interested in the effect of treatments on natural enemies. We evaluatedthe efficacies of oil, imidicloprid (Merit, Imicide), acephate (Acecap), an undisclosedneonicotinoid using the Arbor-jet system, and the growth regulator pyriproxfen (Distance).Oil, Merit, and Distance significantly reduced scale abundance relative to control levels. Para-sitoid emergence showed a similar pattern to that of scale abundance, although parasitoidmovement and generalist predator abundance did not differ among treatments. Our resultssuggest that some chemical controls are effective against elongate hemlock scale. Further-more, limited disruption of natural enemy communities by chemical application may pro-mote sustainable biological control of scales during times when natural enemy populationlevels are low or moderate.
This research was funded or supported by the USDA Forest Service’s Forest HealthProtection program, the International Society of Arboriculture Tree Fund, and the U.S. Na-tional Arboretum. Bayer Crop Sciences, Bartlett Tree Experts, Integrated Plant Care, Arbor-jet, Mauget, and Creative Sales provided materials and technical support.
Third Symposium on Hemlock Woolly Adelgid Posters
Asaro et al. ___________________________________________________________________________________
248
BIOLOGICAL CONTROL OF THE HEMLOCK WOOLLY ADELGID IN THE SOUTHERN
APPALACHIANS
Christopher Asaro1, C. Wayne Berisford2, Michael E. Montgomery3,James Rhea4, and Jim Hanula5
1Virginia Department of Forestry,900 Resources Drive, Suite 800,
Charlottesville, VA 22903
2University of Georgia, Department of Entomology,Athens, GA 30602
3USDA Forest Service, Northeastern Center for Forest Health Research,51 Mill Pond Rd.,
Hamden, CT 06514
4USDA Forest Service, Forest Health Protection,200 Weaver Blvd., P.O. Box 2680,
Asheville, NC 28802
5USDA Forest Service, Southern Research Station,320 Green St.,
Athens, GA 30602
ABSTRACT
Biological control of the hemlock woolly adelgid is thought to be the most feasible long-termsolution to controlling this pest. Two species of imported lady beetles (Coleoptera:Coccinellidae) are currently available for release. Sasajiscymnus tsugae has been the mostwidely released, with over 1 million beetles released throughout the range of the adelgid.However, optimum release densities are unknown. Our study showed no significant differ-ences in adelgid density following releases of 300 or 3,000 adult S. tsugae, although adelgiddensities were significantly higher at control (no release) sites. A sleeve cage study with S.tsugae demonstrated significant control of the adelgid when initial densities were between 0-50 ovisacs per branch. A similar sleeve cage study with Scymnus sinuanodulus demonstratedsome control of the adelgid when densities were greater than 100 ovisacs per branch. Noreproduction was observed for either lady beetle during these studies. In addition to thesestudies, mass releases of 450 S. sinuanodulus and 150 Laricobius nigrinus (Coleoptera:Derodontidae) were done, representing the first release of these species together and the firstrelease in the state of Georgia. It is hoped that the combination of these three predators willbe effective agains the adelgid.
__________________________________________________________________________________ Asaro et al.
Posters Third Symposium on Hemlock Woolly Adelgid
249
KEYWORDS
Sasajiscymnus tsugae, Scymnus sinuanodulus, Laricobius nigrinus, biological control.
INTRODUCTION
The hemlock woolly adelgid, Adelges tsugae Annand, continues to spread through the south-ern Appalachians and the southernmost range of eastern hemlock, causing extensive treemortality. Biological control is considered the most viable, long-term solution to combatingthe adelgid since chemical and silvicultural control are ineffective or impractical on a largescale. As natural enemies of the adelgid native or present in the eastern U.S. have little impact,recent efforts have been undertaken to release biological control agents imported from Japan,China, and western North America. So far, three beetle that feed on the hemlock woollyadelgid are being released. One species, Sasajiscymnus tsugae (Sasaji and McClure)(Coleoptera:Coccinellidae), is widely available, with over 1 million insects released throughout the rangeof the adelgid. Two other species, Scymnus sinuanodulus Yu et Yao (Coleoptera: Coccinellidae)and Laricobius nigrinus (Coleoptera: Derodontidae), have seen limited release but will likelybe more widely utilized in the future.
Evaluating the success of these predators has been problematic because the beetles arevery small and difficult to find a few months after a release. It is unknown whether thesebeetles will be effective at suppressing the adelgid to non-damaging levels in the long term.Adelgid populations reach much higher densities on eastern hemlock in North America thatthey do in Asia or western Northern America, where hemlock species are much less suscep-tible and natural enemies are more abundant. It is thought that more predator species willneed to be introduced to produce an effective and stable natural enemy complex.
Although thousands of S. tsugae are typically released at a time, the optimum number ofbeetles to release is unknown; thus, we replicated and repeatedly sample releases of this beetleat five location at typical number and at a 10-fold less number. Because it is difficult tomonitor the impact of free releases, we also conducted caged studies of S. tsugae and S.sinuanodulus at a range of adelgid densities.
EXPERIMENT SUMMARY
We first compared the effects on the local adelgid population when a typical number of S.tsugae (3,000) and a lower amount (300) were released. Both the adelgid and beetle popula-tions were monitored at the release sites and at a nearby control site where no release wasmade. This was replicated three times throughout Rabun County in northeast Georgia dur-ing April 2003. For 16 weekly sampling dates (April-August), adelgid density was signifi-cantly lower at both release densities compared to the controls. However, during most sam-pling dates, there was little or no difference between the 300 and 3,000 release densities. Thissuggests that the efficacy of the higher releases may be offset by more overcrowding andpredator dispersal. Although we examined foliage samples using a microscope weekly (72-108 total twigs collected from the upper and lower crown of each of 18 trees), we were unable
Third Symposium on Hemlock Woolly Adelgid Posters
Asaro et al. ___________________________________________________________________________________
250
to document any predator reproduction in the form of beetle eggs or larvae. It is uncertainwhether this was due to inadequate sampling intensity or simply the absence of reproduction.
At the Coweeta Hydrologic Laboratory in Otto, North Carolina, sleeve cages wereused to enclose adults of S. tsugae on hemlock branches infested with variable densities ofhemlock woolly adelgid to determine the density levels at which these predators are mosteffective. Adelgid ovisacs were counted on 40 hemlock branches in early April, coincidingwith maximum egg production by the adelgid. Adult predators (one male and two females)were placed in each of 20 of these sleeve cages and 20 cages were left empty. These were leftfor six weeks: enough time for a new generation of predators to be produced. After this timeperiod, sleeve cages and the enclosed branches were harvested and returned to the laboratory,where adelgid ovisacs and the number of predators were counted. At the lowest initial adelgiddensities (0-50 ovisacs per branch), adelgid population growth was greatly reduced comparedwith controls. At higher densities (>50 ovisacs), there was little or no effect by S. tsugae onadelgid population growth. No predator reproduction was documented in any of the sleevecages, for reasons that remain unknown. Therefore, all of the observable effects on adelgidgrowth can be attributed to feeding by the three adult predators placed in each sleeve cage.
A similar study was performed using mating pairs of S. sinuanodulus produced thisspring in the laboratory. In contrast to the multivoltine S. tsugae, S. sinuanodulus is univoltineand hence was not expected to reproduce during the study. Although some of the sleevecages with beetles were missing, the cages were set up and harvested three weeks later, andhad fewer beetles in each cage; the S. sinuanodulus had a greater effect on higher initial adelgidpopulations than S. tsugae.
In addition to the releases of S. tsugae, smaller-scale releases were made of S. sinuanodulusand L. nigrinus were done in Rabun County, in northeastern Georgia. In April 2004, 150 S.sinuanodulus were released, and an additional 300 were released in October 2004. Thesebeetles were obtained from the Insect Rearing Facility, U.S. Forest Service, NortheasternResearch Station, in Hamden, Connecticut. Also at the same location and on the same day inOctober, 150 adults of L. nigrinus, reared at Virginia Tech, Blacksburg, Virginia, were re-leased.
DISCUSSION
Because S. sinuanodulus and L. nigrinus only have one generation per year and are not asamenable to mass rearing, quantities available for field release are much more limited thanwith S. tsugae. It is hoped that more efficient rearing techniques will improve the output ofthese species in the near future. A combination of these three predators may be more effectiveagainst the adelgid. Furthermore, the sleeve cage studies reported here demonstrate that S.tsugae should be released prior to a large buildup of adelgid populations, and more research isneeded to define factors that affect its reproduction following release.
The release of L. nigrinus and S. sinuanodulus was the first time that these species havebeen introduced into Georgia and will represent one the the first locations where all threepredators (including S. tsugae) have been released in the same area (Rabun County). This wasthe first environmental release of S. sinuanodulus and sampling in 2005 will need to be inten-
__________________________________________________________________________________ Asaro et al.
Posters Third Symposium on Hemlock Woolly Adelgid
251
sive to discern if it has established and reproduced. Over 4,000 L. nigrinus have been releasedrecently thoughout the central and southern Appalachians, with year-after recovery reportedfrom several locations.
ACKNOWLEDGEMENTS
Funding was provided by the USDA Forest Service, Southern Research Station, Athens, Geor-gia. Additional support was provided by the USDA Forest Service, Forest Health Protec-tion, Asheville, North Carolina. We would like to thank Hugh Conway of Clemson Univer-sity, Clemson, South Carolina; Carol Cheah of the USDA Forest Service, Hamden, Con-necticut; and David Mausel of Virginia Tech, Blacksburg, Virginia, for assistance with acquir-ing and releasing the beetles used in this study. In addition, we thank Jime Vose, USDAForest Service, Otto, North Carolina, for permission to conduct research at the CoweetaHydrologic Laboratory, and Jim Sullivan, Georgia Forestry Commission, for assistance withlocating additional field sites.
Third Symposium on Hemlock Woolly Adelgid Posters
Bentz et al. ___________________________________________________________________________________
252
INVESTIGATING GENETIC RESISTANCE OF TSUGA TO
HEMLOCK WOOLLY ADELGID
S.E. Bentz1, A.M. Townsend1, Robert J. Griesbach2, Margaret R. Pooler3
1 USDA-ARS, U.S. National Arboretum11601 Old Pond Drive,Glenn Dale, MD 20769
2USDA-ARS, U.S. National ArboretumBeltsville Agriculture Research Center-West,
Beltsville, Maryland 207053USDA-ARS, U.S. National Arboretum
3501 New York Ave., N.E,Washington, DC 20002
KEYWORDS
Tsuga chinensis, breeding, hemlock hybridization.
INTRODUCTION
Research on the nature of genetic resistance of hemlock to hemlock woolly adelgid (HWA),Adelges tsugae (Annand), at the U.S. National Arboretum focuses on three areas of investiga-tion: 1) create, plant and evaluate hemlock hybrids and parent species for HWA resistanceand landscape merit; 2) investigate the nature of the apparent crossability barrier between T.canadensis (L.) Carrière, and T. chinensis; and 3) Plant and evaluate wild-collected T. chinensisgermplasm for landscape suitability and HWA resistance.
CREATE, PLANT, AND EVALUATE HEMLOCK HYBRIDS
In 2002, we reported on the extent of self compatability and hybridization from controlledpollination of several hemlock species (Bentz et al. 2002, Pooler et al. 2002). Authentic hy-brids were identified from crosses between the T. caroliniana (Engelm.) and T. chinensis andbetween the Asiatic species, T. chinensis, T. diversifolia ((Maxim.) and T. sieboldii (Carrière).In 2002, the parents, their hybrids, and self-pollinated progeny were planted in a randomizedblock design at the USDA’s South Farm, Beltsville, Maryland. Beginning in 2004, data col-lection began on important horticultural attributes of each tree including survival, growthrate, form, phenology, injury from cold, heat or pests, and evidence of natural adelgid infesta-tion. When plants are of suitable size, HWA will be introduced into mesh bags attached toeach tree, and data will be collected for such factors as adelgid survival, number of ovisacsproduced, number of eggs per ovisac, number of crawlers, and feeding injury. The researchwill be in cooperation with Michael E. Montgomery, USDA Forest Service, Center for For-est Health Research, Hamden, Connecticut. Data will be analyzed for variation not onlyamong trees of the same progeny group, but also among progeny groups.
__________________________________________________________________________________ Bentz et al.
Posters Third Symposium on Hemlock Woolly Adelgid
253
INVESTIGATE THE NATURE OF THE CROSSABILITY BARRIER BETWEENT. CANADENSIS AND T. CHINENSIS
No hybrids resulted from crosses made between the HWA susceptible T. canadensis and theHWA-tolerant T. chinensis. In order to determine whether the failure to achieve seed set wasdue to the lack of fertilization or from zygote/embryo abortion, a series of controlled polli-nations was carried out in 2003. Crosses included self-pollinations, intra-species crosses, T.chinensis x T. caroliniana, and T. canadensis x T. chinensis cross. Parents were located at theU.S. National Arboretum, Washington, D.C., and Longwood Gardens, Kennett Square, Penn-sylvania. Cones were collected at 0, 3, 6, 9, and 24 weeks post pollination from all crossesattempted as well as from normal, open-pollinated controls from the parent trees.
Six weeks post-pollination, donor pollen tubes of sufficient length for fertilization wereobserved. Even though pollen tubes were of sufficient length, fertilization may not haveoccurred. Nine weeks post pollination, immature ovules were observed for both viable andunviable crosses. Further ovule development only occurred in viable crosses. Because ovuledevelopment occurred in the unviable crosses, these observations suggest that fertilizationmay have occurred. Rarely does an ovule develop without fertilization. The data suggest thathybrid ovules are aborting due to zygotic failure and not due to lack of pollen germinationand subsequent pollen tube growth.
PLANT AND EVALUATE WILD-COLLECTED T. CHINENSIS GERMPLASM
Twenty accessions of wild-collected T. chinensis varieties and relatives are being planted in arandomized block design in fall 2004-spring 2005 at the USDA’s South Farm site. Thegermplasm collected includes accessions from two explorations to the Peoples Republic ofChina sponsored by the North American China Plant Exploration Committee (NACPEC)in 1996 and 1999 and accessions collected by Dr. Michael Montgomery. Germplasm plantedrepresents regional and elevation variations which may affect the hardiness and/or suitabilityof T. chinensis in landscape or forestry applications.
ACKNOWLEDGEMENTS
Thomas Abell, U.S. National Arboretum, Glenn Dale, Maryland; Dr. Casey Sclar, LongwoodGardens, Kennett Square PA 19348; Dr. A. M. Townsend, U.S. National Arboretum, on hisretirement and for his leadership and support of this project.
REFERENCES
Bentz, S.E. and L.G.H. Riedel, M.R. Pooler, A.M. Townsend. 2002. Hybridization andself-compatibility in controlled pollinations of eastern North American and Asian hem-lock (Tsuga) species. J. Arboriculture 28:200-205.
Pooler, M.R. and L.G.H. Riedel, S.E. Bentz, A.M. Townsend, 2002. Molecular markersused to verify interspecific hybridization between hemlock (Tsuga) species. J. Amer. Soc.Hort. Sci. 127(4):623-627.
Third Symposium on Hemlock Woolly Adelgid Posters
Burgess et al. _________________________________________________________________________________
254
IDENTIFICATION OF PREDATORY INSECTS AND SPIDERS
IN SASAJISCYMNUS TSUGAE REARING BOXES
LayLa Burgess
Clemson University
During 2004, Clemson University initiated mass rearing of the biological control agentSasajiscymnus tsugae Sasaji and McClure (Coleoptera: Coccinellidae) for release against thehemlock woolly adelgid (HWA) Adelges tsugae Annand (Homoptera: Adelgidae). Severalspecies of predatory insects and spiders were found on eastern hemlock (Tsuga canadensis(L.) Carriere) and Carolina hemlock (Tsuga caroliniana Englemann) branches infested withHWA in the rearing boxes that were brought in from the field. HWA poses a serious threatto the health and sustainability of the eastern hemlock forests. Native predatory insects andspiders may have an impact on HWA and can cause problems in the mass rearing of S. tsugae.
Samples of predatory insects and spiders were collected from rearing boxes and the break-down of those boxes during the 2004 rearing season. Predatory insects were collected andidentified to order, family, genus, and species depending on the taxa. Spiders were identifiedto order and family.
Predatory insects and spiders from mass rearing boxes of Sasajiscymnus tsugae fed withinfested branches may or may not be predacious on HWA; however after examination underthe microscope, punctures to the eggs of S. tsugae were found. Though the specific impact ofthese predatory insects and spiders have on HWA is uncertain, they can disrupt the life cycleof S. tsugae under laboratory conditions and most likely in nature.
____________________________________________________________________________________Campbell
Posters Third Symposium on Hemlock Woolly Adelgid
255
THE NATURE CONSERVANCY’S RESPONSE TO HWA
Faith T. Campbell
Senior Policy Representative, The Nature Conservancy, Arlington, Virginia 22203
ABSTRACT:
The Nature Conservancy has a dispersed structure. In consequence, its staff have adopted avariety of approaches to responding to the threat to conservation goals posed by the hemlockwoolly adelgid. This poster describes this varied response.
KEYWORDS
Hemlock woolly adelgid, The Nature Conservancy, portfolio sites, widespread threats.
WHY THE NATURE CONSERVANCY IS ENGAGED WITH HEMLOCKWOOLLY ADELGID
The mission of The Nature Conservancy (TNC) is to preserve the plants, animals and naturalcommunities that represent the diversity of life on Earth by protecting the lands and watersthey need to survive.
OVERVIEW OF THE NATURE CONSERVANCY ENGAGEMENT
Nearly 1,340 terrestrial and freshwater ecoregional “portfolio sites1” in nine forest types areat risk to damage by the hemlock woolly adelgid (HWA), Adelges tsugae Annand. About 450of these sites are in counties already infested by HWA; the remaining 890 portfolio sites arewithin the range of either eastern or Carolina hemlocks (Tsuga canadensis (L.) Carr. andTsuga caroliniana Engelm.), but outside of the currently infested counties (see Figure 1). Somesites under threat have great emotional as well as scientific importance: the Mianus RiverGorge in New York, for instance, was the organization’s first preserve.
The Nature Conservancy’s decentralized structure poses a challenge when trying todevelop a consistent response to a widespread threat such as that posed by HWA. We find iteasier to address more recently-introduced organisms that are still restricted to relatively smallareas. Thus, we are actively advocating policies and resources aimed at eradicating the Asian
1 “Portfolio site” is TNC terminology for a site within an ecoregion determined by our scientific process to be a priority forprotecting biological diversity
Third Symposium on Hemlock Woolly Adelgid Posters
Campbell ____________________________________________________________________________________
256
longhorned beetle, Anoplophora glabripennis (Motschulsky), and containing the emerald ashborer, Agrilus planipennis (Fairmaire), and Phytophthora ramorum (Werres et al.), the patho-gen that causes Sudden Oak Death.
A positive aspect of TNC’s decentralization is that state chapters may test various ap-proaches to solving a problem. We then replicate those strategies showing most promise.
In the 1990s, TNC changed its focus from small sites which we could protect throughpurchase or conservation easements to landscape-scale blocks that we have identified as hav-ing high biodiversity value (portfolio sites). We now work with public and private partnersto improve forest health generally across large forest blocks—each block covering severaltens of thousands of acres. We recognize several broad threats that cannot be addressed byour traditional site-based approaches. Among these are invasive species—including insects,pathogens, plants, and aquatic organisms; acid deposition; and global climate change.
We now have staff dedicated to raising awareness and promoting actions intended tominimize the risk from introduced forest insects and diseases. We hope that this project,combined with campaigns to restore fire and other natural disturbance agents to forest man-agement and to improve policies pertaining to acid deposition and global climate change, willtogether contribute to reducing hemlock trees’ vulnerability to introduced insects and otherthreats.
The hemlock woolly adelgid invasion is extremely challenging. The threat to TNC’smission is undeniably grave: hemlock-dominated ecosystems usually constitute small but dis-tinct segments of the forest matrix we seek to conserve – unique sites that provide habitat forunusual levels of biological diversity and rare species. Hemlock-dominated ecosystems alsoplay a major role in sustaining associated aquatic systems.
Despite our recognition of hemlock-dominated systems’ importance, only rarely dohemlock groves or species specifically dependent on hemlock constitute a separate conserva-tion priority. Given TNC’s strategy of focusing on threats to identified “conservation tar-gets,” this means that the threat to hemlocks can “fall through the cracks.” However, evenwhen hemlock stands are specifically identified as targets, TNC staff have sometimes con-cluded that the biocontrol agent Pseudoscymnus tsugae (Sasagi and McClure) offered too littlepromise to warrant accepting the risk of release.
In determining our response, preserve managers and policy staff have been stymied byseveral difficulties. First, hemlocks face a myriad of threats; scientists cannot specify therelative importance of HWA in relation to other exotic insects, changing climate, droughts,and soil compaction. Second, few tools are available to control the insect, and they all havesignificant downsides. Chemical controls are expensive and extremely difficult to deploy inforest systems. Biological control agents have not yet proven effective, and their utilizationraises difficult questions about possible non-target impacts. TNC is adapting: we are nowmore open to dialogue about the benefits as well as the risks posed by biological control inparticular circumstances.
Due to the perceived lack of good options, TNC’s response has followed a pattern:when HWA is first detected in a state, conservation staff take notice and search for solutionsthat will protect at least some of the hemlocks on their preserves. Often, they consider the
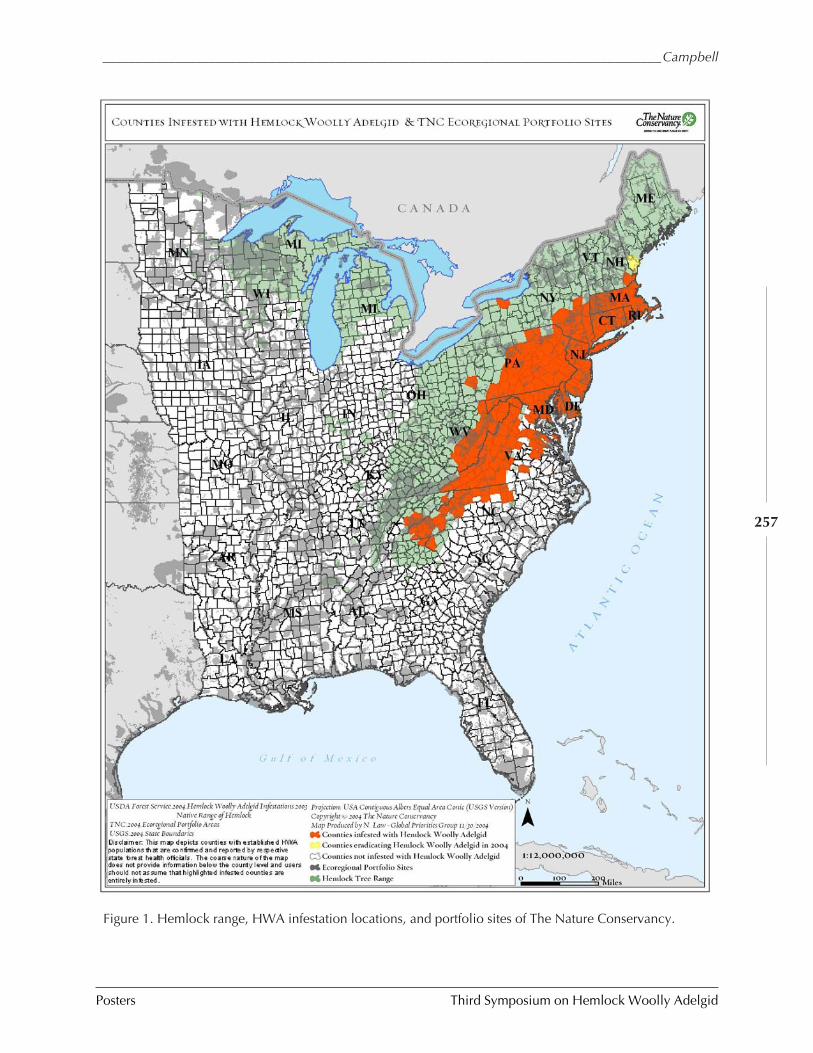
____________________________________________________________________________________Campbell
Posters Third Symposium on Hemlock Woolly Adelgid
257
Figure 1. Hemlock range, HWA infestation locations, and portfolio sites of The Nature Conservancy.
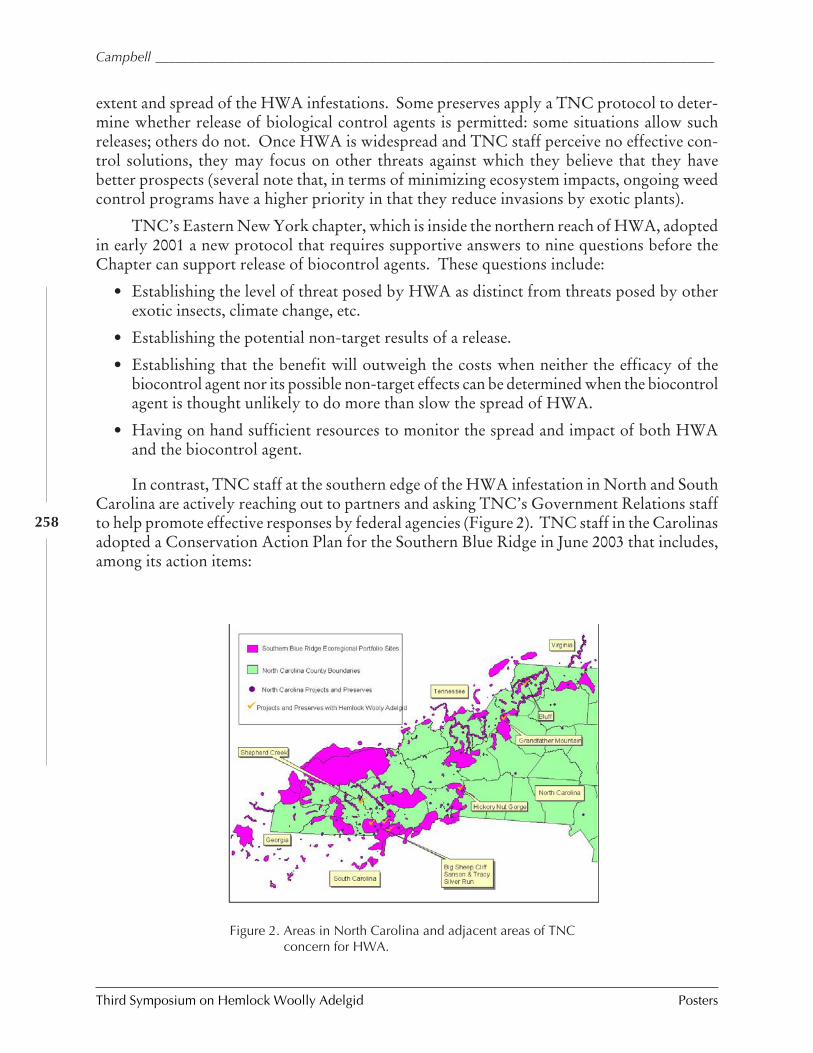
Third Symposium on Hemlock Woolly Adelgid Posters
Campbell ____________________________________________________________________________________
258
extent and spread of the HWA infestations. Some preserves apply a TNC protocol to deter-mine whether release of biological control agents is permitted: some situations allow suchreleases; others do not. Once HWA is widespread and TNC staff perceive no effective con-trol solutions, they may focus on other threats against which they believe that they havebetter prospects (several note that, in terms of minimizing ecosystem impacts, ongoing weedcontrol programs have a higher priority in that they reduce invasions by exotic plants).
TNC’s Eastern New York chapter, which is inside the northern reach of HWA, adoptedin early 2001 a new protocol that requires supportive answers to nine questions before theChapter can support release of biocontrol agents. These questions include:
• Establishing the level of threat posed by HWA as distinct from threats posed by otherexotic insects, climate change, etc.
• Establishing the potential non-target results of a release.
• Establishing that the benefit will outweigh the costs when neither the efficacy of thebiocontrol agent nor its possible non-target effects can be determined when the biocontrolagent is thought unlikely to do more than slow the spread of HWA.
• Having on hand sufficient resources to monitor the spread and impact of both HWAand the biocontrol agent.
In contrast, TNC staff at the southern edge of the HWA infestation in North and SouthCarolina are actively reaching out to partners and asking TNC’s Government Relations staffto help promote effective responses by federal agencies (Figure 2). TNC staff in the Carolinasadopted a Conservation Action Plan for the Southern Blue Ridge in June 2003 that includes,among its action items:
Figure 2. Areas in North Carolina and adjacent areas of TNCconcern for HWA.
____________________________________________________________________________________Campbell
Posters Third Symposium on Hemlock Woolly Adelgid
259
• Develop a landscape-wide strategy and protocols for treatments and biocontrol agentreleases.
• Accelerate mass rearing of agents and research on release techniques.
• Amend any language in TNC easement agreements that hamper release of biocontrolagents.
• Provide assistance in setting priorities for releases.
TNC staff from the eastern states that work on invasive species will meet in April toexplore ways to improve our effectiveness; HWA is a focus of the meeting.
In areas that are not yet experiencing infestations, such as Tennessee and Ohio, the staffis in a “watchful waiting” mode. TNC’s forest ecologist in Ohio is closely following scien-tific developments in such areas as biocontrol agents’ efficacy and recommendations for for-est management practices to restore forest health generally. She is open to the idea of work-ing with partners to conserve genetic material for use in later restoration projects.
At the national level, TNC staff continue searching for useful measures to promote them.In the meantime, we seek to apply to more recently introduced forest pests the lesson fromthe unfortunate HWA experience; authorities should eradicate such organisms promptly be-fore they spread to threaten important conservation goals.
A SAMPLE OF TNC PORTFOLIO SITES VULNERABLE TO HWA
New England The Berkshire-Taconic landscape reserve on the Connecticut-Massachu-setts-New York border is 155,000 acres. It provides habitat for more than 150 rarespecies. TNC staff’s greatest worry is the cumulative impacts of HWA, hemlock looperLambdina fiscellaria (Guenee), and elongate hemlock scale, Fiorinia externa (Ferris).TNC staff were disappointed that release of Pseudoscymnus tsugae in the Mianus RiverGorge of New York reduced HWA populations, but damage by the hemlock looperincreased. TNC will prevent exotic plants from invading areas with newly opened cano-pies through the well-established “Weed it Now” program.
New York The Mianus River Gorge Preserve was TNC’s first project and is a NaturalHistory Landmark. The Mianus River is an AA trout stream. The preserve is unusualin that much of its old-growth forest is hemlock. The Mianus River Gorge Preserve isnow managed by a separate non-profit consortium. This consortium approved releaseof Pseudoscymnus tsugae, but the results were apparently unsatisfactory.
The nearby Shawangunk Mountains are part of a ridge system that extends throughNew Jersey to Harrisburg, Pennsylvania. The 90,000-acre Shawangunk bioreserve is a“Last Great Place”–a major landscape rich in biological diversity. There are more than35 natural communities; the hemlock forests dominate just 5,000 acres. When NewYork State proposed introducing Pseudoscymnus tsugae in the area, the reserve’smanagement (which includes TNC and nine other organizations) could not reachagreement, so it remained neutral on the release, which occurred at one nearby site in2002. As a result, in part, of this quandary, the Director of Conservation Science for theEastern New York Chapter developed the more demanding decision protocol for
Third Symposium on Hemlock Woolly Adelgid Posters
Campbell ____________________________________________________________________________________
260
assessing possible releases of biocontrol agents described briefly elsewhere on this poster.As of late 2004, HWA distribution along Shawangunk ridge is still patchy.
New Jersey In 1999, a TNC intern assessed the HWA invasion at all TNC preserves inthe state. At that time, 11 of the 40 stands evaluated were experiencing severe defolia-tion (80 per cent or more), while eight stands were experiencing mild defoliation (lessthan 19 percent). One stand was described as “healthy.” Five years later, TNC staffreport that HWA has destroyed or seriously degraded over half of the 26,000 acres ofhemlock in New Jersey. The State continues to rear and release Pseudoscymnus tsugae,although its effects are uncertain.
Pennsylvania In an effort to protect important ecosystem functions, in spring 2005 TNCstaff will begin planting other evergreen trees in the West Branch Preserve in ClintonCounty. Candidates for planting include eastern white pine Pinus strobus (L.), red sprucePicea rubens (Sarg.), and even Norway spruce Picea abies (L.)(Karst)—which can beremoved later if better alternatives become available.
Virginia HWA is affecting every portfolio site at which hemlocks occur. Introducedforest insects and diseases—including HWA—have been identified as the greatest threatin the Alleghany Highlands project area. One preserve, Bottom Creek Gorge, was es-tablished to protect the Roanoke River headwaters; it contains the second-highest wa-terfall and the largest Carolina hemlock in Virginia. The stream provides critical habitatfor four species of narrowly endemic fish as well as to the widespread but still rare nativebrook trout.
West Virginia: TNC’s preserve at Ice Mountain protects a site called, in 1845, “one of thegreatest natural curiosities of (then) Virginia”. The microclimate–created in part by thedense hemlock canopy along the deep rock crevasses which retain ice well into sum-mer–provides habitat for regionally rare, typically boreal plants and uncommon tigerbeetles. The preserve approved release of Pseudoscymnus tsugae by the West VirginiaDepartment of Agriculture in 2002 and 2004. In addition, USFS researcher Brad Onkeninjected five trees in the immediate vicinity of the ice vents with imidicloprid in May2003.
North Carolina and South Carolina: In North Carolina, HWA already is present in fiveTNC-owned preserves and another five preserves established by easement agreementswith partners. HWA threatens at least five portfolio sites.
One—the Blue Wall/Southern Blue Ridge Escarpment—stretches from the Pacolet Rivernorth of Spartansburg, South Carolina, west to the Chattooga watershed in Georgia,and from the upper Piedmont of SC to the escarpment ridges of North Carolina. Thisregion harbors more than 300 occurrences of rare species and natural communities. TheBlue Wall Escarpment is “a biological hotspot within a hotspot”- the wider SouthernBlue Ridge ecoregion. Four Conservation Targets in this region have a strong hemlockcomponent: Gorge Species Assemblage, Carolina Hemlock Bluff, Escarpment ForestMatrix, and Headwater River Systems.
____________________________________________________________________________________Campbell
Posters Third Symposium on Hemlock Woolly Adelgid
261
At Grandfather Mountain, a private park with which TNC has both ownership andeasement agreements, staff are treating infected hemlocks in the back country with steminjection of Imicide.
Ohio: The Ohio Chapter led TNC planning for conservation of important examples of theWestern Allegheny Plateau Ecoregion – an area covering more than 40,000 square milesstretching across portions of Kentucky, New York, Ohio, Pennsylvania, and West Vir-ginia. HWA is not yet present in Ohio, but it threatens six large forest blocks in theWest Virginia portion of the ecoregion and five in Ohio. Some extremely rare speciesare associated with hemlock large patch communities within the overall forest matrix.The federally listed Indiana bat has been found to establish maternity roosts inside deadhemlocks standing in dense hemlock groves (Britzke et al. 2003).
REFERENCE
Britzke, E.R., M.J. Harvey, and S.C. Loeb. 2003. Indian bat, Myotis sodalist, maternityroosts in the Southern United States. Southeastern Naturalist 2(2):235-242.
Third Symposium on Hemlock Woolly Adelgid Posters
Clark and Lee_________________________________________________________________________________
262
MONITORING HEMLOCK VITALITY USING
GROUND-BASED DIGITAL IMAGING
Neil A. Clark1 and Sang-Mook Lee2
1USDA Forest Service Southern Research Station1650 Ramble Road, Blacksburg, Virginia 24060
2Electrical and Computer EngineeringVirginia Tech, Blacksburg, Virginia
ABSTRACT
The vitality of hemlock (Tsuga spp.) trees needs to be assessed in order to evaluate the effec-tiveness of treatments that combat hemlock woolly adelgid (HWA), Adelges tsugae Annand(Homoptera: Adelgidae). Ground-based photomonitoring can be used to assess canopy dy-namics, which serves as a visual indicator of tree vitality. Here we propose a sampling strat-egy using a digital camera with a telephoto lens to examine change in needle count over time.The magnification provided by the lens optics reduces some of the complicating effects inher-ent in other forms of below-canopy photographic methods and enables direct measurementof the objects of interest, the needles.
INTRODUCTION
Hemlock woolly adelgid (HWA), Adelges tsugae Annand (Homoptera: Adelgidae), is rap-idly infesting and causing widespread mortality of large areas of hemlock (Tsuga spp.) forestsin the eastern United States. Due to this epidemic, hemlocks are being intensely studied.Branch counts, needle loss, and crown transparency (Mayer et al. 2002, Webb et al. 2003) areoften used to assess individual tree responses to HWA infestations. Defoliation and regrowthdynamics are of interest in studies of hemlock response to HWA infestation. Ground-basedphotomonitoring can be used to assess these canopy dynamics. In this paper we will addresssome of the issues involved with ground-based photomonitoring using digital cameras andmake suggestions on designing an effective system.
GROUND-BASED CANOPY DATA COLLECTION
Due to access difficulties (Barker and Pinard 2001) crowns are often evaluated from a ground-based vantage point. This presents some challenges in the outdoor environment. Hemi-spherical (fisheye) photography is often used for canopy openness or photosynthetic photon
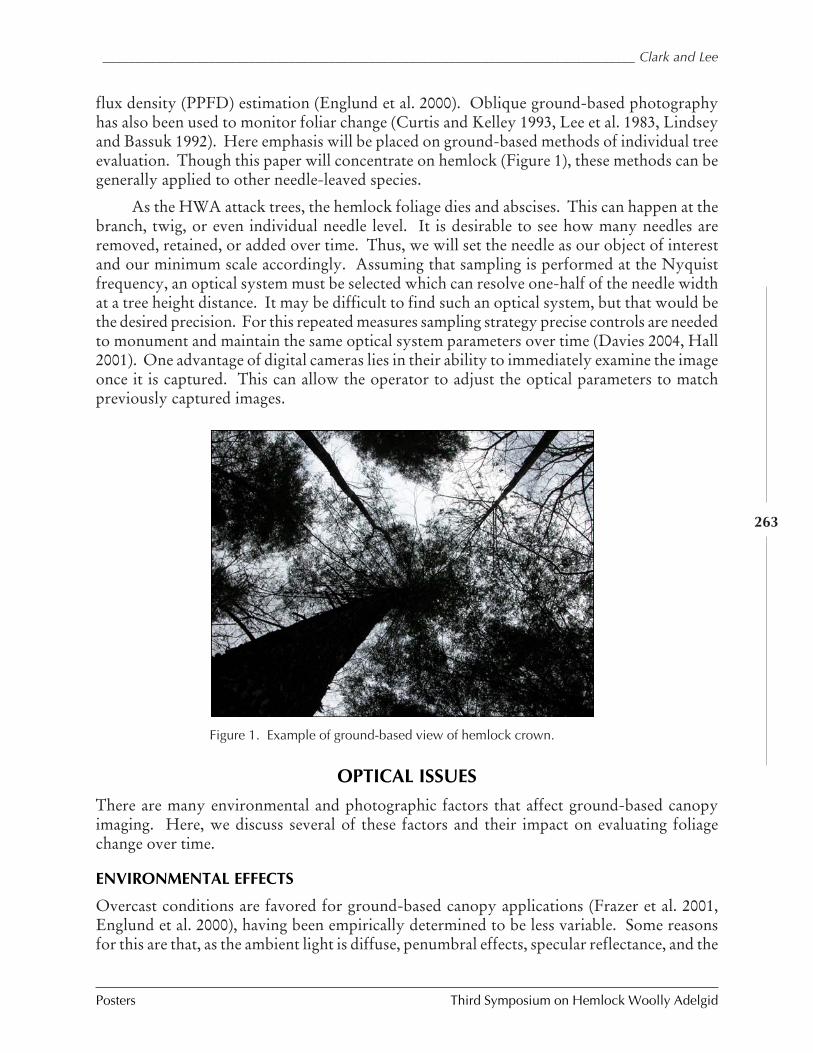
________________________________________________________________________________ Clark and Lee
Posters Third Symposium on Hemlock Woolly Adelgid
263
flux density (PPFD) estimation (Englund et al. 2000). Oblique ground-based photographyhas also been used to monitor foliar change (Curtis and Kelley 1993, Lee et al. 1983, Lindseyand Bassuk 1992). Here emphasis will be placed on ground-based methods of individual treeevaluation. Though this paper will concentrate on hemlock (Figure 1), these methods can begenerally applied to other needle-leaved species.
As the HWA attack trees, the hemlock foliage dies and abscises. This can happen at thebranch, twig, or even individual needle level. It is desirable to see how many needles areremoved, retained, or added over time. Thus, we will set the needle as our object of interestand our minimum scale accordingly. Assuming that sampling is performed at the Nyquistfrequency, an optical system must be selected which can resolve one-half of the needle widthat a tree height distance. It may be difficult to find such an optical system, but that would bethe desired precision. For this repeated measures sampling strategy precise controls are neededto monument and maintain the same optical system parameters over time (Davies 2004, Hall2001). One advantage of digital cameras lies in their ability to immediately examine the imageonce it is captured. This can allow the operator to adjust the optical parameters to matchpreviously captured images.
Figure 1. Example of ground-based view of hemlock crown.
OPTICAL ISSUES
There are many environmental and photographic factors that affect ground-based canopyimaging. Here, we discuss several of these factors and their impact on evaluating foliagechange over time.
ENVIRONMENTAL EFFECTS
Overcast conditions are favored for ground-based canopy applications (Frazer et al. 2001,Englund et al. 2000), having been empirically determined to be less variable. Some reasonsfor this are that, as the ambient light is diffuse, penumbral effects, specular reflectance, and the
Third Symposium on Hemlock Woolly Adelgid Posters
Clark and Lee_________________________________________________________________________________
264
variation of radiant flux density across the scene is more manageable for the imaging sensor.Waiting for overcast conditions can be over-restrictive for our purposes; instead, we suggesta narrow field of view (FOV) to minimize these effects and the probability of imaging the sundirectly.
Other objects can interfere with the clear viewing of the object of interest. Objects inthe background can affect the contrast needed to delineate the object of interest and fore-ground entities can block the view completely. Reasonable precautions can be taken duringthe first sampling cycle; there may be no remedy other than disregarding the sample for sub-sequent visits. For this reason, we suggest taking a larger number of samples than initiallyneeded, knowing that some may be discarded in future revisits.
PHOTOGRAPHIC EFFECTS
Resolution
Measurement precision in any sampling space (i.e., spatial, spectral, and temporal) is limitedby the ability to segment and distinguish between very small changes. As digital sensors arearrangements of discrete sampling areas, not unlike film emulsions, there are limits to spatialprecision. There are also spectral precision limits on the ability to measure specific quantitiesof light of specific wavelengths over specific time intervals.
Many studies attribute digital camera overestimation to the limited spatial resolution ofthe image (Frazer et al. 2001, Englund et al. 2000). This is of particular concern for needle-leaved species as the needle arrangement creates many very thin gaps. Thus, the measurementscale should be considered at the outset of the canopy study to determine the minimum gap(or leaf) dimension to be considered.
It is important to have the appropriate spatial and spectral resolution to be able to re-solve the object of interest: Figure 2 shows two images (a and b) captured with 35 and 280mm-equivalent focal lengths, respectively. The interaction between spatial and spectral reso-lution can have serious affects at the analysis stage. Threshold selection can also contribute tovariability when images are analyzed: the binary images (Figure 2, c and d) show how spatialresolution and thresholding can have a combined effect on the classification of foliage or sky.
Lens Factors
Lens systems gather, filter, and direct light rays to the optical sensor and play a large part inthe usefulness of the output image. Lens focal length affects the spatial and radiometric prop-erties of the captured image: short focal lengths produce wide-angle views with limited mag-nification; conversely, longer focal lengths cover more narrow views in greater detail (higherspatial resolution). The broader spatial coverage of shorter focal lengths incorporates a greaterradiant flux density, allowing small apertures and faster shutter speeds, but greater variationacross the scene. The lower amount of light captured with long focal lengths necessitatesgreater aperture and/or shutter speed adjustments for adequate exposure. The need to adjustfocus will be an added complication when using long focal lengths as the depth of field (DOF)will be drastically reduced.
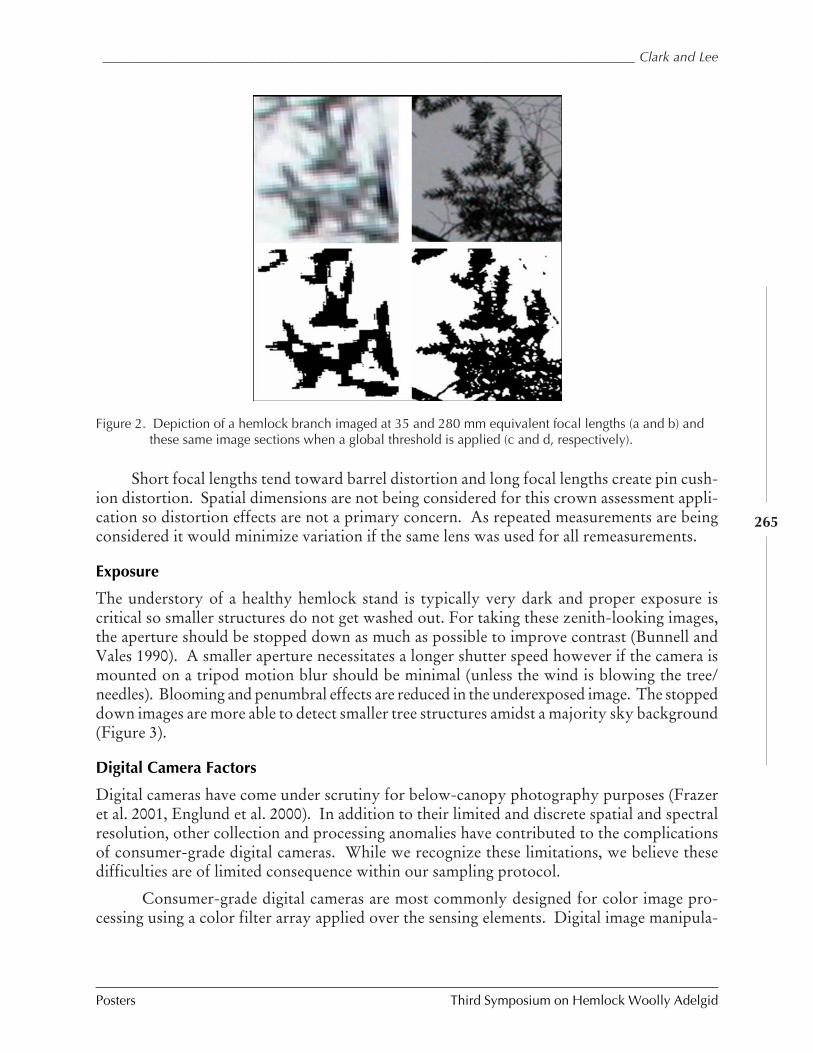
________________________________________________________________________________ Clark and Lee
Posters Third Symposium on Hemlock Woolly Adelgid
265
Short focal lengths tend toward barrel distortion and long focal lengths create pin cush-ion distortion. Spatial dimensions are not being considered for this crown assessment appli-cation so distortion effects are not a primary concern. As repeated measurements are beingconsidered it would minimize variation if the same lens was used for all remeasurements.
Exposure
The understory of a healthy hemlock stand is typically very dark and proper exposure iscritical so smaller structures do not get washed out. For taking these zenith-looking images,the aperture should be stopped down as much as possible to improve contrast (Bunnell andVales 1990). A smaller aperture necessitates a longer shutter speed however if the camera ismounted on a tripod motion blur should be minimal (unless the wind is blowing the tree/needles). Blooming and penumbral effects are reduced in the underexposed image. The stoppeddown images are more able to detect smaller tree structures amidst a majority sky background(Figure 3).
Digital Camera Factors
Digital cameras have come under scrutiny for below-canopy photography purposes (Frazeret al. 2001, Englund et al. 2000). In addition to their limited and discrete spatial and spectralresolution, other collection and processing anomalies have contributed to the complicationsof consumer-grade digital cameras. While we recognize these limitations, we believe thesedifficulties are of limited consequence within our sampling protocol.
Consumer-grade digital cameras are most commonly designed for color image pro-cessing using a color filter array applied over the sensing elements. Digital image manipula-
Figure 2. Depiction of a hemlock branch imaged at 35 and 280 mm equivalent focal lengths (a and b) andthese same image sections when a global threshold is applied (c and d, respectively).
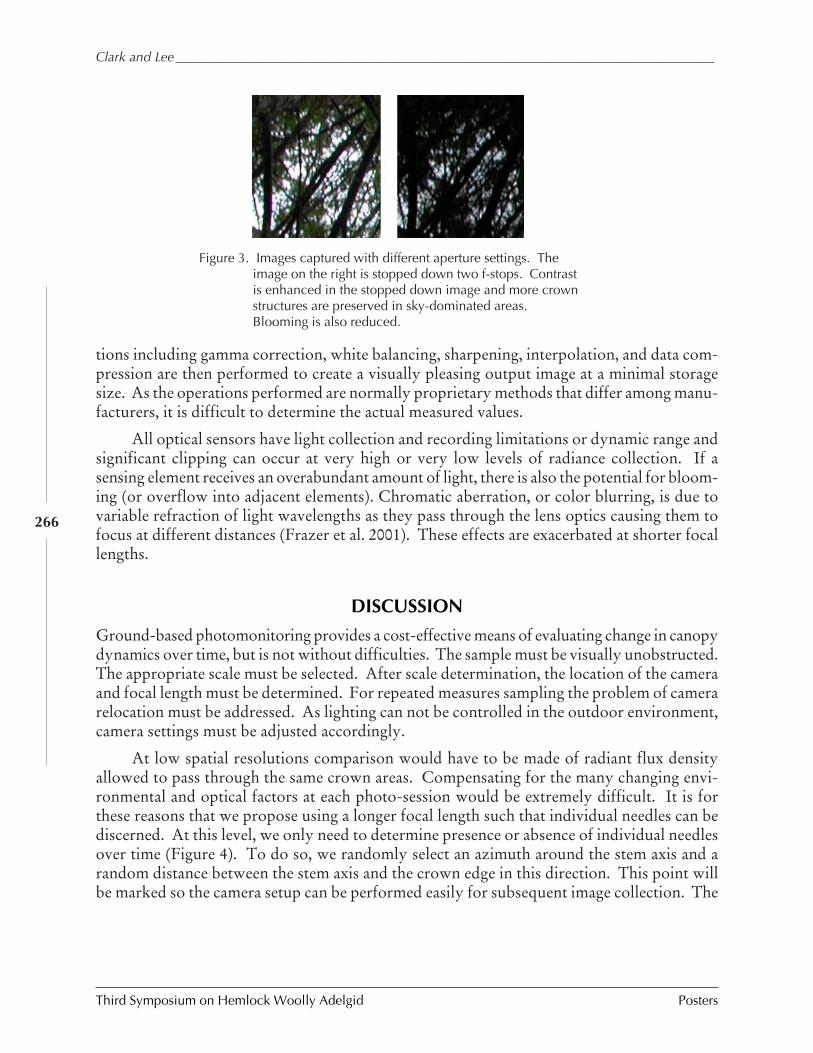
Third Symposium on Hemlock Woolly Adelgid Posters
Clark and Lee_________________________________________________________________________________
266
tions including gamma correction, white balancing, sharpening, interpolation, and data com-pression are then performed to create a visually pleasing output image at a minimal storagesize. As the operations performed are normally proprietary methods that differ among manu-facturers, it is difficult to determine the actual measured values.
All optical sensors have light collection and recording limitations or dynamic range andsignificant clipping can occur at very high or very low levels of radiance collection. If asensing element receives an overabundant amount of light, there is also the potential for bloom-ing (or overflow into adjacent elements). Chromatic aberration, or color blurring, is due tovariable refraction of light wavelengths as they pass through the lens optics causing them tofocus at different distances (Frazer et al. 2001). These effects are exacerbated at shorter focallengths.
DISCUSSION
Ground-based photomonitoring provides a cost-effective means of evaluating change in canopydynamics over time, but is not without difficulties. The sample must be visually unobstructed.The appropriate scale must be selected. After scale determination, the location of the cameraand focal length must be determined. For repeated measures sampling the problem of camerarelocation must be addressed. As lighting can not be controlled in the outdoor environment,camera settings must be adjusted accordingly.
At low spatial resolutions comparison would have to be made of radiant flux densityallowed to pass through the same crown areas. Compensating for the many changing envi-ronmental and optical factors at each photo-session would be extremely difficult. It is forthese reasons that we propose using a longer focal length such that individual needles can bediscerned. At this level, we only need to determine presence or absence of individual needlesover time (Figure 4). To do so, we randomly select an azimuth around the stem axis and arandom distance between the stem axis and the crown edge in this direction. This point willbe marked so the camera setup can be performed easily for subsequent image collection. The
Figure 3. Images captured with different aperture settings. Theimage on the right is stopped down two f-stops. Contrastis enhanced in the stopped down image and more crownstructures are preserved in sky-dominated areas.Blooming is also reduced.
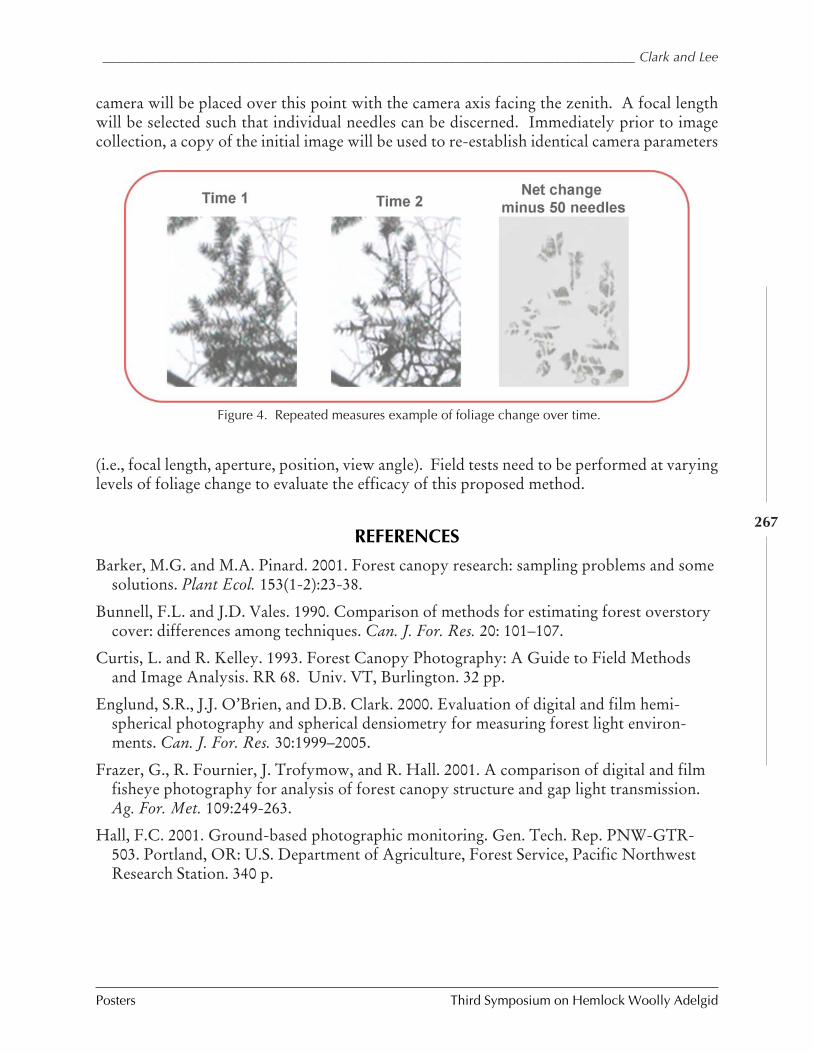
________________________________________________________________________________ Clark and Lee
Posters Third Symposium on Hemlock Woolly Adelgid
267
camera will be placed over this point with the camera axis facing the zenith. A focal lengthwill be selected such that individual needles can be discerned. Immediately prior to imagecollection, a copy of the initial image will be used to re-establish identical camera parameters
Figure 4. Repeated measures example of foliage change over time.
(i.e., focal length, aperture, position, view angle). Field tests need to be performed at varyinglevels of foliage change to evaluate the efficacy of this proposed method.
REFERENCES
Barker, M.G. and M.A. Pinard. 2001. Forest canopy research: sampling problems and somesolutions. Plant Ecol. 153(1-2):23-38.
Bunnell, F.L. and J.D. Vales. 1990. Comparison of methods for estimating forest overstorycover: differences among techniques. Can. J. For. Res. 20: 101–107.
Curtis, L. and R. Kelley. 1993. Forest Canopy Photography: A Guide to Field Methodsand Image Analysis. RR 68. Univ. VT, Burlington. 32 pp.
Englund, S.R., J.J. O’Brien, and D.B. Clark. 2000. Evaluation of digital and film hemi-spherical photography and spherical densiometry for measuring forest light environ-ments. Can. J. For. Res. 30:1999–2005.
Frazer, G., R. Fournier, J. Trofymow, and R. Hall. 2001. A comparison of digital and filmfisheye photography for analysis of forest canopy structure and gap light transmission.Ag. For. Met. 109:249-263.
Hall, F.C. 2001. Ground-based photographic monitoring. Gen. Tech. Rep. PNW-GTR-503. Portland, OR: U.S. Department of Agriculture, Forest Service, Pacific NorthwestResearch Station. 340 p.
Third Symposium on Hemlock Woolly Adelgid Posters
Clark and Lee_________________________________________________________________________________
268
Lee, Y., R. Alfaro, and G. Van Sickle. 1983. Tree-crown defoliation measurement fromdigitized photographs. Can. J. For. Res. 13:956-961.
Lindsey P. and N. Bassuk. 1992. A nondestructive image analysis technique for estimatingwhole-tree leaf area. HortTechnology 2:66–72.
Mayer, M., R. Chianese, T. Scudder, J. White, K. Vongpaseuth, and R. Ward. 2002. Thir-teen years of monitoring the hemlock woolly adelgid in New Jersey forests, pp. 50-60. InProceedings, Hemlock woolly adelgid in the Eastern United States Symposium; 2002February 5-7; East Brunswick, New Jersey, ed. B. Onken, R. Reardon, and J. Lashomb.New Brunswick, New Jersey : Rutgers University.
Webb, R., J. Frank, and M. Raupp. 2003. Eastern hemlock recovery from hemlock woollyadelgid damage following imidacloprid therapy. Journal of Arboriculture 29:298-302.
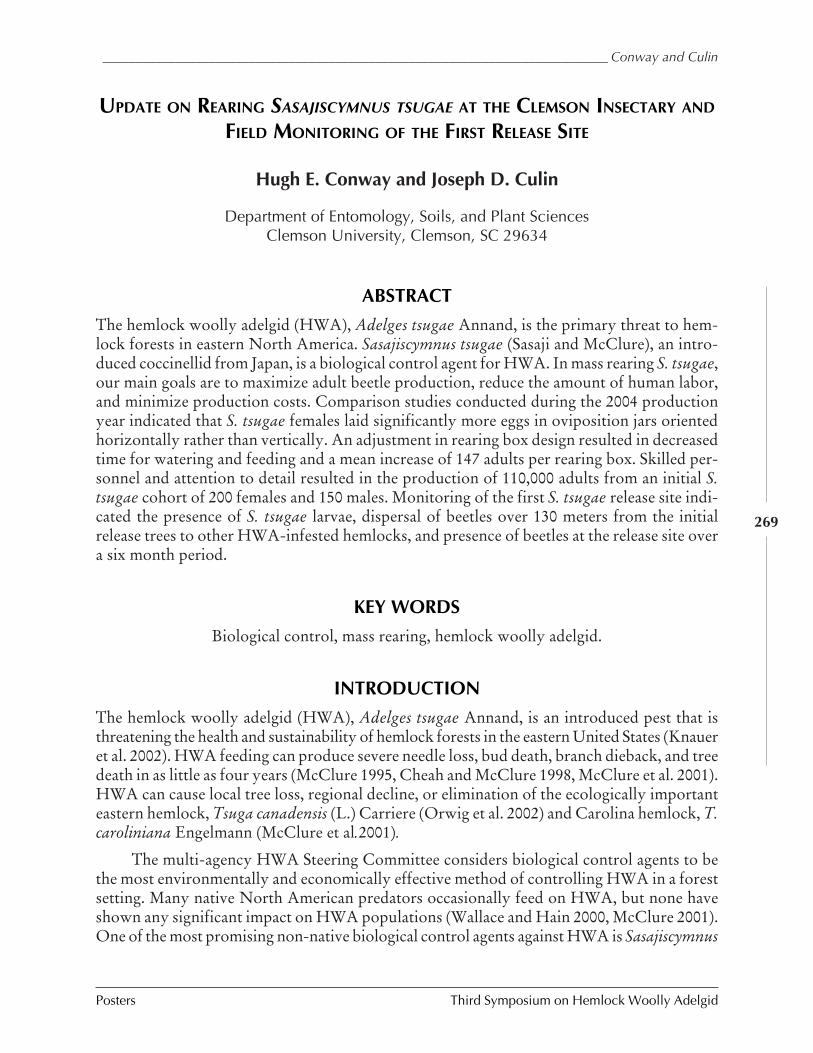
____________________________________________________________________________ Conway and Culin
Posters Third Symposium on Hemlock Woolly Adelgid
269
UPDATE ON REARING SASAJISCYMNUS TSUGAE AT THE CLEMSON INSECTARY AND
FIELD MONITORING OF THE FIRST RELEASE SITE
Hugh E. Conway and Joseph D. Culin
Department of Entomology, Soils, and Plant SciencesClemson University, Clemson, SC 29634
ABSTRACT
The hemlock woolly adelgid (HWA), Adelges tsugae Annand, is the primary threat to hem-lock forests in eastern North America. Sasajiscymnus tsugae (Sasaji and McClure), an intro-duced coccinellid from Japan, is a biological control agent for HWA. In mass rearing S. tsugae,our main goals are to maximize adult beetle production, reduce the amount of human labor,and minimize production costs. Comparison studies conducted during the 2004 productionyear indicated that S. tsugae females laid significantly more eggs in oviposition jars orientedhorizontally rather than vertically. An adjustment in rearing box design resulted in decreasedtime for watering and feeding and a mean increase of 147 adults per rearing box. Skilled per-sonnel and attention to detail resulted in the production of 110,000 adults from an initial S.tsugae cohort of 200 females and 150 males. Monitoring of the first S. tsugae release site indi-cated the presence of S. tsugae larvae, dispersal of beetles over 130 meters from the initialrelease trees to other HWA-infested hemlocks, and presence of beetles at the release site overa six month period.
KEY WORDS
Biological control, mass rearing, hemlock woolly adelgid.
INTRODUCTION
The hemlock woolly adelgid (HWA), Adelges tsugae Annand, is an introduced pest that isthreatening the health and sustainability of hemlock forests in the eastern United States (Knaueret al. 2002). HWA feeding can produce severe needle loss, bud death, branch dieback, and treedeath in as little as four years (McClure 1995, Cheah and McClure 1998, McClure et al. 2001).HWA can cause local tree loss, regional decline, or elimination of the ecologically importanteastern hemlock, Tsuga canadensis (L.) Carriere (Orwig et al. 2002) and Carolina hemlock, T.caroliniana Engelmann (McClure et al.2001).
The multi-agency HWA Steering Committee considers biological control agents to bethe most environmentally and economically effective method of controlling HWA in a forestsetting. Many native North American predators occasionally feed on HWA, but none haveshown any significant impact on HWA populations (Wallace and Hain 2000, McClure 2001).One of the most promising non-native biological control agents against HWA is Sasajiscymnus
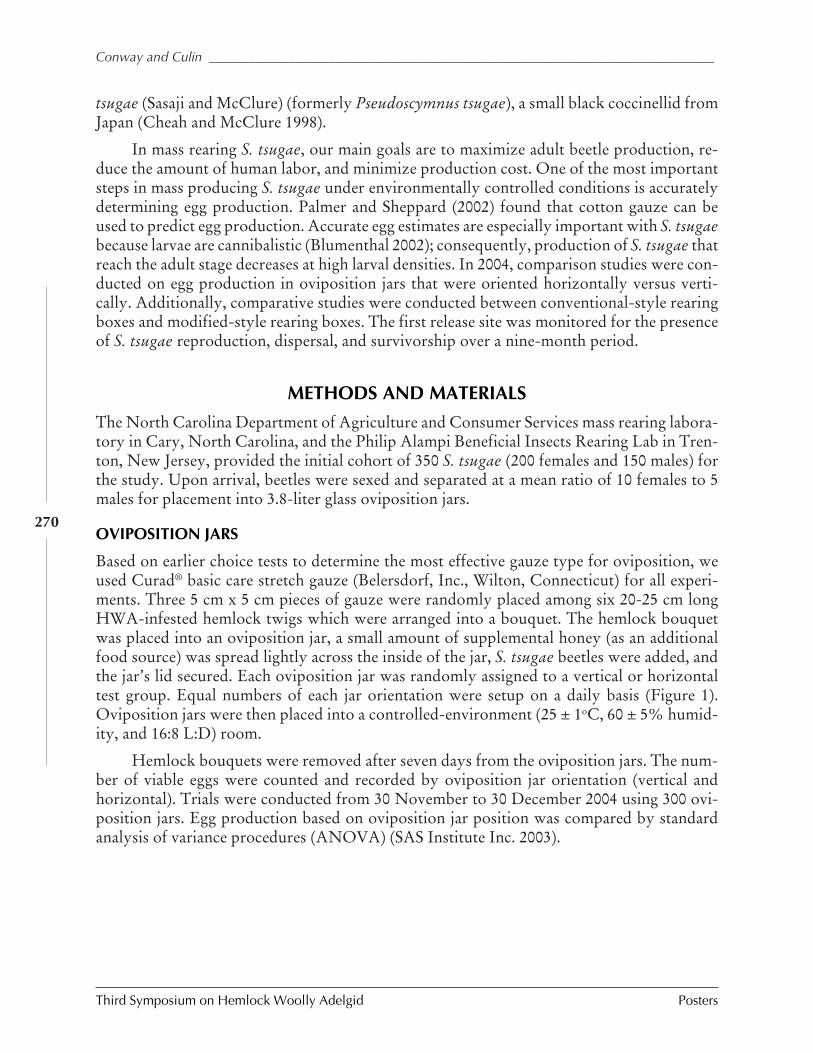
Third Symposium on Hemlock Woolly Adelgid Posters
Conway and Culin ____________________________________________________________________________
270
tsugae (Sasaji and McClure) (formerly Pseudoscymnus tsugae), a small black coccinellid fromJapan (Cheah and McClure 1998).
In mass rearing S. tsugae, our main goals are to maximize adult beetle production, re-duce the amount of human labor, and minimize production cost. One of the most importantsteps in mass producing S. tsugae under environmentally controlled conditions is accuratelydetermining egg production. Palmer and Sheppard (2002) found that cotton gauze can beused to predict egg production. Accurate egg estimates are especially important with S. tsugaebecause larvae are cannibalistic (Blumenthal 2002); consequently, production of S. tsugae thatreach the adult stage decreases at high larval densities. In 2004, comparison studies were con-ducted on egg production in oviposition jars that were oriented horizontally versus verti-cally. Additionally, comparative studies were conducted between conventional-style rearingboxes and modified-style rearing boxes. The first release site was monitored for the presenceof S. tsugae reproduction, dispersal, and survivorship over a nine-month period.
METHODS AND MATERIALS
The North Carolina Department of Agriculture and Consumer Services mass rearing labora-tory in Cary, North Carolina, and the Philip Alampi Beneficial Insects Rearing Lab in Tren-ton, New Jersey, provided the initial cohort of 350 S. tsugae (200 females and 150 males) forthe study. Upon arrival, beetles were sexed and separated at a mean ratio of 10 females to 5males for placement into 3.8-liter glass oviposition jars.
OVIPOSITION JARS
Based on earlier choice tests to determine the most effective gauze type for oviposition, weused Curad® basic care stretch gauze (Belersdorf, Inc., Wilton, Connecticut) for all experi-ments. Three 5 cm x 5 cm pieces of gauze were randomly placed among six 20-25 cm longHWA-infested hemlock twigs which were arranged into a bouquet. The hemlock bouquetwas placed into an oviposition jar, a small amount of supplemental honey (as an additionalfood source) was spread lightly across the inside of the jar, S. tsugae beetles were added, andthe jar’s lid secured. Each oviposition jar was randomly assigned to a vertical or horizontaltest group. Equal numbers of each jar orientation were setup on a daily basis (Figure 1).Oviposition jars were then placed into a controlled-environment (25 ± 1oC, 60 ± 5% humid-ity, and 16:8 L:D) room.
Hemlock bouquets were removed after seven days from the oviposition jars. The num-ber of viable eggs were counted and recorded by oviposition jar orientation (vertical andhorizontal). Trials were conducted from 30 November to 30 December 2004 using 300 ovi-position jars. Egg production based on oviposition jar position was compared by standardanalysis of variance procedures (ANOVA) (SAS Institute Inc. 2003).
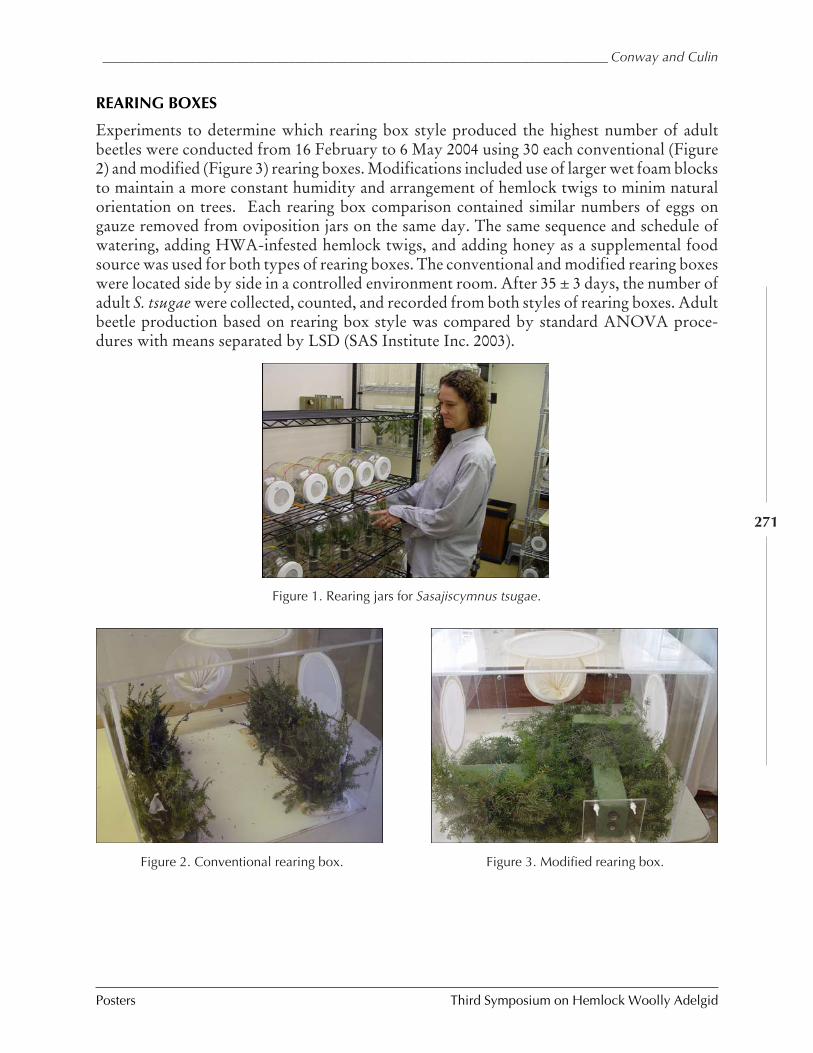
____________________________________________________________________________ Conway and Culin
Posters Third Symposium on Hemlock Woolly Adelgid
271
REARING BOXES
Experiments to determine which rearing box style produced the highest number of adultbeetles were conducted from 16 February to 6 May 2004 using 30 each conventional (Figure2) and modified (Figure 3) rearing boxes. Modifications included use of larger wet foam blocksto maintain a more constant humidity and arrangement of hemlock twigs to minim naturalorientation on trees. Each rearing box comparison contained similar numbers of eggs ongauze removed from oviposition jars on the same day. The same sequence and schedule ofwatering, adding HWA-infested hemlock twigs, and adding honey as a supplemental foodsource was used for both types of rearing boxes. The conventional and modified rearing boxeswere located side by side in a controlled environment room. After 35 ± 3 days, the number ofadult S. tsugae were collected, counted, and recorded from both styles of rearing boxes. Adultbeetle production based on rearing box style was compared by standard ANOVA proce-dures with means separated by LSD (SAS Institute Inc. 2003).
Figure 2. Conventional rearing box. Figure 3. Modified rearing box.
Figure 1. Rearing jars for Sasajiscymnus tsugae.
Third Symposium on Hemlock Woolly Adelgid Posters
Conway and Culin ____________________________________________________________________________
272
MONITORING
We monitored the initial release sites along a valley north of Walhalla, South Carolina, lead-ing into the Walhalla Fish Hatchery near position 34’59"N 83’04"W. The release of 6,680 S.tsugae adults occurred on 12 March 2004 at a location 2460 feet above sea level. At the firstlocation, 4,430 adults were placed on two HWA-infested hemlocks, and approximately 300m downstream along the same hillside, 2,250 adults were placed on a single HWA-infestedhemlock. The sites were monitored using visual observation to determine the number of adultbeetles, larvae, eggs, or pupae in the lower canopy. The number of trees where S. tsugae werefound and the total search time were recorded.
RESULTS AND DISCUSSION
OVIPOSITION JARS
Sasajiscymnus tsugae females laid significantly more eggs on gauze in the horizontal oviposi-tion jars compared to those in the vertical position (P = 0.03) (Table 1). The horizontal ovipo-sition jar allows the twigs in the bouquets to be arranged similarly to twigs on the hemlocktrees. When running 100 oviposition jars per week, the horizontally positioned jars will weeklyproduce an additional 1,900 eggs on gauze per week. Based on this experiment, we now placeall oviposition jars in the horizontal position.
It will be interesting to see if there is a difference in the total number of adults that arereared from eggs taken from the two jar positions. The results of this part of the experimentwill not be known until the beginning of March, 2005, when this study will be completed.
REARING BOXES
The modified rearing boxes produced significantly more S. tsugae (P = 0.02) than the conven-tional rearing boxes (Table 2), and reduced time required for the feeding and watering pro-cess. The larger floral wet foam blocks in the modified boxes maintained a more constantmoisture level. Additionally, the arrangement of the HWA-infested twigs was in an overlap-ping pattern along the sides of the blocks similar to how twigs naturally occur on the hemlocktree. With 100 rearing boxes, the modified boxes have the potential to produce an additional14,700 S. tsugae per year. We are in the process of changing all rearing boxes to the modifiedarrangement to produce as many S. tsugae as possible for release against hemlock woollyadelgids.
MONITORING
Sasajiscymnus tsugae released above the Walhalla Fish Hatchery, Walhalla, South Carolina,provided evidence of reproduction in the field with eggs, larvae, and pupae found on HWA-infested hemlock trees at the site. Dispersal from the initial three trees to eight HWA-infestedhemlocks at the site was recorded. Beetles were observed at the release site over a six-monthperiod (Table 3). From the initial release to the first observation, there were two light snowsand five days with freezing overnight temperatures at the release site.
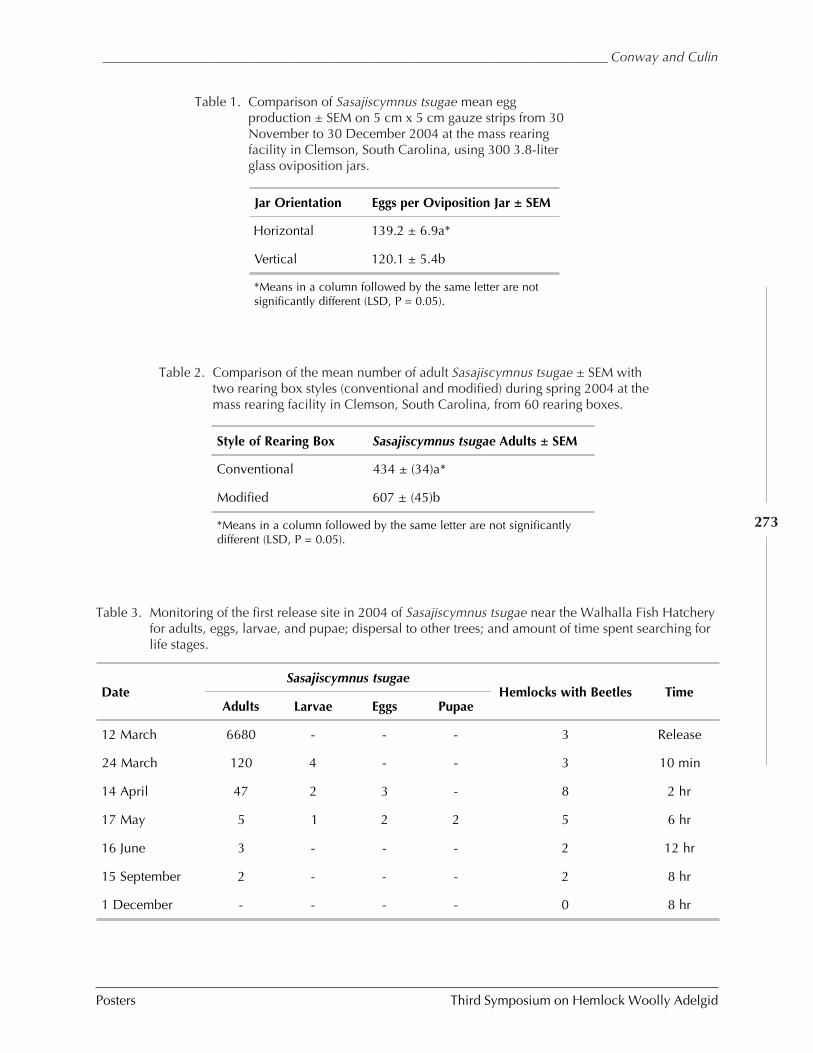
____________________________________________________________________________ Conway and Culin
Posters Third Symposium on Hemlock Woolly Adelgid
273
Table 3. Monitoring of the first release site in 2004 of Sasajiscymnus tsugae near the Walhalla Fish Hatcheryfor adults, eggs, larvae, and pupae; dispersal to other trees; and amount of time spent searching forlife stages.
DateSasajiscymnus tsugae
Hemlocks with Beetles TimeAdults Larvae Eggs Pupae
12 March 6680 - - - 3 Release
24 March 120 4 - - 3 10 min
14 April 47 2 3 - 8 2 hr
17 May 5 1 2 2 5 6 hr
16 June 3 - - - 2 12 hr
15 September 2 - - - 2 8 hr
1 December - - - - 0 8 hr
Table 2. Comparison of the mean number of adult Sasajiscymnus tsugae ± SEM withtwo rearing box styles (conventional and modified) during spring 2004 at themass rearing facility in Clemson, South Carolina, from 60 rearing boxes.
Style of Rearing Box Sasajiscymnus tsugae Adults ± SEM
Conventional 434 ± (34)a*
Modified 607 ± (45)b
*Means in a column followed by the same letter are not significantlydifferent (LSD, P = 0.05).
Table 1. Comparison of Sasajiscymnus tsugae mean eggproduction ± SEM on 5 cm x 5 cm gauze strips from 30November to 30 December 2004 at the mass rearingfacility in Clemson, South Carolina, using 300 3.8-literglass oviposition jars.
Jar Orientation Eggs per Oviposition Jar ± SEM
Horizontal 139.2 ± 6.9a*
Vertical 120.1 ± 5.4b
*Means in a column followed by the same letter are notsignificantly different (LSD, P = 0.05).
Third Symposium on Hemlock Woolly Adelgid Posters
Conway and Culin ____________________________________________________________________________
274
The beetles survived the cold weather and dispersed from the release trees up to 130 mto other nearby HWA-infested trees. The direction of dispersal was primarily downhill fromthe release trees, which could have been due to the majority of HWA-infested hemlocksbeing downhill from the release trees. There were indications of reproduction occurring, withobservations of larvae, eggs, and pupae detected on both release trees and nearby hemlocks.At the nine-month sample date, no adult beetles were found in the lower canopy of the hem-locks. However, there was a noticeable difference in the HWA-infestation level, with release-site trees having only lightly scattered “wool” compared to heavy “wool” levels on hemlocks200 m away. We plan to return in March 2005 to assess and compare the condition of thehemlocks at the release site to hemlocks in the next valley based on pre-release HWA-infesta-tion data from 2004.
In the first year of mass rearing, Clemson’s insectary produced over 110,000 S. tsugaeadults and released over 100,000 beetles into the hemlock forests of South Carolina, NorthCarolina, and Georgia. This year’s goal for the facility is to produce 150,000 S. tsugae forrelease into HWA-infested hemlocks. We plan to continue investigations on the dispersal andthe long-term impacts of S. tsugae on HWA with studies near selected release sites.
ACKNOWLEDGMENTS
We thank Dr. Kathleen Kidd (North Carolina Department of Agriculture and ConsumerServices) and Daniel Palmer (Phillip Alampi Beneficial Insect Laboratory, New Jersey) forthe initial supply of S. tsugae. Thanks to LayLa Burgess, Cora Allard, Wess Klunk, KarenBurton, Carrie Hendrix, Will Reeves, and James Korecki, the hard working technicians andstudents who have worked at the Clemson Insectary. We also thank Rusty Rhea (ForestEntomologist USDA FS) and Buzz Williams (Chattooga Conservancy) for help in site selec-tion and releasing the beetles. For project funding, we thank the Jackson-Macon Conserva-tion Alliance, the Chattooga Conservancy, the National Forest Foundation, and USDA For-est Service.
REFERENCES
Blumenthal, E.M. 2002. Report: Pseudoscymnus tsugae in Pennsylvania forests, pp. 166-169. In Proceedings: Hemlock Woolly Adelgid in the Eastern United States Symposium.Feb. 5-7, 2002, East Brunswick, NJ, ed. B. Onken, R. Reardon, and J. Lashomb. NewBrunswick, New Jersey, Rutgers.
Cheah, C.A.S.-J. and M.S. McClure. 1998. Life history and development of Pseudoscymnustsugae (Coleoptera: Coccinellidae), a new predator of the hemlock woolly adelgid(Homoptera: Adelgidae). Environmental Entomology 27:1531-1536.
Knauer, K., J. Linnane J., K. Shields, and R. Bridges. 2002 An Initiative for Management ofthe hemlock woolly adelgid, pp. 9-11. In Proceedings: Hemlock Woolly Adelgid in theEastern United States Symposium. Feb. 5-7, 2002, East Brunswick, NJ, ed. B. Onken, R.Reardon, and J. Lashomb. New Brunswick, New Jersey, Rutgers.
____________________________________________________________________________ Conway and Culin
Posters Third Symposium on Hemlock Woolly Adelgid
275
McClure, M.S. 1995. Diapterobates humeralis (Orbatida: Ceratozetidae): an effectivecontrol agent of hemlock woolly adelgid (Homoptera: Adelgidae) in Japan. Environmen-tal Entomology 24:1207-1215.
McClure, M.S. 2001. Biological control of the hemlock woolly adelgid in the EasternUnited States. FHTET-2001-08. Morgantown, West Virginia, USDA Forest Service. 10p.
McClure, M.S., S.M. Salom, and K.S. Shields. 2001. Hemlock woolly adelgid. FHTET-2001-03. Morgantown, West Virginia, USDA Forest Service. 14 p.
Palmer, D.J. and J.L. Sheppard. 2002. Mass rearing Pseudoscymnus tsugae at the New JerseyDepartment of Agriculture: Challenges and lessons, pp. 214-220. In Proceedings: Hem-lock Woolly Adelgid in the Eastern United States Symposium. Feb. 5-7, 2002, EastBrunswick, NJ, ed. B. Onken, R. Reardon, and J. Lashomb. New Brunswick, NewJersey, Rutgers.
Orwig, D.A., D.R. Foster, and D.L. Mausel. 2002. Landscape patterns of hemlock declinein New England due to the introduced hemlock woolly adelgid. Journal of Biogeography29:1475-1487.
SAS Institute. 2003. JMP In, Windows Version 5.1, SAS Institute, Inc., Cary, North Caro-lina.
Wallace, M.S. and F.P. Hain. 2000. Field surveys and evaluation of native and establishedpredators of the hemlock woolly adelgid (Homoptera: Adelgidae) in the southeasternUnited States. Environmental Entomology 29:638-644.
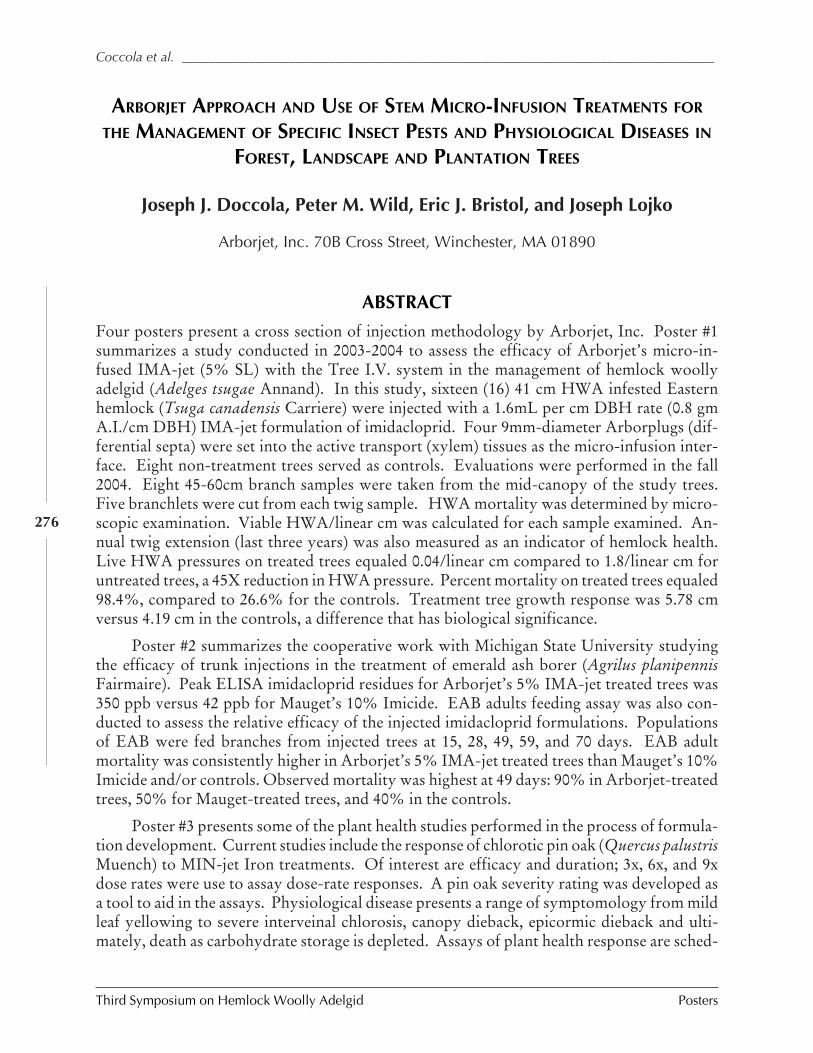
Third Symposium on Hemlock Woolly Adelgid Posters
Coccola et al. ________________________________________________________________________________
276
ARBORJET APPROACH AND USE OF STEM MICRO-INFUSION TREATMENTS FOR
THE MANAGEMENT OF SPECIFIC INSECT PESTS AND PHYSIOLOGICAL DISEASES INFOREST, LANDSCAPE AND PLANTATION TREES
Joseph J. Doccola, Peter M. Wild, Eric J. Bristol, and Joseph Lojko
Arborjet, Inc. 70B Cross Street, Winchester, MA 01890
ABSTRACT
Four posters present a cross section of injection methodology by Arborjet, Inc. Poster #1summarizes a study conducted in 2003-2004 to assess the efficacy of Arborjet’s micro-in-fused IMA-jet (5% SL) with the Tree I.V. system in the management of hemlock woollyadelgid (Adelges tsugae Annand). In this study, sixteen (16) 41 cm HWA infested Easternhemlock (Tsuga canadensis Carriere) were injected with a 1.6mL per cm DBH rate (0.8 gmA.I./cm DBH) IMA-jet formulation of imidacloprid. Four 9mm-diameter Arborplugs (dif-ferential septa) were set into the active transport (xylem) tissues as the micro-infusion inter-face. Eight non-treatment trees served as controls. Evaluations were performed in the fall2004. Eight 45-60cm branch samples were taken from the mid-canopy of the study trees.Five branchlets were cut from each twig sample. HWA mortality was determined by micro-scopic examination. Viable HWA/linear cm was calculated for each sample examined. An-nual twig extension (last three years) was also measured as an indicator of hemlock health.Live HWA pressures on treated trees equaled 0.04/linear cm compared to 1.8/linear cm foruntreated trees, a 45X reduction in HWA pressure. Percent mortality on treated trees equaled98.4%, compared to 26.6% for the controls. Treatment tree growth response was 5.78 cmversus 4.19 cm in the controls, a difference that has biological significance.
Poster #2 summarizes the cooperative work with Michigan State University studyingthe efficacy of trunk injections in the treatment of emerald ash borer (Agrilus planipennisFairmaire). Peak ELISA imidacloprid residues for Arborjet’s 5% IMA-jet treated trees was350 ppb versus 42 ppb for Mauget’s 10% Imicide. EAB adults feeding assay was also con-ducted to assess the relative efficacy of the injected imidacloprid formulations. Populationsof EAB were fed branches from injected trees at 15, 28, 49, 59, and 70 days. EAB adultmortality was consistently higher in Arborjet’s 5% IMA-jet treated trees than Mauget’s 10%Imicide and/or controls. Observed mortality was highest at 49 days: 90% in Arborjet-treatedtrees, 50% for Mauget-treated trees, and 40% in the controls.
Poster #3 presents some of the plant health studies performed in the process of formula-tion development. Current studies include the response of chlorotic pin oak (Quercus palustrisMuench) to MIN-jet Iron treatments. Of interest are efficacy and duration; 3x, 6x, and 9xdose rates were use to assay dose-rate responses. A pin oak severity rating was developed asa tool to aid in the assays. Physiological disease presents a range of symptomology from mildleaf yellowing to severe interveinal chlorosis, canopy dieback, epicormic dieback and ulti-mately, death as carbohydrate storage is depleted. Assays of plant health response are sched-
________________________________________________________________________________ Doccola et al.
Posters Third Symposium on Hemlock Woolly Adelgid
277
uled in 2005, 2006, and 2007. In a study performed in London plane trees (Platanus x Acerifolia)susceptible to defoliation by anthracnose, trees were injected with MIN-jet Copper and com-pared with two systemic fungicides that are labeled for trunk injection. In this unique study,we are interested in tree health response despite the presence of the causal agent. In previousinjection work, we observed trees superior recovery and higher health indices (including morerapid development of woundwood at the injection sites) compared to fungicide treatments.
Poster #4 illustrates the relative wound response in trees using Arborjet technology. Adigital assessment was developed to help the practitioner to rate wound response in trees.The scale uses a -1, 0, and +1 rating system, where ‘-1’ indicates wounds sites with cracking,oozing, ‘0’ indicates no observable response, and ‘+1’ is indicative of wound closure. Threefactors influence wound response: the tree species (including xylem anatomy and wood den-sity), the nature of the physical injury (methodology), and the formulation used (relativephytotoxicity).
Third Symposium on Hemlock Woolly Adelgid Posters
Eisenback et al. _______________________________________________________________________________
278
EFFECTS OF SYSTEMIC, SUBLETHAL DOSES OF IMIDACLOPRID ON TWO
PREDATORS OF HEMLOCK WOOLLY ADELGID
Brian M. Eisenback, Jeffrey G. Fidgen, Scott M. Salom and Loke T. Kok
Virginia Polytechnic Institute and State UniversityDepartment of Entomology, 216 Price Hall, Blacksburg, VA 24061-0319
ABSTRACT
Hemlock woolly adelgid (HWA), Adelges tsugae Annand, is an introduced pest of two nativehemlock species, eastern hemlock (Tsuga canadensis (L.) Carr.), and Carolina hemlock (T.caroliniana). Currently, chemical control is the most effective way to control HWA infesta-tions in accessible stands and on individual trees. Some of the most widely used pesticidesagainst HWA are imidacloprid-based products. Laricobius nigrinus Fender and Sasajiscymnustsugae Sasaji and McClure are two predator beetles being released in the eastern U.S. as bio-logical control agents of HWA. As the biological control agents establish themselves in theforests and as land managers implement chemical control of the pest it will be important tounderstand the interactions between the two agents and how to best apply them together inforest and landscape settings. This study examines non-target effects of the systemic applica-tions of imidacloprid on two important predators of HWA.
On April 23, 2004, 24 hemlocks on a private residence in Abingdon, Virginia, weretreated by the Mauget (J.J. Mauget Co. Arcadia, California) method. There were four treat-ments: full, half, and quarter rates of Imicide®, and an untreated control. Five weeks aftertreatments, HWA-infested foliage was fed to beetles in a no choice test, and beetle survivor-ship and appetite were observed. To monitor HWA populations on the trees, the proportionof 200 shoots infested with at least one HWA were measured before and after treatments. Todetermine imidacloprid levels in the trees, branches were dried, ground, and the imidaclopridextracted with solvent and measured with an Envirologix (Portland, Maine) ELISA test kit.
Prior to treatment, the proportion of shoots infested did not differ significantly betweentreatment groups, but were significant six months after treatment. The change of the propor-tion of shoots infested before and after treatments was significant between treatments. Con-trol and quarter proportions increased (46 and 17 percent respectively), while half and fullproportions both decreased 28 percent. Half and full treatments were comparable as theyboth reduced HWA populations to under 10% infestation.
Differences in beetle survival rates were not statistically significant between sexes, spe-cies, or their combination, so data were pooled by sex and species. Although the mean sur-vival rate for both predators was highest in the control treatment, means were not significantamong treatments. Mean survival rate after 10 days for L. nigrinus was 80% and S. tsugae was86%. Two possible explanations for the lack of significant differences among treatments arethat imidacloprid levels were not high enough at the time of the test or that treatments may
______________________________________________________________________________ Eisenback et al.
Posters Third Symposium on Hemlock Woolly Adelgid
279
not affect beetle feeding and mortality. Branches are being tested to determine theirimidacloprid levels at the time of the tests.
The total number of adelgids eaten did not differ significantly among treatments, spe-cies, or their combination. The amount of HWA eaten was significantly different betweensexes, with females eating more than males. S. tsugae males ate less than females but morethan L. nigrinus males. The amount of feeding seemed unaffected by treatments, althoughchemical levels at the time of the tests are still to be determined. Several follow-up experi-ments are planned for spring 2005. Choice tests will help determine whether beetles prefertreated or untreated adelgids. To test if adelgids are a means by which the predators can beexposed, untreated branches will be cut from trees and treated with high concentrations ofimidacloprid before beetles are placed on them. Also, predator eggs and larvae will be placedon treated branches to study survivorship and development. These experiments will shedmore light on managing infestations and the interactions of the biological and chemical con-trol of HWA.
KEYWORDS
Imidacloprid, Laricobius nigrinus, Sasajiscymnus tsugae.
Third Symposium on Hemlock Woolly Adelgid Posters
Ellison et al. __________________________________________________________________________________
280
CHANGES IN ANT COMMUNITY STRUCTURE AND COMPOSITION ASSOCIATED
WITH HEMLOCK DECLINE IN NEW ENGLAND
Aaron M. Ellison1, Jonathan Chen2, David Díaz1,Chelsea Kammerer-Burnham3, and Matthew Lau4
1Harvard University, Harvard Forest, Petersham, MA [email protected]
2Oberlin College, Department of Biology, Oberlin, OH 44074
3Clark University, Department of Biology, Worcester, MA 01610
4Humboldt State University, Department of Biological Sciences, Arcata, CA 95521
ABSTRACT
Impacts of invasive species on the structure of the invaded communities is an active area ofecological research, but the effects of the hemlock woolly adelgid (HWA) on forest organ-isms other than economically important timber trees rarely have been examined. To date,studies of HWA impacts principally have assessed mortality rates of hemlock and their sub-sequent replacement by early-successional hardwoods, and changes in core ecosystem prop-erties. However, if certain taxa are restricted to hemlock forests, or if dominance by hemlockprecludes the colonization or occurrence of particular species, then removal of hemlock couldresult in changes in overall species diversity and composition within HWA-infested standsand across the landscape. We examined this hypothesis for forest ant communities in south-ern New England. Specifically, we asked how ant species richness and composition differedamong intact hemlock stands, HWA-infested and damaged stands, and mid-successional hard-wood “controls.” In total, 22 species of ants were collected from 16 sites spread across Con-necticut and Massachusetts. Average species richness among sites ranged from three to 12(mean = 7), and was inversely related to the percent of hemlock basal area in the stand. Aver-age dissimilarity among sites was 73%; notably, Formica spp. were virtually absent from in-tact, uninfested hemlock stands. At the stand level, loss of hemlock due to HWA results in anincrease in ant species diversity, but this local increase in diversity is offset by homogeniza-tion of diversity across the landscape. The rate and impacts of colonization by Formica spp.into HWA-infested stands may alter ecosystem structure and dynamics in these forests andmerits further study.
KEYWORDS
Ants, diversity, hemlock woolly adelgid, New England, species richness.
__________________________________________________________________________________ Ellison et al.
Posters Third Symposium on Hemlock Woolly Adelgid
281
INTRODUCTION
Quantifying and predicting the impacts of invasive species on the structure and function ofcommunities is a major focus of ecological research (e.g., Vitousek 1986, Levine 2000, Crooks2002, Gurevitch and Padilla 2004). To date, studies of the impacts of the hemlock woollyadelgid (HWA) on eastern U.S. forests principally have assessed mortality rates of hemlockand their subsequent replacement by early-successional hardwoods (e.g., Lapin 1994, Orwigand Foster 1998, Bonneau et al. 1999, Mayer et al. 2002). Other studies have focused on eco-system changes attendant to loss of hemlock due to HWA (e.g., Jenkins et al. 1999, Orwigand Foster 2000, Stadler et al. 2005). However, if other taxa are restricted to hemlock forests,or if dominance by hemlock precludes the colonization or occurrence of certain species, thenremoval of hemlock could result in changes in overall species diversity and composition withinHWA-infested stands and across the landscape. However, studies of the impact of HWA onorganisms other than economically important timber trees in eastern forests are rare (Tingleyet al. 2002).
Here, we examine the changes in ant (Hymenoptera: Formicidae) community structureand composition occurring as HWA alters hemlock forests. Ants may be a useful indicatortaxon for the impact of HWA on other hemlock-associated communities for several reasons.Ants are abundant and diverse in eastern (U.S.) forests (Cole 1940, Gotelli and Ellison 2002);they interact with plants (e.g., Beattie and Culver 1981, Guo and Brown 1996) and inverte-brates (Buckley 1987, Cushing 1997); and they can both drive (e.g., Lyford 1963, Folgarait1998, MacMahon et al. 2000) and respond to (Johnson 1992) ecosystem processes. Ant com-munity structure changes in response to changes in plant community structure in deserts andgrasslands (e.g. Bestelmeyer 2005), and ants have been used as indicators of ecosystem degra-dation and successful rehabilitation in arid environments (e.g., Andersen et al. 2002).
As a first step to understanding how ant community structure could be affected byHWA impacts to hemlock forests, we examined how ant species richness and compositionvaried among intact hemlock stands, hemlock stands in varying states of degradation due toHWA and that have varying amounts of early-successional shrubs and hardwoods, and mid-successional deciduous stands – to which succession will proceed following the loss of hem-lock in New England. Our results have implications for managing anticipated changes inlocal and regional biodiversity associated with the impact of HWA on New England forests.The observed compositional changes in ant communities associated with loss of hemlock alsomay be associated with substantial changes in soil ecosystem processes.
METHODS
SITES
We sampled eight sites in Connecticut (CT) and eight sites in Massachusetts (MA). The CTsites are a subset of those surveyed by Orwig et al. (2002) for HWA damage in southern NewEngland, and are focal sites for studies of the impact of HWA on ecosystem processes (Jeftsand Orwig 2005). These sites were all dominated by hemlock, and mortality due to HWA inthese sites ranges from none to nearly 100% (Table 1). The MA sites were all 90 x 90 m plots
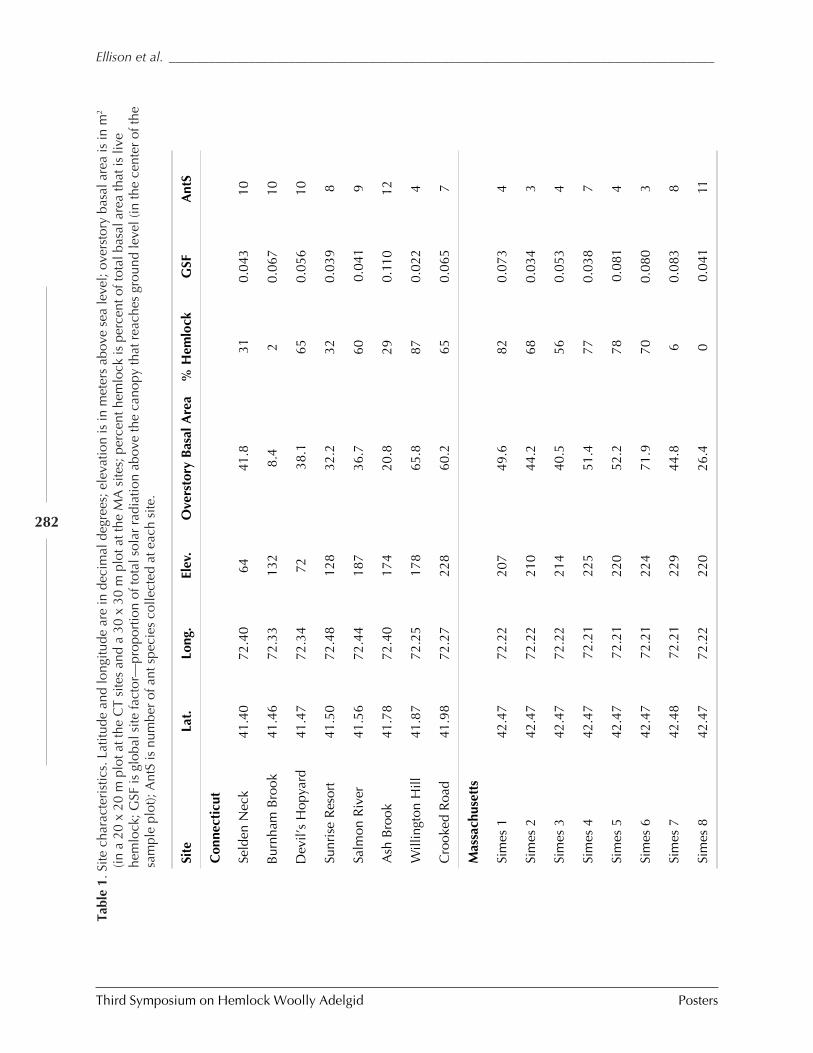
Third Symposium on Hemlock Woolly Adelgid Posters
Ellison et al. __________________________________________________________________________________
282
Site
Lat.
Long
.El
ev.
Ove
rsto
ry B
asal
Are
a%
Hem
lock
GSF
Ant
S
Con
nect
icut
Seld
en N
eck
41.4
072
.40
6441
.831
0.04
310
Bur
nham
Bro
ok41
.46
72.3
313
28.
42
0.06
710
Dev
il’s
Hop
yard
41.4
772
.34
7238
.165
0.05
610
Sunr
ise
Res
ort
41.5
072
.48
128
32.2
320.
039
8
Salm
on R
iver
41.5
672
.44
187
36.7
600.
041
9
Ash
Bro
ok41
.78
72.4
017
420
.829
0.11
012
Will
ingt
on H
ill41
.87
72.2
517
865
.887
0.02
24
Cro
oked
Roa
d41
.98
72.2
722
860
.265
0.06
57
Mas
sach
uset
ts
Sim
es 1
42.4
772
.22
207
49.6
820.
073
4
Sim
es 2
42.4
772
.22
210
44.2
680.
034
3
Sim
es 3
42.4
772
.22
214
40.5
560.
053
4
Sim
es 4
42.4
772
.21
225
51.4
770.
038
7
Sim
es 5
42.4
772
.21
220
52.2
780.
081
4
Sim
es 6
42.4
772
.21
224
71.9
700.
080
3
Sim
es 7
42.4
872
.21
229
44.8
60.
083
8
Sim
es 8
42.4
772
.22
220
26.4
00.
041
11
Tabl
e 1.
Site
cha
ract
eris
tics.
Lat
itude
and
long
itude
are
in d
ecim
al d
egre
es; e
leva
tion
is in
met
ers
abov
e se
a le
vel;
over
stor
y ba
sal a
rea
is in
m2
(in a
20
x 20
m p
lot a
t the
CT
site
s an
d a
30 x
30
m p
lot a
t the
MA
site
s; p
erce
nt h
emlo
ck is
per
cent
of t
otal
bas
al a
rea
that
is li
vehe
mlo
ck; G
SF is
glo
bal s
ite fa
ctor
—pr
opor
tion
of to
tal s
olar
rad
iatio
n ab
ove
the
cano
py th
at r
each
es g
roun
d le
vel (
in th
e ce
nter
of t
hesa
mpl
e pl
ot);
Ant
S is
num
ber
of a
nt s
peci
es c
olle
cted
at e
ach
site
.
__________________________________________________________________________________ Ellison et al.
Posters Third Symposium on Hemlock Woolly Adelgid
283
located within the Simes Tract at the Harvard Forest. These plots are scheduled for experi-mental manipulations (logging, girdling to simulate slow death due to HWA, or no treat-ment) in 2005; plots 1-6 are in stands dominated by hemlock, whereas plots 7 and 8 are mid-successional hardwood “controls” (Barker-Plotkin et al. 2004). As of summer 2004, HWAhad been found in two of the Simes plots (plots 5 and 6), but no impacts on tree vigor had yetbeen observed (Diana Barszcz and Scott Costa, pers. obs.).
ANT SAMPLING
We used standard methods for sampling diversity of ground-nesting ants (Agosti and Alonso2000). At each site, we established a square grid of 25 pitfall traps (20 x 20 m with 5 m spacingin CT; 10 x 10 m with 2.5 m spacing in MA). Each pitfall trap consisted of a 95mm-diameterplastic cup filled with 20 mm of dilute soapy water. Traps were buried so that the upper lip ofeach trap was flush with the surface of the substrate, and left in place for 48 hours during dryweather. Trap contents were fixed in the field in 95% EtOH. After the pitfall traps werecollected, we removed the traps, refilled the holes, and set out a grid of 25 bait stations eachconsisting of 50 g of Pecan Sandies on a 12.5 x 7 cm index card. Baits were allowed to accumu-late ants for 1 hour in the middle of the day, and then representative individuals were col-lected with a suction aspirator. We also collected 3 1-liter leaf litter samples from each gridand sifted them in the field to collect litter-dwelling ants. Finally, we actively searched in andaround each grid for 1 hour and hand-collected any ants that were found on the substrate, inthe leaf litter, or on low-growing vegetation. At each site, two complete ant surveys (pitfalls,baits, litter, and hand-samples) were conducted separated by approximately 42 days. Thesame grids were re-sampled in the second survey. The CT sites were sampled in June–August,2004, and the MA sites were sampled in July and August in both 2003 and 2004 (with onlyone sample in 2004). All ants were identified to species; identifications were confirmed byStefan Cover of the Museum of Comprative Zoology.
VEGETATION SAMPLING
To obtain an “ant’s-eye” view of the vegetation at each site, we recorded the number of stemsof all herbs and shrubs in 50 x 50 cm square quadrats centered on each pitfall trap. We sampledvegetation in mid-July, the peak of the growing season, to ensure that we recorded the vastmajority of both early and late emerging plants. In addition, diameter at breast height (DBH)of all trees greater than 5 cm DBH in each grid was also recorded. Total basal area and percentbasal area in hemlock were determined from these data.
CANOPY MEASUREMENTS
Available light levels beneath the forest canopy were estimated from hemispherical canopyphotographs, which were taken after full leaf flush of the canopy at each site. Photographswere taken 1 m above ground level using an 8mm fish-eye lens on a Nikon F-3 camera. Al-though this does not precisely correspond to an ants-eye view at ground level, differencesamong sites in ground-level light interception are closely correlated with these measurements(Chazdon and Field 1987, Rich et al. 1993). The camera was leveled and oriented to magneticnorth for each photograph. Images were digitized at 300dpi and analyzed using HemiView3.1 (Delta-T, Cambridge, United Kingdom). We summed weighted values of direct site factor
Third Symposium on Hemlock Woolly Adelgid Posters
Ellison et al. __________________________________________________________________________________
284
(DSF) ( total direct beam solar radiation) and indirect site factor (total diffuse solar radiation)to compute a global site factor (GSF) (total solar radiation) for each forest site (Rich et al.1993). GSF values are expressed as percent of total possible solar radiation (i.e., above thecanopy) during the growing season (April through October), corrected for latitude and solartrack.
RESULTS
In total, 22 species of ants in three subfamilies were collected across the 16 sites (Figure 1). Ofthese, four are common generalist species of eastern forests (Camponotus pennsylvanicus (deGeer), Aphaenogaster rudis (Enzmann) s.l., Temnothorax longispinosus (Roger), and Myrmicapunctiventris (Roger)) and four are southern species near their northern range boundary(Prenolepis impairs (Say), Acanthomyops interjectus (Mayr), Camponotus chromaiodes Bolton,and Stenamma schmitti Wheeler). The average species richness (á-diversity) at a site was 7species, and ranged from 3 to 12 species (Table 1). The average pair-wise Jaccard dissimilarity(one measure of landscape-level, or β-diversity) among sites was 0.73 (range = 0.2 – 0.93),indicating substantial differences among sites.
Ant species richness was lowest in dense hemlock stands and increased significantly ashemlock basal area declined (Table 1, Figure 2). This change in species richness appears to bean actual effect of hemlock, as ant species richness was not significantly associated with other,potentially confounding factors, including latitude (P = 0.19), elevation (P = 0.33), or richness(number of species) and diversity (Simpson’s index) of understory vegetation (P = 0.07).
The increase in species richness in early-successional mixed stands of shrubs and hard-woods (CT stands impacted by HWA) and in mid-successional (80-125 year-old) deciduousstands (MA stands without HWA) was due almost entirely to the occurrence in these standsof Formica spp., which were entirely absent in dense hemlock stands. This pattern is indepen-dent of subgenera: Formica aserva Forel (subgenus sanguniea) is an actively-foraging, slave-making ant. The similarly active Formica neogagates Viereck (subgenus neogagates) formssmall colonies. Formica subsericea Say and F. subaenescens Emery (both subgenus fusca) aregeneralists and somewhat less active foragers. As with the overall relationship between spe-cies richness and hemlock basal area, the effect on Formica appears to be an actual effect ofhemlock, as there was no consistent relationship with insolation (P = 0.73) – an otherwisecommon driver of ant activity (Figure 3).
DISCUSSION
We examined changes in ant diversity and composition in stands with a known history ofHWA impact (the CT stands) (Orwig et al. 2002), in stands so far undamaged by HWA(Simes plots 1-6 in MA), and in mid-successional hardwood stands (Simes plots 7-8 in MA)that represent the anticipated stand structure 80-100 years from now, after HWA has elimi-nated hemlock from our landscape (Barker-Plotkin et al. 2004). At the stand level, a shift fromhemlock to hardwood resulted in an increase in ant species diversity (Figure 2). Because geo-graphic (latitude and elevation) or habitat (understory vegetation structure, composition, andinsolation) did not significantly affect ant species richness, we conclude that the low levels of
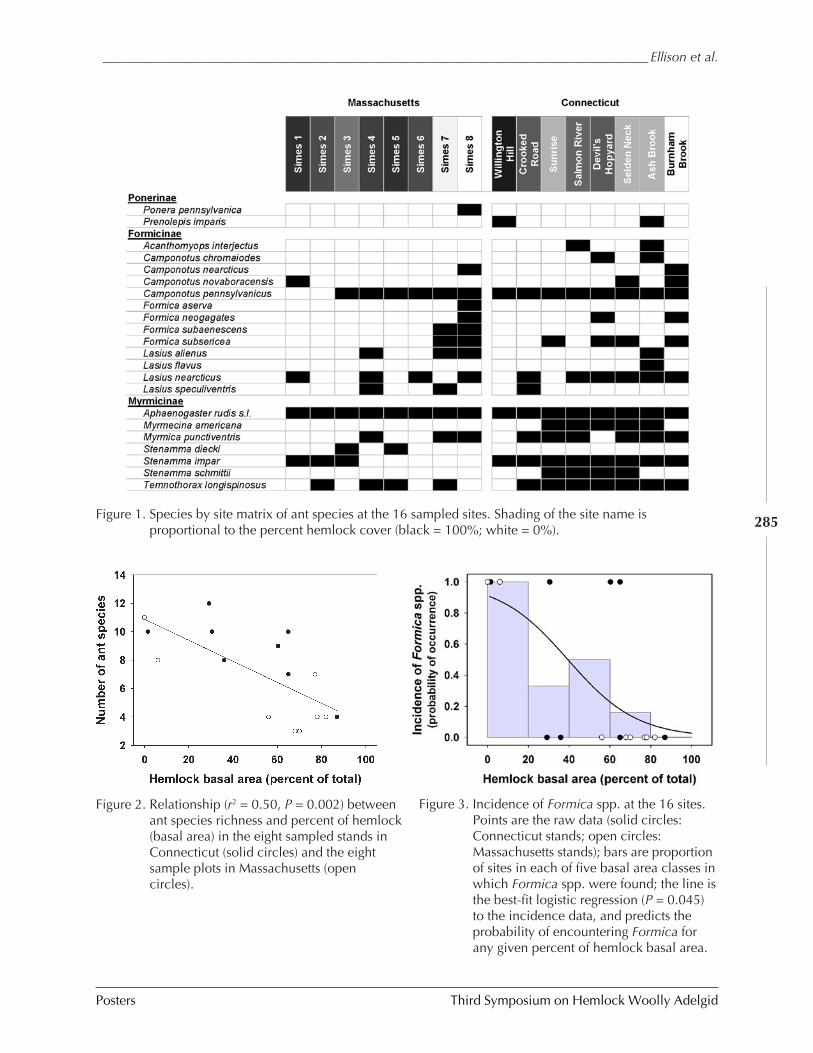
__________________________________________________________________________________ Ellison et al.
Posters Third Symposium on Hemlock Woolly Adelgid
285
Figure 3. Incidence of Formica spp. at the 16 sites.Points are the raw data (solid circles:Connecticut stands; open circles:Massachusetts stands); bars are proportionof sites in each of five basal area classes inwhich Formica spp. were found; the line isthe best-fit logistic regression (P = 0.045)to the incidence data, and predicts theprobability of encountering Formica forany given percent of hemlock basal area.
Figure 1. Species by site matrix of ant species at the 16 sampled sites. Shading of the site name isproportional to the percent hemlock cover (black = 100%; white = 0%).
Figure 2. Relationship (r2 = 0.50, P = 0.002) betweenant species richness and percent of hemlock(basal area) in the eight sampled stands inConnecticut (solid circles) and the eightsample plots in Massachusetts (opencircles).
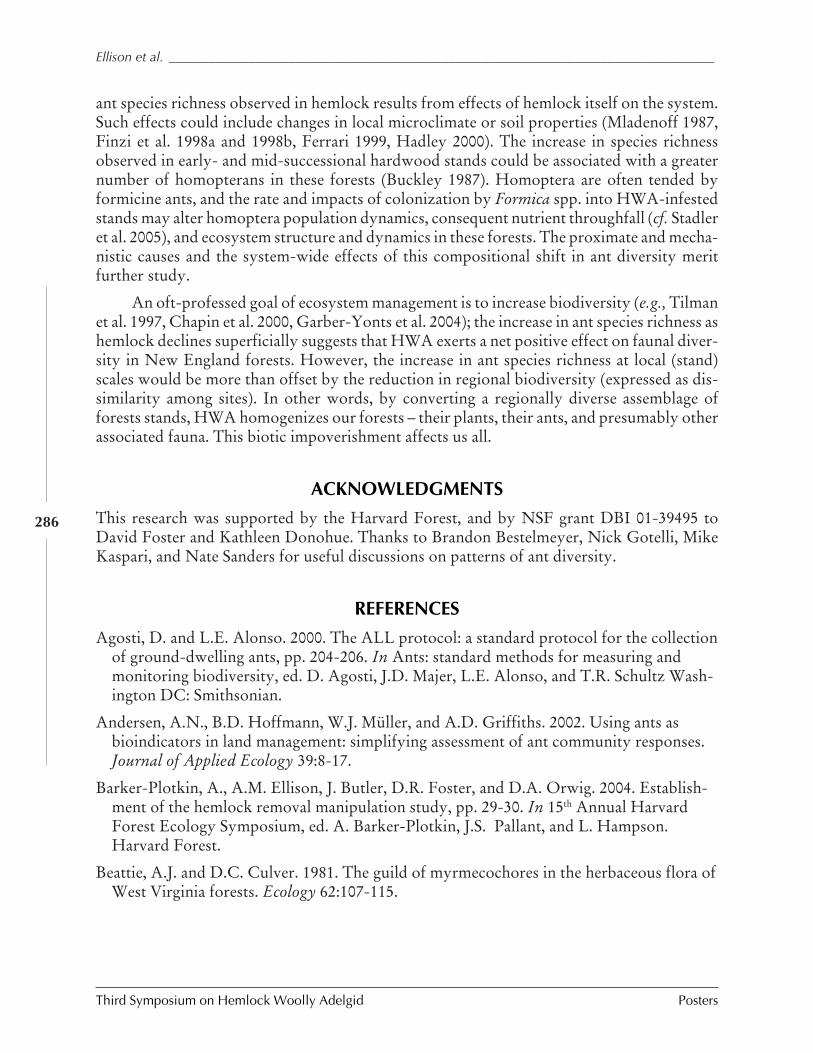
Third Symposium on Hemlock Woolly Adelgid Posters
Ellison et al. __________________________________________________________________________________
286
ant species richness observed in hemlock results from effects of hemlock itself on the system.Such effects could include changes in local microclimate or soil properties (Mladenoff 1987,Finzi et al. 1998a and 1998b, Ferrari 1999, Hadley 2000). The increase in species richnessobserved in early- and mid-successional hardwood stands could be associated with a greaternumber of homopterans in these forests (Buckley 1987). Homoptera are often tended byformicine ants, and the rate and impacts of colonization by Formica spp. into HWA-infestedstands may alter homoptera population dynamics, consequent nutrient throughfall (cf. Stadleret al. 2005), and ecosystem structure and dynamics in these forests. The proximate and mecha-nistic causes and the system-wide effects of this compositional shift in ant diversity meritfurther study.
An oft-professed goal of ecosystem management is to increase biodiversity (e.g., Tilmanet al. 1997, Chapin et al. 2000, Garber-Yonts et al. 2004); the increase in ant species richness ashemlock declines superficially suggests that HWA exerts a net positive effect on faunal diver-sity in New England forests. However, the increase in ant species richness at local (stand)scales would be more than offset by the reduction in regional biodiversity (expressed as dis-similarity among sites). In other words, by converting a regionally diverse assemblage offorests stands, HWA homogenizes our forests – their plants, their ants, and presumably otherassociated fauna. This biotic impoverishment affects us all.
ACKNOWLEDGMENTS
This research was supported by the Harvard Forest, and by NSF grant DBI 01-39495 toDavid Foster and Kathleen Donohue. Thanks to Brandon Bestelmeyer, Nick Gotelli, MikeKaspari, and Nate Sanders for useful discussions on patterns of ant diversity.
REFERENCES
Agosti, D. and L.E. Alonso. 2000. The ALL protocol: a standard protocol for the collectionof ground-dwelling ants, pp. 204-206. In Ants: standard methods for measuring andmonitoring biodiversity, ed. D. Agosti, J.D. Majer, L.E. Alonso, and T.R. Schultz Wash-ington DC: Smithsonian.
Andersen, A.N., B.D. Hoffmann, W.J. Müller, and A.D. Griffiths. 2002. Using ants asbioindicators in land management: simplifying assessment of ant community responses.Journal of Applied Ecology 39:8-17.
Barker-Plotkin, A., A.M. Ellison, J. Butler, D.R. Foster, and D.A. Orwig. 2004. Establish-ment of the hemlock removal manipulation study, pp. 29-30. In 15th Annual HarvardForest Ecology Symposium, ed. A. Barker-Plotkin, J.S. Pallant, and L. Hampson.Harvard Forest.
Beattie, A.J. and D.C. Culver. 1981. The guild of myrmecochores in the herbaceous flora ofWest Virginia forests. Ecology 62:107-115.
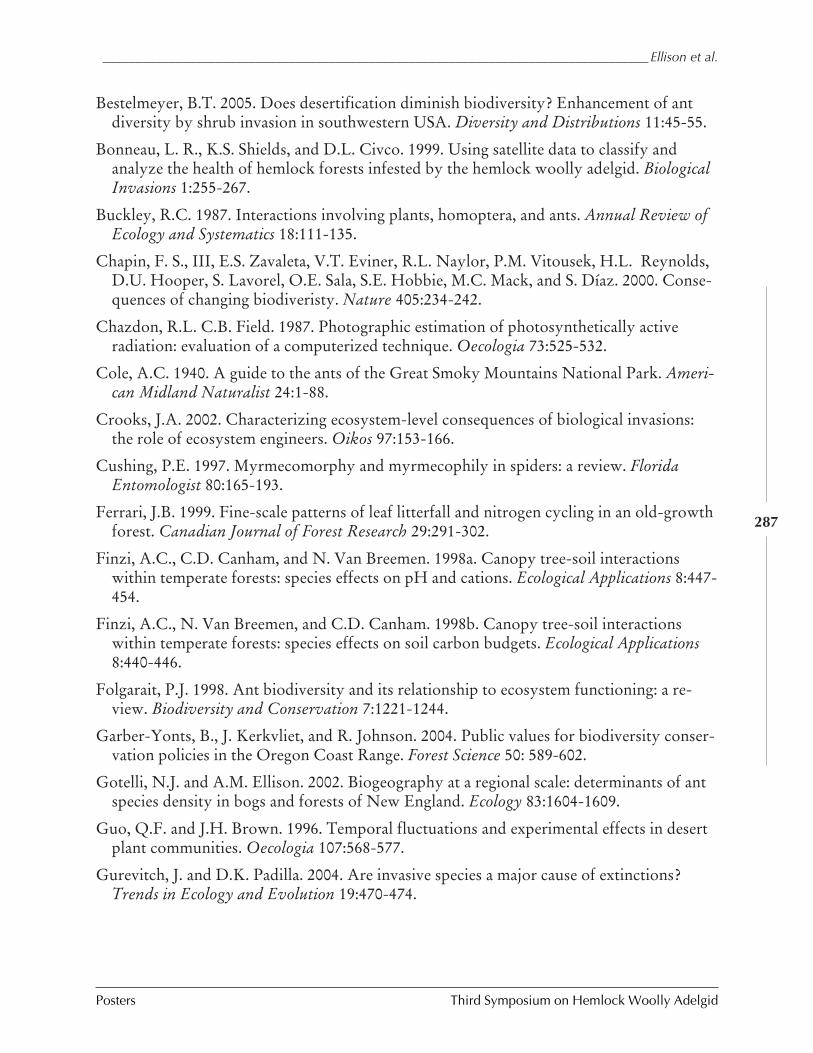
__________________________________________________________________________________ Ellison et al.
Posters Third Symposium on Hemlock Woolly Adelgid
287
Bestelmeyer, B.T. 2005. Does desertification diminish biodiversity? Enhancement of antdiversity by shrub invasion in southwestern USA. Diversity and Distributions 11:45-55.
Bonneau, L. R., K.S. Shields, and D.L. Civco. 1999. Using satellite data to classify andanalyze the health of hemlock forests infested by the hemlock woolly adelgid. BiologicalInvasions 1:255-267.
Buckley, R.C. 1987. Interactions involving plants, homoptera, and ants. Annual Review ofEcology and Systematics 18:111-135.
Chapin, F. S., III, E.S. Zavaleta, V.T. Eviner, R.L. Naylor, P.M. Vitousek, H.L. Reynolds,D.U. Hooper, S. Lavorel, O.E. Sala, S.E. Hobbie, M.C. Mack, and S. Díaz. 2000. Conse-quences of changing biodiveristy. Nature 405:234-242.
Chazdon, R.L. C.B. Field. 1987. Photographic estimation of photosynthetically activeradiation: evaluation of a computerized technique. Oecologia 73:525-532.
Cole, A.C. 1940. A guide to the ants of the Great Smoky Mountains National Park. Ameri-can Midland Naturalist 24:1-88.
Crooks, J.A. 2002. Characterizing ecosystem-level consequences of biological invasions:the role of ecosystem engineers. Oikos 97:153-166.
Cushing, P.E. 1997. Myrmecomorphy and myrmecophily in spiders: a review. FloridaEntomologist 80:165-193.
Ferrari, J.B. 1999. Fine-scale patterns of leaf litterfall and nitrogen cycling in an old-growthforest. Canadian Journal of Forest Research 29:291-302.
Finzi, A.C., C.D. Canham, and N. Van Breemen. 1998a. Canopy tree-soil interactionswithin temperate forests: species effects on pH and cations. Ecological Applications 8:447-454.
Finzi, A.C., N. Van Breemen, and C.D. Canham. 1998b. Canopy tree-soil interactionswithin temperate forests: species effects on soil carbon budgets. Ecological Applications8:440-446.
Folgarait, P.J. 1998. Ant biodiversity and its relationship to ecosystem functioning: a re-view. Biodiversity and Conservation 7:1221-1244.
Garber-Yonts, B., J. Kerkvliet, and R. Johnson. 2004. Public values for biodiversity conser-vation policies in the Oregon Coast Range. Forest Science 50: 589-602.
Gotelli, N.J. and A.M. Ellison. 2002. Biogeography at a regional scale: determinants of antspecies density in bogs and forests of New England. Ecology 83:1604-1609.
Guo, Q.F. and J.H. Brown. 1996. Temporal fluctuations and experimental effects in desertplant communities. Oecologia 107:568-577.
Gurevitch, J. and D.K. Padilla. 2004. Are invasive species a major cause of extinctions?Trends in Ecology and Evolution 19:470-474.
Third Symposium on Hemlock Woolly Adelgid Posters
Ellison et al. __________________________________________________________________________________
288
Hadley, J.L. 2000. Understory microclimate and photosynthetic response of saplings in anold-growth eastern hemlock (Tsuga canadensis L.) forest. Écoscience 7:66-72.
Jefts, S. and D.A. Orwig. 2005. The effects of HWA outbreaks on ecosystem level changesin southern New England. In Proceedings of the Third Symposium on Hemlock WoollyAdelgid in the Eastern United States, ed. R. Onken and R. Reardon. FHTET-2005-01.USDA Forest Service, Morgantown, West Virginia.
Jenkins, J.C., J.D. Aber, and C.D. Canham. 1999. Hemlock woolly adelgid impacts oncommunity structure and N cycling rates in eastern hemlock forests. Canadian Journalof Forest Research 29:630-645.
Johnson, R.A. 1992. Soil texture as an influence on the distribution of the desert seed-harvester ants Pogonomyrmex rugosus and Messor pergandei. Oecologia 89:118-124.
Lapin, B. 1994. The impact of hemlock woolly adelgid on resources in the lower Connecti-cut River valley, pp. 1-45. US Forest Service Report FS-6200-28b(3/92).
Levine, J.M. 2000. Species diversity and biological invasions: relating local process to com-munity pattern. Science 288:852-854.
Lyford, W.H. 1963. Importance of ants to brown podzolic soil genesis in New England,pp. 1-18. Harvard Forest Paper 7.
MacMahon, J.A., J.F. Mull, and T.O. Crist. 2000. Harvester ants (Pogonomyrmex spp.):their community and ecosystem influences. Annual Review of Ecology and Systematics31:265-291.
Mayer, M., R. Chianese, T. Scudder, J. White, K. Vongpaseuth, and R. Ward. 2002. Thir-teen years of monitoring the hemlock woolly adelgid in New Jersey forests, pp. 50-60. InProceedings: Hemlock woolly adelgid in the eastern United States symposium, ed. B.Onken and R. Reardon. New Jersey: Rutgers.
Mladenoff, D.J. 1987. Dynamics of nitrogen mineralization and nitrification in hemlockand hardwood treefall gaps. Ecology 68:1171-1180.
Orwig, D.A. D.R. Foster. 1998. Forest response to the introduced hemlock woolly adelgidin southern New England, USA. Journal of the Torrey Botanical Society 125:60-73.
Orwig, D. A. and D.R. Foster. 2000. Stand, landscape, and ecosystem analyses of hemlockwoolly adelgid outbreaks in southern New England: an overview, pp. 123-125. In Pro-ceedings: Symposium on sustainable management of hemlock ecosystems in easternNorth America, ed. K.A. McManus, K.S. Shields, and D.R. Souto. Pennsylvania: USDAForest Service.
Orwig, D.A., D.R. Foster, D.L. Mausel. 2002. Landscape patterns of hemlock decline inNew England due to the introduced hemlock woolly adelgid. Journal of Biogeography29:1475-1488.
Rich, P.M., D.B. Clark, D.A. Clark, and S.F. Oberbauer. 1993. Long-term study of solarradiation regimes in a tropical wet forest using quantum sensors and hemisphericalphotography. Agricultural and Forest Meteorology 65:107-127.
__________________________________________________________________________________ Ellison et al.
Posters Third Symposium on Hemlock Woolly Adelgid
289
Stadler, B., T. Müller, D. Orwig, and R. Cobb. 2005. Hemlock woolly adelgid: transform-ing ecosystem processes and landscapes. Ecosystems (in press).
Tilman, D., J. Knops, D. Wedin, P. Reich, M. Ritchie, and E. Siemann. 1997. The influenceof functional diversity and composition on ecosystem processes. Science 277:1300-1302.
Tingley, M.W., D.A. Orwig, G. Motzkin, D.R. Foster, and R. Field. 2002. Avian responseto removal of a forest dominant: consequences of hemlock woolly adelgid infestations.Journal of Biogeography 29:1505-1516.
Vitousek, P.M. 1986. Biological invasions and ecosystem properties: can species make adifference? pp. 163-178. In Ecology of biological invasions of North America andHawai’i, ed. H.A. Mooney and J.A. Drake. NY: Springer.
Third Symposium on Hemlock Woolly Adelgid Posters
Flowers et al. _________________________________________________________________________________
290
COMPETITIVE INTERACTIONS AMONG TWO BIOLOGICAL CONTROL AGENTS OF
HEMLOCK WOOLLY ADELGID AND AN ESTABLISHED GENERALIST PREDATOR INSOUTHWESTERN VIRGINIA
Robbie W. Flowers, Scott M. Salom, and Loke T. Kok
Department of Entomology, Virginia Polytechnic and State UniversityBlacksburg, VA 24061-0319
ABSTRACT
Classical biological control using prey-specific predators is currently underway to managehemlock woolly adelgid (HWA) in the eastern United States. Laricobius nigrinus Fender andSasajiscymnus (=Pseudoscymnus) tsugae Sasaji and McClure are prey-specific predators withgood phenological synchrony with HWA. Harmonia axyridis Pallas, a highly polyphagousand voracious predator, previously introduced for biological control of various homopteranpests, is now commonly found in association with HWA in the southeastern United States.Competitive interactions among species utilizing the same resource at the same time can leadto reductions in predator diversity and decrease the efficacy of biological control. Therefore,we examined interactions among these three species in two hemlock stands in southwesternVirginia.
Adult female predators were enclosed in sleeve cages on infested hemlock branches for6 weeks (April-May, 2003-04) at a high and low elevation hemlock stand in southwesternVirginia. Ten eastern hemlocks (20-40 year) were selected at each site that had densities of 3-4 HWA/cm. Predators were evaluated during the winter (sistens) generation of HWA, aloneand in two- and three-predator conspecific or heterospecific groupings. Predator survivalwas assessed as the number of live predators at the end of each trial. Consumption of theHWA winter generation (sistens), impact on the spring generation (progrediens), and netreproduction for each predator was evaluated for 200 cm of branch clippings per enclosure.HWA densities on branches without predators were used as a control. Survival was analyzedusing logistic regression. Predator feeding, impact, and net reproduction were analyzed usingtwo-way ANOVA. Independent categorical variables for both models included species com-bination, site, and their interaction. Results were considered significant at the 5% probabilitylevel.
Survival by all predator species was not significantly affected by predator combinationor site. Intra- and interspecific predation by L. nigrinus or S. tsugae was not observed andmay be due to biological constraints (such as host specificity) or experimental conditions(such as high HWA densities). Intra- and interspecific predation by H. axyridis is well docu-mented, but was not observed in our studies. Previous observations suggest it to be inverselyrelated to prey density in this species. Its absence in our studies may be due to high HWAdensities, avoidance behaviors, or temporal or spatial asynchrony among these species.
________________________________________________________________________________ Flowers et al.
Posters Third Symposium on Hemlock Woolly Adelgid
291
Predator feeding on the winter (sistens) generation of HWA and their impact on thefollowing spring (progrediens) generation was significantly different by species combinationand site. Among individual predators, L. nigrinus and H. axyridis had greater feeding overallthan S. tsugae. This may due to L. nigrinus being adapted to lower temperatures and to thelarger body size and voracity of H. axyridis. Feeding was significantly greater for all speciesin two- and three-predator conspecific and heterospecific combinations. This suggests thatpredator interactions did not significantly interfere with feeding activity. Feeding was greaterat the low elevation site, and this may be related to the higher mean temperatures found atthat site. Similarly, an individual predator, L. nigrinus had much greater impact than H.axyridis or S. tsugae on reducing the number of developing progrediens in the next genera-tion. This may be attributed to the large number of larvae produced during the trial, whichdisturbed and consumed many HWA ovisacs. The other species fed mainly on sistens adultsthat had already laid their eggs. L. nigrinus and H. axyridis had significantly greater impact inconspecific groupings and with one another, while heterospecific grouping with S. tsugae didnot increase their impact. However, further research is necessary to determine the density ofpredators, alone or in combination, that will maintain HWA densities below injury levels.Impact was greater at the high elevation site, and this may be attributed to increased HWAmortality at the lower temperatures found there. All predator treatments had greater feedingand impact than no-predator control branches.
Net reproduction by L. nigrinus and H. axyridis was significantly different by speciescombination and site. As an individual species, L. nigrinus had very high net reproductionwhen alone or with conspecifics in comparison to the other species. Immature stages werealso further advanced, developmentally, than the other species. Since L. nigrinus has a muchlower developmental threshold, they may have been able to continue reproduction at the lowtemperatures of early spring. Low reproductive output by S. tsugae and H. axyridis may beattributed to higher temperature requirements or prey quality. Competitive interference byconspecifics was observed for all species to varying degrees. For L. nigrinus and S. tsugae, thiswas detected by lower-than-expected results with conspecifics. Interference was the mostpronounced for H. axyridis. Previous studies indicate that indirect interference, in the formof fecal cues or oviposition-deterring pheromones, as well as direct interference, such as throughegg cannibalism, occur in this species. Similar mechanisms may be present in the two prey-specific species, but this requires further investigation. In contrast, no significant predatorinterference was detected in heterospecific groupings. This may be attributed to prey speci-ficity by L. nigrinus and S. tsugae, the abundance of HWA provided, or the occurrence ofdifferent ovipositional strategies that may have served to reduce resource competition. Netreproduction was also greater at the low elevation site, and this may again be related to thehigher mean temperatures found there.
The lack of strong seasonal synchrony for these species may limit competitive effects infield populations. For L. nigrinus, there may be limited overlap with other predators due totheir earlier spring activity and development. However, S. tsugae may be at greater risk dueto their later spring development, which overlaps with the presence of many generalist preda-tors. Implications for management include applying low-density releases of the biologicalcontrol agents to reduce the potential for conspecific interference and rapid dispersal. Further
Third Symposium on Hemlock Woolly Adelgid Posters
Flowers et al. _________________________________________________________________________________
292
studies are warranted to examine both direct and indirect mechanisms of competition, theexistence of avoidance strategies, and the degree of natural dispersal (i.e. immigration andemigration) of these species in hemlock stands.
KEYWORDS
Laricobius nigrinus, Sasajiscymnus (=Pseudoscymnus) tsugae, Harmonia axyridis, biologicalcontrol.
________________________________________________________________________________ Graham et al.
Posters Third Symposium on Hemlock Woolly Adelgid
293
HEMLOCK ECOSYSTEMS AND SPATIAL PATTERNS OF ADELGES TSUGAE
INFESTATION IN NORTHWESTERN NORTH CAROLINA
James Graham, Gary Walker, Ray Williams,Zack Murrell, and Arthur Rex
Appalachian State University, Boone, North Carolina
ABSTRACT
Hemlock (Tsuga spp.) ecosystems and associated plant assemblages are at risk of de-cline across the Southern Appalachians. Grandfather Mountain, Linville, Lutherock, andnorthern Watauga County in North Carolina harbor excellent examples of these ecosystems.If not suppressed, the hemlock woolly adelgid (HWA), Adelges tsugae Annand, may facili-tate the destruction of native hemlocks in the region. The goals of this project are: 1) identifybiotic and abiotic interrelationships within hemlock ecosystems, 2) assist the surroundingcommunities in employing an effective system for conserving biodiversity in hemlock eco-systems using a geographic information system (GIS), and 3) develop a methodology forpermanently monitoring hemlock ecosystems. Study sites are located within 20 hemlockforests in five localities to maximize combinations of age, elevation, slope, and aspect. Sur-veys were conducted at these sites using the North Carolina Vegetation Survey methodol-ogy, with the addition of woody seedling surveys, arthropod inventories, and age class analy-sis. The results indicate there were unique plant assemblages within these hemlock ecosys-tems. Preliminary data suggests that high HWA infestation levels within these ecosystemsoccurred in areas closest to roads and streams. Plots at the highest elevations had lower HWAinfestation levels than those at lower elevations. Results from this study can be used as areference by researchers, land managers, and conservationists to prioritize Southern Appala-chian hemlock forests for conservation and/or restoration.
KEYWORDS
Tsuga, hemlock, adelgid, ecosystem, Southern Appalachians.
INTRODUCTION
The diversity of plant assemblages in the Southern Appalachians is strongly influenced byelevation and moisture (Braun 1950, Whittaker 1956). Within the Southern Appalachians,the hemlock ecosystems of northwestern North Carolina are exceptional because they pro-vide unique niches for a diversity of flora and fauna. Only a few scattered fragments ofundisturbed or old-growth ecosystems still remain in the region. Grandfather Mountain,Linville, Lutherock, and northern Watauga County in North Carolina harbor excellent ex-amples of these ecosystems. If not suppressed, the hemlock woolly adelgid (HWA), Adelges
Third Symposium on Hemlock Woolly Adelgid Posters
Graham et al._________________________________________________________________________________
294
tsugae Annand may facilitate the destruction of these native hemlocks. In order to facilitatethe present management techniques and restoration efforts we must understand the composi-tion and design of the hemlock ecosystems in northwestern North Carolina in part by askingthese questions: 1) What are some ecological indicators that differ between healthy and de-clining hemlock ecosystems? 2) How do species richness, basal area, importance values, andsoils vary within or among these ecosystems? 3) Are roads and streams the important vectorsof HWA transmission? 4) What elevations are HWA infestation levels highest? The specificgoals of this project are to: 1) identify biotic and abiotic interrelationships by gathering baselineecological information within hemlock ecosystems of northwestern North Carolina, 2) As-sist surrounding communities in employing an effective system for conserving biodiversity inhemlock ecosystems using a geographic information system (GIS), and 3) Develop a method-ology for permanently monitoring hemlock ecosystems.
MATERIALS AND METHODS
This study identified, classified, and mapped the patterns of infestation and mortality of hem-locks due to HWA. This project collected data both in the field and in the laboratory regard-ing the vegetation structure of hemlock ecosystems. A total of 16 permanent plots at five siteshave been analyzed. Surveys on four additional plots will be performed by spring 2005. Allsites were located on private lands within Avery and Watauga counties, North Carolina. Thefive sites surveyed were Linville (LINN), Grandfather Mountain (GFM), Appalachian StateUniversity Tater Hill Bog (THB), Appalachian State University Gilley Property (GP), andLutherock Camp (LR). Plot site selection and data collection followed the North CarolinaVegetation Survey Protocol (Peet et al. 1998) (Figure 1). Individual hemlock trees withinpermanent plots were monitored for HWA, measured diameter at breast height (DBH) incentimeters, estimated height, and estimated amount of defoliation (Mausel 2003). The com-position of hemlock forests was compared to the composition of similar forests in the South-ern Appalachians. Infestation was monitored by sampling hemlock limbs in fall of 2004.Sampling will occur again in 2005. Plot environmental variables were derived from 10-meterresolution digital elevation model (DEM) using ArcGIS 9.0 software. We analyzed streamsand roads at a scale of 1:250,000 using data from the Southern Appalachian Assessment (SAA)GIS database (Herman 1996). The landscape survey of plots was conducted with rigorousfield work, GIS, and remote sensing techniques.
RESULTS
A total of 16 hemlock plots were surveyed (Table 1). Hemlock woolly adelgid (HWA) oc-curred in 81% of the plots. Infestation levels ranged from 0 (no infestation) to 4 (heavyinfestation). The average infestation level for all plots surveyed was 1.94 (light infestation).The elevation of plots ranged from 996 m at GP3 to 1348 m at GFM3. Average elevation was1175 m. Slope of the plots ranged from 1° at GP4 to 34° in LINN1. Average slope was 17°.The minimum distance to a stream was 73 m at LINN1. The maximum distance to a streamwas 1348 m at GFM3. Average distance to a stream was 466 m. The minimum distance to aroad was 74 m at LINN1. The maximum distance to a road was 1177 m at GFM3. The
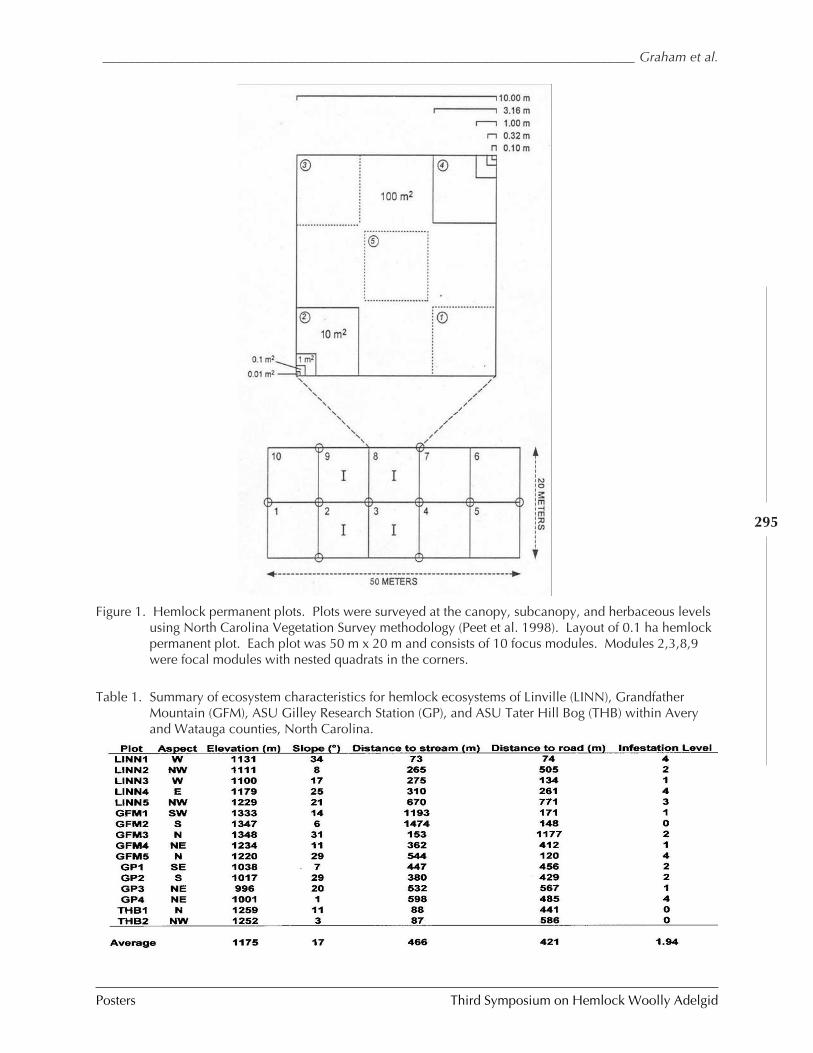
________________________________________________________________________________ Graham et al.
Posters Third Symposium on Hemlock Woolly Adelgid
295
Figure 1. Hemlock permanent plots. Plots were surveyed at the canopy, subcanopy, and herbaceous levelsusing North Carolina Vegetation Survey methodology (Peet et al. 1998). Layout of 0.1 ha hemlockpermanent plot. Each plot was 50 m x 20 m and consists of 10 focus modules. Modules 2,3,8,9were focal modules with nested quadrats in the corners.
Table 1. Summary of ecosystem characteristics for hemlock ecosystems of Linville (LINN), GrandfatherMountain (GFM), ASU Gilley Research Station (GP), and ASU Tater Hill Bog (THB) within Averyand Watauga counties, North Carolina.
Third Symposium on Hemlock Woolly Adelgid Posters
Graham et al._________________________________________________________________________________
296
average distance to a road was 421 m. Preliminary data suggested that high HWA infestationlevels occurred in areas closest to roads and streams. Plots surveyed at the highest elevationshad lower HWA infestation levels than those at lower elevations.
IMPLICATIONS OF THIS STUDY
Hemlock woolly adelgid (HWA) is responsible for hemlock decline in northwestern NorthCarolina. Suppression of HWA and the future of hemlock ecosystems in the Southern Appa-lachians will depend on a mixture of biological control agents and efficient use of insecticides.Early detection and unfavorable climate may assist the suppression of HWA populations inthe near future. This study will provide better estimates of habitats vulnerable to HWAinfestation and may contribute to protection of this unique ecosystem. Our baseline data canpotentially facilitate identification of areas conducive for the release of predator beetles onHWA. The examination of hemlock ecosystems and HWA may furthermore prove con-structive for monitoring potential biological impacts of hemlock decline on mammal, avian,amphibian, aquatic, and herbaceous plant communities throughout the Southern Appala-chians.
Regardless of our ability to reconstruct forest composition through modeling, there is nosubstitute for long-term forest data. Data will be used in an effort to facilitate future ecosys-tem restoration, land and pest management decisions, and to efficiently conserve hemlockforests that are aesthetically and ecologically the most important to the region.
ACKNOWLEDGEMENTS
Appalachian State University Department of Biology and Graduate School, Blue Ridge Re-source, Conservation, and Development, Mr. and Mrs. James R. Graham.
REFERENCES
Braun, E.L. 1950. Deciduous forests of eastern North America. Haefner Publishing Co.New York, New York. 326 p.
Mausel, D.L. 2003. Protocol for choosing Laricobius nigrinus release trees and data collec-tion. Unpublished protocol. Virginia Polytechnic Institute and State University. 3 p.
Herman, K.A. (ed.). 1996. Southern Appalachian Assessment (SAA) GIS database.Streams, 1: 250,000; Roads, 1: 250,000. SAMAB. Norris, Tennessee.
Peet, R.K. T.R. Wentworth, and P.S. Smith. 1998. A flexible multipurpose method forrecording vegetation composition and structure. Castanea 63(3):262-274.
Whittaker, R.H. 1956. Vegetation of the Great Smoky Mountains. Ecological Monographs26:1-80.
__________________________________________________________________________________ Grant et al.
Posters Third Symposium on Hemlock Woolly Adelgid
297
ASSESSMENT OF EGG RELEASES FOR ESTABLISHMENT OF SASAJISCYMNUS TSUGAE
ON EASTERN HEMLOCK
Jerome F. Grant1, Daniel Palmer2, James R. “Rusty” Rhea3,Glenn Taylor4, Paris L. Lambdin1, and Isaac Deal1
1Department of Entomology and Plant Pathology, The University of Tennessee,Knoxville, TN 37996-4560
2New Jersey Department of Agriculture, Division of Plant Industry,West Trenton, NJ 08628
3USDA Forest Service, Forest Health Protection,Asheville, NC 28804
4Great Smoky Mountains National Park,Gatlinburg, TN 37738
ABSTRACT
Infestations of the hemlock woolly adelgid, Adelges tsugae Annand (Homoptera: Adelgidae),are now regularly found on eastern hemlock, Tsuga canadensis (L.) Carriere, in the GreatSmoky Mountains National Park. Management programs have been implemented to reducethe impact of this exotic pest on hemlocks. One management tool has been to release anexotic predatory lady beetle, Sasajiscymnus (=Pseudoscymnus) tsugae (Sasaji and McClure),which feeds on hemlock woolly adelgid. Unfortunately, rearing programs to produce largenumbers of adult S. tsugae are labor intensive and expensive. Thus, alternate release plans(e.g., egg releases) are under investigation to maximize production capacity and minimizeinputs. Egg releases would save time, effort, and money. This paper summarizes results ofthe first year of this multi-year study to assess egg releases as a means to establish S. tsugae.Results supported the use of egg releases for field establishment of S. tsugae against hemlockwoolly adelgid, as eggs hatched, immatures developed through all life stages, and adults wererecovered. The timing of egg releases with suitable prey stages is critical and imperative to thesuccessful survival and colonization of S. tsugae. Suitable food must be present at the time ofrelease, as well as several weeks after release. Further research will better clarify optimumrelease conditions and contribute to a more defined release protocol to enable forest resourcemanagers to enhance release and establishment of S. tsugae against hemlock woolly adelgidon eastern hemlock.
KEYWORDS
Sasajiscymnus tsugae, biological control, predator, Tsuga canadensis, Adelges tsugae.
Third Symposium on Hemlock Woolly Adelgid Posters
Grant et al. ___________________________________________________________________________________
298
INTRODUCTION
The health and survival of eastern hemlock, Tsuga canadensis (L.) Carriere, are now threat-ened by the hemlock woolly adelgid, Adelges tsugae Annand (Homoptera: Adelgidae), a smallaphid-like insect introduced into the United States from Japan and China. Knauer et al.(2002) listed the hemlock woolly adelgid as the single greatest threat to the health andsustainability of hemlock as a forest resource in eastern North America. In the forests of thesouthern Appalachians, eastern hemlock is an important component and is widely distrib-uted. More than 1,500 ha of hemlock-dominated forests are found in the Great Smoky Moun-tains National Park (GRSM), and some of these trees are more than 400 years old (Johnson1995). Of the more than 100 native tree species in GRSM, the eastern hemlock is the onlyspecies of hemlock known to occur within its boundaries (Taylor 2002). Eastern hemlock isecologically and environmentally important as a forest component and is a dominant speciesin at least five of the 12 vegetation types in GRSM (Taylor 2002).
Unfortunately, management tools are limited in an entire forest, considering its area anddiverse systems. Although insecticides may save individual trees, area-wide chemical controlis impractical or not economically feasible in the forest. No native natural enemies or pest-resistant eastern hemlocks have been found, but exotic biological control agents have beenidentified as potential mortality agents of hemlock woolly adelgid (Butin et al. 2002, Cheahand McClure 1996, 1998, 2000, McClure 1995, McClure et al. 2000, Montgomery and Lyon1996, Wallace and Hain 2000). One of these organisms, a lady beetle, Sasajiscymnus(=Pseudoscymnus) tsugae (Sasaji and McClure), has been released against hemlock woollyadelgid in numerous states (Blumenthal 2002, Casagrande et al. 2002, Cheah and McClure2002, McClure and Cheah 2002). The release of S. tsugae in newly-infested areas, such as theGRSM, before the adelgid becomes widely distributed may lower the adelgid’s ability toreach highly damaging levels.
Rearing programs to produce large numbers of adult S. tsugae are labor intensive andexpensive. Thus, the development and implementation of alternate release plans (e.g., eggreleases) would maximize production capacity and minimize inputs. Releases of eggs at fieldsites would be a tremendous boost to rearing programs by saving time, effort, and money. Amulti-year research project was initiated to assess the potential success and benefits of alter-native strategies to release and establish S. tsugae on eastern hemlock. This research focusesspecifically on egg releases and includes the following objectives: 1) develop protocols foregg releases of S. tsugae to augment the regional biological control effort, 2) evaluate inci-dence and establishment of S. tsugae one year after field release, and 3) assess development,survival, and colonization of S. tsugae released as eggs against hemlock woolly adelgid insleeve cages in the field. This paper summarizes results of the first year of this study.
MATERIALS AND METHODS
Before the initiation of this project, discussions were held with numerous individuals withexperience working with large-scale insect rearing programs or with S. tsugae. Based on these
__________________________________________________________________________________ Grant et al.
Posters Third Symposium on Hemlock Woolly Adelgid
299
discussions and previous research results (specifically, those presented in Palmer and Sheppard2002), protocols were developed to acquire and maintain large numbers of eggs for shipment(obtained from the New Jersey Department of Agriculture), laboratory confinement, andplacement in the field. Eggs were shipped via overnight mail and placed in the field on the daythey were received.
In 2003, egg releases of S. tsugae were made at two locations (Jakes Creek, 16 trees, andMeigs Creek, six trees) by park personnel in the GRSM. Eggs were placed in the field onApril 24 at Jakes Creek (4,000 eggs) and on May 22 at Meigs Creek (5,000 eggs). Post-releaseevaluations (visual examinations, sweep-net samples, and branch collections evaluated in thelaboratory) were conducted several months and one year after egg releases.
In a separate study to investigate the development and survival of S. tsugae on easternhemlock, twigs and gauze containing eggs (ca. 6,500) of S. tsugae were placed on twigs usingtwist ties and covered with screened sleeve cages. Eggs were placed in 21 sleeve cages (ca. 250eggs/cage) in the field on April 22, 2004, at Elkmont. As a control treatment, eggs also wereplaced on twigs of eastern hemlock in jars (3.8 l) and maintained in incubators in the labora-tory. Three cages were removed each week for seven weeks and taken to the laboratorywhere the contents were examined thoroughly; the number of damaged and nondamagedwoolly masses were counted to assess predator activity. Development and survival of S. tsugaein the control jars also was monitored weekly for comparison. Data analyses were performedusing SPSS® (2002) to assess differences among seasonal survival and development of beetles.
RESULTS AND DISCUSSION
Low numbers (fewer than 10) of larvae and adult beetles were found several weeks after re-lease at both Jakes Creek and Meigs Creek locations in 2003. However, no larvae or beetleswere recovered at either location one year post-release, in 2004. These results were somewhatconsistent with adult beetle releases in which predator recovery was low in subsequent years(P.L. Lambdin, unpublished data). Tree health and adelgid vigor and quality on release treeswere extremely poor in 2004; these characteristics are not conducive to beetle viability. Re-sults also suggested that the initial egg releases in 2003 may have been made too late in theseason for developing beetles to have sufficient food (i.e., crawlers) for an extended duration.
Sleeve cage evaluations suggested that egg releases of S. tsugae provide a viable means toattempt to establish populations of this predator. Eggs hatched and all larval instars devel-oped including prepupa and pupa. Adults were recovered (though in low numbers), suggest-ing that trees could be colonized via egg releases of S. tsugae. Poor adelgid quality or lack ofsuitable stages may have affected adult development.
Predatory activity of larvae on adelgids within sleeve cages was evident. About 43.9% ofall woolly masses on twigs inside cages were damaged by S. tsugae. Comparatively, only19.1% of woolly masses held as controls in the laboratory exhibited similar damage. Al-though these masses were disturbed or damaged, many nondamaged eggs remained. Percent-age of damaged woolly masses in the field peaked at 64.9% after five weeks (Table 1).
Third Symposium on Hemlock Woolly Adelgid Posters
Grant et al. ___________________________________________________________________________________
300
Adelgid crawlers were numerous when this research was initiated on April 22, and hadbeen extremely abundant earlier. On the release date, crawler densities averaged approxi-mately 15.5/2.5 cm of twig length. Unfortunately, densities fell sharply (ca. 93%) one weeklater and remained almost nonexistent during the remainder of the study (Figure 1). Becauseadelgid eggs and crawlers provide nutritional resources for beetle larvae, the low numbers ofthese prey probably impacted the numbers of beetles that developed successfully to adult-hood. In the sleeve cages where suitable prey was unavailable, cannibalism of S. tsugae onprepupae and pupae was observed. This cannibalism could adversely affect colonization andestablishment of this predator.
SUMMARY
These results are encouraging as they support the use of egg releases of S. tsugae for fieldestablishment against hemlock woolly adelgid. Eggs hatched, immatures developed throughall life stages, and adults were recovered. It is important to also assess the feasibility of releas-ing early-instar larvae, which are not as vulnerable to predators and not as susceptible totemperature/climatic fluctuations. As this preliminary assessment demonstrates, timing ofegg and larval releases with suitable prey stages is critical and imperative to the successfulsurvival and colonization of S. tsugae. Suitable food must be present at the time of release, aswell as several weeks after release, for beetle development. Adelgid eggs, in general, are suit-able food for larvae of S. tsugae. However, in this study, many adelgid eggs were available butwere unacceptable as food for S. tsugae and never hatched. The reasons for these non-viableand unacceptable eggs are unclear. Further research will better clarify optimum release con-ditions and contribute to a more defined release protocol. Improved methodologies willenable forest resource managers to release and establish S. tsugae over a wider geographicalarea to reduce populations of hemlock woolly adelgid on eastern hemlock.
ACKNOWLEDGMENT
Special appreciation is expressed to the staff of the New Jersey Department of Agriculture fortheir willingness to provide eggs for use in this study. Many thanks to the personnel of theGreat Smoky Mountains National Park for site selection and access, and to Matthew Brown,Josh Grant, Jared Oakes, and Greg Wiggins of the University of Tennessee for their field andlaboratory assistance. Partial funding for this research was provided through a cooperativeagreement with the USDA Forest Service, Forest Health, Southern Division.
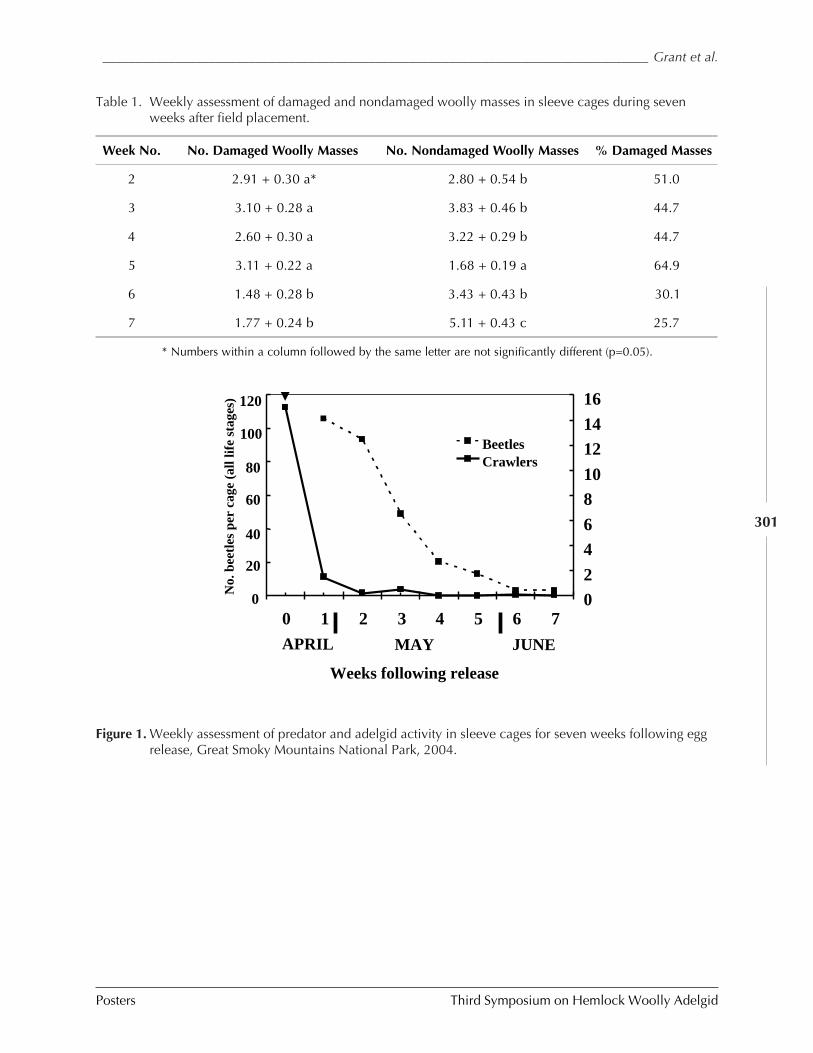
__________________________________________________________________________________ Grant et al.
Posters Third Symposium on Hemlock Woolly Adelgid
301
Week No. No. Damaged Woolly Masses No. Nondamaged Woolly Masses % Damaged Masses
2 2.91 + 0.30 a* 2.80 + 0.54 b 51.0
3 3.10 + 0.28 a 3.83 + 0.46 b 44.7
4 2.60 + 0.30 a 3.22 + 0.29 b 44.7
5 3.11 + 0.22 a 1.68 + 0.19 a 64.9
6 1.48 + 0.28 b 3.43 + 0.43 b 30.1
7 1.77 + 0.24 b 5.11 + 0.43 c 25.7
* Numbers within a column followed by the same letter are not significantly different (p=0.05).
Figure 1. Weekly assessment of predator and adelgid activity in sleeve cages for seven weeks following eggrelease, Great Smoky Mountains National Park, 2004.
0 1 2 3 4 5 6 70
2
4
6
8
10
12
14
16
Beetles
Crawlers
Weeks following release
No
. b
eetl
es p
er c
ag
e (a
ll l
ife
sta
ges
)
0
20
40
120
100
80
60
APRIL MAY JUNE
Table 1. Weekly assessment of damaged and nondamaged woolly masses in sleeve cages during sevenweeks after field placement.
Third Symposium on Hemlock Woolly Adelgid Posters
Grant et al. ___________________________________________________________________________________
302
REFERENCES
Blumenthal, E.M. 2002. Report: Pseudoscymnus tsugae in Pennsylvania forests, pp. 166-169. In Proceedings, Hemlock Woolly Adelgid in the Eastern United States Symposium,ed. B. Onken, R. Reardon, and J. Lashomb. 5-7 February 2002, East Brunswick, NewJersey.
Butin, E., M. Montgomery, N. Havill, and J. Elkinton. 2002. Pre-release host range assess-ment for classical biological controls: experience with predators for the hemlock woollyadelgid, pp. 205-213. In Proceedings, Hemlock Woolly Adelgid in the Eastern UnitedStates Symposium, ed. B. Onken, R. Reardon, and J. Lashomb. 5-7 February 2002, EastBrunswick, New Jersey, Rutgers.
Casagrande, R.A., M. DeSanto, J. Dacey, and A. Lambert. 2002. Pseduoscymnus tsugae forbiological control of the hemlock woolly adelgid in suburban settings, pp. 170-180. InProceedings, Hemlock Woolly Adelgid in the Eastern United States Symposium, ed. B.Onken, R. Reardon, and J. Lashomb. 5-7 February 2002, East Brunswick, New Jersey.
Cheah, C.A.S.-J. and M.S. McClure. 1996. Exotic natural enemies of Adelges tsugae andtheir prospect for biological control, pp. 103-112. In First Hemlock Woolly AdelgidReview, 12 October 1995, Charlottesville, Virginia, ed. S.M. Salom, T.C. Tigner, andR.C. Reardon. FHTET 96-10. U.S. Department of Agriculture, Forest Service,Morgantown, West Virginia.
Cheah, C.A.S.-J. and M.S. McClure. 1998. Life history and development of Pseudoscymustsugae (Coleoptera: Coccinellidae), a new predator of the hemlock woolly adelgid(Homoptera: Adelgidae). Environmental Entomology 27:1531-1536.
Cheah, C.A.S.-J. and M.S. McClure. 2000. Seasonal synchrony of life cycles between theexotic predator, Pseudoscymnus tsugae (Coleoptera: Coccinellidae), and its prey, thehemlock woolly adelgid, Adelges tsugae (Homopterea: Adelgidae). Agriculture andForest Entomology 2:241-251.
Cheah, C.A.S.-J. and M.S. McClure. 2002. Pseudoscymnus tsugae in Connecticut forests:the first five years, pp. 150-165. In Proceedings, Hemlock Woolly Adelgid in the East-ern United States Symposium, ed. B. Onken, R. Reardon, and J. Lashomb. 5-7 February2002, East Brunswick, New Jersey, Rutgers.
Johnson, K.S. 1995. Eastern hemlock forest delineation in Great Smoky Mountains Na-tional Park. Resources Management and Science Division, Great Smoky MountainsNational Park, Gatlinburg, Tennessee.
Knauer, K., J. Linnane, K. Shields, and R. Bridges. 2002. An initiative for management ofhemlock woolly adelgid, pp. 9-11. In Proceedings, Hemlock Woolly Adelgid in theEastern United States Symposium, ed. B. Onken, R. Reardon, and J. Lashomb. 5-7February 2002, East Brunswick, New Jersey.
McClure, M.S. 1995. Using natural enemies from Japan to control hemlock woollyadelgid. Frontier Plant Science 47: 5-7.
__________________________________________________________________________________ Grant et al.
Posters Third Symposium on Hemlock Woolly Adelgid
303
McClure, M.S.; C.A.S.-J. Cheah, and T.C. Tigner. 2000. Is Pseudoscymnus tsugae thesolution to the hemlock woolly adelgid problem?: an early perspective, pp. 89-96. InProceedings, Symposium on Sustainable Management of Hemlock Ecosystems in East-ern North America, ed. K.A. McManus, K.S. Shields, and D.R. Souto. 22-24 June 1999,Durham, New Hampshire. U.S. Department of Agriculture, Forest Service, NewtownSquare, Pennsylvania.
McClure, M.S. and C.A.S.-J. Cheah. 2002. Establishing Pseudoscymnus tsugae Sasaji andMcClure (Coleoptera: Coccinellidae) for biological control of hemlock woolly adelgid,Adelges tsugae Annand (Homoptera: Adelgidae), in the eastern United States, pp. 351-352. In Proceedings, Hemlock Woolly Adelgid in the Eastern United States Symposium,ed. B. Onken, R. Reardon, and J. Lashomb. 5-7 February 2002, East Brunswick, NewJersey, Rutgers.
Montgomery, M.E. and S.M. Lyon. 1996. Natural enemies of adelgids in North America:their prospect for biological control of Adelges tsugae (Homoptera: Adelgidae), pp. 89-102. In First Hemlock Woolly Adelgid Review, 12 October 1995, Charlottesville, Vir-ginia, ed. S.M. Salom, T.C. Tigner, and R.C. Reardon. FHTET 96-10. U.S. Departmentof Agriculture, Forest Service, Morgantown, West Virginia.
Palmer, D.J. and J.L. Sheppard. 2002. Mass rearing Pseudoscymnus tsugae at the NewJersey Department of Agriculture: Challenges and Lessons, pp. 214-220. In Proceedings,Hemlock Woolly Adelgid in the Eastern United States Symposium, ed. B. Onken, R.Reardon, and J. Lashomb. 5-7 February 2002, East Brunswick, New Jersey, Rutgers.
SPSS. 2002. SPSS 12.0 for Windows. Chicago, SPSS, Inc.
Taylor, G. 2002. Hemlock resources in Great Smoky Mountains National Park, pp. 34-35.In Proceedings, Hemlock Woolly Adelgid in the Eastern United States Symposium, ed.B. Onken, R. Reardon, and J. Lashomb. 5-7 February 2002, East Brunswick, NewJersey, Rutgers.
Wallace, M.S. and F.P. Hain. 2000. Field surveys and evaluation of native and establishedpredators of the hemlock woolly adelgid (Homoptera: Adelgidae) in the southeasternUnited States. Environmental Entomology 29:638-644.
Third Symposium on Hemlock Woolly Adelgid Posters
Humble and Mavin____________________________________________________________________________
304
PRELIMINARY ASSESSMENT OF THE COLD TOLERANCE OF LARICOBIUS NIGRINUS,A WINTER-ACTIVE PREDATOR OF THE HEMLOCK WOOLLY ADELGID FROM
WESTERN CANADA
Leland M. Humble and Linda Mavin
Natural Resources Canada, Canadian Forest Service506 West Burnside Road, Victoria, B.C. V8 1M5 CANADA
ABSTRACT
Laricobius nigrinus Fender is a winter-active predator of the hemlock woolly adelgid (HWA),Adelges tusgae Annand, native to the Pacific northwest of North America. Adults appear inthe foliage of infested hemlocks as the overwintering HWA sistens generation develops (Oct.– Dec) and begin oviposition in the ovisacs of HWA soon after adelgid oviposition begins inJanuary. Thus, multiple life stages of the predator are present during the coldest periods ofthe Pacific Northwest winter. As L. nigrinus is being evaluated as a biological control agentagainst HWA in the eastern U.S., where winter climates can be more severe than those of itsnative range, it is important to understand the cold tolerance of the life stages of the predatorpresent during the winter months.
We assessed the cold tolerance of adults, eggs, and larvae of L. nigrinus through evalua-tions of the supercooling points (SCPs) of field-collected adults and laboratory-reared (at5°C) eggs and larvae. Freezing was fatal to all life stages. The mean SCPs of adults rangedbetween –16ºC and –19ºC, while those of overwintering one-day-old and five-day-old eggswere –27.5°C and –26.9°C, respectively. Newly eclosed first instar larvae (L1) that had notyet begun to feed supercooled to -24°C, while their supercooling capacity diminished slightly(0 = –22.1°C) once feeding was intitated. Supercooling capacity diminished with each succes-sive instar, with the SCPs of the L2, L3 and L4 being –17ºC, –15ºC and –13ºC, respectively.
Survival of eggs and adults after exposure to sub-zero temperatures above their meanSCPs (–10ºC and –20ºC for eggs; –10ºC and –15ºC for adults) for increasing durations (to amaximum of 8 hours) was also evaluated. Survivorship was highest for eggs and adults ex-posed to –10ºC. Survival of eggs declined with decreasing temperature and increasing dura-tion of exposure. Survival of eggs exposed to –20ºC for 1 hour was 45%, with no survivalevident at longer durations. Increasing durations of exposure of adults to –15ºC (1º-4ºC abovemean adult SCPs) resulted in reduced adult survival. However, 40% of the adults testedsurvived 8 hours of exposure to –15ºC. These results indicate that both the duration andextent of extreme winter minima may be determinants of the range of L. nigrinus in easternNorth America.
_______________________________________________________________________________Jefts and Orwig
Posters Third Symposium on Hemlock Woolly Adelgid
305
THE EFFECTS OF HWA OUTBREAKS ON ECOSYSTEM LEVEL CHANGES INSOUTHERN NEW ENGLAND
Sultana Jefts and David Orwig
Harvard Forest, Harvard University,P.O. Box 68, Petersham, MA 01366
ABSTRACT
The continued spread of the introduced hemlock woolly adelgid (HWA), Adelges tsugae, haslead to widespread decline and mortality of eastern hemlock (Tsuga canadensis) and initiatedintensive hemlock logging. This pest alters the structural and vegetative composition of hem-lock forests by transforming them into largely hardwood-dominated forests. Less well un-derstood are the impacts that HWA has on local trophic interactions and how this pest mayalter many ecosystem processes. We provide evidence from several studies (Stadler et al.2005, Orwig et al. and Jefts et al., unpublished data) that highlight the important role thatHWA plays in altering stand microenvironment, soil nitrogen (N) availability, soil mycor-rhizal associations, litter quality, litter microbiology, and canopy throughfall chemistry. Inaddition, we compare microenvironmental conditions and nutrient availability associated withHWA infestation and with hemlock logging, one of the primary management responses toHWA outbreaks.
Results from these studies suggest that persistent HWA feeding leads to direct crowndeterioration and initiates subtle but important changes in canopy characteristics that havecascading effects on a variety of ecosystem processes. Forests infested with HWA commonlyhave significantly higher soil temperatures (by 1 - 2 oF) and mineral soil moisture content andlower organic soil moisture content (decreases up to 40%) than uninfested forests. In addi-tion, infested forests typically have higher soil N availability (171 and 92 µg N/g resin ininfested vs. uninfested forests) due to several different mechanisms, including: 1) inducedmicroenvironmental changes that favor decomposition due to deteriorating crowns, 2) re-duced uptake as trees decline, and 3) enhanced N content of litter, and canopy throughfall.Furthermore, infested forests have significantly lower root ectomycorrhizal (ECM) coloni-zation than uninfested forests (up to 30% less ECM coverage), suggesting that soil N is nolonger limiting, and trees are not allocating as much resources to below-ground production—which may in turn also affect changes in soil nutrient availability and cycling. HWA-infestedfoliage exhibited significantly higher foliar N content (1.9–2.8% infested vs. 1.5–1.9% con-trol) and abundances of bacteria, yeasts, and filamentous fungi than uninfested foliage.Throughfall precipitation collected under infested hemlock branches contained significantlyhigher concentrations of nitrate, total N, and dissolved organic N than that collected underuninfested branches.
Third Symposium on Hemlock Woolly Adelgid Posters
Jefts and Orwig _______________________________________________________________________________
306
Hemlock logging led to higher soil temperatures and greater available soil N than in-fested or uninfested forests. Although N availability is highly variable, intensive cutting ofhemlock in response to HWA may lead to ecosystem level impacts that are higher in magni-tude than the insect itself, further increasing N losses from these systems. Results indicatethat introduced pests and selective tree decline can rapidly and dramatically alter ecosystemprocesses such as energy flow and ion fluxes, even prior to the onset of extensive tree mortal-ity.
KEYWORDS
Ecosystem processes, nutrient cycling, throughfall chemistry, hemlock cutting.
ACKNOWLEDGMENTS
We would like to thank Dr. Bernhard Stadler, Richard Cobb, Matt Waterhouse, TawannaChilds, Leann Barnes, and Laura Barbash for field assistance and technical support. HeidiLux provided critical comments on earlier versions of this presentation. This work was fi-nancially supported by the National Science Foundation (Grant # DEB-0236897) and theHarvard Forest Long-Term Ecological Research Program.
REFERENCE
Stadler, B., T. Müller, D. Orwig, and R. Cobb. 2005. Hemlock woolly adelgid in NewEngland forests: canopy impacts transforming ecosystem processes and landscapes.Ecosystems (in press).
_______________________________________________________________________________ Josserand et al.
Posters Third Symposium on Hemlock Woolly Adelgid
307
EVAULATION OF MICROSATELLITE MARKERS IN FRASER FIR (ABIES FRASERI)
S. Josserand1, J.A. Bowen2, K. Potter3, J. Frampton3, C.D. Nelson1
1USDA Forest Service, Southern Institute of Forest Genetics, Harrison Experimental Forest,23332 Mississippi 67, Saucier, MS 39574
2 University of Southern Mississippi, Department of Biological Sciences, Gulf CoastCampus, Long Beach, Mississippi
3 North Carolina State University, Department of Forestry, Raleigh, North Carolina
ABSTRACT
We tested 20 microsatellite primer pairs from Fraser fir (Abies fraseri) for PCR amplificationand allelic polymorphism. These primers originated from cloned inserts enriched for DNAsequences containing tandem repeats of (AC)n, (AG)n, and (AAT)n. In total, 30 clones wereselected for evaluation. PCR primers for 18 of these clones consistently produced single/simple PCR profiles. From these, nine markers were found to be polymorphic among 13Fraser fir samples and are apparently robust for use in population genetic or genome mappingstudies. These markers are being applied in a population genetic study of Fraser fir to assist inefforts to effectively and efficiently conserve the species’ genetic diversity.
KEYWORDS
Microsatellite DNA, population genetics, fir.
Third Symposium on Hemlock Woolly Adelgid Posters
Knoepp et al. _________________________________________________________________________________
308
HEMLOCK WOOLLY ADELGID RESEARCH AT THE COWEETA HYDROLOGIC
LABORATORY
J.D. Knoepp1, J.M. Vose1, K.J. Elliott1,B.D. Clinton1, C. R. Ford1, and B.D. Kloeppel2
1USDA Forest Service-SRS2University of Georgia, Coweeta Hydrologic Laboratory, Otto, North Carolina
ABSTRACT
Hemlock woolly adelgid (HWA) is a non-native invasive pest that impacts eastern hemlock(Tsuga canadensis) and Carolina hemlock (Tsuga caroliniana). Hemlock trees serve impor-tant ecological roles in the southern Appalachians as a keystone species in near-stream areas.Scientists at the USDA Forest Service, Coweeta Hydrologic Laboratory and their collabora-tors have established studies to examine the function of hemlock in riparian areas and theeffects of its potential demise through the activity of HWA. We have focused our researchactivities in four areas: mapping and monitoring, effects, control, and restoration. Utilizingpermanent vegetation plots, established in the Coweeta basin in 1934, we can map the extentand monitor the progress of HWA infestation and its effects on plant biodiversity. We haveestablished intensive research plots to measure the effects of infestation on terrestrial andaquatic nitrogen and carbon cycling, forest and stream microclimatology, site productivity,and plant physiology. Future research will explore methods to restore ecosystem function inareas where hemlock is or will be heavily impacted by HWA. Of particular interest is restor-ing the function of hemlock in terms of providing critical habitat for birds and other animals,shading streams to maintain water temperatures required by trout and other aquatic organ-isms, and regulating nutrient, carbon, and water pools and fluxes.
__________________________________________________________________________________ Lamb et al.
Posters Third Symposium on Hemlock Woolly Adelgid
309
GUIDELINES FOR REARING LARICOBIUS NIGRINUS FENDER
A.B. Lamb, S.M. Salom, and L.T. Kok
Department of Entomology, Virginia TechBlacksburg, VA 24061-0319
ABSTRACT
Laricobius nigrinus (Coleoptera: Derodontidae) is attracting attention for its potential use-fulness as a predator of the hemlock woolly adelgid (HWA), Adelges tsugae Annand. Laricobiusnigrinus is a univoltine species with an unusual lifecycle, where adults spend the summer indiapause but are active for the rest of the year. Field and laboratory studies indicate L. nigrinuspossesses many characteristics deemed favorable for biological control agents. To expediteits establishment and be a viable control option for HWA, L. nigrinus must be reared in largenumbers for field releases. Procedures that have shown some success in laboratory rearing ofL. nigrinus at Virginia Tech are described.
KEYWORDS
Hemlock woolly adelgid, biological control, colony rearing, predators.
INTRODUCTION
Hemlock woolly adelgid (HWA), Adelges tsugae Annand (Homoptera: Adelgidae) is anexotic insect that attacks and kills eastern hemlock, Tsuga canadensis (L.) and Carolina hem-lock, T. caroliniana Engelmann trees in the eastern United States (Ward et al. 2004). HWA isan innocuous inhabitant of Tsuga spp in Asia, where it is believed to originate (Montgomeryet al. 2000). Populations of this insect may be regulated by host resistance and natural en-emies (McClure et al. 2000). In eastern North America, HWA populations rapidly reachlethal levels and with few chemical control options, natural enemies may be the most promis-ing method for controlling HWA in the eastern states (Wallace and Hain 2000).
Laricobius nigrinus Fender (Coleoptera: Derodontidae) is a predator found in associa-tion with HWA in western North America (Zilahi-Balogh et al. 2003a), where hemlock is nottypically injured by HWA (Furniss and Carolin 1977). L. nigrinus is being evaluated for itspotential as a biological control agent for HWA. Field and laboratory studies have revealedthat L. nigrinus can play an important role as part of a complex of biological control agentsaimed at regulating HWA abundance.
This predator has several attributes that are considered necessary for a successful bio-logical control agent including: synchrony and adaptability with its environment and host,host-searching capacity, ability to increase in numbers; and general mobility (Huffaker and
Third Symposium on Hemlock Woolly Adelgid Posters
Lamb et al. ___________________________________________________________________________________
310
Kennett 1969). Zilahi-Balogh (2001) concluded that L. nigrinus adults and larvae feed selec-tively on HWA and in larval development tests, L. nigrinus completed development only onHWA, indicating that it is unable to survive on other prey species (Zilahi-Balogh et al. 2002).Field studies in British Columbia, Canada have shown that its lifecycle is highly synchronouswith HWA, and field studies in Virginia show similar host synchrony in the eastern U.S.(Lamb et al. 2005). In addition, two years after a small field release of L. nigrinus in Virginia,F2 adults were recovered, indicating their potential ability to establish in the eastern U.S.(Lamb et al. unpublished data).
To be a viable biological control candidate, L. nigrinus must be successfully mass rearedfor field releases. Our mass rearing efforts have focused on laboratory propagation and theuse of field insectaries. Successful procedures for laboratory rearing L. nigrinus have beendeveloped after four years of research. Although there is room for improvement, the follow-ing methods have yielded several generations of the beetle. This paper describes the life cycleof L. nigrinus and current procedures used for rearing each life stage in the laboratory atVirginia Tech.
LIFE CYCLE OF LARICOBIUS NIGRINUS AND ADELGES TSUGAE
Field studies in British Columbia (Zilahi-Balogh et al. 2003a) and rearing L. nigrinus in thelaboratory have revealed a univoltine life cycle that is synchronous with the life cycle of HWA(Zilahi-Balogh et al. 2003b). HWA has a complex polymorphic life cycle that involves twoasexual generations annually (McClure 1991). The overwintering generation (sistens) feedsand develops throughout the fall and winter months and deposits eggs within woolly ovisacsin early spring. The second generation (progrediens) lays eggs within woolly ovisacs in latespring, which hatch into sistens crawlers that settle at the base of young needles, feed for ashort time, and then enter aestivation (summer diapause) (McClure 1989; Gray and Salom1996; Salom et al. 2002). Aestivation lasts for several months, and sistens nymphs resumefeeding and development in October (McClure 1987; Gray and Salom 1996).
L. nigrinus adults overwinter on the hemlock branches, feeding on HWA sistens. In lateJanuary or early February, adult L. nigrinus begin ovipositing single eggs directly in sistensovisacs. Oviposition by L. nigrinus is synchronous with the oviposition period of HWAsistens, beginning in January or February and ending in May or June. Eggs hatch and eclosedlarvae feed on HWA eggs. Larvae develop through four instars and the mature larvae drop tothe ground and migrate to a pupation site within the soil. Development from egg to pre-pupae takes five to six weeks using the procedures outlined below. At 15°C, L. nigrinusremain as prepupae for about 10 days prior to pupation (Zilahi-Balogh et al. 2003b). Pupaldevelopment occurs in cells in the soil, and after about two weeks, pupae develop into adults.The adults remain in the soil and enter aestival diapause in early summer. In October, adultL. nigrinus emerge from the soil and migrate back to hemlock trees in search of HWA. Thisis approximately the same time that the HWA sistens are resuming development. Thus, bothspecies enter and complete aestival diapause at approximately the same time.
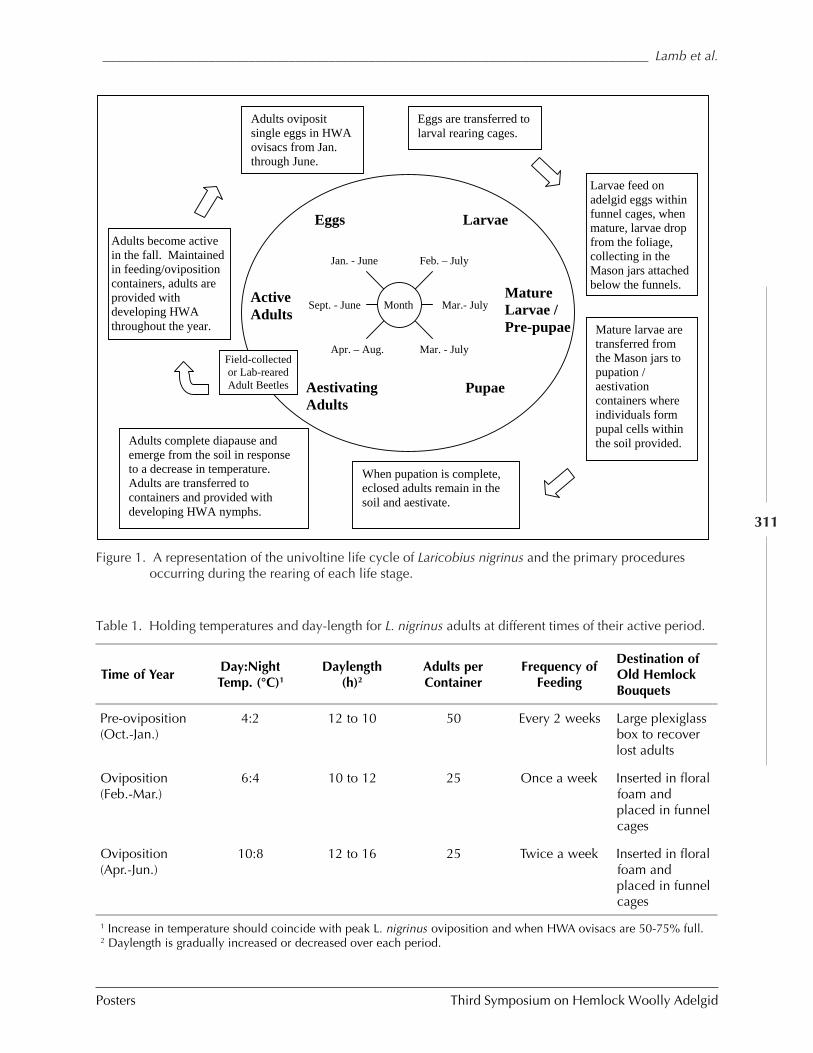
__________________________________________________________________________________ Lamb et al.
Posters Third Symposium on Hemlock Woolly Adelgid
311
Figure 1. A representation of the univoltine life cycle of Laricobius nigrinus and the primary proceduresoccurring during the rearing of each life stage.
Adults become active in the fall. Maintained in feeding/oviposition containers, adults are provided with developing HWA throughout the year.
Adults oviposit single eggs in HWA ovisacs from Jan. through June.
Eggs are transferred to larval rearing cages.
Larvae feed on adelgid eggs within funnel cages, when mature, larvae drop from the foliage, collecting in the Mason jars attached below the funnels.
Mature larvae are transferred from the Mason jars to pupation / aestivation containers where individuals form pupal cells within the soil provided.
When pupation is complete, eclosed adults remain in the soil and aestivate.
Adults complete diapause and emerge from the soil in response to a decrease in temperature. Adults are transferred to containers and provided with developing HWA nymphs.
Active
Adults
Mature
Larvae /
Pre-pupae
Pupae
LarvaeEggs
Aestivating
Adults
Month
Feb. – July Jan. - June
Apr. – Aug. Mar. - July
Sept. - June Mar.- July
Field-collected or Lab-reared Adult Beetles
Time of YearDay:NightTemp. (°C)1
Daylength(h)2
Adults perContainer
Frequency ofFeeding
Destination ofOld HemlockBouquets
Pre-oviposition(Oct.-Jan.)
4:2 12 to 10 50 Every 2 weeks Large plexiglassbox to recoverlost adults
Oviposition(Feb.-Mar.)
6:4 10 to 12 25 Once a week Inserted in floralfoam andplaced in funnelcages
Oviposition(Apr.-Jun.)
10:8 12 to 16 25 Twice a week Inserted in floralfoam andplaced in funnelcages
1 Increase in temperature should coincide with peak L. nigrinus oviposition and when HWA ovisacs are 50-75% full.2 Daylength is gradually increased or decreased over each period.
Table 1. Holding temperatures and day-length for L. nigrinus adults at different times of their active period.
Third Symposium on Hemlock Woolly Adelgid Posters
Lamb et al. ___________________________________________________________________________________
312
Figure 1 represents the life cycle of L. nigrinus and the general rearing procedures coin-ciding with each life stage. References made to specific months indicate the average time ofyear HWA is available in particular stages in Blacksburg, Virginia. The exact time of year L.nigrinus begins and ends oviposition is influenced by the stage of the HWA provided tothem.
FEEDING L. NIGRINUS ADULTS (EARLY FALL THROUGH LATE SPRING)
Laricobius nigrinus adults become active in the early months of fall and require hostmaterial upon emergence. They begin feeding on HWA nymphs attached to hemlock branchesand feed all winter. In late January, they begin to lay eggs, singly in the HWA wool sacs(ovisacs) and continue until about June (peaks in late March–early April).
The general procedures for storing and maintaining adults are similar throughout theyear, however there are minor changes in conditions between the pre-oviposition (Oct.-Jan.)and oviposition (Feb-June) periods (Table 1).
Storage (Adult Feeding/Oviposition Containers)
· Gallon-sized plastic containers (screened holes on the side and the lid) with moistenedfilter paper cut to fit the bottom.
· Each container holds one hemlock “bouquet” (a floral foam-filled film canister holding10-15 heavily HWA-infested hemlock branches (approximately 20 cm long).
· Adults are stored in environmental chambers programmed to create conditions shownin Table 1.
Maintenance
· At the end of each feeding period, every adult is recovered from its current containerand transferred to a new container with a fresh hemlock bouquet (spray with distilledwater).
· Containers are kept at 4°C immediately before adults are fed to reduce flight.
· Adults transfers are carried out under a nylon screen to a table-top cage to preventflying adults from escaping.
(a) Pre-ovipositing Adults
– If all adults are recovered from old containers, discard the old hemlock bouquet.
– If some individuals are not accounted for, old hemlock branches are placed in alarge plexiglass box at room temperature and observed daily for missing adults.
(b) Ovipositing Adults
– It is critical to provide heavily-infested foliage with ovipositing HWA to adults toensure that early instars can access adelgid eggs. Adult L. nigrinus should be pro-vided with enough adelgids (preferably excess amounts, ~100 ovisacs per adultbeetle) for themselves and the early instars of the progeny they produce.
__________________________________________________________________________________ Lamb et al.
Posters Third Symposium on Hemlock Woolly Adelgid
313
– To ensure predator eggs are deposited in optimal sites (singly, in full adelgid ovisacs)adults are fed twice a week and the number of adults per container is reduced (Table1). These modifications also decrease larval competition during their developmentand increase synchrony of larval maturation.
– The hemlock branches from which adults are removed from at each feeding con-tain the L. nigrinus eggs laid since the time of the last feeding. These branches aretransferred to parafilm-wrapped floral foam blocks and are inserted alternatelywith fresh hemlock branches infested with oviposting HWA. The additional HWAfresh foliage provides host material for the more mobile 3rd and 4th L. nigrinusinstars. These blocks are placed into funnel cages (Lamb et al. 2002).
DEVELOPING L. NIGRINUS LARVAE (DEVELOPING FROM FEBRUARY TO JUNE)
After a few weeks, the L. nigrinus eggs hatch within the woolly ovisac and early instars feedon the nearby adelgid eggs. Third and fourth instars are more mobile and feed on adelgideggs and developing nymphs. The duration for L. nigrinus development from egg to maturefourth instar larvae (pre-pupae) varies depending on temperature and food quality. The lar-vae develop at temperatures ranging between 9° and 21° C; however, pupal development doesnot occur at the higher temperatures of this range. The optimal temperature for successfuldevelopment of larvae is likely between 12° and 18°C (Zilahi-Balogh et al. 2003b). Afterconsuming a sufficient amount of prey (200+ eggs) to complete larval development, the pre-pupal stage is reached. This stage is a non-feeding fourth instar that drops from the hemlockbranches and seeks a pupation site in the soil. Larvae are reared in funnel cages, designed totake advantage of this “dropping/migrating” stage so mature larvae (prepupae) essentiallycollect themselves.
Storage (Larval Funnel Cages)
· Hemlock branches with HWA and L. nigrinus eggs are inserted into parafilm-wrappedfloral foam blocks, intermixed with fresh HWA-infested branches, and placed into fun-nel cages. A cylindrical top, made of .7 mm acetate, is placed over the 25 cm funnel baseand a black, pint-size Mason jar is attached underneath the funnel. Each Mason jarcontains about 2 teaspoons of moistened pupating medium.1
· The funnel cages are set up on racks in cold rooms that are maintained at about 13°C anddaylength increased at a rate similar to natural conditions. At this temperature and withadequate prey, mature larvae begin collecting in the jars below the funnels after 3-4weeks. If the temperature increases above 18°C, development rate of larvae increasesdramatically, causing funnels to yield both mature and immature larvae. It is possiblethat the higher temperatures cause the larvae to be more active, resulting in immature
1 Pupating Medium:Southland peat moss (sifted through mesh screen with 0.5 cm openings), Mosser Lee long fiber sphagnum moss (groundfinely), and Play sand.Mix materials (2:2:1 peat:sphagnum:sand) and add distilled water until mixture reaches ~50% saturation. Mixture is thensterilized using two treatments of heat and pressure for several hours or steam sterilization for 12+ hours separated by 24+hours at room temperature.
Third Symposium on Hemlock Woolly Adelgid Posters
Lamb et al. ___________________________________________________________________________________
314
larvae collecting in the jars below the funnels. This situation can also be observed whenlarvae are not provided with an adequate amount of HWA eggs within the funnel. Dif-ferences in appearance and behavior can separate mature and immature larvae.2
Maintenance
· Funnels are set up immediately after adults are fed.
· The foliage in each funnel is sprayed with distilled water twice a month and soil incollecting jars below are moistened every couple of days (in anticipation for maturinglarvae).
· Several days before anticipated larval drop, the collecting jars below the funnels arechecked by emptying the contents into a Petri dish, and a paintbrush is used to siftthrough the materials to recover any larvae.
· Collecting jars are checked daily to separate mature from immature larvae; mature lar-vae become settled for pupation if given enough time (~36 hours), but mortality of im-mature larvae in the collecting jars is high unless immature larvae are returned to brancheswith prey promptly.
· Mature larvae (prepupae) are transferred, using a moistened paintbrush, to pupation/aestivation containers for the summer.
· Immature larvae are transferred to HWA-infested hemlock and placed back in a funnelcage.
MATURE LARVAE/PREPUPAE (MARCH – JULY)
Upon being transferred to pupation/aestivation containers, mature larvae burrow into thesoil, form pupal cells, and remain in a c-shape within their pupal cells for 10-14 days beforedevelopment into pupae. Within 36 hours of dropping from the foliage, prepupae will settleinto cells within the soil to pupate. It is important that individuals are transferred to a pupa-tion/aestivation container before a pupal cell is formed as they have difficulty moving to anew site to pupate after they have settled.
Storage (Pupation/Aestivation Containers)
· Quart-sized and half gallon-sized, clear and opaque, plastic containers with severalscreened holes for air movement are used as pupation/aestivation containers. Each con-tainer contains at least 5 cm of pupating medium; the bottom layer is packed tightly andthe upper layer loosely.
· Depending on the size of the container, between 50 and 200 larvae are placed in eachcontainer.
2 Mature larvae have a yellow vental side and sclerotized dorsal side, typically are moving and are negatively phototactic andwill drop off the branch if placed back on an HWA-infested hemlock branch.Immature larvae are smaller in size, dark in color, and often have white wool attached to their dorsal side; attach them-selves to objects and do not move; and will not drop off branch if placed back onto HWA-infested hemlock branch.
__________________________________________________________________________________ Lamb et al.
Posters Third Symposium on Hemlock Woolly Adelgid
315
· Mold within the pupation/aestivation containers has been a recurring problem. Sourcesof fungal spores are minimized, all containers and the pupation medium are sterilized,and an anti-fungal agent (methyl paraben) is applied to the soil surface weekly.
· Pupation/aestivation containers are maintained at 15°C and long days (16 hours).
Maintainence
· Moisture level of pupation medium should be maintained at about 30-40% saturationby spraying distilled water into containers once a week.
PUPAE/AESTIVATING ADULTS (LATE APRIL THROUGH JULY)
The delicate pupae develop two weeks after burrowing in the soil. L. nigrinus pupae arebright yellow and require a narrow temperature regime during this time (Zilahi-Balogh et al.2003c). At 15°C, pupation is complete in approximately two weeks and the newly eclosedadults remain under the soil surface, and enter summer diapause (aestivation). Adults remainin the soil until they are cued to emerge by a decrease in temperature (Lamb, unpublisheddata). To prevent premature emergence, aestivating adults are stored at high temperaturesuntil mid-September, at which time the temperature is decreased, and adults emerge severalweeks later.
Storage (Pupation/Aestivation Containers)
· Pupation/aestivation containers are kept in the large cold room at 15°C until pupation iscomplete. Once adults have eclosed, containers are moved to 19°C and long daylength(16 hours) until mid-September, when the containers are moved to 13°C and decreasingdaylength at a rate similar to natural conditions.
Maintenance
· Pupation/aestivation containers are watered weekly to maintain about 30% soil satura-tion.
· Containers are checked every other day beginning in late August to recover adults emerg-ing prematurely
· In September, after the temperature is decreased, containers are checked daily for emergingadults.
EMERGING ADULTS (SEPTEMBER – DECEMBER)
Adults complete aestivation and emerge from the soil in the fall, approximately three weeksafter the temperature is decreased. Adults become active and climb up the sides and lids of thepupation/aestivation containers. Premature adult emergence is undesired because emergingadults require developing HWA nymphs to feed on, which do not emerge from diapauseuntil October.
Third Symposium on Hemlock Woolly Adelgid Posters
Lamb et al. ___________________________________________________________________________________
316
Storage (Feeding/Oviposition Containers)
· Emerging adults are transferred from the lids and sides of the pupation/aestivation con-tainers to adult feeding/oviposition containers with developing HWA nymphs and dis-tilled water.
· Recently emergent adults are kept at 6°C and 12 hours daylength. Temperature is low-ered if prey is limited.
Maintenance
· Pupation/aestivation containers are checked for emerging adults several times per day,particularly in the late afternoon and evening.
· Distilled water is sprayed through the screen lids of the feeding/oviposition containersseveral times per week to ensure adults have adequate water. When temperature is de-creased (about November), the frequency of watering decreases.
· Active adults are either released in the field or maintained in feeding/oviposition con-tainers according to the procedures outlined in Table 1.
CONCLUSION
These rearing procedures have produced approximately 44,000 F1 adults during the past 4years. Survival through pupation and aestivation has a greater influence on the number of F1adults produced than size of the initial colony. In addition, field collected adults seem to bemore fecund than lab-reared adults; therefore, starter colonies should be larger (>2000) ifadults are lab-reared and smaller (500-1000) if adults are field-collected.
Several parts of the current rearing procedures need further improvement. Most impor-tantly, the preparation and maintenance of the pupation medium needs to be modified toreduce the high level of pre-pupal and pupal mortality that occurs. In addition, pupation/aestivation containers should be modified to increase the ease and efficiency of adult recoverywhile they are emerging from the soil. Development of rearing containers that take advantageof the “migratory stage” of mature larvae immediately after dropping from the foliage wouldreduce the time spent checking funnel jars. The cage should allow larvae, needles, and debristo fall into one level and from there, enable the larvae to move themselves to a pupation/aestivation container, thereby preventing needles and debris from falling into the sterile pu-pating medium.
ACKNOWLEDGEMENTS
The authors are indebted to all who have helped rear L. nigrinus in the past four years. Indi-viduals who have made significant contributions are: A. McPhee, H. Gatton, L. Ferguson, B.Roessler, B. Eisenback, D. Mausel, E. Fritz, M. Beversdorf, M. Cornwell, and M. Roller. Wethank the USDA Forest Service, FHP, and USDA APHIS for funding this project.
__________________________________________________________________________________ Lamb et al.
Posters Third Symposium on Hemlock Woolly Adelgid
317
REFERENCES
Furniss, R.L. and V.M. Carolin. 1977. Western Forest Insects. USDA For. Serv. Misc.Pub. 1339.
Gray, D.R. and S.M. Salom. 1996. Biology of the hemlock woolly adelgid in the southernAppalachians, pp. 16-25. In First Hemlock Woolly Adelgid Review, ed. S.M. Salom,T.C. Tigner, and R.C. Reardon. 12 October 1995, Charlottesville, Virginia. FHTET 96-10. U.S. Department of Agriculture, Forest Service, Morgantown, West Virginia.
Huffaker, C.B., C.E. Kennett. 1969. Some aspects of assessing efficiency of natural en-emies. Canadian Entomologist 101:425-446.
Lamb, A.B., S.M. Salom, and L.T. Kok. 2002. Field evaluation and improvement of rear-ing procedures for Laricobius nigrinus (Fender) [Coleoptera: Derodontidae], a predatorof hemlock woolly adelgid, pp. 289-296. In Proceedings, Hemlock Woolly Adelgid inthe Eastern United States Symposium, ed. B. Onken, R. Reardon, and J. Lashomb. 5-7February 2002, East Brunswick, New Jersey, Rutgers.
Lamb, A.B., S.M. Salom, and L.T. Kok. 2005. Survival and reproduction of Laricobiusnigrinus Fender (Coleoptera: Derodontidae), a predator of the hemlock woolly adelgid,Adelges tsugae Annand (Homoptera: Adelgidae) in field cages. Biological Control32(2):200-207.
McClure, M.S., 1987. Biology and control of hemlock woolly adelgid. Ct. Ag. Exp. Sta.Bull. No. 851.
McClure, M.S. 1989. Evidence of a polymorphic life cycle in the hemlock woolly adelgid,Adelges tsugae (Homoptera: Adelgidae). Annals of the Entomological Society of America82:50-54.
McClure, M.S. 1991. Density-dependent feedback and population cycles in Adelges tsugae(Homoptera: Adelgidae). Environmental Entomology 20:258-264.
McClure, M.S., C.A.S-J. Cheah, and T.C. Tigner. 2000. Is Pseudoscymnus tsugae thesolution to the hemlock woolly adelgid problem? an early perspective, pp. 89-96. InProceedings: Symposium on sustainable management of hemlock ecosystems in easternNorth America, 22-24 June 1999, ed. K.A. McManus, K.S. Shields, D.R. Souto. USDAFor. Serv. Gen. Tech. Rep. NE-267. Newtown Square, Pennsylvania.
Montgomery, M.E., D. Yao, and H. Wang. 2000. Chinese Coccinellidae for biologicalcontrol of the hemlock woolly adelgid: description of native habitat. In Proceedings:Symposium on sustainable management of hemlock ecosystems in eastern NorthAmerica, 22-24 June 1999, ed. K.A. McManus, K.S. Shields, D.R. Souto. USDA For.Serv. Gen. Tech. Rep. NE-267. Newtown Square, Pennsylvania.
Salom, S.M., A.A. Sharov, W.T. Mays, and D.R. Gray. 2002. Influence of temperature ondevelopment of hemlock woolly adelgid (Homoptera: Adelgidae) progrediens. Journalof Entomological Science 37:166-176.
Third Symposium on Hemlock Woolly Adelgid Posters
Lamb et al. ___________________________________________________________________________________
318
Wallace, M.S. and F.P. Hain. 2000. Field surveys and evaluation of native and establishedpredators of the hemlock woolly adelgid (Homoptera: Adelgidae) in the southeasternUnited States. Environmental Entomology 29:638-644.
Ward, J.S., M.E. Montgomery, C.A.S.-J. Cheah, B.P. Onken, and R.S. Cowles. 2004.Eastern hemlock forests: guidelines to minimize the impacts of hemlock woolly adelgid,pp. 2-3. USDA For. Serv., Northeastern Area State and Private Forestry, NA-TP-03-04.Morgantown, West Virginia.
Zilahi-Balogh, G.M.G. 2001. Biology of Laricobius nigrinus Fender (Coleoptera:Derodontidae) and its potential as a biological control agent of the hemlock woollyadelgid, Adelges tsugae Annand (Homoptera: Adelgidae) in the eastern United States, pp.77-89. Ph.D. Dissertation, Virginia Polytechnic Institute and State University,Blacksburg, Virginia.
Zilahi-Balogh, G.M.G., L.T. Kok, and S.M. Salom. 2002. Host specificity tests ofLaricobius nigrinus Fender (Coleoptera: Derodontidae), a biological control agent of thehemlock woolly adelgid, Adelges tsugae (Homoptera: Adelgidae). Biological Control24:192-198.
Zilahi-Balogh, G.M.G.; L.M. Humble, A.B. Lamb, S.M. Salom, and L.T. Kok. 2003a.Seasonal abundance and synchrony between Laricobius nigrinus Fender (Coleoptera:Derodontidae) and its prey, the hemlock woolly adelgid, Adelges tsugae (Homoptera:Adelgidae) in British Columbia. Canadian Entomologist 135:103-115.
Zilahi-Balogh, G.M.G.; S.M. Salom, and L.T. Kok. 2003b. Development and reproductivebiology of Laricobius nigrinus, a potential biological control agent of Adelges tsugae.Biocontrol 48:293-306.
Zilahi-Balogh, G.M.G., S.M. Salom, L.T. Kok. 2003c. Temperature-dependent develop-ment of the specialist predator Laricobius nigrinus Fender (Coleoptera: Derodontidae).Environmental Entomology 32:1322-1328.
_____________________________________________________________________________________ Lishawa
Posters Third Symposium on Hemlock Woolly Adelgid
319
HWA RISK ASSESSMENT IN DEER WINTERING AREAS OF SOUTHERN VERMONT
Shane C. Lishawa
University of Vermont, School of Environment and Natural Resources,218 Aiken Center, Burlington VT 05405,
email: [email protected]
ABSTRACT
Hemlock woolly adelgid (HWA), Adelges tsugae Annand, an introduced aphid-like insectfrom Asia, is threatening to eliminate eastern hemlock, Tsuga canadensis (L.) Carr., through-out its range. Among its many ecological functions, eastern hemlock provides winter coverand browse for white-tailed deer, Odocoileus virginianus Zimmerman, in areas experiencingharsh winter conditions. In central and southern Vermont, eastern hemlock is the basic com-ponent of many white-tailed deer wintering areas (DWA) and is thought to reduce snowdepths and moderate temperatures. The first objective of this study is to determine the rela-tive risk of HWA infestation to the eastern hemlock dominated DWAs in southern Vermont.The eastern hemlock component of conifer dominated DWAs will be determined and used ina GIS model predicting the susceptibility and vulnerability of DWAs to HWA infestation. Asub-sample of thirty-two DWAs in southern Vermont were inventoried in summer and fallof 2004 for analysis. The second objective is to quantify the effects of eastern hemlock coveron winter temperature and snow depth conditions. Within six site-paired hemlock and hard-wood stands, temperatures were recorded half-hourly and snow depths were recorded bi-weekly in the winters of ‘03-‘04 and ‘04-‘05. Preliminary results indicate that extreme tem-peratures are moderated and snow depth is reduced within eastern hemlock stands as com-pared to site-paired hardwood stands. The elimination of eastern hemlock from the forests ofsouthern Vermont by HWA would greatly alter the local ecology and will dramatically affectspecies reliant upon hemlock stands for winter habitat.
KEYWORDS
Tsuga canadensis, Odocoileus virginianus, Adelges tsugae, winter, risk assessment.
INTRODUCTION
Eastern hemlock, Tsuga canadensis (L.) Carr, represents the most important deer winteringarea (DWA) cover type in southern Vermont (Reay et al. 1990), and the removal of this coverby hemlock woolly adelgid, Adelges tsugae Annand (HWA), has the potential to negativelyaffect white-tailed deer, Odocoileus virginianus Zimmerman, populations and health. It isbelieved that, for deer living in areas with severe winters, the two main factors leading towinter hardship are cold temperatures and deep snow pack (Verme 1968). Eastern hemlock is
Third Symposium on Hemlock Woolly Adelgid Posters
Lishawa _____________________________________________________________________________________
320
considered to be one of the most shade-tolerant species in North America (Goerlich andNyland 1999) and grows in stands with particularly dense foliage, which is thought to reduceradiant heat loss and intercept falling snow. Thus, it is assumed that temperatures beneathhemlock canopies are moderated and snow depth is decreased, but this has not been statisti-cally quantified. Dominant overstory vegetation replacing dying eastern hemlock tends to beexclusively hardwood species (Orwig and Foster 1998, Orwig and Kizlinski 2002), and there-fore current winter conditions within hardwood stands approximate those of HWA after-math forests.
The methods required to accurately remotely sense eastern hemlock are not yet devel-oped. As a result, a large scale eastern hemlock coverage map of Vermont is not available,whereas an extensive GIS data layer of the DWAs of Vermont is available (VCGI 2003).Thus, the conifer component of the DWA GIS layer is currently the best approximation of aneastern hemlock coverage map for southern Vermont.
The primary objective of this study is to determine the relative risk of HWA infestationto the eastern hemlock dominated DWAs in southern Vermont. The second objective is tocompare winter environmental conditions in hemlock stands versus hardwood stands to quan-tify some of the potential effects of HWA induced defoliation on important winter habitatelements.
METHODS
RISK ASSESSMENT OF DEER WINTERING AREAS
A random subsample of 32 DWAs in southern Vermont was selected for field surveying inthe summer of 2004 from three elevations and three size classes. One sampling plot wasassigned for every 40 acres of conifer and mixed cover within each site. Plot data included:DBH of trees within a 10-factor prism plot, understory stems and percent cover by species,groundcover stems and percent cover by species, and crown transparency. At the stand level,data will be evaluated for elevation and size class trends in the eastern hemlock component ofDWAs. At the plot level, a spatial statistical analysis will be performed relating site attributes(slope, aspect, elevation, edaphic characteristics, and distance from streams) and eastern hem-lock occurrence in order to create a GIS model predicting eastern hemlock occurrence in thelandscape.
Spatial statistical analysis using the HWA risk assessment GIS layers (Machin 2003) andvegetation data will be done in order to classify the DWAs of southern Vermont into low,medium, and high risk categories based upon the estimated eastern hemlock component andvulnerability and susceptibility to HWA infestation.
WINTER HABITAT ASSESSMENT
To compare important white-tailed deer winter habitat conditions in hardwood versus hem-lock stands, three sites were chosen for study in winter ’03-’04 and six sites in winter ’04-’05.Sites were selected across a range of aspects and elevations in order to account for the effectsof landscape diversity within DWAs. Eastern hemlock and hardwood site-pairs were se-
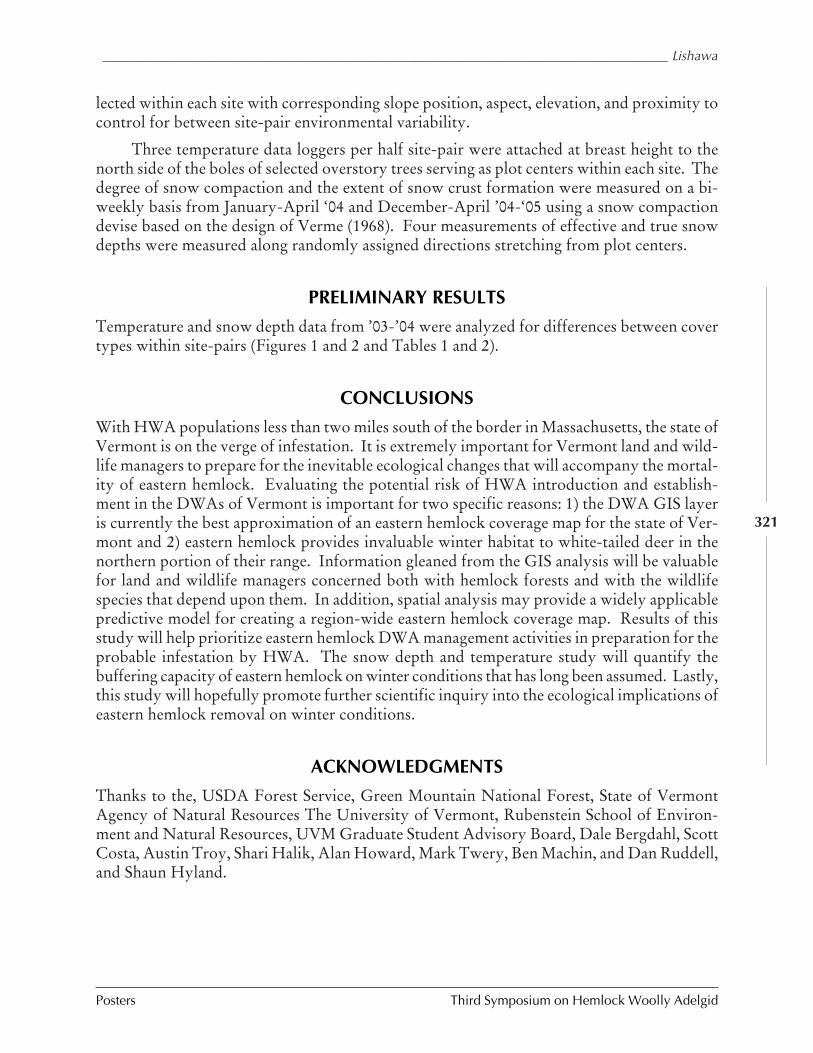
_____________________________________________________________________________________ Lishawa
Posters Third Symposium on Hemlock Woolly Adelgid
321
lected within each site with corresponding slope position, aspect, elevation, and proximity tocontrol for between site-pair environmental variability.
Three temperature data loggers per half site-pair were attached at breast height to thenorth side of the boles of selected overstory trees serving as plot centers within each site. Thedegree of snow compaction and the extent of snow crust formation were measured on a bi-weekly basis from January-April ‘04 and December-April ’04-‘05 using a snow compactiondevise based on the design of Verme (1968). Four measurements of effective and true snowdepths were measured along randomly assigned directions stretching from plot centers.
PRELIMINARY RESULTS
Temperature and snow depth data from ’03-’04 were analyzed for differences between covertypes within site-pairs (Figures 1 and 2 and Tables 1 and 2).
CONCLUSIONS
With HWA populations less than two miles south of the border in Massachusetts, the state ofVermont is on the verge of infestation. It is extremely important for Vermont land and wild-life managers to prepare for the inevitable ecological changes that will accompany the mortal-ity of eastern hemlock. Evaluating the potential risk of HWA introduction and establish-ment in the DWAs of Vermont is important for two specific reasons: 1) the DWA GIS layeris currently the best approximation of an eastern hemlock coverage map for the state of Ver-mont and 2) eastern hemlock provides invaluable winter habitat to white-tailed deer in thenorthern portion of their range. Information gleaned from the GIS analysis will be valuablefor land and wildlife managers concerned both with hemlock forests and with the wildlifespecies that depend upon them. In addition, spatial analysis may provide a widely applicablepredictive model for creating a region-wide eastern hemlock coverage map. Results of thisstudy will help prioritize eastern hemlock DWA management activities in preparation for theprobable infestation by HWA. The snow depth and temperature study will quantify thebuffering capacity of eastern hemlock on winter conditions that has long been assumed. Lastly,this study will hopefully promote further scientific inquiry into the ecological implications ofeastern hemlock removal on winter conditions.
ACKNOWLEDGMENTS
Thanks to the, USDA Forest Service, Green Mountain National Forest, State of VermontAgency of Natural Resources The University of Vermont, Rubenstein School of Environ-ment and Natural Resources, UVM Graduate Student Advisory Board, Dale Bergdahl, ScottCosta, Austin Troy, Shari Halik, Alan Howard, Mark Twery, Ben Machin, and Dan Ruddell,and Shaun Hyland.
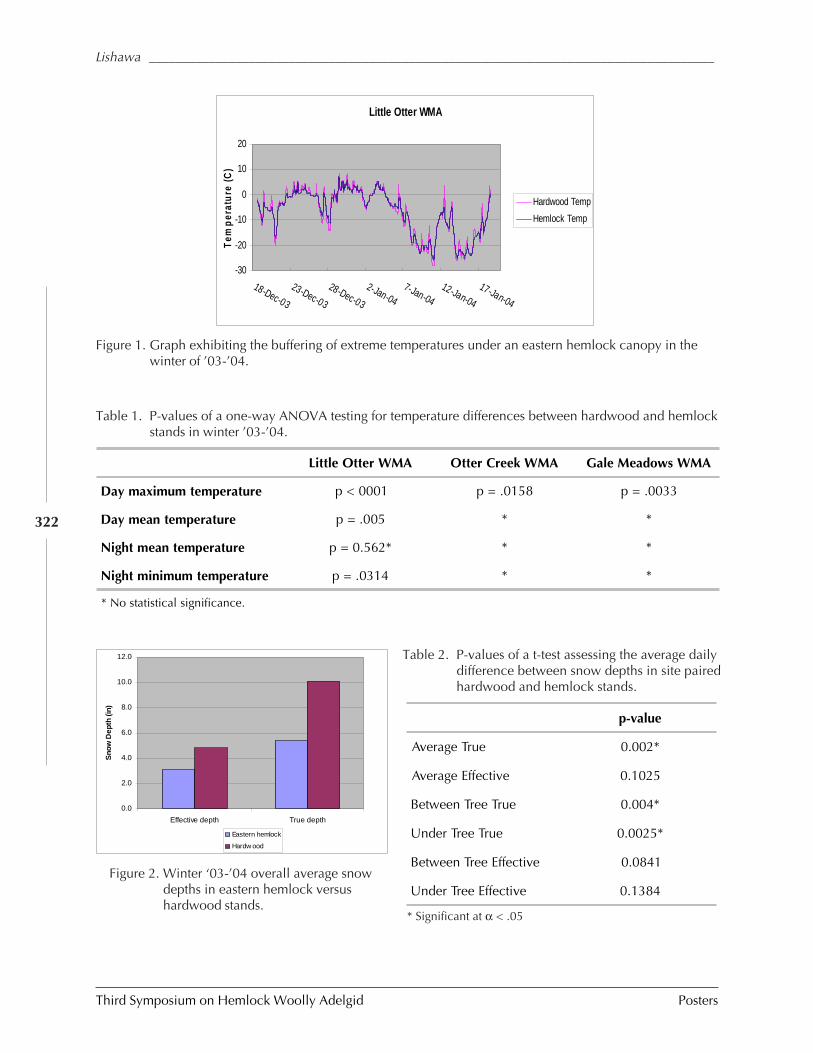
Third Symposium on Hemlock Woolly Adelgid Posters
Lishawa _____________________________________________________________________________________
322
Figure 1. Graph exhibiting the buffering of extreme temperatures under an eastern hemlock canopy in thewinter of ’03-’04.
Little Otter WMA
-30
-20
-10
0
10
20
18-Dec-03
23-Dec-03
28-Dec-03
2-Jan-047-Jan-04
12-Jan-04
17-Jan-04
Tem
per
atu
re (
C)
Hardwood Temp
Hemlock Temp
Table 1. P-values of a one-way ANOVA testing for temperature differences between hardwood and hemlockstands in winter ’03-’04.
Little Otter WMA Otter Creek WMA Gale Meadows WMA
Day maximum temperature p < 0001 p = .0158 p = .0033
Day mean temperature p = .005 * *
Night mean temperature p = 0.562* * *
Night minimum temperature p = .0314 * *
* No statistical significance.
Table 2. P-values of a t-test assessing the average dailydifference between snow depths in site pairedhardwood and hemlock stands.
* Significant at α < .05
p-value
Average True 0.002*
Average Effective 0.1025
Between Tree True 0.004*
Under Tree True 0.0025*
Between Tree Effective 0.0841
Under Tree Effective 0.1384Figure 2. Winter ‘03-’04 overall average snow
depths in eastern hemlock versushardwood stands.
0.0
2.0
4.0
6.0
8.0
10.0
12.0
Effective depth True depth
Sno
w D
epth
(in)
Eastern hemlock
Hardw ood
_____________________________________________________________________________________ Lishawa
Posters Third Symposium on Hemlock Woolly Adelgid
323
REFERENCES
Goerlich, D.L. and R.D. Nyland. 2000. Natural regeneration of eastern hemlock: a review,pp. 14-22. In Proceedings: Symposium on Sustainable Management of Hemlock Ecosys-tems in Eastern North America, June 22-24, 1999, Durham, New Hampshire, ed. K.A.McManus, K.S. Shields, and D.R. Souto. USDA Forest Service Northeastern ResearchStation General Technical Report NE-267.
Machin, B. 2003. A geographic information system based assessment of susceptibility andvulnerability of eastern hemlocks to hemlock woolly adelgid. MS Thesis, The Universityof Vermont, Burlington, Vermont.
Orwig, D.A. and D.R. Foster. 1998. Forest response to the introduced hemlock woollyadelgid in southern New England, USA. Bulletin of the Torrey Botanical Club 125:60-73.
Orwig, D.A. and M.L. Kizlinski. 2002. Vegetation response following hemlock woollyadelgid infestation, hemlock decline, and hemlock salvage logging. In Proceedings,Hemlock Woolly Adelgid in the Eastern United States Symposium, ed. B. Onken, R.Reardon, and J. Lashomb. 5-7 February 2002, East Brunswick, New Jersey, Rutgers.
Reay, R.S., D.W. Blodgett, B.S. Burns, S.J. Weber, and T. Frey. 1990. Management guidefor deer wintering areas in Vermont. Vermont Department of Forests, Parks, and Recre-ation; Vermont Department of Fish and Wildlife.
Verme, L.J. 1968. An index of winter weather severity for northern deer. Journal of WildlifeManagement 32:566-574.
Vermont Center for Geographic Information. 2003. EcologicHabitat_DEERWN: DeerWintering Areas. Vermont Agency of Natural Resources. http://www.vcgi.org.
Third Symposium on Hemlock Woolly Adelgid Posters
McAvoy et al. ________________________________________________________________________________
324
IMPACT OF IMIDACLOPRID ON HEMLOCK WOOLLY ADELGID (ADELGES TSUGAE)AND WATER QUALITY AT MT. LAKE, VIRGINIA
Tom McAvoy, Warren T. Mays, Scott M. Salom, and Loke T. Kok
Dept. of Entomology, Virginia Polytechnic Institute and State University,Blacksburg, VA 24061
ABSTRACT
Two groups of hemlock trees were treated with imidacloprid using Kioritz® soil injectorsand one group of trees with Mauget stem injection capsules from 2001 to 2003. In one groupof soil injected trees the density of HWA was reduced by 35%, 14 months after the firstapplication and two months after the second application. Tree health declined in all years butnot as much as for treated trees in this group. HWA density was reduced by 52% in a secondgroup of soil injected trees, three months after the first treatment and 93% one year after thesecond treatment. Tree health remained unchanged for three years for all trees, treated anduntreated. Stem-injected trees showed a 52% reduction in HWA three months after the firsttreatment and an 87% reduction one year after the second injection. Tree health of these treesdid not change and were no different that the untreated trees. Both groups of trees (soil in-jected and stem injected) had similar health indices, and both treatment methods are provid-ing a similar protection from HWA. Treated trees were located more than 50 m from astream or the lake. Imidacloprid was detected in lake and spring water in concentrationsranging from less than 0.02 ppb to 1.7 ppb in lake water and 3.5 ppb in spring water. Thedensity of invertebrates in the springs did not change from 2001 – 2003. However, cautionmust be used when applying imidacloprid near waterways, especially in rocky well-drainedsoil.
KEYWORDS:
Imidacloprid, hemlock woolly adelgid, Adelges tsugae, water quality, tree health, Imicide®,Merit®.
INTRODUCTION
Mountain Lake Resort is located in Giles County, Virginia. This 1,052 ha resort is situatedon Salt Pond Mountain (1,000–1,200 m) with a 22 ha natural lake. Hemlock woolly adelgid(HWA) Adelges tsugae Annand began infesting Tsuga spp. in southwest during the mid-1990s. HWA was first noticed in the resort area in 1999. Old growth stands of hemlocksencircle the lake, with many trees over 100 cm diameter at breast height (DBH). The hem-locks (Tsuga canadensis (L.) Carrière) surrounding the lake are the dominant species in thisunique climax forest. In order to preserve as many trees as possible the resort contracted theauthors and a chemical control program was begun in 2001.
________________________________________________________________________________ McAvoy et al.
Posters Third Symposium on Hemlock Woolly Adelgid
325
Based on the success of imidacloprid (Steward and Horner 1994, Tatter et al. 1998, Stewardet al. 1998, Cowles and Cheah 2002, Silcox 2002, Webb et al. 2003), this product was used tocontrol HWA at Mt. Lake. The effectiveness of imidacloprid treatments on HWA, tree health,migration of imidacloprid into the lake, and impact on stream invertebrates were evaluated.
METHODS
Two methods of imidacloprid injection, soil and stem injections, were used. To minimizeimidacloprid migrating into the water table or streams in the area, stem injections were usedwhere treated trees were more than 50 m from the lake, springs, or streams.
Three groups of hemlock trees (84, 26, and 32, respectively) were treated between 2001and 2003. Groups I and II were treated with imidacloprid soil injections and Group III withstem injections. Based on their probability of survival, trees that were less than 50% defoli-ated and had new growth were selected. Tree DBH ranged from 5 to 128 cm, with a mean of17 cm. Groups I and II were treated by soil injection with imidacloprid (Merit® 75 WP) at arate of 0.75 g/cm DBH (0.55 g a.i./cm DBH) with Kioritz® soil injectors in April of 2001,2002, and 2003. Soil treatments were made using the Basal System (Silcox 2002). Injectionswere made around the tree, 10 to 20 cm from the tree base. Trees in Group III were close toa stream (Pond Drain) and were stem injected with imidacloprid (Imicide® 10%) at the rateof one 3 ml Mauget (J.J. Mauget Company, Arcadia, California) capsule/5 cm DBH in April2002 and April 2003.
A subset of treated trees was paired with untreated trees for each group. The untreatedtrees selected were similar in size and located up slope and at least 15 m away from its pairedtreated tree. To determine the density of HWA, the number of live HWA adult sistens inMarch and adult progrediens in June were counted on 30 cm of the terminal branches on thenorth, south, east, and west aspects of each treated and untreated tree.
Tree health was evaluated for each treated and untreated tree once during the growingseason by recording the percent crown density, live crown ratio, live branches, live tips, andnew foliage. These five parameters were summed and divided by 5 to obtain a health index. Avalue of 100 would be a perfect tree and 0 would indicate a dead tree.
Water samples (1.9 l) were taken at four locations in the lake and from four springs thatflowed into the lake to determine if imidacloprid was migrating through the soil and into thelake and water-table at Mountain Lake. Samples were analyzed at Virginia Tech PesticideResidue Lab using high performance liquid chromatography (HPLC).
To determine the impact of imidacloprid on stream invertebrates, all springs flowinginto the lake were sampled in the months of April and June of 2001, 2002, and 2003. Samplingwas done each spring between the lake and the forest edge. For each year of sampling, fiftystones were picked up and the invertebrates found were collected at each sample site. Thewater level in these springs was too shallow to use a net. Due to the rise in the lake level in2003 the springs that were sampled became submerged and invertebrate sampling was notpossible.
Third Symposium on Hemlock Woolly Adelgid Posters
McAvoy et al. ________________________________________________________________________________
326
Tree health indices for each treatment group and the number of invertebrates recordedfrom the springs at each sample date were analyzed using one-way analysis of variance(ANOVA) and the Tukey-Kramer HSD test (SAS Institute 1989).
RESULTS
GROUP I
No statistically significant difference in the HWA density was found between treated anduntreated trees 10 months after treatment (Table 1, Figure 1). At this sample date (Feb. 15,2002) there were 1.9 HWA per cm on the treated trees and 1.5 HWA per cm on the untreatedtrees. This is approximately a 37% drop in the HWA density from the previous year and islikely due to the natural decline in HWA several years after the initial infestation (McClure1991). Ten months should be a more than adequate time for imidacloprid to enter the hem-lock branch tips. Tatter et al., (1998) reported that lethal concentrations of imidaclopridoccurred 12 weeks after soil injections. A possible reason for no treatment effect on HWA isthat an insufficient amount of imidacloprid reached the branch tips due to below normalrainfall for several months after the first application. The highly organic, loose rocky soilmay have resulted in low rates of binding with soil particles. However, after the secondapplication on April 6, 2002, sampling on June 18, 2002, showed a 35% reduction in HWA onthe treated trees compared with the untreated trees. As planned, no soil injections were madeto this group of trees in 2003 and 2004 and the HWA population was very low on treated anduntreated trees.
Due to several years of drought and HWA infestation hemlock health declined signifi-cantly in 2002 (Table 2). There was no difference in tree health between the treated anduntreated trees until 2003, the second year after the first treatment. The health index of thetreated trees was approximately 52 in 2003 and 2004 while the health index of the untreatedtrees declined from 44 to 20. The reduction in HWA population density caused by imidaclopridmay have prevented the treated trees from declining significantly in health. Recovery of treehealth following imidacloprid treatments was not as great as reported by Webb et al. (2003),who reported dramatic recovery of tree health following imidacloprid treatments. Their studywas done in a residential landscape and differences in soil type may have contributed to thegreater recovery in health compared to our study done in a forest with rocky, well-drainedsoil.
GROUP II
Three months after treatment the number of HWA on the treated trees (1.14/cm) was 52%lower than the untreated trees (2.39 / cm) (Table 3, Figure 1). In 2003 the HWA populationwas very low on the treated and untreated trees due to the natural decline that HWA exhibitsseveral years after initial infestation. HWA density was also very low in 2004; however, therewas a 93% reduction in HWA on the treated trees compared with the untreated trees.
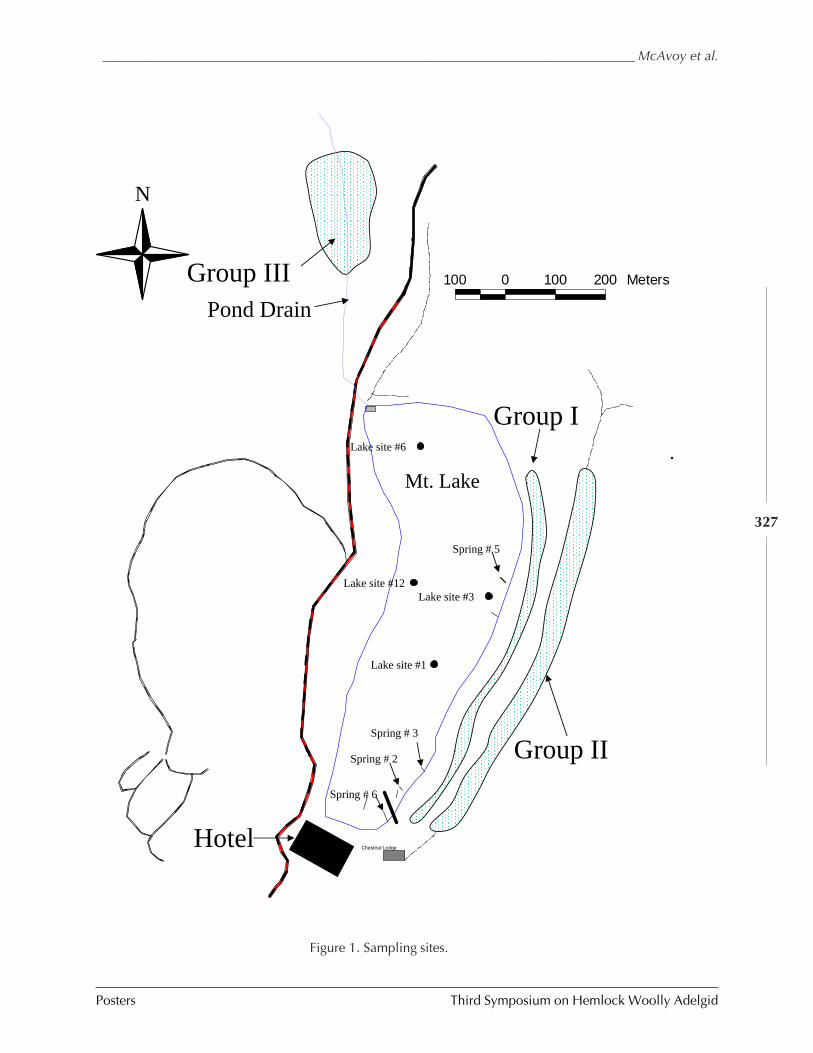
________________________________________________________________________________ McAvoy et al.
Posters Third Symposium on Hemlock Woolly Adelgid
327
Chestnut Lodge
N
100 0 100 200 MetersGroup III
Group II
Group I
Mt. Lake
Spring # 3
Spring # 2
Spring # 6
Spring # 5
Lake site #1
Lake site #12
Lake site #6
Lake site #3
Hotel
Pond Drain
Figure 1. Sampling sites.
Third Symposium on Hemlock Woolly Adelgid Posters
McAvoy et al. ________________________________________________________________________________
328
Unlike the health of Group I, there was no difference in tree health between the treatedand untreated trees and no change in health over the three-year period (Table 4). This groupof trees also had a lower density of HWA than Group I in 2002, and this may have resulted inless stress on these trees. No treated or untreated trees have died in this group.
GROUP III.
Eleven weeks (July 9, 2002) after the first treatment (Table 5, Figure 1) the treated trees had66% fewer HWA (0.59/cm) than untreated trees (1.73/cm). From April 2003 to April 2004,no differences in HWA density occurred. However, in June 2004 there were 87% fewerHWA on the treated trees (0.004 HWA / cm) compared with untreated trees (0.031 HWA /cm). Health of the treated and untreated trees improved from 2002 to 2003, but then declinedin 2004 to the levels found in 2002 (Table 6).
MIGRATION OF MERIT
One month after the first soil treatment imidacloprid was found at 3.6 and 1.6 ppb in samples#6 and #12 (Figure 1), respectively (Table 7). No imidacloprid was found in lake water samples#1 and #3. After soil treatments in 2002, no imidacloprid was detected. While imidaclopridwas not detected in the lake water three weeks after the 2003 soil injection, it was detected inthe spring water.
Three months after this treatment trace amounts were found in the lake water and mea-surable amounts were found in the spring water. Measurable and trace amounts were alsofound in the lake and spring water in 2004. The soil at Mt. Lake is very porous and rocky andlikely allowed for the migration of imidacloprid into the springs and lake. When soil injec-tions were made, loose rock was often contacted. Soil injections in very rocky soil such asthis may not be appropriate due to the potential migration of imidacloprid.
IMPACT ON NONTARGET BENTHIC SPECIES
The number of invertebrates did not change from 2001 to 2003 (Figure 1, Table 8). Although,imidacloprid was found in the spring water in April 2003 (Table 7) at a concentration up to0.5 ppb, it did not appear to impact the invertebrate population. No sampling was done after2003 due to the rise in the lake level, so the impact of the higher concentrations of imidaclopridfound in 2004 could not be determined. The closest trees to the lake that were soil injectedwere approximately 50 m. However, many underground springs occur in this area, and it islikely that imidacloprid could travel into the springs and lake through this route.
The LC50 for trout, daphnia, and algae is 211,000, 85,000, and 10,000 ppb, respectively(Extoxnet 2005). The levels of imidacloprid in the lake water were well below detrimentalconcentrations for these groups of organisms. However, caution must be used when apply-ing imidacloprid in rocky soils near water due to migration protential.
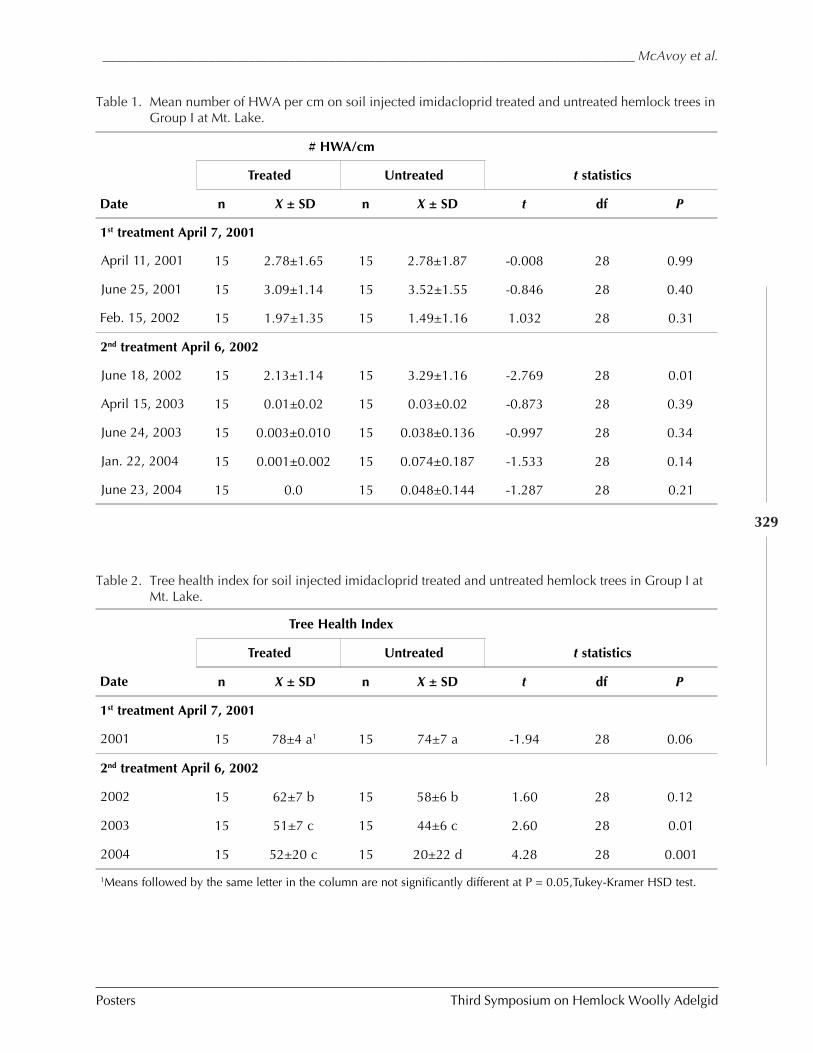
________________________________________________________________________________ McAvoy et al.
Posters Third Symposium on Hemlock Woolly Adelgid
329
Tree Health Index
Treated Untreated t statistics
Date n X ± SD n X ± SD t df P
1st treatment April 7, 2001
2001 15 78±4 a1 15 74±7 a -1.94 28 0.06
2nd treatment April 6, 2002
2002 15 62±7 b 15 58±6 b 1.60 28 0.12
2003 15 51±7 c 15 44±6 c 2.60 28 0.01
2004 15 52±20 c 15 20±22 d 4.28 28 0.001
1Means followed by the same letter in the column are not significantly different at P = 0.05,Tukey-Kramer HSD test.
Table 2. Tree health index for soil injected imidacloprid treated and untreated hemlock trees in Group I atMt. Lake.
# HWA/cm
Treated Untreated t statistics
Date n X ± SD n X ± SD t df P
1st treatment April 7, 2001
April 11, 2001 15 2.78±1.65 15 2.78±1.87 -0.008 28 0.99
June 25, 2001 15 3.09±1.14 15 3.52±1.55 -0.846 28 0.40
Feb. 15, 2002 15 1.97±1.35 15 1.49±1.16 1.032 28 0.31
2nd treatment April 6, 2002
June 18, 2002 15 2.13±1.14 15 3.29±1.16 -2.769 28 0.01
April 15, 2003 15 0.01±0.02 15 0.03±0.02 -0.873 28 0.39
June 24, 2003 15 0.003±0.010 15 0.038±0.136 -0.997 28 0.34
Jan. 22, 2004 15 0.001±0.002 15 0.074±0.187 -1.533 28 0.14
June 23, 2004 15 0.0 15 0.048±0.144 -1.287 28 0.21
Table 1. Mean number of HWA per cm on soil injected imidacloprid treated and untreated hemlock trees inGroup I at Mt. Lake.
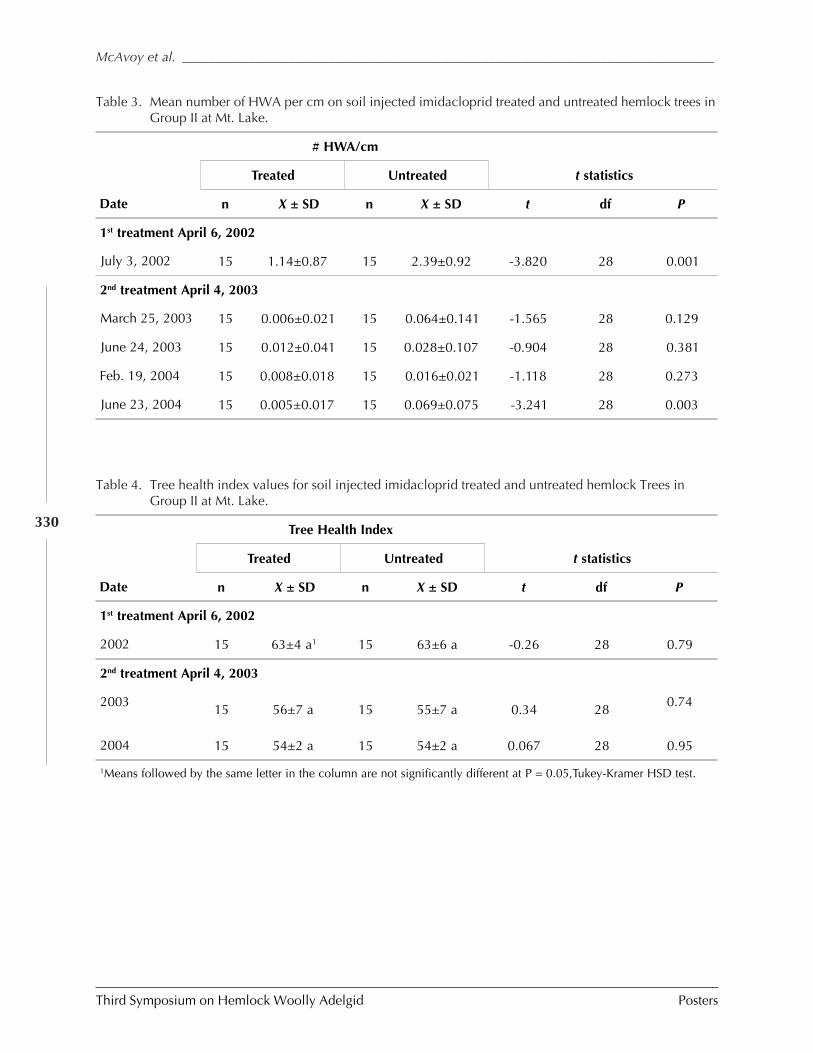
Third Symposium on Hemlock Woolly Adelgid Posters
McAvoy et al. ________________________________________________________________________________
330 Tree Health Index
Treated Untreated t statistics
Date n X ± SD n X ± SD t df P
1st treatment April 6, 2002
2002 15 63±4 a1 15 63±6 a -0.26 28 0.79
2nd treatment April 4, 2003
200315 56±7 a 15 55±7 a 0.34 28
0.74
2004 15 54±2 a 15 54±2 a 0.067 28 0.95
1Means followed by the same letter in the column are not significantly different at P = 0.05,Tukey-Kramer HSD test.
Table 4. Tree health index values for soil injected imidacloprid treated and untreated hemlock Trees inGroup II at Mt. Lake.
# HWA/cm
Treated Untreated t statistics
Date n X ± SD n X ± SD t df P
1st treatment April 6, 2002
July 3, 2002 15 1.14±0.87 15 2.39±0.92 -3.820 28 0.001
2nd treatment April 4, 2003
March 25, 2003 15 0.006±0.021 15 0.064±0.141 -1.565 28 0.129
June 24, 2003 15 0.012±0.041 15 0.028±0.107 -0.904 28 0.381
Feb. 19, 2004 15 0.008±0.018 15 0.016±0.021 -1.118 28 0.273
June 23, 2004 15 0.005±0.017 15 0.069±0.075 -3.241 28 0.003
Table 3. Mean number of HWA per cm on soil injected imidacloprid treated and untreated hemlock trees inGroup II at Mt. Lake.
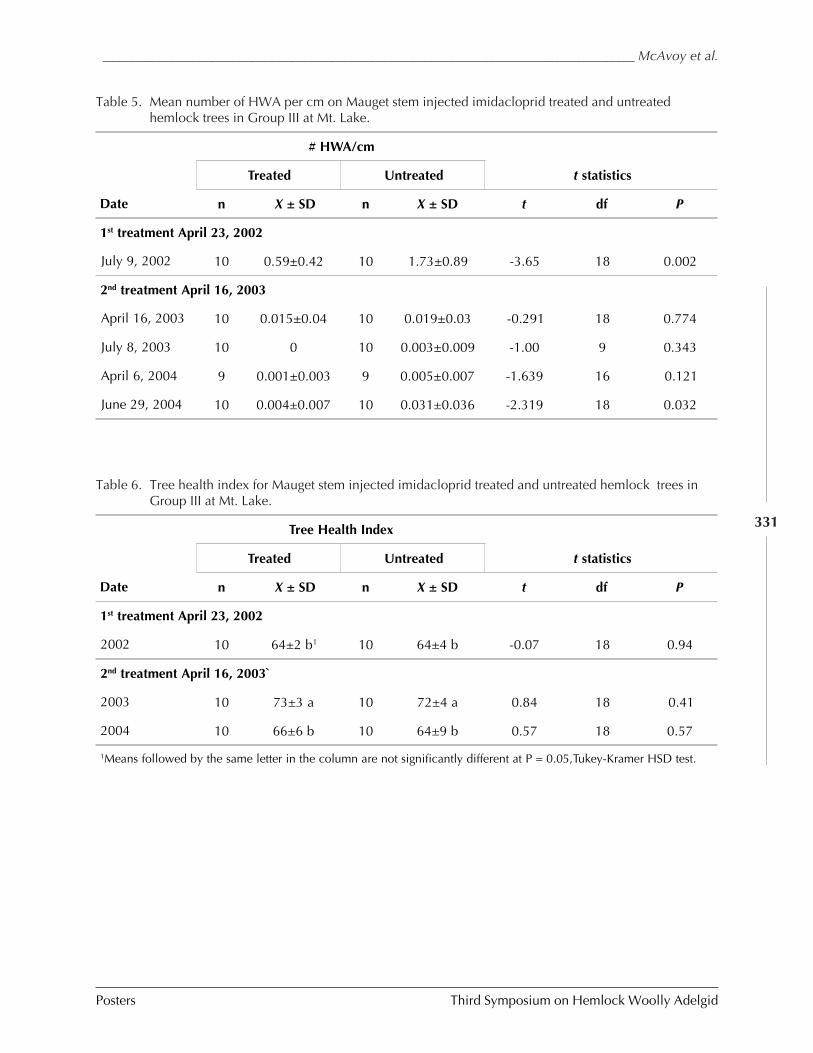
________________________________________________________________________________ McAvoy et al.
Posters Third Symposium on Hemlock Woolly Adelgid
331Tree Health Index
Treated Untreated t statistics
Date n X ± SD n X ± SD t df P
1st treatment April 23, 2002
2002 10 64±2 b1 10 64±4 b -0.07 18 0.94
2nd treatment April 16, 2003`
2003 10 73±3 a 10 72±4 a 0.84 18 0.41
2004 10 66±6 b 10 64±9 b 0.57 18 0.57
1Means followed by the same letter in the column are not significantly different at P = 0.05,Tukey-Kramer HSD test.
Table 6. Tree health index for Mauget stem injected imidacloprid treated and untreated hemlock trees inGroup III at Mt. Lake.
# HWA/cm
Treated Untreated t statistics
Date n X ± SD n X ± SD t df P
1st treatment April 23, 2002
July 9, 2002 10 0.59±0.42 10 1.73±0.89 -3.65 18 0.002
2nd treatment April 16, 2003
April 16, 2003 10 0.015±0.04 10 0.019±0.03 -0.291 18 0.774
July 8, 2003 10 0 10 0.003±0.009 -1.00 9 0.343
April 6, 2004 9 0.001±0.003 9 0.005±0.007 -1.639 16 0.121
June 29, 2004 10 0.004±0.007 10 0.031±0.036 -2.319 18 0.032
Table 5. Mean number of HWA per cm on Mauget stem injected imidacloprid treated and untreatedhemlock trees in Group III at Mt. Lake.
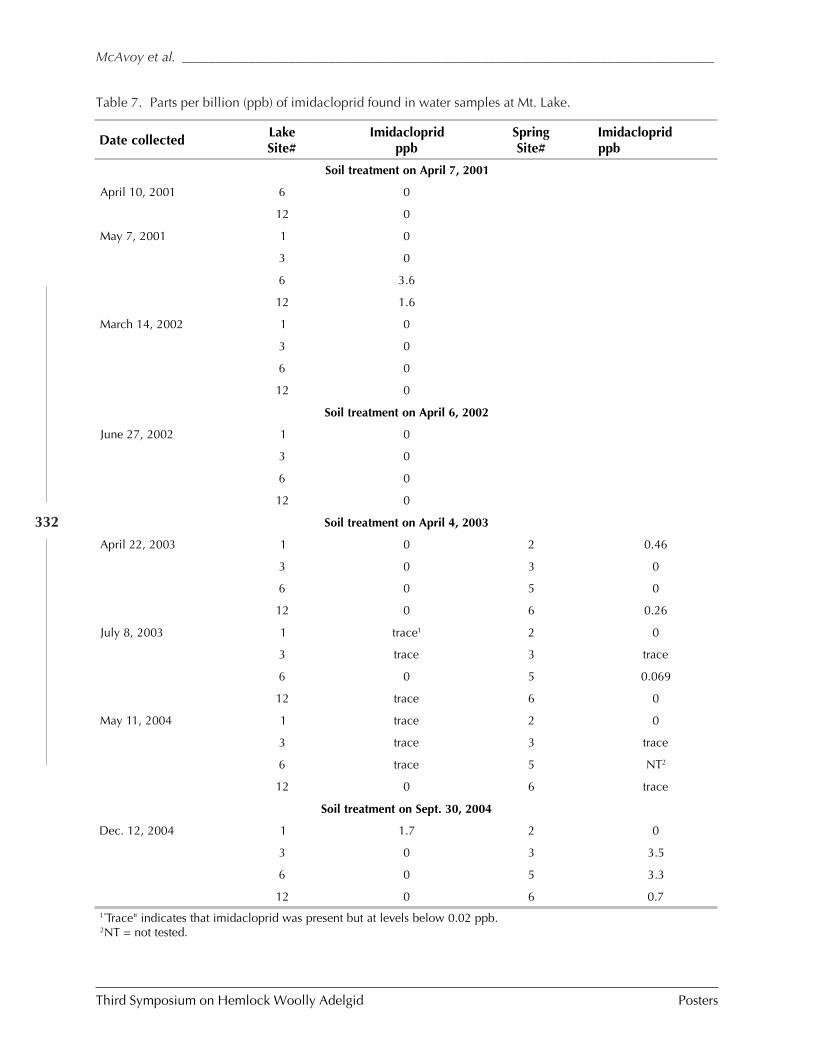
Third Symposium on Hemlock Woolly Adelgid Posters
McAvoy et al. ________________________________________________________________________________
332
Date collectedLakeSite#
Imidaclopridppb
SpringSite#
Imidaclopridppb
Soil treatment on April 7, 2001
April 10, 2001 6 0
12 0
May 7, 2001 1 0
3 0
6 3.6
12 1.6
March 14, 2002 1 0
3 0
6 0
12 0
Soil treatment on April 6, 2002
June 27, 2002 1 0
3 0
6 0
12 0
Soil treatment on April 4, 2003
April 22, 2003 1 0 2 0.46
3 0 3 0
6 0 5 0
12 0 6 0.26
July 8, 2003 1 trace1 2 0
3 trace 3 trace
6 0 5 0.069
12 trace 6 0
May 11, 2004 1 trace 2 0
3 trace 3 trace
6 trace 5 NT2
12 0 6 trace
Soil treatment on Sept. 30, 2004
Dec. 12, 2004 1 1.7 2 0
3 0 3 3.5
6 0 5 3.3
12 0 6 0.71"Trace" indicates that imidacloprid was present but at levels below 0.02 ppb.2NT = not tested.
Table 7. Parts per billion (ppb) of imidacloprid found in water samples at Mt. Lake.
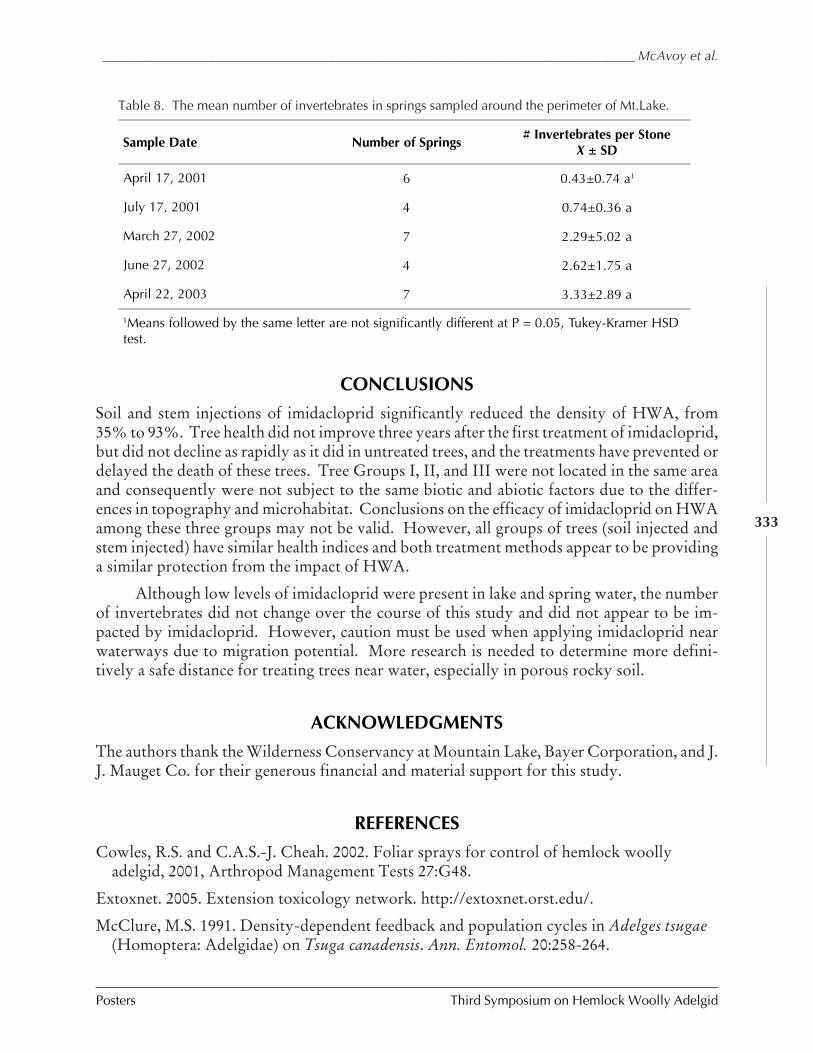
________________________________________________________________________________ McAvoy et al.
Posters Third Symposium on Hemlock Woolly Adelgid
333
Sample Date Number of Springs# Invertebrates per Stone
X ± SD
April 17, 2001 6 0.43±0.74 a1
July 17, 2001 4 0.74±0.36 a
March 27, 2002 7 2.29±5.02 a
June 27, 2002 4 2.62±1.75 a
April 22, 2003 7 3.33±2.89 a
1Means followed by the same letter are not significantly different at P = 0.05, Tukey-Kramer HSDtest.
CONCLUSIONS
Soil and stem injections of imidacloprid significantly reduced the density of HWA, from35% to 93%. Tree health did not improve three years after the first treatment of imidacloprid,but did not decline as rapidly as it did in untreated trees, and the treatments have prevented ordelayed the death of these trees. Tree Groups I, II, and III were not located in the same areaand consequently were not subject to the same biotic and abiotic factors due to the differ-ences in topography and microhabitat. Conclusions on the efficacy of imidacloprid on HWAamong these three groups may not be valid. However, all groups of trees (soil injected andstem injected) have similar health indices and both treatment methods appear to be providinga similar protection from the impact of HWA.
Although low levels of imidacloprid were present in lake and spring water, the numberof invertebrates did not change over the course of this study and did not appear to be im-pacted by imidacloprid. However, caution must be used when applying imidacloprid nearwaterways due to migration potential. More research is needed to determine more defini-tively a safe distance for treating trees near water, especially in porous rocky soil.
ACKNOWLEDGMENTS
The authors thank the Wilderness Conservancy at Mountain Lake, Bayer Corporation, and J.J. Mauget Co. for their generous financial and material support for this study.
REFERENCES
Cowles, R.S. and C.A.S.-J. Cheah. 2002. Foliar sprays for control of hemlock woollyadelgid, 2001, Arthropod Management Tests 27:G48.
Extoxnet. 2005. Extension toxicology network. http://extoxnet.orst.edu/.
McClure, M.S. 1991. Density-dependent feedback and population cycles in Adelges tsugae(Homoptera: Adelgidae) on Tsuga canadensis. Ann. Entomol. 20:258-264.
Table 8. The mean number of invertebrates in springs sampled around the perimeter of Mt.Lake.
Third Symposium on Hemlock Woolly Adelgid Posters
McAvoy et al. ________________________________________________________________________________
334
Silcox, C.A. 2002. Using imidacloprid to control hemlock woolly adelgid, In Rutgers NJ.Onken, B., R. Reardon, and J. Lashomb (Eds.), Proceedings: hemlock woolly adelgid inthe Eastern United States Symposium, 5-7 Feb. 2002, USDA Forest Service. pp. 280–287.
SAS. 1989. SAS/STAT User’s Guide, ver. 6, fourth ed. SAS Institute INC., Cary, NorthCarolina.
Steward, V.B., G. Braness, and S. Gill. 1998. Ornamental pest management usingimidacloprid applied with Kioritz® soil injector. J. of Arboric. 24:344-346.
Steward, V.B. and T.A. Horner. 1994. Control of hemlock woolly adelgid using soil injec-tions of systemic insecticides. J. of Arboric. 20:287-288.
Tatter, T.A., J.A. Dotson, M.S. Ruizzo, and V.B. Steward. 1998. Translocation ofimidacloprid in three tree species when trunk- and soil-injected. J. of Arboric. 24:54-56.
Webb, R.E., J.R. Frank, and M.J. Raupp. 2003. Eastern hemlock recovery from hemlockwoolly adelgid damage following imidacloprid therapy. J. of Arboric. 29:298-301.
_______________________________________________________________________________ Mathada et al.
Posters Third Symposium on Hemlock Woolly Adelgid
335
REPRODUCTIVE SUCCESS OF CYBOCEPHALUS SP. NR. NIPPONICUS ENRODY-YOUNGA ON ELONGATE HEMLOCK SCALE, FIORINIA EXTERNA FERRIS
Deepak Matadha1, Mark Mayer2, James Lashomb1, George Hamilton1, Tho-mas Dorsey2, and Robert Chianese2
1Department of Entomology, Rutgers - The State University of New Jersey93 Lipman Dr., New Brunswick, NJ 08901
2New Jersey Department of Agriculture, Division of Plant IndustryPhillip Alampi Beneficial Insect Laboratory,State Police Drive, West Trenton, NJ 08625
ABSTRACT
A field study was carried out to evaluate the survival and reproductive success of the estab-lished predator Cybocephalus sp.nr. nipponicus Enrody-Younga (Coleoptera: Cybocephalidae)on elongate hemlock scale (EHS), Fiorinia externa Ferris (Homoptera: Diaspididae). A sleeve-cage method with the following four treatment combinations was used to examine the impactof C. sp.nr. nipponicus on EHS: 1) sleeve-caged branches containing hemlock scales at the testdensity and a mated pair of C. sp.nr. nipponicus, 2) sleeve-caged branches containing hemlockscale at the test density and without C. sp.nr. nipponicus, 3) open branch with test scale den-sity, and 4) open uninfested branches. We found that C. sp.nr. nipponicus can survive andreproduce successfully on EHS and has a significant impact on EHS populations. Overall,reproduction by C. sp.nr. nipponicus was observed in 75 percent of the treatment combina-tions. A total of 45 C. sp.nr. nipponicus males, 75 females and 30 larvae were recovered fromthe ‘sleeve-cage with predators’ treatment. We observed 30.18 percent survival of released C.sp.nr. nipponicus males and 26.41 percent survival of females. A significant difference in themean number of surviving scales between sleeve-cage with predators and sleeve-cage withoutpredators was observed. We also examined levels of parasitism of EHS by the adventive para-sitoid, Encarsia citrina Craw (Hymenoptera: Aphelinidae). Significant differences in percentparasitism of EHS were also observed between sleeve-cage with predators and without predatortreatments and between open infested branch and uninfested branch treatments. The highestlevel of parasitism (47.5 percent) was observed in the ‘open infested branch’ treatment.
KEYWORDS
Elongate hemlock scale, Cybocephalus sp.nr. nipponicus, reproductive success, Encarsia citrina,parasitism.
Third Symposium on Hemlock Woolly Adelgid Posters
Mayer et al. __________________________________________________________________________________
336
MASS RELEASE AND RECOVERY OF CYBOCEPHALUS SP. NR. NIPPONICUS ON
ELONGATE HEMLOCK SCALE, FIORINIA EXTERNA FERRIS
Mark Mayer, Thomas Dorsey, Daniel Palmer,Robert Chianese, and Lauren Bronhard
New Jersey Department of Agriculture, Phillip Alampi Beneficial Insect LaboratoryPO Box 330, Trenton, New Jersey 08625
ABSTRACT
Fiorinia externa Ferris, the elongate hemlock scale (EHS), has been a serious pest of hemlockin New Jersey for many years. The Phillip Alampi Beneficial Insect Laboratory has recov-ered Cybocephalus sp. nr. nipponicus Enrody-Younga, from nine sites, four of which hadnever received releases of the beetle, indicating that the beetles are dispersing to EHS on theirown. In 2001, C. sp. nr. nipponicus significantly reduced the EHS population on a release tree(t-test, p < 0.05), prevented the EHS from increasing in a 2002 release site, and significantlyreduced the scale populations at release sites in 2003 and in 2004 (Mann-Whitney Rank-Sumtest, p < 0.05). C. sp. nr. nipponicus populations are increasing at sites where the beetle wasfirst recovered and the indications are that the beetle has the potential to be a biological con-trol agent on this pest.
KEYWORDS
Fiorinia externa, Cybocephalus sp. nr. nipponicus, biological control, hemlock.
INTRODUCTION
The elongate hemlock scale (Fiorinia externa Ferris) can be a serious pest of eastern hemlock,Tsuga canadensis (L.) Carriere and is found from Massachusetts to Virginia and west to Ohio(Kosztarab 1996). It can kill hemlock trees given enough time and works together with thehemlock woolly adelgid to accelerate the decline of hemlock (McClure 2002). It has also beenfound to kill hemlocks after a heavy HWA infestation has passed through an area, leavingtrees with high Fiorina scale populations (Danoff-Burg and Bird 2002). The elongate hem-lock scale (EHS) has one generation per year in the northeastern United States (McClure1978) and there are few biological control agents that are effective. In McClure (1986),Aspidiophagus citrinus Craw (Hymenoptera: Aphelinidae) and Chilocorus kuwanae Sylvestri(Coleoptera: Coccinellidae) were shown to be effective biological control agents in Japan andare present in the United States, but there are two generations of EHS in Japan, providing thebeetle more opportunity for predation. In Japan, there is a high degree of synchrony of A.citrinus with the host because A. citrinus requires two generations per year to complete its lifecycle, which allows it to build up to effective levels. In the US, A. citrinus completes twogenerations per year, and its life cycle is asynchronous with F. externa, which reduces its
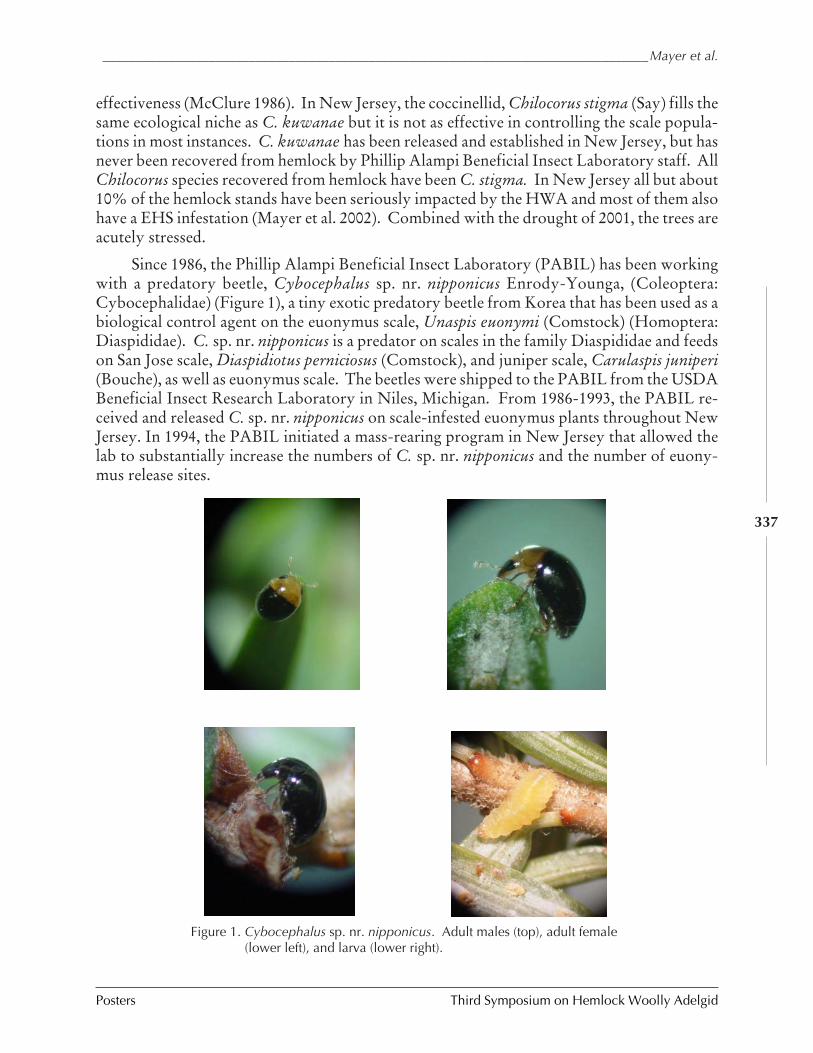
__________________________________________________________________________________Mayer et al.
Posters Third Symposium on Hemlock Woolly Adelgid
337
effectiveness (McClure 1986). In New Jersey, the coccinellid, Chilocorus stigma (Say) fills thesame ecological niche as C. kuwanae but it is not as effective in controlling the scale popula-tions in most instances. C. kuwanae has been released and established in New Jersey, but hasnever been recovered from hemlock by Phillip Alampi Beneficial Insect Laboratory staff. AllChilocorus species recovered from hemlock have been C. stigma. In New Jersey all but about10% of the hemlock stands have been seriously impacted by the HWA and most of them alsohave a EHS infestation (Mayer et al. 2002). Combined with the drought of 2001, the trees areacutely stressed.
Since 1986, the Phillip Alampi Beneficial Insect Laboratory (PABIL) has been workingwith a predatory beetle, Cybocephalus sp. nr. nipponicus Enrody-Younga, (Coleoptera:Cybocephalidae) (Figure 1), a tiny exotic predatory beetle from Korea that has been used as abiological control agent on the euonymus scale, Unaspis euonymi (Comstock) (Homoptera:Diaspididae). C. sp. nr. nipponicus is a predator on scales in the family Diaspididae and feedson San Jose scale, Diaspidiotus perniciosus (Comstock), and juniper scale, Carulaspis juniperi(Bouche), as well as euonymus scale. The beetles were shipped to the PABIL from the USDABeneficial Insect Research Laboratory in Niles, Michigan. From 1986-1993, the PABIL re-ceived and released C. sp. nr. nipponicus on scale-infested euonymus plants throughout NewJersey. In 1994, the PABIL initiated a mass-rearing program in New Jersey that allowed thelab to substantially increase the numbers of C. sp. nr. nipponicus and the number of euony-mus release sites.
Figure 1. Cybocephalus sp. nr. nipponicus. Adult males (top), adult female
(lower left), and larva (lower right).
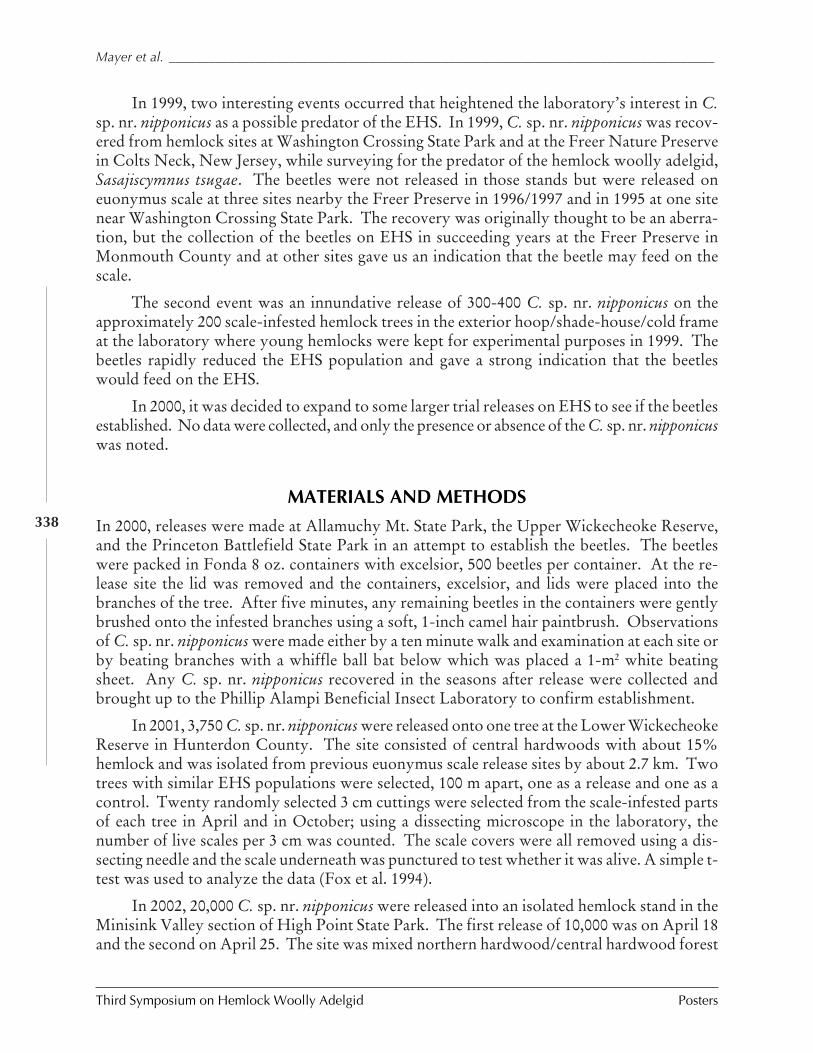
Third Symposium on Hemlock Woolly Adelgid Posters
Mayer et al. __________________________________________________________________________________
338
In 1999, two interesting events occurred that heightened the laboratory’s interest in C.sp. nr. nipponicus as a possible predator of the EHS. In 1999, C. sp. nr. nipponicus was recov-ered from hemlock sites at Washington Crossing State Park and at the Freer Nature Preservein Colts Neck, New Jersey, while surveying for the predator of the hemlock woolly adelgid,Sasajiscymnus tsugae. The beetles were not released in those stands but were released oneuonymus scale at three sites nearby the Freer Preserve in 1996/1997 and in 1995 at one sitenear Washington Crossing State Park. The recovery was originally thought to be an aberra-tion, but the collection of the beetles on EHS in succeeding years at the Freer Preserve inMonmouth County and at other sites gave us an indication that the beetle may feed on thescale.
The second event was an innundative release of 300-400 C. sp. nr. nipponicus on theapproximately 200 scale-infested hemlock trees in the exterior hoop/shade-house/cold frameat the laboratory where young hemlocks were kept for experimental purposes in 1999. Thebeetles rapidly reduced the EHS population and gave a strong indication that the beetleswould feed on the EHS.
In 2000, it was decided to expand to some larger trial releases on EHS to see if the beetlesestablished. No data were collected, and only the presence or absence of the C. sp. nr. nipponicuswas noted.
MATERIALS AND METHODS
In 2000, releases were made at Allamuchy Mt. State Park, the Upper Wickecheoke Reserve,and the Princeton Battlefield State Park in an attempt to establish the beetles. The beetleswere packed in Fonda 8 oz. containers with excelsior, 500 beetles per container. At the re-lease site the lid was removed and the containers, excelsior, and lids were placed into thebranches of the tree. After five minutes, any remaining beetles in the containers were gentlybrushed onto the infested branches using a soft, 1-inch camel hair paintbrush. Observationsof C. sp. nr. nipponicus were made either by a ten minute walk and examination at each site orby beating branches with a whiffle ball bat below which was placed a 1-m2 white beatingsheet. Any C. sp. nr. nipponicus recovered in the seasons after release were collected andbrought up to the Phillip Alampi Beneficial Insect Laboratory to confirm establishment.
In 2001, 3,750 C. sp. nr. nipponicus were released onto one tree at the Lower WickecheokeReserve in Hunterdon County. The site consisted of central hardwoods with about 15%hemlock and was isolated from previous euonymus scale release sites by about 2.7 km. Twotrees with similar EHS populations were selected, 100 m apart, one as a release and one as acontrol. Twenty randomly selected 3 cm cuttings were selected from the scale-infested partsof each tree in April and in October; using a dissecting microscope in the laboratory, thenumber of live scales per 3 cm was counted. The scale covers were all removed using a dis-secting needle and the scale underneath was punctured to test whether it was alive. A simple t-test was used to analyze the data (Fox et al. 1994).
In 2002, 20,000 C. sp. nr. nipponicus were released into an isolated hemlock stand in theMinisink Valley section of High Point State Park. The first release of 10,000 was on April 18and the second on April 25. The site was mixed northern hardwood/central hardwood forest
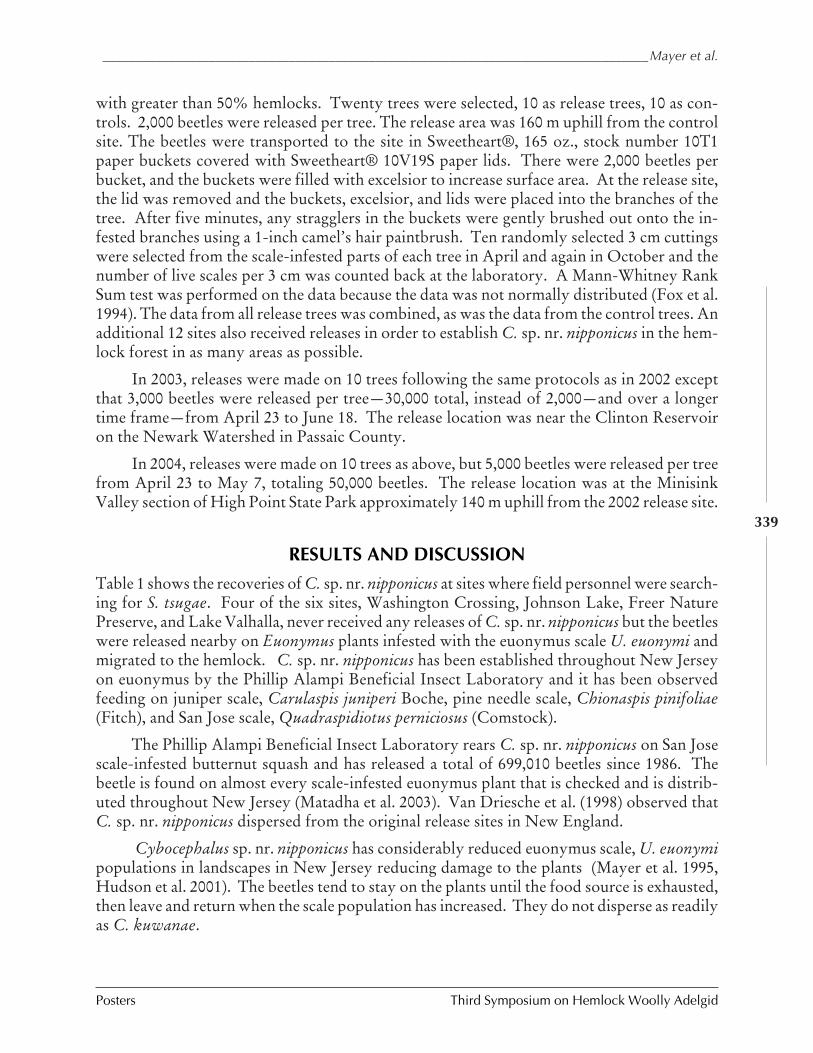
__________________________________________________________________________________Mayer et al.
Posters Third Symposium on Hemlock Woolly Adelgid
339
with greater than 50% hemlocks. Twenty trees were selected, 10 as release trees, 10 as con-trols. 2,000 beetles were released per tree. The release area was 160 m uphill from the controlsite. The beetles were transported to the site in Sweetheart®, 165 oz., stock number 10T1paper buckets covered with Sweetheart® 10V19S paper lids. There were 2,000 beetles perbucket, and the buckets were filled with excelsior to increase surface area. At the release site,the lid was removed and the buckets, excelsior, and lids were placed into the branches of thetree. After five minutes, any stragglers in the buckets were gently brushed out onto the in-fested branches using a 1-inch camel’s hair paintbrush. Ten randomly selected 3 cm cuttingswere selected from the scale-infested parts of each tree in April and again in October and thenumber of live scales per 3 cm was counted back at the laboratory. A Mann-Whitney RankSum test was performed on the data because the data was not normally distributed (Fox et al.1994). The data from all release trees was combined, as was the data from the control trees. Anadditional 12 sites also received releases in order to establish C. sp. nr. nipponicus in the hem-lock forest in as many areas as possible.
In 2003, releases were made on 10 trees following the same protocols as in 2002 exceptthat 3,000 beetles were released per tree—30,000 total, instead of 2,000—and over a longertime frame—from April 23 to June 18. The release location was near the Clinton Reservoiron the Newark Watershed in Passaic County.
In 2004, releases were made on 10 trees as above, but 5,000 beetles were released per treefrom April 23 to May 7, totaling 50,000 beetles. The release location was at the MinisinkValley section of High Point State Park approximately 140 m uphill from the 2002 release site.
RESULTS AND DISCUSSION
Table 1 shows the recoveries of C. sp. nr. nipponicus at sites where field personnel were search-ing for S. tsugae. Four of the six sites, Washington Crossing, Johnson Lake, Freer NaturePreserve, and Lake Valhalla, never received any releases of C. sp. nr. nipponicus but the beetleswere released nearby on Euonymus plants infested with the euonymus scale U. euonymi andmigrated to the hemlock. C. sp. nr. nipponicus has been established throughout New Jerseyon euonymus by the Phillip Alampi Beneficial Insect Laboratory and it has been observedfeeding on juniper scale, Carulaspis juniperi Boche, pine needle scale, Chionaspis pinifoliae(Fitch), and San Jose scale, Quadraspidiotus perniciosus (Comstock).
The Phillip Alampi Beneficial Insect Laboratory rears C. sp. nr. nipponicus on San Josescale-infested butternut squash and has released a total of 699,010 beetles since 1986. Thebeetle is found on almost every scale-infested euonymus plant that is checked and is distrib-uted throughout New Jersey (Matadha et al. 2003). Van Driesche et al. (1998) observed thatC. sp. nr. nipponicus dispersed from the original release sites in New England.
Cybocephalus sp. nr. nipponicus has considerably reduced euonymus scale, U. euonymipopulations in landscapes in New Jersey reducing damage to the plants (Mayer et al. 1995,Hudson et al. 2001). The beetles tend to stay on the plants until the food source is exhausted,then leave and return when the scale population has increased. They do not disperse as readilyas C. kuwanae.
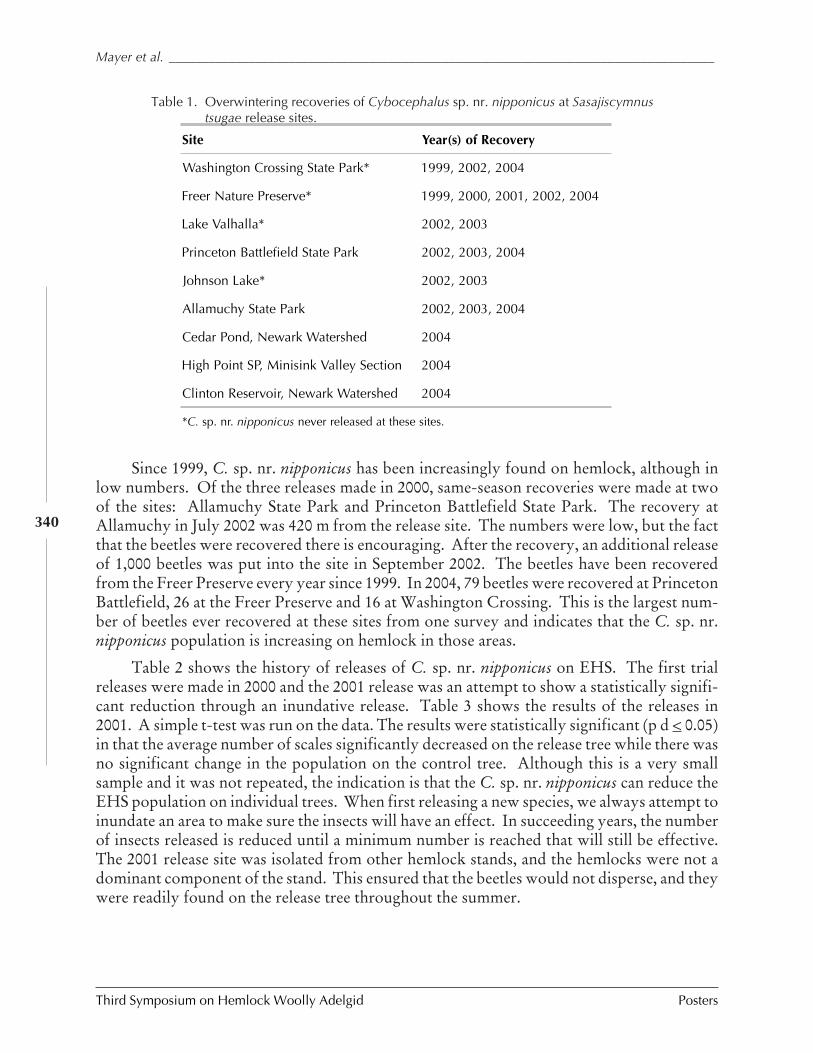
Third Symposium on Hemlock Woolly Adelgid Posters
Mayer et al. __________________________________________________________________________________
340
Since 1999, C. sp. nr. nipponicus has been increasingly found on hemlock, although inlow numbers. Of the three releases made in 2000, same-season recoveries were made at twoof the sites: Allamuchy State Park and Princeton Battlefield State Park. The recovery atAllamuchy in July 2002 was 420 m from the release site. The numbers were low, but the factthat the beetles were recovered there is encouraging. After the recovery, an additional releaseof 1,000 beetles was put into the site in September 2002. The beetles have been recoveredfrom the Freer Preserve every year since 1999. In 2004, 79 beetles were recovered at PrincetonBattlefield, 26 at the Freer Preserve and 16 at Washington Crossing. This is the largest num-ber of beetles ever recovered at these sites from one survey and indicates that the C. sp. nr.nipponicus population is increasing on hemlock in those areas.
Table 2 shows the history of releases of C. sp. nr. nipponicus on EHS. The first trialreleases were made in 2000 and the 2001 release was an attempt to show a statistically signifi-cant reduction through an inundative release. Table 3 shows the results of the releases in2001. A simple t-test was run on the data. The results were statistically significant (p d < 0.05)in that the average number of scales significantly decreased on the release tree while there wasno significant change in the population on the control tree. Although this is a very smallsample and it was not repeated, the indication is that the C. sp. nr. nipponicus can reduce theEHS population on individual trees. When first releasing a new species, we always attempt toinundate an area to make sure the insects will have an effect. In succeeding years, the numberof insects released is reduced until a minimum number is reached that will still be effective.The 2001 release site was isolated from other hemlock stands, and the hemlocks were not adominant component of the stand. This ensured that the beetles would not disperse, and theywere readily found on the release tree throughout the summer.
Site Year(s) of Recovery
Washington Crossing State Park* 1999, 2002, 2004
Freer Nature Preserve* 1999, 2000, 2001, 2002, 2004
Lake Valhalla* 2002, 2003
Princeton Battlefield State Park 2002, 2003, 2004
Johnson Lake* 2002, 2003
Allamuchy State Park 2002, 2003, 2004
Cedar Pond, Newark Watershed 2004
High Point SP, Minisink Valley Section 2004
Clinton Reservoir, Newark Watershed 2004
*C. sp. nr. nipponicus never released at these sites.
Table 1. Overwintering recoveries of Cybocephalus sp. nr. nipponicus at Sasajiscymnustsugae release sites.
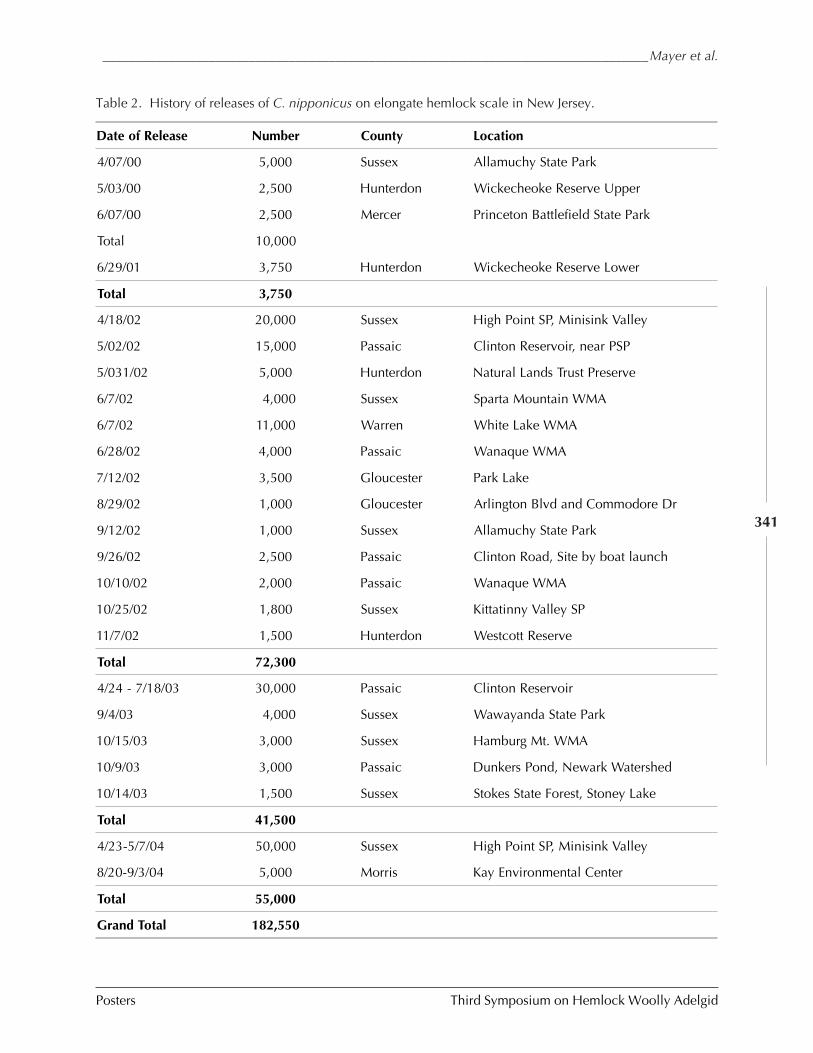
__________________________________________________________________________________Mayer et al.
Posters Third Symposium on Hemlock Woolly Adelgid
341
Date of Release Number County Location
4/07/00 5,000 Sussex Allamuchy State Park
5/03/00 2,500 Hunterdon Wickecheoke Reserve Upper
6/07/00 2,500 Mercer Princeton Battlefield State Park
Total 10,000
6/29/01 3,750 Hunterdon Wickecheoke Reserve Lower
Total 3,750
4/18/02 20,000 Sussex High Point SP, Minisink Valley
5/02/02 15,000 Passaic Clinton Reservoir, near PSP
5/031/02 5,000 Hunterdon Natural Lands Trust Preserve
6/7/02 4,000 Sussex Sparta Mountain WMA
6/7/02 11,000 Warren White Lake WMA
6/28/02 4,000 Passaic Wanaque WMA
7/12/02 3,500 Gloucester Park Lake
8/29/02 1,000 Gloucester Arlington Blvd and Commodore Dr
9/12/02 1,000 Sussex Allamuchy State Park
9/26/02 2,500 Passaic Clinton Road, Site by boat launch
10/10/02 2,000 Passaic Wanaque WMA
10/25/02 1,800 Sussex Kittatinny Valley SP
11/7/02 1,500 Hunterdon Westcott Reserve
Total 72,300
4/24 - 7/18/03 30,000 Passaic Clinton Reservoir
9/4/03 4,000 Sussex Wawayanda State Park
10/15/03 3,000 Sussex Hamburg Mt. WMA
10/9/03 3,000 Passaic Dunkers Pond, Newark Watershed
10/14/03 1,500 Sussex Stokes State Forest, Stoney Lake
Total 41,500
4/23-5/7/04 50,000 Sussex High Point SP, Minisink Valley
8/20-9/3/04 5,000 Morris Kay Environmental Center
Total 55,000
Grand Total 182,550
Table 2. History of releases of C. nipponicus on elongate hemlock scale in New Jersey.
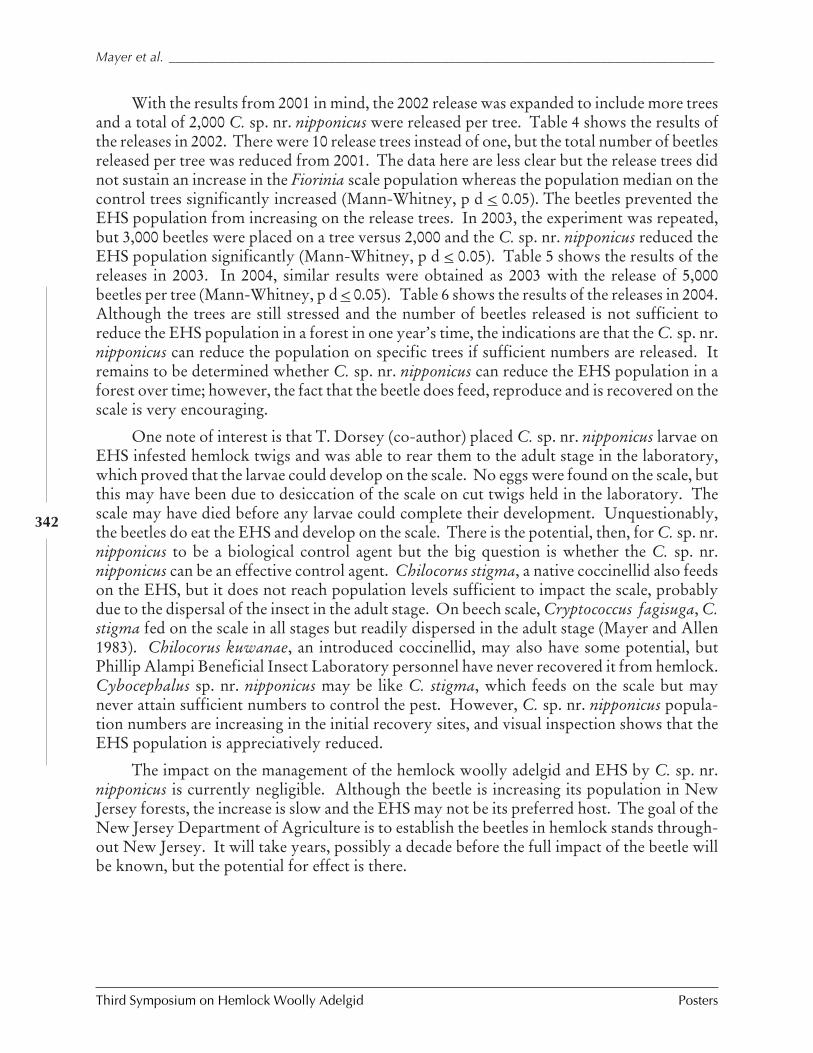
Third Symposium on Hemlock Woolly Adelgid Posters
Mayer et al. __________________________________________________________________________________
342
With the results from 2001 in mind, the 2002 release was expanded to include more treesand a total of 2,000 C. sp. nr. nipponicus were released per tree. Table 4 shows the results ofthe releases in 2002. There were 10 release trees instead of one, but the total number of beetlesreleased per tree was reduced from 2001. The data here are less clear but the release trees didnot sustain an increase in the Fiorinia scale population whereas the population median on thecontrol trees significantly increased (Mann-Whitney, p d < 0.05). The beetles prevented theEHS population from increasing on the release trees. In 2003, the experiment was repeated,but 3,000 beetles were placed on a tree versus 2,000 and the C. sp. nr. nipponicus reduced theEHS population significantly (Mann-Whitney, p d < 0.05). Table 5 shows the results of thereleases in 2003. In 2004, similar results were obtained as 2003 with the release of 5,000beetles per tree (Mann-Whitney, p d < 0.05). Table 6 shows the results of the releases in 2004.Although the trees are still stressed and the number of beetles released is not sufficient toreduce the EHS population in a forest in one year’s time, the indications are that the C. sp. nr.nipponicus can reduce the population on specific trees if sufficient numbers are released. Itremains to be determined whether C. sp. nr. nipponicus can reduce the EHS population in aforest over time; however, the fact that the beetle does feed, reproduce and is recovered on thescale is very encouraging.
One note of interest is that T. Dorsey (co-author) placed C. sp. nr. nipponicus larvae onEHS infested hemlock twigs and was able to rear them to the adult stage in the laboratory,which proved that the larvae could develop on the scale. No eggs were found on the scale, butthis may have been due to desiccation of the scale on cut twigs held in the laboratory. Thescale may have died before any larvae could complete their development. Unquestionably,the beetles do eat the EHS and develop on the scale. There is the potential, then, for C. sp. nr.nipponicus to be a biological control agent but the big question is whether the C. sp. nr.nipponicus can be an effective control agent. Chilocorus stigma, a native coccinellid also feedson the EHS, but it does not reach population levels sufficient to impact the scale, probablydue to the dispersal of the insect in the adult stage. On beech scale, Cryptococcus fagisuga, C.stigma fed on the scale in all stages but readily dispersed in the adult stage (Mayer and Allen1983). Chilocorus kuwanae, an introduced coccinellid, may also have some potential, butPhillip Alampi Beneficial Insect Laboratory personnel have never recovered it from hemlock.Cybocephalus sp. nr. nipponicus may be like C. stigma, which feeds on the scale but maynever attain sufficient numbers to control the pest. However, C. sp. nr. nipponicus popula-tion numbers are increasing in the initial recovery sites, and visual inspection shows that theEHS population is appreciatively reduced.
The impact on the management of the hemlock woolly adelgid and EHS by C. sp. nr.nipponicus is currently negligible. Although the beetle is increasing its population in NewJersey forests, the increase is slow and the EHS may not be its preferred host. The goal of theNew Jersey Department of Agriculture is to establish the beetles in hemlock stands through-out New Jersey. It will take years, possibly a decade before the full impact of the beetle willbe known, but the potential for effect is there.
__________________________________________________________________________________Mayer et al.
Posters Third Symposium on Hemlock Woolly Adelgid
343
Mean # of Live Scales/3 cm*
April October
Release Trees 26.5a 11.2b
Control Trees 20.3a 17.0a
*t-test - p < 0.05. Numbers followed by the same letter within a roware not significantly different.
Mean # of Live Scales/3 cm*
April October
Release Trees 7.0a 8.0a
Control Trees 5.0a 11.0b
*Mann-Whitney rank sum test - p < 0.05. Numbers followed by thesame letter within a row are not significantly different. (Release: T =9977.0, P = 0.8594; Control: T = 8925.0, P = 0.0060.)
Mean # of Live Scales/3 cm*
April October
Release Trees 27.0a 19.0b
Control Trees 21.5a 23.0a
*Mann-Whitney rank sum test - p < 0.05. Numbers followed by thesame letter within a row are not significantly different. (Release: T =8879.0, P = 0.0042; Control: T = 10665.0, P = 0.1332.)
Table 3. 2001 release of C. nipponicus on Fiorina scale; 3,750 released.
Table 4. 2002 release of C. nipponicus on Fiorina scale; 2,000 released per tree at High Point State Park,Minisink Valley Section.
Table 5. 2003 release of C. nipponicus on Fiorina scale; 3,000 released per tree at Clinton Reservoir.
Table 6. 2004 release of C. nipponicus on Fiorina scale; 5,000 released per tree at High Point State Park,Minisink Valley Section.
Mean # of Live Scales/3 cm*
April October
Release Trees 8.0a 5.0b
Control Trees 5.0a 3.0a
*Mann-Whitney rank sum test - p < 0.05. Numbers followed by thesame letter within a row are not significantly different. (Release: T =11159.0, P = 0.0068; Control: T = 10605.5, P = 0.1751.)
Third Symposium on Hemlock Woolly Adelgid Posters
Mayer et al. __________________________________________________________________________________
344
CONCLUSION
The Phillip Alampi Beneficial Insect Laboratory has been making trial releases of C. sp. nr.nipponicus onto F. externa. The beetles have established at nine sites, four of which havenever received releases, and the EHS population has been reduced or prevented from increas-ing at the 2001, 2002, 2003 and 2004 release sites. Escalating numbers of beetles are beingrecovered every year, and visual inspection of the recovery sites shows a reduction in theEHS population. The potential is there for C. sp. nr. nipponicus to be a biological controlagent on the EHS.
ACKNOWLEDGEMENTS
The authors thank the following individuals for their support:
John Keator, Superintendent, High Point State Park, New Jersey Department of Environ-mental Protection, Division of Parks and Forestry; Thomas Koppel, Forester, Newark Wa-tershed Conservation and Development Corporation, for providing the sites. Wayne Hudsonand Thomas Scudder, Entomologists and George Robbins, Senior Inspector; Daniel Kleinand Jeffrey White, Field Scouts, New Jersey Department of Agriculture, Phillip Alampi Ben-eficial Insect Laboratory for doing the EHS counts.
REFERENCES
Danoff-Burg, J.A. and S. Bird. 2002. Hemlock woolly adelgid and elongate hemlock scale:partners in crime? pp. 254-268. In Proceedings, Hemlock Woolly Adelgid in the EasternUnited States Symposium, ed. B. Onken, R. Reardon, and J. Lashomb. 5-7 February2002, East Brunswick, New Jersey, Rutgers.
Fox, E., J. Kuo, L. Tilling, and C. Ulrich. 1994. SigmaStat for Windows User’s Manual.Jandel Scientific, San Rafael, California.
Hudson, W., T. Scudder, T. Dorsey. G. Robbins, and M. Mayer. 2001. Biological Controlof euonymus scale Unaspis euonymi (Homoptera: Diaspididae). Phillip Alampi Benefi-cial Insect Laboratory, New Jersey Department of Agriculture Annual Report, Trenton,New Jersey.
Kosztarab, M. 1996. Scale Insects of Northeastern North America: Identification, Biol-ogy, and Distribution. Special Publication Number 3. Virginia Museum of NaturalHistory, Martinsville, Virginia.
Matadha, D., G. C. Hamilton, M.G. Hughes and J.H. Lashomb. 2003. Distribution ofnatural enemies of euonymus scale, Unaspis euonymi (Comstock) (Homoptera:Diaspididae), in New Jersey. Environmental Entomology 3:602-607.
Mayer, M. and D.C. Allen. 1983. Chilocorus stigma (Coleoptera: Coccinellidae) and otherpredators of beech scale in central New York, pp. 89-98. In Proceedings, IUFRO BeechBark Disease Working Party Conference, USDA-FS General Technical Report WO-37.
__________________________________________________________________________________Mayer et al.
Posters Third Symposium on Hemlock Woolly Adelgid
345
Mayer, M., T. Scudder, W. Hudson, and G. Robbins. 1995. Biological Control of euony-mus scale Unaspis euonymi (Homoptera: Diaspididae). Phillip Alampi Beneficial InsectLaboratory, New Jersey Department of Agriculture Annual Report, Trenton, NewJersey.
Mayer, M., R. Chianese, T. Scudder, J. White, K. Vongpaseuth, and R. Ward. 2002. Thir-teen years of monitoring the hemlock woolly adelgid in New Jersey forests, pp. 50-60.In Proceedings, Hemlock Woolly Adelgid in the Eastern United States Symposium, ed.B. Onken, R. Reardon, and J. Lashomb. 5-7 February 2002, East Brunswick, NewJersey, Rutgers.
McClure, M. 1978. Seasonal development of Fiorinia externa, Tsugaspidiotus tsugae(Homoptera: Diaspididae) and their parasite Aspidiphagus citrinus (Hymenoptera:Aphelinidae): importance of parasite host synchronism to the population dynamics oftwo scale pests of hemlock. Environmental Entomology 7:863-870
McClure, M.S. 1986. Population dynamics of Japanese hemlock scales: a comparison ofendemic and exotic communities. Ecology 67:1411-1421.
McClure, M.S. 2002. The elongate hemlock scale, Fiorinia externa Ferris (Homoptera:Diaspididae): a new look at an old nemesis, pp. 248-255. In Proceedings, HemlockWoolly Adelgid in the Eastern United States Symposium, ed. B. Onken, R. Reardon, andJ. Lashomb. 5-7 February 2002, East Brunswick, New Jersey, Rutgers.
Van Driesche, R.G., K. Idoine, M. Rose, and M. Bryan. 1998. Release, establishment andspread of Asian natural enemies of euonymus scale (Homoptera: Diaspididae) in NewEngland. Fla. Entomol. 81:1-9.
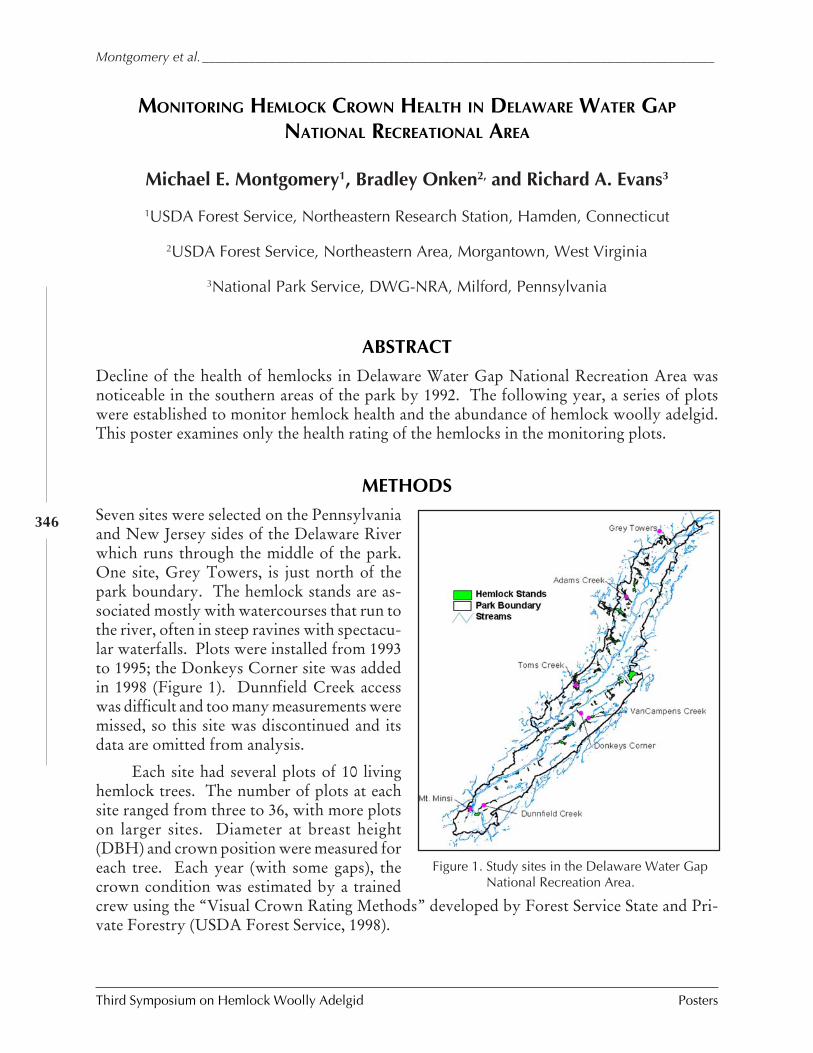
Third Symposium on Hemlock Woolly Adelgid Posters
Montgomery et al._____________________________________________________________________________
346
MONITORING HEMLOCK CROWN HEALTH IN DELAWARE WATER GAP
NATIONAL RECREATIONAL AREA
Michael E. Montgomery1, Bradley Onken2, and Richard A. Evans3
1USDA Forest Service, Northeastern Research Station, Hamden, Connecticut
2USDA Forest Service, Northeastern Area, Morgantown, West Virginia
3National Park Service, DWG-NRA, Milford, Pennsylvania
ABSTRACT
Decline of the health of hemlocks in Delaware Water Gap National Recreation Area wasnoticeable in the southern areas of the park by 1992. The following year, a series of plotswere established to monitor hemlock health and the abundance of hemlock woolly adelgid.This poster examines only the health rating of the hemlocks in the monitoring plots.
METHODS
Seven sites were selected on the Pennsylvaniaand New Jersey sides of the Delaware Riverwhich runs through the middle of the park.One site, Grey Towers, is just north of thepark boundary. The hemlock stands are as-sociated mostly with watercourses that run tothe river, often in steep ravines with spectacu-lar waterfalls. Plots were installed from 1993to 1995; the Donkeys Corner site was addedin 1998 (Figure 1). Dunnfield Creek accesswas difficult and too many measurements weremissed, so this site was discontinued and itsdata are omitted from analysis.
Each site had several plots of 10 livinghemlock trees. The number of plots at eachsite ranged from three to 36, with more plotson larger sites. Diameter at breast height(DBH) and crown position were measured foreach tree. Each year (with some gaps), thecrown condition was estimated by a trainedcrew using the “Visual Crown Rating Methods” developed by Forest Service State and Pri-vate Forestry (USDA Forest Service, 1998).
Figure 1. Study sites in the Delaware Water GapNational Recreation Area.
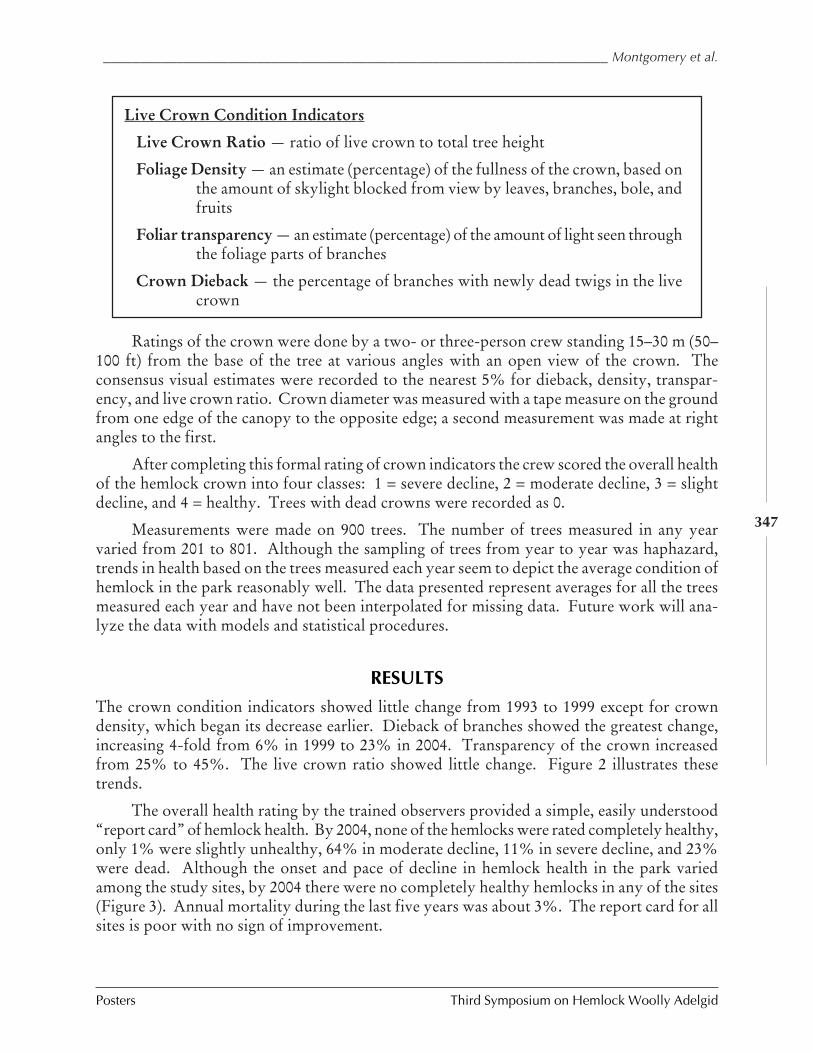
_____________________________________________________________________ Montgomery et al.
Posters Third Symposium on Hemlock Woolly Adelgid
347
Ratings of the crown were done by a two- or three-person crew standing 15–30 m (50–100 ft) from the base of the tree at various angles with an open view of the crown. Theconsensus visual estimates were recorded to the nearest 5% for dieback, density, transpar-ency, and live crown ratio. Crown diameter was measured with a tape measure on the groundfrom one edge of the canopy to the opposite edge; a second measurement was made at rightangles to the first.
After completing this formal rating of crown indicators the crew scored the overall healthof the hemlock crown into four classes: 1 = severe decline, 2 = moderate decline, 3 = slightdecline, and 4 = healthy. Trees with dead crowns were recorded as 0.
Measurements were made on 900 trees. The number of trees measured in any yearvaried from 201 to 801. Although the sampling of trees from year to year was haphazard,trends in health based on the trees measured each year seem to depict the average condition ofhemlock in the park reasonably well. The data presented represent averages for all the treesmeasured each year and have not been interpolated for missing data. Future work will ana-lyze the data with models and statistical procedures.
RESULTS
The crown condition indicators showed little change from 1993 to 1999 except for crowndensity, which began its decrease earlier. Dieback of branches showed the greatest change,increasing 4-fold from 6% in 1999 to 23% in 2004. Transparency of the crown increasedfrom 25% to 45%. The live crown ratio showed little change. Figure 2 illustrates thesetrends.
The overall health rating by the trained observers provided a simple, easily understood“report card” of hemlock health. By 2004, none of the hemlocks were rated completely healthy,only 1% were slightly unhealthy, 64% in moderate decline, 11% in severe decline, and 23%were dead. Although the onset and pace of decline in hemlock health in the park variedamong the study sites, by 2004 there were no completely healthy hemlocks in any of the sites(Figure 3). Annual mortality during the last five years was about 3%. The report card for allsites is poor with no sign of improvement.
Live Crown Condition Indicators
Live Crown Ratio — ratio of live crown to total tree height
Foliage Density — an estimate (percentage) of the fullness of the crown, based onthe amount of skylight blocked from view by leaves, branches, bole, andfruits
Foliar transparency — an estimate (percentage) of the amount of light seen throughthe foliage parts of branches
Crown Dieback — the percentage of branches with newly dead twigs in the livecrown
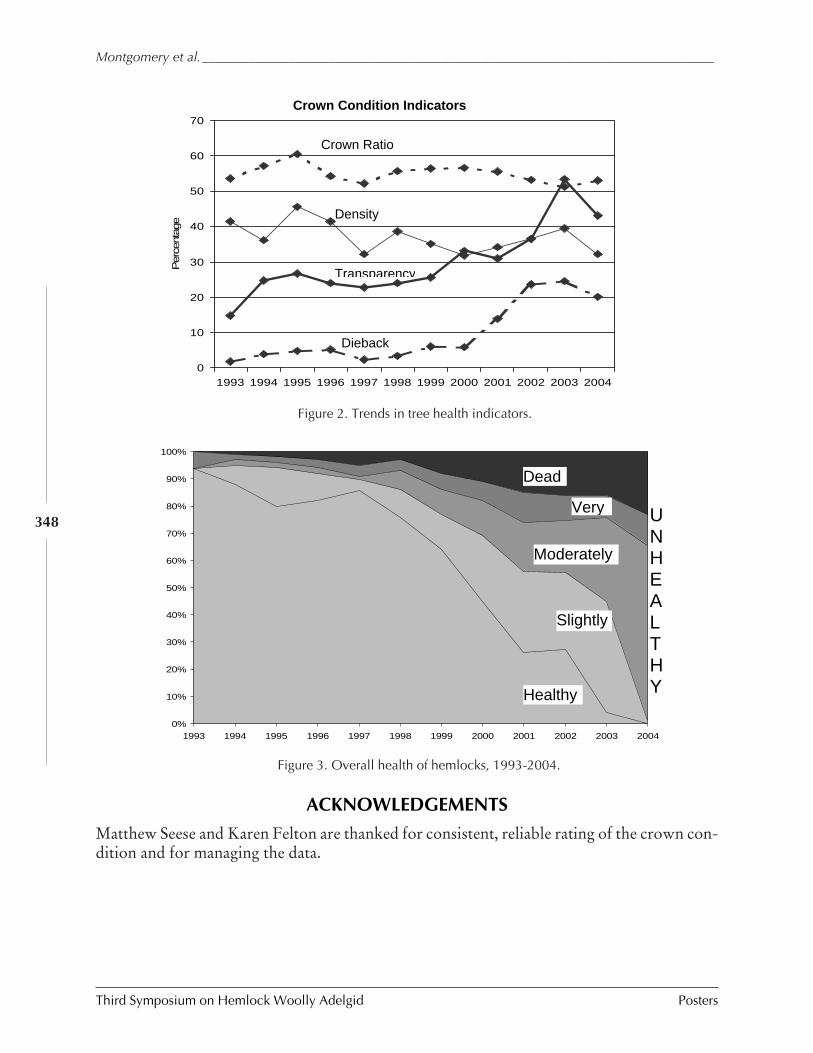
Third Symposium on Hemlock Woolly Adelgid Posters
Montgomery et al._____________________________________________________________________________
348
0
10
20
30
40
50
60
70
1993 1994 1995 1996 1997 1998 1999 2000 2001 2002 2003 2004
Per
cent
age
Crown Ratio
Density
Transparency
Dieback
Crown Condition Indicators
Figure 2. Trends in tree health indicators.
ACKNOWLEDGEMENTS
Matthew Seese and Karen Felton are thanked for consistent, reliable rating of the crown con-dition and for managing the data.
0%
10%
20%
30%
40%
50%
60%
70%
80%
90%
100%
1993 1994 1995 1996 1997 1998 1999 2000 2001 2002 2003 2004
Slightly
Moderately
Very
Dead
Healthy
U N H E A L T H Y
Figure 3. Overall health of hemlocks, 1993-2004.
_______________________________________________________________________Pais and Demko
Posters Third Symposium on Hemlock Woolly Adelgid
349
MANAGEMENT OF HWA AND RESTORATION OF HEMLOCK HEALTH
Richard C. Pais1 and David Demko2
1 Pais Ecological Services, Inc,P.O. Box 2487, Wilkes Barre, PA 18703
2Environmental and Real Estate Restoration,1112 E. Broad St., Hazleton, PA 18201
ABSTRACT
Hemlock woolly adelgid (Adelges tsugae) populations have been dramatically reduced andthe health of eastern hemlock (Tsuga canadensis) forest stands has been restored in two loca-tions in northeastern Pennsylvania.
Bushkill Falls, Pike County, Pennsylvania has over 30-acres of hemlock-dominated for-est. A comprehensive inventory and health assessment was conducted of individual trees inNovember 2000. Defoliation of 50 percent and significant individual mortality of hemlocksover 20-inches DBH was observed in five (5) hemlock-dominated stands. The economic andecological importance of 1,500 trees was studied and 1,100 trees were chemically injectedwith imidacloprid in 2001-2002. The systemic insecticide was applied via soil drench (Merit®75WSP) with a Kioritz® soil injector and via stem injections (Pointer ®) with a Wedgle® treeinjector. Sampling results and visual observations indicated adelgid populations were re-duced to less than 10 percent of pre-application levels in the winter 2002-2003. Significantnew growth was subsequently observed on all treated trees with exception of hemlocks thathad experienced significant defoliation.
A foliar chemistry analysis was conducted in late winter 2003 to determine if elementsnecessary for optimal photosynthesis were lacking in the needles of previously infested hem-locks. An analysis of 12 micro-elements and crude fiber from samples taken at Bushkill Fallswas compared to samples taken from healthy nursery-grown hemlocks. The results indi-cated hemlocks infested with HWA had deficiencies in micro-elements necessary to maxi-mize photosynthesis and produce new growth in the absence of HWA. Deficiencies wereobserved in all five stands. In May 2004, a customized mix of chelated nitrogen and micro-elements was applied to the foliage of 30-acres of hemlocks via helicopter spraying. Newgrowth of 3 inches or more was abundant throughout the forest in summer and fall of 2004,and foliar element levels examined after treatment showed significant positive changes.
The Henryville Troutfisherman own land bordering six (6) miles of Paradise Creek inMonroe County, Pennsylvania. Paradise Creek is an high value trout stream which main-tains native reproducing brook trout Hemlocks occupy approximately 30 percent of the
Third Symposium on Hemlock Woolly Adelgid Posters
Pais and Demko ______________________________________________________________________________
350
forest cover within 100 yards of the streambank. Hemlocks form greater than 80 percent ofthe forest over some pools and riffles. HWA was observed on greater than 60 percent of thehemlocks along the stream in April 2001. HWA canopy decline was observed and crowndensities were 50 percent of normal in many locations. Scattered mortality of mature hem-locks was observed. In May and October 2001, approximately 500 HWA infested trees weretreated with a systemic insecticide applied via soil drench (Merit® 75WSP) with a Kioritz®soil injector and via stem injections (Pointer ®) with a Wedgle® tree injector.
Approximately 5,000 Sasajiscymnus tsugae beetles were released in May and June 2002within stands treated with systemic insecticides; however, beetle-release trees were not in-jected. HWA surveys in the 2003 and 2004 indicated that HWA was observed on less than 5-percent of trees and HWA populations were limited to scattered individuals. New growthwas abundant on treated and untreated trees.
__________________________________________________________________ Paradis and Elkington
Posters Third Symposium on Hemlock Woolly Adelgid
351
GROWTH AND SURVIVAL OF HEMLOCK WOOLLY ADELGID ON THE NORTHERN
FRONTIER
Annie Paradis and Joe Elkinton
University of Massachusetts- Amherst; Division of Entomology
ABSTRACT
The hemlock woolly adelgid, Adelges tsugae Annand, was originally introduced to the east-ern U.S. in 1954 near Richmond, Virginia, from Osaka, a lowland region of Japan (Havill2005). The insect reached Connecticut in 1985, and subsequently invaded Springfield, Massa-chusetts, in 1991. We are attempting to document the impacts of cold temperatures on thesurvival and fecundity of the adelgid at the northern edge of its range in southern New En-gland. Further objectives are to determine how adelgid density affects overwintering sur-vival, and if there are any Allee effects associated with overwintering mortality. Allee effectscan be described as decreases in survival or fecundity as population densities decline to ex-tremely low levels frequently resulting in extinctions of incipient populations. New infesta-tions may arise from a single dispersing individual, and the resulting small populations facegenetic bottlenecks, inbreeding depression, and the difficulty of individuals finding mates.While parthenogenesis excludes the adelgid from the latter challenge, there are several otherreasons to expect Allee effects in newly colonized adelgid populations. These include thedocumented benefits of some hemipterans forming feeding aggregations, the possible weak-ening of tree defenses when adelgid are at higher densities, and increased protection from theenvironment when woolly masses are clumped and overlapping on branchlets.
In order to study the effects of overwintering temperature and adelgid density on sur-vival and fecundity of the sistens generation, thirteen sites throughout Massachusetts andConnecticut were sampled between March and May, 2004. We found that adelgid mortalitysignificantly increased with decreasing mean overwintering temperature P=0.050). The sametrend is present using average minimum winter temperature, however the regression is notstatistically significant (p=0.407). Fecundity also declined at lower minimum temperatures, atrend that was marginally significant (p=0.066). Overwintering mortality increases with den-sity even at the lowest densities (p<0.001); thus there is no evidence for an Allee effect inoverwintering mortality.
We are also collecting data on adelgid survival and fecundity at several sites for both theprogrediens and sistens generations to see if we can explain the very slow rate of spread wehave observed in Massachusetts over the past four years.
Third Symposium on Hemlock Woolly Adelgid Posters
Playfoot and Ward ____________________________________________________________________________
352
DEVELOPMENT OF A MICROSATELLITE LIBRARY FOR THE EASTERN HEMLOCK,TSUGA CANADENSIS
Kristine Playfoot and Rocky Ward
USGS Leetown Science Center,Northern Appalachian Research Laboratory,
Wellsboro, Pennsylvania
ABSTRACT
Eastern hemlock, Tsuga canadensis, is a vital component of the eastern North American for-est, providing important habitat for songbirds and small mammals (Yamasaki et al. 2000,Young et al. 2002), browse for deer and other herbivores (Anderson and Loucks 1979), andtemperature moderation important for native brook trout in first and second order streams(Ross et al. 2003). Over the last 20 years, widespread decline and mortality of hemlock in theeastern United States has occurred, particularly in association with hemlock woolly adelgid(Adelges tsugae) infestations. In order to mitigate hemlock decline, an important first step isto determine the genetic structure of the existing hemlock populations. This will be accom-plished using a library of microsatellite markers recently being developed at our facility.
Microsatellites occur throughout a species’ genome and are comprised of segments ofrepeated DNA with a short (usually 1-6 nucleotides) repeat length, are highly unstable, andmutate at high rates compared to other genetic markers. These differing numbers of repeatsat a microsatellite constitute alleles and are inherited in a Mendelian fashion. Divergence ofallele frequencies between populations occurs over time due to new mutations and drift whilemigration leads to a homogenization of allele frequencies. Effects of natural selection mayovercome these forces by causing selection of an allele at a specific locus.
Screening individuals with microsatellite markers allows these allele frequencies to bemeasured and can reveal a multitude of information about the species being studied.Microsatellites have been used for genetic mapping, linage analyses of disease susceptibilitygenes, paternity and kinship analysis, early cancer detection, and the probability of sampleidentity at both the individual and population levels. In the study of entire populations,microsatellites are also useful in determining the degree of hybridization between closelyrelated species, interspecies and inter-population variation, estimating effective populationsize, degree of population structure including both the amount of migration between sub-populations and genetic relationships among the various subpopulations (Murray 1996).
For eastern hemlock, these markers will facilitate identification of native variants thatare resistant to infestation effects of hemlock woolly adelgid and allow the effectiveness ofrecovery strategies, such as genetic engineering of resistance genes and intergression of con-generic genomes into T. canadensis, to be monitored.
____________________________________________________________ Schwartzentruber and Master
Posters Third Symposium on Hemlock Woolly Adelgid
353
THE EFFECTS OF HEMLOCK WOOLLY ADELGID INFESTATION ON BREEDING
POPULATIONS OF THREE SPECIES OF EASTERN HEMLOCK-DEPENDENT SONGBIRDS
IN THE DELAWARE WATER GAP NATIONAL RECREATION AREA
Beth A. Swartzentruber and Terry L. Master
Department of Biological Sciences, University of Pennsylvania,East Stroudsburg, PA 18301.
ABSTRACT
The hemlock woolly adelgid (Adelges tsugae) is currently decimating eastern hemlock standsthroughout the northeastern United States. Recent studies have demonstrated that severalspecies of songbirds, including the black-throated green warbler (Dendroica virens),Blackburnian warbler (Dendroica fusca) and blue-headed vireo (Vireo solitarius), are hem-lock-dependent species during the breeding season (Benzinger 1994, Howe and Mossman1996, Tingley et al. 2002, Ross et al. 2004). In this study, line transect detection frequenciesand resulting densities for these species were compared among hemlock stands differing indegree of infestation and hemlock condition in order to determine effects of infestation levelon breeding populations. Correlation of several measures of infestation level with detectionfrequency and density estimates varied considerably and was, for the most part, not signifi-cant. Measures of infestation utilizing height of the lowest live branch and distance from firstdead to first live branch (lower height and smaller distance, respectively, equate to betterhealth as lower branches tend to die off first) were significantly correlated with blue-headedvireo detection frequency (P < 0.05) and with black-throated green warbler detection fre-quency and density estimation (P < 0.05) using Spearman’s rho correlations. Results suggesta relationship between degree of infestation, hemlock condition, and the population levels ofthese two species, but not for Blackburnian warbler.
REFERENCES
Benzinger, J. 1994. Hemlock decline and breeding birds I: hemlock ecology records. NewJersey Birds 20:2-12.
Howe, R.W. and M. Mossman. 1996. The significance of hemlock for breeding birds inthe Western Great Lakes region, pp. 125-139. In Proceedings of the Hemlock Ecologyand Management Conference, 27-28 September, Iron Mountain, Michigan, ed. G. Mrozand J. Martin. University of Wisconsin, Madison, Wisconsin.
Ross, R.M., L.A. Redell, and R.M. Bennett. 2004. Mesohabitat use of threatened hemlockforests by breeding birds of the Delaware River Basin in Northeastern United States.Natural Areas Journal 24:307-315.
Tingley, M.W., D.A. Orwig, R. Field, and G. Monzkin. 2002. Avian response to removalof a forest dominant: consequences of hemlock woolly adelgid infestations. Journal ofBiogeography 29:1505-1516.
Third Symposium on Hemlock Woolly Adelgid Posters
Shields and Cheah ____________________________________________________________________________
354
WINTER MORTALITY IN ADELGES TSUGAE POPULATIONS IN 2003 AND 2004
Kathleen S. Shields1 and Carole A. S-J. Cheah2
1USDA Forest Service, Northeastern Center for Forest Health Research51 Mill Pond Road, Hamden, CT 06514
2Connecticut Agricultural Experiment Station, Valley Laboratory153 Cook Hill Road, Windsor, CT 06095
ABSTRACT
We assessed the mortality of hemlock woolly adelgid populations in the northeastern U.S.after the winters of 2002-2003 and 2003-2004. In 2003, adelgid winter mortality averaged86.0% at 29 sites in New York and New England, 73.8% at six Pennsylvania sites, and 11.2%at a North Carolina site. In 2004, adelgid winter mortality averaged 93.6% at 17 New Yorkand New England sites, 78.4% at seven Pennsylvania sites, and 21.1% at the North Carolinasite. Mortality was positively correlated with degrees of latitude and the minimum tempera-ture recorded at each site.
KEY WORDS
Hemlock woolly adelgid, mortality.
INTRODUCTION
The hemlock woolly adelgid (HWA), Adelges tsugae Annand, a destructive invasive speciesnative to Asia, is a serious pest of hemlock trees in the eastern U.S. It was first found in easternNorth America in Virginia in the 1950s and since that time has spread to locations fromsouthern Maine to Georgia. The range of eastern hemlock extends well into Canada, but coldwinter temperatures could be a factor in limiting the northward spread of this pest. We as-sessed the mortality of HWA populations after the winter of 2002-2003 and 2003-2004, thecoldest winters recorded in the Northeast in the past decade (National Weather Service data).
METHODS
Between the beginning of March and the end of April 2003, we sampled HWA populations at36 sites in New Hampshire, Massachusetts, Connecticut, New York, Pennsylvania, and NorthCarolina. During a similar period in 2004 we sampled populations at 35 sites in ME, NewHampshire, Massachusetts, Connecticut, New York, New Jersey, Pennsylvania, Maryland,West Virginia, and North Carolina. At each site, one or two branch tips (30-40 cm long) werecut from 10 eastern hemlock, Tsuga canadensis (L.) Carrière, that had new growth, no historyof fertilization or insecticide treatment, and light to moderate HWA infestations. Samples
_____________________________________________________________________ Shields and Cheah
Posters Third Symposium on Hemlock Woolly Adelgid
355
were examined within two to five days of collection. The length of new growth and the num-ber of living and dead HWA sistens that were 2nd, 3rd, or 4th stage nymphs or adults werecounted. First instar nymphs also were counted but not included in the assessment of wintermortality. Mortality assessments were made by carefully probing each woolly mass and adelgidfound on the new growth of branch tips. Where possible, at least 100 HWA sistens, nymphalstage 2 or older, were examined from each of the 10 trees at each site, totaling at least 1,000HWA per site. In addition, in 2004, a determination was made of the life stage of each livingand dead adelgid on the branch tips collected from one of the 10 trees at each site. Latitude,longitude, and elevation were recorded at each site. Highest and lowest daily temperatures forthe period November 2002 through March 2003 were obtained from the National ClimateData Center for the weather station closest to each site. Available data were analyzed usingthe Spearman rank correlation test and multiple regression. Values of P < 0.05 were consid-ered significant.
RESULTS AND DISCUSSION
In the northeastern U.S., HWA sistens aestivate during the summer months as first instarsand many do not survive the summer. In October, surviving nymphs begin feeding and re-sume development through four instars, generally maturing by February or March. Becausesamples were collected and evaluated in March and April, living HWA were adults, or insome cases 3rd or 4th stage nymphs. Dead adelgids ranged from 1st stage nymphs to adults.Percent mortality of adelgids that broke aestivation was highest in the 2nd and 3rd nymphalstages (32 and 54%, respectively); comparatively few adelgids died as 4th instars (12%) oradults (2%).
In 2003, mortality of HWA sistens that had successfully molted into 2nd stage nymphsaveraged 86.0% at 29 sites in New York and New England, 73.8% at six Pennsylvania sites,and 11.2% at a North Carolina site; highest mortality observed was 99.4% at a New Hamp-shire site. In 2004, HWA winter mortality averaged 93.6% at 17 New York and New En-gland sites, 78.4% at seven Pennsylvania sites, and 21.1% at the North Carolina site; highestmortality observed was 100% at a New York site. Analysis of data from the winter of 2002-2003 indicates that mortality was positively correlated with degrees of latitude (r = 0.422, P =0.010), even when the outlying North Carolina site was excluded (r = .371, P = 0.028), andnegatively correlated with mean daily low temperature (r = -0.626, P = 0.03). There were nosignificant correlations between percent mortality and plant hardiness zone, longitude, orelevation, but there was a slight negative correlation between percent mortality and the mini-mum temperature recorded at each site (r = 0.333, P = 0.047). This may indicate that highmortality is more the result of long-term low temperatures over the course of the winter thanof a cold period of short duration.
Compared with sites examined in 2003, the 35 sites sampled in 2004 extended over agreater part of the adelgid’s current range and as a result, there was a stronger positive corre-lation between adelgid mortality and degrees of latitude (r = 0.590, P = 0.0002). Mortality wasnegatively correlated with degrees of longitude (r = 0.624, P = <0.0001) and elevation (r =0.395, P = 0.0190). (Verified weather data for 2004 are not yet available.) Based on multipleregression analysis, only latitude accounted for a significant amount of the variance in percent
Third Symposium on Hemlock Woolly Adelgid Posters
Shields and Cheah ____________________________________________________________________________
356
mortality (P = 0.0321). This may be because the more western sites tended to be farther southand at higher elevations.
Although HWA populations are established in the eastern U.S. as far north as the Catskillsin New York and southeastern New Hampshire and ME, existing populations are restrictedto plant hardiness zone 5A (min. low of -26.5° to -28.8°C), or warmer. Based on the highwinter mortality experienced by northern HWA populations in 2003 and 2004, we speculatethat cold winter temperatures will limit the rate and extent of its northward spread.
ACKNOWLEDGMENT
We gratefully acknowledge the technical assistance of D. Mikus, R. Hirth, J. Fagan, and K.McManus of the USDA Forest Service, R. Hiskes and R. Cowles of the Connecticut Agricul-tural Experiment Station, and the many state and federal cooperators who provided us withsamples.
______________________________________________________________________ Shields and Hirth
Posters Third Symposium on Hemlock Woolly Adelgid
357
BACTERIAL ENDOSYMBIONTS OF ADELGES TSUGAE ANNAND: POTENTIAL TARGETS
FOR BIOCONTROL?
Kathleen S. Shields and Richard T. Hirth
USDA Forest Service, Northeastern Center for Forest Health Research51 Mill Pond Road, Hamden, CT 06514
ABSTRACT
We report the existence of four morphological forms of endosymbiotic bacteria in Adelgestsugae Annand and describe their ultrastructure. The endosymbionts are both intracellularand free-living in the hemocele. Systemic treatment of adelgid-infested hemlock seedlingswith the antibiotic rifampicin resulted in degradation of adelgid endosymbionts and eventualdeath of the insects.
KEY WORDS
Bacteria, endosymbiont, ultrastructure.
INTRODUCTION
The hemlock woolly adelgid (HWA), Adelges tsugae Annand, is a devastating non-nativepest of eastern hemlocks (Tsuga canadensis (L.) Carrière and T. caroliniana Engelm.) and amajor threat to the health and sustainability of hemlock as a forest resource in eastern NorthAmerica. HWA is native to Asia, where it infests Asian hemlocks but causes no particulardamage. It was first reported in western North America in the 1920s on western hemlocks (T.heterophylla (Raf.) Sarg. and T. mertensiana (Bong.) Carrière), but these species, like those inAsia, appear to tolerate the effects of adelgid feeding. It is not known with certainty whethernative predators in Asia and western North America mitigate impacts of HWA on hemlockin these areas or if genetic differences make eastern hemlocks more susceptible to adverseimpacts of adelgid feeding. However, a recent study of terpenoids in worldwide Tsuga spe-cies found a possible linkage between terpenoid profiles and hemlock susceptibility to HWA(Lagalante and Montgomery 2003).
Terpenoids are volatile compounds found in conifers; they serve in chemical communi-cation between plants and insects and are known to have antibiotic properties. There is evi-dence of terpenoid interference with the host-symbiont relationship in a number of insects,including Aphidoidea (aphids, phylloxerans, adelgids) (Van den Heuvel et al. 1998; Raguramanand Saxena 1994). Symbiotic microorganisms are common in Aphidoidea, but little is knownabout such in the Adelgidae. Here we describe bacterial endosymbionts in HWA, and specu-late that host plant terpenoids in western and Asian hemlocks may adversely affect thesemicroorganisms and inhibit HWA development on these Tsuga species.
Third Symposium on Hemlock Woolly Adelgid Posters
Shields and Hirth______________________________________________________________________________
358
METHODS
Hemlock woolly adelgid-infested foliage was collected from T. canadensis located in urbanand forested settings in CT, PA, and VA, and from T. heterophylla in UT and OR. Collec-tions were made over a period of several years and included all developmental stages of thethree adelgid morphs (sistens, progrediens, and sexuparae). In addition, a group of easternhemlock seedlings, naturally infested with aestivating HWA sistens, was treated in the fallwith the antibiotic rifampicin via root soak for five days. Control seedlings were treated withwater. All specimens were examined using light microscopy and transmission and scanningelectron microscopy.
RESULTS AND DISCUSSION
Adelges tsugae harbors bacterial organisms that are found free living in the hemocele as wellas bacteria in specialized cells known as mycetocytes or bacteriocytes. Based on their ultra-structure, A. tsugae endosymbionts appear to be prokaryotic bacteria with several distinctmorphological forms. There are no apparent differences in the forms of bacteria found in thesistens, progrediens, or sexuparae morphs.
Form “A” bacteria are exclusively intracellular, residing in mycetocytes. They are 2.1-2.9 µm in diameter and variable in shape. The bacteria are densely packed in the mycetocyteand their cytoplasm is uniformly distributed and relatively dense. Form “A” endosymbiontsare not present in oocytes or eggs prior to formation of mycetocytes, but they are found in allother A. tsugae stages except the post-oviposition adult, which lacks mycetocytes. Form “B”endosymbionts occur both intra- and extracellularly. They are spherical, 2.3-3.1 µm in diam-eter, and less electron-dense than the “A” form. They also are in mycetocytes, both separatelyand in combination with the “A” form. The “B” form often is seen in mycetocytes withdisrupted cell membranes. Form “C” endosymbionts are rod-shaped, 1.5-2.3 µm in diameterand 8.7-14.6 µm long. They are prevalent in the hemocele of all A. tsugae nymphs and adults,and in oocytes and eggs, but do not appear in mycetocytes. The “C” form penetrates oocytes,transmitting the organism to the next adelgid generation. As oocytes develop, another mor-phological form, “D”, appears along with “B” and “C” in a bacterial syncytium, which isincorporated into the embryo. As mycetocytes develop, the “D” form disappears and the“A” form appears in the new mycetocytes.
Treating infested hemlock seedlings with the antibiotic rifampicin resulted in inhibitionof HWA development while changes occurred concurrently in the appearance of the endo-symbionts. Treated adelgids eventually became aposymbiotic, gut tissues became increas-ingly necrotic, and nymphs died in the second instar. Anomalies similar to those seen in theendosymbionts of antibiotic-treated HWA (i.e., vacuolization, ruptured cell membranes, andnecrosis) were occasionally observed in adelgids collected from T. canadensis and often ob-served in HWA on T. heterophylla.
______________________________________________________________________ Shields and Hirth
Posters Third Symposium on Hemlock Woolly Adelgid
359
Lagalante and Montgomery (2003) speculated that the significant differences in terpe-noid profiles in the two eastern North American Tsuga species and the Asian and westernNorth American species might correspond to the susceptibility/resistance of Tsuga species toHWA. We speculate that the mode of action for resistance may be terpenoid-induced degen-eration of the endosymbiont population in HWA resulting in reduced development and fe-cundity of the insect population feeding on western North American and Asian Tsuga hosts.There could be subtle differences between the terpenoid profiles of individual T. canadensis,which could account for the degeneration observed in endosymbionts of some HWA andcould reflect tolerance of some hemlocks to HWA feeding. Thus, the bacterial endosym-bionts of HWA could serve as appropriate targets for biocontrol through systemic inhibitionof metabolic pathways or by selecting resistant cultivars based on terpenoid profiles.
REFERENCES
Lagalante, A.F. and M.E. Montgomery. 2003. Analysis of terpenoids from hemlock (Tsuga)species by solid-phase microextraction/gas chromatography/ion-trap mass spectropho-tometry. Journal of Agriculture and Food Chemistry 15:2115-2120.
Raguraman S. and R.C. Saxena. 1994. Effects of neem seed derivatives on brownplanthopper symbionts. Phytoparasitica 22(4):299-307.
Van den Heuvel, J.F.J.M., S.A. Hogenhout, M. Verbeek, and F. van der Wilk. 1998.Axadirachita indica metabolites interfere with the host-endosymbiont relationship andinhibit the transmission of potato leafroll virus by Myzus persicae. EntomolgiaExperimentalis et Applicata 86:253-260.
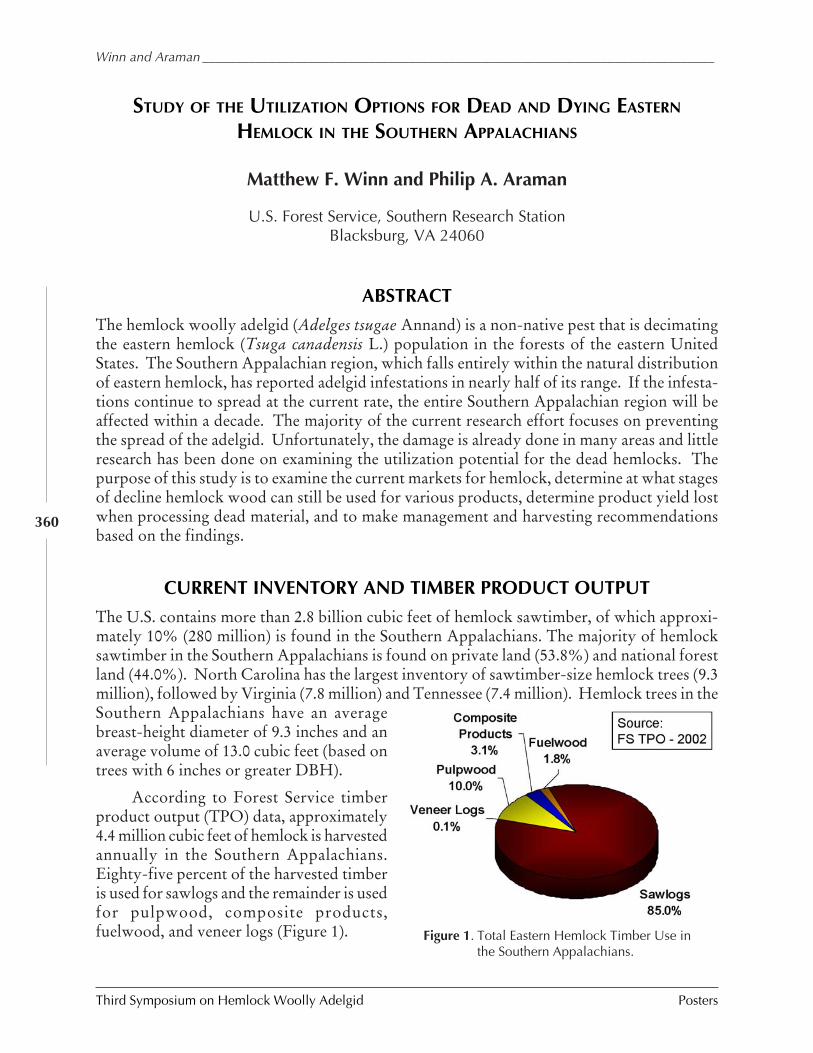
Third Symposium on Hemlock Woolly Adelgid Posters
Winn and Araman _____________________________________________________________________________
360
STUDY OF THE UTILIZATION OPTIONS FOR DEAD AND DYING EASTERN
HEMLOCK IN THE SOUTHERN APPALACHIANS
Matthew F. Winn and Philip A. Araman
U.S. Forest Service, Southern Research StationBlacksburg, VA 24060
ABSTRACT
The hemlock woolly adelgid (Adelges tsugae Annand) is a non-native pest that is decimatingthe eastern hemlock (Tsuga canadensis L.) population in the forests of the eastern UnitedStates. The Southern Appalachian region, which falls entirely within the natural distributionof eastern hemlock, has reported adelgid infestations in nearly half of its range. If the infesta-tions continue to spread at the current rate, the entire Southern Appalachian region will beaffected within a decade. The majority of the current research effort focuses on preventingthe spread of the adelgid. Unfortunately, the damage is already done in many areas and littleresearch has been done on examining the utilization potential for the dead hemlocks. Thepurpose of this study is to examine the current markets for hemlock, determine at what stagesof decline hemlock wood can still be used for various products, determine product yield lostwhen processing dead material, and to make management and harvesting recommendationsbased on the findings.
CURRENT INVENTORY AND TIMBER PRODUCT OUTPUT
The U.S. contains more than 2.8 billion cubic feet of hemlock sawtimber, of which approxi-mately 10% (280 million) is found in the Southern Appalachians. The majority of hemlocksawtimber in the Southern Appalachians is found on private land (53.8%) and national forestland (44.0%). North Carolina has the largest inventory of sawtimber-size hemlock trees (9.3million), followed by Virginia (7.8 million) and Tennessee (7.4 million). Hemlock trees in theSouthern Appalachians have an averagebreast-height diameter of 9.3 inches and anaverage volume of 13.0 cubic feet (based ontrees with 6 inches or greater DBH).
According to Forest Service timberproduct output (TPO) data, approximately4.4 million cubic feet of hemlock is harvestedannually in the Southern Appalachians.Eighty-five percent of the harvested timberis used for sawlogs and the remainder is usedfor pulpwood, composite products,fuelwood, and veneer logs (Figure 1). Figure 1. Total Eastern Hemlock Timber Use in
the Southern Appalachians.
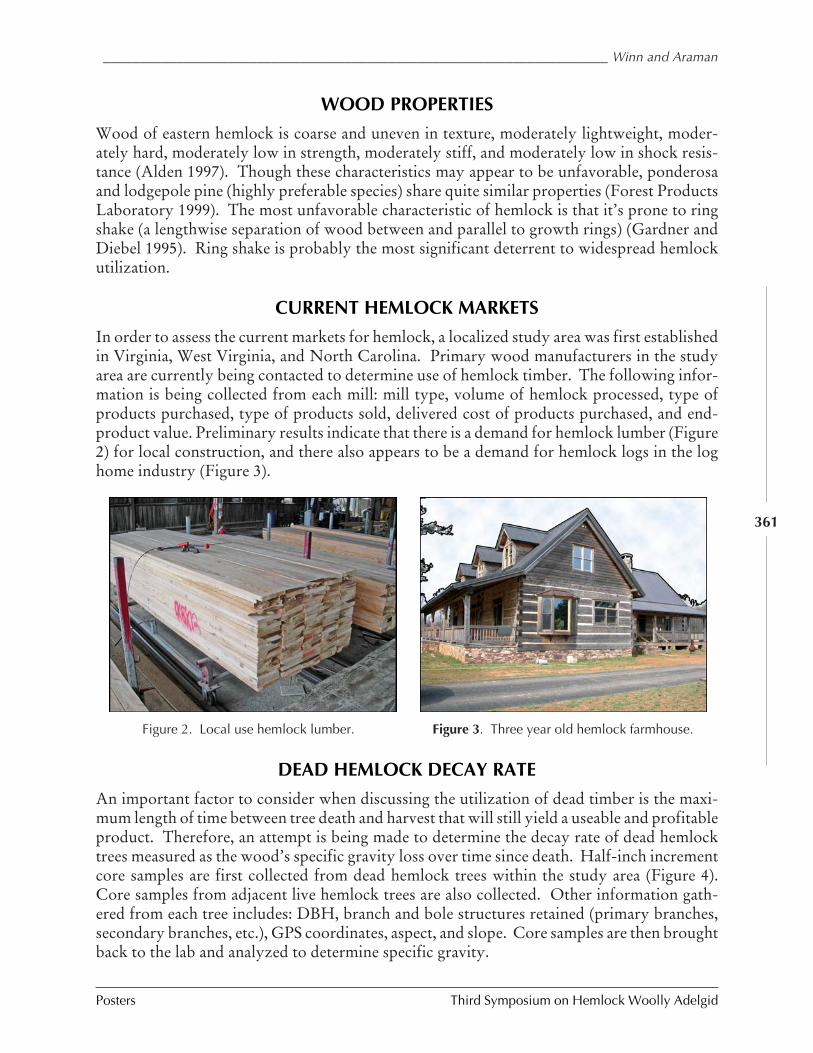
_____________________________________________________________________ Winn and Araman
Posters Third Symposium on Hemlock Woolly Adelgid
361
WOOD PROPERTIES
Wood of eastern hemlock is coarse and uneven in texture, moderately lightweight, moder-ately hard, moderately low in strength, moderately stiff, and moderately low in shock resis-tance (Alden 1997). Though these characteristics may appear to be unfavorable, ponderosaand lodgepole pine (highly preferable species) share quite similar properties (Forest ProductsLaboratory 1999). The most unfavorable characteristic of hemlock is that it’s prone to ringshake (a lengthwise separation of wood between and parallel to growth rings) (Gardner andDiebel 1995). Ring shake is probably the most significant deterrent to widespread hemlockutilization.
CURRENT HEMLOCK MARKETS
In order to assess the current markets for hemlock, a localized study area was first establishedin Virginia, West Virginia, and North Carolina. Primary wood manufacturers in the studyarea are currently being contacted to determine use of hemlock timber. The following infor-mation is being collected from each mill: mill type, volume of hemlock processed, type ofproducts purchased, type of products sold, delivered cost of products purchased, and end-product value. Preliminary results indicate that there is a demand for hemlock lumber (Figure2) for local construction, and there also appears to be a demand for hemlock logs in the loghome industry (Figure 3).
Figure 3. Three year old hemlock farmhouse.Figure 2. Local use hemlock lumber.
DEAD HEMLOCK DECAY RATE
An important factor to consider when discussing the utilization of dead timber is the maxi-mum length of time between tree death and harvest that will still yield a useable and profitableproduct. Therefore, an attempt is being made to determine the decay rate of dead hemlocktrees measured as the wood’s specific gravity loss over time since death. Half-inch incrementcore samples are first collected from dead hemlock trees within the study area (Figure 4).Core samples from adjacent live hemlock trees are also collected. Other information gath-ered from each tree includes: DBH, branch and bole structures retained (primary branches,secondary branches, etc.), GPS coordinates, aspect, and slope. Core samples are then broughtback to the lab and analyzed to determine specific gravity.
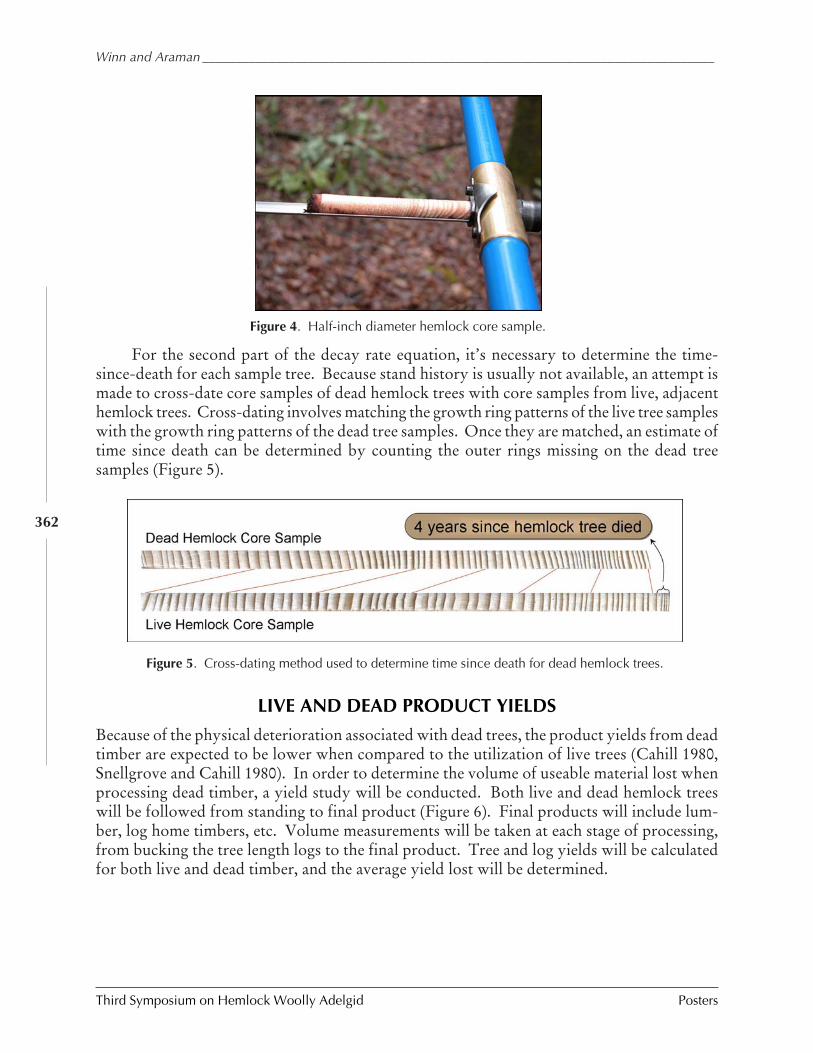
Third Symposium on Hemlock Woolly Adelgid Posters
Winn and Araman _____________________________________________________________________________
362
Figure 4. Half-inch diameter hemlock core sample.
Figure 5. Cross-dating method used to determine time since death for dead hemlock trees.
LIVE AND DEAD PRODUCT YIELDS
Because of the physical deterioration associated with dead trees, the product yields from deadtimber are expected to be lower when compared to the utilization of live trees (Cahill 1980,Snellgrove and Cahill 1980). In order to determine the volume of useable material lost whenprocessing dead timber, a yield study will be conducted. Both live and dead hemlock treeswill be followed from standing to final product (Figure 6). Final products will include lum-ber, log home timbers, etc. Volume measurements will be taken at each stage of processing,from bucking the tree length logs to the final product. Tree and log yields will be calculatedfor both live and dead timber, and the average yield lost will be determined.
For the second part of the decay rate equation, it’s necessary to determine the time-since-death for each sample tree. Because stand history is usually not available, an attempt ismade to cross-date core samples of dead hemlock trees with core samples from live, adjacenthemlock trees. Cross-dating involves matching the growth ring patterns of the live tree sampleswith the growth ring patterns of the dead tree samples. Once they are matched, an estimate oftime since death can be determined by counting the outer rings missing on the dead treesamples (Figure 5).
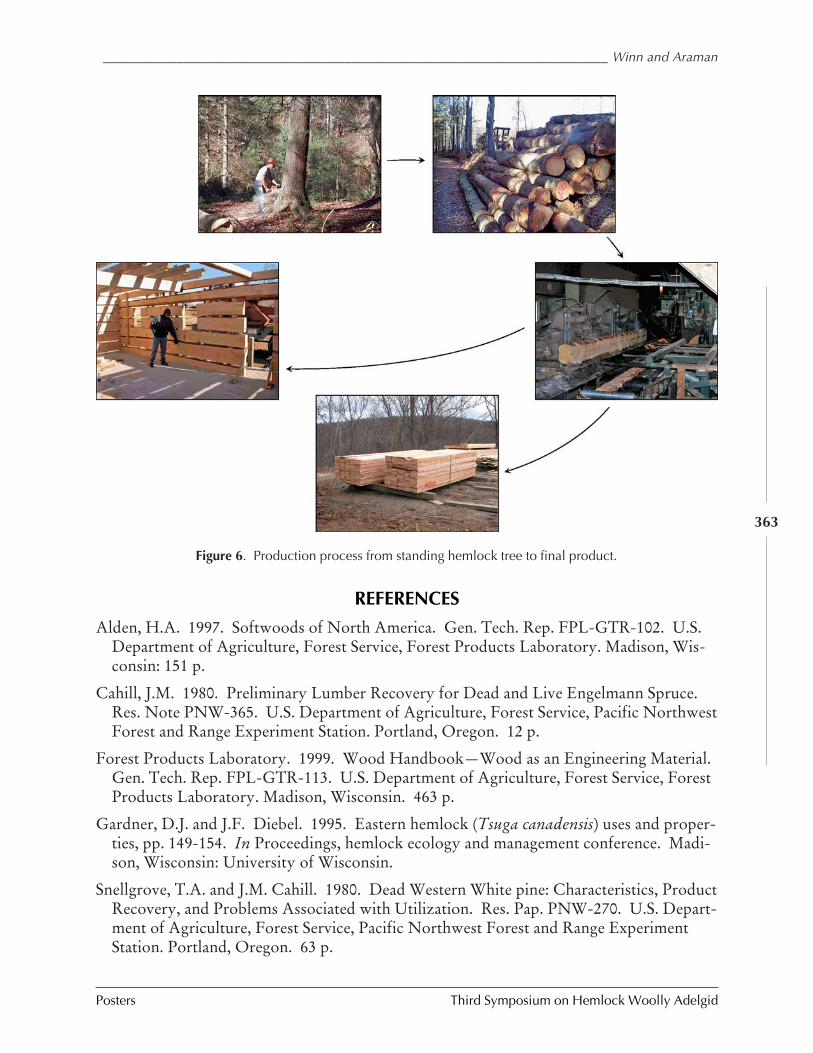
_____________________________________________________________________ Winn and Araman
Posters Third Symposium on Hemlock Woolly Adelgid
363
REFERENCES
Alden, H.A. 1997. Softwoods of North America. Gen. Tech. Rep. FPL-GTR-102. U.S.Department of Agriculture, Forest Service, Forest Products Laboratory. Madison, Wis-consin: 151 p.
Cahill, J.M. 1980. Preliminary Lumber Recovery for Dead and Live Engelmann Spruce.Res. Note PNW-365. U.S. Department of Agriculture, Forest Service, Pacific NorthwestForest and Range Experiment Station. Portland, Oregon. 12 p.
Forest Products Laboratory. 1999. Wood Handbook—Wood as an Engineering Material.Gen. Tech. Rep. FPL-GTR-113. U.S. Department of Agriculture, Forest Service, ForestProducts Laboratory. Madison, Wisconsin. 463 p.
Gardner, D.J. and J.F. Diebel. 1995. Eastern hemlock (Tsuga canadensis) uses and proper-ties, pp. 149-154. In Proceedings, hemlock ecology and management conference. Madi-son, Wisconsin: University of Wisconsin.
Snellgrove, T.A. and J.M. Cahill. 1980. Dead Western White pine: Characteristics, ProductRecovery, and Problems Associated with Utilization. Res. Pap. PNW-270. U.S. Depart-ment of Agriculture, Forest Service, Pacific Northwest Forest and Range ExperimentStation. Portland, Oregon. 63 p.
Figure 6. Production process from standing hemlock tree to final product.


ATTENDEES

___________________________________________________________________________________ Attendees
Third Symposium on Hemlock Woolly Adelgid
367
Kristopher AbellUniversity of MassachusettsDept Plant, Soil & Insect ScienceFernald Hall, 270 Stockbridge Rd.Amherst, MA [email protected]
Rob AhernUniversity of Maryland4112 Plant Sciences Bldg.College Park, MD [email protected]
Cora AllardClemson University114 Long HallClemson, SC [email protected]
Parker AndesBiltmore Estate1 North Pack SquareAsheville, NC [email protected]
Chris AsaroVirginia Dept. of Forestry900 Natural Resources Dr., Suite 800Charlottesville, VA [email protected]
Diane AshburnN.C. Cooperative Extension740 Glover St.Hendersonville, NC [email protected]
Kristen AustinThe Nature ConservancyP.O. Box 232Greenville, SC [email protected]
Mary Willeford BairNational Park Service3655 U.S. Hwy 211 EastLuray, VA [email protected]
Mikhail BalakshinNCSUBox 8005Raleigh, NC [email protected]
David M. BatesJackson-Macon Conservation AlliancePessy Crosby Center, 348 South 5th St.Highlands, NC [email protected]
Susan E. BentzU.S. National Arboretum11601 Old Pond Dr.Glenn Dale, MD [email protected]
Wayne BerisfordUniversity of GeorgiaDept. of EntomologyAthens, GA [email protected]
Will BlozanAppalachian Arborists2000 Riverside Dr.Asheville, NC [email protected]
Mike BlumenthalDCNR - Forestry - FPM208 Airport Dr., Second FloorMiddletown, PA [email protected]
Andy BooneS.C. Forestry CommissionP.O. Box 21707Columbia, SC 29221
Third Symposium on Hemlock Woolly Adelgid
Attendees ____________________________________________________________________________________
368
Brian BowenTN Division of Natural Heritage14th Fl, L&C Tower, 401 Church St.Nashville, TN 37243-0447
Christy BredenkampN.C. Cooperative Extension Service538 Scotts Creek Rd.Sylva, NC [email protected]
Meredith BrooksSherwood Forest Homeowners Asso.251 Purple Finch TrailBrevard, NC [email protected]
Chris J. BrownU.S. Forest Service1001 Pisgah Hwy.Pisgah Forest, NC [email protected]
Joan BrownUS Forest ServiceWayah Rd. - 90 Sloan Rd.Franklin, NC [email protected]
Richard BrysonSouthern Highlands Reserve750 Lower Whitewater Rd.Sapphire, NC [email protected]
Layla BurgessClemson University114 Long HallClemson, SC [email protected]
Lynn BurgessUSFS Athens320 Green StAthens, GA [email protected]
Barbara BurnsVermont Forestry Division100 Mineral St., Suite 304Springfield, VT [email protected]
Faith T. CampbellThe Nature Conservancy4245 North Fairfax Dr.Arlington, VA [email protected]
Cindy CarpenterU.S. Forest Service, Cradle of Forestry1001 Pisgah Hwy.Pisgah Forest, NC [email protected]
Teresa CarswellN.C. Forest Service443 Highway 116Sylva, NC [email protected]
Carole CheahCT Agricultural Experimental Station153 Cook Hill Rd.Windsor, CT [email protected]
Neil ClarkUSDA Forest Service1650 Ramble RoadBlacksburg, VA [email protected]
Barry ClintonCoweeta Hydrologic Lab3160 Coweeta Lab Rd.Otto, NC [email protected]
___________________________________________________________________________________ Attendees
Third Symposium on Hemlock Woolly Adelgid
369
Jason ColeHelicopter Applicators Inc.1670 York RdGettysburg, PA [email protected]
Steve ColeU.S. Forest Service809 Highway 4415Clayton, GA [email protected]
Jim ComptonUSDA Forest Service200 Weaver BlvdAsheville, NC [email protected]
Hugh ConwayClemson University114 Long HallClemson, SC [email protected]
Wes CoolerSAMAB Foundation Board1119 Cleo Chapman Hwy.Sunset, SC [email protected]
Jim CorteseTipco-Tree Injection Products Company1201 W. Fourth Ave.Knoxville, TN [email protected]
Scott CostaUniversity of Vermont661 Spear St.Burlington, VT [email protected]
Robert CoulsonTexas A&M UniversityEntomology Dept.College Station, TX [email protected]
Richard S. CowlesCT Agricultural Expt StationP. O. Box 248Windsor, CT [email protected]
Mike CraneUS Forest Service112 Andrew Pickens CircleMountain Rest, SC 29664
Mark DaluskyUniversity of Georgia,Dept. of EntomologyAthens, GA [email protected]
Michael DavieCanopy Tree CareP.O. Box 41Asheville, NC [email protected]
Isaac DealUniversity of TN3700 Sutherland Ave, Apt. B11Knoxville, TN [email protected]
David DemkoEnvironmental & Real Estate Restoration1112 E. Broad StHazleton, PA [email protected]
Third Symposium on Hemlock Woolly Adelgid
Attendees ____________________________________________________________________________________
370
Jason DenhamNYS Division of Lands & Forests625 BroadwayAlbany, NY [email protected]
Mary Ellen DixUSDA Forest Service WO-UMPR1601 North Kent StreetArlington, VA [email protected]
Joseph J. DoccolaArborjet, Inc.70 B Cross StreetWinchester, MA [email protected]
Kevin DoddsUSDA Forest Service271 Mast Rd., P.O. Box 640Durham, NC [email protected]
Jarrod DoucetteSUNY - ESF312 Bray Hall, 1 Forestry Dr.Syracuse, NY [email protected]
Marla C. DowningUSDA Forest Service2150 Centre Ave., Bldg. A, Suite 331Fort Collins, CO 80526
Don DuerrU.S. Forest Service1720 Peachtree Rd., NWAtlanta, GA [email protected]
Bill DvorakCamcore-NCSUBox 7626, Grinnells LabRaleigh, NC [email protected]
Brian EisenbackVirginia TechDept. of Entomology, 216 Price HallBlacksburg, VA [email protected]
Joe ElkintonUniversity of MassachusettsDept. of Plant, Soil & Insect Sciences,Fernald HallAmherst, MA [email protected]
Katherine ElliottCoweeta, SRS USDA Forest Service3160 Coweeta Lab Rd.Otto, NC [email protected]
Tom ElliottUSDA Forest Service180 Canfield St.Morgantown, WV [email protected]
Aaron EllisonHarvard ForestP. O. Box 68Petersham, MA [email protected]
Belinda EshamTennessee Tree Improvement ProgramUT, FWF Dept.,274 Ellington Plant SciencesKnoxville, TN [email protected]
Richard EvansNational Park Service294 Milford RdMilford, PA [email protected]
___________________________________________________________________________________ Attendees
Third Symposium on Hemlock Woolly Adelgid
371
Zander EvansYale School of Forestry360 Prospect StNew Haven, CT [email protected]
Sean FaceyArborjet, Inc.70 B Cross StreetWinchester, MA [email protected]
Karen FeltonUSDA Forest Service180 Canfield St.Morgantown, WV [email protected]
Jeffrey FidgenVirginia Tech216A Price HallBlacksburg, VA [email protected]
Robbie W. FlowersVirginia Tech, Dept. of Entomology216 Price HallBlacksburg, VA [email protected]
John FramptonNCSU Dept. of ForestryBox 8002Raleigh, NC [email protected]
Ryan FranksAppalachian Tree Care17 Hickory Estate LaneNewland, NC 28657
Chris FurqueronNational Park Service100 Alabama St., SWAtlanta, GA [email protected]
Bob GaleWNC Alliance29 N. Market St., Suite 610Asheville, NC [email protected]
Rick GarrisonUSDA Forest Service-FHP200 Weaver BlvdAsheville, NC [email protected]
Jack GilpinTennessee State Parks1335 Paulson WayAntioch, TN [email protected]
Vladimir GouliUniversity of Vermont661 Spear St.Burlington, VT [email protected]
James R. Graham, Jr.Appalachian State UniversityBiology Dept., P.O. Box 20937Boone, NC [email protected]
Jerome GrantUniversity of TN2431 Joe Johnson Drive, 205 PSBKnoxville, TN [email protected]
Stacie GrassanoEcoscientific Solutions930 Meadow Ave., Suite 2BScranton, PA [email protected]
Third Symposium on Hemlock Woolly Adelgid
Attendees ____________________________________________________________________________________
372
Sarah GreenHelicopter Applicators Inc.1670 York RdGettysburg, PA [email protected]
Scott GriffinGeorgia Forestry Commission3005 Atlanta HwyGainesville, GA [email protected]
Janet GriffithsN.C. DA & CS1060 Mail Service CenterRaleigh, NC [email protected]
Bill GulliverHomeowner w/HWA114 Brookside Ave.Black Mountain, NC [email protected]
Yu GuoyueInstitute of Plant & EnvironmentalProtection, Beijing Academy of Ag. &Forest ResearchBeijing, [email protected]
Fred HainNCSU, Dept. of EntomologyBox 7626, NCSURaleigh, NC [email protected]
Mark HallS.C. DNR206 Laurel Valley Rd.Sunset, SC [email protected]
Richard HallettUSDA Forest Service, NE271 Mast Rd.Durham, NH [email protected]
Jim HanulaUSDA Forest Service320 Green StAthens, GA [email protected]
Jim HarperNC State UniversityDept. of EntomologyRaleigh, NC [email protected]
Larry HartmannGreat Smoky Mts. National Park107 Park Headquarters Rd.Gatlinburg, TN [email protected]
Bill HascherBiltmore Estate1 North Pack SquareAsheville, NC [email protected]
Nathan HavillYale University, Dept of Ecology &Evolutionary Biology165 Prospect St,New Haven, CT [email protected]
Elizabeth HawkeUSFS Grey TowersP.O. Box 188Milford, PA [email protected]
___________________________________________________________________________________ Attendees
Third Symposium on Hemlock Woolly Adelgid
373
Brian HeathNC Forest Service701 Sanford Dr.Morganton, NC [email protected]
Richard W. HeintzelmanBayer CropScience2 T.W. Alexander Dr.Research Triangle Park, NC [email protected]
Nancy G. HerbertSouthern Research StationP.O. Box 2680Asheville, NC [email protected]
Beverly HillBeverly Hill’s Nursery105 Wilshire Blvd.Burnsville, NC [email protected]
Andrea HilleUSDA Forest Service29 U.S. Forest Service Dr.Bradford, PA [email protected]
Brian HinshawAppalachian Arborists2000 Riverside Dr.Asheville, NC [email protected]
Bill HoffmanBeecwold FarmsP. O. Box 1584Newland, NC 28657
Tom HolmesUSDA Forest Service1408 North Mangum StreetDurham, NC [email protected]
Chuck HooverDCNR - Forestry - FPM192 North Valley Rd.Harrisonville, PA [email protected]
Ellen HrabovskyWest Virginia University975 Tyrone Rd.Morgantown, WV [email protected]
Justin HuntemanTennessee Valley Authority1101 Market St. (MR-5E)Chattanooga, TN 37402
Tony HunterHunter’s Tree Service, Inc.P.O. Box 1674Banner Elk, NC 28604
Sherri HutchinsonWV Dept. of AgriculturePlant Industries Division1900 Kanawha Blvd., E.Charleston, WV [email protected]
Stan HuttoSC State Park Service1205 Pendleton StColumbia, SC [email protected]
Hugh IrwinSAFC46 Haywood St., Suite 323Asheville, NC [email protected]
George IveyFriends of the Smokies160 S. Main St.Waynesville, NC [email protected]
Third Symposium on Hemlock Woolly Adelgid
Attendees ____________________________________________________________________________________
374
Sultana S. JeftsHarvard University-Harvard ForestP. O. Box 68Petersham, MA [email protected]
Amy Yancey JenkinsUniversity of Tennessee114 Morgan HallKnoxville, TN [email protected]
Robert JettonN.C. State UniversityCampus Box 7626, Grinnells LabRaleigh, NC [email protected]
Bruce JewellSouthern Research StationP.O. Box 2680Asheville, NC [email protected]
Kristine JohnsonGreat Smoky Mtns. National Park107 Park Headquarters Rd.Gatlinburg, TN [email protected]
James JohnsonGeorgia Forestry Commission1055 E. Whitehall RdAthens, GA [email protected]
Gene JoleHemlock Huggers1516 Big Brush Creek Rd.Green Mountain, NC 28740
Carey JonesGreat Smoky Mtns. National Park107 Park Headquarters Rd.Gatlinburg, TN [email protected]
Carl JonesUniversity of TennesseeKnoxville, TN [email protected]
Skip KarbyMountain Lake & Pond Mgmt. Inc.371 Mountain Forest EstatesSylva, NC [email protected]
Bruce KauffmanForest Service-Forest Health Protection200 WT Weaver BlvdAsheville, NC [email protected]
Kathy KiddN.C. DA & CS1060 Mail Service CenterRaleigh, NC [email protected]
Janet Kintz-EarlyNisus Corporation100 Nisus Dr.Rockford, TN [email protected]
John KirkseyTennessee Division of ForestryBox 40627, Melrose StationNashville, TN [email protected]
Brian KlingEcoscientific Solutions930 Meadow Ave., Suite 2BScranton, PA 18505
Brian D. KloeppelUniv of GA - Coweeta Hydrologic Lab3160 Coweeta Lab Rd.Otto, NC [email protected]
___________________________________________________________________________________ Attendees
Third Symposium on Hemlock Woolly Adelgid
375
Jennifer KnoeppUSDA Forest Service3160 Coweeta Lab Rd.Otto, NC [email protected]
Frank KochNCSU-Forest Health Monitoring Program3041 Cornwallis Rd.Research Triangle Park, NC [email protected]
Guy KramerEast Tennessee State Univeristy2918 S. Grenwood Dr. #30Johnson City, TN [email protected]
Ashley LambVirginia Tech216 Price HallBlacksburg, VA [email protected]
Paris L. LambdinUniversity of TennesseeDept. of Entomology & Plant PathologyKnoxville, TN [email protected]
Patrick LangfordHillside ServicesP.O. Box 87Waynesville, NC [email protected]
James H. LashombEntomology at RutgersBlake Hall, 93 Lipman Dr.Rm 114, Cook CollegeNew Brunswick, NJ [email protected]
Laura LazarusNC Division of Forest Resources762 Claridge Nursery Rd.Goldsboro, NC 2;[email protected]
Tim LeeSC State Park ServiceCaesars Head State Park, 8155 Geer HwyCleveland, SC [email protected]
Michael LeventryLongwood GardensP.O. Box 501Kennett Square, PA [email protected]
Sarah LinnHigh Country Tree CareP.O. Box 8Scaly Mountain, NC [email protected]
Shane LishawaUniversity of Vermont85 Ferguson Ave.Burlington, VT [email protected]
Cindy LongmireGreat Smoky Mts. National Park107 Park Headquarters Rd.Gatlinburg, TN [email protected]
Wenhua LuThe Conservation Agency6 Swinburne StJamestown, RI [email protected]
Third Symposium on Hemlock Woolly Adelgid
Attendees ____________________________________________________________________________________
376
Heather LuczakUSDA Forest Service29 Forest Service Dr.Bradford, PA [email protected]
Gina LukerNC Division of Forest Resources1543 Wilkersboro Blvd. NELenoir, NC [email protected]
Dale LuthringerPA - DCNR: Cook Forest State ParkCook forst State ParkP.O. Box 120 (River Rd.)Cooksburg, PA [email protected]
Heidi LuxHarvard ForestP.O. Box 68Petersham, MA [email protected]
Christine LynchUniversity of Tennessee1545 Coleman Rd. Apt. CKnoxville, TN [email protected]
Suzanne LyonUniversity of MADept. of PSIS, Fernald HallAmherst, MA [email protected]
Ben MachinUniveristy of Vermont-Redstart Forestry211 Joe Lord RoadCorinth, VT [email protected]
Vern MadduxCherokee National Forest4400 Unicoi Dr.Unicoi, TN [email protected]
Mike MancusiGreat Smoky Mtns. National Park107 Park Headquarters Rd.Gatlinburg, TN [email protected]
Megan MannerDuke UniversityNicholas School of the Environment604 Remington CircleDurham, NC [email protected]
Tim MarascoDCNR - Forestry - FPM274 Arbutus Park Rd.Bloomsburg, PA [email protected]
Jose MarcelinoUniversity of Vermont661 Spear St.Burlington, VT [email protected]
Deepak MatadhaEntomology at RutgersBlake Hall, 93 Lipman Dr.Rm 114, Cook CollegeNew Brunswick, NJ [email protected]
Susan MatthewsSouthern Research Station1577 Brevard Rd.Asheville, NC [email protected]
___________________________________________________________________________________ Attendees
Third Symposium on Hemlock Woolly Adelgid
377
David Logan MauselVirginia Tech217 Price HallBlacksburg, VA [email protected]
Mark A. MayerN.J. Dept. of AgricultureBeneficial Insect Lab.P.O. Box 330Trenton, NJ 08625
Richard C. McDonaldSymbiont Biological Pest Mgmt.194 Shulll’s HollarSugar Grove, NC 28679
Lillian McElrathNational Park Service214 Parkway Maintenance Rd.Spruce Pine, NC [email protected]
Joe McGuinessCherokee National Forest4400 Unicoi Dr.Unicoi, TN 37692
Chad McRorieAppalachian Tree Care17 Hickory Estate LaneNewland, NC 28657
Brant MillerTennessee Wildlife Resources AgencyP.O. Box 40747Nashville, TN [email protected]
Dan MillerUSDA Forest Service320 Green StAthens, GA [email protected]
Abigail MinerWarren Wilson College701 Warren Wilson RoadSwannanoa, NC [email protected]
Mike MontgomeryUSDA Forest Service, NERS51 Mill Pond Rd.Hamden, CT [email protected]
Jerry MoodyNC Cooperative Extension Service-AveryCounty805 Cranberry St.Newland, NC [email protected]
Kate MorkeskiVirgina Tech Stream TeamDept. of Biology, 1027 Derring HallBlacksburg, VA [email protected]
Jeffrey NathansonBioLogixs437 E. Bayard AveDenver, CO [email protected]
C. Dana NelsonUSDA Forest ServiceSouthern Research Station, 23332 Hwy. 67Saucier, MS [email protected]
John D. NelsonUniv of TennesseeDept of Entomology & Plant Pathology2431 Joe Johnson Drive, 205 PSBKnoxville, TN [email protected]
Third Symposium on Hemlock Woolly Adelgid
Attendees ____________________________________________________________________________________
378
Wes NettletonU.S. Forest Service1720 Peachtree Rd. NWAtlanta, GA [email protected]
Leslie NewtonNC State University2820 O’Berry StRaleigh, NC [email protected]
Jerry OlsonUT affiliate508 Emben Cave RdLenior City, TN [email protected]
Amy OnkenUSDA Forest Service180 Canfield St.Morgantown, WV [email protected]
Brad OnkenUSDA Forest Service180 Canfield St.Morgantown, WV [email protected]
Ted M. Oprean, IIIU.S. Forest Service1001 Pisgah Hwy.Pisgah Forest, NC [email protected]
David OrwigHarvard ForestP.O. Box 68Petersham, MA [email protected]
Don OuelletteME Forest Service-Insect & Disease Lab50 Hospital St.Augusta, ME [email protected]
Rich PaisPais Ecological Services, Inc.PO Box 2487Wilkes Barre, PA [email protected]
Annie ParadisUniversity of Massachusetts102 Fernald HallAmherst, MA [email protected]
Gary PautzWoodtech Services, Inc.14212 Countryside Dr.Northport, AL [email protected]
John PerezNational Park Service104 Main St., P.O. Box 246Glen Jean, WV [email protected]
Kristine PlayfootUSGS Northern Appalachian Research Lab176 Straight Run RdWellsboro, PA 16901
Dawn PonderConservation Concepts206 Firetree Ln.Cary, NC [email protected]
Del PonderConservation Concepts206 Firetree Ln.Cary, NC [email protected]
___________________________________________________________________________________ Attendees
Third Symposium on Hemlock Woolly Adelgid
379
Jennifer PontiusUSDA Forest Service, NE271 Mast Rd.Durham, NH [email protected]
Lear PowellHunter’s Tree Service, Inc.P.O. Box 1674Banner Elk, NC 28604
Evan PreisserUniversity of Massachusetts - Amherst191 Kings Ridge Rd.Wakefield, RI [email protected]
Bob RabagliaMaryland Dept. of Agriculture50 Harry S. Truman ParkwayAnnapolis, MD [email protected]
Bernie RaimoUSDA Forest Service271 Mast Rd., P.O. Box 640Durham, NH [email protected]
Linda RandolphUSDA Forest ServiceP. O. Box 128, 88 Bridge St.Hot Springs, NC [email protected]
Richard ReardonUSDA Forest Service180 Canfield St.Morgantown, WV [email protected]
Owen ReedGreat Smoky Mtns. National Park107 Park Headquarters Rd.Gatlinburg, TN [email protected]
Brad RegesterDCNR - Forestry - FPMOne Nessmuk LaneWellsboro, PA [email protected]
Laurie ReidSouth Carolina Forestry CommissionP.O. Box 21707Columbia, SC [email protected]
Tom Remaley
Great Smoky Mtns. National Park107 Park Headquarters Rd.Gatlinburg, TN [email protected]
James RentchWest Virginia UniversityP.O. Box 6125, Division of ForestryMorgantown, WV [email protected]
Barbara ReynoldsUNCA37 Brookcliff DrAsheville, NC [email protected]
Rusty RheaUSDA Forest Service200 Weaver BlvdAsheville, NC [email protected]
Christian RielAppalachian Tree Care17 Hickory Estate LaneNewland, NC 28657
Third Symposium on Hemlock Woolly Adelgid
Attendees ____________________________________________________________________________________
380
Scott RobertsUniversity of TennesseeDept of Geography2908 Painter Ave.Knoxville, TN [email protected]
Nate RoyaltyBayer Environmental Science981 East Highway 42Clayton, NC [email protected]
Denise RoyleCMI, Virginia Tech.1900 Kraft Dr., Suite 250Blacksburg, VA [email protected]
Daniel RuddellAntioch New England63 Monarch HillTunbridge, VT [email protected]
Scotty RuffSapphire LakesP.O. Box 130Sapphire, NC [email protected]
Scott SalomVirginia Tech216 Price Hall, Dept. of EntomologyBlacksburg, VA [email protected]
Richard SandersWarren Wilson CollegeCPO 6131 Warren Wilson CollegeAsheville, NC [email protected]
Susan SchexnayderSAMAB314 Conference Center BldgKnoxville, TN [email protected]
Noel SchneebergerUSDA Forest Service11 Campus Blvd., Suite 200Newtown Square, PA [email protected]
Richard SchulhofArnold Arboretum125 ArborwayJamaica Plain, MA [email protected]
Casey SclarLongwood GardensP.O. Box 501Kennett Square, PA [email protected]
Matt SeeseUSDA Forest Service180 Canfield St.Morgantown, WV [email protected]
Jeff SeilerN.C. Cooperative Extension Service538 Scotts Creek Rd.Sylva, NC [email protected]
Terry SeydenUS Forest Service160A Zillicoa StAsheville, NC [email protected]
___________________________________________________________________________________ Attendees
Third Symposium on Hemlock Woolly Adelgid
381
Susan ShawUSDA Forest Service-Cherokee NFP. O. Box 2010Cleveland, TN [email protected]
Chris ShawTree Injection Products Co337 Arnold RdBristol, TN [email protected]
Catherine SheehyUniversity of TennesseePO Box 1348Norris, TN [email protected]
Jenni SheppardNJDAState Police DriveWest Trenton, NJ [email protected]
Kathleen ShieldsUSDA Forest Service, NERS51 Mill Pond Rd.Hamden, CT [email protected]
Jill SidebottomNCSU455 Research Dr.Fletcher, NC [email protected]
Michael SkinnerBalsam Mountain Trust52 Sugarloaf RdSylva, NC [email protected]
Kevin SmithNortheastern Research Station, USDA-FS271 Mast Rd.Durham, NH [email protected]
Craig SnyderLeetown Science CenterKearneysville, WV [email protected]
Dennis SoutoUSDA Forest Service271 Mast Rd., P.O. Box 640Durham, NH [email protected]
Ron StephensUSDA Forest Service1755 Cleveland Hwy.Gainesville, GA [email protected]
Este StifelTNCP. O. Box 397Saluda, NC [email protected]
William StitelerSUNY - ESF1 Forestry Dr.Syracuse, NY [email protected]
Jim StokoeLand-of-Sky Regional Council25 Heritage DriveAsheville, NC [email protected]
Amos StoneDaniel Boone National Forest1700 Bypass Rd.Winchester, KY [email protected]
Third Symposium on Hemlock Woolly Adelgid
Attendees ____________________________________________________________________________________
382
Kesi StonekingWarren Wilson CollegeCPO 7622 Warren Wilson CollegeAsheville, NC [email protected]
John StriderNCSU32 Gray Squirrel WayLouisburg, NC [email protected]
Eli StrullWNC Nature CenterAsheville, [email protected]
Jim SullivanGeorgia Forestry CommissionRoute 3, Box 3952Toccoa, GA [email protected]
Glenn TaylorGreat Smoky Mtns. National Park107 Park Headquarters Rd.Gatlinburg, TN [email protected]
Brent TeillonUniversity of Vermont661 Spear St.Burlington, VT 05405
Michael TigheCamcore-NCSUGrinnells Lab Rm. 1106,NCSU Box 7626Raleigh, NC [email protected]
Don TomczakUSDA Forest Service1720 Peachtree Rd. NW, Room 816Atlanta, GA [email protected]
Peter Del TrediciArnold Arboretum125 ArborwayJamaica Plain, MA [email protected]
Rick TurcotteUSDA Forest Service180 Canfield St.Morgantown, WV [email protected]
John TurnerSouthern Highlands Reserve750 Lower Whitewater Rd.Sapphire, NC [email protected]
Robb TurnerSAMAB314 Conference Center BldgKnoxville, TN [email protected]
Chris UlreyBlue Ridge Parkway-NPS199 Hemphill Knob Rd.Asheville, NC [email protected]
Jim UngerDCNR - Forestry - FPM192 North Valley Rd.Harrisonville, PA [email protected]
Jason Van DriescheUpstate ForeverP.O. Box 2308Greenville, SC 29602
Roy Van DriescheU Mass, PSIS/EntomologyFernald HallAmherst, MA [email protected]
___________________________________________________________________________________ Attendees
Third Symposium on Hemlock Woolly Adelgid
383
Irene Van HoffNational Park Service81 Carl Sandburg LaneFlat Rock, NC [email protected]
Jeff VanceN.C. Cooperative Extension ServiceP.O. Box 366Bakersville, NC [email protected]
Frank VarvoutisGreat Smoky Mts. National Park107 Park Headquarters Rd.Gatlinburg, TN [email protected]
John WaldronTexas A&M University1577 Brevard Rd.Asheville, NC [email protected]
Matthew S. WallaceEast Stroudsburg UniversityBiological Sciences200 Prospect St.East Stroudsburg, PA [email protected]
Kimberly WallinOregon State UniversityDept. of Forest Science, Richardson HallCorvallis, OR [email protected]
Jeff WardCT Agricultural Experimental StationP.O. Box 1106, 123 Huntington St.New Haven, CT [email protected]
Bob WeberWeber Tree Co., Inc.PO Box 118Highlands, NC [email protected]
Ian WedderspoonSherwood Forest76 Cardinal Rd.Brevard, NC [email protected]
Bill WeeksHemlock Huggers545 Copperhead BendBurnsville, NC [email protected]
Carrie WellsAppalachian State University210 Meadowview Dr.Boone, NC [email protected]
Shahla WernerDCNR - Forestry - FPM208 Airport Dr., Second FloorMiddletown, PA [email protected]
Ross WhettenN.C. State UniversityBox 8002Raleigh, NC [email protected]
Andy WhittierCamcore-NCSU1000 N. Blount St.Raleigh, NC [email protected]
Third Symposium on Hemlock Woolly Adelgid
Attendees ____________________________________________________________________________________
384
Peter M. WildArborjet, Inc.70 B Cross StreetWinchester, MA [email protected]
Barry WilkinsonUS Forest Service1001 Pisgah Hwy.Pisgah Forest, NC [email protected]
Buzz WilliamsChattooga Conservancy2368 Pinnacle Dr.Clayton, GA [email protected]
Linda WilliamsWisconsin DNR1125 N. Military Ave.Green Bay, WI [email protected]
Roy WiltDCNR - Forestry - FPMR.R. 1, Box 486Blain, PA [email protected]
Matt WinnUSDA Forest Service1650 Ramble RoadBlacksburg, VA [email protected]
Todd WoodardMountain Lake & Pond Mgmt. Inc.371 Mountain Forest EstatesSylva, NC [email protected]
Related Documents


