Software for Evolutionary Analysis © 2002 Jon C. Herron 1 ForensicEA Tutorial Did the surgeon give hepatitis C to his patient? In a recent issue of the Journal of Medical Virology, R. Stephan Ross and colleagues (2002) report the story of a German surgeon with a viral infection. In July of 2000, the surgeon notified his hospital that he had contracted Hepatitis C Virus (HCV). HCV infects the liver, and is spread by contact with the blood of an infected person. Although many infected individuals show no symptoms, some patients suffer serious liver damage. The surgeon’s specialty was emergency orthopedic surgery. A typi- cal case might involve repairing bones and joints badly damaged in a car wreck. Orthopedic surgery requires a combination of physical

Welcome message from author
This document is posted to help you gain knowledge. Please leave a comment to let me know what you think about it! Share it to your friends and learn new things together.
Transcript
ForensicEA Tutorial
Did the surgeon givehepatitis C to his
patient?
In a recent issue of the Journal of Medical Virology, R. Stephan Ross and colleagues (2002) report the story of a German surgeon with a viral infection. In July of 2000, the surgeon notified his hospital that he had contracted Hepatitis C Virus (HCV). HCV infects the liver, and is spread by contact with the blood of an infected person. Although many infected individuals show no symptoms, some patients suffer serious liver damage.
The surgeon’s specialty was emergency orthopedic surgery. A typi-cal case might involve repairing bones and joints badly damaged in a car wreck. Orthopedic surgery requires a combination of physical
Software for Evolutionary Analysis © 2002 Jon C. Herron 1
2
Did the surgeon give hepatitis C to his patient?
strength and carpentry skill. It involves quick but precise work with saws, hammers, drills, pins, and screws. To a lay spectator, it can appear both violent and bloody. It is not unusual for an orthopedic sur-geon, even an unusually careful one, to cut his or her fingers while working inside a patient.
Among the hospital’s concerns upon learning that the surgeon had heptatis C was whether he had accidentally passed the infection to any of his patients. The hospital performed blood tests on 207 patients, three of which tested positive for HCV. Among these three, one was known to have been infected before his surgery, and another had a viral strain obviously unrelated to the surgeon’s. The last patient, however, had a strain of HCV belonging to the same subtype as the surgeon’s. This patient thus presented an open question: Did the patient get HCV from the surgeon, or did he get it from someone else?
We can answer this question by reconstructing a phylogeny, or evo-lutionary tree. This tutorial, and the application ForensicEA, will help you develop the evolutionary logic needed to reconstruct trees from genetic data, and it will teach you one method for doing so. At the end we’ll give you data from the paper by Ross and colleagues. You can draw your own conclusions about the German orthopedic surgeon and his patient.
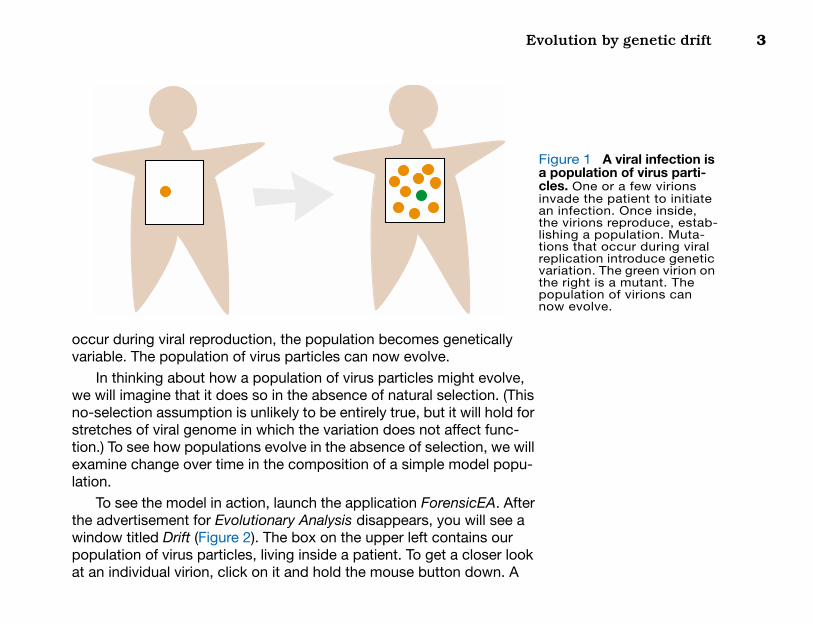
Evolution by genetic driftThe first step toward developing the tools we need to trace chains of transmission is to recognize that a viral infection is a population of indi-vidual virus particles (Figure 1). The infection may be started by one or a few particles that invade the patient’s body. But soon the invaders begin to reproduce, establishing a large population. When mutations
Evolution by genetic drift
3
ure 1 A viral infection is opulation of virus parti-s. One or a few virions ade the patient to initiate infection. Once inside, e virions reproduce, estab-hing a population. Muta-ns that occur during viral lication introduce genetic
riation. The green virion on e right is a mutant. The pulation of virions can w evolve.
occur during viral reproduction, the population becomes genetically variable. The population of virus particles can now evolve.
In thinking about how a population of virus particles might evolve, we will imagine that it does so in the absence of natural selection. (This no-selection assumption is unlikely to be entirely true, but it will hold for stretches of viral genome in which the variation does not affect func-tion.) To see how populations evolve in the absence of selection, we will examine change over time in the composition of a simple model popu-lation.
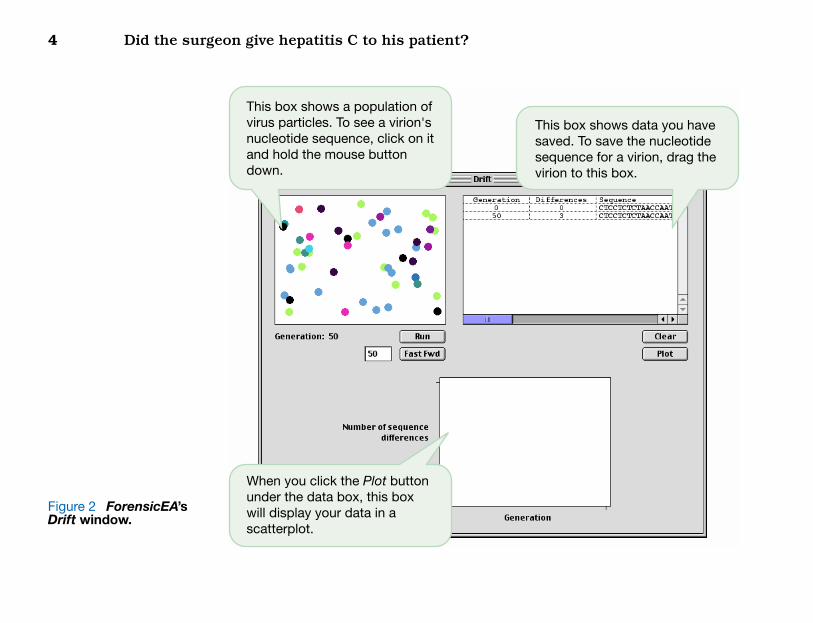
To see the model in action, launch the application ForensicEA. After the advertisement for Evolutionary Analysis disappears, you will see a window titled Drift (Figure 2). The box on the upper left contains our population of virus particles, living inside a patient. To get a closer look at an individual virion, click on it and hold the mouse button down. A
Figa pcleinvanthlistiorepvathpono
4
Did the surgeon give hepatitis C to his patient?
Thivirunucanddow
Whundwillsca
Figure 2 ForensicEA’s Drift window.
s box shows a population of s particles. To see a virion's leotide sequence, click on it hold the mouse button n.
This box shows data you have saved. To save the nucleotide sequence for a virion, drag the virion to this box.
en you click the Plot button er the data box, this box
display your data in a tterplot.
Evolution by genetic drift
5
window will pop up showing you a picture of the virion, plus the nucle-otide sequence from a stretch of its genome that is 100 base pairs long. (The reader may notice that the nucleotide sequence is written in DNA bases. Although the hepatitis C virus is an RNA virus, we have chosen to represent its genome as a cDNA copy made for sequencing pur-poses.)
Virus particles with the same color are genetically identical to each other. Note that most, if not all, of the virions in our population are black. These are genetically identical to the virion that initiated our patient’s infection. You may see a few virions of different colors. These are mutants that differ from the founder in one or more nucleotides.
You can compare the sequences of two or more virions by dragging them, one at a time, to the box on the upper right. When you drag a vir-ion to this box, the box records the virion’s data. The first column con-tains the time (in generations) at which you collected the virion. The second column shows how many differences there are between the vir-ion’s nucleotide sequence and the sequence of the first virion in the table. The third column shows the virion’s nucleotide sequence itself.
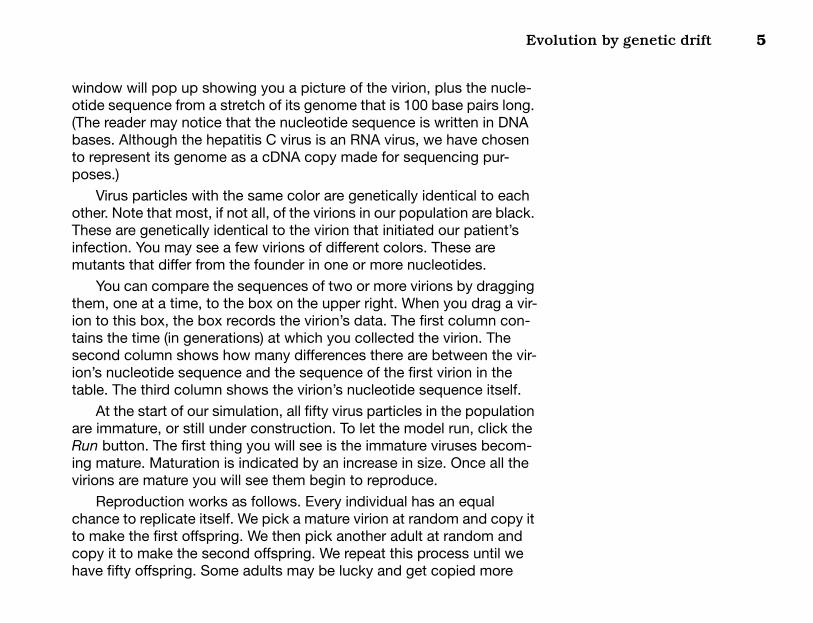
At the start of our simulation, all fifty virus particles in the population are immature, or still under construction. To let the model run, click the Run button. The first thing you will see is the immature viruses becom-ing mature. Maturation is indicated by an increase in size. Once all the virions are mature you will see them begin to reproduce.
Reproduction works as follows. Every individual has an equal chance to replicate itself. We pick a mature virion at random and copy it to make the first offspring. We then pick another adult at random and copy it to make the second offspring. We repeat this process until we have fifty offspring. Some adults may be lucky and get copied more
6
Did the surgeon give hepatitis C to his patient?
than once. Other adults may be unlucky and never get copied at all. Once we have made 50 offspring, all the adults die. Then the offspring mature and get a chance to reproduce themselves. A counter below the box keeps track of the number of generations that have passed.
That’s all there is to our model. The virions have no enemies, and experience no competition. They are born, get their chance to repro-duce, then die. At first glance, you might expect that this population will not evolve at all. There is little or no variation, and no selection. Variation and selection are necessary ingredients for adaptive evolution.
The model does, however, incorporate mutation. As we have already seen, each virus particle has a genome, represented by a piece of cDNA 100 nucleotides long. Every time an adult gets copied to make an offspring, its genome gets copied too. But the copying is not perfect. Occasionally an A is subsituted for a T, or a T for a G, and so on. These mistakes, or mutations, add genetic variation to our population. When a mutation creates a new nucleotide sequence, the virion containing it gets a new color. Watch closely as the simulation runs. Most offspring are identical to their parent, but occassionally you will see new mutants appear among the offspring in the population.
Our model also incorporates chance. Without selection there can be no adaptive evolution, but with chance there can be non-adaptive evo-lution. Just by luck, some genotypes may reproduce more often than others. These will become more common in the population. Also just by luck, other genotypes may reproduce less often than others. These will become rare, and may disappear altogether.
If the composition of our model population changes appreciably as the generations pass, it does so because mutation creates new vari-ants, and then luck takes over. Most of the new variants disappear. But
Evolution by genetic drift
7
occassionally virons of a particular color (and nucleotide sequence) will have a run of good luck and become the most abundant form in the population.
This mechanism of evolution is known as genetic drift. In order to examine genetic drift in more detail, we need to gather some data.
Pause the simulation for a moment. If you have not already done so, drag a virion to the data box on the upper right. This will save its nucle-otide sequence. What we want to do now is run the simulation for sev-eral hundred generations, recording a nucleotide sequence every 50 to 100 generations along the way.
Here is a trick to make the simulation run faster. Enter a number, say 50 or 100, in the small text box to the left of the Fast Fwd button. Now click the Fast Fwd button itself. Instead of showing you every step of the virus’s life cycle, the simulation now skips from one adult generation to the next. (Behind the scenes, the simulation is still running as before.)
When the simulation stops, pick a virion at random and drag it to the data box to record its sequence. (A good way to pick a random virion is to simply take the one that landed closest to the lower right corner of the box.) Click Fast Fwd again, record the sequence for another virion, and so on. Continue letting the population evolve by genetic drift and recording data. Your goal is to gather data spanning at least 700 gener-ations, recording 10 to 20 sequences along the way.
Once you have your 10 or 20 sequences spanning several hundred generations, compare each sequence to the first one you collected. Note the number of differences between the first sequence and each subsequent one. If you click on the Plot button, ForensicEA will display a scatterplot showing the number of sequence differences between the present viral genome and the original one (y-axis) as a function of the
8
Did the surgeon give hepatitis C to his patient?
number of generations that have passed (x-axis). What is the pattern in your graph? Copy the graph onto your worksheet. You might also want to compare the graph to the one in Figure 19.4 in Evolutionary Analysis.
Now go to the File menu and select Reset.... Click the Okay button in the window that appears. Repeat the exercise you have just com-pleted.
Think about what happened in your two experiments. What was similar between them? What was different? What generalizations can you make about how populations evolve by genetic drift? If someone gave you frozen samples of virions from your patient, could you make an educated guess as to how far apart in time the samples were col-lected? Why might an evolutionary biologist think of the graphs you have prepared as molecular clocks?
[ For further investigation: You may have noticed that the Reset dia-log box lets you change the population size, and it lets you change how selection acts on the new mutations that appear. You may want to do some experiments on your own to see how population size, and the pattern of selection, affect the rate at which sequence changes accu-mulate in populations. If you experiment with the effect of population size on the rate of neutral evolution, be aware that chance can play a large role in any particular run. You will have to run the simulation sev-eral times at each of several different population sizes to get a good sense of whether or not population size matters.]
Population divergence by genetic drift
9
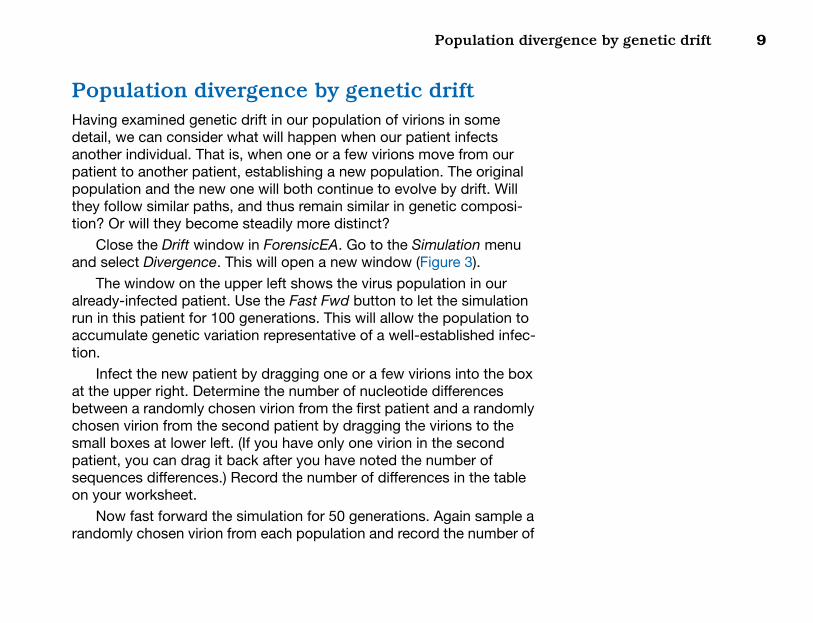
Population divergence by genetic driftHaving examined genetic drift in our population of virions in some detail, we can consider what will happen when our patient infects another individual. That is, when one or a few virions move from our patient to another patient, establishing a new population. The original population and the new one will both continue to evolve by drift. Will they follow similar paths, and thus remain similar in genetic composi-tion? Or will they become steadily more distinct?
Close the Drift window in ForensicEA. Go to the Simulation menu and select Divergence. This will open a new window (Figure 3).
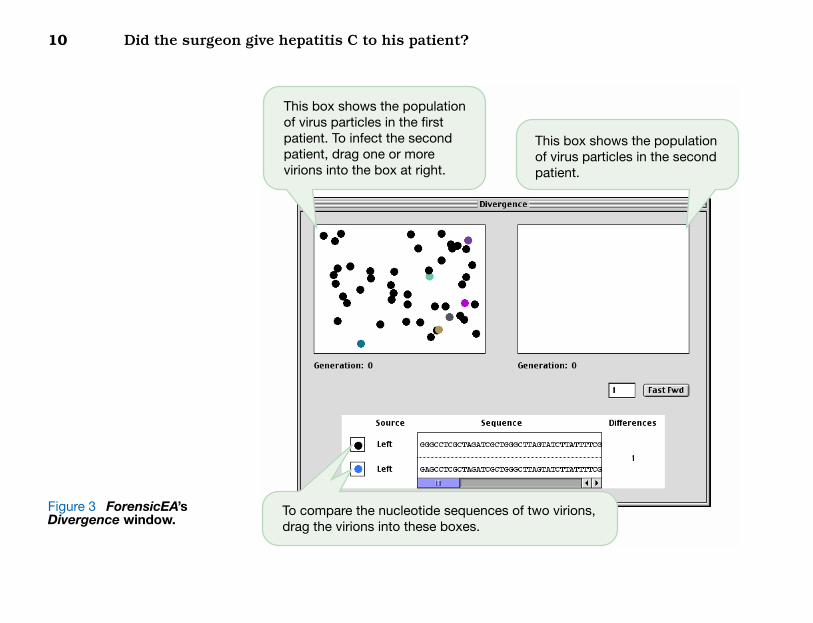
The window on the upper left shows the virus population in our already-infected patient. Use the Fast Fwd button to let the simulation run in this patient for 100 generations. This will allow the population to accumulate genetic variation representative of a well-established infec-tion.
Infect the new patient by dragging one or a few virions into the box at the upper right. Determine the number of nucleotide differences between a randomly chosen virion from the first patient and a randomly chosen virion from the second patient by dragging the virions to the small boxes at lower left. (If you have only one virion in the second patient, you can drag it back after you have noted the number of sequences differences.) Record the number of differences in the table on your worksheet.
Now fast forward the simulation for 50 generations. Again sample a randomly chosen virion from each population and record the number of
10
Did the surgeon give hepatitis C to his patient?
Figure 3 ForensicEA’s Divergence window.
This box shows the population of virus particles in the first patient. To infect the second patient, drag one or more virions into the box at right.
This box shows the population of virus particles in the second patient.
To compare the nucleotide sequences of two virions, drag the virions into these boxes.
Population divergence by genetic drift
11
sequence differences. Continue fast forwarding and collecting data until you have accumulated at least 10 measures of sequence difference spanning at least 500 generations.
Plot a graph on your worksheet showing the number of differences between DNA sequences versus the number of generations that have passed since the second population was established from the first. If you had sequences of virions from two infected individuals, could you make a reasonably accurate guess about how long it has been since the virus populations in the two patients shared a common ancestor? That is, could you estimate how far in the past the two patients were connected in the chain of transmission?
[For further investigation: Use the Reset... command under the File menu to start a new simulation. Experiment with the number of virions transfered to the new patient to start the new infection. Do the popula-tions diverge at an appreciably different rate if you transfer 5, or 10, or 25 virions instead of just one? Is there any effect of population size on the rate at which the populations diverge? Does the rate of divergence depend on whether mutations are neutral, beneficial, or deleterious? How often do you need to transfer individuals between two popula-tions, and how many individuals do you need to transfer, to prevent the populations from diverging?]
12
Did the surgeon give hepatitis C to his patient?
Evolutionary treesWe have looked at how a genetic drift causes a single population to change over time, and at how drift causes two populations to diverge. We are now ready to think about how we might use nucleotide sequences to reconstruct evolutionary history, and to determine whether a particular doctor infected a particular patient.
Reading evolutionary treesClose all windows in ForensicEA. Go to the Simulation menu and
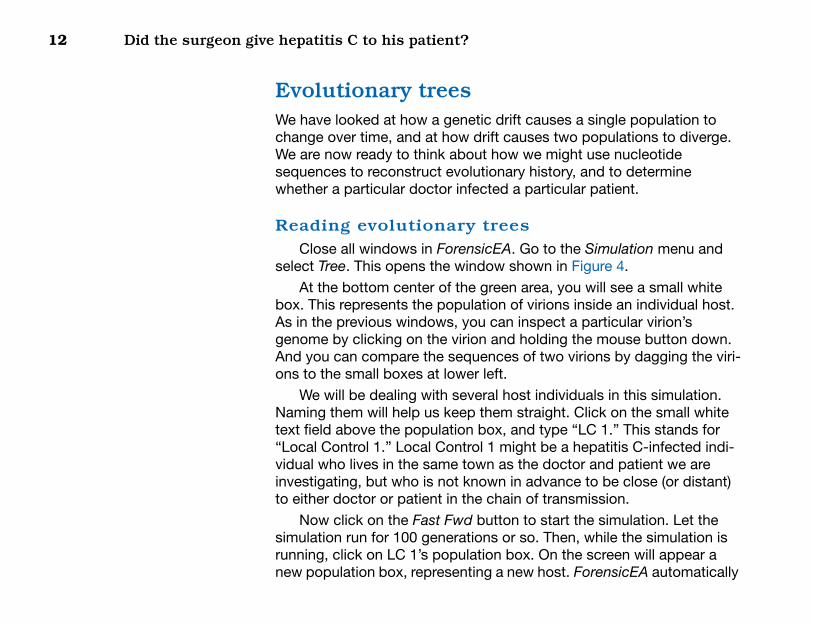
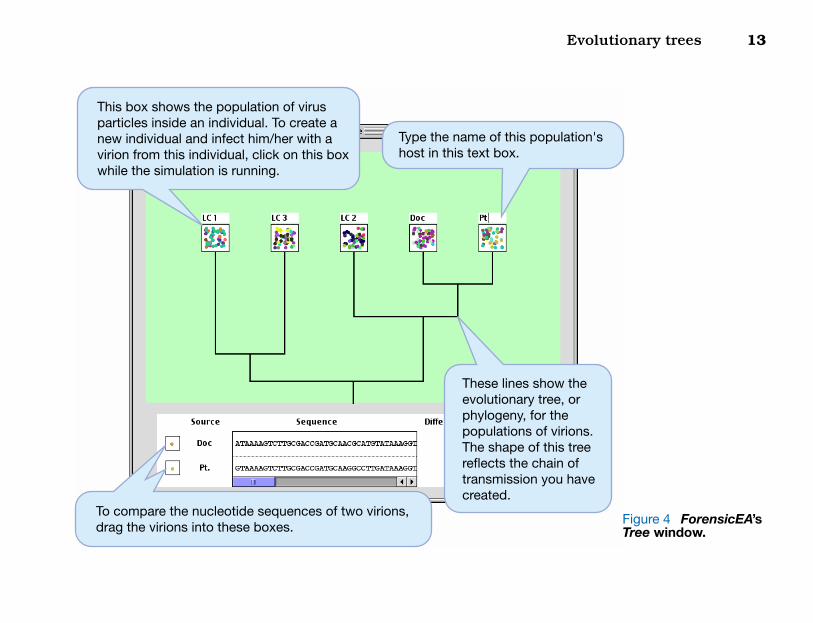
select Tree. This opens the window shown in Figure 4.At the bottom center of the green area, you will see a small white
box. This represents the population of virions inside an individual host. As in the previous windows, you can inspect a particular virion’s genome by clicking on the virion and holding the mouse button down. And you can compare the sequences of two virions by dagging the viri-ons to the small boxes at lower left.
We will be dealing with several host individuals in this simulation. Naming them will help us keep them straight. Click on the small white text field above the population box, and type “LC 1.” This stands for “Local Control 1.” Local Control 1 might be a hepatitis C-infected indi-vidual who lives in the same town as the doctor and patient we are investigating, but who is not known in advance to be close (or distant) to either doctor or patient in the chain of transmission.
Now click on the Fast Fwd button to start the simulation. Let the simulation run for 100 generations or so. Then, while the simulation is running, click on LC 1’s population box. On the screen will appear a new population box, representing a new host. ForensicEA automatically
Evolutionary trees
13
ulation's
w the e, or he virions. is tree in of u have
Figure 4 ForensicEA’s Tree window.
This box shows the population of virus particles inside an individual. To create a new individual and infect him/her with a virion from this individual, click on this box while the simulation is running.
Type the name of this pophost in this text box.
To compare the nucleotide sequences of two virions, drag the virions into these boxes.
These lines shoevolutionary trephylogeny, for tpopulations of The shape of threflects the chatransmission yocreated.
14
Did the surgeon give hepatitis C to his patient?
infects this new host with a virion chosen at random from LC 1’s virus population. Name the new host “LC 2.” Note that ForensicEA is indicat-ing that the virus populations in LC 1 and LC 2 are related to each other by drawing lines below the population boxes that connect them.
Let the simulation run for another 100 generations, then click on LC 1 again. Call the new host “LC 3.” How does the evolutionary tree below the population boxes reflect the fact that LC 1 passed HVC to LC 3 more recently than he or she passed it to LC 2?
After another 100 generations, click on LC 2. Label the new host “Doc.” This host is the doctor we are investigating, who in this particular scenario picked up HVC from LC 2 (perhaps while performing surgery.) How would the evolutionary tree look if, instead, the doctor had gotten HVC from LC 3? LC 1? A tourist who was visiting from a distant city?
Finally, after an additional 100 generations have passed, click on Doc. Label the new host “Pt.” for patient. In this scenario, the doctor has indeed passed HVC to the patient. Let the simulation run for a final 50 generations or so, then click on the Pause button. Your evolutionary tree should look like the one in Figure 4 (although your branch lengths might be different).
Examine the evolutionary tree closely. How does it reflect the fact that the patient got HVC from the doctor? What would it have looked like if, instead, the patient had gotten HVC from someone else?
Reset the simulation and run it again, this time creating your own chain of transmission, different from the one in Figure 4. Let the patient pick up the infection from someone other than the doctor. Does the tree look like you thought it would? Make several different trees, reflecting different chains of transmission, until you are sure you could infer how
Evolutionary trees
15
close two individuals are in the chain of transmission just by looking at the evolutionary tree for their virus populations.
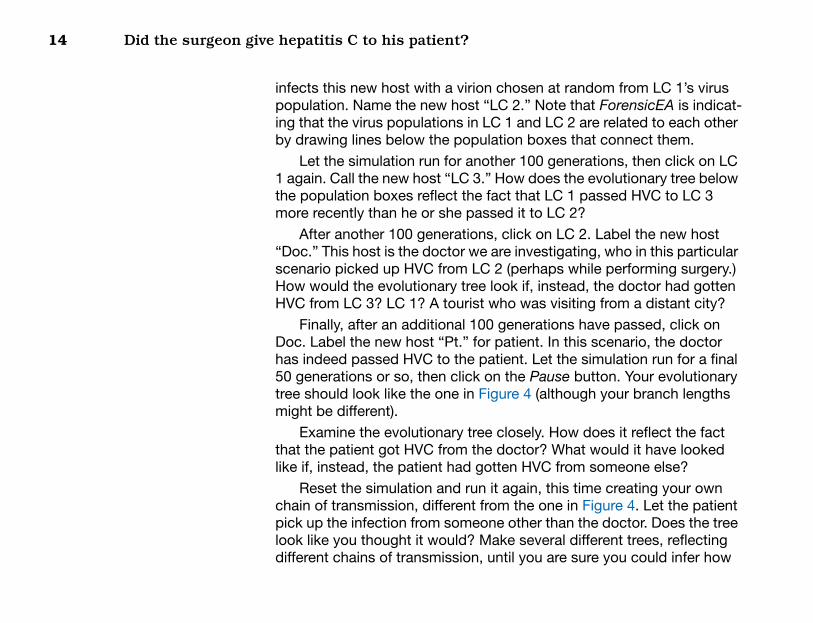
It is also worth thinking about what you cannot infer about the chain of transmission just from looking at an evolutionary tree. ForensicEA always puts the new host to the right of the host passing the infection, but that was an arbitrary choice. We could have programmed it to put the new host to the left. Or to put the new host on either the right or the left, depending on the toss of a coin. All three of the trees below reflect the same relationships among the hosts’s virus populations:
The virus population in LC 1, for example, is more closely related to the population in Patient than either is to the population in LC 3.
However, the trees may or may not reflect exactly the same chain of transmission. For example, LC 2 might have gotten the infection from the doctor, or the doctor might have gotten the infection from LC 2. As a result, we can say with greater confidence what didn’t happen—the patient didn’t get the infection directly from the doctor—than we can say exactly what did happen.
LC 1 Pt. LC 3 LC 2 Doc LC 1 Pt. LC 3 LC 2Doc LC 1 Pt.LC 3LC 2Doc
16
Did the surgeon give hepatitis C to his patient?
Are the trees shown here consistent with a scenario in which the doctor was the first individual infected, and thus the ultimate source of all other infections? Are they consistent with a scenario in which the doctor was the last individual infected? The answer to both questions is “yes.”
Reconstructing evolutionary treesLook back at the last evolutionary tree you grew in ForensicEA. If
the vertical branch lengths on the tree aren’t fairly long—if you didn’t let at least 50 to 100 generations pass between transmissions—grow another tree in which the branches are fairly long.
Your challenge now is to try to reconstruct the evolutionary history of your five virus populations, and infer what you can about the chain of transmission, using only nucleotide sequences sampled from the popu-lations at the branch tips.
This is the same challenge faced by biologists who are trying to unravel the evolutionary relationships among living individuals, popula-tions, or species. The only difference is that you already know the true evolutionary history of your five populations—ForensicEA kept track of it for you as the populations evolved. Biologists working with real popu-lations almost never know the true pattern of evolutionary history. The best they can do is make an educated guess about that history based on the available data.
There are many methods for reconstructing evolutionary history based on nucleotide sequences. The details of most methods are math-ematically challenging. But the methods have in common the straight-forward assumption that the longer it has been since two populations split apart—that is, since they shared a common ancestor—the more
Evolutionary trees
17
AATG GAATAACACTA?TG GAATAA?ACTAATG GAGG?AAACTCATC CCTTCAGACACGGC CCTTCAGACAIV virions. Sequences
genetically different the populations will be. Or to put it another way, the more genetically similar a pair of populations are, the closer they proba-bly are to each other on the tree of life.
The method we will use to reconstruct evolutionary history goes by the acronym UPGMA. This stands for Unweighted Pair Group Method using Arithmetic averages. Never mind what that means. In spite of its name, UPGMA is an intuitively straightforward method. And, while it is not the most powerful method for reconstructing evolutionary trees, it works reasonably well for many data sets.
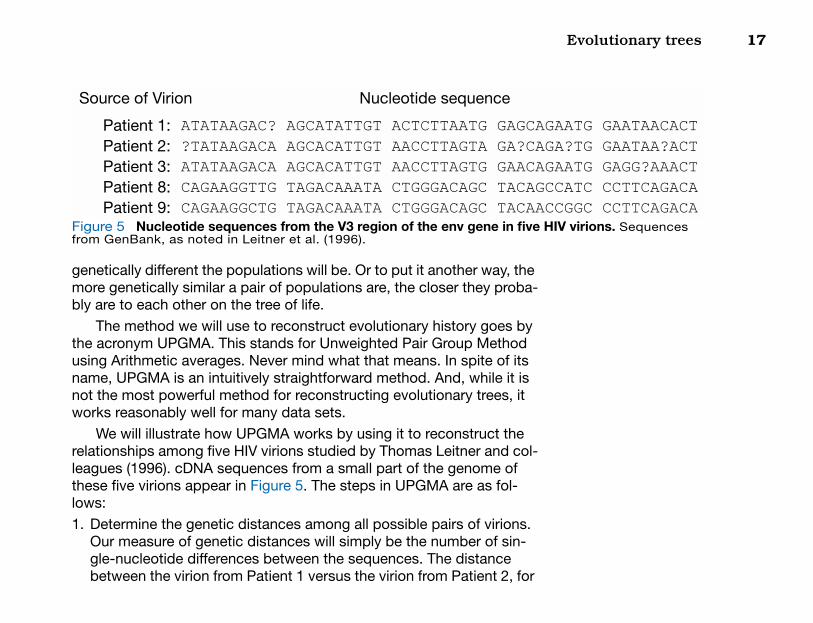
We will illustrate how UPGMA works by using it to reconstruct the relationships among five HIV virions studied by Thomas Leitner and col-leagues (1996). cDNA sequences from a small part of the genome of these five virions appear in Figure 5. The steps in UPGMA are as fol-lows:1. Determine the genetic distances among all possible pairs of virions.
Our measure of genetic distances will simply be the number of sin-gle-nucleotide differences between the sequences. The distance between the virion from Patient 1 versus the virion from Patient 2, for
Patient 1:Patient 2:Patient 3:Patient 8:Patient 9:
Source of Virion Nucleotide sequence
ATATAAGAC? AGCATATTGT ACTCTTAATG GAGCAG?TATAAGACA AGCACATTGT AACCTTAGTA GA?CAGATATAAGACA AGCACATTGT AACCTTAGTG GAACAGCAGAAGGTTG TAGACAAATA CTGGGACAGC TACAGCCAGAAGGCTG TAGACAAATA CTGGGACAGC TACAAC
Figure 5 Nucleotide sequences from the V3 region of the env gene in five Hfrom GenBank, as noted in Leitner et al. (1996).
18
Did the surgeon give hepatitis C to his patient?
A)
Patient 1Patient 2Patient 3Patient 8Patient 9
C)
Patient 1(Patient 2-3)
Patient 8Patient 9
E)
Patient 1(Patient 2-3)(Patient 8-9)
Figure 6 Utext for expl
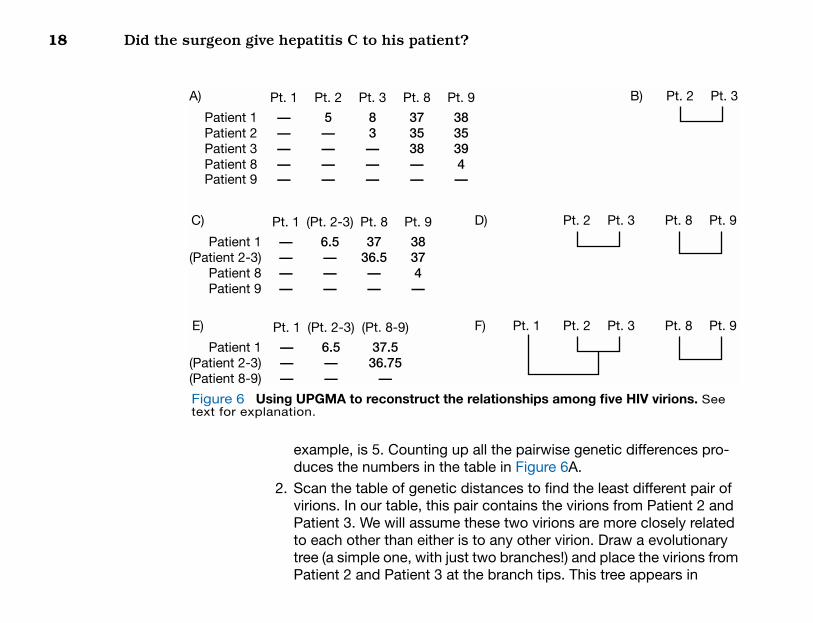
example, is 5. Counting up all the pairwise genetic differences pro-duces the numbers in the table in Figure 6A.
2. Scan the table of genetic distances to find the least different pair of virions. In our table, this pair contains the virions from Patient 2 and Patient 3. We will assume these two virions are more closely related to each other than either is to any other virion. Draw a evolutionary tree (a simple one, with just two branches!) and place the virions from Patient 2 and Patient 3 at the branch tips. This tree appears in
Pt. 8
373538——
Pt. 1
——
——
—
Pt. 2
5————
Pt. 3
83———
Pt. 9
3835394—
B) Pt. 2 Pt. 3
Pt. 9
38374—
Pt. 1
——
——
(Pt. 2-3)
6.5———
Pt. 8
3736.5——
D) Pt. 8 Pt. 9Pt. 2 Pt. 3
Pt. 1
———
(Pt. 2-3)
6.5——
(Pt. 8-9)
37.536.75
—
F) Pt. 8 Pt. 9Pt. 2 Pt. 3Pt. 1
sing UPGMA to reconstruct the relationships among five HIV virions. See anation.
Evolutionary trees
19
Figure 6B. Note that the base of the tree, where the branches leading to the Patient 2 and Patient 3 virions split, is the two virions’ common ancestor. We now want to know how this common ancestor is related to the virions from Patients 1, 8, and 9.
3. Revise the table of genetic distances, replacing the Patient 2 and Patient 3 virions with their common ancestor, which we will call the (Patient 2-3) virion. We don’t know for certain the genetic distance between the (Patient 2-3) virion the and the Patient 1 virion, but we can estimate it as the average of the Patient 2-to-Patient 1distance and the Patient 3-to-Patient 1 distance. This is (5+8) / 2 = 6.5. Like-wise, we can estimate the distance between the (Patient 2-3) virion and the Patient 8 virion as (35+38) / 2 = 36.5, and the distance between the (Patient 2-3) virion and the Patient 9 virion as (35+39) / 2 = 37. We now have the table of distances in Figure 6C.
4. Repeat steps 2 and 3 until the tree is complete. Scanning our new table reveals that the Patient 8 and Patient 9 virions are the least dif-ferent pair. Placing them on neighboring branch tips gives the tree in Figure 6D. The revised table of genetic distances appears in Figure 6E. Note that our estimate of the genetic distance between (Patient 2-3) and (Patient 8-9) is the average of four genetic dis-tances: Patient 2-to-Patient 8, Patient 2-to-Patient 9, Patient 3-to-Patient 8, and Patient 3-to-Patient 9. The smallest genetic distance now is that between the virions from Patient 1 and (Patient 2-3). Add-ing this relationship to our evolutinary tree produces the diagram in Figure 6F.[Shortly you will use UPGMA to reconstruct your own HVC tree. There is one situation that may arise that we haven’t covered. If, when scanning the table of genetic distances, you find a tie for the
20
Did the surgeon give hepatitis C to his patient?
Figure 7 relationshstructed u
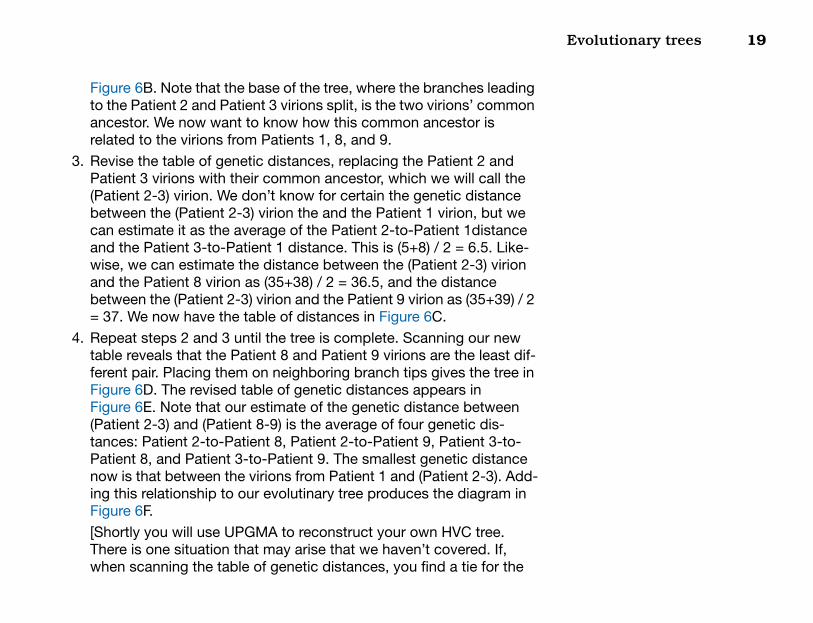
least different pair, flip a coin to decide which pair you will add to the tree next.]Our reconstructed evolutionary tree now includes all our HIV virions.
All that remains is to connect the two parts of the tree to each other (Figure 7).
How well did UPGMA work? In this particular example, we know the true tree, and the actual chain of transmission. Based on detailed inter-views and other evidence, Leitner and colleagues know that Patient 1 was the first of this cluster to become infected with HIV. Patient 1, a Swedish man, later transmitted the infection to two of his female sex partners, Patient 2 and Patient 8. Patient 2 later had a son, Patient 3, to whom she passed the infection. And Patient 8 had a daughter, Patient 9, to whom she passed the infection as well. In this case, the tree we reconstructed with UPGMA is consistent with the true tree. And it is consistent with the known chain of transmission.
Use UPGMA to try to reconstruct the evolutionary tree you pro-duced with ForensicEA. Under Question 5 on your worksheet you will find blank tables and spaces to draw your trees.
Your measure of the genetic distance between a pair of hepatitis C virus populations will be the number of single-nucleotide differences between the sequences of virions drawn at random from the popula-
Pt. 8 Pt. 9Pt. 2 Pt. 3Pt. 1
An estimate of the evolutionary ips among five HIV virions, recon-sing UPGMA.
Evolutionary trees
21
tions. Drag virions to the small boxes at lower left in the Tree window, and record the number of differences in Table A.
After you have filled in Table A, complete the UPGMA procedure. Compare the tree you got by using UPGMA to the truth, which was recorded by ForensicEA as your populations evolved. (Note that there are many different ways to draw the same tree. The important thing is the pattern of branching among the ancestors. Recall that the trees on page 15 are the same.) How well did UPGMA do at recontructing the truth?
[For further investigation: As we mentioned above, UPGMA is not the most powerful method for reconstructing evolutionary trees. Some-times it reconstructs the true tree; other times it doesn’t. Experiment with using UPGMA to reconstruct a variety of known trees generated in ForensicEA. What kinds of trees can UPGMA reconstruct accurately? What kinds of trees does UPGMA do poorly with?]
22
Did the surgeon give hepatitis C to his patient?
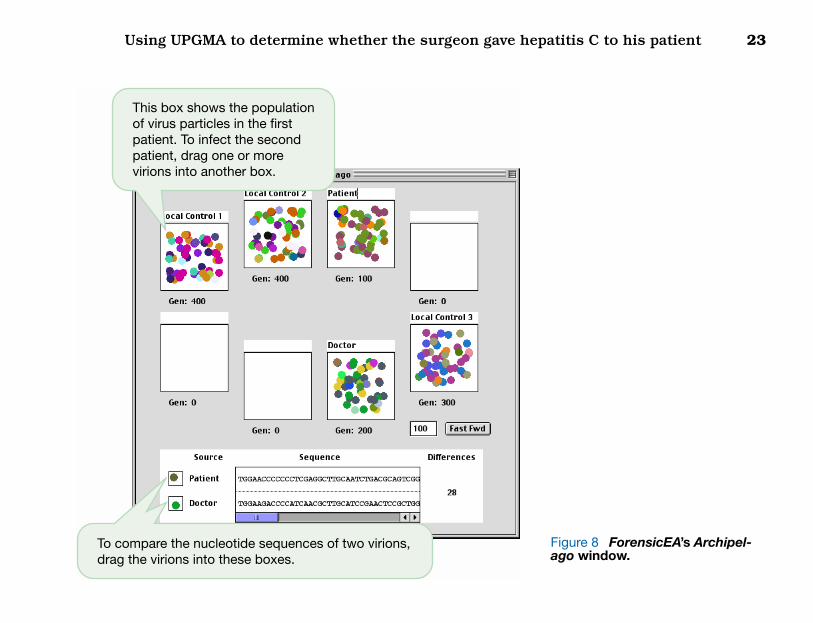
Using UPGMA to determine whether the surgeon gave hepatitis C to his patientIn ForensicEA, go the Simulation menu and select Archipelago. The Archipelago window is shown in Figure 8. This simulation is similar to the one you worked with in the Tree window. Each of the white boxes arranged in a circle represents a potential host for hepatitis C. You can initiate new infections by dragging virions from one host to another. Your task is as it was in the Tree simulation: You will generate a chain of transmission for the virus, then try to reconstruct it with UPGMA. The difference is that you have to keep track of the true tree yourself, because the program no longer does it for you.
Start by naming the already infected individual. You might call this host “Local Control 1.” Run the simulation for 100 generations.
Infect the host to the right of Local Control 1. This will be “Local Control 2.” Look at the diagram under Question 8 on your worksheet, and note that the transfer from Local Control 1 to Local Control 2 has been recorded for you. An evolutionary tree showing the relationship between your two virus populations appears on the worksheet as well. Run the simulation for another 100 generations.
Now that you have two distinct populations of virions, move a virion from Local Control 1 or Local Control 2 to another host. Record the establishment of your new viral population in the diagram under Ques-tion 8. Also, add the new population to the evolutionary tree. Run the simulation for 100 generations.
Using UPGMA to determine whether the surgeon gave hepatitis C to his patient 23
igure 8 ForensicEA’s Archipel-go window.
This box shows the population of virus particles in the first patient. To infect the second patient, drag one or more virions into another box.
To compare the nucleotide sequences of two virions, drag the virions into these boxes.
Fa
24 Did the surgeon give hepatitis C to his patient?
Establish a fourth population, and label its host “Doctor.” Add this new population to the diagram and phylogeny under Question 8. Run the simulation for 100 generations.
Finally, prepare a fifth host by naming it “Patient.” Flip a coin to decide whether you will infect the patient with a virion from the doctor or from one of the local controls. Infect the patient, and record the transmission in your diagram and evolutionary tree.
Now use UPGMA to reconstruct the evolutionary tree for your five virus populations. Tables and drawing space are provided on your worksheet. How well did UPGMA do at reconstructing the true tree? Did the reconstructed tree accurately reflect the origin of Patient’s infec-tion?
[For further investigation: We noted above that a close relationship between the doctor and patient’s heptatis C populations provides evi-dence that the two hosts are closely linked in the chain of transmission, but that it doesn’t establish who infected who. Can you think of a way to solve this problem? What if we sample several virus particles from the doctor and several from the patient, instead of just one virus particle from each? Now what will the tree look like if the doctor infected the patient? If the patient infected the doctor? Test your ideas by running experiments in ForensicEA.]
The surgeon and the patient 25
on a
on b
on c
on d
on e
t at b
t ct d
t e
control 1
control 3
control 2
control 4
control 5
t controlt control
t controlt controlt controlt controlt controlt control
t controlt controlt control
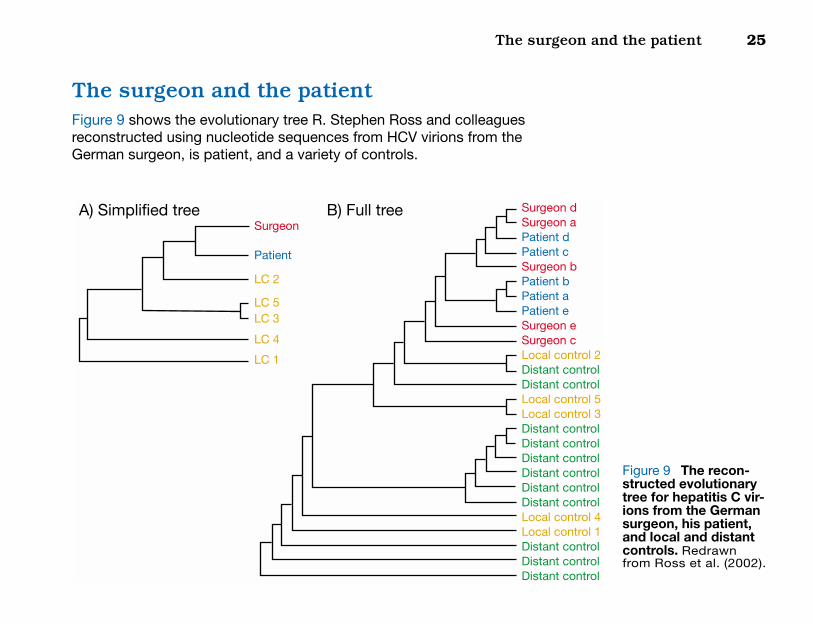
Figure 9 The recon-structed evolutionary tree for hepatitis C vir-ions from the German surgeon, his patient, and local and distant controls. Redrawn from Ross et al. (2002).
The surgeon and the patientFigure 9 shows the evolutionary tree R. Stephen Ross and colleagues reconstructed using nucleotide sequences from HCV virions from the German surgeon, is patient, and a variety of controls.
Surge
Surge
Surge
Surge
Surge
PatienPatien
PatienPatien
Patien
Local
Local
Local
Local
Local
DistanDistan
DistanDistanDistanDistanDistanDistan
DistanDistanDistan
Surgeon
Patient
LC 2
LC 5LC 3
LC 4
LC 1
A) Simplified tree B) Full tree
26 Did the surgeon give hepatitis C to his patient?
Look first at the simplified version on the left. This tree includes a single virion each from the surgeon, the patient, and five local controls. Is the tree consistent with the hypothesis that the surgeon passed HVC to the patient? What other interpretations are possible? What other hypotheses can you rule out?
Now look at the full evolutionary tree on the right. This tree includes controls from a variety of cities in addition to the five from the town where the surgeon and patient live. More importantly, it also includes five virions each from the surgeon and the patient. Does the full tree tend to weaken or strengthen the case that the surgeon accidently gave his patient hepatitis? Why?
What do you conclude?
The surgeon and the patient 27
BibliographyHillis, D. M., J. J. Bull, et al. 1992. Experimental phylogenetics: Genera-
tion of a known phylogeny. Science 255:589-592.Leitner, T., D. Escanilla, et al. 1996. Accurate reconstruction of a known
HIV-1 transmission history by phylotenetic tree analysis. Proceed-ings of the National Academy of Sciences, USA 93: 10864–10869.
Ross, R. S., S. Viazov, and M. Roggendorf. 2002. Phylogenetic analysis indicates transmission of heptatitis C virus from an infected ortho-pedic surgeon to his patient. Journal of Medical Virology 66: 461-467.
Swofford and Olsen. 1990. Chapter 11 in Molecular systematics. D. M. Hillis and C. Moritz, Eds. Sinauer Associates, Sunderland MA.
Related Documents