Forensic transient analyses of two pipeline failures MARKO V. IVETIC* Faculty of Civil Engineering, University of Belgrade, Bul. Revolucije 73 Belgrade, Yugoslavia (Revised version received June 2004) Details pertaining to two groups of preventable accidents, both caused by transient events, are presented. The accidents could have been avoided if there had been better coordination during the design process, during system construction and during operation. Moreover, a number of common beliefs, inherited from the period when computer simulations were rare, as well as ill-informed attempts to mimic ‘‘good solutions’’, influenced design decisions and contributed to the performance difficulties. The two examples illustrate transient analysis in complex systems and raise crucial issues about the lines of responsibility; although such problems also exist in small systems, the damage is typically proportionally smaller, and thus small systems have tended to receive less attention. The first case presented involves the Abattemarco pipeline in Italy. In this case, an unauthorized decision to marginally decrease capital costs by reducing the pipe’s pressure class significantly compromised system reliability. In the second case, involving a desalination plant, it was erroneously believed that such a low-pressure system would not be susceptible to transients and that, in any case, a higher pressure class would invariably cover all contingencies. The operation of this second system was further complicated by a decision to oversize the pumps, a choice that increased both capital and running costs and simultaneously diminished the reliability of the already vulnerable system. Keywords: Hydraulic transients; Pipeline failure; Risk assessment 1. Introduction In spite of theoretical and practical advances over many years (e.g. Parmakian 1963, Wylie and Streeter 1978, Thorley 1991), and even with continuing research into numerical transient analysis, controlling transient events in pipelines and water distribution networks is not easy (Karney and McInnis 1990). In fact, it is difficult to assess the reliability of transient control measures, since too few detailed case studies have been presented. A detailed analysis depends on the level of information available regarding the performance of real systems. Such informa- tion should include details of system layout, the conditions of pipes and equipment, operational and control ap- proaches, the state of system maintenance, and many related factors. Mathematical and numerical models based on the method of characteristics have proven to be effective (Ivetic 1996). They have been successfully applied in highly complex systems, even in cases involving transient cavita- tion (Provoost 1976, Streeter 1983, Ivetic 2003). Moreover, significant progress has been made in the use of transient analysis to examine the conditions of distribution networks and other complex systems. It is relatively easy to perform simulations that correspond to measured values in an existing system. On the other hand, there is much greater uncertainty in defining control devices in systems that have not yet been constructed. Certainly the equipment can be specified, but it may change before being purchased and commissioned, and may not operate as expected. The main sources of uncertainty that remain unresolved are: *Corresponding author. Email: [email protected] Urban Water Journal, Vol. 1, No. 2, June 2004, 85 – 95 Urban Water Journal ISSN 1573-062X print/ISSN 1744-9006 online # 2004 Taylor & Francis Ltd http://www.tandf.co.uk/journals DOI: 10.1080/157306204112331289986

Welcome message from author
This document is posted to help you gain knowledge. Please leave a comment to let me know what you think about it! Share it to your friends and learn new things together.
Transcript
Forensic transient analyses of two pipeline failures
MARKO V. IVETIC*
Faculty of Civil Engineering, University of Belgrade, Bul. Revolucije 73 Belgrade, Yugoslavia
(Revised version received June 2004)
Details pertaining to two groups of preventable accidents, both caused by transient
events, are presented. The accidents could have been avoided if there had been better
coordination during the design process, during system construction and during
operation. Moreover, a number of common beliefs, inherited from the period when
computer simulations were rare, as well as ill-informed attempts to mimic ‘‘good
solutions’’, influenced design decisions and contributed to the performance difficulties.
The two examples illustrate transient analysis in complex systems and raise crucial issues
about the lines of responsibility; although such problems also exist in small systems, the
damage is typically proportionally smaller, and thus small systems have tended to receive
less attention. The first case presented involves the Abattemarco pipeline in Italy. In this
case, an unauthorized decision to marginally decrease capital costs by reducing the pipe’s
pressure class significantly compromised system reliability. In the second case, involving a
desalination plant, it was erroneously believed that such a low-pressure system would not
be susceptible to transients and that, in any case, a higher pressure class would invariably
cover all contingencies. The operation of this second system was further complicated by a
decision to oversize the pumps, a choice that increased both capital and running costs and
simultaneously diminished the reliability of the already vulnerable system.
Keywords: Hydraulic transients; Pipeline failure; Risk assessment
1. Introduction
In spite of theoretical and practical advances over many
years (e.g. Parmakian 1963, Wylie and Streeter 1978,
Thorley 1991), and even with continuing research into
numerical transient analysis, controlling transient events in
pipelines and water distribution networks is not easy
(Karney and McInnis 1990). In fact, it is difficult to assess
the reliability of transient control measures, since too few
detailed case studies have been presented. A detailed
analysis depends on the level of information available
regarding the performance of real systems. Such informa-
tion should include details of system layout, the conditions
of pipes and equipment, operational and control ap-
proaches, the state of system maintenance, and many
related factors.
Mathematical and numerical models based on the
method of characteristics have proven to be effective (Ivetic
1996). They have been successfully applied in highly
complex systems, even in cases involving transient cavita-
tion (Provoost 1976, Streeter 1983, Ivetic 2003). Moreover,
significant progress has been made in the use of transient
analysis to examine the conditions of distribution networks
and other complex systems. It is relatively easy to perform
simulations that correspond to measured values in an
existing system. On the other hand, there is much greater
uncertainty in defining control devices in systems that have
not yet been constructed. Certainly the equipment can be
specified, but it may change before being purchased and
commissioned, and may not operate as expected.
The main sources of uncertainty that remain unresolved
are:
*Corresponding author. Email: [email protected]
Urban Water Journal, Vol. 1, No. 2, June 2004, 85 – 95
Urban Water JournalISSN 1573-062X print/ISSN 1744-9006 online # 2004 Taylor & Francis Ltd
http://www.tandf.co.uk/journalsDOI: 10.1080/157306204112331289986
. For steady state conditions, friction coefficients can be
estimated within a margin of perhaps+ 10%. In the
majority of analyses the same expressions are used for
unsteady flow, giving a much wider margin of
uncertainty.. Pump characteristics are only known after delivery and
installation (and the actual pump characteristics in all
four quadrants will probably remain unknown).. Many small changes to the system take place in the later
phases of design, after the primary hydraulic analysis
has been completed. Even if these changes are small,
their cumulative effect can be significant. For example,
the pressure class of valves could change, and indeed it is
not uncommon to modify the size or configuration of a
valve.. Different contractors often complete different phases of
design and construction, and some may not treat the
whole system but only the part within their own ‘‘Terms
of Reference’’; this inevitably leads to variations in
system details.. The amount of free and dissolved air depends on local/
seasonal conditions and the design of the water intake.
The influence of free air on wave velocity is significant
(though, fortunately, usually conservative in terms of
peak pressures).. Although, some of the uncertainties may significantly
reduce the risk of transients and conservative safety
factors are used in the structural design of pipes,
accidents do happen (Almeida 1992, Tulis and Watkins
1992, Locher et al. 2000). The experience gathered from
such accidents is valuable, yet rarely shared.
The worrisome characteristic of the present design practice
is insufficient participation by transient analysis specialists
throughout design and construction. In a process that is
inherently iterative, where several interactive parameters of
the system have to be adjusted, all changes that may affect
system operation and reliability should be authorised by
the specialist. This observation has led more recently to the
idea of providing system operators with tools to assess the
risk of hydraulic transients, which can be used on a daily
basis and to share responsibility for system safety (Far et al.
2004).
In this paper, hydraulic analysis results from two groups
of accidents are summarized. The chief goal of both
analyses, performed by the author, was a search for
evidence to assign fault: to determine that something (or
someone) did not perform as expected. In a situation where
information might be unavailable for a variety of reasons,
the investigation assumed a forensic character.
2. Abattemarco pipeline, Italy
2.1 Accidents
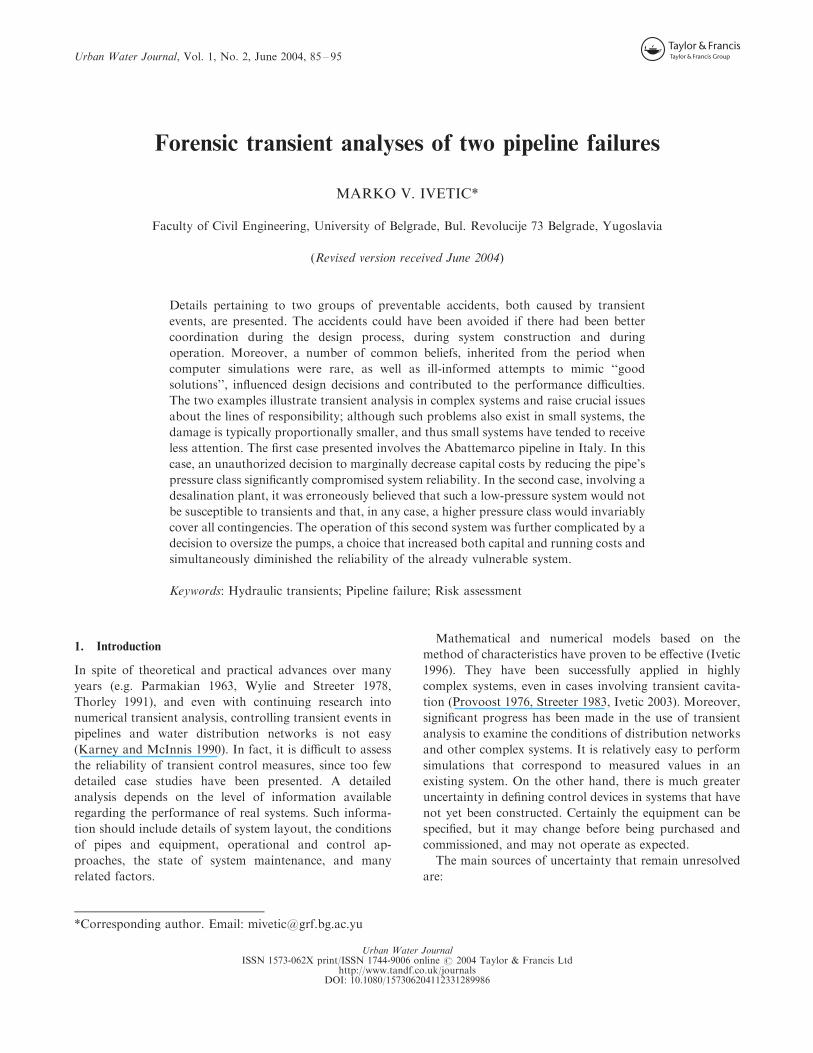
The Abattemarco pipeline is a part of the water supply
system of Cosenza in Italy. The distance between the intake
and the main reservoir in Cosenza is 56 km, with diameters
ranging from 800 mm (upstream) to 550 mm (down-
stream), and a total head difference of 250 m (figure 1).
The flow capacity of the pipeline is approximately 500 l/s.
A pump with a capacity 100 l/s is connected to the main
pipeline (DN 700) via pipeline DN 400, a further 5 km
downstream (figure 2). The ground profile is highly
irregular with the maximum elevation being 615 m at the
water intake and a minimum along the line of 104 m. Over
the line’s first 16 km, there is an additional parallel segment
that locally reduces both velocities and head losses (figure
2). After more than 20 years of reliable operation, the
pipeline experienced two accidents in a short interval.
Figure 2 gives a perspective view and layout of the pipeline,
with an indication of the location of both the pump and the
Figure 1. The Abattemarco pipeline.
86 M. V. Ivetic
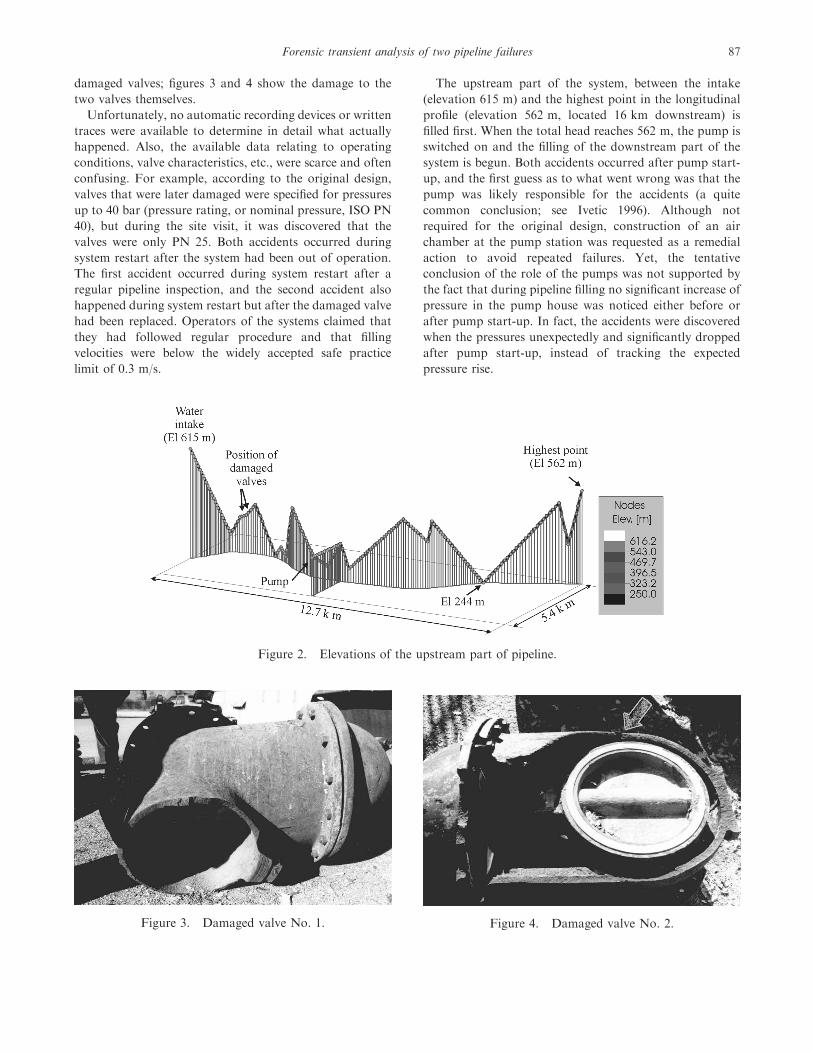
damaged valves; figures 3 and 4 show the damage to the
two valves themselves.
Unfortunately, no automatic recording devices or written
traces were available to determine in detail what actually
happened. Also, the available data relating to operating
conditions, valve characteristics, etc., were scarce and often
confusing. For example, according to the original design,
valves that were later damaged were specified for pressures
up to 40 bar (pressure rating, or nominal pressure, ISO PN
40), but during the site visit, it was discovered that the
valves were only PN 25. Both accidents occurred during
system restart after the system had been out of operation.
The first accident occurred during system restart after a
regular pipeline inspection, and the second accident also
happened during system restart but after the damaged valve
had been replaced. Operators of the systems claimed that
they had followed regular procedure and that filling
velocities were below the widely accepted safe practice
limit of 0.3 m/s.
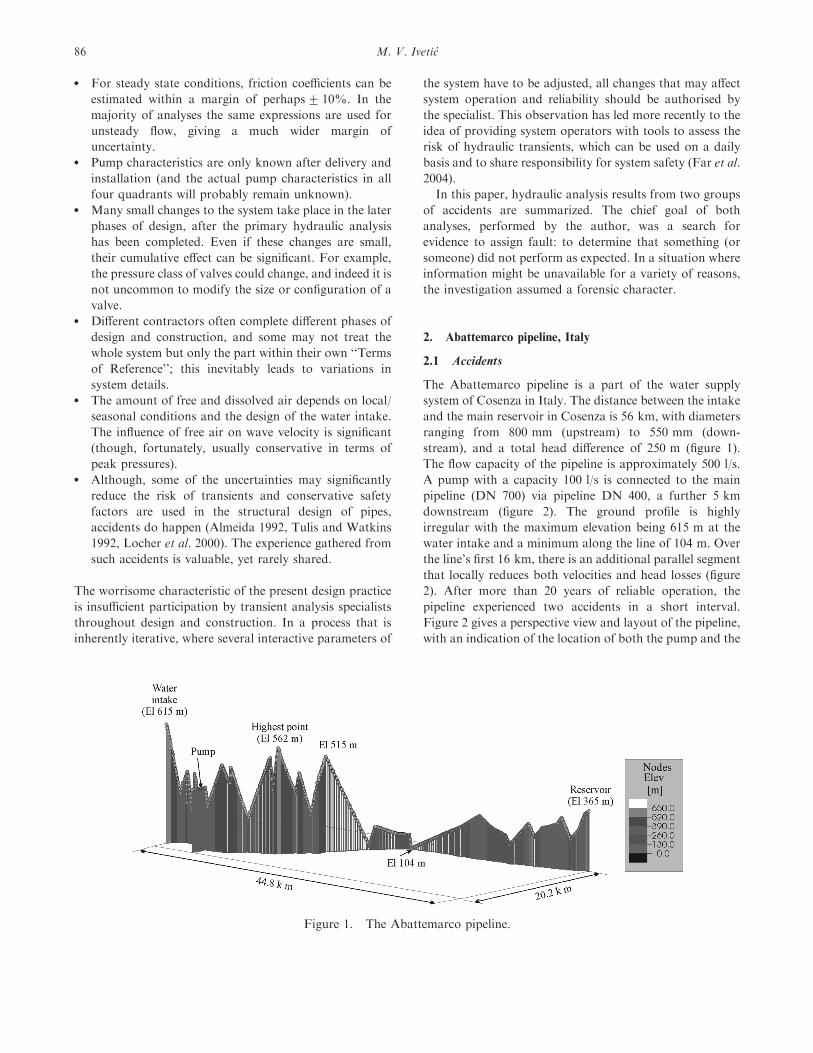
The upstream part of the system, between the intake
(elevation 615 m) and the highest point in the longitudinal
profile (elevation 562 m, located 16 km downstream) is
filled first. When the total head reaches 562 m, the pump is
switched on and the filling of the downstream part of the
system is begun. Both accidents occurred after pump start-
up, and the first guess as to what went wrong was that the
pump was likely responsible for the accidents (a quite
common conclusion; see Ivetic 1996). Although not
required for the original design, construction of an air
chamber at the pump station was requested as a remedial
action to avoid repeated failures. Yet, the tentative
conclusion of the role of the pumps was not supported by
the fact that during pipeline filling no significant increase of
pressure in the pump house was noticed either before or
after pump start-up. In fact, the accidents were discovered
when the pressures unexpectedly and significantly dropped
after pump start-up, instead of tracking the expected
pressure rise.
Figure 3. Damaged valve No. 1.
Figure 2. Elevations of the upstream part of pipeline.
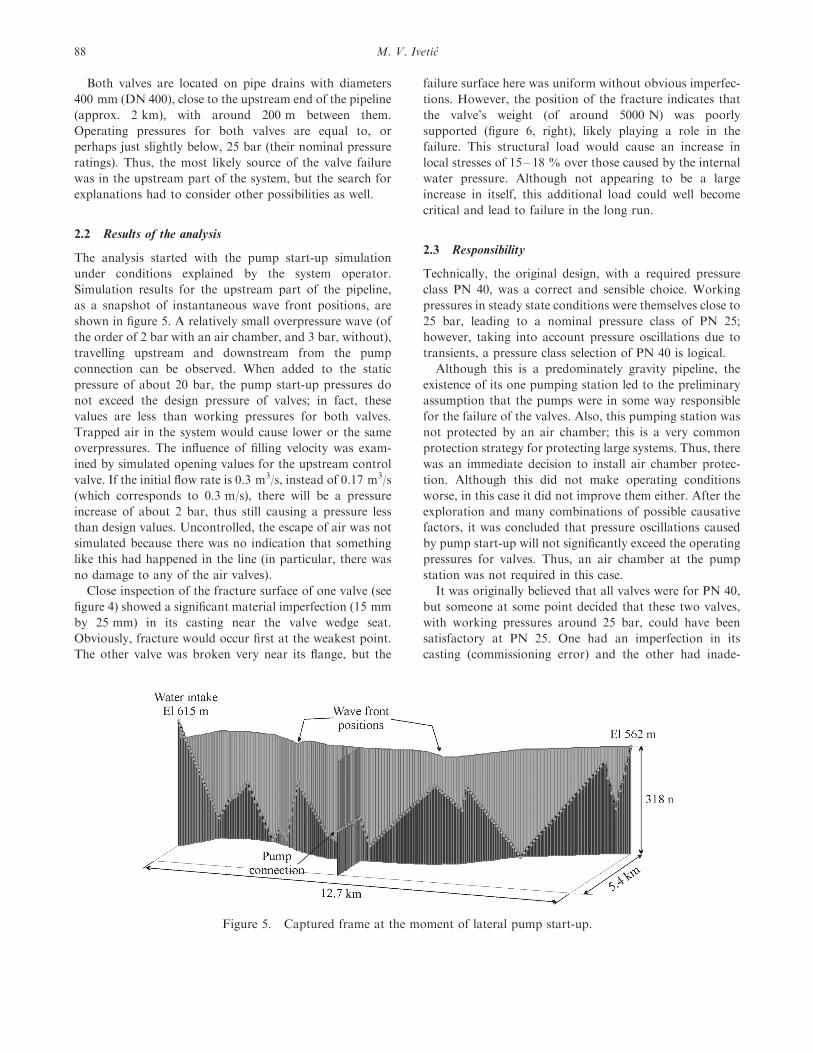
Figure 4. Damaged valve No. 2.
Forensic transient analysis of two pipeline failures 87
Both valves are located on pipe drains with diameters
400 mm (DN 400), close to the upstream end of the pipeline
(approx. 2 km), with around 200 m between them.
Operating pressures for both valves are equal to, or
perhaps just slightly below, 25 bar (their nominal pressure
ratings). Thus, the most likely source of the valve failure
was in the upstream part of the system, but the search for
explanations had to consider other possibilities as well.
2.2 Results of the analysis
The analysis started with the pump start-up simulation
under conditions explained by the system operator.
Simulation results for the upstream part of the pipeline,
as a snapshot of instantaneous wave front positions, are
shown in figure 5. A relatively small overpressure wave (of
the order of 2 bar with an air chamber, and 3 bar, without),
travelling upstream and downstream from the pump
connection can be observed. When added to the static
pressure of about 20 bar, the pump start-up pressures do
not exceed the design pressure of valves; in fact, these
values are less than working pressures for both valves.
Trapped air in the system would cause lower or the same
overpressures. The influence of filling velocity was exam-
ined by simulated opening values for the upstream control
valve. If the initial flow rate is 0.3 m3/s, instead of 0.17 m3/s
(which corresponds to 0.3 m/s), there will be a pressure
increase of about 2 bar, thus still causing a pressure less
than design values. Uncontrolled, the escape of air was not
simulated because there was no indication that something
like this had happened in the line (in particular, there was
no damage to any of the air valves).
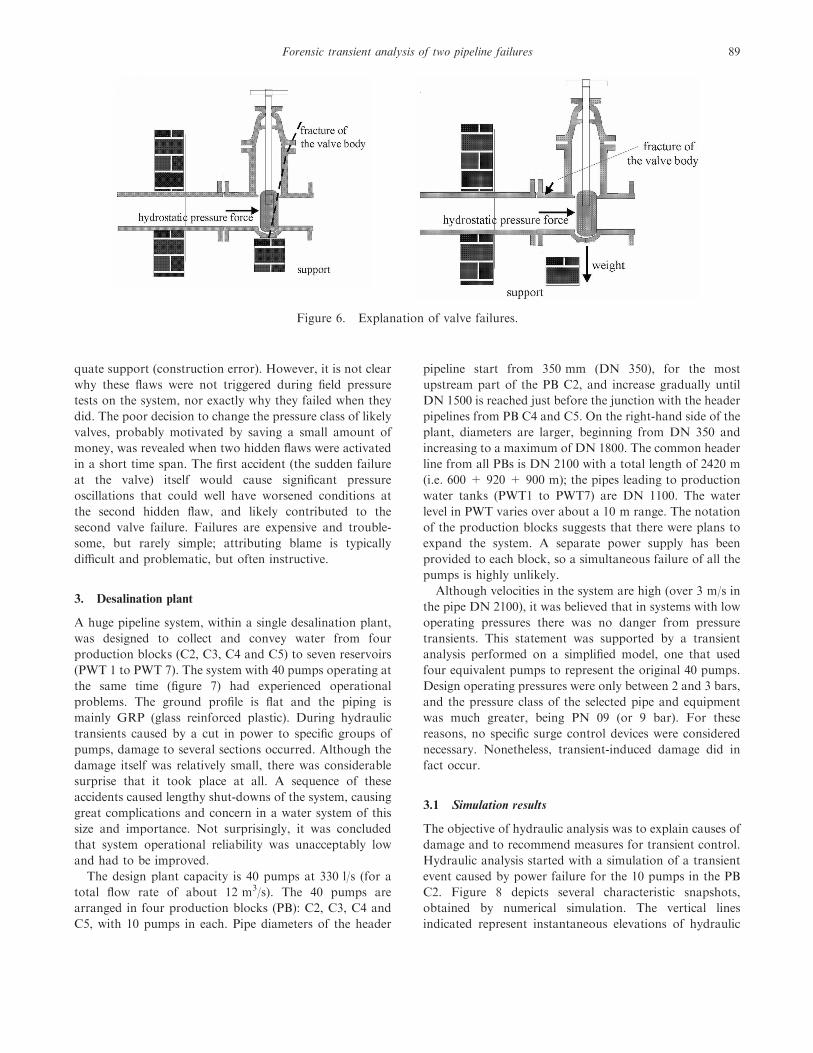
Close inspection of the fracture surface of one valve (see
figure 4) showed a significant material imperfection (15 mm
by 25 mm) in its casting near the valve wedge seat.
Obviously, fracture would occur first at the weakest point.
The other valve was broken very near its flange, but the
failure surface here was uniform without obvious imperfec-
tions. However, the position of the fracture indicates that
the valve’s weight (of around 5000 N) was poorly
supported (figure 6, right), likely playing a role in the
failure. This structural load would cause an increase in
local stresses of 15 – 18 % over those caused by the internal
water pressure. Although not appearing to be a large
increase in itself, this additional load could well become
critical and lead to failure in the long run.
2.3 Responsibility
Technically, the original design, with a required pressure
class PN 40, was a correct and sensible choice. Working
pressures in steady state conditions were themselves close to
25 bar, leading to a nominal pressure class of PN 25;
however, taking into account pressure oscillations due to
transients, a pressure class selection of PN 40 is logical.
Although this is a predominately gravity pipeline, the
existence of its one pumping station led to the preliminary
assumption that the pumps were in some way responsible
for the failure of the valves. Also, this pumping station was
not protected by an air chamber; this is a very common
protection strategy for protecting large systems. Thus, there
was an immediate decision to install air chamber protec-
tion. Although this did not make operating conditions
worse, in this case it did not improve them either. After the
exploration and many combinations of possible causative
factors, it was concluded that pressure oscillations caused
by pump start-up will not significantly exceed the operating
pressures for valves. Thus, an air chamber at the pump
station was not required in this case.
It was originally believed that all valves were for PN 40,
but someone at some point decided that these two valves,
with working pressures around 25 bar, could have been
satisfactory at PN 25. One had an imperfection in its
casting (commissioning error) and the other had inade-
Figure 5. Captured frame at the moment of lateral pump start-up.
88 M. V. Ivetic
quate support (construction error). However, it is not clear
why these flaws were not triggered during field pressure
tests on the system, nor exactly why they failed when they
did. The poor decision to change the pressure class of likely
valves, probably motivated by saving a small amount of
money, was revealed when two hidden flaws were activated
in a short time span. The first accident (the sudden failure
at the valve) itself would cause significant pressure
oscillations that could well have worsened conditions at
the second hidden flaw, and likely contributed to the
second valve failure. Failures are expensive and trouble-
some, but rarely simple; attributing blame is typically
difficult and problematic, but often instructive.
3. Desalination plant
A huge pipeline system, within a single desalination plant,
was designed to collect and convey water from four
production blocks (C2, C3, C4 and C5) to seven reservoirs
(PWT 1 to PWT 7). The system with 40 pumps operating at
the same time (figure 7) had experienced operational
problems. The ground profile is flat and the piping is
mainly GRP (glass reinforced plastic). During hydraulic
transients caused by a cut in power to specific groups of
pumps, damage to several sections occurred. Although the
damage itself was relatively small, there was considerable
surprise that it took place at all. A sequence of these
accidents caused lengthy shut-downs of the system, causing
great complications and concern in a water system of this
size and importance. Not surprisingly, it was concluded
that system operational reliability was unacceptably low
and had to be improved.
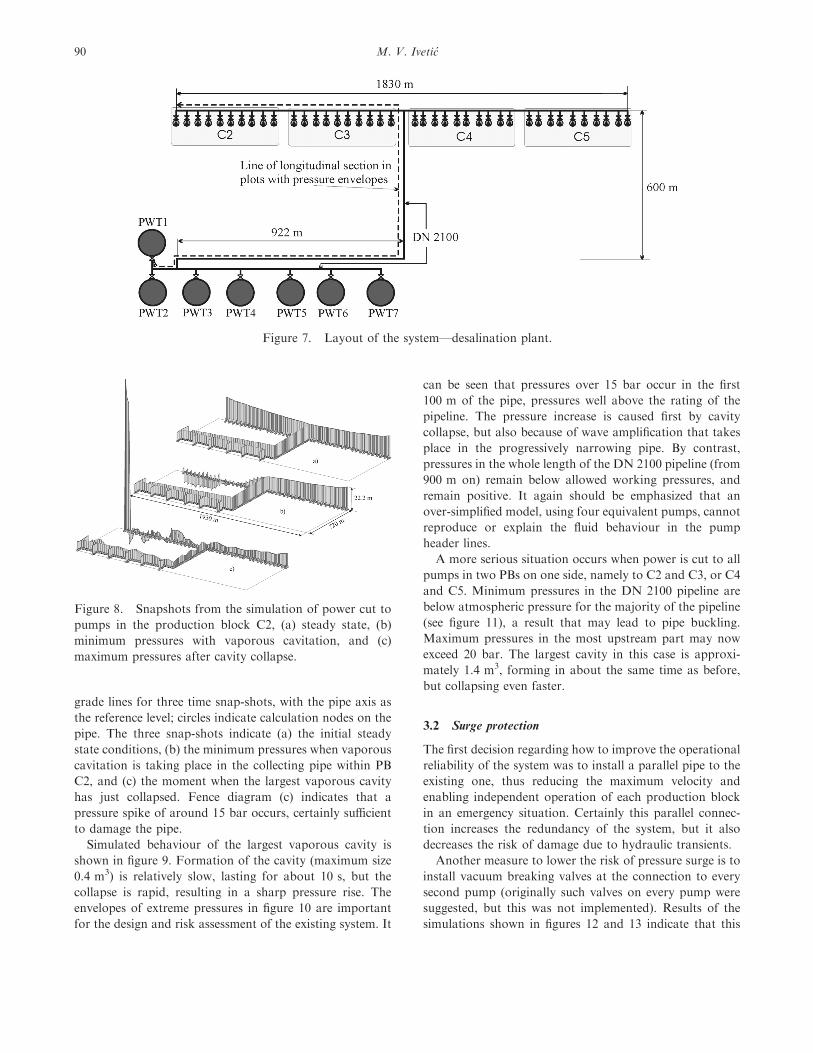
The design plant capacity is 40 pumps at 330 l/s (for a
total flow rate of about 12 m3/s). The 40 pumps are
arranged in four production blocks (PB): C2, C3, C4 and
C5, with 10 pumps in each. Pipe diameters of the header
pipeline start from 350 mm (DN 350), for the most
upstream part of the PB C2, and increase gradually until
DN 1500 is reached just before the junction with the header
pipelines from PB C4 and C5. On the right-hand side of the
plant, diameters are larger, beginning from DN 350 and
increasing to a maximum of DN 1800. The common header
line from all PBs is DN 2100 with a total length of 2420 m
(i.e. 600 + 920 + 900 m); the pipes leading to production
water tanks (PWT1 to PWT7) are DN 1100. The water
level in PWT varies over about a 10 m range. The notation
of the production blocks suggests that there were plans to
expand the system. A separate power supply has been
provided to each block, so a simultaneous failure of all the
pumps is highly unlikely.
Although velocities in the system are high (over 3 m/s in
the pipe DN 2100), it was believed that in systems with low
operating pressures there was no danger from pressure
transients. This statement was supported by a transient
analysis performed on a simplified model, one that used
four equivalent pumps to represent the original 40 pumps.
Design operating pressures were only between 2 and 3 bars,
and the pressure class of the selected pipe and equipment
was much greater, being PN 09 (or 9 bar). For these
reasons, no specific surge control devices were considered
necessary. Nonetheless, transient-induced damage did in
fact occur.
3.1 Simulation results
The objective of hydraulic analysis was to explain causes of
damage and to recommend measures for transient control.
Hydraulic analysis started with a simulation of a transient
event caused by power failure for the 10 pumps in the PB
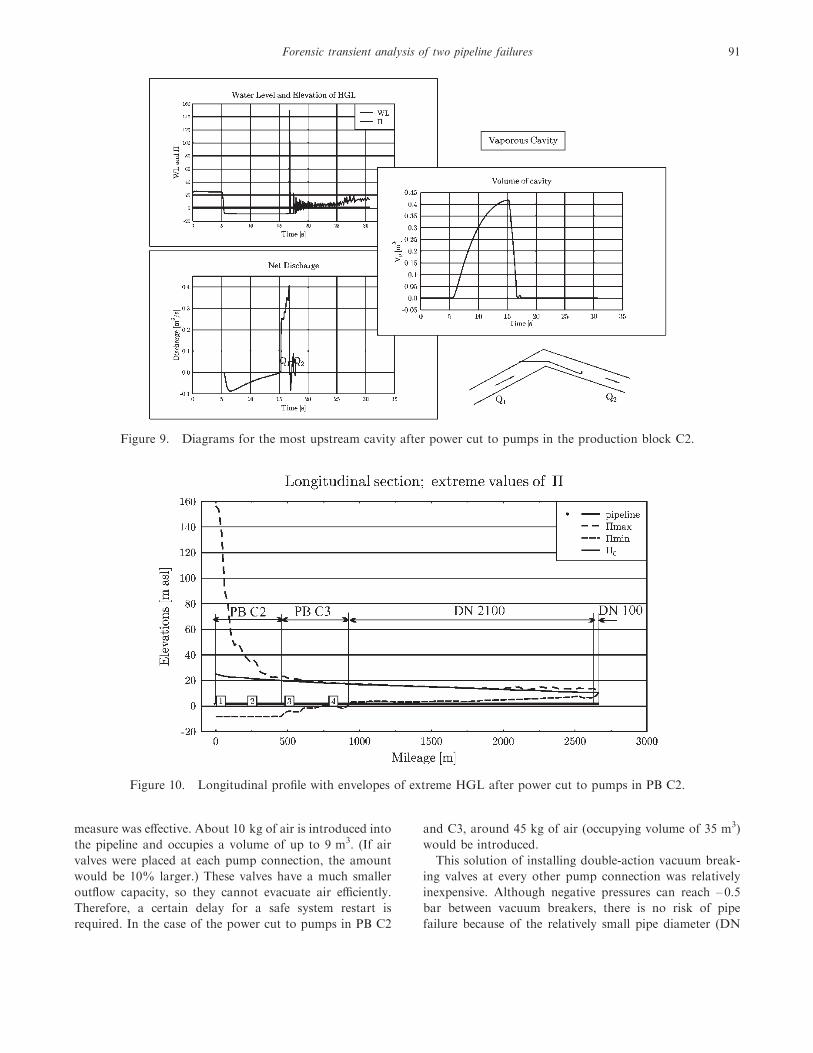
C2. Figure 8 depicts several characteristic snapshots,
obtained by numerical simulation. The vertical lines
indicated represent instantaneous elevations of hydraulic
Figure 6. Explanation of valve failures.
Forensic transient analysis of two pipeline failures 89
grade lines for three time snap-shots, with the pipe axis as
the reference level; circles indicate calculation nodes on the
pipe. The three snap-shots indicate (a) the initial steady
state conditions, (b) the minimum pressures when vaporous
cavitation is taking place in the collecting pipe within PB
C2, and (c) the moment when the largest vaporous cavity
has just collapsed. Fence diagram (c) indicates that a
pressure spike of around 15 bar occurs, certainly sufficient
to damage the pipe.
Simulated behaviour of the largest vaporous cavity is
shown in figure 9. Formation of the cavity (maximum size
0.4 m3) is relatively slow, lasting for about 10 s, but the
collapse is rapid, resulting in a sharp pressure rise. The
envelopes of extreme pressures in figure 10 are important
for the design and risk assessment of the existing system. It
can be seen that pressures over 15 bar occur in the first
100 m of the pipe, pressures well above the rating of the
pipeline. The pressure increase is caused first by cavity
collapse, but also because of wave amplification that takes
place in the progressively narrowing pipe. By contrast,
pressures in the whole length of the DN 2100 pipeline (from
900 m on) remain below allowed working pressures, and
remain positive. It again should be emphasized that an
over-simplified model, using four equivalent pumps, cannot
reproduce or explain the fluid behaviour in the pump
header lines.
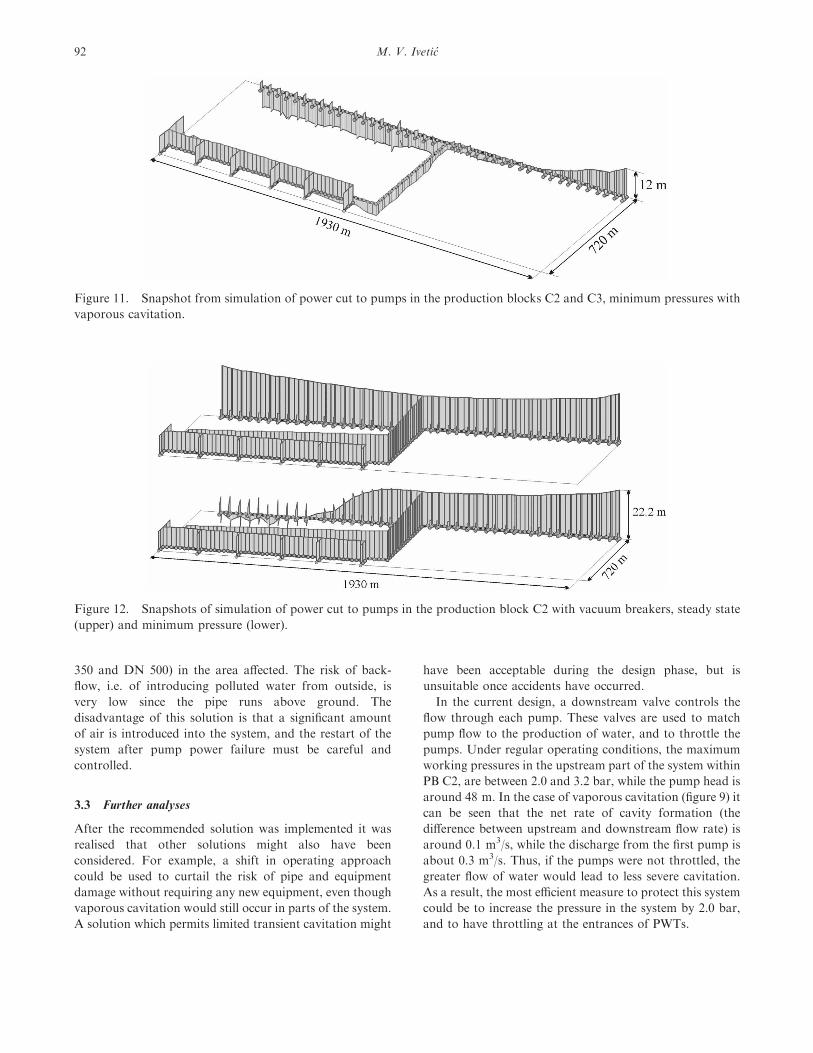
A more serious situation occurs when power is cut to all
pumps in two PBs on one side, namely to C2 and C3, or C4
and C5. Minimum pressures in the DN 2100 pipeline are
below atmospheric pressure for the majority of the pipeline
(see figure 11), a result that may lead to pipe buckling.
Maximum pressures in the most upstream part may now
exceed 20 bar. The largest cavity in this case is approxi-
mately 1.4 m3, forming in about the same time as before,
but collapsing even faster.
3.2 Surge protection
The first decision regarding how to improve the operational
reliability of the system was to install a parallel pipe to the
existing one, thus reducing the maximum velocity and
enabling independent operation of each production block
in an emergency situation. Certainly this parallel connec-
tion increases the redundancy of the system, but it also
decreases the risk of damage due to hydraulic transients.
Another measure to lower the risk of pressure surge is to
install vacuum breaking valves at the connection to every
second pump (originally such valves on every pump were
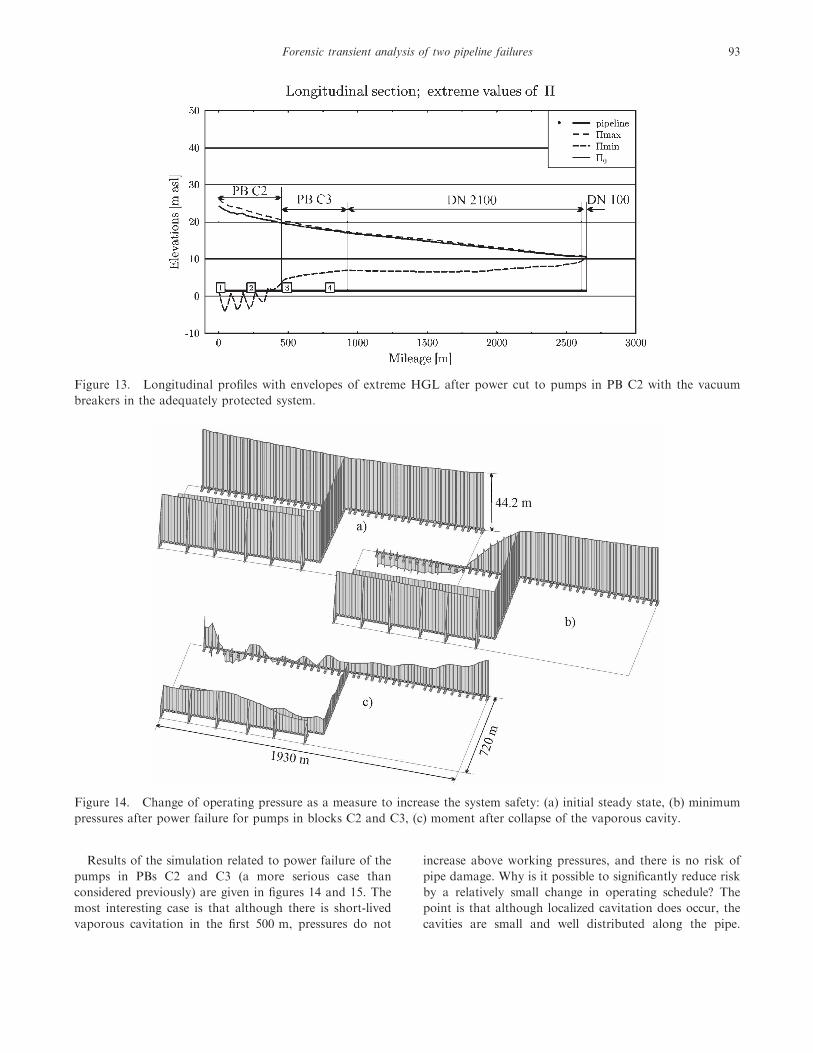
suggested, but this was not implemented). Results of the
simulations shown in figures 12 and 13 indicate that this
Figure 7. Layout of the system—desalination plant.
Figure 8. Snapshots from the simulation of power cut to
pumps in the production block C2, (a) steady state, (b)
minimum pressures with vaporous cavitation, and (c)
maximum pressures after cavity collapse.
90 M. V. Ivetic
measure was effective. About 10 kg of air is introduced into
the pipeline and occupies a volume of up to 9 m3. (If air
valves were placed at each pump connection, the amount
would be 10% larger.) These valves have a much smaller
outflow capacity, so they cannot evacuate air efficiently.
Therefore, a certain delay for a safe system restart is
required. In the case of the power cut to pumps in PB C2
and C3, around 45 kg of air (occupying volume of 35 m3)
would be introduced.
This solution of installing double-action vacuum break-
ing valves at every other pump connection was relatively
inexpensive. Although negative pressures can reach – 0.5
bar between vacuum breakers, there is no risk of pipe
failure because of the relatively small pipe diameter (DN
Figure 9. Diagrams for the most upstream cavity after power cut to pumps in the production block C2.
Figure 10. Longitudinal profile with envelopes of extreme HGL after power cut to pumps in PB C2.
Forensic transient analysis of two pipeline failures 91
350 and DN 500) in the area affected. The risk of back-
flow, i.e. of introducing polluted water from outside, is
very low since the pipe runs above ground. The
disadvantage of this solution is that a significant amount
of air is introduced into the system, and the restart of the
system after pump power failure must be careful and
controlled.
3.3 Further analyses
After the recommended solution was implemented it was
realised that other solutions might also have been
considered. For example, a shift in operating approach
could be used to curtail the risk of pipe and equipment
damage without requiring any new equipment, even though
vaporous cavitation would still occur in parts of the system.
A solution which permits limited transient cavitation might
have been acceptable during the design phase, but is
unsuitable once accidents have occurred.
In the current design, a downstream valve controls the
flow through each pump. These valves are used to match
pump flow to the production of water, and to throttle the
pumps. Under regular operating conditions, the maximum
working pressures in the upstream part of the system within
PB C2, are between 2.0 and 3.2 bar, while the pump head is
around 48 m. In the case of vaporous cavitation (figure 9) it
can be seen that the net rate of cavity formation (the
difference between upstream and downstream flow rate) is
around 0.1 m3/s, while the discharge from the first pump is
about 0.3 m3/s. Thus, if the pumps were not throttled, the
greater flow of water would lead to less severe cavitation.
As a result, the most efficient measure to protect this system
could be to increase the pressure in the system by 2.0 bar,
and to have throttling at the entrances of PWTs.
Figure 11. Snapshot from simulation of power cut to pumps in the production blocks C2 and C3, minimum pressures with
vaporous cavitation.
Figure 12. Snapshots of simulation of power cut to pumps in the production block C2 with vacuum breakers, steady state
(upper) and minimum pressure (lower).
92 M. V. Ivetic
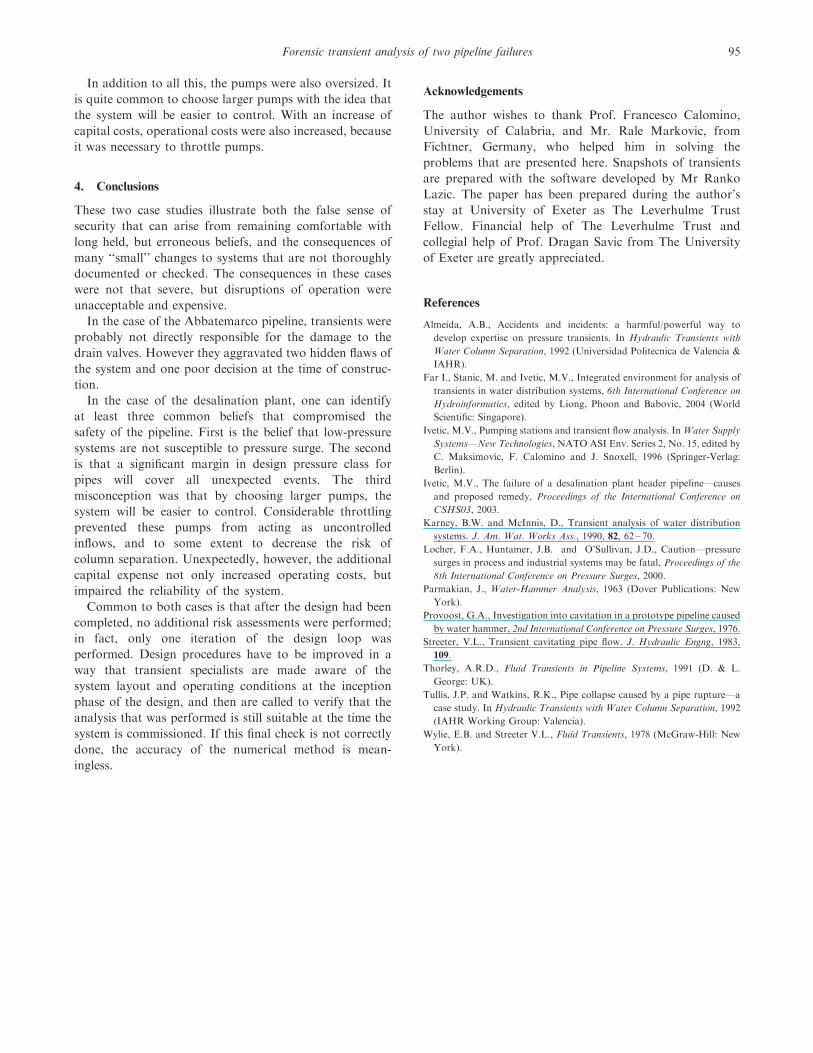
Results of the simulation related to power failure of the
pumps in PBs C2 and C3 (a more serious case than
considered previously) are given in figures 14 and 15. The
most interesting case is that although there is short-lived
vaporous cavitation in the first 500 m, pressures do not
increase above working pressures, and there is no risk of
pipe damage. Why is it possible to significantly reduce risk
by a relatively small change in operating schedule? The
point is that although localized cavitation does occur, the
cavities are small and well distributed along the pipe.
Figure 13. Longitudinal profiles with envelopes of extreme HGL after power cut to pumps in PB C2 with the vacuum
breakers in the adequately protected system.
Figure 14. Change of operating pressure as a measure to increase the system safety: (a) initial steady state, (b) minimum
pressures after power failure for pumps in blocks C2 and C3, (c) moment after collapse of the vaporous cavity.
Forensic transient analysis of two pipeline failures 93
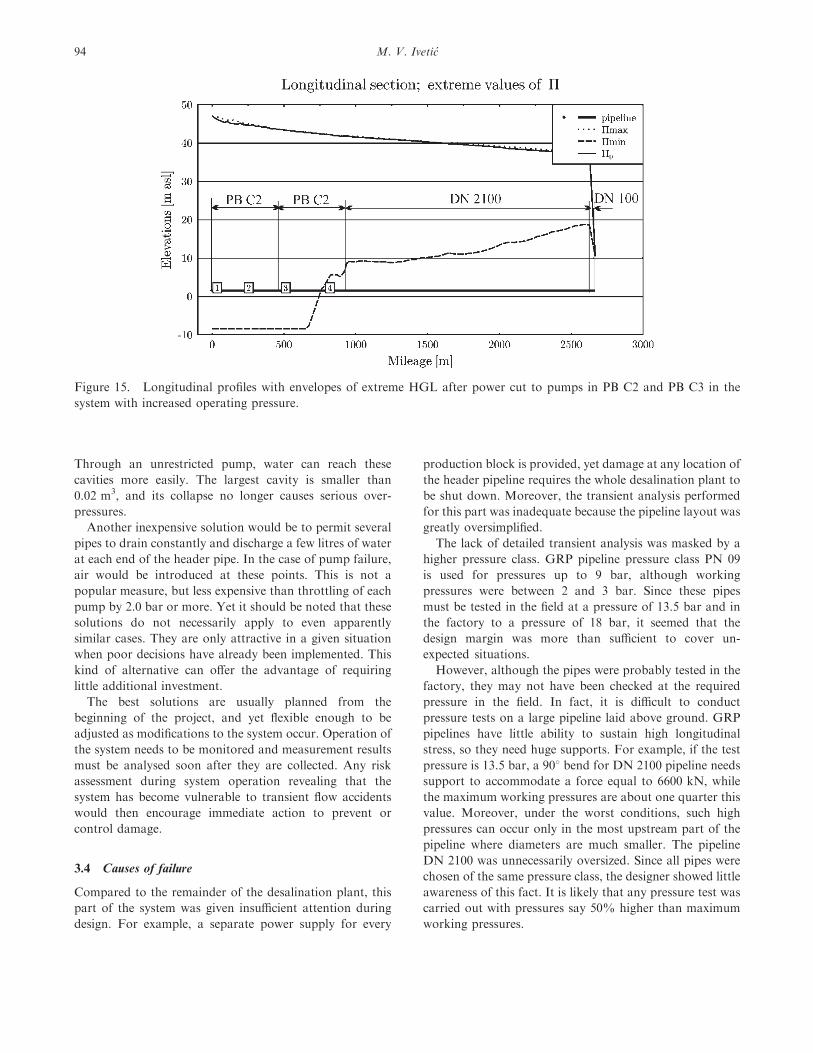
Through an unrestricted pump, water can reach these
cavities more easily. The largest cavity is smaller than
0.02 m3, and its collapse no longer causes serious over-
pressures.
Another inexpensive solution would be to permit several
pipes to drain constantly and discharge a few litres of water
at each end of the header pipe. In the case of pump failure,
air would be introduced at these points. This is not a
popular measure, but less expensive than throttling of each
pump by 2.0 bar or more. Yet it should be noted that these
solutions do not necessarily apply to even apparently
similar cases. They are only attractive in a given situation
when poor decisions have already been implemented. This
kind of alternative can offer the advantage of requiring
little additional investment.
The best solutions are usually planned from the
beginning of the project, and yet flexible enough to be
adjusted as modifications to the system occur. Operation of
the system needs to be monitored and measurement results
must be analysed soon after they are collected. Any risk
assessment during system operation revealing that the
system has become vulnerable to transient flow accidents
would then encourage immediate action to prevent or
control damage.
3.4 Causes of failure
Compared to the remainder of the desalination plant, this
part of the system was given insufficient attention during
design. For example, a separate power supply for every
production block is provided, yet damage at any location of
the header pipeline requires the whole desalination plant to
be shut down. Moreover, the transient analysis performed
for this part was inadequate because the pipeline layout was
greatly oversimplified.
The lack of detailed transient analysis was masked by a
higher pressure class. GRP pipeline pressure class PN 09
is used for pressures up to 9 bar, although working
pressures were between 2 and 3 bar. Since these pipes
must be tested in the field at a pressure of 13.5 bar and in
the factory to a pressure of 18 bar, it seemed that the
design margin was more than sufficient to cover un-
expected situations.
However, although the pipes were probably tested in the
factory, they may not have been checked at the required
pressure in the field. In fact, it is difficult to conduct
pressure tests on a large pipeline laid above ground. GRP
pipelines have little ability to sustain high longitudinal
stress, so they need huge supports. For example, if the test
pressure is 13.5 bar, a 908 bend for DN 2100 pipeline needs
support to accommodate a force equal to 6600 kN, while
the maximum working pressures are about one quarter this
value. Moreover, under the worst conditions, such high
pressures can occur only in the most upstream part of the
pipeline where diameters are much smaller. The pipeline
DN 2100 was unnecessarily oversized. Since all pipes were
chosen of the same pressure class, the designer showed little
awareness of this fact. It is likely that any pressure test was
carried out with pressures say 50% higher than maximum
working pressures.
Figure 15. Longitudinal profiles with envelopes of extreme HGL after power cut to pumps in PB C2 and PB C3 in the
system with increased operating pressure.
94 M. V. Ivetic
In addition to all this, the pumps were also oversized. It
is quite common to choose larger pumps with the idea that
the system will be easier to control. With an increase of
capital costs, operational costs were also increased, because
it was necessary to throttle pumps.
4. Conclusions
These two case studies illustrate both the false sense of
security that can arise from remaining comfortable with
long held, but erroneous beliefs, and the consequences of
many ‘‘small’’ changes to systems that are not thoroughly
documented or checked. The consequences in these cases
were not that severe, but disruptions of operation were
unacceptable and expensive.
In the case of the Abbatemarco pipeline, transients were
probably not directly responsible for the damage to the
drain valves. However they aggravated two hidden flaws of
the system and one poor decision at the time of construc-
tion.
In the case of the desalination plant, one can identify
at least three common beliefs that compromised the
safety of the pipeline. First is the belief that low-pressure
systems are not susceptible to pressure surge. The second
is that a significant margin in design pressure class for
pipes will cover all unexpected events. The third
misconception was that by choosing larger pumps, the
system will be easier to control. Considerable throttling
prevented these pumps from acting as uncontrolled
inflows, and to some extent to decrease the risk of
column separation. Unexpectedly, however, the additional
capital expense not only increased operating costs, but
impaired the reliability of the system.
Common to both cases is that after the design had been
completed, no additional risk assessments were performed;
in fact, only one iteration of the design loop was
performed. Design procedures have to be improved in a
way that transient specialists are made aware of the
system layout and operating conditions at the inception
phase of the design, and then are called to verify that the
analysis that was performed is still suitable at the time the
system is commissioned. If this final check is not correctly
done, the accuracy of the numerical method is mean-
ingless.
Acknowledgements
The author wishes to thank Prof. Francesco Calomino,
University of Calabria, and Mr. Rale Markovic, from
Fichtner, Germany, who helped him in solving the
problems that are presented here. Snapshots of transients
are prepared with the software developed by Mr Ranko
Lazic. The paper has been prepared during the author’s
stay at University of Exeter as The Leverhulme Trust
Fellow. Financial help of The Leverhulme Trust and
collegial help of Prof. Dragan Savic from The University
of Exeter are greatly appreciated.
References
Almeida, A.B., Accidents and incidents: a harmful/powerful way to
develop expertise on pressure transients. In Hydraulic Transients with
Water Column Separation, 1992 (Universidad Politecnica de Valencia &
IAHR).
Far I., Stanic, M. and Ivetic, M.V., Integrated environment for analysis of
transients in water distribution systems, 6th International Conference on
Hydroinformatics, edited by Liong, Phoon and Babovic, 2004 (World
Scientific: Singapore).
Ivetic, M.V., Pumping stations and transient flow analysis. InWater Supply
Systems—New Technologies, NATO ASI Env. Series 2, No. 15, edited by
C. Maksimovic, F. Calomino and J. Snoxell, 1996 (Springer-Verlag:
Berlin).
Ivetic, M.V., The failure of a desalination plant header pipeline—causes
and proposed remedy, Proceedings of the International Conference on
CSHS03, 2003.
Karney, B.W. and McInnis, D., Transient analysis of water distribution
systems. J. Am. Wat. Works Ass., 1990, 82, 62 – 70.
Locher, F.A., Huntamer, J.B. and O’Sullivan, J.D., Caution—pressure
surges in process and industrial systems may be fatal, Proceedings of the
8th International Conference on Pressure Surges, 2000.
Parmakian, J., Water-Hammer Analysis, 1963 (Dover Publications: New
York).
Provoost, G.A., Investigation into cavitation in a prototype pipeline caused
by water hammer, 2nd International Conference on Pressure Surges, 1976.
Streeter, V.L., Transient cavitating pipe flow. J. Hydraulic Engng, 1983,
109.
Thorley, A.R.D., Fluid Transients in Pipeline Systems, 1991 (D. & L.
George: UK).
Tullis, J.P. and Watkins, R.K., Pipe collapse caused by a pipe rupture—a
case study. In Hydraulic Transients with Water Column Separation, 1992
(IAHR Working Group: Valencia).
Wylie, E.B. and Streeter V.L., Fluid Transients, 1978 (McGraw-Hill: New
York).
Forensic transient analysis of two pipeline failures 95
Related Documents