Research paper EMPOP-quality mtDNA control region sequences from Kashmiri of Azad Jammu & Kashmir, Pakistan Allah Rakha a,b, *, Min-Sheng Peng c , Rui Bi a , Jiao-Jiao Song c , Zeenat Salahudin b , Atif Adan b , Muhammad Israr d , Yong-Gang Yao a a Key Laboratory of Animal Models and Human Disease Mechanisms of the Chinese Academy of Sciences & Yunnan Province, Kunming Institute of Zoology, Kunming, Yunnan 650223, China b Department of Forensic Sciences, University of Health Sciences, Lahore, Pakistan c State Key Laboratory of Genetic Resources and Evolution, Kunming Institute of Zoology, Chinese Academy of Sciences, Kunming 650223, China d Department of Forensic Studies, University of Swat, Swat, Pakistan A R T I C L E I N F O Article history: Received 20 May 2016 Received in revised form 24 August 2016 Accepted 26 August 2016 Available online 28 August 2016 Keywords: Pakistan Kashmiri mtDNA Control region Forensic database A B S T R A C T The mitochondrial DNA (mtDNA) control region (nucleotide position 16024-576) sequences were generated through Sanger sequencing method for 317 self-identified Kashmiris from all districts of Azad Jammu & Kashmir Pakistan. The population sample set showed a total of 251 haplotypes, with a relatively high haplotype diversity (0.9977) and a low random match probability (0.54%). The containing matrilineal lineages belonging to three different phylogeographic origins of Western Eurasian (48.9%), South Asian (47.0%) and East Asian (4.1%). The present study was compared to previous data from Pakistan and other worldwide populations (Central Asia, Western Asia, and East & Southeast Asia). The dataset is made available through EMPOP under accession number EMP00679 and will serve as an mtDNA reference database in forensic casework in Pakistan. ã 2016 Elsevier Ireland Ltd. All rights reserved. 1. Introduction Mitochondrial DNA analysis has become a very useful tool for human evolutionary studies and especially forensic casework in several circumstances when standard nuclear markers cannot be applied [1,2]. Forensic casework involving mtDNA depends on relevant but authentic databases for estimating the probability of random match. The EMPOP, at present, provides the best quality data representation from all over the world based on logical and phylogenetic measures admissible for forensic purposes [3]. Large-scale investigations of archaeological sites in Central Asia, Northern Pakistan and India revealed a typographical affinity between their cultures going as far back as major pre- and proto- historic periods. The legend relates to an early periodic movement of tribal people from Central Asia to the Kashmir Valley during the cold season when the valley was comparatively warm, which were later replaced by the influx of Aryans from the Punjab. There is historical evidence to the settlement of immigrants from Persia, Greece, Turkistan and Tibet, China. With the advent of Islam there was an influx of a large number of Sufis and Sayyids in the 14th century [4]. Colonies of Mughals, Pathans, Punjabis, and Paharis settled within comparatively recent times throughout the Jammu and Kashmir. Kashmiris through out the Jammu and Kashmir (India) and Azad Jammu and Kashmir (Pakistan) speak the Kashmiri language. By origin it is a Dravidian Burushaski language, but it has become predominately Indo-Aryan in character. Reflecting the history of area, the Kashmiri vocabulary is mixed, containing Dardic, Sanskrit, Punjabi, and Persian elements [5]. Recent waves of immigrants to Azad Jammu and Kashmir have also introduced Punjabi and Pashto to the main languages [6]. The available mtDNA sequence data from Pakistan is scarce, fragmentary and limited to a few samples from main ethnic groups [7–9]. However, limited number of sample size inhibits the accurate characterization of any population for forensic and genetic purposes. Moreover, there is no representation of Kashmiris from Azad Jammu and Kashmir in any of reference population databases. The present study is intended to character- ize the diversity of the matrilineal lineages of current inhabitants of Azad Jammu and Kashmir by analyzing the entire mitochondrial DNA control region. With this analysis, we seek to contribute new mtDNA haplotype data, taking into account that the development * Corresponding author at: Key Laboratory of Animal Models and Human Disease Mechanisms of the Chinese Academy of Sciences & Yunnan Province, Kunming Institute of Zoology, Kunming, Yunnan 650223, China. E-mail addresses: [email protected], [email protected] (A. Rakha). http://dx.doi.org/10.1016/j.fsigen.2016.08.009 1872-4973/ã 2016 Elsevier Ireland Ltd. All rights reserved. Forensic Science International: Genetics 25 (2016) 125–131 Contents lists available at ScienceDirect Forensic Science International: Genetics journa l homepage: www.e lsevier.com/locate/fsig

Welcome message from author
This document is posted to help you gain knowledge. Please leave a comment to let me know what you think about it! Share it to your friends and learn new things together.
Transcript

Forensic Science International: Genetics 25 (2016) 125–131
Research paper
EMPOP-quality mtDNA control region sequences from Kashmiri ofAzad Jammu & Kashmir, Pakistan
Allah Rakhaa,b,*, Min-Sheng Pengc, Rui Bia, Jiao-Jiao Songc, Zeenat Salahudinb,Atif Adanb, Muhammad Isrard, Yong-Gang Yaoa
aKey Laboratory of Animal Models and Human Disease Mechanisms of the Chinese Academy of Sciences & Yunnan Province, Kunming Institute of Zoology,Kunming, Yunnan 650223, ChinabDepartment of Forensic Sciences, University of Health Sciences, Lahore, Pakistanc State Key Laboratory of Genetic Resources and Evolution, Kunming Institute of Zoology, Chinese Academy of Sciences, Kunming 650223, ChinadDepartment of Forensic Studies, University of Swat, Swat, Pakistan
A R T I C L E I N F O
Article history:Received 20 May 2016Received in revised form 24 August 2016Accepted 26 August 2016Available online 28 August 2016
Keywords:PakistanKashmirimtDNAControl regionForensic database
A B S T R A C T
The mitochondrial DNA (mtDNA) control region (nucleotide position 16024-576) sequences weregenerated through Sanger sequencing method for 317 self-identified Kashmiris from all districts of AzadJammu & Kashmir Pakistan. The population sample set showed a total of 251 haplotypes, with a relativelyhigh haplotype diversity (0.9977) and a low random match probability (0.54%). The containingmatrilineal lineages belonging to three different phylogeographic origins of Western Eurasian (48.9%),South Asian (47.0%) and East Asian (4.1%). The present study was compared to previous data fromPakistan and other worldwide populations (Central Asia, Western Asia, and East & Southeast Asia). Thedataset is made available through EMPOP under accession number EMP00679 and will serve as anmtDNA reference database in forensic casework in Pakistan.
ã 2016 Elsevier Ireland Ltd. All rights reserved.
Contents lists available at ScienceDirect
Forensic Science International: Genetics
journa l homepage: www.e lsev ier .com/ locate / fs ig
1. Introduction
Mitochondrial DNA analysis has become a very useful tool forhuman evolutionary studies and especially forensic casework inseveral circumstances when standard nuclear markers cannot beapplied [1,2]. Forensic casework involving mtDNA depends onrelevant but authentic databases for estimating the probability ofrandom match. The EMPOP, at present, provides the best qualitydata representation from all over the world based on logical andphylogenetic measures admissible for forensic purposes [3].
Large-scale investigations of archaeological sites in CentralAsia, Northern Pakistan and India revealed a typographical affinitybetween their cultures going as far back as major pre- and proto-historic periods. The legend relates to an early periodic movementof tribal people from Central Asia to the Kashmir Valley during thecold season when the valley was comparatively warm, which werelater replaced by the influx of Aryans from the Punjab. There ishistorical evidence to the settlement of immigrants from Persia,
* Corresponding author at: Key Laboratory of Animal Models and Human DiseaseMechanisms of the Chinese Academy of Sciences & Yunnan Province, KunmingInstitute of Zoology, Kunming, Yunnan 650223, China.
E-mail addresses: [email protected], [email protected] (A. Rakha).
http://dx.doi.org/10.1016/j.fsigen.2016.08.0091872-4973/ã 2016 Elsevier Ireland Ltd. All rights reserved.
Greece, Turkistan and Tibet, China. With the advent of Islam therewas an influx of a large number of Sufis and Sayyids in the 14thcentury [4]. Colonies of Mughals, Pathans, Punjabis, and Paharissettled within comparatively recent times throughout the Jammuand Kashmir. Kashmiris through out the Jammu and Kashmir(India) and Azad Jammu and Kashmir (Pakistan) speak theKashmiri language. By origin it is a Dravidian Burushaski language,but it has become predominately Indo-Aryan in character.Reflecting the history of area, the Kashmiri vocabulary is mixed,containing Dardic, Sanskrit, Punjabi, and Persian elements [5].Recent waves of immigrants to Azad Jammu and Kashmir have alsointroduced Punjabi and Pashto to the main languages [6].
The available mtDNA sequence data from Pakistan is scarce,fragmentary and limited to a few samples from main ethnic groups[7–9]. However, limited number of sample size inhibits theaccurate characterization of any population for forensic andgenetic purposes. Moreover, there is no representation ofKashmiris from Azad Jammu and Kashmir in any of referencepopulation databases. The present study is intended to character-ize the diversity of the matrilineal lineages of current inhabitantsof Azad Jammu and Kashmir by analyzing the entire mitochondrialDNA control region. With this analysis, we seek to contribute newmtDNA haplotype data, taking into account that the development

126 A. Rakha et al. / Forensic Science International: Genetics 25 (2016) 125–131
and improvement of databases constitute a major goal forconsolidating the use of mtDNA for forensic purposes. We furtheranalyzed the haplogroup distribution in Kashmiris from AzadJammu and Kashmir (Pakistan) to corroborate, from the perspec-tive of female genetic lineages, the ancestry composition of thishighly mixed population.
The present work constitutes of 317 entire mtDNA controlregion sequences from randomly selected Kashmiris sampled ateight districts of Jammu & Kashmir, Pakistan. The generatedmtDNA population data is deposited to the EMPOP database underthe accession number EMP00679 for the worldwide use, andparticularly as a reference database for mtDNA applications inforensic and missing person casework in Pakistan.
2. Materials and methods
2.1. Samples
Blood samples were collected from 317 unrelated Kashmirimales and females residing in different parts of Azad Jammu &Kashmir, Pakistan (Fig. 1).
Only individuals with self-reported Kashmiri origin of at leasttwo generations back on the maternal side were included. Writteninformed consent was obtained from all the volunteer donors. Inorder to have full representation, samples were collected fromdifferent towns and cities of Azad Jammu & Kashmir. Personalinformation was treated anonymously. In addition, samplecollection was conducted in accordance with the InstitutionalReview Board of University of Health Sciences, Lahore.
2.2. DNA extraction, amplification and sequencing
Genomic DNA extraction was carried out with the Axygen1
AxyPrepTM Blood Genomic DNA Miniprep Kit following themanufacturer’s protocol (Axygen Biosciences; CA, USA). The entirecontrol region from nt16024 to nt576 was amplified by usingprimers (Table S4 in Supplementary material) as reported earlier[10]. PCR reactions were performed in 30 mL of reaction mixturecontaining 3 mL 10 � LA PCR Buffer II (Mg2+ Plus), 1.5 units ofTaKaRa LA Taq (TaKaRa Bio Inc., Dalian, China), 400 mM of each
Fig. 1. Geographic location of Azad Jammu & Kashmir and inset m
dNTP, 0.2 mM of each primer, and 10 ng DNA. The amplification wasrun on the GeneAmp PCR System 9700 (Applied Biosystems, FosterCity, CA, USA) under following conditions: one denaturation cycleof 94 �C for 5 min; 30 amplification cycles of 94 �C for 30 s, 60 �C for30 s and 72 �C for 2 min; and one full extension cycle of 72 �C for10 min. The PCR products were purified with Exonuclease I(TaKaRa) and Shrimp Alkaline Phosphatase (TaKaRa) in 10XExonuclease I Buffer (TaKaRa) following reaction compositionsrecommended by manufacturer, incubating at 37 �C for 45 min,followed by enzyme deactivation at 95 �C for 15 min. Sequencingby capillary electrophoresis using the BigDyeTM Terminator v3.0Ready Reaction Cycle Sequencing Kit was performed on AppliedBiosystems 3730xl DNA Analyzer (Thermo Fisher Scientific)according to manufacturer’s manual.
2.3. Haplogroup assignment
Forward and reverse sequences were aligned and comparedusing SeqManNGen1 version 12.0 (DNASTAR. Madison, WI) withthe revised Cambridge Reference Sequences (rCRS) [11]. Quality ofsequences was examined manually, and two analysts indepen-dently annotated deviations from the reference sequence. Therecommended nomenclature for mtDNA typing was used foralignment of variants [12]. The haplogroup assignments werecarried out using Mitotool (www.mitotool.org) [13], Haplogrep(www.haplogrep.uibk.ac.at) [14], and EMMA (www.empop.on-line) [15] based on PhyloTree builds 16 and 17 [16] with referring tothe additional guidelines [1]. Haplogroup assignments were re-evaluated by manual inference and conservative MRCA status wasassigned to each sequence to improve the predictions. All 317mtDNA haplotypes were confirmed and validated by the EMPOPcurators, being now available from EMPOP browser with theaccession number (EMP00679) [3]. The sequences are alsoavailable on GenBank via accession numbers KX084069–KX084385.
2.4. Data analysis
For all calculations, insertions at nt16193, nt309, nt315, andnt573 were ignored unless otherwise mentioned. The number and
ap depicting the birthplaces of samples used for this study.
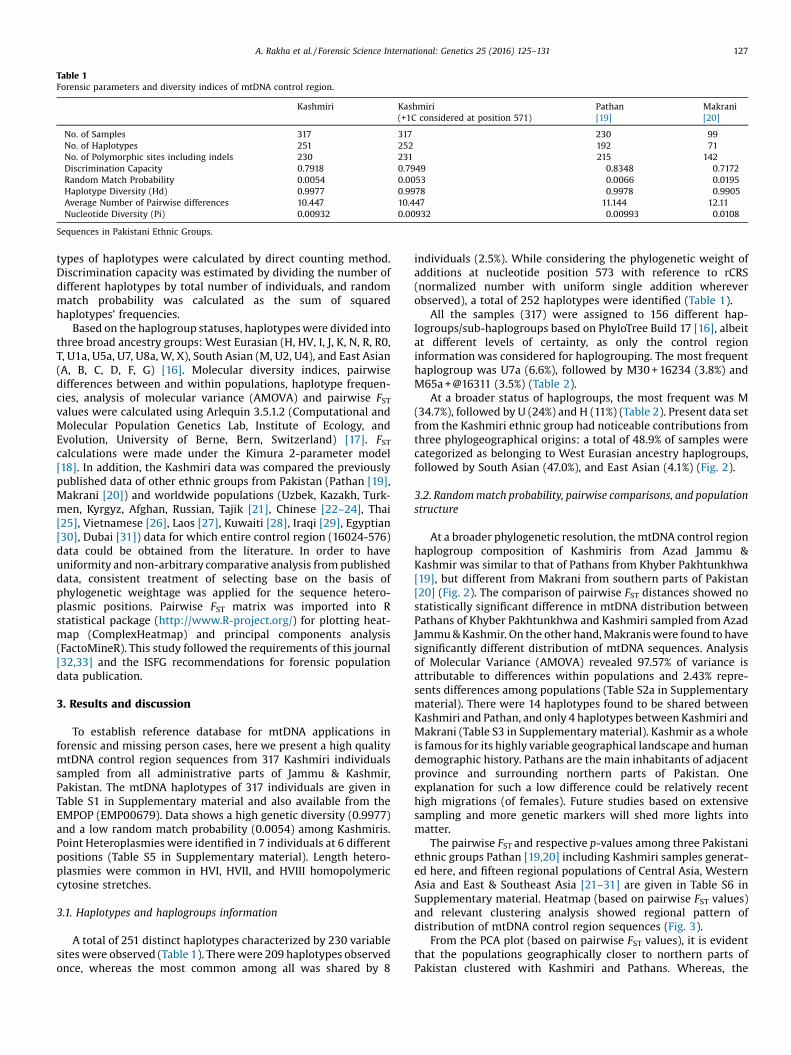
Table 1Forensic parameters and diversity indices of mtDNA control region.
Kashmiri Kashmiri(+1C considered at position 571)
Pathan[19]
Makrani[20]
No. of Samples 317 317 230 99No. of Haplotypes 251 252 192 71No. of Polymorphic sites including indels 230 231 215 142Discrimination Capacity 0.7918 0.7949 0.8348 0.7172Random Match Probability 0.0054 0.0053 0.0066 0.0195Haplotype Diversity (Hd) 0.9977 0.9978 0.9978 0.9905Average Number of Pairwise differences 10.447 10.447 11.144 12.11Nucleotide Diversity (Pi) 0.00932 0.00932 0.00993 0.0108
Sequences in Pakistani Ethnic Groups.
A. Rakha et al. / Forensic Science International: Genetics 25 (2016) 125–131 127
types of haplotypes were calculated by direct counting method.Discrimination capacity was estimated by dividing the number ofdifferent haplotypes by total number of individuals, and randommatch probability was calculated as the sum of squaredhaplotypes’ frequencies.
Based on the haplogroup statuses, haplotypes were divided intothree broad ancestry groups: West Eurasian (H, HV, I, J, K, N, R, R0,T, U1a, U5a, U7, U8a, W, X), South Asian (M, U2, U4), and East Asian(A, B, C, D, F, G) [16]. Molecular diversity indices, pairwisedifferences between and within populations, haplotype frequen-cies, analysis of molecular variance (AMOVA) and pairwise FSTvalues were calculated using Arlequin 3.5.1.2 (Computational andMolecular Population Genetics Lab, Institute of Ecology, andEvolution, University of Berne, Bern, Switzerland) [17]. FSTcalculations were made under the Kimura 2-parameter model[18]. In addition, the Kashmiri data was compared the previouslypublished data of other ethnic groups from Pakistan (Pathan [19],Makrani [20]) and worldwide populations (Uzbek, Kazakh, Turk-men, Kyrgyz, Afghan, Russian, Tajik [21], Chinese [22–24], Thai[25], Vietnamese [26], Laos [27], Kuwaiti [28], Iraqi [29], Egyptian[30], Dubai [31]) data for which entire control region (16024-576)data could be obtained from the literature. In order to haveuniformity and non-arbitrary comparative analysis from publisheddata, consistent treatment of selecting base on the basis ofphylogenetic weightage was applied for the sequence hetero-plasmic positions. Pairwise FST matrix was imported into Rstatistical package (http://www.R-project.org/) for plotting heat-map (ComplexHeatmap) and principal components analysis(FactoMineR). This study followed the requirements of this journal[32,33] and the ISFG recommendations for forensic populationdata publication.
3. Results and discussion
To establish reference database for mtDNA applications inforensic and missing person cases, here we present a high qualitymtDNA control region sequences from 317 Kashmiri individualssampled from all administrative parts of Jammu & Kashmir,Pakistan. The mtDNA haplotypes of 317 individuals are given inTable S1 in Supplementary material and also available from theEMPOP (EMP00679). Data shows a high genetic diversity (0.9977)and a low random match probability (0.0054) among Kashmiris.Point Heteroplasmies were identified in 7 individuals at 6 differentpositions (Table S5 in Supplementary material). Length hetero-plasmies were common in HVI, HVII, and HVIII homopolymericcytosine stretches.
3.1. Haplotypes and haplogroups information
A total of 251 distinct haplotypes characterized by 230 variablesites were observed (Table 1). There were 209 haplotypes observedonce, whereas the most common among all was shared by 8
individuals (2.5%). While considering the phylogenetic weight ofadditions at nucleotide position 573 with reference to rCRS(normalized number with uniform single addition whereverobserved), a total of 252 haplotypes were identified (Table 1).
All the samples (317) were assigned to 156 different hap-logroups/sub-haplogroups based on PhyloTree Build 17 [16], albeitat different levels of certainty, as only the control regioninformation was considered for haplogrouping. The most frequenthaplogroup was U7a (6.6%), followed by M30 + 16234 (3.8%) andM65a + @16311 (3.5%) (Table 2).
At a broader status of haplogroups, the most frequent was M(34.7%), followed by U (24%) and H (11%) (Table 2). Present data setfrom the Kashmiri ethnic group had noticeable contributions fromthree phylogeographical origins: a total of 48.9% of samples werecategorized as belonging to West Eurasian ancestry haplogroups,followed by South Asian (47.0%), and East Asian (4.1%) (Fig. 2).
3.2. Random match probability, pairwise comparisons, and populationstructure
At a broader phylogenetic resolution, the mtDNA control regionhaplogroup composition of Kashmiris from Azad Jammu &Kashmir was similar to that of Pathans from Khyber Pakhtunkhwa[19], but different from Makrani from southern parts of Pakistan[20] (Fig. 2). The comparison of pairwise FST distances showed nostatistically significant difference in mtDNA distribution betweenPathans of Khyber Pakhtunkhwa and Kashmiri sampled from AzadJammu & Kashmir. On the other hand, Makranis were found to havesignificantly different distribution of mtDNA sequences. Analysisof Molecular Variance (AMOVA) revealed 97.57% of variance isattributable to differences within populations and 2.43% repre-sents differences among populations (Table S2a in Supplementarymaterial). There were 14 haplotypes found to be shared betweenKashmiri and Pathan, and only 4 haplotypes between Kashmiri andMakrani (Table S3 in Supplementary material). Kashmir as a wholeis famous for its highly variable geographical landscape and humandemographic history. Pathans are the main inhabitants of adjacentprovince and surrounding northern parts of Pakistan. Oneexplanation for such a low difference could be relatively recenthigh migrations (of females). Future studies based on extensivesampling and more genetic markers will shed more lights intomatter.
The pairwise FST and respective p-values among three Pakistaniethnic groups Pathan [19,20] including Kashmiri samples generat-ed here, and fifteen regional populations of Central Asia, WesternAsia and East & Southeast Asia [21–31] are given in Table S6 inSupplementary material. Heatmap (based on pairwise FST values)and relevant clustering analysis showed regional pattern ofdistribution of mtDNA control region sequences (Fig. 3).
From the PCA plot (based on pairwise FST values), it is evidentthat the populations geographically closer to northern parts ofPakistan clustered with Kashmiri and Pathans. Whereas, the

Table 2Haplogroup frequencies of 317 Kashmiris from AJ & K, Pakistan.
Broad Haplogroup Number Percent Haplogroup Number Percentage
A 2 0.6 A17 1 0.3A19 1 0.3
B 1 0.3 B4c1a1c 1 0.3C 4 1.3 C4a2c 1 0.3
C4a3b 3 0.9D 2 0.6 D4b2b 1 0.3
D6a1 1 0.3F 3 0.9 F1c1a 1 0.3
F1d 2 0.6G 1 0.3 G3a102 1 0.3H 34 10.7 H* 13 4.1
H1 2 0.6H14a 1 0.3H15 1 0.3H15a1b 1 0.3H17a1 2 0.6H17c 2 0.6H1ap1 1 0.3H1e3 1 0.3H1f + 16093 1 0.3H3v 1 0.3H41a 1 0.3H5 1 0.3H6 1 0.3H66a 1 0.3H6b 3 0.9H7a2 1 0.3
HV 6 1.9 HV14 3 0.9HV2 1 0.3HV6 2 0.6
I 3 0.9 I1 1 0.3I1f 1 0.3I6a 1 0.3
J 11 3.5 J1b1a1 1 0.3J1b1b 8 2.5J1d 2 0.6
K 1 0.3 K2a5 1 0.3M 110 34.7 M* 1 0.3
M18c 1 0.3M22a 2 0.6M2a1a 3 0.9M3 5 1.6M30 3 0.9M30 + 16234 12 3.8M30b 6 1.9M30c 1 0.3M30c1 6 1.9M30d 2 0.6M30e 1 0.3M30g 1 0.3M31a2 2 0.6M33a2a 1 0.3M35b + 16304 1 0.3M37e 2 0.6M37e2 1 0.3M3a 1 0.3M3a1 + 204 6 1.9M3c + 152 1 0.3M3c1b 1 0.3M3c2 3 0.9M3d 1 0.3M4 10 3.2M49d 1 0.3M4b 2 0.6M5 4 1.3M5a1 1 0.3M5a1a 2 0.6M5a2a 2 0.6M5a2a1a 2 0.6M5b2 1 0.3M5d 1 0.3M6 2 0.6M65 1 0.3M65a 1 0.3M65a + @16311 11 3.5M65b 4 1.3
128 A. Rakha et al. / Forensic Science International: Genetics 25 (2016) 125–131

Table 2 (Continued)
Broad Haplogroup Number Percent Haplogroup Number Percentage
M6a1b 1 0.3N 6 1.9 N1a1a1a 2 0.6
N1a1a1a1a 1 0.3N1a1b 1 0.3N1a2 2 0.6
R 19 6 R 4 1.3R30a1b 1 0.3R30b1 7 2.2R30b2 3 0.9R6 3 0.9R6b 1 0.3
R0 7 2.2 R0 5 1.6R0a + 60.1T 2 0.6
T 14 4.4 T1a 1 0.3T1a103 1 0.3T2 5 1.6T2b 1 0.3T2b34 1 0.3T2c1 3 0.9T2e 1 0.3T2e2 1 0.3
U 77 24.3 U1a 2 0.6U1a1a1 1 0.3U2 1 0.3U2 + 152 2 0.6U2a 3 0.9U2a1a 1 0.3U2b 5 1.6U2b1 1 0.3U2b2 5 1.6U2c'd 7 2.2U2e1 2 0.6U2e1h 1 0.3U2e2 1 0.3U4 1 0.3U4a2c1 1 0.3U4b1a1a1 2 0.6U5a1 1 0.3U5a1b + 16362 1 0.3U7 10 3.2U7a 21 6.6U7a3 1 0.3U7a3 1 0.3U7a3b 4 1.3U7a4 1 0.3U8b1a1 1 0.3
W 14 4.4 W 1 0.3W + 194 4 1.3W3a1 + 199 1 0.3W4 1 0.3W5a 1 0.3W5a1a 1 0.3W6 4 1.3W6b1 1 0.3
X 2 0.6 X2 1 0.3X2d 1 0.3
Fig. 2. Percentage composition of phylogeographical lineages in Pakistani populations.
A. Rakha et al. / Forensic Science International: Genetics 25 (2016) 125–131 129

Fig. 3. Heatmap matrix of pairwise FST values for 20 populations including Kashmiri.
130 A. Rakha et al. / Forensic Science International: Genetics 25 (2016) 125–131
Makranis being in south of Pakistan are found to be clustered withother West Asian populations (Fig. S1 in Supplementary material).
The Kashmiri dataset was compared to other 15 populations bycomputing AMOVA (Table S2b in Supplementary material). Themajority of observed variance (96.38%) was attributable todifferences within populations, and only 3.62% representeddifferences among populations.
4. Conclusion
The primary goal of this study was to develop forensic qualitymtDNA control region reference database from Kashmiris broadlysampled from the entire region of Azad Jammu & Kashmir,Pakistan. Following the best practices for mtDNA populationdatabases, 317 complete mtDNA control region haplotypes aremade available to all users through the EMPOP (EMP00679).Additionally, phylogeographical findings based on haplogroupcomposition confirmed a high genetic heterogeneity of theKashmiri population as a supposed consequence of the impactof different waves of migrations to this region. This mtDNAheterogeneity at the ethnicity and provincial levels demandsextended and more reliable databases to improve forensic andgenetic analyses in the Pakistani populations. Our study providesreasonably good start towards the expansion of Pakistani mtDNAreference database rendering more accurate estimates of randommatch probability in routine forensic mtDNA analysis.
Conflicts of interest
The authors declare no conflict of interest.
Acknowledgements
We would like to thank all volunteers for providing theirsamples used in this study, Salah-ud-din, Ghulam Yasin, AyadAkhtar, Javaid Akhtar Chaudhry for their valuable support for thesampling, Li-Li Kong, Lu-Xiu Yang, Yu Li, Saadia Noreen, Fatima Gullfor technical assistance, Hansi Weissensteiner (HAPLOGREP,
Medical University Innsbruck, Austria) and EMPOP (University ofInnsbruck, Austria) for haplogroup assignments. This project wassupported by the President's International Fellowship Initiative(PIFI) Program of the Chinese Academy of Sciences and theNational Natural Science Foundation of China (30925021). M.-S.P.thanks the Youth Innovation Promotion Association, ChineseAcademy of Sciences, for its support.
Appendix A. Supplementary data
Supplementary data associated with this article can befound, in the online version, at http://dx.doi.org/10.1016/j.fsigen.2016.08.009.
References
[1] H.-J. Bandelt, M. van Oven, A. Salas, Haplogrouping mitochondrial DNAsequences in legal medicine/forensic genetics, Int. J. Legal Med. 126 (2012)901–916, doi:http://dx.doi.org/10.1007/s00414-012-0762-y.
[2] T. Kivisild, Maternal ancestry and population history from wholemitochondrial genomes, Investig. Genet. 6 (2015) 3, doi:http://dx.doi.org/10.1186/s13323-015-0022-2.
[3] W. Parson, A. Dür, EMPOP—a forensic mtDNA database, Forensic Sci. Int. Genet.1 (2007) 88–92, doi:http://dx.doi.org/10.1016/j.fsigen.2007.01.018.
[4] P.N.K. Bamzai, Culture and Political History of Kashmir, M.D. Publications Pvt.Ltd., 1994.
[5] P.I. Ahmad, A Hand Book on Azad Jammu & Kashmir, (2003).[6] Languages: Kashmiri-Language, http://www.britannica.com/topic/Kashmiri-
language (accessed 07.05.16).[7] R. Cordaux, N. Saha, G.R. Bentley, R. Aunger, S.M. Sirajuddin, M. Stoneking,
Mitochondrial DNA analysis reveals diverse histories of tribal populationsfrom India, Eur. J. Hum. Genet. 11 (2003) 253–264, doi:http://dx.doi.org/10.1038/sj.ejhg.5200949.
[8] L. Quintana-Murci, R. Chaix, R.S. Wells, D.M. Behar, H. Sayar, R. Scozzari, et al.,Where west meets east: the complex mtDNA landscape of the southwest andCentral Asian corridor, Am. J. Hum. Genet. 74 (2004) 827–845, doi:http://dx.doi.org/10.1086/383236.
[9] M. Metspalu, T. Kivisild, E. Metspalu, J. Parik, G. Hudjashov, K. Kaldma, et al.,Most of the extant mtDNA boundaries in south and southwest Asia were likelyshaped during the initial settlement of Eurasia by anatomically modernhumans, BMC Genet. 5 (2004) 26, doi:http://dx.doi.org/10.1186/1471-2156-5-26.
[10] H.-W. Wang, X. Jia, Y. Ji, Q.-P. Kong, Q. Zhang, Y.-G. Yao, et al., Strikingly differentpenetrance of LHON in two Chinese families with primary mutation G11778Ais independent of mtDNA haplogroup background and secondary mutation

A. Rakha et al. / Forensic Science International: Genetics 25 (2016) 125–131 131
G13708A, Mutat. Res. 643 (2008) 48–53, doi:http://dx.doi.org/10.1016/j.mrfmmm.2008.06.004.
[11] R.M. Andrews, I. Kubacka, P.F. Chinnery, R.N. Lightowlers, D.M. Turnbull, N.Howell, Reanalysis and revision of the Cambridge reference sequence forhuman mitochondrial DNA, Nat. Genet. 23 (1999) 147, doi:http://dx.doi.org/10.1038/13779.
[12] W. Parson, L. Gusmão, D.R. Hares, J.A. Irwin, W.R. Mayr, N. Morling, et al., DNACommission of the International Society for Forensic Genetics: revised andextended guidelines for mitochondrial DNA typing, Forensic Sci. Int. Genet. 13(2014) 134–142, doi:http://dx.doi.org/10.1016/j.fsigen.2014.07.010.
[13] L. Fan, Y.-G. Yao, MitoTool: a web server for the analysis and retrieval of humanmitochondrial DNA sequence variations, Mitochondrion 11 (2011) 351–356,doi:http://dx.doi.org/10.1016/j.mito.2010.09.013.
[14] H. Weissensteiner, D. Pacher, A. Kloss-Brandstätter, L. Forer, G. Specht, H.-J.Bandelt, et al., HaploGrep 2: mitochondrial haplogroup classification in the eraof high-throughput sequencing, Nucleic Acids Res. (2016) gkw233, doi:http://dx.doi.org/10.1093/nar/gkw233.
[15] A.W. Röck, A. Dür, M. van Oven, W. Parson, Concept for estimatingmitochondrial DNA haplogroups using a maximum likelihood approach(EMMA), Forensic Sci. Int. Genet. 7 (2013) 601–609, doi:http://dx.doi.org/10.1016/j.fsigen.2013.07.005.
[16] M. van Oven, M. Kayser, Updated comprehensive phylogenetic tree of globalhuman mitochondrial DNA variation, Hum. Mutat. 30 (2009) E386–94, doi:http://dx.doi.org/10.1002/humu.20921.
[17] L. Excoffier, H.E.L. Lischer, Arlequin suite ver 3.5: a new series of programs toperform population genetics analyses under Linux and Windows, Mol. Ecol.Resour. 10 (2010) 564–567, doi:http://dx.doi.org/10.1111/j.1755-0998.2010.02847.x.
[18] M. Kimura, A simple method for estimating evolutionary rates of basesubstitutions through comparative studies of nucleotide sequences, J. Mol.Evol. 16 (1980) 111–120.
[19] A. Rakha, K.-J. Shin, J.A. Yoon, N.Y. Kim, M.H. Siddique, I.S. Yang, et al., Forensicand genetic characterization of mtDNA from Pathans of Pakistan, Int. J. LegalMed. 125 (2011) 841–848, doi:http://dx.doi.org/10.1007/s00414-010-0540-7.
[20] M.H. Siddiqi, T. Akhtar, A. Rakha, G. Abbas, A. Ali, N. Haider, et al., Geneticcharacterization of the Makrani people of Pakistan from mitochondrial DNAcontrol-region data, Leg. Med. (Tokyo) 17 (2015) 134–139, doi:http://dx.doi.org/10.1016/j.legalmed.2014.09.007.
[21] J.A. Irwin, A. Ikramov, J. Saunier, M. Bodner, S. Amory, A. Röck, et al., The mtDNAcomposition of Uzbekistan: a microcosm of Central Asian patterns, Int. J. LegalMed. 124 (2010) 195–204, doi:http://dx.doi.org/10.1007/s00414-009-0406-z.
[22] D. Wang, L.-Y. Su, A.-M. Zhang, Y.-Y. Li, X.-A. Li, L.-L. Chen, et al., MitochondrialDNA copy number, but not haplogroup, confers a genetic susceptibility to
leprosy in Han Chinese from Southwest China, PLoS One 7 (2012) e38848, doi:http://dx.doi.org/10.1371/journal.pone.0038848.
[23] W. Zhang, J. Tang, A.-M. Zhang, M.-S. Peng, H.-B. Xie, L. Tan, et al., A matrilinealgenetic legacy from the last glacial maximum confers susceptibility toschizophrenia in Han Chinese, J. Genet. Genomics 41 (2014) 397–407, doi:http://dx.doi.org/10.1016/j.jgg.2014.05.004.
[24] J.A. Irwin, J.L. Saunier, P. Beh, K.M. Strouss, C.D. Paintner, T.J. Parsons,Mitochondrial DNA control region variation in a population sample from HongKong, China, Forensic Sci. Int. Genet. 3 (2009) e119–25, doi:http://dx.doi.org/10.1016/j.fsigen.2008.10.008.
[25] B. Zimmermann, M. Bodner, S. Amory, L. Fendt, A. Röck, D. Horst, et al., Forensicand phylogeographic characterization of mtDNA lineages from northernThailand (Chiang Mai), Int. J. Legal Med. 123 (2009) 495–501, doi:http://dx.doi.org/10.1007/s00414-009-0373-4.
[26] J.A. Irwin, J.L. Saunier, K.M. Strouss, T.M. Diegoli, K.A. Sturk, J.E. O’Callaghan,et al., Mitochondrial control region sequences from a Vietnamese populationsample, Int. J. Legal Med. 122 (2008) 257–259, doi:http://dx.doi.org/10.1007/s00414-007-0205-3.
[27] M. Bodner, B. Zimmermann, A. Röck, A. Kloss-Brandstätter, D. Horst, B. Horst,et al., Southeast Asian diversity: first insights into the complex mtDNAstructure of Laos, BMC Evol. Biol. 11 (2011) 49, doi:http://dx.doi.org/10.1186/1471-2148-11-49.
[28] M. Scheible, M. Alenizi, K. Sturk-Andreaggi, M.D. Coble, S. Ismael, J.A. Irwin,Mitochondrial DNA control region variation in a Kuwaiti population sample,Forensic Sci. Int. Genet. 5 (2011) e112–3, doi:http://dx.doi.org/10.1016/j.fsigen.2011.04.001.
[29] N. Al-Zahery, J. Saunier, K. Ellingson, W. Parson, T.J. Parsons, J.A. Irwin,Characterization of mitochondrial DNA control region lineages in Iraq, Int. J.Legal Med. 127 (2013) 373–375, doi:http://dx.doi.org/10.1007/s00414-012-0757-8.
[30] J.L. Saunier, J.A. Irwin, K.M. Strouss, H. Ragab, K.A. Sturk, T.J. Parsons,Mitochondrial control region sequences from an Egyptian population sample,Forensic Sci. Int. Genet. 3 (2009) e97–103, doi:http://dx.doi.org/10.1016/j.fsigen.2008.09.004.
[31] F. Alshamali, A. Brandstätter, B. Zimmermann, W. Parson, Mitochondrial DNAcontrol region variation in dubai, United Arab Emirates, Forensic Sci. Int. Genet.2 (2008) e9–10, doi:http://dx.doi.org/10.1016/j.fsigen.2007.08.005.
[32] Á. Carracedo, J.M. Butler, L. Gusmão, A. Linacre, W. Parson, L. Roewer, et al., Newguidelines for the publication of genetic population data, Forensic Sci. Int.Genet. 7 (2013) 217–220, doi:http://dx.doi.org/10.1016/j.fsigen.2013.01.001.
[33] Á. Carracedo, J.M. Butler, L. Gusmão, A. Linacre, W. Parson, L. Roewer, et al.,Update of the guidelines for the publication of genetic population data,Forensic Sci. Int. Genet. 10 (2014) A1–A2, doi:http://dx.doi.org/10.1016/j.fsigen.2014.01.004.

Table S1. Mitochondrial DNA control region (16024-576) haplotypes and estimated haplogroups for Kashmiri ethnic group from Azad Jammu & Kashmir, Pakistan
Sample ID MRCA Polymorphisms (delimited with tabs)
KPR_001 I1 16129A 16223T 16311C 16362C 16391A 16519C 73G 199C 204C 207A 250C 263G 309.1C 315.1C 455.1T 573.1C 573.2C 573.3C
KPR_002 U7a 16309G 16318C 16519C 73G 151T 152C 263G 309.1C 315.1C 523d 524d
KPR_003 X2d 16189C 16193.1C 16223T 16278T 16519C 73G 195C 263G 315.1C
KPR_004 U5a1 16192T 16256T 16270T 16399G 16519C 73G 263G 309.1C 315.1C 524.1A 524.2C
KPR_005 H66a 16172C 16519C 263G 315.1C
KPR_006 N1a1a1a 16147A 16172C 16223T 16248T 16320T 16355T 16519C 73G 152C 199C 204C 263G 309.1C 309.2C 315.1C 573.1C 573.2C
KPR_007 R6 16093C 16129A 16261T 16362C 73G 189G 195C 263G 309.1C 315.1C
KPR_008 C4a2c 16223T 16298C 16327T 16357C 16519C 47A 73G 249d 263G 309.1C 315.1C 489C
KPR_009 M65a+@16311 16223T 16289G 16519C 73G 152C 263G 315.1C 489C 511T
KPR_010 U2a 16051G 16206C 16519C 44.1C 73G 152C 194T 263G 315.1C
KPR_011 W6 16189C 16192T 16223T 16260T 16292T 16325C 16355T 16519C 73G 143A 189G 194T 195C 204C 207A 263G 309.1C 315.1C
KPR_012 N1a1a1a 16147A 16172C 16223T 16248T 16320T 16355T 16519C 73G 152C 199C 204C 263G 309.1C 315.1C 573.1C
KPR_013 H* 16309G 16519C 152C 263G 309.1C 309.2C 315.1C 523d 524d
KPR_014 W6b1 16189C 16223T 16292T 16325C 16355T 16519C 73G 143A 189G 194T 195C 204C 207A 263G 309.1C 315.1C
KPR_015 T1a1'3 16093C 16126C 16163G 16186T 16189C 16294T 16519C 73G 152C 195C 263G 309.1C 315.1C
KPR_016 R0a+60.1T 16126C 16362C 16519C 60.1T 64T 263G 309.1C 315.1C
KPR_017 U2b2 16051G 16086C 16259A 16267T 16291T 16326G 16352C 16353T 73G 146C 234G 263G 315.1C 524.1A 524.2C
KPR_018 U2e1h 16051G 16129C 16145A 16183C 16193.1C 16362C 16519C 73G 217C 228A 263G 309.1C 309.2C 315.1C 340T 508G
KPR_019 H5 16304C 263G 309.1C 315.1C 456T 523d 524d
KPR_020 W6 16192T 16223T 16266T 16292T 16325C 16519C 73G 189G 194T 195C 204C 207A 263G 309.1C 315.1C
KPR_021 M3c2 16126C 16145A 16154C 16223T 16224C 16519C 73G 195C 263G 309.1C 315.1C 482C 489C 523d 524d
KPR_022 M30b 16223T 16278T 16465T 16519C 73G 152C 195A 263G 315.1C 489C 573.1C
KPR_023 U2c'd 16051G 16093C 16234T 73G 146C 152C 263G 315.1C 524.1A 524.2C
KPR_024 W6 16189C 16192T 16193.1C 16193.2C 16223T 16292T 16325C 16355T 16519C 73G 143A 189G 194T 195C 204C 207A 263G 309.1C 315.1C
KPR_025 U2b 16051G 16239T 73G 146C 234G 263G 315.1C 575T
KPR_026 R0 16519C 263G 315.1C
KPR_027 J1d 16069T 16126C 16193T 16519C 73G 152C 263G 295T 309.1C 315.1C 462T 489C 524.1A 524.2C
KPR_028 M65a+@16311 16223T 16289G 16519C 73G 263G 309.1C 315.1C 489C 511T
KPR_029 U2b 16051G 16239T 73G 146C 234G 263G 315.1C 575T
KPR_030 T2b34 16126C 16209C 16294T 16304C 16519C 41T 73G 263G 309.1C 315.1C 319C
KPR_031 H* 16092C 263G 315.1C 475G
KPR_032 U7a 16309G 16318C 16519C 73G 151T 152C 263G 309.1C 315.1C 523d 524d
KPR_033 T2b 16126C 16294T 16296T 16304C 16519C 73G 263G 309.1C 309.2C 315.1C
KPR_034 M30+16234 16223T 16234T 16519C 73G 195A 263G 309.1C 315.1C 489C 523d 524d
KPR_035 X2 16189C 16223T 16278T 16519C 73G 153G 195C 263G 315.1C
KPR_036 U7a 16166d 16309G 16318T 16519C 73G 151T 152C 263G 315.1C 523d 524d
KPR_037 M65b 16223T 16311C 16519C 73G 146C 241G 263G 309.1C 315.1C 489C 511T
KPR_038 M* 16051G 16319A 16519C 73G 152C 263G 309.1C 315.1C 489C
KPR_039 M30c1 16166d 16223T 16519C 73G 146C 195A 263G 315.1C 489C 523d 524d
KPR_040 J1b1b 16069T 16126C 16145A 16189C 16193.1C 16261T 16519C 73G 263G 271T 295T 315.1C 462T 489C 523d 524d
KPR_041 U2b2 16051G 16209C 16239T 16320T 16352C 16353T 73G 146C 152C 234G 263G 315.1C 384G 499A
KPR_042 U7 16309G 16318T 16519C 73G 152C 263G 315.1C 523d 524d
KPR_043 M30c1 16166d 16223T 16519C 73G 146C 195A 263G 315.1C 489C
KPR_044 HV2 16093C 16217C 16359C 73G 152C 195C 263G 315.1C 523d 524d
KPR_045 U7a3b 16093C 16126C 16207G 16292T 16309G 16318T 16519C 73G 151T 152C 263G 315.1C 523d 524d
KPR_046 M65b 16223T 16311C 16519C 73G 241G 263G 309.1C 309.2C 315.1C 489C 511T
KPR_047 U2b 16051G 16086C 16227G 16259A 16267T 16291T 16326G 16353T 73G 146C 234G 263G 315.1C 524.1A 524.2C 524.3A 524.4C 524.5A 524.6C
KPR_048 HV14 16519C 152C 263G 309.1C 315.1C 480C
KPR_049 HV14 16519C 152C 263G 309.1C 315.1C 480C
KPR_050 U2e1 16051G 16129C 16183C 16189C 16193.1C 16362C 16519C 73G 152C 217C 263G 309.1C 309.2C 315.1C 340T 508G 524.1A 524.2C
KPR_051 R0 16519C 263G 315.1C
KPR_052 W+194 16223T 16240G 16292T 16519C 73G 189G 194T 195C 204C 207A 263G 309.1C 315.1C
KPR_053 M65b 16172C 16223T 16311C 16519C 73G 241G 251A 263G 309.1C 315.1C 489C 511T
KPR_054 N1a1a1a1a 16147A 16172C 16189C 16223T 16248T 16320T 16355T 16519C 73G 152C 199C 204C 263G 315.1C 573.1C
KPR_055 M30e 16223T 16234T 16519C 73G 152C 195A 263G 315.1C 489C 523d 524d
KPR_056 G3a1'2 16129A 16223T 16274A 16311C 16362C 73G 143A 263G 315.1C 489C
KPR_057 M65a+@16311 16223T 16289G 16519C 73G 263G 309.1C 315.1C 489C 511T
KPR_058 U2b1 16051G 16172C 73G 263G 309.1C 315.1C
KPR_059 M4b 16086C 16145A 16223T 16261T 16311C 16519C 73G 263G 315.1C 471C 489C
KPR_060 M5a2a1a 16129A 16223T 16264T 16265C 16519C 73G 263G 309.1C 309.2C 315.1C 489C
KPR_061 R30b2 16234T 16292T 16497G 16519C 73G 150T 263G 309.1C 315.1C 373G
KPR_062 M30+16234 16223T 16234T 16519C 73G 195A 263G 309.1C 315.1C 489C 523d 524d
KPR_063 R30a1b 16126C 16181G 16209C 16260T 16362C 16519C 73G 152C 263G 315.1C
KPR_064 M49d 16223T 16234T 16243C 16244A 16290T 16519C 73G 186T 249d 263G 315.1C 489C
KPR_065 R30b1 16183C 16189C 16222T 16298C 16299G 73G 152C 263G 299d 309.1C 309.2C 315.1C 373G 480C
KPR_066 R30b1 16169T 16183C 16189C 16193.1C 16243C 16298C 16299G 73G 129C 152C 189G 263G 299d 309.1C 309.2C 315.1C 373G 480C
Sample ID
�1

KPR_067 U1a 16182C 16183C 16189C 16249C 16362C 73G 263G 285T 309.1C 309.2C 315.1C
KPR_068 H1ap1 16129A 16189C 16311C 16519C 152C 263G 309.1C 309.2C 315.1C
KPR_069 M4 16086C 16145A 16189C 16223T 16261T 16311C 16519C 73G 152C 263G 315.1C 489C
KPR_070 H6b 16300G 16362C 16482G 239C 263G 309.1C 315.1C
KPR_071 U2c'd 16051G 16129A 16179T 16234T 16247G 73G 152C 263G 309.1C 315.1C 480C
KPR_072 H* 16519C 146C 263G 315.1C 460.1T
KPR_073 M35b+16304 16223T 16304C 16362C 16519C 73G 199C 263G 309.1C 315.1C 489C
KPR_074 R 16519C 73G 263G 309.1C 315.1C
KPR_075 M5 16129A 16223T 16271C 16519C 73G 263G 309.1C 315.1C 489C
KPR_076 U7a3 16136C 16207G 16309G 16318T 16519C 73G 151T 152C 263G 309.1C 315.1C 523d 524d
KPR_077 M3c1b 16179T 16183C 16189C 16193.1C 16223T 16294T 16519C 73G 152C 263G 309.1C 309.2C 315.1C 482C 489C 523d 524d
KPR_078 M4 16086C 16145A 16148T 16223T 16261T 16311C 16519C 16527T 73G 263G 315.1C 489C
KPR_079 M65a+@16311 16223T 16289G 16519C 73G 263G 315.1C 489C 511T
KPR_080 H1f+16093 16093C 16183C 16189C 16519C 182T 263G 309.1C 309.2C 315.1C
KPR_081 M30+16234 16172C 16223T 16234T 16519C 73G 195A 263G 309.1C 315.1C 489C 523d 524d
KPR_082 U2e2 16051G 16092C 16129C 16153A 16182C 16183C 16189C 16261T 16362C 16519C 73G 151T 152C 217C 263G 309d 315.1C 508G
KPR_083 U7a 16309G 16318C 16519C 73G 151T 152C 263G 315.1C 523d 524d
KPR_084 T2c1 16126C 16286T 16292T 16294T 16296T 16519C 73G 152C 263G 315.1C
KPR_085 U7a 16309G 16318C 16519C 73G 151T 152C 263G 309.1C 315.1C 523d 524d
KPR_086 M30c1 16166d 16223T 16519C 73G 146C 195A 204C 263G 315.1C 489C 523d 524d
KPR_087 U2a 16051G 16129A 16206C 16291T 16311C 44.1C 73G 146C 263G 309.1C 315.1C
KPR_088 U7 16092C 16183C 16189C 16309G 16318C 16519C 73G 151T 152C 263G 315.1C 523d 524d 573.1C
KPR_089 H15a1b 16124C 16184T 44.1C 55C 57C 146C 263G 309.1C 309.2C 315.1C
KPR_090 J1b1b 16069T 16126C 16145A 16189C 16261T 16519C 73G 263G 271T 295T 315.1C 462T 489C 523d 524d
KPR_091 U7 16297C 16309G 16318T 16519C 73G 152C 263G 309.1C 315.1C 523d 524d
KPR_092 W3a1+199 16169T 16223T 16292T 16311C 16519C 73G 189G 194T 195C 199C 204C 207A 263G 309.1C 315.1C
KPR_093 H* 16311C 16362C 152C 263G 315.1C
KPR_094 F1c1a 16111T 16129A 16304C 16519C 73G 234G 249d 263G 315.1C 523d 524d
KPR_095 U7a 16085T 16309G 16318C 16519C 73G 151T 152C 263G 315.1C 523d 524d
KPR_096 H17a1 16129A 16291T 193G 198T 263G 309.1C 315.1C
KPR_097 M5b2 16048A 16129A 16223T 16519C 73G 263G 309.1C 309.2C 315.1C 356.1C 489C 523d 524d
KPR_098 U2+152 16051G 16093C 16206T 16362C 44.1C 73G 152C 263G 309.1C 315.1C
KPR_099 U7a 16274A 16309G 16318T 16343G 16390A 16519C 73G 151T 152C 263G 315.1C 523d 524d
KPR_100 R30b1 16172C 16182C 16183C 16189C 16234T 16261T 16298C 16299G 73G 152C 257G 263G 299d 315.1C 373G 480C
KPR_101 C4a3b 16223T 16298C 16311C 16327T 16357C 16519C 73G 249d 263G 310C 489C
KPR_102 N1a1b 16223T 16311C 16391A 16519C 73G 143A 199C 204C 250C 263G 309.1C 309.2C 315.1C 573.1C 573.2C 573.3C
KPR_103 U2b2 16051G 16209C 16239T 16352C 16353T 73G 146C 152C 234G 263G 315.1C
KPR_104 T2e2 16126C 16153A 16294T 16296T 16519C 73G 150T 204C 263G 309.1C 315.1C 523d 524d
KPR_105 M5 16129A 16212G 16223T 16519C 73G 263G 309.1C 315.1C 489C
KPR_106 U2b2 16051G 16209C 16239T 16352C 16353T 73G 146C 152C 234G 263G 309.1C 315.1C
KPR_107 M2a1a 16223T 16270T 16319A 16352C 73G 195C 204C 263G 309.1C 315.1C 447G 489C 523d 524d
KPR_108 H17c 16051G 16129A 16239T 73G 146C 234G 263G 315.1C
KPR_109 M30 16189C 16190T 16193.1C 16223T 16260T 16293G 16519C 73G 195A 263G 315.1C 489C 523d 524d
KPR_110 M3a1+204 16126C 16223T 16519C 73G 204C 214G 263G 315.1C 482C 489C
KPR_111 U7 16309G 16318C 16519C 73G 152C 263G 315.1C 523d 524d 525T
KPR_112 I1f 16129A 16223T 16293C 16311C 16391A 16519C 73G 199C 204C 250C 263G 309.1C 309.2C 315.1C 455.1T 524.1A 524.2C 573.1C 573.2C 573.3C
KPR_113 W+194 16223T 16240G 16292T 16519C 73G 189G 194T 195C 204C 207A 263G 309.1C 315.1C
KPR_114 M30c1 16166d 16223T 16519C 73G 146C 195A 263G 315.1C 489C 523d 524d
KPR_115 H* 16311C 93G 152C 263G 309.1C 315.1C
KPR_116 W6 16192T 16223T 16266T 16292T 16325C 16519C 73G 189G 194T 195C 204C 207A 263G 309.1C 315.1C
KPR_117 W+194 16223T 16292T 16519C 73G 189G 194T 195C 204C 207A 263G 309.1C 315.1C
KPR_118 I6a 16129A 16223T 16254G 16293C 16296.1C 16311C 16391A 16519C 73G 199C 204C 250C 263G 315.1C 573.1C
KPR_119 A17 16223T 16234T 16235G 16290T 16311C 16319A 16362C 16519C 73G 152C 234G 235G 256T 263G 309.1C 315.1C 523d 524d
KPR_120 M4 16145A 16176T 16223T 16261T 16291T 16311C 16519C 73G 152C 263G 315.1C 489C
KPR_121 M4 16145A 16176T 16223T 16261T 16311C 16519C 73G 263G 309.1C 315.1C 489C
KPR_122 M2a1a 16129A 16169T 16178C 16223T 16270T 16319A 16352C 16519C 73G 143A 195C 204C 263G 309.1C 309.2C 315.1C 447G 489C
KPR_123 R 16519C 73G 263G 309.1C 315.1C 523d 524d
KPR_124 M18c 16201T 16223T 16311C 16318T 16519C 73G 246C 263G 315.1C 335G 489C
KPR_125 M30+16234 16223T 16234T 16311C 16519C 73G 195A 263G 315.1C 489C 523d 524d 573.1C
KPR_126 M30+16234 16223T 16234T 16256T 16519C 73G 195A 263G 309.1C 315.1C 489C 523d 524d
KPR_127 R30b2 16234T 16292T 16497G 16519C 73G 150T 263G 309.1C 315.1C 373G
KPR_128 C4a3b 16188T 16223T 16298C 16311C 16327T 16357C 16519C 73G 249d 263G 309.1C 310C 489C 524.1A 524.2C
KPR_129 U7a 16093C 16148T 16309G 16318T 16519C 73G 151T 152C 263G 315.1C 523d 524d
KPR_130 B4c1a1c 16217C 16311C 16519C 73G 152C 200G 263G 309.1C 315.1C 455.1T
KPR_131 J1b1b 16069T 16126C 16145A 16185T 16261T 16519C 73G 263G 271T 295T 309.1C 315.1C 459d 462T 489C 523d 524d
KPR_132 M4 16124C 16145A 16176T 16223T 16261T 16311C 16519C 73G 146C 263G 309.1C 315.1C 489C
KPR_133 M5a2a 16129A 16209C 16223T 16519C 73G 151T 263G 315.1C 489C
MRCA Polymorphisms (delimited with tabs)Sample ID
�2

KPR_134 M3c+152 16126C 16223T 16519C 73G 152C 263G 315.1C 482C 489C
KPR_135 R0a+60.1T 16126C 16246T 16362C 60.1T 64T 152C 263G 309.1C 315.1C
KPR_136 M65a+@16311 16223T 16276C 16289G 16519C 73G 146C 185A 234G 263G 315.1C 489C 511T
KPR_137 J1b1a1 16069T 16126C 16145A 16172C 16222T 16242T 16261T 73G 146C 242T 263G 295T 315.1C 462T 489C 523d 524d
KPR_138 M4 16136C 16145A 16223T 16261T 16304C 16311C 16519C 73G 263G 315.1C 489C
KPR_139 M4 16086C 16145A 16223T 16261T 16311C 16519C 73G 263G 315.1C 489C
KPR_140 HV14 16311C 263G 309.1C 315.1C 480C
KPR_141 U7 16169T 16309G 16318T 16519C 73G 152C 153G 263G 309.1C 315.1C 523d 524d
KPR_142 H1 16174T 16519C 93G 152C 263G 315.1C 513A
KPR_143 J1d 16069T 16126C 16193T 16519C 73G 146C 152C 263G 295T 309.1C 315.1C 462T 489C 524.1A 524.2C 524.3A 524.4C
KPR_144 H6b 16189C 16300G 16362C 16482G 239C 263G 309.1C 315.1C
KPR_145 M3a1+204 16126C 16223T 16311C 16519C 73G 204C 217C 260A 263G 315.1C 482C 489C
KPR_146 U2b 16051G 16291T 16353T 73G 146C 234G 263G 315.1C 524.1A 524.2C
KPR_147 M30b 16223T 16278T 16465T 16519C 73G 152C 195A 263G 309.1C 309.2C 315.1C 489C 573.1C
KPR_148 W4 16223T 16292T 16519C 73G 143A 189G 194A 196C 196.1C 204C 207A 263G 309.1C 315.1C
KPR_149 W 16093C 16223T 16519C 73G 189G 195C 204C 207A 249d 263G 309.1C 315.1C
KPR_150 M3d 16126C 16223T 16344T 16519C 73G 263G 315.1C 482C 489C
KPR_151 U2c'd 16051G 16188T 16207G 16234T 16355T 16519C 73G 194.1A 263G 315.1C
KPR_152 C4a3b 16223T 16298C 16311C 16327T 16357C 16519C 73G 249d 263G 310C 489C
KPR_153 H1 16243C 16311C 16319A 16519C 263G 309.1C 309.2C 315.1C
KPR_154 R30b1 16182C 16183C 16189C 16298C 16299G 73G 152C 195C 263G 299d 309.1C 315.1C 373G
KPR_155 T2c1 16111A 16126C 16292T 16294T 16296T 16519C 73G 263G 309.1C 315.1C
KPR_156 R6 16129A 16213A 16362C 16519C 73G 152C 195C 263G 309.1C 315.1C
KPR_157 M6 16223T 73G 152C 214G 263G 315.1C 461T 489C 523d 524d
KPR_158 U7a 16309G 16318C 16519C 73G 151T 152C 263G 309.1C 315.1C 523d 524d
KPR_159 W5a1a 16093C 16223T 16292T 16362C 16519C 73G 189G 194T 195C 204C 207A 263G 309.1C 315.1C
KPR_160 T2 16126C 16296T 16519C 73G 263G 309.1C 309.2C 315.1C
KPR_161 M30 16111T 16223T 16399G 16519C 73G 195A 263G 309.1C 315.1C 489C 523d 524d
KPR_162 H17c 16051G 16129A 16239T 73G 146C 234G 263G 315.1C
KPR_163 M65b 16172C 16223T 16311C 16519C 73G 241G 251A 263G 309.1C 315.1C 489C 511T
KPR_164 F1d 16183C 16189C 16304C 16519C 73G 146C 249d 263G 315.1C 523d 524d
KPR_165 U5a1b+16362 16192T 16256T 16270T 16362C 16399G 16519C 73G 263G 315.1C
KPR_166 H41a 16261T 262T 263G 309.1C 315.1C
KPR_167 M37e 16111T 16184T 16189C 16223T 16274A 16295T 16519C 73G 263G 315.1C 489C
KPR_168 U4b1a1a1 16311C 16356C 16362C 16519C 73G 195C 263G 309.1C 315.1C 499A 507C
KPR_169 M5d 16129A 16223T 16519C 73G 146C 263G 309.1C 315.1C 489C
KPR_170 U7 16173T 16309G 16318T 16362C 16519C 73G 152C 263G 309.1C 315.1C 523d 524d
KPR_171 U7a4 16126C 16207G 16292T 16309G 16318T 16519C 73G 151T 152C 263G 309.1C 315.1C 523d 524d
KPR_172 U2c'd 16051G 16179T 16234T 16519C 73G 152C 263G 309.1C 315.1C
KPR_173 R0 16519C 263G 315.1C
KPR_174 M65a+@16311 16223T 16289G 16519C 73G 263G 315.1C 489C 511T
KPR_175 M4 16086C 16145A 16223T 16261T 16311C 16519C 73G 263G 315.1C 489C
KPR_176 M3 16126C 16223T 16519C 73G 263G 315.1C 482C 489C
KPR_177 K2a5 16129A 16224C 16311C 16519C 73G 146C 152C 263G 309.1C 309.2C 315.1C 324T
KPR_178 U7a3 16207G 16309G 16318T 16519C 73G 151T 152C 263G 315.1C 523d 524d
KPR_179 F1d 16183C 16189C 16304C 16519C 73G 146C 249d 263G 315.1C 523d 524d
KPR_180 M30b 16189C 16223T 16249C 16278T 16519C 73G 152C 195A 263G 309.1C 315.1C 489C 523d 524d
KPR_181 J1b1b 16069T 16126C 16145A 16183C 16189C 16261T 16519C 73G 263G 271T 295T 315.1C 462T 489C 523d 524d
KPR_182 U4a2c1 16242A 16288C 16356C 16362C 16519C 73G 146C 195C 263G 310C 499A 524.1A 524.2C 524.3A 524.4C
KPR_183 M6 16093C 16223T 16362C 73G 152C 214G 263G 315.1C 461T 489C 523d 524d
KPR_184 M3 16126C 16223T 16519C 73G 263G 315.1C 482C 489C
KPR_185 A19 16125A 16223T 16274A 16290T 16311C 16319A 16362C 73G 152C 195C 199C 235G 263G 309.1C 315.1C 523d 524d 576G
KPR_186 M3 16126C 16223T 16519C 73G 263G 315.1C 482C 489C
KPR_187 M30+16234 16223T 16234T 16519C 73G 195A 263G 315.1C 489C 523d 524d 573.1C
KPR_188 U7a 16309G 16318C 16519C 73G 151T 152C 263G 315.1C 523d 524d
KPR_189 U7a3b 16182C 16183C 16189C 16207G 16309G 16318C 16519C 73G 151T 152C 263G 315.1C 523d 524d 573.1C
KPR_190 U7a 16309G 16318T 16519C 73G 151T 152C 263G 309.1C 315.1C 523d 524d
KPR_191 M30c1 16166d 16167T 16223T 16519C 73G 146C 195A 263G 315.1C 489C 523d 524d
KPR_192 H* 16145A 263G 309.1C 309.2C 315.1C
KPR_193 HV6 16172C 16311C 263G 309.1C 315.1C
KPR_194 H* 16311C 152C 263G 309.1C 315.1C
KPR_195 U7a 16309G 16318T 16519C 73G 151T 152C 263G 309.1C 315.1C 523d 524d
KPR_196 M3a1+204 16126C 16223T 16295T 16311C 16519C 73G 204C 217C 263G 315.1C 482C 489C
KPR_197 M30b 16037G 16189C 16192T 16223T 16278T 16519C 73G 152C 195A 263G 315.1C 489C 523d 524d
KPR_198 H* 16356C 236C 263G 309.1C 315.1C
KPR_199 M30+16234 16223T 16234T 16519C 73G 195A 263G 315.1C 489C 523d 524d 573.1C
KPR_200 U2a 16051G 16206C 16278T 73G 194T 263G 309.1C 315.1C
MRCA Polymorphisms (delimited with tabs)Sample ID
�3

KPR_201 U2a1a 16051G 16154C 16206C 16230G 16311C 73G 263G 309.1C 309.2C 315.1C
KPR_202 D6a1 16189C 16223T 16274A 16362C 73G 263G 309.1C 315.1C 489C
KPR_203 H1e3 16129A 16189C 16519C 93G 263G 309.1C 309.2C 315.1C
KPR_204 M4 16086C 16145A 16148T 16223T 16261T 16311C 16519C 73G 204C 207A 263G 315.1C 489C
KPR_205 M65a+@16311 16166G 16185T 16223T 16289G 16362C 16519C 73G 195C 263G 315.1C 489C 511T
KPR_206 T2 16126C 16172C 16294T 16296T 16325C 16519C 73G 195C 263G 309.1C 309.2C 315.1C
KPR_207 H15 16092C 16519C 55C 57C 152C 263G 309.1C 309.2C 315.1C 523d 524d
KPR_208 J1b1b 16069T 16126C 16145A 16189C 16261T 16519C 73G 263G 271T 295T 315.1C 462T 489C 523d 524d
KPR_209 H* 16519C 152C 263G 309.1C 315.1C
KPR_210 M65a+@16311 16223T 16234T 16289G 16519C 73G 263G 309.1C 315.1C 489C 511T
KPR_211 U2b2 16051G 16239T 16352C 16353T 73G 146C 234G 263G 315.1C
KPR_212 U1a1a1 16129A 16169T 16182C 16183C 16189C 16249C 16274A 16380T 16519C 73G 146C 152C 263G 285T 309.1C 315.1C 385G 523d 524d 573.1C 573.2C
KPR_213 U2c'd 16051G 16169T 16234T 16278T 16304C 16519C 73G 152C 217C 263G 315.1C
KPR_214 M65 16223T 16311C 16519C 73G 263G 309.1C 315.1C 489C 511T
KPR_215 M30g 16223T 16304C 16519C 73G 195A 204C 263G 309T 315.1C 489C 523d 524d
KPR_216 T1a 16126C 16163G 16172C 16186T 16189C 16294T 16519C 73G 152C 195C 263G 315.1C
KPR_217 M4 16136C 16145A 16223T 16261T 16304C 16311C 16519C 73G 263G 315.1C 489C
KPR_218 M31a2 16126C 16145A 16223T 73G 146C 195C 263G 315.1C 489C
KPR_219 M30+16234 16223T 16234T 16256T 16519C 73G 195A 263G 309.1C 315.1C 489C 523d 524d
KPR_220 D4b2b 16037G 16223T 16304C 16362C 16519C 73G 194T 263G 309.1C 315.1C 489C 523d 524d
KPR_221 U2c'd 16051G 16126C 16178C 16179T 16183C 16189C 16193.1C 16234T 16247G 73G 146C 152C 263G 315.1C 573d
KPR_222 T2c1 16111A 16126C 16292T 16294T 16296T 16519C 73G 263G 309.1C 315.1C
KPR_223 R30b1 16172C 16182C 16183C 16189C 16234T 16261T 16298C 16299G 73G 152C 257G 263G 299d 309d 315.1C 373G 480C
KPR_224 M30 16189C 16190T 16193.1C 16223T 16260T 16293G 16519C 73G 195A 263G 315.1C 489C 523d 524d
KPR_225 M37e2 16111T 16182C 16183C 16189C 16223T 16224C 16295T 16519C 73G 182T 263G 309.1C 315.1C 489C
KPR_226 U7 16318T 16519C 73G 152C 263G 309.1C 315.1C 523d 524d
KPR_227 R6b 16169T 16179T 16227G 16245T 16266T 16278T 16362C 16519C 73G 94A 195C 246C 263G 309.1C 309.2C 315.1C 523d 524d
KPR_228 M3a1+204 16126C 16223T 16311C 16519C 73G 204C 217C 263G 315.1C 482C 489C
KPR_229 U7a 16189C 16266T 16309G 16318T 16519C 73G 151T 152C 263G 315.1C 523d 524d
KPR_230 M37e 16086C 16111T 16184T 16189C 16223T 16274A 16295T 16519C 73G 263G 309.1C 315.1C 489C
KPR_231 M22a 16126C 16223T 16290T 16519C 73G 263G 309.1C 309.2C 315.1C 489C
KPR_232 H7a2 16176T 16184T 16357C 16497G 16519C 146C 263G 309.1C 315.1C
KPR_233 R0 16519C 263G 315.1C
KPR_234 T2 16126C 16294T 16296T 16519C 73G 200G 263G 315.1C
KPR_235 M22a 16126C 16223T 16290T 16519C 73G 263G 309.1C 315.1C 489C
KPR_236 M33a2a 16169T 16172C 16223T 16519C 73G 146C 263G 309.1C 315.1C 462T 489C
KPR_237 M5a2a 16129A 16209C 16223T 16519C 73G 151T 263G 315.1C 489C
KPR_238 H6b 16300G 16362C 16482G 239C 263G 309.1C 315.1C
KPR_239 M65a+@16311 16185T 16223T 16289G 16362C 16519C 73G 263G 315.1C 489C 511T
KPR_240 M65a 16185T 16189C 16193d 16223T 16289G 16311C 16362C 16519C 73G 263G 315.1C 489C 511T
KPR_241 M2a1a 16223T 16270T 16319A 16352C 73G 195C 204C 263G 309.1C 315.1C 447G 489C 523d 524d
KPR_242 U7a3b 16140C 16207G 16214T 16309G 16318T 16362C 16519C 73G 151T 152C 263G 315.1C 523d 524d
KPR_243 U2c'd 16051G 16188T 16207G 16213A 16234T 16519C 16527T 63C 64T 66A 73G 152C 263G 315.1C
KPR_244 W5a 16223T 16292T 16362C 16519C 73G 146C 189G 194T 195C 204C 207A 263G 315.1C
KPR_245 R30b2 16292T 16497G 16519C 73G 150T 263G 309.1C 315.1C 373G
KPR_246 J1b1b 16069T 16126C 16145A 16183C 16189C 16261T 16519C 73G 263G 271T 295T 315.1C 462T 489C 523d 524d
KPR_247 M30b 16189C 16193T 16193.1C 16223T 16278T 16519C 73G 152C 195A 309.1C 315.1C 489C 523d 524d
KPR_248 U4b1a1a1 16145A 16356C 16362C 16519C 73G 195C 263G 315.1C 499A
KPR_249 H* 16519C 263G 315.1C 513A
KPR_250 HV6 16172C 16259T 16311C 263G 309.1C 315.1C
KPR_251 H17a1 16129A 16291T 193G 198T 263G 315.1C
KPR_252 U7 16227G 16309G 16318C 16519C 73G 152C 215G 263G 309.1C 315.1C 523d 524d
KPR_253 U2e1 16051G 16129C 16183C 16189C 16362C 16519C 73G 152C 217C 263G 309.1C 309.2C 315.1C 340T 508G 524.1A 524.2C
KPR_254 T2 16126C 16294T 16296T 16325C 16519C 16527T 73G 263G 315.1C 523d 524d
KPR_255 H* 16261T 16516A 263G 309.1C 309.2C 315.1C
KPR_256 U7 16309G 16318T 16519C 73G 152C 263G 315.1C 523d 524d
KPR_257 M5 16111T 16129A 16223T 16519C 73G 263G 315.1C 489C
KPR_258 M30c1 16166d 16223T 16352C 16519C 73G 146C 195A 263G 315.1C 489C 523d 524d
KPR_259 U2b 16051G 16247G 16254G 16311C 16326G 73G 146C 150T 152C 263G 315.1C
KPR_260 M30+16234 16223T 16234T 16291T 16362C 16519C 73G 195A 263G 309.1C 315.1C 489C 523d 524d
KPR_261 M65a+@16311 16137G 16223T 16289G 16360T 16519C 73G 263G 315.1C 489C 511T
KPR_262 M5 16129A 16223T 53A 55C 56G 73G 152C 199C 263G 315.1C 489C
KPR_263 U7 16309G 16318T 16519C 73G 152C 263G 309.1C 315.1C 523d 524d
KPR_264 T2 16126C 16257d 16294T 16296T 16519C 73G 200G 263G 315.1C
KPR_265 J1b1b 16069T 16126C 16145A 16189C 16261T 16519C 73G 263G 271T 295T 315.1C 462T 489C 523d 524d
KPR_266 R6 16129A 16213A 16311C 16362C 16519C 73G 195C 263G 315.1C
KPR_267 M5a1a 16129A 16223T 16291T 16519C 73G 152C 263G 315.1C 334C 489C
MRCA Polymorphisms (delimited with tabs)Sample ID
�4

KPR_268 M3a 16126C 16223T 16311C 16519C 73G 150T 204C 263G 315.1C 482C 489C
KPR_269 M30c 16183C 16189C 16223T 16519C 73G 146C 195A 200G 263G 309.1C 315.1C 489C 523d 524d
KPR_270 M30d 16179d 16223T 16302G 16519C 73G 195A 263G 315.1C 489C 523d 524d
KPR_271 M4b 16086C 16145A 16192T 16223T 16261T 16311C 16519C 73G 263G 315.1C 489C
KPR_272 R30b1 16183C 16189C 16298C 16299G 73G 152C 195C 263G 299d 309.1C 309.2T 315.1C 373G
KPR_273 N1a2 16192T 16223T 16274A 16301T 16309G 16311C 16356C 73G 199C 204C 263G 315.1C 523d 524d
KPR_274 U2+152 16051G 16319A 16519C 73G 152C 263G 309.1C 315.1C 489C
KPR_275 H* 151T 152C 263G 315.1C
KPR_276 J1b1b 16069T 16126C 16145A 16183C 16189C 16261T 16519C 73G 263G 271T 295T 315.1C 462T 489C 523d 524d
KPR_277 M3a1+204 16223T 16311C 16519C 73G 204C 217C 263G 309.1C 315.1C 482C 489C
KPR_278 M3a1+204 16126C 16223T 16519C 73G 146C 204C 263G 309.1C 315.1C 482C 489C
KPR_279 U7a 16085T 16309G 16318C 16519C 73G 151T 152C 263G 315.1C 523d 524d
KPR_280 U7a 16085T 16309G 16318C 16519C 73G 151T 152C 263G 315.1C 523d 524d
KPR_281 M3 16126C 16223T 16519C 73G 263G 315.1C 482C 489C
KPR_282 M5a1 16129A 16223T 16291T 16519C 73G 263G 309.1C 315.1C 489C
KPR_283 U7a 16309G 16318C 16519C 73G 151T 152C 263G 309.1C 309.2C 315.1C 523d 524d
KPR_284 M3 16126C 16185T 16223T 16519C 73G 195C 263G 315.1C 482C 489C
KPR_285 M5a2a1a 16129A 16223T 16265C 16344T 16519C 73G 263G 315.1C 374G 489C
KPR_286 M5a1a 16129A 16223T 16291T 16519C 73G 152C 263G 315.1C 334C 489C
KPR_287 R30b1 16183C 16189C 16298C 16299G 73G 152C 195C 263G 299d 309.1C 315.1C 373G
KPR_288 U2 16051G 16092C 16192T 16325C 73G 195C 263G 309.1C 315.1C
KPR_289 U7a 16309G 16318T 16519C 73G 151T 152C 263G 315.1C 523d 524d
KPR_290 U7a 16093C 16274A 16309G 16318T 16343G 16390A 16519C 73G 151T 152C 263G 315.1C 523d 524d
KPR_291 M3c2 16126C 16154C 16223T 16224C 16519C 73G 195C 263G 309.1C 315.1C 482C 489C 523d 524d
KPR_292 H6 16519C 239C 263G 315.1C
KPR_293 U8b1a1 16129A 16183C 16189C 16193.1C 16519C 73G 185A 195C 263G 309.1C 309.2C 315.1C
KPR_294 M30+16234 16223T 16234T 16519C 73G 195A 263G 309.1C 315.1C 489C 523d 524d
KPR_295 W+194 16223T 16240G 16292T 16519C 73G 189G 194T 195C 204C 207A 263G 309.1C 315.1C
KPR_296 H3v 16519C 93G 152C 263G 315.1C 408A 513A
KPR_297 U4 16356C 16519C 73G 195C 263G 309.1C 315.1C 499A
KPR_298 R 16519C 73G 146C 263G 309.1C 315.1C
KPR_299 M3c2 16126C 16154C 16223T 16519C 73G 263G 315.1C 482C 489C 523d 524d
KPR_300 M30d 16179d 16223T 16302G 16519C 73G 195A 263G 309.1C 309.2C 315.1C 489C 523d 524d
KPR_301 R0 16519C 263G 315.1C
KPR_302 H* 16519C 263G 315.1C 513A
KPR_303 T2e 16126C 16153A 16189C 16294T 16296T 16519C 73G 150T 263G 309.1C 315.1C
KPR_304 U7a3b 16140C 16207G 16309G 16318T 16362C 16519C 73G 151T 152C 195C 263G 315.1C 523d 524d
KPR_305 U1a 16182C 16183C 16189C 16249C 16257T 16519C 73G 204C 263G 285T 309.1C 315.1C
KPR_306 N1a2 16189C 16223T 16286T 16301T 16356C 73G 199C 204C 263G 315.1C 523d 524d
KPR_307 U7a 16140C 16207G 16309G 16318T 16362C 16519C 73G 151T 152C 195C 263G 315.1C 523d 524d
KPR_308 M30b 16223T 16278T 16519C 73G 152C 195A 263G 315.1C 489C 523d 524d
KPR_309 U7a 16309G 16318T 16519C 73G 151T 152C 263G 315.1C 523d 524d
KPR_310 R 16497G 16519C 73G 152C 263G 315.1C 480C
KPR_311 U7a 16309G 16318C 16519C 73G 151T 152C 263G 309.1C 315.1C 523d 524d
KPR_312 M6a1b 16178C 16188T 16223T 16231C 16362C 16519C 73G 146C 185A 263G 315.1C 461T 489C
KPR_313 M30+16234 16223T 16234T 16362C 16519C 73G 195A 263G 315.1C 489C 523d 524d
KPR_314 M30+16234 16223T 16234T 16362C 16519C 73G 195A 263G 315.1C 489C 523d 524d
KPR_315 M65a+@16311 16223T 16276C 16289G 16519C 73G 185A 263G 309.1C 315.1C 489C 511T
KPR_316 H14a 16256T 16352C 263G 309.1C 315.1C
KPR_317 M31a2 16126C 16145A 16223T 73G 146C 195C 263G 315.1C 489C
MRCA Polymorphisms (delimited with tabs)Sample ID
�5

TableS2.
a. AMOVAforPakistaniethnicgroups(Kashmiri,Pathan,Makrani)
Sourceofvariation Degreesoffreedom Sumofsquares Variancecomponents Percentageofvariation
Amongpopulations 2 70.132 0.14807 2.43Withinpopulations 643 3820.524 5.94172 97.57Total 645 3890.656 6.08979
b. AMOVAresultsforKashmiriand15regionalpopulations
Sourceofvariation Degreesoffreedom Sumofsquares Variancecomponents PercentageofvariationAmongpopulations 15 869.77 0.2269 3.62Withinpopulations 3672 22178.289 6.03984 96.38Total 3687 23048.059 6.26674
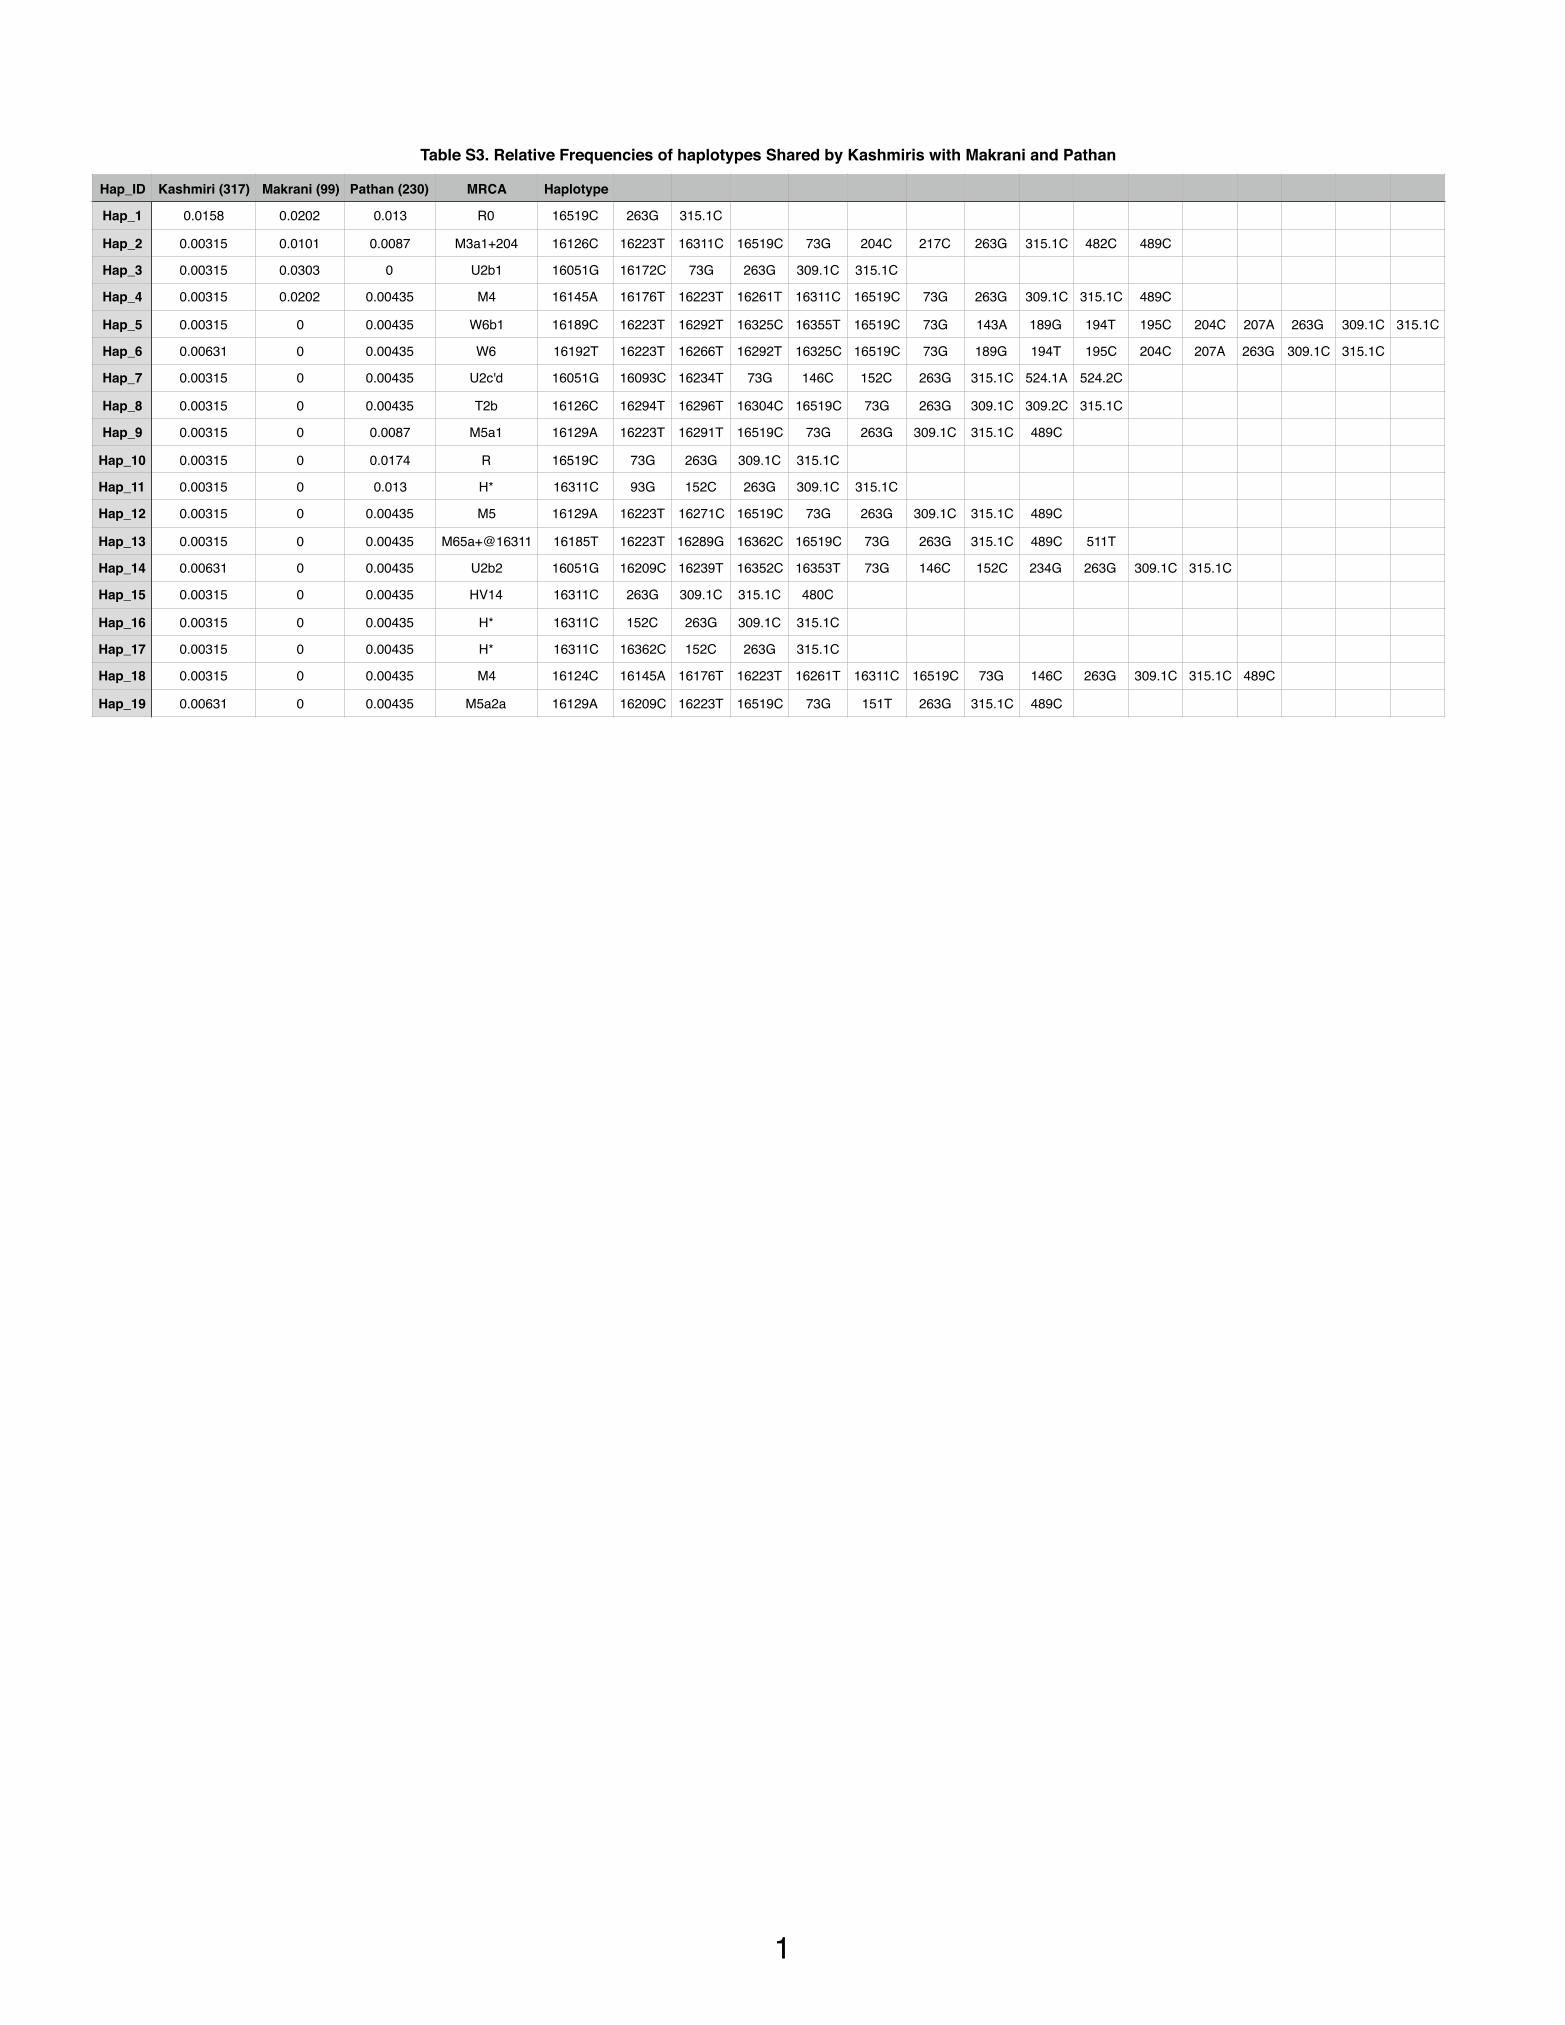
Table S3. Relative Frequencies of haplotypes Shared by Kashmiris with Makrani and Pathan
Hap_ID Kashmiri (317) Makrani (99) Pathan (230) MRCA Haplotype
Hap_1 0.0158 0.0202 0.013 R0 16519C 263G 315.1C
Hap_2 0.00315 0.0101 0.0087 M3a1+204 16126C 16223T 16311C 16519C 73G 204C 217C 263G 315.1C 482C 489C
Hap_3 0.00315 0.0303 0 U2b1 16051G 16172C 73G 263G 309.1C 315.1C
Hap_4 0.00315 0.0202 0.00435 M4 16145A 16176T 16223T 16261T 16311C 16519C 73G 263G 309.1C 315.1C 489C
Hap_5 0.00315 0 0.00435 W6b1 16189C 16223T 16292T 16325C 16355T 16519C 73G 143A 189G 194T 195C 204C 207A 263G 309.1C 315.1C
Hap_6 0.00631 0 0.00435 W6 16192T 16223T 16266T 16292T 16325C 16519C 73G 189G 194T 195C 204C 207A 263G 309.1C 315.1C
Hap_7 0.00315 0 0.00435 U2c'd 16051G 16093C 16234T 73G 146C 152C 263G 315.1C 524.1A 524.2C
Hap_8 0.00315 0 0.00435 T2b 16126C 16294T 16296T 16304C 16519C 73G 263G 309.1C 309.2C 315.1C
Hap_9 0.00315 0 0.0087 M5a1 16129A 16223T 16291T 16519C 73G 263G 309.1C 315.1C 489C
Hap_10 0.00315 0 0.0174 R 16519C 73G 263G 309.1C 315.1C
Hap_11 0.00315 0 0.013 H* 16311C 93G 152C 263G 309.1C 315.1C
Hap_12 0.00315 0 0.00435 M5 16129A 16223T 16271C 16519C 73G 263G 309.1C 315.1C 489C
Hap_13 0.00315 0 0.00435 M65a+@16311 16185T 16223T 16289G 16362C 16519C 73G 263G 315.1C 489C 511T
Hap_14 0.00631 0 0.00435 U2b2 16051G 16209C 16239T 16352C 16353T 73G 146C 152C 234G 263G 309.1C 315.1C
Hap_15 0.00315 0 0.00435 HV14 16311C 263G 309.1C 315.1C 480C
Hap_16 0.00315 0 0.00435 H* 16311C 152C 263G 309.1C 315.1C
Hap_17 0.00315 0 0.00435 H* 16311C 16362C 152C 263G 315.1C
Hap_18 0.00315 0 0.00435 M4 16124C 16145A 16176T 16223T 16261T 16311C 16519C 73G 146C 263G 309.1C 315.1C 489C
Hap_19 0.00631 0 0.00435 M5a2a 16129A 16209C 16223T 16519C 73G 151T 263G 315.1C 489C
�1

Table S4: Primers for mtDNA control region sequence analysis
Primers Sequence (5′ to 3′) Usage
L15594 CGCCTACACAATTCTCCGATC PCR and Sequencing
H901 ACTTGGGTTAATCGTGTGACC PCR and Sequencing
L15996 CTCCACCATTAGCACCCAAAGC Sequencing
L16209 CCCCATGCTTACAAGCAAGT Sequencing
L29 GGTCTATCACCCTATTAACCAC Sequencing
L333 GCTTCTGGCCACAGCACT Sequencing
H16498 CCTGAAGTAGGAACCAGATG Sequencing
H408 CTGTTAAAAGTGCATACCGCCA Sequencing
�1

Table S6. Pairwise differences calculated using Arlequin 3.5.1.2
Table S6a. Population pairwise Fst valuesAfghan Chinese_HK Dubai Egypt Kashmiri Chinese_ZW Iraq Kazakh Kuwait Kyrgyz Laos Chinese_WD Makrani Pathan Russian Tajik Thai Turkmen Uzbek Vietnam
Afghan 0
Chinese_HK 0.08047 0
Dubai 0.03445 0.05766 0
Egypt 0.02809 0.05794 0.01036 0
Kashmiri 0.04942 0.05265 0.02055 0.02903 0
Chinese_ZW 0.07575 0.00138 0.05541 0.05611 0.04369 0
Iraq 0.03217 0.07841 0.01146 0.00631 0.03058 0.07232 0
Kazakh 0.05452 0.02958 0.0261 0.03172 0.02465 0.02224 0.03779 0
Kuwait 0.04283 0.06402 0.00722 0.01172 0.02611 0.06107 0.00531 0.03024 0
Krgyz 0.06815 0.01782 0.03501 0.03825 0.02449 0.01203 0.05095 0.0066 0.03923 0
Laos 0.08092 0.01827 0.06156 0.05613 0.05302 0.01726 0.07124 0.05119 0.06443 0.0359 0
Chinese_WD 0.07414 0.01103 0.0475 0.04758 0.04012 0.00406 0.06207 0.02018 0.05168 0.01416 0.01547 0
Makrani 0.04931 0.07821 0.0114 0.01768 0.03481 0.07073 0.02029 0.04146 0.01796 0.05349 0.07789 0.05939 0
Pathan 0.03648 0.05359 0.01468 0.01967 -0.00009 0.04476 0.02194 0.02189 0.02122 0.02996 0.05121 0.03795 0.0281 0
Russian 0.05958 0.11475 0.0385 0.02936 0.05831 0.09953 0.01572 0.06093 0.0314 0.08075 0.10176 0.0914 0.06091 0.04663 0
Tajik 0.04925 0.04323 0.02964 0.02314 0.02446 0.03722 0.03054 0.02401 0.02679 0.02434 0.04176 0.03129 0.03465 0.02498 0.05578 0
Thai 0.0691 0.00977 0.05061 0.04822 0.04425 0.01108 0.06115 0.03404 0.05514 0.02732 0.00645 0.01024 0.06962 0.04101 0.0883 0.03644 0
Turkmen 0.04628 0.04535 0.01579 0.01805 0.01568 0.03573 0.01771 0.00814 0.01545 0.014 0.05261 0.03083 0.03431 0.0166 0.03759 0.01889 0.04193 0
Uzbek 0.03842 0.03492 0.01666 0.01574 0.01319 0.02886 0.01914 0.00506 0.01789 0.00976 0.04456 0.02547 0.0302 0.01144 0.03874 0.01461 0.0322 0.00272 0
Vietnam 0.07372 0.01334 0.05718 0.05473 0.05064 0.01389 0.06921 0.04752 0.06293 0.03518 0.00014 0.01604 0.07364 0.04687 0.10288 0.04142 0.00472 0.05309 0.04254 0
Table S6b. Fst p-valuesAfghan Chinese_HK Dubai Egypt Kashmiri Chinese_ZW Iraq Kazakh Kuwait Kyrgyz Laos Chinese_WD Makrani Pathan Russian Tajik Thai Turkmen Uzbek Vietnam
Afghan *
Chinese_HK 0.00000±0.0000 *
Dubai 0.00000±0.0000 0.00000±0.0000 *
Egypt 0.00000±0.0000 0.00000±0.0000 0.00000±0.0000 *
Kashmiri 0.00000±0.0000 0.00000±0.0000 0.00000±0.0000 0.00000±0.0000 *
Chinese_ZW 0.00000±0.0000 0.09570±0.0081 0.00000±0.0000 0.00000±0.0000 0.00000±0.0000 *
Iraq 0.00000±0.0000 0.00000±0.0000 0.00000±0.0000 0.00098±0.0010 0.00000±0.0000 0.00000±0.0000 *
Kazakh 0.00000±0.0000 0.00000±0.0000 0.00000±0.0000 0.00000±0.0000 0.00000±0.0000 0.00000±0.0000 0.00000±0.0000 *
Kuwait 0.00000±0.0000 0.00000±0.0000 0.00000±0.0000 0.00000±0.0000 0.00000±0.0000 0.00000±0.0000 0.00000±0.0000 0.00000±0.0000 *
Krgyz 0.00000±0.0000 0.00000±0.0000 0.00000±0.0000 0.00000±0.0000 0.00000±0.0000 0.00000±0.0000 0.00000±0.0000 0.00000±0.0000 0.00000±0.0000 *
Laos 0.00000±0.0000 0.00000±0.0000 0.00000±0.0000 0.00000±0.0000 0.00000±0.0000 0.00000±0.0000 0.00000±0.0000 0.00000±0.0000 0.00000±0.0000 0.00000±0.0000 *
Chinese_WD 0.00000±0.0000 0.00000±0.0000 0.00000±0.0000 0.00000±0.0000 0.00000±0.0000 0.00000±0.0000 0.00000±0.0000 0.00000±0.0000 0.00000±0.0000 0.00000±0.0000 0.00000±0.0000 *
Makrani 0.00000±0.0000 0.00000±0.0000 0.00098±0.0010 0.00000±0.0000 0.00000±0.0000 0.00000±0.0000 0.00000±0.0000 0.00000±0.0000 0.00000±0.0000 0.00000±0.0000 0.00000±0.0000 0.00000±0.0000 *
Pathan 0.00000±0.0000 0.00000±0.0000 0.00000±0.0000 0.00000±0.0000 0.46875±0.0198 0.00000±0.0000 0.00000±0.0000 0.00000±0.0000 0.00000±0.0000 0.00000±0.0000 0.00000±0.0000 0.00000±0.0000 0.00000±0.0000 *
Russian 0.00000±0.0000 0.00000±0.0000 0.00000±0.0000 0.00000±0.0000 0.00000±0.0000 0.00000±0.0000 0.00000±0.0000 0.00000±0.0000 0.00000±0.0000 0.00000±0.0000 0.00000±0.0000 0.00000±0.0000 0.00000±0.0000 0.00000±0.0000 *
Tajik 0.00000±0.0000 0.00000±0.0000 0.00000±0.0000 0.00000±0.0000 0.00000±0.0000 0.00000±0.0000 0.00000±0.0000 0.00000±0.0000 0.00000±0.0000 0.00000±0.0000 0.00000±0.0000 0.00000±0.0000 0.00000±0.0000 0.00000±0.0000 0.00000±0.0000 *
Thai 0.00000±0.0000 0.00098±0.0010 0.00000±0.0000 0.00000±0.0000 0.00000±0.0000 0.00000±0.0000 0.00000±0.0000 0.00000±0.0000 0.00000±0.0000 0.00000±0.0000 0.00488±0.0020 0.00000±0.0000 0.00000±0.0000 0.00000±0.0000 0.00000±0.0000 0.00000±0.0000 *
Turkmen 0.00000±0.0000 0.00000±0.0000 0.00000±0.0000 0.00000±0.0000 0.00000±0.0000 0.00000±0.0000 0.00000±0.0000 0.00000±0.0000 0.00000±0.0000 0.00000±0.0000 0.00000±0.0000 0.00000±0.0000 0.00000±0.0000 0.00000±0.0000 0.00000±0.0000 0.00000±0.0000 0.00000±0.0000 *
Uzbek 0.00000±0.0000 0.00000±0.0000 0.00000±0.0000 0.00000±0.0000 0.00000±0.0000 0.00000±0.0000 0.00000±0.0000 0.00000±0.0000 0.00000±0.0000 0.00000±0.0000 0.00000±0.0000 0.00000±0.0000 0.00000±0.0000 0.00000±0.0000 0.00000±0.0000 0.00000±0.0000 0.00000±0.0000 0.01074±0.0033 *
Vietnam 0.00000±0.0000 0.00000±0.0000 0.00000±0.0000 0.00000±0.0000 0.00000±0.0000 0.00000±0.0000 0.00000±0.0000 0.00000±0.0000 0.00000±0.0000 0.00000±0.0000 0.38281±0.0125 0.00000±0.0000 0.00000±0.0000 0.00000±0.0000 0.00000±0.0000 0.00000±0.0000 0.01367±0.0039 0.00000±0.0000 0.00000±0.0000 *
Table S6c. Population average pairwise differences Afghan Chinese_HK Dubai Egypt Kashmiri Chinese_ZW Iraq Kazakh Kuwait Kyrgyz Laos Chinese_WD Makrani Pathan Russian Tajik Thai Turkmen Uzbek Vietnam
Afghan 11.1479 12.62863 13.44515 12.54814 11.82109 12.7472 12.33783 12.18551 13.27847 12.12969 12.84314 12.81657 12.78219 12.05951 10.77292 12.46281 12.69735 11.56352 11.96917 12.63008
Chinese_HK 1.03008 12.0492 14.22692 13.40975 12.32829 12.21076 13.43302 12.32482 14.03474 11.96041 12.45999 12.42444 13.65381 12.74378 11.99584 12.83771 12.37394 12.02321 12.38149 12.29877
Dubai 0.50105 0.83218 14.74029 14.1168 13.29781 14.2963 13.88836 13.66219 14.56083 13.56889 14.47481 14.30569 14.11747 13.60728 12.45662 14.04356 14.33307 13.03342 13.51625 14.31053
Egypt 0.37299 0.78395 0.14546 13.20239 12.62553 13.51686 13.04004 12.94919 13.85137 12.81727 13.5738 13.50482 13.41644 12.89242 11.53671 13.16314 13.48383 12.28195 12.72576 13.45365
Kashmiri 0.58705 0.64359 0.26757 0.36424 11.32019 12.3789 12.38732 11.88835 13.09255 11.66934 12.52519 12.41947 12.65525 11.69469 10.8948 12.21299 12.43112 11.29523 11.74069 12.39085
Chinese_ZW 1.00459 0.0175 0.75749 0.747 0.55015 12.33732 13.49142 12.38322 14.09836 12.0409 12.59301 12.48083 13.68944 12.78027 12.05175 12.90383 12.53532 12.0714 12.45663 12.4525
Iraq 0.4081 1.05264 0.16244 0.08306 0.37145 0.96698 12.71156 12.77122 13.5174 12.72174 13.52592 13.45083 13.19884 12.66867 11.10828 13.00915 13.4036 12.02241 12.51758 13.39259
Kazakh 0.67539 0.36405 0.35588 0.41183 0.29209 0.27839 0.47928 11.87233 13.43722 11.73737 12.79724 12.44994 13.03876 12.24008 11.21797 12.49252 12.5914 11.48719 11.92211 12.64576
Kuwait 0.61811 0.92373 0.10427 0.16377 0.34605 0.84329 0.07522 0.41464 14.17282 13.34673 14.22821 14.08139 13.9232 13.4145 12.08308 13.71656 14.11097 12.74837 13.25115 14.10794
Krgyz 0.832 0.21207 0.47501 0.49234 0.28551 0.14851 0.64223 0.07747 0.53659 11.44747 12.37379 12.15886 12.97043 12.12261 11.22951 12.27912 12.28528 11.33995 11.76464 12.26281
Laos 1.06172 0.22792 0.89721 0.76514 0.65764 0.21689 0.96268 0.65361 0.93434 0.4426 12.41492 12.66538 13.85143 12.90402 12.03738 13.00748 12.51661 12.30907 12.69564 12.31938
Chinese_WD 0.98082 0.13803 0.67374 0.64182 0.49757 0.05036 0.83325 0.25196 0.73318 0.17332 0.19611 12.52361 13.63784 12.78445 11.9875 12.92289 12.61962 12.09514 12.5055 12.57454
Makrani 0.63059 1.05156 0.16968 0.2376 0.41752 0.94314 0.26542 0.52495 0.25915 0.66905 1.06633 0.79839 13.15529 12.96902 11.83999 13.28809 13.75429 12.43856 12.87708 13.68263
Pathan 0.44943 0.68305 0.20101 0.2551 -0.00153 0.57549 0.27677 0.26778 0.29197 0.36275 0.66044 0.48651 0.35525 12.07225 11.14659 12.60795 12.78812 11.68703 12.09977 12.74309
Russian 0.62567 1.39794 0.51318 0.36221 0.66141 1.3098 0.17921 0.7085 0.42337 0.93248 1.25662 1.1524 0.68905 0.53716 9.14659 11.49748 11.86865 10.43336 10.94709 11.92945
Tajik 0.63219 0.55644 0.41674 0.30527 0.29623 0.47849 0.3967 0.29968 0.37348 0.29871 0.54335 0.40442 0.45377 0.31515 0.66752 12.51334 12.95739 11.93941 12.36184 12.90224
Thai 0.89498 0.12091 0.7345 0.65421 0.5426 0.13824 0.8194 0.42681 0.79614 0.33312 0.08072 0.12939 0.94822 0.52357 1.06693 0.47229 12.45684 12.19183 12.55504 12.39711
Turkmen 0.5321 0.54115 0.20582 0.22329 0.17768 0.44528 0.20917 0.09357 0.2045 0.15876 0.64415 0.37587 0.40346 0.19345 0.40261 0.22528 0.50595 10.91492 11.41471 12.21006
Uzbek 0.46963 0.43129 0.22051 0.19897 0.155 0.36237 0.2362 0.06035 0.23915 0.11531 0.56259 0.3181 0.37384 0.13805 0.4482 0.17957 0.40102 0.03166 11.85119 12.56788
Vietnam 0.94597 0.164 0.83022 0.7423 0.62059 0.17368 0.92666 0.59944 0.91137 0.42892 0.00176 0.20258 0.99483 0.59681 1.246 0.53541 0.05853 0.64245 0.53213 12.22032
Description S6c.Above diagonal: Average number of pairwise differences between populationDiagonal elements: Average number of pairwise differences within populationBelow diagonal: Corrected average pairwise difference
�1

Table S5. Point heteroplasmy observed
SampleID Heteroplasmic Position
Haplotypes (based on dominant sequence variants)
KPR026 16311Y 16519C 263G 315.1C
KPR029 263R 16051G 16239T 73G 146C 234G 263G 315.1C 575T
KPR054 16181R 16147A 16172C 16189C 16223T 16248T 16320T 16355T 16519C 73G 152C 199C 204C 263G 315.1C 573.1C
KPR064 16111M 16223T 16234T 16243C 16244A 16290T 16519C 73G 186T 249d 263G 315.1C 489C
KPR122 16169Y 16129A 16169T 16178C 16223T 16270T 16319A 16352C 16519C 73G 143A 195C 204C 263G 309.1C 309.2C 315.1C 447G 489C
KPR156 152Y 16129A 16213A 16362C 16519C 73G 152C 195C 263G 309.1C 315.1C
KPR308 152Y 16223T 16278T 16519C 73G 152C 195A 263G 315.1C 489C 523d 524d
�1

Fig S1. Principal component analysis plot for all the compared populations based on FST values calculated by Kimura 2-parameter
−5 0 5 10
−4−2
02
46
8Individuals factor map (PCA)
Dim 1 (60.42%)
Dim
2 (2
9.94
%)
Afghan
Chinese_HK
DubaiEgypt
Kashmiri
Chinese_SC
Iraq
Kazakh
Kuwait
Krgyz
Laos
Chinese_SW
Makrani
Pathan
Russian
Tajik
Thai
Turkmen
Uzbek
Vietnam
Afghan
Chinese_HK
DubaiEgypt
Kashmiri
Chinese_SC
Iraq
Kazakh
Kuwait
Krgyz
Laos
Chinese_SW
Makrani
Pathan
Russian
Tajik
Thai
Turkmen
Uzbek
Vietnam
Afghan
Chinese_HK
DubaiEgypt
Kashmiri
Chinese_SC
Iraq
Kazakh
Kuwait
Krgyz
Laos
Chinese_SW
Makrani
Pathan
Russian
Tajik
Thai
Turkmen
Uzbek
Vietnam
Afghan
Chinese_HK
DubaiEgypt
Kashmiri
Chinese_SC
Iraq
Kazakh
Kuwait
Krgyz
Laos
Chinese_SW
Makrani
Pathan
Russian
Tajik
Thai
Turkmen
Uzbek
Vietnam
Afghan
Chinese_HK
DubaiEgypt
Kashmiri
Chinese_SC
Iraq
Kazakh
Kuwait
Krgyz
Laos
Chinese_SW
Makrani
Pathan
Russian
Tajik
Thai
Turkmen
Uzbek
Vietnam
Afghan
Chinese_HK
DubaiEgypt
Kashmiri
Chinese_SC
Iraq
Kazakh
Kuwait
Krgyz
Laos
Chinese_SW
Makrani
Pathan
Russian
Tajik
Thai
Turkmen
Uzbek
Vietnam
Afghan
Chinese_HK
DubaiEgypt
Kashmiri
Chinese_SC
Iraq
Kazakh
Kuwait
Krgyz
Laos
Chinese_SW
Makrani
Pathan
Russian
Tajik
Thai
Turkmen
Uzbek
Vietnam
Afghan
Chinese_HK
DubaiEgypt
Kashmiri
Chinese_SC
Iraq
Kazakh
Kuwait
Krgyz
Laos
Chinese_SW
Makrani
Pathan
Russian
Tajik
Thai
Turkmen
Uzbek
Vietnam
Afghan
Chinese_HK
DubaiEgypt
Kashmiri
Chinese_SC
Iraq
Kazakh
Kuwait
Krgyz
Laos
Chinese_SW
Makrani
Pathan
Russian
Tajik
Thai
Turkmen
Uzbek
Vietnam
Related Documents


