Foreign Trade Statistics Section [email protected] Monthly Review of FOREIGN TRADE January, 2013 Government of Pakistan Statistics Division Pakistan Bureau of Statistics

Welcome message from author
This document is posted to help you gain knowledge. Please leave a comment to let me know what you think about it! Share it to your friends and learn new things together.
Transcript
Foreign Trade Statistics Section [email protected]
Monthly Review of
FOREIGN TRADE January, 2013
Government of Pakistan Statistics Division
Pakistan Bureau of Statistics

CONTENTS Page # 1. Summary 1 2. Review of Foreign Trade 2 3. Exports by Group/Commodities 4 4. Monthly Exports by Group/Commodities 6 5. Cumulative Exports by Group/Commodities 8 6. Analysis of Selected Commodities of Exports 9 i) Cotton Fabrics 9 ii) Cotton Yarn 10 iii) Rice 11 iv) Petroleum Products 13 v) Leather 14 vi) Carpets, Carpeting, Rugs & Mats 15 vii) Raw Cotton 16 7. Direction of Exports 17 8. Monthly Exports by Territories/Regions 18 9. Monthly Exports by Major Countries 19 10. Cumulative Exports by Territories/Regions 20 11. Cumulative Exports by Major Countries 21 12. Exports by Economic Categories 22 13. Imports by Group/Commodities 23 14. Monthly Imports by Group/Commodities 26 15. Cumulative Imports by Group/Commodities 28 16. Analysis of selected Commodities of Imports 29 i) POL 29 ii) Chemicals 30 iii) Machinery 31 iv) Transport Equipment 32 17. Direction of Imports 33 18. Monthly Imports by Territories/Regions 34 19. Monthly Imports by Major Countries 35 20. Cumulative Imports by Territories/Regions 36 21. Cumulative Imports by Major Countries 37 22. Imports by Economic Categories 38

1
SUMMARY
January, 2013
Exports Imports Balance of Trade
(Rupees in Million)
(U.S. Dollars in Million)
Series
January, 2013
December, 2012
% Change January, 2013
December, 2012 Rs. $ Rs. $ Rs. $
Exports 197,186.61 2,023.01 191,390.68 1,969.30 +3.03 +2.73
Imports 366,822.60 3,763.36 356,898.70 3,672.29 +2.78 +2.48
* Balance of Trade -169,635.99 -1,740.35 -165,508.02 -1,702.99 +2.49 +2.19
Series
January, 2013
January, 2012
% Change January, 2013 January, 2012
Rs. $ Rs. $ Rs. $
Exports 197,186.61 2,023.01 172,701.19 1,916.01 +14.18 +5.58
Imports 366,822.60 3,763.36 328,907.14 3,649.02 +11.53 +3.13
* Balance of Trade -169,635.99 -1,740.35 -156,205.95 -1,733.01 +8.60 +0.42
Series
July – January,2013
July – January, 2012
% Change July – Jan, 2013 July – Jan, 2012
Rs. $ Rs. $ Rs. $
Exports 1,343,192.18 14,047.30 1,149,445.39 13,117.81 +16.86 +7.09
Imports 2,456,663.39 25,685.45 2,308,108.86 26,326.55 +6.44 -2.44
* Balance of Trade -1,113,471.21 -11,638.15 -1,158,663.47 -13,208.74 -3.90 -11.89
Note: * Balance of Trade dose not included Re-Exports & Re-Imports.

2Review of Foreign Trade
January, 2013 EXPORTS The total Exports of Pakistan during January, 2013 amounted to Rs 197,186.61million as against Rs. 191,390.68 million in December, 2012 and Rs. 172,701.19 million during January, 2012 showing an increase of 3.03% over December, 2013 and by 14.18% January, 2012. Exports during July – January, 2013 totalled Rs. 1,343,192.18million as against Rs. 1,149,445.39million during the corresponding period of last year showing an increase of 16.86 percent. In terms of U.S dollars, the exports during January, 2013 amounted to $ 2,023.01million as against $ 1,969.30 million in December, 2012 and $ 1,916.01 million during January, 2012 showing an increase of 2.73% over December, 2013 by 5.58% over January, 2012. In terms of U.S. dollars, the exports during Exports during July –January, 2013 totaled $ 14,047.30 million as against $ 13,117.81 million during the corresponding period of last year showing an increase of 7.09%. IMPORTS The total Imports of Pakistan during January, 2013 amounted to Rs. 366,822.60million as against Rs. 356,898.70 million in December, 2012 and Rs. 328,907.14 million during January, 2012 showing an increase of 2.78% over December, 2013 and by 11.53% over January, 2012. Imports during July–January, 2013 amounted to Rs. 2,456,663.39 million as against Rs. 2,308,108.86 million during the corresponding period of last year showing an increase of 6.44 %. In terms of US dollars, the imports during January, 2013 amounted to $ 3,763.36 million as against $ 3,672.29 million in December, 2012 and $ 3,649.02 million during showing an increase of 2.48% over December, 2012 and by 3.13% over January, 2013. In term of U.S. dollars, the imports during July – January, 2013 amounted $ 26,326.55 million as against $ 22,546.08 million during the corresponding period of last year showing an increase of 16.77 percent.

3
Based on the above figures of exports & imports the balance of trade in January, 2013 was unfavourable for Pakistan to the tune of 169,635.99 million rupees equal to US $ 1,740.35 million, and the balance of trade during July – January, 2013 was also unfavourable to the tune of 1,113,471.21 million rupees equal to U.S. $ 11,638.15 million.

4
I - Exports by Group/Commodities
The total Exports of Pakistan during January, 2013 amounted to Rs
197,186.61million as against Rs. 191,390.68 million in December, 2012 and Rs.
172,701.19 million during January, 2012 showing an increase of 3.03% over
December, 2012 by 14.18% January, 2012.
Exports during July – January, 2013 totalled Rs. 1,343,192.18million as
against Rs. 1,149,445.39 million during the corresponding period of last year
showing an increase of 16.86 %.
Comparative figure of exports by group/commodities during January,
2013 compared to December, 2012 and January, 2012 are given in table-1 and
cumulative exports for the period July – January, 2013 of current financial year
compared to the corresponding period of last year are given in table-2.
Primary Commodities
During January, 2013 the 6 selected commodities of Primary
Commodities contributed 19.41% of total exports in which the share of Rice was
(12.25%), Fruit, vegetables & preparation thereof (5.11%) and Fish & fish
preparation (1.15%).
During July – January, 2013 these 6 commodities contributed 11.58% of
total exports showing a decrease of 16.51% as against their combined share of
13.87% during the corresponding period of last year.

5
Textile Manufactures
During January, 2013 the 9 selected commodities of Textile
Manufactures contributed 49.74% of total exports in which the share of Cotton
fabrics was (10.05%), Cotton yarn (8.00%), Knitwear (7.94%), Articles of
apparel & clothing accessories (excl. knitwear) (7.84%) and Bed-wear (7.64%).
During July – January, 2013 these 9 commodities contributed 50.70% of
total exports showing an increase of 1.89% as against their combined share of
49.76% during the corresponding period of last year.
Other Manufactures
During January, 2013 the 7 selected commodities of Other Manufactures
contributed 7.40% of total exports in which the share of Leather clothes &
accessories was (2.38%), Leather (1.57%), Sports goods (excl. toys) (1.34%),
Surgical instruments (1.24%) and Footwear (0.55%).
During July – January, 2013 these 7 commodities contributed 7.70% of
total exports showing a decrease of 40.12% as against their combined share of
12.86% during the corresponding period of last year.

6Table - 1
Monthly Exports by Group/Commodities
(Million Rs.)
Commodities January,
2013 December,
2012 January,
2012 % Change
Jan, 2013 Jan, 2013
Dec, 2012 Jan, 2012
Total 197,186.61 191,390.68 172,701.19 3.03 14.18 A. Primary Commodities 38,271.92 27,495.21 31,043.88 39.19 23.28
1. Rice 24,160.73 16,607.42 17,262.03 45.48 39.96
2. Fruits, vegetables & preparation thereof 10,082.68 6,766.05 7,212.96 49.02 39.79
3. Fish & fish preparation 2,269.47 2,963.84 1,924.15 -23.43 17.95 4. Raw cotton (excl. linters) 1,199.54 927.35 4,261.56 29.35 -71.85 5. Tobacco un-manufactured 415.42 149.4 360.19 178.06 15.33 6. Raw wool 144.08 81.15 22.99 77.55 526.71 B. Textile Manufactures 98,085.01 97,772.07 81,195.32 0.32 20.80
1. Cotton fabrics 19,815.55 21,848.88 16,027.81 -9.31 23.63 2. Cotton yarn 15,780.88 19,276.91 14,167.03 -18.14 11.39 3. Knitwear 15,661.02 16,077.97 13,665.67 -2.59 14.60
4. Articles of apparel & clothing accessories (excl.knitwear) 15,455.91 14,341.64 13,167.31 7.77 17.38
5. Bed wear 15,058.09 14,076.40 11,128.57 6.97 35.31 6. Towel 6,799.49 6,105.39 4,475.60 11.37 51.92
7. Textile made up (excl. towels & bed wear) 4,514.27 4,682.35 4,295.96 -3.59 5.08
8. Synthetic textile fabrics 3,640.07 639.73 3,611.81 469.00 0.78
9. Tarpaulin and other convas goods 1,359.73 722.80 655.56 88.12 107.42
C. Other Manufactures 14,582.64 15,555.67 18,864.97 -6.26 -22.70
1. Leather clothes & accessories 4,690.21 5,027.13 3,763.91 -6.70 24.61
2. Leather 3,087.97 3,577.50 3,251.37 -13.68 -5.03 3. Sports goods (excl. toys) 2,635.82 2,672.18 2,382.92 -1.36 10.61 4. Surgical instruments 2,454.92 2,495.55 2,174.26 -1.63 12.91 5. Footwear 1,087.98 906.32 848.44 20.04 28.23
6. Carpets, carpeting, rugs & mats 607.92 876.85 937.75 -30.67 -35.17
7. Petroleum products 17.82 0.14 5,506.32 12628.57 -99.68 Others 46,247.04 50,567.73 41,597.02 -8.54 11.18

7
0
50000
100000
150000
200000
250000
Jul Aug Sep Oct Nov Dec Jan Feb Mar Apr May Jun
2011-12 2012-13
MONTHLY EXPORTS FROM PAKISTAN
Million Rupees

8Table - 2
Cumulative Exports by Group/Commodities
(Million Rs.)
Commodities
July – Jan,
2013
July–Jan,
2012
% Change July – Jan, 2013 July – Jan,2012
Total 1,343,192.18 1,149,445.39 16.86 A. Primary Commodities 155,588.95 159,471.34 -2.43 1 Rice 95,776.49 97,996.38 -2.27
2 Fruits, vegetables & preparation thereof 32,510.65 26,232.72 23.93
3 Fish & fish preparation 17,245.40 15,270.47 12.93 4 Raw cotton (excl. linters) 8,661.10 18,380.85 -52.88 5 Tobacco un-manufactured 1,040.99 1,417.15 -26.54 6 Raw wool 354.32 173.77 103.90 B. Textile Manufacture 680,961.30 572,018.07 19.05 1 Cotton fabrics 146,119.32 116,815.23 25.09 2 Cotton yarn 121,335.92 82,659.71 46.79 3 Knitwear 116,977.54 104,715.79 11.71 4 Bed wear 98,696.49 92,909.91 6.23
5 Articles of apparel & clothing accessories (excl. knitwear) 98,178.29 82,272.70 19.33
6 Towels 42,813.23 33,003.73 29.72
7 Textile made up (excl. towels & bedwear) 31,759.55 28,268.97 12.35
8 Synthetic textile fabrics 19,114.02 26,963.14 -29.11 9 Tarpaulin & other canvas goods 5,966.94 4,408.89 35.34 C. Other Manufactures 103,421.40 147,844.34 -30.05 1 Leather clothes & accessories 32,446.20 29,203.39 11.10 2 Leather 24,156.53 21,598.47 11.84 3 Sports goods (excl. toys) 17,252.02 15,471.29 11.51 4 Surgical instruments 17,002.63 15,333.88 10.88 5 Carpets, carpeting, rugs & mats 6,695.26 6,500.16 3.00 6 Footwear 5,765.45 5,003.48 15.23 7 Petroleum Products 103.31 54,733.67 -99.81 Others 403,220.53 270,111.64 49.28
9
II – Analysis of Selected Commodities of Exports
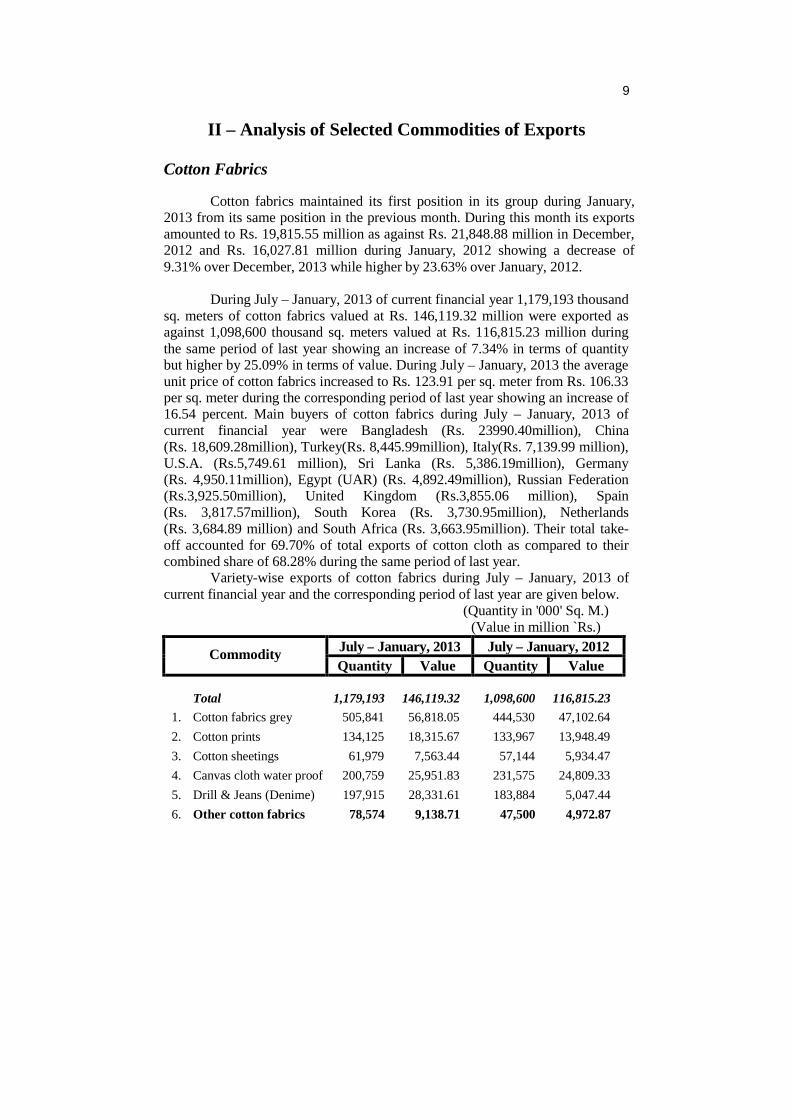
Cotton Fabrics Cotton fabrics maintained its first position in its group during January, 2013 from its same position in the previous month. During this month its exports amounted to Rs. 19,815.55 million as against Rs. 21,848.88 million in December, 2012 and Rs. 16,027.81 million during January, 2012 showing a decrease of 9.31% over December, 2013 while higher by 23.63% over January, 2012. During July – January, 2013 of current financial year 1,179,193 thousand sq. meters of cotton fabrics valued at Rs. 146,119.32 million were exported as against 1,098,600 thousand sq. meters valued at Rs. 116,815.23 million during the same period of last year showing an increase of 7.34% in terms of quantity but higher by 25.09% in terms of value. During July – January, 2013 the average unit price of cotton fabrics increased to Rs. 123.91 per sq. meter from Rs. 106.33 per sq. meter during the corresponding period of last year showing an increase of 16.54 percent. Main buyers of cotton fabrics during July – January, 2013 of current financial year were Bangladesh (Rs. 23990.40million), China (Rs. 18,609.28million), Turkey(Rs. 8,445.99million), Italy(Rs. 7,139.99 million), U.S.A. (Rs.5,749.61 million), Sri Lanka (Rs. 5,386.19million), Germany (Rs. 4,950.11million), Egypt (UAR) (Rs. 4,892.49million), Russian Federation (Rs.3,925.50million), United Kingdom (Rs.3,855.06 million), Spain (Rs. 3,817.57million), South Korea (Rs. 3,730.95million), Netherlands (Rs. 3,684.89 million) and South Africa (Rs. 3,663.95million). Their total take-off accounted for 69.70% of total exports of cotton cloth as compared to their combined share of 68.28% during the same period of last year. Variety-wise exports of cotton fabrics during July – January, 2013 of current financial year and the corresponding period of last year are given below.
(Quantity in '000' Sq. M.) (Value in million `Rs.)
Commodity July – January, 2013 July – January, 2012 Quantity Value Quantity Value
Total 1,179,193 146,119.32 1,098,600 116,815.23 1. Cotton fabrics grey 505,841 56,818.05 444,530 47,102.64 2. Cotton prints 134,125 18,315.67 133,967 13,948.49 3. Cotton sheetings 61,979 7,563.44 57,144 5,934.47 4. Canvas cloth water proof 200,759 25,951.83 231,575 24,809.33 5. Drill & Jeans (Denime) 197,915 28,331.61 183,884 5,047.44 6. Other cotton fabrics 78,574 9,138.71 47,500 4,972.87

10 Cotton Yarn Cotton yarn maintained its second position in its group during January, 2013 as in the previous month. Its exports in this month amounted to Rs. 15,780.88 million as against Rs. 19,276.91 million in December, 2012 and Rs. 14,167.03 million in January, 2012 showing a decrease of 18.14% over December, 2013 while higher by 11.39% over January, 2012. During July – January, 2013 exports of cotton yarn amounted to Rs. 121,335.32 million as against Rs. 82,659.71 million in the corresponding period of last year showing a rise of 46.79 percent. In terms of quantity 421,768 thousand Kg. of cotton yarn was exported during July – January, 2013 of current financial year as against 294,592 thousand Kg. during the corresponding period of last year showing an increase of 43.17 percent. The average unit price of cotton yarn for the period July – January, 2013 of current financial year was Rs. 287.68 per Kg. as against Rs. 280.59 per Kg. in the same period of last year showing an increase of 2.53 percent. China (Rs. million), Hong Kong (Rs. million), Bangladesh (Rs. million), Korea Rep. of (Rs. million), Japan (Rs. million), Portugal (Rs. million) and Turkey (Rs. million) were major buyers of cotton yarn during this period. Their combined share accounted for 90.55%of total exports of cotton yarn as compared to their combined share of 83.64%during the same period of last year. Variety-wise exports of cotton yarn in terms of quantity and value during July–January, 2013 of the current financial year and corresponding period of last year are given below:-
(Quantity in '000' Kg.) (Value in million Rs.)
Commodity July – January, 2013 July – January, 2012 Quantity Value Quantity Value
Total 421,768 121,335.92 294,592 82,659.71 1. Cotton yarn single Combed/uncombed 367,141 104,075.76 251,358 69,088.49 2. Cotton yarn multiple Combed/uncombed 54,480 17,202.81 43,021 13,500.71 Cotton yarn N.S. 146 57.35 213 70.51
11
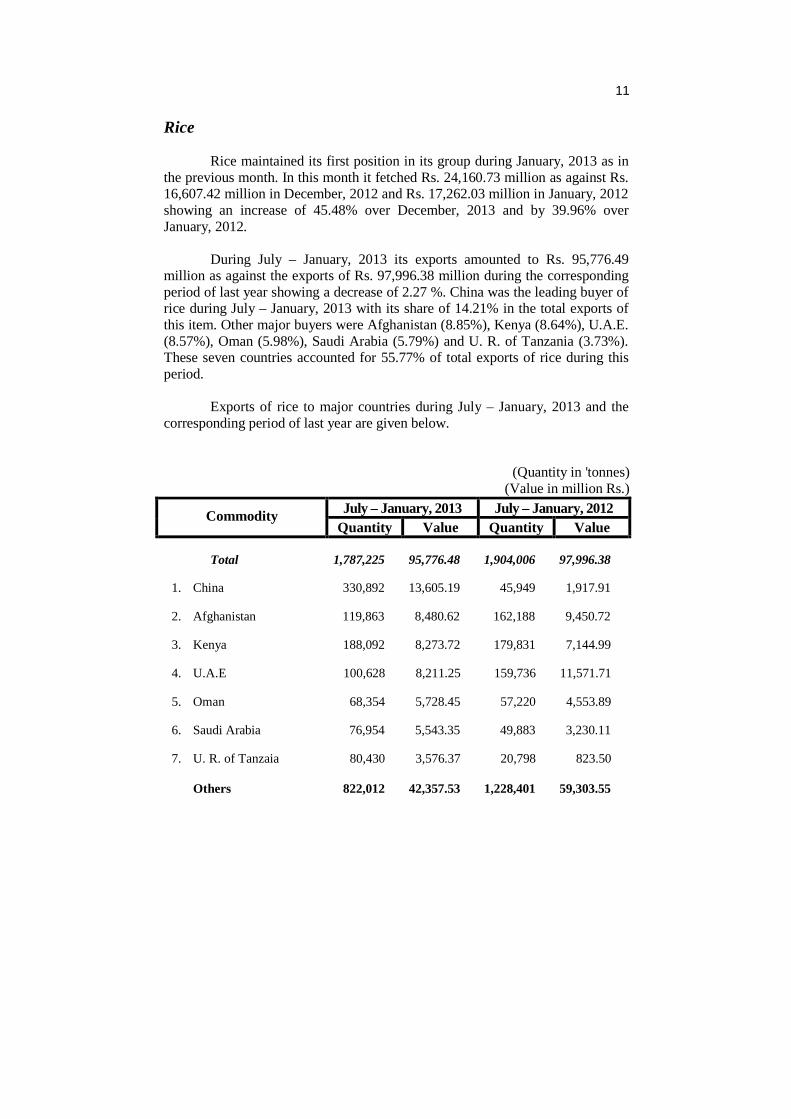
Rice Rice maintained its first position in its group during January, 2013 as in the previous month. In this month it fetched Rs. 24,160.73 million as against Rs. 16,607.42 million in December, 2012 and Rs. 17,262.03 million in January, 2012 showing an increase of 45.48% over December, 2013 and by 39.96% over January, 2012.
During July – January, 2013 its exports amounted to Rs. 95,776.49 million as against the exports of Rs. 97,996.38 million during the corresponding period of last year showing a decrease of 2.27 %. China was the leading buyer of rice during July – January, 2013 with its share of 14.21% in the total exports of this item. Other major buyers were Afghanistan (8.85%), Kenya (8.64%), U.A.E. (8.57%), Oman (5.98%), Saudi Arabia (5.79%) and U. R. of Tanzania (3.73%). These seven countries accounted for 55.77% of total exports of rice during this period. Exports of rice to major countries during July – January, 2013 and the corresponding period of last year are given below.
(Quantity in 'tonnes) (Value in million Rs.)
Commodity July – January, 2013 July – January, 2012 Quantity Value Quantity Value
Total 1,787,225 95,776.48 1,904,006 97,996.38
1. China 330,892 13,605.19 45,949 1,917.91
2. Afghanistan 119,863 8,480.62 162,188 9,450.72
3. Kenya 188,092 8,273.72 179,831 7,144.99
4. U.A.E 100,628 8,211.25 159,736 11,571.71
5. Oman 68,354 5,728.45 57,220 4,553.89
6. Saudi Arabia 76,954 5,543.35 49,883 3,230.11
7. U. R. of Tanzaia 80,430 3,576.37 20,798 823.50
Others 822,012 42,357.53 1,228,401 59,303.55

12 Unit price of rice basmati for January, 2013 was Rs. 97,353.54 per tonne
as against Rs. 70,357.64 in January, 2012 showing a rise of 38.37 %. Average unit price of this variety for July – January, 2013 of current financial year was Rs. 92,291.37 per tonne as against Rs. 75,830.72 per tonne for the same period of last year showing a rise of 21.71 percent. Unit price of rice "Other Varieties" increased to Rs. 42,862.87 per tonne in January, 2013 from Rs. 39,723.28 per tonne in January, 2012 showing a rise of 7.90 percent. The average unit price of rice "Other Varieties" for July –January, 2013 at Rs. 44,302.76 per tonne was higher by 6.13% compared to average unit price of Rs. 41,741.96 per tonne for the same period of last year. Variety-wise exports of rice in terms of quantity and value are given below:-
(Quantity in tonnes.) (Value in million Rs.)
Variety/period Quantity Value Unit value (Rs. Per tonne)
Rice Basmati January, 2013 55,876 5,439.73 97,353.54 January, 2012 71,877 5,057.10 70,357.64 July, 2012 – January, 2013 345,863 31,920.17 92,291.37 July, 2010– January, 2012 543,271 41,196.63 75,830.72 Rice other varieties January, 2013 436,765 18,721.00 42,862.87 January, 2012 307,249 12,204.94 39,723.28 July, 2012 – January, 2013 1,441,362 63,856.32 44,302.76 July, 2010 – January, 2012 1,360,735 56,799.75 41,741.96

13
Petroleum Products Petroleum products maintained its seventh position in its group during January, 2013 as in the previous month. In this month its exports amounted to Rs. 17.82 million as against Rs. 0.14 million in December, 2012 and Rs. 5,506.32 million in January, 2012 showing an increase of 12,628.57% over December, 2013 but lower by 99.68% over January, 2012. Exports of this item during July – January, 2013 of current financial year stood at Rs. 103.31million as against exports of Rs. 54,733.67 million during the corresponding period of last year showing a decrease of 99.81 percent. In terms of quantity 1,411 tonnes of petroleum products were exported during July – January, 2013 of current financial year as against 605,049 tonnes exported during the corresponding period of last year showing a decrease of 99.77 percent. The main buyers of petroleum products during July – January, 2013 were Afghanistan (Rs. 50.10 million) U.R. of Tanzania (Rs. 24.25 million), Bangladesh (Rs. 17.74 million) and U.A.E. (Rs. 10.60million). These four countries accounted for 99.40% of total exports of petroleum products during July – January, 2013 as against their combined share of 88.43% during the same period of last year. Quantity and value of exports of petroleum products during July – January, 2013 and the corresponding period of last year are given below:-
(Quantity in tonnes) (Value in million Rs.)
Commodity July– January, 2013 July – January, 2012 Quantity Value Quantity Value
Total 1,411 103.31 605,049 54,733.67 Petroleum Top-Neptha – – 355,428 30,743.09 Other petroleum products 1,411 103.31 249,621 23,990.58
(–) Indicate nil.

14 Leather Leather maintained its second position in its group during January, 2013 as in the previous month. Its exports in this month amounted to Rs. 3,087.97 million as against Rs. 3,577.50 million in December, 2012 and Rs. 3,251.37 million in January, 2012 showing a decrease of 13.68% over December, 2013 and by 5.03% over January, 2012. Exports of this item during July – January, 2013 totaled Rs. 24,156.53 million as against Rs. 21,598.47 million during the corresponding period of last year showing a rise of 11.84 percent. In terms of quantity 14,697,984 sq. meter of leather was exported during July – January, 2013 as against 14,171.623 sq. meters exported during the corresponding period of last year showing an increase of 3.71 percent. The main buyers of leather during July – January, 2013 were Hong Kong (Rs. 6,973.41 million), China (Rs. 3,314.68 million), Italy (Rs. 2,844.45 million), Korea Rep. of (Rs. 1,896.42 million), Viet Nam (Rs. 1,376.58 million), Germany (Rs. 922.00 million), Turkey (Rs. 687.40 million), Spain (Rs. 616.62 million), South Africa (Rs. 565.10 million) and India (Rs. 505.47 million), whose combined share in total exports of leather was 81.56% as against their combined share of 80.84% during the same period of last year. Quantity and value of exports of leather during July – January, 2013 and the corresponding period of last year are given below:-
(Quantity in sq. meters) (Value in million Rs.)
Commodity July – January, 2013 July – January, 2012 Quantity Value Quantity Value
Total 14,697,984 24,156.53 14,171,623 21,598.47
Tanned/curst hide/skin bovine ani. 412,316 610.23 195,860 290.20
Tanned/curst dress bovine ani. 6,775,340 11,438.98 5,731,859 9,115.44
Tanned/curst hide/skin sheep/lamb 41,242 57.34 113,527 167.46
Tanned/curst dress sheep/lamb 1,930,303 3,197.70 1,859,124 2,827.77
Tanned/curst hide/skin goat/kids 6,826 10.90 24,593 33.47
Tanned/curst dress goat/kids 4,545,453 7,258.17 4,930,979 7,074.47
Leather ns 986,504 1,583.22 1,315,681 2,089.67

15
Carpets, Carpeting, Rugs & Mats Carpets, carpeting, rugs and mats maintained its sixth position in its group during January, 2013 as in the previous month. Its exports in January, 2013 amounted to Rs. 607.92 million as against Rs. 876.85 million in December, 2012 and Rs. 937.75 million in January, 2012 showing a decrease of 36.67% over December, 2013 and by 35.17% over January, 2012. Exports of this item for July – January, 2013 of current financial year amounted to Rs. 6,695.26 million as against Rs. 6,500.16 million during the corresponding period of last year showing an increase of 3.00 percent. In terms of quantity 1,806,410 sq. meters of carpets, carpeting, rugs & mats were exported during July – January, 2013 of current financial year as against 2,098,215 sq. meters exported during the corresponding period of last year showing a decrease of 13.91 percent. The average unit price of carpets of wool hand knotted was Rs. 4,835.85 per sq. meter during July– January, 2013 as against Rs. 4,021.93 per sq. meter in the corresponding period of last year showing a rise of 20.24percent. U.S.A (Rs. 2,739.14 million), Turkey (Rs. 523.80 million), Germany (Rs. 467.11 million), Japan (Rs. 369.62 million), Italy (Rs.343.14 million), United Kingdom (Rs. 302.09 million), South Africa (Rs. 291.10 million) and France (Rs. 270.05 million), were the main buyers of carpets, carpeting, rugs & mats during July – January, 2013. They together accounted for 80.06 % during July – January, 2013 as compared to their combined share of 73.19% during the same period of last year. Quantity and value of exports of carpets, carpeting, rugs & mats during July – January, 2013 and corresponding period of last year are given below.
(Quantity in sq. meters) (Value in million Rs.)
Commodity July – January, 2013 July – January, 2012 Quantity Value Quantity Value
Total 1,806,410 6,695.26 2,098,215 6,500.16 Carpets of wool (hand knotted) 1,306,845 6,319.70 1,490,090 5,993.04 Other carpets, carpeting, rugs & mats 499,565 375.56 608,125 507.12

16 Raw Cotton Raw Cotton maintained its fourth position in its group during January, 2013 as in the previous month. Its exports in this month amounted to Rs. 1,199.54 million as against Rs. 927.35 million in December, 2012 and Rs. 4,261.56 million in January, 2012 showing an increase of 29.35% over December, 2013 but lower by 71.85% over January, 2012. Exports of this item during July – January, 2013 amounted to Rs. 8,661.10 million as against Rs. 18,380.85 million showing a decrease of 52.88% compared to the same period of last year. In terms of quantity 53,540 tonnes of raw cotton was exported during July – January, 2013 as against 109,689 tonnes exported during the same period of last year showing a decrease of 51.19 percent. The main buyers of raw cotton during July – January, 2013 were Viet Nam (Rs. 2,620.51 million), Bangladesh (Rs. 2,175.28 million), Indonesia (Rs. 1,505.49 million), India (Rs. 1,007.25 million) and China (Rs. 892.75 million). They together accounted for 94.69% of total exports of raw cotton during July – January, 2013 as against their combined share of 83.37% during the corresponding period of last year. Quantity and value data of exports of raw cotton during July – January, 2013 and the corresponding period of last year are given below:-
(Quantity in `Tonnes’.) (Value in million Rs.)
Commodity July – January, 2013 July – January, 2012 Quantity Value Quantity Value
Total 53,540 8,661.10 109,689 18,380.85 1. Cotton American – – 3 0.58 2. Cotton Egyptian – – 48 16.47 Others 53,540 8,661.10 109,638 18,363.81
(– ) Indicate nil.

17
III - Direction of Exports
Exports by Territories/Regions and Major countries during January, 2013
compared with January, 2012 are given in table 3 & 4 and cumulative Exports by
Territories/Regions and Major countries for the period July – January, 2013 of
the current financial year compared with the same period of last year are given in
table 5 & 6 respectively.
During the month of January, 2013 (24.76%) of total exports went to
European Union as against 21.95% in January, 2012. The share of North
America during January, 2013 was 15.04% as against 14.72% in January, 2012.
The share of Middle East during January, 2013 was 15.40% as against 19.92% in
January, 2012. Country-wise, U.S.A. was at the top of the exports list for
January, 2013 followed by China, Afghanistan, U.A.E., United Kingdom and
Germany. The share of these six countries in total exports for January, 2013 was
47.83% as against their combined share of 51.43% in January, 2012.
During July – January, 2013 the share of European Union in total
Exports was 22.11% as against 24.16% in January, 2012. The share of North
America was 16.32% as against 16.32% during the same period of last year. The
share of Middle East increased to 19.24% from 17.16% during the same period
of last year.
Country-wise, U.S.A. was at the top of the exports list for July –January,
2013 followed by U.A.E., China, Afghanistan, United Kingdom and Germany.
The share of these six countries in total exports for July –January, 2013 of the
current financial year was 54.11% as against their combined share of 52.25% in
the same period of last year.

18 Table - 3
Monthly Exports by Territories/Regions
(Million Rs.)
Territories/Regions January, 2013 January, 2012 Value % Share Value % Share
Total: 197,186.61 100.00 172,701.19 100.00 1. Latin & Central America 1,544.96 0.78 1,007.25 0.58 2. South America 2,649.23 1.34 2,344.07 1.36 3. North America 29,651.23 15.04 25,425.07 14.72 4. Eastern Europe 3,934.43 2.00 3,653.59 2.12 5. European Union 48,821.91 24.76 37,909.88 21.95 6. E.F.T.A 481.13 0.24 445.90 0.26 7. Other Europe 147.79 0.07 79.11 0.05 8. Middle East 30,361.76 15.40 34,404.65 19.92 i) Asian Countries 26,217.64 13.30 30,032.43 17.39 ii) African Countries 4,144.12 2.10 4,372.22 2.53 9. Other Asia 60,169.81 30.51 56,589.61 32.77 10. Other Africa 17,504.19 8.88 8,903.82 5.16 11. Oceania 1,920.19 0.97 1,938.23 1.12

19
Table - 4
Monthly Exports To Major Countries
(Million Rs.)
Countries January, 2013 January, 2012 Value % Share Value % Share
Total: 197,186.61 100.00 172,701.19 100.00 1. U.S.A. 27,996.80 14.20 23,947.77 13.87 2. China 19,571.63 9.93 16,653.70 9.64 3. Afghanistan 15,878.98 8.05 14,910.80 8.63 4. U.A.E. 12,013.35 6.09 17,743.38 10.27 5. United Kingdom 11,813.92 5.99 8,148.66 4.72 6. Germany 9,019.92 4.57 7,434.15 4.30 7. Bangladesh 5,007.88 2.54 4,553.68 2.64 8. Italy 4,959.17 2.51 4,162.41 2.41 9. Saudi Arabia 4,799.04 2.43 2,652.84 1.54 10. Belgium 4,453.25 2.26 3,206.43 1.86 11. Netherlands 4,432.88 2.25 4,022.25 2.33 12. Spain 4,397.98 2.23 3,878.93 2.25 13. Turkey 3,488.28 1.77 3,671.22 2.13 14. France 2,988.97 1.52 2,275.98 1.32 15. Kenya 2,866.22 1.45 1,447.04 0.84 16. Russian Federation 2,846.31 1.44 2,268.21 1.31 17. Sri Lanka 2,492.77 1.26 1,768.40 1.02 18. South Africa 2,431.55 1.23 1,767.84 1.02 19. India 2,396.67 1.22 2,619.75 1.52 20. Hong Kong 2,375.21 1.20 3,247.00 1.88 Others 50,955.84 25.84 42,320.76 24.51

20
Table - 5
Cumulative Exports by Territories/Regions
(Million Rs.)
Territories/Regions July – January, 2013 July – January, 2012 Value % Share Value % Share
Total 1,343,192.18 100.00 1,149,445.39 100.00 1. Latin & Central America 10,756.72 0.80 8,782.50 0.76 2. South America 19,507.92 1.45 16,273.74 1.42 3. North America 219,224.27 16.32 187,553.99 16.32 4. Eastern Europe 16,565.52 1.23 16,393.91 1.43 5. European Union 296,918.90 22.11 277,649.27 24.16 6. E.F.T.A. 3,232.94 0.24 3,224.75 0.28 7. Other Europe 791.17 0.06 736.68 0.06 8. Middle East 258,413.92 19.24 197,193.69 17.16 i) Asian Countries 236,372.22 17.60 177,811.28 15.47 ii) African Countries 22,041.70 1.64 19,382.41 1.69 9. Other Asia 434,891.97 32.38 369,988.91 32.19 10. Other Africa 70,801.00 5.27 61,554.79 5.36 11. Oceania 12,087.85 0.90 10,093.15 0.88

21
Table - 6
Cumulative Exports To Major Countries
(Million Rs.)
Countries July – January, 2013 July – January, 2012 Value % Share Value % Share
Total 1,343,192.18 100.00 1,149,445.39 100.00 1. U.S.A. 206,418.23 15.37 176.764.82 15.38 2. U.A.E. 152,033.46 11.32 97,828.48 8.51 3. China 142,797.92 10.63 91,999.54 8.00 4. Afghanistan 112,978.98 8.41 117,047.15 10.18 5. United Kingdom 71,543.21 5.33 60,006.30 5.22 6. Germany 54,437.89 4.05 57,035.64 4.96 7. Bangladesh 37,923.46 2.82 29,264.70 2.55 8. Spain 29,046.12 2.16 25,346.93 2.21 9. Belgium 28,651.38 2.13 27,933.12 2.43 10. Italy 27,359.34 2.04 29,960.44 2.61 11. Saudi Arabia 25,980.86 1.93 18,922.58 1.65 12. Netherlands 25,284.53 1.88 25,434.49 2.21 13. Hong Kong 20,487.20 1.53 18,266.86 1.59 14. Turkey 20,009.61 1.49 22,217.38 1.93 15. France 18,345.79 1.37 17,724.19 1.54 16. India 17,163.57 1.28 15,320.58 1.33 17. Sri Lanka 15,796.61 1.18 14,305.94 1.24 18. South Africa 15,356.20 1.14 13,335.53 1.16 19. Viet Nam 15,029.59 1.12 13,144.35 1.14 20. Korea, Republic of 14,236.77 1.06 17,570.07 1.53 Others 292,311.48 21.76 260,016.32 22.62

22
IV - Exports by Economic Categories Performance of exports by economic categories during January, 2013 and July – January, 2013 of the current financial year compared to the same period of last year are shown in table-7. During January, 2013 exports of primary commodities increased by 29.01%, semi-manufactures by 27.91% and of manufactured goods by 7.28% during the current month as compared to the same month of last year. During July – January, 2013 exports of primary commodities were higher by 2.14%, semi-manufactures by 51.44% and manufactured goods by 14.55% as compared to the same period of last year.
Table - 7
Exports by Economic Categories
(Million Rs.)
Economic Category January, 2013
January, 2012
July–January, 2013
July–January, 2012
Total: 197,186.61 172,701.19 1,343,192.18 1,149,445.39 1. Primary Commodities 43,247.30 33,521.88 193,591.47 189,539.32 % share in total exports 21.93 19.41 14.41 16.49 2. Semi- manufactures 28,670.38 22,414.69 205,252.60 135,536.27 % share in total exports 14.54 12.98 15.28 11.79 3. Manufactured goods 125,268.93 116,764.62 944,348.11 824,369.80 % share in total exports 63.53 67.61 70.31 71.72

23
I – Imports by Group/Commodities
Imports into Pakistan during January, 2013 amounted to Rs. 366,822.60 million as against the imports of Rs. 356,898.70 million in the previous month and Rs. 328,907.14 million during the corresponding month of last year showing an increase of 2.78% over previous month and by 11.53% over the corresponding month of last year. Imports during July – January, 2013amounted to Rs. 2,456,663.39 million as against Rs. 2,308,108.86 million during the corresponding period of last year showing an increase of 6.44 percent. Comparative figures of imports by group/commodities during January, 2013, December, 2012 and January, 2012 are given in Table-8 and cumulative imports for July – January, 2013 of current financial year and the previous year are given in Table-9. Food Group
During January, 2013 the 5 selected commodities of Food group
contributed 6.93% of total imports in which the share of Palm oil and Tea were
4.94% and 1.03% respectively.
During July – January, 2013 this group contributed 6.82% of total
imports showing a decrease 9.79% as against their combined share of 7.56%
during the corresponding period of last year.
Machinery & Transport Group
During January, 2013 Machinery & Transport group contributed 18.00%
of total imports in which the share of Machinery and Transport equipment were
12.42% and 5.57% respectively.
24
During July – January, 2013 this Group contributed 18.51% of the total
imports showing an increase of 9.72% as against their combined share of 16.87%
during the corresponding period of last year.
Petroleum Group
During January, 2013 Petroleum group contributed 30.45% of total
imports in which the share of Petroleum products and Petroleum crude were
18.50% and 11.96% respectively.
During July – January, 2013 this group contributed 34.45% of total
imports showing an increase of 3.52% as against their combined share of 33.28%
during the corresponding period of last year.
Textile Group
During January, 2013 Textile group contributed 2.13% of total imports in
which the share of Synthetic & artificial silk yarn and Synthetic fibre were 1.21%
and 0.93% respectively.
During July – January, 2013 this group contributed 2.13% of total import
showing a decrease of 17.76% as against their combined share of 2.59% during
the corresponding period of last year.
Chemical Group
During January, 2013 Chemical group contributed 13.34% of total
imports in which the share of Chemical (excl. fertilizer, medicines & insecticide)
were (10.97%), Medical products (1.21%), Fertilizer manufactured (0.93%) and
Insecticide (0.22%).

25
During July – January, 2013 chemical group contributed 14.63% of the
total imports showing a decrease of 12.13% as against their combined share of
16.65% during the corresponding period of last year.
Metal Group
During January, 2013 Metal group contributed 5.71% of total imports in
which the share of Iron & steel and Iron & steel scrap were 4.14% and 1.56%
respectively.
During July – January, 2013 this group contributed 4.89% of total
imports showing an increase of 15.33% as against their combined share of 4.24%
during the corresponding period of last year.
Miscellaneous Group
During January, 2013 miscellaneous group contributed 1.26% of total
imports in which the share of Paper & paper products and Tyres & tubes were
0.79% and 0.47% respectively.
During July – January, 2013 this group contributed 1.24% of total
imports showing a decrease of 10.79% as against their combined share of 1.39%
during the corresponding period of last year.

26
Table - 8
Monthly Imports by Group/Commodities
(Million Rs.)
Commodities
January, 2013
December,
2012
January,
2012
% Change
Jan, 2013 Jan,2013
Dec,2012 Jan,2012
Total 366,822.60 356,898.70 328,907.14 2.78 11.53
A- Food Group 25,419.10 21,426.57 23,172.96 18.63 9.69 1 Palm oil 18,114.96 15,554.96 16,229.40 16.46 11.62 2 Tea 3,796.09 3,403.18 2,759.22 11.55 37.58 3 Pulses 2,644.95 1,869.18 1,914.72 41.50 38.14
4 Milk &milk food for infants 625.38 578.29 1710.75 8.14 -63.44 5 Soya-bean oil 237.72 20.96 558.87 1034.16 -57.46
B- Mach. & Transport Group 66,014.44 64,650.17 57,165.59 2.11 15.48 1 Machinery 45,569.11 49,093.34 43,326.06 -7.18 5.18 2 Transport equipment 20,445.33 15,556.83 13,839.53 31.42 47.73
C- Petroleum Group 111,703.95 121,617.35 104,212.47 -8.15 7.19 1 Petroleum Products 67,848.97 73,261.51 64,689.63 -7.39 4.88 2 Petroleum Crude 43,854.98 48,355.84 39,522.84 -9.31 10.96
D- Textile Group 7,830.56 7,617.40 7,215.49 2.80 8.52 1 Synthetic &art silk yarn 4,425.32 4,379.94 3,620.02 1.04 22.25 2 Synthetic fiber 3,405.24 3,237.46 3,595.47 5.18 -5.29
E- Chemical Group 48,917.23 52,944.22 54,289.65 -7.61 -9.90 1 Chemicals (excl. 2, 3&4) 40,236.95 40,470.81 37,199.76 -0.58 8.16 2 Medicinal products 4,454.41 9,472.90 5,220.35 -52.98 -14.67 3 Fertilizer manufactured 3,417.45 2,443.46 10,933.23 39.86 -68.74 4 Insecticide 808.42 557.05 936.31 45.13 -13.66
F- Metal Group 20,934.58 15,108.03 16,058.54 38.57 30.36 1 Iron & steel 15,194.63 10,580.30 11,434.12 43.61 32.89 2 Iron & steel scrap 5,739.95 4,527.73 4,624.42 26.77 24.12
G- Miscellaneous Group 4,615.41 4,333.90 4,944.51 6.50 -6.66 1 Paper & paper products 2,906.15 2,563.88 2,954.39 13.35 -1.63 2 Tyres & tubes 1,709.26 1,770.02 1,990.12 -3.43 -14.11
Others 81,387.33 69,201.06 61,847.93 17.61 31.59
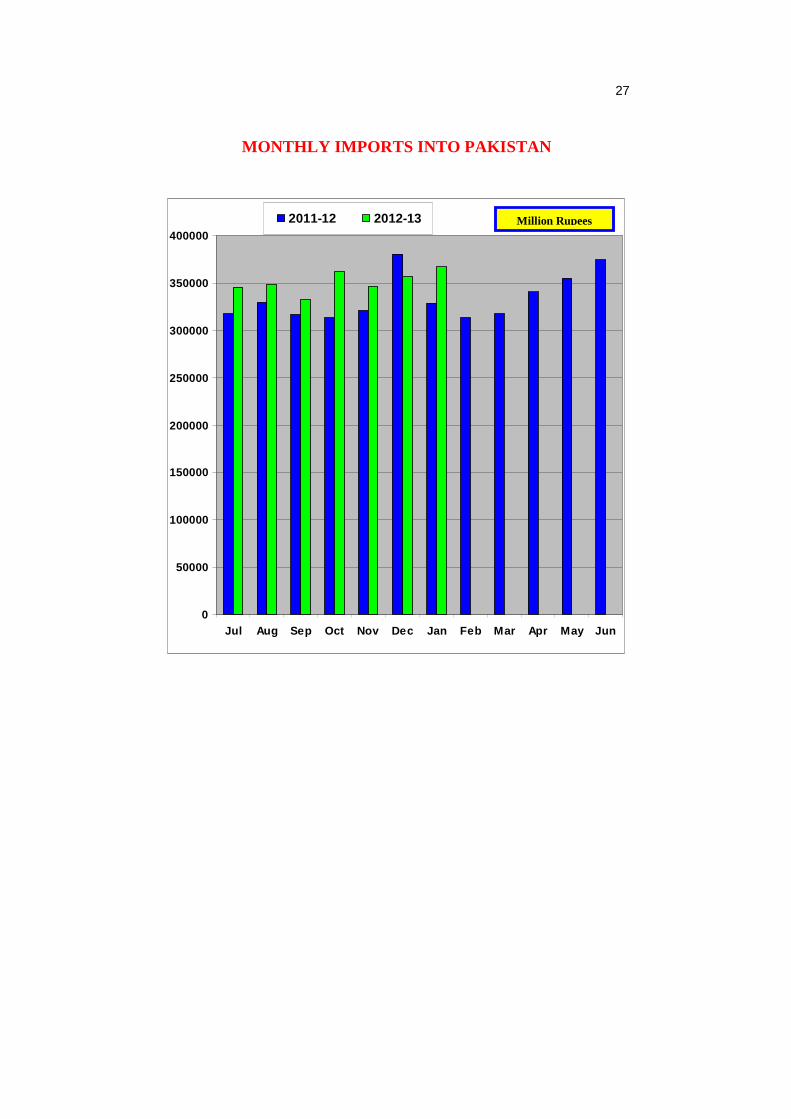
27
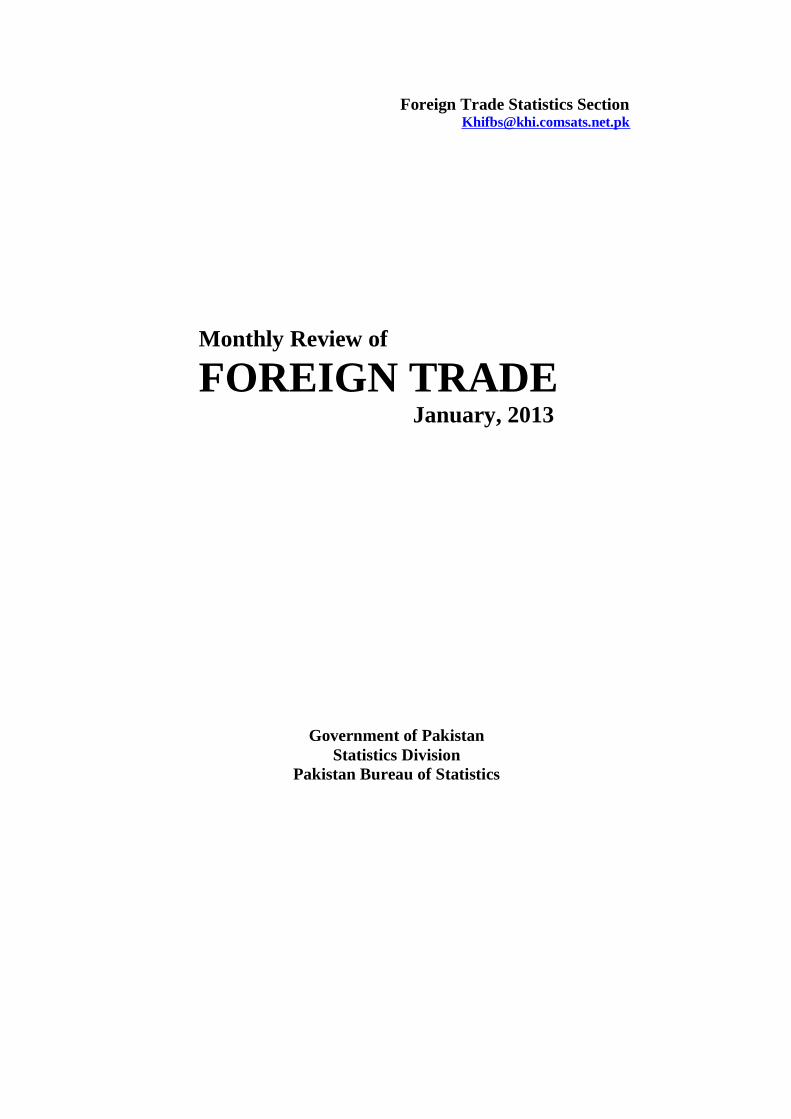
MONTHLY IMPORTS INTO PAKISTAN
0
50000
100000
150000
200000
250000
300000
350000
400000
Jul Aug Sep Oct Nov Dec Jan Feb Mar Apr May Jun
2011-12 2012-13
Million Rupees

28
Table - 9
Cumulative Imports by Group/Commodities
(Million Rs.)
Commodities July–February, 2013
July–February, 2012
% Change
July – Feb, 2013
July – Feb,2012
Total 2,456,663.39 2,308,108.86 6.44 A-Food Group 167,630.15 174,464.31 -3.92 1 Palm oil 115,675.79 126,411.55 -8.49 3 Tea 21,250.38 17,737.55 19.80 2 Pulses 19,811.10 19,829.11 -0.09 4 Milk & milk food for infants 6,467.15 6,885.43 -6.07 5 Soyabean oil 4,425.73 3,600.67 22.91 B-Machinery & Transport Group 454,788.05 389,479.57 16.77 1 Machinery 326,624.15 289,617.53 12.78 2 Transport equipment 128,163.90 99,862.04 28.34 C-Petroleum Group 846,305.42 768,117.87 10.18 1 Petroleum products 537,565.33 513,727.67 4.64
2 Petroleum crude 308,740.09 254,390.20 21.36 D-Textile Group 52,265.44 59,833.03 -12.65 1 Synthetic & artificial silk yarn 30,461.57 31,858.53 -4.38
2 Synthetic fiber 21,803.87 27,974.50 -22.06 E-Chemical Group 359,307.47 384,303.85 -6.50 1 Chemicals (excl. 2, 3&4) 265,952.08 262,289.15 1.40
2 Fertilizer manufactured 46,724.62 80,173.99 -41.72 3 Medicinal products 42,721.44 34,696.17 23.13 4 Insecticide 3,909.33 7,144.54 -45.28 F-Metal Group 120,033.64 97,914.65 22.59 1 Iron & steel 80,672.15 68,423.37 17.90
2 Iron & steel scrap 39,361.49 29,491.28 33.47 G-Miscellaneous Group 30,530.75 32,115.20 -4.93 1 Paper & paper products 18,913.45 19,542.58 -3.22
2 Tyres & tubes 11,617.30 12,572.62 -7.60 Others 425,802.47 401,880.38 5.95

29
II – Analysis of Selected Commodities of Imports
POL Imports of POL during January, 2013 valued at Rs. 111,703.95 million was lower by 8.15% compared to December, 2012 Rs. 121,617.35 million while higher by 7.19% compared to January, 2012 Rs. 104,212.47 million. Cumulative imports of POL during the period July – January, 2013 amounted to Rs. 846,305.42 million as against Rs. 768,117.87 million during the corresponding period of last year showing an increase of 10.18 percent. The share of POL in total imports in January, 2013 was 30.45% as against 34.08% in December, 2012 and by 31.68% in January, 2012. During July – January, 2013 its share was 34.45% as against 33.28% in the corresponding period of last year. Variety wise details of imports of POL during July – January, 2013 and the corresponding period of last year are given below:-
(Million Rs.)
Commodity July – January, 2013 July – January, 2012
Total 846,305.42 768,117.87 Petroleum Crude 308,740.09 254,390.20 Motor spirit 93,056.60 78,429.28 Kerosene oil 6,909.34 18,078.83 Diesel oil 3.27 1.60 Lubricating Oils, Greases 6,108.56 5,006.75 Mineral Jelly, Wax 592.20 385.79 Other Petroleum and Petroleum Products 430,895.36 411,825.43

30 Chemicals (Excluding fertilizer, insecticide & medicines) Imports of chemicals (Excluding fertilizer, insecticide & medicines) during January, 2013 valued at Rs. 40,236.95 million was lower by 0.58% compared to December, 2012 Rs. 40,470.81 million while higher by 8.16% compared to January, 2012 Rs. 37,199.76 million. During July – January, 2013 its imports amounted to Rs. 265,952.08 million which was higher by 1.40% compared to imports of Rs. 262,289.15 million during the corresponding period of last year. The share of chemicals (Excluding fertilizer, insecticide & medicines) in total imports in January, 2013 were 10.97% as against 11.34% in December, 2012 and 11.31% in January, 2012. During July – January, 2013 its share was 10.83% as against 11.36% in the corresponding period of last year. Details of imports of chemicals by type during July – January, 2013 and the corresponding period of last year are given below:-
(Million Rs.)
Commodity July – January, 2013 July – January, 2012
Total 265,952.08 262,289.15 Organic chemicals 104,474.43 104,093.02 Inorganic chemicals 29,236.89 28,090.82 Dyeing, tanning and colouring materials 16,646.22 15,969.38 Essential oil perfume and flavour materials 11,214.02 10,188.26 Plastic materials etc. 76,880.26 79,553.66 Other chemical materials and products 27,500.26 24,394.01

31
Machinery Imports of machinery during January, 2013 valued at Rs. 45,569.11 million was lower by 7.18% compared to December, 2012 Rs. 49,093.34 million while higher by 5.18% compared to January, 2012 Rs. 43,326.06 million. Cumulative imports of machinery during the period July – January, 2013 amounted to Rs. 326,624.15 million as against Rs. 289,617.53 million during the corresponding period of last year showing an increase of 12.78 percent. The share of machinery in total imports in January, 2013 was 12.42% as against 13.76% in December, 2012 and by 13.17% in January, 2012. During July – January, 2013 its share was 13.30% as against 12.55% in the corresponding period of last year. Details of imports of machinery during July – January, 2013 and the corresponding period of last year are given below:-
(Million Rs.)
Type of Machinery July – January, 2013
July – January, 2012
Total 326,624.15 289,617.53 1. Power generating machinery and equipment 57,918.96 57,406.90 2. Agricultural machinery and implements excluding tractors 4,788.37 3,188.88 3. Tractors all sorts 1,756.90 3,784.43 4. Textile and leather machinery 22,806.59 23,519.89 5. Construction and mining machinery 8,711.19 7,087.01 6. Metal working machinery 2,095.15 4,136.74 7. Office machines and automatic data processing machines 14,713.00 13,117.68 8. Equipment for distributing electricity 5,038.21 3,936.64 9. Telecommunication apparatus 4,332.06 5,274.99 Other machinery and apparatus 204,463.72 168,164.37

32 Transport Equipment Transport equipment were Rs. 20,445.33 million was imported during January, 2013 as against its imports of Rs. 15,556.83 million in December, 2012 and Rs. 13,839.53 million in January, 2012 showing an increase of 31.42% over December, 2012 and by 47.73% over January, 2012. The imports of this item during July – January, 2013 totaled Rs. 128,163.90million which was higher by 28.34% as compared to its imports of Rs. 99,862.04 million during the corresponding period of last year. The share of transport equipment in total imports in January, 2013 was 5.57% as against 4.36% in December, 2012 and by 4.21% in January, 2012. During July – January, 2013 its share was 5.22% as against the share of 4.33% in the corresponding period of last year. Details of imports of transport equipment during July – January, 2013 and the corresponding period of last year are given below:-
(Million Rs.)
Transport Equipment July – January, 2013
July – January, 2012
Total 128,163.90 99,862.04 Passenger motor vehicles excl. buses 45,447.18 43,220.65 Buses and their chassis with engine 4,473.41 3,223.78 Lorries & trucks (incl. special lorries and their chassis with engine) 2,717.97 3,021.61 Aircrafts 4,589.61 7,078.12 Ships & boats 39,644.18 17,187.14 Railway vehicles 5,623.83 351.52 Motor cycles, scooters 4,412.53 4,794.58 Others 21,255.20 20,984.65

33
III - Direction of Imports
Imports by Territories/Regions and major countries during January, 2013
and July – January, 2013 of current financial year compared with the
corresponding month and corresponding period of last year are given in table 10,
11, 12 and 13 respectively.
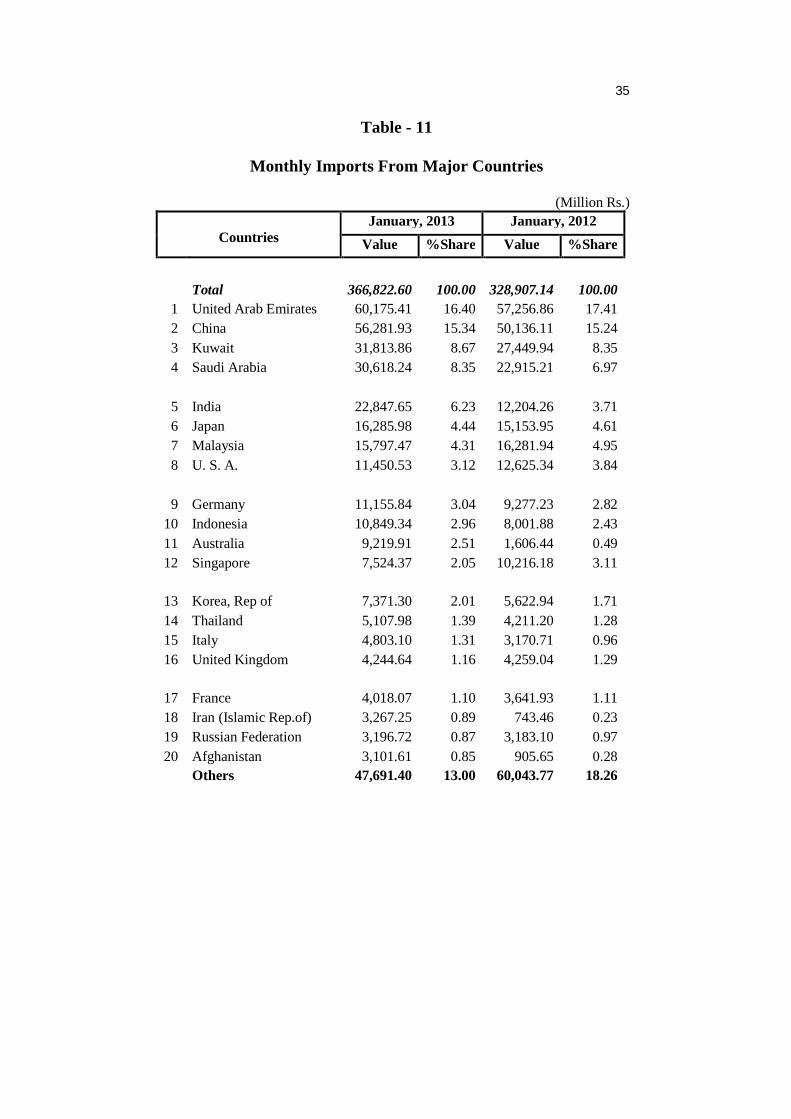
During January, 2013, (10.92%) of total imports were from European
Union. The share of imports of Middle East was 36.10% and North America 3.34
percent. Country-wise, U.A.E was at the top of imports list during January, 2013
followed by China, Kuwait, Saudi Arabia, India and Japan. The combined share
of these six countries during January, 2013 was 59.43% as against their
combined share of 56.29% during January, 2012.
During July – January, 2013, the share of imports of European Union
was 10.76 percent. The share of imports of Middle East was 39.51% and from
North America 3.84% of total imports during this period. Country- wise, U.A.E,
was at the top of the imports list followed by China, Kuwait, Saudi Arabia,
Malaysia and Japan during July – January, 2013. Combined share of these six
countries in total imports during this period was 59.67% as against their
combined share of 62.10% during the corresponding period of last year.

34
Table - 10
Monthly Imports by Territories/Regions
(Million Rs.)
Territories/Regions January, 2013 January, 2012 Value % Share Value % Share
Total 366,822.60 100.00 328,907.14 100.00 1. Latin & Central America 1,102.93 0.30 301.06 0.09 2. South America 2,801.21 0.76 2,671.69 0.81 3. North America 12,259.72 3.34 18,155.52 5.52 4. Eastern Europe 3,549.18 0.97 8,709.07 2.65 5. European Union 40,074.55 10.92 33.024.98 10.04 6. E.F.T.A. 3,019.28 0.82 1,710.41 0.52 7. Other Europe 294.30 0.08 98.78 0.03 8. Middle East 132,424.40 36.10 121,443.44 36.92 i) Asian Countries 131,132.84 35.75 119,971.19 36.48 ii) African Countries 1,291.56 0.35 1,472.25 0.45 9. Other Asia 151,842.53 41.39 129,081.38 39.25 10. Other Africa 9,818.14 2.68 11,706.07 3.56 11. Oceania 9,636.38 2.63 2,004.74 0.61
35
Table - 11
Monthly Imports From Major Countries
(Million Rs.)
Countries
January, 2013 January, 2012 Value %Share Value %Share
Total 366,822.60 100.00 328,907.14 100.00
1 United Arab Emirates 60,175.41 16.40 57,256.86 17.41 2 China 56,281.93 15.34 50,136.11 15.24 3 Kuwait 31,813.86 8.67 27,449.94 8.35 4 Saudi Arabia 30,618.24 8.35 22,915.21 6.97
5 India 22,847.65 6.23 12,204.26 3.71 6 Japan 16,285.98 4.44 15,153.95 4.61 7 Malaysia 15,797.47 4.31 16,281.94 4.95 8 U. S. A. 11,450.53 3.12 12,625.34 3.84
9 Germany 11,155.84 3.04 9,277.23 2.82
10 Indonesia 10,849.34 2.96 8,001.88 2.43 11 Australia 9,219.91 2.51 1,606.44 0.49 12 Singapore 7,524.37 2.05 10,216.18 3.11 13 Korea, Rep of 7,371.30 2.01 5,622.94 1.71 14 Thailand 5,107.98 1.39 4,211.20 1.28 15 Italy 4,803.10 1.31 3,170.71 0.96 16 United Kingdom 4,244.64 1.16 4,259.04 1.29 17 France 4,018.07 1.10 3,641.93 1.11 18 Iran (Islamic Rep.of) 3,267.25 0.89 743.46 0.23 19 Russian Federation 3,196.72 0.87 3,183.10 0.97 20 Afghanistan 3,101.61 0.85 905.65 0.28 Others 47,691.40 13.00 60,043.77 18.26

36
Table - 12
Cumulative Imports by Territories/Regions
(Million Rs.)
Territories/Regions July – January, 2013 July – January, 2012 Value % Share Value % Share
Total 2,456,663.39 100.00 2,308,108.86 100.00 1. Latin & Central America 3,505.98 0.14 2,424.09 0.11 2. South America 20,008.71 0.81 16,015.7 0.69 3. North America 94,233.30 3.84 114,953.38 4.98 4. Eastern Europe 26,362.18 1.07 35,206.86 1.53 5. European Union 264,407.16 10.76 220,815.79 9.57 6. E.F.T.A. 15,896.84 0.65 15,410.08 0.67 7. Other Europe 1,098.77 0.04 4,441.61 0.19 8. Middle East 970,529.82 39.51 920,194.52 39.87 i) Asian Countries 960,140.50 39.08 910,197.03 39.43 ii) African Countries 10,389.32 0.42 9,997.49 0.43 9. Other Asia 944,317.47 38.44 888,062.99 38.48 10. Other Africa 63437.82 2.58 62,505.14 2.71
11. Oceania 52,864.33 2.15 28,079.33 1.22

37
Table - 13
Cumulative Imports From Major Countries
(Million Rs.)
Countries
July – January, 2013
July – January, 2012
Value % Share Value %Share
Total 2,456,663.39 100.00 2,308,108.86 100.00 1 U.A.E. 452,649.95 18.43 436,229.60 18.90 2 China 378,757.51 15.42 347,139.63 15.04 3 Kuwait 220,379.96 8.97 181,440.04 7.86 4 Saudi Arabia 189,704.31 7.72 231,314.31 10.02
5 Malaysia 118,555.79 4.83 136,652.97 5.92 6 Japan 105,714.16 4.30 100,686.86 4.36 7 India 95,892.92 3.90 73,024.74 3.16 8 U.S.A 85,920.92 3.50 78,383.92 3.40
9 Indonesia 72,323.85 2.94 47,556.84 2.06
10 Germany 63,544.74 2.59 54,904.62 2.38 11 Oman 52,886.00 2.15 22,860.82 0.99 12 Australia 50,287.05 2.05 25,373.85 1.10 13 United Kingdom 48,203.45 1.96 28,689.99 1.24 14 Korea Rep. of 39,630.54 1.61 45,972.10 1.99 15 Singapore 36,409.01 1.48 41,854.40 1.81 16 Thailand 35,890.71 1.46 42,287.44 1.83 17 France 27,243.66 1.11 30,055.52 1.30 18 Italy 23,146.34 0.94 23,001.03 1.00 19 Morocco 20,793.59 0.85 21,466.41 0.93 20 Qatar 19,672.60 0.80 13,024.29 0.56 Others 319,056.33 12.99 326,189.48 14.13

38 IV - Imports by Economic Categories
During January, 2013 imports of consumer goods increased by 7.28% and of raw materials for consumer goods by 14.06% compared to January, 2012. Imports of capital goods during January, 2013 increased by 10.08% and of raw material for capital goods by 5.50% compared to the same month of last year. During July – January, 2013 imports of consumer goods was higher by 8.37 and of raw material for consumer goods by 4.33% compared to July – January, 2012. Imports of capital goods during July – January, 2013 increased by 8.70% and of raw material for capital goods by 12.90% compared to the corresponding period of last year. Performance of imports by economic categories is shown in table-14.
Table - 14 Imports by Economic Categories
(Million Rs.)
Economic Category January, 2013
January, 2012
July –January, 2013
July –January, 2012
Total: 366,822.60 328,907.14 2,456,663.39 2,308,108.86 1. Consumer goods 54,515.39 50,815.16 343,664.88 317,114.27
% share in total imports 14.86 15.45 13.99 13.74
2. Raw material for consumer goods 206,825.36 181,327.08 1,376,896.02 1,319,746.83
% share in total imports 56.38 55.13 56.05 57.18
3. Raw material for capital goods 23,898.23 22,652.65 174,063.66 154,181.47
% share in total imports 6.51 6.89 7.09 6.68
4. Capital goods 81,583.62 74,112.25 562,038.83 517,066.30
% share in total imports 22.24 22.53 22.88 22.40
Related Documents