Folia Oeconomica Stetinensia DOI: 10.2478/v10031-008-0028-5 FOREIGN DIRECT INVESTMENTS IN POLAND – REPORT FOR THE END OF 2004 AND NEW FACTS Grażyna Kozuń-Cieślak, Ph.D. Faculty of Economics Technical University of Radom 31 Chrobrego Str. 26-600 Radom email: [email protected] Received 7 October 2008, Accepted 12 December 2008 Abstract Joining the European Union is regarded as a chance for Poland to improve its economic growth and to catch up the EU-15 wealth level. However, it is necessary to remember that this is going to be a difficult and long-lasting process, where success is possible only on the condition that suitable economic policy is implemented. Such policy should provide stable frameworks to support business development, attract foreign direct investments (FDI), keep the discipline in public finances and assure the right institutional ability and managerial skills to absorb the EU funds. In the study: FDI inflows to Poland and other new EU member states have been evaluated from the viewpoint of the size of the economy represented by its GDP per capita; The amount of FDI inward stock in Poland over the years 1993-2004 and its structure from the viewpoint of the investor’s country of origin and sector of allocation have been evaluated (data published by PAIiIZ); The activity of foreign capital in special economic zones (SEZ), entrepreneurship-supporting enclaves in the regions characterised by extremely difficult socio-economic conditions, has been identified; FDI inflows to Poland in 2005-2007 (data published by NBP) have been presented. According to the estimates, appropriate economic transformation in Poland and keeping a 5% economic growth rate in Poland require approx. USD 10 billion of annual FDI inflow. With regard to those forecasts, the amount of FDI inflow to Poland seems to be insufficient to keep the desired economic growth rate, and the investment incentives in the form of special economic zones do not meet expectations. Keywords: development, foreign direct investments, special economic zones. JEL classification: F21, O16, R38. Unauthenticated | 83.9.151.118 Download Date | 12/29/13 4:38 PM

Welcome message from author
This document is posted to help you gain knowledge. Please leave a comment to let me know what you think about it! Share it to your friends and learn new things together.
Transcript
Folia Oeconomica Stetinensia
DOI: 10.2478/v10031-008-0028-5
FOREIGN DIRECT INVESTMENTS IN POLAND –
REPORT FOR THE END OF 2004 AND NEW FACTS
Grażyna Kozuń-Cieślak, Ph.D.
Faculty of Economics Technical University of Radom 31 Chrobrego Str. 26-600 Radom email: [email protected]
Received 7 October 2008, Accepted 12 December 2008
Abstract
Joining the European Union is regarded as a chance for Poland to improve its economic growth and to catch up the EU-15 wealth level. However, it is necessary to remember that this is going to be a difficult and long-lasting process, where success is possible only on the condition that suitable economic policy is implemented. Such policy should provide stable frameworks to support business development, attract foreign direct investments (FDI), keep the discipline in public finances and assure the right institutional ability and managerial skills to absorb the EU funds. In the study:
FDI inflows to Poland and other new EU member states have been evaluated from the viewpoint of the size of the economy represented by its GDP per capita;
The amount of FDI inward stock in Poland over the years 1993-2004 and its structure from the viewpoint of the investor’s country of origin and sector of allocation have been evaluated (data published by PAIiIZ);
The activity of foreign capital in special economic zones (SEZ), entrepreneurship-supporting enclaves in the regions characterised by extremely difficult socio-economic conditions, has been identified;
FDI inflows to Poland in 2005-2007 (data published by NBP) have been presented. According to the estimates, appropriate economic transformation in Poland and keeping a 5% economic growth rate in Poland require approx. USD 10 billion of annual FDI inflow. With regard to those forecasts, the amount of FDI inflow to Poland seems to be insufficient to keep the desired economic growth rate, and the investment incentives in the form of special economic zones do not meet expectations.
Keywords: development, foreign direct investments, special economic zones.
JEL classification: F21, O16, R38.
Unauthenticated | 83.9.151.118Download Date | 12/29/13 4:38 PM
64 Grażyna Kozuń-Cieślak
1. Research Object and Definitions
Research object: According to OECD benchmark definition, a direct investment enterprise is
an incorporated or unincorporated enterprise in which a foreign investor owns 10 per cent or
more of the ordinary shares or voting power of an incorporated enterprise or the equivalent of
an unincorporated enterprise. The numerical guideline of ownership of 10 per cent of ordinary
shares or voting stock determines the existence of a direct investment relationship. An
effective voice in the management, as evidenced by an ownership of at least 10 per cent,
implies that the direct investor is able to influence or participate in the management of an
enterprise; it does not require absolute control by the foreign investor1.
According to the definition adopted by the United Nations Conference on Trade and
Development, and applied also by the Polish Information and Foreign Investment Agency:
FDI inflows comprise the capital provided (either directly or through other related
enterprises) by a foreign direct investor to an FDI enterprise, or the capital received by a
foreign direct investor from an FDI enterprise. FDI includes the three following components:
equity capital, reinvested earnings and intra-company loans.
Equity capital is the foreign direct investor's purchase of shares of an enterprise in a
country other than that of its residence.
Reinvested earnings comprise the direct investor's share (in proportion to direct equity
participation) of earnings not distributed as dividends by affiliates or earnings not
remitted to the direct investor. Such retained profits by affiliates are reinvested.
Intra-company loans or intra-company debt transactions refer to short- or long-term
borrowing and lending of funds between direct investors (parent enterprises) and
affiliate enterprises.
FDI stock is the value of the share of their capital and reserves (including retained
profits) attributable to the parent enterprise, plus the net indebtedness of affiliates to the
parent enterprises2.
Source of statistical data: data provided by the Polish Information and Foreign Investment
Agency (PAIiIZ).
Spatial range: Poland (and new EU member states as benchmarks, selectively).
Time range: years 1993-2004.
Unauthenticated | 83.9.151.118Download Date | 12/29/13 4:38 PM
Foreign Direct Investments in Poland 65
Since 2006 Polish Information and Foreign Investment Agency (PAIiIZ) no longer
publishes the value of foreign direct investments inflow to Poland. Data on FDI inflow (its
structure and amounts of payments due to foreign investments) are published now by National
Bank of Poland (NBP). Because of methodological differences it is not possible to compare
data published by NBP with those published by PAIiIZ. Closing data collected by PAIiIZ
concerns 2004.
2. Economic Development and FDI
According to the estimates, appropriate economic transformation in Poland and
keeping a 5% economic growth rate in Poland require approx. USD 10 billion of annual FDI
inflow3.
The relationship between FDI and economic growth has two aspects: FDI stimulates
economic growth, but also reacts to economic growth and progress of transformation. Growth
is generated by FDI through imported means of investment, new technologies and capabilities
transferred by foreign multinationals and international networking. On the other hand, foreign
investors react positively to the consolidation of market-economy rules and the resumption of
economic growth4. High technology is of particular importance as it supports technological
development, value creation, enhancement of staff qualifications, improvement in
management quality, better competitiveness of enterprises, regions, related sectors and the
whole economy. The form of FDI is relevant just next to its sector structure – the variety of
organisational forms contributes significantly to the creation of new jobs, structure of the
economy and development of individual regions (greenfield investments are particularly
desired as well as other export-supporting projects). Another important factor related to FDI
inflow is its proper portfolio by the investor’s country of origin5.
Unauthenticated | 83.9.151.118Download Date | 12/29/13 4:38 PM
66 Grażyna Kozuń-Cieślak
Cyprus
Czech Republic
Estonia
Hungary
Latvia
Lithuania
Malta
Poland
Slovakia
y = 20561Ln(x) - 187228
R2 = 0,8607
0
5000
10000
15000
20000
25000
5000 10000 15000 20000 25000 30000
GDP per capita
FDI p
er c
apit
a
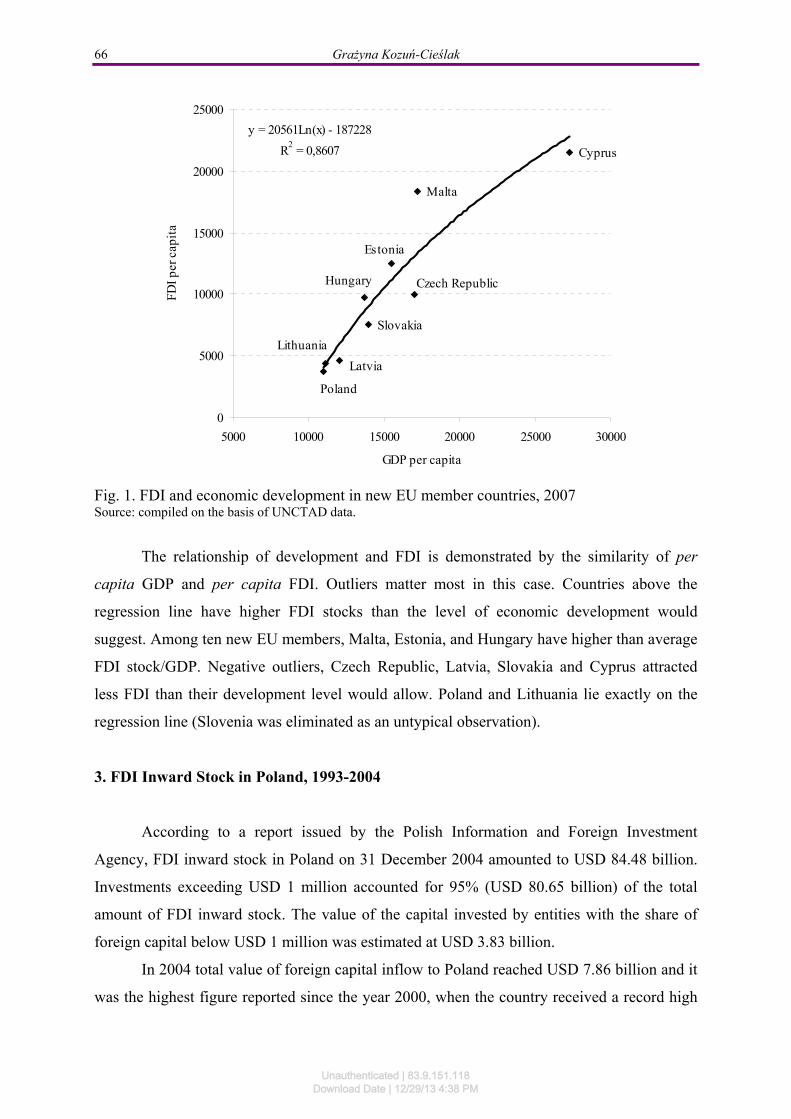
Fig. 1. FDI and economic development in new EU member countries, 2007 Source: compiled on the basis of UNCTAD data.
The relationship of development and FDI is demonstrated by the similarity of per
capita GDP and per capita FDI. Outliers matter most in this case. Countries above the
regression line have higher FDI stocks than the level of economic development would
suggest. Among ten new EU members, Malta, Estonia, and Hungary have higher than average
FDI stock/GDP. Negative outliers, Czech Republic, Latvia, Slovakia and Cyprus attracted
less FDI than their development level would allow. Poland and Lithuania lie exactly on the
regression line (Slovenia was eliminated as an untypical observation).
3. FDI Inward Stock in Poland, 1993-2004
According to a report issued by the Polish Information and Foreign Investment
Agency, FDI inward stock in Poland on 31 December 2004 amounted to USD 84.48 billion.
Investments exceeding USD 1 million accounted for 95% (USD 80.65 billion) of the total
amount of FDI inward stock. The value of the capital invested by entities with the share of
foreign capital below USD 1 million was estimated at USD 3.83 billion.
In 2004 total value of foreign capital inflow to Poland reached USD 7.86 billion and it
was the highest figure reported since the year 2000, when the country received a record high
Unauthenticated | 83.9.151.118Download Date | 12/29/13 4:38 PM
Foreign Direct Investments in Poland 67
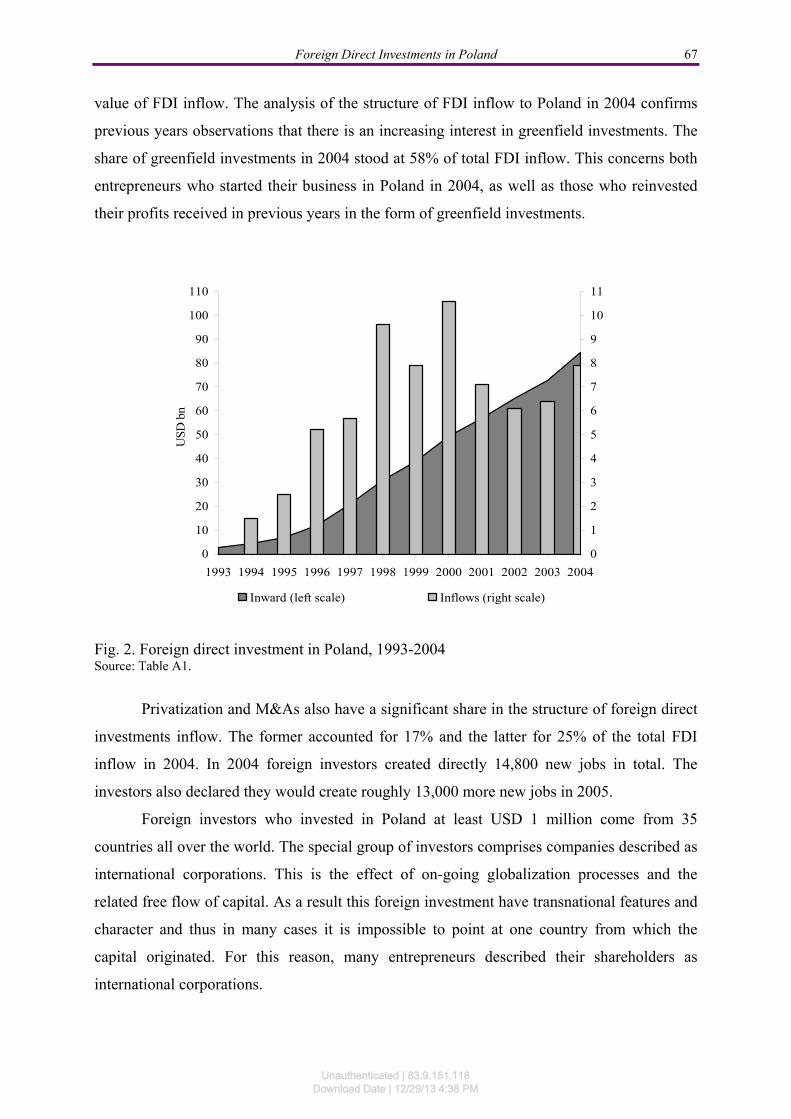
value of FDI inflow. The analysis of the structure of FDI inflow to Poland in 2004 confirms
previous years observations that there is an increasing interest in greenfield investments. The
share of greenfield investments in 2004 stood at 58% of total FDI inflow. This concerns both
entrepreneurs who started their business in Poland in 2004, as well as those who reinvested
their profits received in previous years in the form of greenfield investments.
0
10
20
30
40
50
60
70
80
90
100
110
1993 1994 1995 1996 1997 1998 1999 2000 2001 2002 2003 2004
USD
bn
0
1
2
3
4
5
6
7
8
9
10
11
Inward (left scale) Inflows (right scale)
Fig. 2. Foreign direct investment in Poland, 1993-2004 Source: Table A1.
Privatization and M&As also have a significant share in the structure of foreign direct
investments inflow. The former accounted for 17% and the latter for 25% of the total FDI
inflow in 2004. In 2004 foreign investors created directly 14,800 new jobs in total. The
investors also declared they would create roughly 13,000 more new jobs in 2005.
Foreign investors who invested in Poland at least USD 1 million come from 35
countries all over the world. The special group of investors comprises companies described as
international corporations. This is the effect of on-going globalization processes and the
related free flow of capital. As a result this foreign investment have transnational features and
character and thus in many cases it is impossible to point at one country from which the
capital originated. For this reason, many entrepreneurs described their shareholders as
international corporations.
Unauthenticated | 83.9.151.118Download Date | 12/29/13 4:38 PM
68 Grażyna Kozuń-Cieślak
- 1 2 3 4 5 6 7 8 9 10 11 12 13 14 15 16
France
Netherlands
USA
Germany
International
Great Britain
Italy
Sweden
Belgium
Denmark
Switzerland
Austria
S. Korea
Cyprus
Ireland
Other 21 countries
USD bn
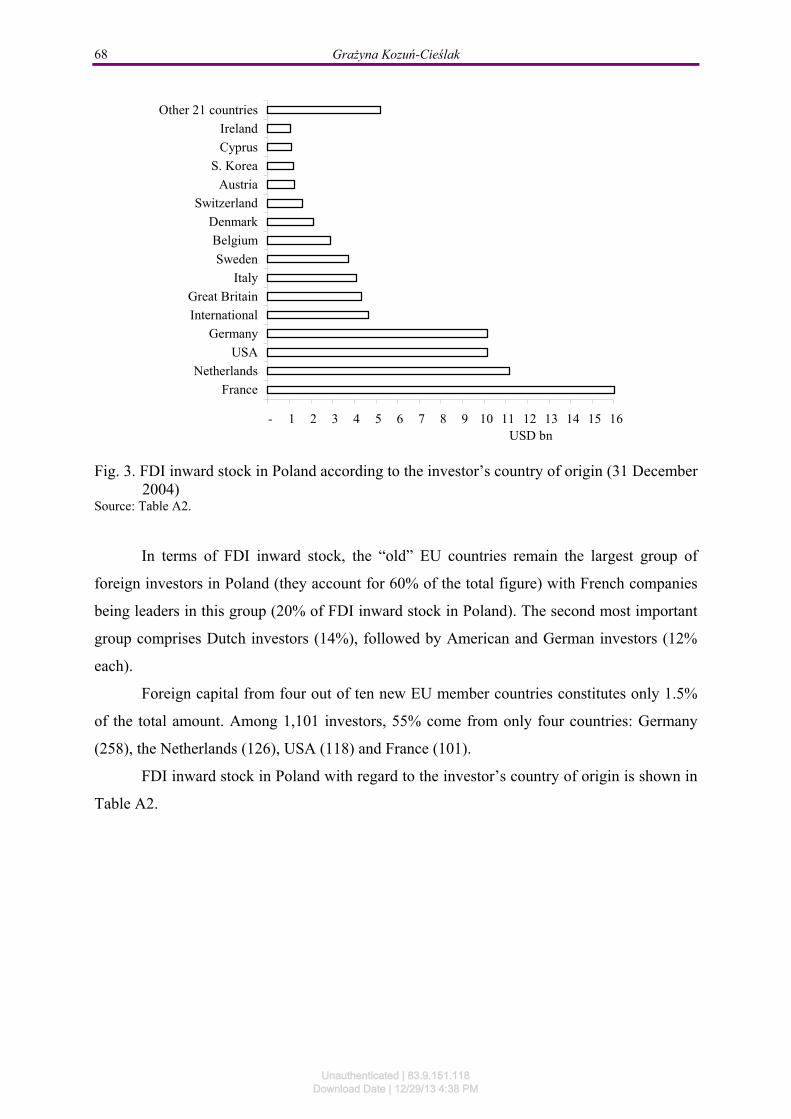
Fig. 3. FDI inward stock in Poland according to the investor’s country of origin (31 December 2004)
Source: Table A2.
In terms of FDI inward stock, the “old” EU countries remain the largest group of
foreign investors in Poland (they account for 60% of the total figure) with French companies
being leaders in this group (20% of FDI inward stock in Poland). The second most important
group comprises Dutch investors (14%), followed by American and German investors (12%
each).
Foreign capital from four out of ten new EU member countries constitutes only 1.5%
of the total amount. Among 1,101 investors, 55% come from only four countries: Germany
(258), the Netherlands (126), USA (118) and France (101).
FDI inward stock in Poland with regard to the investor’s country of origin is shown in
Table A2.
Unauthenticated | 83.9.151.118Download Date | 12/29/13 4:38 PM
Foreign Direct Investments in Poland 69
France20%
Netherlands 14%
USA13%
Germany13%
Other 32 countries
40%
Fig. 4. Major foreign investors in Poland by the country of origin (as of 31 December 2004) Source: Table A2.
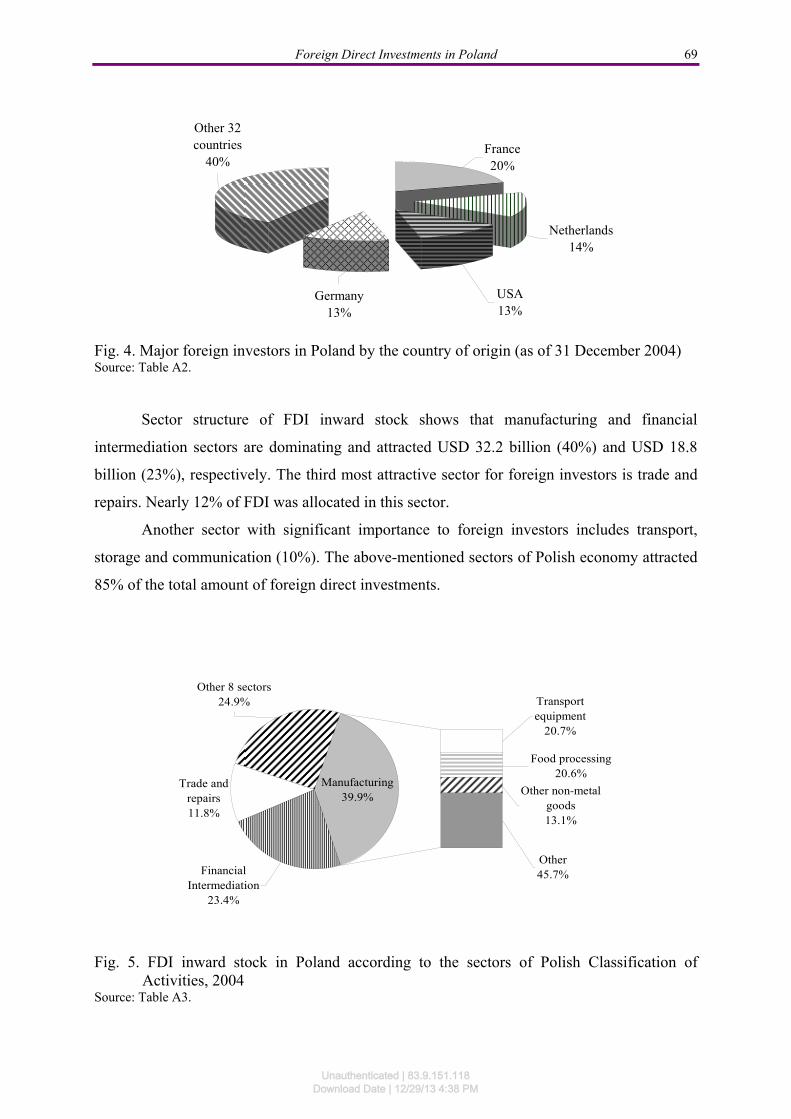
Sector structure of FDI inward stock shows that manufacturing and financial
intermediation sectors are dominating and attracted USD 32.2 billion (40%) and USD 18.8
billion (23%), respectively. The third most attractive sector for foreign investors is trade and
repairs. Nearly 12% of FDI was allocated in this sector.
Another sector with significant importance to foreign investors includes transport,
storage and communication (10%). The above-mentioned sectors of Polish economy attracted
85% of the total amount of foreign direct investments.
Financial Intermediation
23.4%
Trade and repairs11.8%
Other 8 sectors24.9% Transport
equipment20.7%
Food processing20.6%
Other non-metal goods13.1%
Other45.7%
Manufacturing39.9%
Fig. 5. FDI inward stock in Poland according to the sectors of Polish Classification of Activities, 2004
Source: Table A3.
Unauthenticated | 83.9.151.118Download Date | 12/29/13 4:38 PM
70 Grażyna Kozuń-Cieślak
Special stress should be put on the two manufacturing subsectors: transport equipment
and food processing, which attracted most of the investments – 21% of total investments in
the manufacturing sector each. Significant share in attracting foreign capital is owned also by
the “other non-metal goods” subsector (its share in the total capital allocated in the
manufacturing sector amounts to roughly 13%). FDI inward stock in Poland according to
Polish Classification of Activities (PKD) is shown in Table A3.
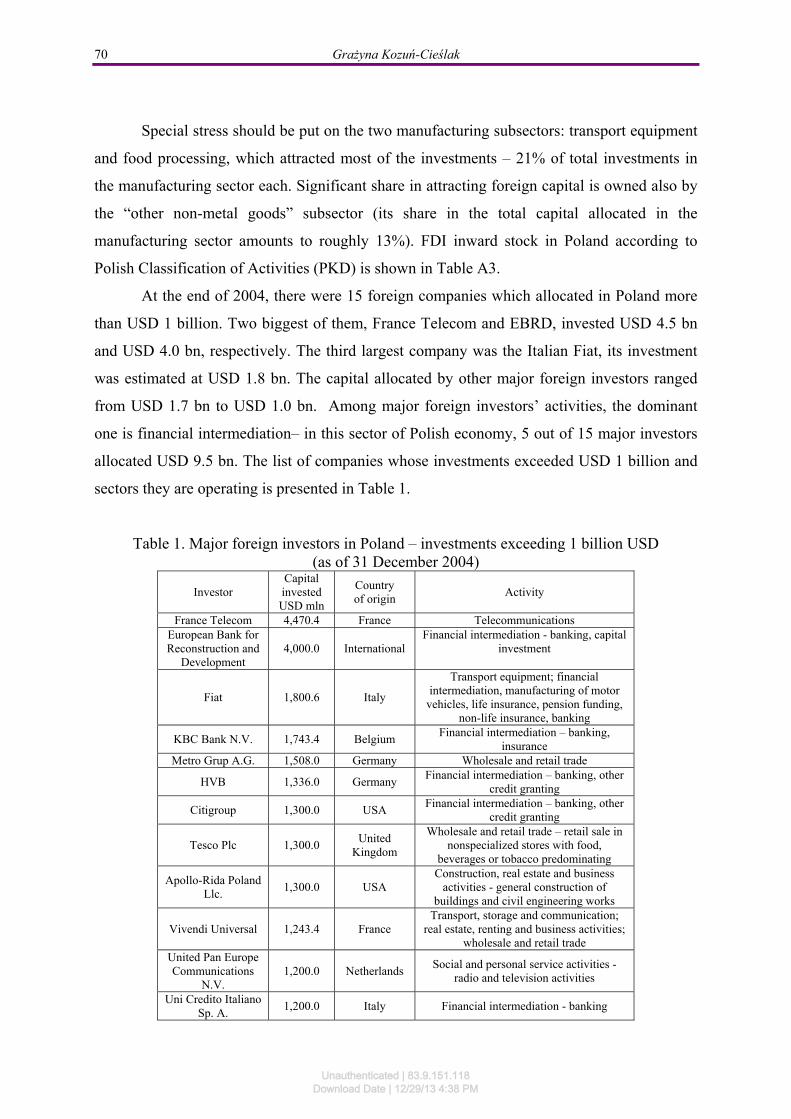
At the end of 2004, there were 15 foreign companies which allocated in Poland more
than USD 1 billion. Two biggest of them, France Telecom and EBRD, invested USD 4.5 bn
and USD 4.0 bn, respectively. The third largest company was the Italian Fiat, its investment
was estimated at USD 1.8 bn. The capital allocated by other major foreign investors ranged
from USD 1.7 bn to USD 1.0 bn. Among major foreign investors’ activities, the dominant
one is financial intermediation– in this sector of Polish economy, 5 out of 15 major investors
allocated USD 9.5 bn. The list of companies whose investments exceeded USD 1 billion and
sectors they are operating is presented in Table 1.
Table 1. Major foreign investors in Poland – investments exceeding 1 billion USD (as of 31 December 2004)
Investor Capital invested USD mln
Country of origin
Activity
France Telecom 4,470.4 France Telecommunications European Bank for Reconstruction and
Development 4,000.0 International
Financial intermediation - banking, capital investment
Fiat 1,800.6 Italy
Transport equipment; financial intermediation, manufacturing of motor
vehicles, life insurance, pension funding, non-life insurance, banking
KBC Bank N.V. 1,743.4 Belgium Financial intermediation – banking,
insurance Metro Grup A.G. 1,508.0 Germany Wholesale and retail trade
HVB 1,336.0 Germany Financial intermediation – banking, other
credit granting
Citigroup 1,300.0 USA Financial intermediation – banking, other
credit granting
Tesco Plc 1,300.0 United
Kingdom
Wholesale and retail trade – retail sale in nonspecialized stores with food,
beverages or tobacco predominating
Apollo-Rida Poland Llc.
1,300.0 USA Construction, real estate and business
activities - general construction of buildings and civil engineering works
Vivendi Universal 1,243.4 France Transport, storage and communication;
real estate, renting and business activities; wholesale and retail trade
United Pan Europe Communications
N.V. 1,200.0 Netherlands
Social and personal service activities - radio and television activities
Uni Credito Italiano Sp. A.
1,200.0 Italy Financial intermediation - banking
Unauthenticated | 83.9.151.118Download Date | 12/29/13 4:38 PM
Foreign Direct Investments in Poland 71
Kronospan Holdings Ltd.
1,061.8 Cyprus Manufacture of wood and wooden
products Vattenfall AB 1,029.2 Sweden production and distribution of electricity,
steam and hot water supply General Motors
Corporation 1,010.0 USA manufacture of motor vehicles
Source: The List of Major Foreign Investors in Poland, December 2004, PAIiIZ (http://www.paiz.pl).
4. FDI Inflows to Poland in 2004
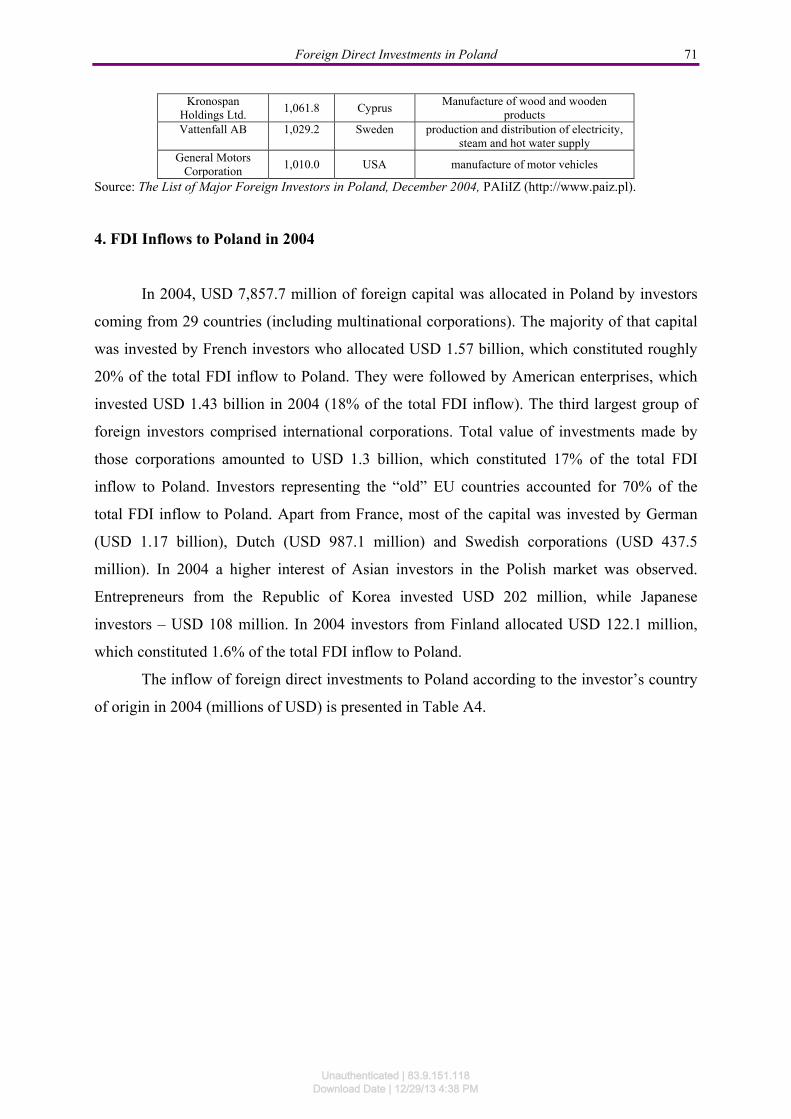
In 2004, USD 7,857.7 million of foreign capital was allocated in Poland by investors
coming from 29 countries (including multinational corporations). The majority of that capital
was invested by French investors who allocated USD 1.57 billion, which constituted roughly
20% of the total FDI inflow to Poland. They were followed by American enterprises, which
invested USD 1.43 billion in 2004 (18% of the total FDI inflow). The third largest group of
foreign investors comprised international corporations. Total value of investments made by
those corporations amounted to USD 1.3 billion, which constituted 17% of the total FDI
inflow to Poland. Investors representing the “old” EU countries accounted for 70% of the
total FDI inflow to Poland. Apart from France, most of the capital was invested by German
(USD 1.17 billion), Dutch (USD 987.1 million) and Swedish corporations (USD 437.5
million). In 2004 a higher interest of Asian investors in the Polish market was observed.
Entrepreneurs from the Republic of Korea invested USD 202 million, while Japanese
investors – USD 108 million. In 2004 investors from Finland allocated USD 122.1 million,
which constituted 1.6% of the total FDI inflow to Poland.
The inflow of foreign direct investments to Poland according to the investor’s country
of origin in 2004 (millions of USD) is presented in Table A4.
Unauthenticated | 83.9.151.118Download Date | 12/29/13 4:38 PM
72 Grażyna Kozuń-Cieślak
other 25 countries
30%
France 20%Germany
15%
Multinatio-nals 17%
USA 18%
Fig. 6. Percentage share in total FDI inflow of foreign direct investment to Poland according to the investor’s country of origin in 2004
Source: Table A4.
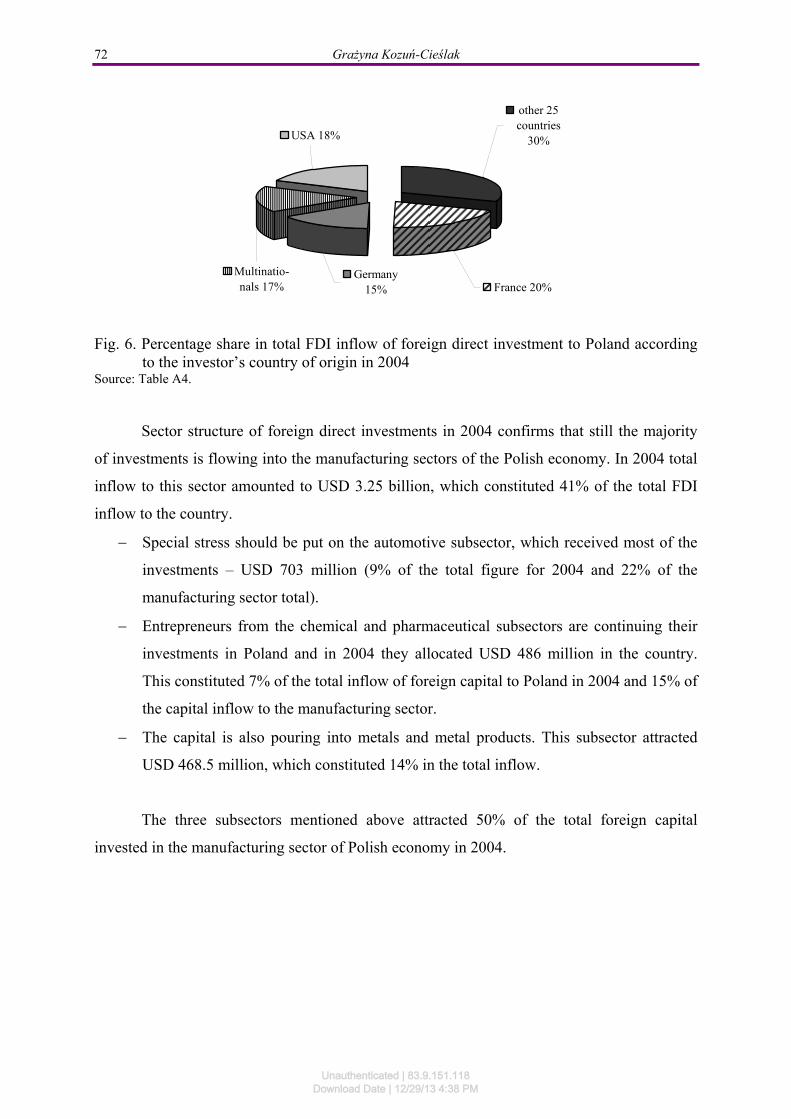
Sector structure of foreign direct investments in 2004 confirms that still the majority
of investments is flowing into the manufacturing sectors of the Polish economy. In 2004 total
inflow to this sector amounted to USD 3.25 billion, which constituted 41% of the total FDI
inflow to the country.
Special stress should be put on the automotive subsector, which received most of the
investments – USD 703 million (9% of the total figure for 2004 and 22% of the
manufacturing sector total).
Entrepreneurs from the chemical and pharmaceutical subsectors are continuing their
investments in Poland and in 2004 they allocated USD 486 million in the country.
This constituted 7% of the total inflow of foreign capital to Poland in 2004 and 15% of
the capital inflow to the manufacturing sector.
The capital is also pouring into metals and metal products. This subsector attracted
USD 468.5 million, which constituted 14% in the total inflow.
The three subsectors mentioned above attracted 50% of the total foreign capital
invested in the manufacturing sector of Polish economy in 2004.
Unauthenticated | 83.9.151.118Download Date | 12/29/13 4:38 PM
Foreign Direct Investments in Poland 73
Other 7 sectors9.9%
Financial Intermediation
26.9%
Real estate and business activities
11.0%
Trade and repairs10.8%
Transport equipment
21.6%Chemicals and
chemical products 14.9%
Metals and metal products
14.4%Others49.1%
Manufacturing41.4%
Fig. 7. FDI inflows to Poland in 2004 according to the sectors of Polish Classification of
Activities Source: Table A5.
The second most attractive sector for foreign investors is broadly understood financial
intermediation. In 2004 investors allocated USD 2.1 billion in this sector, which constituted
27% of the total FDI inflow to Poland. Foreign direct investments were also flowing to the
real estate sector and trade and repairs, the value of investments in these sectors is estimated
at the level of USD 865.5 million and USD 848.5 million, respectively. Those sectors
attracted roughly 90% of foreign capital invested in Poland in 2004. The inflow of foreign
investment to Poland according to the sectors of Polish Classification of Activities (PKD) in
the year 2004 is presented in Table A5.
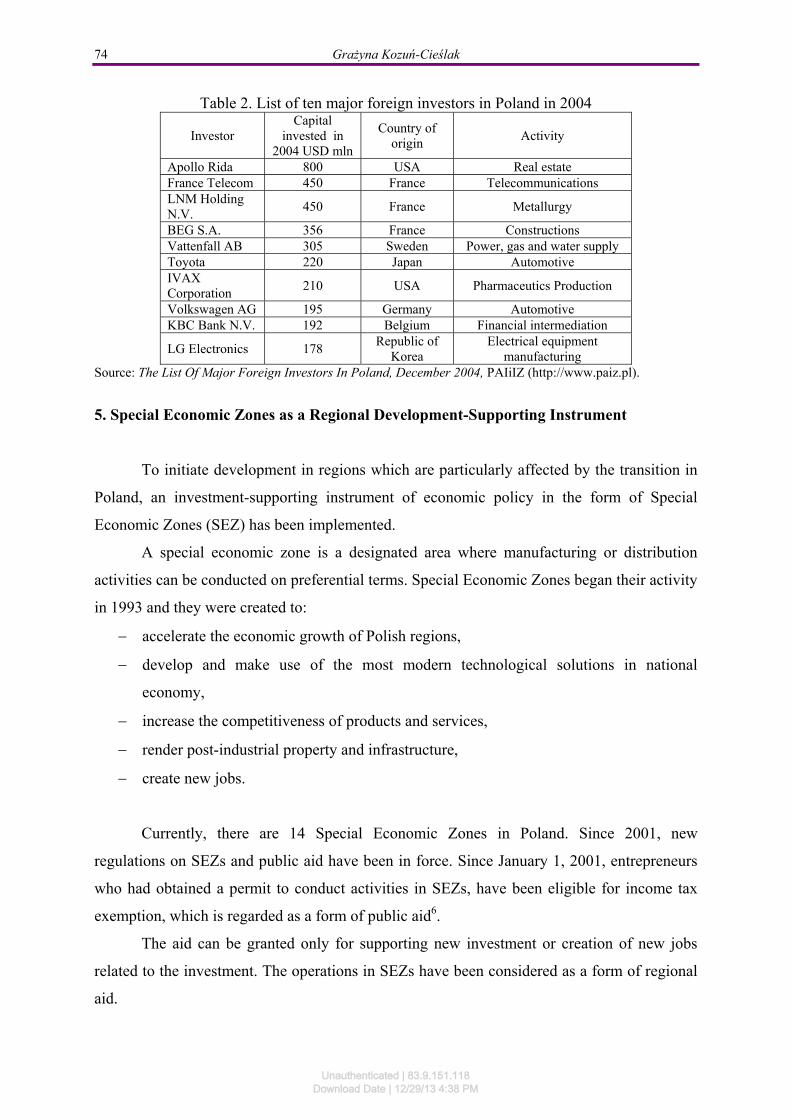
Among 10 major investors in 2004 there were 5 companies from EU countries, as well
as three Asian and two American enterprises. The American Apollo Rida was the biggest
investor in 2004 in Poland, and its investment into real estate was estimated to USD 800
million. The second largest investor was France Telecom (USD 450 million) and the third - an
Indian company LNM Holding N.V which invested USD 390 million into metallurgy.
Unauthenticated | 83.9.151.118Download Date | 12/29/13 4:38 PM
74 Grażyna Kozuń-Cieślak
Table 2. List of ten major foreign investors in Poland in 2004
Investor Capital
invested in 2004 USD mln
Country of origin
Activity
Apollo Rida 800 USA Real estate France Telecom 450 France Telecommunications LNM Holding N.V.
450 France Metallurgy
BEG S.A. 356 France Constructions Vattenfall AB 305 Sweden Power, gas and water supply Toyota 220 Japan Automotive IVAX Corporation
210 USA Pharmaceutics Production
Volkswagen AG 195 Germany Automotive KBC Bank N.V. 192 Belgium Financial intermediation
LG Electronics 178 Republic of
Korea Electrical equipment
manufacturing Source: The List Of Major Foreign Investors In Poland, December 2004, PAIiIZ (http://www.paiz.pl).
5. Special Economic Zones as a Regional Development-Supporting Instrument
To initiate development in regions which are particularly affected by the transition in
Poland, an investment-supporting instrument of economic policy in the form of Special
Economic Zones (SEZ) has been implemented.
A special economic zone is a designated area where manufacturing or distribution
activities can be conducted on preferential terms. Special Economic Zones began their activity
in 1993 and they were created to:
accelerate the economic growth of Polish regions,
develop and make use of the most modern technological solutions in national
economy,
increase the competitiveness of products and services,
render post-industrial property and infrastructure,
create new jobs.
Currently, there are 14 Special Economic Zones in Poland. Since 2001, new
regulations on SEZs and public aid have been in force. Since January 1, 2001, entrepreneurs
who had obtained a permit to conduct activities in SEZs, have been eligible for income tax
exemption, which is regarded as a form of public aid6.
The aid can be granted only for supporting new investment or creation of new jobs
related to the investment. The operations in SEZs have been considered as a form of regional
aid.
Unauthenticated | 83.9.151.118Download Date | 12/29/13 4:38 PM
Foreign Direct Investments in Poland 75
Regional aid is aimed at the initiation of long-term development of the regions
characterised by the GDP per capita level below 60% of the EU average.
The amount of that aid for individual regions is determined by various factors such as:
unemployment, changes in its level and structure, GDP, demographic factors, condition of
infrastructure.
The legal regulations concerning regional aid allow for the return of invested capital in
the form of income tax exemptions in the maximum amount limited by the aid intensity
indicator for given region and the limit of 50% of eligible costs for big enterprises, 55% for
medium-sized7 and 65% for small enterprises8. The amount of regional aid for creation of
new jobs is estimated on the basis of staff costs (gross salaries and salary-related costs borne
within two years from the moment the number of jobs required by the exemption is created).
In general, the intensity of the aid granted on the majority of Poland’s territory is 50%,
except for:
Kraków, Wrocław and the Gdańsk-Sopot-Gdynia Agglomeration: 40%,
Warsaw and Poznań: 30%.
Appropriate regulations specify the following conditions for SEZ entrepreneurs to be
entitled to benefit from regional aid:
Investment of a minimum of EUR 100,000;
Business activities related to that investment conducted for at least 5 years from the
date the aid was granted;
The newly created jobs maintained for at least 5 years (regional aid for employment).
If the entrepreneur is a foreign entity, as defined by the Polish law, in order to
purchase land in a SEZ they must obtain a permit from the Minister of Interior and
Administration.
The income tax exemption is the most important incentive available in the SEZs.
Nevertheless, the entrepreneurs can also benefit from other incentives, both tax-related and
other. Forms of tax reliefs and other incentives to encourage investment in the SEZs are
shown in the table below.
According to the end-December 2004 data, the total area of SEZs in Poland amounted
to 6,529.3 ha. After 10 years of operations, the areas within the zones were developed in 55%.
Unauthenticated | 83.9.151.118Download Date | 12/29/13 4:38 PM
76 Grażyna Kozuń-Cieślak
679 permits for business operations in the area were granted, and employment reached
77,570, and as such was still far from the targeted 166,000.
Table 3. Forms of tax reliefs and incentives to encourage investment in the SEZs Forms of relief and incentives Characteristics
Reg
iona
l Aid
The value of the aid cannot exceed the maximum intensity of aid for a given region of Poland, as stipulated in the public aid regulations. The intensity indicates the allowable share of regional aid in the costs (investment expenditure) that qualify the investor for being covered by such aid. The intensity of 50% means that, when investing in the zones, entrepreneurs may obtain aid in an amount not exceeding 50% of all eligible costs (investment expenditure). For small and medium enterprises the index is higher by 15 percentage points (i.e. 65% and 55% respectively).
to s
uppo
rt n
ew in
vest
men
t pro
ject
s
The amount of regional aid for new investment projects depends on the amount, nature and structure of investment expenditure of a given enterprise. To determine the amount of regional aid for investment projects it is necessary to establish the level of qualifying costs on the basis of investment expenditure of a given enterprise. The qualifying costs include the following types of expenditure: - purchase of land - expenditure on buildings and structures - expenditure on equipping the facilities with tangible assets (machinery and devices, tools and instruments, equipment for office work, technical infrastructure). The qualifying costs may also include expenditure on the purchase of intangible assets, within the limits stipulated in respective regulations9.
for
crea
tion
of
new
jobs
The amount of regional aid allocated to job creation is calculated on the basis of two-years’ costs of labour of newly employed staff borne by the entrepreneur, which consist of gross payroll costs and all mandatory charges relating to the employment10.
Non
-tax
Inc
entiv
es
Related to Investment Procedures in the SEZs
These include in particular: - Full preparation of the plot of land for a given investment project; - Preferential price for the plot of land; - The accelerated procedure for issuing a permit to purchase real estate (within 1 month); - Free-of-charge assistance in handling various formalities, actions and obligations.
Related to Employment of New Employees
There are various types of instruments (such as reimbursement of expenditures borne or in the form of a loan) aimed at supporting the hire of new employees.
Unauthenticated | 83.9.151.118Download Date | 12/29/13 4:38 PM
Foreign Direct Investments in Poland 77
Rel
ief
in Real Estate Tax The relief is of general nature (for a group of entrepreneurs meeting certain preconditions). Reliefs are granted by the local authorities,
in Tax on Means of Transport
In Customs Duty
The Polish customs law offers numerous incentives for entrepreneurs, such as: - Customs duty exemptions; - Economic customs procedures; - Operations in duty free areas; - Facilitated payments; - Exemption from the obligation to place security for customs duty and tax liabilities.
Source: Poland Special Economic Zones – a unique investment opportunity, PAIiIZ, December, 2003.
0% 10 20 30 40 50 60 70 80 90 100
Tarnobrzeg SEZ
Warminsko – Mazurska SEZ
Krakow SEZ
Kostrzyn – Słubice SEZ
Kamienna Gora SEZ
Slupsk SEZ
Starachowice SEZ
Legnica SEZ
Katowice SEZ
Lodz SEZ
Suwalki SEZ
Pomerania SEZ
Walbrzych SEZ
Mielec SEZ
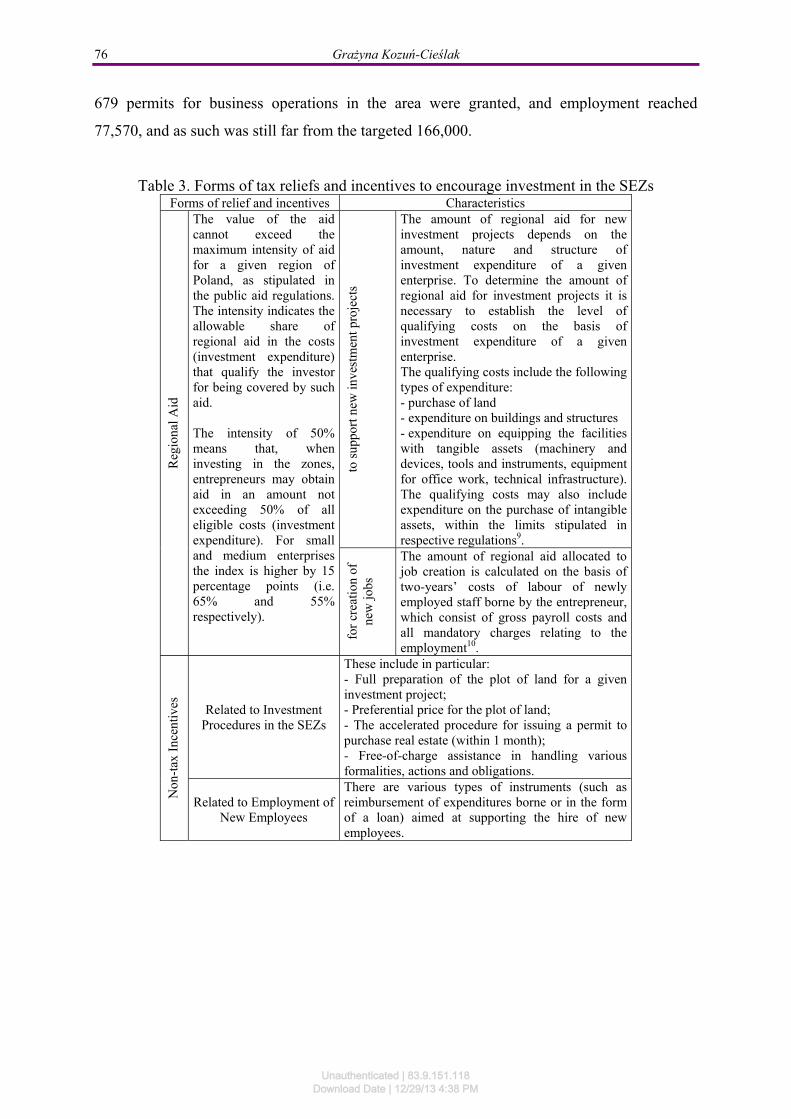
Fig. 8. Development of Special Economic Zones (as of 31.12.2004) Source: Table A6.
The most active SEZs were: the Mielec SEZ (79% development of the area and
employment 66% above the target), Walbrzych SEZ (74% development of the area and
employment 80% above the target), and Pomerania SEZ (71% development of the area and
employment nearly twice above the target). The biggest area (827 ha) belongs to the Katowice
SEZ, where employment, at more than 17,000, is at also the highest level, which accounts for
over 22% of the jobs created in Special Economic Zones.
Table 4. Total employment and investment in Special Economic Zones in Poland in 2004
SEZ Total employment Total amount of
investment in PLN mln (31.12.2004) plan
actual 31.12.2004
execution of plan in %
Mielec 7,000 11,588 166 2,240.5 Katowice 40,000 17,374 43 6,631.9 Suwalki 15,000 3,235 22 399.9 Lodz 10,000 3,061 31 1,191.7
Unauthenticated | 83.9.151.118Download Date | 12/29/13 4:38 PM
78 Grażyna Kozuń-Cieślak
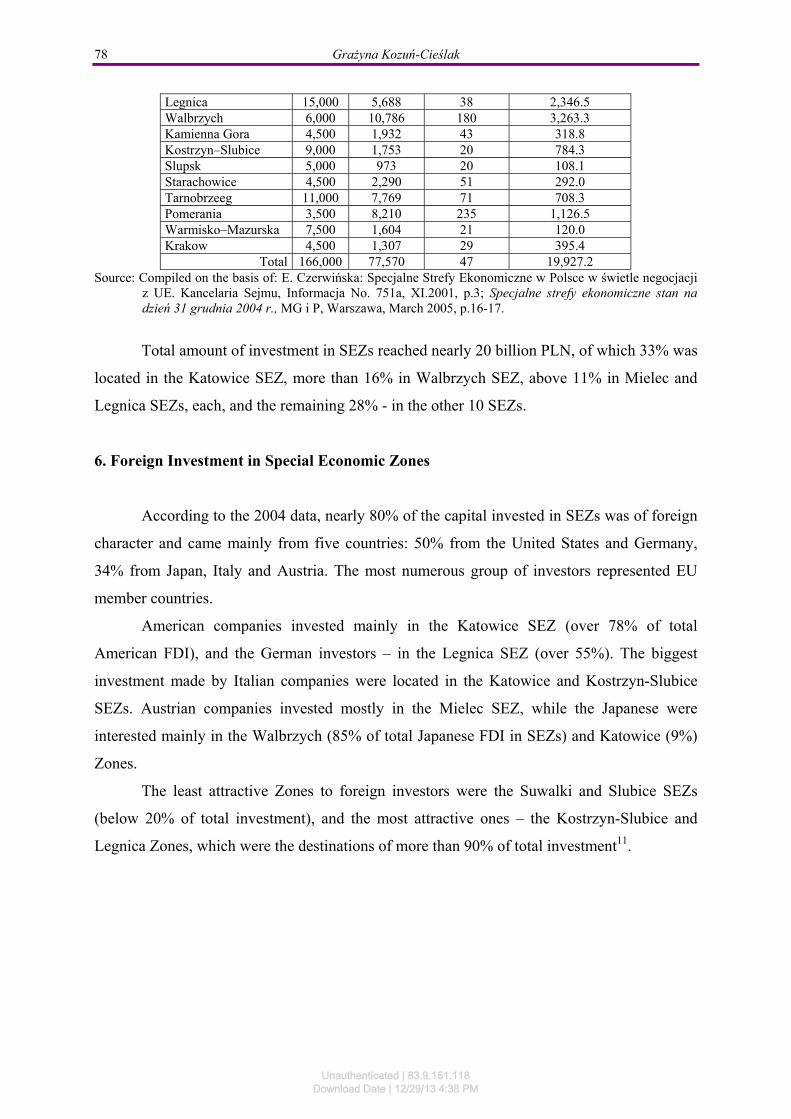
Legnica 15,000 5,688 38 2,346.5 Walbrzych 6,000 10,786 180 3,263.3 Kamienna Gora 4,500 1,932 43 318.8 Kostrzyn–Slubice 9,000 1,753 20 784.3 Slupsk 5,000 973 20 108.1 Starachowice 4,500 2,290 51 292.0 Tarnobrzeeg 11,000 7,769 71 708.3 Pomerania 3,500 8,210 235 1,126.5 Warmisko–Mazurska 7,500 1,604 21 120.0 Krakow 4,500 1,307 29 395.4
Total 166,000 77,570 47 19,927.2 Source: Compiled on the basis of: E. Czerwińska: Specjalne Strefy Ekonomiczne w Polsce w świetle negocjacji
z UE. Kancelaria Sejmu, Informacja No. 751a, XI.2001, p.3; Specjalne strefy ekonomiczne stan na dzień 31 grudnia 2004 r., MG i P, Warszawa, March 2005, p.16-17.
Total amount of investment in SEZs reached nearly 20 billion PLN, of which 33% was
located in the Katowice SEZ, more than 16% in Walbrzych SEZ, above 11% in Mielec and
Legnica SEZs, each, and the remaining 28% - in the other 10 SEZs.
6. Foreign Investment in Special Economic Zones
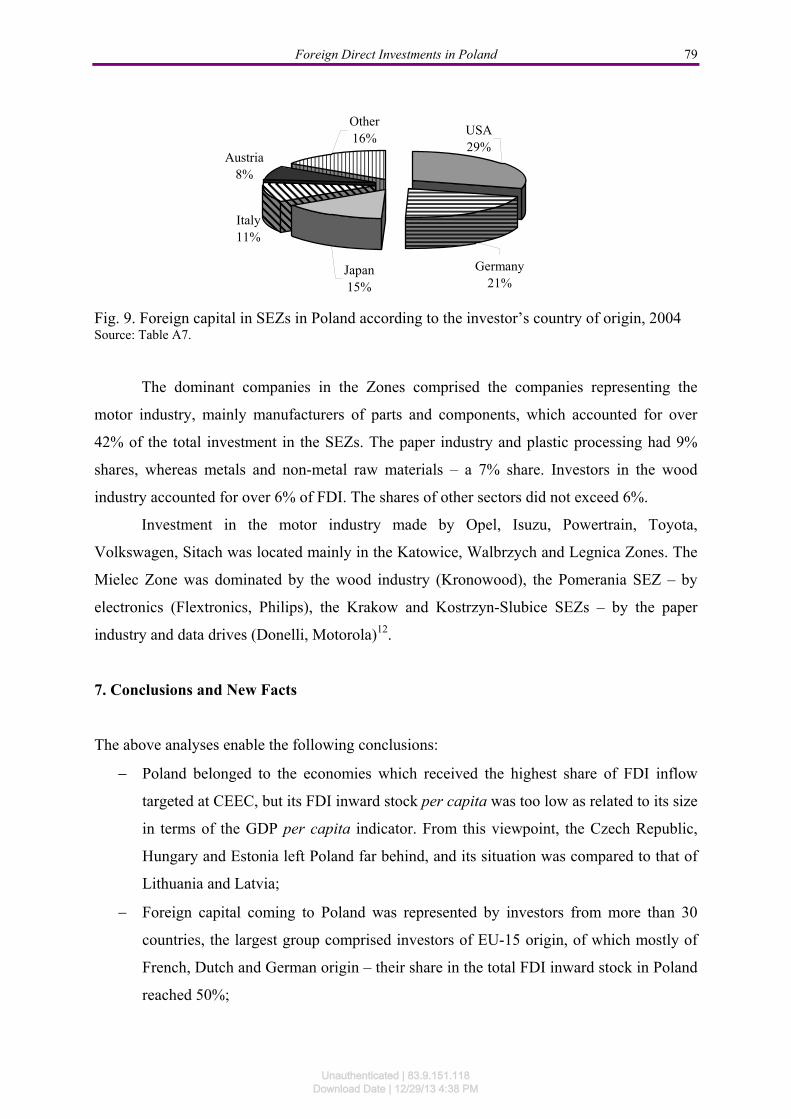
According to the 2004 data, nearly 80% of the capital invested in SEZs was of foreign
character and came mainly from five countries: 50% from the United States and Germany,
34% from Japan, Italy and Austria. The most numerous group of investors represented EU
member countries.
American companies invested mainly in the Katowice SEZ (over 78% of total
American FDI), and the German investors – in the Legnica SEZ (over 55%). The biggest
investment made by Italian companies were located in the Katowice and Kostrzyn-Slubice
SEZs. Austrian companies invested mostly in the Mielec SEZ, while the Japanese were
interested mainly in the Walbrzych (85% of total Japanese FDI in SEZs) and Katowice (9%)
Zones.
The least attractive Zones to foreign investors were the Suwalki and Slubice SEZs
(below 20% of total investment), and the most attractive ones – the Kostrzyn-Slubice and
Legnica Zones, which were the destinations of more than 90% of total investment11.
Unauthenticated | 83.9.151.118Download Date | 12/29/13 4:38 PM
Foreign Direct Investments in Poland 79
Italy11%
Austria8%
USA29%
Germany21%
Japan15%
Other16%
Fig. 9. Foreign capital in SEZs in Poland according to the investor’s country of origin, 2004 Source: Table A7.
The dominant companies in the Zones comprised the companies representing the
motor industry, mainly manufacturers of parts and components, which accounted for over
42% of the total investment in the SEZs. The paper industry and plastic processing had 9%
shares, whereas metals and non-metal raw materials – a 7% share. Investors in the wood
industry accounted for over 6% of FDI. The shares of other sectors did not exceed 6%.
Investment in the motor industry made by Opel, Isuzu, Powertrain, Toyota,
Volkswagen, Sitach was located mainly in the Katowice, Walbrzych and Legnica Zones. The
Mielec Zone was dominated by the wood industry (Kronowood), the Pomerania SEZ – by
electronics (Flextronics, Philips), the Krakow and Kostrzyn-Slubice SEZs – by the paper
industry and data drives (Donelli, Motorola)12.
7. Conclusions and New Facts
The above analyses enable the following conclusions:
Poland belonged to the economies which received the highest share of FDI inflow
targeted at CEEC, but its FDI inward stock per capita was too low as related to its size
in terms of the GDP per capita indicator. From this viewpoint, the Czech Republic,
Hungary and Estonia left Poland far behind, and its situation was compared to that of
Lithuania and Latvia;
Foreign capital coming to Poland was represented by investors from more than 30
countries, the largest group comprised investors of EU-15 origin, of which mostly of
French, Dutch and German origin – their share in the total FDI inward stock in Poland
reached 50%;
Unauthenticated | 83.9.151.118Download Date | 12/29/13 4:38 PM
80 Grażyna Kozuń-Cieślak
At the end of 2004, Poland hosted 1,101 foreign companies; each of them invested at
least USD 1 million. Fifteen of those companies invested more than USD 1 billion and
accounted for 30% of the total FDI inward stock in Poland (of which 10% was
invested by France Telekom and European Bank for Reconstruction and
Development);
75% of FDI is concentrated in three sectors of Polish economy: manufacturing (40%),
financial intermediation (23%), trade and repairs (12%).
In 2004 we were witnessing an accession-related 23% growth in the FDI inflow to
Poland as compared to the preceding year, most of which had the form of greenfield
projects (58%), takeovers (25%) and privatization (17%);
The highest share in the 2004 investment (60%) had the investors from France, the
United States, Germany and multinational corporations with the leader being the
American Apollo Rida that invested USD 0.8 billion in the real estate sector;
To encourage the Polish regions which were the most affected by the transition, 14
Special Economic Zones were established, which provide special incentives for
business, e.g. tax exemptions;
Ten years after their establishment, Special Economic Zones are developed only in
55%, and the gap between the most and least developed Zones is huge – 80% in the
Mielec SEZ as compared to as little as 12% in the Tarnobrzeg Special Economic
Zone;
In 2004 nearly 80% of the capital invested in SEZs was foreign capital coming mainly
from five countries: 50% from the United States and Germany, 34% from Japan, Italy
and Austria. The most numerous group of investors represented EU member countries;
Still, it should be stressed that the foreign capital invested in SEZs accounted for only
4.8% of the total FDI inward stock in 2004 in Poland.
To meet the 5% economic growth target, Poland requires approx. EUR 10 billion of
annual FDI inflow. The analyses clearly indicate that the amount of FDI targeted at Poland in
1993 – 2004 was insufficient. Favourable conditions for investment are, therefore, of extreme
importance, all the more so that the competition among new EU member states is really
strong and the Poland’s position as the FDI host country is instable. The situation is even
more serious after the last EU enlargement in 2007 when Bulgaria and Romania joined EU.
Unauthenticated | 83.9.151.118Download Date | 12/29/13 4:38 PM
Foreign Direct Investments in Poland 81
As according to the National Bank’s of Poland data, FDI inflow in 2005 was 23%
lower than in 200413.
In 2006 inflow of foreign direct investment to Poland amounted to EUR 15,061
million, up by 81.9%, when compared with EUR 8,280 million in 2005. In 2006, a
phenomenon called “capital in transit” was recorded. It is a direct investment from abroad in a
company seated in Poland, which reinvests the capital abroad. Capital which was “in transit”
through Poland in 2006 amounts to EUR 3,114 million, i.e. 20.7% of the inflow (respectively
in 2005, it was EUR 1,218 million, i.e. 14.7% of the inflow). As from 2006, buying and
selling of real estate has also been included in the inflow. The amount of EUR 15,061 million
comprises: ownership capital expenditure of direct investment enterprises (37%), reinvested
earnings amounting to (29%), and the positive balance of inter-company loans standing
(34%). The direct investment flows amounted to EUR 13,242, i.e. 87.9% were from the
European Union countries, the rest – EUR 1,819 million from other countries. The largest
amounts came from Luxemburg (EUR 3,573 million), Germany (EUR 2,707 million), Italy
(EUR 1,353 million), Netherlands (EUR 1,303 million), United Kingdom (EUR 1,170
million) and Spain (EUR 1,125 million). The greatest amount of direct investment inflow in
2006 was invested in real estate and other business activities (33%), manufacturing (EUR
24%), trade and repairs (14%), financial intermediation (11%), and buying and selling of real
estate by nonresidents (6%)14.
In 2007 the value of foreign direct investment inflow to Poland amounted to EUR
12,834 million, down by EUR 2,227 million, i.e. 14.8%, when compared with FDI amount in
2006. The amount of EUR 12,834 million comprises: ownership capital expenditure of direct
investment enterprises (30%), reinvested earnings (42%), and the positive balance of inter-
company loans (28%). Reinvested earnings were higher by 22.3% when compared with 2006.
In 2007, capital for the purchase of shares in direct investment enterprises amounted to EUR
3,859 million and was lower by EUR 1,773 million, when compared with 2006 (i.e. down by
31.5%). The parallel situation occurred in inter-company loans, where its positive balance
stood at EUR 3,645 million and was lower by EUR 1,426 million (i.e. down by 28.1%).
The greatest amount of direct investment inflow in 2007 was invested in
manufacturing (20%), real estate and other business activities (19.8%), financial
intermediation (15.3%) as well as trade and repairs (11.9%). It is estimated that in 2007
85.3% of direct investment flows were from European Union countries, mainly from France,
Germany, Austria, Italy and Sweden. The most significant investment from outside the
Unauthenticated | 83.9.151.118Download Date | 12/29/13 4:38 PM

82 Grażyna Kozuń-Cieślak
European Union came from residents of United States of America, Netherlands Antilles,
Republic of Korea (South Korea) and Japan15.
Unauthenticated | 83.9.151.118Download Date | 12/29/13 4:38 PM
Foreign Direct Investments in Poland 83
APPENDIX
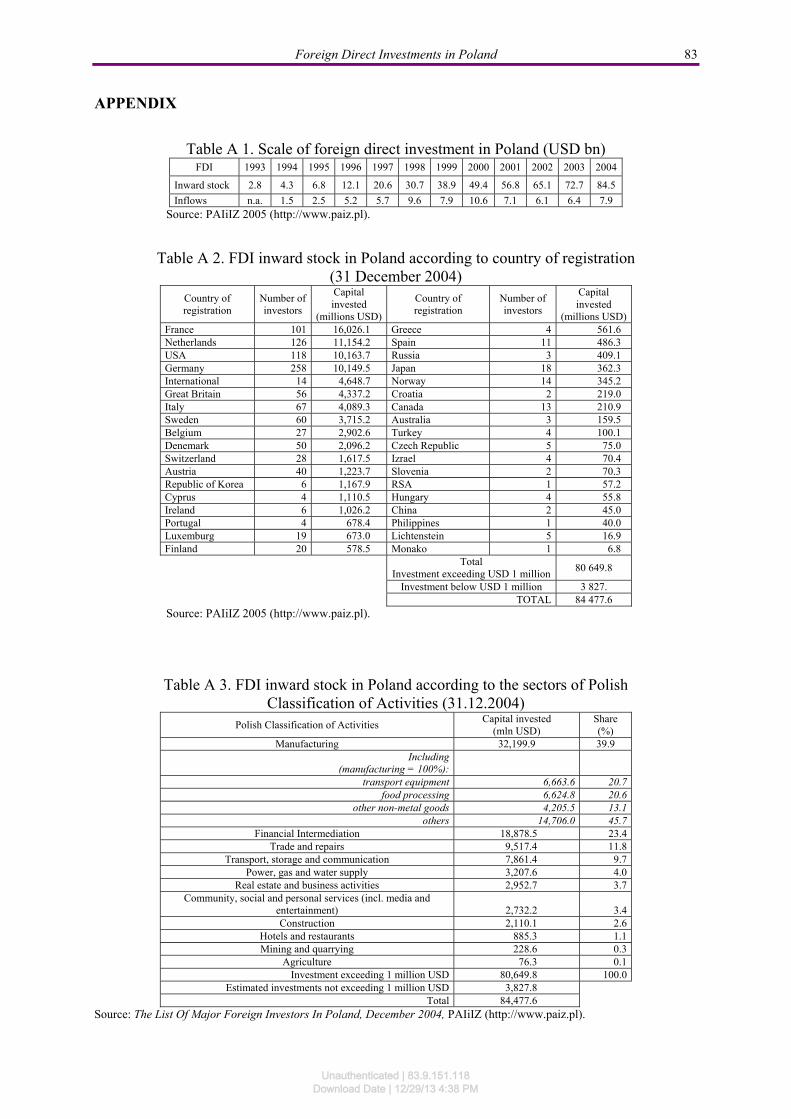
Table A 1. Scale of foreign direct investment in Poland (USD bn)
FDI 1993 1994 1995 1996 1997 1998 1999 2000 2001 2002 2003 2004
Inward stock 2.8 4.3 6.8 12.1 20.6 30.7 38.9 49.4 56.8 65.1 72.7 84.5
Inflows n.a. 1.5 2.5 5.2 5.7 9.6 7.9 10.6 7.1 6.1 6.4 7.9 Source: PAIiIZ 2005 (http://www.paiz.pl).
Table A 2. FDI inward stock in Poland according to country of registration (31 December 2004)
Country of registration
Number of investors
Capital invested
(millions USD)
Country of registration
Number of investors
Capital invested
(millions USD) France 101 16,026.1 Greece 4 561.6 Netherlands 126 11,154.2 Spain 11 486.3 USA 118 10,163.7 Russia 3 409.1 Germany 258 10,149.5 Japan 18 362.3 International 14 4,648.7 Norway 14 345.2 Great Britain 56 4,337.2 Croatia 2 219.0 Italy 67 4,089.3 Canada 13 210.9 Sweden 60 3,715.2 Australia 3 159.5 Belgium 27 2,902.6 Turkey 4 100.1 Denemark 50 2,096.2 Czech Republic 5 75.0 Switzerland 28 1,617.5 Izrael 4 70.4 Austria 40 1,223.7 Slovenia 2 70.3 Republic of Korea 6 1,167.9 RSA 1 57.2 Cyprus 4 1,110.5 Hungary 4 55.8 Ireland 6 1,026.2 China 2 45.0 Portugal 4 678.4 Philippines 1 40.0 Luxemburg 19 673.0 Lichtenstein 5 16.9 Finland 20 578.5 Monako 1 6.8
Total
Investment exceeding USD 1 million 80 649.8
Investment below USD 1 million 3 827. TOTAL 84 477.6
Source: PAIiIZ 2005 (http://www.paiz.pl).
Table A 3. FDI inward stock in Poland according to the sectors of Polish Classification of Activities (31.12.2004)
Polish Classification of Activities Capital invested
(mln USD) Share (%)
Manufacturing 32,199.9 39.9 Including
(manufacturing = 100%): transport equipment 6,663.6 20.7
food processing 6,624.8 20.6 other non-metal goods 4,205.5 13.1
others 14,706.0 45.7 Financial Intermediation 18,878.5 23.4
Trade and repairs 9,517.4 11.8 Transport, storage and communication 7,861.4 9.7
Power, gas and water supply 3,207.6 4.0 Real estate and business activities 2,952.7 3.7
Community, social and personal services (incl. media and entertainment) 2,732.2 3.4 Construction 2,110.1 2.6
Hotels and restaurants 885.3 1.1 Mining and quarrying 228.6 0.3
Agriculture 76.3 0.1 Investment exceeding 1 million USD 80,649.8 100.0
Estimated investments not exceeding 1 million USD 3,827.8 Total 84,477.6
Source: The List Of Major Foreign Investors In Poland, December 2004, PAIiIZ (http://www.paiz.pl).
Unauthenticated | 83.9.151.118Download Date | 12/29/13 4:38 PM
84 Grażyna Kozuń-Cieślak
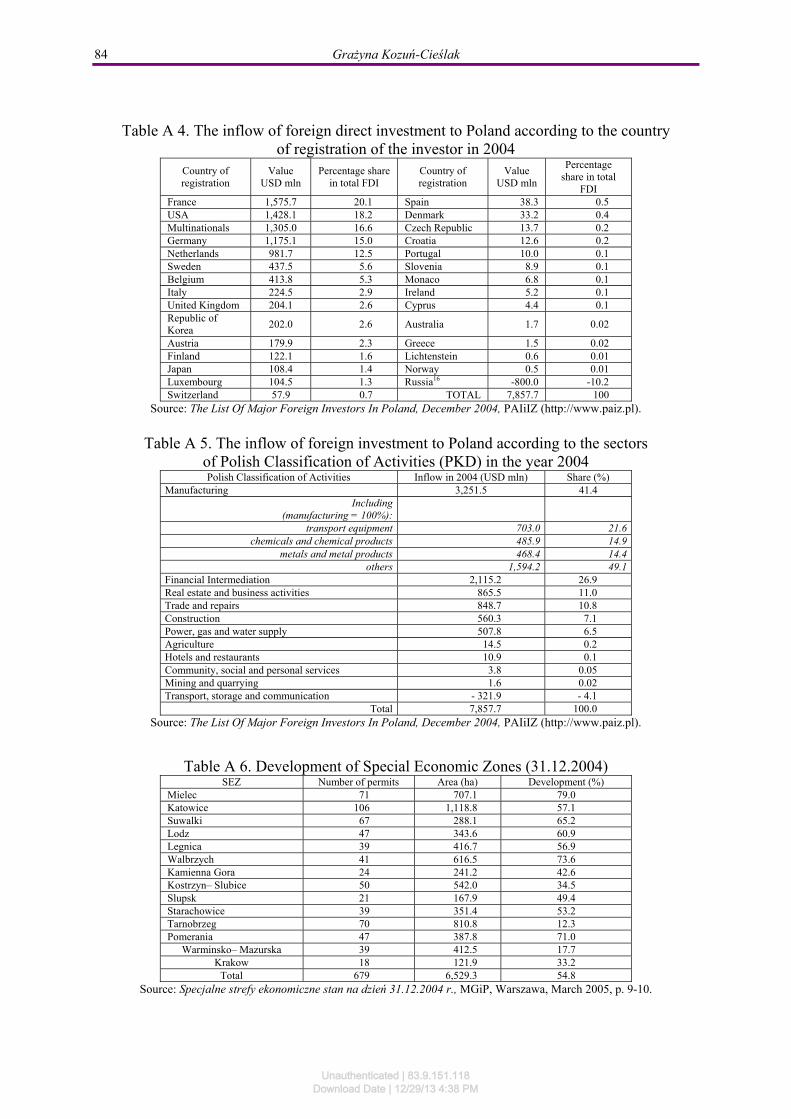
Table A 4. The inflow of foreign direct investment to Poland according to the country of registration of the investor in 2004
Country of registration
Value USD mln
Percentage share in total FDI
Country of registration
Value USD mln
Percentage share in total
FDI France 1,575.7 20.1 Spain 38.3 0.5 USA 1,428.1 18.2 Denmark 33.2 0.4 Multinationals 1,305.0 16.6 Czech Republic 13.7 0.2 Germany 1,175.1 15.0 Croatia 12.6 0.2 Netherlands 981.7 12.5 Portugal 10.0 0.1 Sweden 437.5 5.6 Slovenia 8.9 0.1 Belgium 413.8 5.3 Monaco 6.8 0.1 Italy 224.5 2.9 Ireland 5.2 0.1 United Kingdom 204.1 2.6 Cyprus 4.4 0.1 Republic of Korea
202.0 2.6 Australia 1.7 0.02
Austria 179.9 2.3 Greece 1.5 0.02 Finland 122.1 1.6 Lichtenstein 0.6 0.01 Japan 108.4 1.4 Norway 0.5 0.01 Luxembourg 104.5 1.3 Russia16 -800.0 -10.2 Switzerland 57.9 0.7 TOTAL 7,857.7 100
Source: The List Of Major Foreign Investors In Poland, December 2004, PAIiIZ (http://www.paiz.pl).
Table A 5. The inflow of foreign investment to Poland according to the sectors
of Polish Classification of Activities (PKD) in the year 2004 Polish Classification of Activities Inflow in 2004 (USD mln) Share (%)
Manufacturing 3,251.5 41.4 Including
(manufacturing = 100%): transport equipment 703.0 21.6
chemicals and chemical products 485.9 14.9 metals and metal products 468.4 14.4
others 1,594.2 49.1 Financial Intermediation 2,115.2 26.9 Real estate and business activities 865.5 11.0 Trade and repairs 848.7 10.8 Construction 560.3 7.1 Power, gas and water supply 507.8 6.5 Agriculture 14.5 0.2 Hotels and restaurants 10.9 0.1 Community, social and personal services 3.8 0.05 Mining and quarrying 1.6 0.02 Transport, storage and communication - 321.9 - 4.1
Total 7,857.7 100.0 Source: The List Of Major Foreign Investors In Poland, December 2004, PAIiIZ (http://www.paiz.pl).
Table A 6. Development of Special Economic Zones (31.12.2004) SEZ Number of permits Area (ha) Development (%)
Mielec 71 707.1 79.0 Katowice 106 1,118.8 57.1 Suwalki 67 288.1 65.2 Lodz 47 343.6 60.9 Legnica 39 416.7 56.9 Walbrzych 41 616.5 73.6 Kamienna Gora 24 241.2 42.6 Kostrzyn– Slubice 50 542.0 34.5 Slupsk 21 167.9 49.4 Starachowice 39 351.4 53.2 Tarnobrzeg 70 810.8 12.3 Pomerania 47 387.8 71.0
Warminsko– Mazurska 39 412.5 17.7 Krakow 18 121.9 33.2
Total 679 6,529.3 54.8 Source: Specjalne strefy ekonomiczne stan na dzień 31.12.2004 r., MGiP, Warszawa, March 2005, p. 9-10.
Unauthenticated | 83.9.151.118Download Date | 12/29/13 4:38 PM
Foreign Direct Investments in Poland 85
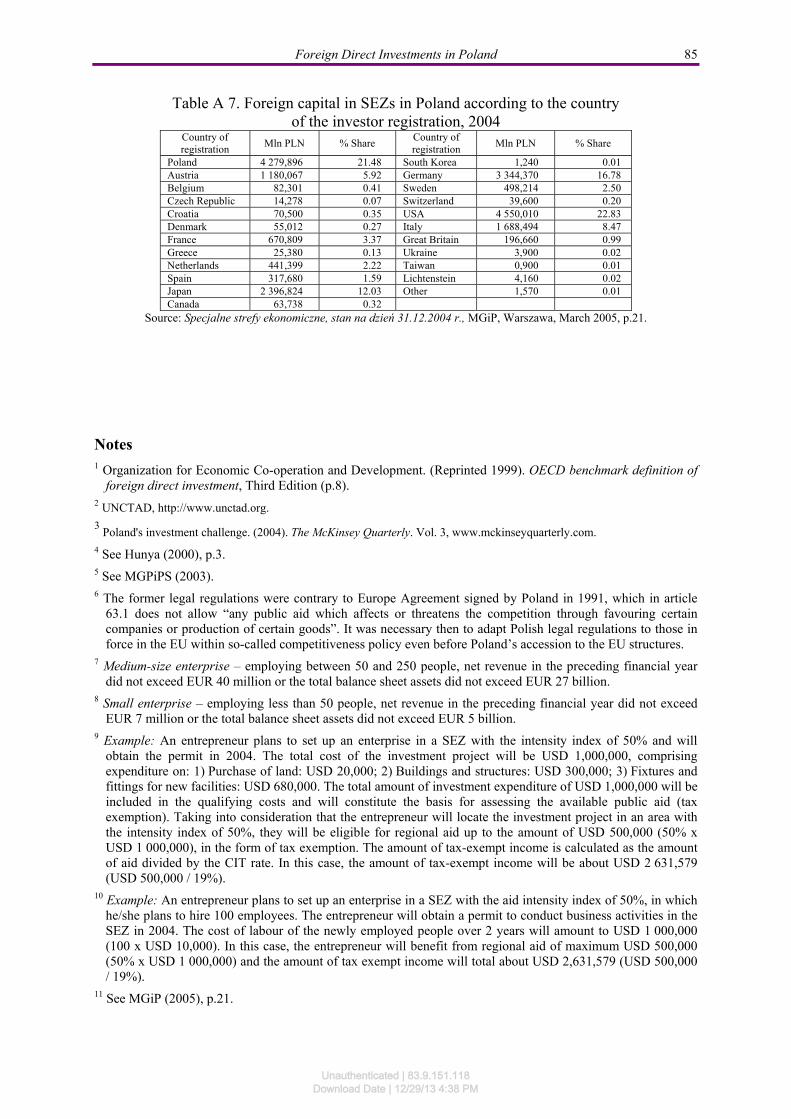
Table A 7. Foreign capital in SEZs in Poland according to the country of the investor registration, 2004
Country of registration
Mln PLN % Share Country of registration
Mln PLN % Share
Poland 4 279,896 21.48 South Korea 1,240 0.01 Austria 1 180,067 5.92 Germany 3 344,370 16.78 Belgium 82,301 0.41 Sweden 498,214 2.50 Czech Republic 14,278 0.07 Switzerland 39,600 0.20 Croatia 70,500 0.35 USA 4 550,010 22.83 Denmark 55,012 0.27 Italy 1 688,494 8.47 France 670,809 3.37 Great Britain 196,660 0.99 Greece 25,380 0.13 Ukraine 3,900 0.02 Netherlands 441,399 2.22 Taiwan 0,900 0.01 Spain 317,680 1.59 Lichtenstein 4,160 0.02 Japan 2 396,824 12.03 Other 1,570 0.01 Canada 63,738 0.32
Source: Specjalne strefy ekonomiczne, stan na dzień 31.12.2004 r., MGiP, Warszawa, March 2005, p.21.
Notes 1 Organization for Economic Co-operation and Development. (Reprinted 1999). OECD benchmark definition of
foreign direct investment, Third Edition (p.8). 2 UNCTAD, http://www.unctad.org. 3 Poland's investment challenge. (2004). The McKinsey Quarterly. Vol. 3, www.mckinseyquarterly.com.
4 See Hunya (2000), p.3. 5 See MGPiPS (2003). 6 The former legal regulations were contrary to Europe Agreement signed by Poland in 1991, which in article
63.1 does not allow “any public aid which affects or threatens the competition through favouring certain companies or production of certain goods”. It was necessary then to adapt Polish legal regulations to those in force in the EU within so-called competitiveness policy even before Poland’s accession to the EU structures.
7 Medium-size enterprise – employing between 50 and 250 people, net revenue in the preceding financial year did not exceed EUR 40 million or the total balance sheet assets did not exceed EUR 27 billion.
8 Small enterprise – employing less than 50 people, net revenue in the preceding financial year did not exceed EUR 7 million or the total balance sheet assets did not exceed EUR 5 billion.
9 Example: An entrepreneur plans to set up an enterprise in a SEZ with the intensity index of 50% and will obtain the permit in 2004. The total cost of the investment project will be USD 1,000,000, comprising expenditure on: 1) Purchase of land: USD 20,000; 2) Buildings and structures: USD 300,000; 3) Fixtures and fittings for new facilities: USD 680,000. The total amount of investment expenditure of USD 1,000,000 will be included in the qualifying costs and will constitute the basis for assessing the available public aid (tax exemption). Taking into consideration that the entrepreneur will locate the investment project in an area with the intensity index of 50%, they will be eligible for regional aid up to the amount of USD 500,000 (50% x USD 1 000,000), in the form of tax exemption. The amount of tax-exempt income is calculated as the amount of aid divided by the CIT rate. In this case, the amount of tax-exempt income will be about USD 2 631,579 (USD 500,000 / 19%).
10 Example: An entrepreneur plans to set up an enterprise in a SEZ with the aid intensity index of 50%, in which he/she plans to hire 100 employees. The entrepreneur will obtain a permit to conduct business activities in the SEZ in 2004. The cost of labour of the newly employed people over 2 years will amount to USD 1 000,000 (100 x USD 10,000). In this case, the entrepreneur will benefit from regional aid of maximum USD 500,000 (50% x USD 1 000,000) and the amount of tax exempt income will total about USD 2,631,579 (USD 500,000 / 19%).
11 See MGiP (2005), p.21.
Unauthenticated | 83.9.151.118Download Date | 12/29/13 4:38 PM
86 Grażyna Kozuń-Cieślak
12 See MGiP (2005), pp.18-19. 13 See http://www.nbp.pl/publikacje/zib/zib2005notatka.pdf. 14 See http://www.nbp.pl/en/publikacje/ziben/ziben2006n.pdf. 15 See http://www.nbp.pl/en/publikacje/ziben/ziben2007n.pdf. 16The outflow of capital in 2004 resulted from the remittance of liabilities by entities with capital cross-
ownership.
References
Hunya, G. (2000). Recent FDI Trends, Policies and Challenges in SEE Countries in
Comparison with other Regions in Transition. The Vienna Institute for International
Economic Studies.
MGiP. (2005). Specjalne strefy ekonomiczne stan na dzień 31 grudnia 2004. Warszawa.
MGPiPS. (2003). Program promocji gospodarczej Polski do roku 2005. Warszawa.
NBP. (2007). Direct Investment Flows in Poland in 2007. Warszawa,
www.nbp.pl/en/publikacje/ziben/ziben2007n.pdf.
NBP. (2007). Informacja o zagranicznych inwestycjach bezpośrednich w 2005 roku.
Warszawa, www.nbp.pl/publikacje/zib/zib2005notatka.pdf.
NBP. (2007). Information on FDI in Poland in 2006.
www.nbp.pl/en/publikacje/ziben/ziben2006n.pdf.
Organization for Economic Co-operation and Development. (Reprinted 1999). OECD
Benchmark Definition of Foreign Direct Investment. Third Edition.
Poland's Investment Challenge. (2004). The McKinsey Quarterly. Vol. 3,
www.mckinseyquarterly.com.
Unauthenticated | 83.9.151.118Download Date | 12/29/13 4:38 PM
Related Documents