JOURNAL OF ECONOMIC DEVELOPMENT 35 Volume 40, Number 2, June 2015 FOREIGN DIRECT INVESTMENT IN NORTH KOREA AND THE EFFECT OF SPECIAL ECONOMIC ZONES: LEARNING FROM TRANSITION ECONOMIES HANHEE LEE * Sookmyung Women’s University, Korea This study analyzes critical factors that foreign investors would consider before investing in North Korea by empirically analyzing key FDI determinants in Central and Eastern Europe and the former Soviet Union (i.e., transition economies) and juxtaposing these results against North Korea’s main investment hurdles and pull factors in order to suggest a way forward. For the empirical study, a fixed effect model is employed based on the panel data of all the transition economies through their entire transition periods. The analysis suggests that the special economic zones in the Visegrad countries could provide a relevant benchmark for North Korea. Keywords: North Korea, Transition Economies, Central and Eastern Europe, Former Soviet Union, Foreign Direct Investment, Special Economic Zone JEL classification: C33, P21, P52 1. INTRODUCTION North Korea, one of the world’s few remaining communist countries, suffers severe economic difficulties. Since around 1990, its economy has experienced either zero or negative growth. According to the Bank of Korea, North Korea’s gross national income (GNI) in 2012 was only about USD 30 billion, representing a marginal change over 25 years, while per capita GNI was only about USD 1,200. 1 North Korea’s attempts to secure external aid and foreign investment are unsuccessful because of its nuclear brinkmanship and inferior investment environment. This study theoretically and practically analyzes the measures that North Korea may take in order to attract foreign direct investment (FDI). * I would like to thank the anonymous referee for valuable comments. All remaining errors are my own. 1 North Korea’s GNI and per capita GNI in 1990 were approximately USD 13 billion and USD 800, respectively (The Bank of Korea).

Welcome message from author
This document is posted to help you gain knowledge. Please leave a comment to let me know what you think about it! Share it to your friends and learn new things together.
Transcript
JOURNAL OF ECONOMIC DEVELOPMENT 35 Volume 40, Number 2, June 2015
FOREIGN DIRECT INVESTMENT IN NORTH KOREA AND THE
EFFECT OF SPECIAL ECONOMIC ZONES:
LEARNING FROM TRANSITION ECONOMIES
HANHEE LEE*
Sookmyung Women’s University, Korea
This study analyzes critical factors that foreign investors would consider before investing in North Korea by empirically analyzing key FDI determinants in Central and Eastern Europe and the former Soviet Union (i.e., transition economies) and juxtaposing these results against North Korea’s main investment hurdles and pull factors in order to suggest a way forward. For the empirical study, a fixed effect model is employed based on the panel data of all the transition economies through their entire transition periods. The analysis suggests that the special economic zones in the Visegrad countries could provide a relevant benchmark for North Korea. Keywords: North Korea, Transition Economies, Central and Eastern Europe, Former
Soviet Union, Foreign Direct Investment, Special Economic Zone JEL classification: C33, P21, P52
1. INTRODUCTION North Korea, one of the world’s few remaining communist countries, suffers severe
economic difficulties. Since around 1990, its economy has experienced either zero or negative growth. According to the Bank of Korea, North Korea’s gross national income (GNI) in 2012 was only about USD 30 billion, representing a marginal change over 25 years, while per capita GNI was only about USD 1,200.1 North Korea’s attempts to secure external aid and foreign investment are unsuccessful because of its nuclear brinkmanship and inferior investment environment. This study theoretically and practically analyzes the measures that North Korea may take in order to attract foreign direct investment (FDI).
* I would like to thank the anonymous referee for valuable comments. All remaining errors are my own.
1 North Korea’s GNI and per capita GNI in 1990 were approximately USD 13 billion and USD 800, respectively (The Bank of Korea).
HANHEE LEE 36
FDI is one of the main sources of international financial flows, which takes two forms: private foreign direct and portfolio investment and public and private development assistance (Todaro and Smith, 2006, p. 706). Empirical research has revealed that FDI is one of the most effective tools for transferring capital and advanced technology to developing countries as well as for developing their human capital, and thus, facilitating faster economic growth in these countries (Grossman and Helpman, 1991; Neuhaus, 2006). In the case of North Korea, the primary reason for its economic stagnation is the lack of initial capital to mobilize economic growth. North Korea does not meet the basic requirements of either the Harrod-Domar growth model, which requires economies to save and invest for growth, or the Solow model, in which technological progress is a residual factor explaining long-term growth.
The roots of North Korea’s economic hardship lie in the country’s politico-economic system and confrontation with the existing international order. The security of Kim’s regime takes priority over everything else, and the closed socialist planned economic system has fundamental limits in productivity and efficiency. The chronic-shortage economy (Kornai, 1982) of North Korea cannot afford to supply sufficient inputs to both the agricultural and industrial sectors, which results in a continuous decline in output. In this respect, this study suggests that FDI can spur North Korea’s economic growth.
Several researchers have examined FDI in North Korea. Some have focused on its comprehensive economic engagement with foreign countries from the perspective of economic rehabilitation (Snyder, 2001; Haggard and Noland, 2010) or China’s expansion of its influence in North Korea through FDI (Kim, 2006; Choo, 2008). Others have focused on the need for institutional reform in North Korea (Oh, 2004; Park, 2010; Shin, 2012) or comparative analyses of the investment environment there and in foreign countries, usually China and Vietnam, where economic reform has been successful (Namkung, 1996). However, the present study focuses on an aspect that seems to have been insufficiently dealt with by these studies. I assume a different scenario in which North Korea proactively attracts FDI because Kim Jong-un’s regime will, in all likelihood, be forced to do so either by means of a major political breakthrough on the nuclear front or modest economic reforms. In this scenario, the issue of identifying methods to attract FDI arises.
Therefore, this study seeks to determine (i) critical factors that foreign investors would consider before investing in North Korea and (ii) means by which to attract FDI. First, I assume a different situation from the present one in which North Korea proactively attracts FDI. Second, I examine FDI in the transition economies of Central and Eastern Europe (CEE) and the Commonwealth of Independent States (CIS). This approach is used to establish a benchmark in terms of best practices for attracting FDI into a potentially proactive (in soliciting FDI) North Korean economy because it is impossible to undertake an empirical study using North Korean data when meaningful
FOREIGN DIRECT INVESTMENT IN NORTH KOREA 37
foreign investment has yet to be made.2 In particular, by reviewing previous studies on FDI determinants in the CEE and CIS transition economies and empirically analyzing general FDI determinants throughout their transition periods, determinants with a relatively higher applicability to North Korea may be identified. Third, North Korea’s main investment hurdles and pull factors are analyzed and juxtaposed against the main findings of the mirror study in order to suggest a way forward.
The remainder of the paper is organized as follows. Section 2 presents a discussion on FDI inflow into comparative transition economies and a related literature review. Section 3 identifies potential determinants of FDI for the analysis. The empirical analysis is covered in Section 4. Section 5 discusses the results and Section 6 concludes with implications for North Korea.
2. FDI IN TRANSITION ECONOMIES AND LITERATURE REVIEW A historical event occurred in 1990-1991, namely, the collapse of the socialist
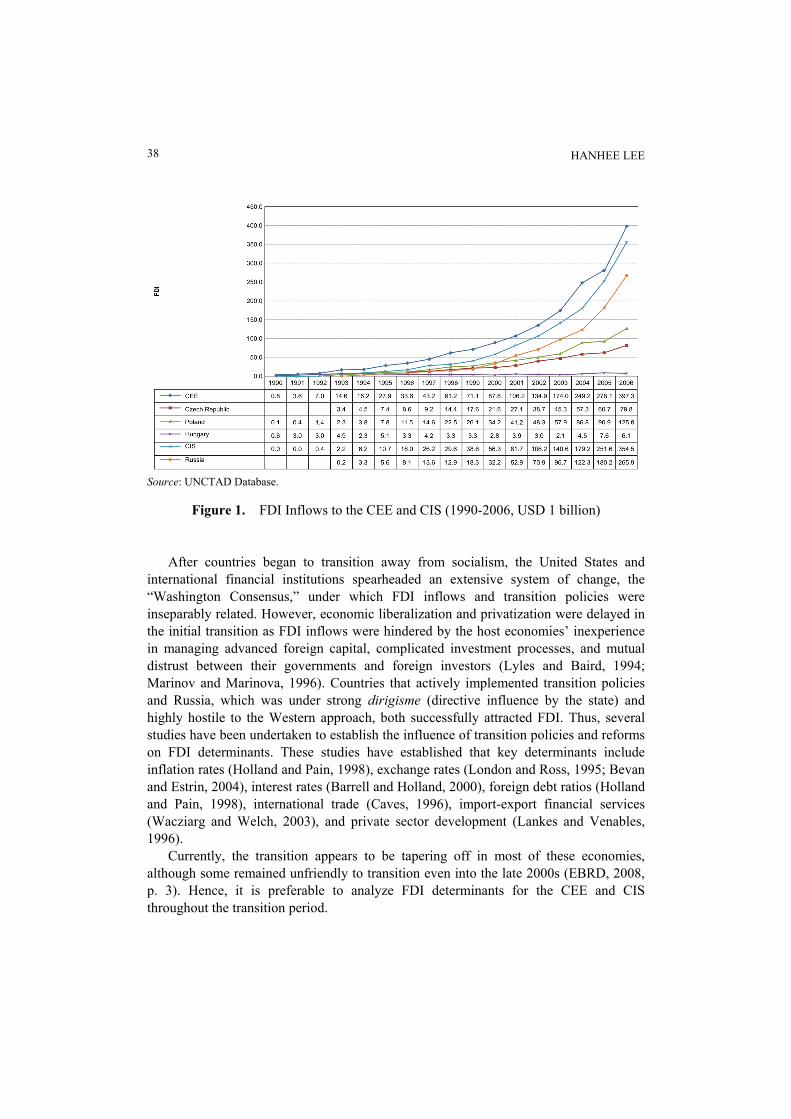
systems in the Eastern Bloc and the Soviet Union. According to the United Nations Conference on Trade and Development (UNCTAD), shortly thereafter, the volume of FDI into the region accounted for only about 0.4% of total worldwide flows. However, in the late 1990s, the flows increased dramatically to over 5% in the CEE and to 2-3% in the CIS; in the 2000s, they were more than 17% and 15%, respectively. Much of the FDI inflow into the CIS went to Russia. By comparison, the CEE experienced 3-4 years of recession after the transition, but FDI increased rapidly thereafter, mostly into Poland, the Czech Republic, and Hungary.
Given the considerable differences in the amount and characteristics of FDI among the countries and periods, studies on the 1990s focused on the factors behind distinctive FDI flows. These factors include the initial conditions within the transition economies (Bevan and Estrin, 2000), such as their proximity to Western economies, the prevalence of centralized planning systems, their level of industrialization, repressed inflation, and the availability of natural resources. Other studies focused on market potential, factor prices, (Tsai, 1991; Wheeler and Mody, 1992) and levels of reform and institutional development (Lankes, Stern, Blumenthal, and Weigl, 1999). Studies in the late 1990s and 2000s typically analyzed how policy differences and subsequent macroeconomic changes affected FDI (Campos and Kinoshita, 2003; Merlevede and Schoors, 2004).
2 The CEE is comprised of Albania, Bosnia-Herzegovina, Bulgaria, Croatia, the Czech Republic, Estonia,
Hungary, Kosovo, Latvia, Lithuania, Macedonia, Montenegro, Poland, Romania, Serbia, Slovakia, and Slovenia. The CIS is comprised of Armenia, Azerbaijan, Belarus, Georgia, Kazakhstan, the Kyrgyz Republic, Moldova, Russia, Tajikistan, Turkmenistan, Ukraine, and Uzbekistan.
HANHEE LEE 38
Source: UNCTAD Database.
Figure 1. FDI Inflows to the CEE and CIS (1990-2006, USD 1 billion)
After countries began to transition away from socialism, the United States and international financial institutions spearheaded an extensive system of change, the “Washington Consensus,” under which FDI inflows and transition policies were inseparably related. However, economic liberalization and privatization were delayed in the initial transition as FDI inflows were hindered by the host economies’ inexperience in managing advanced foreign capital, complicated investment processes, and mutual distrust between their governments and foreign investors (Lyles and Baird, 1994; Marinov and Marinova, 1996). Countries that actively implemented transition policies and Russia, which was under strong dirigisme (directive influence by the state) and highly hostile to the Western approach, both successfully attracted FDI. Thus, several studies have been undertaken to establish the influence of transition policies and reforms on FDI determinants. These studies have established that key determinants include inflation rates (Holland and Pain, 1998), exchange rates (London and Ross, 1995; Bevan and Estrin, 2004), interest rates (Barrell and Holland, 2000), foreign debt ratios (Holland and Pain, 1998), international trade (Caves, 1996), import-export financial services (Wacziarg and Welch, 2003), and private sector development (Lankes and Venables, 1996).
Currently, the transition appears to be tapering off in most of these economies, although some remained unfriendly to transition even into the late 2000s (EBRD, 2008, p. 3). Hence, it is preferable to analyze FDI determinants for the CEE and CIS throughout the transition period.

FOREIGN DIRECT INVESTMENT IN NORTH KOREA 39
3. POTENTIAL FDI DETERMINANTS AND SELECTION RATIONALE This study includes key factors identified in previous studies that comply with
Dunning’s taxonomy (as suggested in his eclectic paradigm, 2000) as subjects of analysis. Even if a unified framework concerning FDI has yet to be developed, Dunning’s taxonomy is considered the only valuable instrument in this regard; it identifies markets, efficiency, resources, and strategic asset seeking as key traditional motives behind FDI. I now discuss the factors included in the present analysis and the rationale for their selection.
The transition economies of both the CEE and CIS experienced “transition recessions” upon the collapse of socialism. Hence, managing a sustained level of inflation was at the core of their stabilization programs (Lavigne, 1999, pp. 128-137). Inflation has been studied as a key determinant of FDI as its inherent uncertainty is a significant impediment to attracting investments (Brunetti, Kisunko, and Weder, 1997). In addition, creating business-friendly environments and promoting market-oriented corporate governance were important during the reform and were realized mainly through strategically planned privatization. Privatization, a key FDI determinant, is the level of privatization of former state-owned enterprises and the development of institutions that promote competition; it is usually measured by progress in the market- oriented transition (Lankes and Venables, 1996; De Melo, 2001). Progress in establishing market institutions reduces institutional uncertainty if it subjects bureaucratic interference in business transactions to clear rules and regulations. Notably, this applies to competition policy, which is important in protecting consumers but can also be used to inhibit foreign entry (Bevan, Estrin, and Meyer, 2004, p. 49). Transition countries retained legacies of their old systems, though, such as capital controls and stringent profit remittance (Resmini, 2000; Campos and Kinoshita, 2003); as such, the level of government regulation played a key role in determining FDI (Brenton, Di Mauro, and Lucke, 1999).
Foreign investors usually profit from relatively liberal trade systems (Jun and Singh, 1996; Barrell and Pain, 1999). Related measures of this include abolition of trade licensing and quantity controls, lowering tariffs, and forging bilateral investment treaties. The current account balance is a reflection of a host economy’s strength and the balance between national savings, domestic investments, and debt accumulation (Roubini and Wachtel, 1997, pp. 2-3). The current account deficit may lead to inflation and exchange rate volatility or may be utilized by foreign investors to leverage favorable terms during investment negotiations with the host governments (Dhakal, Mixon, and Upadhyaya, 2007, p. 2). Likewise, exchange rates could either facilitate exports or render their prices uncompetitive in international markets, thus hindering FDI inflows (Lavigne, 1999). Another decisive category of FDI determinants is input costs, of which labor costs are important in labor-intensive industries (Holland and Pain, 1998; Bevan and Estrin, 2000). Similarly, Dunning (2004) finds that human resource availability is a principal FDI determinant in transition economies. However, most CEE countries experienced rapid

HANHEE LEE 40
economic growth from the mid-1990s and integrated into the EU from the early 2000s. Accordingly, the impact of input costs might have been mitigated during this period. Meanwhile, infrastructure development is significant as both a cost and an efficiency factor (Campos and Kinoshita, 2003).
Market size is traditionally considered an important FDI determinant. A market of sufficient size, as measured by gross domestic product (GDP) or population, is usually a critical motive for FDI inflows, which increase in response to increasing sales (Agarwal, 1980). Natural resource endowment has been empirically verified as a significant FDI determinant (De Melo, Denizer, and Gelb, 1996; Merlevede and Schoors, 2004) as either a cost factor or a strategic resource. However, since FDI is not exclusively resource seeking or export oriented, investors are often attracted to countries with relatively higher national incomes or larger populations, all other factors being equal (Wheeler and Mody, 1992; Jun and Singh, 1996).
4. EMPIRICAL ANALYSIS 4.1. Method and Data This study statistically analyzes FDI determinants in the CEE and CIS during their
transition periods. The CEE countries analyzed are Albania, Bulgaria, Croatia, the Czech Republic, Estonia, Hungary, Latvia, Lithuania, Macedonia, Poland, Romania, Slovakia, and Slovenia. Because of limited data availability, I analyze only seven CIS countries: Armenia, Azerbaijan, Belarus, Kazakhstan, the Kyrgyz Republic, Russia, and Ukraine. The explanatory variables include GDP, inflation (INF, GDP deflator), the current account balance (CAB), the official exchange rate (OER), level of openness (OPEN), level of government regulation (GR), private sector share (PS), level of competition policy (CP), the average manufacturing wage (AW), labor force percentage (LF), level of natural resource endowment (NRE), and level of infrastructure development (ID).3 To prevent biased results owing to the recession in the early 1990s and the global economic crisis of 2007–2008, annual time-series data from 1995 to 2006 are employed and a panel data set is constructed for the CEE and CIS. The basic model is
ititiit εxβuαy +++= ,
where ity is a dependent variable, α , a constant term, iu , an individual panel error term, β , a regression coefficient, itx , an independent variable, itε , an error term, I,
3 This study considers natural resources only, unlike Dunning’s taxonomy, in which “resource” indicates
natural resources as well as unskilled labor and technological and managerial capabilities.
FOREIGN DIRECT INVESTMENT IN NORTH KOREA 41
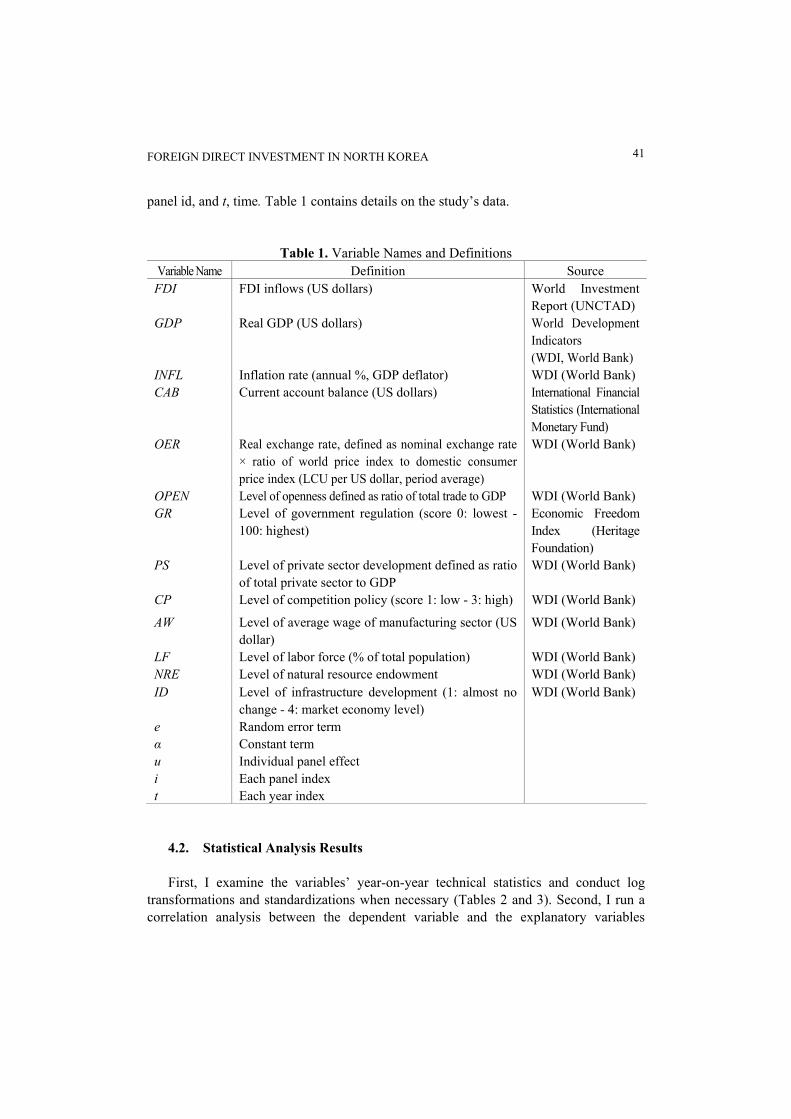
panel id, and t, time. Table 1 contains details on the study’s data.
Table 1. Variable Names and Definitions Variable Name Definition Source FDI FDI inflows (US dollars) World Investment
Report (UNCTAD) GDP Real GDP (US dollars) World Development
Indicators (WDI, World Bank)
INFL Inflation rate (annual %, GDP deflator) WDI (World Bank) CAB Current account balance (US dollars) International Financial
Statistics (International Monetary Fund)
OER Real exchange rate, defined as nominal exchange rate × ratio of world price index to domestic consumer price index (LCU per US dollar, period average)
WDI (World Bank)
OPEN Level of openness defined as ratio of total trade to GDP WDI (World Bank) GR Level of government regulation (score 0: lowest -
100: highest) Economic Freedom Index (Heritage Foundation)
PS Level of private sector development defined as ratio of total private sector to GDP
WDI (World Bank)
CP Level of competition policy (score 1: low - 3: high) WDI (World Bank)
AW Level of average wage of manufacturing sector (US dollar)
WDI (World Bank)
LF Level of labor force (% of total population) WDI (World Bank) NRE Level of natural resource endowment WDI (World Bank) ID Level of infrastructure development (1: almost no
change - 4: market economy level) WDI (World Bank)
e Random error term α Constant term u Individual panel effect i Each panel index t Each year index
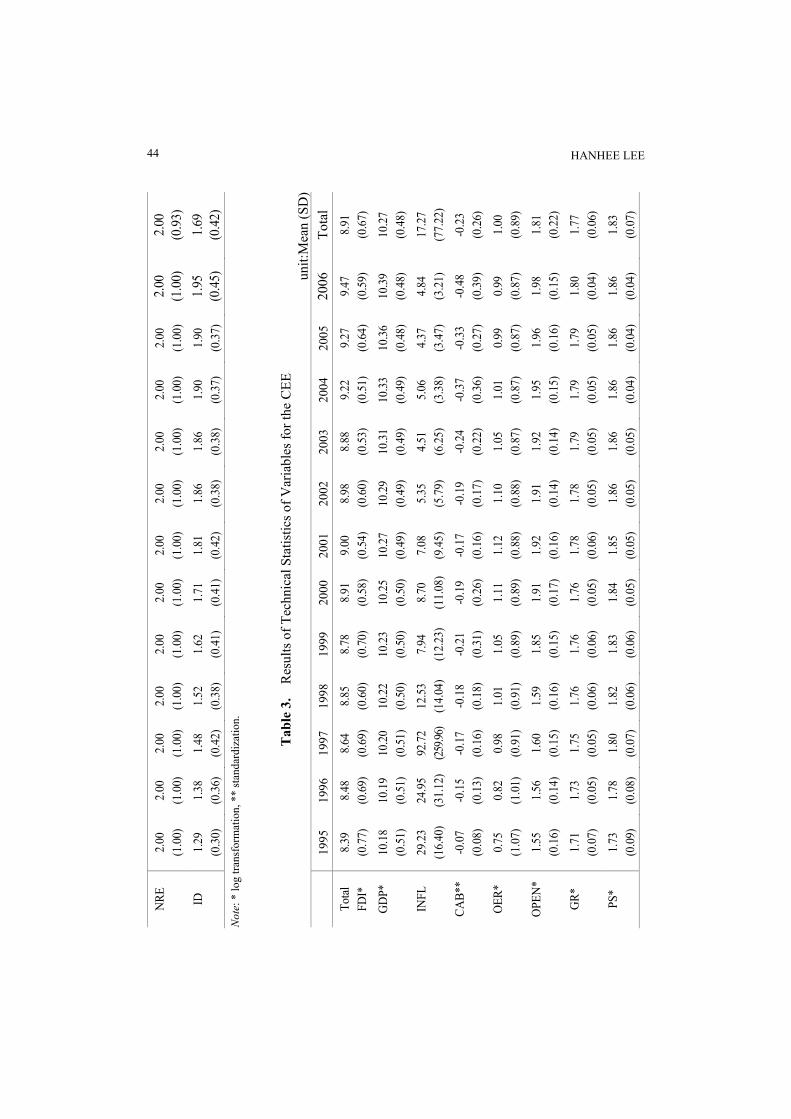
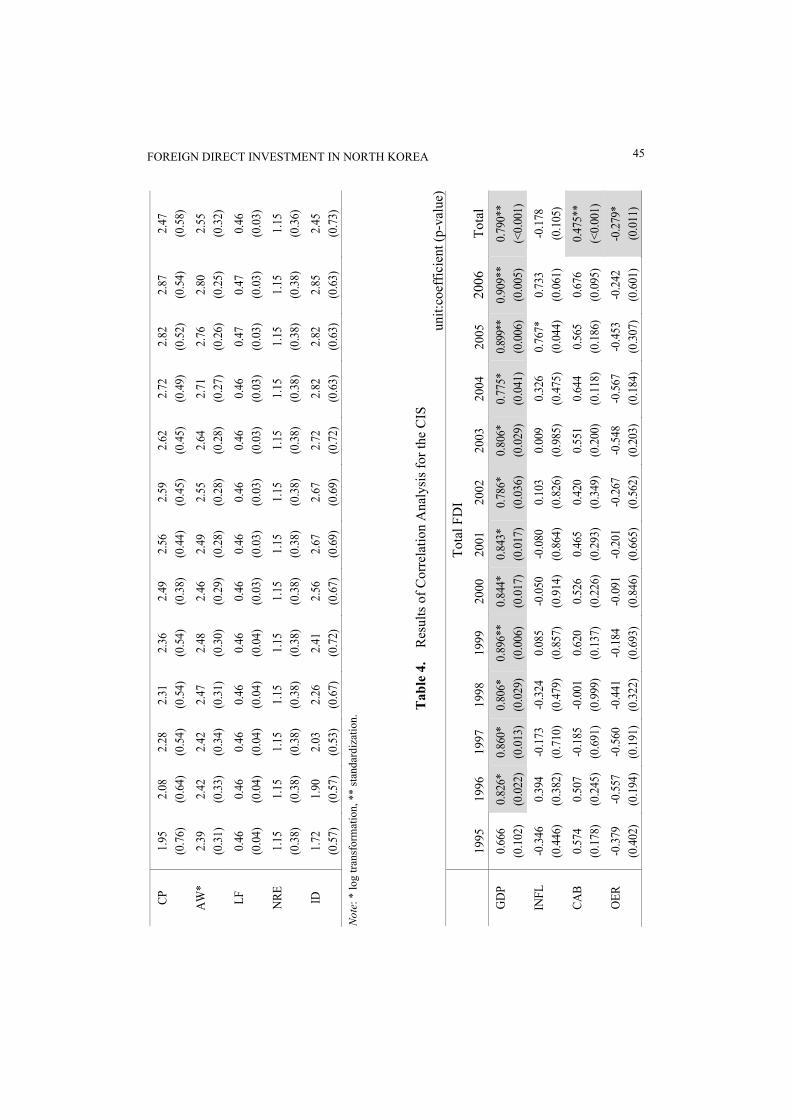
4.2. Statistical Analysis Results First, I examine the variables’ year-on-year technical statistics and conduct log
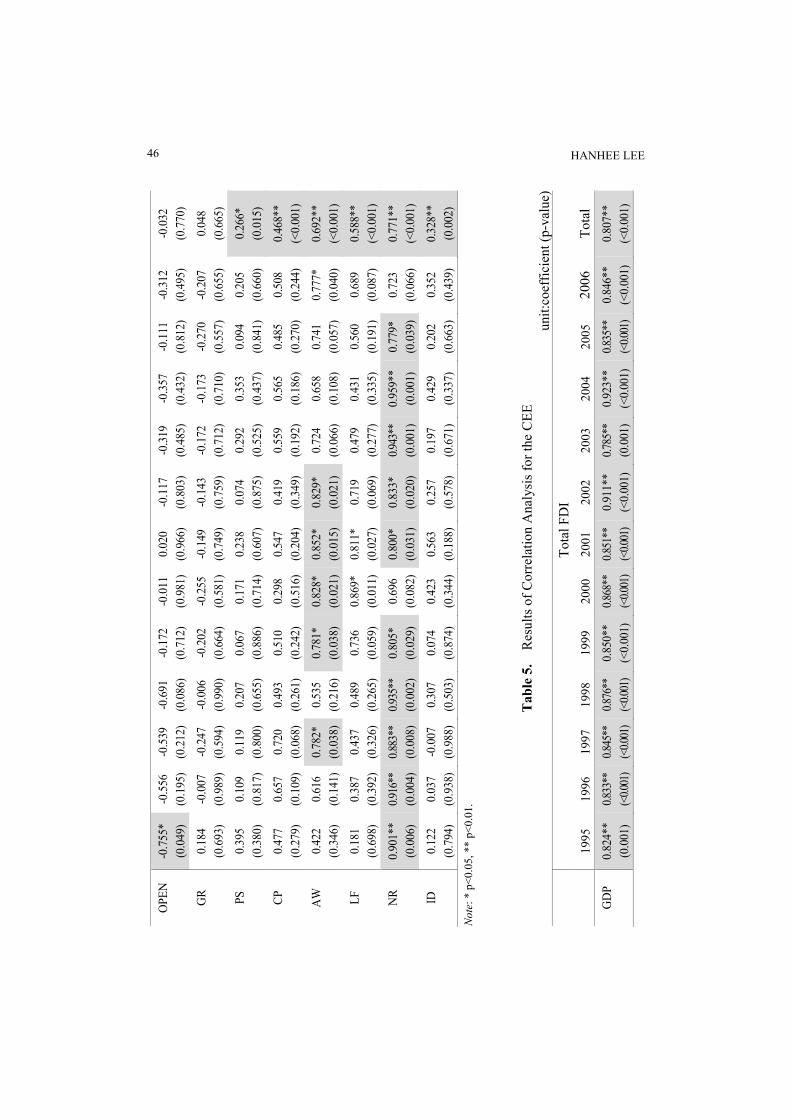
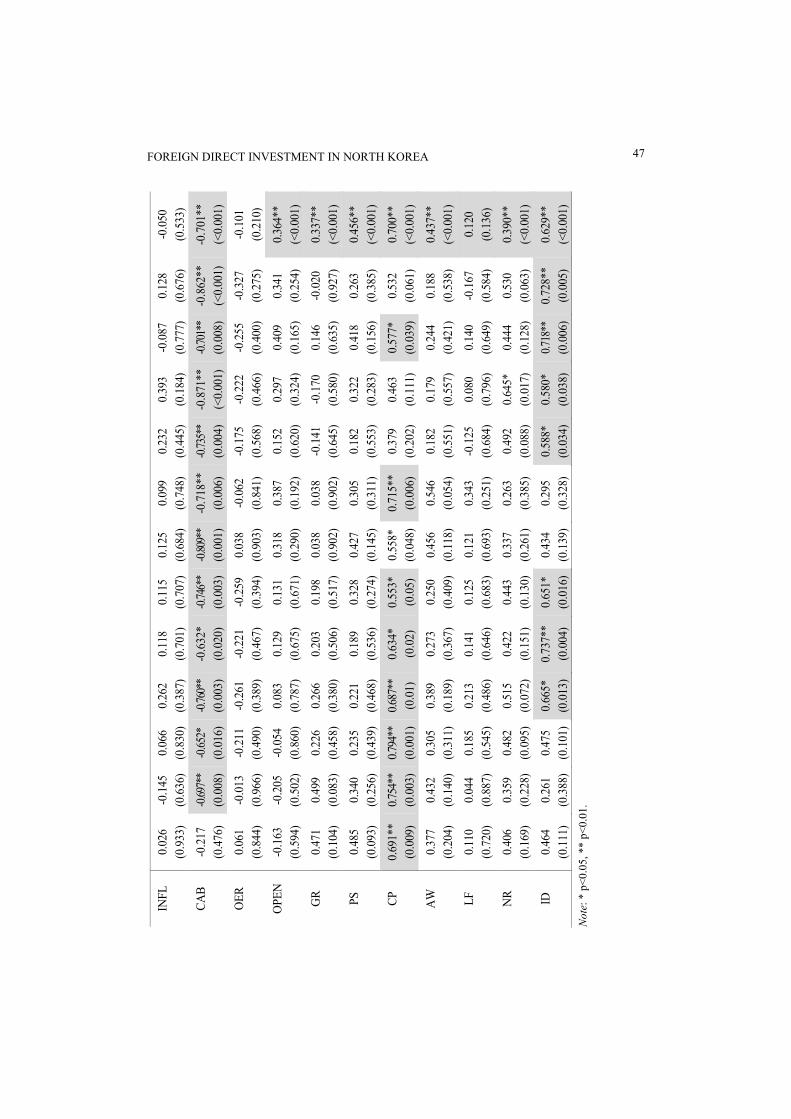
transformations and standardizations when necessary (Tables 2 and 3). Second, I run a correlation analysis between the dependent variable and the explanatory variables

HANHEE LEE 42
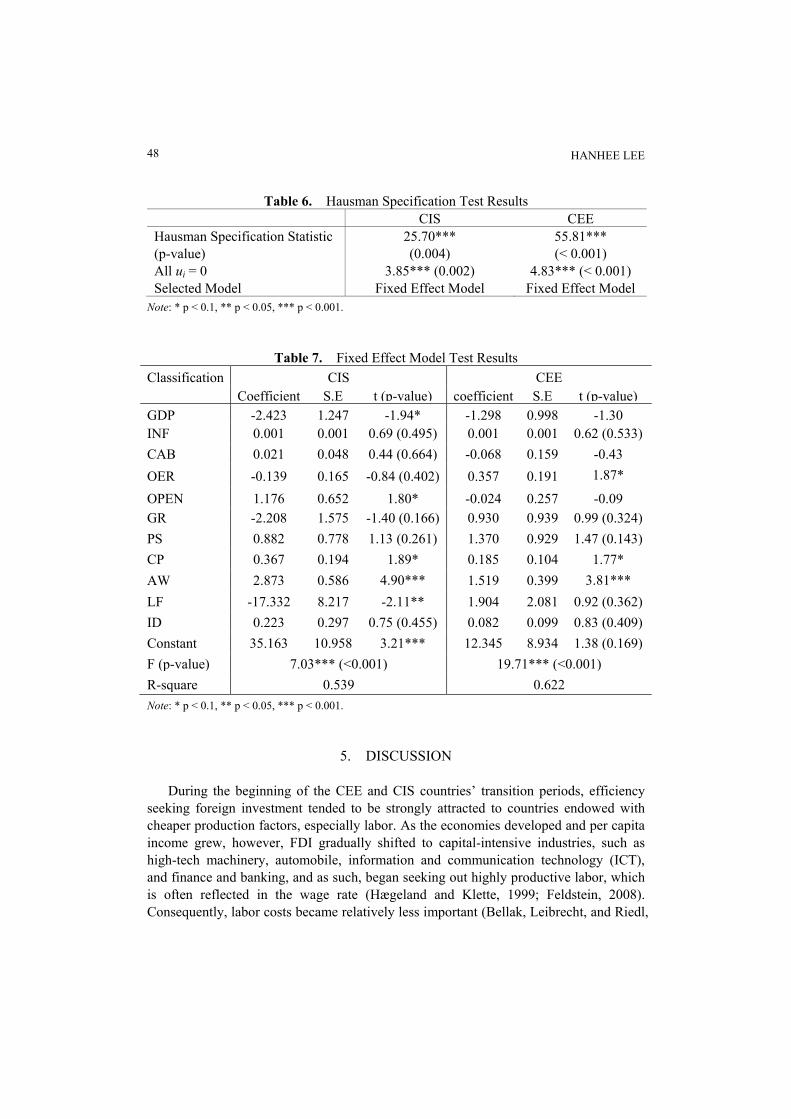
(Tables 4 and 5). Third, I conduct a Hausman specification test (Table 6) to check whether a fixed effect model or a random effect model is appropriate. Last, I run a regression analysis (Table 7). The panel regression model of the current analysis is as follows:
.)log()log()log()log(
)log()()log()()log(
11109
8765
4321
itititit
itititit
ititititiit
εIDβLFβAWβCPβPSβGRβOPENβ
OERβCABZβINFLβGDPβuαFDI
++++++++
+++++=
Here, Z(CAB) indicates the standardized CAB variable and log indicates log-
transformed variables. Natural resource endowment level is excluded because of its multicollinearity with other variables. The model is inversely transformed as follows:
.]exp[]exp[]exp[]exp[)exp()exp()exp(
)exp(]71080535667/)7.327747517(exp[]exp[)exp()]exp[(
1110
98765
43
21
ititit
ititititit
itit
ititiit
εIDβLFβAWβCPβPSβGRβOPENβ
OERβCABβINFLβGDPβuαFDI
××××××××
×−×××+=
In the case of the CEE, the Hausman specification test results in an x2 statistic of
55.81 (p<0.001) and an F-test for the null hypothesis that all the individual panel effects ui (i = 1, …, 13)=0 results in 4.83 (p<0.001), which explain the different individual panel effects. As such, the fixed effect model is selected. In the case of the CIS, the Hausman specification test resulted in an x2 statistic of 25.7 (p=0.004) and F-test for the null hypothesis that all the individual panel effects ui (i = 1, …, 7)=0 resulted in 3.85 (p =0.002), which also explain different individual panel effects. So once again, the fixed effect model is selected.
In the case of the CEE, the F-statistic for the goodness of fit test on the panel analysis model is 19.71 (p<0.001) and the model is significant at the 10% level. Explanatory variables found to be FDI determinants are OER, CP, and AW. Every one point increase in the official exchange rate, competition policy level, and average manufacturing wage leads to a total FDI increase of 1.429, 1.203, and 4.568 times, respectively. The R-square indicates the model is explanatory at the 62.2% level.
In the case of the CIS, the F-statistic for the goodness of fit test is 7.03 (p<0.001), with the model significant at the 10% level. Explanatory variables found to be FDI determinants are GDP, OPEN, CP, AW, and LF. Every one point increase in GDP, openness level, competition policy level, average manufacturing wage level, and labor force percentage leads to a total FDI increase of 0.089, 3.241, 1.443, 17.690, and 0.0000000297 times, respectively. The R-square indicates that the model is explanatory at the 53.9% level.

FOREIGN DIRECT INVESTMENT IN NORTH KOREA 43
Tab
le 2
. R
esul
ts o
f Tec
hnic
al S
tatis
tics o
f Var
iabl
es fo
r the
CIS
un
it:M
ean
(SD
) 19
95
1996
1997
1998
1999
20
0020
0120
02
2003
2004
20
0520
06
Tota
l To
tal
FDI*
8.
26
(0.7
9)
8.42
(0
.79)
8.69
(0
.69)
8.72
(0
.50)
8.64
(0
.63)
8.
27
(1.0
0)8.
38
(0.9
8)8.
58
(1.0
0)
8.84
(0
.84)
9.06
(0
.78)
9.
00
(0.8
8)9.
18
(0.8
2)
8.67
(0
.82)
G
DP*
9.
98
(0.8
2)
9.98
(0
.80)
10.0
0(0
.79)
10.0
1 (0
.77)
10.0
3 (0
.77)
10
.06
(0.7
8)10
.09
(0.7
8)10
.12
(0.7
8)
10.1
6(0
.77)
10.2
0 (0
.77)
10
.24
(0.7
7)10
.29
(0.7
6)
10.1
0 (0
.73)
IN
FL
304.
44
(235
.88)
40
.85
(15.
94)
23.8
9(2
1.32
)18
.80
(26.
17)
67.0
9 (1
12.8
7)43
.12
(63.
87)
18.5
7 (2
7.27
)11
.28
(15.
54)
11.3
1(9
.30)
13.4
0 (6
.92)
15
.29
(7.4
7)12
.57
(5.3
7)
48.3
8 (1
08.2
9)CA
B**
0.03
(0
.26)
0.
06
(0.4
0)-0
.09
(0.0
4)-0
.10
(0.0
6)0.
30
(0.8
6)
0.60
(1
.63)
0.41
(1
.19)
0.37
(1
.02)
0.
44
(1.2
5)0.
80
(2.0
8)
1.11
(2
.95)
1.20
(3
.33)
0.
43
(1.5
7)
OER
* 1.
04
(0.9
2)
1.08
(0
.92)
1.17
(0
.95)
1.26
(0
.95)
1.53
(1
.00)
1.
66
(1.0
7)1.
70
(1.1
1)1.
73
(1.1
3)
1.73
(1
.14)
1.71
(1
.14)
1.
70
(1.1
4)1.
68
(1.1
4)
1.50
(1
.02)
O
PEN
* 1.
53
(0.1
2)
1.52
(0
.13)
1.51
(0
.15)
1.52
(0
.12)
1.84
(0
.10)
1.
90
(0.1
4)1.
85
(0.1
4)1.
85
(0.1
2)
1.88
(0
.12)
1.89
(0
.15)
1.
91
(0.1
4)1.
92
(0.1
3)
1.76
(0
.21)
G
R*
1.61
(0
.07)
1.
61
(0.0
7)1.
63
(0.0
5)1.
65
(0.0
6)1.
68
(0.0
7)
1.71
(0
.06)
1.70
(0
.07)
1.71
(0
.07)
1.
72
(0.0
7)1.
73
(0.0
6)
1.74
(0
.05)
1.75
(0
.06)
1.
69
(0.0
8)
PS*
1.52
(0
.20)
1.
58
(0.2
2)1.
68
(0.1
8)1.
72
(0.2
0)1.
70
(0.1
8)
1.70
(0
.19)
1.72
(0
.19)
1.76
(0
.16)
1.
76
(0.1
6)1.
77
(0.1
7)
1.77
(0
.17)
1.77
(0
.17)
1.
70
(0.1
9)
CP
1.86
(0
.38)
1.
86
(0.3
8)1.
95
(0.4
5)1.
95
(0.4
5)1.
95
(0.4
5)
1.95
(0
.45)
2.09
(0
.16)
2.09
(0
.16)
2.
09
(0.1
6)2.
09
(0.1
6)
2.14
(0
.18)
2.14
(0
.18)
2.
02
(0.3
2)
AW
* 1.
61
(0.3
3)
1.75
(0
.34)
1.81
(0
.29)
1.82
(0
.23)
1.71
(0
.20)
1.
73
(0.2
0)1.
81
(0.2
2)1.
88
(0.2
2)
1.97
(0
.22)
2.08
(0
.23)
2.
20
(0.2
3)2.
31
(0.2
3)
1.89
(0
.31)
LF
0.
46
(0.0
4)
0.46
(0
.04)
0.46
(0
.03)
0.46
(0
.03)
0.47
(0
.03)
0.
47
(0.0
3)0.
47
(0.0
3)0.
48
(0.0
3)
0.48
(0
.03)
0.49
(0
.03)
0.
49
(0.0
3)0.
50
(0.0
3)
0.47
(0
.03)
HANHEE LEE 44
N
RE
2.00
(1
.00)
2.
00
(1.0
0)2.
00
(1.0
0)2.
00
(1.0
0)2.
00
(1.0
0)
2.00
(1
.00)
2.00
(1
.00)
2.00
(1
.00)
2.
00
(1.0
0)2.
00
(1.0
0)
2.00
(1
.00)
2.00
(1
.00)
2.
00
(0.9
3)
ID
1.29
(0
.30)
1.
38
(0.3
6)1.
48
(0.4
2)1.
52
(0.3
8)1.
62
(0.4
1)
1.71
(0
.41)
1.81
(0
.42)
1.86
(0
.38)
1.
86
(0.3
8)1.
90
(0.3
7)
1.90
(0
.37)
1.95
(0
.45)
1.
69
(0.4
2)
Not
e: *
log
trans
form
atio
n, *
* st
anda
rdiz
atio
n.
T
able
3.
Res
ults
of T
echn
ical
Sta
tistic
s of V
aria
bles
for t
he C
EE
unit:
Mea
n (S
D)
19
95
1996
1997
1998
1999
20
0020
0120
02
2003
2004
20
0520
06
Tota
l To
tal
FDI*
8.
39
(0.7
7)
8.48
(0
.69)
8.64
(0
.69)
8.85
(0
.60)
8.78
(0
.70)
8.
91
(0.5
8)9.
00
(0.5
4)8.
98
(0.6
0)
8.88
(0
.53)
9.22
(0
.51)
9.
27
(0.6
4)9.
47
(0.5
9)
8.91
(0
.67)
GD
P*
10.1
8 (0
.51)
10
.19
(0.5
1)10
.20
(0.5
1)10
.22
(0.5
0)10
.23
(0.5
0)
10.2
5(0
.50)
10.2
7 (0
.49)
10.2
9 (0
.49)
10
.31
(0.4
9)10
.33
(0.4
9)
10.3
6(0
.48)
10.3
9 (0
.48)
10
.27
(0.4
8)
INFL
29
.23
(16.
40)
24.9
5(3
1.12
)92
.72
(259.9
6)12
.53
(14.
04)
7.94
(1
2.23
) 8.
70
(11.
08)
7.08
(9
.45)
5.35
(5
.79)
4.
51
(6.2
5)5.
06
(3.3
8)
4.37
(3
.47)
4.84
(3
.21)
17
.27
(77.
22)
CAB*
* -0
.07
(0.0
8)
-0.1
5 (0
.13)
-0.1
7 (0
.16)
-0.1
8 (0
.18)
-0.2
1 (0
.31)
-0
.19
(0.2
6)-0
.17
(0.1
6)-0
.19
(0.1
7)
-0.2
4 (0
.22)
-0.3
7 (0
.36)
-0
.33
(0.2
7)-0
.48
(0.3
9)
-0.2
3 (0
.26)
OER
* 0.
75
(1.0
7)
0.82
(1
.01)
0.98
(0
.91)
1.01
(0
.91)
1.05
(0
.89)
1.
11
(0.8
9)1.
12
(0.8
8)1.
10
(0.8
8)
1.05
(0
.87)
1.01
(0
.87)
0.
99
(0.8
7)0.
99
(0.8
7)
1.00
(0
.89)
OPE
N*
1.55
(0
.16)
1.
56
(0.1
4)1.
60
(0.1
5)1.
59
(0.1
6)1.
85
(0.1
5)
1.91
(0
.17)
1.92
(0
.16)
1.91
(0
.14)
1.
92
(0.1
4)1.
95
(0.1
5)
1.96
(0
.16)
1.98
(0
.15)
1.
81
(0.2
2)
GR*
1.
71
(0.0
7)
1.73
(0
.05)
1.75
(0
.05)
1.76
(0
.06)
1.76
(0
.06)
1.
76
(0.0
5)1.
78
(0.0
6)1.
78
(0.0
5)
1.79
(0
.05)
1.79
(0
.05)
1.
79
(0.0
5)1.
80
(0.0
4)
1.77
(0
.06)
PS*
1.73
(0
.09)
1.
78
(0.0
8)1.
80
(0.0
7)1.
82
(0.0
6)1.
83
(0.0
6)
1.84
(0
.05)
1.85
(0
.05)
1.86
(0
.05)
1.
86
(0.0
5)1.
86
(0.0
4)
1.86
(0
.04)
1.86
(0
.04)
1.
83
(0.0
7)
FOREIGN DIRECT INVESTMENT IN NORTH KOREA 45
CP
1.95
(0
.76)
2.
08
(0.6
4)2.
28
(0.5
4)2.
31
(0.5
4)2.
36
(0.5
4)
2.49
(0
.38)
2.56
(0
.44)
2.59
(0
.45)
2.
62
(0.4
5)2.
72
(0.4
9)
2.82
(0
.52)
2.87
(0
.54)
2.
47
(0.5
8)
AW
* 2.
39
(0.3
1)
2.42
(0
.33)
2.42
(0
.34)
2.47
(0
.31)
2.48
(0
.30)
2.
46
(0.2
9)2.
49
(0.2
8)2.
55
(0.2
8)
2.64
(0
.28)
2.71
(0
.27)
2.
76
(0.2
6)2.
80
(0.2
5)
2.55
(0
.32)
LF
0.46
(0
.04)
0.
46
(0.0
4)0.
46
(0.0
4)0.
46
(0.0
4)0.
46
(0.0
4)
0.46
(0
.03)
0.46
(0
.03)
0.46
(0
.03)
0.
46
(0.0
3)0.
46
(0.0
3)
0.47
(0
.03)
0.47
(0
.03)
0.
46
(0.0
3)
NRE
1.
15
(0.3
8)
1.15
(0
.38)
1.15
(0
.38)
1.15
(0
.38)
1.15
(0
.38)
1.
15
(0.3
8)1.
15
(0.3
8)1.
15
(0.3
8)
1.15
(0
.38)
1.15
(0
.38)
1.
15
(0.3
8)1.
15
(0.3
8)
1.15
(0
.36)
ID
1.72
(0
.57)
1.
90
(0.5
7)2.
03
(0.5
3)2.
26
(0.6
7)2.
41
(0.7
2)
2.56
(0
.67)
2.67
(0
.69)
2.67
(0
.69)
2.
72
(0.7
2)2.
82
(0.6
3)
2.82
(0
.63)
2.85
(0
.63)
2.
45
(0.7
3)
Not
e: *
log
trans
form
atio
n, *
* st
anda
rdiz
atio
n.
T
able
4.
Res
ults
of C
orre
latio
n A
naly
sis f
or th
e C
IS
unit:
coef
ficie
nt (p
-val
ue)
To
tal F
DI
1995
19
9619
9719
9819
99
2000
2001
2002
20
0320
04
2005
2006
To
tal
GD
P 0.
666
(0.1
02)
0.82
6*(0
.022
)0.
860*
(0.0
13)
0.80
6*(0
.029
)0.
896*
*(0
.006
) 0.
844*
(0.0
17)
0.84
3*(0
.017
)0.
786*
(0
.036
) 0.
806*
(0.0
29)
0.77
5*
(0.0
41)
0.899
**(0
.006
)0.
909*
*(0
.005
) 0.
790*
* (<
0.00
1)
INFL
-0
.346
(0
.446
) 0.
394
(0.3
82)
-0.1
73(0
.710
)-0
.324
(0.4
79)
0.08
5 (0
.857
) -0
.050
(0.9
14)
-0.0
80(0
.864
)0.
103
(0.8
26)
0.00
9(0
.985
)0.
326
(0.4
75)
0.76
7*(0
.044
)0.
733
(0.0
61)
-0.1
78
(0.1
05)
CAB
0.57
4 (0
.178
) 0.
507
(0.2
45)
-0.1
85(0
.691
)-0
.001
(0.9
99)
0.62
0 (0
.137
) 0.
526
(0.2
26)
0.46
5 (0
.293
)0.
420
(0.3
49)
0.55
1(0
.200
)0.
644
(0.1
18)
0.56
5(0
.186
)0.
676
(0.0
95)
0.47
5**
(<0.
001)
OER
-0
.379
(0
.402
) -0
.557
(0.1
94)
-0.5
60(0
.191
)-0
.441
(0.3
22)
-0.1
84
(0.6
93)
-0.0
91(0
.846
)-0
.201
(0.6
65)
-0.2
67
(0.5
62)
-0.5
48(0
.203
)-0
.567
(0
.184
) -0
.453
(0.3
07)
-0.2
42
(0.6
01)
-0.2
79*
(0.0
11)
HANHEE LEE 46
O
PEN
-0
.755
* (0
.049
) -0
.556
(0.1
95)
-0.5
39(0
.212
)-0
.691
(0.0
86)
-0.1
72
(0.7
12)
-0.0
11(0
.981
)0.
020
(0.9
66)
-0.1
17
(0.8
03)
-0.3
19(0
.485
)-0
.357
(0
.432
) -0
.111
(0.8
12)
-0.3
12
(0.4
95)
-0.0
32
(0.7
70)
GR
0.18
4 (0
.693
) -0
.007
(0.9
89)
-0.2
47(0
.594
)-0
.006
(0.9
90)
-0.2
02
(0.6
64)
-0.2
55(0
.581
)-0
.149
(0.7
49)
-0.1
43
(0.7
59)
-0.1
72(0
.712
)-0
.173
(0
.710
) -0
.270
(0.5
57)
-0.2
07
(0.6
55)
0.04
8 (0
.665
)
PS
0.39
5 (0
.380
) 0.
109
(0.8
17)
0.11
9(0
.800
)0.
207
(0.6
55)
0.06
7 (0
.886
) 0.
171
(0.7
14)
0.23
8 (0
.607
)0.
074
(0.8
75)
0.29
2(0
.525
)0.
353
(0.4
37)
0.09
4(0
.841
)0.
205
(0.6
60)
0.26
6*
(0.0
15)
CP
0.47
7 (0
.279
) 0.
657
(0.1
09)
0.72
0(0
.068
)0.
493
(0.2
61)
0.51
0 (0
.242
) 0.
298
(0.5
16)
0.54
7 (0
.204
)0.
419
(0.3
49)
0.55
9(0
.192
)0.
565
(0.1
86)
0.48
5(0
.270
)0.
508
(0.2
44)
0.46
8**
(<0.
001)
AW
0.
422
(0.3
46)
0.61
6(0
.141
)0.
782*
(0.0
38)
0.53
5 (0
.216
)0.
781*
(0
.038
) 0.
828*
(0.0
21)
0.85
2*(0
.015
)0.
829*
(0
.021
) 0.
724
(0.0
66)
0.65
8 (0
.108
) 0.
741
(0.0
57)
0.77
7*
(0.0
40)
0.69
2**
(<0.
001)
LF
0.18
1 (0
.698
) 0.
387
(0.3
92)
0.43
7(0
.326
)0.
489
(0.2
65)
0.73
6 (0
.059
) 0.
869*
(0.0
11)
0.81
1*(0
.027
)0.
719
(0.0
69)
0.47
9(0
.277
)0.
431
(0.3
35)
0.56
0(0
.191
)0.
689
(0.0
87)
0.58
8**
(<0.
001)
NR
0.90
1**
(0.0
06)
0.916
**(0
.004
)0.8
83**
(0.0
08)
0.935
**(0
.002
)0.
805*
(0
.029
) 0.
696
(0.0
82)
0.80
0*(0
.031
)0.
833*
(0
.020
) 0.9
43**
(0.0
01)
0.95
9**
(0.0
01)
0.77
9*(0
.039
)0.
723
(0.0
66)
0.77
1**
(<0.
001)
ID
0.12
2 (0
.794
) 0.
037
(0.9
38)
-0.0
07(0
.988
)0.
307
(0.5
03)
0.07
4 (0
.874
) 0.
423
(0.3
44)
0.56
3 (0
.188
)0.
257
(0.5
78)
0.19
7(0
.671
)0.
429
(0.3
37)
0.20
2(0
.663
)0.
352
(0.4
39)
0.32
8**
(0.0
02)
Not
e: *
p<0
.05,
**
p<0.
01.
T
able
5.
Res
ults
of C
orre
latio
n A
naly
sis f
or th
e C
EE
unit:
coef
ficie
nt (p
-val
ue)
To
tal F
DI
1995
19
9619
9719
9819
99
2000
2001
2002
20
0320
04
2005
2006
To
tal
GD
P 0.
824*
* (0
.001
) 0.8
33**
(<0.0
01)
0.845
**(<
0.001
)0.8
76**
(<0.0
01)
0.85
0**
(<0.
001)
0.868
**(<
0.001
)0.8
51**
(<0.0
01)
0.91
1**
(<0.
001)
0.7
85**
(0.0
01)
0.92
3**
(<0.
001)
0.835
**(<
0.001
)0.
846*
*(<
0.00
1)0.
807*
* (<
0.00
1)
FOREIGN DIRECT INVESTMENT IN NORTH KOREA 47
IN
FL
0.02
6 (0
.933
) -0
.145
(0.6
36)
0.06
6(0
.830
)0.
262
(0.3
87)
0.11
8 (0
.701
) 0.
115
(0.7
07)
0.12
5 (0
.684
)0.
099
(0.7
48)
0.23
2(0
.445
)0.
393
(0.1
84)
-0.0
87(0
.777
)0.
128
(0.6
76)
-0.0
50
(0.5
33)
CAB
-0.2
17
(0.4
76)
-0.69
7**
(0.0
08)
-0.65
2*(0
.016
)-0.
760*
*(0
.003
)-0
.632
*(0
.020
) -0.
746*
*(0
.003
)-0.
809*
*(0
.001
)-0
.718
**
(0.0
06)
-0.73
5**
(0.0
04)
-0.8
71**
(<0.
001)
-0.70
1**
(0.0
08)
-0.8
62**
(<0.
001)
-0.7
01**
(<
0.00
1)
OER
0.
061
(0.8
44)
-0.0
13(0
.966
)-0
.211
(0.4
90)
-0.2
61(0
.389
)-0
.221
(0
.467
) -0
.259
(0.3
94)
0.03
8 (0
.903
)-0
.062
(0
.841
) -0
.175
(0.5
68)
-0.2
22
(0.4
66)
-0.2
55(0
.400
)-0
.327
(0
.275
) -0
.101
(0
.210
)
OPE
N
-0.1
63
(0.5
94)
-0.2
05(0
.502
)-0
.054
(0.8
60)
0.08
3 (0
.787
)0.
129
(0.6
75)
0.13
1(0
.671
)0.
318
(0.2
90)
0.38
7 (0
.192
) 0.
152
(0.6
20)
0.29
7 (0
.324
) 0.
409
(0.1
65)
0.34
1 (0
.254
) 0.
364*
* (<
0.00
1)
GR
0.47
1 (0
.104
) 0.
499
(0.0
83)
0.22
6(0
.458
)0.
266
(0.3
80)
0.20
3 (0
.506
) 0.
198
(0.5
17)
0.03
8 (0
.902
)0.
038
(0.9
02)
-0.1
41(0
.645
)-0
.170
(0
.580
) 0.
146
(0.6
35)
-0.0
20
(0.9
27)
0.33
7**
(<0.
001)
PS
0.48
5 (0
.093
) 0.
340
(0.2
56)
0.23
5(0
.439
)0.
221
(0.4
68)
0.18
9 (0
.536
) 0.
328
(0.2
74)
0.42
7 (0
.145
)0.
305
(0.3
11)
0.18
2(0
.553
)0.
322
(0.2
83)
0.41
8(0
.156
)0.
263
(0.3
85)
0.45
6**
(<0.
001)
CP
0.69
1**
(0.0
09)
0.754
**(0
.003
)0.7
94**
(0.0
01)
0.687
**(0
.01)
0.63
4*
(0.0
2)
0.55
3*(0
.05)
0.55
8*(0
.048
)0.
715*
* (0
.006
) 0.
379
(0.2
02)
0.46
3 (0
.111
) 0.
577*
(0.0
39)
0.53
2 (0
.061
) 0.
700*
* (<
0.00
1)
AW
0.
377
(0.2
04)
0.43
2(0
.140
)0.
305
(0.3
11)
0.38
9 (0
.189
)0.
273
(0.3
67)
0.25
0(0
.409
)0.
456
(0.1
18)
0.54
6 (0
.054
) 0.
182
(0.5
51)
0.17
9 (0
.557
) 0.
244
(0.4
21)
0.18
8 (0
.538
) 0.
437*
* (<
0.00
1)
LF
0.11
0 (0
.720
) 0.
044
(0.8
87)
0.18
5(0
.545
)0.
213
(0.4
86)
0.14
1 (0
.646
) 0.
125
(0.6
83)
0.12
1 (0
.693
)0.
343
(0.2
51)
-0.1
25(0
.684
)0.
080
(0.7
96)
0.14
0(0
.649
)-0
.167
(0
.584
) 0.
120
(0.1
36)
NR
0.40
6 (0
.169
) 0.
359
(0.2
28)
0.48
2(0
.095
)0.
515
(0.0
72)
0.42
2 (0
.151
) 0.
443
(0.1
30)
0.33
7 (0
.261
)0.
263
(0.3
85)
0.49
2(0
.088
)0.
645*
(0
.017
) 0.
444
(0.1
28)
0.53
0 (0
.063
) 0.
390*
* (<
0.00
1)
ID
0.46
4 (0
.111
) 0.
261
(0.3
88)
0.47
5(0
.101
)0.
665*
(0.0
13)
0.73
7**
(0.0
04)
0.65
1*(0
.016
)0.
434
(0.1
39)
0.29
5 (0
.328
) 0.
588*
(0.0
34)
0.58
0*
(0.0
38)
0.718
**(0
.006
)0.
728*
*(0
.005
) 0.
629*
* (<
0.00
1)
Not
e: *
p<0
.05,
**
p<0.
01.
HANHEE LEE 48
Table 6. Hausman Specification Test Results CIS CEE Hausman Specification Statistic (p-value)
25.70*** (0.004)
55.81*** (< 0.001)
All ui = 0 3.85*** (0.002) 4.83*** (< 0.001) Selected Model Fixed Effect Model Fixed Effect Model
Note: * p < 0.1, ** p < 0.05, *** p < 0.001.
Table 7. Fixed Effect Model Test Results Classification CIS CEE
Coefficient S.E t (p-value) coefficient S.E t (p-value) GDP -2.423 1.247 -1.94* -1.298 0.998 -1.30 INF 0.001 0.001 0.69 (0.495) 0.001 0.001 0.62 (0.533) CAB 0.021 0.048 0.44 (0.664) -0.068 0.159 -0.43 OER -0.139 0.165 -0.84 (0.402) 0.357 0.191 1.87*
OPEN 1.176 0.652 1.80* -0.024 0.257 -0.09 GR -2.208 1.575 -1.40 (0.166) 0.930 0.939 0.99 (0.324) PS 0.882 0.778 1.13 (0.261) 1.370 0.929 1.47 (0.143) CP 0.367 0.194 1.89* 0.185 0.104 1.77* AW 2.873 0.586 4.90*** 1.519 0.399 3.81*** LF -17.332 8.217 -2.11** 1.904 2.081 0.92 (0.362) ID 0.223 0.297 0.75 (0.455) 0.082 0.099 0.83 (0.409) Constant 35.163 10.958 3.21*** 12.345 8.934 1.38 (0.169) F (p-value) 7.03*** (<0.001) 19.71*** (<0.001) R-square 0.539 0.622 Note: * p < 0.1, ** p < 0.05, *** p < 0.001.
5. DISCUSSION During the beginning of the CEE and CIS countries’ transition periods, efficiency
seeking foreign investment tended to be strongly attracted to countries endowed with cheaper production factors, especially labor. As the economies developed and per capita income grew, however, FDI gradually shifted to capital-intensive industries, such as high-tech machinery, automobile, information and communication technology (ICT), and finance and banking, and as such, began seeking out highly productive labor, which is often reflected in the wage rate (Hægeland and Klette, 1999; Feldstein, 2008). Consequently, labor costs became relatively less important (Bellak, Leibrecht, and Riedl,

FOREIGN DIRECT INVESTMENT IN NORTH KOREA 49
2008). With regard to the CEE, FDI flowed primarily into the Czech Republic, Hungary,
and Poland during the initial period and expanded to the Baltic States and other countries later. Over the course of the entire transition period, these countries attracted more capital intensive FDI, which, according to UNCTAD, requires a fairly substantial and long-term commitment. The CEE and the EU markets were already expected to integrate in the early 1990s and most CEE countries became WTO members by 1996. For instance, by 1989, Poland had already signed a bilateral investment treaty and trade agreement with advanced Western economies, and Estonia abolished almost all of its trade regulations in the early 1990s. Thus, the countries already had a high and stable degree of economic openness and as such, its impact on FDI was mitigated over time. In addition, EU membership required the enactment of commercial and civil EU legislation, including trade rates, financial regulations, and competition policies (Mayhew, 1998). Efficient legal infrastructure reduced institutional uncertainties for foreign investors, facilitated the establishment and enforcement of contracts, and reduced the transaction costs of doing business (Bevan, Estrin, and Meyer, 2004).
Many CEE transition economies adopted a value-added tax (VAT) in the mid-1990s while individual and corporate income taxes reached over 40% (Svejnar, 2002, p. 13). Nevertheless, the CEE attracted a large volume of FDI by creating special economic zones (SEZs), which provide investors with financial, fiscal, and special taxation (often tax holidays) incentives as well as liberal trade regimes, customs, and regulations and world-class infrastructure. Furthermore, these zones allow firms in the same sector to locate near each other and thereby exploit spillovers and demand linkages (Campos and Kinoshita, 2003) to create an agglomeration effect. Foreign investors could also overcome the transition period’s politico-economic uncertainty and institutional volatility to produce and trade products at a globally competitive price in SEZs. The positive impact of these zones on FDI in transition economies has been empirically verified (Easson, 1998; Guagliano and Riela, 2005). According to Guagliano and Riela (2005, pp. 5-10), Poland created 25 SEZs up to 2004 and successfully attracted almost half of the regional aid from 2000 to 2003, totaling 269 million euros annually. In a scheme similar to SEZs, Hungary created industrial free-trade zones (IFTZs) in 1982 and attracted FDI in export-oriented high technology by providing incentives such as customs and VAT exemptions, import of duty-free inputs, machinery, and equipment, and the ability to keep books in a foreign currency. By late 2002, the 2,152 enterprises operating in the Hungarian IFTZs created 128,000 jobs (15.7% of total industry employment), and were responsible for 26.3% of total industrial sales and 39% of Hungary’s industrial exports. By 2004, there were 161 IFTZs and they produced the highest domestic sales turnover, exports, and profits, including over 70 Greenfield Investments, all of which were foreign owned. The Czech Republic created 142 SEZs by 2004 and offered similar benefits to those in Hungary; as such, they were able to attract a large volume of FDI and became a global production hub for personal computers and electronic appliances. Given these countries’ stabilized economic openness, legal
HANHEE LEE 50
infrastructure, and SEZ incentives, the impact of exchange rates on FDI became ever more important in the attainment of globally competitive pricing.
Meanwhile, privatization was at the core of the transition process (Aghion and Blanchard, 1994; World Bank, 2002, p. 71). CEE countries adopted free-distribution schemes in order to speed up large-scale privatization and promoted FDI-driven privatization to supplement depleting domestic savings in the early 1990s. Accordingly, as the CEE had nearly completed its privatization efforts by the late 1990s, their impact on FDI in this statistical analysis eased.
By comparison, the CIS countries experienced relatively longer transition recessions and maintained a hostile stance toward the West. The CIS recorded a serious current account deficit in the early 1990s; in Russia, the deficit averaged 12% between 1990 and 1994 (World Bank, 1997) and they even went so far as to place a moratorium on payments to foreign creditors in 1998. Consequently, what little FDI there was in the early 1990s was mainly dedicated to developing products that utilized cheap labor and existing manufacturing bases to meet the CIS’s high consumption demands. Throughout the 1990s, the potential within the CIS market was strong enough to outweigh the macroeconomic instability and attract FDI. The deficit began improving in the late 1990s when Russian president Vladimir Putin’s dirigisme, authoritarian government-led capitalism, promoted GDP growth within the CIS. However, a substantial portion of FDI in Russia was merely the result of capital flight by Russian investors; by the early 2000s, 20-30% of FDI into Russia came from Russian-owned enterprises in Cyprus, one of the world’s top six tax havens. Russia’s large-scale privatization was considered to amount to insider privatization (Mihalyi, 2001). Russia failed to open its natural resources sector to foreign investors, but opted to promote FDI in its manufacturing, financial, and service sectors. Russia allowed spontaneous, bottom-up growth in banking, resulting in the creation of hundreds of banks virtually overnight (Svejnar, 2002, p. 6). Accordingly, Russia’s tertiary sector attracted USD 23.6 billion of FDI through 2006, whereas the primary and secondary sectors attracted only USD 16.49 billion and USD 21.65 billion, respectively (UNCTAD). Therefore, both the availability of highly skilled and educated labor and labor productivity (as reflected in the wage rate) became comparatively more important (which is verified in this statistical analysis).
Though many elements of a market-based legal framework had been established by the late 1990s, the enforcement of these laws was often lax (EBRD, 1999). Due to the greater prevalence of corruption and bureaucratic coordination and intervention, the legal framework’s impact (including liberal competition policies and economic openness) on FDI was significant.
6. CONCLUSION AND IMPLICATIONS FOR NORTH KOREA My empirical analysis shows that FDI host countries should function as either
consumption markets or production markets. During the initial transition phase in
FOREIGN DIRECT INVESTMENT IN NORTH KOREA 51
production markets, efficiency plays a key role in attracting FDI. A key aspect of this relationship is multinational corporations’ search for production locations that are geographically close to the final consumer markets and that provide cheap, but skilled, labor (Bormann and Plank, 2010, p. 15). North Korea, even under Kim Jong-un’s rule, still maintains the characteristics of the former socialist countries before their collapse, such as a one-party dictatorship, a corrupt ruling class, a planned economic system, bureaucratic coordination, centralized resource distribution, soft budget constraints, a closed economy, and chronic goods shortages. When one considers that North Korea has extremely limited potential for a consumption market but has easy access to regional consumption markets (such as China and South Korea), an abundant and cheap workforce, underdeveloped institutions, and a hostility toward the idea of extensive reforms or openness, it appears that Hungary’s IFTZ business model would be the best suited to its situation. In fact, Hungary’s policies for attracting FDI to the IFTZs, such as fiscal incentives (tax holidays and tax reductions), financial incentives (grants and preferential credit), and efforts to maximize FID benefits (such as linking multinational corporations’ support to employment creation targets and investments in particular regions in order to integrate their operations into the local economy (Bormann and Plank, 2010, p. 18)), would translate well to North Korea and enable it to facilitate long term economic growth.
An excellent example of this business model that North Korea should seek to emulate is that of the Kaesong Industrial Park (KIP), which opened in December 2004 in Kaesong (about an hour’s drive from Seoul, South Korea). It is comprised of 123 South Korean companies that, as of 2014, employ more than 53,000 North Koreans and 800 South Koreans. The strengths of the KIP include abundant, cheap, and educated labor that is skilled and fluent in Korean; tax incentives; and an efficient production- distribution-consumption structure that stems from its geographical proximity to South Korea. Furthermore, the free trade agreement (FTA) between South Korea and China, sealed on November 10, 2014, concluded that all products manufactured in the KIP will be considered to be “made in South Korea.” This measure has effectively abolished the major obstacles to future KIP growth caused by international sanctions on products made in North Korea. The KIP now has potential to grow as an international industrial park and create cross-border agglomeration if it expands as a production base and promotes South Korea as an export base by incorporating more foreign capital and technology.
Despite the international sanctions placed on North Korean ICT related industries by the Wassenaar Arrangement and the US Trade with the Enemy Act, North Korea may still be able to attract multinational corporations that are specialized in labor-intensive manufacturing, such as textile and garment producers, to the KIP. In so doing, the KIP will be able to practically embody the effect of peace economics; that is, the bigger the facility, the more difficult it would be to shut down because of its significant benefits (or,
HANHEE LEE 52
conversely, the significant damage it would cause if it were shut down) to both Koreas.4 Meanwhile, the Russian dirigisme suggests not only that government intervention in
a politico-economic “coordination failure” - “a state of affairs in which the agents’ inability to coordinate their behavior (choices) leads to an outcome (equilibrium) that leaves all of the agents worse off than in an alternative situation (Todaro and Smith, 2006, p. 145)” - could facilitate economic growth, but also that economic openness and reforms, even if limited, do not necessarily result in regime instability. Currently, North Korea welcomes joint ventures with foreign companies, investment in SEZs, and foreign trade, as long as the central role of the state is maintained and the infiltration of capitalist ideologies and cultures is forbidden. However, it still has numerous investment hurdles to overcome and has long been economically underdeveloped due to the intrinsic limitations of its political and economic system and the international sanctions placed on it. My empirical analysis suggests that an SEZ business scheme alone would not remedy North Korea’s chronic shortage problems. Consequently, more radical and comprehensive reforms are needed to develop the economy.
By studying the impact of SEZs on FDI throughout former socialist countries’ transition to free-market economies, this study derives important implications regarding the mutually beneficial expansion of the KIP for both North and South Korea. A limitation of this study is that the FDI determinants within the KIP are not empirically investigated and compared to those in the transition economies; this aspect is to be explored in greater detail in future research.
REFERENCES
Agarwal, J.P. (1980), “Determinants of Foreign Direct Investment: Survey,” Review of World Economics, 116(4), 739-773.
Aghion, P., and O.J. Blanchard (1994), “On the Speed of Transition in Central Europe,” National Bureau of Economic Research Working Paper, 4736, Cambridge: MIT Press.
Bellak, C., M. Leibrecht, and A. Riedl (2008), “Labour Costs and FDI Flows into Central and Eastern European Countries: A Survey of the Literature and Empirical Evidence,” Structural Change and Economic Dynamics, 19, 17-37.
Barrell, R., and N. Pain (1999), “Domestic Institutions, Agglomeration Foreign Direct Investment in Europe,” Economic Review, 43(46), 925-934.
4 If revenue from the KIP is counted as regular income in North Korea’s planned economic system, it
becomes even harder to shut down the facility. Indeed, this is currently the case with KIP, which provides the rationale to expand the Park as previously agreed in 2000.
FOREIGN DIRECT INVESTMENT IN NORTH KOREA 53
Barrell, R., and D. Holland (2000), “Foreign Direct Investment and Enterprise Restructuring in Central Europe,” Economics of Transition, 8(2), 477-504.
Bevan, A., and S. Estrin (2000), “The Determinants of Foreign Direct Investment in Transition Economies,” William Davidson Institute Working Paper, 342.
_____ (2004), “The Determinants of Foreign Direct Investment into European Transition Economies,” Journal of Comparative Economics, 32(4), 775-787.
Bevan, A., S. Estrin, and K. Meyer (2004), “Foreign Investment Location and Institutional Development in Transition Economies,” International Business Review, 13, 43-64.
Bormann, S., and L. Plank (2010), Under Pressure: Working Conditions and Economic Development in ICT Production in Central and Eastern Europe, Berlin: World Economy, Ecology and Development (WEED).
Brenton, P., F. Di Mauro, and M. Lucke (1999), “Economic Integration and FDI: An Empirical Analysis of Foreign Investment in the EU and in Central and Eastern Europe,” Empirica, 26(2), 95-121.
Brunetti, A., G. Kisunko, and B. Weder (1997), “Institutional Obstacles to Doing Business: Region-by-Region Results from a Worldwide Survey of the Private Sector,” World Bank Working Paper Series, 1759.
Campos, N.F., and Y. Kinoshita (2003), “Why Does FDI Go Where It Goes? New Evidence from the Transition Economies,” International Monetary Fund Working Paper, WP/03/228.
Caves, R.E. (1996), Multinational Enterprise and Economic Analysis, Cambridge: Cambridge University.
Choo, J. (2008), “Mirroring North Korea’s Growing Economic Dependence on China: Political Ramifications,” Asian Survey, 48(2), 343-372.
De Melo, M. (2001), “Circumstance and Choice: The Role of Initial Conditions and Policies in Transition Economies,” The World Bank Economic Review, 15(1), 1-31.
De Melo, M., C. Denizer, and A. Gelb (1996), “From Plan to Market: Patterns of Transition,” World Bank Policy Research Working Paper, 1564.
Dhakal, D., F. Mixon, Jr., and K. Upadhyaya (2007), “Foreign Direct Investment and Transition Economies: Empirical Evidence from a Panel Data Estimator,” Economics Bulletin, 6(33), 1-9.
Dunning, J.H. (2000), “The Eclectic Paradigm of International Production: A Personal Perspective,” in Pitelis, C., and R. Sugden, ed., The Nature of the Transnational Firm, New York: Routledge, 119-139.
_____ (2004), “Institutional Reform, FDI and European Transition Economies,” in Grosse, R., ed., International Business and Government Relations in the 21st Century, New York: Cambridge University Press, 49-78.
Easson, A. (1998), “Duty-Free Zones and Special Economic Zones in Central and Eastern Europe and the Former Soviet Union,” Tax Notes International, 9.
European Bank for Reconstruction and Development (EBRD) (1999), Transition Report, London: EBRD.

HANHEE LEE 54
_____ (2008), Transition Report, London: EBRD. Feldstein, M.S. (2008), “Did Wages Reflect Growth in Productivity?” National Bureau
of Economic Research Working Paper, 13953. Grossman, G.M., and E. Helpman (1991), “Trade, Knowledge Spillovers, and Growth,”
National Bureau of Economic Research Working Paper, 3485. Guagliano, C., and S. Riela (2005), “Do Special Economic Areas Matter in Attracting
FDI? Evidence from Poland, Hungary, and Czech Republic,” Working Paper, 21, ISLA.
Haggard, S., and M. Noland (2010), “Sanctioning North Korea: The Political Economy of Denuclearization and Proliferation,” Asian Survey, 50(3), 539-568.
Hægeland, T., and T.J. Klette (1999), “Do Higher Wages Reflect Higher Productivity? Education, Gender and Experience Premiums in a Matched Plant-Worker Data Set,” in Haltiwanger, J., J. Lane, J.R. Spletzer, J. Theeuwes, and K. Troske, eds., The Creation and Analysis of Employer-Employee Matched Data, Amsterdam: North Holland.
Holland, D., and N. Pain (1998), “The Diffusion of Innovations in Central and Eastern Europe: A Study of the Determinants and Impact of Foreign Direct Investment,” National Institute of Economic and Social Research Working Paper.
Jun, K., and H. Singh (1996), “The Determinants of Foreign Direct Investment: New Empirical Evidence,” Transatlantic Corporations, 5, 67-106.
Kim, J. (2006), “The Political Economy of Chinese Investment in North Korea: A Preliminary Assessment,” Asian Survey, 46(6), 898-916.
Kornai, J. (1982), Growth, Shortage, and Efficiency: A Macrodynamic Model of the Socialist Economy, Berkeley and Los Angeles: University of California Press, 12.
Lankes, H.P., N. Stern, W.M. Blumenthal, and J. Weigl (1999), “Capital Flows to Eastern Europe,” in Feldstein, M., ed., International Capital Flows, Chicago: University of Chicago Press, 57-110.
Lankes, H.P., and A.J. Venables (1996), “Foreign Direct Investment in Economic Transition: The Changing Pattern of Investments,” The Economics of Transition, 4(2), 331-347.
Lavigne, M. (1999), The Economics of Transition: From Socialist Economy to Market Economy, New York: Palgrave Macmillan.
London, B., and R.J.S. Ross (1995), “The Political Sociology of Foreign Direct Investment,” International Journal of Comparative Sociology, 36(3-4), 198-218.
Lyles, M., and I.S. Baird (1994), “Performance of International Joint Ventures in Two Eastern European Countries: The Case of Hungary and Poland,” Management International Review, 24(4), 313-329.
Marinov, M., and S. Marinova (1996), “Characteristics and Conditions of Entrepreneurship in Eastern Europe,” Journal for East European Management Studies, 1(4), 7-24.
Mayhew, A. (1998), Recreating Europe: The European Union’s Policy towards Central and Eastern Europe, Cambridge: Cambridge University Press.
FOREIGN DIRECT INVESTMENT IN NORTH KOREA 55
Merlevede, B., and K.J.L. Schoors (2004), “How to Catch Foreign Fish? FDI and Privatization in EU Accession Countries,” William Davidson Institute Working Paper, 785.
Meyer, K.E. (1998), Direct Investment in Economies in Transition, Aldershot: Edward Elgar Publishing.
Mihalyi, P. (2001), “Foreign Direct Investment in Hungary-The Postcommunist Privatization Story Reconsidered,” Acta Oeconomica, 51(1), 107-129.
Namkung, Y. (1996), “Investment Environment of North Korea: Comparative Analysis with China and Vietnam,” Korean Journal of Unification Affairs, 8(1), 203-235.
Neuhaus, M. (2006), The Impact of FDI on Economic Growth, An Analysis for the Transition Countries of Central and Eastern Europe, New York: Physica-Verlag.
Oh, S. (2004), “North Korea’s Economic Changes and Its Implications for Overseas Korean Investors,” Korean Journal of Unification Affairs, 16(2), 33-58.
Park, J. (2010), “North Korea’s Foreign Investment Legal System and Problems: Focus on Rajin-Sunbong Economic Trade Zone Law,” Justice, 121, 471-502.
Resmini, L. (2000), “The Determinants of Foreign Direct Investment in the CEECs: New Evidence from Sectoral Patterns,” Journal of Economics of Transition, 8(3), 665-689.
Roubini, N., and P. Wachtel (1997), “Current Account Sustainability in Transition Economies,” Paper Presented at the Third Dubrovnik Conference on Transition Economies Dubrovnik, Croatia, June 1997.
Shin, H. (2012), “Problems and Prospects of Recent Foreign Investment Legislation in North Korea,” Justice, 131, 276-304.
Snyder, S. (2001), “North Korea’s Challenge of Regime Survival: Internal Problems and Implications for the Future,” Pacific Affairs, 73(4), Special Issue: Korea in Flux, 517-533.
Svejnar, J. (2002), “Transition Economies: Performance and Challenges,” Journal of Economic Perspectives, 16(1), 3-28.
Todaro, M., and S. Smith (2006), Economic Development, Edinburgh: Pearson Education, 706.
Tsai, P. (1991), “Determinants of Foreign Direct Investment in Taiwan: An Alternative Approach with Time-Series Data,” World Development, 19(2-3), 275-285.
Wacziarg, R., and K.H. Welch (2003), “Trade Liberalization and Growth: New Evidence,” National Bureau of Economic Research Working Paper, 10152.
Wheeler, D., and A. Mody (1992), “International Investment Location Decisions: The Case of US Firms,” Journal of International Economics, 33(1-2), 57-76.
World Bank (1997), Annual Report, World Bank, Washington, DC. _____ (2002), Transition, the First Ten Years: Analysis and Lessons for Eastern Europe
and the Former Soviet Union, Washington, DC: World Bank.
Database World Development Indicators, World Bank. (Available online at http://data.worldbank.
HANHEE LEE 56
org/data-catalog/world-development-indicators, last accessed in 17 November 2011). World Investment Report, United Nations Conference on Trade and Development
(UNCTAD). (Available online at http://unctadstat.unctad.org/ReportFolders/report Folders.aspx, last accessed in 15 November 2011).
Database of North Korean Economy, Bank of Korea. (Available online at http://www. bok.or.kr/broadcast.action?menuNaviId=2236, last accessed in 23 November 2011)
Mailing Address: Hanhee Lee, Sookmyung Women’s University, Cheongpa-ro 47-gil 100, Yongsan-gu, Seoul, 140-742, Korea. E-mail: [email protected].
Received May 30, 2014, Revised October 10, 2014, Accepted April 13, 2015.
Related Documents