1 Foreign Direct Investment and Uncertainty: Implications for Ethiopia Adugna Lemi (e-mail: [email protected] ), Western Michigan University, Kalamazoo Sisay Asefa (e-mail: [email protected] ), Western Michigan University, Kalamazoo Abstract The paper examines the effect of price and exchange rate uncertainty and political instability on the inflow of Foreign Direct Investment (FDI) to selected African economies. Measures of uncertainty of inflation rate and real exchange rate are incorporated by taking the conditional variance of the residual of the Autoregressive (AR) processes of each series. Pooled data result without accounting for country specific factors is misleading. Fixed effects model provides a better explanation of the variation of FDI flow to African economies. The results show that uncertainty in the rate of inflation and political instability constrain the flow of FDI only when both are combined, and when they pass some threshold level. Real exchange rate volatility impedes the inflow of FDI only when its magnitude is low. When combined with political instability, real exchange rate has an unexpected significant positive impact on the flow of foreign direct investment. Domestic market size and market potential are not significant determinants of FDI inflow, but the volume of export attracts more FDI in the case where the stock of previous FDI is small. Introduction As the world becomes highly integrated, capital inflow to developing countries also grows significantly. Capital inflow is views as a vehicle to address the pressing problems of developing countries in general and Africa in particular. The purpose of this paper is to analysis the role that uncertainty plays in affecting the inflow of capital to Africa. Uncertainties may emanate from macro economic variables like exchange rate, prices, interest rate and change is policy and rules of business transactions. Along with these uncertainties in the context of Africa, political instability plays significant role to hamper the inflow of capital. There are different forms of capital inflows to developing countries: portfolio investment (both bonds and equity) and foreign direct investment. The analysis of the later is very important in the case of African economies for two reasons. First, foreign direct investment brings to host countries not only the capital per sec but also the know-how and the technology that these countries are lacking. Second, foreign direct investment accounts for the larger share of capital inflow to these economies and their form of entry exposes the investors to instability in domestic prices, exchange rate fluctuations, frequent policy changes and political instability. These frequent changes in policy, rules, and political instabilities are common in most developing countries and even more so in the case of African economies. The objective of this paper is, therefore to show what determines FDI inflow to African economies. The most important determinants of FDI inflow, particularly in Africa, are believed to be uncertainties in terms of economic policy parameters, variability of price of resources and political instability. Given these uncertainty measures, there are also other variables that acoount for the inflow of FDI, that include market size, availability and price of resources (raw materials and labor) and infrastructure facility. Policy parameters under government control that include tax policy and other incentive mechanism are also critical to the decision of foreign direct investment. However, the focus of this paper is on uncertainty indicators through price, exchange rate and political instability. The organization of the paper is as follows. The next section presents a review of the theoretical and empirical literature on the issue of determinants of foreign direct investment with special focus on the impact of uncertainty. This section is followed by review of studies that

Welcome message from author
This document is posted to help you gain knowledge. Please leave a comment to let me know what you think about it! Share it to your friends and learn new things together.
Transcript

1
Foreign Direct Investment and Uncertainty: Implications for Ethiopia Adugna Lemi (e-mail: [email protected]), Western Michigan University, Kalamazoo
Sisay Asefa (e-mail: [email protected]), Western Michigan University, Kalamazoo
Abstract
The paper examines the effect of price and exchange rate uncertainty and political instability on the inflow of Foreign Direct Investment (FDI) to selected African economies. Measures of uncertainty of inflation rate and real exchange rate are incorporated by taking the conditional variance of the residual of the Autoregressive (AR) processes of each series. Pooled data result without accounting for country specific factors is misleading. Fixed effects model provides a better explanation of the variation of FDI flow to African economies. The results show that uncertainty in the rate of inflation and political instability constrain the flow of FDI only when both are combined, and when they pass some threshold level. Real exchange rate volatility impedes the inflow of FDI only when its magnitude is low. When combined with political instability, real exchange rate has an unexpected significant positive impact on the flow of foreign direct investment. Domestic market size and market potential are not significant determinants of FDI inflow, but the volume of export attracts more FDI in the case where the stock of previous FDI is small.
Introduction
As the world becomes highly integrated, capital inflow to developing countries also grows significantly. Capital inflow is views as a vehicle to address the pressing problems of developing countries in general and Africa in particular. The purpose of this paper is to analysis the role that uncertainty plays in affecting the inflow of capital to Africa. Uncertainties may emanate from macro economic variables like exchange rate, prices, interest rate and change is policy and rules of business transactions. Along with these uncertainties in the context of Africa, political instability plays significant role to hamper the inflow of capital.
There are different forms of capital inflows to developing countries: portfolio investment (both bonds and equity) and foreign direct investment. The analysis of the later is very important in the case of African economies for two reasons. First, foreign direct investment brings to host countries not only the capital per sec but also the know-how and the technology that these countries are lacking. Second, foreign direct investment accounts for the larger share of capital inflow to these economies and their form of entry exposes the investors to instability in domestic prices, exchange rate fluctuations, frequent policy changes and political instability. These frequent changes in policy, rules, and political instabilities are common in most developing countries and even more so in the case of African economies.
The objective of this paper is, therefore to show what determines FDI inflow to African economies. The most important determinants of FDI inflow, particularly in Africa, are believed to be uncertainties in terms of economic policy parameters, variability of price of resources and political instability. Given these uncertainty measures, there are also other variables that acoount for the inflow of FDI, that include market size, availability and price of resources (raw materials and labor) and infrastructure facility. Policy parameters under government control that include tax policy and other incentive mechanism are also critical to the decision of foreign direct investment. However, the focus of this paper is on uncertainty indicators through price, exchange rate and political instability.
The organization of the paper is as follows. The next section presents a review of the theoretical and empirical literature on the issue of determinants of foreign direct investment with special focus on the impact of uncertainty. This section is followed by review of studies that
2
deals with the case of African economies. The fourth section covers methodology and data sources followed by discussion of regression results. Finally, the paper offers concluding remarks. Literature Review
One of the reasons that are believed to affect the flow of capital from capital abundant countries to capital scarce countries is the classical unadjusted rate of return differential. Lucas (1990) questioned the result and pointed out three factors for the failure of neoclassical prediction: differences in human capital, external benefits of human capital, and capital market imperfection (which he labeled as political risk). In Sub-Saharan Africa, results from survey of international banks and investors conducted by International Monetary Fund (IMF) also shows that domestic risk factors were the main impediments to identifying and exploiting profitable opportunities compared to other regions (Bhattacharya et al. (1997)).
Recently, authors blame factors external to the domestic economy for the volatility and slow movement of capital to developing countries (Kim, 2000). Kim showed that the recent increased movement in capital is largely due to external reasons such as decreases in the world interest rate or recession in industrial countries. The question that remains is whether Africa has got its share of this capital movement.
Evidence shows that in Sub-Saharan Africa (SSA), except for Nigeria and South Africa, the inflow of capital has been declined compared to other regions of the world. Unlike the trend in emerging markets, total net capital flows in SSA registered a moderate increase in the 1980s, compared to the 1970s, and fell somewhat in 1990s (UNCTAD, 2000). What is important for this study however, is the private capital flow, particularly Foreign Direct Investment (FDI). UNCTAD (2000) reported that private capital flows in SSA have mainly consisted of Foreign Direct Investment (FDI) and short-term bank lending, while equity inflows have been more important in North Africa. Similarly, Bhattachrya et. al. (1997) pointed out that SSA countries received very modest amounts of FDI, despite the fact that rates of return on FDI have been generally higher in SSA than in other developing regions. Recently, partly because international capital markets have become inaccessible for most African economies as a result of lack of creditworthiness, foreign direct investment (FDI) is expected to play a significant role in the development of African economies.
The theory of FDI determinants suggests that the flow of FDI is a function of variables that affect profitability of firms, which in turn is affected by uncertainty in macro economic variables, government commitment to stable policy environment and political stability. The determinants of FDI inflow are different from the determinants that affect domestic private investment, in part due to the difference they have in terms of access to insider information and knowledge as to how host country system works, among other things. However, domestic private investors are not big enough and with less experience and technological know how to launch capital and technology intensive projects in SSA. As a result, some foreign investors prefer joint venture than independent direct investment both to share risk and get insider information.
Host countries has an investment opportunity that it cannot exploit itself, because of its limited access to capital markets and lack of technology, but which Multinational Corporations (MNCs) can exploit as it has the necessary capital, technology, marketing and managerial skills. These host countries have control over domestic policy and rules and regulations of business operation. Moreover, some macro economic variables are under managed system in some host countries while others determined by the market; these are subject to frequent change and hence volatility. The irreversibility nature of FDI due to large sunk costs and risk of expropriation make

3
the problem even worse. The sources of uncertainty to the MNCs are therefore, changing conditions of operation, changing major macroeconomic variables both managed and those determined by the market. To this effect, any profit that the MNCs expect from the host countries in Africa should be non-negative after those risks to invest in a particular economy are accounted for. Moreover, the adjusted return should be more attractive compared to other competing countries in the world.
Investment-uncertainty relationship studies that show investors response to uncertainty are not conclusive. Lucas and Prescott (1971) incorporated shifting demand and cost of varying capacity in general equilibrium framework to study the behavior of capital stock, output, and price. They found that demand shift leads capital stock to settle down, either with certainty or on average to a long term equilibrium level, determined by interest rates, adjustment costs, and average demand levels. Similar studies are conducted following different methodologies and data sets and arrive at different results (Abel, 1983; Aiznman and Marion, 1996; Ramey and Ramey, 1995; Lehmann, 1999; Huizenga, 1993).
Abel (1983) showed that there is positive relationship between investment and uncertainty due to the fact that existence of high uncertainty raises the marginal profitability of capital and hence increases investment. Ramey and Ramey (1995) also argue that if there is a precautionary motive for savings, then higher volatility should lead to a higher savings rate, and hence a higher investment rate.
However, the results of studies by Aiznman and Mario (1996) and Lehmann (1999) refuted the findings of Abel (1983) and are in line with the argument given by Dixit and Pindyck (1994). Dixit and Pindyck (1994) shows that there will exist an 'option' value to delay an investment decision in order to wait the arrival of new information about market conditions. This situation is pointed out for the case of African economies, where multinational move cautiously (Quelch and Austin, 1993). The existence of this 'option' value drives a wedge between the conventional net present value (NPV) calculation of the current worth of an investment project and current worth of the project to decision maker (Carruth, and et al., 1998). Lucas and Prescott (1971) also emphasis the role played by securities prices in informing firms about future investment demand. The nature of direct investment-irreversibility- also plays important role to delay the commitment of investment and result in negative relationship between investment and uncertainty.
The existing theoretical and empirical work on international capital mobility and uncertainty mainly focused on demand, exchange rate uncertainty, and political risk (Itagaki, 1981; Sung and Lapan, 2000; Campa, 1993; Firoozi, 1997; Goldberg and Kolstad, 1995). While others incorporate international capital mobility in trade models to see the effect of uncertainty (Grossman and Razin, 1984). Grossman and Razin studied the determinants of the direction of international capital movements in a model of trade in commodities and real equities. They found that physical capital flows in an uncertain world are subject to the combined influence of relative factor abundance, relative size of labor force, and relative country riskiness. The impact of taxation is also the focus of most empirical works (Billington, 1999; Gastanaga et al, 1998). The Case of Sub Saharan Africa
Studies that addressed the connection of FDI to uncertainty for the case of African economies are very rare. The exceptions are Nnadozie (2000), Bennell (1995) and Pigato (2000). Bennell studied British manufacturing investments in 14 Anglophone SSA countries using survey data in 1989 and 1994. The results showed major disinvestments during early 1990

4
despite government efforts to attract foreign investment through structural adjustment program. Although the study used firm level data and larger sample size, it used only point in time survey data and uncertainty and instability issues were not addressed directly.
The study by Pigato (2000) presented assessment of the current situation of FDI flow to African economies. However, the FDI data used by the study were not actual figures and regression was not attempted to see the role played by uncertainty. Nnadozie (2000) presents study close to this paper, in that it incorporated risk indicators. The study used US direct investment in 22 African economies for the year 1996. The uncertainty indicators used in the study were lag of inflation rate and political risk indicators. The results showed that US direct investment concentrated in countries with extractable mineral resources and economic and political risk variables were found to be the major determinants. The study used high quality data for political uncertainty though only point in time data were considered in the regression. Methodology and Data
The hypotheses that this paper address revolves around the role of economic uncertainty, political instability, labor, market size, previous level of FDI and export sector. First, it can be argued that foreign direct investment flow to African economics is aimed at exploiting the advantages of large domestic market size. Since there is no guarantee that large population generates large market size due to lack of purchasing power, market size is proxyed by private consumption expenditure.
Second, foreign direct investment flow to African economies is in search for cheap labor to produce for export to neighboring markets and to parent companies. The best indicators of cost of labor are wages and salaries. However, it is difficult to find long time series data for African economies that relates to the cost of labor. The only information available is the one provided by International Labor Organization (ILO), which is not complete for most countries. Hence cost and availability of labor force is proxed by the level of economically active labor force that include working population between the ages of 15-64. Value of export is also used in the model to test for the attractive role of large export sector.
Third, to test the hypothesis that uncertainty in major economic variables constrains flow of FDI, variance of inflation and growth rate of real exchange rate is incorporated in the FDI equation. So that even the advantages of cheap labor and raw materials cannot fully compensate for the cost of risk for FDI to target African economies as one alternative.
Finally, FDI flow also responds significantly to political instability (proxied by political instability index) and international investment guarantee provided by the host country (proxied by membership in Multilateral Investment Guarantee Agency (MIG)). Previous level of foreign direct investment in a country is also one of the determinants of the flow of FDI; particularly in economies where the market size is limited and foreign investors concentrate on specific sectors. To account for the role of the level of previous foreign direct investment lag of FDI is incorporated in the model. The variable is added to the model to see the role played by first movers, either as advantage for new comers by providing new information or by crowding out due to limited market potentials. Similar studies also pointed out that FDI target resource sectors in African economies, particularly oil and mineral sectors (Allaoua and Atkin, 1993; Nnadozie, 2000). Dummy variable for those countries1 with large mineral export sector is also added to the model to capture effect of large mineral sector.
1 See table 2 for the characteristics of sample countries.

5
Methodologies used to incorporate measures of uncertainty vary from lagged market prices of a variable of interest to estimating conditional or unconditional variance of a variable2. Autoregressive Heteroscedastic (ARCH) (Generalized Autoregressive Heteroscedastic (GARCH)) models are popular in finance literature as a vehicle for modeling volatility. ARCH (GARCH) model takes the form of a univariate Autoregressive (AR) process of a variable in question, together with a moving average process (and the conditional variance) in the square of the innovations from this AR process. Implicit risk premium embedded in the term structure of interest rates is also used as a forward-looking measure of risk compared to the conditional variances from ARCH/GARCH. However, Engle et al., (1987) showed a positive relationship between the risk premium embedded in the interest rate term structure and ARCH estimates of the conditional variance of the interest rates. They extended the simple ARCH technique of measuring conditional variances to the ARCH-M model where the conditional variance is a determinant of the current risk premium. Hence ARCH method can also be used as a proxy even as the forward-looking measure of uncertainty. Recently, ARCH is a widely used econometric technique in finance and investment empirical models.
The method used in this paper to incorporate measures of uncertainty in the FDI equation is ARCH or GARCH, that fits a series with heavy tail (large kurtosis) to follow AR process and that allows the variance of the error to be conditionally time variant. In this paper ARCH or GARCH models are estimated for the rate of inflation and real exchange rate of selected African economies. First, the series of rate of inflation and real exchange rate are tested for the presence of ARCH using the method proposed by Engel (1982). The square of the residuals from the AR processes of each series is regressed on a constant and p3 lags. The test statistics is the product of the number of observations (T) and R2 (TR2) and it is asymptotically distributed as chi-square with p degrees of freedom (X2
p). After presence of ARCH is determined, the following equation is estimated to generate
conditional variances: (1) Yt= γ0 + γ1Yt-1 + γ2Yt-2……...... + γpYt-p + εt tt θε ~ N(0,ht)
ht = α0+ α1εt-12 + α2εt-2
2 + …………αpεt-p2 t=1,……T
P= lag length of the AR model determined by Akaike information criterion (AK)4. θt is the information set. ht is the conditional variance of the error term.
The generalized form of the above ARCH model that includes variance of the error term (GARCH) can be estimated from the following equation: (2) Yt= γ + γ1 Yt-1 + γ2 Yt-2…….γpYt-p + εt ht
= α1εt-12 +α2 εt-2
2 + …………αpεt-p2 + φ1ht-1 + φ2ht-2 + φ3ht-3 +….. .. φqht-q
Hence, conditional variances of inflation and real exchange rate are estimated from the above equation.
2 For the detailed discussion of the various methodologies to measure uncertainty see Carruth and et al., 1998. 3 Lags are determined by the Akaike Information Criteria (AIC) 4 This criterion is similar in spirit to adjusted R2 in that it rewards good fit but penalizes the loss of degree of freedom (Greene, 1997).

6
qtqttptpttt hhhhh −−−−−−− +++++++= ˆ........ˆˆˆˆ............ˆˆˆ)3( 33221112
22
312
21 φφφφεαεαεαα
The econometric issue raised in this model is stationarity of the series. The series are tested both for the presence of ARCH and also for stationarity. Since the series of inflation is annual growth rates of consumer price index, one expects the series to be stationary. Similarly, for the real exchange rate since it is deflated by the ratio of US to domestic prices, it is very likely that there is no trend in the series.
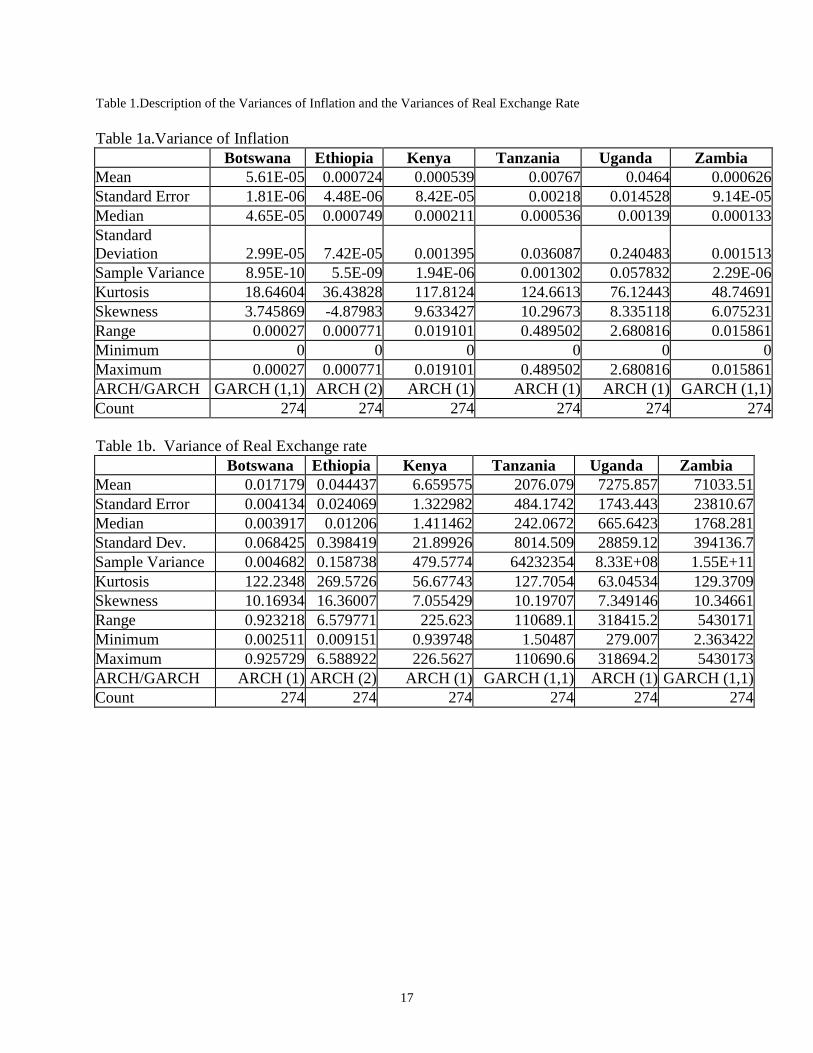
Description of the variances of inflation rate and real exchange rate series is presented in table 1 in the appendix. The description shows that all the series have heavy tail and can be used to fit ARCH (GARCH) model. Given the value of kurtosis, monthly inflation rates and monthly real exchange rates of all sample countries are found to be with heavy tail and ARCH (GARCH) of different order are fitted for these series. After the variances are obtained from the series, it is aggregated to annual values by taking the average of monthly variances so that it can be added to the FDI equation.
The popular forms of specifications for estimation of FDI model are translog function (Wheeler and Mody, 1992) to allow for interrelated marginal productivities of factors of production used by MNCs and gravity model (Summary and Summary, 1995) for bilateral capital flows. Detailed firm level data on factor use is required to see the impact of individual factor productivity and the interaction effect of two factors in the model. Gravity model is often used in analyzing bilateral trade flow, its application to capital flow is often limited due to lack of bilateral capital flow data, particularly in the case of developing countries. Given the nature of data available to test the proposed hypotheses in this paper, which is aggregate FDI from all source countries to host countries and not vise versa, neither translog nor gravity specification is appropriate.
The procedures to estimate FDI model are as follows. First, data for sample countries are pooled together and OLS regressions are run with different specification of FDI model. One of the advantages of these procedures is to estimate coefficient of a dummy variable that is constant for a country5; the other advantage is to compare the result with the fixed effects model that accounts for country specific factors. Second, two-way fixed effect specification that allows for both country and time effects is also estimated to compare the result with the one way fixed effect model, which accounts only for country specific effects. However, only fixed effects with country effects are reported; as the two-way fixed effect model fails to explain the variation in the data.
The problem that arises in time series data is the non-stationary nature of the variables and the usual practice is to take first difference of the variable if it is non-stationary. This procedure is often questioned on the ground that taking the first difference removes the information content in the variables. To overcome this problem, variables with this problem are divided by GDP of that country. This also helps to account for the country size effects and the non-stationary nature of the variables.
Two econometric issues can be raised in estimation of these models. The first one is the use of lag of the dependent variable that creates problem of simultaneity in the model. The second problem is heteroscedasticity, specifically groupwise heteroscedasticty in the case of panel data. The solution for the first problem of simultaneity is to use instrumental variable to proxy the lagged dependent variable. For the second one heteroscedastic corrected variance are used by applying white estimation. 5 In this case dummy variable for the large mining product export is created, mine=1 for countries with large mineral/mining production (Botswana, Uganda and Zambia) 0 otherwise.

7
To exploit the possibility of nonlinear relationship of the variables square terms of the
variables of interest are also used in the model. Square of variance of inflation, variance of real exchange rate and political instability indicators and their interaction terms are used.
Separate models are estimated for variance of inflation and variance of real exchange rate to overcome possible problem of simultaneity and to see the individual effects of each of the variances and their role together with political uncertainty indicators.
For the variance of inflation the following model is estimated: (4) FDIR it = β1 + β2VINFR it + β3LABR it + β4PLFDIR it + β5MIG it + β6GGDP it + β7PCONR
it +β8EXPR it + β9POL it + β10POLVINFR it + β11POL it 2 + β12VINFR it
2 + ε it Where Where FDIR is Ratio of Net Foreign Direct Investment to GDP6, VINF is Conditional Variance of Inflation, LABR is Ratio of Economically Active Labor Force to Population, PLFDIR is Predicted value of lagged ratio of FDI to GDP7, MIG is Dummy for Membership in Multilateral Investment Guarantee Agency, GGDP is Growth rate of GDP per Capita, PCONR is Ratio of private consumption expenditure to GDP, EXPR is Ratio of Export to GDP, and POL is Political freedom indicators. Other variable that should be added in the pooled data is dummy variable for the mining sector. This variable has value of 1 for those countries dominated by mining sector exports (Botswana, Uganda and Zambia) and 0 for others (Ethiopia, Kenya and Tanzania). Privatization is also one measure that less developed countries trust to bring about the inflow of foreign capital. However, most African countries launch privatization policy and almost at the same time join Multilateral Investment Guarantee Agency. Hence both variables proxy similar policy drive and hence used alternatively to see if domestic policy changes have impact in attracting FDI. Interaction terms of variance of inflation and political instability and variance of real exchange rate and political instability are also added to see the combined effect of economic and political uncertainty.
Similar model is also estimated for real exchange rate uncertainty. The following model is estimated: 5 FDIR it = β1 + β2VRER it + β3LABR it + β4PLFDIR it + β5MIG it + β6GGDP it + β7PCONR it +β8EXPR it + β9POL it + β10POLVRER it + β11POL it
2 + β12VRER it 2 +ε it
Where VRER = Conditional Variance of Real Exchange Rate. All other variables are the same as in equation (4).
The expected sign for the measure of uncertainty is not clear from economic theory. Positive sign implies that firms invest more in foreign markets to diversify production and to use that market as shock absorber and to compete with rival competitor, which is strategic motive. On the other hand, neoclassical theory implies that firms lower investment when there is uncertainty. The expected sign for lagged FDI is positive, as firms learn and follow first movers after they get new information in terms of profits and risk situation in that particular host country. It is also possible that if the market is already crowded, the existence of previous FDI shows irreversible investment and commitment by the first movers and new firms hesitate to enter the already crowded market. 6 Net of inflow and outflow is used in this paper, in similar studies authors used only inflow, however, in countries where outflow is large using only inflow will bias the result. For instance, in our case there are signs that show there is tendency of more outflow in Botswana and Zambia. 7 We used instrumental variables to predict lagged dependent variable to use as regressor. The instruments used to predict lag of FDI are LFDIR it = LLABR it + LEXPR it + LPOL it + LPCON it (all regressors are lag of the regressors used in equation 4)

8
Positive sign is expected for economically active labor force, PCONR and MIG. PCONR is a measure of effective market size of the country and foreign firms may sell some of its products to domestic consumers even though their target is to export. MIG or privatization policy is to capture commitment from the government side and positive sign may imply that investors are taking advantage of policies and government commitment (after controlling for political freedom indicator (POL)). The squares of variance of inflation (VINF2), real exchange rate (VRER2) and political freedom indicator (POL2) are also added to the model to explore nonlinear relationship between the variables. Market potential is often captured by growth rate of GDP. Again high growth rate may encourage investment unless there is crowed out effect by domestic firms.
As most of the macro variables are determined together, it is possible that some of these variables correlate and affect the regression results. To see the robustness of the regression results, different specification of FDI models are estimated. Two different specifications are estimated using the pooled data: one with the squared terms and the other without. In the fixed effects model eight different specifications are estimated by alternating variables suspected to be determined simultaneously. In tables 5 and 6, the specifications are from A-H, where the first two models (A and B) are without the square terms and model B includes MIG. The other specifications C-H have square terms but differ by alternating four variables (EXPR, PFDIR, MIG, GGDP). Data
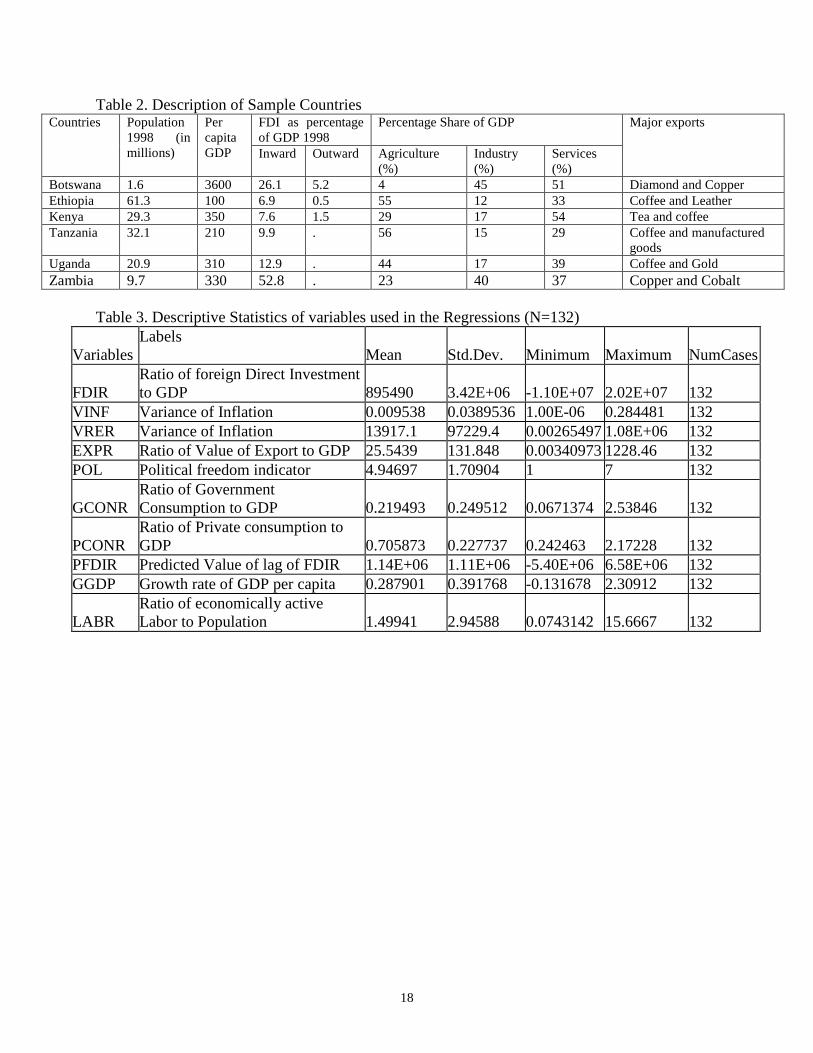
Initially, countries are selected based on availability of data for FDI and other important determinants. Then to incorporate measures of uncertainty based on the methodology discussed above, countries are selected based on the data as to whether it allows to fit ARCH or GARCH model to get the conditional variance series. Hence six countries (Botswana, Ethiopia, Kenya, Tanzania, Uganda and Zambia) are selected based on the above criteria. The main source of data is International Financial Statistics of International Monetary Fund. The variables are annual FDI-net foreign direct investment- from 1975-1997, monthly CPI-consumer price index-from 1975-1997 and monthly exchange rate from 1975-1997 for the sample countries. Other annual control variables are economically active labor force, political freedom index (from freedom house), growth rate of real GDP, dummy for membership in Multilateral Investment Guarantee Agency, and growth rate of private consumption expenditure. Descriptive statistics of the variables are shown in table 3 in the appendix. Major economic indicators of sample countries are also shown in table 2 in the appendix. Definition of and sources of variables are also presented in appendix.
Case of Ethiopia
9
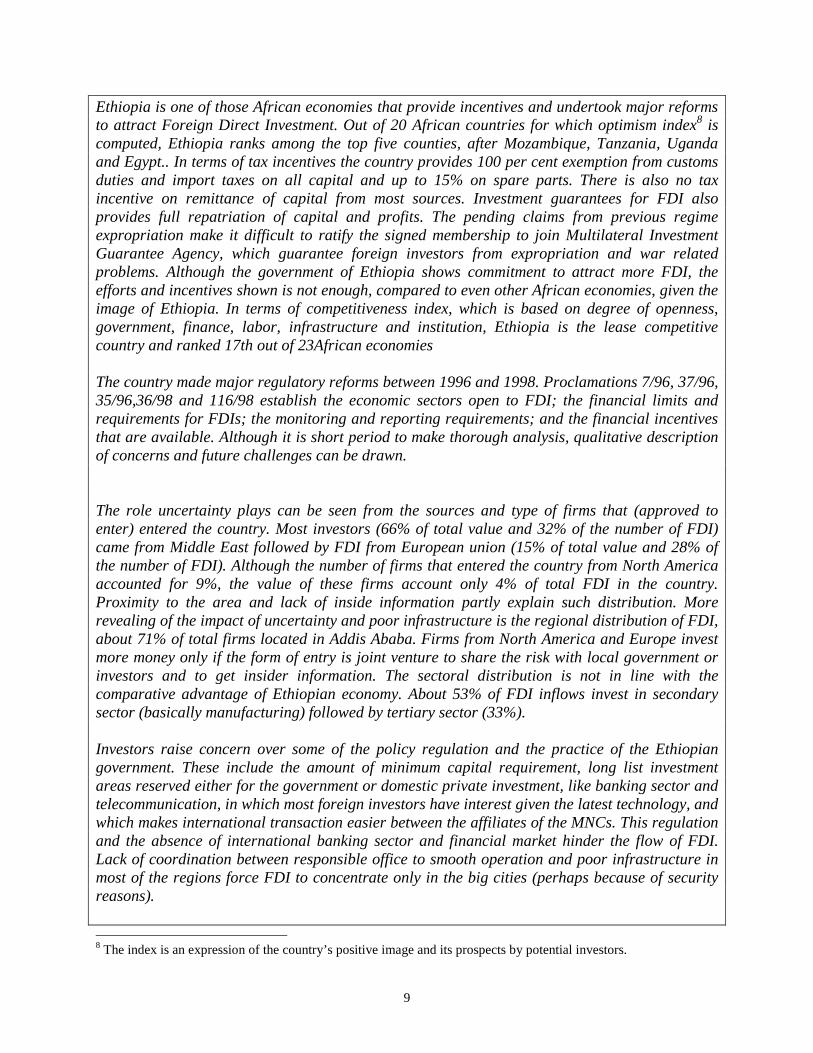
Ethiopia is one of those African economies that provide incentives and undertook major reforms to attract Foreign Direct Investment. Out of 20 African countries for which optimism index8 is computed, Ethiopia ranks among the top five counties, after Mozambique, Tanzania, Uganda and Egypt.. In terms of tax incentives the country provides 100 per cent exemption from customs duties and import taxes on all capital and up to 15% on spare parts. There is also no tax incentive on remittance of capital from most sources. Investment guarantees for FDI also provides full repatriation of capital and profits. The pending claims from previous regime expropriation make it difficult to ratify the signed membership to join Multilateral Investment Guarantee Agency, which guarantee foreign investors from expropriation and war related problems. Although the government of Ethiopia shows commitment to attract more FDI, the efforts and incentives shown is not enough, compared to even other African economies, given the image of Ethiopia. In terms of competitiveness index, which is based on degree of openness, government, finance, labor, infrastructure and institution, Ethiopia is the lease competitive country and ranked 17th out of 23African economies The country made major regulatory reforms between 1996 and 1998. Proclamations 7/96, 37/96, 35/96,36/98 and 116/98 establish the economic sectors open to FDI; the financial limits and requirements for FDIs; the monitoring and reporting requirements; and the financial incentives that are available. Although it is short period to make thorough analysis, qualitative description of concerns and future challenges can be drawn. The role uncertainty plays can be seen from the sources and type of firms that (approved to enter) entered the country. Most investors (66% of total value and 32% of the number of FDI) came from Middle East followed by FDI from European union (15% of total value and 28% of the number of FDI). Although the number of firms that entered the country from North America accounted for 9%, the value of these firms account only 4% of total FDI in the country. Proximity to the area and lack of inside information partly explain such distribution. More revealing of the impact of uncertainty and poor infrastructure is the regional distribution of FDI, about 71% of total firms located in Addis Ababa. Firms from North America and Europe invest more money only if the form of entry is joint venture to share the risk with local government or investors and to get insider information. The sectoral distribution is not in line with the comparative advantage of Ethiopian economy. About 53% of FDI inflows invest in secondary sector (basically manufacturing) followed by tertiary sector (33%). Investors raise concern over some of the policy regulation and the practice of the Ethiopian government. These include the amount of minimum capital requirement, long list investment areas reserved either for the government or domestic private investment, like banking sector and telecommunication, in which most foreign investors have interest given the latest technology, and which makes international transaction easier between the affiliates of the MNCs. This regulation and the absence of international banking sector and financial market hinder the flow of FDI. Lack of coordination between responsible office to smooth operation and poor infrastructure in most of the regions force FDI to concentrate only in the big cities (perhaps because of security reasons). 8 The index is an expression of the country’s positive image and its prospects by potential investors.

10
The country has to further open sectors for which there is no comparative advantage to benefit from the new technology. Capital limit also constrains the current knowledge intensive investments and reconsidering the limits is also worthwhile to be competitive. Finally, building confidence of foreign investors is the future challenge of the government hence intensive promotion with strong sign of commitment must be put in place to attract investors with full potential. Regression Results
The result of the test for the presence of ARCH shows that there is ARCH process for the rates of inflation. The result for the real exchange rate is not statistically significant. However, after dropping five years data when exchange rate was managed and pegged to foreign currencies at fixed rate, the test shows that there exists ARCH process in the data for most of the countries. Stationarity test of the rate of inflation and real exchange rate also shows that there is no trend in the series. The result is expected since inflation is rate of change and real exchange rate is deflated by the ratio of prices. After the orders of the series are determined based on the AK information criteria, ARCH/GARCH of different orders are estimated for all the sample countries. Table 1 in the appendix shows descriptive of the series and the ARCH/GARCH models fitted for the series.
Even though the test for the presence of ARCH failed for real exchange rate of Tanzania and Zambia, the result shows significant nonlinear relationship in the residuals of the AR process. Hence ARCH or GARCH models are fitted for each of the series. All the models are estimated without imposing the non-negativity condition on the coefficients. Inflation rate of Ethiopia violates the regularity conditions as negative values of ARCH coefficients are encountered. Engle (1982) recognized this problem and imply that the non-negativity and stationarity constraints on the coefficients would be hard to satisfy in an unrestricted model. In almost all cases after fitting ARCH or GARCH to the residuals, the sample kurtosis become smaller than before and hence the model takes care of the heavy tail of the series. However, none of the residuals pass the test for normality after estimating ARCH or GARCH. ARCH (GARCH) variance series is generated out of the regression and aggregated to annual values to be added in the FDI equation.
For the pooled data, OLS regression is run without country dummies and the results are reported in table 4 in the appendix. Some of the results of these specifications are misleading as control variable for country specific factors are missing. Dummy variable for mining sector (MINE), domestic market potential indicator (GGDP) and domestic market size indicator (PCONR) have the expected signs. Large mining sector attracts more foreign capital inflow and both domestic market size potential and domestic market size are significant determinants to attract foreign investors. Furthermore, the latter two affects FDI inflow in the same directions by constraining inflow of investment probably due to crowded market size as domestic investors grow. The signs of the other variables are misleading. Economically active labor force (LABR) and value of export have negative sign, which is against the hypothesis and findings of similar papers.
Economic uncertainty indicators (VINF and VRER) are not significant both in linear and square terms. However, political uncertainty indicator has unexpected positive sign in linear form but negative sign in square terms. This proves that it is only after some threshold level that

11
political instability become a factor for foreign investors as to whether to invest in a country or not.
The one way fixed effects9 regression results are presented in tables 5 and 6 in the appendix, for variance of inflation and exchange rate, respectively. Interaction terms between economic uncertainty indicators (inflation and real exchange rate) and political instability are also added to the model in all specification. This helps to compute the full effect of economic uncertainty and political instability. The full effects are computed as follows:
Let X and Y are the variables of interest and XY is the interaction term. Let a, b and c are the respective coefficients and x and y be the means of X and Y. Full effect of X = a + c (y ) Full effect of Y= b + c (x ) However, to test the significance of the full effect coefficients the standard error (and probably the covariance) of the combined coefficients need to be computed. However, in this paper the significance of the full effect coefficients is not determined due to the difficulty of determining covariance of the combined coefficients.
Economic uncertainty proxied by variance of inflation (VINF) affects FDI inflows positively in cases where it is significant. This result goes in line with the findings of Lucas and Prescott (1971), in which case it captures shifts in demand that leads investment towards long run equilibrium. However, the square term has negative sign and is significant in the last two specifications. This result is similar to that of political instability indicator (POL) as shown in the OLS regression results in table 4. In table 5 also after accounting for country specific factors both economic uncertainty and political instability indicators have positive signs but the role of both variables in attracting FDI is at declining rates as both square terms have negative signs.
The interaction term (POLINF) also has negative sign, which supports the view that it is only when economic and political uncertainties are combined that constrains flow of FDI to sample countries. The variable has negative sign in most specifications and significant in two of the cases.
The full effect of both variables that measures uncertainty (POL and VINF) also shows that variance in prices that captures shift in demand helps to attract more foreign direct investment. The same is true for some degree of political control until it gets to the point where investors start to be concerned about it.
The other result that contradicts OLS regression results is that both economically active labor force (LABR) and export (EXPR) contributes positively in attracting FDI. However, role of export becomes weak once previous levels of investment (PFDIR) are accounted for; taken alone the role of previous investment is positive in attracting new FDI.
One variable that has unexpected sign is Multilateral Investment Guarantee (MIG) membership, which has negative and significant effect in attracting FDI. It is indicated that most economies launch privatization policy during the late 80s or early 90s and during the same years volatility in economic variables rises in those economies. At the same time other countries in East Europe, Asia and Latin America increased their efforts to compete for FDI (Kim, 2000). African economies join MIG to give access to all countries with no preferential treatment to a given country and to provide guarantee to all international investors. That put African economies in free competition with other economies in which case investors shift to other countries with better services, market and infrastructure despite countries resource base. This
9 One way fixed effects better represent the data compared to two ways, hence only one way fixed effects are reported here.

12
may imply that countries should reconsider their policies to be in similar footing with other countries and to be attractive.
The market size indicators (GGDP and PCONR) have negative signs as in the case of the pooled data results and are significant in most of the cases. Again this proves that the unexpected result of economic progress and/or the limited market size and market potential that impede foreign capital inflow as the markets get saturated easily.
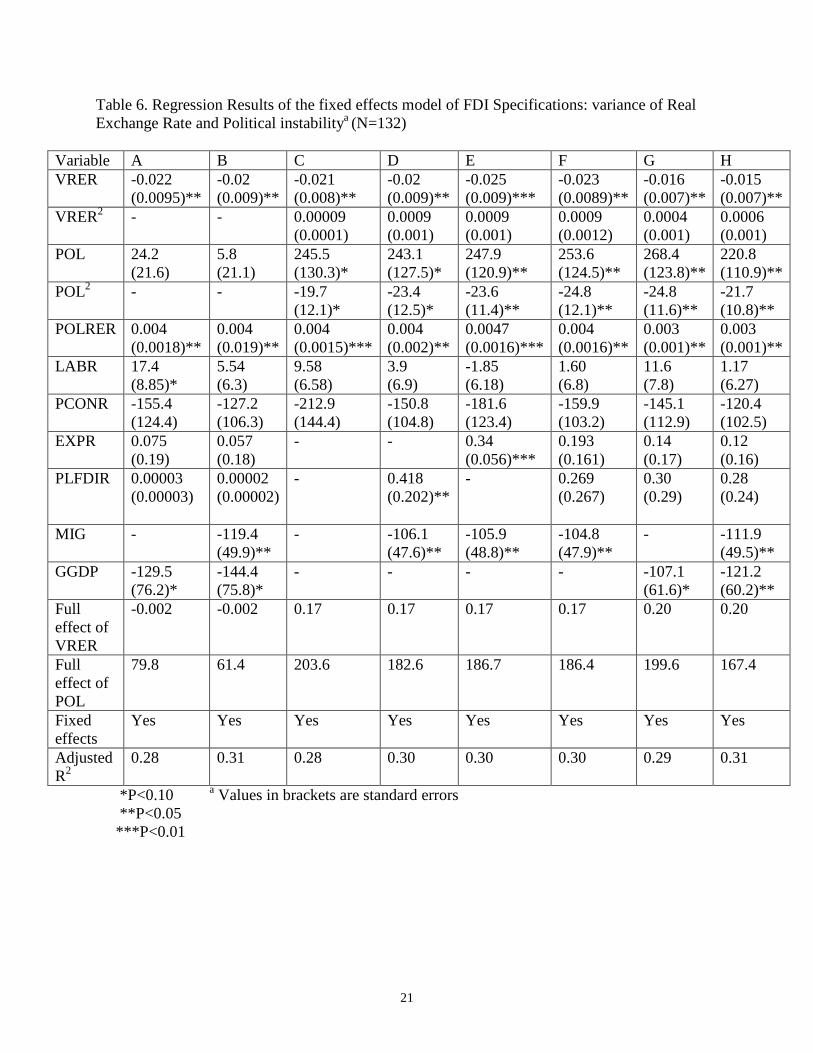
The results of the estimation that uses variance of real exchange rate (VRER) and all other variables similar to the above regressions are reported in table 6 in the appendix. The signs and significance of most common variables are similar to the results in table 5 for LABR, EXPR, MIG, GGDP, PCONR, and PFDIR.
The impact of variance of real exchange rate (VRER) has different impact in attracting investment compared to variance of inflation (VINF). In all the specifications VRER affects FDI flow negatively and significantly. This implies that FDI inflows target export sector and concerned about the repatriation of profits so that fluctuation in real exchange rate hinders their investment in those African economies. Campa (1993) arrives at similar conclusion for the FDI inflow to US. This result is also in line with the argument that there exists ‘option’ value that delays current investment. The “wait and see” principle of investors until new information arrives is applicable in this case. The square term of variance of real exchange rate is not significant in all specifications. When VRER is combined with political instability indicator, the interaction term has positive impact in attracting FDI and is significant in all the specifications. Probably, this is due to the fact that most investors enter these host countries to exploit the export sector and the influence of domestic political instability is limited. It also has to do with the impact of devaluation, as most African economies undertook devaluation mostly in recent years where variance of exchange rate is high. The high variance of exchange rate (when interacted with political instability) captures the impact of devaluation on export sector.
Full effect of political control has the same effect as in table 5 in that some degree of political control helps attract foreign investors. However, the full effect of variance of real exchange rate is mixed due to the opposite effect of variance of real exchange rate alone and its interaction term with political instability indicator. Concluding Remarks
The paper estimates FDI model for panel of six African economies by incorporating economic and political uncertainty. Both pooled data and fixed effects model are estimated for the sample countries. Variance of rate of price change and real exchange rate are used as indicators of economic uncertainty together with measure for political instability.
The result shows that pooled data regressions without taking into account country specific factors are misleading. One way fixed effect model better explains the data. Results of the fixed effect model show that both inflation uncertainty and political instability indicators attract investment flow only until it reaches the threshold level where investors start to worry about uncertainty. Both the interaction and the square terms of variance of inflation and political instability have negative signs, which proves that it is only higher level of uncertainty that impede FDI inflow to these African economies. That can also be explained by Dixit’s hysteresis model that widens the Marshallian entry and exit range for investment.
Export sector that is dominated by mining has also important role in attracting FDI and hence exchange rate uncertainty is even more important decision variable for those foreign investors targeting mining sector. Variance of Real exchange rate is important determinant both
13
because it determines price of exports and also investors are concerned about repatriating their profit. The result shows that variance of real exchange rate constrains the FDI inflow in linear terms; however, when combined with political instability and in its square terms, it has positive sign. This is probably due to the fact that it picks the effect of devaluation that works as incentive for exporters and also attracts foreign investors to the export sector.
Given the country specific effects, the results of this study lead to further research based on country level and even firm and sector level analysis to better understand the determinants of FDI to Africa. It is also important to consider the sectors that FDI firms target and the characteristics of these sectors. Study on African economies alone is not enough to get complete picture of the determinants of FDI to Africa without considering determinants of capital flow to the rest of the world. As world becomes highly integrated, it is crucial to learn and draw lessons from similar developing countries in Asia and Latin America, hence comparative analysis worth considering in future research.

14
References Abel, Andrew B.(1983) Optimal Investment Under Uncertainty, American Economic
Review, Vol. 73, No. 1, March, 228-233. Aizemman, Joshua and Marion, Nancy P.(1996) Volatility and the Investment Response,
NBER working paper 5841. Allaoua, Abdelkader and Atkin, Micheal (1993) FDI in Africa: Trends, Constraints and
Challenges, Economic Commission for Africa (ECA), Addis Ababa, Ethiopia. Bennell Paul (1995) British Manufacturing Investment in Sub-Saharan Africa: Corporate
Responses During Structural Adjustment, The Journal of Development Studies, Vol 32, No.2, December.
Bhattacharya, Amar, Peter J.Montiel, and Sunil Sharma (1997) How Can Sub-Saharan Africa Attract More Private Capital Inflows? Finance and Development, June.
Billington, Nicholas (1999) The location of Foreign Direct Investment: An Empirical Analysis, Applied Economics, 31.
Campa J. Manual (1993) Entry by Foreign Firms in the United States Under Exchange Rate Uncertainty, The Review of Economics and Statistics, 75.
Carruth, Alan, Dickerson, Andy and Henley, Andrew (1998) What do we know about Investment and Uncertainty? Department of Economics, University of Kent, UK.
Dixit, Avinash and Pindyck, Robert S. (1994) Investment Under Uncertainty, Princeton, Princeton University Press.
Dunning, John H. and Rugman, Alan M. (1985) The Influence of Mymer’s Dissertation on the Theory of Foreign Direct Investment, American Economic Review, Vol.75, No.2, May, 228-233.
Engle, Robert F. (1983) Estimates of the Variance of US inflation based upon the ARCH model, Journal of Money Credit and Banking, Vol.15, No.3, August, 286-301.
Engle, Robert F., Lillien, David and Robbins Russell P. (1987) Estimating Time Varying Risk Premia in the Term Structure: The ARCH-M model, Econometrica, Vol. 55, No.2, March, 391-407.
Financial Times, Ethiopia Moves Up Competitiveness Index, 22/06/2000. Freedom House, Annual Survey of Freedom Country Ratings 1972-73 to 1999-00, 2000. Firoozi, Fathali (1997) Multinationals FDI and Uncertainty: an exposition, Journal of
Multinational Financial Management, No. 7. Gastanga, M. Victor, Nugent Jeffrey and Pashamova, Bistra (1998) Host Country
Reforms and FDI Inflows: How Much Different Do They Make? World Development, Vol. 26, No.7.
Goldberg, Linda, S. and Kolstad, D. Charles (1995) Foreign Direct Investment, Exchange Rate Variability and Demand Uncertainty, International Economic Review, Vol. 36 No. 4, November.
Greene, William (1997) Econometric Analysis, Third edition, Prentice Hall. Grossman, Gene and Razin Assaf (1984) International Capital Movement Under
Uncertainty, The Journal of Political Economy, Vol 92, Issue 2, April. Huizenga, John (1993) Inflation Uncertainty, and Investment in U.S Manufacturing,
Journal of Money, Credit and Banking, Vol.25. Issue 3. Itagaki, Takao (1981) The Theory of Multinational Firm Under Exchange Rate
Uncertainty, Canadian Journal of Economics, XIV, No.2, May.
15
Kim, Yoonbai (2000) Causes of Capital Flows in Developing Countries, Journal of International Money and Finance, 19, 235-253.
Lehmann, Alexander (1999) Country Risks and the Investment Activity of U.S. Multinationals in Developing Countries. IMF working paper WP /99/133.
Lucas, Robert E. (1990) Why Doesn’t Capital Flow from Rich to Poor Countries? American Economic Review, Vol. 80, No.2.
Lucas, Robert E. and Prescott, Edward C. (1971) Investment Under Uncertainty, Econometrica, Vol.39, Issue 5, September.
Nnadozie, Emmanuel (2000) What Determines US Direct Investment in African Countries? Truman State University.
Pigato, Miria (2000) Foreign Direct Investment in Africa: Old tales and New Evidence, Africa Region Working paper series, November.
Quelch, John A. and James E. Austin (1993) Should Multinationals Invest in Africa? Sloan Management Review, Spring.
Ramey, Grey and Ramey Valerie (1995) Cross-country Evidence on the Link Between Volatility and Growth, American Economic Review, Vol.85, No.5, December, 1138-1151.
Summary, Rebecca and Summary, Larry J. (1995) The Political Economy of United States Foreign Direct Investment in Developing Countries: An Empirical Analysis, Quarterly Journal of Business and Economies, Vol. 34, No.3, Summer.
Sung, Hongmo and Lapan, Harvey (2000) Strategic Foreign Direct Investment and Exchange Rate Uncertainty, International Economic Review, Vol. 41, No.2, May.
Teece, David J. (1985) Multinational Enterprise, Internal Governance, and Industrial Organization, American Economic Review, Vol.75, No.2, May, 233-238.
United Nations (1998) World Investment Report: Trends and Determinants: Overview. Geneva.
United Nations Conference on Trade and Development (UNCTAD) (2000) Capital Flows and Growth in Africa, United Nations, New York and Geneva.
Wheeler, David and Mody, Ashoka (1992) International Investment Location Decisions: The case of U.S. Firms, Journal of International Economics, 33.
16
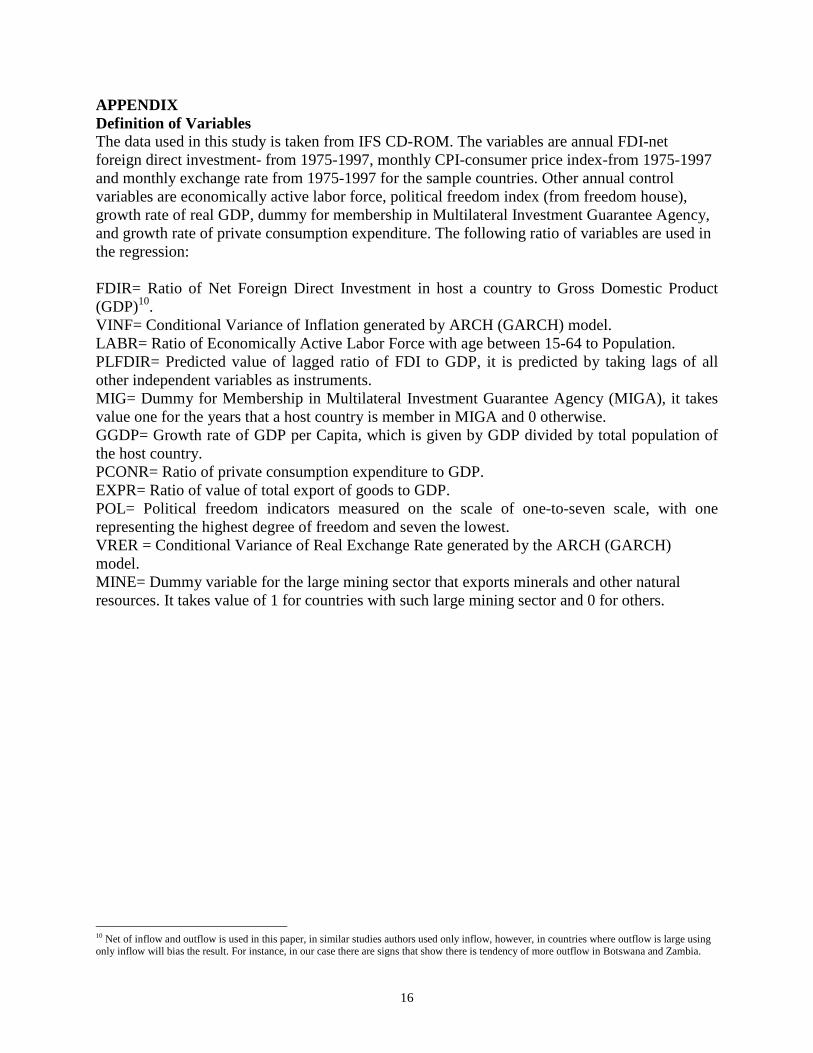
APPENDIX Definition of Variables The data used in this study is taken from IFS CD-ROM. The variables are annual FDI-net foreign direct investment- from 1975-1997, monthly CPI-consumer price index-from 1975-1997 and monthly exchange rate from 1975-1997 for the sample countries. Other annual control variables are economically active labor force, political freedom index (from freedom house), growth rate of real GDP, dummy for membership in Multilateral Investment Guarantee Agency, and growth rate of private consumption expenditure. The following ratio of variables are used in the regression: FDIR= Ratio of Net Foreign Direct Investment in host a country to Gross Domestic Product (GDP)10. VINF= Conditional Variance of Inflation generated by ARCH (GARCH) model. LABR= Ratio of Economically Active Labor Force with age between 15-64 to Population. PLFDIR= Predicted value of lagged ratio of FDI to GDP, it is predicted by taking lags of all other independent variables as instruments. MIG= Dummy for Membership in Multilateral Investment Guarantee Agency (MIGA), it takes value one for the years that a host country is member in MIGA and 0 otherwise. GGDP= Growth rate of GDP per Capita, which is given by GDP divided by total population of the host country. PCONR= Ratio of private consumption expenditure to GDP. EXPR= Ratio of value of total export of goods to GDP. POL= Political freedom indicators measured on the scale of one-to-seven scale, with one representing the highest degree of freedom and seven the lowest. VRER = Conditional Variance of Real Exchange Rate generated by the ARCH (GARCH) model. MINE= Dummy variable for the large mining sector that exports minerals and other natural resources. It takes value of 1 for countries with such large mining sector and 0 for others.
10 Net of inflow and outflow is used in this paper, in similar studies authors used only inflow, however, in countries where outflow is large using only inflow will bias the result. For instance, in our case there are signs that show there is tendency of more outflow in Botswana and Zambia.
17
Table 1.Description of the Variances of Inflation and the Variances of Real Exchange Rate Table 1a.Variance of Inflation Botswana Ethiopia Kenya Tanzania Uganda Zambia Mean 5.61E-05 0.000724 0.000539 0.00767 0.0464 0.000626 Standard Error 1.81E-06 4.48E-06 8.42E-05 0.00218 0.014528 9.14E-05 Median 4.65E-05 0.000749 0.000211 0.000536 0.00139 0.000133 Standard Deviation 2.99E-05 7.42E-05 0.001395 0.036087 0.240483 0.001513 Sample Variance 8.95E-10 5.5E-09 1.94E-06 0.001302 0.057832 2.29E-06 Kurtosis 18.64604 36.43828 117.8124 124.6613 76.12443 48.74691 Skewness 3.745869 -4.87983 9.633427 10.29673 8.335118 6.075231 Range 0.00027 0.000771 0.019101 0.489502 2.680816 0.015861 Minimum 0 0 0 0 0 0 Maximum 0.00027 0.000771 0.019101 0.489502 2.680816 0.015861 ARCH/GARCH GARCH (1,1) ARCH (2) ARCH (1) ARCH (1) ARCH (1) GARCH (1,1) Count 274 274 274 274 274 274 Table 1b. Variance of Real Exchange rate
Botswana Ethiopia Kenya Tanzania Uganda Zambia Mean 0.017179 0.044437 6.659575 2076.079 7275.857 71033.51Standard Error 0.004134 0.024069 1.322982 484.1742 1743.443 23810.67Median 0.003917 0.01206 1.411462 242.0672 665.6423 1768.281Standard Dev. 0.068425 0.398419 21.89926 8014.509 28859.12 394136.7Sample Variance 0.004682 0.158738 479.5774 64232354 8.33E+08 1.55E+11Kurtosis 122.2348 269.5726 56.67743 127.7054 63.04534 129.3709Skewness 10.16934 16.36007 7.055429 10.19707 7.349146 10.34661Range 0.923218 6.579771 225.623 110689.1 318415.2 5430171Minimum 0.002511 0.009151 0.939748 1.50487 279.007 2.363422Maximum 0.925729 6.588922 226.5627 110690.6 318694.2 5430173ARCH/GARCH ARCH (1) ARCH (2) ARCH (1) GARCH (1,1) ARCH (1) GARCH (1,1)Count 274 274 274 274 274 274
18
Table 2. Description of Sample Countries FDI as percentage of GDP 1998
Percentage Share of GDP Countries Population 1998 (in millions)
Per capita GDP Inward Outward Agriculture
(%) Industry (%)
Services (%)
Major exports
Botswana 1.6 3600 26.1 5.2 4 45 51 Diamond and Copper Ethiopia 61.3 100 6.9 0.5 55 12 33 Coffee and Leather Kenya 29.3 350 7.6 1.5 29 17 54 Tea and coffee Tanzania 32.1 210 9.9 . 56 15 29 Coffee and manufactured
goods Uganda 20.9 310 12.9 . 44 17 39 Coffee and Gold Zambia 9.7 330 52.8 . 23 40 37 Copper and Cobalt
Table 3. Descriptive Statistics of variables used in the Regressions (N=132)
Variables Labels
Mean Std.Dev. Minimum Maximum NumCases
FDIR Ratio of foreign Direct Investment to GDP 895490 3.42E+06 -1.10E+07 2.02E+07 132
VINF Variance of Inflation 0.009538 0.0389536 1.00E-06 0.284481 132 VRER Variance of Inflation 13917.1 97229.4 0.00265497 1.08E+06 132 EXPR Ratio of Value of Export to GDP 25.5439 131.848 0.00340973 1228.46 132 POL Political freedom indicator 4.94697 1.70904 1 7 132
GCONR Ratio of Government Consumption to GDP 0.219493 0.249512 0.0671374 2.53846 132
PCONR Ratio of Private consumption to GDP 0.705873 0.227737 0.242463 2.17228 132
PFDIR Predicted Value of lag of FDIR 1.14E+06 1.11E+06 -5.40E+06 6.58E+06 132 GGDP Growth rate of GDP per capita 0.287901 0.391768 -0.131678 2.30912 132
LABR Ratio of economically active Labor to Population 1.49941 2.94588 0.0743142 15.6667 132

19
Table 4. Regression Results of the Pooled Data of FDI Specificationsa (N=132) Variable Variance of Inflation Variance of Real Exchange Rate VINF
-2127.2 (6901.7)
-11753.7 (8105.3)
- -
VINF2
- 6996.6
(4961.7) - -
VRER - - 0.0081 (0.005)
0.006 (0.005)
VRER2 - - - -0.00004 (0.0001)
POL
48.4 (16.9)***
130.5 (50.4)**
46.5 (15.5)**
112.7 (47.7)**
POL2
- -11.5
(5.28)** - -9.5
(5.1)** POLINF
484.9 (1348.6)
2076.9 (1440.2)
- -
POLRER - - -0.002 (0.001)
-0.001 (0.001)
LABR
-24.9 (10.2)**
-28.1 (11.1)**
-25.1 (10.7)**
-27.2 (12.1)**
PCONR
-326.1 (122.4)***
-389.1 (150.1)**
-303.2 (109.8)**
-346.1 (139.5)**
EXPR
-0.29 (0.26)
-0.118 (0.23)
-0.306 (0.28)
-0.16 (0.26)
PLFDIR
0.035 (0.02)
0.02 (0.0214)
0.037 (0.0.025)
0.03 (0.02)
MIG
-139.2 (55.4)**
-157.1 (59.7)**
-148.1 (61.6)
-159.5 (67.1)**
GGDP
-176.39 (86.6)**
-175.7 (90.5)*
-174.9 (79.5)**
-184.4 (74.6)**
MINE 367.4 (117.1)**
325.9 (102.9)**
362.5 (121.1)**
319.8 (110.8)**
Full effect of POL
53.1 93.3 18.7 51.7
F-value 4.29*** 3.68*** 4.31*** 3.64*** LM 209.9*** 227.41*** 227.63*** 251.4*** Adjusted R2 0.18 0.18 0.18 0.18
*P<0.10 a Values in brackets are standard errors **P<0.05
***P<0.01

20
Table 5. Regression Results of the Fixed Effects model of FDI Specifications: Variances of Inflation and Political Instabilitya (N=132)
Variable A B C D E F G H VINF
12385.2 (5087.8)**
3969.9 (4978.9)
1985.9 (5349.8)
-6144.7 (5886.3)
-7034.9 (5863.2)
-6165.9 (5645.5)
21648.7 (10010.5)**
12382.5 (8994.2)
VINF2
- - 3853.9
(3717.3) 1318.5 (2110.6)
2614.3 (3239.3)
1212.1 (2174.9)
-11580.2 (5839.7)**
-9855.2 (5269.1)*
POL
47.1 (20.9)**
26.9 (19.5)
302.7 (128.6)**
303.2 (125.1)**
310.9 (119.7)**
312.8 (120.9)**
193.9 (91.3)**
166.1 (85.7)*
POL2
- - -23.5
(11.7)** -28.1 (12.3)**
-27.9 (11.27)**
-29.1 (11.8)**
-15.3 (8.1)**
-14.3 (8.1)*
POLINF
-1986.2 (869.7)**
-379.3 (909.8)
-553.6 (1014.3)
1108.1 (1078.9)
1298.3 (1053.3)
1145.8 (1022.2)
-3291.8 (1611.1)**
-1595.9 (1489.4)
LABR
19.4 (8.9)**
9.7 (7.1)
9.38 (7.1)
3.1 (7.9)
-1.3 (6.7)
1.9 (7.8)
15.9 (8.4)**
7.2 (6.9)
PCONR
-394.3 (155.8)**
-338.9 (144.8)**
-245.4 (157.5)
-136.7 (138.8)
-216.1 (143.8)
-160.6 (132.6)
-352.9 (139.8)**
-304.8 (134.7)*
EXPR
0.27 (0.17)
0.22 (0.15)
- - 0.33 (0.602)***
0.144 (0.184)
0.314 (0.154)**
0.27 (0.14)*
PLFDIR
-0.00001 (0.0002)
0.00001 (0.0002)
- 0.435 (0.201)**
- 0.32 (0.29)
0.077 (0.26)
0.09 (0.23)
MIG
- -97.5 (45.3)**
- -102.5 (46.5)**
-99.2 (46.9)**
-100.3 (47.4)**
- -89.5 (44.2)**
GGDP
-301.2 (116.9)**
-292 (111.2)***
- - - - -297.4 (122.6)**
-286.6 (116.7)**
Full effect of VINF
2553.5 - - - - - 5244.3 4389.2
Full effect of POL
28.2 - 181.1 173.6 185.1 179.5 86.9 80.1
Fixed effects
Yes Yes Yes Yes Yes Yes Yes Yes
Adjusted R2
0.30 0.32 0.26 0.28 0.28 0.27 0.30 0.31
*P<0.10 a Values in brackets are standard errors **P<0.05
***P<0.01
21
Table 6. Regression Results of the fixed effects model of FDI Specifications: variance of Real Exchange Rate and Political instabilitya (N=132)
Variable A B C D E F G H VRER
-0.022 (0.0095)**
-0.02 (0.009)**
-0.021 (0.008)**
-0.02 (0.009)**
-0.025 (0.009)***
-0.023 (0.0089)**
-0.016 (0.007)**
-0.015 (0.007)**
VRER2
- - 0.00009
(0.0001) 0.0009 (0.001)
0.0009 (0.001)
0.0009 (0.0012)
0.0004 (0.001)
0.0006 (0.001)
POL
24.2 (21.6)
5.8 (21.1)
245.5 (130.3)*
243.1 (127.5)*
247.9 (120.9)**
253.6 (124.5)**
268.4 (123.8)**
220.8 (110.9)**
POL2
- - -19.7
(12.1)* -23.4 (12.5)*
-23.6 (11.4)**
-24.8 (12.1)**
-24.8 (11.6)**
-21.7 (10.8)**
POLRER
0.004 (0.0018)**
0.004 (0.019)**
0.004 (0.0015)***
0.004 (0.002)**
0.0047 (0.0016)***
0.004 (0.0016)**
0.003 (0.001)**
0.003 (0.001)**
LABR
17.4 (8.85)*
5.54 (6.3)
9.58 (6.58)
3.9 (6.9)
-1.85 (6.18)
1.60 (6.8)
11.6 (7.8)
1.17 (6.27)
PCONR
-155.4 (124.4)
-127.2 (106.3)
-212.9 (144.4)
-150.8 (104.8)
-181.6 (123.4)
-159.9 (103.2)
-145.1 (112.9)
-120.4 (102.5)
EXPR
0.075 (0.19)
0.057 (0.18)
- - 0.34 (0.056)***
0.193 (0.161)
0.14 (0.17)
0.12 (0.16)
PLFDIR
0.00003 (0.00003)
0.00002 (0.00002)
- 0.418 (0.202)**
- 0.269 (0.267)
0.30 (0.29)
0.28 (0.24)
MIG
- -119.4 (49.9)**
- -106.1 (47.6)**
-105.9 (48.8)**
-104.8 (47.9)**
- -111.9 (49.5)**
GGDP
-129.5 (76.2)*
-144.4 (75.8)*
- - - - -107.1 (61.6)*
-121.2 (60.2)**
Full effect of VRER
-0.002 -0.002 0.17 0.17 0.17 0.17 0.20 0.20
Full effect of POL
79.8 61.4 203.6 182.6 186.7 186.4 199.6 167.4
Fixed effects
Yes Yes Yes Yes Yes Yes Yes Yes
Adjusted R2
0.28 0.31 0.28 0.30 0.30 0.30 0.29 0.31
*P<0.10 a Values in brackets are standard errors **P<0.05
***P<0.01
Related Documents