_______________________________________________________________________________________________________ Approved by the World Agricultural Outlook Board/USDA United States Department of Agriculture Foreign Agricultural Service Circular Series December 2011 Colombia’s Diminished Production Continues Oct-2011 0 200 400 600 800 1,000 1,200 1,400 Oct Nov Dec Jan Feb Mar Apr May Jun Jul Aug Sep Thousand 60 Kilogram Bags 2003/04 – 07/08 Average 2008/09 – 10/11 Average Colombia’s 2011/12 coffee production is lowered 2.0 million bags from the June forecast and is equal to last year’s downwardly revised 8.5 million bags. October 2011 production, the first month of the marketing year, was significantly below normal. Production over the last several years has been plagued by heavy rains, coffee rust and the coffee cherry borer. These negative factors have persisted longer than anticipated. Colombia accounts for about 10 percent of world production. Brazil and Vietnam’s production estimates are unchanged from the June forecast and together account for over 50 percent of the total. Coffee: World Markets and Trade

Welcome message from author
This document is posted to help you gain knowledge. Please leave a comment to let me know what you think about it! Share it to your friends and learn new things together.
Transcript

_______________________________________________________________________________________________________ Approved by the World Agricultural Outlook Board/USDA
United States Department of Agriculture Foreign Agricultural Service Circular Series December 2011
Colombia’s Diminished Production Continues
Oct-2011
0
200
400
600
800
1,000
1,200
1,400
Oct Nov Dec Jan Feb Mar Apr May Jun Jul Aug Sep
Thou
sand
60
Kilo
gram
Bag
s
2003/04 – 07/08 Average
2008/09 – 10/11 Average
Colombia’s 2011/12 coffee production is lowered 2.0 million bags from the June forecast and is equal to last year’s downwardly revised 8.5 million bags. October 2011 production, the first month of the marketing year, was significantly below normal. Production over the last several years has been plagued by heavy rains, coffee rust and the coffee cherry borer. These negative factors have persisted longer than anticipated. Colombia accounts for about 10 percent of world production. Brazil and Vietnam’s production estimates are unchanged from the June forecast and together account for over 50 percent of the total.
Coffee: World Markets and Trade

Approved by the World Agricultural Outlook Board/USDA
Revised 2011/12 Forecast Overview Production World coffee production is revised down from the June estimate by 1.2 million bags to 133.8 million bags (60 kilograms).
• Colombia is reduced 2.0 million bags to 8.5 million as shortfalls continue due to heavy rains, coffee rust and the coffee cherry borer.
• Brazil and Vietnam are unchanged at 49.2 million bags and 20.6 million bags, respectively. • Mexico is raised 600,000 bags to 4.3 million on higher yields from renovated trees as well as a
recovery in the State of Puebla following cold temperatures during the previous season’s bloom.
Ending Stocks World green coffee bean ending stocks are reduced 2.4 million bags to 24.0 million and remain tight.
• Brazil is lowered 1.6 million bags to 3.4 million following an upward revision to exports. • EU-27 is reduced 500,000 bags to 11.5 million on the expectation of weaker imports.
Exports World green coffee bean exports are raised 500,000 bags to 91.2 million (trade figures exclude roast and soluble coffee).
• Brazil is raised 1.0 million bags to 25.9 million due in part to stronger than anticipated exports to the United States and Japan.
• Indonesia is revised up 600,000 bags to 5.8 million following larger available supplies and increased shipments to Japan and Russia.
• Colombia is reduced 1.5 million bags to 7.5 million on sharply reduced exportable supplies.
15
20
25
30
35
40
06/07 07/08 08/09 09/10 10/11 11/12
Mill
ion
60 K
ilogr
am B
ags
World Ending Stocks Remain Tight
December 2011

Imports World green coffee bean imports are raised 700,000 bags to 90.8 million primarily on upward revisions to a number of producing countries.
• Indonesia is revised up 400,000 bags to 600,000 to meet domestic demand. • Colombia is raised 240,000 bags to 800,000 to account for lower production. • India is up 250,000 bags to 750,000 with the expectation of solid demand. • Switzerland is increased 300,000 bags to 2.3 million on steady growth.
Revised 2010/11 Production World coffee production is revised down from the June estimate by 1.5 million bags to 136.4 million bags.
• Colombia is reduced 1.0 million bags to 8.5 million as the second crop significantly underperformed the main crop.
• Cote d’Ivoire is lowered 500,000 bags to 1.6 million on difficulties related to its recent supply chain disruptions caused in part by recent political turmoil.
Ending Stocks World green coffee bean ending stocks are lowered 700,000 bags to 26.1 million.
• Brazil is reduced 900,000 bags to 2.9 million on stronger than anticipated exports. • Japan is raised 300,000 bags to 2.6 million on a build-up primarily from Central America.
Exports World green coffee bean exports are raised 500,000 bags to 96.5 million.
• Brazil is revised up 1.2 million bags to 31.8 million on stronger shipments to Europe. • India is 900,000 bags higher to 3.7 million on gains for Europe. • Colombia is lowered 1.0 million bags to 7.4 million on lower exportable supplies.
For additional information, please contact Tony Halstead at 202-720-4620, or [email protected] Users can find the release schedule and generate the full USDA Production, Supply and Distribution (PSD) dataset for reporting countries by accessing the following link: http://www.fas.usda.gov/psdonline/psdHome.aspx
December 2011

Table 01 Coffee World Production, Supply and Distribution
Thousand 60-Kilogram Bags
Beginning
Stocks
Arabica
Production
Robusta
Production
Production Imports Total Supply Exports Domestic
Consumption
Ending
Stocks
Total
Distribution
Exportable
Production
Coffee, Green
52,23397,01829,43518,82848,75597,01862770,72415,92054,43025,667 1977/78
60,035109,13125,05719,46264,612109,13167879,01818,77059,84729,435 1978/79
62,283107,61625,52319,96362,130107,61665381,90619,20762,30225,057 1979/80
66,007112,37230,97920,43860,955112,37267586,17422,58463,15425,523 1980/81
77,771129,75743,84220,55665,359129,75775598,02322,39675,13230,979 1981/82
61,916126,47940,19920,22166,059126,47973381,90422,19659,25843,842 1982/83
68,490129,60640,83820,57768,191129,60660688,80117,90570,45940,199 1983/84
68,591131,65637,36621,96872,322131,65645690,36224,59165,30240,838 1984/85
74,777133,51341,81521,22070,478133,51339795,75023,99871,29937,366 1985/86
58,416121,47133,28721,20266,982121,47126279,39426,12152,81241,815 1986/87
82,310136,75348,17421,07567,504136,753296103,17023,81078,98533,287 1987/88
73,168142,75450,19321,19071,371142,75441594,16528,90164,93448,174 1988/89
76,157147,40943,01220,99583,402147,40925896,95827,54269,11850,193 1989/90
78,131143,52445,09622,26576,163143,524331100,18127,76872,14343,012 1990/91
81,950149,45146,29822,26680,887149,451291104,06429,80973,98045,096 1991/92
71,722139,97040,52221,57977,869139,97071392,95927,45565,23446,298 1992/93
69,764133,51334,30122,92876,284133,51358592,40627,14665,05240,522 1993/94
74,978132,41341,21522,52668,672132,4131,07097,04228,03368,80934,301 1994/95
65,393131,24033,08824,04974,103131,2401,07988,94627,37261,39441,215 1995/96
79,780137,96529,09524,36184,509137,9651,091103,78637,23666,45233,088 1996/97
72,986128,00224,88325,18077,939128,0021,22097,68732,94064,71229,095 1997/98
83,533135,27124,40025,73885,133135,2711,435108,95334,06074,85924,883 1998/99
88,064139,25620,87525,64892,733139,2561,303113,55340,32373,20024,400 1999/00
91,357139,87422,61826,31990,937139,8741,478117,52147,00070,48620,875 2000/01
84,157141,11025,20727,61188,292141,1106,974111,51843,28968,19922,618 2001/02
99,454257,18747,359115,72094,108257,18790,663127,10242,12184,95339,422 2002/03
80,601248,80739,345119,39190,071248,80790,698110,75044,18566,54047,359 2003/04
89,607253,61840,274120,14993,195253,61893,011121,26243,24377,99439,345 2004/05
84,653249,19031,254125,10792,829249,19092,195116,72146,89469,80240,274 2005/06
99,197260,54333,577124,107102,859260,54397,470131,81949,56782,22731,254 2006/07
89,082252,53929,017126,97196,551252,53996,809122,15348,98373,14533,577 2007/08
100,029259,94136,898123,59299,451259,94196,821134,10351,09282,98629,017 2008/09
92,187263,01926,024135,249101,746263,01999,416126,70552,32774,35336,898 2009/10
100,705267,18926,159131,159109,871267,189104,788136,37751,60884,74426,024 2010/11
97,204261,48923,979133,855103,655261,489101,529133,80155,01178,76526,159 2011/12
Prior to 2002/03, the database does not include import, consumption or stocks data for non-producing countries such as the
United States, EU-27 and Japan.
December 2011

Table 02 Coffee Summary
Thousand 60-Kilogram Bags
2007/08 2008/09 2009/10 2010/11
Jun
2011/12
Dec
2011/12
Production none
39,100 Brazil 53,300 44,800 54,500 49,200 49,200
18,000 Vietnam 16,980 18,500 18,735 20,600 20,600
12,515 Colombia 8,664 8,100 8,525 10,500 8,500
8,000 Indonesia 10,000 10,500 9,325 7,885 8,300
4,660 India 4,375 4,825 5,040 4,800 5,200
3,906 Ethiopia 3,650 4,000 4,400 4,500 4,700
4,350 Mexico 4,550 4,150 4,000 3,700 4,300
3,642 Honduras 3,225 3,550 3,900 4,100 4,100
4,110 Guatemala 3,980 4,010 3,810 3,910 3,810
2,800 Peru 4,000 3,300 4,100 3,800 3,800
21,070 Other 21,379 20,970 20,042 22,051 21,291
122,153 Total 134,103 126,705 136,377 135,046 133,801
Domestic Consumption none
45,885 EU-27 41,815 51,720 43,970 46,600 46,500
23,726 United States 23,800 23,395 24,152 24,150 23,930
17,390 Brazil 18,030 18,760 19,380 20,100 19,760
7,060 Japan 7,025 6,935 6,975 7,125 6,950
4,520 Russia 3,455 4,075 4,415 3,975 4,200
1,710 Switzerland 1,800 1,950 2,180 2,000 2,300
1,380 Philippines 1,620 2,220 2,839 2,255 2,255
25,300 Other 26,047 26,194 27,248 27,752 27,960
126,971 Total 123,592 135,249 131,159 133,957 133,855
Ending Stocks none
12,775 EU-27 16,325 10,850 12,900 12,000 11,500
5,600 United States 5,333 4,250 4,580 4,500 4,200
2,781 Brazil 6,576 2,836 2,946 4,936 3,386
1,960 Japan 2,050 1,950 2,550 1,950 2,050
1,747 Vietnam 2,307 1,012 755 970 740
4,154 Other 4,307 5,126 2,428 2,031 2,103
29,017 Total 36,898 26,024 26,159 26,387 23,979
Bean Exports none
23,770 Brazil 28,396 26,580 31,810 24,930 25,930
15,600 Vietnam 15,430 18,425 17,545 19,000 19,000
10,770 Colombia 8,160 6,445 7,410 9,000 7,500
5,510 Indonesia 6,625 7,425 7,375 5,150 5,750
3,440 Honduras 3,050 3,200 3,900 3,925 3,925
3,890 Guatemala 3,783 3,860 3,850 3,925 3,700
2,660 Peru 3,830 3,150 3,880 3,650 3,700
2,620 India 2,120 2,760 3,700 2,500 2,900
2,110 Ethiopia 1,850 2,325 2,660 2,640 2,800
2,160 Uganda 2,770 2,290 1,885 2,100 2,000
13,628 Other 13,297 13,697 12,508 13,969 14,041
86,158 Total 89,311 90,157 96,523 90,789 91,246
Bean Imports none
43,550 EU-27 43,350 44,200 44,070 43,500 43,000
21,775 United States 21,660 20,250 22,460 21,800 21,500
6,150 Japan 6,375 6,160 6,900 6,200 5,800
1,710 Switzerland 1,800 1,950 2,180 2,000 2,300
2,025 Algeria 2,045 2,060 1,550 2,025 2,025
1,960 Canada 1,940 2,010 2,305 2,100 2,000
1,550 Korea, South 1,680 1,705 1,930 1,900 2,000
970 Russia 1,240 1,430 1,540 1,475 1,700
920 Australia 950 1,040 1,115 1,100 1,125
660 Malaysia 650 960 1,045 850 1,000
5,126 Other 5,812 7,005 8,215 7,125 8,320
86,396 Total 87,502 88,770 93,310 90,075 90,770
Coffee marketing year for producer countries begins either in October (Colombia), April (Indonesia) or July (Brazil), as examples.
Coffee marketing year for non-producer countries begins in October.
December 2011

Table 03A Coffee Production
Thousand 60-Kilogram Bags
2007/08 2008/09 2009/10 2010/11
Jun
2011/12
Dec
2011/12
Production none
30 Angola 30 30 25 25 25
140 Bolivia 135 140 125 140 140
39,100 Brazil 53,300 44,800 54,500 49,200 49,200
209 Burundi 250 300 235 275 230
695 Cameroon 650 590 665 590 665
50 Central African Republic 10 30 27 30 25
12,515 Colombia 8,664 8,100 8,525 10,500 8,500
315 Congo (Kinshasa) 300 305 270 290 290
1,867 Costa Rica 1,580 1,475 1,575 1,640 1,640
2,098 Cote d'Ivoire 1,853 2,350 1,600 2,300 2,000
70 Cuba 127 120 120 125 125
465 Dominican Republic 545 500 500 500 500
825 Ecuador 635 635 650 650 650
1,650 El Salvador 1,550 1,300 1,750 1,525 1,600
3,906 Ethiopia 3,650 4,000 4,400 4,500 4,700
27 Ghana 19 30 57 35 35
4,110 Guatemala 3,980 4,010 3,810 3,910 3,810
250 Guinea 400 445 300 450 400
335 Haiti 360 275 300 300 300
3,642 Honduras 3,225 3,550 3,900 4,100 4,100
4,660 India 4,375 4,825 5,040 4,800 5,200
8,000 Indonesia 10,000 10,500 9,325 7,885 8,300
35 Jamaica 31 28 21 30 30
700 Kenya 884 750 650 825 750
355 Laos 350 390 450 475 500
25 Liberia 7 2 1 1 1
555 Madagascar 530 475 550 550 575
25 Malawi 25 25 25 25 25
770 Malaysia 975 1,000 1,000 1,100 1,100
4,350 Mexico 4,550 4,150 4,000 3,700 4,300
1,850 Nicaragua 1,650 1,925 1,675 2,150 2,000
35 Nigeria 30 30 30 30 30
150 Panama 100 100 87 100 100
970 Papua New Guinea 1,035 1,085 865 1,050 1,050
28 Paraguay 25 25 25 25 25
2,800 Peru 4,000 3,300 4,100 3,800 3,800
460 Philippines 360 245 460 455 455
230 Rwanda 340 240 317 325 250
42 Sierra Leone 87 90 58 70 70
35 Sri Lanka 35 35 35 35 35
830 Tanzania 1,040 920 930 900 750
900 Thailand 800 900 900 900 900
255 Togo 185 450 510 550 550
2,500 Uganda 3,200 2,700 2,300 2,500 2,400
151 United States 133 107 102 100 100
900 Venezuela 900 725 690 800 800
18,000 Vietnam 16,980 18,500 18,735 20,600 20,600
150 Yemen 150 150 145 150 150
60 Zambia 39 27 7 15 10
31 Zimbabwe 22 21 10 15 10
2 Trinidad and Tobago 2 0 0 0 0
122,153 Total 134,103 126,705 136,377 135,046 133,801
Coffee marketing year for producer countries begins either in October (Colombia), April (Indonesia) or July (Brazil), as examples.
Coffee marketing year for non-producer countries begins in October.
December 2011

Table 03B Arabica Coffee Production
Thousand 60-Kilogram Bags
2007/08 2008/09 2009/10 2010/11
Jun
2011/12
Dec
2011/12
Arabica Production none
140 Bolivia 135 140 125 140 140
27,650 Brazil 40,500 33,000 41,800 34,700 34,700
209 Burundi 250 300 235 275 230
90 Cameroon 90 90 90 90 90
12,515 Colombia 8,664 8,100 8,525 10,500 8,500
115 Congo (Kinshasa) 100 105 100 100 100
1,867 Costa Rica 1,580 1,475 1,575 1,640 1,640
70 Cuba 127 120 120 125 125
465 Dominican Republic 545 500 500 500 500
475 Ecuador 360 375 400 425 425
1,650 El Salvador 1,550 1,300 1,750 1,525 1,600
3,906 Ethiopia 3,650 4,000 4,400 4,500 4,700
4,100 Guatemala 3,970 4,000 3,800 3,900 3,800
335 Haiti 360 275 300 300 300
3,642 Honduras 3,225 3,550 3,900 4,100 4,100
1,580 India 1,325 1,575 1,575 1,475 1,650
800 Indonesia 1,300 1,500 1,375 1,230 1,300
35 Jamaica 31 28 21 30 30
700 Kenya 884 750 650 825 750
30 Madagascar 30 25 25 25 25
25 Malawi 25 25 25 25 25
4,100 Mexico 4,300 3,950 3,800 3,500 4,100
1,850 Nicaragua 1,650 1,925 1,675 2,150 2,000
150 Panama 100 100 87 100 100
925 Papua New Guinea 1,000 1,050 825 1,000 1,000
28 Paraguay 25 25 25 25 25
2,800 Peru 4,000 3,300 4,100 3,800 3,800
35 Philippines 35 20 35 30 30
230 Rwanda 340 240 317 325 250
10 Sri Lanka 10 10 10 10 10
525 Tanzania 700 620 640 600 500
1 Trinidad and Tobago 1 0 0 0 0
400 Uganda 400 400 400 400 400
151 United States 133 107 102 100 100
900 Venezuela 900 725 690 800 800
400 Vietnam 480 450 585 675 750
150 Yemen 150 150 145 150 150
60 Zambia 39 27 7 15 10
31 Zimbabwe 22 21 10 15 10
73,145 Total 82,986 74,353 84,744 80,125 78,765
Coffee marketing year for producer countries begins either in October (Colombia), April (Indonesia) or July (Brazil), as examples.
Coffee marketing year for non-producer countries begins in October.
December 2011

Table 03C Robusta Coffee Production
Thousand 60-Kilogram Bags
2007/08 2008/09 2009/10 2010/11
Jun
2011/12
Dec
2011/12
Robusta Production none
30 Angola 30 30 25 25 25
11,450 Brazil 12,800 11,800 12,700 14,500 14,500
605 Cameroon 560 500 575 500 575
50 Central African Republic 10 30 27 30 25
200 Congo (Kinshasa) 200 200 170 190 190
2,098 Cote d'Ivoire 1,853 2,350 1,600 2,300 2,000
350 Ecuador 275 260 250 225 225
27 Ghana 19 30 57 35 35
10 Guatemala 10 10 10 10 10
250 Guinea 400 445 300 450 400
3,080 India 3,050 3,250 3,465 3,325 3,550
7,200 Indonesia 8,700 9,000 7,950 6,655 7,000
355 Laos 350 390 450 475 500
25 Liberia 7 2 1 1 1
525 Madagascar 500 450 525 525 550
770 Malaysia 975 1,000 1,000 1,100 1,100
250 Mexico 250 200 200 200 200
35 Nigeria 30 30 30 30 30
45 Papua New Guinea 35 35 40 50 50
400 Philippines 300 200 400 400 400
42 Sierra Leone 87 90 58 70 70
25 Sri Lanka 25 25 25 25 25
305 Tanzania 340 300 290 300 250
900 Thailand 800 900 900 900 900
255 Togo 185 450 510 550 550
1 Trinidad and Tobago 1 0 0 0 0
2,100 Uganda 2,800 2,300 1,900 2,100 2,000
17,600 Vietnam 16,500 18,050 18,150 19,925 19,850
48,983 Total 51,092 52,327 51,608 54,896 55,011
Coffee marketing year for producer countries begins either in October (Colombia), April (Indonesia) or July (Brazil), as examples.
Coffee marketing year for non-producer countries begins in October.
December 2011

Table 04 Coffee Consumption
Thousand 60-Kilogram Bags
2007/08 2008/09 2009/10 2010/11
Jun
2011/12
Dec
2011/12
Domestic Consumption none
2,025 Algeria 2,045 2,060 1,550 2,025 2,025
31 Angola 31 31 26 25 23
490 Argentina 480 500 510 525 525
920 Australia 950 1,040 1,115 1,100 1,125
80 Bolivia 80 75 75 80 80
17,390 Brazil 18,030 18,760 19,380 20,100 19,760
75 Cameroon 75 75 75 75 75
1,960 Canada 1,940 2,010 2,305 2,100 2,000
25 Central African Republic 25 30 30 30 30
300 China 320 425 680 675 800
1,137 Colombia 1,100 1,200 1,070 1,200 950
200 Congo (Kinshasa) 200 200 200 200 200
232 Costa Rica 261 305 450 365 435
300 Cote d'Ivoire 300 300 300 300 300
325 Croatia 300 300 270 300 300
295 Cuba 361 333 340 343 343
424 Dominican Republic 503 464 452 450 445
155 Ecuador 167 169 205 210 210
161 El Salvador 170 180 180 230 230
1,825 Ethiopia 1,825 1,775 1,765 1,850 1,850
45,885 EU-27 41,815 51,720 43,970 46,600 46,500
340 Guatemala 360 365 345 270 345
40 Guinea 40 40 30 40 40
340 Haiti 340 284 294 295 295
200 Honduras 200 200 200 200 200
1,350 India 1,450 1,090 1,145 1,500 1,150
1,730 Indonesia 1,720 1,780 1,350 1,750 1,780
7,060 Japan 7,025 6,935 6,975 7,125 6,950
50 Kenya 50 50 50 50 50
1,550 Korea, South 1,680 1,705 1,930 1,900 2,000
130 Laos 100 100 100 100 100
450 Madagascar 450 450 455 450 450
548 Malaysia 491 515 870 550 800
1,800 Mexico 1,950 1,900 2,000 1,950 2,000
570 Morocco 600 580 540 500 525
90 Nicaragua 90 90 90 90 90
34 Nigeria 29 27 28 28 28
590 Norway 610 580 620 600 600
54 Panama 55 47 50 50 50
30 Papua New Guinea 30 30 30 40 40
35 Paraguay 35 35 34 30 30
150 Peru 150 160 170 180 170
1,380 Philippines 1,620 2,220 2,839 2,255 2,255
4,520 Russia 3,455 4,075 4,415 3,975 4,200
590 Serbia 590 525 520 500 500
17 Sierra Leone 17 20 20 20 20
410 South Africa 330 400 400 400 400
40 Sri Lanka 41 35 35 35 35
1,710 Switzerland 1,800 1,950 2,180 2,000 2,300
100 Tanzania 100 100 100 100 100
565 Thailand 616 711 800 750 750
230 Turkey 260 275 315 300 325
400 Uganda 420 410 438 400 400
23,726 United States 23,800 23,395 24,152 24,150 23,930
927 Venezuela 1,025 880 1,220 1,125 1,125
850 Vietnam 950 1,200 1,325 1,325 1,475
110 Yemen 115 120 125 125 125
126,971 Total 123,592 135,249 131,159 133,957 133,855
December 2011
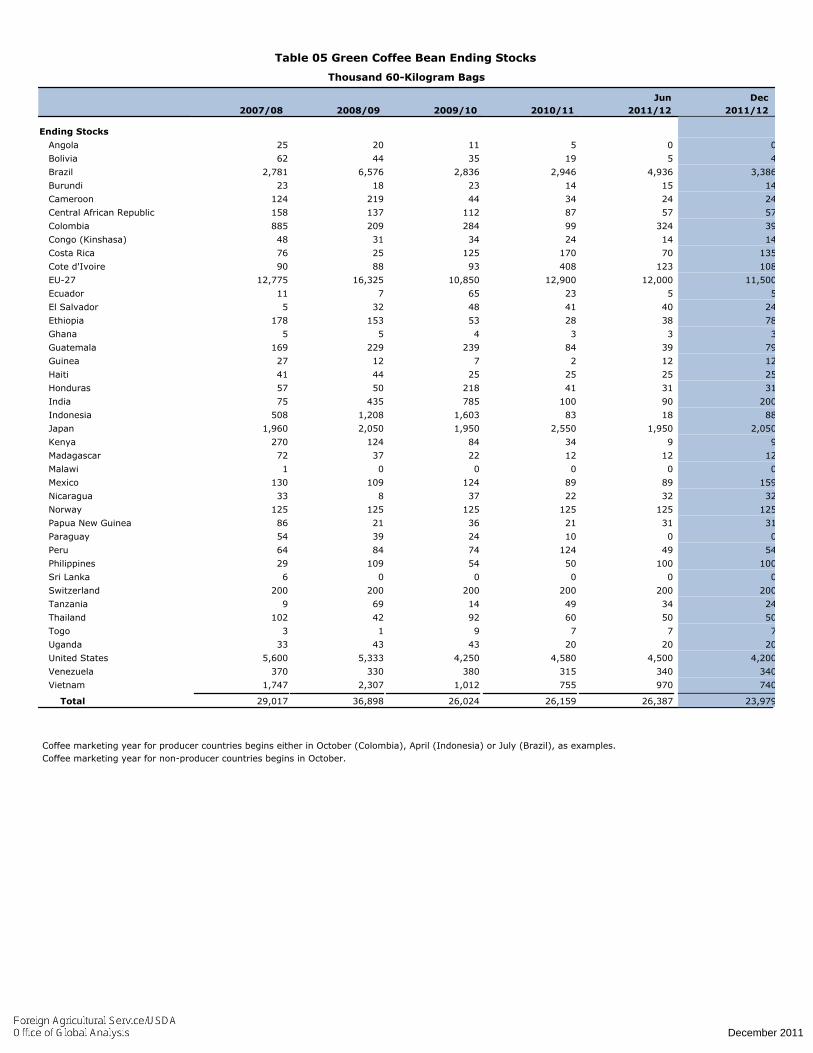
Table 05 Green Coffee Bean Ending Stocks
Thousand 60-Kilogram Bags
2007/08 2008/09 2009/10 2010/11
Jun
2011/12
Dec
2011/12
Ending Stocks none
25 Angola 20 11 5 0 0
62 Bolivia 44 35 19 5 4
2,781 Brazil 6,576 2,836 2,946 4,936 3,386
23 Burundi 18 23 14 15 14
124 Cameroon 219 44 34 24 24
158 Central African Republic 137 112 87 57 57
885 Colombia 209 284 99 324 39
48 Congo (Kinshasa) 31 34 24 14 14
76 Costa Rica 25 125 170 70 135
90 Cote d'Ivoire 88 93 408 123 108
12,775 EU-27 16,325 10,850 12,900 12,000 11,500
11 Ecuador 7 65 23 5 5
5 El Salvador 32 48 41 40 24
178 Ethiopia 153 53 28 38 78
5 Ghana 5 4 3 3 3
169 Guatemala 229 239 84 39 79
27 Guinea 12 7 2 12 12
41 Haiti 44 25 25 25 25
57 Honduras 50 218 41 31 31
75 India 435 785 100 90 200
508 Indonesia 1,208 1,603 83 18 88
1,960 Japan 2,050 1,950 2,550 1,950 2,050
270 Kenya 124 84 34 9 9
72 Madagascar 37 22 12 12 12
1 Malawi 0 0 0 0 0
130 Mexico 109 124 89 89 159
33 Nicaragua 8 37 22 32 32
125 Norway 125 125 125 125 125
86 Papua New Guinea 21 36 21 31 31
54 Paraguay 39 24 10 0 0
64 Peru 84 74 124 49 54
29 Philippines 109 54 50 100 100
6 Sri Lanka 0 0 0 0 0
200 Switzerland 200 200 200 200 200
9 Tanzania 69 14 49 34 24
102 Thailand 42 92 60 50 50
3 Togo 1 9 7 7 7
33 Uganda 43 43 20 20 20
5,600 United States 5,333 4,250 4,580 4,500 4,200
370 Venezuela 330 380 315 340 340
1,747 Vietnam 2,307 1,012 755 970 740
29,017 Total 36,898 26,024 26,159 26,387 23,979
Coffee marketing year for producer countries begins either in October (Colombia), April (Indonesia) or July (Brazil), as examples.
Coffee marketing year for non-producer countries begins in October.
December 2011

Table 06A Total Coffee Exports
Thousand 60-Kilogram Bags
2007/08 2008/09 2009/10 2010/11
Jun
2011/12
Dec
2011/12
Exports none
4 Angola 4 8 5 5 7
73 Bolivia 73 74 66 75 75
27,290 Brazil 31,475 29,780 35,010 28,000 29,000
300 Burundi 250 290 236 270 225
560 Cameroon 480 690 600 525 600
50 Central African Republic 6 25 22 30 25
11,525 Colombia 8,935 7,435 8,395 9,800 8,450
110 Congo (Kinshasa) 117 102 80 100 100
1,640 Costa Rica 1,385 1,200 1,255 1,390 1,390
1,890 Cote d'Ivoire 1,555 2,045 985 2,000 2,000
5 Cuba 6 7 5 7 7
41 Dominican Republic 42 36 48 50 55
942 Ecuador 861 1,140 1,250 1,275 1,275
1,585 El Salvador 1,510 1,240 1,714 1,454 1,529
2,110 Ethiopia 1,850 2,325 2,660 2,640 2,800
26 Ghana 18 30 57 35 35
3,890 Guatemala 3,783 3,860 3,850 3,925 3,700
195 Guinea 375 410 275 400 350
19 Haiti 17 10 6 5 5
3,440 Honduras 3,050 3,200 3,900 3,925 3,925
3,820 India 3,120 4,110 5,300 3,750 4,700
6,110 Indonesia 7,700 8,750 9,680 6,350 7,250
30 Jamaica 26 23 16 25 25
820 Kenya 980 740 650 800 725
225 Laos 250 290 350 375 400
25 Liberia 7 2 1 1 1
165 Madagascar 115 40 105 100 125
25 Malawi 25 24 24 24 24
1,422 Malaysia 1,619 1,980 1,870 1,920 1,920
2,610 Mexico 2,735 2,480 2,435 2,125 2,600
1,745 Nicaragua 1,585 1,806 1,600 2,050 1,900
1 Nigeria 1 3 2 2 2
96 Panama 45 53 37 50 50
900 Papua New Guinea 1,070 1,040 850 1,000 1,000
10 Paraguay 5 5 5 5 5
2,660 Peru 3,830 3,150 3,880 3,650 3,700
0 Philippines 0 0 0 0 0
230 Rwanda 340 240 317 325 250
25 Sierra Leone 70 70 38 50 50
730 Tanzania 880 875 795 800 675
775 Thailand 644 684 1,202 760 760
250 Togo 185 440 510 550 550
2,160 Uganda 2,770 2,290 1,885 2,100 2,000
160 Venezuela 0 0 0 0 0
15,735 Vietnam 15,565 18,670 17,867 19,350 19,350
40 Yemen 35 30 20 25 25
59 Zambia 39 27 7 15 10
27 Zimbabwe 18 17 6 10 5
96,551 Total 99,451 101,746 109,871 102,123 103,655
A conversion factor of 2.6 was used to convert soluble coffee to the green bean equivalent.
Coffee marketing year for producer countries begins either in October (Colombia), April (Indonesia) or July (Brazil), as examples.
Coffee marketing year for non-producer countries begins in October.
For the United States, Canada and the EU-27, exports appear as zero in the database and the actual amount has been subtracted from
imports to show net imports.
December 2011
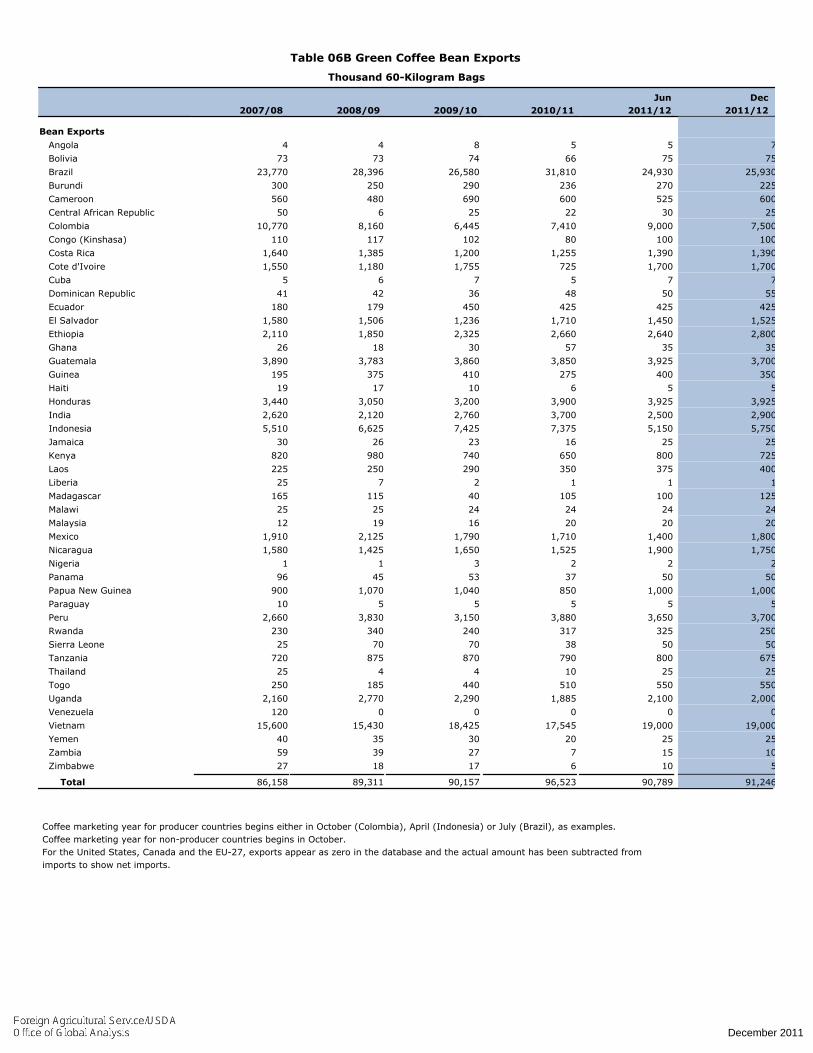
Table 06B Green Coffee Bean Exports
Thousand 60-Kilogram Bags
2007/08 2008/09 2009/10 2010/11
Jun
2011/12
Dec
2011/12
Bean Exports none
4 Angola 4 8 5 5 7
73 Bolivia 73 74 66 75 75
23,770 Brazil 28,396 26,580 31,810 24,930 25,930
300 Burundi 250 290 236 270 225
560 Cameroon 480 690 600 525 600
50 Central African Republic 6 25 22 30 25
10,770 Colombia 8,160 6,445 7,410 9,000 7,500
110 Congo (Kinshasa) 117 102 80 100 100
1,640 Costa Rica 1,385 1,200 1,255 1,390 1,390
1,550 Cote d'Ivoire 1,180 1,755 725 1,700 1,700
5 Cuba 6 7 5 7 7
41 Dominican Republic 42 36 48 50 55
180 Ecuador 179 450 425 425 425
1,580 El Salvador 1,506 1,236 1,710 1,450 1,525
2,110 Ethiopia 1,850 2,325 2,660 2,640 2,800
26 Ghana 18 30 57 35 35
3,890 Guatemala 3,783 3,860 3,850 3,925 3,700
195 Guinea 375 410 275 400 350
19 Haiti 17 10 6 5 5
3,440 Honduras 3,050 3,200 3,900 3,925 3,925
2,620 India 2,120 2,760 3,700 2,500 2,900
5,510 Indonesia 6,625 7,425 7,375 5,150 5,750
30 Jamaica 26 23 16 25 25
820 Kenya 980 740 650 800 725
225 Laos 250 290 350 375 400
25 Liberia 7 2 1 1 1
165 Madagascar 115 40 105 100 125
25 Malawi 25 24 24 24 24
12 Malaysia 19 16 20 20 20
1,910 Mexico 2,125 1,790 1,710 1,400 1,800
1,580 Nicaragua 1,425 1,650 1,525 1,900 1,750
1 Nigeria 1 3 2 2 2
96 Panama 45 53 37 50 50
900 Papua New Guinea 1,070 1,040 850 1,000 1,000
10 Paraguay 5 5 5 5 5
2,660 Peru 3,830 3,150 3,880 3,650 3,700
230 Rwanda 340 240 317 325 250
25 Sierra Leone 70 70 38 50 50
720 Tanzania 875 870 790 800 675
25 Thailand 4 4 10 25 25
250 Togo 185 440 510 550 550
2,160 Uganda 2,770 2,290 1,885 2,100 2,000
120 Venezuela 0 0 0 0 0
15,600 Vietnam 15,430 18,425 17,545 19,000 19,000
40 Yemen 35 30 20 25 25
59 Zambia 39 27 7 15 10
27 Zimbabwe 18 17 6 10 5
86,158 Total 89,311 90,157 96,523 90,789 91,246
Coffee marketing year for producer countries begins either in October (Colombia), April (Indonesia) or July (Brazil), as examples.
Coffee marketing year for non-producer countries begins in October.
For the United States, Canada and the EU-27, exports appear as zero in the database and the actual amount has been subtracted from
imports to show net imports.
December 2011

Table 06C Soluble Coffee Exports
Thousand 60-Kilogram Bags
2007/08 2008/09 2009/10 2010/11
Jun
2011/12
Dec
2011/12
Soluble Exports none
3,395 Brazil 2,991 3,120 3,140 3,000 3,000
720 Colombia 725 925 935 750 900
340 Cote d'Ivoire 375 290 260 300 300
760 Ecuador 680 680 825 850 850
2 El Salvador 2 2 2 2 2
1,200 India 1,000 1,350 1,600 1,250 1,800
600 Indonesia 1,075 1,325 2,305 1,200 1,500
1,410 Malaysia 1,600 1,964 1,850 1,900 1,900
700 Mexico 610 690 725 725 800
165 Nicaragua 160 156 75 150 150
10 Tanzania 5 5 5 0 0
750 Thailand 640 680 1,192 735 735
115 Vietnam 110 195 272 300 300
10,167 Total 9,973 11,382 13,186 11,162 12,237
A conversion factor of 2.6 was used to convert soluble coffee to the green bean equivalent.
Coffee marketing year for producer countries begins either in October (Colombia), April (Indonesia) or July (Brazil), as examples.
Coffee marketing year for non-producer countries begins in October.
For the United States, Canada and the EU-27, exports appear as zero in the database and the actual amount has been subtracted from
imports to show net imports.
December 2011

Table 07A Total Coffee Imports
Thousand 60-Kilogram Bags
2007/08 2008/09 2009/10 2010/11
Jun
2011/12
Dec
2011/12
Imports none
2,025 Algeria 2,045 2,060 1,550 2,025 2,025
490 Argentina 480 500 510 525 525
920 Australia 950 1,040 1,115 1,100 1,125
1,960 Canada 1,940 2,010 2,305 2,100 2,000
300 China 320 425 680 675 800
142 Colombia 695 610 755 600 840
325 Croatia 300 300 270 300 300
230 Cuba 240 220 225 225 225
274 Ecuador 389 732 763 817 817
96 El Salvador 157 136 137 142 142
45,760 EU-27 45,365 46,245 46,020 45,600 45,100
193 Guatemala 223 225 230 230 230
14 Honduras 18 18 23 15 15
490 India 555 725 720 500 750
100 Indonesia 120 425 185 200 735
6,860 Japan 7,115 6,835 7,575 6,825 6,450
1,550 Korea, South 1,680 1,705 1,930 1,900 2,000
1,200 Malaysia 1,135 1,495 1,740 1,370 1,620
171 Mexico 114 245 400 370 370
570 Morocco 600 580 540 500 525
590 Norway 610 580 620 600 600
915 Philippines 1,340 1,920 2,375 1,850 1,850
4,520 Russia 3,455 4,075 4,415 3,975 4,200
590 Serbia 590 525 520 500 500
410 South Africa 330 400 400 400 400
1,710 Switzerland 1,800 1,950 2,180 2,000 2,300
530 Thailand 400 545 1,070 600 600
230 Turkey 260 275 315 300 325
23,475 United States 23,400 22,205 24,380 23,750 23,450
77 Venezuela 85 205 465 350 350
88 Vietnam 95 75 200 150 210
96,809 Total 96,821 99,416 104,788 100,574 101,529
A conversion factor of 2.6 was used to convert soluble coffee to the green bean equivalent.
Coffee marketing year for producer countries begins either in October (Colombia), April (Indonesia) or July (Brazil), as examples.
Coffee marketing year for non-producer countries begins in October.
For the United States, Canada and the EU-27, exports appear as zero in the database and the actual amount has been subtracted from
imports to show net imports.
December 2011

Table 07B Green Coffee Bean Imports
Thousand 60-Kilogram Bags
2007/08 2008/09 2009/10 2010/11
Jun
2011/12
Dec
2011/12
Bean Imports none
2,025 Algeria 2,045 2,060 1,550 2,025 2,025
490 Argentina 480 500 510 525 525
920 Australia 950 1,040 1,115 1,100 1,125
1,960 Canada 1,940 2,010 2,305 2,100 2,000
300 China 320 425 680 675 800
110 Colombia 650 570 715 560 800
325 Croatia 300 300 270 300 300
43,550 EU-27 43,350 44,200 44,070 43,500 43,000
210 Ecuador 310 650 700 750 750
1 El Salvador 3 0 0 0 0
490 India 555 725 720 500 750
100 Indonesia 120 425 185 200 600
6,150 Japan 6,375 6,160 6,900 6,200 5,800
1,550 Korea, South 1,680 1,705 1,930 1,900 2,000
660 Malaysia 650 960 1,045 850 1,000
1 Mexico 4 90 245 200 200
570 Morocco 600 580 540 500 525
590 Norway 610 580 620 600 600
390 Philippines 405 420 375 400 400
970 Russia 1,240 1,430 1,540 1,475 1,700
590 Serbia 590 525 520 500 500
410 South Africa 330 400 400 400 400
1,710 Switzerland 1,800 1,950 2,180 2,000 2,300
200 Thailand 130 205 620 200 200
230 Turkey 260 275 315 300 325
21,775 United States 21,660 20,250 22,460 21,800 21,500
65 Vietnam 70 50 175 125 185
86,396 Total 87,502 88,770 93,310 90,075 90,770
Coffee marketing year for producer countries begins either in October (Colombia), April (Indonesia) or July (Brazil), as examples.
Coffee marketing year for non-producer countries begins in October.
Imports for the United States, Canada and the EU-27 are net imports after subtracting exports.
December 2011

Table 07C Soluble Coffee Imports
Thousand 60-Kilogram Bags
2007/08 2008/09 2009/10 2010/11
Jun
2011/12
Dec
2011/12
Soluble Imports none
64 Ecuador 77 79 60 65 65
80 El Salvador 140 125 125 130 130
2,210 EU-27 2,015 2,045 1,950 2,100 2,100
140 Guatemala 160 165 170 170 170
7 Honduras 10 10 15 15 15
710 Japan 740 675 675 625 650
520 Malaysia 465 515 675 500 600
150 Mexico 95 135 135 150 150
525 Philippines 935 1,500 2,000 1,450 1,450
3,550 Russia 2,215 2,645 2,875 2,500 2,500
1,700 United States 1,740 1,955 1,920 1,950 1,950
22 Vietnam 25 25 25 25 25
10,081 Total 8,972 10,324 11,150 10,180 10,305
A conversion factor of 2.6 was used to convert soluble coffee to the green bean equivalent.
Coffee marketing year for producer countries begins either in October (Colombia), April (Indonesia) or July (Brazil), as examples.
Coffee marketing year for non-producer countries begins in October.
For the United States, Canada and the EU-27, exports appear as zero in the database and the actual amount has been subtracted from
imports to show net imports.
December 2011

Table 08 World Coffee Supply and Distribution, 2011/12
Thousand 60-Kilogram Bags
Country Beginning
Stocks
Arabica
Production
Robusta
Production
Total
Production
Total
Imports
Total
Supply
Total
Exports
Domestic
Use
Ending
Stocks
Total
Distributio
Exportable
Production
Caribbean
03500343735022512501250 Cuba
55500044555500050005000 Dominican Republic
53252529553250300030025 Haiti
25300525300300300 Jamaica
00000000000 Trinidad and Tobago
851,205251,088921,205225955095525 Total Caribbean
Central America
1,2051,9601354351,3901,9601501,64001,640170 Costa Rica
1,3701,783242301,5291,7831421,60001,60041 El Salvador
3,4654,124793453,7004,1242303,810103,80084 Guatemala
3,9004,156312003,9254,156154,10004,10041 Honduras
1,9102,02232901,9002,02202,00002,00022 Nicaragua
5010005050100010001000 Panama
11,90014,1453011,35012,49414,14553713,2501013,240358 Total Central America
East Asia
0800080008008000000 China
09,0002,0506,95009,0006,4500002,550 Japan
02,00002,00002,0002,0000000 Korea, South
011,8002,0509,750011,8009,2500002,550 Total East Asia
European Union
058,00011,50046,500058,00045,10000012,900 EU-27
058,00011,50046,500058,00045,10000012,900 Total European Union
Former Soviet Union - 12
04,20004,20004,2004,2000000 Russia
04,20004,20004,2004,2000000 Total Former Soviet Union - 12
Middle East
0325032503253250000 Turkey
25150012525150015001500 Yemen
2547504502547532515001500 Total Middle East
North Africa
02,02502,02502,0252,0250000 Algeria
0525052505255250000 Morocco
02,55002,55002,5502,5500000 Total North Africa
December 2011

Table 08 World Coffee Supply and Distribution, 2011/12 (Continued)
Thousand 60-Kilogram Bags
Country Beginning
Stocks
Arabica
Production
Robusta
Production
Total
Production
Total
Imports
Total
Supply
Total
Exports
Domestic
Use
Ending
Stocks
Total
Distributio
Exportable
Production
North America
02,00002,00002,0002,0000000 Canada
2,3004,7591592,0002,6004,7593704,3002004,10089 Mexico
028,1304,20023,930028,13023,45010001004,580 United States
2,30034,8894,35927,9302,60034,88925,8204,4002004,2004,669 Total North America
Oceania
01,12501,12501,1251,1250000 Australia
00000000000 New Caledonia
1,0101,07131401,0001,07101,050501,00021 Papua New Guinea
1,0102,196311,1651,0002,1961,1251,050501,00021 Total Oceania
0300030003003000000 Croatia
07251256000725600000125 Norway
0500050005005000000 Serbia
02,5002002,30002,5002,300000200 Switzerland
04,0253253,70004,0253,700000325 Total Other Europe
South America
0525052505255250000 Argentina
60159480751590140014019 Bolivia
29,44052,1463,38619,76029,00052,146049,20014,50034,7002,946 Brazil
7,5509,439399508,4509,4398408,50008,50099 Colombia
4401,49052101,2751,49081765022542523 Ecuador
00000000000 Guyana
03503053502502510 Paraguay
3,6303,924541703,7003,92403,80003,800124 Peru
01,4653401,12501,4653508000800315 Venezuela
41,12069,1833,82822,85042,50569,1832,53263,11514,72548,3903,536 Total South America
South Asia
4,0506,0502001,1504,7006,0507505,2003,5501,650100 India
03503503503525100 Sri Lanka
4,0506,0852001,1854,7006,0857505,2353,5751,660100 Total South Asia
Southeast Asia
6,5209,118881,7807,2509,1187358,3007,0001,30083 Indonesia
4005000100400500050050000 Laos
3002,72008001,9202,7201,6201,1001,10000 Malaysia
02,3551002,25502,3551,8504554003050 Philippines
1501,560507507601,560600900900060 Thailand
December 2011

Table 08 World Coffee Supply and Distribution, 2011/12 (Continued)
Thousand 60-Kilogram Bags
Country Beginning
Stocks
Arabica
Production
Robusta
Production
Total
Production
Total
Imports
Total
Supply
Total
Exports
Domestic
Use
Ending
Stocks
Total
Distributio
Exportable
Production
19,12521,5657401,47519,35021,56521020,60019,850750755 Vietnam
26,49537,8189787,16029,68037,8185,01531,85529,7502,080948 Total Southeast Asia
Sub-Saharan Africa
2300237300252505 Angola
00000000000 Benin
2252441452252440230023014 Burundi
590699247560069906655759034 Cameroon
011257302511202525087 Central African Republic
00000000000 Congo (Brazzaville)
9031414200100314029019010024 Congo (Kinshasa)
1,7002,4081083002,0002,40802,0002,0000408 Cote d'Ivoire
00000000000 Equatorial Guinea
2,8504,728781,8502,8004,72804,70004,70028 Ethiopia
00000000000 Gabon
35383035380353503 Ghana
3604021240350402040040002 Guinea
7007849507257840750075034 Kenya
11001101100 Liberia
1255871245012558705755502512 Madagascar
24250124250250250 Malawi
2300282300303000 Nigeria
25025000250250025002500 Rwanda
507002050700707000 Sierra Leone
0400040004004000000 South Africa
65079924100675799075025050049 Tanzania
55055770550557055055007 Togo
2,0002,420204002,0002,42002,4002,00040020 Uganda
10100010100100100 Zambia
510055100100100 Zimbabwe
10,21914,9183823,97710,55914,91840013,7916,7017,090727 Total Sub-Saharan Africa
World
97,204261,48923,979133,855103,655261,489101,529133,80155,01178,76526,159 World
December 2011

Table 09 World Coffee Supply and Distribution, 2010/11
Thousand 60-Kilogram Bags
Country Beginning
Stocks
Arabica
Production
Robusta
Production
Total
Production
Total
Imports
Total
Supply
Total
Exports
Domestic
Use
Ending
Stocks
Total
Distributio
Exportable
Production
Caribbean
03450340534522512001200 Cuba
48500045248500050005000 Dominican Republic
63252529463250300030025 Haiti
16210516210210210 Jamaica
00000000000 Trinidad and Tobago
701,191251,091751,191225941094125 Total Caribbean
Central America
1,1251,8751704501,2551,8751751,57501,575125 Costa Rica
1,5701,935411801,7141,9351371,75001,75048 El Salvador
3,4654,279843453,8504,2792303,810103,800239 Guatemala
3,7004,141412003,9004,141233,90003,900218 Honduras
1,5851,71222901,6001,71201,67501,67537 Nicaragua
378705037870870870 Panama
11,48214,0293581,31512,35614,02956512,7971012,787667 Total Central America
East Asia
0680068006806800000 China
09,5252,5506,97509,5257,5750001,950 Japan
01,93001,93001,9301,9300000 Korea, South
012,1352,5509,585012,13510,1850001,950 Total East Asia
European Union
056,87012,90043,970056,87046,02000010,850 EU-27
056,87012,90043,970056,87046,02000010,850 Total European Union
Former Soviet Union - 12
04,41504,41504,4154,4150000 Russia
04,41504,41504,4154,4150000 Total Former Soviet Union - 12
Middle East
0315031503153150000 Turkey
20145012520145014501450 Yemen
2046004402046031514501450 Total Middle East
North Africa
01,55001,55001,5501,5500000 Algeria
0540054005405400000 Morocco
02,09002,09002,0902,0900000 Total North Africa
December 2011

Table 09 World Coffee Supply and Distribution, 2010/11 (Continued)
Thousand 60-Kilogram Bags
Country Beginning
Stocks
Arabica
Production
Robusta
Production
Total
Production
Total
Imports
Total
Supply
Total
Exports
Domestic
Use
Ending
Stocks
Total
Distributio
Exportable
Production
North America
02,30502,30502,3052,3050000 Canada
2,0004,524892,0002,4354,5244004,0002003,800124 Mexico
028,7324,58024,152028,73224,38010201024,250 United States
2,00035,5614,66928,4572,43535,56127,0854,1022003,9024,374 Total North America
Oceania
01,11501,11501,1151,1150000 Australia
00000000000 New Caledonia
835901213085090108654082536 Papua New Guinea
8352,016211,1458502,0161,1158654082536 Total Oceania
0270027002702700000 Croatia
07451256200745620000125 Norway
0520052005205200000 Serbia
02,3802002,18002,3802,180000200 Switzerland
03,9153253,59003,9153,590000325 Total Other Europe
South America
0510051005105100000 Argentina
501601975661600125012535 Bolivia
35,12057,3362,94619,38035,01057,336054,50012,70041,8002,836 Brazil
7,4559,564991,0708,3959,5647558,52508,525284 Colombia
4451,478232051,2501,47876365025040065 Ecuador
00000000000 Guyana
049103454902502524 Paraguay
3,9304,1741241703,8804,17404,10004,10074 Peru
01,5353151,22001,5354656900690380 Venezuela
47,00074,8063,53622,66448,60674,8062,49368,61512,95055,6653,698 Total South America
South Asia
3,8956,5451001,1455,3006,5457205,0403,4651,575785 India
03503503503525100 Sri Lanka
3,8956,5801001,1805,3006,5807205,0753,4901,585785 Total South Asia
Southeast Asia
7,97511,113831,3509,68011,1131859,3257,9501,3751,603 Indonesia
3504500100350450045045000 Laos
1302,74008701,8702,7401,7401,0001,00000 Malaysia
02,889502,83902,8892,3754604003554 Philippines
1002,062608001,2022,0621,070900900092 Thailand
December 2011

Table 09 World Coffee Supply and Distribution, 2010/11 (Continued)
Thousand 60-Kilogram Bags
Country Beginning
Stocks
Arabica
Production
Robusta
Production
Total
Production
Total
Imports
Total
Supply
Total
Exports
Domestic
Use
Ending
Stocks
Total
Distributio
Exportable
Production
17,41019,9477551,32517,86719,94720018,73518,1505851,012 Vietnam
25,96539,2019487,28430,96939,2015,57030,87028,8501,9952,761 Total Southeast Asia
Sub-Saharan Africa
03652653602525011 Angola
00000000000 Benin
2272581482362580235023523 Burundi
590709347560070906655759044 Cameroon
0139873022139027270112 Central African Republic
00000000000 Congo (Brazzaville)
703042420080304027017010034 Congo (Kinshasa)
1,3001,6934083009851,69301,6001,600093 Cote d'Ivoire
00000000000 Equatorial Guinea
2,6354,453281,7652,6604,45304,40004,40053 Ethiopia
00000000000 Gabon
56613157610575704 Ghana
270307230275307030030007 Guinea
60073434506507340650065084 Kenya
11001101100 Liberia
955721245510557205505252522 Madagascar
24250124250250250 Malawi
2300282300303000 Nigeria
31731700317317031703170 Rwanda
385802038580585800 Sierra Leone
0400040004004000000 South Africa
83094449100795944093029064014 Tanzania
50851972510519051051009 Togo
1,8622,343204381,8852,34302,3001,90040043 Uganda
77007707070 Zambia
610046100100100 Zimbabwe
9,43813,9207273,9339,26013,92040012,9676,0686,899553 Total Sub-Saharan Africa
World
100,705267,18926,159131,159109,871267,189104,788136,37751,60884,74426,024 World
December 2011
Related Documents