FORECASTING THE VALUE OF RECYCLABLE WASTE STREAMS FOR A CIRCULAR ECONOMY TRANSITION IN ORLANDO, FLORIDA by Koichi Kanaoka Dr. Megan Mullin, Advisor Dr. Lawrence Bowdish, External Advisor April 26, 2018 Master’s Project submitted in partial fulfillment of the requirements for the Master of Environmental Management degree in the Nicholas School of the Environment of Duke University

Welcome message from author
This document is posted to help you gain knowledge. Please leave a comment to let me know what you think about it! Share it to your friends and learn new things together.
Transcript
FORECASTING THE VALUE OF RECYCLABLE WASTE STREAMS FOR
A CIRCULAR ECONOMY TRANSITION IN ORLANDO, FLORIDA
by
Koichi Kanaoka
Dr. Megan Mullin, Advisor
Dr. Lawrence Bowdish, External Advisor
April 26, 2018
Master’s Project submitted in partial fulfillment of the
requirements for the Master of Environmental Management degree in
the Nicholas School of the Environment of
Duke University
2
ABSTRACT
The circular economy is a paradigm that views waste as a valuable resource, creating value for local economies through waste recycling and reuse. Despite the benefits of waste recovery, the national recycling rate has remained stagnant around 34% for the past decade in the U.S. This Master’s Project for Duke University’s Nicholas School of the Environment aimed to quantify the economic potential of improving recycling rates in the Orlando Metropolitan Statistical Area (MSA) through: (1) forecasting the value of recyclable municipal solid waste generated in Orlando MSA, and; (2) conducting a benefit-cost analysis (BCA) of building a material recovery facility (MRF) in Orlando. Forecasts and BCA were conducted by incorporating uncertainties from commodity price volatility. Results from the study suggested that values of single-stream recycling waste in Orlando MSA may reach $100 million in 2027, from $72 million in 2015. Cardboard and aluminum cans accounted for 70-90% of the waste stream’s value, while only accounting for 32% of the weight. The BCA revealed that building a MRF in Orlando MSA is expected to be profitable for the municipality. The cost for building the MRF was expected to be recovered as early as in the fourth year. Sensitivity analysis showed that an initial processing cost of $85 per ton, a $10 increase from the base model’s $75 per ton, made building a MRF expected to be unprofitable. The results from this study may not apply to other municipalities, since Orlando MSA already had a functioning collection infrastructure for recyclables. The study also raised questions regarding the optimal design of recycling programs.
3
TABLE OF CONTENTS ABSTRACT.................................................................................................................................................. 2
LIST OF TABLES AND FIGURES........................................................................................................... 4
EXECUTIVE SUMMARY.......................................................................................................................... 5
1. INTRODUCTION ................................................................................................................................... 6 1.1. Waste Management in the U.S. .......................................................................................................... 6 1.2. Waste Recycling.................................................................................................................................. 7 1.3. Macro Factors Affecting Recycling Rates........................................................................................... 9 1.3.1 Policy.............................................................................................................................................. 9 1.3.2. Landfill Tipping Fees.................................................................................................................. 10 1.4. The Circular Economy Concept........................................................................................................ 10 1.5. U.S. Chamber of Commerce Foundation’s Beyond 34 Project......................................................... 11
2. METHODS............................................................................................................................................. 12 2.1. Study Site........................................................................................................................................... 12 2.2. Waste Stream Valuation.................................................................................................................... 13 2.2.1. Waste Generation Projections..................................................................................................... 13 2.2.2. Price Forecasts............................................................................................................................ 14 2.3. Material Recovery Facility (MRF) Benefit-Cost Analysis................................................................ 16
3. RESULTS............................................................................................................................................... 19 3.1. Waste Stream Valuation.................................................................................................................... 19 3.2. MRF Benefit-Cost Analysis...............................................................................................................23 3.2.1. Scenario 1: Constant Recycling Rate.......................................................................................... 23 3.2.2. Scenario 2: Medium Increase in Recycling Rate........................................................................ 24 3.2.3. Scenario 3: Maximum Increase in Recycling Rate...................................................................... 26 3.2.4. Sensitivity Analysis: Processing Cost of $85 Per Ton................................................................. 28 3.2.5. Sensitivity Analysis: Processing Cost of $95 Per Ton................................................................. 29 3.2.6. Sensitivity Analysis: 10% Discount Rate..................................................................................... 30
4. DISCUSSION AND CONCLUSION................................................................................................... 32
ACKNOWLEDGEMENTS....................................................................................................................... 34
REFERENCES........................................................................................................................................... 35
APPENDIX................................................................................................................................................. 41
4
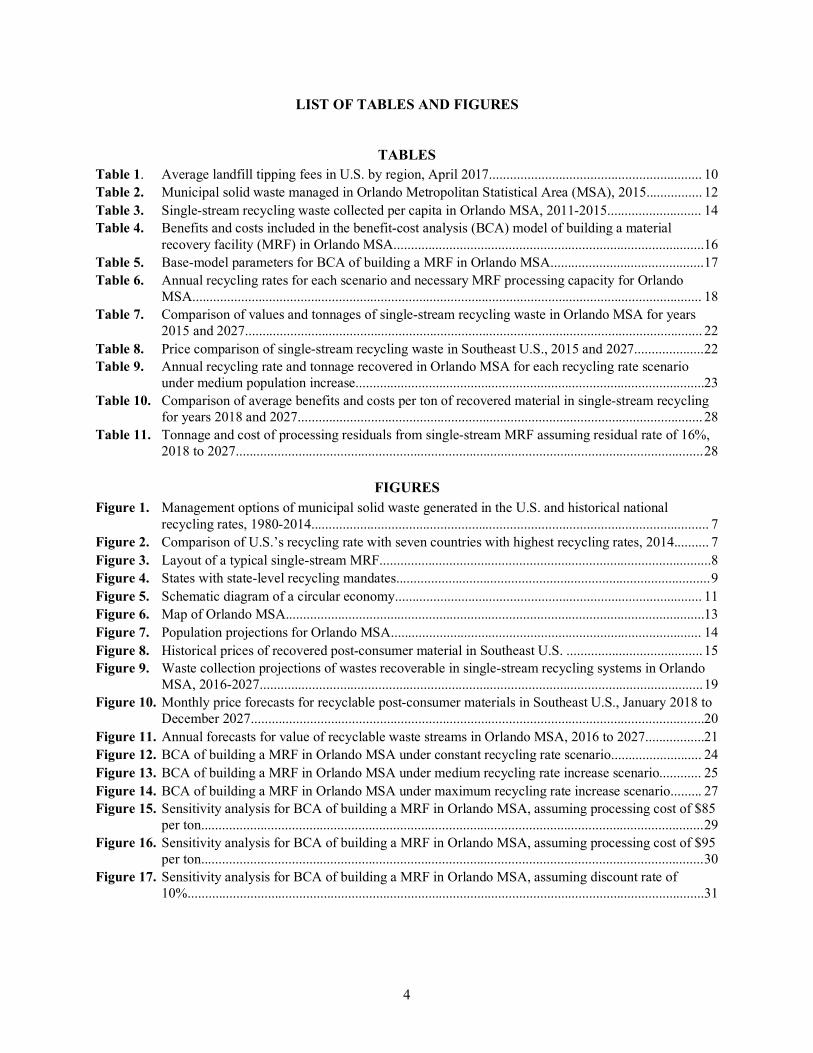
LIST OF TABLES AND FIGURES
TABLES Table 1. Average landfill tipping fees in U.S. by region, April 2017............................................................. 10 Table 2. Municipal solid waste managed in Orlando Metropolitan Statistical Area (MSA), 2015................ 12 Table 3. Single-stream recycling waste collected per capita in Orlando MSA, 2011-2015........................... 14 Table 4. Benefits and costs included in the benefit-cost analysis (BCA) model of building a material
recovery facility (MRF) in Orlando MSA......................................................................................... 16 Table 5. Base-model parameters for BCA of building a MRF in Orlando MSA............................................ 17 Table 6. Annual recycling rates for each scenario and necessary MRF processing capacity for Orlando
MSA.................................................................................................................................................. 18 Table 7. Comparison of values and tonnages of single-stream recycling waste in Orlando MSA for years
2015 and 2027................................................................................................................................... 22 Table 8. Price comparison of single-stream recycling waste in Southeast U.S., 2015 and 2027.................... 22 Table 9. Annual recycling rate and tonnage recovered in Orlando MSA for each recycling rate scenario
under medium population increase....................................................................................................23 Table 10. Comparison of average benefits and costs per ton of recovered material in single-stream recycling
for years 2018 and 2027.................................................................................................................... 28 Table 11. Tonnage and cost of processing residuals from single-stream MRF assuming residual rate of 16%,
2018 to 2027...................................................................................................................................... 28
FIGURES Figure 1. Management options of municipal solid waste generated in the U.S. and historical national
recycling rates, 1980-2014.................................................................................................................. 7 Figure 2. Comparison of U.S.’s recycling rate with seven countries with highest recycling rates, 2014.......... 7 Figure 3. Layout of a typical single-stream MRF............................................................................................... 8 Figure 4. States with state-level recycling mandates.......................................................................................... 9 Figure 5. Schematic diagram of a circular economy........................................................................................ 11 Figure 6. Map of Orlando MSA........................................................................................................................13 Figure 7. Population projections for Orlando MSA......................................................................................... 14 Figure 8. Historical prices of recovered post-consumer material in Southeast U.S. ....................................... 15 Figure 9. Waste collection projections of wastes recoverable in single-stream recycling systems in Orlando
MSA, 2016-2027............................................................................................................................... 19 Figure 10. Monthly price forecasts for recyclable post-consumer materials in Southeast U.S., January 2018 to
December 2027..................................................................................................................................20 Figure 11. Annual forecasts for value of recyclable waste streams in Orlando MSA, 2016 to 2027.................21 Figure 12. BCA of building a MRF in Orlando MSA under constant recycling rate scenario.......................... 24 Figure 13. BCA of building a MRF in Orlando MSA under medium recycling rate increase scenario............ 25 Figure 14. BCA of building a MRF in Orlando MSA under maximum recycling rate increase scenario......... 27 Figure 15. Sensitivity analysis for BCA of building a MRF in Orlando MSA, assuming processing cost of $85
per ton................................................................................................................................................ 29 Figure 16. Sensitivity analysis for BCA of building a MRF in Orlando MSA, assuming processing cost of $95
per ton................................................................................................................................................ 30 Figure 17. Sensitivity analysis for BCA of building a MRF in Orlando MSA, assuming discount rate of
10%.................................................................................................................................................... 31
5
EXECUTIVE SUMMARY
The circular economy is a paradigm that views waste as a valuable resource, creating value for local economies through waste recycling and reuse. Despite the benefits of waste recovery, the United States’ national recycling rate has remained around 34% for the past decade. In 2016, the U.S. Chamber of Commerce Foundation (USCCF) saw the circular economy as an opportunity to stimulate local economies across the U.S. and launched the Beyond 34 Project. This project aimed to develop a strategic model for locally-driven increases in waste recovery rates. Florida’s Orlando Metropolitan Statistical Area (MSA) was selected as the site of the project’s pilot program. Currently, Orlando MSA does not have a material recovery facility (MRF) with the capacity to process municipal waste streams. This Master’s Project for Duke University’s Nicholas School of the Environment aimed to quantify the economic potential of improving recycling rates in the Orlando MSA through: (1) forecasting the value of recyclable municipal solid waste generated in Orlando MSA, and; (2) conducting a benefit-cost analysis (BCA) of building a MRF in Orlando MSA. Forecasts and BCA were conducted by incorporating uncertainties from commodity price volatility. Other studies have quantified the values of recyclable waste streams at the local level, but no long-term forecasts incorporating uncertainties have been made previously. However, recent falls in commodity prices have made recycling unprofitable for many businesses, suggesting the importance of incorporating uncertainties in recycling decisions. Key findings from this study include:
• Total value of Orlando MSA’s single-stream recycling waste was expected to be $94.2 million in 2027, a 31% increase from the 2015.
• Cardboard and aluminum cans accounted for 70-90% of the waste stream’s value, while only accounting for 32% of the weight.
• Average of price of Orlando MSA’s single-stream recycling waste was expected to increase to $77 per ton in 2027 from $75 per ton in 2015.
• 50% of single-stream recycling waste by weight yielded a net loss per ton of material recycled. • Building a MRF in Orlando MSA is expected to be profitable for the municipality, and the initial
costs is expected to be recovered as early as in the fourth year. • An initial processing cost of $85 per ton, a $10 increase from the base model’s $75 per ton, made
building a MRF expected to be unprofitable.
Results of this study suggested that uncertainties in commodity prices and high costs of recycling are potential barriers to a circular economy transition. This study makes several recommendations to address these barriers:
• Environmental benefits of recycling should be quantified to understand the social benefits of recycling.
• Municipalities and recycling businesses may benefit from engaging in community outreach and education programs to reduce processing costs in recycling.
• Municipalities and recycling businesses may benefit from not recycling certain low benefit, high cost materials (e.g., commingled plastics).
• Local government bodies should consider strategies such as profit sharing with recycling businesses to create more incentive for increasing recycling rates.
6
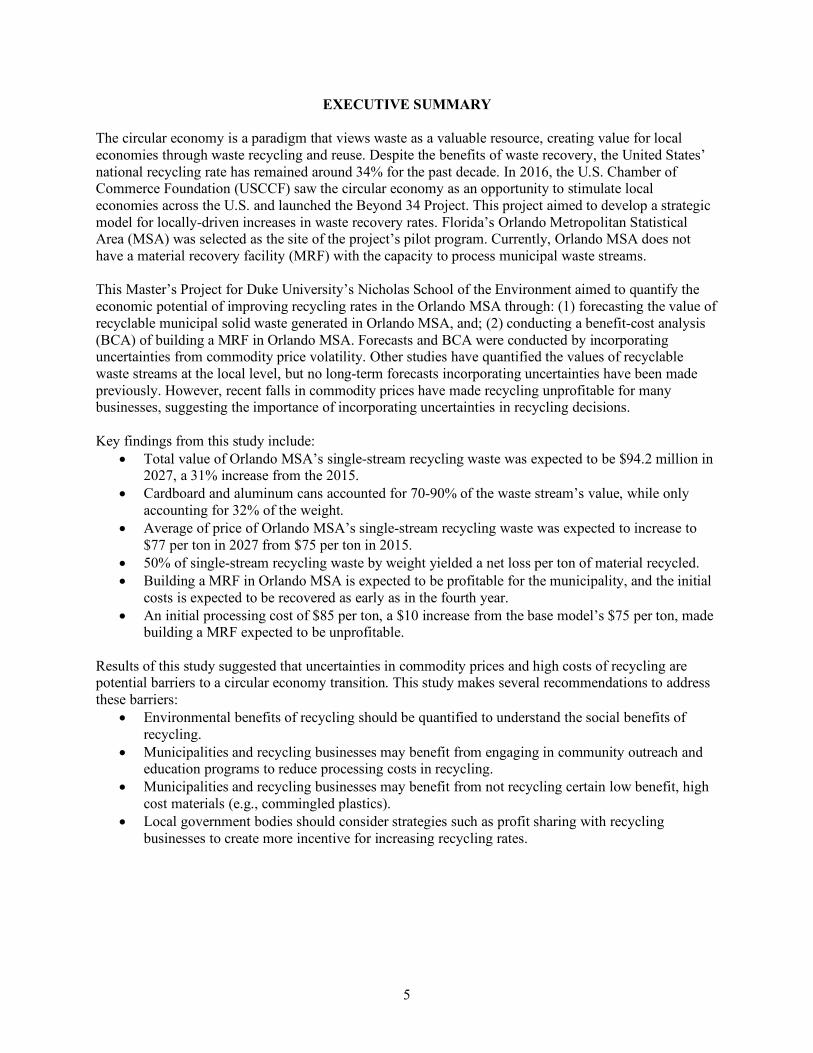
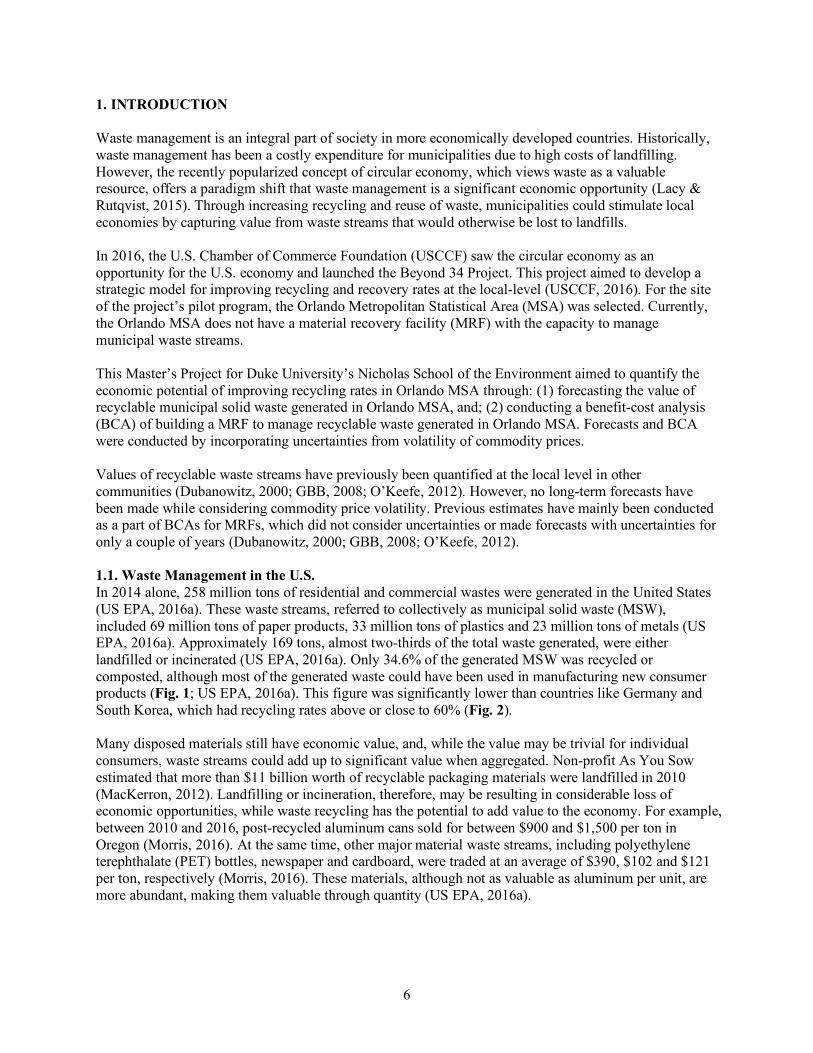
1. INTRODUCTION Waste management is an integral part of society in more economically developed countries. Historically, waste management has been a costly expenditure for municipalities due to high costs of landfilling. However, the recently popularized concept of circular economy, which views waste as a valuable resource, offers a paradigm shift that waste management is a significant economic opportunity (Lacy & Rutqvist, 2015). Through increasing recycling and reuse of waste, municipalities could stimulate local economies by capturing value from waste streams that would otherwise be lost to landfills. In 2016, the U.S. Chamber of Commerce Foundation (USCCF) saw the circular economy as an opportunity for the U.S. economy and launched the Beyond 34 Project. This project aimed to develop a strategic model for improving recycling and recovery rates at the local-level (USCCF, 2016). For the site of the project’s pilot program, the Orlando Metropolitan Statistical Area (MSA) was selected. Currently, the Orlando MSA does not have a material recovery facility (MRF) with the capacity to manage municipal waste streams. This Master’s Project for Duke University’s Nicholas School of the Environment aimed to quantify the economic potential of improving recycling rates in Orlando MSA through: (1) forecasting the value of recyclable municipal solid waste generated in Orlando MSA, and; (2) conducting a benefit-cost analysis (BCA) of building a MRF to manage recyclable waste generated in Orlando MSA. Forecasts and BCA were conducted by incorporating uncertainties from volatility of commodity prices. Values of recyclable waste streams have previously been quantified at the local level in other communities (Dubanowitz, 2000; GBB, 2008; O’Keefe, 2012). However, no long-term forecasts have been made while considering commodity price volatility. Previous estimates have mainly been conducted as a part of BCAs for MRFs, which did not consider uncertainties or made forecasts with uncertainties for only a couple of years (Dubanowitz, 2000; GBB, 2008; O’Keefe, 2012). 1.1. Waste Management in the U.S. In 2014 alone, 258 million tons of residential and commercial wastes were generated in the United States (US EPA, 2016a). These waste streams, referred to collectively as municipal solid waste (MSW), included 69 million tons of paper products, 33 million tons of plastics and 23 million tons of metals (US EPA, 2016a). Approximately 169 tons, almost two-thirds of the total waste generated, were either landfilled or incinerated (US EPA, 2016a). Only 34.6% of the generated MSW was recycled or composted, although most of the generated waste could have been used in manufacturing new consumer products (Fig. 1; US EPA, 2016a). This figure was significantly lower than countries like Germany and South Korea, which had recycling rates above or close to 60% (Fig. 2). Many disposed materials still have economic value, and, while the value may be trivial for individual consumers, waste streams could add up to significant value when aggregated. Non-profit As You Sow estimated that more than $11 billion worth of recyclable packaging materials were landfilled in 2010 (MacKerron, 2012). Landfilling or incineration, therefore, may be resulting in considerable loss of economic opportunities, while waste recycling has the potential to add value to the economy. For example, between 2010 and 2016, post-recycled aluminum cans sold for between $900 and $1,500 per ton in Oregon (Morris, 2016). At the same time, other major material waste streams, including polyethylene terephthalate (PET) bottles, newspaper and cardboard, were traded at an average of $390, $102 and $121 per ton, respectively (Morris, 2016). These materials, although not as valuable as aluminum per unit, are more abundant, making them valuable through quantity (US EPA, 2016a).
7
Figure 1. Management options of municipal solid waste (MSW) generated in the U.S. (in million tons), and historical national recycling rates, 1980-2014 (adapted from US EPA, 2016a).
Figure 2. Comparison of U.S.’s recycling rate with seven countries with highest recycling rates, 2014 (OECD, 2015). 1.2. Waste Recycling Waste recycling is a process that recovers the value of commercial products at the end of their useful life by reusing material components in the manufacturing of new products. Recycling is comprised of three main processes: collection, sorting, and sales of recyclables. The collection of recyclables generally involves a curbside pickup program or drop-off centers, where businesses and individuals could bring their recyclables. The collected recyclables are transported to MRFs for processing and sorting into material categories like glass, paper, plastic and metals. Further sorted materials are then compacted and sold to industrial customers (Liming, n.d.). Municipal recycling programs are primarily managed by local governments and could be operated by a government entity or outside contractors. For example, private haulers like Republic Services could be
8
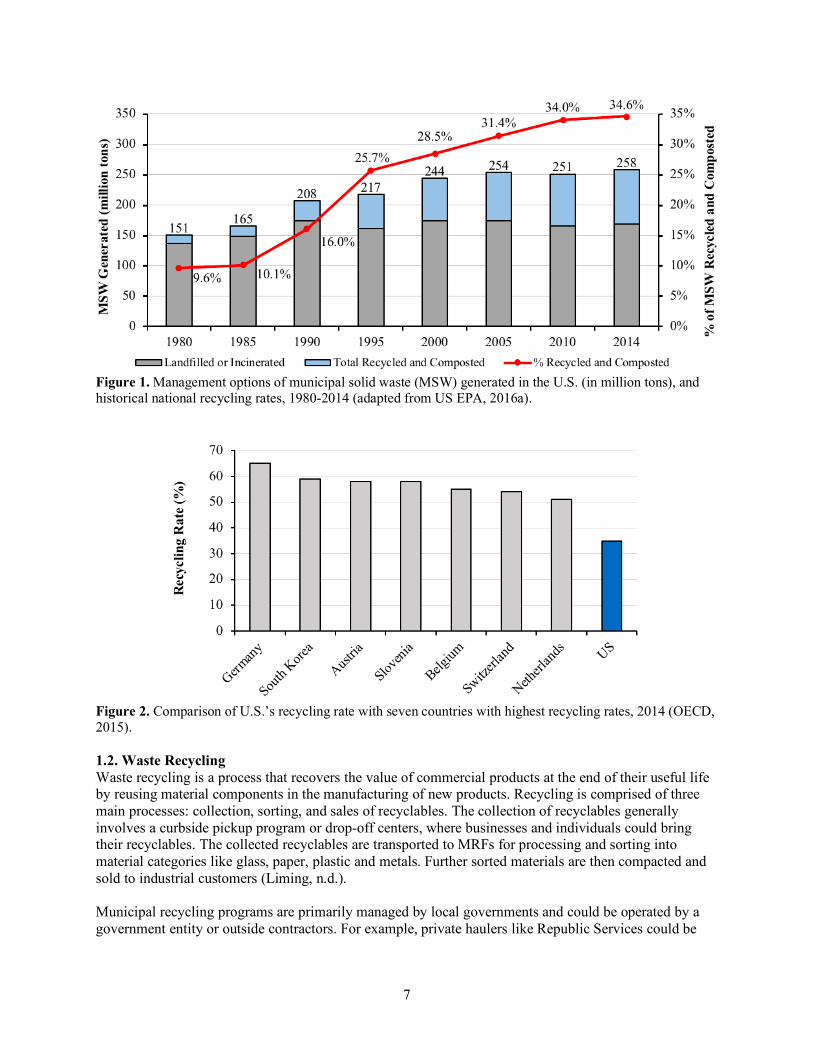
responsible for collecting and transporting recyclables to a local government-owned and operated MRF. The division of duties largely depends on the community (Liming, n.d.). Recycling collection generally takes a multi-stream or a single-stream approach. In multi-stream systems, recyclables are sorted by residents and commercial customers into separate bins for different materials prior to collection. In a single-stream approach, recyclable products are combined in one bin and separated later at MRFs (Fig. 3). The separation process in a MRF involves using magnets to separate the metals, fans to blow papers, and manually sorting materials on a conveyer belt (Liming, n.d.). The costs associated with these processes increase the processing costs of single-stream systems relative to the multi-stream systems (Lakhan, 2015). Single-stream recycling also results in higher rates of recyclable waste stream contamination, where unaccepted or unrecyclable wastes1 are mixed in with recyclable waste (Lakhan, 2015). This increases the total cost of processing and reduces the yield of recovered materials from the processed waste stream (Lakhan, 2015). However, single-stream recycling has generally been perceived to simplify the collection process and lower the overall cost of recycling programs (Lakhan, 2015). Single-stream recycling also yields higher recycling rates, with Waste Management claiming that single-stream recycling increased their retail customers’ recycling rates by 30% on average (Waste Management, 2017).
Figure 3. Layout of a typical single-stream material recovery facility (MRF). Figure from Asian Development Bank (2013). Multi-stream recycling had been the standard until MRFs equipped to handle single-stream waste was introduced to the U.S. in the mid-1990s (CRI, n.d.). By 2010, 64% of recycling communities in the U.S. have adopted single-stream recycling, with more than 160 operational single-stream MRFs (Berenyi, 2015). As of 2015, 9 of the 10 largest American cities operate single-stream recycling programs, with the exception of New York City (Cooley, 2015; DSNY, 2015). They too, however, are planning to switch to a single-stream system by 2020 (Jorgensen, 2015). 1 Contamination includes unrecyclable wastes like soiled or degraded materials, and unaccepted wastes like food waste and plastic bags that frequently jam recycling equipment.
9
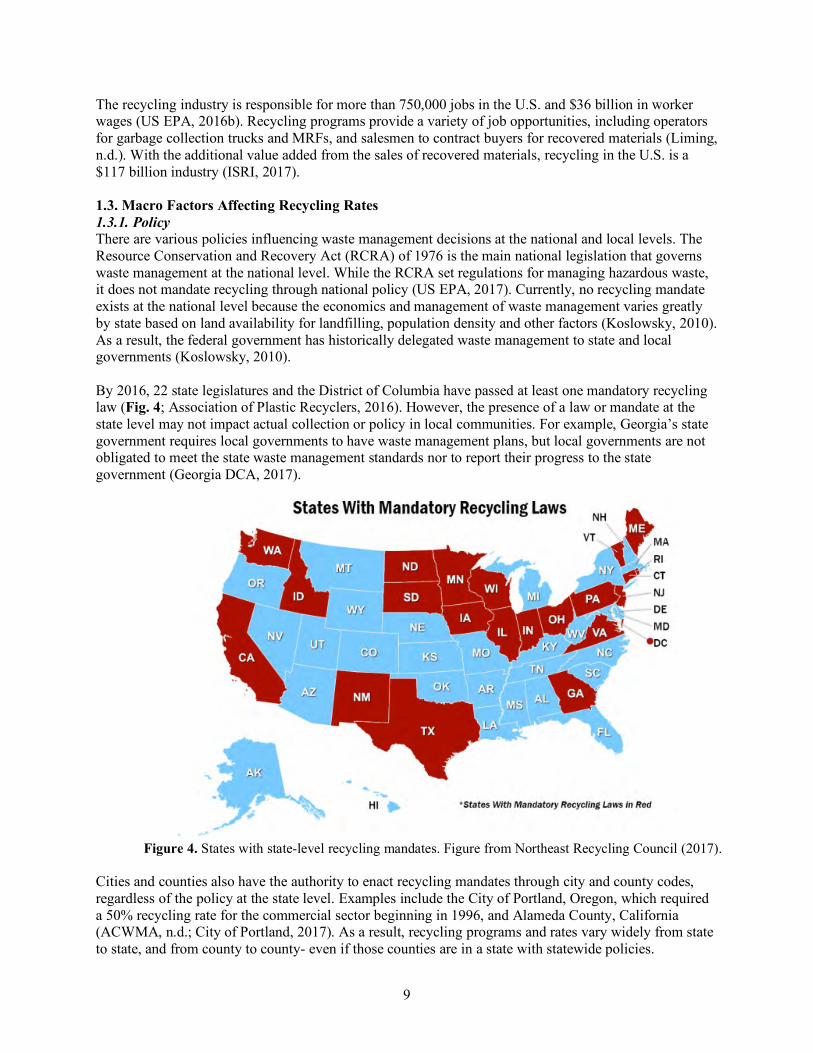
The recycling industry is responsible for more than 750,000 jobs in the U.S. and $36 billion in worker wages (US EPA, 2016b). Recycling programs provide a variety of job opportunities, including operators for garbage collection trucks and MRFs, and salesmen to contract buyers for recovered materials (Liming, n.d.). With the additional value added from the sales of recovered materials, recycling in the U.S. is a $117 billion industry (ISRI, 2017). 1.3. Macro Factors Affecting Recycling Rates 1.3.1. Policy There are various policies influencing waste management decisions at the national and local levels. The Resource Conservation and Recovery Act (RCRA) of 1976 is the main national legislation that governs waste management at the national level. While the RCRA set regulations for managing hazardous waste, it does not mandate recycling through national policy (US EPA, 2017). Currently, no recycling mandate exists at the national level because the economics and management of waste management varies greatly by state based on land availability for landfilling, population density and other factors (Koslowsky, 2010). As a result, the federal government has historically delegated waste management to state and local governments (Koslowsky, 2010). By 2016, 22 state legislatures and the District of Columbia have passed at least one mandatory recycling law (Fig. 4; Association of Plastic Recyclers, 2016). However, the presence of a law or mandate at the state level may not impact actual collection or policy in local communities. For example, Georgia’s state government requires local governments to have waste management plans, but local governments are not obligated to meet the state waste management standards nor to report their progress to the state government (Georgia DCA, 2017).
Figure 4. States with state-level recycling mandates. Figure from Northeast Recycling Council (2017).
Cities and counties also have the authority to enact recycling mandates through city and county codes, regardless of the policy at the state level. Examples include the City of Portland, Oregon, which required a 50% recycling rate for the commercial sector beginning in 1996, and Alameda County, California (ACWMA, n.d.; City of Portland, 2017). As a result, recycling programs and rates vary widely from state to state, and from county to county- even if those counties are in a state with statewide policies.
10
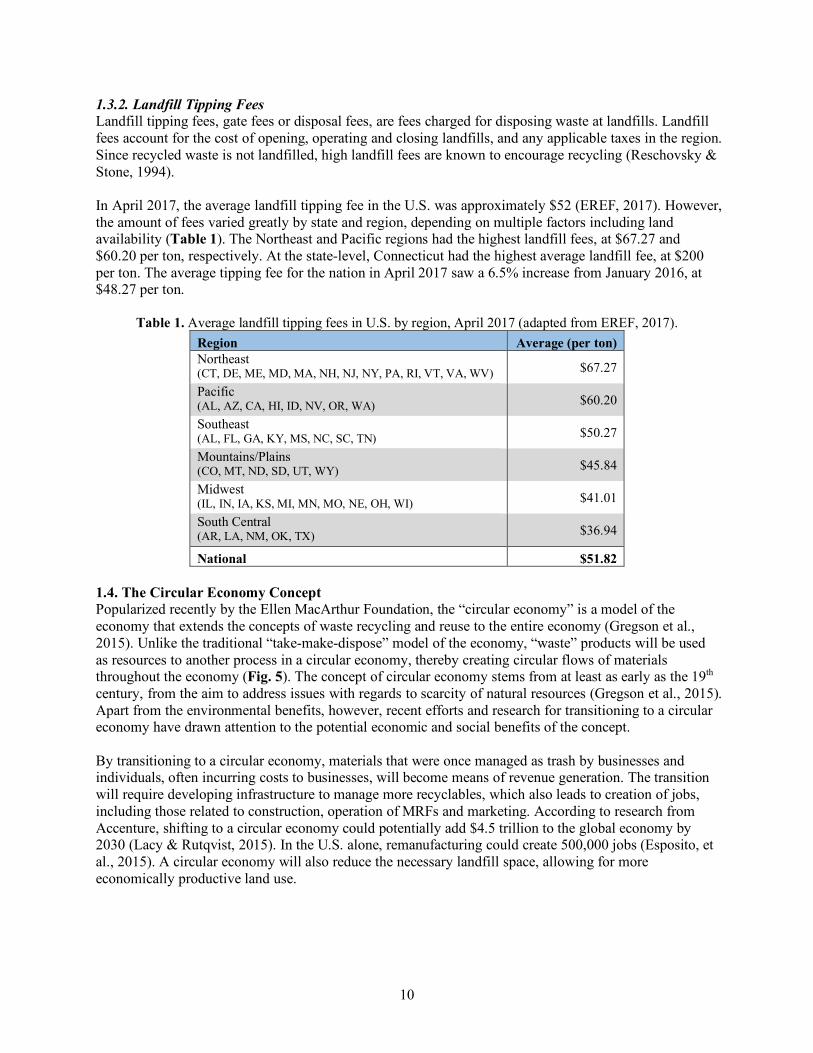
1.3.2. Landfill Tipping Fees Landfill tipping fees, gate fees or disposal fees, are fees charged for disposing waste at landfills. Landfill fees account for the cost of opening, operating and closing landfills, and any applicable taxes in the region. Since recycled waste is not landfilled, high landfill fees are known to encourage recycling (Reschovsky & Stone, 1994). In April 2017, the average landfill tipping fee in the U.S. was approximately $52 (EREF, 2017). However, the amount of fees varied greatly by state and region, depending on multiple factors including land availability (Table 1). The Northeast and Pacific regions had the highest landfill fees, at $67.27 and $60.20 per ton, respectively. At the state-level, Connecticut had the highest average landfill fee, at $200 per ton. The average tipping fee for the nation in April 2017 saw a 6.5% increase from January 2016, at $48.27 per ton.
Table 1. Average landfill tipping fees in U.S. by region, April 2017 (adapted from EREF, 2017). Region Average (per ton) Northeast (CT, DE, ME, MD, MA, NH, NJ, NY, PA, RI, VT, VA, WV) $67.27
Pacific (AL, AZ, CA, HI, ID, NV, OR, WA) $60.20
Southeast (AL, FL, GA, KY, MS, NC, SC, TN) $50.27
Mountains/Plains (CO, MT, ND, SD, UT, WY) $45.84
Midwest (IL, IN, IA, KS, MI, MN, MO, NE, OH, WI) $41.01
South Central (AR, LA, NM, OK, TX) $36.94
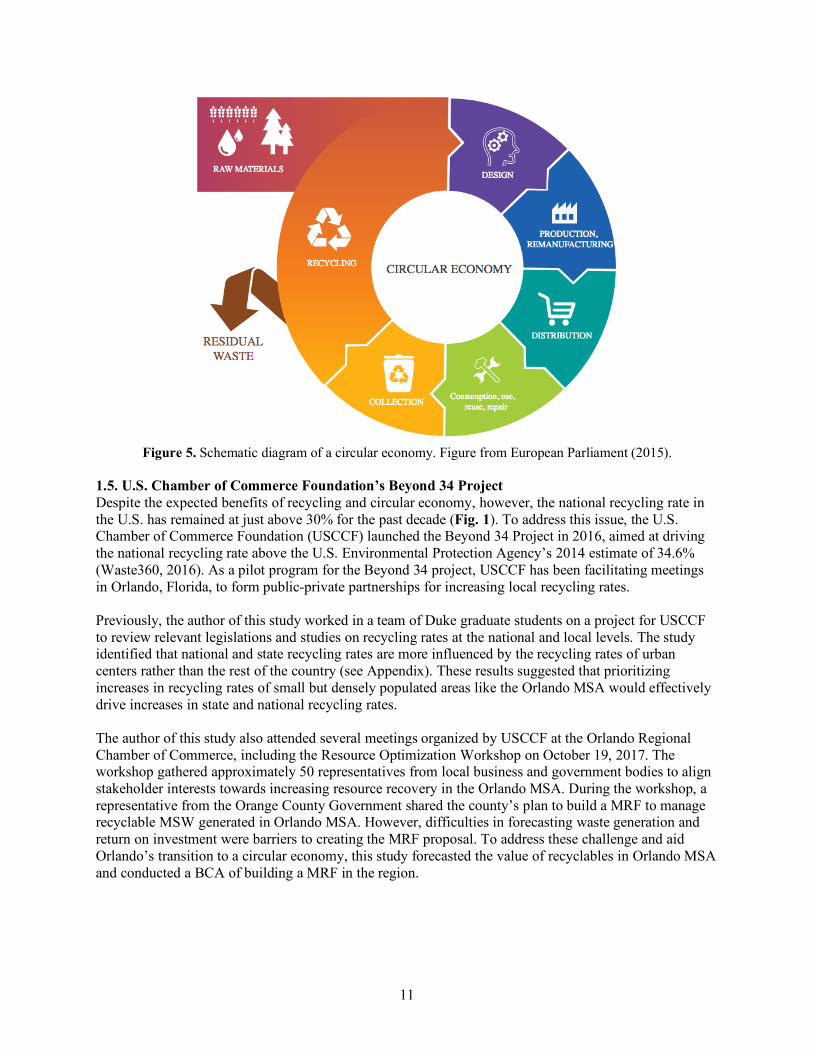
National $51.82 1.4. The Circular Economy Concept Popularized recently by the Ellen MacArthur Foundation, the “circular economy” is a model of the economy that extends the concepts of waste recycling and reuse to the entire economy (Gregson et al., 2015). Unlike the traditional “take-make-dispose” model of the economy, “waste” products will be used as resources to another process in a circular economy, thereby creating circular flows of materials throughout the economy (Fig. 5). The concept of circular economy stems from at least as early as the 19th century, from the aim to address issues with regards to scarcity of natural resources (Gregson et al., 2015). Apart from the environmental benefits, however, recent efforts and research for transitioning to a circular economy have drawn attention to the potential economic and social benefits of the concept. By transitioning to a circular economy, materials that were once managed as trash by businesses and individuals, often incurring costs to businesses, will become means of revenue generation. The transition will require developing infrastructure to manage more recyclables, which also leads to creation of jobs, including those related to construction, operation of MRFs and marketing. According to research from Accenture, shifting to a circular economy could potentially add $4.5 trillion to the global economy by 2030 (Lacy & Rutqvist, 2015). In the U.S. alone, remanufacturing could create 500,000 jobs (Esposito, et al., 2015). A circular economy will also reduce the necessary landfill space, allowing for more economically productive land use.
11
Figure 5. Schematic diagram of a circular economy. Figure from European Parliament (2015).
1.5. U.S. Chamber of Commerce Foundation’s Beyond 34 Project Despite the expected benefits of recycling and circular economy, however, the national recycling rate in the U.S. has remained at just above 30% for the past decade (Fig. 1). To address this issue, the U.S. Chamber of Commerce Foundation (USCCF) launched the Beyond 34 Project in 2016, aimed at driving the national recycling rate above the U.S. Environmental Protection Agency’s 2014 estimate of 34.6% (Waste360, 2016). As a pilot program for the Beyond 34 project, USCCF has been facilitating meetings in Orlando, Florida, to form public-private partnerships for increasing local recycling rates. Previously, the author of this study worked in a team of Duke graduate students on a project for USCCF to review relevant legislations and studies on recycling rates at the national and local levels. The study identified that national and state recycling rates are more influenced by the recycling rates of urban centers rather than the rest of the country (see Appendix). These results suggested that prioritizing increases in recycling rates of small but densely populated areas like the Orlando MSA would effectively drive increases in state and national recycling rates. The author of this study also attended several meetings organized by USCCF at the Orlando Regional Chamber of Commerce, including the Resource Optimization Workshop on October 19, 2017. The workshop gathered approximately 50 representatives from local business and government bodies to align stakeholder interests towards increasing resource recovery in the Orlando MSA. During the workshop, a representative from the Orange County Government shared the county’s plan to build a MRF to manage recyclable MSW generated in Orlando MSA. However, difficulties in forecasting waste generation and return on investment were barriers to creating the MRF proposal. To address these challenge and aid Orlando’s transition to a circular economy, this study forecasted the value of recyclables in Orlando MSA and conducted a BCA of building a MRF in the region.
12
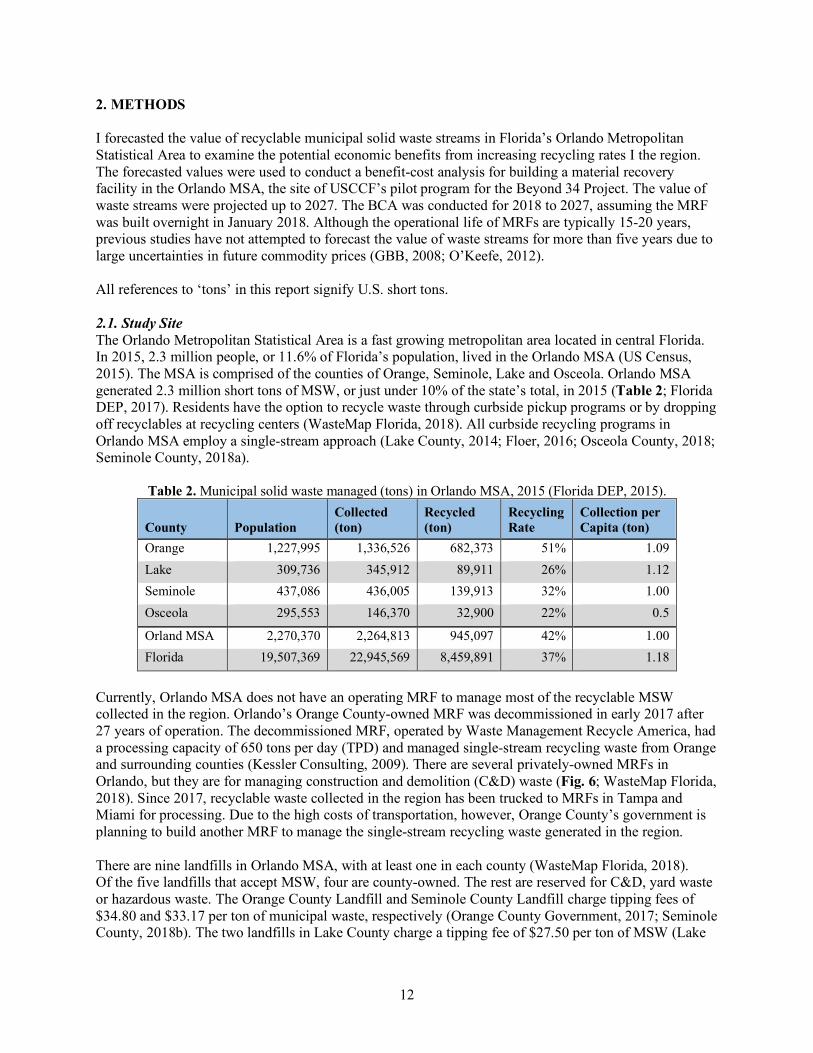
2. METHODS I forecasted the value of recyclable municipal solid waste streams in Florida’s Orlando Metropolitan Statistical Area to examine the potential economic benefits from increasing recycling rates I the region. The forecasted values were used to conduct a benefit-cost analysis for building a material recovery facility in the Orlando MSA, the site of USCCF’s pilot program for the Beyond 34 Project. The value of waste streams were projected up to 2027. The BCA was conducted for 2018 to 2027, assuming the MRF was built overnight in January 2018. Although the operational life of MRFs are typically 15-20 years, previous studies have not attempted to forecast the value of waste streams for more than five years due to large uncertainties in future commodity prices (GBB, 2008; O’Keefe, 2012). All references to ‘tons’ in this report signify U.S. short tons. 2.1. Study Site The Orlando Metropolitan Statistical Area is a fast growing metropolitan area located in central Florida. In 2015, 2.3 million people, or 11.6% of Florida’s population, lived in the Orlando MSA (US Census, 2015). The MSA is comprised of the counties of Orange, Seminole, Lake and Osceola. Orlando MSA generated 2.3 million short tons of MSW, or just under 10% of the state’s total, in 2015 (Table 2; Florida DEP, 2017). Residents have the option to recycle waste through curbside pickup programs or by dropping off recyclables at recycling centers (WasteMap Florida, 2018). All curbside recycling programs in Orlando MSA employ a single-stream approach (Lake County, 2014; Floer, 2016; Osceola County, 2018; Seminole County, 2018a).
Table 2. Municipal solid waste managed (tons) in Orlando MSA, 2015 (Florida DEP, 2015).
County Population Collected (ton)
Recycled (ton)
Recycling Rate
Collection per Capita (ton)
Orange 1,227,995 1,336,526 682,373 51% 1.09 Lake 309,736 345,912 89,911 26% 1.12 Seminole 437,086 436,005 139,913 32% 1.00 Osceola 295,553 146,370 32,900 22% 0.5
Orland MSA 2,270,370 2,264,813 945,097 42% 1.00 Florida 19,507,369 22,945,569 8,459,891 37% 1.18
Currently, Orlando MSA does not have an operating MRF to manage most of the recyclable MSW collected in the region. Orlando’s Orange County-owned MRF was decommissioned in early 2017 after 27 years of operation. The decommissioned MRF, operated by Waste Management Recycle America, had a processing capacity of 650 tons per day (TPD) and managed single-stream recycling waste from Orange and surrounding counties (Kessler Consulting, 2009). There are several privately-owned MRFs in Orlando, but they are for managing construction and demolition (C&D) waste (Fig. 6; WasteMap Florida, 2018). Since 2017, recyclable waste collected in the region has been trucked to MRFs in Tampa and Miami for processing. Due to the high costs of transportation, however, Orange County’s government is planning to build another MRF to manage the single-stream recycling waste generated in the region. There are nine landfills in Orlando MSA, with at least one in each county (WasteMap Florida, 2018). Of the five landfills that accept MSW, four are county-owned. The rest are reserved for C&D, yard waste or hazardous waste. The Orange County Landfill and Seminole County Landfill charge tipping fees of $34.80 and $33.17 per ton of municipal waste, respectively (Orange County Government, 2017; Seminole County, 2018b). The two landfills in Lake County charge a tipping fee of $27.50 per ton of MSW (Lake
13
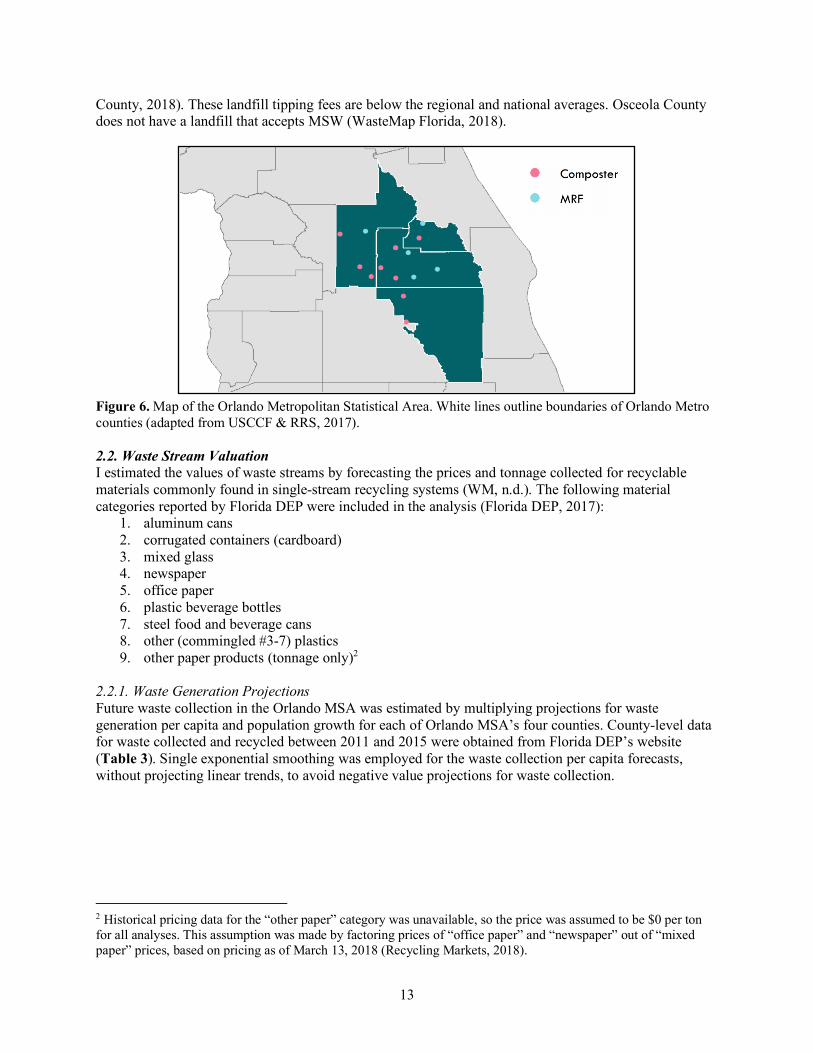
County, 2018). These landfill tipping fees are below the regional and national averages. Osceola County does not have a landfill that accepts MSW (WasteMap Florida, 2018).
Figure 6. Map of the Orlando Metropolitan Statistical Area. White lines outline boundaries of Orlando Metro counties (adapted from USCCF & RRS, 2017). 2.2. Waste Stream Valuation I estimated the values of waste streams by forecasting the prices and tonnage collected for recyclable materials commonly found in single-stream recycling systems (WM, n.d.). The following material categories reported by Florida DEP were included in the analysis (Florida DEP, 2017):
1. aluminum cans 2. corrugated containers (cardboard) 3. mixed glass 4. newspaper 5. office paper 6. plastic beverage bottles 7. steel food and beverage cans 8. other (commingled #3-7) plastics 9. other paper products (tonnage only)2
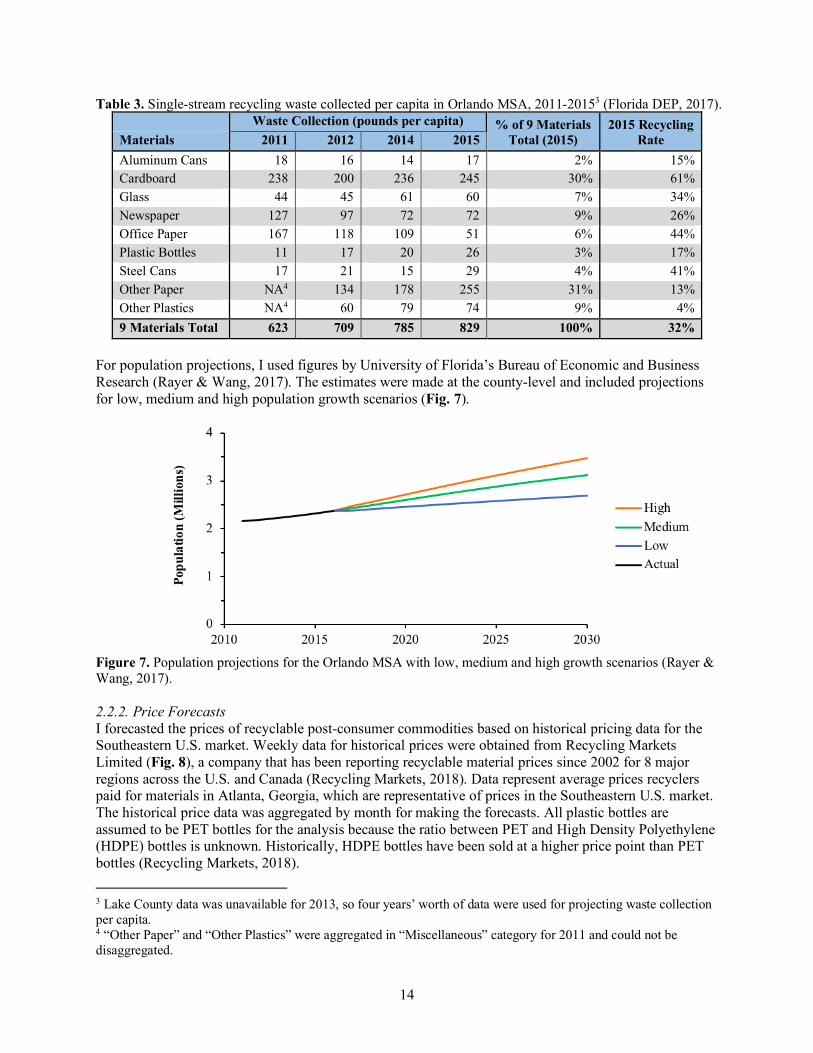
2.2.1. Waste Generation Projections Future waste collection in the Orlando MSA was estimated by multiplying projections for waste generation per capita and population growth for each of Orlando MSA’s four counties. County-level data for waste collected and recycled between 2011 and 2015 were obtained from Florida DEP’s website (Table 3). Single exponential smoothing was employed for the waste collection per capita forecasts, without projecting linear trends, to avoid negative value projections for waste collection.
2 Historical pricing data for the “other paper” category was unavailable, so the price was assumed to be $0 per ton for all analyses. This assumption was made by factoring prices of “office paper” and “newspaper” out of “mixed paper” prices, based on pricing as of March 13, 2018 (Recycling Markets, 2018).
14
Table 3. Single-stream recycling waste collected per capita in Orlando MSA, 2011-20153 (Florida DEP, 2017). Waste Collection (pounds per capita) % of 9 Materials
Total (2015) 2015 Recycling
Rate Materials 2011 2012 2014 2015 Aluminum Cans 18 16 14 17 2% 15% Cardboard 238 200 236 245 30% 61% Glass 44 45 61 60 7% 34% Newspaper 127 97 72 72 9% 26% Office Paper 167 118 109 51 6% 44% Plastic Bottles 11 17 20 26 3% 17% Steel Cans 17 21 15 29 4% 41% Other Paper NA4 134 178 255 31% 13% Other Plastics NA4 60 79 74 9% 4% 9 Materials Total 623 709 785 829 100% 32%
For population projections, I used figures by University of Florida’s Bureau of Economic and Business Research (Rayer & Wang, 2017). The estimates were made at the county-level and included projections for low, medium and high population growth scenarios (Fig. 7).
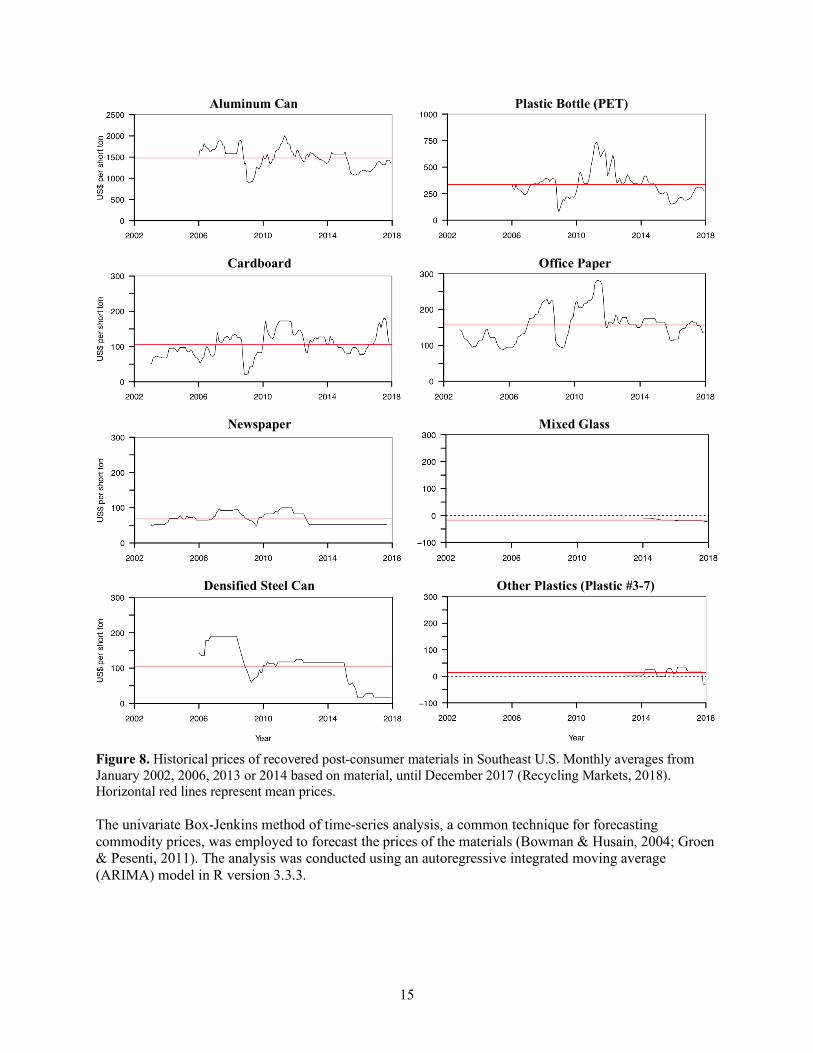
Figure 7. Population projections for the Orlando MSA with low, medium and high growth scenarios (Rayer & Wang, 2017). 2.2.2. Price Forecasts I forecasted the prices of recyclable post-consumer commodities based on historical pricing data for the Southeastern U.S. market. Weekly data for historical prices were obtained from Recycling Markets Limited (Fig. 8), a company that has been reporting recyclable material prices since 2002 for 8 major regions across the U.S. and Canada (Recycling Markets, 2018). Data represent average prices recyclers paid for materials in Atlanta, Georgia, which are representative of prices in the Southeastern U.S. market. The historical price data was aggregated by month for making the forecasts. All plastic bottles are assumed to be PET bottles for the analysis because the ratio between PET and High Density Polyethylene (HDPE) bottles is unknown. Historically, HDPE bottles have been sold at a higher price point than PET bottles (Recycling Markets, 2018).
3 Lake County data was unavailable for 2013, so four years’ worth of data were used for projecting waste collection per capita. 4 “Other Paper” and “Other Plastics” were aggregated in “Miscellaneous” category for 2011 and could not be disaggregated.
15
Aluminum Can Plastic Bottle (PET)
Cardboard Office Paper
Newspaper Mixed Glass
Densified Steel Can Other Plastics (Plastic #3-7)
Figure 8. Historical prices of recovered post-consumer materials in Southeast U.S. Monthly averages from January 2002, 2006, 2013 or 2014 based on material, until December 2017 (Recycling Markets, 2018). Horizontal red lines represent mean prices. The univariate Box-Jenkins method of time-series analysis, a common technique for forecasting commodity prices, was employed to forecast the prices of the materials (Bowman & Husain, 2004; Groen & Pesenti, 2011). The analysis was conducted using an autoregressive integrated moving average (ARIMA) model in R version 3.3.3.
16
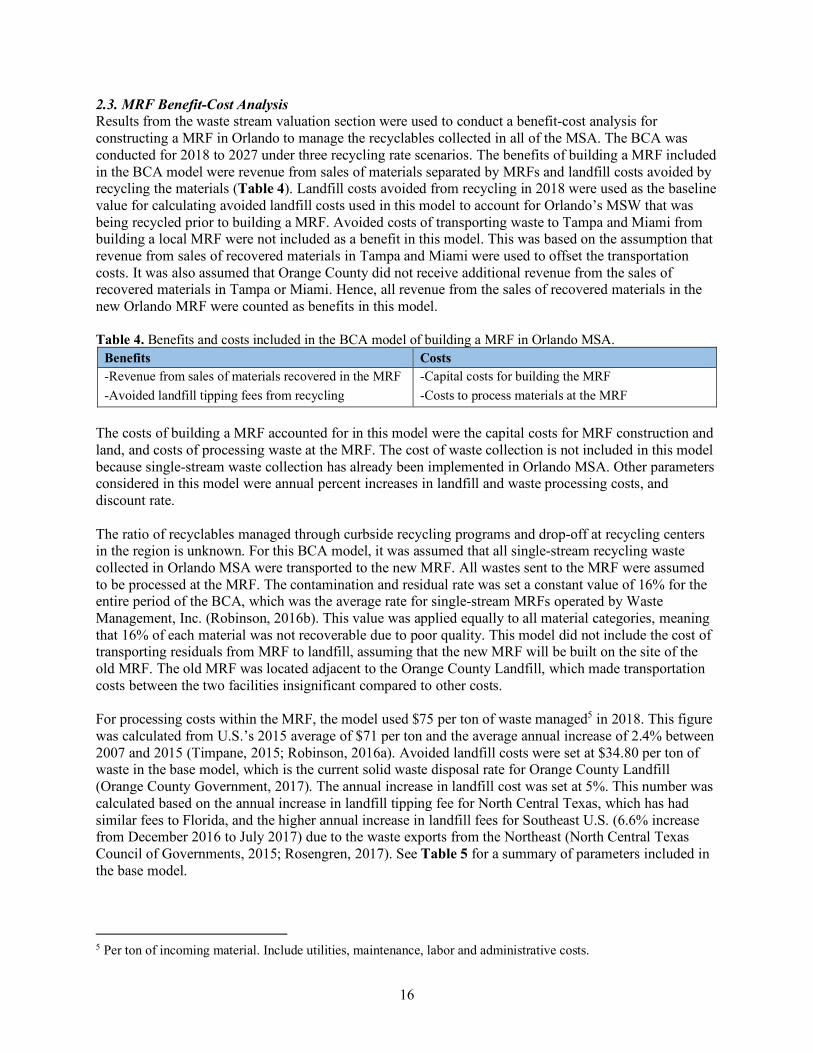
2.3. MRF Benefit-Cost Analysis Results from the waste stream valuation section were used to conduct a benefit-cost analysis for constructing a MRF in Orlando to manage the recyclables collected in all of the MSA. The BCA was conducted for 2018 to 2027 under three recycling rate scenarios. The benefits of building a MRF included in the BCA model were revenue from sales of materials separated by MRFs and landfill costs avoided by recycling the materials (Table 4). Landfill costs avoided from recycling in 2018 were used as the baseline value for calculating avoided landfill costs used in this model to account for Orlando’s MSW that was being recycled prior to building a MRF. Avoided costs of transporting waste to Tampa and Miami from building a local MRF were not included as a benefit in this model. This was based on the assumption that revenue from sales of recovered materials in Tampa and Miami were used to offset the transportation costs. It was also assumed that Orange County did not receive additional revenue from the sales of recovered materials in Tampa or Miami. Hence, all revenue from the sales of recovered materials in the new Orlando MRF were counted as benefits in this model. Table 4. Benefits and costs included in the BCA model of building a MRF in Orlando MSA.
Benefits Costs -Revenue from sales of materials recovered in the MRF -Avoided landfill tipping fees from recycling
-Capital costs for building the MRF -Costs to process materials at the MRF
The costs of building a MRF accounted for in this model were the capital costs for MRF construction and land, and costs of processing waste at the MRF. The cost of waste collection is not included in this model because single-stream waste collection has already been implemented in Orlando MSA. Other parameters considered in this model were annual percent increases in landfill and waste processing costs, and discount rate. The ratio of recyclables managed through curbside recycling programs and drop-off at recycling centers in the region is unknown. For this BCA model, it was assumed that all single-stream recycling waste collected in Orlando MSA were transported to the new MRF. All wastes sent to the MRF were assumed to be processed at the MRF. The contamination and residual rate was set a constant value of 16% for the entire period of the BCA, which was the average rate for single-stream MRFs operated by Waste Management, Inc. (Robinson, 2016b). This value was applied equally to all material categories, meaning that 16% of each material was not recoverable due to poor quality. This model did not include the cost of transporting residuals from MRF to landfill, assuming that the new MRF will be built on the site of the old MRF. The old MRF was located adjacent to the Orange County Landfill, which made transportation costs between the two facilities insignificant compared to other costs. For processing costs within the MRF, the model used $75 per ton of waste managed5 in 2018. This figure was calculated from U.S.’s 2015 average of $71 per ton and the average annual increase of 2.4% between 2007 and 2015 (Timpane, 2015; Robinson, 2016a). Avoided landfill costs were set at $34.80 per ton of waste in the base model, which is the current solid waste disposal rate for Orange County Landfill (Orange County Government, 2017). The annual increase in landfill cost was set at 5%. This number was calculated based on the annual increase in landfill tipping fee for North Central Texas, which has had similar fees to Florida, and the higher annual increase in landfill fees for Southeast U.S. (6.6% increase from December 2016 to July 2017) due to the waste exports from the Northeast (North Central Texas Council of Governments, 2015; Rosengren, 2017). See Table 5 for a summary of parameters included in the base model.
5 Per ton of incoming material. Include utilities, maintenance, labor and administrative costs.
17
Table 5. Base-model parameters for BCA of building a MRF in Orlando MSA. Model Parameter Value References Discount Rate 5% Processing Cost ($ per ton of incoming waste) 75 Timpane (2015) Annual Increase in Processing Cost 2.4% MRF Capital Cost ($ per ton of annual capacity) 18.1 Pressley et al. (2015) Landfill Tipping Fee ($ per ton) 34.80 Orange County Government (2017) Annual Increase in Landfill Cost 5% Contamination Rate 16% Robinson (2016b)
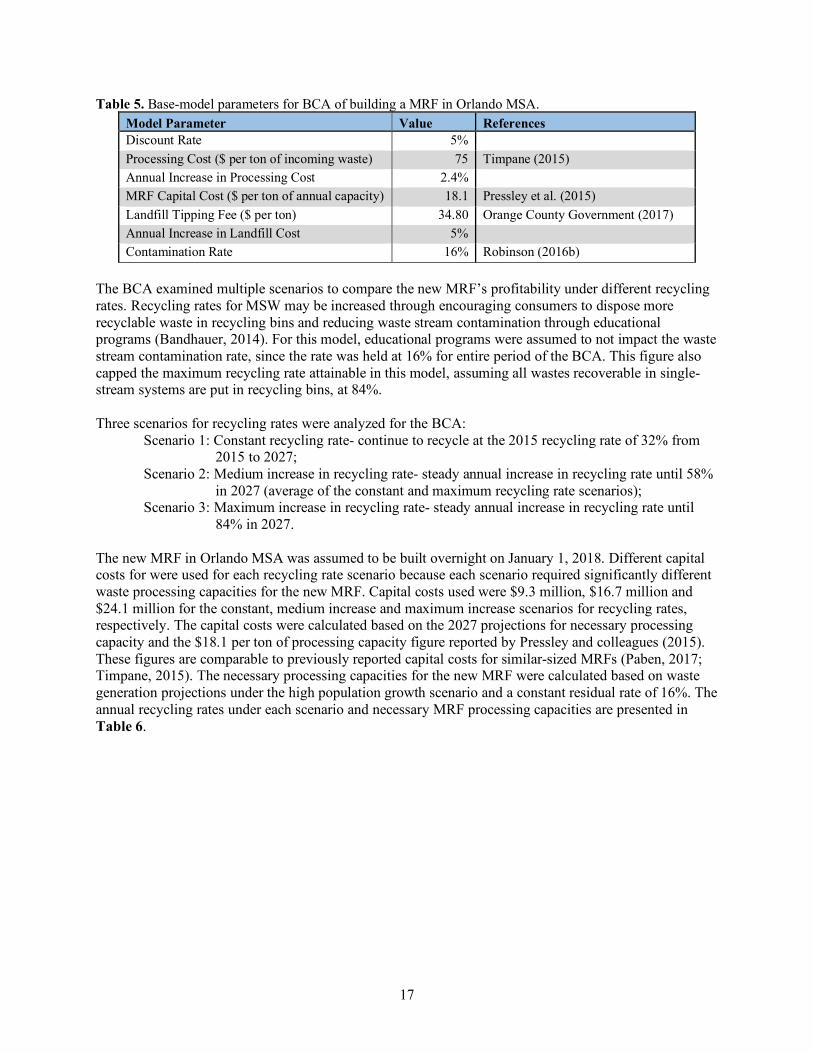
The BCA examined multiple scenarios to compare the new MRF’s profitability under different recycling rates. Recycling rates for MSW may be increased through encouraging consumers to dispose more recyclable waste in recycling bins and reducing waste stream contamination through educational programs (Bandhauer, 2014). For this model, educational programs were assumed to not impact the waste stream contamination rate, since the rate was held at 16% for entire period of the BCA. This figure also capped the maximum recycling rate attainable in this model, assuming all wastes recoverable in single-stream systems are put in recycling bins, at 84%. Three scenarios for recycling rates were analyzed for the BCA:
Scenario 1: Constant recycling rate- continue to recycle at the 2015 recycling rate of 32% from 2015 to 2027;
Scenario 2: Medium increase in recycling rate- steady annual increase in recycling rate until 58% in 2027 (average of the constant and maximum recycling rate scenarios);
Scenario 3: Maximum increase in recycling rate- steady annual increase in recycling rate until 84% in 2027.
The new MRF in Orlando MSA was assumed to be built overnight on January 1, 2018. Different capital costs for were used for each recycling rate scenario because each scenario required significantly different waste processing capacities for the new MRF. Capital costs used were $9.3 million, $16.7 million and $24.1 million for the constant, medium increase and maximum increase scenarios for recycling rates, respectively. The capital costs were calculated based on the 2027 projections for necessary processing capacity and the $18.1 per ton of processing capacity figure reported by Pressley and colleagues (2015). These figures are comparable to previously reported capital costs for similar-sized MRFs (Paben, 2017; Timpane, 2015). The necessary processing capacities for the new MRF were calculated based on waste generation projections under the high population growth scenario and a constant residual rate of 16%. The annual recycling rates under each scenario and necessary MRF processing capacities are presented in Table 6.
18
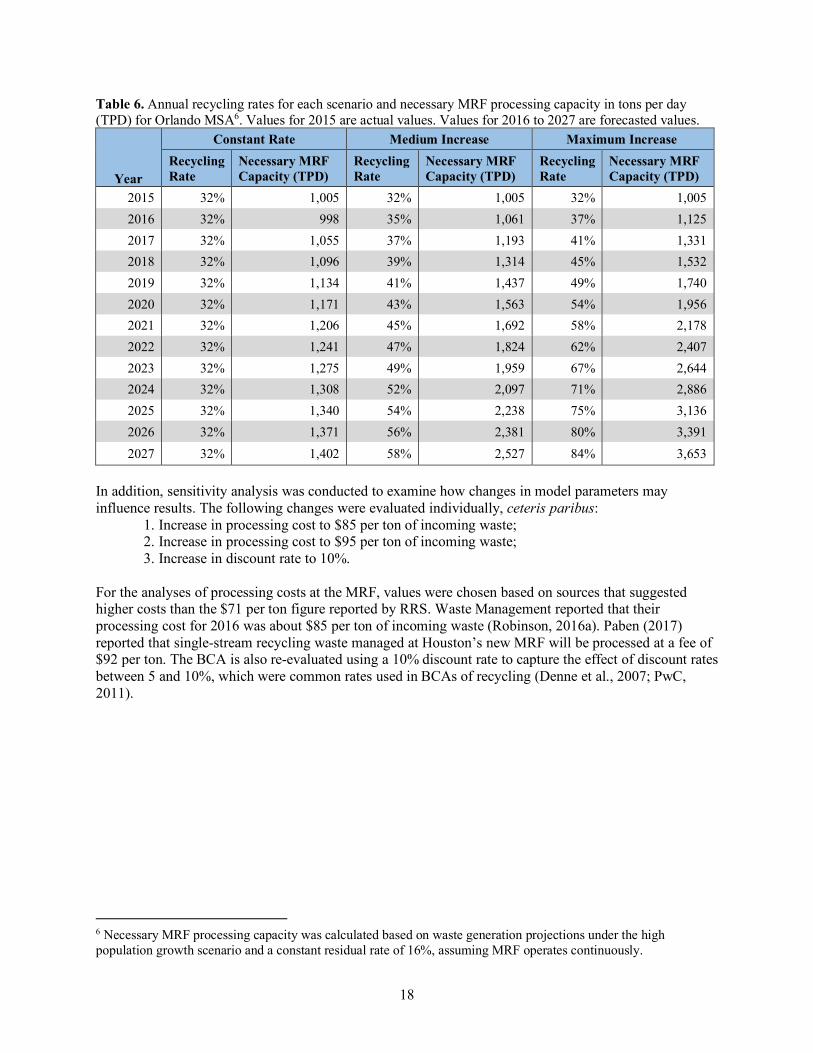
Table 6. Annual recycling rates for each scenario and necessary MRF processing capacity in tons per day (TPD) for Orlando MSA6. Values for 2015 are actual values. Values for 2016 to 2027 are forecasted values.
Year
Constant Rate Medium Increase Maximum Increase Recycling Rate
Necessary MRF Capacity (TPD)
Recycling Rate
Necessary MRF Capacity (TPD)
Recycling Rate
Necessary MRF Capacity (TPD)
2015 32% 1,005 32% 1,005 32% 1,005 2016 32% 998 35% 1,061 37% 1,125 2017 32% 1,055 37% 1,193 41% 1,331 2018 32% 1,096 39% 1,314 45% 1,532 2019 32% 1,134 41% 1,437 49% 1,740 2020 32% 1,171 43% 1,563 54% 1,956 2021 32% 1,206 45% 1,692 58% 2,178 2022 32% 1,241 47% 1,824 62% 2,407 2023 32% 1,275 49% 1,959 67% 2,644 2024 32% 1,308 52% 2,097 71% 2,886 2025 32% 1,340 54% 2,238 75% 3,136 2026 32% 1,371 56% 2,381 80% 3,391 2027 32% 1,402 58% 2,527 84% 3,653
In addition, sensitivity analysis was conducted to examine how changes in model parameters may influence results. The following changes were evaluated individually, ceteris paribus:
1. Increase in processing cost to $85 per ton of incoming waste; 2. Increase in processing cost to $95 per ton of incoming waste; 3. Increase in discount rate to 10%.
For the analyses of processing costs at the MRF, values were chosen based on sources that suggested higher costs than the $71 per ton figure reported by RRS. Waste Management reported that their processing cost for 2016 was about $85 per ton of incoming waste (Robinson, 2016a). Paben (2017) reported that single-stream recycling waste managed at Houston’s new MRF will be processed at a fee of $92 per ton. The BCA is also re-evaluated using a 10% discount rate to capture the effect of discount rates between 5 and 10%, which were common rates used in BCAs of recycling (Denne et al., 2007; PwC, 2011).
6 Necessary MRF processing capacity was calculated based on waste generation projections under the high population growth scenario and a constant residual rate of 16%, assuming MRF operates continuously.
19
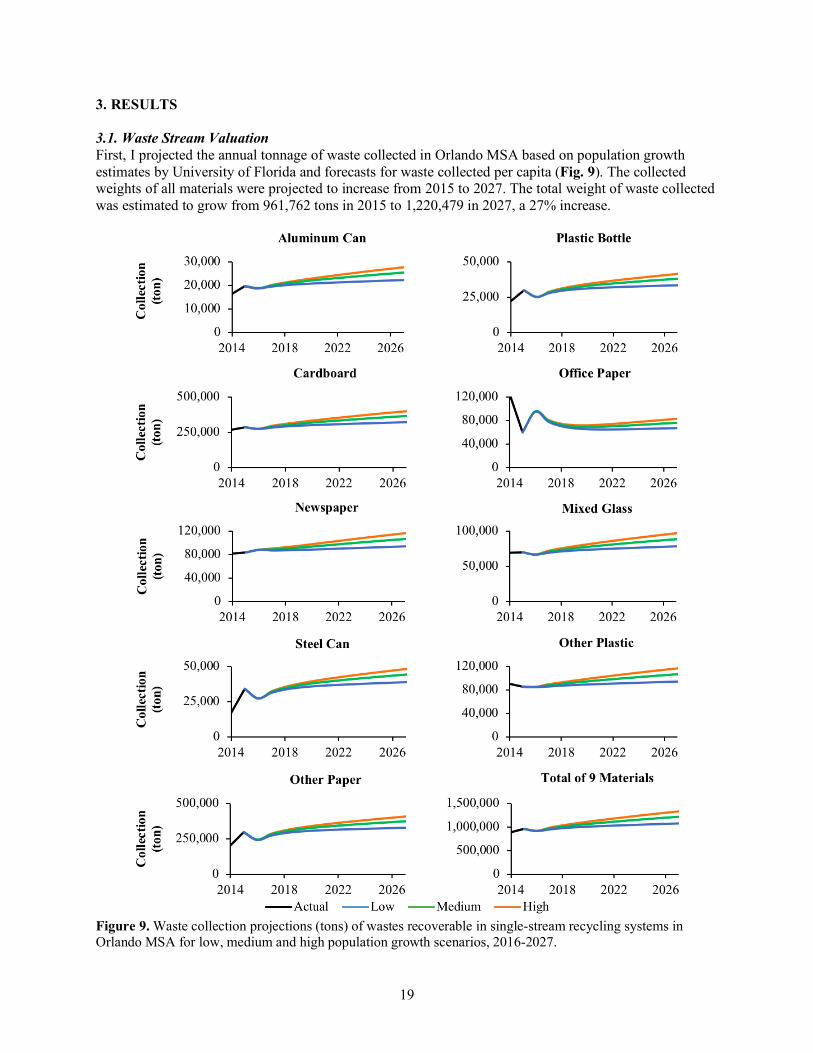
3. RESULTS 3.1. Waste Stream Valuation First, I projected the annual tonnage of waste collected in Orlando MSA based on population growth estimates by University of Florida and forecasts for waste collected per capita (Fig. 9). The collected weights of all materials were projected to increase from 2015 to 2027. The total weight of waste collected was estimated to grow from 961,762 tons in 2015 to 1,220,479 in 2027, a 27% increase.
Figure 9. Waste collection projections (tons) of wastes recoverable in single-stream recycling systems in Orlando MSA for low, medium and high population growth scenarios, 2016-2027.
20
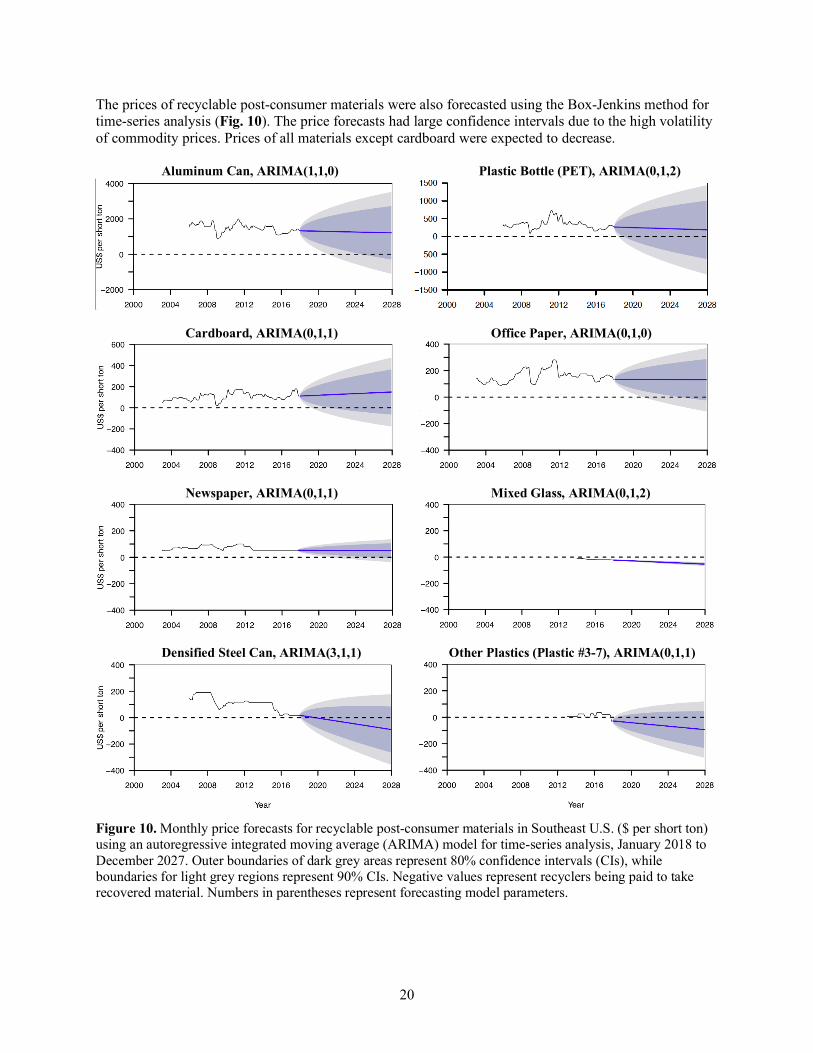
The prices of recyclable post-consumer materials were also forecasted using the Box-Jenkins method for time-series analysis (Fig. 10). The price forecasts had large confidence intervals due to the high volatility of commodity prices. Prices of all materials except cardboard were expected to decrease. Aluminum Can, ARIMA(1,1,0) Plastic Bottle (PET), ARIMA(0,1,2)
Cardboard, ARIMA(0,1,1) Office Paper, ARIMA(0,1,0)
Newspaper, ARIMA(0,1,1) Mixed Glass, ARIMA(0,1,2)
Densified Steel Can, ARIMA(3,1,1) Other Plastics (Plastic #3-7), ARIMA(0,1,1)
Figure 10. Monthly price forecasts for recyclable post-consumer materials in Southeast U.S. ($ per short ton) using an autoregressive integrated moving average (ARIMA) model for time-series analysis, January 2018 to December 2027. Outer boundaries of dark grey areas represent 80% confidence intervals (CIs), while boundaries for light grey regions represent 90% CIs. Negative values represent recyclers being paid to take recovered material. Numbers in parentheses represent forecasting model parameters.
21
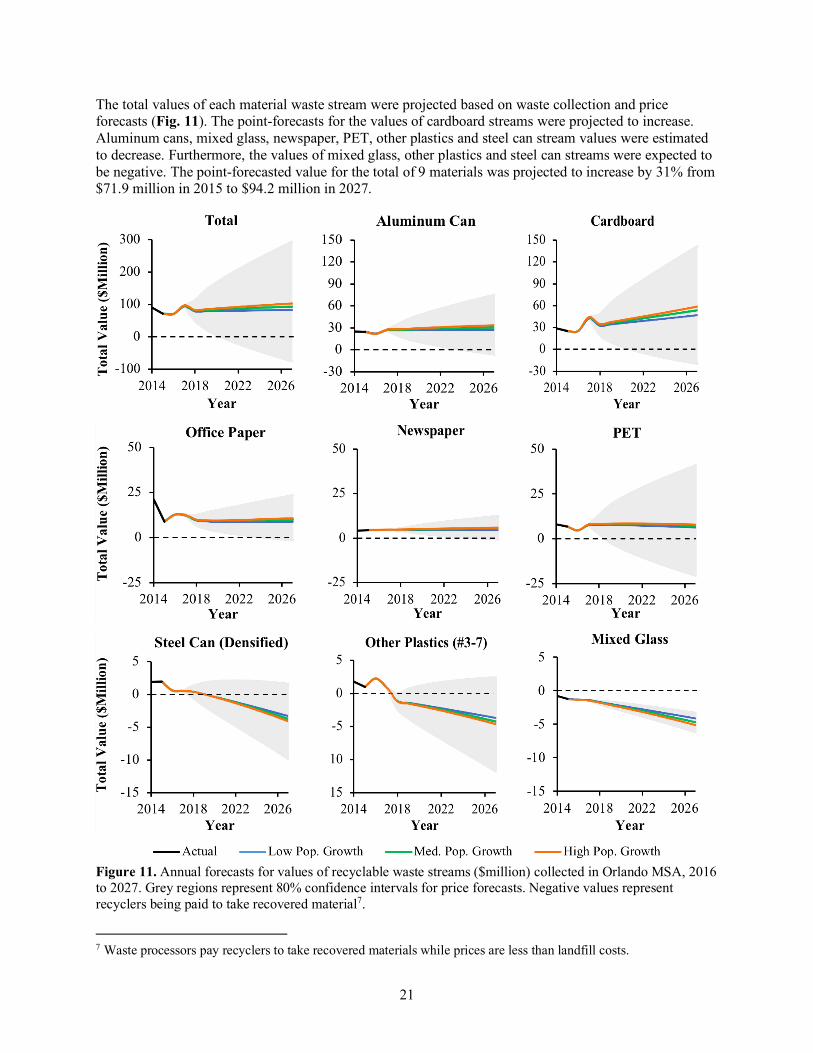
The total values of each material waste stream were projected based on waste collection and price forecasts (Fig. 11). The point-forecasts for the values of cardboard streams were projected to increase. Aluminum cans, mixed glass, newspaper, PET, other plastics and steel can stream values were estimated to decrease. Furthermore, the values of mixed glass, other plastics and steel can streams were expected to be negative. The point-forecasted value for the total of 9 materials was projected to increase by 31% from $71.9 million in 2015 to $94.2 million in 2027.
Figure 11. Annual forecasts for values of recyclable waste streams ($million) collected in Orlando MSA, 2016 to 2027. Grey regions represent 80% confidence intervals for price forecasts. Negative values represent recyclers being paid to take recovered material7.
7 Waste processors pay recyclers to take recovered materials while prices are less than landfill costs.
22
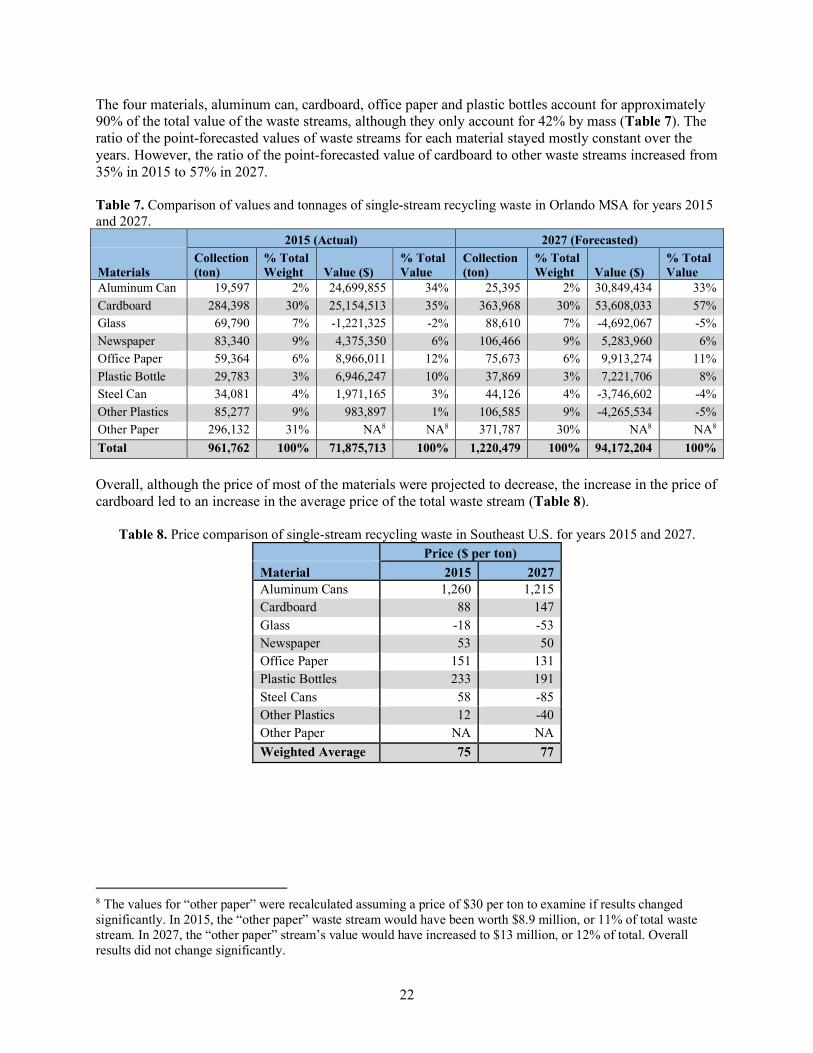
The four materials, aluminum can, cardboard, office paper and plastic bottles account for approximately 90% of the total value of the waste streams, although they only account for 42% by mass (Table 7). The ratio of the point-forecasted values of waste streams for each material stayed mostly constant over the years. However, the ratio of the point-forecasted value of cardboard to other waste streams increased from 35% in 2015 to 57% in 2027. Table 7. Comparison of values and tonnages of single-stream recycling waste in Orlando MSA for years 2015 and 2027. 2015 (Actual) 2027 (Forecasted)
Materials Collection (ton)
% Total Weight Value ($)
% Total Value
Collection (ton)
% Total Weight Value ($)
% Total Value
Aluminum Can 19,597 2% 24,699,855 34% 25,395 2% 30,849,434 33% Cardboard 284,398 30% 25,154,513 35% 363,968 30% 53,608,033 57% Glass 69,790 7% -1,221,325 -2% 88,610 7% -4,692,067 -5% Newspaper 83,340 9% 4,375,350 6% 106,466 9% 5,283,960 6% Office Paper 59,364 6% 8,966,011 12% 75,673 6% 9,913,274 11% Plastic Bottle 29,783 3% 6,946,247 10% 37,869 3% 7,221,706 8% Steel Can 34,081 4% 1,971,165 3% 44,126 4% -3,746,602 -4% Other Plastics 85,277 9% 983,897 1% 106,585 9% -4,265,534 -5% Other Paper 296,132 31% NA8 NA8 371,787 30% NA8 NA8
Total 961,762 100% 71,875,713 100% 1,220,479 100% 94,172,204 100% Overall, although the price of most of the materials were projected to decrease, the increase in the price of cardboard led to an increase in the average price of the total waste stream (Table 8).
Table 8. Price comparison of single-stream recycling waste in Southeast U.S. for years 2015 and 2027. Price ($ per ton) Material 2015 2027 Aluminum Cans 1,260 1,215 Cardboard 88 147 Glass -18 -53 Newspaper 53 50 Office Paper 151 131 Plastic Bottles 233 191 Steel Cans 58 -85 Other Plastics 12 -40 Other Paper NA NA Weighted Average 75 77
8 The values for “other paper” were recalculated assuming a price of $30 per ton to examine if results changed significantly. In 2015, the “other paper” waste stream would have been worth $8.9 million, or 11% of total waste stream. In 2027, the “other paper” stream’s value would have increased to $13 million, or 12% of total. Overall results did not change significantly.
23
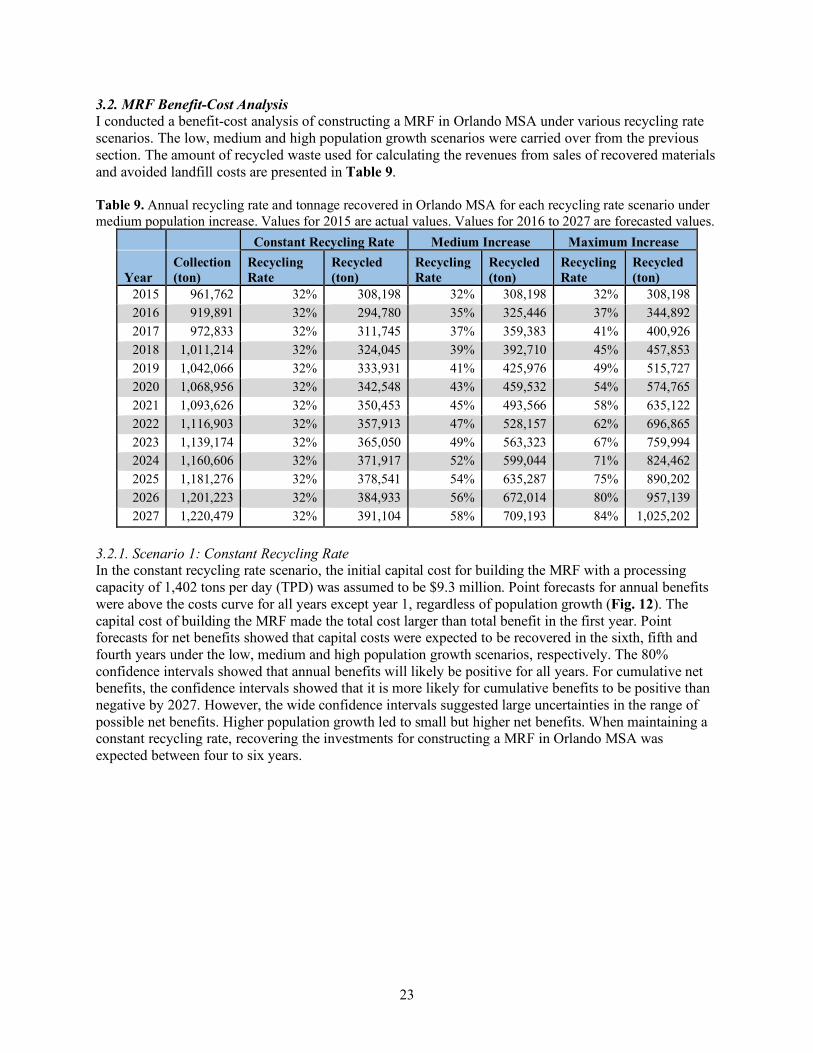
3.2. MRF Benefit-Cost Analysis I conducted a benefit-cost analysis of constructing a MRF in Orlando MSA under various recycling rate scenarios. The low, medium and high population growth scenarios were carried over from the previous section. The amount of recycled waste used for calculating the revenues from sales of recovered materials and avoided landfill costs are presented in Table 9. Table 9. Annual recycling rate and tonnage recovered in Orlando MSA for each recycling rate scenario under medium population increase. Values for 2015 are actual values. Values for 2016 to 2027 are forecasted values.
Constant Recycling Rate Medium Increase Maximum Increase
Year Collection (ton)
Recycling Rate
Recycled (ton)
Recycling Rate
Recycled (ton)
Recycling Rate
Recycled (ton)
2015 961,762 32% 308,198 32% 308,198 32% 308,198 2016 919,891 32% 294,780 35% 325,446 37% 344,892 2017 972,833 32% 311,745 37% 359,383 41% 400,926 2018 1,011,214 32% 324,045 39% 392,710 45% 457,853 2019 1,042,066 32% 333,931 41% 425,976 49% 515,727 2020 1,068,956 32% 342,548 43% 459,532 54% 574,765 2021 1,093,626 32% 350,453 45% 493,566 58% 635,122 2022 1,116,903 32% 357,913 47% 528,157 62% 696,865 2023 1,139,174 32% 365,050 49% 563,323 67% 759,994 2024 1,160,606 32% 371,917 52% 599,044 71% 824,462 2025 1,181,276 32% 378,541 54% 635,287 75% 890,202 2026 1,201,223 32% 384,933 56% 672,014 80% 957,139 2027 1,220,479 32% 391,104 58% 709,193 84% 1,025,202
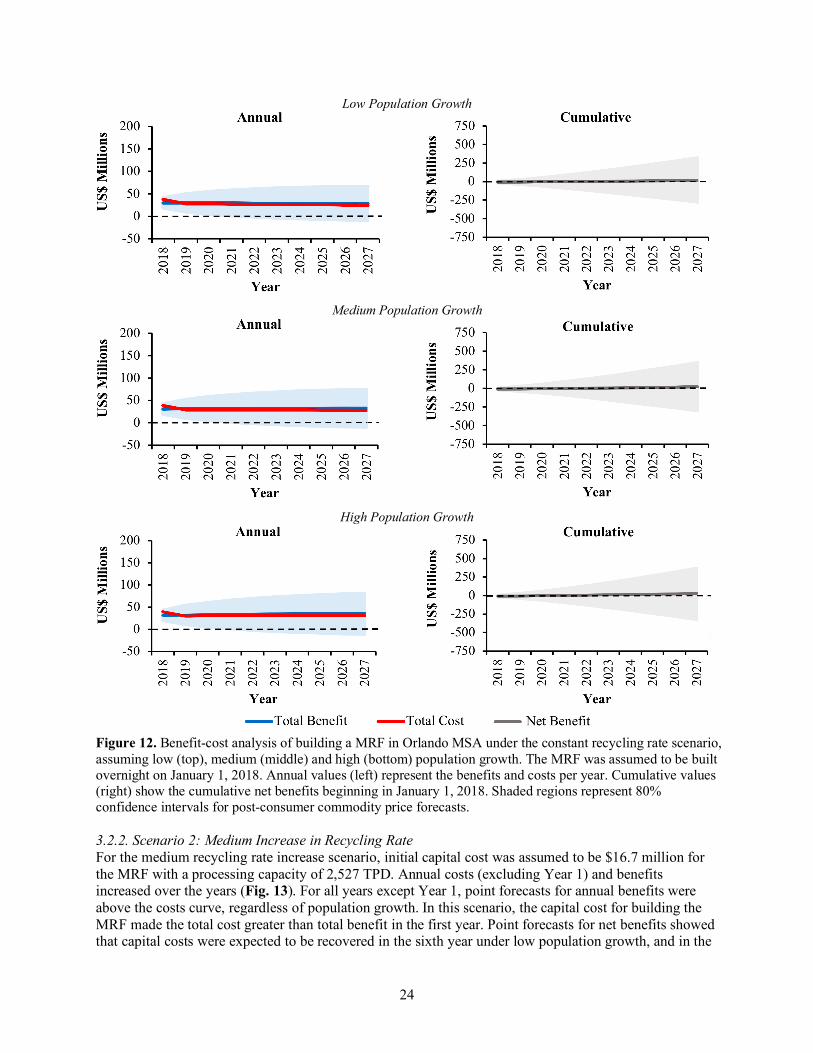
3.2.1. Scenario 1: Constant Recycling Rate In the constant recycling rate scenario, the initial capital cost for building the MRF with a processing capacity of 1,402 tons per day (TPD) was assumed to be $9.3 million. Point forecasts for annual benefits were above the costs curve for all years except year 1, regardless of population growth (Fig. 12). The capital cost of building the MRF made the total cost larger than total benefit in the first year. Point forecasts for net benefits showed that capital costs were expected to be recovered in the sixth, fifth and fourth years under the low, medium and high population growth scenarios, respectively. The 80% confidence intervals showed that annual benefits will likely be positive for all years. For cumulative net benefits, the confidence intervals showed that it is more likely for cumulative benefits to be positive than negative by 2027. However, the wide confidence intervals suggested large uncertainties in the range of possible net benefits. Higher population growth led to small but higher net benefits. When maintaining a constant recycling rate, recovering the investments for constructing a MRF in Orlando MSA was expected between four to six years.
24
Low Population Growth
Medium Population Growth
High Population Growth
Figure 12. Benefit-cost analysis of building a MRF in Orlando MSA under the constant recycling rate scenario, assuming low (top), medium (middle) and high (bottom) population growth. The MRF was assumed to be built overnight on January 1, 2018. Annual values (left) represent the benefits and costs per year. Cumulative values (right) show the cumulative net benefits beginning in January 1, 2018. Shaded regions represent 80% confidence intervals for post-consumer commodity price forecasts. 3.2.2. Scenario 2: Medium Increase in Recycling Rate For the medium recycling rate increase scenario, initial capital cost was assumed to be $16.7 million for the MRF with a processing capacity of 2,527 TPD. Annual costs (excluding Year 1) and benefits increased over the years (Fig. 13). For all years except Year 1, point forecasts for annual benefits were above the costs curve, regardless of population growth. In this scenario, the capital cost for building the MRF made the total cost greater than total benefit in the first year. Point forecasts for net benefits showed that capital costs were expected to be recovered in the sixth year under low population growth, and in the
25
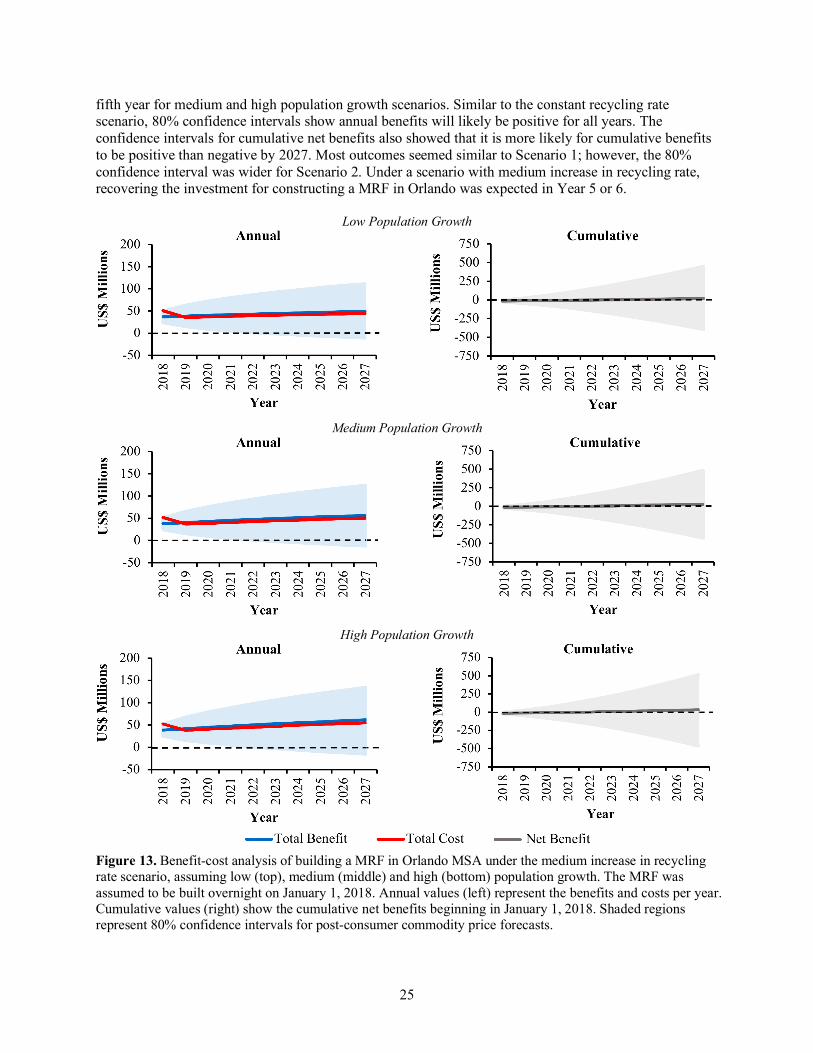
fifth year for medium and high population growth scenarios. Similar to the constant recycling rate scenario, 80% confidence intervals show annual benefits will likely be positive for all years. The confidence intervals for cumulative net benefits also showed that it is more likely for cumulative benefits to be positive than negative by 2027. Most outcomes seemed similar to Scenario 1; however, the 80% confidence interval was wider for Scenario 2. Under a scenario with medium increase in recycling rate, recovering the investment for constructing a MRF in Orlando was expected in Year 5 or 6.
Low Population Growth
Medium Population Growth
High Population Growth
Figure 13. Benefit-cost analysis of building a MRF in Orlando MSA under the medium increase in recycling rate scenario, assuming low (top), medium (middle) and high (bottom) population growth. The MRF was assumed to be built overnight on January 1, 2018. Annual values (left) represent the benefits and costs per year. Cumulative values (right) show the cumulative net benefits beginning in January 1, 2018. Shaded regions represent 80% confidence intervals for post-consumer commodity price forecasts.
26
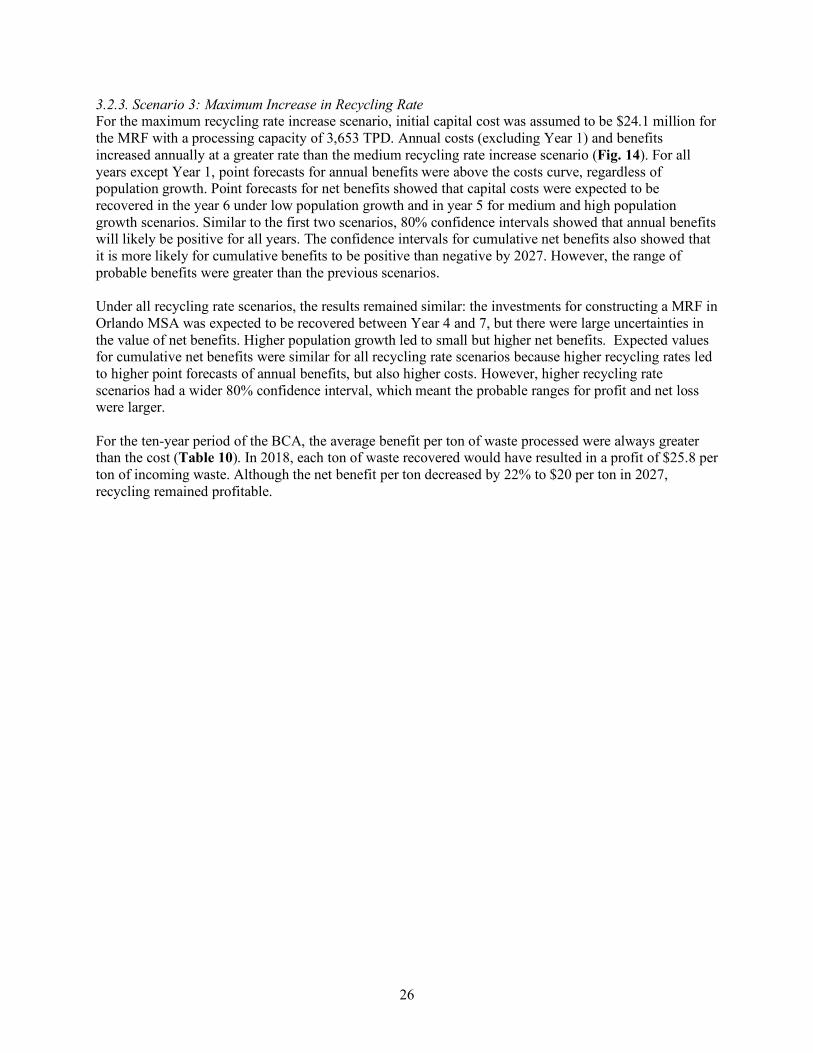
3.2.3. Scenario 3: Maximum Increase in Recycling Rate For the maximum recycling rate increase scenario, initial capital cost was assumed to be $24.1 million for the MRF with a processing capacity of 3,653 TPD. Annual costs (excluding Year 1) and benefits increased annually at a greater rate than the medium recycling rate increase scenario (Fig. 14). For all years except Year 1, point forecasts for annual benefits were above the costs curve, regardless of population growth. Point forecasts for net benefits showed that capital costs were expected to be recovered in the year 6 under low population growth and in year 5 for medium and high population growth scenarios. Similar to the first two scenarios, 80% confidence intervals showed that annual benefits will likely be positive for all years. The confidence intervals for cumulative net benefits also showed that it is more likely for cumulative benefits to be positive than negative by 2027. However, the range of probable benefits were greater than the previous scenarios. Under all recycling rate scenarios, the results remained similar: the investments for constructing a MRF in Orlando MSA was expected to be recovered between Year 4 and 7, but there were large uncertainties in the value of net benefits. Higher population growth led to small but higher net benefits. Expected values for cumulative net benefits were similar for all recycling rate scenarios because higher recycling rates led to higher point forecasts of annual benefits, but also higher costs. However, higher recycling rate scenarios had a wider 80% confidence interval, which meant the probable ranges for profit and net loss were larger. For the ten-year period of the BCA, the average benefit per ton of waste processed were always greater than the cost (Table 10). In 2018, each ton of waste recovered would have resulted in a profit of $25.8 per ton of incoming waste. Although the net benefit per ton decreased by 22% to $20 per ton in 2027, recycling remained profitable.
27
Low Population Growth
Medium Population Growth
High Population Growth
Figure 14. Benefit-cost analysis of building a MRF in Orlando MSA under the maximum increase in recycling rate scenario, assuming low (top), medium (middle) and high (bottom) population growth. The MRF was assumed to be built overnight on January 1, 2018. Annual values (left) represent the benefits and costs per year. Cumulative values (right) show the cumulative net benefits beginning in January 1, 2018. Shaded regions represent 80% confidence intervals for post-consumer commodity price forecasts.
28
Table 10. Comparison of average benefit and cost per ton of recovered material in single-stream recycling for years 2018 and 2027.
Value ($ per ton) 2018 2027 Total Benefit 114.8 131
Revenue from Sale of Recovered Materials (Weighted Average) 80 77
Avoided Landfill Cost 34.8 54 Total Cost 89 111
Processing Cost 89 111 Net Benefit 25.8 20
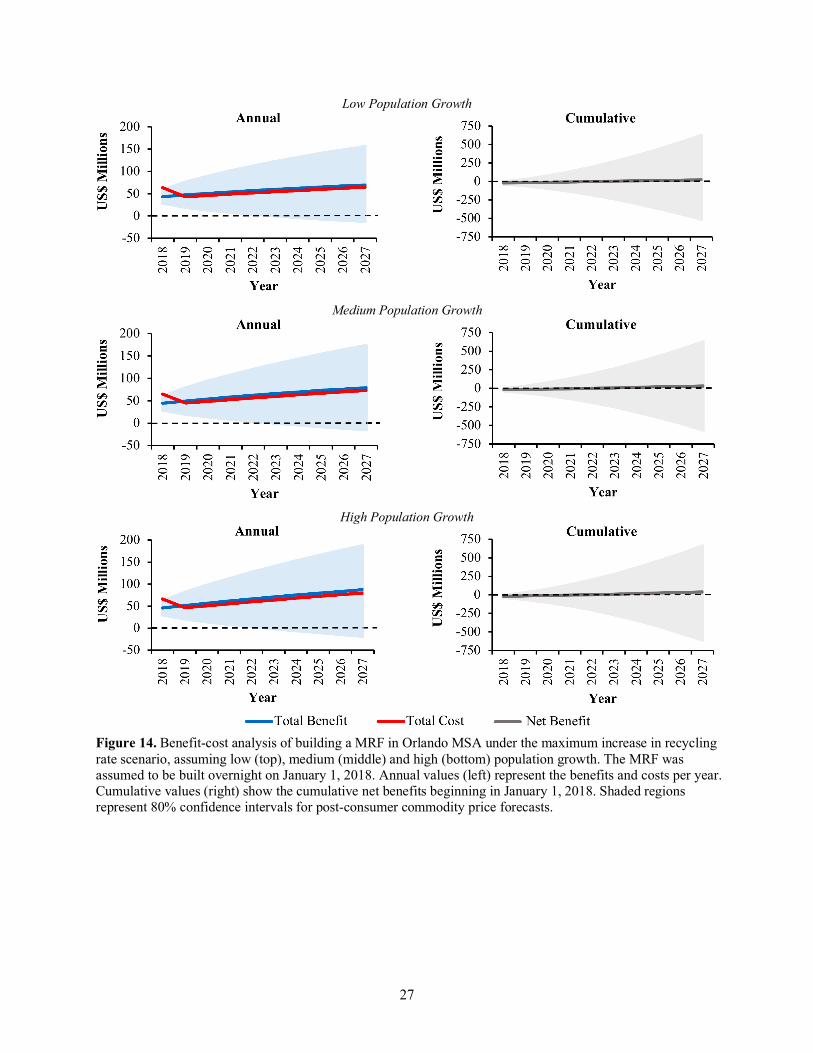
Although building a MRF in Orlando MSA was expected to be profitable, it may be worth noting that managing contamination and residuals incurred significant costs. Assuming a constant 16% contamination and residual rate and medium population growth, the total processing costs for managing residuals were expected to range from $2.2 to $7.9 million between 2018 and 2027 (Table 11). Reducing waste stream contamination may be an effective way to improve the profitability of recycling. Table 11. Tonnage and costs of processing residuals in single-stream MRF in Orlando MSA assuming residual rate of 16%, 2018 to 2027.
Constant Recycling Rate Medium Increase Maximum Increase
Year Residuals (ton)
Processing Costs ($million)
Residuals (ton)
Processing Costs ($million)
Residuals (ton)
Processing Costs ($million)
2018 62,374 2.2 74,802 2.6 87,229 3.0 2021 67,023 2.4 94,013 3.4 121,002 4.4 2024 71,148 2.7 114,104 4.4 157,060 6.0 2027 74,892 3.0 135,084 5.4 195,277 7.9
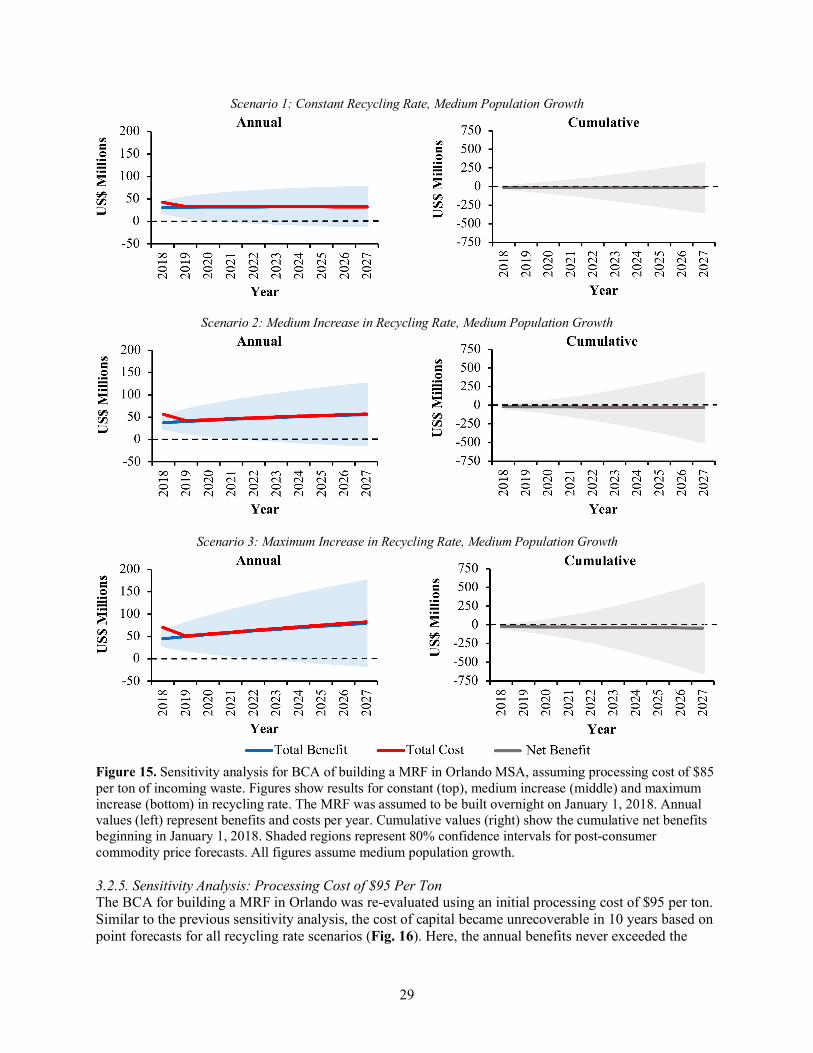
3.2.4. Sensitivity Analysis: Processing Cost of $85 Per Ton The BCA for building a MRF in Orlando MSA was re-evaluated using an initial processing cost at the MRF of $85 per ton of waste. Only results for the medium population growth scenario are presented for the sensitivity analyses because population growth scenarios did not yield significantly different results as previous sections. Compared to the base model, annual costs have increased for all recycling rate scenarios, and the point forecasts for net benefits have shifted downwards (Fig. 15). Based on point forecasts, capital costs became unrecoverable in ten years for all recycling rate scenarios. Expected annual benefits never exceeded the costs for medium and maximum recycling rate increase scenarios. For the constant recycling rate scenario, annual net benefits became positive in Year 8, but were not enough to make building a MRF profitable within ten years. Increasing the initial processing costs to $85 per ton, a $10 increase from the base model, made building a MRF in Orlando MSA expected to be unprofitable over ten years. However, the MRF may become expected to be profitable over a longer time horizon under the constant recycling rate scenario.
29
Scenario 1: Constant Recycling Rate, Medium Population Growth
Scenario 2: Medium Increase in Recycling Rate, Medium Population Growth
Scenario 3: Maximum Increase in Recycling Rate, Medium Population Growth
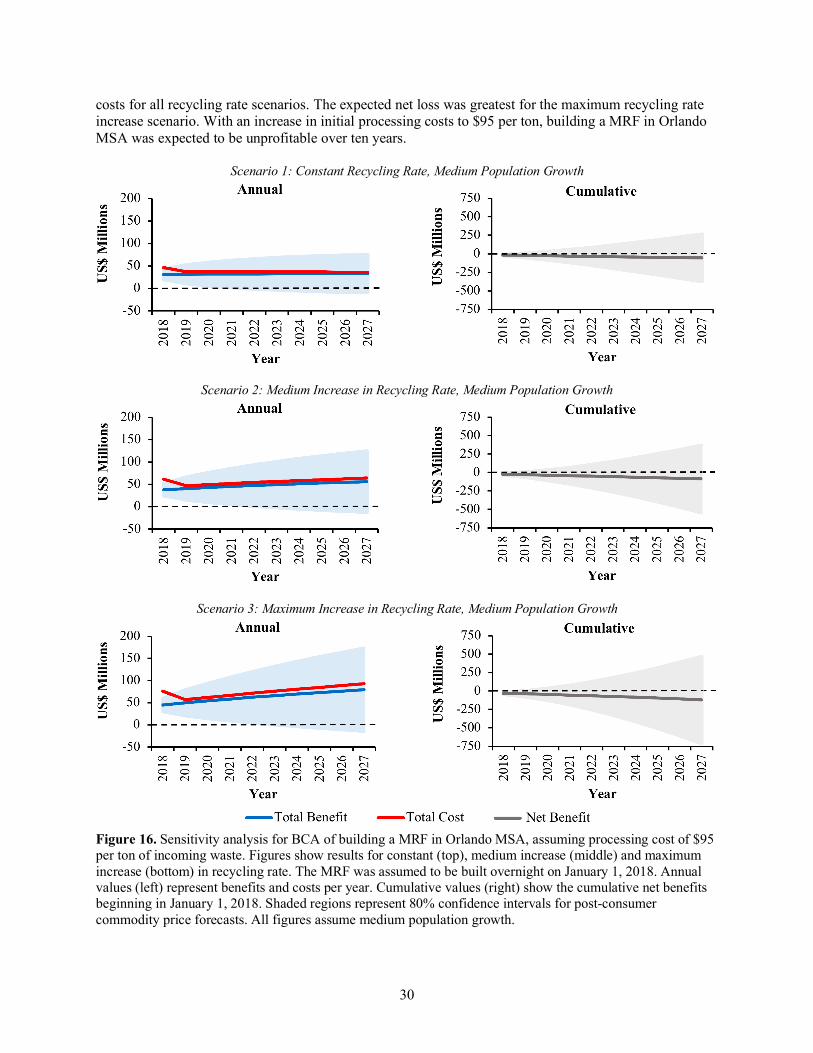
Figure 15. Sensitivity analysis for BCA of building a MRF in Orlando MSA, assuming processing cost of $85 per ton of incoming waste. Figures show results for constant (top), medium increase (middle) and maximum increase (bottom) in recycling rate. The MRF was assumed to be built overnight on January 1, 2018. Annual values (left) represent benefits and costs per year. Cumulative values (right) show the cumulative net benefits beginning in January 1, 2018. Shaded regions represent 80% confidence intervals for post-consumer commodity price forecasts. All figures assume medium population growth. 3.2.5. Sensitivity Analysis: Processing Cost of $95 Per Ton The BCA for building a MRF in Orlando was re-evaluated using an initial processing cost of $95 per ton. Similar to the previous sensitivity analysis, the cost of capital became unrecoverable in 10 years based on point forecasts for all recycling rate scenarios (Fig. 16). Here, the annual benefits never exceeded the
30
costs for all recycling rate scenarios. The expected net loss was greatest for the maximum recycling rate increase scenario. With an increase in initial processing costs to $95 per ton, building a MRF in Orlando MSA was expected to be unprofitable over ten years.
Scenario 1: Constant Recycling Rate, Medium Population Growth
Scenario 2: Medium Increase in Recycling Rate, Medium Population Growth
Scenario 3: Maximum Increase in Recycling Rate, Medium Population Growth
Figure 16. Sensitivity analysis for BCA of building a MRF in Orlando MSA, assuming processing cost of $95 per ton of incoming waste. Figures show results for constant (top), medium increase (middle) and maximum increase (bottom) in recycling rate. The MRF was assumed to be built overnight on January 1, 2018. Annual values (left) represent benefits and costs per year. Cumulative values (right) show the cumulative net benefits beginning in January 1, 2018. Shaded regions represent 80% confidence intervals for post-consumer commodity price forecasts. All figures assume medium population growth.
31
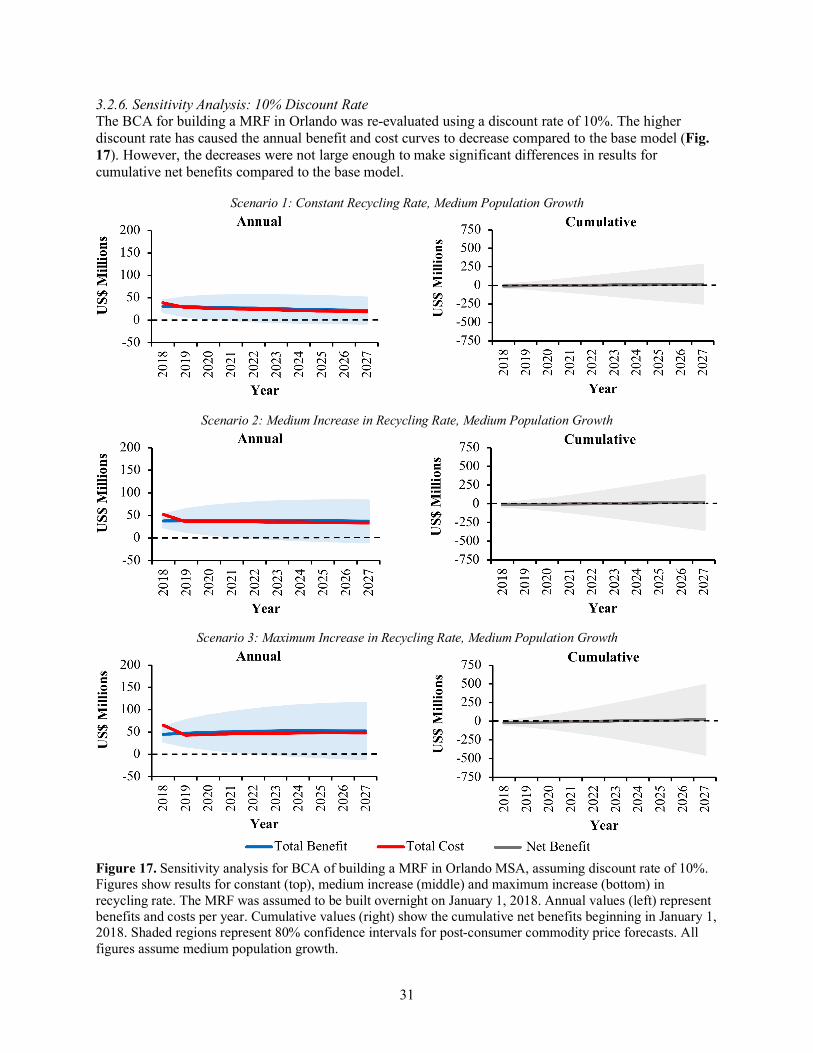
3.2.6. Sensitivity Analysis: 10% Discount Rate The BCA for building a MRF in Orlando was re-evaluated using a discount rate of 10%. The higher discount rate has caused the annual benefit and cost curves to decrease compared to the base model (Fig. 17). However, the decreases were not large enough to make significant differences in results for cumulative net benefits compared to the base model.
Scenario 1: Constant Recycling Rate, Medium Population Growth
Scenario 2: Medium Increase in Recycling Rate, Medium Population Growth
Scenario 3: Maximum Increase in Recycling Rate, Medium Population Growth
Figure 17. Sensitivity analysis for BCA of building a MRF in Orlando MSA, assuming discount rate of 10%. Figures show results for constant (top), medium increase (middle) and maximum increase (bottom) in recycling rate. The MRF was assumed to be built overnight on January 1, 2018. Annual values (left) represent benefits and costs per year. Cumulative values (right) show the cumulative net benefits beginning in January 1, 2018. Shaded regions represent 80% confidence intervals for post-consumer commodity price forecasts. All figures assume medium population growth.
32
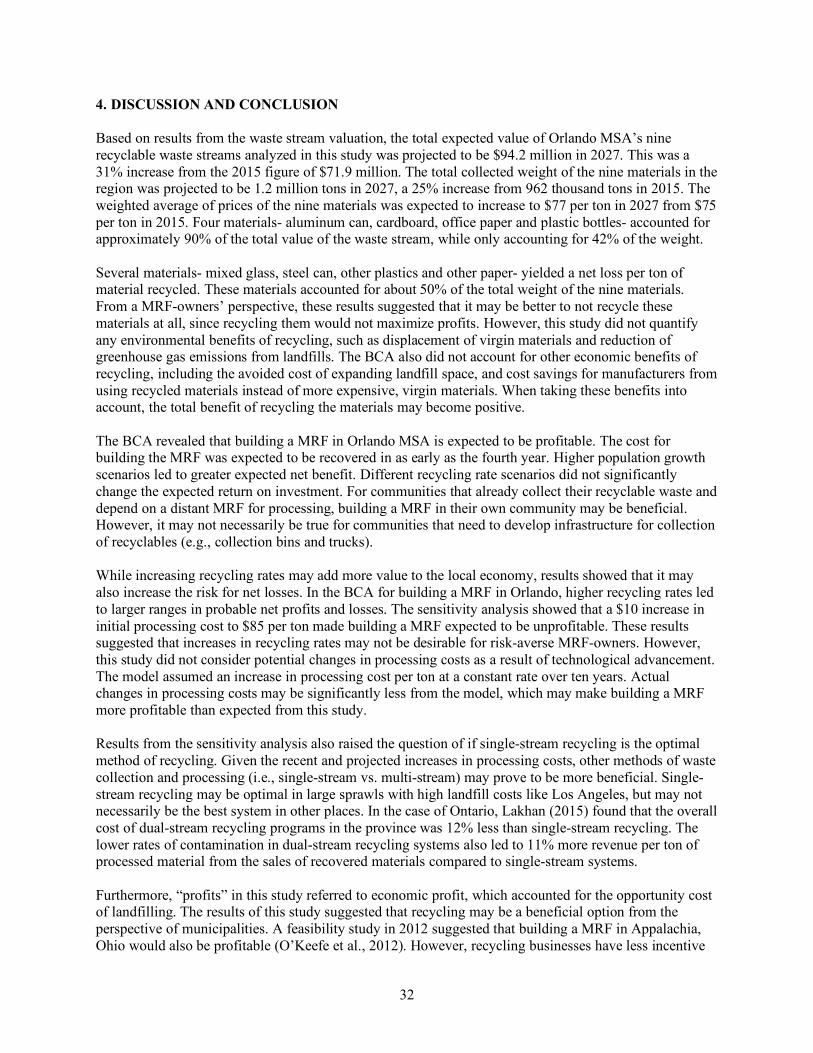
4. DISCUSSION AND CONCLUSION Based on results from the waste stream valuation, the total expected value of Orlando MSA’s nine recyclable waste streams analyzed in this study was projected to be $94.2 million in 2027. This was a 31% increase from the 2015 figure of $71.9 million. The total collected weight of the nine materials in the region was projected to be 1.2 million tons in 2027, a 25% increase from 962 thousand tons in 2015. The weighted average of prices of the nine materials was expected to increase to $77 per ton in 2027 from $75 per ton in 2015. Four materials- aluminum can, cardboard, office paper and plastic bottles- accounted for approximately 90% of the total value of the waste stream, while only accounting for 42% of the weight. Several materials- mixed glass, steel can, other plastics and other paper- yielded a net loss per ton of material recycled. These materials accounted for about 50% of the total weight of the nine materials. From a MRF-owners’ perspective, these results suggested that it may be better to not recycle these materials at all, since recycling them would not maximize profits. However, this study did not quantify any environmental benefits of recycling, such as displacement of virgin materials and reduction of greenhouse gas emissions from landfills. The BCA also did not account for other economic benefits of recycling, including the avoided cost of expanding landfill space, and cost savings for manufacturers from using recycled materials instead of more expensive, virgin materials. When taking these benefits into account, the total benefit of recycling the materials may become positive. The BCA revealed that building a MRF in Orlando MSA is expected to be profitable. The cost for building the MRF was expected to be recovered in as early as the fourth year. Higher population growth scenarios led to greater expected net benefit. Different recycling rate scenarios did not significantly change the expected return on investment. For communities that already collect their recyclable waste and depend on a distant MRF for processing, building a MRF in their own community may be beneficial. However, it may not necessarily be true for communities that need to develop infrastructure for collection of recyclables (e.g., collection bins and trucks). While increasing recycling rates may add more value to the local economy, results showed that it may also increase the risk for net losses. In the BCA for building a MRF in Orlando, higher recycling rates led to larger ranges in probable net profits and losses. The sensitivity analysis showed that a $10 increase in initial processing cost to $85 per ton made building a MRF expected to be unprofitable. These results suggested that increases in recycling rates may not be desirable for risk-averse MRF-owners. However, this study did not consider potential changes in processing costs as a result of technological advancement. The model assumed an increase in processing cost per ton at a constant rate over ten years. Actual changes in processing costs may be significantly less from the model, which may make building a MRF more profitable than expected from this study. Results from the sensitivity analysis also raised the question of if single-stream recycling is the optimal method of recycling. Given the recent and projected increases in processing costs, other methods of waste collection and processing (i.e., single-stream vs. multi-stream) may prove to be more beneficial. Single-stream recycling may be optimal in large sprawls with high landfill costs like Los Angeles, but may not necessarily be the best system in other places. In the case of Ontario, Lakhan (2015) found that the overall cost of dual-stream recycling programs in the province was 12% less than single-stream recycling. The lower rates of contamination in dual-stream recycling systems also led to 11% more revenue per ton of processed material from the sales of recovered materials compared to single-stream systems. Furthermore, “profits” in this study referred to economic profit, which accounted for the opportunity cost of landfilling. The results of this study suggested that recycling may be a beneficial option from the perspective of municipalities. A feasibility study in 2012 suggested that building a MRF in Appalachia, Ohio would also be profitable (O’Keefe et al., 2012). However, recycling businesses have less incentive
33
to recycle because accounting profits often le net losses. Reports suggested that recycling has not been profitable for recycling business in the last several years due to falls in commodity prices (Daniels, 2016). Waste Management, Inc. divested 30 recycling facilities over the past few years (Daniels, 2016). One of California’s largest recyclers, rePlanet, also closed 191 recycling centers across the state in February of 2016 (Daniels, 2016). This again suggested that unprofitable materials, when only considering economic cost, should not be recycled at all. In fact, certain recycling programs for communities in the U.S., including Knox County, Maine, and Ada County, Idaho, stopped accepting non-profitable mixed-plastics (Berg, 2018; Bettcher, 2018). It would be necessary for municipalities to help cover the costs of recycling for private businesses to create more incentive for increasing recycling rates. Results of this study suggested that high costs of recycling were barriers to transitioning to a circular economy. However, a circular economy has many benefits, many of which were not quantified by this study. A benefit-cost analysis incorporating environmental benefits may be beneficial for governments and policy makers to estimate the social benefit of recycling. Processing costs could be significantly reduced through the contribution of individual consumers, and municipalities could benefit from outreach and education programs for the community. Also, although this study suggested that building a MRF in Orlando MSA was profitable, municipalities should carefully consider their specific context to make decisions about how to manage their recyclables. Finally, local government bodies and businesses should consider strategies like profit sharing to drive the transition to a circular economy.

34
ACKNOWLEDGEMENTS I would like to sincerely thank my advisors, Dr. Megan Mullin and Dr. Lawrence Bowdish, for their guidance during this project. I also thank my program advisor, Dr. Timothy Johnson, for his support throughout my Master’s Project. I am grateful for Christina Boulanger-Bosley of Recycling Markets, Inc., who provided me access to historical data of post-consumer commodity prices. Finally, this research was made possible by the generous support of the Environmental Research and Education Foundation and U.S. Chamber of Commerce Foundation.
35
REFERENCES ACWMA (Alameda County Waste Management Authority). (n.d.). Ordinance Overview: Recycling Rules
Alameda County. Retrieved December 13, 2017, from http://www.recyclingrulesac.org/ordinance-overview/.
Asian Development Bank. (2013). Materials Recovery Facility Tool Kit. Retrieved March 10, 2018, from
https://www.adb.org/sites/default/files/publication/30220/materials-recovery-facility-tool-kit.pdf. Association of Plastic Recyclers. (2016). Mandatory Plastic Recycling Legislation. Retrieved October 3,
2017, from http://www.plasticsrecycling.org/state-recycling/mandatory-plastic-recycling-legislation.
Bandhauer, K. (2014). Tools and Tips: Increasing Recycling Through Education and Outreach.
Environmental Protection Agency. Retrieved April 10, 2018, from https://www.epa.gov/sites/production/files/2015-09/documents/bandhauer.pdf.
Berenyi, E.B. (2015). What Comes After Single-Stream? Resource Recycling. Retrieved April 10, 2018,
from https://nerc.org/. Berg, S. (2018). Why recycling in Ada County faces a defining moment, and how it will affect you. Idaho
Statesman. Retrieved April 15, 2018, from http://www.idahostatesman.com/news/local/community/boise/article207096584.html.
Bettcher, L. (2018). Transfer station stops recycling no-longer-profitable plastics. Knox VillageSoup.
Retrieved April 15, 2018, from https://knox.villagesoup.com/p/transfer-station-stops-recycling-no-longer-profitable-plastics/1738764.
Bowman, C., & Husain, A.M. (2004). Forecasting Commodity Prices: Futures Versus Judgment.
International Monetary Fund. Retrieved February 12, 2018, from https://www.imf.org/external/pubs/ft/wp/2004/wp0441.pdf.
City of Portland. (2017). History of Portland's Garbage and Recycling System. Retrieved December 13,
2017, from https://www.portlandoregon.gov/bps/article/109782. Cooley, D. (2015). Convenience at a cost: Big U.S. cities opting for single-stream recycling. Smart Cities
Council. Retrieved December 5, 2017, from https://smartcitiescouncil.com/article/convenience-cost-big-us-cities-opting-single-stream-recycling.
CRI (Container Recycling Institute). (n.d.). Single Stream Recycling. Retrieved April 10, 2018, from
http://www.container-recycling.org/index.php/issues/single-stream-recycling. Daniels, J. (2016). Why recycling business is feeling so discarded these days. CNBC. Retrieved April 18,
2018 from https://www.cnbc.com/2016/03/09/why-recycling-business-is-feeling-so-discarded-these-days.html.
Denne, T., Irvine, R., Atreya, N., & Robinson, M. (2007). Recycling: Cost Benefit Analysis. Covec.
Retrieved March 10, 2018, from https://www.mfe.govt.nz/sites/default/files/recycling-cost-benefit-analysis-apr07.pdf.
36
DSNY (The City of New York Department of Sanitation). (2015). Recycling. Retrieved December 12, 2017, from http://www1.nyc.gov/assets/dsny/about/inside-dsny/recycling-and-waste-prevention-materials.shtml.
Dubanowitz, A.J. (2000). Design of a Materials Recovery Facility (MRF) For Processing the Recyclable
Materials of New York City’s Municipal Solid Waste. Columbia University. Retrieved February 28, 2018, from http://www.seas.columbia.edu/earth/dubanmrf.pdf.
EREF (Environmental Research and Education Foundation). 2017. Analysis of MSW Landfill Tipping
Fees: April 2017. Esposito, M., Tse, T., & Soufani, K. (2015). Is the Circular Economy a New Fast-Expanding Market?
Thunderbird International Business Review, 59(1), 9-14. European Parliament. (2015). Circular economy: the importance of re-using products and materials.
Retrieved October 8, 2017, from http://www.europarl.europa.eu/news/en/headlines/economy/20151201STO05603/circular-economy-the-importance-of-re-using-products-and-materials.
Floer, J. (2016). Orange County, FL Launches “Think 5” Recycling Education Campaign. Orange County
Government, Florida. Retrieved April 13, 2018, from https://newsroom.ocfl.net/media-advisories/press-releases/orange-county-fl-launches-think-5-recycling-education-campaign/.
Florida DEP (Department of Environmental Protection). (2017). Solid Waste Management in Florida
2015 Annual Report. Retrieved November 5, 2017, from https://floridadep.gov/waste/waste-reduction/content/solid-waste-management-florida-2015-annual-report.
GBB (Gershman, Brickner & Bratton, Inc.). (2008). Materials Recovery Facility Feasibility Report.
Retrieved March 15, 2018, from https://www.tucsonaz.gov/files/es/GBB-Tucson_MRF_Feasibility_Report_-_120308.pdf.
Georgia DCA (Department of Community Affairs). (2017). FY 2011 Solid Waste Management Annual
Report. Retrieved October 29, 2017, from http://www.dca.state.ga.us/development/research/programs/swar2011.asp.
Gregson, N., Crang, M., Fuller, S., & Holmes, H. (2015). Interrogating the circular economy: the moral
economy of resource recovery in the EU. Economy and Society, 44(2), 218-243. Groen, J.J., & Pesenti, P.A. (2011). How Easy Is It to Forecast Commodity Prices? Liberty Street
Economics. Retrieved February 12, 2018, from http://libertystreeteconomics.newyorkfed.org/2011/06/how-easy-is-it-to-forecast-commodity-prices.html.
ISRI (Institute of Scrap Recycling Industries). (2017). Economy. Retrieved December 8, 2017, from
http://www.isri.org/policy-regulations/economy. Jorgensen, J. (2015). Bill de Blasio Calls for the End of Garbage by 2030. Observer. Retrieved December
12, 2017, from http://observer.com/2015/04/bill-de-blasio-calls-for-the-end-of-garbage-by-2030/#ixzz3bS6XCCs5.
37
Kessler Consulting, Inc. (2009). Materials Recovery Facility Technology Review. Pinellas County, Florida. Retrieved April 10, 2018, from http://www.nswai.com/DataBank/Reports_pdf/reports_aug15/MATERIALS%20RECOVERY%20FACILITY%20TECHONOLOGY%20REVIEW.pdf.
Koslowsky, N. (2010). Why No National Recycling Law in the U.S.? Business Ethics. Retrieved
December 14, 2017, from http://business-ethics.com/2010/11/21/why-no-national-recycling-law-in-the-u-s/.
Lacy, P., & Rutqvist, J. (2015). Waste to Wealth – The Circular Economy Advantage. Palgrave
Macmillan, New York/London. Lake County. (2014). Single-Stream Curbside Recycling Program. Retrieved April 13,2018, from
https://www.lakecountyfl.gov/pdfs/Public_Works/solid_waste/RecyclingFactSheet.pdf. Lake County. (2018). FY 2018 Fee Schedule. Retrieved April 13, 2018, from
https://www.lakecountyfl.gov/pdfs/fee_schedules/2018/solid_waste.pdf. Lakhan, C. (2015). A Comparison of Single and Multi-Stream Recycling Systems in Ontario, Canada.
Resources, 4:384-397. Laskow, S. (2014). Single-Stream Recycling Is Easier for Consumers, but Is It Better? The Atlantic.
https://www.theatlantic.com/technology/archive/2014/09/single-stream-recycling-is-easier-for-consumers-but-is-it-better/380368/.
Liming, D. (n.d.) Careers in Recycling. Bureau of Labor Statistics. Retrieved October 3, 2017, from
https://www.bls.gov/green/recycling/. Morris, J. (2016). Oregon Recycling Markets Price Cycles and Trends: A Statistical Search for
Significant Economic Causes. State of Oregon Department of Environmental Quality. Retrieved October 25, 2017, from http://www.oregon.gov/deq/FilterDocs/RecyclingPriceAnalysis.pdf.
North Central Texas Council of Governments. (2015). Planning for Sustainable Materials Management
in North Central Texas: 2015-2040. Retrieved March 13, 2018, from http://www.nctcog.org/envir/SEELT/funding/documents/2015_North_Central_Texas_Regional_Solid_Waste_Management_Plan_10_15_15.pdf.
Northeast Recycling Council. (2017). Disposal Bans & Mandatory Recycling in the United States.
Retrieved September 28, 2017, from https://nerc.org/documents/disposal_bans_mandatory_recycling_united_states.pdf.
O’Keefe, K., de Haag, S.U., & Glazer, J. (2012). Materials Recovery Facility for Athens and Hocking
Counties. The Appalachia Ohio Zero Waste Initiative. March 8, 2018, from http://ruralaction.org/wp-content/uploads/2013/03/App-D-MRF-Feasibility-Study.pdf.
OECD. (2015). Municipal Waste. OECD Environment Statistics. Retrieved March 28, 2018, from
https://www.oecd-ilibrary.org/environment/data/oecd-environment-statistics/municipal-waste_data-00601-en.
38
Orange County Government. (2017). Orange County Solid Waste Disposal Rates. Retrieved February 26, 2018, from https://www.orangecountyfl.net/Portals/0/Library/Water-Garbage-Recycle/docs/SolidWasteDisposalRate.pdf.
Osceola County. (2018). Curbside Recycling Program. Retrieved April 13, 2018, from
http://www.osceola.org/agencies-departments/public-works/solid-waste/curbside-collection-services/curbside-recycling.stml.
Paben, J. (2017). Houston mayor wooed by MRF plans and lower costs. Resource Recycling. Retrieved
February 28, 2018, from https://resource-recycling.com/recycling/2017/07/11/houston-mayor-wooed-by-mrf-plans-and-lower-costs/.
Pressley, P.N., Levis, J.W., Damgaard, A., Barlaz, M.A., & DeCarolis, J.F. (2015). Analysis of material
recovery facilities for use in life-cycle assessment. Waste Management, 35, 307-17. PwC (PricewaterhouseCoopers). (2011). Attachment C: Cost benefit analysis report. Standing Council on
Environment and Water. Retrieved February 28, 2018, from http://www.nepc.gov.au/system/files/consultations/c299407e-3cdf-8fd4-d94d-6181f096abc8/files/att-c-cost-benefit-analysis-report.pdf.
Rayer, S., & Wang, Y. (2017). Projections of Florida Population by County, 2020–2045, With Estimates
For 2016. University of Florida Bureau of Economic and Business Research. Retrieved January 5, 2018 from https://www.bebr.ufl.edu/population/population-data/projections-florida-population-county-2020%E2%80%932045-estimates-2016.
Recycling Markets. (2018). Secondary Materials Pricing & Secondary Fiber Pricing. Retrieved February
13, 2018, from http://www.recyclingmarkets.net/. Reschovsky, J.D., & Stone, S.E. (1994). Market Incentives to Encourage Household Waste Recycling:
Paying for What You Throw Away. Journal of Policy Analysis and Management, 13(1): 120-139. Robinson, S. (2016a). Current State of MRFs in 2016. Waste Management. Retrieved March 15, 2018,
from http://www.recyclingstar.org/wp-content/uploads/2016/11/Robinson-MRF-panel-2016-Final.pdf.
Robinson, S. (2016b). The Economics of Recycling: A Collector/Processor Perspective. Waste
Management. Retrieved March 10, 2018, from http://www.serdc.org/resources/Pictures/2016%20Summit/Susan%20Robinson.pdf.
Rosengren, C. (2017). Report: Average landfill tip fees up 3.5% so far this year. Waste Dive. Retrieved
March 10, 2018, from https://www.wastedive.com/news/report-average-landfill-tip-fees-up-35-so-far-this-year/446834/.
SC DHEC (South Carolina Department of Health and Environmental Control). (2017). South Carolina
Solid Waste Management Annual Report. Retrieved December 10, 2017, from http://www.scdhec.gov/Library/OR-1414.pdf.
Seminole County. (2018a). Curbside Collection and Service Requirements. Retrieved April 13, 2018,
from https://www.seminolecountyfl.gov/departments-services/environmental-services/solid-waste-management/solid-waste-services/curbside-collection-service-requiremen.stml.
39
Seminole County. (2018b). Rates. Retrieved April 13, 2018, from https://www.seminolecountyfl.gov/departments-services/environmental-services/solid-waste-management/rates.stml.
Shin, D. (2014). Generation and Disposition of Municipal Solid Waste (MSW) in the United States –A
National Survey. Columbia University. Retrieved June 25, 2017, from http://www.seas.columbia.edu/earth/wtert/sofos/Dolly_Shin_Thesis.pdf.
Timpane, M.R. (2015). Costs of Recycling & Diversion. Resource Recycling Systems. Retrieved March 5,
2018, from http://recycle.com/wp-content/uploads/2015/05/RRS-Costs-of-Recycling-and-Diversion-NWRA-Webinar-May-2015-MTi.pdf.
US Census Bureau. (2017). Annual Estimates of the Resident Population for the United States, Regions,
States, and Puerto Rico: April 1, 2010 to July 1, 2016. Retrieved December 12, 2017, from https://www2.census.gov/programs-surveys/popest/tables/2010-2016/state/totals/nst-est2016-01.xlsx.
US EPA (United States Environmental Protection Agency). (2015). MSW Characterization Methodology.
Retrieved October 25, 2017, from https://www.epa.gov/sites/production/files/2015-09/documents/06numbers.pdf.
US EPA (United States Environmental Protection Agency). (2016a). Advancing Sustainable Materials
Management: 2014 Fact Sheet. Retrieved June 12, 2017, from https://www.epa.gov/sites/production/files/2016-11/documents/2014_smmfactsheet_508.pdf.
US EPA (United States Environmental Protection Agency). (2016b). Recycling Economic Information
(REI) Report. Retrieved October 25, 2017, from https://www.epa.gov/smm/recycling-economic-information-rei-report#findings.
US EPA (United States Environmental Protection Agency). (2017). Resource Conservation and Recovery
Act (RCRA) Laws and Regulations. Retrieved October 3, 2017, from https://www.epa.gov/rcra. USCCF (U.S. Chamber of Commerce Foundation). (2016). U.S. Chamber Foundation Launches New
Project: “Beyond 34: Recycling and Recovery for A New Economy.” Retrieved March 5, 2018, from https://www.uschamberfoundation.org/press-release/us-chamber-foundation-launches-new-project-beyond-34-recycling-and-recovery-new.
USCCF & RRS (U.S. Chamber of Commerce Foundation and Resource Recycling Systems). (2017).
Beyond 34: Recycling and Recovery for a New Economy. Oral presentation at Resource Optimization Workshop, Orlando, FL.
van Haaren, R., Themelis, N., & Goldstein, N. (2010). State of Garbage in America. BioCycle. Retrieved
June 20, 2017, from http://biocycle.net/images/art/1010/bc101016_s.pdf. Virginia Department of Environmental Quality. (2016). Virginia Annual Recycling Summary Report:
Calendar Year 2015. Retrieved July 10, 2017, from http://deq.state.va.us/Portals/0/DEQ/Land/RecyclingPrograms/2015CY_Recycle_Rate_Report.pdf.
40
Waste360. (2016). U.S. Chamber of Commerce Foundation Rolls out New Project to Increase Recycling and Recovery. Retrieved January 15, 2018, from http://www.waste360.com/waste-reduction/us-chamber-commerce-foundation-rolls-out-new-project-increase-recycling-and-recovery. WasteMap Florida. (2018). WasteMap Facility Index. Retrieved March 25, 2018, from
http://www.wastemap.org/Facility-Index.cfm. WM (Waste Management). (n.d.). Single Stream Specifications. Retrieved March 5, 2018, from
https://www.wm.com/recycling-services/pdfs/SingleStream.pdf.
41
APPENDIX REVIEW OF CURRENT RECYCLING RATES IN THE UNITED STATES
Overview Recent data on municipal solid waste management were compiled and analyzed by the author of this study to better understand the current state of recycling in the U.S. These results are from a report for the U.S. Chamber of Commerce Foundation as a part of the Beyond 34 Project. To my knowledge, this is the first study that comprehensively reviewed recycling rates in the U.S. Methods The amount of generated and recycled MSW at the national, state, and local levels were compiled by surveying publically available reports on academic and government websites. The most recent waste generation and recycling rates data at the state and local levels were plotted geospatially to uncover any geographical trends in recycling. Recycling rates were calculated using U.S. Environmental Protection Agency (EPA)’s definition of MSW, which excluded construction and demolition (C&D) waste (US EPA, 2016a). Since the actual flow of materials were the main interest of this study, recycling credits were not included in the calculations. For the analysis of state-level recycling rates, I identified two studies by the Columbia University Earth Engineering Center (EEC) that quantified recycling rates for each state (van Haaren, et al., 2010; Shin, 2014). The recycling rates calculated were for years 2008 and 2011. These were the only studies that attempted to comprehensively quantify state-level recycling rates for the U.S. The EEC calculated recycling rates by surveying recycling agencies in each state, using data from EPA as a reference. Since I was interested in the most recent recycling rates, only the 2011 data was analyzed in this report. For the analysis of local recycling rates, data for Florida, South Carolina and Virginia were identified. These three were the only states that publically reported local recycling rates for the entire state. Data were published by the respective states’ government body responsible for environmental management. In Florida and South Carolina, recycling data was reported by counties, the smallest unit for waste management designated by the Florida Department of Environmental Protection (DEP) and South Carolina Department of Health and Environmental Control (DHEC). In Virginia, MSW was managed by Solid Waste Planning Units (SWPU)9 designated by the Virginia Department of Environmental Quality (DEQ). Waste generation and recycling rates for years 2015 and fiscal 201610 were visualized geospatially for Florida and South Carolina, respectively. Virginia’s recycling data was only analyzed quantitatively because of difficulties with mapping the geographic division of SWPUs. Florida and South Carolina do not have state-level recycling mandates, while Virginia requires all of its SWPUs to maintain a recycling rate of at least 15%. Results National Recycling Rate The U.S. Environmental Protection Agency reported that 34.6% of the 258 million tons of MSW generated in the U.S. in 2014 were recycled (US EPA, 2016a). This figure was calculated using a material flows approach, which consisted of estimating the weight of waste generated and recycled based on domestic production, imports and exports data from the U.S. Department of Commerce and recycling professionals (US EPA, 2015). EPA’s methodology included most residential and commercial wastes, but excluded industrial waste, C&D waste and sewage sludge. 9Virginia’s local waste management entities, which combined counties, cities and towns. 10July 1, 2015 to June 30, 2016.
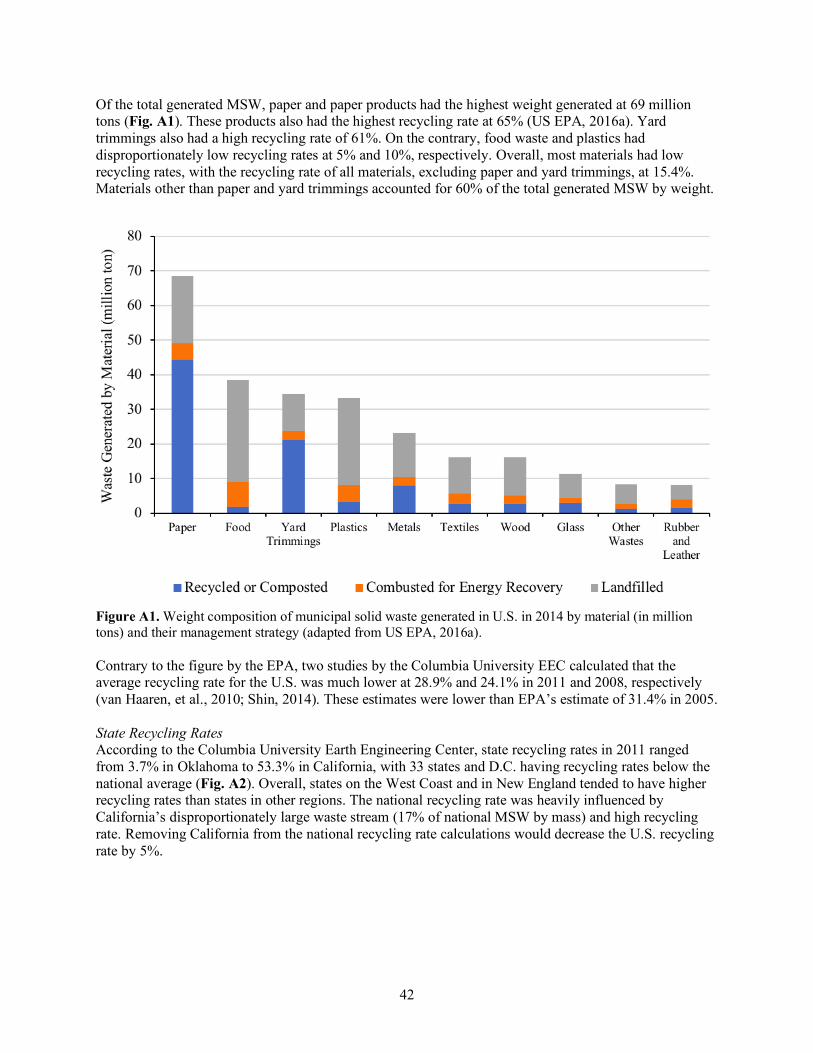
42
Of the total generated MSW, paper and paper products had the highest weight generated at 69 million tons (Fig. A1). These products also had the highest recycling rate at 65% (US EPA, 2016a). Yard trimmings also had a high recycling rate of 61%. On the contrary, food waste and plastics had disproportionately low recycling rates at 5% and 10%, respectively. Overall, most materials had low recycling rates, with the recycling rate of all materials, excluding paper and yard trimmings, at 15.4%. Materials other than paper and yard trimmings accounted for 60% of the total generated MSW by weight.
Figure A1. Weight composition of municipal solid waste generated in U.S. in 2014 by material (in million tons) and their management strategy (adapted from US EPA, 2016a). Contrary to the figure by the EPA, two studies by the Columbia University EEC calculated that the average recycling rate for the U.S. was much lower at 28.9% and 24.1% in 2011 and 2008, respectively (van Haaren, et al., 2010; Shin, 2014). These estimates were lower than EPA’s estimate of 31.4% in 2005. State Recycling Rates According to the Columbia University Earth Engineering Center, state recycling rates in 2011 ranged from 3.7% in Oklahoma to 53.3% in California, with 33 states and D.C. having recycling rates below the national average (Fig. A2). Overall, states on the West Coast and in New England tended to have higher recycling rates than states in other regions. The national recycling rate was heavily influenced by California’s disproportionately large waste stream (17% of national MSW by mass) and high recycling rate. Removing California from the national recycling rate calculations would decrease the U.S. recycling rate by 5%.
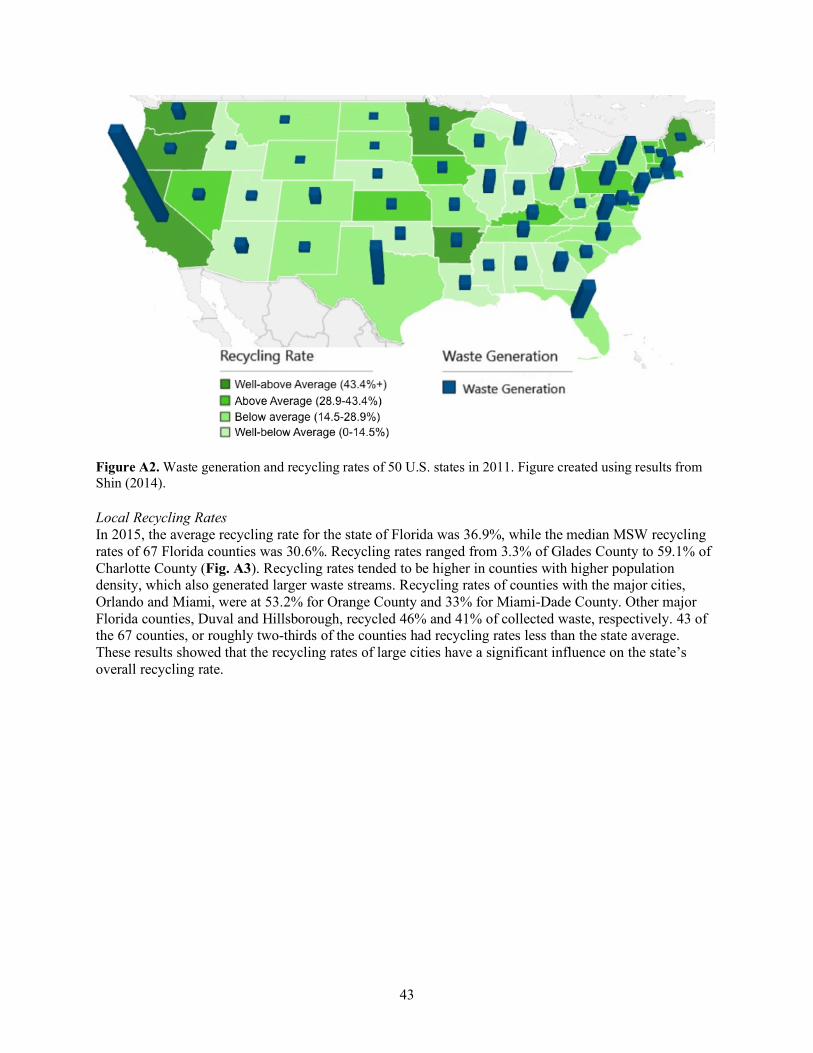
43
Figure A2. Waste generation and recycling rates of 50 U.S. states in 2011. Figure created using results from Shin (2014). Local Recycling Rates In 2015, the average recycling rate for the state of Florida was 36.9%, while the median MSW recycling rates of 67 Florida counties was 30.6%. Recycling rates ranged from 3.3% of Glades County to 59.1% of Charlotte County (Fig. A3). Recycling rates tended to be higher in counties with higher population density, which also generated larger waste streams. Recycling rates of counties with the major cities, Orlando and Miami, were at 53.2% for Orange County and 33% for Miami-Dade County. Other major Florida counties, Duval and Hillsborough, recycled 46% and 41% of collected waste, respectively. 43 of the 67 counties, or roughly two-thirds of the counties had recycling rates less than the state average. These results showed that the recycling rates of large cities have a significant influence on the state’s overall recycling rate.
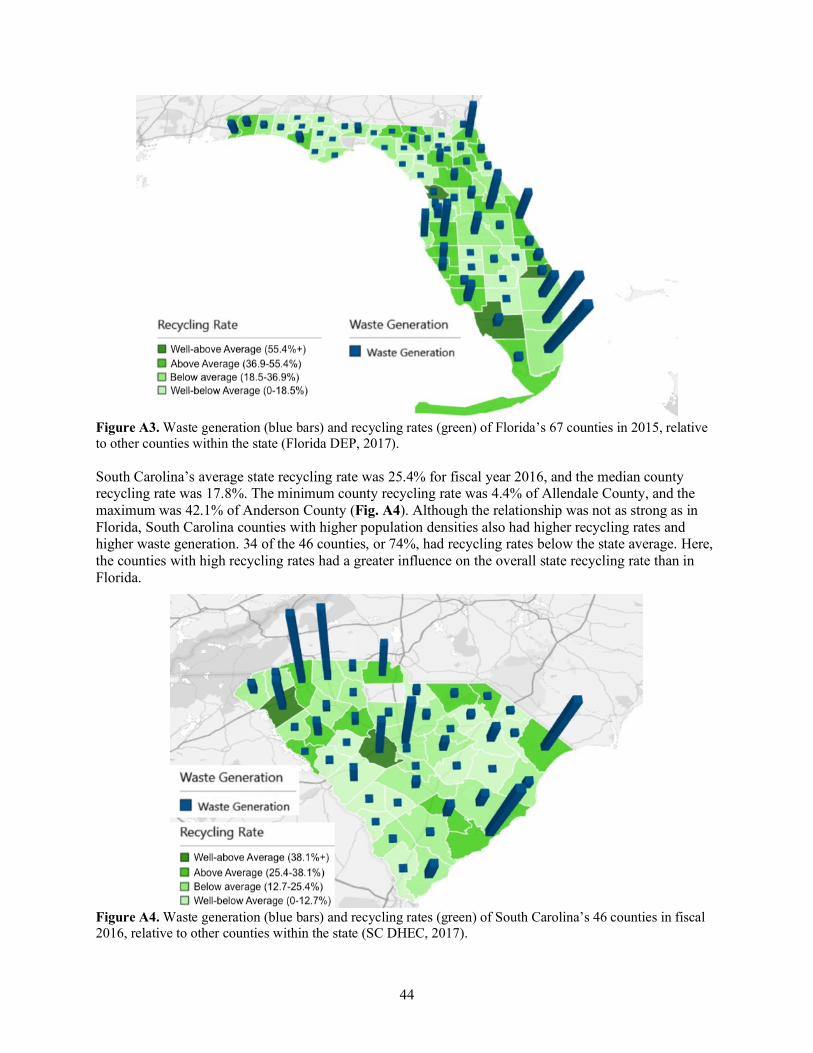
44
Figure A3. Waste generation (blue bars) and recycling rates (green) of Florida’s 67 counties in 2015, relative to other counties within the state (Florida DEP, 2017). South Carolina’s average state recycling rate was 25.4% for fiscal year 2016, and the median county recycling rate was 17.8%. The minimum county recycling rate was 4.4% of Allendale County, and the maximum was 42.1% of Anderson County (Fig. A4). Although the relationship was not as strong as in Florida, South Carolina counties with higher population densities also had higher recycling rates and higher waste generation. 34 of the 46 counties, or 74%, had recycling rates below the state average. Here, the counties with high recycling rates had a greater influence on the overall state recycling rate than in Florida.
Figure A4. Waste generation (blue bars) and recycling rates (green) of South Carolina’s 46 counties in fiscal 2016, relative to other counties within the state (SC DHEC, 2017).
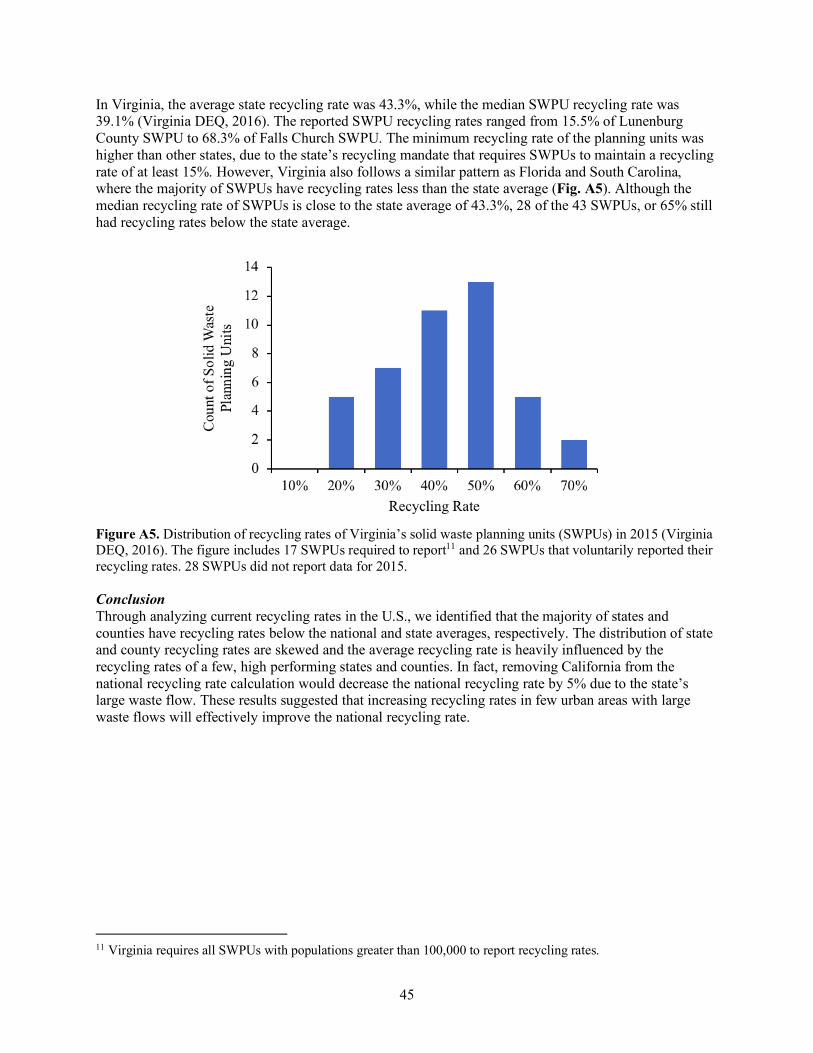
45
In Virginia, the average state recycling rate was 43.3%, while the median SWPU recycling rate was 39.1% (Virginia DEQ, 2016). The reported SWPU recycling rates ranged from 15.5% of Lunenburg County SWPU to 68.3% of Falls Church SWPU. The minimum recycling rate of the planning units was higher than other states, due to the state’s recycling mandate that requires SWPUs to maintain a recycling rate of at least 15%. However, Virginia also follows a similar pattern as Florida and South Carolina, where the majority of SWPUs have recycling rates less than the state average (Fig. A5). Although the median recycling rate of SWPUs is close to the state average of 43.3%, 28 of the 43 SWPUs, or 65% still had recycling rates below the state average.
Figure A5. Distribution of recycling rates of Virginia’s solid waste planning units (SWPUs) in 2015 (Virginia DEQ, 2016). The figure includes 17 SWPUs required to report11 and 26 SWPUs that voluntarily reported their recycling rates. 28 SWPUs did not report data for 2015. Conclusion Through analyzing current recycling rates in the U.S., we identified that the majority of states and counties have recycling rates below the national and state averages, respectively. The distribution of state and county recycling rates are skewed and the average recycling rate is heavily influenced by the recycling rates of a few, high performing states and counties. In fact, removing California from the national recycling rate calculation would decrease the national recycling rate by 5% due to the state’s large waste flow. These results suggested that increasing recycling rates in few urban areas with large waste flows will effectively improve the national recycling rate.
11 Virginia requires all SWPUs with populations greater than 100,000 to report recycling rates.
Related Documents