Forecasting the Morbidity and Mortality Associated with Prevalent Cases of Pre-Cirrhotic Chronic Hepatitis C Infections in the United States Technical Report Prepared by David B. Rein, PhD John S. Wittenborn, BS Sarah B. Lesesne, BS RTI International 3040 Cornwallis Road Research Triangle Park, NC 27709 RTI Project Number 0212229.001.003

Welcome message from author
This document is posted to help you gain knowledge. Please leave a comment to let me know what you think about it! Share it to your friends and learn new things together.
Transcript

Forecasting the Morbidity and Mortality Associated with Prevalent
Cases of Pre-Cirrhotic Chronic Hepatitis C Infections in the United
States
Technical Report
Prepared by
David B. Rein, PhD John S. Wittenborn, BS
Sarah B. Lesesne, BS RTI International
3040 Cornwallis Road Research Triangle Park, NC 27709
RTI Project Number 0212229.001.003

RTI Project Number 0212229.001.003
Forecasting the Morbidity and Mortality Associated with Prevalent
Cases of Pre-Cirrhotic Chronic Hepatitis C Infections in the United
States
Draft Report
Prepared by
David B. Rein, PhD John S. Wittenborn, BS
Sarah B. Lesesne, BS RTI International
3040 Cornwallis Road Research Triangle Park, NC 27709
Contents
Section Page
1. Project and Model Overview 1-1
1.1 Overview .............................................................................................. 1-1
1.2 Model Steps .......................................................................................... 1-2
1.2.1 Initiation ..................................................................................... 1-2
1.2.2 Disease Progression...................................................................... 1-2
2. Initiation Parameters 2-1
2.1 Prevalence ............................................................................................ 2-1
2.2 Infection Duration .................................................................................. 2-4
2.3 Prevalence of IDU Behaviors .................................................................... 2-4
2.4 Probability of Other Baseline Characteristics............................................... 2-5
2.5 Background Mortality Rates ..................................................................... 2-5
3. Disease Progression 3-1
3.1 Model of Natural History of Hepatitis C Progression ..................................... 3-1
3.2 Fibrosis Rate ......................................................................................... 3-3
3.3 Annual Probabilities of HCC, Decompensated Cirrhosis, and Death................. 3-4
4. Liver Transplants 4-1
4.1 Probability of Transplant.......................................................................... 4-1
4.2 Probability of Death During or After Liver Transplant ................................... 4-3
References R-1
iii

Figures
Number Page
1-1. Hepatitis C Natural History Model................................................................... 1-2
3-1. Model Schematics ....................................................................................... 3-2
iv
Tables
Number Page
2-1. Non-IDU HCV Prevalence by Age Group, Gender, and Race/Ethnicity: White Male Non-IDU ............................................................................................. 2-1
2-2. Non-IDU HCV Prevalence by Age Group, Gender, and Race/Ethnicity: White Female Non-IDU.......................................................................................... 2-2
2-3. Non-IDU HCV Prevalence by Age Group, Gender, and Race/Ethnicity: Black Male Non-IDU ............................................................................................. 2-2
2-4. Non-IDU HCV Prevalence by Age Group, Gender, and Race/Ethnicity: Black Female Non-IDU.......................................................................................... 2-2
2-5. Non-IDU HCV Prevalence by Age Group, Gender, and Race/Ethnicity: Hispanic Male Non-IDU ............................................................................................. 2-2
2-6. Non-IDU HCV Prevalence by Age Group, Gender, and Race/Ethnicity: Hispanic Female Non-IDU.......................................................................................... 2-3
2-7. IDU HCV Prevalence by Age Group and Gender: Male IDU................................. 2-3
2-8. IDU HCV Prevalence by Age Group and Gender: Female IDU ............................. 2-3
2-9. IDU HCV Prevalence by Age Group: All IDU..................................................... 2-3
2-10. IDUs—Duration of Infection by Age Group....................................................... 2-4
2-11. Prevalence of Any Previous IDU Behavior, by Age Group ................................... 2-5
2-12. Other Baseline Characteristics of Patients with HCV/IDU Drug Users ................... 2-5
3-1. Fibrosis Rates by Category: Median Rate and Rate Distribution .......................... 3-4
3-2. Probability of HCC ....................................................................................... 3-5
3-3. Probability of Decompensated Cirrhosis .......................................................... 3-6
3-4. Probability of Death from End Stage Disorders................................................. 3-6
4-1. Probability of Getting a Liver Transplant Given Patient Has Decompensated Cirrhosis, Hepatocellular Carcinoma, or Is on the Transplant Waiting List............. 4-2
4-2. Probability of Death Following Liver Transplant ................................................ 4-3
v


1. PROJECT AND MODEL OVERVIEW
1.1 Overview
The Centers for Disease Control and Prevention’s (CDC’s) Division of Viral Hepatitis has
contracted with RTI International to develop a multicohort simulation model of individuals
with chronic hepatitis C infection. The model, which incorporated the full range of potential
hepatitis C disease states, from asymptomatic disease to liver disease, transplants and
death, was used to forecast the morbidity and mortality associated with prevalent cases of
hepatitis C in 2005. This document is designed to facilitate the review and understanding of
the model and its input parameters.
The model divided the population ages 20 and older into mutually exclusive subcategories
and simulated progression of hepatitis C among each subgroup. Each mutually exclusive
sub-category was described in terms of four primary characteristics:
age group
gender
race/ethnicity
past injecting drug use (IDU) behavior
Based on these characteristics, the model estimates a patient’s hepatitis C virus (HCV)
infection status based on data from the National Health and Nutrition Examination Survey
(NHANES) and from published sources. The model categorizes patients with HCV infection
based on three characteristics that are relevant to infected patients only:
duration of infection
heavy drinking status
HIV/AIDS infection status
From the combination of primary characteristics assigned to all patients and secondary
characteristics assigned only to patients with HCV, each unique patient group is assigned a
fibrosis rate. The disease stage of each unique patient group is then calculated based on the
fibrosis rate for that group multiplied by their expected duration of infection.
Health outcomes are collected from each unique cohort in each year, discounted into their
net present value.
This document presents parameter data that drive the model. Each table is prefaced with
the name of the variable, its purpose in the model, and any additional adjustments made to
the parameters.
1-1
Forecasting the Morbidity and Mortality Associated with Prevalent Cases of Pre-Cirrhotic Chronic Hepatitis C Infections in the United States
1.2 Model Steps
1.2.1 Initiation
Before the model is run, the model sets the initiation parameters. These settings include
population size,
proportional demography of the population
prevalence of IDU risk behaviors (risk of infection) and disease progression risk factors,
1.2.2 Disease Progression
Based on the assignment of initiation parameters, the model calculates the prevalence of
infection, the infection duration for prevalent cases, and the degree of disease progression
in each duration group. All prevalent cases then progress from their baseline severity group
forward to cirrhosis based on their progression rate and their progression risk behaviors.
Disease progression is re-estimated in time steps of 1 year moving forward from the year of
model initiation.
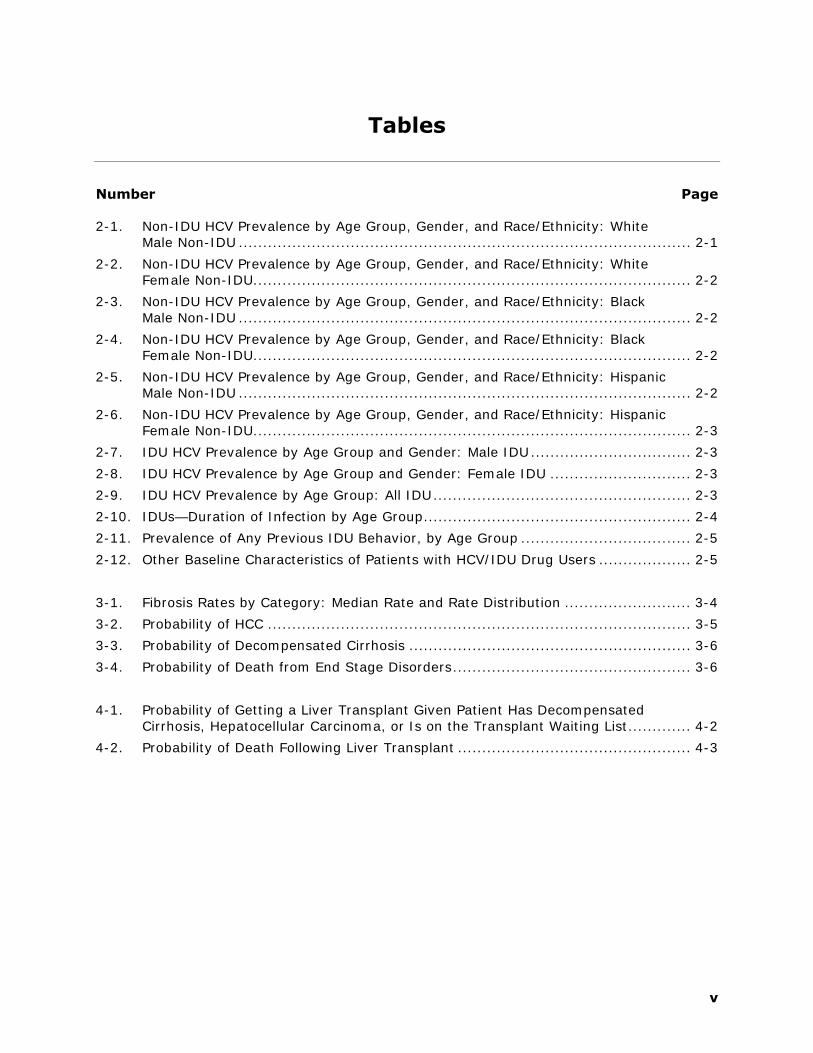
As illustrated by Figure 1-1, the model will incorporate two chronic infection states (mild
disease corresponding to a METAVIR score of 0 or 1, and moderate disease corresponding to
a METAVIR score of 2 or 3), cirrhosis (corresponding to a METAVIR score of 4), a grouped
category to describe the symptoms associated with decompensation, hepatocellular
carcinoma (HCC), and post-liver transplant states. Probabilities of death are not shown.
Patients can die from causes unrelated to hepatitis C. From hepatitis C, patients can die
from decompensated cirrhosis, HCC, or as a result of complications or failure of their liver
transplant.
Figure 1-1. Hepatitis C Natural History Model
Chronic Infection by Metavir Score 0 . . . . . 1 . . . . . 2 . . . . . 3 . . . . .
Cirrhosis Metavir =
4
HCC Liver transplant
states
D. Cirrhosis Encephalopathy, ascites, variceal bleeding
Death from HCV
1-2

2. INITIATION PARAMETERS
Initiation parameters set baseline characteristics of the modeled population and include
the prevalence of hepatitis C virus (HCV) infection, by age group, gender, race/ethnicity, and injecting drug use (IDU) status;
the distribution of infection duration by age, gender, race/ethnicity, and IDU status;
the probability of IDU risk behavior by age, gender, and race/ethnicity;
the prevalence of heavy drinking by age, gender, race/ethnicity, and IDU status;
2.1 Prevalence
In our model, disease prevalence governs the number of patients infected with HCV in a
given population. Published evidence suggests that HCV prevalence varies by age group,
gender, race/ethnicity, and especially according to a history of IDU (Alter et al., 1999;
Armstrong et al., 2006; CDC, 1998). The model stratifies prevalence by these four
variables.
For the model, we estimated disease prevalence in two ways. First, for the U.S.
noninstitutionalized population, we used pooled data from the National Health and Nutrition
Examination Survey (NHANES) from 2001 to 2006. Disease prevalence was defined as the
presence of any HCV antibodies, which includes patients with ongoing chronic infection
(approximately 75%) and patients whose infection spontaneously cleared (25%). From the
NHANES data, we estimated the prevalence of HCV by age group, gender, and
race/ethnicity for patients with no disclosed IDU behavior and then for patients who
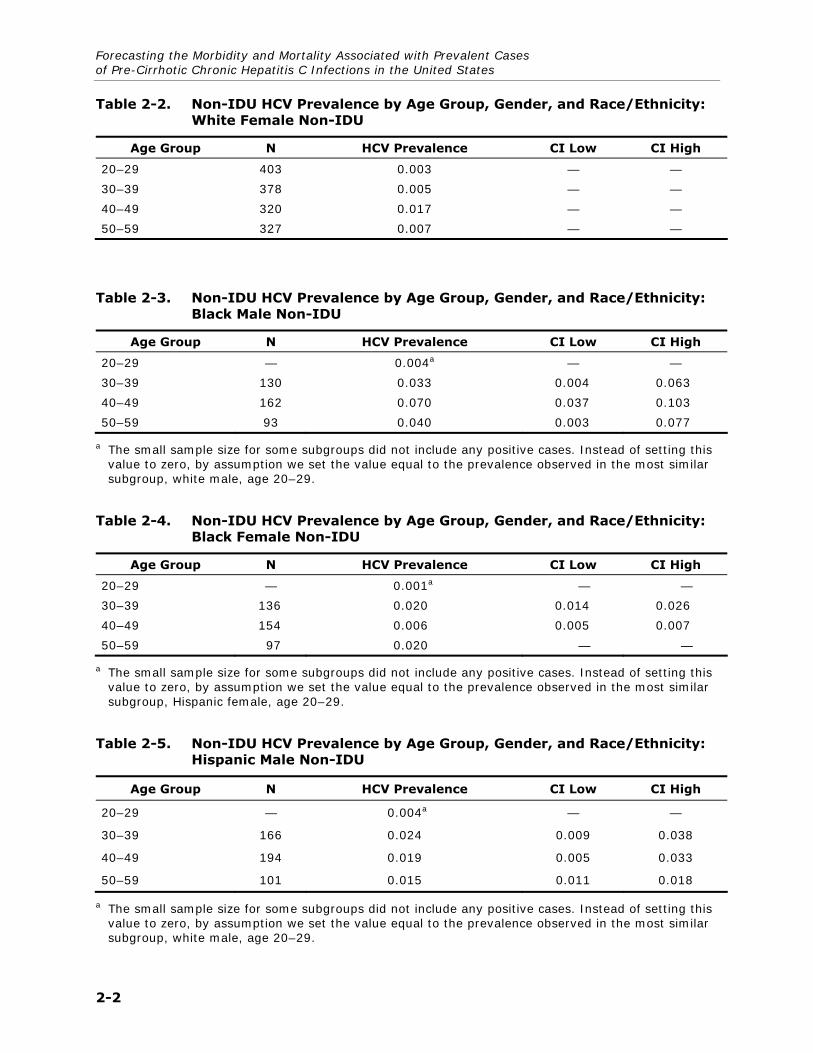
disclosed IDU behavior. Tables 2-1 through 2-6 present our analytic results for non-IDUs.
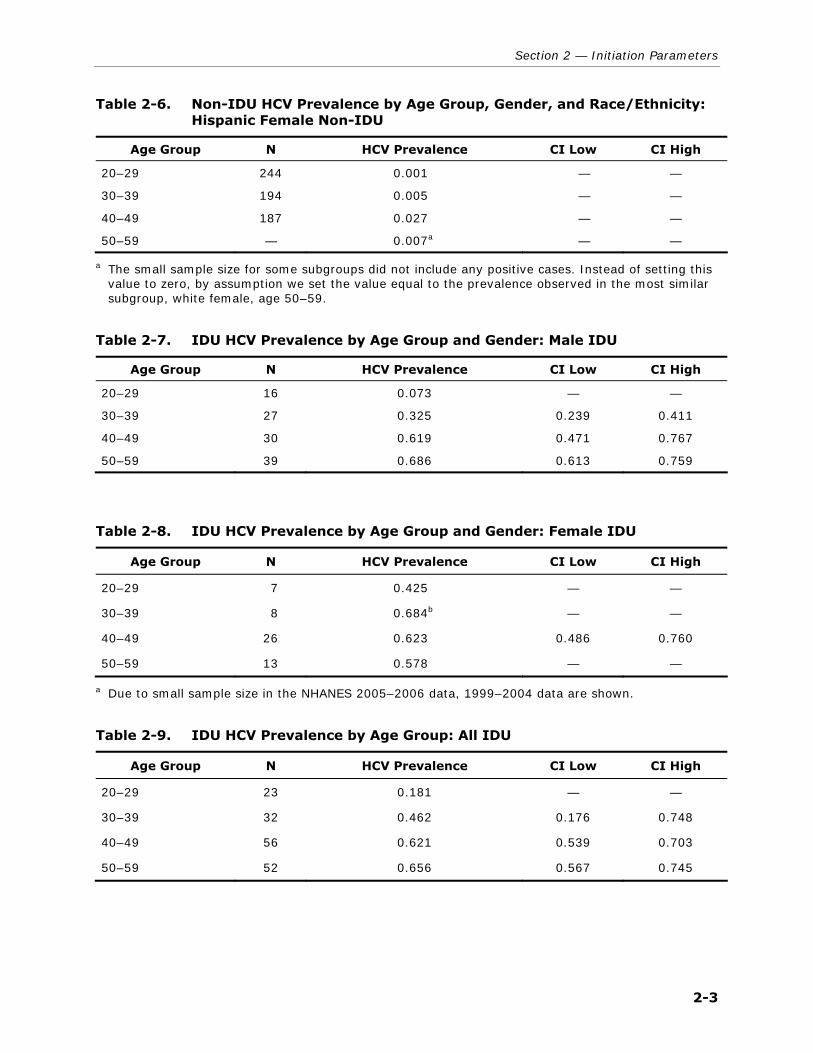
For IDU patients, NHANES contained an insufficient sample to estimate prevalence by age
group, gender, and race/ethnicity, although overall, 26% of IDUs are black and 55% are
white. Tables 2-7 and 2-8 present data stratified by age group and gender only for IDUs,
and Table 2-9 presents data by age group alone. IDU behavior was defined as disclosing on
the NHANES behavioral questionnaire ever using a needle to shoot illegal street drugs.
Table 2-1. Non-IDU HCV Prevalence by Age Group, Gender, and Race/Ethnicity: White Male Non-IDU
Age Group N HCV Prevalence CI Low CI High
20–29 298 0.004 — —
30–39 295 0.006 — —
40–49 357 0.035 0.015 0.055
50–59 332 0.014 0.002 0.025
2-1
Forecasting the Morbidity and Mortality Associated with Prevalent Cases of Pre-Cirrhotic Chronic Hepatitis C Infections in the United States
Table 2-2. Non-IDU HCV Prevalence by Age Group, Gender, and Race/Ethnicity: White Female Non-IDU
Age Group N HCV Prevalence CI Low CI High
20–29 403 0.003 — —
30–39 378 0.005 — —
40–49 320 0.017 — —
50–59 327 0.007 — —
Table 2-3. Non-IDU HCV Prevalence by Age Group, Gender, and Race/Ethnicity: Black Male Non-IDU
Age Group N HCV Prevalence CI Low CI High
20–29 — 0.004a — —
30–39 130 0.033 0.004 0.063
40–49 162 0.070 0.037 0.103
50–59 93 0.040 0.003 0.077
a The small sample size for some subgroups did not include any positive cases. Instead of setting this value to zero, by assumption we set the value equal to the prevalence observed in the most similar subgroup, white male, age 20–29.
Table 2-4. Non-IDU HCV Prevalence by Age Group, Gender, and Race/Ethnicity: Black Female Non-IDU
Age Group N HCV Prevalence CI Low CI High
20–29 — 0.001a — —
30–39 136 0.020 0.014 0.026
40–49 154 0.006 0.005 0.007
50–59 97 0.020 — —
a The small sample size for some subgroups did not include any positive cases. Instead of setting this value to zero, by assumption we set the value equal to the prevalence observed in the most similar subgroup, Hispanic female, age 20–29.
Table 2-5. Non-IDU HCV Prevalence by Age Group, Gender, and Race/Ethnicity: Hispanic Male Non-IDU
Age Group N HCV Prevalence CI Low CI High
20–29 — 0.004a — —
30–39 166 0.024 0.009 0.038
40–49 194 0.019 0.005 0.033
50–59 101 0.015 0.011 0.018
a The small sample size for some subgroups did not include any positive cases. Instead of setting this value to zero, by assumption we set the value equal to the prevalence observed in the most similar subgroup, white male, age 20–29.
2-2
Section 2 — Initiation Parameters
Table 2-6. Non-IDU HCV Prevalence by Age Group, Gender, and Race/Ethnicity: Hispanic Female Non-IDU
Age Group N HCV Prevalence CI Low CI High
20–29 244 0.001 — —
30–39 194 0.005 — —
40–49 187 0.027 — —
50–59 — 0.007a — —
a The small sample size for some subgroups did not include any positive cases. Instead of setting this value to zero, by assumption we set the value equal to the prevalence observed in the most similar subgroup, white female, age 50–59.
Table 2-7. IDU HCV Prevalence by Age Group and Gender: Male IDU
Age Group N HCV Prevalence CI Low CI High
20–29 16 0.073 — —
30–39 27 0.325 0.239 0.411
40–49 30 0.619 0.471 0.767
50–59 39 0.686 0.613 0.759
Table 2-8. IDU HCV Prevalence by Age Group and Gender: Female IDU
Age Group N HCV Prevalence CI Low CI High
20–29 7 0.425 — —
30–39 8 0.684b — —
40–49 26 0.623 0.486 0.760
50–59 13 0.578 — —
a Due to small sample size in the NHANES 2005–2006 data, 1999–2004 data are shown.
Table 2-9. IDU HCV Prevalence by Age Group: All IDU
Age Group N HCV Prevalence CI Low CI High
20–29 23 0.181 — —
30–39 32 0.462 0.176 0.748
40–49 56 0.621 0.539 0.703
50–59 52 0.656 0.567 0.745
2-3

Forecasting the Morbidity and Mortality Associated with Prevalent Cases of Pre-Cirrhotic Chronic Hepatitis C Infections in the United States
2.2 Infection Duration
In our model, the infection duration (the number of years since a patient has been infected
with HCV) will in part (along with progression rate) govern the disease severity and the
probability the patient is aware of his or her infection. The average infection duration of a
population will directly influence the cost-effectiveness of interventions to detect, treat, or
slow the progression of hepatitis C, because it, along with fibrosis rate, determines disease
severity.
Our model will assign duration of infection using incidence data developed to generate a
published model (Armstrong et al., 2000). We developed a specialized model to estimate
duration based on estimated past HCV incidence trends adjusting for past trends in
mortality and the difference in infection rates between population subgroups. The models
apply estimates of past incidence and mortality to past cohorts and have been calibrated to
accurately reproduce current anti-HCV prevalence. Table 2-10 shows the estimated
proportional distribution of infection in years of duration among the total population. Based
on available data, we explored whether duration varied by gender, race/ethnicity, age, or
IDU status and found no support for stratifying on those characteristics.
Table 2-10. IDUs—Duration of Infection by Age Group
Duration of Infection (Years)
Age Group 0 to 4 5 to 9 10 to 14 15 to 20 20+
20 to 29 0.6 0.25 0.08 0.04 0.03
30 to 39 0.27 0.32 0.24 0.11 0.06
40 to 49 0.08 0.14 0.21 0.24 0.33
50 to 59 0.04 0.05 0.08 0.13 0.7
60+ 0.03 0.04 0.04 0.06 0.83
2.3 Prevalence of IDU Behaviors
Because the prevalence of HCV is substantially higher among patients who disclose IDU risk
behaviors, the prevalence of IDU behaviors in a given setting will drive the cost-
effectiveness of interventions in most settings. We used data from two sources—NHANES
and the National Survey on Drug Use and Health (NSDUH)—to estimate the proportion of
patients that have disclosed IDU behaviors.
We compared NHANES data from 2003 and 2004 with NSDUH data from 2003, 2004, and
2005. Both surveys measured IDU behaviors in roughly the same way, with one major
difference. NHANES asked only patients aged 20 to 59 who had earlier disclosed using
2-4

Section 2 — Initiation Parameters
cocaine or other street drugs, not including marijuana, if they had “ever used a needle to
inject illegal street drugs,” whereas NSDUH asked all respondents if they had ever used a
needle to shoot recreational drugs. Given the overall high degree of similarity between
estimates from each of the data sets, we used the estimates from NSDUH only, because it
asks the question of all respondents and not just those who disclose cocaine use. (See Table
2-11.)
Table 2-11. Prevalence of Any Previous IDU Behavior, by Age Group
Age Group Prevalence
Under 20 0.005
20 to 29 0.016
30 to 39 0.019
40 to 49 0.029
50 to 59 0.022
60+ 0.002
Source: 2003 to 2005 NSDUH data.
2.4 Probability of Other Baseline Characteristics
HIV infection status and alcohol intake are other characteristics that are assigned at model
baseline that effect the progression of HCV. The estimates in Table 2-12 were derived from
the NHANES and NSDUH data sets. The use of heavy alcohol was assumed to be the
average of the NHANES and NSDUH estimates (0.10).
Table 2-12. Other Baseline Characteristics of Patients with HCV/IDU Drug Users
Parameter Parameter Source
HIV infection 0.01912 NHANES
Heavy alcohol (more than four drinks/day) 0.095, 0.106 NHANES, NSDUH
Note: NHANES estimates are among patients with HCV, and NSDUH estimates are among those who disclose IDU behavior.
2.5 Background Mortality Rates
Background mortality rates were estimated using the 2003 National Vital Statistics Life
Tables (Arias, 2006). For the model, these rates were used to assign mortality risks for non-
IDUs stratified by age, sex, and race/ethnicity. Active IDUs experience an elevated risk of
death compared to non-IDUs, and the failure to include this elevated risk of mortality might
lead to substantial bias in our results in favor of testing and treatment of HCV (Spittal et al.,
2006, Miller et al., 2007, Vlahov et al., 2004, Joe et al., 1982, Davoli et al., 1997). We
2-5
Forecasting the Morbidity and Mortality Associated with Prevalent Cases of Pre-Cirrhotic Chronic Hepatitis C Infections in the United States
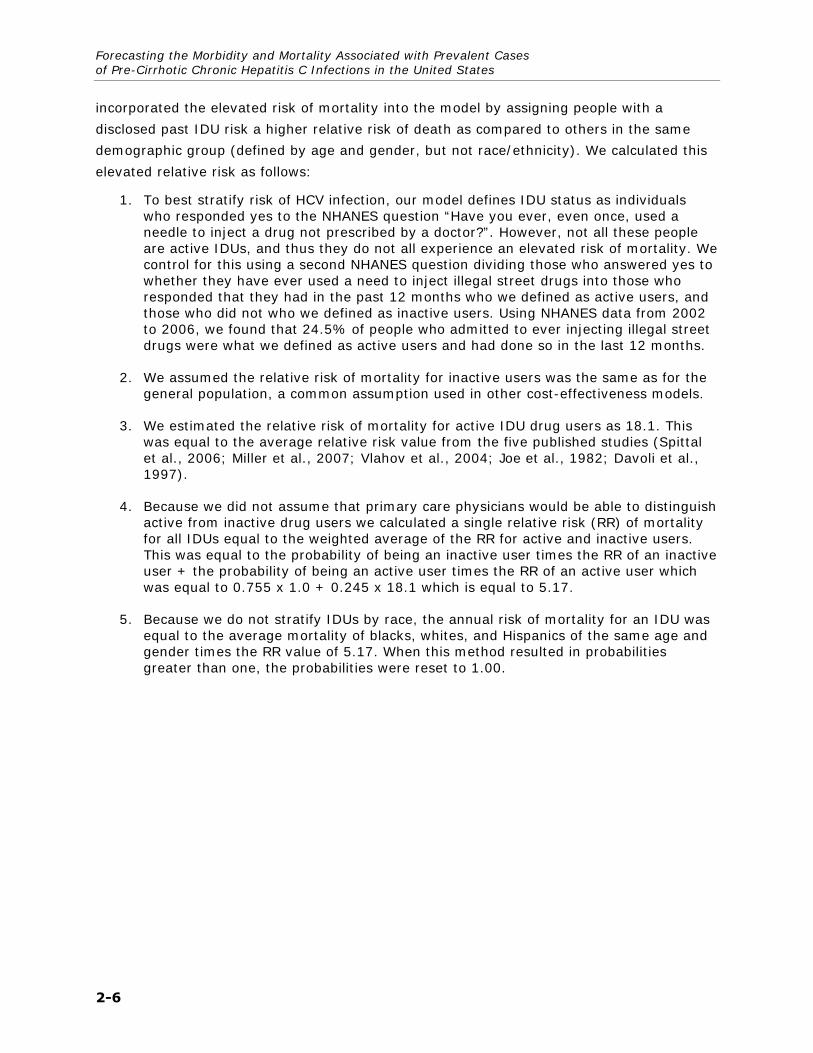
incorporated the elevated risk of mortality into the model by assigning people with a
disclosed past IDU risk a higher relative risk of death as compared to others in the same
demographic group (defined by age and gender, but not race/ethnicity). We calculated this
elevated relative risk as follows:
1. To best stratify risk of HCV infection, our model defines IDU status as individuals who responded yes to the NHANES question “Have you ever, even once, used a needle to inject a drug not prescribed by a doctor?”. However, not all these people are active IDUs, and thus they do not all experience an elevated risk of mortality. We control for this using a second NHANES question dividing those who answered yes to whether they have ever used a need to inject illegal street drugs into those who responded that they had in the past 12 months who we defined as active users, and those who did not who we defined as inactive users. Using NHANES data from 2002 to 2006, we found that 24.5% of people who admitted to ever injecting illegal street drugs were what we defined as active users and had done so in the last 12 months.
2. We assumed the relative risk of mortality for inactive users was the same as for the general population, a common assumption used in other cost-effectiveness models.
3. We estimated the relative risk of mortality for active IDU drug users as 18.1. This was equal to the average relative risk value from the five published studies (Spittal et al., 2006; Miller et al., 2007; Vlahov et al., 2004; Joe et al., 1982; Davoli et al., 1997).
4. Because we did not assume that primary care physicians would be able to distinguish active from inactive drug users we calculated a single relative risk (RR) of mortality for all IDUs equal to the weighted average of the RR for active and inactive users. This was equal to the probability of being an inactive user times the RR of an inactive user + the probability of being an active user times the RR of an active user which was equal to 0.755 x 1.0 + 0.245 x 18.1 which is equal to 5.17.
5. Because we do not stratify IDUs by race, the annual risk of mortality for an IDU was equal to the average mortality of blacks, whites, and Hispanics of the same age and gender times the RR value of 5.17. When this method resulted in probabilities greater than one, the probabilities were reset to 1.00.
2-6
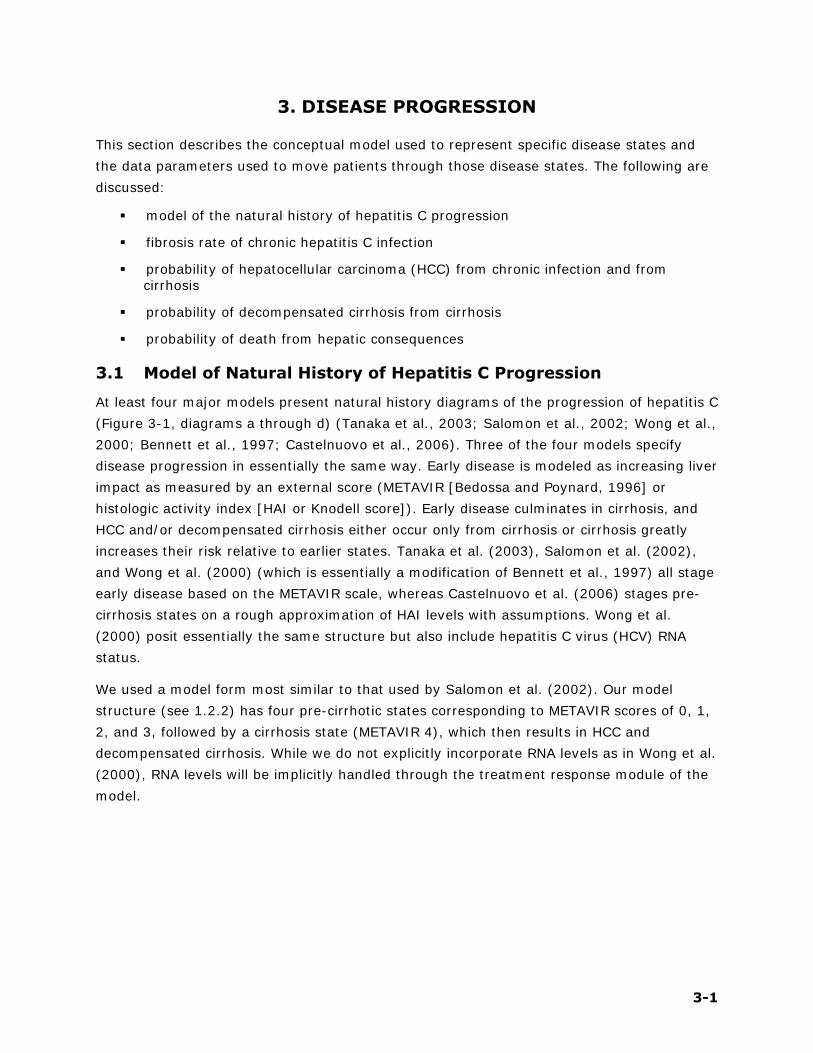
3. DISEASE PROGRESSION
This section describes the conceptual model used to represent specific disease states and
the data parameters used to move patients through those disease states. The following are
discussed:
model of the natural history of hepatitis C progression
fibrosis rate of chronic hepatitis C infection
probability of hepatocellular carcinoma (HCC) from chronic infection and from cirrhosis
probability of decompensated cirrhosis from cirrhosis
probability of death from hepatic consequences
3.1 Model of Natural History of Hepatitis C Progression
At least four major models present natural history diagrams of the progression of hepatitis C
(Figure 3-1, diagrams a through d) (Tanaka et al., 2003; Salomon et al., 2002; Wong et al.,
2000; Bennett et al., 1997; Castelnuovo et al., 2006). Three of the four models specify
disease progression in essentially the same way. Early disease is modeled as increasing liver
impact as measured by an external score (METAVIR [Bedossa and Poynard, 1996] or
histologic activity index [HAI or Knodell score]). Early disease culminates in cirrhosis, and
HCC and/or decompensated cirrhosis either occur only from cirrhosis or cirrhosis greatly
increases their risk relative to earlier states. Tanaka et al. (2003), Salomon et al. (2002),
and Wong et al. (2000) (which is essentially a modification of Bennett et al., 1997) all stage
early disease based on the METAVIR scale, whereas Castelnuovo et al. (2006) stages pre-
cirrhosis states on a rough approximation of HAI levels with assumptions. Wong et al.
(2000) posit essentially the same structure but also include hepatitis C virus (HCV) RNA
status.
We used a model form most similar to that used by Salomon et al. (2002). Our model
structure (see 1.2.2) has four pre-cirrhotic states corresponding to METAVIR scores of 0, 1,
2, and 3, followed by a cirrhosis state (METAVIR 4), which then results in HCC and
decompensated cirrhosis. While we do not explicitly incorporate RNA levels as in Wong et al.
(2000), RNA levels will be implicitly handled through the treatment response module of the
model.
3-1

Forecasting the Morbidity and Mortality Associated with Prevalent Cases of Pre-Cirrhotic Chronic Hepatitis C Infections in the United States
Figure 3-1. Model Schematics
Tanaka et al. (2003)
Asympt. carrier
Chronic HCV
Liver cirrhosis
Hepato. carcinoma or death
Salomon et al. (2002)
No fibrosis
Portal no septa
Septa Many septa
D. Cirr.
HCC Cirr.
Wong et al. (2000), Bennett et al. (1997)
Mild HCV RNA −
Mod HCV RNA+
Mod HCV RNA−
Mild HCV RNA+
HCC
C. Cirr. RNA +
C. Cirr. RNA −
DC. Cirr. RNA −
DC. Cirr. RNA − Ascites, variceal hem., encephalopathy can
occur with cirrhosis
Castelnuovo et al. (2006)
Mild Moderate Severe Cirrhosis HCC Liver transplant states
D. Cirrhosis Encephalopathy, ascites, variceal bleeding
Note: HCV = hepatitis C virus; HCC = hepatocellular carcinoma; RNA = ribonucleic acid
3-2
Section 3 — Disease Progression
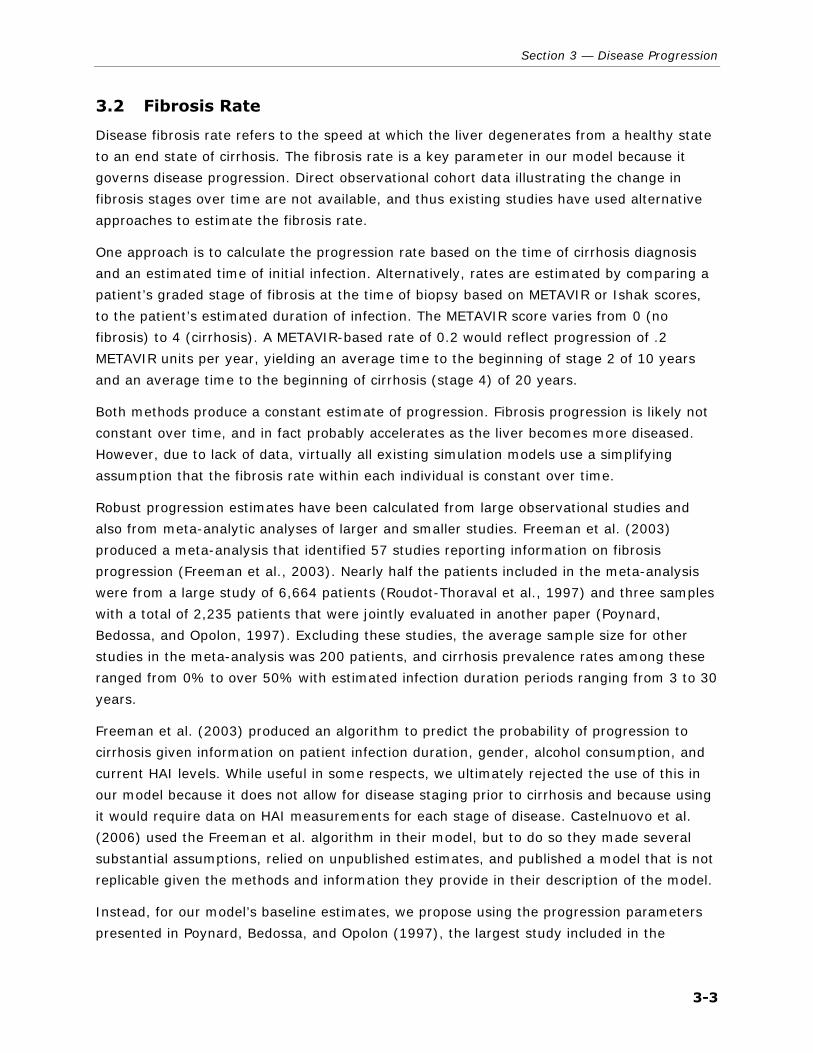
3.2 Fibrosis Rate
Disease fibrosis rate refers to the speed at which the liver degenerates from a healthy state
to an end state of cirrhosis. The fibrosis rate is a key parameter in our model because it
governs disease progression. Direct observational cohort data illustrating the change in
fibrosis stages over time are not available, and thus existing studies have used alternative
approaches to estimate the fibrosis rate.
One approach is to calculate the progression rate based on the time of cirrhosis diagnosis
and an estimated time of initial infection. Alternatively, rates are estimated by comparing a
patient’s graded stage of fibrosis at the time of biopsy based on METAVIR or Ishak scores,
to the patient’s estimated duration of infection. The METAVIR score varies from 0 (no
fibrosis) to 4 (cirrhosis). A METAVIR-based rate of 0.2 would reflect progression of .2
METAVIR units per year, yielding an average time to the beginning of stage 2 of 10 years
and an average time to the beginning of cirrhosis (stage 4) of 20 years.
Both methods produce a constant estimate of progression. Fibrosis progression is likely not
constant over time, and in fact probably accelerates as the liver becomes more diseased.
However, due to lack of data, virtually all existing simulation models use a simplifying
assumption that the fibrosis rate within each individual is constant over time.
Robust progression estimates have been calculated from large observational studies and
also from meta-analytic analyses of larger and smaller studies. Freeman et al. (2003)
produced a meta-analysis that identified 57 studies reporting information on fibrosis
progression (Freeman et al., 2003). Nearly half the patients included in the meta-analysis
were from a large study of 6,664 patients (Roudot-Thoraval et al., 1997) and three samples
with a total of 2,235 patients that were jointly evaluated in another paper (Poynard,
Bedossa, and Opolon, 1997). Excluding these studies, the average sample size for other
studies in the meta-analysis was 200 patients, and cirrhosis prevalence rates among these
ranged from 0% to over 50% with estimated infection duration periods ranging from 3 to 30
years.
Freeman et al. (2003) produced an algorithm to predict the probability of progression to
cirrhosis given information on patient infection duration, gender, alcohol consumption, and
current HAI levels. While useful in some respects, we ultimately rejected the use of this in
our model because it does not allow for disease staging prior to cirrhosis and because using
it would require data on HAI measurements for each stage of disease. Castelnuovo et al.
(2006) used the Freeman et al. algorithm in their model, but to do so they made several
substantial assumptions, relied on unpublished estimates, and published a model that is not
replicable given the methods and information they provide in their description of the model.
Instead, for our model’s baseline estimates, we propose using the progression parameters
presented in Poynard, Bedossa, and Opolon (1997), the largest study included in the
3-3

Forecasting the Morbidity and Mortality Associated with Prevalent Cases of Pre-Cirrhotic Chronic Hepatitis C Infections in the United States
Freeman et al. (2003) meta-analysis. Poynard, Bedossa, and Opolon (1997) provide median
fibrosis rates in units of expected increases in METAVIR score per year stratified by age of
infection (under/over age 40), gender, and alcohol consumption (under/over 50 grams of
alcohol per day). We stratified these rates into a more detailed distribution of progression
rates based on the proportion of overall patients who exhibited each progression category.
We assumed that 25% of patients exhibited the low estimate, 50% exhibited the medium
estimate, and 25% exhibited the high estimate.
Table 3-1 shows the median fibrosis rate for each patient combination of age of infection,
alcohol consumption, and gender using the values found in Poynard et al. (1997). It then
shows the low, medium, and high rates.
Because of small cell sizes, Poynard, Bedossa, and Opolon (1997) produced somewhat
unexpected results for female heavy drinkers who were infected under age 40 (too low) and
female heavy drinkers who were infected over age 40 (too high). For this reason, we believe
the rates for female alcoholics and non-alcoholics under age 40 to be the same. For similar
reasons, we assumed the rates of alcoholic males and females over age 40 to be the same.
Table 3-1. Fibrosis Rates by Category: Median Rate and Rate Distribution
Age Gender Alcohol ≥ 50ga Low Medium High
<40 F N 0.088 0.095 0.1
<40 M N 0.091 0.111 0.13
<40 F Y 0.088 0.095 0.1
<40 M Y 0.125 0.154 0.167
>40 F N 0.167 0.2 0.25
>40 M N 0.235 0.301 0.333
>40 F Y 0.2 0.267 0.5
>40 M Y 0.2 0.267 0.5
a Alcohol consumption of over 50g per day.
3.3 Annual Probabilities of HCC, Decompensated Cirrhosis, and Death
Once a patient progresses to cirrhosis, he or she experiences an annual probability of HCC
(Table 3-2), decompensated cirrhosis (Table 3-3), or death from hepatitis C-related causes
(Table 3-4). The probability of these events depends on whether a patient has experienced
a sustained viral response (SVR) from therapy or not. The four specific parameters used in
the model are
annual probability of HCC,
3-4

Section 3 — Disease Progression
annual probability of decompensated cirrhosis,
annual probability of death from HCC, and
annual probability of death from decompensated cirrhosis
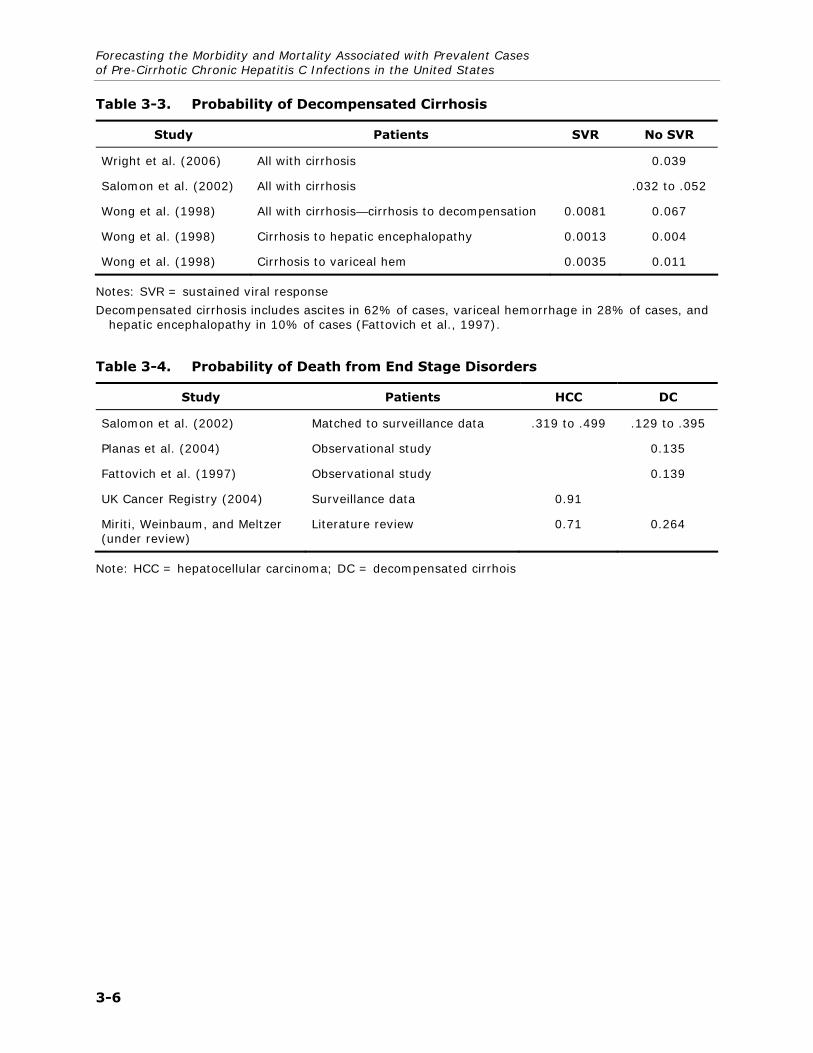
While a number of studies were examined and shown in Tables 3-2 through 3-4, the model
uses the midpoint of the Thomas and Seef (2005) range (0.025) as the annual probability of
HCC. The annual probability of decompensated cirrhosis of 0.039 was taken from Wright et
al. (2006). The probability of death from HCC was estimated by taking the midpoint of the
Salomon et al. (2002) range (0.409). The probability of death from decompensated cirrhosis
(0.135) was taken from Planas et al. (2004).
Table 3-2. Probability of HCC
Study Patients SVR No SVR Unknown
SVR
Bruno et al. (2007) All treated 0.0066 0.021
Hung et al. (2006) All treated 0.006 0.01
Kobayashi et al. 2007) Treated with SVR 0.009
Chen and Morgan (2006) Treated with SVR .002 to .004
Ren, Piao, and Jin (2006) All chronic liver 0.013
N'Kontchou et al. (2006) HCV-cirrhosis only 0.035
Sola et al. (2006) Decompensated cirrhosis 0.024
Thomas and Seeff (2005) All patients .01 to .04
Fattovich et al. (1997) All treated with cirrhosis 0.014
Serfaty et al. (1998) Treated and untreated patients with cirrhosis
0.026 0.009
Salomon et al. (2002) Cirrhosis, no SVR .017 to .028
Fattovich et al. (2004) Cirrhosis, no SVR 0.037
Sola et al. (2006) HCV decompensated cirrhosis 0.056
Wong et al. (1998) Moderate chronic infection 0.000001 0.001
Wong et al. (1998) Cirrhosis patients 0.006 0.015
Note: HCC = hepatocellular carcinoma; SVR = sustained viral response; HCV = hepatitis C virus
3-5
Forecasting the Morbidity and Mortality Associated with Prevalent Cases of Pre-Cirrhotic Chronic Hepatitis C Infections in the United States
Table 3-3. Probability of Decompensated Cirrhosis
Study Patients SVR No SVR
Wright et al. (2006) All with cirrhosis 0.039
Salomon et al. (2002) All with cirrhosis .032 to .052
Wong et al. (1998) All with cirrhosis—cirrhosis to decompensation 0.0081 0.067
Wong et al. (1998) Cirrhosis to hepatic encephalopathy 0.0013 0.004
Wong et al. (1998) Cirrhosis to variceal hem 0.0035 0.011
Notes: SVR = sustained viral response
Decompensated cirrhosis includes ascites in 62% of cases, variceal hemorrhage in 28% of cases, and hepatic encephalopathy in 10% of cases (Fattovich et al., 1997).
Table 3-4. Probability of Death from End Stage Disorders
Study Patients HCC DC
Salomon et al. (2002) Matched to surveillance data .319 to .499 .129 to .395
Planas et al. (2004) Observational study 0.135
Fattovich et al. (1997) Observational study 0.139
UK Cancer Registry (2004) Surveillance data 0.91
Miriti, Weinbaum, and Meltzer (under review)
Literature review 0.71 0.264
Note: HCC = hepatocellular carcinoma; DC = decompensated cirrhois
3-6

4. LIVER TRANSPLANTS
This section outlines the parameters used to estimate the probability of liver transplant
among persons with chronic hepatitis C. Probabilities were obtained from published
literature.
4.1 Probability of Transplant
About 20% of patients with hepatitis C develop cirrhosis within 10 to 20 years of diagnosis
(http://digestive.niddk.nih.gov/ddiseases/pubs/chronichepc/chronichepc.pdf). A smaller
percentage develops hepatocellular carcinoma (HCC) 20 to 40 years after infection. Liver
failure from chronic hepatitis C is one of the most common reasons for liver transplants in
the United States.
Estimates of the probability of liver transplants differ by source. Hepatitis C simulation
models use input values of the annual probability of transplant that are lower than those
derived from primary sources such as the Scientific Registry of Transplant Recipients
(SRTR). For example, Bennett et al. (1997), Wong et al. (2000), and Miriti et al.
(unpublished) each report the annual probability of transplants is between .015 and .046.
In contrast, using data from the SRTR, Ortner and Cosway (2005) estimated an annual
probability of liver transplants of 0.360 for those on the waiting list for any reason. Our
primary analysis of SRTR data, which restricted transplants to only those with a hepatitis C
virus (HCV) diagnosis for years 2001 through 2005, found similar results: a probability of
0.164 for patients on the waiting list. Most of the difference between Ortner and Cosway’s
estimate and our estimate stems from the exclusion of fulminant cases from our analysis.
HCV does not cause fulminant liver failure, and patients with fulminant liver failure have a
higher probability of transplant. Any diagnosed HCC that is confined to the liver or any
symptom of decompensation qualifies a patient for the liver transplant waiting list under
currently accepted standards of practice (Lucey et al., 1997).
Bennett et al.’s (1997) estimate of 0.031 was developed by dividing the number of liver
transplants from HCV patients in 1994, 730, by an estimate of the population eligible for
transplants. The estimate of the population eligible for transplants was created by dividing
the CDC estimate of 8,300 deaths attributable to hepatitis C in 1996 by a 1987 estimate
(0.35) of the annual probability of death from decompensation. This identical estimate was
subsequently used in Salomon et al. (2003) and Wong et al. (1998).
Wong et al. (2000) estimated the probability of a liver transplant (0.015) by dividing the
annual number of transplants between the years 1991 and 1997 by their estimate of the
number of patients with decompensated cirrhosis. The derivation of the number of patients
with decompensated cirrhosis is unclear from the article.
4-1
Forecasting the Morbidity and Mortality Associated with Prevalent Cases of Pre-Cirrhotic Chronic Hepatitis C Infections in the United States
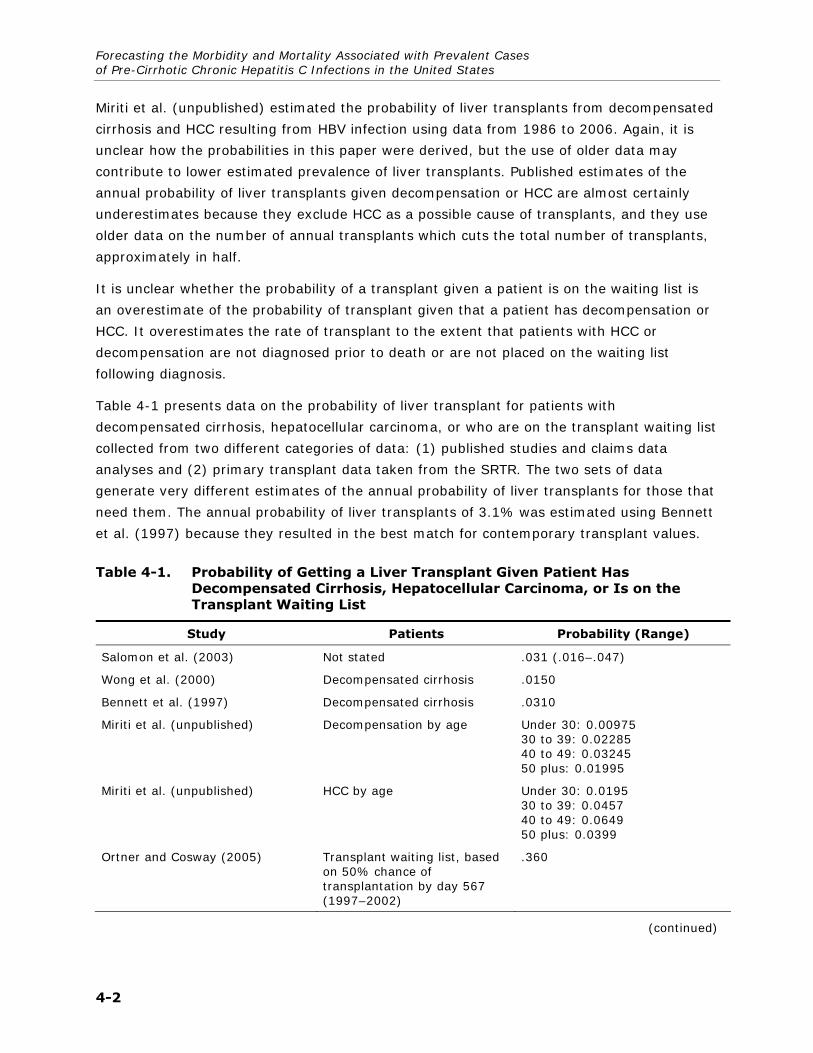
Miriti et al. (unpublished) estimated the probability of liver transplants from decompensated
cirrhosis and HCC resulting from HBV infection using data from 1986 to 2006. Again, it is
unclear how the probabilities in this paper were derived, but the use of older data may
contribute to lower estimated prevalence of liver transplants. Published estimates of the
annual probability of liver transplants given decompensation or HCC are almost certainly
underestimates because they exclude HCC as a possible cause of transplants, and they use
older data on the number of annual transplants which cuts the total number of transplants,
approximately in half.
It is unclear whether the probability of a transplant given a patient is on the waiting list is
an overestimate of the probability of transplant given that a patient has decompensation or
HCC. It overestimates the rate of transplant to the extent that patients with HCC or
decompensation are not diagnosed prior to death or are not placed on the waiting list
following diagnosis.
Table 4-1 presents data on the probability of liver transplant for patients with
decompensated cirrhosis, hepatocellular carcinoma, or who are on the transplant waiting list
collected from two different categories of data: (1) published studies and claims data
analyses and (2) primary transplant data taken from the SRTR. The two sets of data
generate very different estimates of the annual probability of liver transplants for those that
need them. The annual probability of liver transplants of 3.1% was estimated using Bennett
et al. (1997) because they resulted in the best match for contemporary transplant values.
Table 4-1. Probability of Getting a Liver Transplant Given Patient Has Decompensated Cirrhosis, Hepatocellular Carcinoma, or Is on the Transplant Waiting List
Study Patients Probability (Range)
Salomon et al. (2003) Not stated .031 (.016–.047)
Wong et al. (2000) Decompensated cirrhosis .0150
Bennett et al. (1997) Decompensated cirrhosis .0310
Miriti et al. (unpublished) Decompensation by age Under 30: 0.00975 30 to 39: 0.02285 40 to 49: 0.03245 50 plus: 0.01995
Miriti et al. (unpublished) HCC by age Under 30: 0.0195 30 to 39: 0.0457 40 to 49: 0.0649 50 plus: 0.0399
Ortner and Cosway (2005) Transplant waiting list, based on 50% chance of transplantation by day 567 (1997–2002)
.360
(continued)
4-2

Section 4 — Liver Transplants
Table 4-1. Probability of Getting a Liver Transplant Given Patient Has Decompensated Cirrhosis, Hepatocellular Carcinoma, or Is on the Transplant Waiting List (continued)
Study Patients Probability (Range)
9Analyses prepared by the Scientific Registry of Transplant Recipients, May 1, 2007. Waiting list information, 2006.
Probability of patient with HCV receiving transplant given that they were on the waiting list
.164 (based on an average of 1,677 transplants for HCV per year divided by an average of 10,244 people on the waiting list for potentially HCV-related causes)
HCC = hepatocellular carcinoma; HCV = hepatitis C virus
4.2 Probability of Death During or After Liver Transplant
Table 4-2 shows the probability of death during transplant, 1 to 5 years post-transplant, 5
to 15 years post-transplant, and 16 to 18 years post-transplant. The probability was highest
1 to 5 years post-transplant. There was no incremental risk of death 19 or more years after
transplant. The parameters in the model were taken from Ortner and Cosway (2005) for
transplant year and years 2–5. Probabilities of death in years 5–15 and 16–18 were taken
from Jain et al. (2000)
Table 4-2. Probability of Death Following Liver Transplant
Study Time Period Probability
Miriti et al. (unpublished) Transplant year (Following Decompensated cirrhosis)
0.264
Miriti et al. (unpublished) Transplant year (HCC) 0.14
Rein et al. (2007) Transplant year (fulminant HAV) 0.24
Ortner and Cosway (2005) Transplant year (any cause) 0.14
Ortner and Cosway (2005) 2 to 5 years (annual risk) 0.0384
Jain et al. (2000) 5 to 15 years (annual risk) 0.0252
Jain et al. (2000) 16 to 18 years (annual risk) 0.0136
Note: HCC = hepatocellular carcinoma; HAV = hepatitis A virus
4-3


REFERENCES
Alter MJ, Kruszon-Moran D, Nainan OV, McQuillan GM, Gao F, Moyer LA, Kaslow RA, et al. The prevalence of hepatitis C virus infection in the United States, 1988 through 1994. N Engl J Med 1999;341:556-562.
Arias E. United States Life Tables, 2003. Natl Vital Stat Rep 2006; 54: 1-40.
Armstrong GL, Wasley A, Simard EP, McQuillan GM, Kuhnert WL, Alter MJ. The prevalence of hepatitis C virus infection in the United States, 1999 through 2002. Ann Intern Med 2006;144:705-714.
Backus LI, Boothroyd D, Deyton LR. HIV, hepatitis C and HIV/hepatitis C virus co-infection in vulnerable populations. AIDS 2005;19 Suppl 3:S13-19.
Backus LI, Phillips BR, Boothroyd DB, Mole LA, Burgess J, Rigsby MO, Chang SW. Effects of hepatitis C virus coinfection on survival in veterans with HIV treated with highly active antiretroviral therapy. J Acquir Immune Defic Syndr 2005;39:613-619.
Baillargeon J, Wu H, Kelley MJ, Grady J, Linthicum L, Dunn K. Hepatitis C seroprevalence among newly incarcerated inmates in the Texas correctional system. Public Health 2003;117:43-48.
Bair RM, Baillargeon JG, Kelly PJ, Lerand SJ, Williams JF, Lyerla R, Alter MJ. Prevalence and risk factors for hepatitis C virus infection among adolescents in detention. Arch Pediatr Adolesc Med 2005;159:1015-1018.
Bedossa P, Poynard T. An algorithm for the grading of activity in chronic hepatitis C. The METAVIR Cooperative Study Group. Hepatology 1996;24:289-293.
Beech BM, Myers L, Beech DJ, Kernick NS. Human immunodeficiency syndrome and hepatitis B and C infections among homeless adolescents. Semin Pediatr Infect Dis 2003;14:12-19.
Bennett WG, Inoue Y, Beck JR, Wong JB, Pauker SG, Davis GL. Estimates of the cost-effectiveness of a single course of interferon-alpha 2b in patients with histologically mild chronic hepatitis C. Ann Intern Med 1997;127:855-865.
Bruno S, Stroffolini T, Colombo M, Bollani S, Benvegnu L, Mazzella G, Ascione A, et al. Sustained virological response to interferon-alpha is associated with improved outcome in HCV-related cirrhosis: a retrospective study. Hepatology 2007;45:579-587.
Castelnuovo E, Thompson-Coon J, Pitt M, Cramp M, Siebert U, Price A, Stein K. The cost-effectiveness of testing for hepatitis C in former injecting drug users. Health Technol Assess 2006;10:iii-iv, ix-xii, 1-93.
Centers for Disease Control and Prevention (CDC). Recommendations for Prevention and Control of Hepatitis C Virus (HCV) Infection and HCV-Related Chronic Disease: Centers for Disease Control and Prevention. October 16, 1998.
R-1

Forecasting the Morbidity and Mortality Associated with Prevalent Cases of Pre-Cirrhotic Chronic Hepatitis C Infections in the United States
Chen SL, Morgan TR. The natural history of hepatitis C virus (HCV) infection. Int J Med Sci 2006;3:47-52.
Cheung RC, Hanson AK, Maganti K, Keeffe EB, Matsui SM. Viral hepatitis and other infectious diseases in a homeless population. J Clin Gastroenterol 2002;34:476-480.
Culver DH, Alter MJ, Mullan RJ, Margolis HS. Evaluation of the effectiveness of targeted lookback for HCV infection in the United States-interim results. Transfusion 2000;40:1176-1181.
Davoli M, Perucci CA, Rapiti E, Bargagli AM, D'Ippoliti D, Forastiere F, Abeni D. A persistent rise in mortality among injection drug users in Rome, 1980 through 1992. Am J Public Health 1997;87:851-853.
Desai RA, Rosenheck RA, Agnello V. Prevalence of Hepatitis C virus infection in a sample of homeless veterans. Soc Psychiatry Psychiatr Epidemiol 2003;38:396-401.
El-Serag HB, Giordano TP, Kramer J, Richardson P, Souchek J. Survival in hepatitis C and HIV co-infection: a cohort study of hospitalized veterans. Clin Gastroenterol Hepatol 2005;3:175-183.
Fattovich G, Giustina G, Degos F, Tremolada F, Diodati G, Almasio P, Nevens F, et al. Morbidity and mortality in compensated cirrhosis type C: a retrospective follow-up study of 384 patients. Gastroenterology 1997;112:463-472.
Fattovich G, Stroffolini T, Zagni I, Donato F. Hepatocellular carcinoma in cirrhosis: incidence and risk factors. Gastroenterology 2004;127:S35-50.
Freeman AJ, Law MG, Kaldor JM, Dore GJ. Predicting progression to cirrhosis in chronic hepatitis C virus infection. J Viral Hepat 2003;10:285-293.
Gorbandt MB. Prevalence of hepatitis C in U.S. Army aircrew: do flaws in the data exist? Aviat Space Environ Med 2002;73:488-495.
Graham CS, Baden LR, Yu E, Mrus JM, Carnie J, Heeren T, Koziel MJ. Influence of human immunodeficiency virus infection on the course of hepatitis C virus infection: a meta-analysis. Clin Infect Dis 2001;33:562-569.
Gunn RA, Lee MA, Callahan DB, Gonzales P, Murray PJ, Margolis HS. Integrating hepatitis, STD, and HIV services into a drug rehabilitation program. Am J Prev Med 2005;29:27-33.
Hagan H, Campbell J, Thiede H, Strathdee S, Ouellet L, Kapadia F, Hudson S, et al. Self-reported hepatitis C virus antibody status and risk behavior in young injectors. Public Health Rep 2006;121:710-719.
Hall CS, Charlebois ED, Hahn JA, Moss AR, Bangsberg DR. Hepatitis C virus infection in San Francisco's HIV-infected urban poor. J Gen Intern Med 2004;19:357-365.
Hung CH, Lee CM, Lu SN, Wang JH, Hu TH, Tung HD, Chen CH, et al. Long-term effect of interferon alpha-2b plus ribavirin therapy on incidence of hepatocellular carcinoma in patients with hepatitis C virus-related cirrhosis. J Viral Hepat 2006;13:409-414.
R-2

References
Hyams KC, Riddle J, Rubertone M, Trump D, Alter MJ, Cruess DF, Han X, et al. Prevalence and incidence of hepatitis C virus infection in the US military: a seroepidemiologic survey of 21,000 troops. Am J Epidemiol 2001;153:764-770.
Jain A, Reyes J, Kashyap R, Dodson SF, Demetris AJ, Ruppert K, Abu-Elmagd K, et al. Long-term survival after liver transplantation in 4,000 consecutive patients at a single center. Ann Surg 2000;232:490-500.
Joe GW, Lehman W, Simpson DD. Addict death rates during a four-year posttreatment follow-up. Am J Public Health 1982;72:703-709.
Klinkenberg WD, Caslyn RJ, Morse GA, Yonker RD, McCudden S, Ketema F, Constantine NT. Prevalence of human immunodeficiency virus, hepatitis B, and hepatitis C among homeless persons with co-occurring severe mental illness and substance use disorders. Compr Psychiatry 2003;44:293-302.
Kobayashi S, Takeda T, Enomoto M, Tamori A, Kawada N, Habu D, Sakaguchi H, et al. Development of hepatocellular carcinoma in patients with chronic hepatitis C who had a sustained virological response to interferon therapy: a multicenter, retrospective cohort study of 1124 patients. Liver Int 2007;27:186-191.
Kwiatkowski CF, Fortuin Corsi K, Booth RE. The association between knowledge of hepatitis C virus status and risk behaviors in injection drug users. Addiction 2002;97:1289-1294.
Lucey MR, Brown KA, Everson GT, Fung JJ, Gish R, Keeffe EB, Kneteman NM, et al. Minimal criteria for placement of adults on the liver transplant waiting list: a report of a national conference organized by the American Society of Transplant Physicians and the American Association for the Study of Liver Diseases. Liver Transpl Surg 1997;3:628-637.
Macalino GE, Vlahov D, Dickinson BP, Schwartzapfel B, Rich JD. Community incidence of hepatitis B and C among reincarcerated women. Clin Infect Dis 2005;41:998-1002.
Macalino GE, Vlahov D, Sanford-Colby S, Patel S, Sabin K, Salas C, Rich JD. Prevalence and incidence of HIV, hepatitis B virus, and hepatitis C virus infections among males in Rhode Island prisons. Am J Public Health 2004;94:1218-1223.
Miller CL, Kerr T, Strathdee SA, Li K, Wood E. Factors associated with premature mortality among young injection drug users in Vancouver. Harm Reduct J 2007;4:1.
Miriti M BK, Weinbaum C, Meltzer MI. Lifetime Medical Cost of Chronic Hepatitis B Acquired in the United States. Working paper 2007.
Murray KF, Richardson LP, Morishima C, Owens JW, Gretch DR. Prevalence of hepatitis C virus infection and risk factors in an incarcerated juvenile population: a pilot study. Pediatrics 2003;111:153-157.
N'Kontchou G, Paries J, Htar MT, Ganne-Carrie N, Costentin L, Grando-Lemaire V, Trinchet JC, et al. Risk factors for hepatocellular carcinoma in patients with alcoholic or viral C cirrhosis. Clin Gastroenterol Hepatol 2006;4:1062-1068.
R-3
Forecasting the Morbidity and Mortality Associated with Prevalent Cases of Pre-Cirrhotic Chronic Hepatitis C Infections in the United States
Noell J, Rohde P, Ochs L, Yovanoff P, Alter MJ, Schmid S, Bullard J, et al. Incidence and prevalence of chlamydia, herpes, and viral hepatitis in a homeless adolescent population. Sex Transm Dis 2001;28:4-10.
Ortner N, Cosway R. 2005 US organ and tissue transplant cost estimates and discussion. Seattle: Milliman Consultants and Actuaries; 2005.
Planas R, Balleste B, Alvarez MA, Rivera M, Montoliu S, Galeras JA, Santos J, et al. Natural history of decompensated hepatitis C virus-related cirrhosis. A study of 200 patients. J Hepatol 2004;40:823-830.
Poynard T, Bedossa P, Opolon P. Natural history of liver fibrosis progression in patients with chronic hepatitis C. The OBSVIRC, METAVIR, CLINIVIR, and DOSVIRC groups. Lancet 1997;349:825-832.
Reimer J, Lorenzen J, Baetz B, Fischer B, Rehm J, Haasen C, Backmund M. Multiple viral hepatitis in injection drug users and associated risk factors. J Gastroenterol Hepatol 2007;22:80-85.
Rein DB, Hicks KA, Wirth KE, Billah K, Finelli L, Fiore AE, Hoerger TJ, et al. Cost-effectiveness of routine childhood vaccination for hepatitis A in the United States. Pediatrics 2007;119:e12-21.
Ren FY, Piao XX, Jin AL. Efficacy of ultrasonography and alpha-fetoprotein on early detection of hepatocellular carcinoma. World J Gastroenterol 2006;12:4656-4659.
Riley ED, Bangsberg DR, Guzman D, Perry S, Moss AR. Antiretroviral therapy, hepatitis C virus, and AIDS mortality among San Francisco's homeless and marginally housed. J Acquir Immune Defic Syndr 2005;38:191-195.
Rosenberg SD, Drake RE, Brunette MF, Wolford GL, Marsh BJ. Hepatitis C virus and HIV co-infection in people with severe mental illness and substance use disorders. Aids 2005;19 Suppl 3:S26-33.
Rosenblum A, Nuttbrock L, McQuistion HL, Magura S, Joseph H. Hepatitis C and substance use in a sample of homeless people in New York City. J Addict Dis 2001;20:15-25.
Roudot-Thoraval F, Bastie A, Pawlotsky JM, Dhumeaux D. Epidemiological factors affecting the severity of hepatitis C virus-related liver disease: a French survey of 6,664 patients. The Study Group for the Prevalence and the Epidemiology of Hepatitis C Virus. Hepatology 1997;26:485-490.
Ruiz JD, Molitor F, Plagenhoef JA. Trends in hepatitis C and HIV infection among inmates entering prisons in California, 1994 versus 1999. Aids 2002;16:2236-2238.
Salomon JA, Weinstein MC, Hammitt JK, Goldie SJ. Empirically calibrated model of hepatitis C virus infection in the United States. Am J Epidemiol 2002;156:761-773.
Salomon JA, Weinstein MC, Hammitt JK, Goldie SJ. Cost-effectiveness of treatment for chronic hepatitis C infection in an evolving patient population. Jama 2003;290:228-237.
R-4

References
Serfaty L, Aumaitre H, Chazouilleres O, Bonnand AM, Rosmorduc O, Poupon RE, Poupon R. Determinants of outcome of compensated hepatitis C virus-related cirrhosis. Hepatology 1998;27:1435-1440.
Sherman KE, Rouster SD, Chung RT, Rajicic N. Hepatitis C Virus prevalence among patients infected with Human Immunodeficiency Virus: a cross-sectional analysis of the US adult AIDS Clinical Trials Group. Clin Infect Dis 2002;34:831-837.
Sola R, Alvarez MA, Balleste B, Montoliu S, Rivera M, Miquel M, Cirera I, et al. Probability of liver cancer and survival in HCV-related or alcoholic-decompensated cirrhosis. A study of 377 patients. Liver Int 2006;26:62-72.
Solomon L, Flynn C, Muck K, Vertefeuille J. Prevalence of HIV, syphilis, hepatitis B, and hepatitis C among entrants to Maryland correctional facilities. J Urban Health 2004;81:25-37.
Spittal PM, Hogg RS, Li K, Craib KJ, Recsky M, Johnston C, Montaner JS, et al. Drastic elevations in mortality among female injection drug users in a Canadian setting. AIDS Care 2006;18:101-108.
Sullivan PS, Hanson DL, Teshale EH, Wotring LL, Brooks JT. Effect of hepatitis C infection on progression of HIV disease and early response to initial antiretroviral therapy. Aids 2006;20:1171-1179.
Tanaka J, Kumada H, Ikeda K, Chayama K, Mizui M, Hino K, Katayama K, et al. Natural histories of hepatitis C virus infection in men and women simulated by the Markov model. J Med Virol 2003;70:378-386.
Thomas DL. Hepatitis C and human immunodeficiency virus infection. Hepatology 2002;36:S201-209.
Thomas DL, Seeff LB. Natural history of hepatitis C. Clin Liver Dis 2005;9:383-398, vi.
United Kingdom Department of Health. United Kingdom Association of Cancer Registries. In; 2004.
Vlahov D, Wang CL, Galai N, Bareta J, Mehta SH, Strathdee SA, Nelson KE. Mortality risk among new onset injection drug users. Addiction 2004;99:946-954.
Wasley A, Finelli L, Bell B, Alter M. The knowledge and behaviors of HCV-infected persons identified in a seroprevalence survey, USA, 2001–2002. Journal of Clinical Virology 2006;36:S198-S199.
Wong JB, Bennett WG, Koff RS, Pauker SG. Pretreatment evaluation of chronic hepatitis C: risks, benefits, and costs. Jama 1998;280:2088-2093.
Wong JB, McQuillan GM, McHutchison JG, Poynard T. Estimating future hepatitis C morbidity, mortality, and costs in the United States. Am J Public Health 2000;90:1562-1569.
Wright M, Grieve R, Roberts J, Main J, Thomas HC. Health benefits of antiviral therapy for mild chronic hepatitis C: randomised controlled trial and economic evaluation. Health Technol Assess 2006;10:1-113, iii.
R-5
Related Documents