Forecasting Seasonal Footwear Demand Using Machine Learning By Majd Kharfan & Vicky Chan, SCM 2018 Advisor: Tugba Efendigil 1

Welcome message from author
This document is posted to help you gain knowledge. Please leave a comment to let me know what you think about it! Share it to your friends and learn new things together.
Transcript

Forecasting Seasonal Footwear Demand Using Machine
Learning
By Majd Kharfan & Vicky Chan, SCM 2018Advisor: Tugba Efendigil
1

2
Agenda
Ø The State Of Fashion Industry
Ø Research Objectives
Ø AI In the Fashion Industry
Ø Literature Review
Ø Methodology
Ø Results
Ø Conclusion
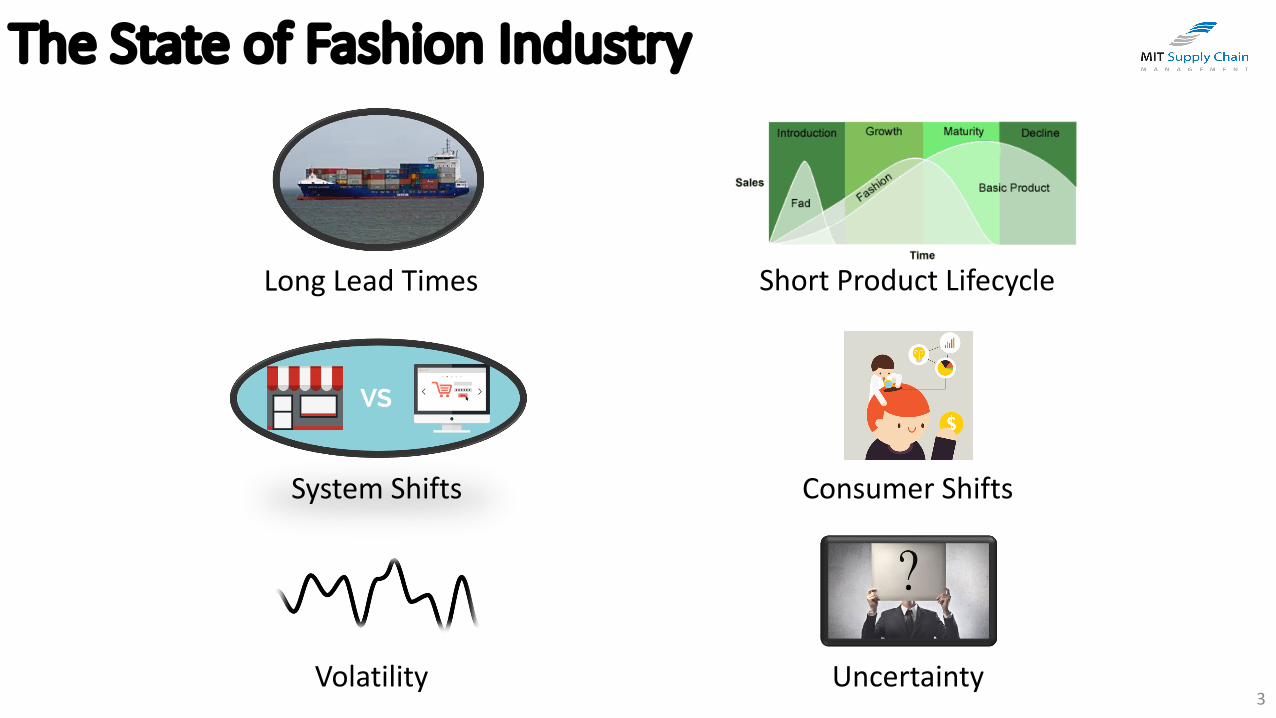
The State of Fashion Industry
Long Lead Times Short Product Lifecycle
System Shifts Consumer Shifts
Volatility Uncertainty3

Research Objectives
1. Leverage AI and machine learning technologies to recommend solutions that improve demand forecasting capabilities and prediction accuracy in the apparel and footwear industry
2. Maximize the utilization of POS data and help uncover new insights to be used in developing a demand forecasting framework that meets the today’s strategic needs
How footwear and apparel companies can optimize their demand forecasting toward having an agile supply chain strategy that meets today’s challenges?
4

AI and the Fashion Industry
Large and diverse
data sets
Advancement in ML
algorithms and
computing power
Fashion industry
lags behind other
industries when it
comes to AI
“Many fashion executives regard AI as too mechanical to capture the creative core of fashion, and so are uncertain of what exactly it can do for them” 1
1. The Business of Fashion and Mckinsey & Company, The State of Fashion, 2017 2. (Chase, 2009: 78)
3. Smartening up with artificial intelligence (AI): What’s in it for Germany and its industrial sector? McKinsey & Company, 2017
High forecast error
on SKU level can be
as high as 100% 2
The Benefits of AI-enabled demand forecasting in retail: 3
30% ~ 50%Forecast Error
Reduction
65%Lost Sales
Reduction
25% ~ 40%Warehousing Cost
Reduction
20% ~ 50%Overall Inventory
Reduction
5

Lit. Review Findings & Our Contribution• In general advanced or hybrid approaches perform better than traditional approaches• Few studies on fashion industry• Contradictory findings• Identify the best mix of forecasting approaches for apparel and footwear companies• A new forecasting approach for look-alike group of products
Traditional Approaches Advanced ApproachesTechniques Moving average, linear regression, Holt-
Winters, exponential smoothing, ARIMASupport vector machines (SVM), neural networks,
decision trees, clustering, fuzzy inference system (FIS)No. of predictor variables
Single or a few Unlimited
Data source Mainly demand history MultipleData manipulation/ cleansing need
High Low
Data requirements Low HighTechnology requirements
Low High
Types of demand forecasting techniques
Literature Review
6

Sell-through (POS) Data
Data Filtering
Data Aggregation
Feature Engineering
Feature SelectionPrediction
Forecast Accuracy and Bias
Clustering
Classification
Prediction
General Model
Three-Step Model
Data Pre-processing
Model Results
Methodology
7

Methodology - Data Pre-ProcessingScope and
Granularity of Data• Dataset Collected:o Sell-in (shipment)o Sell-through (POS) data
from Jul 2013 – Mar 2018
• POS data:oDaily style-location o115 retail outlet stores
• Types of attributes:oProduct attributesoCalendar attributeso Store attributesoPrice and promotion
attributes
Data Filtering and Aggregation
• Aggregated data:oAll storesoMonthly level
• Filtered data:oOutlet exclusive
productso Full price statuso Lifecycle of 1 – 4
months
Feature Selection and Engineering
• Additional attributes:o Lifecycleo Store countoAverage sales
• Feature selection:oRecursive feature
eliminationoDecision trees
Dataset Partitioning
• Training set (67%)• Validation set (25%)• Test set (8%)
8

Methodology - General Model
Individual Models
• Regression Trees• Random Forests• k-Nearest Neighbors• Neural Networks
Ensemble Models
• Average of the four individual models• Median of the four individual models
9
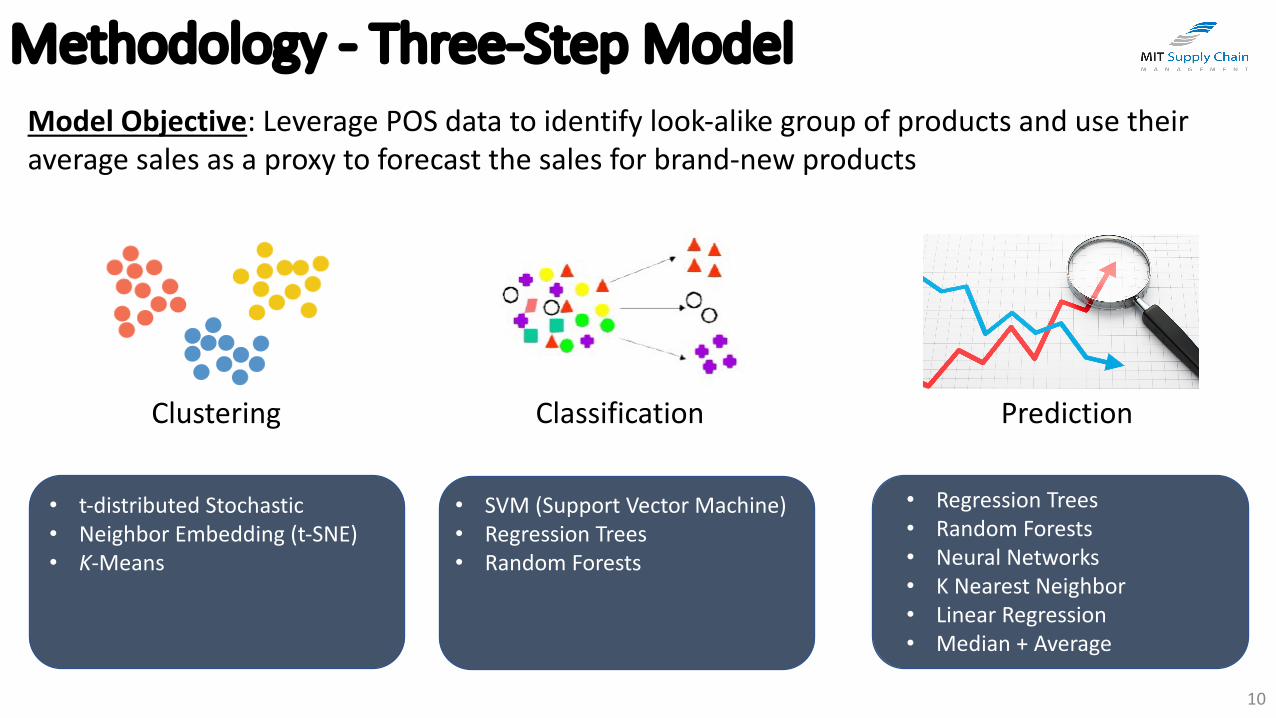
Methodology - Three-Step ModelIndustry Overarching Characteristics
Long Lead Times Short Product Lifecycles High SKU Intensity
Model Objective: Leverage POS data to identify look-alike group of products and use their average sales as a proxy to forecast the sales for brand-new products
Clustering Classification Prediction
• t-distributed Stochastic • Neighbor Embedding (t-SNE) • K-Means
• SVM (Support Vector Machine)• Regression Trees• Random Forests
• Regression Trees• Random Forests• Neural Networks• K Nearest Neighbor • Linear Regression• Median + Average
10

Results – Feature SelectionList of Attributes Selected for Model Building Cross Validation Error by Number of Attributes
• 12 out of the 14 predictor variables were and 2 variables (category and sub-category) were dropped.
• Store count, month and lifecycle month are the top 3 numerical attributes, while gender, material and colorare the top 3 categorical attributes
11
Importance Rank
Attribute Attribute Category
1. Store Count Store2. Month Calendar3. Lifecycle Month Lifecycle4. Gender Desc Product5. AUR Price and Promotion6. Year Calendar7. Basic Material Product8. MSRP Price and Promotion9. Color Group Product10. Lifecycle Lifecycle11. Cut Desc Product12. Product Class Desc Product

Results- General Model
• Individual Models: Random forests gives the best predictive performance with the highest accuracy and lowest bias
• Ensemble Models: Median and Average yield similar results which are better than the individual models
• Implication: immediate implementation, outperforming the company’s current forecasting model in terms of forecast accuracy and bias
-2% -2%
19%
-12%
-2% 1%
47%50%
56%
49%45% 45%
37% 39%
49%
38%35% 35%
-20%
-10%
0%
10%
20%
30%
40%
50%
60%
RandomForest
kNN NeuralNetwork
RegressionTree
Median Average
Fore
cast
Acc
urac
y/Bi
as
Machine Learning Algorithms Used
Forecast Accuracy and Bias of the General Model
Forecast Bias_Style-Lifecycle WMAPE_Style-Month WMAPE_Style-Lifecycle
12
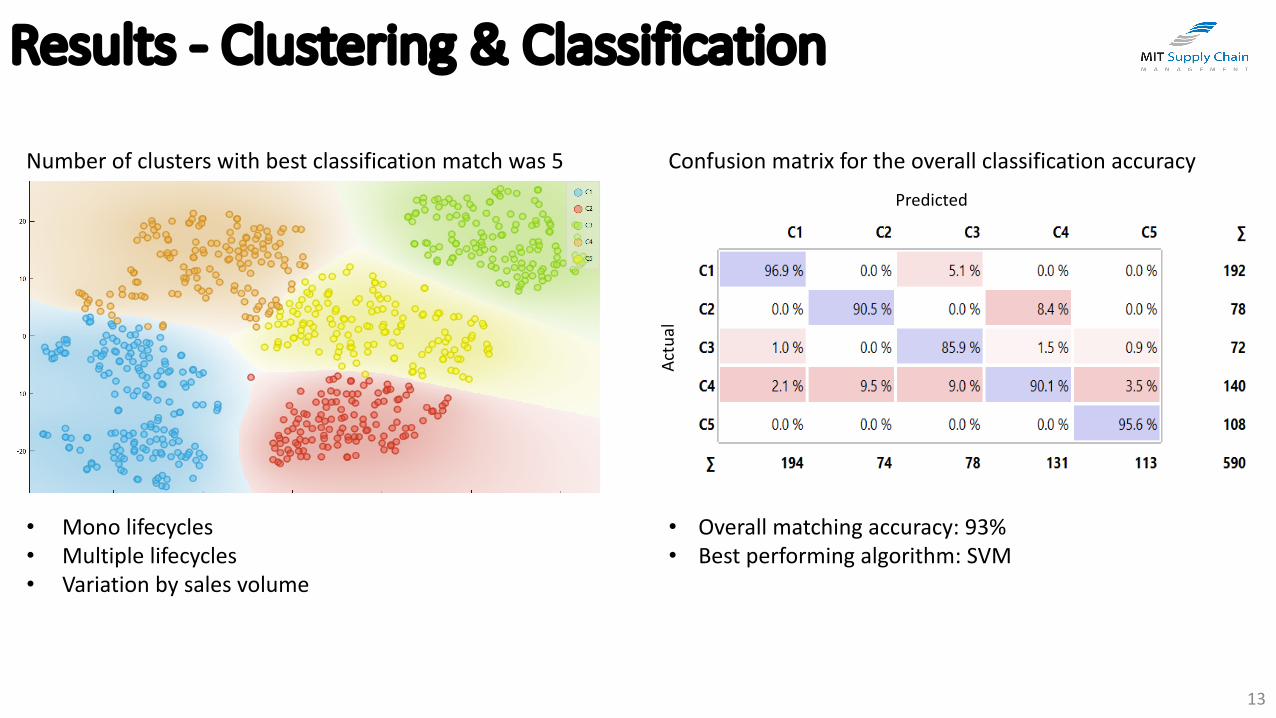
Results - Clustering & Classification
High SKU IntensityNumber of clusters with best classification match was 5 Confusion matrix for the overall classification accuracy
• Mono lifecycles• Multiple lifecycles• Variation by sales volume
• Overall matching accuracy: 93%• Best performing algorithm: SVM
13
Actu
al
Predicted

Results - Three-Step Model
Short Product Lifecycles High SKU Intensity
Cluster Characteristics
Best Performing Algorithm
WMAPE (Style-Lifecycle)
WMPE(Style-Lifecycle)
Mono Lifecycle
High Average Sales
K-NN
Linear Regression
28% +4%
-11%
Mono Lifecycle
Medium Average
Sales
Random Forests 32%~37% -11%~+6%
Multiple Lifecycle
Low Average Sales
Regression Trees 39%~45% -30%~0%
Prediction results on a cluster-level:
• Ensemble Models: highest forecast accuracy (30%) and
low forecast bias (<10%)
• Individual Models: regression trees and linear regression,
high forecast accuracy (>35%) with lowest bias (<5%)
Implication:
• Forecasting can be customized to deliver best possible
results based on product characteristics
14
-18%-7%
-23%
2% 3%
-7% -9%
45% 44%40%
44%41% 40% 40%
36% 35% 33% 31% 33%30% 30%
-30%
-20%
-10%
0%
10%
20%
30%
40%
50%
Random
Forest
kNN Neural
Network
Regression
Tree
Linear
Regression
Median Average
Fo
reca
st A
ccu
racy
/Bia
s
Machine Learning Algorithms Used
Overall Forecast Accuracy and Bias of the Three-Step Model
Forecast Bias_Style-Lifecycle WMAPE_Style-Month
WMAPE_Style-Lifecycle
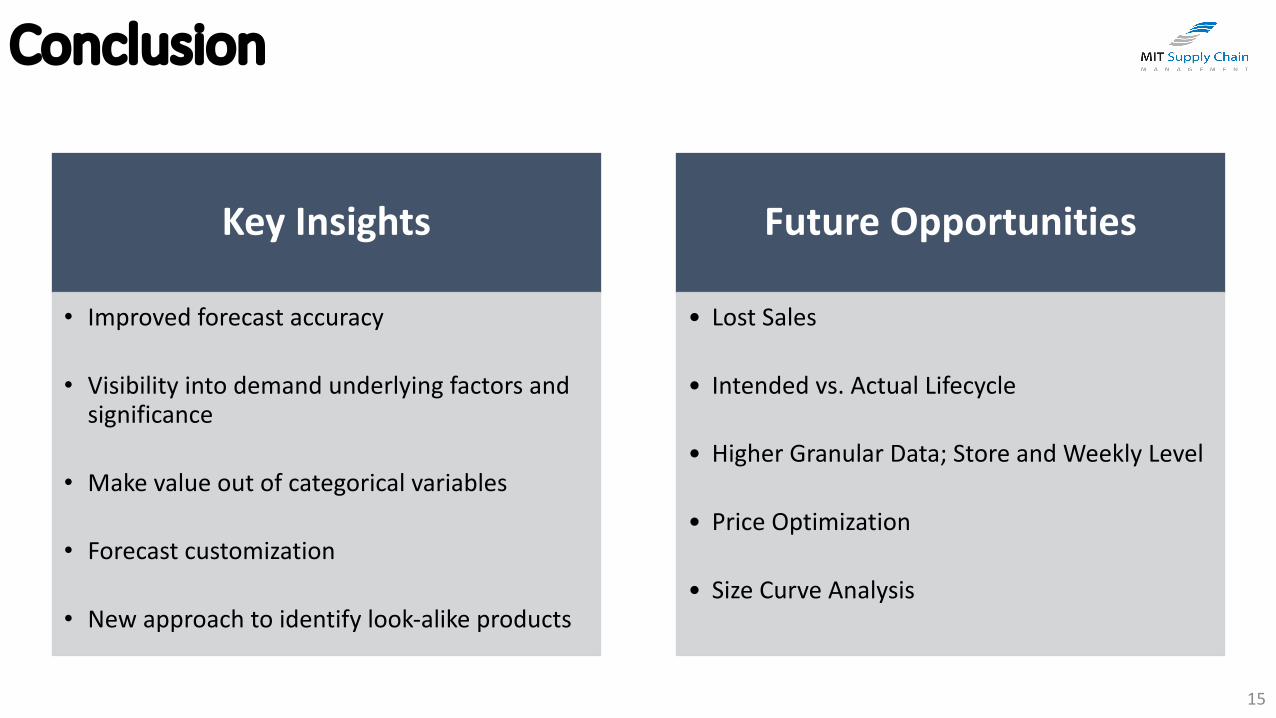
Conclusion
Key Insights
• Improved forecast accuracy
• Visibility into demand underlying factors and significance
• Make value out of categorical variables
• Forecast customization
• New approach to identify look-alike products
Future Opportunities
• Lost Sales
• Intended vs. Actual Lifecycle
• Higher Granular Data; Store and Weekly Level
• Price Optimization
• Size Curve Analysis
15

Q&A
16

Appendix
17

Efforts to Counter Current Industry Challenges
Adaptive Overarching Strategies Agile Supply Chain Strategies
• Omni channel investments• Brand experiments with direct-to-consumer• Push the limits of time from design to shelf• Proliferation of data
• Streamline manufacturing processes• FG Inventory pooling and raw materials staging• Digitize the supply chain for cost efficiencies• Improve forecasting capabilities
18

Why Demand Forecasting?
Demand Forecasting is the art & science of predicting customer future demand for products.
Why optimizing demand forecasting is one of the major initiatives for achieving agile supply chain?
• Input for planning across different supply chain and business functions (i.e., raw materials, sales, merchandising, etc.)
• Poor forecast results in:o Stock-outs i.e., lost revenue and consequently lost market share to competitorso Excessive inventory i.e., frozen net working capital and price mark-downs and both cause brand image deterioration
Agility: “The ability of an organisation to respond rapidly to changes in demand both in terms of volume and variety”4
4. Martin Christopher, Industrial Marketing Management, 2000 19
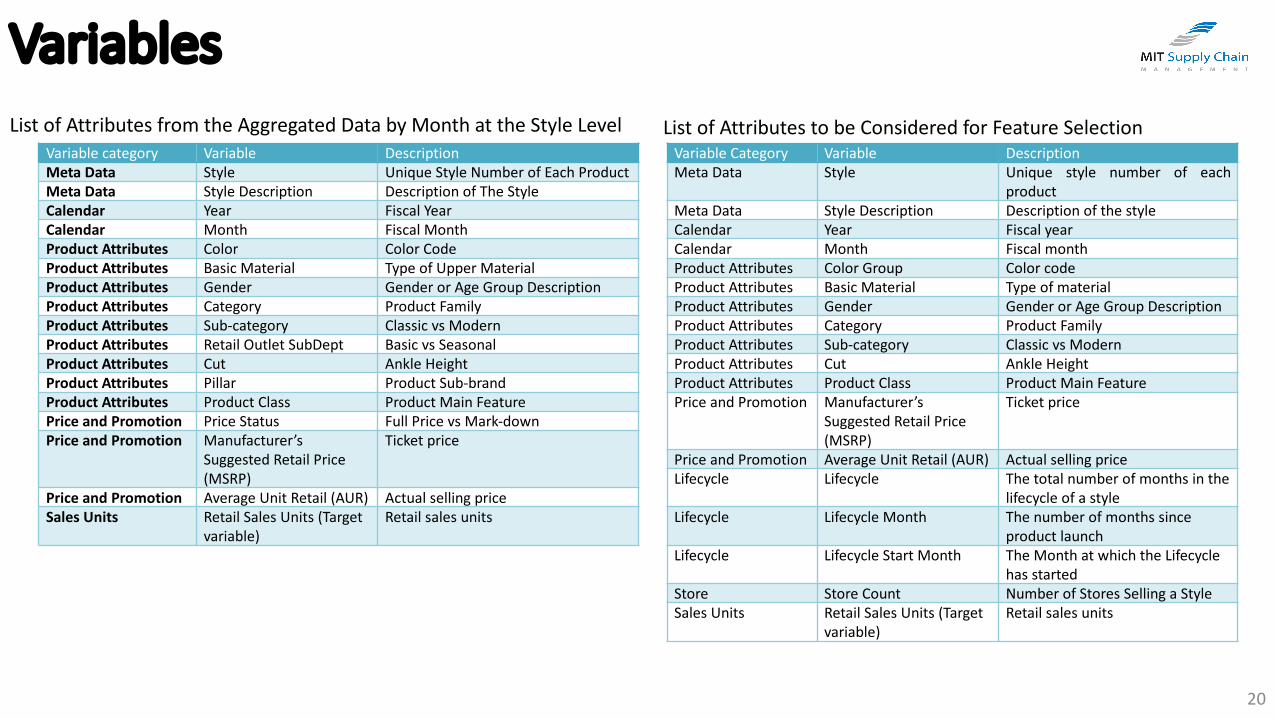
Variable Category Variable DescriptionMeta Data Style Unique style number of each
productMeta Data Style Description Description of the styleCalendar Year Fiscal yearCalendar Month Fiscal monthProduct Attributes Color Group Color codeProduct Attributes Basic Material Type of materialProduct Attributes Gender Gender or Age Group DescriptionProduct Attributes Category Product FamilyProduct Attributes Sub-category Classic vs ModernProduct Attributes Cut Ankle HeightProduct Attributes Product Class Product Main FeaturePrice and Promotion Manufacturer’s
Suggested Retail Price (MSRP)
Ticket price
Price and Promotion Average Unit Retail (AUR) Actual selling priceLifecycle Lifecycle The total number of months in the
lifecycle of a styleLifecycle Lifecycle Month The number of months since
product launchLifecycle Lifecycle Start Month The Month at which the Lifecycle
has startedStore Store Count Number of Stores Selling a StyleSales Units Retail Sales Units (Target
variable)Retail sales units
List of Attributes from the Aggregated Data by Month at the Style LevelVariable category Variable DescriptionMeta Data Style Unique Style Number of Each ProductMeta Data Style Description Description of The StyleCalendar Year Fiscal YearCalendar Month Fiscal MonthProduct Attributes Color Color CodeProduct Attributes Basic Material Type of Upper MaterialProduct Attributes Gender Gender or Age Group DescriptionProduct Attributes Category Product FamilyProduct Attributes Sub-category Classic vs ModernProduct Attributes Retail Outlet SubDept Basic vs SeasonalProduct Attributes Cut Ankle HeightProduct Attributes Pillar Product Sub-brandProduct Attributes Product Class Product Main FeaturePrice and Promotion Price Status Full Price vs Mark-downPrice and Promotion Manufacturer’s
Suggested Retail Price (MSRP)
Ticket price
Price and Promotion Average Unit Retail (AUR) Actual selling priceSales Units Retail Sales Units (Target
variable)Retail sales units
List of Attributes to be Considered for Feature Selection
Variables
20

Datasets
Dataset Months of sales Number of Styles Number of recordsTraining 36 578 1796Validation 18 195 560
Dataset Months of sales Number of Styles Number of recordsTraining 35 539 1558Validation 19 201 591Testing 3 58 155
General Model:
Three-Step Model:
21
Related Documents