Forecasting Formal Employment in Cities Citation Lora, Eduardo. “Forecasting Formal Employment in Cities.” CID Research Fellow and Graduate Student Working Paper Series 2019.114, Harvard University, Cambridge, MA, May 2019. Published Version https://www.hks.harvard.edu/centers/cid/publications/fellow-graduate-student-working-papers Permanent link https://nrs.harvard.edu/URN-3:HUL.INSTREPOS:37366838 Terms of Use This article was downloaded from Harvard University’s DASH repository, and is made available under the terms and conditions applicable to Other Posted Material, as set forth at http:// nrs.harvard.edu/urn-3:HUL.InstRepos:dash.current.terms-of-use#LAA Share Your Story The Harvard community has made this article openly available. Please share how this access benefits you. Submit a story . Accessibility

Welcome message from author
This document is posted to help you gain knowledge. Please leave a comment to let me know what you think about it! Share it to your friends and learn new things together.
Transcript
Forecasting Formal Employment in Cities
CitationLora, Eduardo. “Forecasting Formal Employment in Cities.” CID Research Fellow and Graduate Student Working Paper Series 2019.114, Harvard University, Cambridge, MA, May 2019.
Published Versionhttps://www.hks.harvard.edu/centers/cid/publications/fellow-graduate-student-working-papers
Permanent linkhttps://nrs.harvard.edu/URN-3:HUL.INSTREPOS:37366838
Terms of UseThis article was downloaded from Harvard University’s DASH repository, and is made available under the terms and conditions applicable to Other Posted Material, as set forth at http://nrs.harvard.edu/urn-3:HUL.InstRepos:dash.current.terms-of-use#LAA
Share Your StoryThe Harvard community has made this article openly available.Please share how this access benefits you. Submit a story .
Accessibility
Forecasting Formal Employment in Cities
Eduardo Lora
CID Research Fellow and Graduate Student Working Paper No. 114
May 2019
© Copyright 2019 Lora, Eduardo; and the President and Fellows of Harvard College
at Harvard University Center for International Development
Working Papers
1
Forecastingformalemploymentincities
EduardoLora1RiSEandDepartmentofEconomics,UniversidadEafitand
CenterforInternationationalDevelopment,HarvardUniversityMay2019
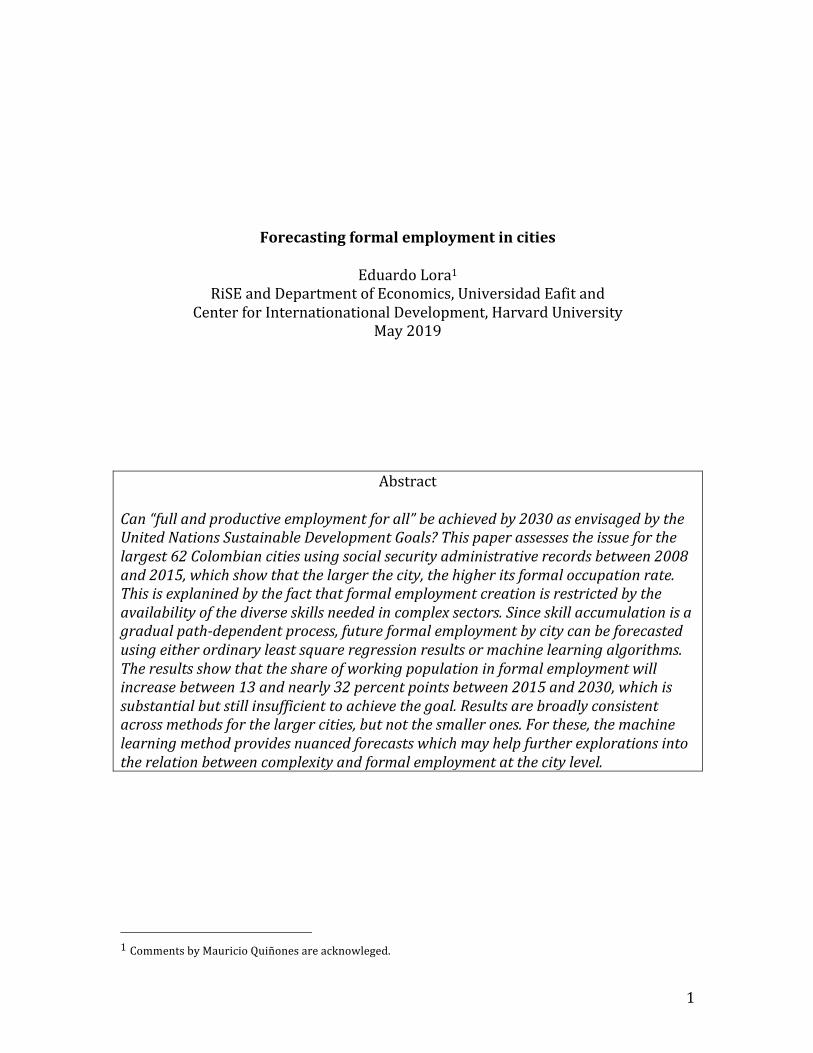
AbstractCan“fullandproductiveemploymentforall”beachievedby2030asenvisagedbytheUnitedNationsSustainableDevelopmentGoals?Thispaperassessestheissueforthelargest62Colombiancitiesusingsocialsecurityadministrativerecordsbetween2008and2015,whichshowthatthelargerthecity,thehigheritsformaloccupationrate.Thisisexplaninedbythefactthatformalemploymentcreationisrestrictedbytheavailabilityofthediverseskillsneededincomplexsectors.Sinceskillaccumulationisagradualpath-dependentprocess,futureformalemploymentbycitycanbeforecastedusingeitherordinaryleastsquareregressionresultsormachinelearningalgorithms.Theresultsshowthattheshareofworkingpopulationinformalemploymentwillincreasebetween13andnearly32percentpointsbetween2015and2030,whichissubstantialbutstillinsufficienttoachievethegoal.Resultsarebroadlyconsistentacrossmethodsforthelargercities,butnotthesmallerones.Forthese,themachinelearningmethodprovidesnuancedforecastswhichmayhelpfurtherexplorationsintotherelationbetweencomplexityandformalemploymentatthecitylevel.
1CommentsbyMauricioQuiñonesareacknowleged.
2
1.IntroductionUnitedNationsSustainableDevelopmentGoal8is“Promotesustained,inclusiveandsustainableeconomicgrowth,fullandproductiveemploymentanddecentworkforall”. More specifically, target 8.3 seeks to “[b]y 2030, achieve full and productiveemploymentanddecentwork forallwomenandmen, including foryoungpeopleand personswith disabilities, and equal pay forwork of equal value”. This paperassesses how achievable this target is for Colombia, based on a novel theory offormalemploymentcreationincitiesandtwocomplementaryforecastingmethods:standardregressionsandmachinelearning.
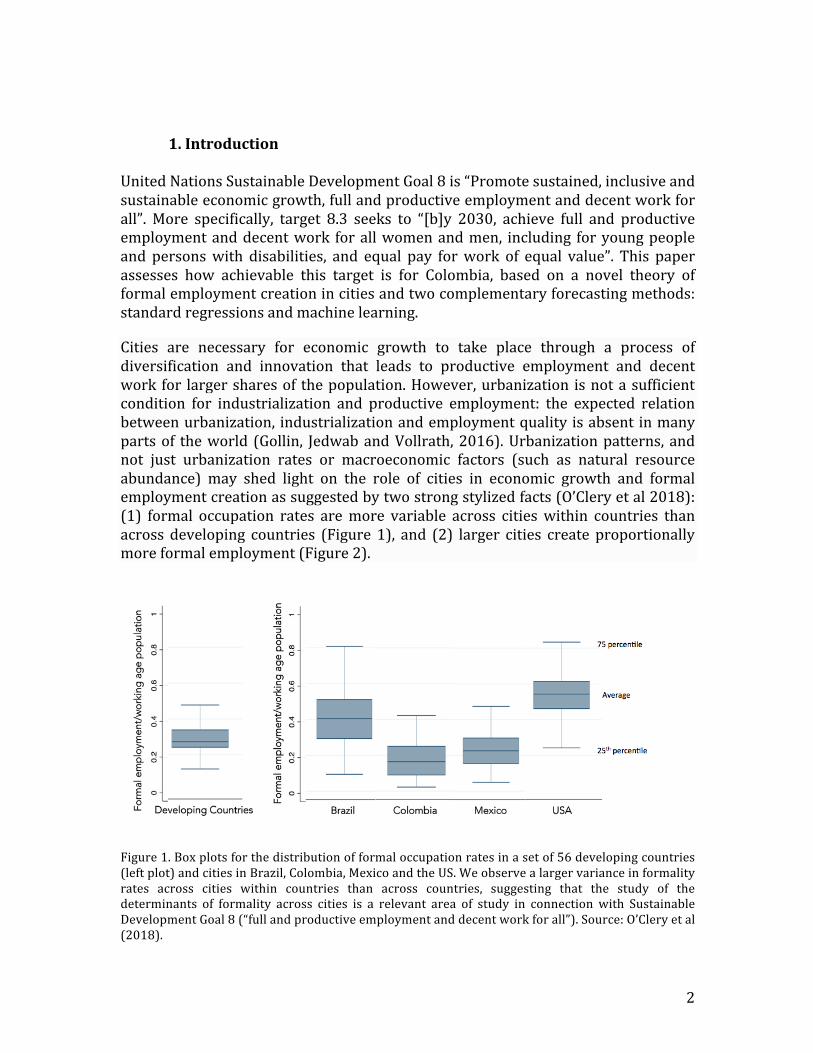
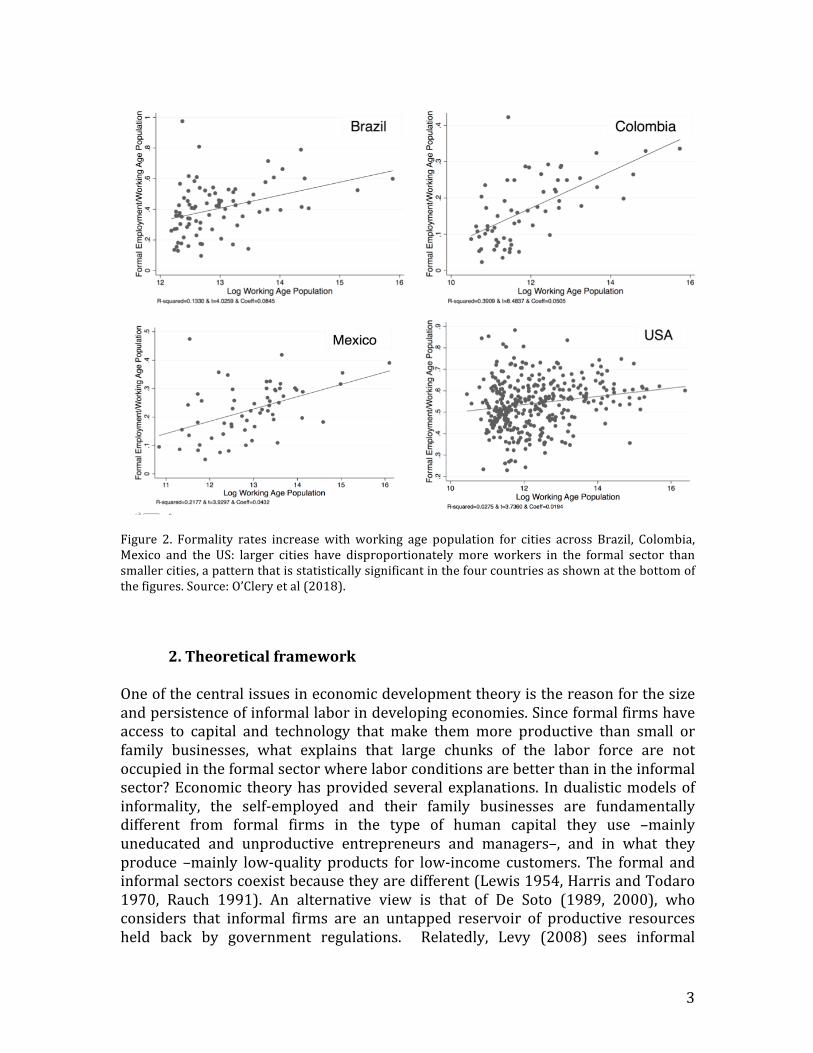
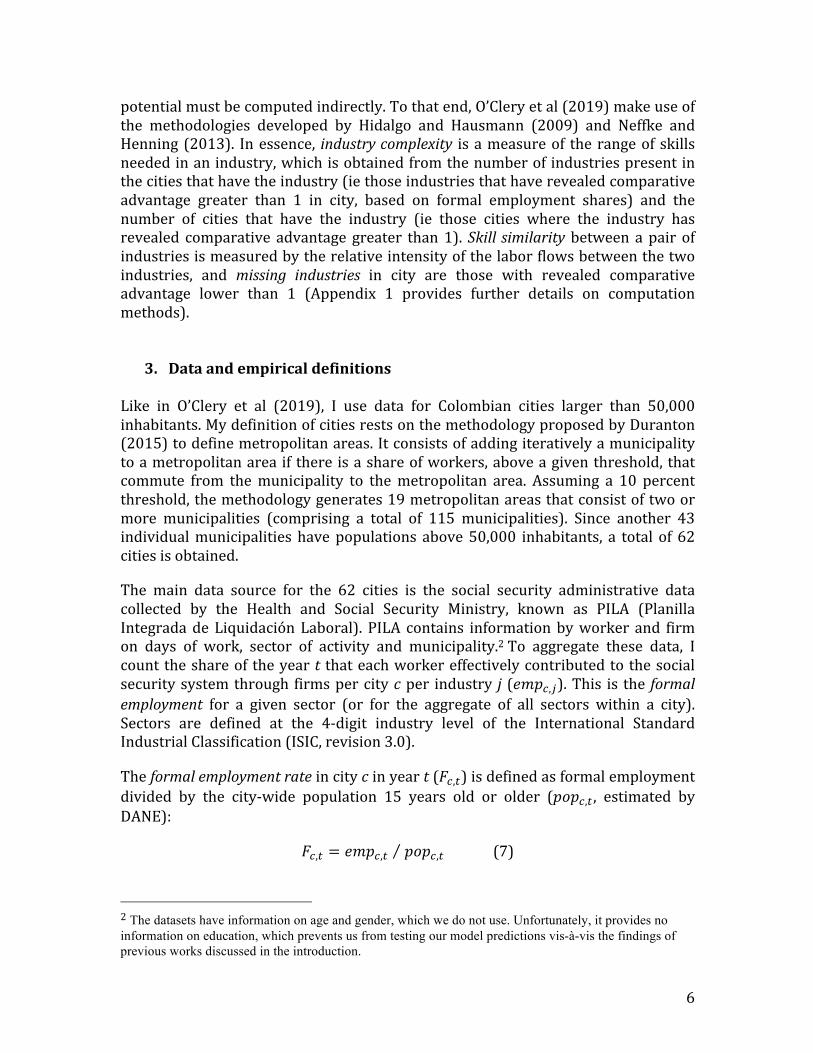
Cities are necessary for economic growth to take place through a process ofdiversification and innovation that leads to productive employment and decentwork for largersharesof thepopulation.However,urbanization isnotasufficientcondition for industrialization and productive employment: the expected relationbetweenurbanization, industrializationandemploymentqualityisabsentinmanypartsof theworld (Gollin, JedwabandVollrath,2016).Urbanizationpatterns,andnot just urbanization rates or macroeconomic factors (such as natural resourceabundance) may shed light on the role of cities in economic growth and formalemploymentcreationassuggestedbytwostrongstylizedfacts(O’Cleryetal2018):(1) formal occupation rates aremore variable across citieswithin countries thanacross developing countries (Figure 1), and (2) larger cities create proportionallymoreformalemployment(Figure2).
Figure1.Boxplotsforthedistributionofformaloccupationratesinasetof56developingcountries(leftplot)andcitiesinBrazil,Colombia,MexicoandtheUS.Weobservealargervarianceinformalityrates across cities within countries than across countries, suggesting that the study of thedeterminants of formality across cities is a relevant area of study in connection with SustainableDevelopmentGoal8(“fullandproductiveemploymentanddecentworkforall”).Source:O’Cleryetal(2018).
3
Figure 2. Formality rates increasewithworking age population for cities across Brazil, Colombia,Mexico and the US: larger cities have disproportionatelymore workers in the formal sector thansmallercities,apatternthatisstatisticallysignificantinthefourcountriesasshownatthebottomofthefigures.Source:O’Cleryetal(2018).
2.TheoreticalframeworkOneofthecentralissuesineconomicdevelopmenttheoryisthereasonforthesizeandpersistenceofinformallaborindevelopingeconomies.Sinceformalfirmshaveaccess to capital and technology that make themmore productive than small orfamily businesses, what explains that large chunks of the labor force are notoccupiedintheformalsectorwherelaborconditionsarebetterthanintheinformalsector?Economic theoryhasprovidedseveralexplanations. Indualisticmodelsofinformality, the self-employed and their family businesses are fundamentallydifferent from formal firms in the type of human capital they use –mainlyuneducated and unproductive entrepreneurs and managers–, and in what theyproduce –mainly low-quality products for low-income customers. The formal andinformalsectorscoexistbecausetheyaredifferent(Lewis1954,HarrisandTodaro1970, Rauch 1991). An alternative view is that of De Soto (1989, 2000), whoconsiders that informal firms are an untapped reservoir of productive resourcesheld back by government regulations. Relatedly, Levy (2008) sees informal
4
businesses as entrenched firms that survive in spite of their low productivity byavoidingtaxesandregulations.Lastly,inlaborsearchmodelsthattakeintoaccountthe costs and benefits of labor regulations, informal employment is not theconsequence of exclusion, but the result of labor market frictions betweenheterogeneousworkersandfirms(Albrecht,NavarroandVroman2009;BoschandMaloney2010;Ulyssea2010;Meghir,NaritaandRobin2015).While empirical evidence has been provided in support to each of theseexplanations of informality, none of them recognizes the two stylized factsmentioned in the introduction, namely that formal occupation rates across cities(within a given country) have a larger variance than across countries, and thatformal occupation rates are directly and significantly associatedwith city size. Inotherwords,noneofthemainstreamtheoriescanexplaintheroleofcitiesinformalemployment creation. Furthermore, some of the main variables put forward bythose theories to explain the presence of informality –such as social securityregimes and labor hiring and firing legislation—have little or no variance acrosscitieswithineachcountry.In view of these shortcomings, this paper adopts the theoretical frameworkdevelopedbyO’Cleryetal(2019),whichdiffersfromprevioustheoriesinanumberofways.First,itfocusesoncitiesratherthancountries,becausecitiesaretheactuallocationswhereworkers and their employers interact. Second, it emphasizes skilldiversity–whichiscentralinurbaneconomics—ratherthanskilllevels,educationalattainment or managerial capabilities. Third, it assumes that firms evolve bytinkering with skills because many feasible technologies cannot be known inadvance, but need to be discovered. Formal employment creation in cities resultsfrom this evolutionary process. In larger cities, firms have better access to thediverseskillstheyneedtoproducemoresophisticatedgoods.Themaincomponentsofthemodelcanbesummarizedasfollows(forthecompletemodelseeO’Cleryetal2018):Citysizeandskilldiversityaretakenasexogenous.Eachfirmislocatedinacity,butsellstothewholenationalmarketunderperfectcompetition.Theoutputoffirm𝑟,whichbelongstoindustry𝑗attime𝑡,isgivenbyaCESproductionfunctionwhoseonlyproductionfactorsaretypesoflabordifferentiatedbyskill,whereskills𝑘arehardtosubstituteforoneanother:
𝑦!! = 𝐴!! 𝑙!! 𝑘 !!"!! !
!! (1)
Optimalformallabordemandofeachskillisgivenbythesolutiontothecostminimizationproblemfacingthefirm,fromwhichwagebyskillisobtained:
𝑊!! = 𝑤!
!! ! ! 𝐶!
! (2)
5
where𝑤!is thesurvival (orminimum)wageofworkerswithgeneralskills (whicharesuppliedinexcessofwhatfirmsdemand),andwhere𝐶!
! reflectsthediversityofskillsthatareneededinindustry𝑗,andcanthereforebeinterpretedasameasureofthecomplexityoftheindustry,
𝐶!! = 𝜃! 𝑘
!! ! !! ! ! (3)
Since𝜃! 𝑘 ≥ 1foreveryskill,industrycomplexityislargerinindustrieswhichcombinealargersubsetofsophisticatedskills.Finally, firms transition from less to more sophisticated industries following aprobabilisticrulesuchthattheconditionalexpectedvalueofafirm´scomplexityoneperiodaheadis:
𝐸! 𝐶!!!! 𝑗! 𝑟 = 𝑗 = 𝑝 𝐶!
! + 1− 𝑝 𝛽! 𝑗, 𝑗!!!∈! 𝐶!!!
!"#$%&'()* !"#$%#&'(
(4)
Duetothedefinitionof𝛽! 𝑗, 𝑗! ,thecomplexitypotentialofagivenfirmdependson(i)theindustrytowhichthefirmcurrentlybelongs,(ii)thedistancebetweensuchindustry and those industries to which the firm could migrate, (iii) the relativeabundanceinthelocallabormarketofthosenewskillswhichthefirmmusthireinordertocarryoutanindustrytransition,and(iv)thesizeoflaborforceincity.
Totalformalemploymentatthecityleveloneperiodahead(𝐹!!!)isthusobtainedbyaggregatinglabordemandacrossskillsandfirms:
𝐹!!! = 𝑙!!!! 𝑘 ∗!∈!!!! !! = !!!!
!
!!!!! 𝐶!!!!
! !! 𝜃!!! 𝑘
!! ! !
!∈!!!! !! (5)
Aggregateformalemploymentinacitydependsoncurrentcomplexityofallitsfirms,whichinturndependsonpastcomplexitypotential(equation4).Therefore,formalemploymentinperiodt+1isafunctionofcomplexitypotentialinperiodt:
𝐹!!! = 𝑓 𝛽! 𝑗, 𝑗!!!∈! 𝐶!!!
!"#$%&'()* !"#$%#&'(
(6)
Noticethatcomplexitypotentialisaweightedaverageoftheindustrycomplexityofthemissingsectorswithweightsgivenbytheskillsimilaritybetweenthosesectorsandtheonesalreadypresent.Inorder tooperationalize equation (6), dataareneededon industrycomplexity,missingsectors,andskillsimilaritybetweenallpairsof industries.Sinceskillsaretacit knowledge and therefore unobservable, industry complexity and complexity
6
potentialmustbecomputedindirectly.Tothatend,O’Cleryetal(2019)makeuseofthe methodologies developed by Hidalgo and Hausmann (2009) and Neffke andHenning(2013). Inessence, industrycomplexity isameasureof therangeofskillsneededinanindustry,whichisobtainedfromthenumberofindustriespresentinthecitiesthathavetheindustry(iethoseindustriesthathaverevealedcomparativeadvantage greater than 1 in city, based on formal employment shares) and thenumber of cities that have the industry (ie those cities where the industry hasrevealed comparative advantage greater than1).Skill similarity between apair ofindustriesismeasuredbytherelativeintensityofthelaborflowsbetweenthetwoindustries, and missing industries in city are those with revealed comparativeadvantage lower than 1 (Appendix 1 provides further details on computationmethods).
3. DataandempiricaldefinitionsLike in O’Clery et al (2019), I use data for Colombian cities larger than 50,000inhabitants.MydefinitionofcitiesrestsonthemethodologyproposedbyDuranton(2015)todefinemetropolitanareas.Itconsistsofaddingiterativelyamunicipalitytoametropolitanareaif thereisashareofworkers,aboveagiventhreshold,thatcommute from themunicipality to themetropolitan area. Assuming a 10 percentthreshold,themethodologygenerates19metropolitanareasthatconsistoftwoormore municipalities (comprising a total of 115 municipalities). Since another 43individualmunicipalities havepopulations above50,000 inhabitants, a total of 62citiesisobtained.
The main data source for the 62 cities is the social security administrative datacollected by the Health and Social Security Ministry, known as PILA (PlanillaIntegradadeLiquidaciónLaboral). PILA contains informationbyworker and firmon days of work, sector of activity and municipality.2To aggregate these data, Icounttheshareof theyeart thateachworkereffectivelycontributedtothesocialsecuritysystemthrough firmspercitycper industry j (𝑒𝑚𝑝!,!).This is the formalemployment for a given sector (or for the aggregate of all sectors within a city).Sectors are defined at the 4-digit industry level of the International StandardIndustrialClassification(ISIC,revision3.0).
Theformalemploymentrateincitycinyeart(𝐹!,!)isdefinedasformalemploymentdivided by the city-wide population 15 years old or older (𝑝𝑜𝑝!,! , estimated byDANE):
𝐹!,! = 𝑒𝑚𝑝!,! 𝑝𝑜𝑝!,! (7)
2The datasets have information on age and gender, which we do not use. Unfortunately, it provides no information on education, which prevents us from testing our model predictions vis-à-vis the findings of previous works discussed in the introduction.
7
The (simple) average formal occupation rate in cities was only 20.3 percent ofworkingagepopulationin2015,witharelativelylargestandarddeviation(between11.1percentpoints).Importantchangesinurbanformaloccupationratesoccurredbetween2008and2015:theaggregateformaloccupationrateforthe62citieswentupfrom21.1percentto31.2percent,witha(simple)averageincreaseacrosscitiesof8.1percentpointsandastandarddeviationof5.4points.Formaloccupationwasfacilitated by a rate of GDP growth of 4.1 percent, and probably also by theeliminationinMayof2013ofpayrolltaxesrepresenting5percentofthewagebill(Kugler,KuglerandHerrera-Prada2017).
Sincetheformalemploymentrateisavariableboundedbetween0and1,andtheaimistoassesshowfastitapproaches1,itistransformedtoitslogisticform,time-differentiatedandexpressedinannualterms:
𝑦!,!!! =!!!!
!!!,!
!!!!!,!− !!!,!!!
!!!!!,!!! (8)
where𝑦!,!!! willbethedependendvariableandthesubscriptiistheyear-intervalornumberofyearsforthetime-differentiation(whichmaytakevaluesbetween1and7,giventhatthedatacoveran8-yearspan).Forintuition’ssake,Iwillrefertothedependentvariableasthe“annualspeedtowardsfullemployment”,or“speed”,forshort.Theindependentvariables(attimet-i)willbecomplexitypotential,𝐶𝑃!,!!! asexplainedabove,the(logof)workingagepopulation,𝑙𝑝𝑜𝑝!,!!! ,thelogisticofformal
occupationrate, !!!,!!!
!!!!!,!!!,adummyfortheoil-producingcities(thosewithmorethan
oneoilwellper10,000inhabitants:Acacías,Arauca,Barrancabermeja,NeivaandYopal)andasyntheticmeasureoftheexogenoussectoralshocksbycityc(followingMcGuireandBartik1991,theso-calledBartikshockmeasureforcitycattimetisaweightedaverageoftheratesofchangebetweent-iandtofformalemploymentbysectoratthenationallevel,excludingcityc,withweightsequaltotheemploymentshareofeachsectorincitycinyeart-i).3Twoforecastingmethodswillbeusedinacomplementaryway.Thefirstonewillbebasedonordinaryleastsquareregressionsforallthepossibletimefrequenciesoftheyearlydatabetween2008and2015.Afterdiscussingthelackofconsistencyofsomeofthecoefficcients,tworegressionsarechosentoforecastthedependentvariablebycityandcomputetheformalityratesbycityin2030.Thesecondmethod,furtherexplainedinsection5,willbeamachinelearningtechniqueknownas“randomforest”,bywhichasetofalternativeresultsarepredictedbasedoncombinationsofexplanatoryvariablespresumedlyassociatedwiththeresults(inan
3InO’Cleryetal(2019)themeasureofcomplexitypotentialdependsonworkingagepopulation,whilehereIamtakingthelatterasaseparateexplanatoryvariable.Inthisway,therelationbetweenbothvariablescanbeexploredinthemachinelearningexercises.
8
unknownnon-linearfashion).Thetwomethodsarecomplementarybecause,whileOLSprovideslightonthepossibleinfluenceofeachindividualvariable,itspredictionscanonlybereliableifthecoefficientscanbeconsistentlyestimatedandtherelationbetweenthedependentandtheindependentvariables(orcombinationsthereof)islinearandknowninadvance.Theselimitationsdonotapplytomachinelearningtechniques,whichareintendedtoproducereliablepredictionsusingprobabilisticmethodsthatmakeefficientuseofallthedatathatmayberelevant.
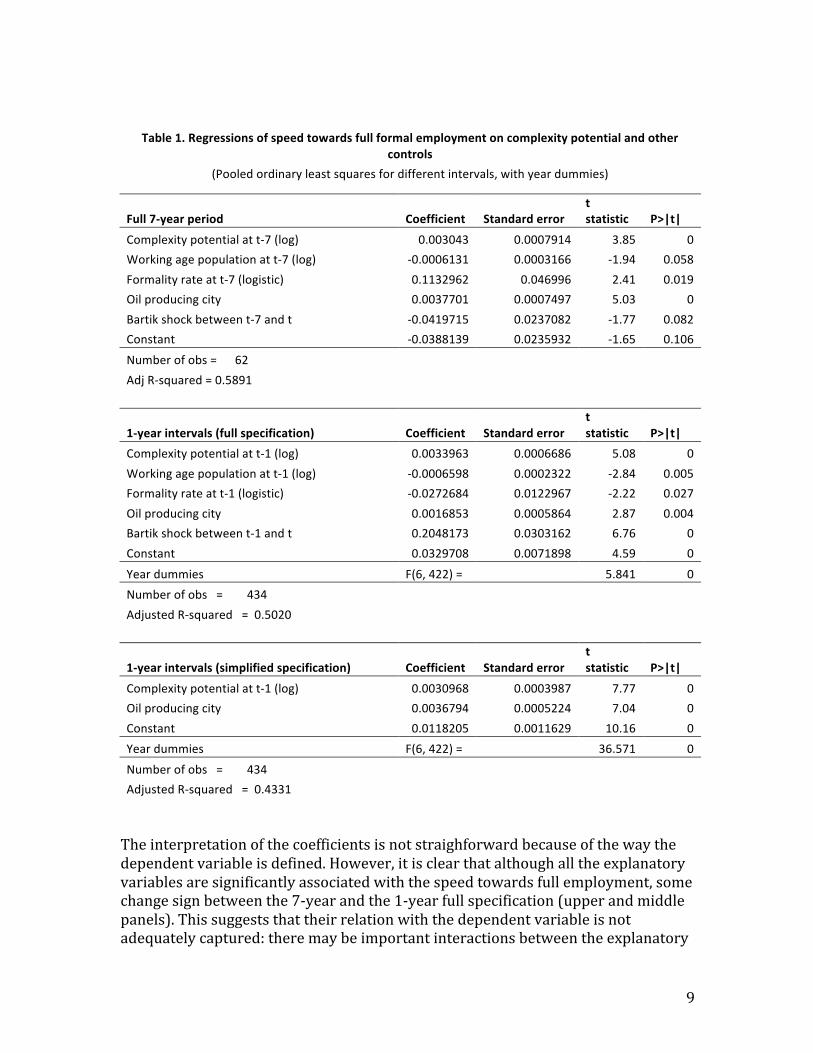
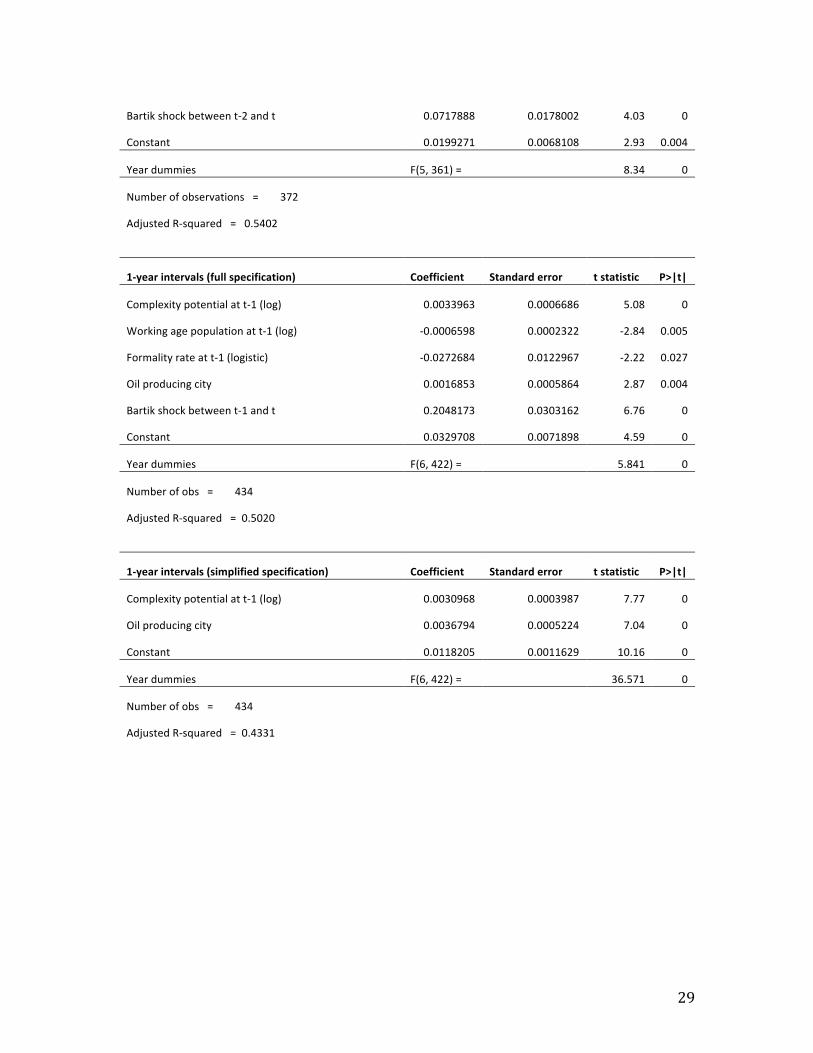
4. Regression-basedforecastsTable1isasummaryoftheregressions.Onlythe7-year(iefull2008-2015)and1-yearintervalregressionsarepresented(seeAppendix2foralltheintervals).Intheupperpanelthe62observationscorrespondtothenumberofcitiesbecausethereisonlyoneperiod.Inthetwootherpanels,thenumberofobservationsis434,sincethereare7one-yearperiods(434=62x7).
9
Table1.Regressionsofspeedtowardsfullformalemploymentoncomplexitypotentialandothercontrols
(Pooledordinaryleastsquaresfordifferentintervals,withyeardummies)
Full7-yearperiod Coefficient Standarderror
tstatistic P>|t|
Complexitypotentialatt-7(log) 0.003043 0.0007914 3.85 0Workingagepopulationatt-7(log) -0.0006131 0.0003166 -1.94 0.058Formalityrateatt-7(logistic) 0.1132962 0.046996 2.41 0.019Oilproducingcity 0.0037701 0.0007497 5.03 0Bartikshockbetweent-7andt -0.0419715 0.0237082 -1.77 0.082Constant -0.0388139 0.0235932 -1.65 0.106
Numberofobs=62 AdjR-squared=0.5891
1-yearintervals(fullspecification) Coefficient Standarderror
tstatistic P>|t|
Complexitypotentialatt-1(log) 0.0033963 0.0006686 5.08 0Workingagepopulationatt-1(log) -0.0006598 0.0002322 -2.84 0.005Formalityrateatt-1(logistic) -0.0272684 0.0122967 -2.22 0.027Oilproducingcity 0.0016853 0.0005864 2.87 0.004Bartikshockbetweent-1andt 0.2048173 0.0303162 6.76 0Constant 0.0329708 0.0071898 4.59 0
Yeardummies F(6,422)= 5.841 0Numberofobs=434
AdjustedR-squared=0.5020
1-yearintervals(simplifiedspecification) Coefficient Standarderror
tstatistic P>|t|
Complexitypotentialatt-1(log) 0.0030968 0.0003987 7.77 0Oilproducingcity 0.0036794 0.0005224 7.04 0Constant 0.0118205 0.0011629 10.16 0Yeardummies F(6,422)= 36.571 0
Numberofobs=434 AdjustedR-squared=0.4331
Theinterpretationofthecoefficientsisnotstraighforwardbecauseofthewaythedependentvariableisdefined.However,itisclearthatalthoughalltheexplanatoryvariablesaresignificantlyassociatedwiththespeedtowardsfullemployment,somechangesignbetweenthe7-yearandthe1-yearfullspecification(upperandmiddlepanels).Thissuggeststhattheirrelationwiththedependentvariableisnotadequatelycaptured:theremaybeimportantinteractionsbetweentheexplanatory
10
variablesordynamicissuesthatareignoredinthespecificationadopted.Sinceboththenumberofcitiesandthenumberofperiodsaresmall,notmuchcanbedonetoovercometheseproblemswithstandardeconometrics.Aswewillsee,machinelearningtechniquesareabletodealwiththeselimitations.Thelowerpanelshowsasimplifiedversionofthe1-yearintervalregression,whichonlyincludestheexplanatoryvariablesthataresignificantlyandconsistentlydirectlyorinverselyassociatedwiththedependentvariable.Thosearejustcomplexitypotentialandthedummyvariableforoil-producingcities.Iusethecoefficientsofthemiddle-andlower-panelregressionstoforecastformalemploymentin2030,withthefollowingadditionalassumptionsandmethods:
• Complexitypotentialbycityisassumedconstantatthe2015values• Workingagepopulationbycityisprojectedatthesamegrowthrate
observedbetween2008and2015• Formalityrateatt-1(logistic)bycityiscalculatedrecursivelywiththe
forecastofthedependentvariableforthepreviousyear• Oilproducingcitydummyiskeptunchangedthroughouttheforecastperiod• Bartikshockbycityisassumedconstantatthemeanoftheyearlydatafor
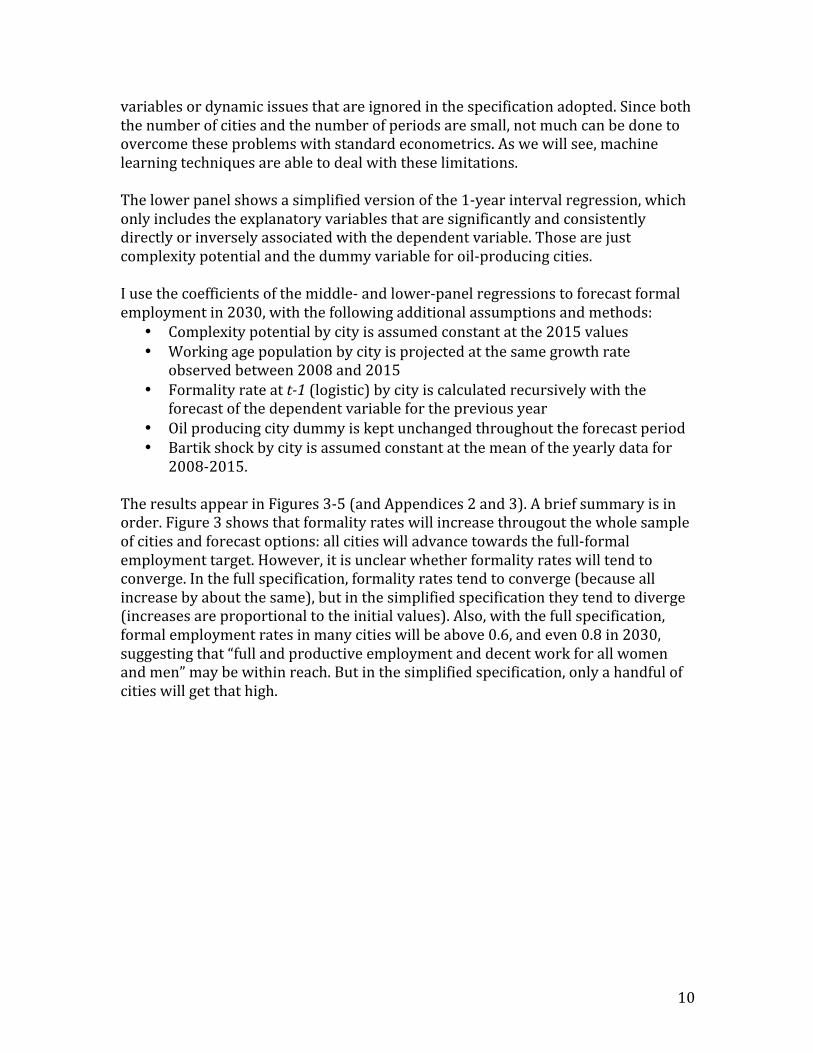
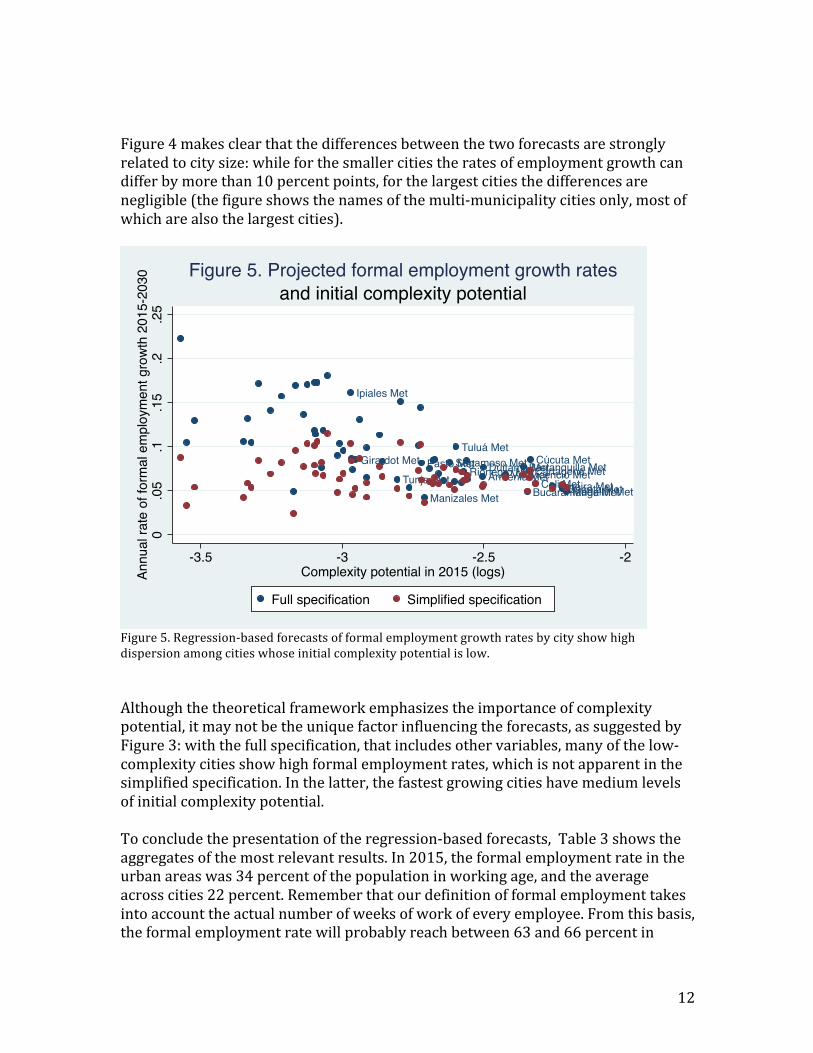
2008-2015.TheresultsappearinFigures3-5(andAppendices2and3).Abriefsummaryisinorder.Figure3showsthatformalityrateswillincreasethrougoutthewholesampleofcitiesandforecastoptions:allcitieswilladvancetowardsthefull-formalemploymenttarget.However,itisunclearwhetherformalityrateswilltendtoconverge.Inthefullspecification,formalityratestendtoconverge(becauseallincreasebyaboutthesame),butinthesimplifiedspecificationtheytendtodiverge(increasesareproportionaltotheinitialvalues).Also,withthefullspecification,formalemploymentratesinmanycitieswillbeabove0.6,andeven0.8in2030,suggestingthat“fullandproductiveemploymentanddecentworkforallwomenandmen”maybewithinreach.Butinthesimplifiedspecification,onlyahandfulofcitieswillgetthathigh.
11
Figure3.Regression-basedforecastsofformalemploymentbycityshowthatallcitieswouldmovetowardsfullemployment.Inthesimplifiedspecification,formalemploymentratestendtodiverge.
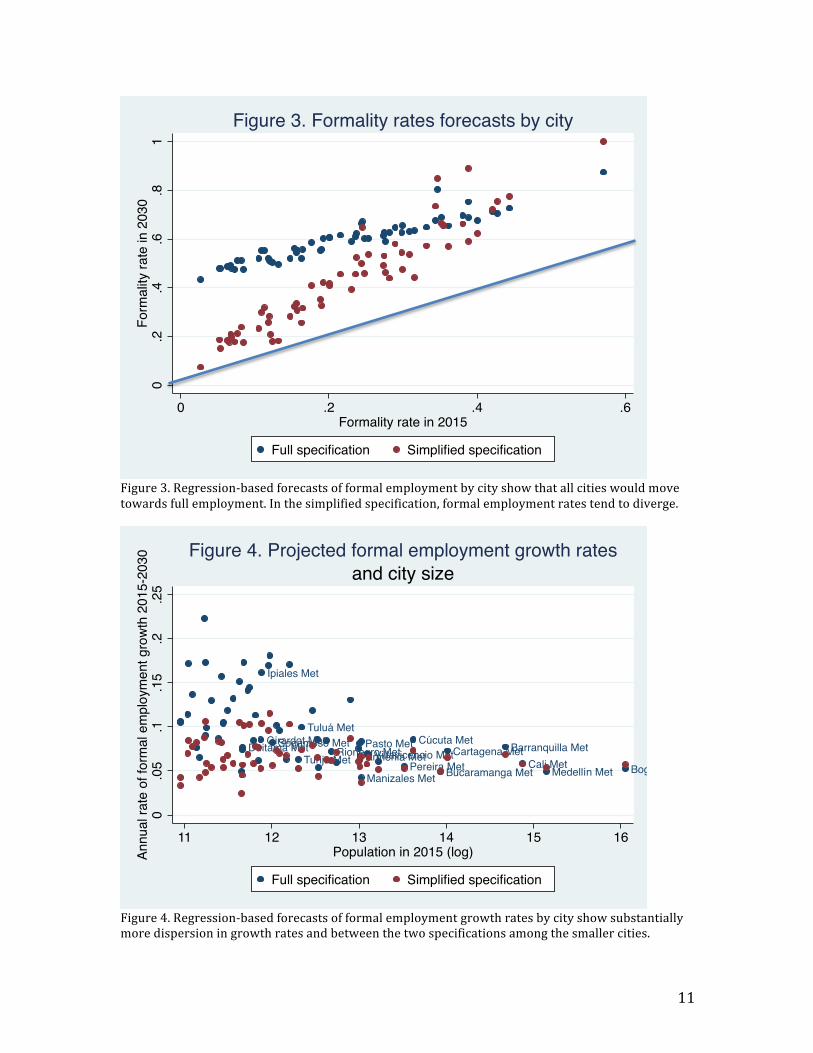
Figure4.Regression-basedforecastsofformalemploymentgrowthratesbycityshowsubstantiallymoredispersioningrowthratesandbetweenthetwospecificationsamongthesmallercities.
0.2
.4.6
.81
Form
ality
rate
in 2
030
0 .2 .4 .6Formality rate in 2015
Full specification Simplified specification
Figure 3. Formality rates forecasts by city
Medellín Met
Rionegro Met Barranquilla Met
Bogotá MetCartagena Met
Tunja MetDuitama MetSogamoso Met
Manizales Met
Girardot MetVillavicencio Met
Pasto Met
Ipiales Met
Cúcuta MetArmenia Met
Pereira MetBucaramanga MetCali Met
Tuluá Met
0.0
5.1
.15
.2.2
5An
nual
rate
of f
orm
al e
mpl
oym
ent g
row
th 2
015-
2030
11 12 13 14 15 16Population in 2015 (log)
Full specification Simplified specification
and city sizeFigure 4. Projected formal employment growth rates
12
Figure4makesclearthatthedifferencesbetweenthetwoforecastsarestronglyrelatedtocitysize:whileforthesmallercitiestheratesofemploymentgrowthcandifferbymorethan10percentpoints,forthelargestcitiesthedifferencesarenegligible(thefigureshowsthenamesofthemulti-municipalitycitiesonly,mostofwhicharealsothelargestcities).
Figure5.Regression-basedforecastsofformalemploymentgrowthratesbycityshowhighdispersionamongcitieswhoseinitialcomplexitypotentialislow.Althoughthetheoreticalframeworkemphasizestheimportanceofcomplexitypotential,itmaynotbetheuniquefactorinfluencingtheforecasts,assuggestedbyFigure3:withthefullspecification,thatincludesothervariables,manyofthelow-complexitycitiesshowhighformalemploymentrates,whichisnotapparentinthesimplifiedspecification.Inthelatter,thefastestgrowingcitieshavemediumlevelsofinitialcomplexitypotential.Toconcludethepresentationoftheregression-basedforecasts,Table3showstheaggregatesofthemostrelevantresults.In2015,theformalemploymentrateintheurbanareaswas34percentofthepopulationinworkingage,andtheaverageacrosscities22percent.Rememberthatourdefinitionofformalemploymenttakesintoaccounttheactualnumberofweeksofworkofeveryemployee.Fromthisbasis,theformalemploymentratewillprobablyreachbetween63and66percentin
Medellín Met
Rionegro MetBarranquilla Met
Bogotá MetCartagena Met
Tunja MetDuitama MetSogamoso Met
Manizales Met
Girardot MetVillavicencio Met
Pasto Met
Ipiales Met
Cúcuta MetArmenia Met
Pereira MetBucaramanga MetCali Met
Tuluá Met
0.0
5.1
.15
.2.2
5An
nual
rate
of f
orm
al e
mpl
oym
ent g
row
th 2
015-
2030
-3.5 -3 -2.5 -2Complexity potential in 2015 (logs)
Full specification Simplified specification
and initial complexity potentialFigure 5. Projected formal employment growth rates
13
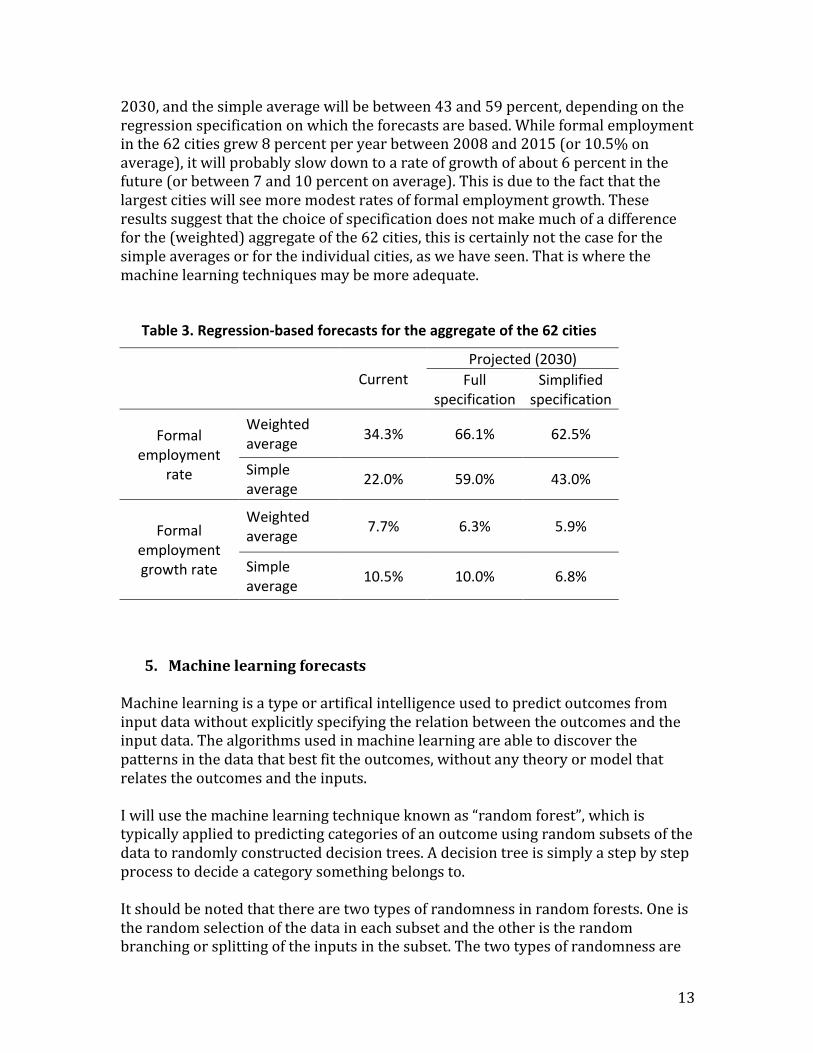
2030,andthesimpleaveragewillbebetween43and59percent,dependingontheregressionspecificationonwhichtheforecastsarebased.Whileformalemploymentinthe62citiesgrew8percentperyearbetween2008and2015(or10.5%onaverage),itwillprobablyslowdowntoarateofgrowthofabout6percentinthefuture(orbetween7and10percentonaverage).Thisisduetothefactthatthelargestcitieswillseemoremodestratesofformalemploymentgrowth.Theseresultssuggestthatthechoiceofspecificationdoesnotmakemuchofadifferenceforthe(weighted)aggregateofthe62cities,thisiscertainlynotthecaseforthesimpleaveragesorfortheindividualcities,aswehaveseen.Thatiswherethemachinelearningtechniquesmaybemoreadequate.
Table3.Regression-basedforecastsfortheaggregateofthe62cities
Current
Projected(2030)
Fullspecification
Simplifiedspecification
Formalemployment
rate
Weightedaverage 34.3% 66.1% 62.5%
Simpleaverage 22.0% 59.0% 43.0%
Formalemploymentgrowthrate
Weightedaverage 7.7% 6.3% 5.9%
Simpleaverage 10.5% 10.0% 6.8%
5. MachinelearningforecastsMachinelearningisatypeorartificalintelligenceusedtopredictoutcomesfrominputdatawithoutexplicitlyspecifyingtherelationbetweentheoutcomesandtheinputdata.Thealgorithmsusedinmachinelearningareabletodiscoverthepatternsinthedatathatbestfittheoutcomes,withoutanytheoryormodelthatrelatestheoutcomesandtheinputs.Iwillusethemachinelearningtechniqueknownas“randomforest”,whichistypicallyappliedtopredictingcategoriesofanoutcomeusingrandomsubsetsofthedatatorandomlyconstructeddecisiontrees.Adecisiontreeissimplyastepbystepprocesstodecideacategorysomethingbelongsto.Itshouldbenotedthattherearetwotypesofrandomnessinrandomforests.Oneistherandomselectionofthedataineachsubsetandtheotheristherandombranchingorsplittingoftheinputsinthesubset.Thetwotypesofrandomnessare
14
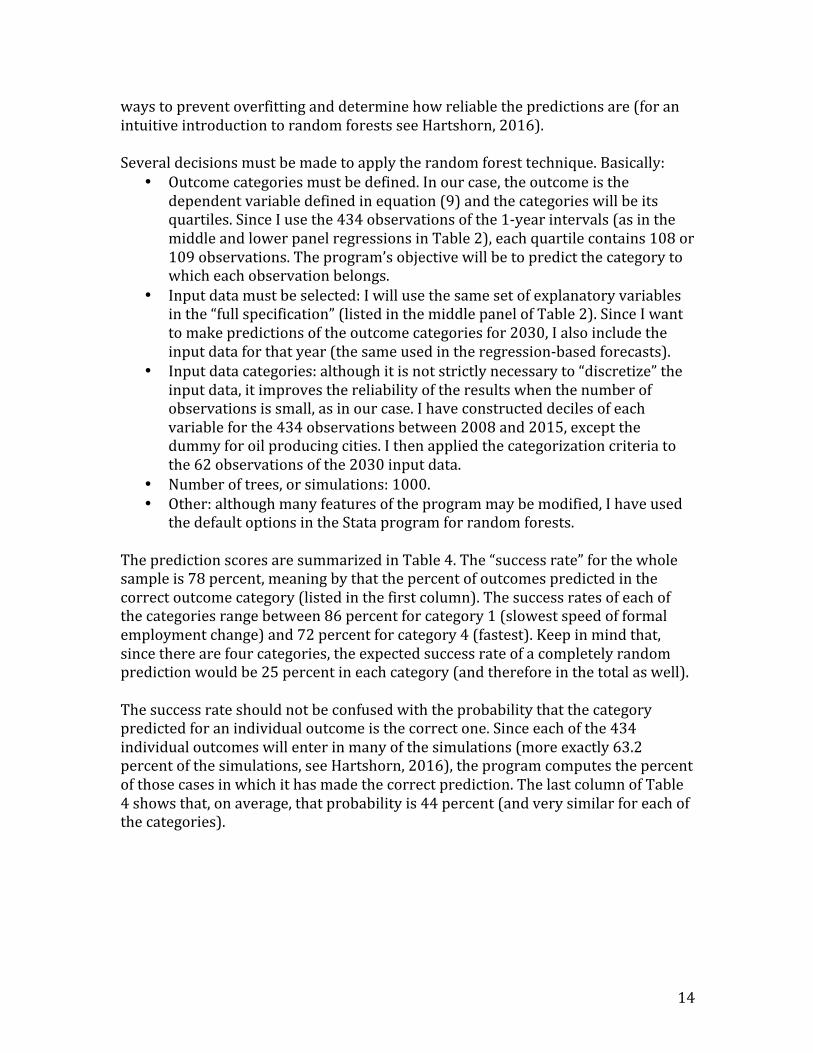
waystopreventoverfittinganddeterminehowreliablethepredictionsare(foranintuitiveintroductiontorandomforestsseeHartshorn,2016).Severaldecisionsmustbemadetoapplytherandomforesttechnique.Basically:
• Outcomecategoriesmustbedefined.Inourcase,theoutcomeisthedependentvariabledefinedinequation(9)andthecategorieswillbeitsquartiles.SinceIusethe434observationsofthe1-yearintervals(asinthemiddleandlowerpanelregressionsinTable2),eachquartilecontains108or109observations.Theprogram’sobjectivewillbetopredictthecategorytowhicheachobservationbelongs.
• Inputdatamustbeselected:Iwillusethesamesetofexplanatoryvariablesinthe“fullspecification”(listedinthemiddlepanelofTable2).SinceIwanttomakepredictionsoftheoutcomecategoriesfor2030,Ialsoincludetheinputdataforthatyear(thesameusedintheregression-basedforecasts).
• Inputdatacategories:althoughitisnotstrictlynecessaryto“discretize”theinputdata,itimprovesthereliabilityoftheresultswhenthenumberofobservationsissmall,asinourcase.Ihaveconstructeddecilesofeachvariableforthe434observationsbetween2008and2015,exceptthedummyforoilproducingcities.Ithenappliedthecategorizationcriteriatothe62observationsofthe2030inputdata.
• Numberoftrees,orsimulations:1000.• Other:althoughmanyfeaturesoftheprogrammaybemodified,Ihaveused
thedefaultoptionsintheStataprogramforrandomforests.ThepredictionscoresaresummarizedinTable4.The“successrate”forthewholesampleis78percent,meaningbythatthepercentofoutcomespredictedinthecorrectoutcomecategory(listedinthefirstcolumn).Thesuccessratesofeachofthecategoriesrangebetween86percentforcategory1(slowestspeedofformalemploymentchange)and72percentforcategory4(fastest).Keepinmindthat,sincetherearefourcategories,theexpectedsuccessrateofacompletelyrandompredictionwouldbe25percentineachcategory(andthereforeinthetotalaswell).Thesuccessrateshouldnotbeconfusedwiththeprobabilitythatthecategorypredictedforanindividualoutcomeisthecorrectone.Sinceeachofthe434individualoutcomeswillenterinmanyofthesimulations(moreexactly63.2percentofthesimulations,seeHartshorn,2016),theprogramcomputesthepercentofthosecasesinwhichithasmadethecorrectprediction.ThelastcolumnofTable4showsthat,onaverage,thatprobabilityis44percent(andverysimilarforeachofthecategories).
15
Table4.Scoresummaryofmachinelearningpredictions
Annualspeedtowardsfullemploymentcategory
Falselypredicted
Correctlypredicted
Totalnumberof
cases
Successrate
Meanprobabilityofthecorrect
predictions
1=Lessthan0.05pp 15 94 109 86% 46%
2=Between0.05and0.28pp 28 80 108 74% 40%
3=Between0.28and0.54pp 24 85 109 78% 42%
4=Morethan0.54pp 30 78 108 72% 48%
Total 97 337 434 78% 44%
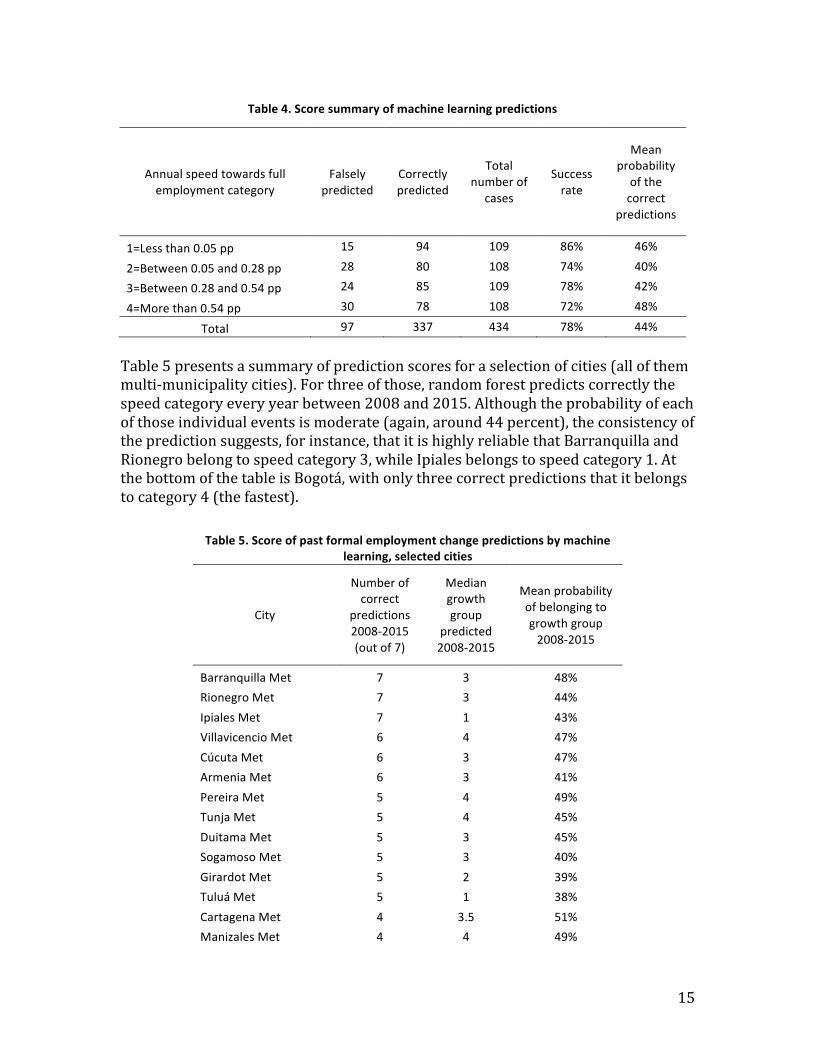
Table5presentsasummaryofpredictionscoresforaselectionofcities(allofthemmulti-municipalitycities).Forthreeofthose,randomforestpredictscorrectlythespeedcategoryeveryyearbetween2008and2015.Althoughtheprobabilityofeachofthoseindividualeventsismoderate(again,around44percent),theconsistencyofthepredictionsuggests,forinstance,thatitishighlyreliablethatBarranquillaandRionegrobelongtospeedcategory3,whileIpialesbelongstospeedcategory1.AtthebottomofthetableisBogotá,withonlythreecorrectpredictionsthatitbelongstocategory4(thefastest).
Table5.Scoreofpastformalemploymentchangepredictionsbymachinelearning,selectedcities
City
Numberofcorrect
predictions2008-2015(outof7)
Mediangrowthgroup
predicted2008-2015
Meanprobabilityofbelongingtogrowthgroup2008-2015
BarranquillaMet 7 3 48%RionegroMet 7 3 44%IpialesMet 7 1 43%VillavicencioMet 6 4 47%CúcutaMet 6 3 47%ArmeniaMet 6 3 41%PereiraMet 5 4 49%TunjaMet 5 4 45%DuitamaMet 5 3 45%SogamosoMet 5 3 40%GirardotMet 5 2 39%TuluáMet 5 1 38%CartagenaMet 4 3.5 51%ManizalesMet 4 4 49%
16
MedellínMet 4 4 48%CaliMet 4 3.5 44%BucaramangaMet 4 4 43%BogotáMet 3 4 45%
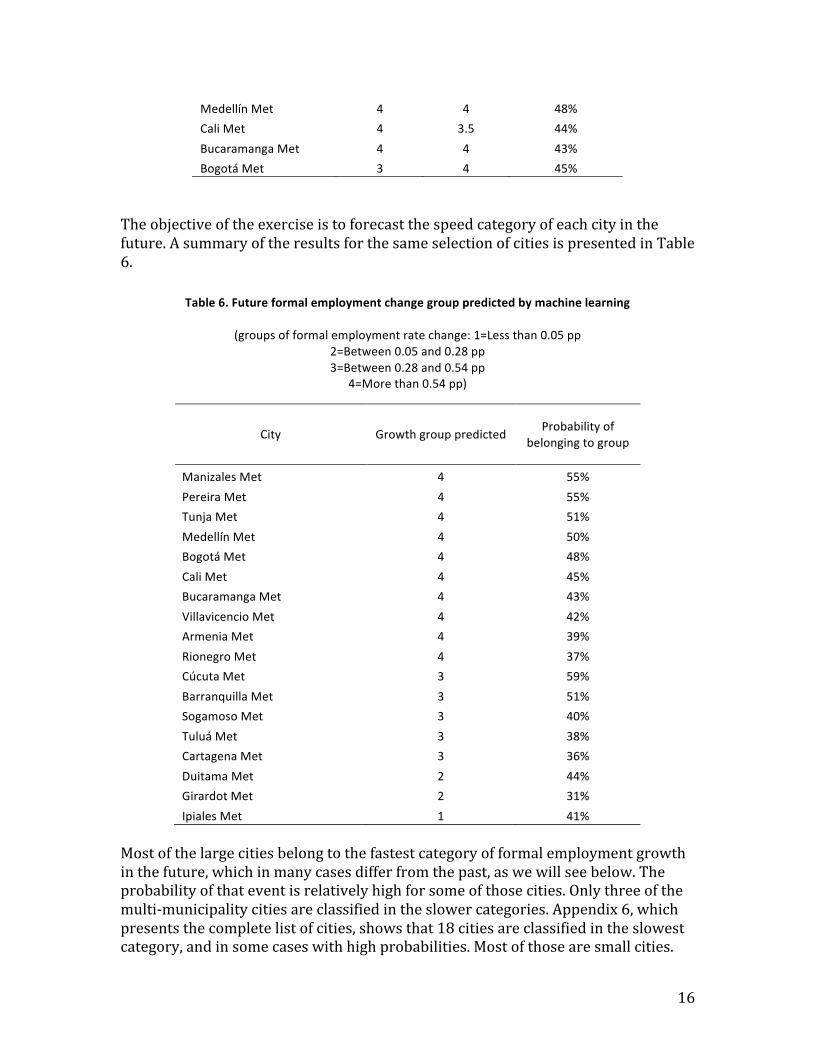
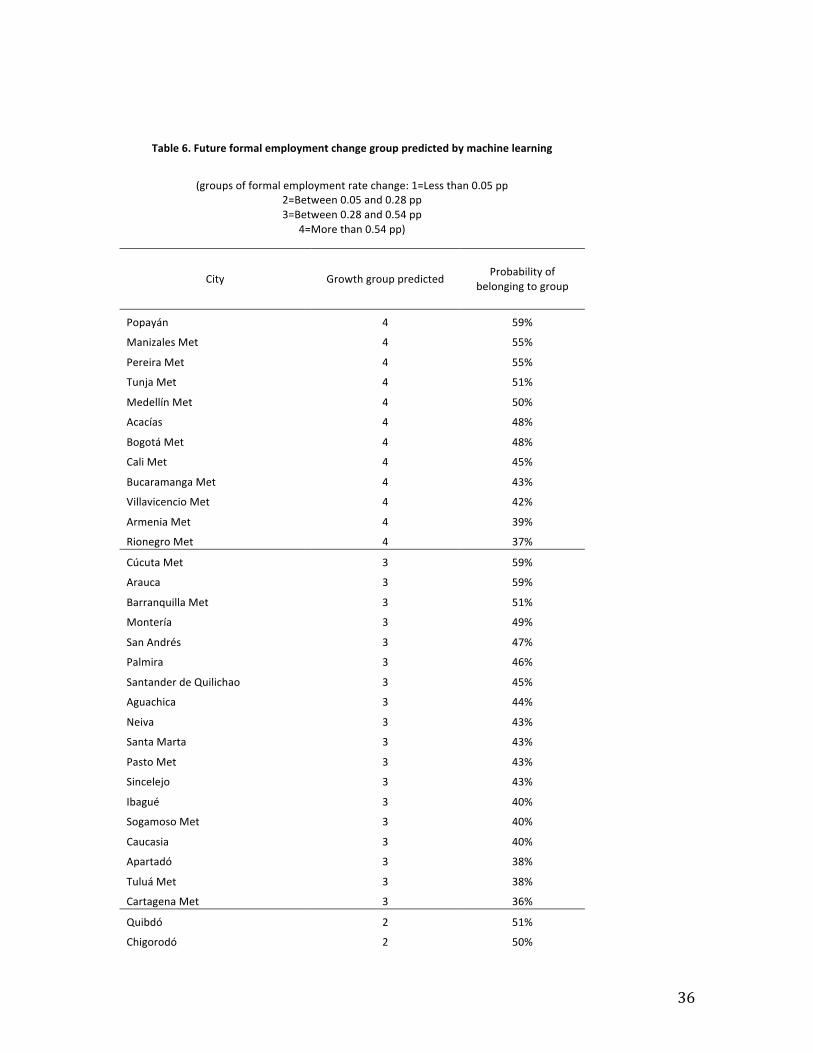
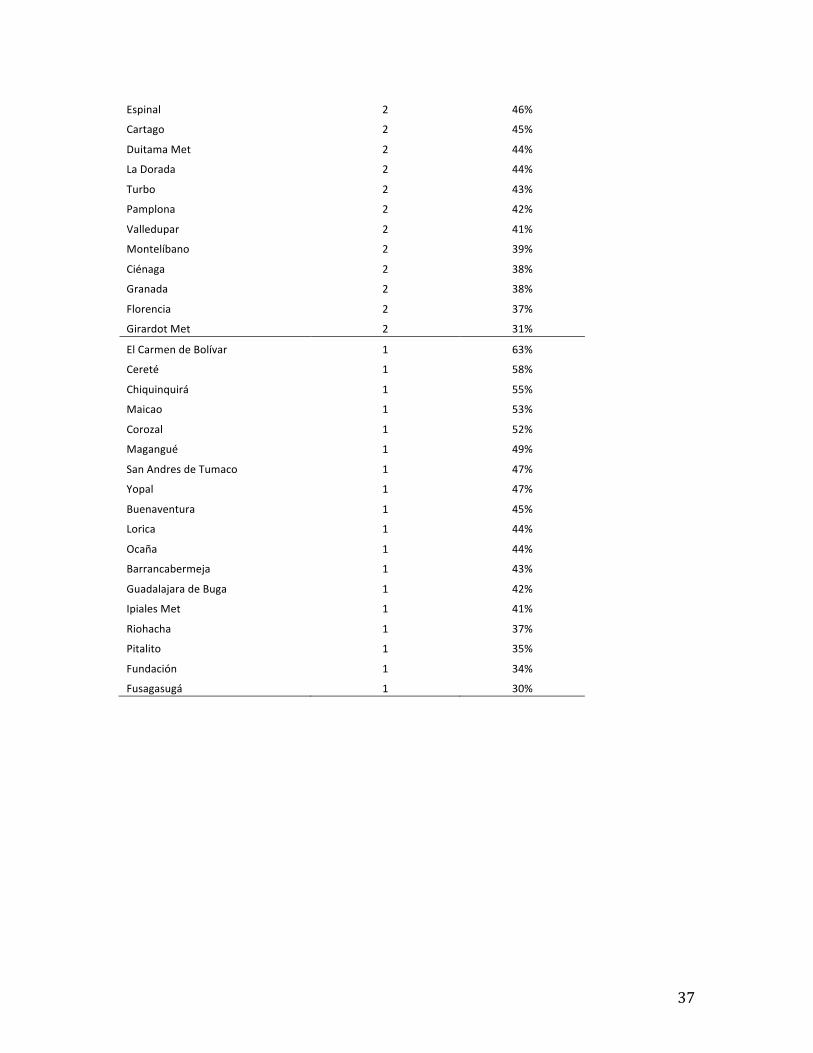
Theobjectiveoftheexerciseistoforecastthespeedcategoryofeachcityinthefuture.AsummaryoftheresultsforthesameselectionofcitiesispresentedinTable6.
Table6.Futureformalemploymentchangegrouppredictedbymachinelearning
(groupsofformalemploymentratechange:1=Lessthan0.05pp2=Between0.05and0.28pp3=Between0.28and0.54pp
4=Morethan0.54pp)
City Growthgrouppredicted Probabilityofbelongingtogroup
ManizalesMet 4 55%PereiraMet 4 55%TunjaMet 4 51%MedellínMet 4 50%BogotáMet 4 48%CaliMet 4 45%BucaramangaMet 4 43%VillavicencioMet 4 42%ArmeniaMet 4 39%RionegroMet 4 37%CúcutaMet 3 59%BarranquillaMet 3 51%SogamosoMet 3 40%TuluáMet 3 38%CartagenaMet 3 36%DuitamaMet 2 44%GirardotMet 2 31%IpialesMet 1 41%
Mostofthelargecitiesbelongtothefastestcategoryofformalemploymentgrowthinthefuture,whichinmanycasesdifferfromthepast,aswewillseebelow.Theprobabilityofthateventisrelativelyhighforsomeofthosecities.Onlythreeofthemulti-municipalitycitiesareclassifiedintheslowercategories.Appendix6,whichpresentsthecompletelistofcities,showsthat18citiesareclassifiedintheslowestcategory,andinsomecaseswithhighprobabilities.Mostofthosearesmallcities.
17
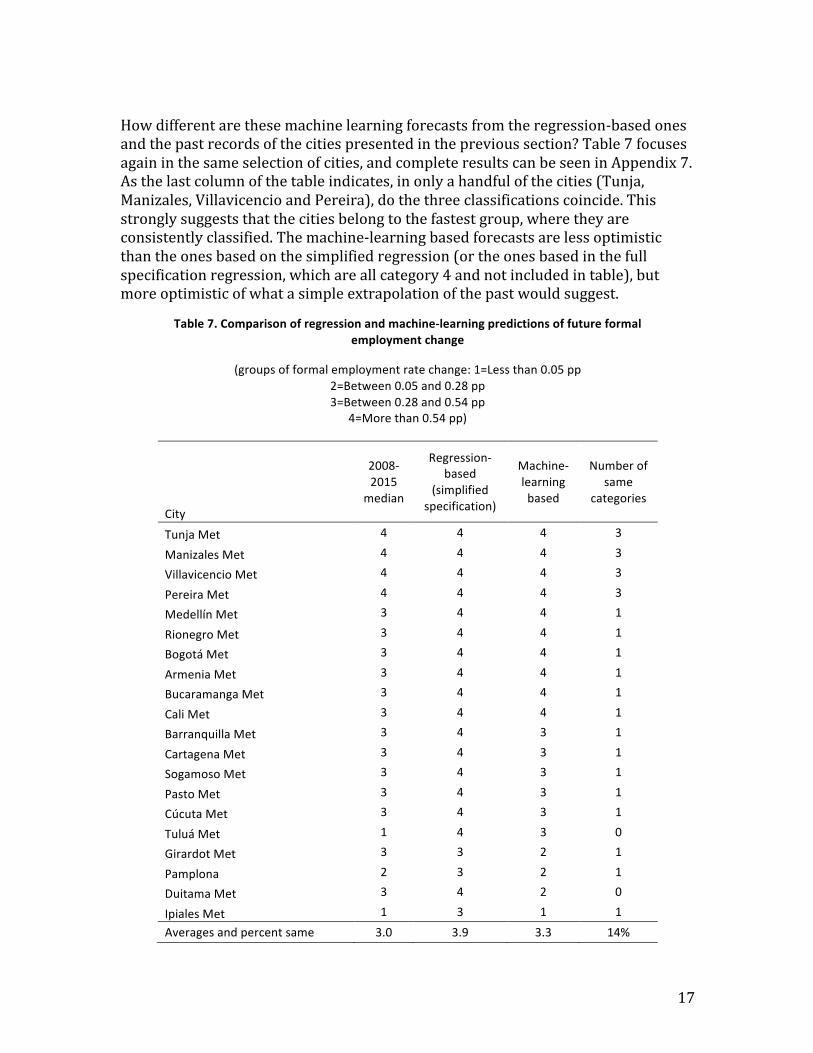
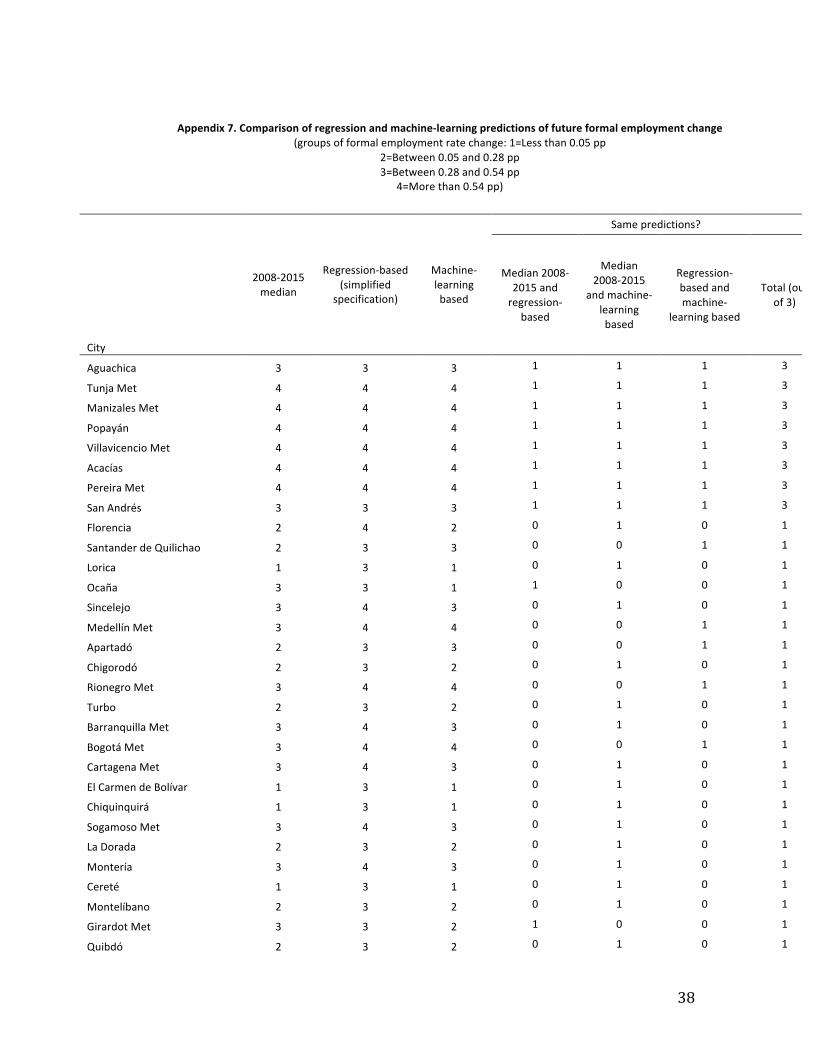
Howdifferentarethesemachinelearningforecastsfromtheregression-basedonesandthepastrecordsofthecitiespresentedintheprevioussection?Table7focusesagaininthesameselectionofcities,andcompleteresultscanbeseeninAppendix7.Asthelastcolumnofthetableindicates,inonlyahandfulofthecities(Tunja,Manizales,VillavicencioandPereira),dothethreeclassificationscoincide.Thisstronglysuggeststhatthecitiesbelongtothefastestgroup,wheretheyareconsistentlyclassified.Themachine-learningbasedforecastsarelessoptimisticthantheonesbasedonthesimplifiedregression(ortheonesbasedinthefullspecificationregression,whichareallcategory4andnotincludedintable),butmoreoptimisticofwhatasimpleextrapolationofthepastwouldsuggest.
Table7.Comparisonofregressionandmachine-learningpredictionsoffutureformalemploymentchange
(groupsofformalemploymentratechange:1=Lessthan0.05pp2=Between0.05and0.28pp3=Between0.28and0.54pp
4=Morethan0.54pp)
2008-2015
median
Regression-based
(simplifiedspecification)
Machine-learningbased
Numberofsame
categoriesCity
TunjaMet 4 4 4 3
ManizalesMet 4 4 4 3
VillavicencioMet 4 4 4 3
PereiraMet 4 4 4 3
MedellínMet 3 4 4 1
RionegroMet 3 4 4 1
BogotáMet 3 4 4 1
ArmeniaMet 3 4 4 1
BucaramangaMet 3 4 4 1
CaliMet 3 4 4 1
BarranquillaMet 3 4 3 1
CartagenaMet 3 4 3 1
SogamosoMet 3 4 3 1
PastoMet 3 4 3 1
CúcutaMet 3 4 3 1
TuluáMet 1 4 3 0
GirardotMet 3 3 2 1
Pamplona 2 3 2 1
DuitamaMet 3 4 2 0
IpialesMet 1 3 1 1Averagesandpercentsame 3.0 3.9 3.3 14%
18
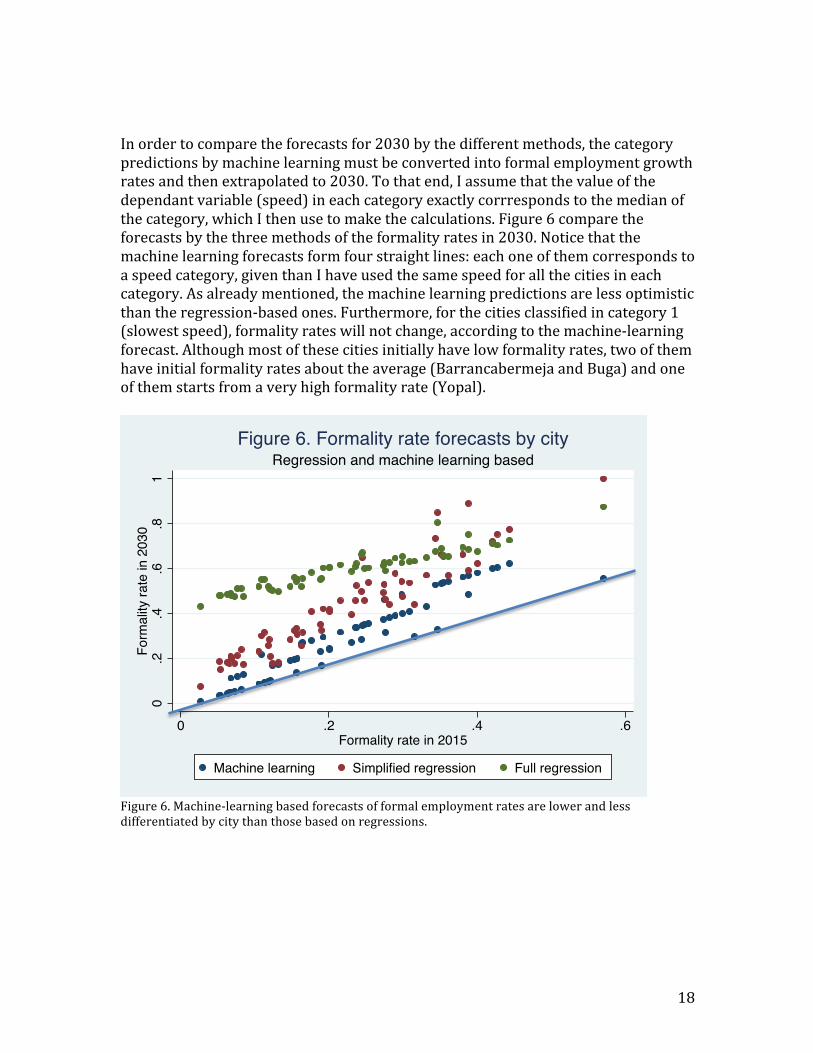
Inordertocomparetheforecastsfor2030bythedifferentmethods,thecategorypredictionsbymachinelearningmustbeconvertedintoformalemploymentgrowthratesandthenextrapolatedto2030.Tothatend,Iassumethatthevalueofthedependantvariable(speed)ineachcategoryexactlycorrrespondstothemedianofthecategory,whichIthenusetomakethecalculations.Figure6comparetheforecastsbythethreemethodsoftheformalityratesin2030.Noticethatthemachinelearningforecastsformfourstraightlines:eachoneofthemcorrespondstoaspeedcategory,giventhanIhaveusedthesamespeedforallthecitiesineachcategory.Asalreadymentioned,themachinelearningpredictionsarelessoptimisticthantheregression-basedones.Furthermore,forthecitiesclassifiedincategory1(slowestspeed),formalityrateswillnotchange,accordingtothemachine-learningforecast.Althoughmostofthesecitiesinitiallyhavelowformalityrates,twoofthemhaveinitialformalityratesabouttheaverage(BarrancabermejaandBuga)andoneofthemstartsfromaveryhighformalityrate(Yopal).
Figure6.Machine-learningbasedforecastsofformalemploymentratesarelowerandlessdifferentiatedbycitythanthosebasedonregressions.
0.2
.4.6
.81
Form
ality
rate
in 2
030
0 .2 .4 .6Formality rate in 2015
Machine learning Simplified regression Full regression
Regression and machine learning basedFigure 6. Formality rate forecasts by city
19
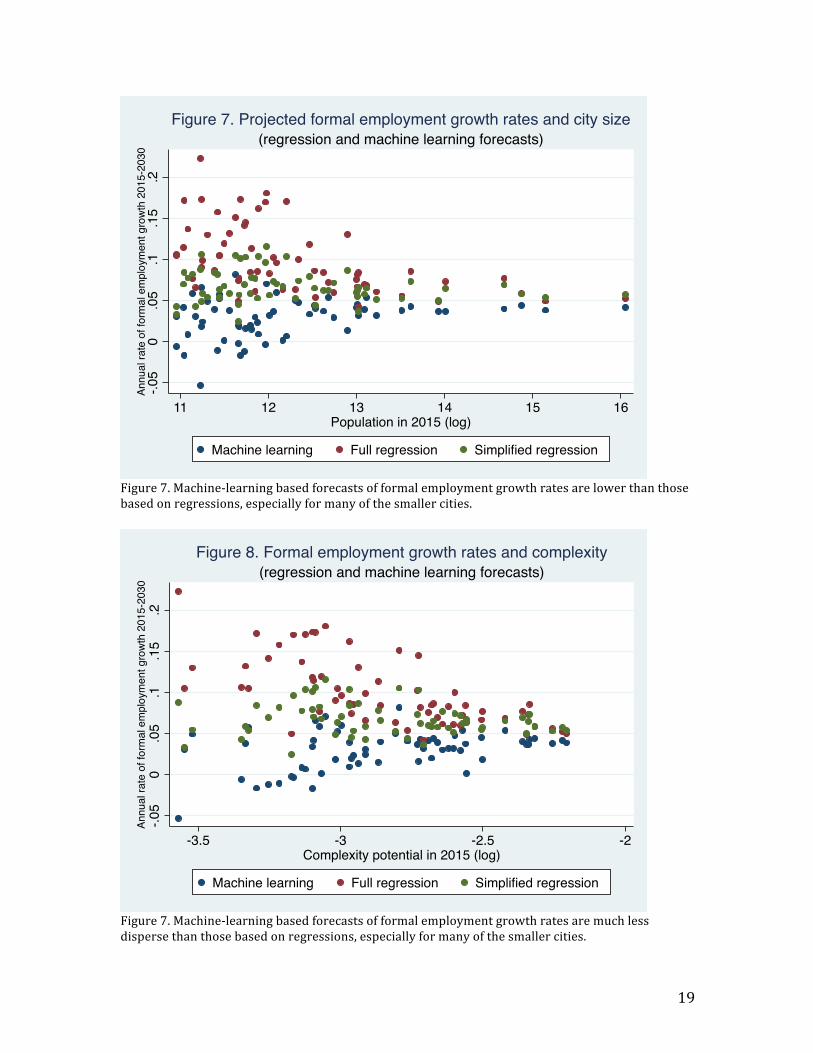
Figure7.Machine-learningbasedforecastsofformalemploymentgrowthratesarelowerthanthosebasedonregressions,especiallyformanyofthesmallercities.
Figure7.Machine-learningbasedforecastsofformalemploymentgrowthratesaremuchlessdispersethanthosebasedonregressions,especiallyformanyofthesmallercities.
-.05
0.0
5.1
.15
.2An
nual
rate
of f
orm
al e
mpl
oym
ent g
row
th 2
015-
2030
11 12 13 14 15 16Population in 2015 (log)
Machine learning Full regression Simplified regression
(regression and machine learning forecasts)Figure 7. Projected formal employment growth rates and city size
-.05
0.0
5.1
.15
.2An
nual
rate
of f
orm
al e
mpl
oym
ent g
row
th 2
015-
2030
-3.5 -3 -2.5 -2Complexity potential in 2015 (log)
Machine learning Full regression Simplified regression
(regression and machine learning forecasts)Figure 8. Formal employment growth rates and complexity
20
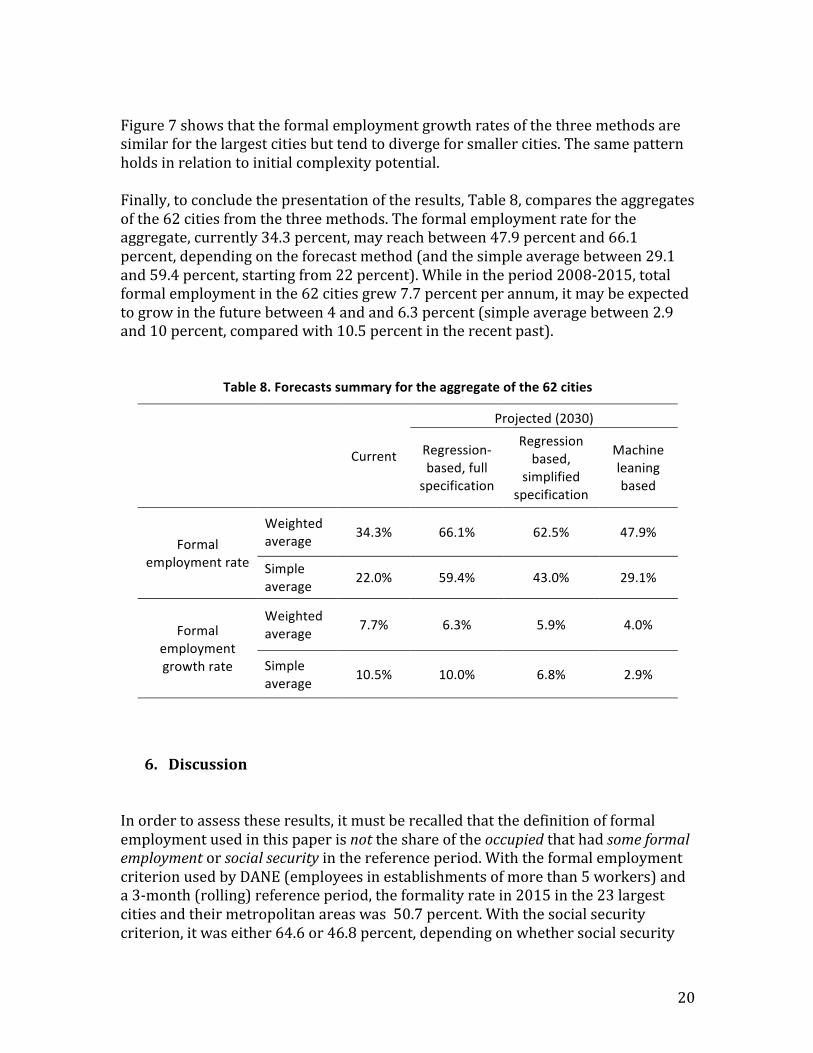
Figure7showsthattheformalemploymentgrowthratesofthethreemethodsaresimilarforthelargestcitiesbuttendtodivergeforsmallercities.Thesamepatternholdsinrelationtoinitialcomplexitypotential.Finally,toconcludethepresentationoftheresults,Table8,comparestheaggregatesofthe62citiesfromthethreemethods.Theformalemploymentratefortheaggregate,currently34.3percent,mayreachbetween47.9percentand66.1percent,dependingontheforecastmethod(andthesimpleaveragebetween29.1and59.4percent,startingfrom22percent).Whileintheperiod2008-2015,totalformalemploymentinthe62citiesgrew7.7percentperannum,itmaybeexpectedtogrowinthefuturebetween4andand6.3percent(simpleaveragebetween2.9and10percent,comparedwith10.5percentintherecentpast).
Table8.Forecastssummaryfortheaggregateofthe62cities
Current
Projected(2030)
Regression-based,fullspecification
Regressionbased,
simplifiedspecification
Machineleaningbased
Formalemploymentrate
Weightedaverage 34.3% 66.1% 62.5% 47.9%
Simpleaverage 22.0% 59.4% 43.0% 29.1%
Formalemploymentgrowthrate
Weightedaverage 7.7% 6.3% 5.9% 4.0%
Simpleaverage 10.5% 10.0% 6.8% 2.9%
6. Discussion
Inordertoassesstheseresults,itmustberecalledthatthedefinitionofformalemploymentusedinthispaperisnottheshareoftheoccupiedthathadsomeformalemploymentorsocialsecurityinthereferenceperiod.WiththeformalemploymentcriterionusedbyDANE(employeesinestablishmentsofmorethan5workers)anda3-month(rolling)referenceperiod,theformalityratein2015inthe23largestcitiesandtheirmetropolitanareaswas50.7percent.Withthesocialsecuritycriterion,itwaseither64.6or46.8percent,dependingonwhethersocialsecurity
21
affiliationreferstohealthorpensions.Inanyofthesedefinitions,thereisonlyonemarginthroughwhichtheformalityratemayincrease,whichisthestatus(eitherformalorinformal)oftheoccupied.Inmydefinition,therearefourmargins,ascanbeseeninthisexpression,whichisanexpansionofequation(7):𝐹!,! =
!"#!,!!"!!,!
= !"#!,! !"#$%#&!,!
∗ !"#$%#&!,!!""#$%&'!,!
∗ !""#$%&'!,!!"#$%&$%'(!,!
∗ !"#$%&$%'(!,!!"!!,!
(9)𝐹!,! =
!"#!,!!"!!,!
= 𝑤𝑜𝑟𝑘 𝑖𝑛𝑡𝑒𝑠𝑖𝑡𝑦 𝑟𝑎𝑡𝑒!,! ∗ 𝑜𝑓𝑓𝑖𝑐𝑖𝑎𝑙 𝑓𝑜𝑟𝑚𝑎𝑙𝑖𝑡𝑦 𝑟𝑎𝑡𝑒!,! ∗ 1 − 𝑢𝑛𝑒𝑚𝑝𝑙𝑜𝑦𝑚𝑒𝑛𝑡 𝑟𝑎𝑡𝑒!,! ∗
𝑝𝑎𝑟𝑡𝑖𝑐𝑖𝑝𝑎𝑡𝑖𝑜𝑛 𝑟𝑎𝑡𝑒!,! (10)wheretheworkintensityrateistheshareoftheyeartthatworkersonaverageeffectivelycontributetothesocialsecuritysystem,givenmydefinitionof𝑒𝑚𝑝!,! .Myformalemploymentrateandtheofficialformalityratewouldmoveproportionallyaslongasthethreeothermarginsremainunchanged.Ifso,theofficialformalityratewouldgoupfromarangebetween46.8and64.6percent,aswehavejustseen,toarangebetween65.3percentand90.2percentinthemachine-learningbasedforecast.Butthisconclusionisunwarrantedbecause,althoughIhavenotexplicitlymodelledthethreeothermargins(ietheworkintensity,theunemploymentandtheparticipationmargins)theyareimplicitlyconsideredintheforecastsanditwouldnotbereasonabletoexpectsubstantialincreasesintheofficialformalityratewithoutincreasesintheotherrates.Asarguedbefore,theofficialdefinitionsof(in)formalityarenotadequatetoassessthefeasibilityofthesustainabledevelopmentgoalof“fullandproductiveemploymentanddecentworkforallwomenandmen”.Mydefinitionismuchbettersuitedtothisend.Beingso,itisabundantlyclearfromtheforecaststhatreachingthefullemploymentgoalliesmuchfurtherinthefuturethan2030.Thisdoesnotcontradictthefindingthat,mostlikely,formalityrateswillincreaseinmostifnotallColombiancitieslargerthan50,000inhabitants.Also,itdoesnotdenythatthedifferentforecastmethodsconsistentlyindicatethattheformalemploymentgrowthratesinthelargestcitieswillbeabout5percent.However,thereismuchlessconsistencyinthepredictionsforthemid-sizeandsmallercities,manyofwhicharenotveryoptimistic.Giventhelimitationsoftheregression-basedforecasts,themachine-learningbasedoneshouldbegivenseriousconsideration.Themainstrengthofthelatterliesnotinitsabilitytopredictaggregates,butinallthenuancesitprovideswithrespecttotheindividualpredictions.Forsomeofthesmallercities(suchasCarmendeBolívarandChiquinquirá),itpredictswithconfidencethatformalemploymentrateswillstagnateattheirlowinitiallevel,contrarytowhatthefullspecificationregressionwouldsuggest.Inothercases(suchasTunjaandPopayán),itstronglypredictsafastprocessoflaborformalization,consistentwiththestillincipientpasttendencies,butalsowiththepredictionsbasedonregressions.Yetinothers,thepredictionsnot

22
onlydifferwidelyacrossmethods,butthosebymachine-learningarestatisticallyweak(Fusagasugá,Tulúa).Asarguedinthetheoreticalsectionandshownintheregressionresults,complexitypotentialisthestrongestandmostconsistentpredictorofformalemploymentratechangesincities.However,themachine-learningmethodsuggeststhattherelationbetweenthetwovariablesislessstraightforwardthanassumedintheregression-basedmethods.Furtherresearchisneededtounderstandhowtheabilityofcitiestomakeuseoftheirskillmixindevelopingnewindustriesmaybeaffectedbyurbanfeaturessuchasdensity,availabilityoftransportationmeans,women’saccesstoworkplaces,etc.
23
ReferencesAlbrecht, James, Lucas Navarro, and Susan Vroman. 2009. “The effects of LabourMarket
PoliciesinanEconomywithanInformalSector”.EconomicJournal,119(539):1105-29.
Bosch, Mariano, and William F. Maloney. 2010. “Comparative analysis of labor marketdynamicsusingMarkovprocesses:Anapplicationtoinformality”.LabourEconomics,17(4):621-31.
DeSoto,Hernando.1989.TheOtherPath:TheInvisibleRevolutionintheThirdWorld.NewYork:HarperandRow.
_______________.2000.TheMysteryofCapital:WhyCapitalismTriumphsintheWestandFailsEverywhereElse.NewYork:BasicBooks.
Duranton, Gilles. 2015. Delineating Metropolitan Areas: Measuring Spatial LabourMarketNetworksThroughCommutingPatterns. In:WatanabeT.,Uesugi I.,OnoA.(eds)TheEconomicsofInterfirmNetworks.AdvancesinJapaneseBusinessandEconomics,vol4.Springer,Tokyo.
Gollin, D., Jedwab, R. & Vollrath D., “Urbanizationwith andwithout Industrialization”,Journal of Economic Growth (2016) 21: 35. https://doi-org.ezp-prod1.hul.harvard.edu/10.1007/s10887-015-9121-4
Harris,JohnR.,andMichaelP.Todaro.1970.“Migration,Unemployment,andDevelopment:ATwo-SectorAnalysis.”AmericanEconomicReview60(1):126–42.
Hartshorn,Scott.MachineLearningWithRandomForestsAndDecisionTrees:AVisualGuideForBeginners.KindleEdition,2016.
Hidalgo,CésarandRicardoHausmann2009.“TheBuildingBlocksofEconomicComplexity”,Proceedings of the National Academy of Sciences,106(26):10570-5.DOI:10.1073/pnas.0900943106.
Kugler,Adriana,MauriceD.KuglerandLuisO.Herrera-Prada.2017."DoPayrollTaxBreaksStimulate Formality? Evidence from Colombia’s Reform,"Economia, Journal of theLatinAmericanandCaribbeanEconomicAssociation,Fall2017:3-40.
Levy,Santiago.2008.GoodIntentions,BadOutcomes:SocialPolicy,Informality,andEconomicGrowthinMexico.BrookingsInstitutionPress.
Lewis, W. Arthur. 1954. “Economic Development with Unlimited Supplies of Labor.”ManchesterSchoolofEconomicandSocialStudies22(2):139–91.
McGuire,T.J.,Bartik,T.J.,1991.WhobenefitsFromstateandlocaleconomicdevelopmentpolicies?JSTOR.
Meghir, Costas, Renata Narita, and Jean-Marc Robin. 2015. “Wages and Informality inDevelopingCountries”.AmericanEconomicReview,105:1509-46.
Neffke, Frank and Martin Henning. 2013. “Skill Relatedness and Firm Diversification”,StrategicManagementJournal,34(3):297-316
O’Clery, N., Chaparro, J.C., Gómez-Liévano, A., *Lora, E. 2019. “Skill Diversity and theEvolutionofFormalEmploymentinCities”,submittedtoResearchPolicy.
Rauch, James E. 1991. “Modeling the Informal Sector Formally.” Journal of DevelopmentEconomics35(1):33–47.
Ulyssea, Gabriel. 2010. “Regulation of entry, labor market institutions and the informalsector”.JournalofDevelopmentEconomics,91(1):87-99.
24
Appendix1-CalculationMethodsforIndustryComplexityThisappendixexplainsthemethodsforcalculatingtheindustrycomplexityvariableintroducedattheendofSection2.ItisadaptedfromHidalgoandHausmann(2009)andNeffke andHenning (2013). The actual calculations used formal employmentdataofallindustriesproducingeithergoodsorservices(ISIC-AC,Rev.3,at4digits,usingsocialsecuritydatafromPILA).Intheequationsbelow,thesub-indexcindicatescitiesandthesub-indexpindicatesindustries.Whilenotimesub-indexisusedhere,allcalculationsareappliedforeachyearseparately(2008-2015).CalculationofRevealedComparativeAdvantagesThe computation starts with data for employment by industry, city and year,organizedinmatrixform:
𝑋!"Fromthismatrix,thefollowingaggregatesarecomputed:
𝑋! = 𝑋!"!
𝑋! = 𝑋!"
!
𝑋 = 𝑋!"
!!
ThesemetricsareusedtocalculatetheRevealedComparativeAdvantage(RCA)foreachcity/industrycombination:
𝑅𝐶𝐴!" =𝑋!" 𝑋!𝑋! 𝑋
DiversityandUbiquityCalculationsThe RCA matrix is transformed in a binary matrix depending on whether aparticularvalueislargerthan1ornot:
25
𝑀!" =1 𝑅𝐶𝐴!" ≥ 1
0 𝑅𝐶𝐴!" < 1
Thismatrixindicatestheindustriesthatarerelativelylargeineachcity.Thismatrixis thenused to compute theDiversity indicator at the city level, and theUbiquityindicatorat the industry level–that is, thecountof thenumberof industrieswithrelatively large employment for each city, and the count of the cities that have agivenindustrywitharelativelyhighintensity:
𝑘!,! = 𝑀!"!
𝑘!,! = 𝑀!"!
IndustryEconomicComplexityThe complexity of an industry can be measured by its ubiquity weighed by thediversity of the localities that have revealed comparative advantage in suchindustry.Extendingthisexerciseadinfinitum,correctingdiversitywithubiquityandvice-versawith consecutive iterations, is called themethodofreflections. It canbeexpressedasfollows:
𝑘!,! =1𝑘!,!
𝑀!"!
1𝑘!,!
𝑀!!!𝑘!!,!!!!!
= 𝑘!!,!!!!!
𝑀!!!𝑀!"
𝑘!,! 𝑘!,!!
= 𝑘!!,!!!
!!𝑀!,!!!
Where:
𝑀!,!!! ≡
𝑀!!!𝑀!!
𝑘!,! 𝑘!,!!
Usingvectornotation,thecalculationmethodcanbewritteninacompactmanneras:
𝒌𝒏 = 𝑴𝑪×𝒌𝒏!𝟐when𝑛 → ∞,thefollowingexpressionobtains:
26
𝑴𝑪×𝒌 = 𝝀𝒌Where𝒌isaneigenvectorof𝑴𝑪.Thesecondlargesteigenvectorof𝑴!istakenastheIndustryComplexityIndex.TheIndex iscalculatedonemployment levelsper industry/citycombination, includingonly industrieswith at least 50 formal employees in an averagemonth, and onlycitieswithatleast10industrieswith50ormoreformalemployees.
27
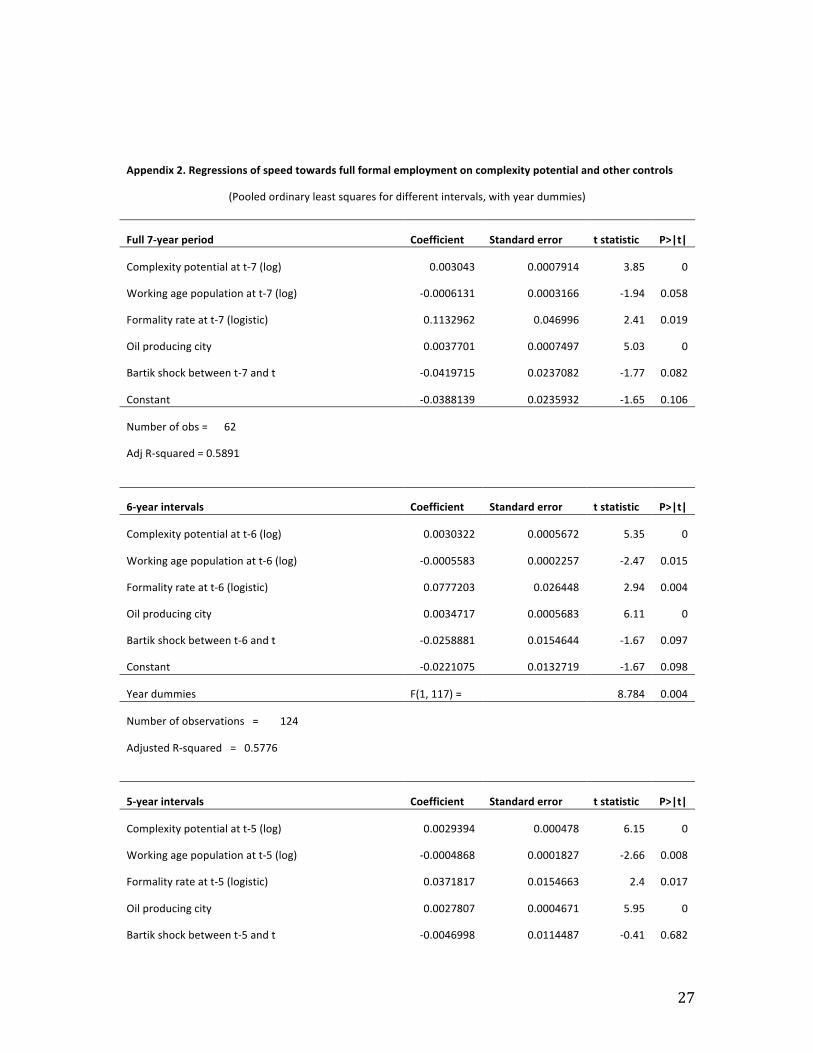
Appendix2.Regressionsofspeedtowardsfullformalemploymentoncomplexitypotentialandothercontrols
(Pooledordinaryleastsquaresfordifferentintervals,withyeardummies)
Full7-yearperiod Coefficient Standarderror tstatistic P>|t|
Complexitypotentialatt-7(log) 0.003043 0.0007914 3.85 0
Workingagepopulationatt-7(log) -0.0006131 0.0003166 -1.94 0.058
Formalityrateatt-7(logistic) 0.1132962 0.046996 2.41 0.019
Oilproducingcity 0.0037701 0.0007497 5.03 0
Bartikshockbetweent-7andt -0.0419715 0.0237082 -1.77 0.082
Constant -0.0388139 0.0235932 -1.65 0.106
Numberofobs=62
AdjR-squared=0.5891
6-yearintervals Coefficient Standarderror tstatistic P>|t|
Complexitypotentialatt-6(log) 0.0030322 0.0005672 5.35 0
Workingagepopulationatt-6(log) -0.0005583 0.0002257 -2.47 0.015
Formalityrateatt-6(logistic) 0.0777203 0.026448 2.94 0.004
Oilproducingcity 0.0034717 0.0005683 6.11 0
Bartikshockbetweent-6andt -0.0258881 0.0154644 -1.67 0.097
Constant -0.0221075 0.0132719 -1.67 0.098
Yeardummies F(1,117)= 8.784 0.004
Numberofobservations=124
AdjustedR-squared=0.5776
5-yearintervals Coefficient Standarderror tstatistic P>|t|
Complexitypotentialatt-5(log) 0.0029394 0.000478 6.15 0
Workingagepopulationatt-5(log) -0.0004868 0.0001827 -2.66 0.008
Formalityrateatt-5(logistic) 0.0371817 0.0154663 2.4 0.017
Oilproducingcity 0.0027807 0.0004671 5.95 0
Bartikshockbetweent-5andt -0.0046998 0.0114487 -0.41 0.682
28
Constant -0.0031799 0.007911 -0.4 0.688
Yeardummies F(2,178)= 2.3 0.103
Numberofobservations=186
AdjustedR-squared=0.5334
4-yearintervals Coefficient Standarderror tstatistic P>|t|
Complexitypotentialatt-4(log) 0.0029197 0.0004596 6.35 0
Workingagepopulationatt-4(log) -0.0004501 0.0001706 -2.64 0.009
Formalityrateatt-4(logistic) 0.0158137 0.0133056 1.19 0.236
Oilproducingcity 0.0022181 0.0004436 5 0
Bartikshockbetweent-4andt 0.0154851 0.0119289 1.3 0.195
Constant 0.0070455 0.0069345 1.02 0.311
Yeardummies F(3,239)= 6.548 0
Numberofobservations=248
AdjustedR-squared=0.514
3-yearintervals Coefficient Standarderror tstatistic P>|t|
Complexitypotentialatt-3(log) 0.0029632 0.0004778 6.2 0
Workingagepopulationatt-3(log) -0.0005133 0.0001734 -2.96 0.003
Formalityrateatt-3(logistic) -0.0015121 0.0120469 -0.13 0.9
Oilproducingcity 0.0018829 0.0004502 4.18 0
Bartikshockbetweent-3andt 0.0446801 0.0134568 3.32 0.001
Constant 0.0166122 0.0064531 2.57 0.011
Yeardummies F(4,300)= 6.922 0
Numberofobservations=310
AdjustedR-squared=0.5149
2-yearintervals Coefficient Standarderror tstatistic P>|t|
Complexitypotentialatt-2(log) 0.0032913 0.0005331 6.17 0
Workingagepopulationatt-2(log) -0.0006558 0.0001903 -3.45 0.001
Formalityrateatt-2(logistic) -0.0025988 0.0124833 -0.21 0.835
Oilproducingcity 0.001869 0.0004873 3.84 0
29
Bartikshockbetweent-2andt 0.0717888 0.0178002 4.03 0
Constant 0.0199271 0.0068108 2.93 0.004
Yeardummies F(5,361)= 8.34 0
Numberofobservations=372
AdjustedR-squared=0.5402
1-yearintervals(fullspecification) Coefficient Standarderror tstatistic P>|t|
Complexitypotentialatt-1(log) 0.0033963 0.0006686 5.08 0
Workingagepopulationatt-1(log) -0.0006598 0.0002322 -2.84 0.005
Formalityrateatt-1(logistic) -0.0272684 0.0122967 -2.22 0.027
Oilproducingcity 0.0016853 0.0005864 2.87 0.004
Bartikshockbetweent-1andt 0.2048173 0.0303162 6.76 0
Constant 0.0329708 0.0071898 4.59 0
Yeardummies F(6,422)= 5.841 0
Numberofobs=434
AdjustedR-squared=0.5020
1-yearintervals(simplifiedspecification) Coefficient Standarderror tstatistic P>|t|
Complexitypotentialatt-1(log) 0.0030968 0.0003987 7.77 0
Oilproducingcity 0.0036794 0.0005224 7.04 0
Constant 0.0118205 0.0011629 10.16 0
Yeardummies F(6,422)= 36.571 0
Numberofobs=434
AdjustedR-squared=0.4331
30
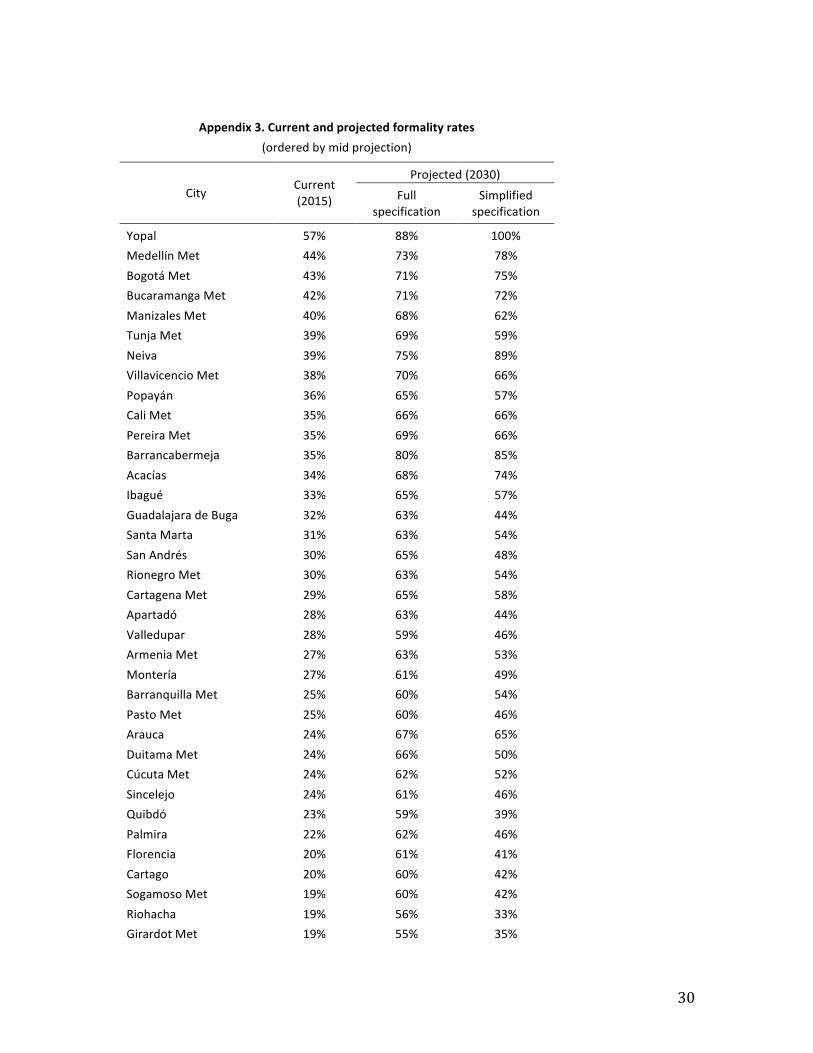
Appendix3.Currentandprojectedformalityrates
(orderedbymidprojection)
CityCurrent(2015)
Projected(2030)
Fullspecification
Simplifiedspecification
Yopal 57% 88% 100%MedellínMet 44% 73% 78%BogotáMet 43% 71% 75%BucaramangaMet 42% 71% 72%ManizalesMet 40% 68% 62%TunjaMet 39% 69% 59%Neiva 39% 75% 89%VillavicencioMet 38% 70% 66%Popayán 36% 65% 57%CaliMet 35% 66% 66%PereiraMet 35% 69% 66%Barrancabermeja 35% 80% 85%Acacías 34% 68% 74%Ibagué 33% 65% 57%GuadalajaradeBuga 32% 63% 44%SantaMarta 31% 63% 54%SanAndrés 30% 65% 48%RionegroMet 30% 63% 54%CartagenaMet 29% 65% 58%Apartadó 28% 63% 44%Valledupar 28% 59% 46%ArmeniaMet 27% 63% 53%Montería 27% 61% 49%BarranquillaMet 25% 60% 54%PastoMet 25% 60% 46%Arauca 24% 67% 65%DuitamaMet 24% 66% 50%CúcutaMet 24% 62% 52%Sincelejo 24% 61% 46%Quibdó 23% 59% 39%Palmira 22% 62% 46%Florencia 20% 61% 41%Cartago 20% 60% 42%SogamosoMet 19% 60% 42%Riohacha 19% 56% 33%GirardotMet 19% 55% 35%
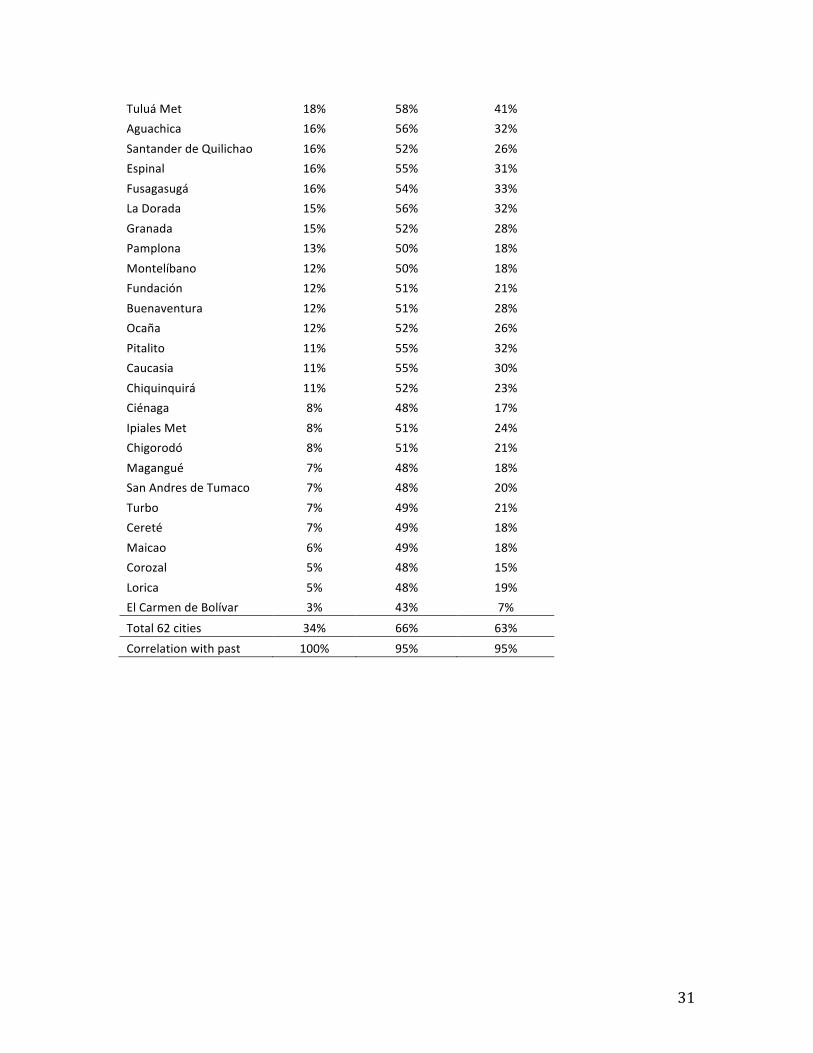
31
TuluáMet 18% 58% 41%Aguachica 16% 56% 32%SantanderdeQuilichao 16% 52% 26%Espinal 16% 55% 31%Fusagasugá 16% 54% 33%LaDorada 15% 56% 32%Granada 15% 52% 28%Pamplona 13% 50% 18%Montelíbano 12% 50% 18%Fundación 12% 51% 21%Buenaventura 12% 51% 28%Ocaña 12% 52% 26%Pitalito 11% 55% 32%Caucasia 11% 55% 30%Chiquinquirá 11% 52% 23%Ciénaga 8% 48% 17%IpialesMet 8% 51% 24%Chigorodó 8% 51% 21%Magangué 7% 48% 18%SanAndresdeTumaco 7% 48% 20%Turbo 7% 49% 21%Cereté 7% 49% 18%Maicao 6% 49% 18%Corozal 5% 48% 15%Lorica 5% 48% 19%ElCarmendeBolívar 3% 43% 7%
Total62cities 34% 66% 63%Correlationwithpast 100% 95% 95%
32
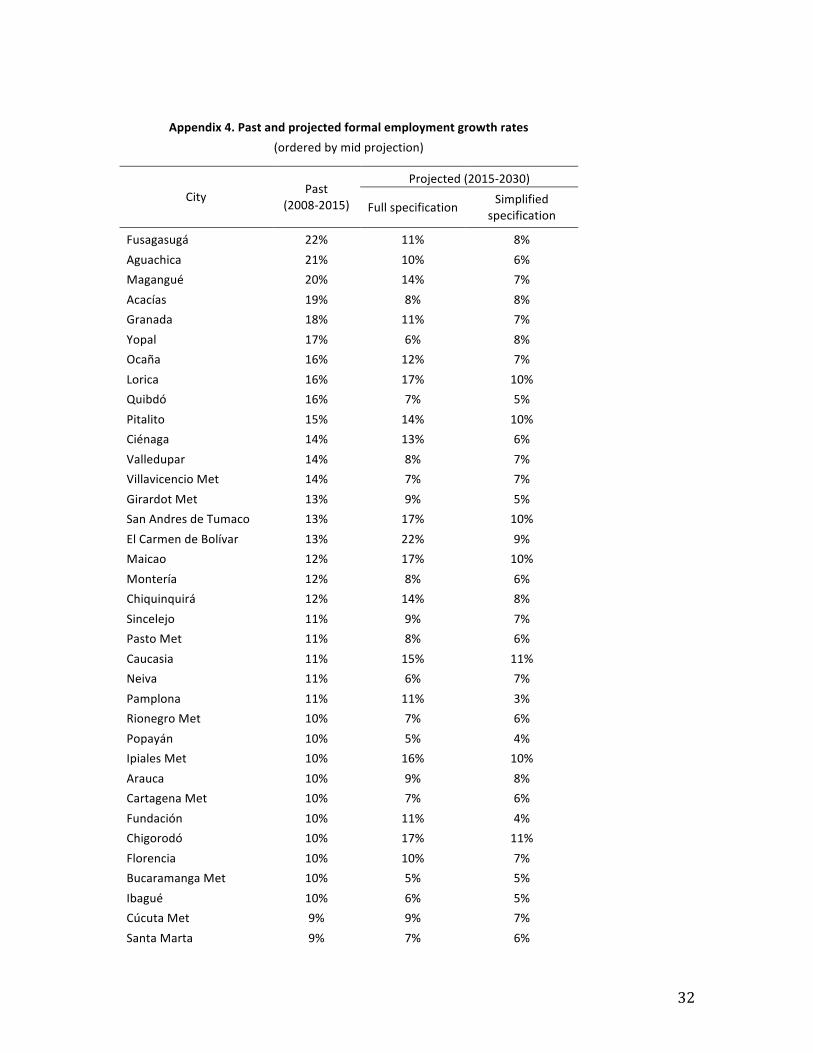
Appendix4.Pastandprojectedformalemploymentgrowthrates
(orderedbymidprojection)
City Past(2008-2015)
Projected(2015-2030)
FullspecificationSimplified
specification
Fusagasugá 22% 11% 8%Aguachica 21% 10% 6%Magangué 20% 14% 7%Acacías 19% 8% 8%Granada 18% 11% 7%Yopal 17% 6% 8%Ocaña 16% 12% 7%Lorica 16% 17% 10%Quibdó 16% 7% 5%Pitalito 15% 14% 10%Ciénaga 14% 13% 6%Valledupar 14% 8% 7%VillavicencioMet 14% 7% 7%GirardotMet 13% 9% 5%SanAndresdeTumaco 13% 17% 10%ElCarmendeBolívar 13% 22% 9%Maicao 12% 17% 10%Montería 12% 8% 6%Chiquinquirá 12% 14% 8%Sincelejo 11% 9% 7%PastoMet 11% 8% 6%Caucasia 11% 15% 11%Neiva 11% 6% 7%Pamplona 11% 11% 3%RionegroMet 10% 7% 6%Popayán 10% 5% 4%IpialesMet 10% 16% 10%Arauca 10% 9% 8%CartagenaMet 10% 7% 6%Fundación 10% 11% 4%Chigorodó 10% 17% 11%Florencia 10% 10% 7%BucaramangaMet 10% 5% 5%Ibagué 10% 6% 5%CúcutaMet 9% 9% 7%SantaMarta 9% 7% 6%
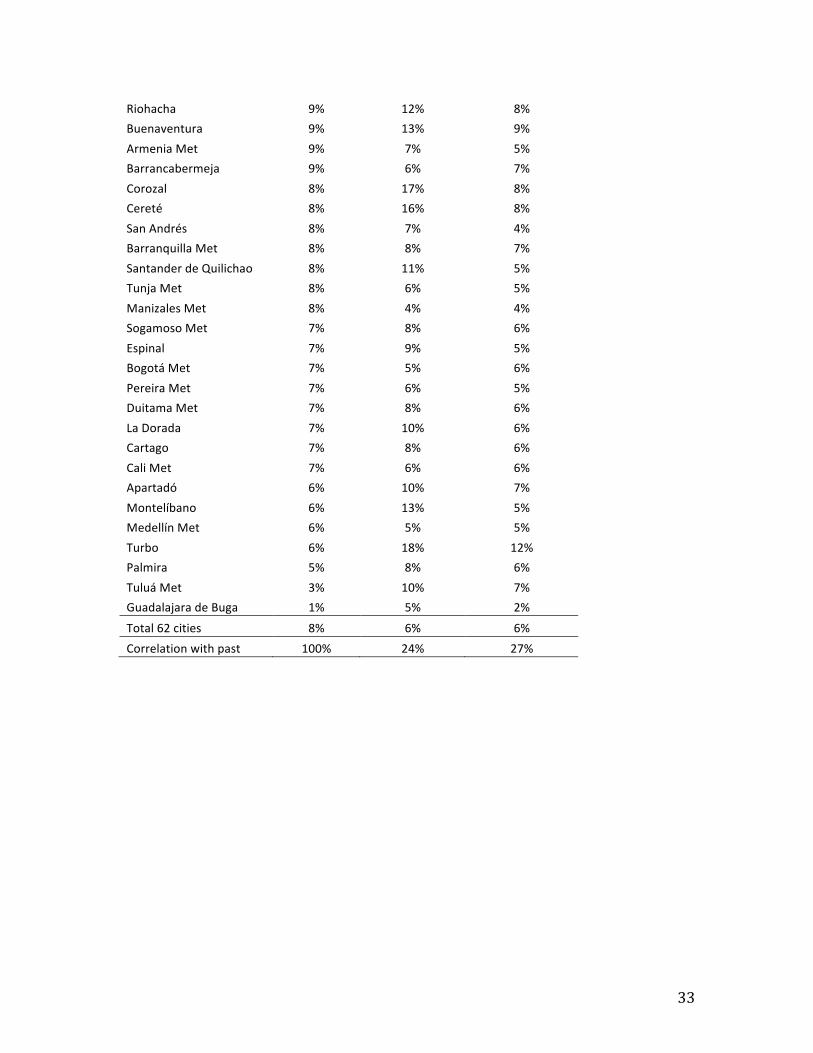
33
Riohacha 9% 12% 8%Buenaventura 9% 13% 9%ArmeniaMet 9% 7% 5%Barrancabermeja 9% 6% 7%Corozal 8% 17% 8%Cereté 8% 16% 8%SanAndrés 8% 7% 4%BarranquillaMet 8% 8% 7%SantanderdeQuilichao 8% 11% 5%TunjaMet 8% 6% 5%ManizalesMet 8% 4% 4%SogamosoMet 7% 8% 6%Espinal 7% 9% 5%BogotáMet 7% 5% 6%PereiraMet 7% 6% 5%DuitamaMet 7% 8% 6%LaDorada 7% 10% 6%Cartago 7% 8% 6%CaliMet 7% 6% 6%Apartadó 6% 10% 7%Montelíbano 6% 13% 5%MedellínMet 6% 5% 5%Turbo 6% 18% 12%Palmira 5% 8% 6%TuluáMet 3% 10% 7%GuadalajaradeBuga 1% 5% 2%
Total62cities 8% 6% 6%Correlationwithpast 100% 24% 27%
34
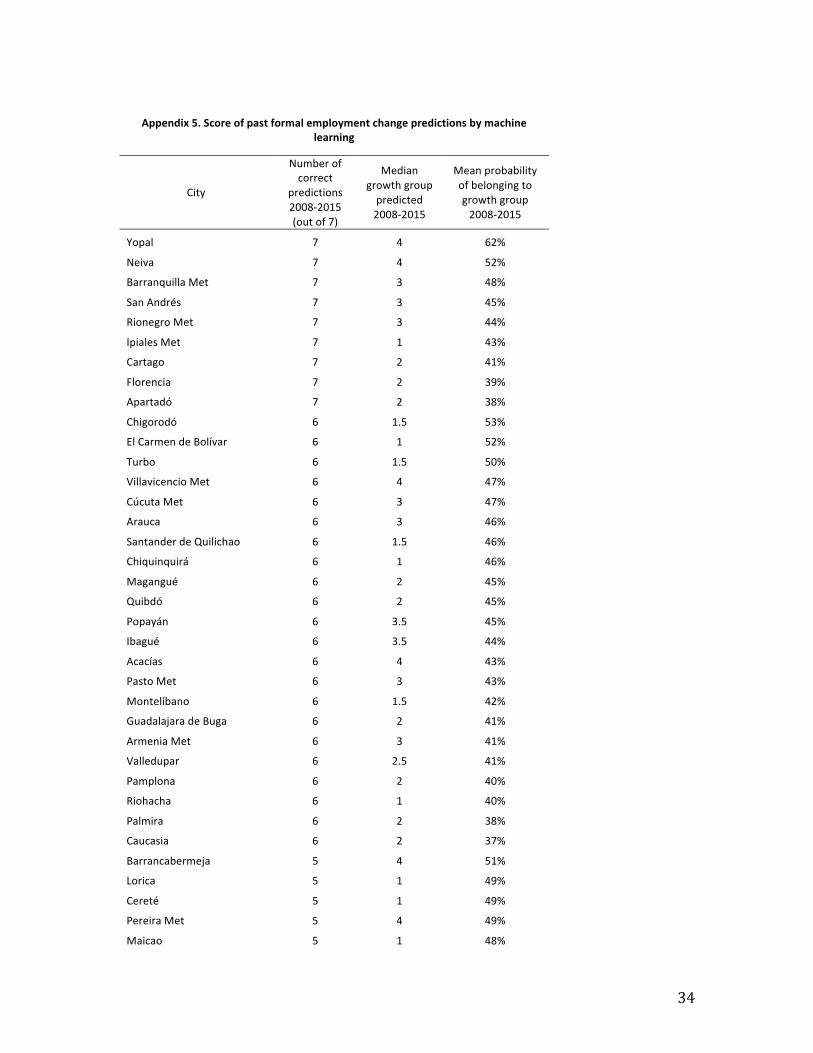
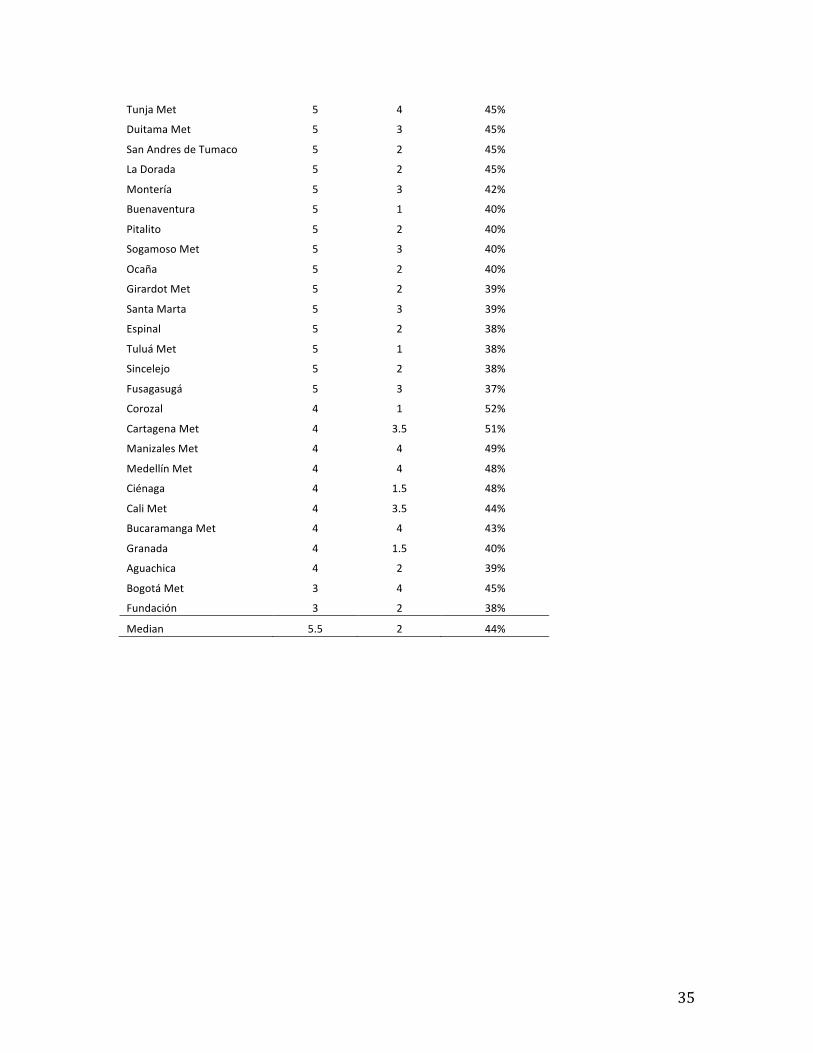
Appendix5.Scoreofpastformalemploymentchangepredictionsbymachine
learning
City
Numberofcorrect
predictions2008-2015(outof7)
Mediangrowthgrouppredicted2008-2015
Meanprobabilityofbelongingtogrowthgroup2008-2015
Yopal 7 4 62%
Neiva 7 4 52%
BarranquillaMet 7 3 48%
SanAndrés 7 3 45%
RionegroMet 7 3 44%
IpialesMet 7 1 43%
Cartago 7 2 41%
Florencia 7 2 39%
Apartadó 7 2 38%
Chigorodó 6 1.5 53%
ElCarmendeBolívar 6 1 52%
Turbo 6 1.5 50%
VillavicencioMet 6 4 47%
CúcutaMet 6 3 47%
Arauca 6 3 46%
SantanderdeQuilichao 6 1.5 46%
Chiquinquirá 6 1 46%
Magangué 6 2 45%
Quibdó 6 2 45%
Popayán 6 3.5 45%
Ibagué 6 3.5 44%
Acacías 6 4 43%
PastoMet 6 3 43%
Montelíbano 6 1.5 42%
GuadalajaradeBuga 6 2 41%
ArmeniaMet 6 3 41%
Valledupar 6 2.5 41%
Pamplona 6 2 40%
Riohacha 6 1 40%
Palmira 6 2 38%
Caucasia 6 2 37%
Barrancabermeja 5 4 51%
Lorica 5 1 49%
Cereté 5 1 49%
PereiraMet 5 4 49%
Maicao 5 1 48%
35
TunjaMet 5 4 45%
DuitamaMet 5 3 45%
SanAndresdeTumaco 5 2 45%
LaDorada 5 2 45%
Montería 5 3 42%
Buenaventura 5 1 40%
Pitalito 5 2 40%
SogamosoMet 5 3 40%
Ocaña 5 2 40%
GirardotMet 5 2 39%
SantaMarta 5 3 39%
Espinal 5 2 38%
TuluáMet 5 1 38%
Sincelejo 5 2 38%
Fusagasugá 5 3 37%
Corozal 4 1 52%
CartagenaMet 4 3.5 51%
ManizalesMet 4 4 49%
MedellínMet 4 4 48%
Ciénaga 4 1.5 48%
CaliMet 4 3.5 44%
BucaramangaMet 4 4 43%
Granada 4 1.5 40%
Aguachica 4 2 39%
BogotáMet 3 4 45%
Fundación 3 2 38%
Median 5.5 2 44%
36
Table6.Futureformalemploymentchangegrouppredictedbymachinelearning
(groupsofformalemploymentratechange:1=Lessthan0.05pp2=Between0.05and0.28pp3=Between0.28and0.54pp
4=Morethan0.54pp)
City Growthgrouppredicted Probabilityofbelongingtogroup
Popayán 4 59%
ManizalesMet 4 55%
PereiraMet 4 55%
TunjaMet 4 51%
MedellínMet 4 50%
Acacías 4 48%
BogotáMet 4 48%
CaliMet 4 45%
BucaramangaMet 4 43%
VillavicencioMet 4 42%
ArmeniaMet 4 39%
RionegroMet 4 37%
CúcutaMet 3 59%
Arauca 3 59%
BarranquillaMet 3 51%
Montería 3 49%
SanAndrés 3 47%
Palmira 3 46%
SantanderdeQuilichao 3 45%
Aguachica 3 44%
Neiva 3 43%
SantaMarta 3 43%
PastoMet 3 43%
Sincelejo 3 43%
Ibagué 3 40%
SogamosoMet 3 40%
Caucasia 3 40%
Apartadó 3 38%
TuluáMet 3 38%
CartagenaMet 3 36%
Quibdó 2 51%
Chigorodó 2 50%
37
Espinal 2 46%
Cartago 2 45%
DuitamaMet 2 44%
LaDorada 2 44%
Turbo 2 43%
Pamplona 2 42%
Valledupar 2 41%
Montelíbano 2 39%
Ciénaga 2 38%
Granada 2 38%
Florencia 2 37%
GirardotMet 2 31%
ElCarmendeBolívar 1 63%
Cereté 1 58%
Chiquinquirá 1 55%
Maicao 1 53%
Corozal 1 52%
Magangué 1 49%
SanAndresdeTumaco 1 47%
Yopal 1 47%
Buenaventura 1 45%
Lorica 1 44%
Ocaña 1 44%
Barrancabermeja 1 43%
GuadalajaradeBuga 1 42%
IpialesMet 1 41%
Riohacha 1 37%
Pitalito 1 35%
Fundación 1 34%
Fusagasugá 1 30%
38
Appendix7.Comparisonofregressionandmachine-learningpredictionsoffutureformalemploymentchange
(groupsofformalemploymentratechange:1=Lessthan0.05pp2=Between0.05and0.28pp3=Between0.28and0.54pp
4=Morethan0.54pp)
2008-2015median
Regression-based(simplified
specification)
Machine-learningbased
Samepredictions?
City
Median2008-2015andregression-
based
Median2008-2015
andmachine-learningbased
Regression-basedandmachine-
learningbased
Total(outof3)
Aguachica 3 3 3 1 1 1 3
TunjaMet 4 4 4 1 1 1 3
ManizalesMet 4 4 4 1 1 1 3
Popayán 4 4 4 1 1 1 3
VillavicencioMet 4 4 4 1 1 1 3
Acacías 4 4 4 1 1 1 3
PereiraMet 4 4 4 1 1 1 3
SanAndrés 3 3 3 1 1 1 3
Florencia 2 4 2 0 1 0 1
SantanderdeQuilichao 2 3 3 0 0 1 1
Lorica 1 3 1 0 1 0 1
Ocaña 3 3 1 1 0 0 1
Sincelejo 3 4 3 0 1 0 1
MedellínMet 3 4 4 0 0 1 1
Apartadó 2 3 3 0 0 1 1
Chigorodó 2 3 2 0 1 0 1
RionegroMet 3 4 4 0 0 1 1
Turbo 2 3 2 0 1 0 1
BarranquillaMet 3 4 3 0 1 0 1
BogotáMet 3 4 4 0 0 1 1
CartagenaMet 3 4 3 0 1 0 1
ElCarmendeBolívar 1 3 1 0 1 0 1
Chiquinquirá 1 3 1 0 1 0 1
SogamosoMet 3 4 3 0 1 0 1
LaDorada 2 3 2 0 1 0 1
Montería 3 4 3 0 1 0 1
Cereté 1 3 1 0 1 0 1
Montelíbano 2 3 2 0 1 0 1
GirardotMet 3 3 2 1 0 0 1
Quibdó 2 3 2 0 1 0 1
39
Neiva 4 4 3 1 0 0 1
Riohacha 1 3 1 0 1 0 1
SantaMarta 3 4 3 0 1 0 1
Ciénaga 2 3 2 0 1 0 1
Granada 3 3 2 1 0 0 1
PastoMet 3 4 3 0 1 0 1
IpialesMet 1 3 1 0 1 0 1
CúcutaMet 3 4 3 0 1 0 1
Pamplona 2 3 2 0 1 0 1
ArmeniaMet 3 4 4 0 0 1 1
BucaramangaMet 3 4 4 0 0 1 1
Corozal 1 3 1 0 1 0 1
Ibagué 3 4 3 0 1 0 1
Espinal 2 3 2 0 1 0 1
CaliMet 3 4 4 0 0 1 1
Cartago 2 4 2 0 1 0 1
Arauca 3 4 3 0 1 0 1
Yopal 4 4 1 1 0 0 1
DuitamaMet 3 4 2 0 0 0 0
Caucasia 2 4 3 0 0 0 0
Magangué 2 3 1 0 0 0 0
Valledupar 3 4 2 0 0 0 0
Fusagasugá 3 4 1 0 0 0 0
Pitalito 2 4 1 0 0 0 0
Maicao 2 3 1 0 0 0 0
Fundación 2 3 1 0 0 0 0
SanAndresdeTumaco 2 3 1 0 0 0 0
Barrancabermeja 3 4 1 0 0 0 0
Buenaventura 2 3 1 0 0 0 0
GuadalajaradeBuga 2 3 1 0 0 0 0
Palmira 2 4 3 0 0 0 0
TuluáMet 1 4 3 0 0 0 0
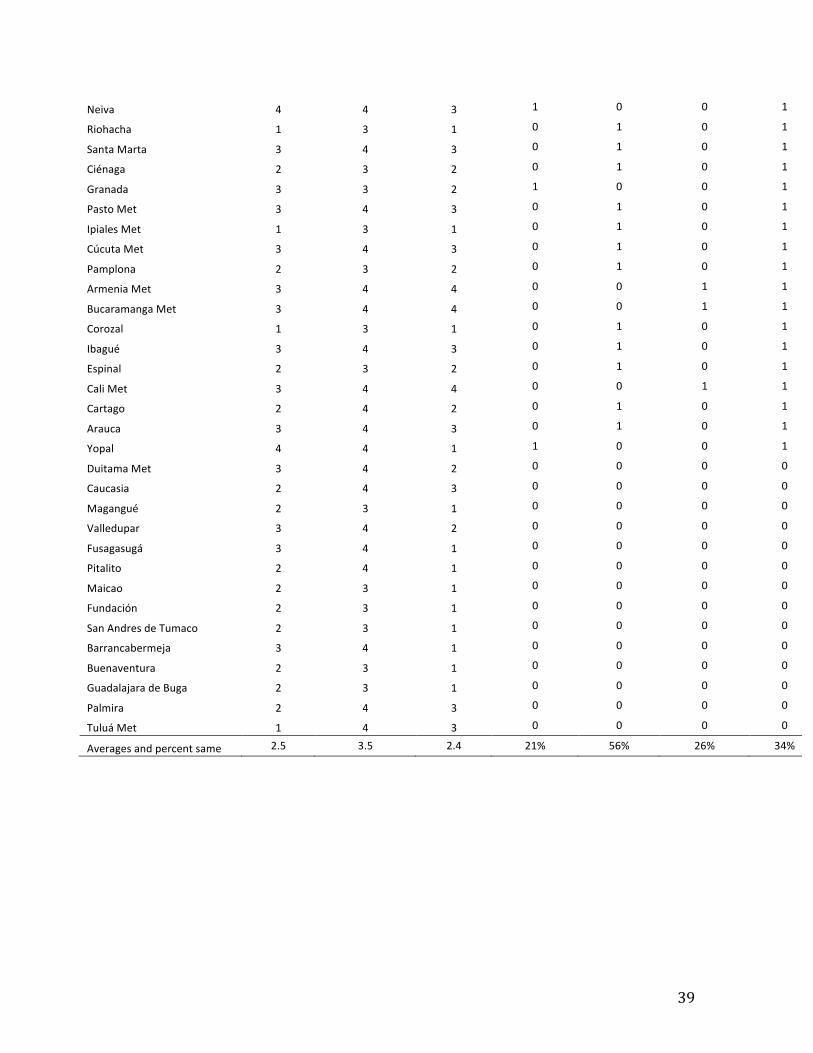
Averagesandpercentsame 2.5 3.5 2.4 21% 56% 26% 34%

40
Related Documents