Renewable and Appropriate Energy Laboratory - rael.berkeley.edu Forecasting and Impacts of our Energy Future Daniel M. Kammen Co-Director, Berkeley Institute of the Environment Energy and Resources Group & Goldman School of Public Policy Department of Nuclear Engineering University of California, Berkeley Materials online at: http://rael.berkeley.edu NAS/IoM Climate Change and Human Health, San Francisco, CA September 10, 2007

Welcome message from author
This document is posted to help you gain knowledge. Please leave a comment to let me know what you think about it! Share it to your friends and learn new things together.
Transcript

Renewable and Appropriate Energy Laboratory - rael.berkeley.edu
Forecasting and Impacts of our Energy Future
Daniel M. Kammen
Co-Director, Berkeley Institute of the EnvironmentEnergy and Resources Group & Goldman School of Public Policy
Department of Nuclear EngineeringUniversity of California, Berkeley
Materials online at: http://rael.berkeley.edu
NAS/IoM Climate Change and Human Health, San Francisco, CA September 10, 2007
Renewable and Appropriate Energy Laboratory - rael.berkeley.edu
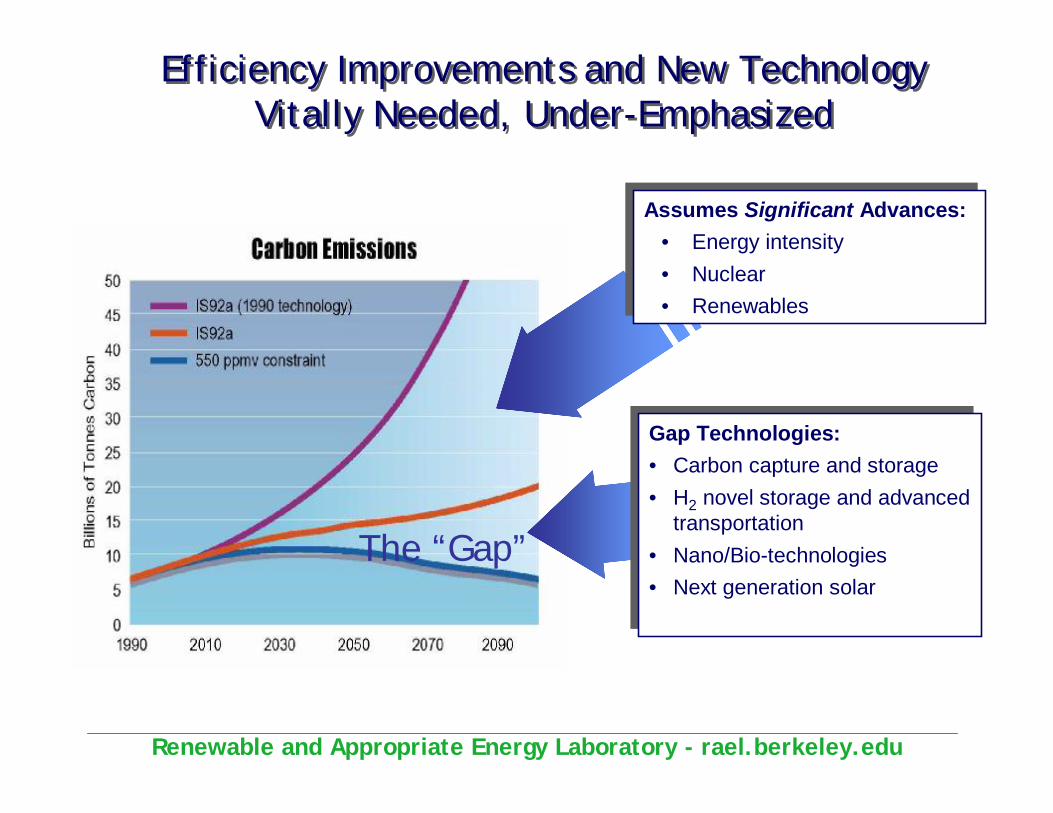
Assumes Significant Advances:• Energy intensity• Nuclear• Renewables
Assumes Significant Advances:• Energy intensity• Nuclear• Renewables
Gap Technologies:• Carbon capture and storage• H2 novel storage and advanced
transportation• Nano/Bio-technologies• Next generation solar
Gap Technologies:• Carbon capture and storage• H2 novel storage and advanced
transportation• Nano/Bio-technologies• Next generation solar
The “Gap”
Efficiency Improvements and New Technology Vitally Needed, Under-Emphasized
Efficiency Improvements and New Technology Vitally Needed, Under-Emphasized

Renewable and Appropriate Energy Laboratory - rael.berkeley.edu
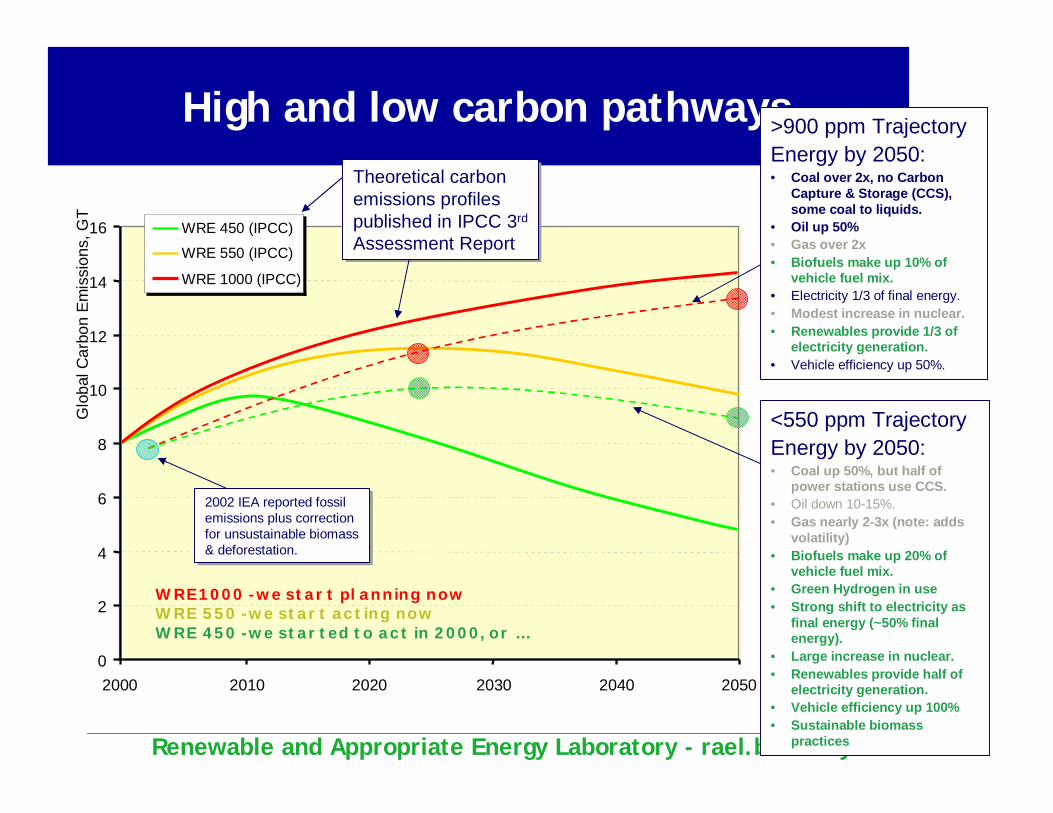
High and low carbon pathways
0
2
4
6
8
10
12
14
16
2000 2010 2020 2040 2050
Glo
bal C
arbo
n Em
issi
ons,
GT
2030
2002 IEA reported fossil emissions plus correction for unsustainable biomass & deforestation.
2002 IEA reported fossil emissions plus correction for unsustainable biomass & deforestation.
Thanks to the World Business Council for Sustainable Development
WRE 450 (IPCC)
WRE 550 (IPCC)
WRE 1000 (IPCC)
Theoretical carbon emissions profiles published in IPCC 3rd
Assessment Report
Theoretical carbon emissions profiles published in IPCC 3rd
Assessment Report
Current coastlineHigh emissions
coastline
Renewable and Appropriate Energy Laboratory - rael.berkeley.edu
High and low carbon pathways
0
2
4
6
8
10
12
14
16
2000 2010 2020 2040 2050
Glo
bal C
arbo
n Em
issi
ons,
GT
2030
WRE 450 (IPCC)
WRE 550 (IPCC)
WRE 1000 (IPCC)
Theoretical carbon emissions profiles published in IPCC 3rd
Assessment Report
Theoretical carbon emissions profiles published in IPCC 3rd
Assessment Report
2002 IEA reported fossil emissions plus correction for unsustainable biomass & deforestation.
2002 IEA reported fossil emissions plus correction for unsustainable biomass & deforestation.
>900 ppm TrajectoryEnergy by 2050:• Coal over 2x, no Carbon
Capture & Storage (CCS), some coal to liquids.
• Oil up 50%• Gas over 2x• Biofuels make up 10% of
vehicle fuel mix.• Electricity 1/3 of final energy.• Modest increase in nuclear.• Renewables provide 1/3 of
electricity generation.• Vehicle efficiency up 50%.
<550 ppm TrajectoryEnergy by 2050:• Coal up 50%, but half of
power stations use CCS.• Oil down 10-15%.• Gas nearly 2-3x (note: adds
volatility)• Biofuels make up 20% of
vehicle fuel mix.• Green Hydrogen in use• Strong shift to electricity as
final energy (~50% final energy).
• Large increase in nuclear.• Renewables provide half of
electricity generation.• Vehicle efficiency up 100%• Sustainable biomass
practices
WRE1000 - we start planning nowWRE 550 - we start acting nowWRE 450 - we started to act in 2000, or …
Renewable and Appropriate Energy Laboratory - rael.berkeley.edu
0
2
4
6
8
10
1950 1990 2030
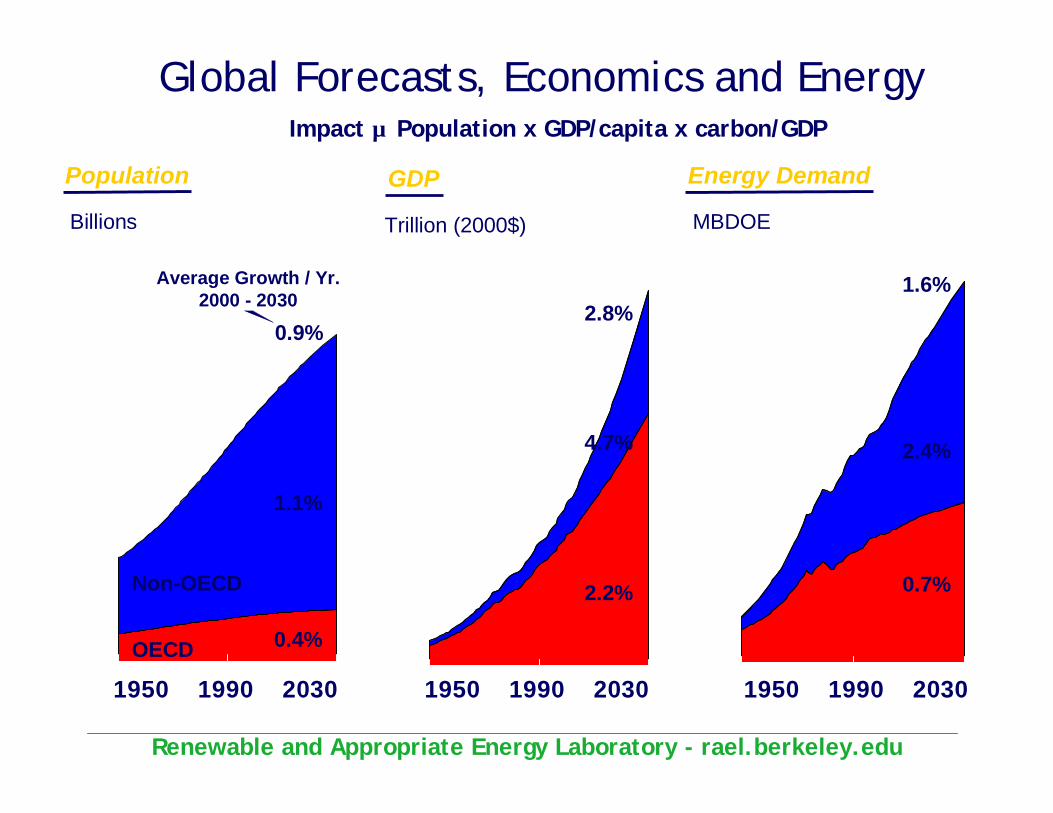
Global Forecasts, Economics and Energy
Population
0.9%
0.4%
1.1%
OECD
Non-OECD
Billions
0
50
100
150
200
250
300
350
1950 1990 2030
Energy Demand
1.6%
0.7%
2.4%
MBDOE
Average Growth / Yr. 2000 - 2030
0
10
20
30
40
50
60
70
80
1950 1990 2030
GDP
2.8%
2.2%
Trillion (2000$)
4.7%
Impact ∝ Population x GDP/capita x carbon/GDP
1950 1990 2030 1950 1990 20301950 1990 2030
Renewable and Appropriate Energy Laboratory - rael.berkeley.edu

Renewable and Appropriate Energy Laboratory - rael.berkeley.edu
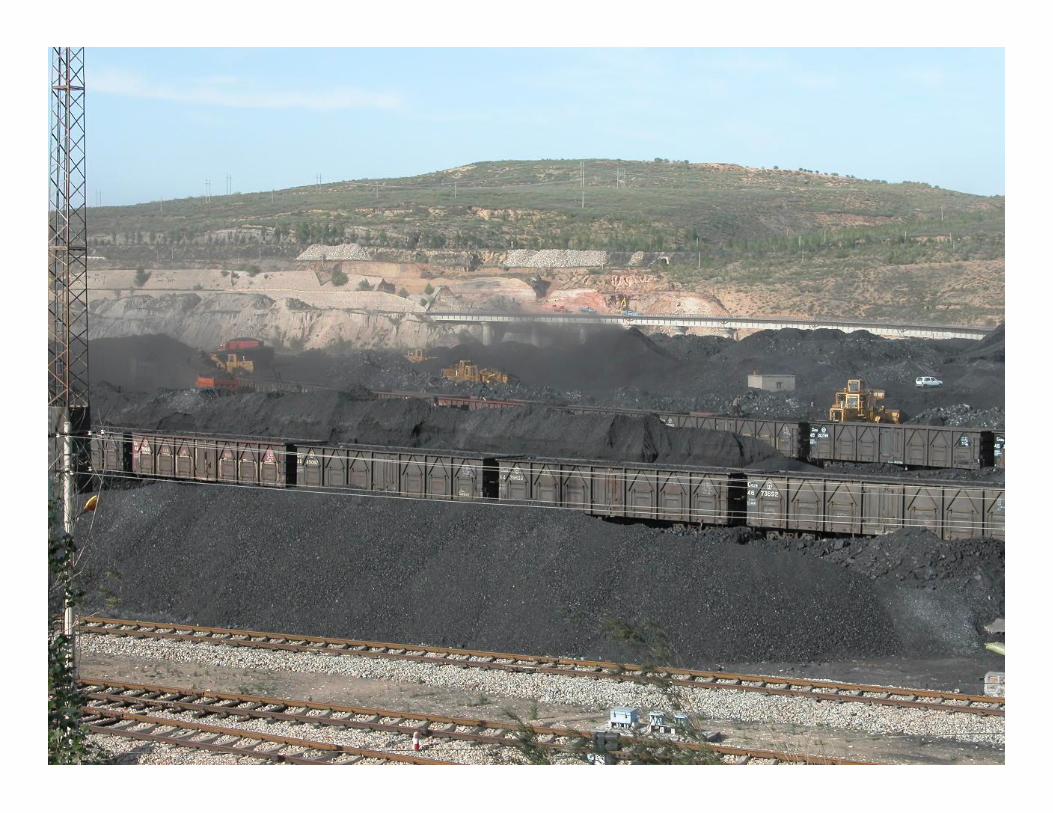
New Coal by the Decades
0
200
400
600
800
GW
Co
al
Other Developing 43 90 128
India 16 48 79
China 150 168 226
Transition 1 11 19
OECD 12 184 218
2003-2010 2011-2020 2021-2030
Source: IEA, WEO 2004
221
500
670
>$1 trillion in capital
Renewable and Appropriate Energy Laboratory - rael.berkeley.edu
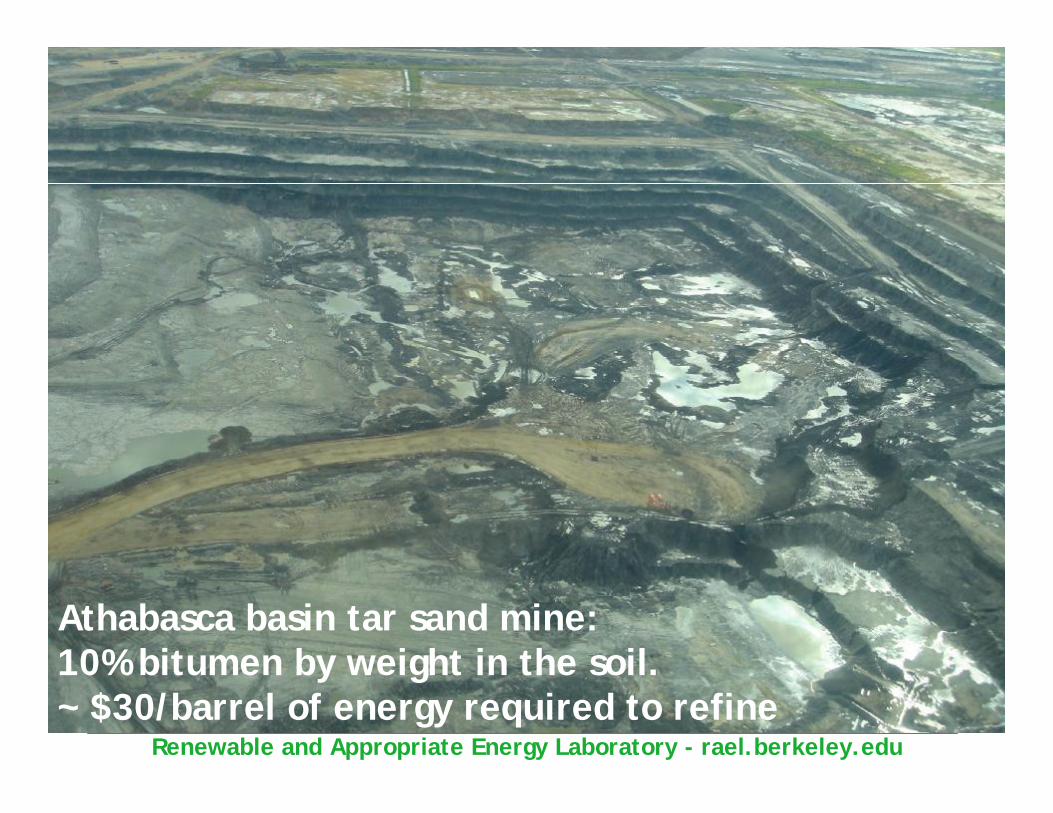
Athabasca basin tar sand mine: 10% bitumen by weight in the soil.~ $30/barrel of energy required to refine
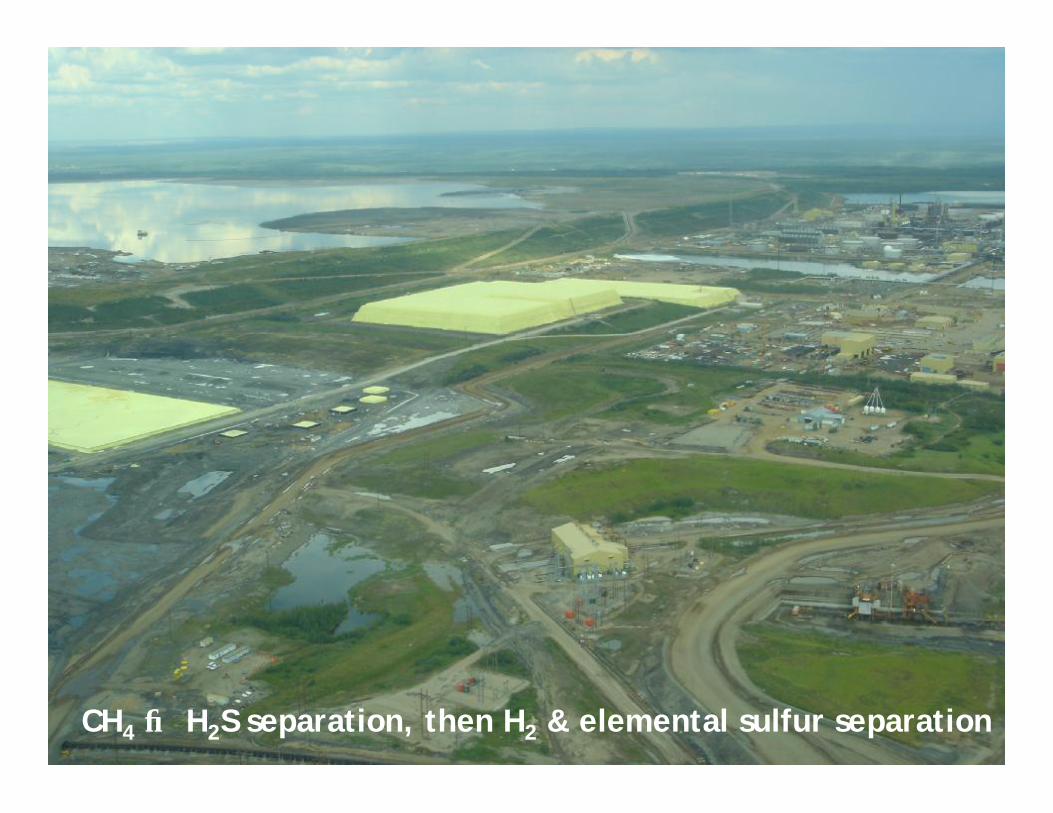
Renewable and Appropriate Energy Laboratory - rael.berkeley.eduCH4 → H2S separation, then H2 & elemental sulfur separation

Renewable and Appropriate Energy Laboratory - rael.berkeley.edu

Renewable and Appropriate Energy Laboratory - rael.berkeley.edu
We are running out of atmosphere much faster than fossil fuels … at all price points
Source: Brandt and Farrell (2006) Environmental Research Letters (erl.iop.org)

Renewable and Appropriate Energy Laboratory - rael.berkeley.edu
Global Energy Supply by Fuel
Fossil Energy
0
50
100
150
200
250
300
350
1980 2005 2030
1.6%
1.6%
1.3%
1.7%
1.6%
Oil
Gas
Coal
Other
MBDOEAverage Growth / Yr. 2000 - 2030
Other Energy
0
10
20
30
40
50
60
70
1980 2005 2030
1.6%
1.0%
2.2%
Nuclear
Hydro/Geo
Biomass / Other
MBDOE
Wind & Solar20.5%
1.4%
Biofuels 7.2%
Wind, Solar & Biofuels
0
1
2
3
4
5
1980 2005 2030
8.8%
12.5%
7.2%
Wind
Biofuels
MBDOE
8.4%Solar
Renewable and Appropriate Energy Laboratory - rael.berkeley.edu
50
100
150
200
1970 1976 1982 1988 1994 2000 2006
Ene
rgy
Serv
ices
in Q
uads
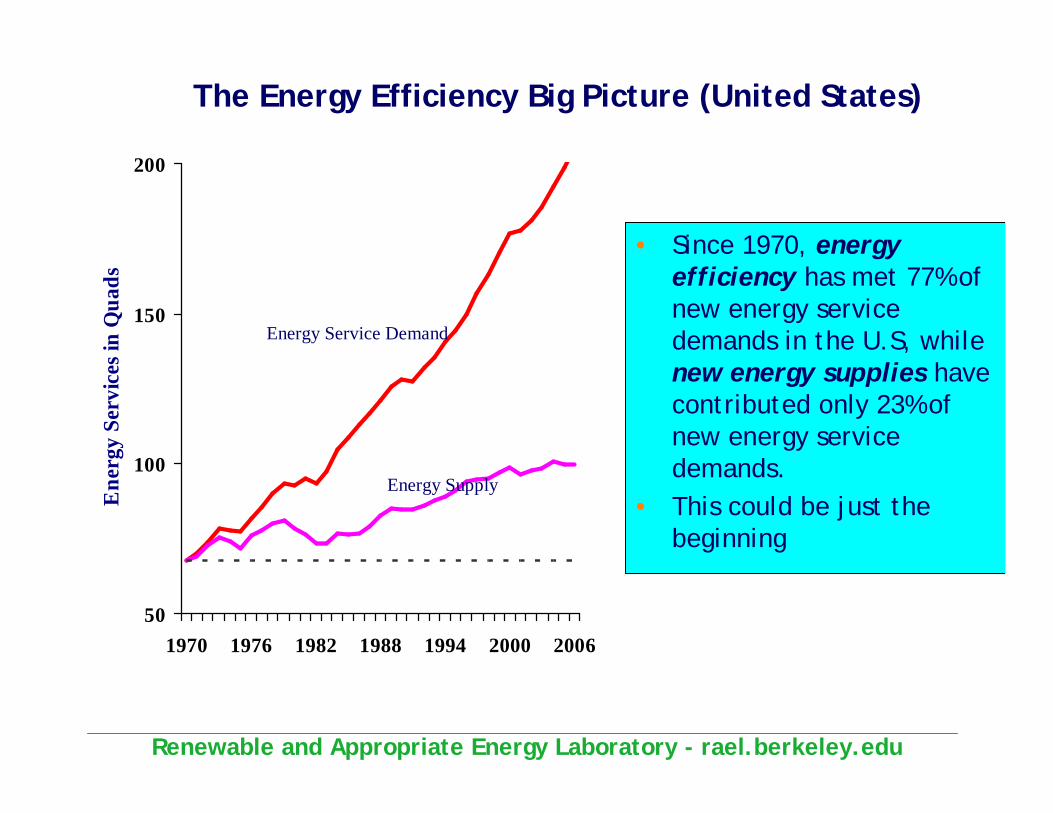
• Since 1970, energy efficiency has met 77% of new energy service demands in the U.S, while new energy supplies have contributed only 23% of new energy service demands.
• This could be just the beginning
Energy Service Demand
Energy Supply
The Energy Efficiency Big Picture (United States)
Renewable and Appropriate Energy Laboratory - rael.berkeley.edu
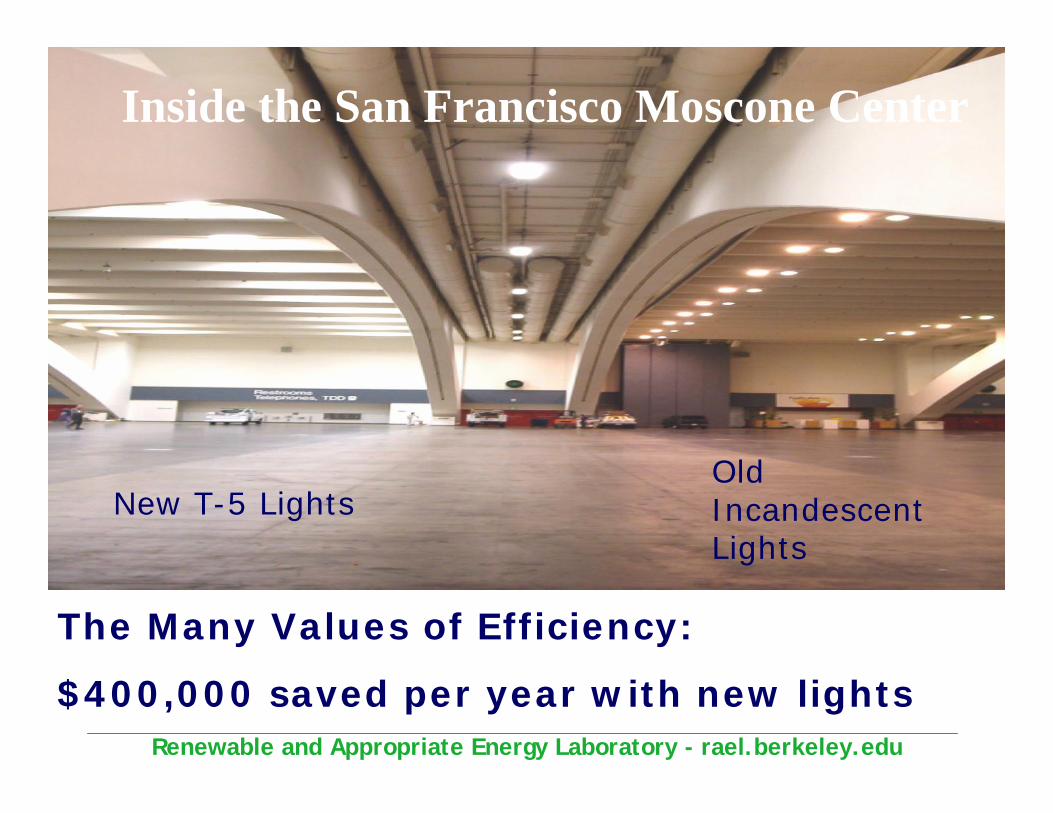
The Many Values of Efficiency:
$400,000 saved per year with new lights
Old Incandescent Lights
New T-5 Lights
Inside the San Francisco Moscone Center
0
50
100
150
200
250
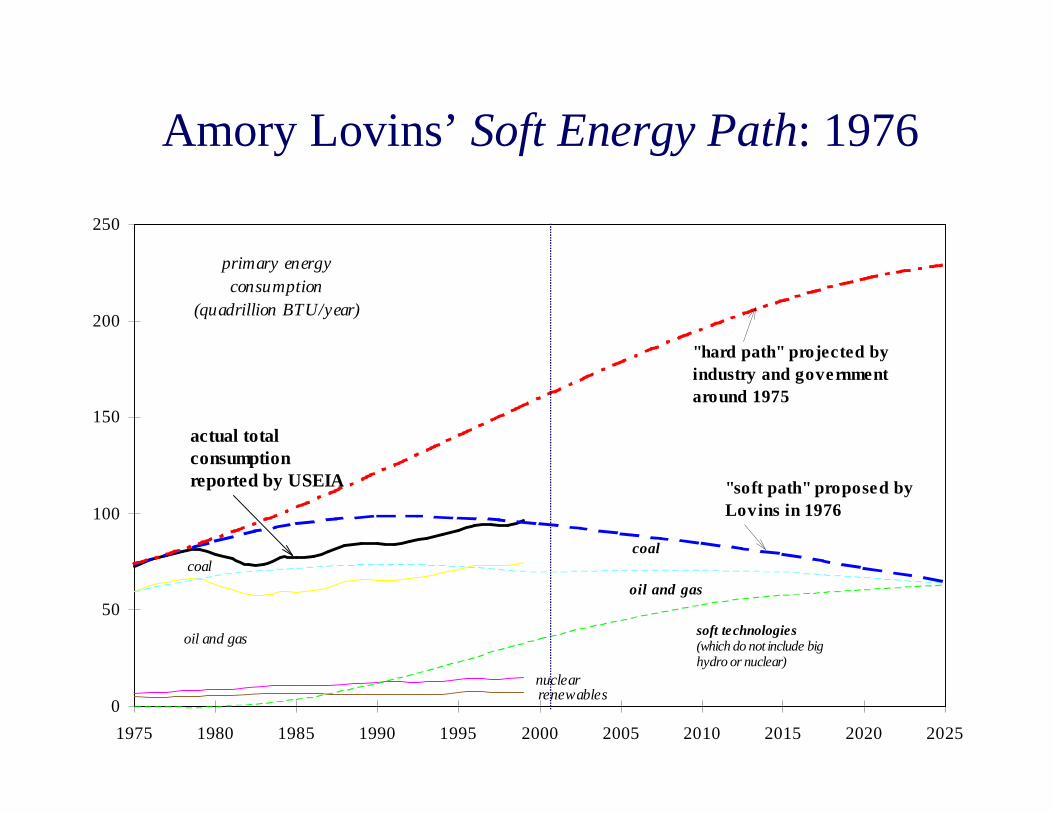
1975 1980 1985 1990 1995 2000 2005 2010 2015 2020 2025
primary energy consumption
(quadrillion BTU/year)
"hard path" projected by industry and government around 1975
"soft path" proposed by Lovins in 1976
soft technologies(which do not include big hydro or nuclear)
oil and gas
coal
renewablesnuclear
coal
oil and gas
actual total consumptionreported by USEIA
US energy use/$ GDP already cut 40%, to very nearly the 1976 “Soft Energy Pat1976h”
Amory Lovins’ Soft Energy Path: 1976
Renewable and Appropriate Energy Laboratory - rael.berkeley.edu
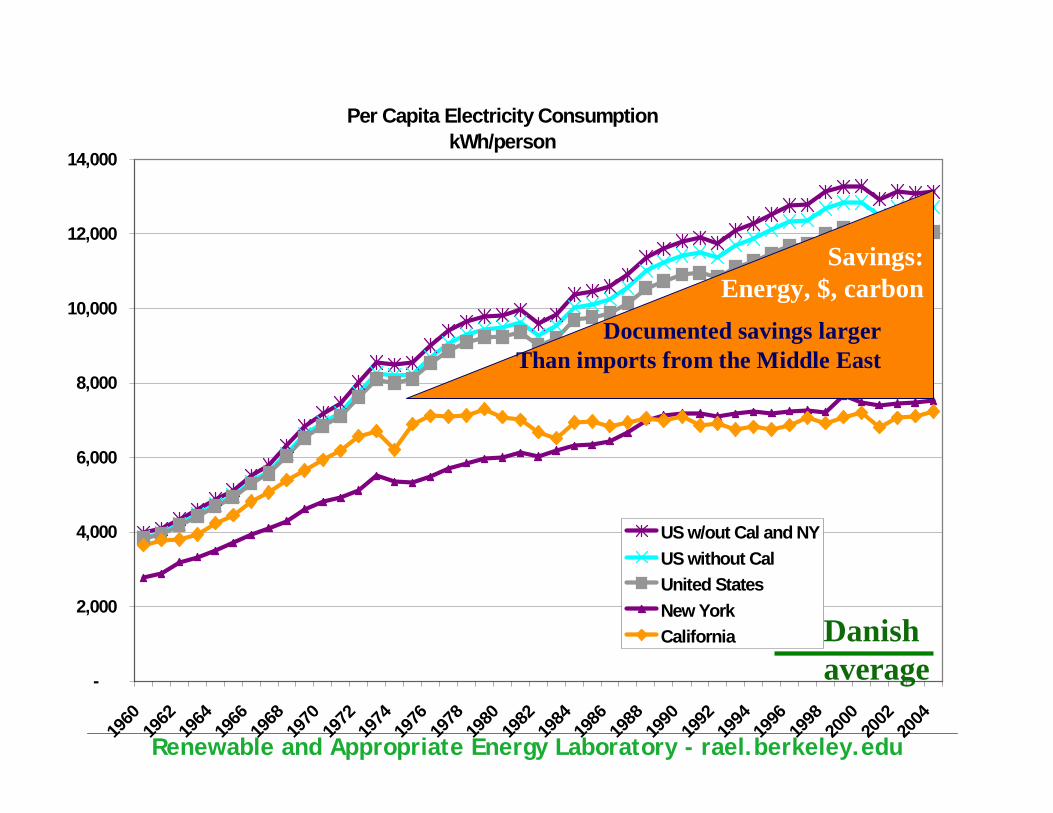
Per Capita Electricity ConsumptionkWh/person
-
2,000
4,000
6,000
8,000
10,000
12,000
14,000
1960
1962
1964
1966
1968
1970
1972
1974
1976
1978
1980
1982
1984
1986
1988
1990
1992
1994
1996
1998
2000
2002
2004
US w/out Cal and NYUS without CalUnited StatesNew YorkCalifornia
Documented savings largerThan imports from the Middle East
Savings:Energy, $, carbon
Danishaverage

Renewable and Appropriate Energy Laboratory - rael.berkeley.edu
Best ResearchBest Research--Cell EfficienciesCell EfficienciesEf
ficien
cy (%
)
Universityof Maine
Boeing
Boeing
Boeing
BoeingARCO
NREL
Boeing
Euro-CIS
200019951990198519801975
NREL/Spectrolab
NRELNREL
JapanEnergy
Spire
No. CarolinaState University
Multijunction ConcentratorsThree-junction (2-terminal, monolithic)Two-junction (2-terminal, monolithic)
Crystalline Si CellsSingle crystalMulticrystalline
Thin Film TechnologiesCu(In,Ga)Se2CdTeAmorphous Si:H (stabilized)
Emerging PVDye cellsOrganic cells(various technologies)
Varian
RCA
Solarex
UNSW
UNSW
ARCO
UNSWUNSW
UNSWSpire Stanford
Westing-house
UNSWGeorgia TechGeorgia Tech Sharp NREL
Spectrolab
NREL
MasushitaMonosolar Kodak
Kodak
AMETEK
Photon Energy
UniversitySo. Florida
NREL
NREL
NRELCu(In,Ga)Se2
14x concentration
NREL
United Solar
United Solar
RCA
RCARCA
RCA RCARCA
Spectrolab
Solarex12
8
4
0
16
20
24
28
32
36
University ofLausanne
University ofLausanne
Siemens
2005
Kodak UCSBCambridge
Groningen
University LinzBerkeley
Princeton
UniversityLinz
DOE/NREL Solar Energy Workshop, 2005
Renewable and Appropriate Energy Laboratory - rael.berkeley.edu
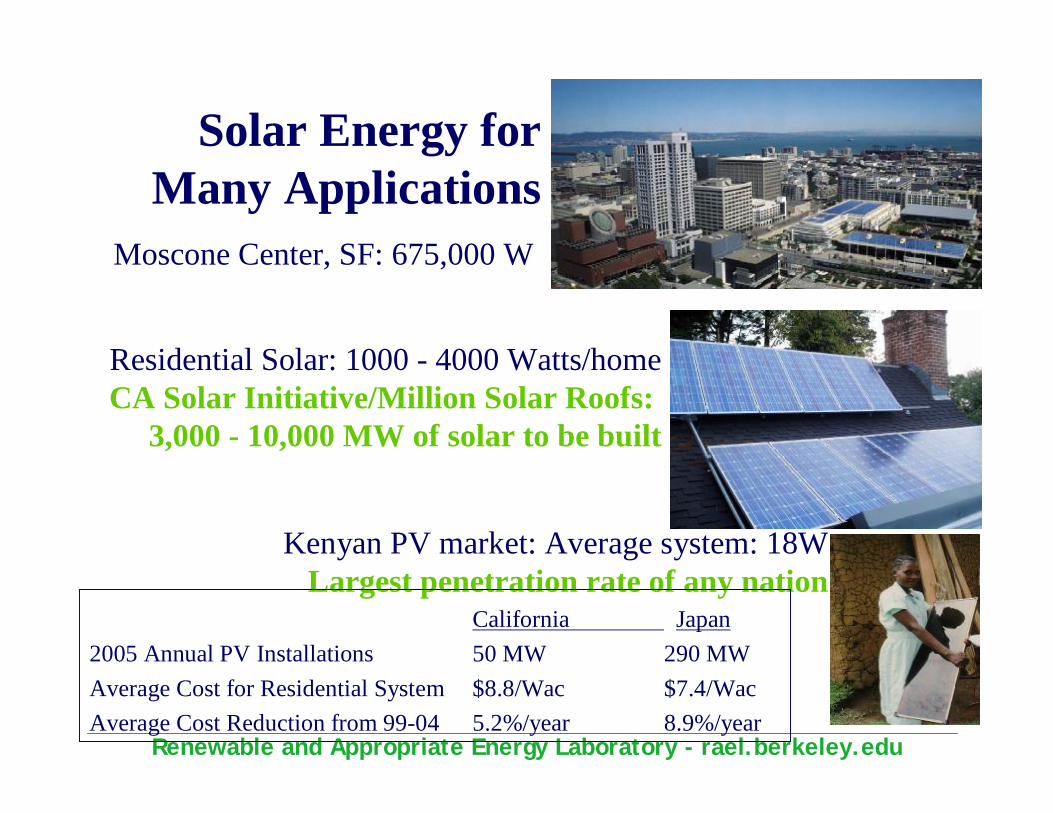
Solar Energy for Many Applications
Moscone Center, SF: 675,000 W
Kenyan PV market: Average system: 18WLargest penetration rate of any nation
Residential Solar: 1000 - 4000 Watts/homeCA Solar Initiative/Million Solar Roofs:
3,000 - 10,000 MW of solar to be built
California Japan2005 Annual PV Installations 50 MW 290 MWAverage Cost for Residential System $8.8/Wac $7.4/WacAverage Cost Reduction from 99-04 5.2%/year 8.9%/year
Renewable and Appropriate Energy Laboratory - rael.berkeley.edu
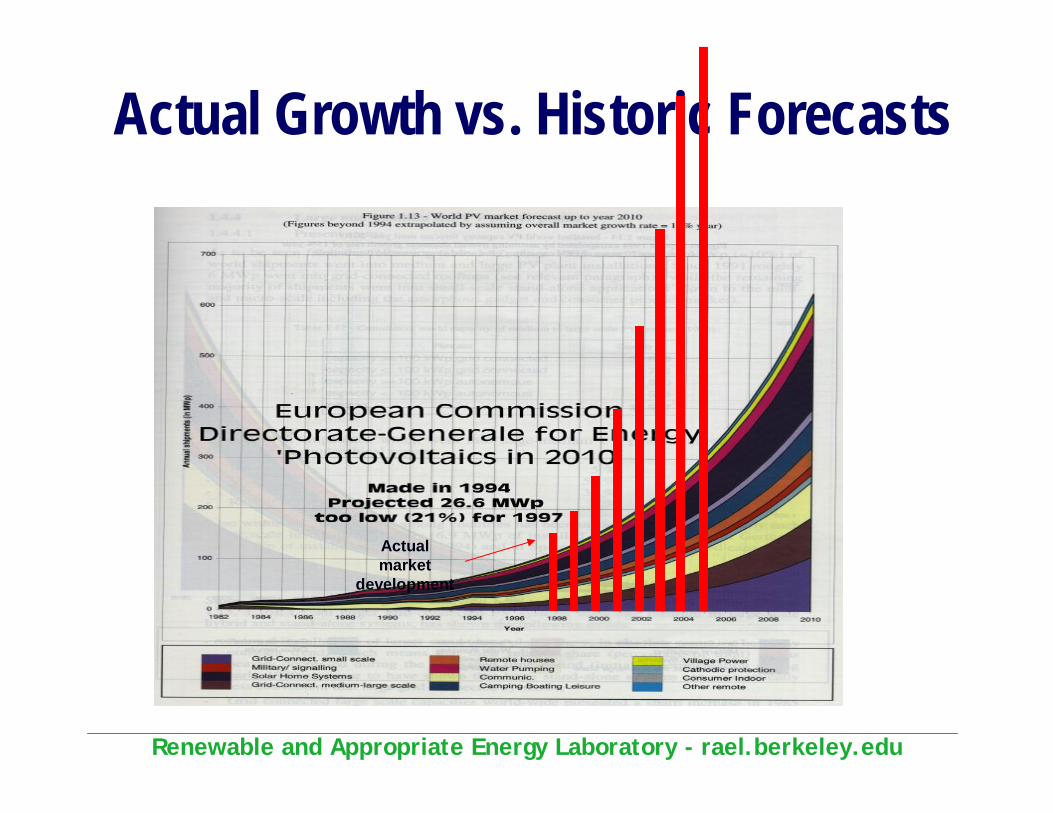
Actual Growth vs. Historic Forecasts
Actual market
development
Renewable and Appropriate Energy Laboratory - rael.berkeley.edu
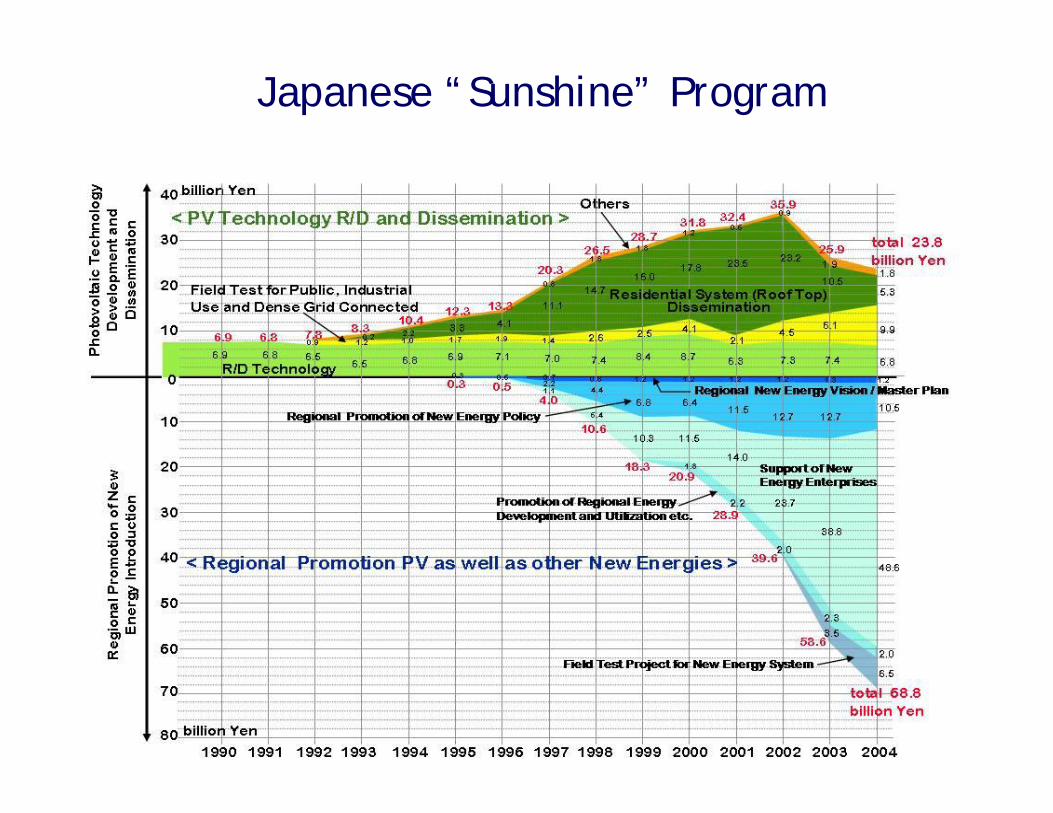
Japanese “Sunshine” Program
Renewable and Appropriate Energy Laboratory - rael.berkeley.edu
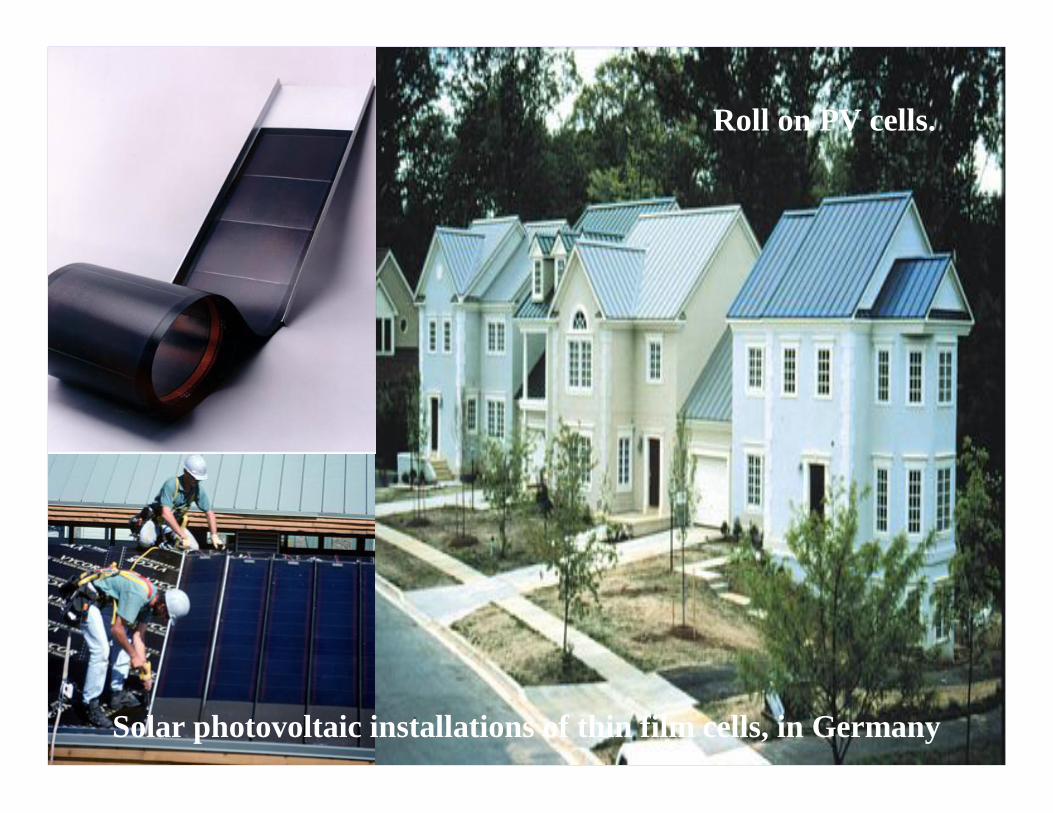
Roll on PV cells.
Solar photovoltaic installations of thin film cells, in Germany
Renewable and Appropriate Energy Laboratory - rael.berkeley.edu
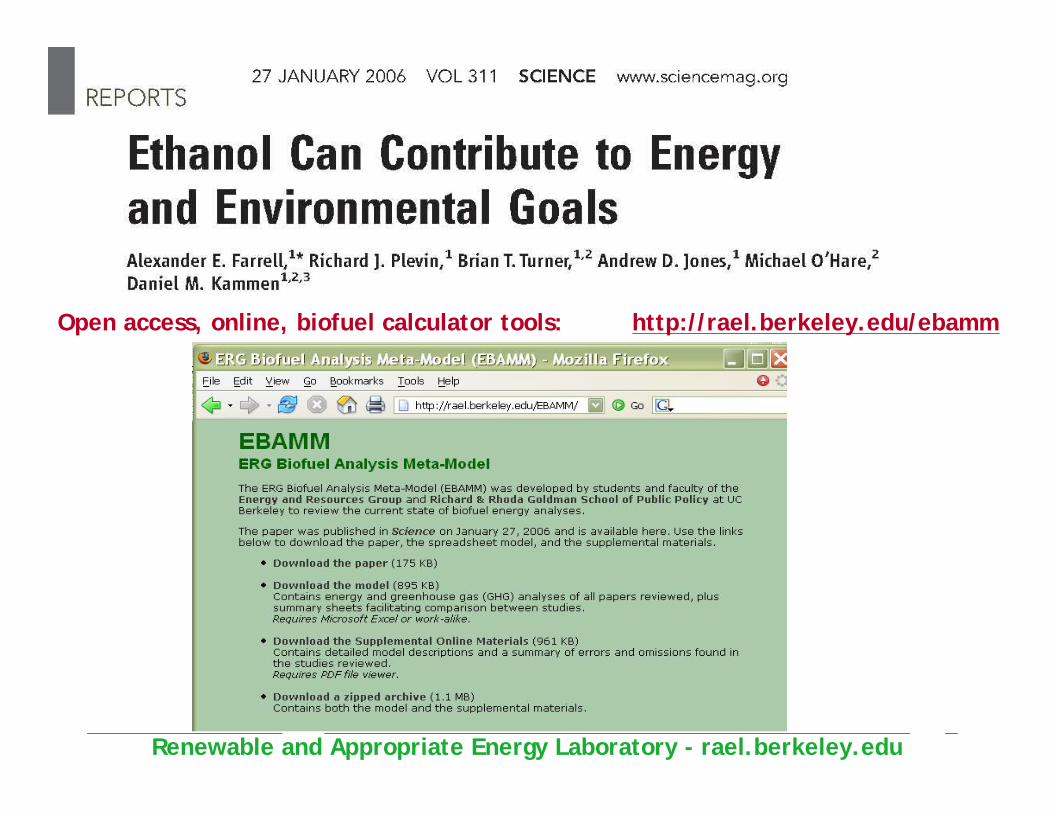
Open access, online, biofuel calculator tools: http://rael.berkeley.edu/ebamm

Renewable and Appropriate Energy Laboratory - rael.berkeley.edu
An Alternative Fuel is Not Necessarily a Low-Carbon Fuel, but it can be
FT (Coal)
Gasolin
e (Shale)
Gasolin
e (Tar S
ands)
FT (Coal C
CD)
Gasolin
e
Ethanol (Corn
Coal)
Ethanol (Today)
Ethanol (Corn N
G)
Biodiesel
Ethanol (Corn B
iomass)
Ethanol (Cellu
lose)
Ethanol (Corn B
iomass C
CD)
Ethanol (Cellu
lose C
CD)
-10
0
10
20
30
40
50
60
1
lbs
CO
2/ga
l gas
olin
e eq
uiva
lent
FT (Coal)Gasoline (Shale)Gasoline (Tar Sands)FT (Coal CCD)GasolineEthanol (Corn Coal)Ethanol (Today)Ethanol (Corn NG)BiodieselEthanol (Corn Biomass)Ethanol (Cellulose)Ethanol (Corn Biomass CCD)Ethanol (Cellulose CCD)
Renewable and Appropriate Energy Laboratory - rael.berkeley.edu
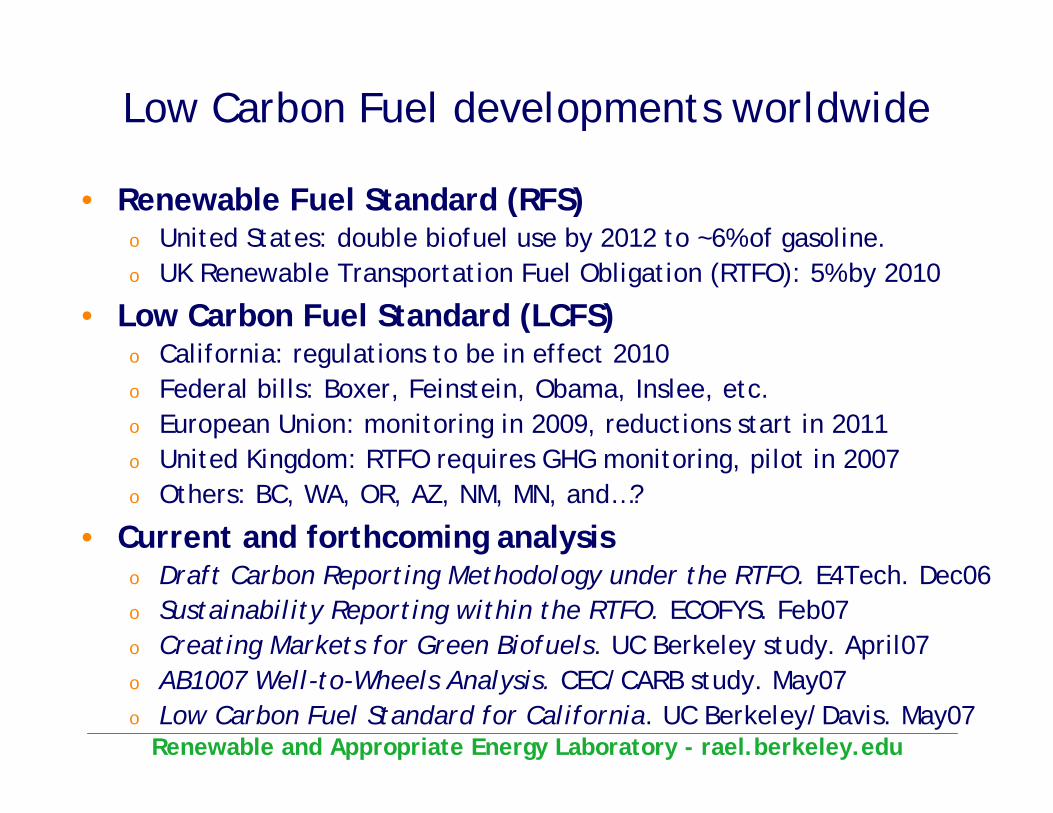
Low Carbon Fuel developments worldwide
• Renewable Fuel Standard (RFS)o United States: double biofuel use by 2012 to ~6% of gasoline.o UK Renewable Transportation Fuel Obligation (RTFO): 5% by 2010
• Low Carbon Fuel Standard (LCFS)o California: regulations to be in effect 2010o Federal bills: Boxer, Feinstein, Obama, Inslee, etc.o European Union: monitoring in 2009, reductions start in 2011o United Kingdom: RTFO requires GHG monitoring, pilot in 2007o Others: BC, WA, OR, AZ, NM, MN, and…?
• Current and forthcoming analysiso Draft Carbon Reporting Methodology under the RTFO. E4Tech. Dec06o Sustainability Reporting within the RTFO. ECOFYS. Feb07o Creating Markets for Green Biofuels. UC Berkeley study. April07o AB1007 Well-to-Wheels Analysis. CEC/CARB study. May07o Low Carbon Fuel Standard for California. UC Berkeley/Davis. May07

Renewable and Appropriate Energy Laboratory - rael.berkeley.edu
Pro
babi
lity
(AR
I)
Average Daily Exposure (µg / m3)
0
0.05
0.1
0.15
0 2000 4000 6000 8000
Charcoal
Ceramic Wood Stoves3-Stone Fire
Illness Reduction Observed in Kenya(ARI = acute respiratory infection)
All ARI
ALRI, Lower respiratoryInfections only
Renewable and Appropriate Energy Laboratory - rael.berkeley.edu
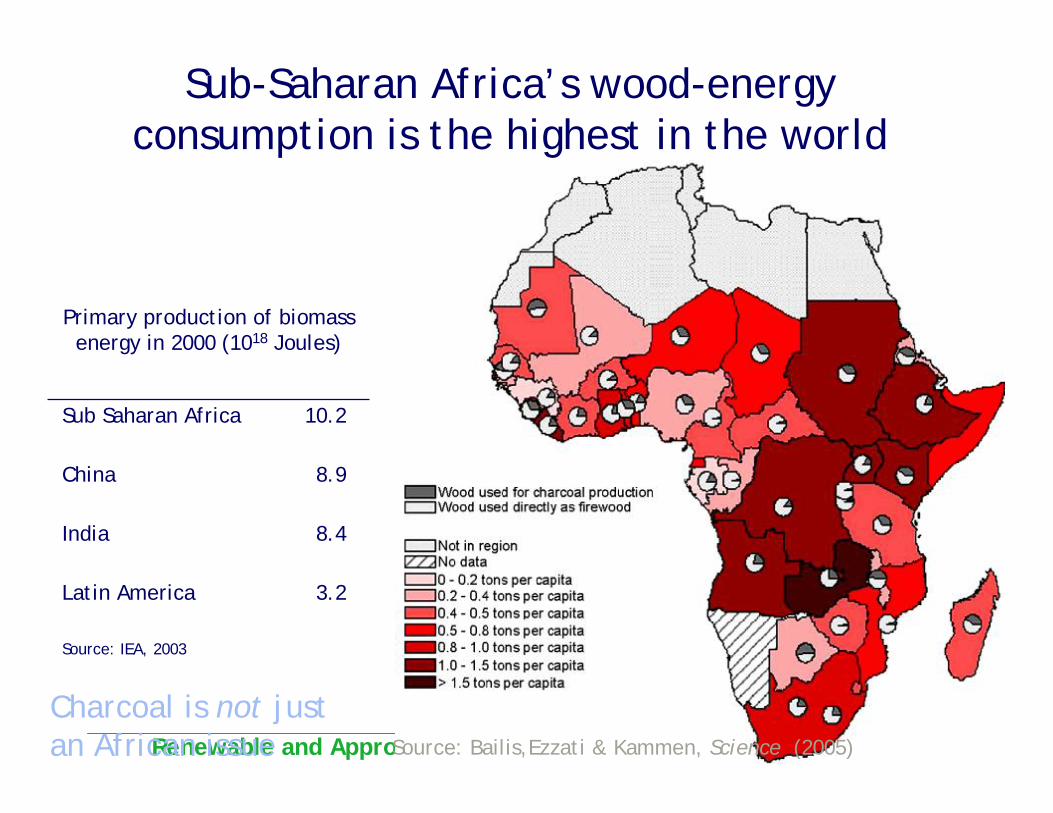
Sub-Saharan Africa’s wood-energy consumption is the highest in the world
Source: Bailis,Ezzati & Kammen, Science (2005)
3.2Latin America
Source: IEA, 2003
8.4India
8.9China
10.2Sub Saharan Africa
Primary production of biomass energy in 2000 (1018 Joules)
Charcoal is not just an African issue
Renewable and Appropriate Energy Laboratory - rael.berkeley.edu
0
200
400
600
800
2000 2005 2010 2015 2020 2025 2030Year
BAU C
F RC
RF
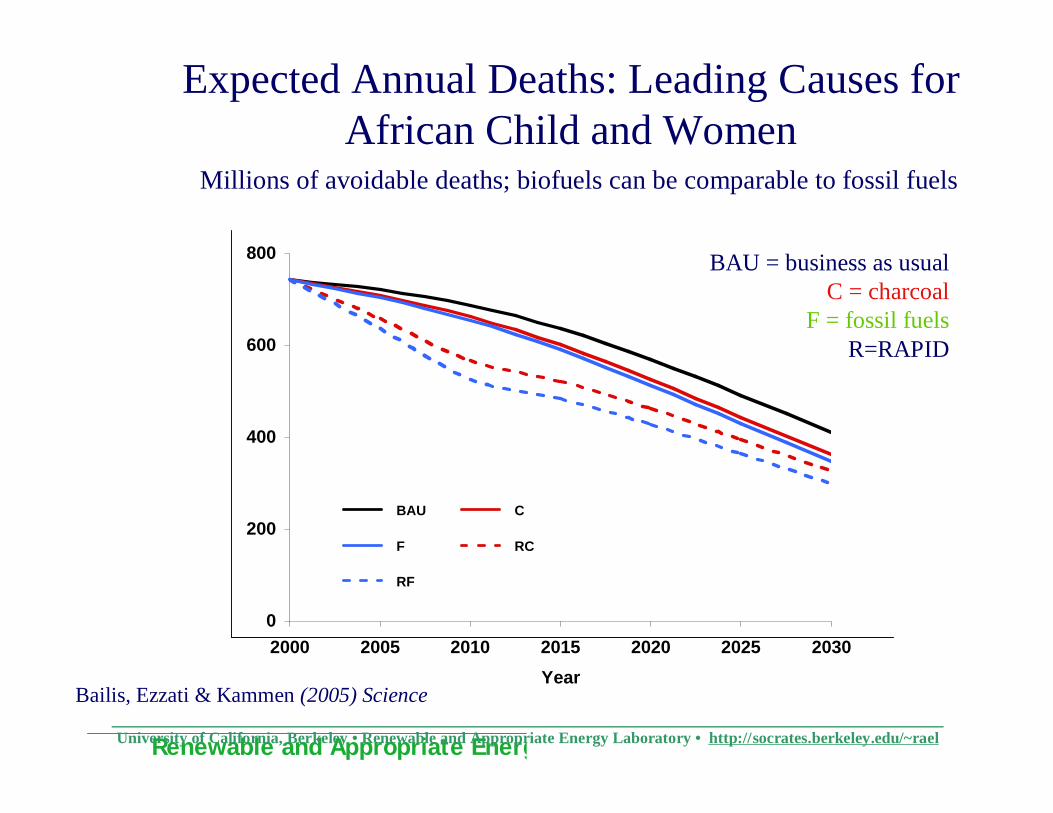
Expected Annual Deaths: Leading Causes for African Child and Women
Millions of avoidable deaths; biofuels can be comparable to fossil fuels
University of California, Berkeley • Renewable and Appropriate Energy Laboratory • http://socrates.berkeley.edu/~rael
BAU = business as usualC = charcoal
F = fossil fuelsR=RAPID
Bailis, Ezzati & Kammen (2005) Science
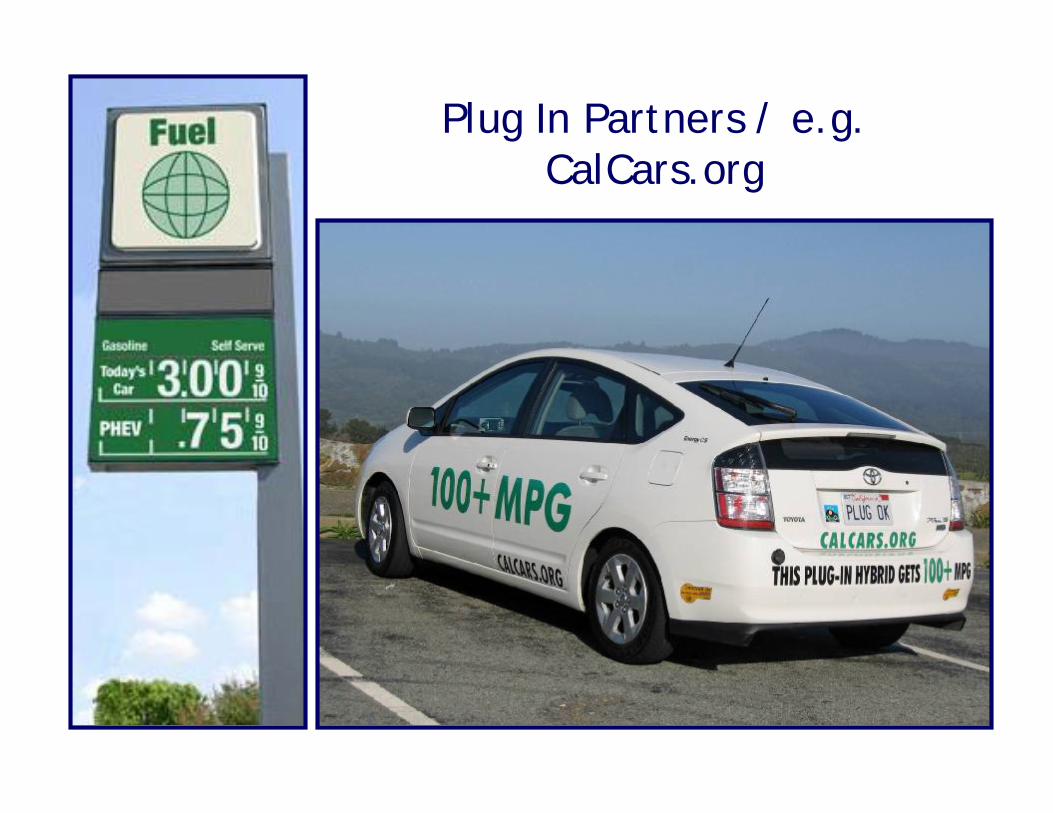
Plug In Partners / e.g.CalCars.org
Renewable and Appropriate Energy Laboratory - rael.berkeley.edu
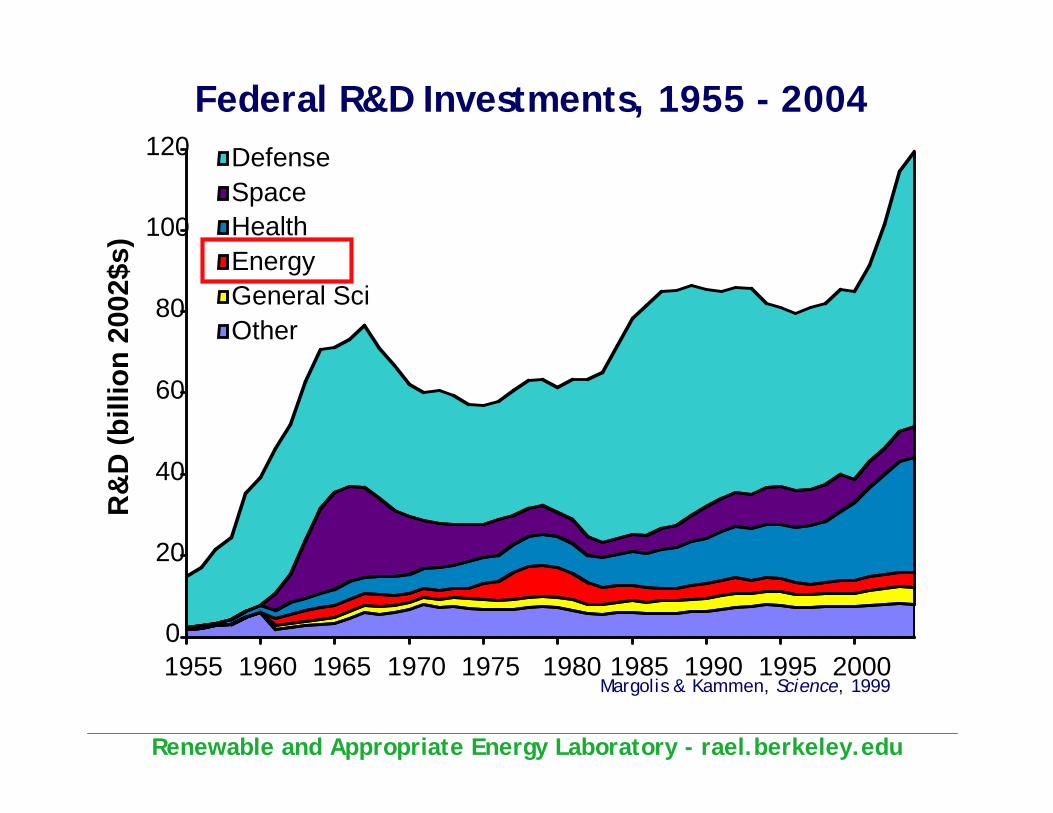
0
20
40
60
80
100
120
1955 1960 1965 1970 1975 1980 1985 1990 1995 2000
R&
D (b
illio
n 20
02$s
)DefenseSpaceHealthEnergyGeneral ScienceOther
Federal R&D Investments, 1955 - 2004
Margolis & Kammen, Science, 1999
Renewable and Appropriate Energy Laboratory - rael.berkeley.edu
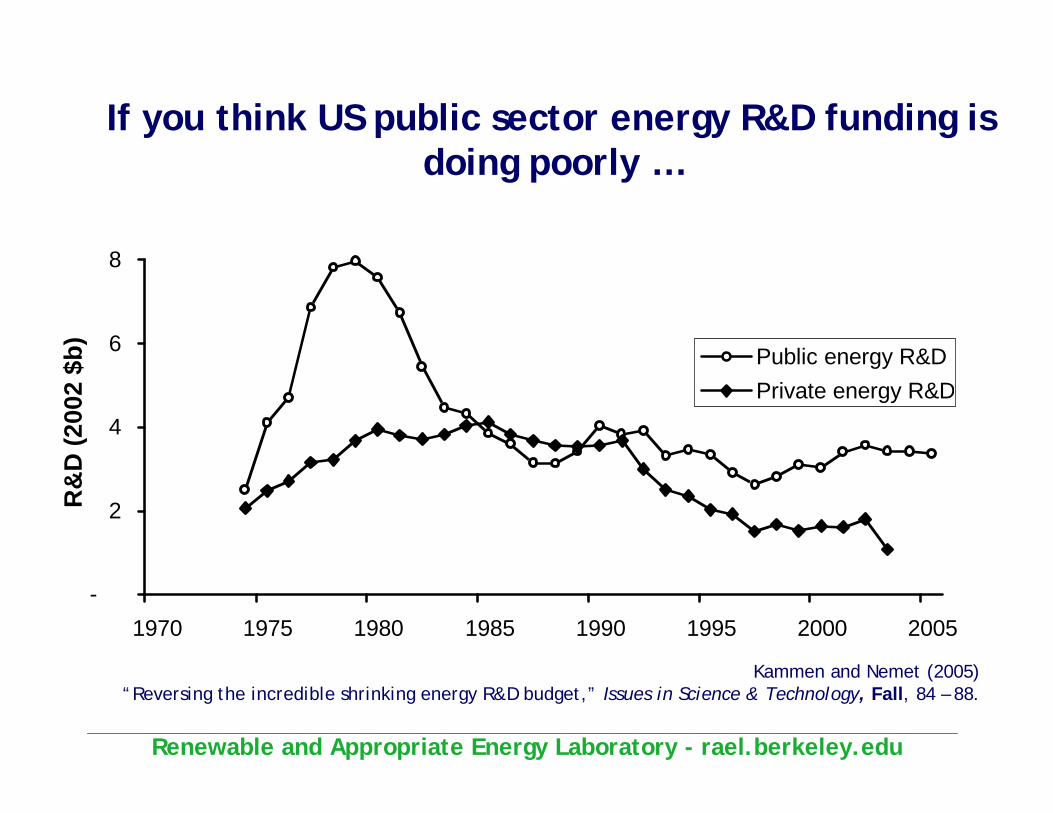
If you think US public sector energy R&D funding is doing poorly …
Kammen and Nemet (2005) “Reversing the incredible shrinking energy R&D budget,” Issues in Science & Technology, Fall, 84 – 88.
-
2
4
6
8
1970 1975 1980 1985 1990 1995 2000 2005
R&
D (2
002
$b)
Public energy R&DPrivate energy R&D

Kammen and Nemet (2005) “Reversing the incredible shrinking energy R&D budget,” Issues in Science & Technology, Fall, 84 – 88.
And Nemet, dissertation, 2007
Patents and R&D Funding Correlated

Renewable and Appropriate Energy Laboratory - rael.berkeley.edu
Renewable Energy Portfolio Standards
23 states + DC, and counting
State Goal
PA: 18%¹ by 2020NJ: 22.5% by 2021
CT: 10% by 2010
MA: 4% by 2009 + 1% annual increase
WI: requirement varies by utility; 10% by 2015 Goal
IA: 105 MW
MN: 10% by 2015 Goal +Xcel mandate of
1,125 MW wind by 2010
TX: 5,880 MW by 2015
*NM: 10% by 2011AZ: 15% by 2025
CA: 20% by 2010
NV: 20% by 2015
ME: 30% by 2000;10% by 2017 goal - new RE
State RPS
*MD: 7.5% by 2019
* Increased credit for solar or other customer-sited renewablesPA: 8% Tier I (renewables)
HI: 20% by 2020
RI: 15% by 2020
CO: 10% by 2015
DC: 11% by 2022
NY: 24% by 2013
MT: 15% by 2015
*DE: 10% by 2019
IL: 8% by 2013
VT: RE meets load growth by 2012
Solar water heating eligible
*WA: 15% by 2020

Renewable and Appropriate Energy Laboratory - rael.berkeley.edu
Solar & Distributed GenerationProvisions in RPS Policies
PA: 0.5% solar PV by 2020
TX: 500 MW non-wind
NM: triple credit for solar electric
AZ: 4.5% DG by 2025
NV: 1% solar by 2015;2.4 to 2.45 multiplier for PV
MD: double credit for solar electric
CO: 0.4% solar electric by 2015
DC: 0.386% solar electric by 2022
NY: 0.1542% customer-sited by 2013
DE: triple credit for solar electric
Solar water heating counts towards solar set-aside
WA: double credit for DG
DG: Distributed Generation
NJ: 2.12% solar electric by 2021
CA: 3,000 MW or more via SB1 & Million solar roofs

Renewable and Appropriate Energy Laboratory - rael.berkeley.edu
Gasoline
Air travel
Gasoline
Automanufacturing
Auto services
public trans.
airlinespublic trans.
Electricity
Naturalgas
Other fuels
Construction
Financingwater & sewage
electricitynatural gasother fuels
Meat
Eating out
Fruit & veg.
Snack food
cereals
DairyAlcohol & tobacco
ClothingHousehold equip.
entertainment.cleaning supplies.
furniture.
healthcaregiving
education
Transportation Housing Food Goods Services
Summary of GHG Emissions for Typical U.S. Household (LEAPS Results) 50 Metric tons of CO2 equivalent gases
IndirectDirect44%
56%
05
101520253035404550
Total

Renewable and Appropriate Energy Laboratory - rael.berkeley.edu
Greenhouse Gas Emissions:Lifecycles & Lifestyle Sources
(Jones, Horvath & Kammen, in press)
furniture
clothing & shoes
appl/equip milk and related products
tools & supplies
butter
cheese
fish
sausage & otherprepared meats
beef, pork, lamb
chicken
eggs
breadsrice
flour & mil l products
tree nuts
oatspet food
corn sweeteners
motor vehicles
-
1.0
2.0
3.0
4.0
0 500 1000 1500 2000 2500gCO2 equivalent / $
gC e
quiv
alen
t / g
Prod
uct key
meatdairyfruit & veggiessnack & othercereals & bakerydrinksgoods
area of ciricle= % of annual average U.S. household consumption

Renewable and Appropriate Energy Laboratory - rael.berkeley.edu
0.0
0.5
1.0
1.5
2.0
2.5
3.0
1990 2000 2010 2020 2030 2040 2050
U.S
. GH
G E
mis
sion
s (G
T C
eq.
)
Historic U. S.
emissions
Business as usual (EIA)
Kyoto protocol
Administration intensity target
California AB 32, AB1493& EE 3-05
Scaled from CAto the nation
Climate Stabilization Zone
Kammen, “September 27, 2006 – A day to remember”, San Francisco Chronicle, September 27,
The California commitment - scaled to the nation
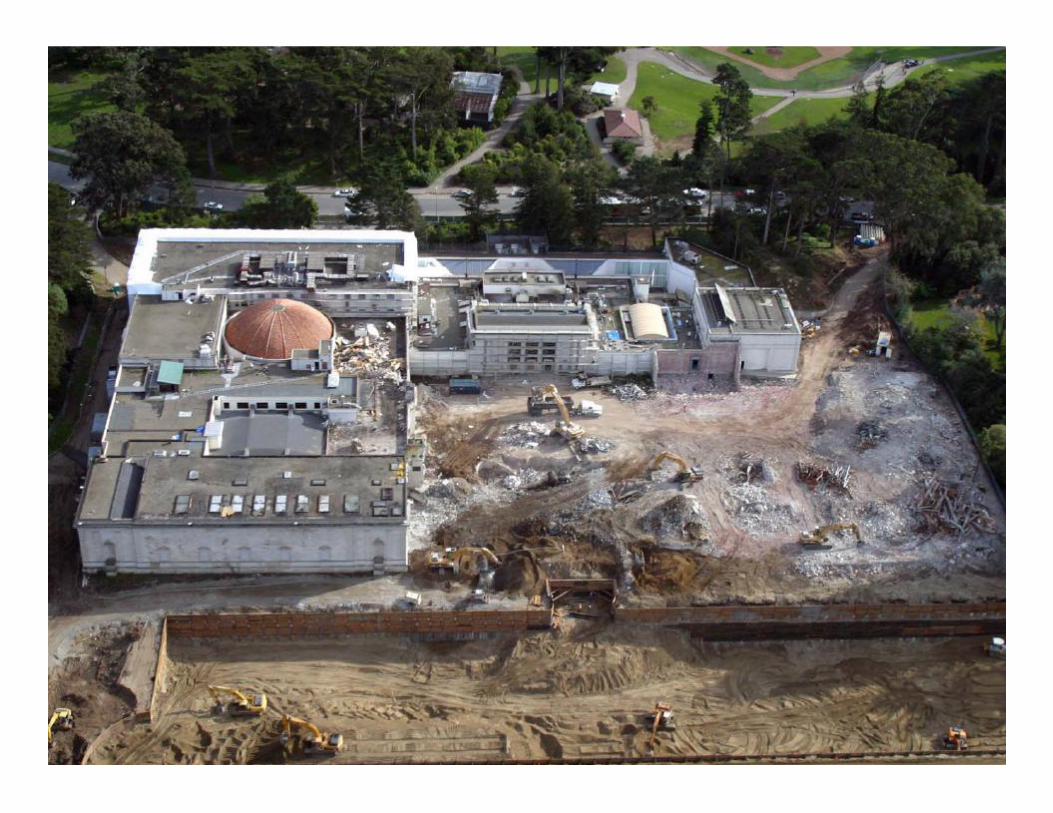

Solar roofing & off-site wind purchases
All materials from reclaimed former building

Renewable and Appropriate Energy Laboratory - rael.berkeley.edu
The Path Ahead
• Clean energy sources today are evolving rapidly, butare a small component of our overall energy system
• Rapid growth of the clean energy sector will require a coordinated commitment to technology push and demand pullo Aggressive R&D will need to be coupled with strong
support for clean energy market expansiono Business and consumer involvement is vital
• Pricing carbon/greenhouse gas emissions is vital to moving from sector support strategies to long-term sustainability policies

Renewable and Appropriate Energy Laboratory - rael.berkeley.edu
Boiling Water ReactorPressurized Water Reactor
Reactor Type
A 1: Westinghouse <700 MWe 2: Westinghouse 700–1000 MWW 3: Westinghouse >1000 MWf 4: Babcock & Wilcox^ 5: Combustion EngineeringG 6: GE <700 MWk 7: GE 700–1000 MW] 8: GE > 1000 MW
Reactor Cohort
0 25 50 75 100Cost Rank
0.00
0.01
0.02
0.03
0.04
0.05
0.06
0.07
0.08
0.09
0.10
0.11
0.12
0.13
0.14
Life
time
leve
lized
ele
ctric
ity c
ost (
2004
$ p
er k
Wh)
k] ] k k ]
]G
k k kG
G
]
]W ]
]] ]
] ]
]]
k
] ]
Gk
k
Fitzpatrick
Susquehanna 1
Perry Columbia
River Bend
Fermi Hope Creek
Nine Mile Pt 2
Clinton
Shoreham
f f e A e Aff
AA ^ e WA e ^ e W e ^ ^f W WW
e e ^ f e e We WWWWW ^ f ^^ ^ ^ e
WWW
f W^ ^
WW W
We WWW
We
^W
W
e
W
Oconee 1 Oconee 2
Surry 1 Turkey Pt 3
Surry 2 Turkey Pt 4
Oconee 3
Arkansas 1
Diablo Canyon 2 Vogtle 2
Shearon Harris South Texas 1 South Texas 2 Diablo Canyon 1 Comanche Pk. 2
Rancho Seco Seabrook 1 Millstone 3 Watts Bar 1
Beaver Valley 2
Comanche Pk 1
Hultman, Koomey & Kammen (2007) ES&T, in press
The Cost of Nuclear Power from the U. S. Civilian Reactor Fleet
Related Documents