The company has just over 11 months of its 2012 operating expenses covered based upon its current gross profit backlog of $1.88million. However, to cover the financing costs of the company and achieve its overall goal of $250,000 of profitability for 2012, the company needs to record an additional $920,000 of gross profit from unassigned contracts, which at a 14.5% average gross margin translates to about $6.3 million of revenue on the unassigned contracts. There seems to be some traction in the regional construction market as construction employment in AnyState, USA rose over 6% during 2011 with the Anytown, USA area showing a gain of 1,800 jobs or 11%. Only 7 states experienced construction job gains of 5% or more in 2011. The fact that AnyState, USA is in this minority leads one to believe that demand for construction services is on the incline in NumberOneConstruction Co., Inc.'s market. Page 1 of 15

Welcome message from author
This document is posted to help you gain knowledge. Please leave a comment to let me know what you think about it! Share it to your friends and learn new things together.
Transcript
The company has just over 11 months of its 2012 operating expenses covered based upon its current gross profit backlog of $1.88million. However, to cover the financing costs of the company and achieve its overall goal of $250,000 of profitability for 2012, the company needs to record an additional $920,000 of gross profit from unassigned contracts, which at a 14.5% average gross margin translates to about $6.3 million of revenue on the unassigned contracts.
There seems to be some traction in the regional construction market as construction employment in AnyState, USA rose over 6% during 2011 with the Anytown, USA area showing a gain of 1,800 jobs or 11%. Only 7 states experienced construction job gains of 5% or more in 2011. The fact that AnyState, USA is in this minority leads one to believe that demand for construction services is on the incline in NumberOneConstruction Co., Inc.'s market.
Page 1 of 15

$‐
$2,000,000
$4,000,000
$6,000,000
$8,000,000
$10,000,000
$12,000,000
$14,000,000
$16,000,000
$18,000,000
$20,000,000
07/11 08/11 09/11 10/11 11/11 12/11 01/12 02/12 03/12 04/12 05/12 06/12
Backlog ‐ Billings
ORIGINAL ORIGINAL ‐ ADJUSTED ROLLING ‐ ACTUAL
$3,500,000
Backlog ‐ Gross Profit
= Total remaining billings on uncompleted jobs.Explanation: This metric shows the $$ amount of billings remaining on uncompleted jobs and shows when the backlog‐billings will expire. This is a good indicator of future cash inflows that will be available to support construction and administrative operations.
ACTUAL
FORECASTED
Page 2 of 15
$‐
$2,000,000
$4,000,000
$6,000,000
$8,000,000
$10,000,000
$12,000,000
$14,000,000
$16,000,000
$18,000,000
$20,000,000
07/11 08/11 09/11 10/11 11/11 12/11 01/12 02/12 03/12 04/12 05/12 06/12
Backlog ‐ Billings
ORIGINAL ORIGINAL ‐ ADJUSTED ROLLING ‐ ACTUAL
$‐
$500,000
$1,000,000
$1,500,000
$2,000,000
$2,500,000
$3,000,000
$3,500,000
07/11 08/11 09/11 10/11 11/11 12/11 01/12 02/12 03/12 04/12 05/12 06/12
Backlog ‐ Gross Profit
ORIGINAL ORIGINAL ‐ ADJUSTED ROLLING ‐ ACTUAL
= Total remaining billings on uncompleted jobs.Explanation: This metric shows the $$ amount of billings remaining on uncompleted jobs and shows when the backlog‐billings will expire. This is a good indicator of future cash inflows that will be available to support construction and administrative operations.
= Total remaining Gross Profit on uncompleted jobs.Explanation: This metric shows the $$ amount of Gross Profit remaining on uncompleted jobs and shows when the backlog will expire. This metric carries slightly more weight than the backlog billings as it shows the remaining profitability to be recognized on uncompleted jobs, and profits are what drive improved equity and working capital.
ACTUAL
ACTUAL
FORECASTED
FORECASTED
Page 2 of 15
0
Net Over/(Under) Billings
‐
5
10
15
20
25
07/11 08/11 09/11 10/11 11/11 12/11 01/12 02/12 03/12 04/12 05/12 06/12
Months Backlog
ORIGINAL ORIGINAL ‐ ADJUSTED ROLLING ‐ ACTUAL
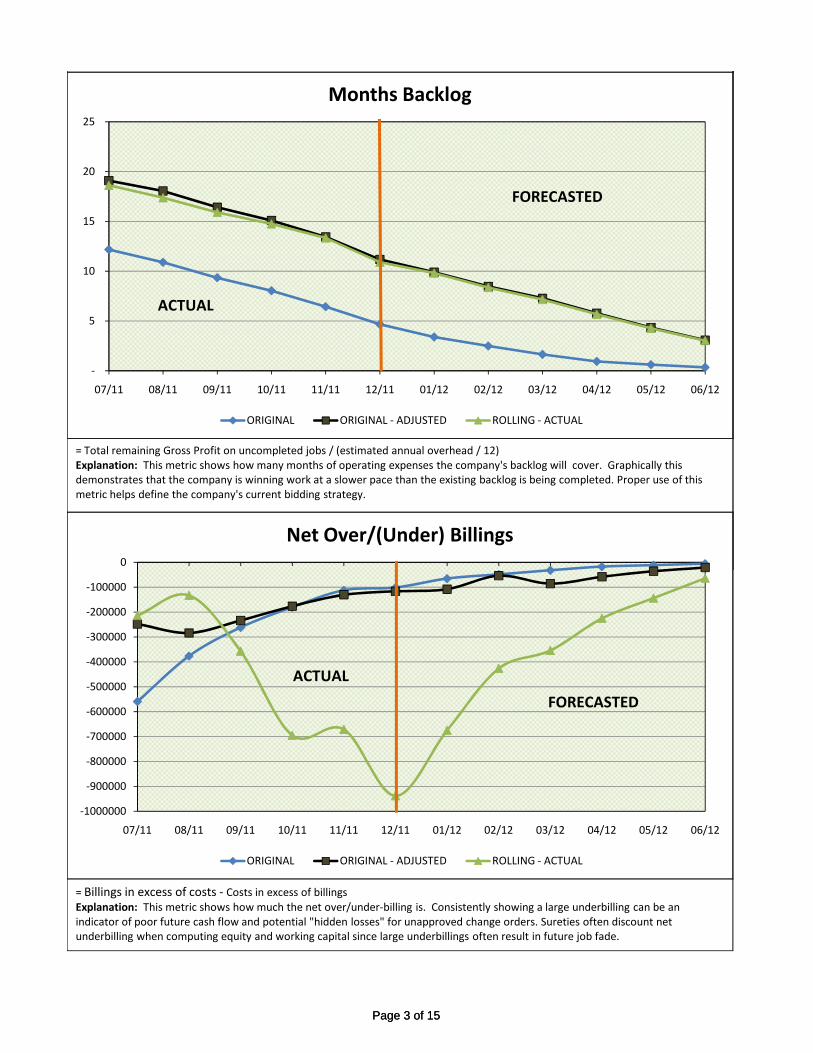
= Total remaining Gross Profit on uncompleted jobs / (estimated annual overhead / 12)Explanation: This metric shows how many months of operating expenses the company's backlog will cover. Graphically this demonstrates that the company is winning work at a slower pace than the existing backlog is being completed. Proper use of this metric helps define the company's current bidding strategy.
ACTUAL
FORECASTED
Page 3 of 15
‐1000000
‐900000
‐800000
‐700000
‐600000
‐500000
‐400000
‐300000
‐200000
‐100000
0
07/11 08/11 09/11 10/11 11/11 12/11 01/12 02/12 03/12 04/12 05/12 06/12
Net Over/(Under) Billings
ORIGINAL ORIGINAL ‐ ADJUSTED ROLLING ‐ ACTUAL
‐
5
10
15
20
25
07/11 08/11 09/11 10/11 11/11 12/11 01/12 02/12 03/12 04/12 05/12 06/12
Months Backlog
ORIGINAL ORIGINAL ‐ ADJUSTED ROLLING ‐ ACTUAL
= Billings in excess of costs ‐ Costs in excess of billings Explanation: This metric shows how much the net over/under‐billing is. Consistently showing a large underbilling can be an indicator of poor future cash flow and potential "hidden losses" for unapproved change orders. Sureties often discount net underbilling when computing equity and working capital since large underbillings often result in future job fade.
= Total remaining Gross Profit on uncompleted jobs / (estimated annual overhead / 12)Explanation: This metric shows how many months of operating expenses the company's backlog will cover. Graphically this demonstrates that the company is winning work at a slower pace than the existing backlog is being completed. Proper use of this metric helps define the company's current bidding strategy.
ACTUAL
ACTUAL
FORECASTED
FORECASTED
Page 3 of 15

The company achieved about $215,000 of net income for the 4th quarter of 2011. An exponential improvement considering the losses through the 3rd quarter were about $1.26 million. Based on only the backlog of jobs, we forecast the company starting off the year with a profitable first quarter of about $53,000, which is 21% of the $250,000 goal for 2012 and would put the company right behind the pace to achieve this goal. However, additional unassigned contracts will need to be won to keep the company rolling towards its target of $250,000 as the existing backlog will only help generate about $27,000 of net income in the 2nd quarter.
Page 4 of 15

$2,000,000
Year‐to‐Date Direct Gross Profit
‐50.0%
‐40.0%
‐30.0%
‐20.0%
‐10.0%
0.0%
10.0%
20.0%
30.0%
07/11 08/11 09/11 10/11 11/11 12/11 01/12 02/12 03/12 04/12 05/12 06/12
Monthly Direct Gross Profit%
ORIGINAL ORIGINAL ‐ ADJUSTED ROLLING ‐ ACTUAL
=Monthly Gross Profit (no depreciation) /Monthly RevenueExplanation: This number indicates the percentage of sales revenue that is not paid out in direct job costs. Higher is better. Jobs appear to be more profitable in the 4th quarter than originally budgeted. This can be the result of better management and animproving market.
ACTUAL FORECASTED
Page 5 of 15
$(1,000,000)
$(500,000)
$‐
$500,000
$1,000,000
$1,500,000
$2,000,000
07/11 08/11 09/11 10/11 11/11 12/11 01/12 02/12 03/12 04/12 05/12 06/12
Year‐to‐Date Direct Gross Profit
ORIGINAL ORIGINAL ‐ ADJUSTED ROLLING ‐ ACTUAL
‐50.0%
‐40.0%
‐30.0%
‐20.0%
‐10.0%
0.0%
10.0%
20.0%
30.0%
07/11 08/11 09/11 10/11 11/11 12/11 01/12 02/12 03/12 04/12 05/12 06/12
Monthly Direct Gross Profit%
ORIGINAL ORIGINAL ‐ ADJUSTED ROLLING ‐ ACTUAL
= Year to date Gross Profit (no depreciation) (January resets to "0" as it is a new year.)Explanation: This number indicates the year‐to‐date $$ amount of sales revenue that is not paid out in direct cob costs. Higher is better (the company is more efficient). By mid 2012 we are expecting the company to have generated more gross profit than it did for all of 2011. The impact of the university job in AnyState, USA is the primary culprit of the poor 2011 margin.
=Monthly Gross Profit (no depreciation) /Monthly RevenueExplanation: This number indicates the percentage of sales revenue that is not paid out in direct job costs. Higher is better. Jobs appear to be more profitable in the 4th quarter than originally budgeted. This can be the result of better management and animproving market.
ACTUAL
ACTUAL
FORECASTED
FORECASTED
Page 5 of 15

$1,000,000
Year‐to‐Date Operating Profit
= Year to date Gross Profit (no depreciation) (January resets to "0" as it is a new year.)Explanation: This number indicates the year‐to‐date % of sales revenue that is not paid out in direct cob costs. Higher is better (the company is more efficient). Every job needs to be reconciled at various points during the project to see if there are lessons to be learned, losses to mitigate, or additional profits to earn.
‐10.0%
‐5.0%
0.0%
5.0%
10.0%
15.0%
20.0%
07/11 08/11 09/11 10/11 11/11 12/11 01/12 02/12 03/12 04/12 05/12 06/12
Year‐to‐date Direct GM %
ORIGINAL ORIGINAL ‐ ADJUSTED ROLLING ‐ ACTUAL
FORECASTED
ACTUAL
Page 6 of 15
$(2,000,000)
$(1,500,000)
$(1,000,000)
$(500,000)
$‐
$500,000
$1,000,000
07/11 08/11 09/11 10/11 11/11 12/11 01/12 02/12 03/12 04/12 05/12 06/12
Year‐to‐Date Operating Profit
ORIGINAL ORIGINAL ‐ ADJUSTED ROLLING ‐ ACTUAL
= Year‐to‐date Operating Profit (January resets to "0" as it is a new year.)Explanation: This number indicates the year‐to‐date $$ amount of sales revenue that is not paid out in direct job costs and overhead. Higher is better. Operating profit is the result of keeping your hand on all 3 dials; Revenue, Margin and Overhead. Complacency and being comfortable are threats to operating profits.
ACTUAL
FORECASTED
= Year to date Gross Profit (no depreciation) (January resets to "0" as it is a new year.)Explanation: This number indicates the year‐to‐date % of sales revenue that is not paid out in direct cob costs. Higher is better (the company is more efficient). Every job needs to be reconciled at various points during the project to see if there are lessons to be learned, losses to mitigate, or additional profits to earn.
‐10.0%
‐5.0%
0.0%
5.0%
10.0%
15.0%
20.0%
07/11 08/11 09/11 10/11 11/11 12/11 01/12 02/12 03/12 04/12 05/12 06/12
Year‐to‐date Direct GM %
ORIGINAL ORIGINAL ‐ ADJUSTED ROLLING ‐ ACTUAL
FORECASTED
ACTUAL
Page 6 of 15

$(2,000,000)
$(1,500,000)
$(1,000,000)
$(500,000)
$‐
$500,000
07/11 08/11 09/11 10/11 11/11 12/11 01/12 02/12 03/12 04/12 05/12 06/12
Year‐to‐Date Net Profit
ORIGINAL ORIGINAL ‐ ADJUSTED ROLLING ‐ ACTUAL
9.0%
Monthly Operational Payroll %
= Year‐to‐date Adjusted Net Profit before Taxes (January resets to "0" as it is a new year.)Explanation: This is one of the more important barometers that we look at. It measures how much of the company's revenue it can retain to improve its balance sheet.
ACTUAL
FORECASTED
Page 7 of 15
$(2,000,000)
$(1,500,000)
$(1,000,000)
$(500,000)
$‐
$500,000
07/11 08/11 09/11 10/11 11/11 12/11 01/12 02/12 03/12 04/12 05/12 06/12
Year‐to‐Date Net Profit
ORIGINAL ORIGINAL ‐ ADJUSTED ROLLING ‐ ACTUAL
0.0%
1.0%
2.0%
3.0%
4.0%
5.0%
6.0%
7.0%
8.0%
9.0%
07/11 08/11 09/11 10/11 11/11 12/11 01/12 02/12 03/12 04/12 05/12 06/12
Monthly Operational Payroll %
ORIGINAL ORIGINAL ‐ ADJUSTED ROLLING ‐ ACTUAL
= Year‐to‐date Adjusted Net Profit before Taxes (January resets to "0" as it is a new year.)Explanation: This is one of the more important barometers that we look at. It measures how much of the company's revenue it can retain to improve its balance sheet.
= Monthly G & A Payroll Expense / Monthly RevenueExplanation: This metric shows G & A payroll expense for the company as a percentage of revenue. Note: G&A payroll is a relatively flat amount, but ratio helps to understand if overhead is staffed appropriately for the revenue levels. Change from prior reports is due to payroll reclassed to patent.
ACTUAL
ACTUAL
FORECASTED
FORECASTED
Page 7 of 15

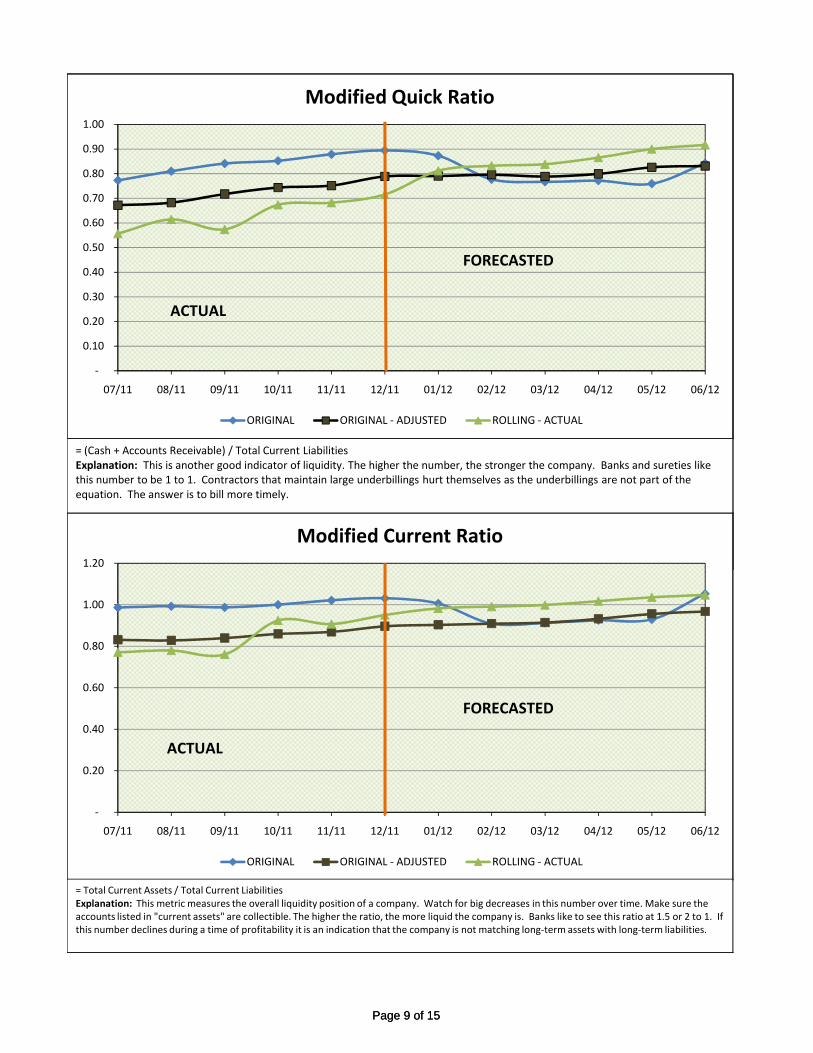
The 4th quarter profit and restructuring of debt has improved the company 's current ratio from about 1.21 in 2010 to 1.80. Without the debt restructure, a "modified" current ratio would be 0.99. This is a dramatic improvement from the 0.80 calculated at September 30, 2011. As the modified ratio gets above the 1.00 mark, positive working capital will be generated. Getting above the line in this metric is vital to the organization as it is an indicator of the health of the company. Even though the modified working capital balance won't be as high as it should be for a healthy organization, the growth seen in this area since June 2011 is fantastic. The company has risen from its lowest depth of a $1.6 million modified working capital deficiency to a deficiency under $65,000. Continued improvement in these areas for 2012 will get the modified tangible working capital balance into a positive position.
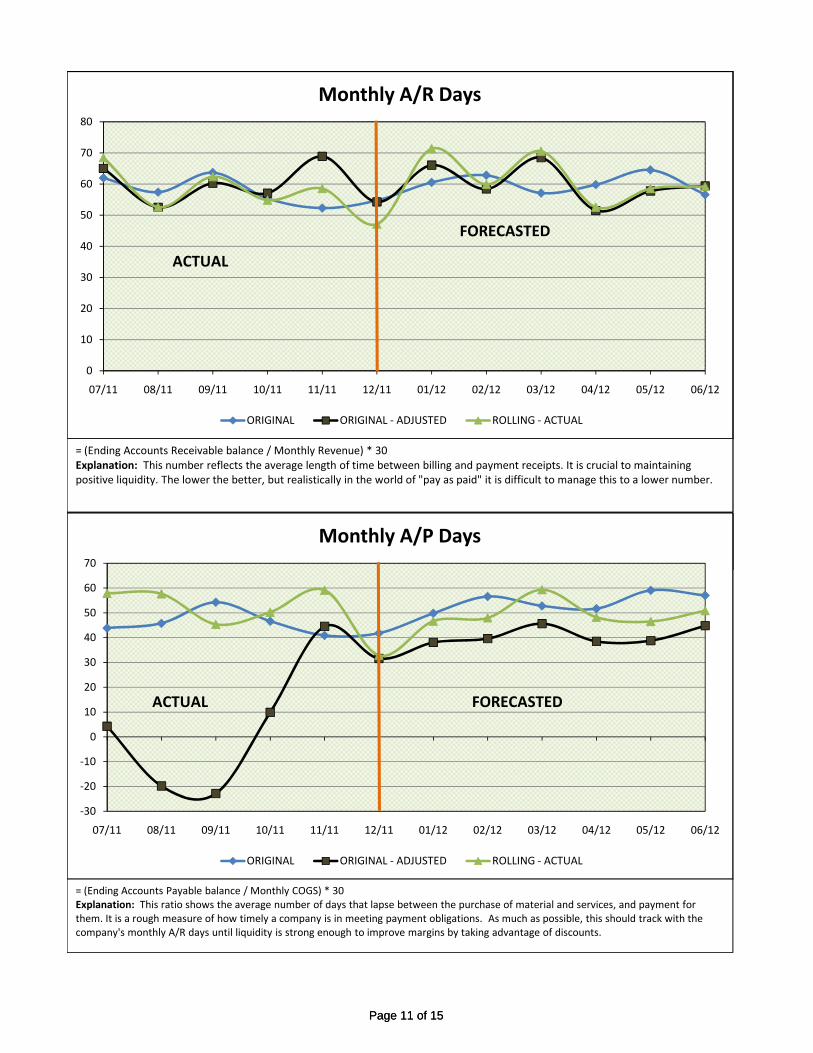
The company continues to do a good job of tracking and controlling its receivables and payables as the average days collection and payment for these two metrics are well within reason and translate to a quick conversion period of generating cash. The A/R days has seen an improvement due to one customers paying quicker.
The company is close to generating consistent positive cash flow from operations. For the 4th quarter, the company realized about a negative $85,000 of operating cash flow, which is consistent with the 3rd quarter, but with all the positive growth coming in the 1st quarter of 2012, the company should see a positive result in this metric.
Note ‐ The ratios and metrics identified above have been "modified" to include the working capital line of credit in current liabilities.
Page 8 of 15
‐
0.10
0.20
0.30
0.40
0.50
0.60
0.70
0.80
0.90
1.00
07/11 08/11 09/11 10/11 11/11 12/11 01/12 02/12 03/12 04/12 05/12 06/12
Modified Quick Ratio
ORIGINAL ORIGINAL ‐ ADJUSTED ROLLING ‐ ACTUAL
1.20
Modified Current Ratio
= (Cash + Accounts Receivable) / Total Current LiabilitiesExplanation: This is another good indicator of liquidity. The higher the number, the stronger the company. Banks and sureties like this number to be 1 to 1. Contractors that maintain large underbillings hurt themselves as the underbillings are not part of the equation. The answer is to bill more timely.
ACTUAL
FORECASTED
Page 9 of 15
‐
0.10
0.20
0.30
0.40
0.50
0.60
0.70
0.80
0.90
1.00
07/11 08/11 09/11 10/11 11/11 12/11 01/12 02/12 03/12 04/12 05/12 06/12
Modified Quick Ratio
ORIGINAL ORIGINAL ‐ ADJUSTED ROLLING ‐ ACTUAL
‐
0.20
0.40
0.60
0.80
1.00
1.20
07/11 08/11 09/11 10/11 11/11 12/11 01/12 02/12 03/12 04/12 05/12 06/12
Modified Current Ratio
ORIGINAL ORIGINAL ‐ ADJUSTED ROLLING ‐ ACTUAL
= Total Current Assets / Total Current LiabilitiesExplanation: This metric measures the overall liquidity position of a company. Watch for big decreases in this number over time. Make sure the accounts listed in "current assets" are collectible. The higher the ratio, the more liquid the company is. Banks like to see this ratio at 1.5 or 2 to 1. If this number declines during a time of profitability it is an indication that the company is not matching long‐term assets with long‐term liabilities.
= (Cash + Accounts Receivable) / Total Current LiabilitiesExplanation: This is another good indicator of liquidity. The higher the number, the stronger the company. Banks and sureties like this number to be 1 to 1. Contractors that maintain large underbillings hurt themselves as the underbillings are not part of the equation. The answer is to bill more timely.
ACTUAL
ACTUAL
FORECASTED
FORECASTED
Page 9 of 15

$(2,000,000)
$(1,500,000)
$(1,000,000)
$(500,000)
$‐
$500,000
07/11 08/11 09/11 10/11 11/11 12/11 01/12 02/12 03/12 04/12 05/12 06/12
Modified Working Capital
ORIGINAL ORIGINAL ‐ ADJUSTED ROLLING ‐ ACTUAL
= Total Current Assets ‐ Total Current LiabilitiesExplanation: Generally, this metric measures the overall liquidity position of a company in dollars. While not a perfect measurement, it is a good one. Watch for big decreases over time. Make sure the accounts listed in "current assets" are collectible. The higher the ratio, the more liquid the company is.
$‐
Modified Tangible Working Capital
ACTUAL
FORECASTED
Page 10 of 15
$(2,000,000)
$(1,500,000)
$(1,000,000)
$(500,000)
$‐
$500,000
07/11 08/11 09/11 10/11 11/11 12/11 01/12 02/12 03/12 04/12 05/12 06/12
Modified Working Capital
ORIGINAL ORIGINAL ‐ ADJUSTED ROLLING ‐ ACTUAL
= Total Current Assets ‐ Total Current LiabilitiesExplanation: Generally, this metric measures the overall liquidity position of a company in dollars. While not a perfect measurement, it is a good one. Watch for big decreases over time. Make sure the accounts listed in "current assets" are collectible. The higher the ratio, the more liquid the company is.
$(2,500,000)
$(2,000,000)
$(1,500,000)
$(1,000,000)
$(500,000)
$‐
07/11 08/11 09/11 10/11 11/11 12/11 01/12 02/12 03/12 04/12 05/12 06/12
Modified Tangible Working Capital
ORIGINAL ORIGINAL ‐ ADJUSTED ROLLING ‐ ACTUAL
=( Total Current Assets ‐ Prepaid Expenses ‐ 50% inventory) ‐ Total Current LiabilitiesExplanation: This metric measures the overall liquidity position of a company. It is a better measure of net cash available for operations than is traditional working capital. Remember, in construction we define cash as your ability to execute transactions.
ACTUAL
ACTUAL
FORECASTED
FORECASTED
Page 10 of 15
0
10
20
30
40
50
60
70
80
07/11 08/11 09/11 10/11 11/11 12/11 01/12 02/12 03/12 04/12 05/12 06/12
Monthly A/R Days
ORIGINAL ORIGINAL ‐ ADJUSTED ROLLING ‐ ACTUAL
70
Monthly A/P Days
= (Ending Accounts Receivable balance / Monthly Revenue) * 30Explanation: This number reflects the average length of time between billing and payment receipts. It is crucial to maintaining positive liquidity. The lower the better, but realistically in the world of "pay as paid" it is difficult to manage this to a lower number.
ACTUAL
FORECASTED
Page 11 of 15
0
10
20
30
40
50
60
70
80
07/11 08/11 09/11 10/11 11/11 12/11 01/12 02/12 03/12 04/12 05/12 06/12
Monthly A/R Days
ORIGINAL ORIGINAL ‐ ADJUSTED ROLLING ‐ ACTUAL
‐30
‐20
‐10
0
10
20
30
40
50
60
70
07/11 08/11 09/11 10/11 11/11 12/11 01/12 02/12 03/12 04/12 05/12 06/12
Monthly A/P Days
ORIGINAL ORIGINAL ‐ ADJUSTED ROLLING ‐ ACTUAL
= (Ending Accounts Payable balance / Monthly COGS) * 30Explanation: This ratio shows the average number of days that lapse between the purchase of material and services, and payment for them. It is a rough measure of how timely a company is in meeting payment obligations. As much as possible, this should track with the company's monthly A/R days until liquidity is strong enough to improve margins by taking advantage of discounts.
= (Ending Accounts Receivable balance / Monthly Revenue) * 30Explanation: This number reflects the average length of time between billing and payment receipts. It is crucial to maintaining positive liquidity. The lower the better, but realistically in the world of "pay as paid" it is difficult to manage this to a lower number.
ACTUAL
ACTUAL
FORECASTED
FORECASTED
Page 11 of 15

(4,000,000)
(3,000,000)
(2,000,000)
(1,000,000)
‐
1,000,000
2,000,000
3,000,000
07/11 08/11 09/11 10/11 11/11 12/11 01/12 02/12 03/12 04/12 05/12 06/12
Cash Flow From Operations ‐ Trailing 3 Months
ORIGINAL ORIGINAL ‐ ADJUSTED ROLLING ‐ ACTUAL
= sum of current month and prior 2 months operating cash flowExplanation: This metric measures how much cash flow was generated or lost from the monthly operations for a rolling period of 3 months.
FORECASTED
ACTUAL
Page 12 of 15Page 12 of 15

The company's results for 2011 did not put it in a good position in terms of its debt leverage (total debt vs. its annualized EBITDA), but this does need to be looked at in two segmented periods:
From 1/1/11 thru 6/30/11 the ratio was: 8,536,157 : ‐1,829,782 = ‐4.67From 7/1/11 thru 12/31/11 the ratio was: 9,799,030 : 1,154,393 = 8.49
The company is not leveraging its debt adequately, but it is a major improvement from where it stood just 6 months ago. As the company moves forward thru 2012 the ratio will start fresh and improve as the company consistently earns profits.
Aside from the company's debt leverage position is its ability to pay its financing obligations (interest), which has been positive and should stay that way through 2012.
The company has seen improvement all around, but continued improvement for several years will be needed to knock down its long term debt levels, which currently sit at about $4.5 million, not including the line of credit of $3.5 million. Strengthening the balance sheet needs to be the company's primary objective. This will allow it to become independent of debt financing and put itself in a leverage position to take advantage of its leadership position in the AnyState, USA marketplace.
Page 13 of 15

6.00
Monthly Interest Coverage Ratio
‐50.0
‐40.0
‐30.0
‐20.0
‐10.0
0.0
10.0
20.0
07/11 08/11 09/11 10/11 11/11 12/11 01/12 02/12 03/12 04/12 05/12 06/12
Year to Date Debt Leverage
ORIGINAL ORIGINAL ‐ ADJUSTED ROLLING ‐ ACTUAL
= Total Liabilities / Year to Date EBITDAExplanation: This ratio measures a company's ability to repay debt obligations from annualized operating cash flow (EBITDA). Theratio will be off for 2011 as it requires an annualized EBITDA calculation, which doesn't not account for the upswing experienced in the 4th quarter of 2011.
ACTUAL
FORECASTED
Page 14 of 15
(12.00)
(10.00)
(8.00)
(6.00)
(4.00)
(2.00)
‐
2.00
4.00
6.00
07/11 08/11 09/11 10/11 11/11 12/11 01/12 02/12 03/12 04/12 05/12 06/12
Monthly Interest Coverage Ratio
ORIGINAL ORIGINAL ‐ ADJUSTED ROLLING ‐ ACTUAL
= Monthly EBITDA / Monthly Interest ExpenseExplanation: This ratio measures a company's ability to service debt payments from operating cash flow (EBITDA). An increasing ratio is a good indicator of improving credit quality. The higher the better.
‐50.0
‐40.0
‐30.0
‐20.0
‐10.0
0.0
10.0
20.0
07/11 08/11 09/11 10/11 11/11 12/11 01/12 02/12 03/12 04/12 05/12 06/12
Year to Date Debt Leverage
ORIGINAL ORIGINAL ‐ ADJUSTED ROLLING ‐ ACTUAL
= Total Liabilities / Year to Date EBITDAExplanation: This ratio measures a company's ability to repay debt obligations from annualized operating cash flow (EBITDA). Theratio will be off for 2011 as it requires an annualized EBITDA calculation, which doesn't not account for the upswing experienced in the 4th quarter of 2011.
ACTUAL
ACTUAL
FORECASTED
FORECASTED
Page 14 of 15

‐
0.20
0.40
0.60
0.80
1.00
1.20
1.40
1.60
1.80
07/11 08/11 09/11 10/11 11/11 12/11 01/12 02/12 03/12 04/12 05/12 06/12
Monthly Fixed Asset Turnover
ORIGINAL ORIGINAL ‐ ADJUSTED ROLLING ‐ ACTUAL
5.0
Year to date Return on Equity
= Monthly Revenue/ Gross Fixed AssetsExplanation: This ratio shows the multiple of annualized revenue that each dollar of gross fixed assets is producing. The higher the more effective the company's investments in Net Property, Plant, and Equipment are.
Y d /
ACTUAL
FORECASTED
Page 15 of 15
‐
0.20
0.40
0.60
0.80
1.00
1.20
1.40
1.60
1.80
07/11 08/11 09/11 10/11 11/11 12/11 01/12 02/12 03/12 04/12 05/12 06/12
Monthly Fixed Asset Turnover
ORIGINAL ORIGINAL ‐ ADJUSTED ROLLING ‐ ACTUAL
(40.0)
(35.0)
(30.0)
(25.0)
(20.0)
(15.0)
(10.0)
(5.0)
‐
5.0
07/11 08/11 09/11 10/11 11/11 12/11 01/12 02/12 03/12 04/12 05/12 06/12
Year to date Return on Equity
ORIGINAL ORIGINAL ‐ ADJUSTED ROLLING ‐ ACTUAL
= Monthly Revenue/ Gross Fixed AssetsExplanation: This ratio shows the multiple of annualized revenue that each dollar of gross fixed assets is producing. The higher the more effective the company's investments in Net Property, Plant, and Equipment are.
Y d /
= Year to Date Net Income / Total EquityExplanation: This measure shows how much profit is being returned on the shareholders' equity each year. It is a vital statistic from the perspective of equity holders in a company. The higher the better.
ACTUAL
ACTUAL
FORECASTED
FORECASTED
Page 15 of 15
Related Documents