1 Forecast TNUoS tariffs from 2016/17 to 2019/20 This information paper provides a forecast of Transmission Network Use of System (TNUoS) tariffs from 2016/17 to 2019/20. These tariffs apply to generators and suppliers. This annual publication is intended to show how tariffs may evolve over the next five years. The forecast tariffs for 2016/17 will be refined throughout the year. 28 January 2015 Version 1.0 Tariff Information Paper

Welcome message from author
This document is posted to help you gain knowledge. Please leave a comment to let me know what you think about it! Share it to your friends and learn new things together.
Transcript
1
Forecast TNUoStariffs from 2016/17 to2019/20
This information paper provides a forecast of TransmissionNetwork Use of System (TNUoS) tariffs from 2016/17 to2019/20. These tariffs apply to generators and suppliers.
This annual publication is intended to show how tariffs mayevolve over the next five years. The forecast tariffs for2016/17 will be refined throughout the year.
28 January 2015
Version 1.0
Tariff Information Paper
2
Contents
1. Executive Summary....................................................................................4
2. Five Year Tariff Forecast Tables ...............................................................5
2.1 Generation Tariffs ................................................................................. 5
2.2 Onshore Local Circuit Tariffs ..............................................................10
2.3 Onshore Local Substation Tariffs .......................................................12
2.4 Offshore Local Tariffs .........................................................................12
2.5 Demand Tariffs ...................................................................................13
3. Key Drivers for Tariff Changes................................................................14
3.1 CMP213 (Project TransmiT) ...............................................................14
3.2 HVDC Circuits.....................................................................................14
3.3 Contracted Generation .......................................................................15
3.4 Generation/Demand Revenue Proportions ........................................15
3.5 Transmission Owners’ Revenue.........................................................16
3.6 Demand Forecasts .............................................................................17
3.7 Other model inputs .............................................................................18
4. Commentary on Forecast Generation Tariffs ........................................21
4.1 Wider Zonal Generation Tariffs...........................................................21
4.2 Changes in the Generator Residual ...................................................23
4.3 Onshore Local Circuit Tariffs ..............................................................23
4.4 Onshore Local Substation Tariffs .......................................................24
4.5 Small Generators Discount.................................................................24
5. Commentary on Forecast Demand Tariffs .............................................25
5.2 Half-Hourly Demand Tariffs (£/kW).....................................................25
5.3 Non Half-Hourly Demand Tariffs (p/kWh)...........................................26
5.4 Residual Demand Changes................................................................27
5.5 Locational Demand Changes .............................................................27
6. Generation and Demand Revenue Proportions.....................................28
7. Generation and Demand Residuals ........................................................29
7.1 Effect of Changing Demand Charging Bases.....................................30
8. Tools and Supporting Information..........................................................31
8.1 Discussing Tariff Changes..................................................................31
8.2 Future Updates to Tariff Forecasts .....................................................31
8.3 Charging Models.................................................................................31
8.4 Tools and Useful Guides ....................................................................31
9. Comments & Feedback ............................................................................32
Any Questions?
Contact:
Mary Owen
Stuart Boyle
mary.owen@nationalgrid.
com
stuart.boyle@nationalgrid
.com
Mary: 01926 653845
Stuart: 01926 655588
Team: 01926 654633

3
Appendix A : Treatment of HVDC Links.......................................................34
Appendix B : TNUoS Tariffs without HVDC Links.......................................36
Appendix C : Revenue Analysis....................................................................40
Appendix D : Contracted Generation Changes from 16/17 to 19/20 .........45
Appendix E : Zonal Summaries of Modelled Demand................................51
Appendix F : Generation Zone Map..............................................................52
Appendix G : Demand Zone Map .................................................................53
Disclaimer
This report is published without prejudice and whilst every effort has been made to ensure the accuracy of the
information, it is subject to several estimations and forecasts and may not bear relation to either the indicative or
actual tariffs National Grid will publish at later dates.

4
1. Executive Summary
This document contains our forecast of how Transmission Network Use of System (TNUoS) tariffs will change
between 2016/17 and 2019/20. TNUoS is paid by generators and suppliers for use of the GB electricity transmission
networks. Tariffs for 2015/16 were discussed in more detail in December’s Draft TNUoS tariffs for 2015/16 and will be
finalised at the end of January 20151. We will update the Tariffs for 2016/17 over the next year and finalise them in
January 2016.
For charging years 2016/17 onwards, we are using the methodology associated with Working-group Alternative Code
Modification 2 of CUSC Modification Proposal CMP213 (Project Transmit) which was approved by Ofgem in July
2014.
Forecasts take into account changes in: Generation and Demand connected to the transmission system; the
transmission network due to investments undertaken by transmission owners (TOs); and TO revenues. TO revenues
include a forecast of inflation, changes to onshore TO allowed revenue under RIIO price controls and a forecast of
offshore transmission owners’ revenue.
An EU regulation limits the average annual use of system charges that generators pay to €2.5/MWh for the
foreseeable future. With rising revenues this limit is reached in 2015/16 and consequently the revenue recovered from
generation is capped and variations in allowed revenue are only reflected in demand tariffs. The generation cap
includes revenue from offshore generators which increases with more offshore transmission networks and this,
combined with an increase in contracted generation, reduces the generation residual meaning that average
Generation tariffs decrease year on year.
There are locational variances in Generation and Demand tariffs in 2017/18 due to the Western HVDC link which for
the purposes of this report is assumed to commission in mid-2017. This link between Hunterston in Western Scotland
and Deeside in North Wales is being built to facilitate the delivery of renewable energy between Scotland and England
& Wales. The HVDC link generally increases Generation tariffs in the North and decreases Generation tariffs in the
South, with the opposite effect on Demand tariffs.
In 2018/19, the Caithness-Moray HVDC link is planned to commission and new offshore wind farms in Scotland
increase North to South flows. This generally increases Generation tariffs in the North and decreases Generation
tariffs in the South, with the opposite effect on Demand tariffs. Certain zones do reverse this trend where large scale
Generation projects connect.
1http://www2.nationalgrid.com/UK/Industry-information/System-charges/Electricity-transmission/Approval-conditions/Condition-5/

5
2. Five Year Tariff Forecast Tables
This section contains the Generation and Demand Tariffs for 2016/17 to 2019/20 using the Diversity 1 methodology
which forms part of CMP213 Working-group Alternative Code Modification proposal 2.
The proportion of revenue recovered from Generation and Demand is altered each year to limit the average
generation charge to €2.5/MWh.
2.1 Generation Tariffs
Under the approved CMP213 Diversity 1 methodology the tariff paid by a generator depends on: the zone into which
the generator connects, whether the generator is conventional or intermittent, and the generator’s specific annual load
factor. The tariff is built up from four elements as follows:
System Peak:Payable by conventional generators only
Shared Year Round: Payable by all generators, scaled by each generator’s specific annual load factor
Not Shared Year Round: Payable by all generators. (Use £0/kW where no tariff is shown in the tables.)
Residual: Payable by all generators.
To illustrate the combined effect of these elements we include examples of the tariff that would be paid by:
A conventional generator with an annual load factor of 70%
An intermittent generator with an annual load factor of 30%.
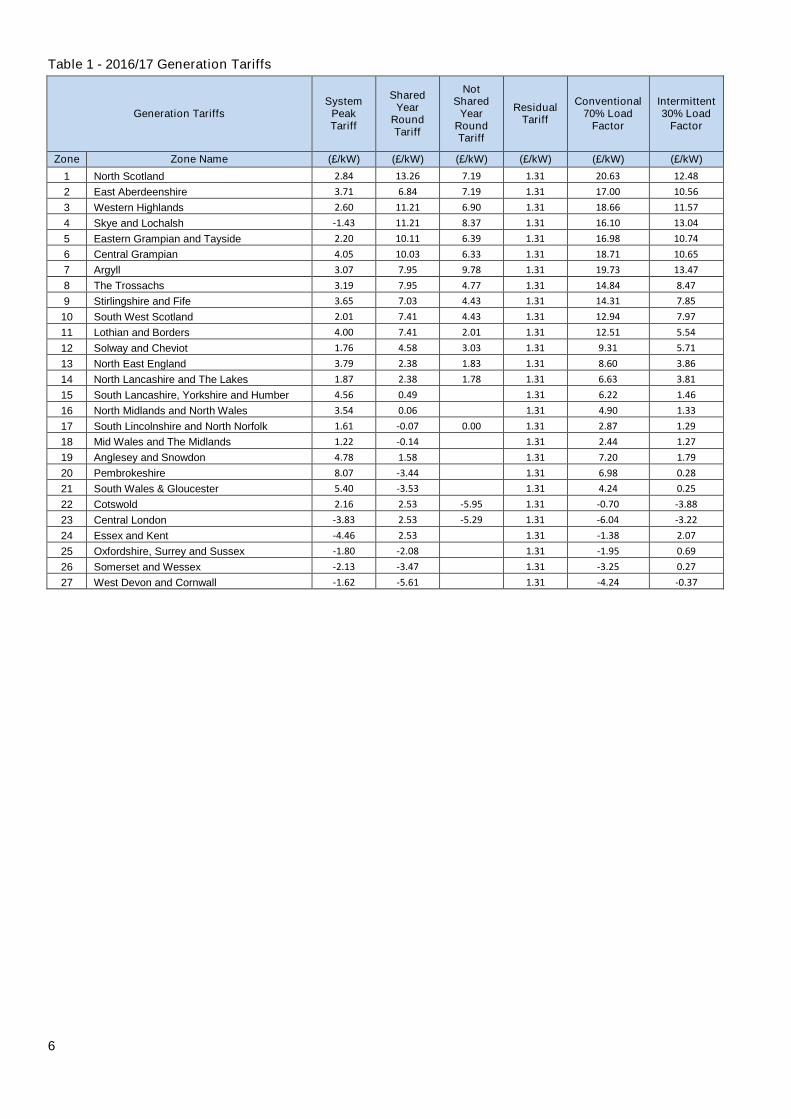
6
Table 1 - 2016/17 Generation Tariffs
Generation TariffsSystem
PeakTariff
SharedYear
RoundTariff
NotShared
YearRoundTariff
ResidualTariff
Conventional70% Load
Factor
Intermittent30% Load
Factor
Zone Zone Name (£/kW) (£/kW) (£/kW) (£/kW) (£/kW) (£/kW)
1 North Scotland 2.84 13.26 7.19 1.31 20.63 12.48
2 East Aberdeenshire 3.71 6.84 7.19 1.31 17.00 10.56
3 Western Highlands 2.60 11.21 6.90 1.31 18.66 11.57
4 Skye and Lochalsh -1.43 11.21 8.37 1.31 16.10 13.04
5 Eastern Grampian and Tayside 2.20 10.11 6.39 1.31 16.98 10.74
6 Central Grampian 4.05 10.03 6.33 1.31 18.71 10.65
7 Argyll 3.07 7.95 9.78 1.31 19.73 13.47
8 The Trossachs 3.19 7.95 4.77 1.31 14.84 8.47
9 Stirlingshire and Fife 3.65 7.03 4.43 1.31 14.31 7.85
10 South West Scotland 2.01 7.41 4.43 1.31 12.94 7.97
11 Lothian and Borders 4.00 7.41 2.01 1.31 12.51 5.54
12 Solway and Cheviot 1.76 4.58 3.03 1.31 9.31 5.71
13 North East England 3.79 2.38 1.83 1.31 8.60 3.86
14 North Lancashire and The Lakes 1.87 2.38 1.78 1.31 6.63 3.81
15 South Lancashire, Yorkshire and Humber 4.56 0.49 0.00 1.31 6.22 1.46
16 North Midlands and North Wales 3.54 0.06 0.00 1.31 4.90 1.33
17 South Lincolnshire and North Norfolk 1.61 -0.07 0.00 1.31 2.87 1.29
18 Mid Wales and The Midlands 1.22 -0.14 0.00 1.31 2.44 1.27
19 Anglesey and Snowdon 4.78 1.58 0.00 1.31 7.20 1.79
20 Pembrokeshire 8.07 -3.44 0.00 1.31 6.98 0.28
21 South Wales & Gloucester 5.40 -3.53 0.00 1.31 4.24 0.25
22 Cotswold 2.16 2.53 -5.95 1.31 -0.70 -3.88
23 Central London -3.83 2.53 -5.29 1.31 -6.04 -3.22
24 Essex and Kent -4.46 2.53 0.00 1.31 -1.38 2.07
25 Oxfordshire, Surrey and Sussex -1.80 -2.08 0.00 1.31 -1.95 0.69
26 Somerset and Wessex -2.13 -3.47 0.00 1.31 -3.25 0.27
27 West Devon and Cornwall -1.62 -5.61 0.00 1.31 -4.24 -0.37

7
Table 2 - 2017/18 Generation Tariffs (With Western HVDC Link)
Generation TariffsSystem
PeakTariff
SharedYear
RoundTariff
NotShared
YearRoundTariff
ResidualTariff
Conventional70% Load
Factor
Intermittent30% Load
Factor
Zone Zone Name (£/kW) (£/kW) (£/kW) (£/kW) (£/kW) (£/kW)
1 North Scotland 2.77 19.05 12.55 0.45 29.11 18.72
2 East Aberdeenshire 3.76 11.94 12.55 0.45 25.12 16.58
3 Western Highlands 2.70 16.70 12.18 0.45 27.03 17.64
4 Skye and Lochalsh -3.20 16.70 12.11 0.45 21.06 17.57
5 Eastern Grampian and Tayside 2.32 15.73 11.64 0.45 25.43 16.81
6 Central Grampian 4.49 15.97 11.83 0.45 27.96 17.08
7 Argyll 3.62 13.94 16.68 0.45 30.51 21.31
8 The Trossachs 3.78 13.94 10.13 0.45 24.11 14.76
9 Stirlingshire and Fife 3.60 12.58 9.53 0.45 22.38 13.76
10 South West Scotland 2.44 14.82 9.53 0.45 22.79 14.43
11 Lothian and Borders 4.36 14.82 2.34 0.45 17.52 7.24
12 Solway and Cheviot 1.85 7.78 5.93 0.45 13.67 8.71
13 North East England 4.18 3.32 3.44 0.45 10.39 4.89
14 North Lancashire and The Lakes 1.77 3.32 1.70 0.45 6.25 3.15
15 South Lancashire, Yorkshire and Humber 4.85 -0.08 0.00 0.45 5.24 0.43
16 North Midlands and North Wales 3.67 -1.57 0.00 0.45 3.02 -0.02
17 South Lincolnshire and North Norfolk 1.77 -0.93 0.00 0.45 1.57 0.17
18 Mid Wales and The Midlands 1.26 -1.27 0.00 0.45 0.83 0.07
19 Anglesey and Snowdon 4.01 -1.51 0.00 0.45 3.40 0.00
20 Pembrokeshire 8.22 -4.80 0.00 0.45 5.31 -0.99
21 South Wales & Gloucester 5.48 -4.88 0.00 0.45 2.51 -1.01
22 Cotswold 2.16 1.50 -6.26 0.45 -2.60 -5.36
23 Central London -3.89 1.50 -5.34 0.45 -7.73 -4.44
24 Essex and Kent -4.53 1.50 0.00 0.45 -3.02 0.90
25 Oxfordshire, Surrey and Sussex -1.84 -3.28 0.00 0.45 -3.68 -0.53
26 Somerset and Wessex -2.34 -4.76 0.00 0.45 -5.22 -0.98
27 West Devon and Cornwall -1.70 -6.82 0.00 0.45 -6.02 -1.59
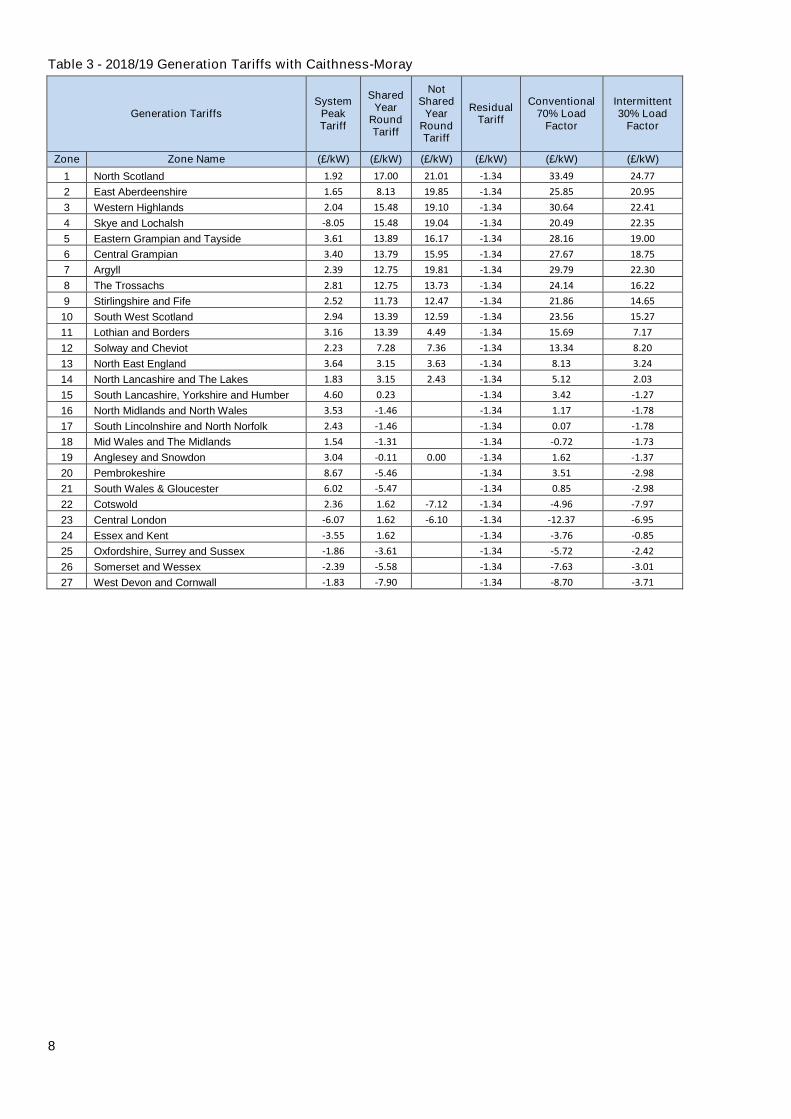
8
Table 3 - 2018/19 Generation Tariffs with Caithness-Moray
Generation TariffsSystem
PeakTariff
SharedYear
RoundTariff
NotShared
YearRoundTariff
ResidualTariff
Conventional70% Load
Factor
Intermittent30% Load
Factor
Zone Zone Name (£/kW) (£/kW) (£/kW) (£/kW) (£/kW) (£/kW)
1 North Scotland 1.92 17.00 21.01 -1.34 33.49 24.77
2 East Aberdeenshire 1.65 8.13 19.85 -1.34 25.85 20.95
3 Western Highlands 2.04 15.48 19.10 -1.34 30.64 22.41
4 Skye and Lochalsh -8.05 15.48 19.04 -1.34 20.49 22.35
5 Eastern Grampian and Tayside 3.61 13.89 16.17 -1.34 28.16 19.00
6 Central Grampian 3.40 13.79 15.95 -1.34 27.67 18.75
7 Argyll 2.39 12.75 19.81 -1.34 29.79 22.30
8 The Trossachs 2.81 12.75 13.73 -1.34 24.14 16.22
9 Stirlingshire and Fife 2.52 11.73 12.47 -1.34 21.86 14.65
10 South West Scotland 2.94 13.39 12.59 -1.34 23.56 15.27
11 Lothian and Borders 3.16 13.39 4.49 -1.34 15.69 7.17
12 Solway and Cheviot 2.23 7.28 7.36 -1.34 13.34 8.20
13 North East England 3.64 3.15 3.63 -1.34 8.13 3.24
14 North Lancashire and The Lakes 1.83 3.15 2.43 -1.34 5.12 2.03
15 South Lancashire, Yorkshire and Humber 4.60 0.23 0.00 -1.34 3.42 -1.27
16 North Midlands and North Wales 3.53 -1.46 0.00 -1.34 1.17 -1.78
17 South Lincolnshire and North Norfolk 2.43 -1.46 0.00 -1.34 0.07 -1.78
18 Mid Wales and The Midlands 1.54 -1.31 0.00 -1.34 -0.72 -1.73
19 Anglesey and Snowdon 3.04 -0.11 0.00 -1.34 1.62 -1.37
20 Pembrokeshire 8.67 -5.46 0.00 -1.34 3.51 -2.98
21 South Wales & Gloucester 6.02 -5.47 0.00 -1.34 0.85 -2.98
22 Cotswold 2.36 1.62 -7.12 -1.34 -4.96 -7.97
23 Central London -6.07 1.62 -6.10 -1.34 -12.37 -6.95
24 Essex and Kent -3.55 1.62 0.00 -1.34 -3.76 -0.85
25 Oxfordshire, Surrey and Sussex -1.86 -3.61 0.00 -1.34 -5.72 -2.42
26 Somerset and Wessex -2.39 -5.58 0.00 -1.34 -7.63 -3.01
27 West Devon and Cornwall -1.83 -7.90 0.00 -1.34 -8.70 -3.71
9
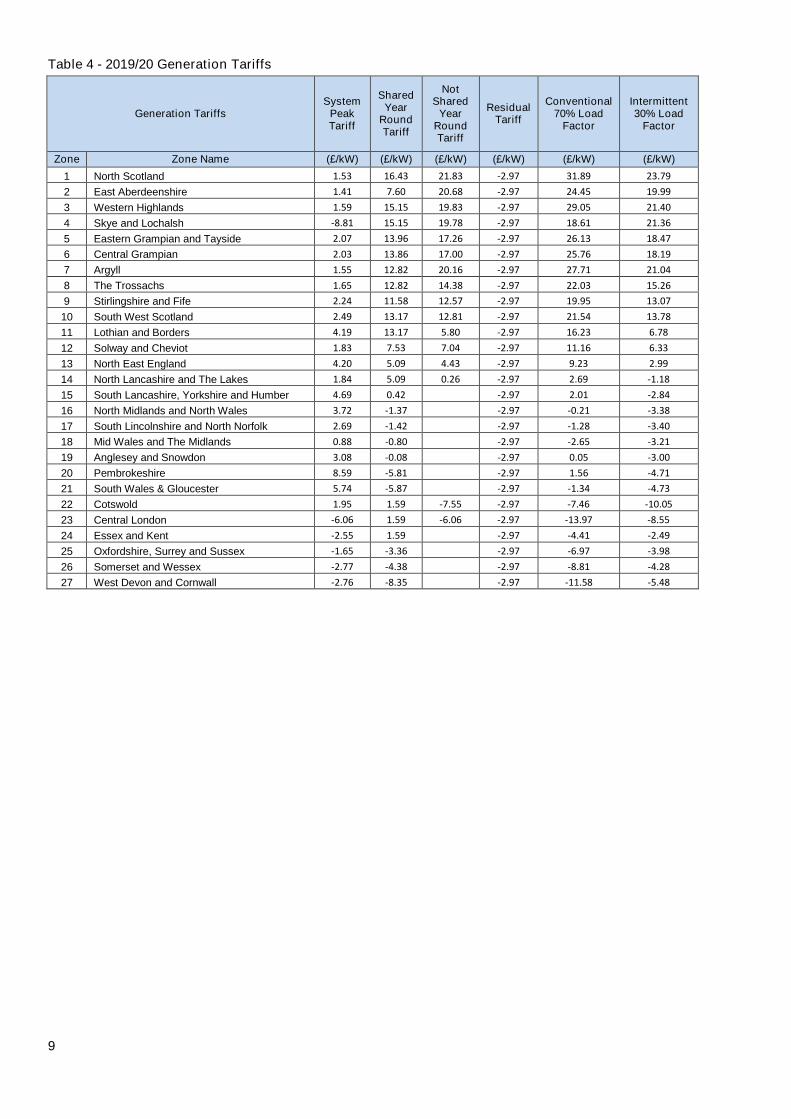
Table 4 - 2019/20 Generation Tariffs
Generation TariffsSystem
PeakTariff
SharedYear
RoundTariff
NotShared
YearRoundTariff
ResidualTariff
Conventional70% Load
Factor
Intermittent30% Load
Factor
Zone Zone Name (£/kW) (£/kW) (£/kW) (£/kW) (£/kW) (£/kW)
1 North Scotland 1.53 16.43 21.83 -2.97 31.89 23.79
2 East Aberdeenshire 1.41 7.60 20.68 -2.97 24.45 19.99
3 Western Highlands 1.59 15.15 19.83 -2.97 29.05 21.40
4 Skye and Lochalsh -8.81 15.15 19.78 -2.97 18.61 21.36
5 Eastern Grampian and Tayside 2.07 13.96 17.26 -2.97 26.13 18.47
6 Central Grampian 2.03 13.86 17.00 -2.97 25.76 18.19
7 Argyll 1.55 12.82 20.16 -2.97 27.71 21.04
8 The Trossachs 1.65 12.82 14.38 -2.97 22.03 15.26
9 Stirlingshire and Fife 2.24 11.58 12.57 -2.97 19.95 13.07
10 South West Scotland 2.49 13.17 12.81 -2.97 21.54 13.78
11 Lothian and Borders 4.19 13.17 5.80 -2.97 16.23 6.78
12 Solway and Cheviot 1.83 7.53 7.04 -2.97 11.16 6.33
13 North East England 4.20 5.09 4.43 -2.97 9.23 2.99
14 North Lancashire and The Lakes 1.84 5.09 0.26 -2.97 2.69 -1.18
15 South Lancashire, Yorkshire and Humber 4.69 0.42 0.00 -2.97 2.01 -2.84
16 North Midlands and North Wales 3.72 -1.37 0.00 -2.97 -0.21 -3.38
17 South Lincolnshire and North Norfolk 2.69 -1.42 0.00 -2.97 -1.28 -3.40
18 Mid Wales and The Midlands 0.88 -0.80 0.00 -2.97 -2.65 -3.21
19 Anglesey and Snowdon 3.08 -0.08 0.00 -2.97 0.05 -3.00
20 Pembrokeshire 8.59 -5.81 0.00 -2.97 1.56 -4.71
21 South Wales & Gloucester 5.74 -5.87 0.00 -2.97 -1.34 -4.73
22 Cotswold 1.95 1.59 -7.55 -2.97 -7.46 -10.05
23 Central London -6.06 1.59 -6.06 -2.97 -13.97 -8.55
24 Essex and Kent -2.55 1.59 0.00 -2.97 -4.41 -2.49
25 Oxfordshire, Surrey and Sussex -1.65 -3.36 0.00 -2.97 -6.97 -3.98
26 Somerset and Wessex -2.77 -4.38 0.00 -2.97 -8.81 -4.28
27 West Devon and Cornwall -2.76 -8.35 0.00 -2.97 -11.58 -5.48
10
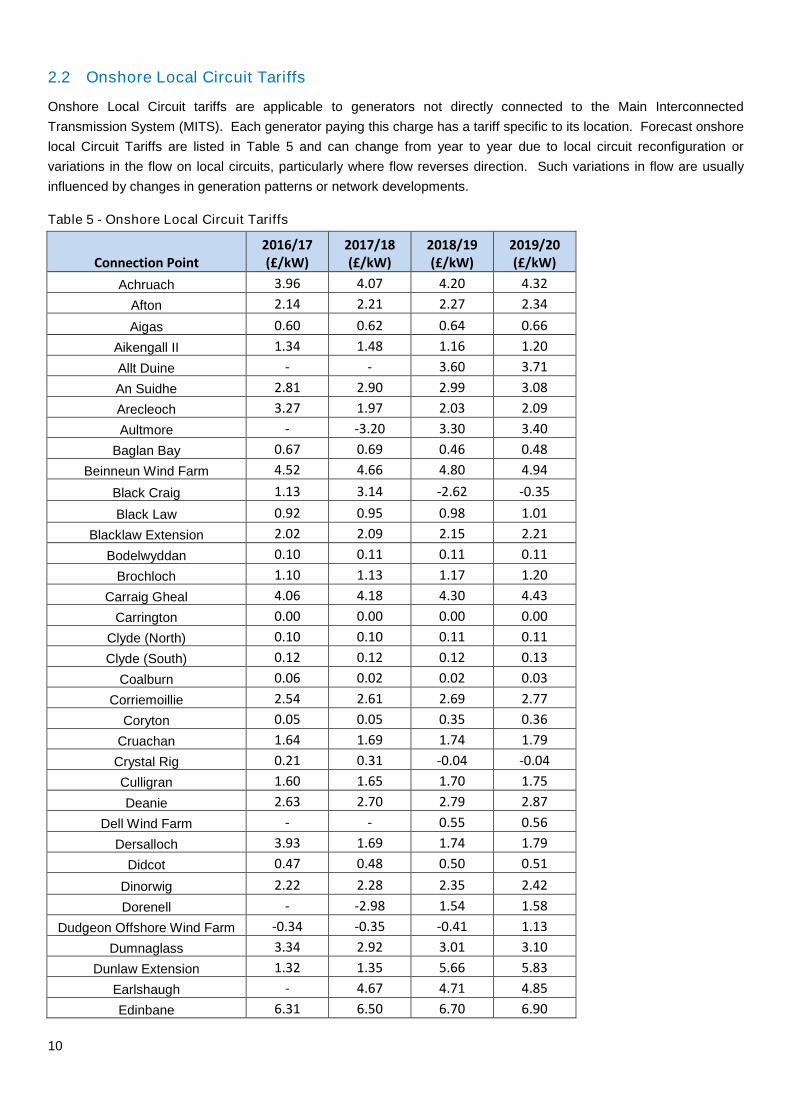
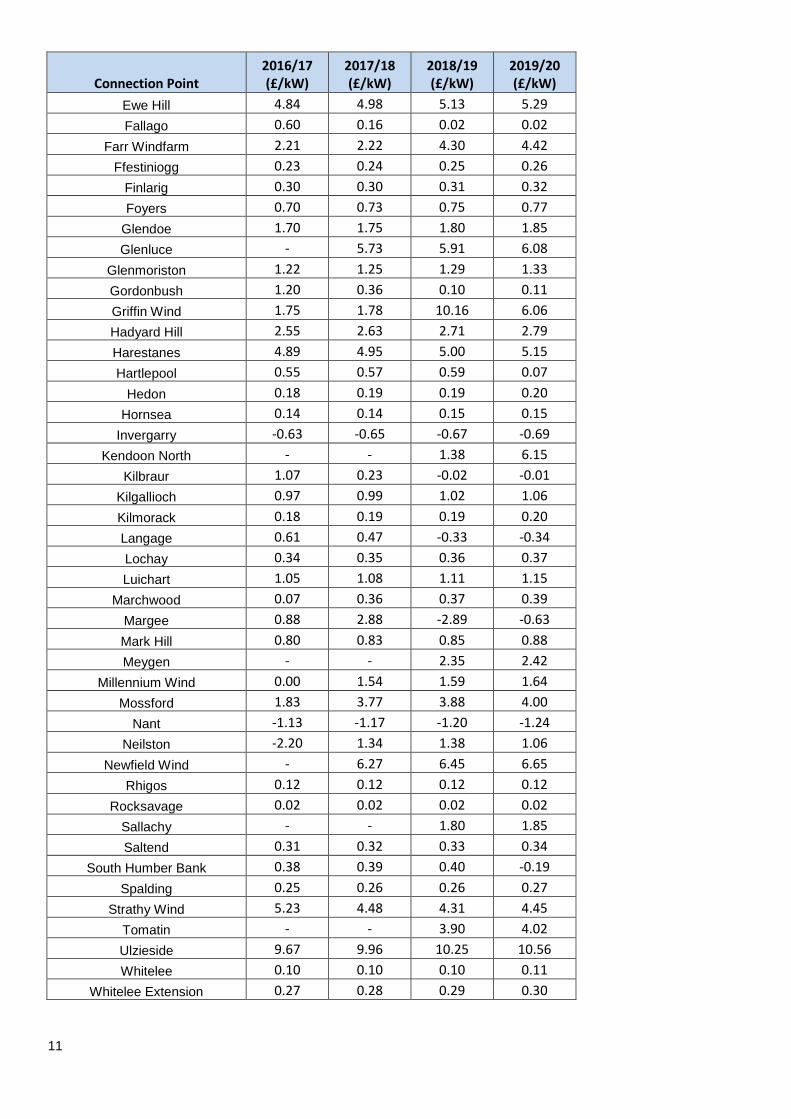
2.2 Onshore Local Circuit Tariffs
Onshore Local Circuit tariffs are applicable to generators not directly connected to the Main Interconnected
Transmission System (MITS). Each generator paying this charge has a tariff specific to its location. Forecast onshore
local Circuit Tariffs are listed in Table 5 and can change from year to year due to local circuit reconfiguration or
variations in the flow on local circuits, particularly where flow reverses direction. Such variations in flow are usually
influenced by changes in generation patterns or network developments.
Table 5 - Onshore Local Circuit Tariffs
Connection Point2016/17(£/kW)
2017/18(£/kW)
2018/19(£/kW)
2019/20(£/kW)
Achruach 3.96 4.07 4.20 4.32
Afton 2.14 2.21 2.27 2.34
Aigas 0.60 0.62 0.64 0.66
Aikengall II 1.34 1.48 1.16 1.20
Allt Duine - - 3.60 3.71
An Suidhe 2.81 2.90 2.99 3.08
Arecleoch 3.27 1.97 2.03 2.09
Aultmore - -3.20 3.30 3.40
Baglan Bay 0.67 0.69 0.46 0.48
Beinneun Wind Farm 4.52 4.66 4.80 4.94
Black Craig 1.13 3.14 -2.62 -0.35
Black Law 0.92 0.95 0.98 1.01
Blacklaw Extension 2.02 2.09 2.15 2.21
Bodelwyddan 0.10 0.11 0.11 0.11
Brochloch 1.10 1.13 1.17 1.20
Carraig Gheal 4.06 4.18 4.30 4.43
Carrington 0.00 0.00 0.00 0.00
Clyde (North) 0.10 0.10 0.11 0.11
Clyde (South) 0.12 0.12 0.12 0.13
Coalburn 0.06 0.02 0.02 0.03
Corriemoillie 2.54 2.61 2.69 2.77
Coryton 0.05 0.05 0.35 0.36
Cruachan 1.64 1.69 1.74 1.79
Crystal Rig 0.21 0.31 -0.04 -0.04
Culligran 1.60 1.65 1.70 1.75
Deanie 2.63 2.70 2.79 2.87
Dell Wind Farm - - 0.55 0.56
Dersalloch 3.93 1.69 1.74 1.79
Didcot 0.47 0.48 0.50 0.51
Dinorwig 2.22 2.28 2.35 2.42
Dorenell - -2.98 1.54 1.58
Dudgeon Offshore Wind Farm -0.34 -0.35 -0.41 1.13
Dumnaglass 3.34 2.92 3.01 3.10
Dunlaw Extension 1.32 1.35 5.66 5.83
Earlshaugh - 4.67 4.71 4.85
Edinbane 6.31 6.50 6.70 6.90
11
Connection Point2016/17(£/kW)
2017/18(£/kW)
2018/19(£/kW)
2019/20(£/kW)
Ewe Hill 4.84 4.98 5.13 5.29
Fallago 0.60 0.16 0.02 0.02
Farr Windfarm 2.21 2.22 4.30 4.42
Ffestiniogg 0.23 0.24 0.25 0.26
Finlarig 0.30 0.30 0.31 0.32
Foyers 0.70 0.73 0.75 0.77
Glendoe 1.70 1.75 1.80 1.85
Glenluce - 5.73 5.91 6.08
Glenmoriston 1.22 1.25 1.29 1.33
Gordonbush 1.20 0.36 0.10 0.11
Griffin Wind 1.75 1.78 10.16 6.06
Hadyard Hill 2.55 2.63 2.71 2.79
Harestanes 4.89 4.95 5.00 5.15
Hartlepool 0.55 0.57 0.59 0.07
Hedon 0.18 0.19 0.19 0.20
Hornsea 0.14 0.14 0.15 0.15
Invergarry -0.63 -0.65 -0.67 -0.69
Kendoon North - - 1.38 6.15
Kilbraur 1.07 0.23 -0.02 -0.01
Kilgallioch 0.97 0.99 1.02 1.06
Kilmorack 0.18 0.19 0.19 0.20
Langage 0.61 0.47 -0.33 -0.34
Lochay 0.34 0.35 0.36 0.37
Luichart 1.05 1.08 1.11 1.15
Marchwood 0.07 0.36 0.37 0.39
Margee 0.88 2.88 -2.89 -0.63
Mark Hill 0.80 0.83 0.85 0.88
Meygen - - 2.35 2.42
Millennium Wind 0.00 1.54 1.59 1.64
Mossford 1.83 3.77 3.88 4.00
Nant -1.13 -1.17 -1.20 -1.24
Neilston -2.20 1.34 1.38 1.06
Newfield Wind - 6.27 6.45 6.65
Rhigos 0.12 0.12 0.12 0.12
Rocksavage 0.02 0.02 0.02 0.02
Sallachy - - 1.80 1.85
Saltend 0.31 0.32 0.33 0.34
South Humber Bank 0.38 0.39 0.40 -0.19
Spalding 0.25 0.26 0.26 0.27
Strathy Wind 5.23 4.48 4.31 4.45
Tomatin - - 3.90 4.02
Ulzieside 9.67 9.96 10.25 10.56
Whitelee 0.10 0.10 0.10 0.11
Whitelee Extension 0.27 0.28 0.29 0.30
12
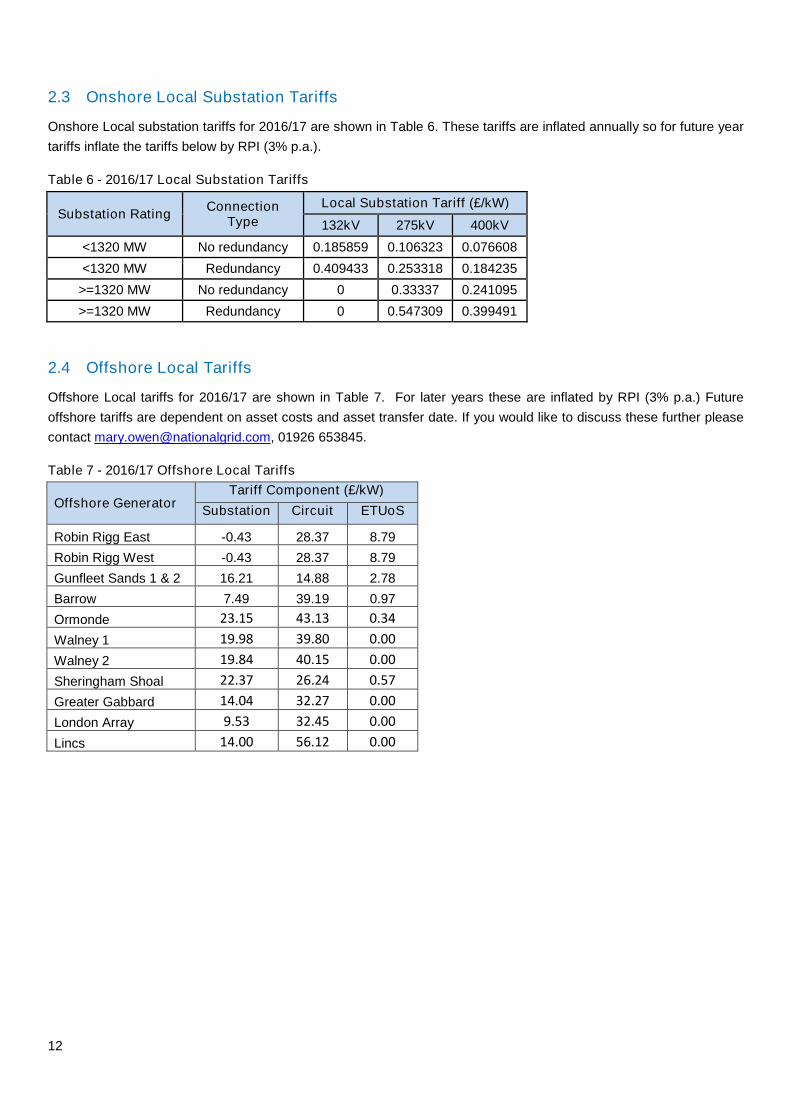
2.3 Onshore Local Substation Tariffs
Onshore Local substation tariffs for 2016/17 are shown in Table 6. These tariffs are inflated annually so for future year
tariffs inflate the tariffs below by RPI (3% p.a.).
Table 6 - 2016/17 Local Substation Tariffs
Substation RatingConnection
Type
Local Substation Tariff (£/kW)
132kV 275kV 400kV
<1320 MW No redundancy 0.185859 0.106323 0.076608
<1320 MW Redundancy 0.409433 0.253318 0.184235
>=1320 MW No redundancy 0 0.33337 0.241095
>=1320 MW Redundancy 0 0.547309 0.399491
2.4 Offshore Local Tariffs
Offshore Local tariffs for 2016/17 are shown in Table 7. For later years these are inflated by RPI (3% p.a.) Future
offshore tariffs are dependent on asset costs and asset transfer date. If you would like to discuss these further please
contact [email protected], 01926 653845.
Table 7 - 2016/17 Offshore Local Tariffs
Offshore GeneratorTariff Component (£/kW)
Substation Circuit ETUoS
Robin Rigg East -0.43 28.37 8.79
Robin Rigg West -0.43 28.37 8.79
Gunfleet Sands 1 & 2 16.21 14.88 2.78
Barrow 7.49 39.19 0.97
Ormonde 23.15 43.13 0.34
Walney 1 19.98 39.80 0.00
Walney 2 19.84 40.15 0.00
Sheringham Shoal 22.37 26.24 0.57
Greater Gabbard 14.04 32.27 0.00
London Array 9.53 32.45 0.00
Lincs 14.00 56.12 0.00
13
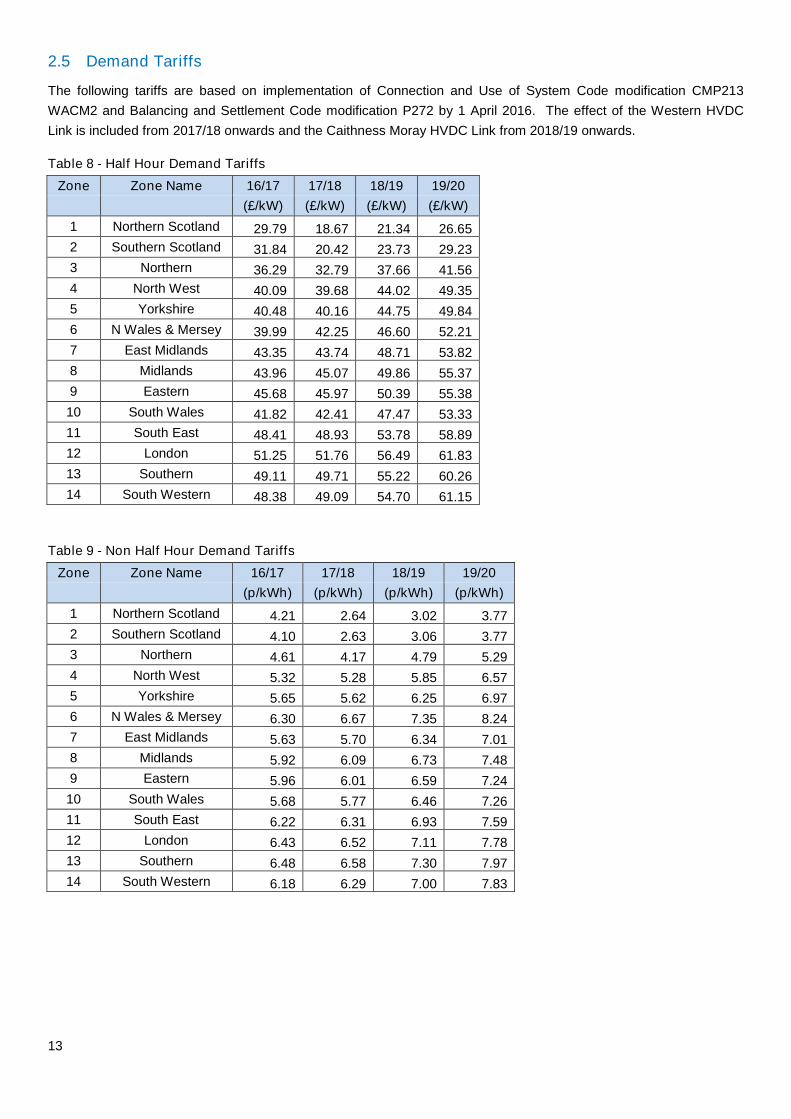
2.5 Demand Tariffs
The following tariffs are based on implementation of Connection and Use of System Code modification CMP213
WACM2 and Balancing and Settlement Code modification P272 by 1 April 2016. The effect of the Western HVDC
Link is included from 2017/18 onwards and the Caithness Moray HVDC Link from 2018/19 onwards.
Table 8 - Half Hour Demand Tariffs
Zone Zone Name 16/17 17/18 18/19 19/20
(£/kW) (£/kW) (£/kW) (£/kW)
1 Northern Scotland 29.79 18.67 21.34 26.65
2 Southern Scotland 31.84 20.42 23.73 29.23
3 Northern 36.29 32.79 37.66 41.56
4 North West 40.09 39.68 44.02 49.35
5 Yorkshire 40.48 40.16 44.75 49.84
6 N Wales & Mersey 39.99 42.25 46.60 52.21
7 East Midlands 43.35 43.74 48.71 53.82
8 Midlands 43.96 45.07 49.86 55.37
9 Eastern 45.68 45.97 50.39 55.38
10 South Wales 41.82 42.41 47.47 53.33
11 South East 48.41 48.93 53.78 58.89
12 London 51.25 51.76 56.49 61.83
13 Southern 49.11 49.71 55.22 60.26
14 South Western 48.38 49.09 54.70 61.15
Table 9 - Non Half Hour Demand Tariffs
Zone Zone Name 16/17 17/18 18/19 19/20
(p/kWh) (p/kWh) (p/kWh) (p/kWh)
1 Northern Scotland 4.21 2.64 3.02 3.77
2 Southern Scotland 4.10 2.63 3.06 3.77
3 Northern 4.61 4.17 4.79 5.29
4 North West 5.32 5.28 5.85 6.57
5 Yorkshire 5.65 5.62 6.25 6.97
6 N Wales & Mersey 6.30 6.67 7.35 8.24
7 East Midlands 5.63 5.70 6.34 7.01
8 Midlands 5.92 6.09 6.73 7.48
9 Eastern 5.96 6.01 6.59 7.24
10 South Wales 5.68 5.77 6.46 7.26
11 South East 6.22 6.31 6.93 7.59
12 London 6.43 6.52 7.11 7.78
13 Southern 6.48 6.58 7.30 7.97
14 South Western 6.18 6.29 7.00 7.83
14
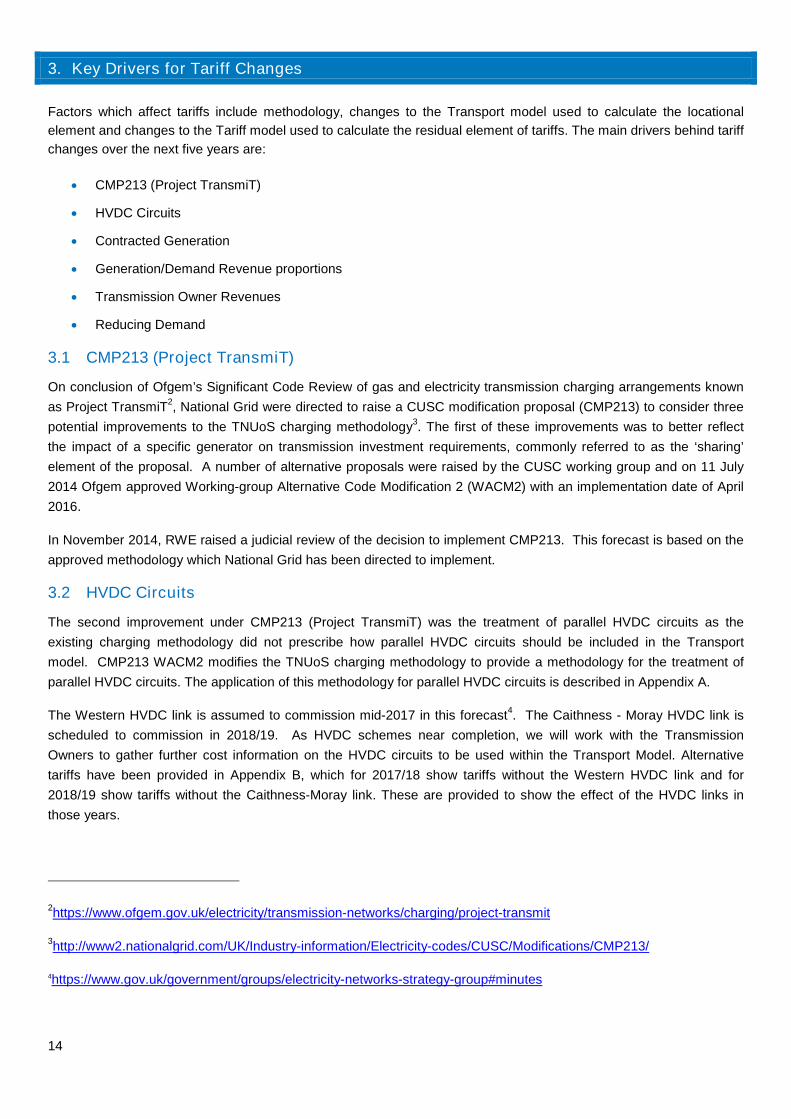
3. Key Drivers for Tariff Changes
Factors which affect tariffs include methodology, changes to the Transport model used to calculate the locational
element and changes to the Tariff model used to calculate the residual element of tariffs. The main drivers behind tariff
changes over the next five years are:
CMP213 (Project TransmiT)
HVDC Circuits
Contracted Generation
Generation/Demand Revenue proportions
Transmission Owner Revenues
Reducing Demand
3.1 CMP213 (Project TransmiT)
On conclusion of Ofgem’s Significant Code Review of gas and electricity transmission charging arrangements known
as Project TransmiT2, National Grid were directed to raise a CUSC modification proposal (CMP213) to consider three
potential improvements to the TNUoS charging methodology3. The first of these improvements was to better reflect
the impact of a specific generator on transmission investment requirements, commonly referred to as the ‘sharing’
element of the proposal. A number of alternative proposals were raised by the CUSC working group and on 11 July
2014 Ofgem approved Working-group Alternative Code Modification 2 (WACM2) with an implementation date of April
2016.
In November 2014, RWE raised a judicial review of the decision to implement CMP213. This forecast is based on the
approved methodology which National Grid has been directed to implement.
3.2 HVDC Circuits
The second improvement under CMP213 (Project TransmiT) was the treatment of parallel HVDC circuits as the
existing charging methodology did not prescribe how parallel HVDC circuits should be included in the Transport
model. CMP213 WACM2 modifies the TNUoS charging methodology to provide a methodology for the treatment of
parallel HVDC circuits. The application of this methodology for parallel HVDC circuits is described in Appendix A.
The Western HVDC link is assumed to commission mid-2017 in this forecast4. The Caithness - Moray HVDC link is
scheduled to commission in 2018/19. As HVDC schemes near completion, we will work with the Transmission
Owners to gather further cost information on the HVDC circuits to be used within the Transport Model. Alternative
tariffs have been provided in Appendix B, which for 2017/18 show tariffs without the Western HVDC link and for
2018/19 show tariffs without the Caithness-Moray link. These are provided to show the effect of the HVDC links in
those years.
2https://www.ofgem.gov.uk/electricity/transmission-networks/charging/project-transmit
3http://www2.nationalgrid.com/UK/Industry-information/Electricity-codes/CUSC/Modifications/CMP213/
4https://www.gov.uk/government/groups/electricity-networks-strategy-group#minutes
15
3.3 Contracted Generation
In previous five year forecasts the Generation data used to create the transport model has been based upon
contracted TEC. Generation significantly affects tariff forecasts but contracted TEC has not always been a good basis
for forecasting tariffs due to station closures, project delays and cancellations. Therefore, similar to the five year
forecast published in May 2014, we no longer simply use contracted TEC. Instead, market intelligence has been used
to derive a ‘best view’ as to the likelihood of new Generation projects progressing as planned. Where progression
looked likely to vary from plan, the contracted TEC for those projects has been adjusted. The overall result of these
adjustments is that the modelled TEC is less than the contracted position shown in the TEC register. Please note that
we have not taken a view on the closure of current generation.
To enable the report to be written and analysis undertaken a freeze on generation data was taken in mid-December.
We are looking to further enhance this process going forward. For example, future models might include a view on
current generation closures, or how much generation is likely to be required to match forecast demand.
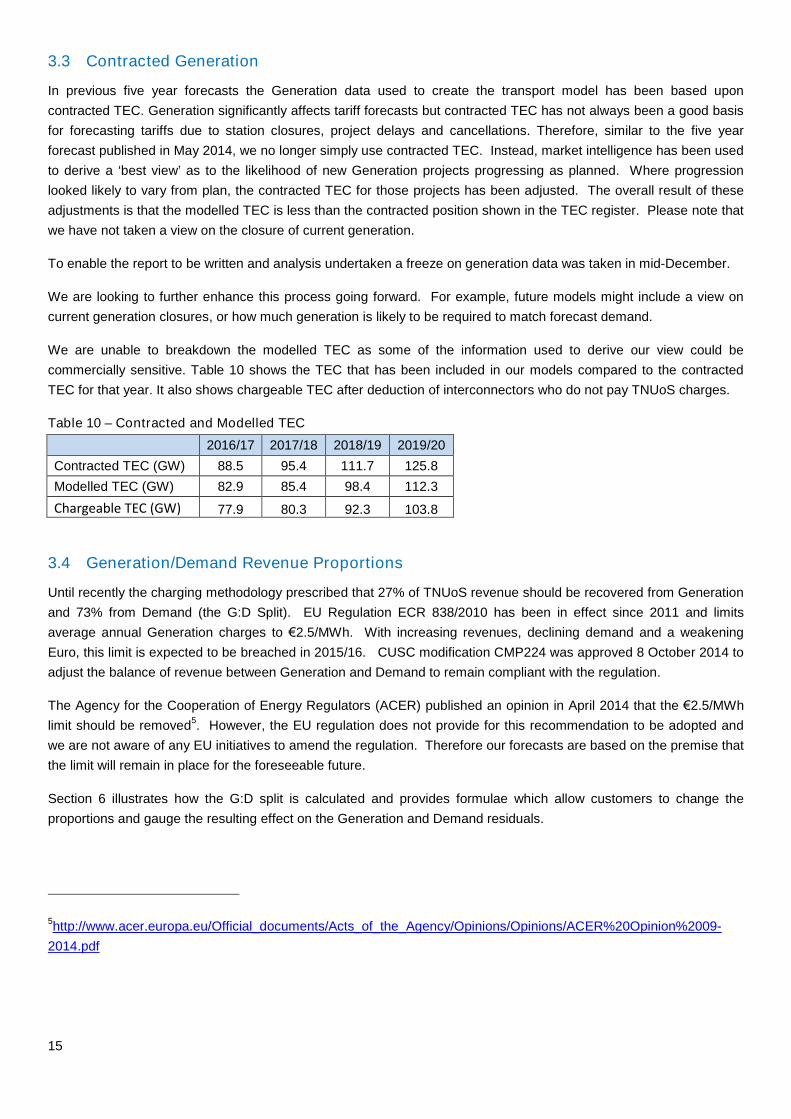
We are unable to breakdown the modelled TEC as some of the information used to derive our view could be
commercially sensitive. Table 10 shows the TEC that has been included in our models compared to the contracted
TEC for that year. It also shows chargeable TEC after deduction of interconnectors who do not pay TNUoS charges.
Table 10 – Contracted and Modelled TEC
2016/17 2017/18 2018/19 2019/20
Contracted TEC (GW) 88.5 95.4 111.7 125.8
Modelled TEC (GW) 82.9 85.4 98.4 112.3
Chargeable TEC (GW) 77.9 80.3 92.3 103.8
3.4 Generation/Demand Revenue Proportions
Until recently the charging methodology prescribed that 27% of TNUoS revenue should be recovered from Generation
and 73% from Demand (the G:D Split). EU Regulation ECR 838/2010 has been in effect since 2011 and limits
average annual Generation charges to €2.5/MWh. With increasing revenues, declining demand and a weakening
Euro, this limit is expected to be breached in 2015/16. CUSC modification CMP224 was approved 8 October 2014 to
adjust the balance of revenue between Generation and Demand to remain compliant with the regulation.
The Agency for the Cooperation of Energy Regulators (ACER) published an opinion in April 2014 that the €2.5/MWh
limit should be removed5. However, the EU regulation does not provide for this recommendation to be adopted and
we are not aware of any EU initiatives to amend the regulation. Therefore our forecasts are based on the premise that
the limit will remain in place for the foreseeable future.
Section 6 illustrates how the G:D split is calculated and provides formulae which allow customers to change the
proportions and gauge the resulting effect on the Generation and Demand residuals.
5http://www.acer.europa.eu/Official_documents/Acts_of_the_Agency/Opinions/Opinions/ACER%20Opinion%2009-
2014.pdf
16
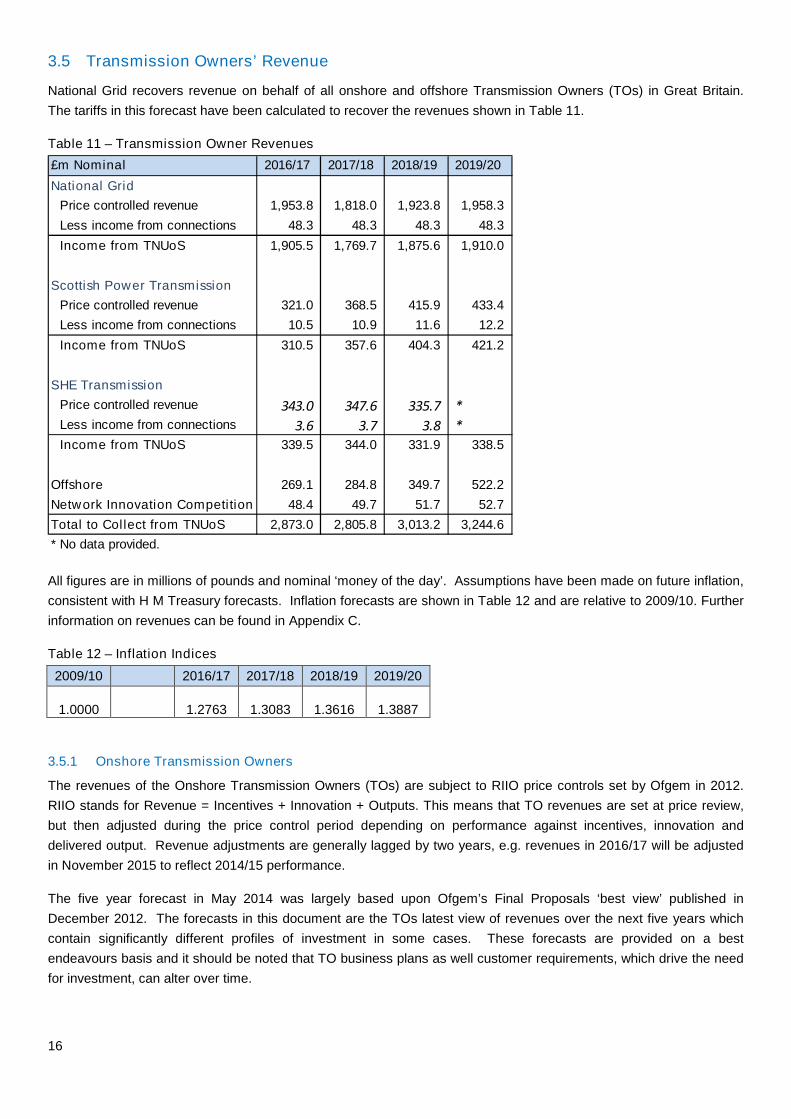
3.5 Transmission Owners’ Revenue
National Grid recovers revenue on behalf of all onshore and offshore Transmission Owners (TOs) in Great Britain.
The tariffs in this forecast have been calculated to recover the revenues shown in Table 11.
Table 11 – Transmission Owner Revenues
All figures are in millions of pounds and nominal ‘money of the day’. Assumptions have been made on future inflation,
consistent with H M Treasury forecasts. Inflation forecasts are shown in Table 12 and are relative to 2009/10. Further
information on revenues can be found in Appendix C.
Table 12 – Inflation Indices
2009/10 2016/17 2017/18 2018/19 2019/20
1.0000 1.2763 1.3083 1.3616 1.3887
3.5.1 Onshore Transmission Owners
The revenues of the Onshore Transmission Owners (TOs) are subject to RIIO price controls set by Ofgem in 2012.
RIIO stands for Revenue = Incentives + Innovation + Outputs. This means that TO revenues are set at price review,
but then adjusted during the price control period depending on performance against incentives, innovation and
delivered output. Revenue adjustments are generally lagged by two years, e.g. revenues in 2016/17 will be adjusted
in November 2015 to reflect 2014/15 performance.
The five year forecast in May 2014 was largely based upon Ofgem’s Final Proposals ‘best view’ published in
December 2012. The forecasts in this document are the TOs latest view of revenues over the next five years which
contain significantly different profiles of investment in some cases. These forecasts are provided on a best
endeavours basis and it should be noted that TO business plans as well customer requirements, which drive the need
for investment, can alter over time.
£m Nominal 2016/17 2017/18 2018/19 2019/20
National Grid
Price controlled revenue 1,953.8 1,818.0 1,923.8 1,958.3
Less income from connections 48.3 48.3 48.3 48.3
Income from TNUoS 1,905.5 1,769.7 1,875.6 1,910.0
Scottish Power Transmission
Price controlled revenue 321.0 368.5 415.9 433.4
Less income from connections 10.5 10.9 11.6 12.2
Income from TNUoS 310.5 357.6 404.3 421.2
SHE Transmission
Price controlled revenue 343.0 347.6 335.7 *Less income from connections 3.6 3.7 3.8 *
Income from TNUoS 339.5 344.0 331.9 338.5
Offshore 269.1 284.8 349.7 522.2
Network Innovation Competition 48.4 49.7 51.7 52.7
Total to Collect from TNUoS 2,873.0 2,805.8 3,013.2 3,244.6
* No data provided.

17
Subject to consultation on need case and cost, Ofgem may award additional funding for Strategic Wider Works
projects. Where determinations have been made by Ofgem then the effect of these have been included in the
revenue forecasts. Where determinations have yet to be made, the TOs may take a view on whether to include
additional funding in their forecasts. The following Strategic Wider works have been included in this forecast:
Kintyre – Hunterston
Beauly – Mossford
Caithness – Moray
Hinckley - Seabank
An estimate has been included in 2016/17 revenues for retrospective recovery of under-recovered 2014/15 revenue.
This reflects the lower than anticipated demand seen so far during 2014/15 but the size of the under-recovery will not
be known until after the end of the financial year. There are no adjustments for revenue recovery or variations in
inflation in later years.
3.5.2 Offshore Transmission Owners
The revenues of offshore transmission owners (OFTOs) are determined by Ofgem in a competitive tender process.
The revenue is confirmed when the network is transferred from the developer to the appointed OFTO. Prior to this
there is uncertainty as to the value of the revenue stream and when it will start. Therefore, whilst the revenues for
existing OFTOs are relatively predictable, the revenue for future OFTOs is a forecast. OFTO asset transfers have
tended to occur within two years of the associated wind farm commissioning although this will be reduced to eighteen
months or less for tender round 3 OFTOs. Transfer values have been extrapolated from previous values and sizes of
wind farm.
3.5.3 Pan-Company Funding
National Grid also collects revenue to fund pan-company incentives awarded by Ofgem in the November prior to the
charging year. The Network Innovation Competition Fund provides up to £27m (2009/10 prices) each year for
electricity transmission owners. From 2016/17 onwards a further £60m will be available for the electricity distribution
Network Innovation completion Fund. Ofgem may also make Environmental Discretionary awards of up to £4m each
year to electricity transmission owners with 50% of un-awarded funding carried over to later years. We have
assumed 50% of pan-company funding will be awarded each year.
3.5.4 Connection Revenues
Part of the onshore transmission owner revenues are recovered from pre-vesting connection assets in the case of
National Grid, and pre-BETTA connection assets in the case of the Scottish TOs. These revenues are therefore
deducted from allowed revenue to calculate the revenue to be recovered from TNUoS charges. Whilst this revenue is
diminishing due to depreciation and replacement, it may remain broadly flat in nominal terms due to inflation and the
operating cost element.
3.6 Demand Forecasts
Two types of Demand forecast are used to determine the location element and the residual element of the tariffs.
3.6.1 Locational Element
The locational model uses peak demands at each Grid Supply Point (GSP). The July 2013 Week 24 demand
submissions provided by Distribution Network Operators and forecasts of directly connected demand sites such as
steelworks and other heavy industry have been used. Zonal demand information is summarised in Table 13 and
detailed in Appendix E.
18
3.6.2 Residual Element
National Grid’s forecasts of demand are used to determine the charging bases that will actually pay demand tariffs.
The residual is used to recover the correct proportion of revenue from demand with the overall aim of recovering
allowed revenue. Changes to the demand charging base therefore impact the residual element of Half-Hourly (HH)
demand tariffs and subsequently Non Half Hourly (NHH) tariffs. National Grid’s forecasts cover average system
demand over the Triads6, average Half-Hour metered demand over the Triads and Non-Half-Hourly metered energy
between 4pm and 7pm over the year. Section 7 shows how the residuals are calculated to allow customers to model
the impact on demand tariffs of their own forecasts of future demand.
The demand charging bases have all decreased from the May 2014 five year forecast. The decrease in total peak
demands and Non-Half-Hourly energy are due to a number of different factors including; Triad avoidance, energy
efficiency, embedded generation, price elasticity and Balancing & Settlement Code (BSC) changes.
3.6.3 P272
BSC amendment 272 will make it mandatory that customer classes 5-8 move from Non-Half-Hour settlement to Half-
Hour settlement by April 2016. This change alters our demand charging bases from 2016/17 onwards. Using profiling
data for each half hour period we estimate that classes 5-8 make up approximately 9.4% of NHH demand between the
hours of 4-7pm. Therefore we have reduced the NHH demand base by this amount from 2016/17 onwards with the
decrease spread across each zone on a pro rata basis.
As these classes become half hourly metered the proportion of HH demand at Triad will increase. The proportion of
NHH demand at Peak for classes 5-8 is similar to the proportion of NHH energy use between 4-7pm for classes 5-8.
Therefore the effect on HH and NHH tariffs is currently forecasted to be minimal as the extra revenue we receive from
HH offsets the decrease in revenue from NHH.
National Grid only receives aggregated data on a BMU basis. We have assumed that the proportion of demand
Classes 5-8 compared to Classes 1-4 is the same across all zones. We are working with Elexon to break this data set
down further. We actively encourage feedback on forecasting demand post P272 to avoid future tariff forecast
volatility.
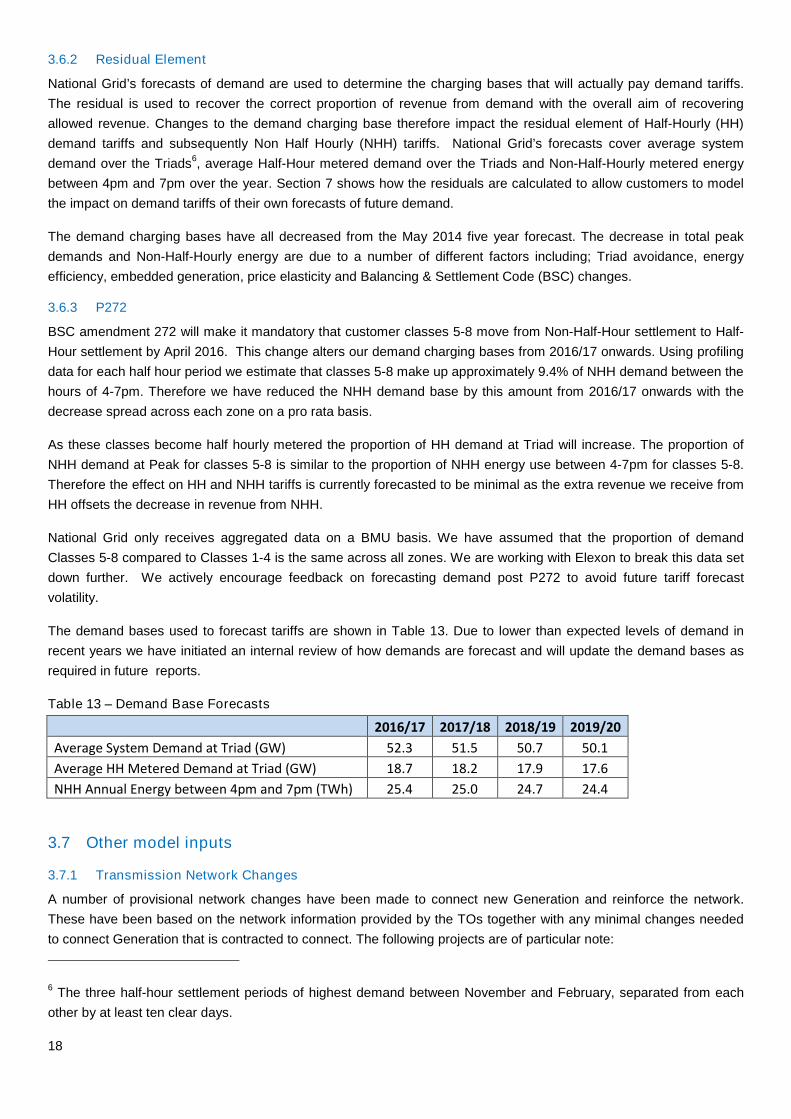
The demand bases used to forecast tariffs are shown in Table 13. Due to lower than expected levels of demand in
recent years we have initiated an internal review of how demands are forecast and will update the demand bases as
required in future reports.
Table 13 – Demand Base Forecasts
2016/17 2017/18 2018/19 2019/20
Average System Demand at Triad (GW) 52.3 51.5 50.7 50.1
Average HH Metered Demand at Triad (GW) 18.7 18.2 17.9 17.6
NHH Annual Energy between 4pm and 7pm (TWh) 25.4 25.0 24.7 24.4
3.7 Other model inputs
3.7.1 Transmission Network Changes
A number of provisional network changes have been made to connect new Generation and reinforce the network.
These have been based on the network information provided by the TOs together with any minimal changes needed
to connect Generation that is contracted to connect. The following projects are of particular note:
6The three half-hour settlement periods of highest demand between November and February, separated from each
other by at least ten clear days.
19
North London Reinforcement Project – This is included from 2016/17 and alters flows on the system and
therefore tariffs. Flows on these new circuits are heavily determined by Generation, so if Generation changes
from that forecast then the tariff can change.
Western HVDC link - This is included from 2017/18 and increases generation tariffs in Scotland and reduces
generation tariffs in Wales and England.
Caithness Moray HVDC link - This is included from 2018/19.
3.7.2 Expansion Constant
The charging methodology requires the expansion constant to be updated each year in line with RPI inflation. Table
14 shows the expansion constants used in the forecasts.
Table 14 – Expansion Constant
£/MWkm 16/17 17/18 18/19 19/20
ExpansionConstant
13.608932 14.017200 14.437716 14.870847
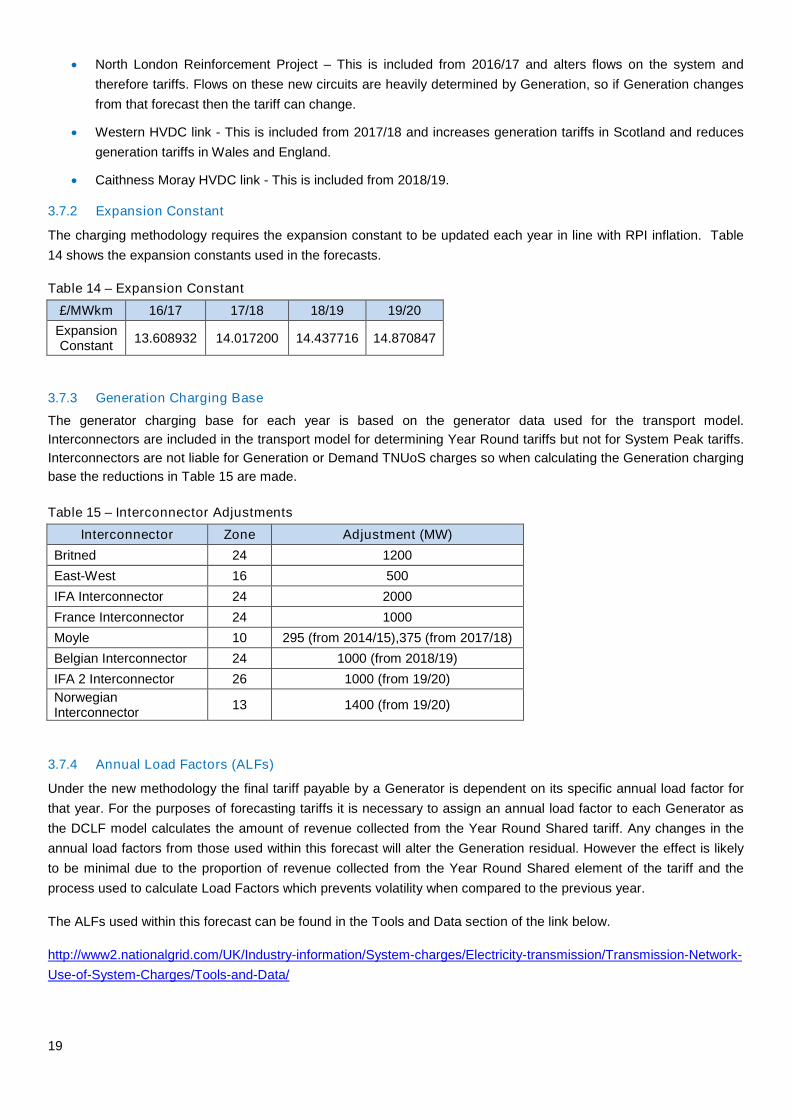
3.7.3 Generation Charging Base
The generator charging base for each year is based on the generator data used for the transport model.
Interconnectors are included in the transport model for determining Year Round tariffs but not for System Peak tariffs.
Interconnectors are not liable for Generation or Demand TNUoS charges so when calculating the Generation charging
base the reductions in Table 15 are made.
Table 15 – Interconnector Adjustments
Interconnector Zone Adjustment (MW)
Britned 24 1200
East-West 16 500
IFA Interconnector 24 2000
France Interconnector 24 1000
Moyle 10 295 (from 2014/15),375 (from 2017/18)
Belgian Interconnector 24 1000 (from 2018/19)
IFA 2 Interconnector 26 1000 (from 19/20)
NorwegianInterconnector
13 1400 (from 19/20)
3.7.4 Annual Load Factors (ALFs)
Under the new methodology the final tariff payable by a Generator is dependent on its specific annual load factor for
that year. For the purposes of forecasting tariffs it is necessary to assign an annual load factor to each Generator as
the DCLF model calculates the amount of revenue collected from the Year Round Shared tariff. Any changes in the
annual load factors from those used within this forecast will alter the Generation residual. However the effect is likely
to be minimal due to the proportion of revenue collected from the Year Round Shared element of the tariff and the
process used to calculate Load Factors which prevents volatility when compared to the previous year.
The ALFs used within this forecast can be found in the Tools and Data section of the link below.
http://www2.nationalgrid.com/UK/Industry-information/System-charges/Electricity-transmission/Transmission-Network-
Use-of-System-Charges/Tools-and-Data/

20
The ALFs will be updated in 2015. Further updates/information will be provided in our Quarterly updates of 2016/17
tariffs.
21
4. Commentary on Forecast Generation Tariffs
4.1 Wider Zonal Generation Tariffs
4.1.1 Key Assumptions
CMP213 implemented April 2016
Western HVDC link completed in 2017/18
Caithness Moray completed in 2018/19
EU Regulation ECR 838/2010 limits generation to €2.5/MWh
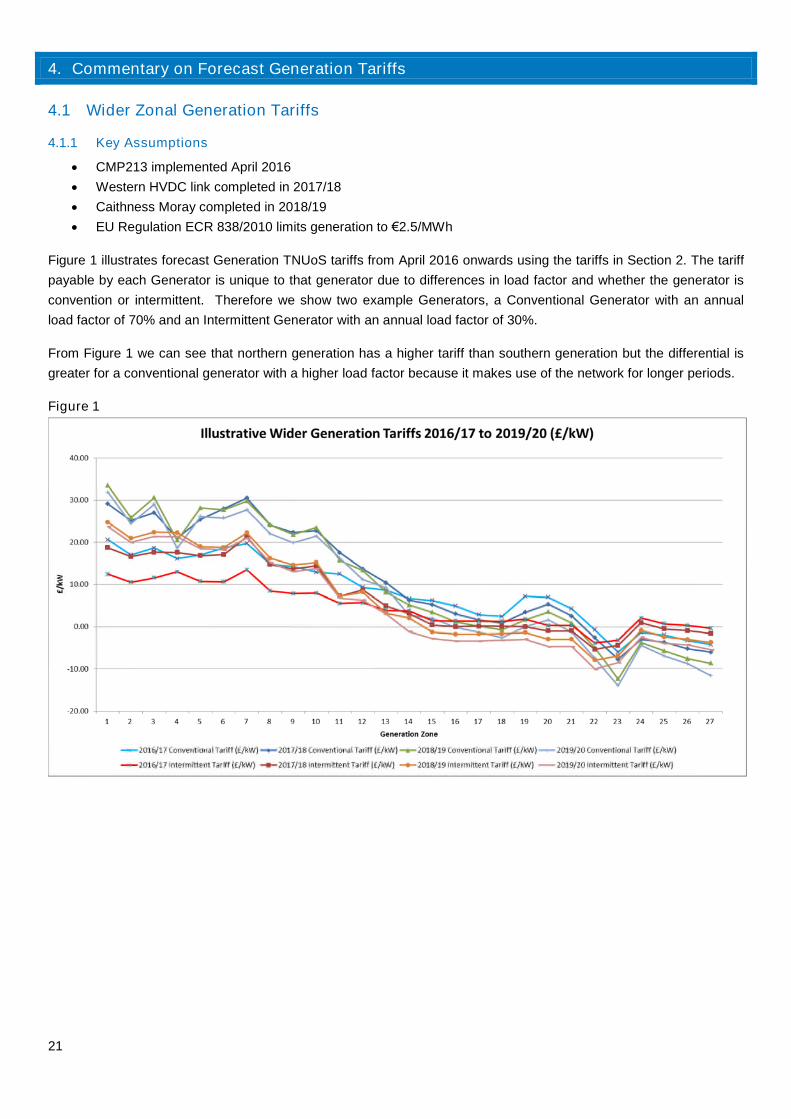
Figure 1 illustrates forecast Generation TNUoS tariffs from April 2016 onwards using the tariffs in Section 2. The tariff
payable by each Generator is unique to that generator due to differences in load factor and whether the generator is
convention or intermittent. Therefore we show two example Generators, a Conventional Generator with an annual
load factor of 70% and an Intermittent Generator with an annual load factor of 30%.
From Figure 1 we can see that northern generation has a higher tariff than southern generation but the differential is
greater for a conventional generator with a higher load factor because it makes use of the network for longer periods.
Figure 1
22
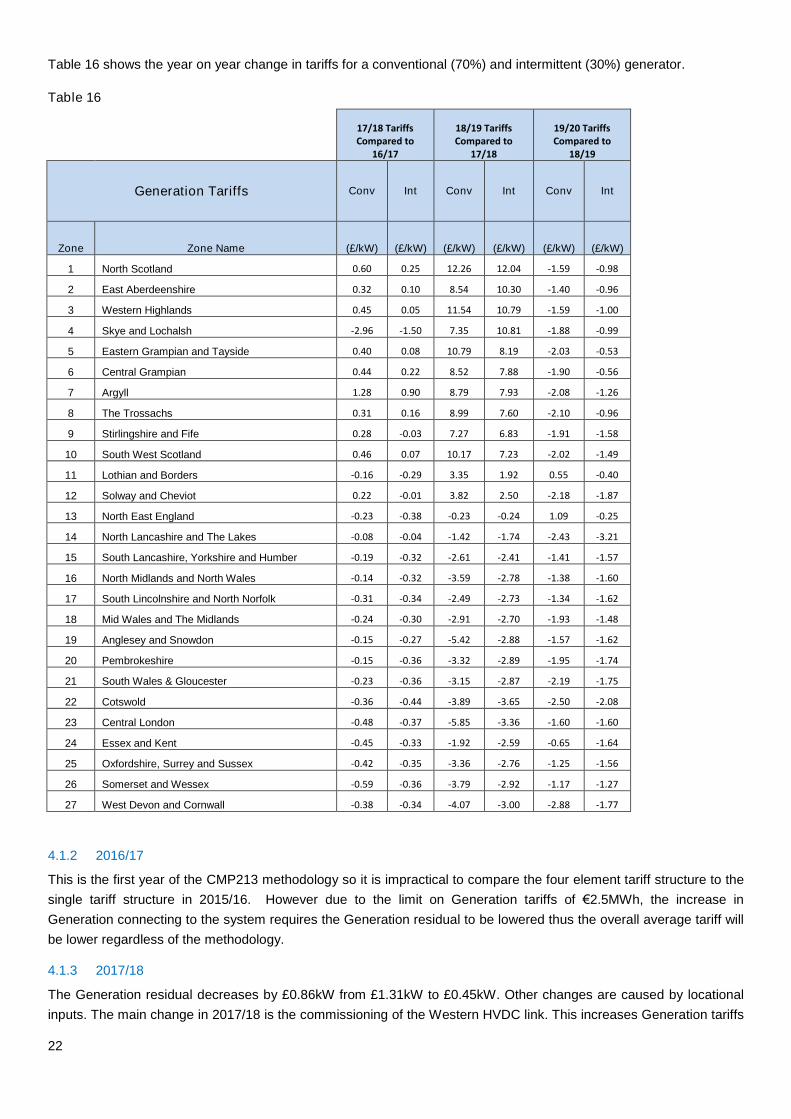
Table 16 shows the year on year change in tariffs for a conventional (70%) and intermittent (30%) generator.
Table 16
17/18 TariffsCompared to
16/17
18/19 TariffsCompared to
17/18
19/20 TariffsCompared to
18/19
Generation Tariffs Conv Int Conv Int Conv Int
Zone Zone Name (£/kW) (£/kW) (£/kW) (£/kW) (£/kW) (£/kW)
1 North Scotland 0.60 0.25 12.26 12.04 -1.59 -0.98
2 East Aberdeenshire 0.32 0.10 8.54 10.30 -1.40 -0.96
3 Western Highlands 0.45 0.05 11.54 10.79 -1.59 -1.00
4 Skye and Lochalsh -2.96 -1.50 7.35 10.81 -1.88 -0.99
5 Eastern Grampian and Tayside 0.40 0.08 10.79 8.19 -2.03 -0.53
6 Central Grampian 0.44 0.22 8.52 7.88 -1.90 -0.56
7 Argyll 1.28 0.90 8.79 7.93 -2.08 -1.26
8 The Trossachs 0.31 0.16 8.99 7.60 -2.10 -0.96
9 Stirlingshire and Fife 0.28 -0.03 7.27 6.83 -1.91 -1.58
10 South West Scotland 0.46 0.07 10.17 7.23 -2.02 -1.49
11 Lothian and Borders -0.16 -0.29 3.35 1.92 0.55 -0.40
12 Solway and Cheviot 0.22 -0.01 3.82 2.50 -2.18 -1.87
13 North East England -0.23 -0.38 -0.23 -0.24 1.09 -0.25
14 North Lancashire and The Lakes -0.08 -0.04 -1.42 -1.74 -2.43 -3.21
15 South Lancashire, Yorkshire and Humber -0.19 -0.32 -2.61 -2.41 -1.41 -1.57
16 North Midlands and North Wales -0.14 -0.32 -3.59 -2.78 -1.38 -1.60
17 South Lincolnshire and North Norfolk -0.31 -0.34 -2.49 -2.73 -1.34 -1.62
18 Mid Wales and The Midlands -0.24 -0.30 -2.91 -2.70 -1.93 -1.48
19 Anglesey and Snowdon -0.15 -0.27 -5.42 -2.88 -1.57 -1.62
20 Pembrokeshire -0.15 -0.36 -3.32 -2.89 -1.95 -1.74
21 South Wales & Gloucester -0.23 -0.36 -3.15 -2.87 -2.19 -1.75
22 Cotswold -0.36 -0.44 -3.89 -3.65 -2.50 -2.08
23 Central London -0.48 -0.37 -5.85 -3.36 -1.60 -1.60
24 Essex and Kent -0.45 -0.33 -1.92 -2.59 -0.65 -1.64
25 Oxfordshire, Surrey and Sussex -0.42 -0.35 -3.36 -2.76 -1.25 -1.56
26 Somerset and Wessex -0.59 -0.36 -3.79 -2.92 -1.17 -1.27
27 West Devon and Cornwall -0.38 -0.34 -4.07 -3.00 -2.88 -1.77
4.1.2 2016/17
This is the first year of the CMP213 methodology so it is impractical to compare the four element tariff structure to the
single tariff structure in 2015/16. However due to the limit on Generation tariffs of €2.5MWh, the increase in
Generation connecting to the system requires the Generation residual to be lowered thus the overall average tariff will
be lower regardless of the methodology.
4.1.3 2017/18
The Generation residual decreases by £0.86kW from £1.31kW to £0.45kW. Other changes are caused by locational
inputs. The main change in 2017/18 is the commissioning of the Western HVDC link. This increases Generation tariffs

23
in zones whose incremental flows utilise the link i.e. the majority of Scotland or where flows now increase, with a
corresponding decrease in tariffs elsewhere. Appendix B shows 2017/18 tariffs without the HVDC link to allow users to
gauge its effect. The increase in the expansion constant effectively stretches the network widening the spread of
tariffs.
4.1.4 2018/19
The Generation residual decreases by £1.79kW from £0.45kW to -£1.34kW due to the increase in offshore revenue
and increase in generation connecting to the system. The residual turns negative as the sum of the revenue recovered
from Local Tariffs (onshore and offshore) and the locational elements of the Wider tariff is greater than what is
required to be recovered from Generation. Other changes are caused by locational inputs.
Tariffs in Scotland generally have higher increases due to the increase in North to South flows. North of Scotland
(Zones 1, 2 and 3) see a higher increase than the rest of Scotland due to the completion of the Caithness Moray
HVDC link.
The increase in low carbon generation results in flows along circuits driving year round tariffs to change direction. This
increases the distance of year round generation flows, in terms of km. Also the increasing proportion of low carbon in
Scotland switches costs from Year Round Shared to Year Round Not-Shared. The latter is not reduced by annual
load factors, increasing the effective tariff. The switch occurs when Non-Carbon based generation becomes the
dominant form of generation within a zone.
Tariffs paid by conventional Generation in certain zones in Scotland don’t increase as much as intermittent Generation
because it benefits from a decrease in the Peak tariff. Intermittent does not pay the Peak Tariff and so the increase in
Year Round Shared has a greater effect on its tariffs.
Zone 23 (Central London) sees larger decreases due to the uprating of circuits.
The increase in the expansion constant effectively stretches the network widening the spread of tariffs.
4.1.5 2019/20
The Generation residual decreases by -£1.63kW from -£1.34kW to -£2.97kW due to the increase in offshore revenue
and the increase in Generation connecting to the system. Other changes are caused by locational inputs i.e. large
increases in Generation in the East/South East of the country and Yorkshire/North East
The increase in the expansion constant effectively stretches the network widening the spread of tariffs.
4.2 Changes in the Generator Residual
The Residual element of the Generation charge is affected by the following variables:
Generation and Demand split – Discussed in Section 6.
Revenue assumptions – Discussed in Section 3.5.
Generation charging base - As the Generation charging base increases from year to year the Generation
residual decreases. The increase in the generator charging base is described in Section 3.3. The calculation
of generator residuals is described in Section 7.
4.3 Onshore Local Circuit Tariffs
A forecast of onshore local circuit tariffs from 2016/17 to 2019/20 is shown in Table 5 - Onshore Local Circuit Tariffs.
These have been calculated using contracted generation from 2016/17 onwards. The Onshore Local Circuit charge for
a Generation Spur is dependent on the length of the circuit (s), type of circuit (s) connecting to the nearest MITS
substation. For those local circuits which tee into a line the impedance and flows along the circuits also affect the tariff.

24
For later years where there is limited information on how or where the generator intends to connect to the
Transmission system, Generation has been mapped to the nearest existing node. This will alter the forecast Local
Circuit Tariff. If you are unsure about your local circuit tariff or whether one will be applied please contact your
Connection Account Manager or alternatively use the contact details in Section 9.
4.4 Onshore Local Substation Tariffs
Table 6 shows the onshore local substation tariffs that are forecasted to apply during 2016/17. These tariffs only apply
to transmission connected generators. The tariffs will be indexed by RPI for each year of the price control. For future
year we assume tariffs inflate by 3% each year.
If no significant work is planned at a substation that changes whether or not there is redundancy, the tariff will only
alter by RPI. If the sum of the TEC of the generators at a substation changes such that the 1320MW threshold is
crossed, this will change the tariff applied to all generators at that location. If you are unsure about what tariff may
apply please contact National Grid for further information.
4.5 Small Generators Discount
Under Condition C13 of National Grid’s electricity transmission licence a discount is applied to small generators
connected to 132kV transmission systems who, but for the fact they are connected to a transmission system, would
not otherwise be liable for TNUoS charges. The discount lapses on 1 April 2016.
25
5. Commentary on Forecast Demand Tariffs
5.1.1 Key Assumptions
New methodology implemented April 2016
Western HVDC link completed in 2017/18
Caithness Moray completed in 2018/19
EU Regulation ECR 838/2010 limits generation to €2.5/MWh
P272 Implemented 2016/17
The above assumptions are the major drivers of demand tariff changes over the next 5 years other than specific
Generation connecting.
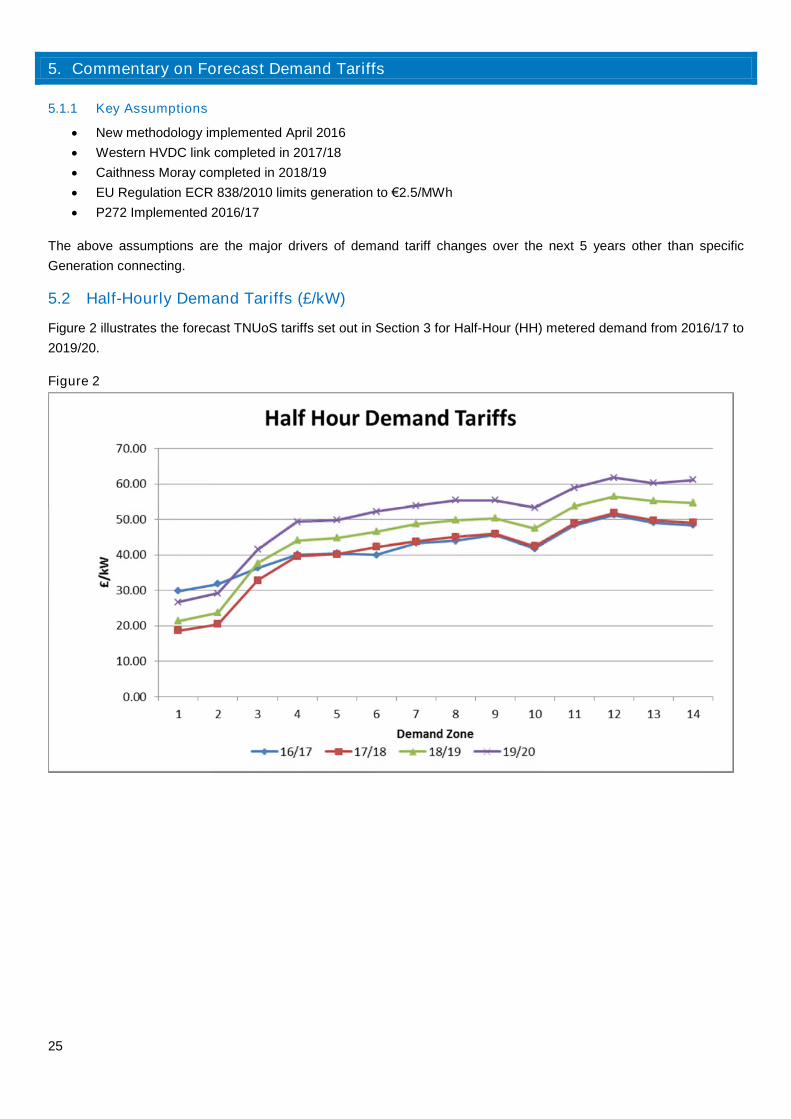
5.2 Half-Hourly Demand Tariffs (£/kW)
Figure 2 illustrates the forecast TNUoS tariffs set out in Section 3 for Half-Hour (HH) metered demand from 2016/17 to
2019/20.
Figure 2
26
Table 17 – Changes in Half-Hourly Metered Tariffs
Zone Zone Name
Difference16/17 to
17/18(£/kW)
Difference17/18 to
18/19(£/kW)
Difference18/19 to
19/20(£/kW)
1 Northern Scotland -11.12 2.67 5.30
2 Southern Scotland -11.42 3.31 5.50
3 Northern -3.49 4.87 3.90
4 North West -0.42 4.34 5.34
5 Yorkshire -0.32 4.60 5.09
6 N Wales & Mersey 2.26 4.36 5.61
7 East Midlands 0.39 4.96 5.12
8 Midlands 1.11 4.79 5.51
9 Eastern 0.30 4.42 4.99
10 South Wales 0.59 5.06 5.86
11 South East 0.52 4.84 5.11
12 London 0.51 4.73 5.34
13 Southern 0.60 5.51 5.04
14 South Western 0.71 5.61 6.45
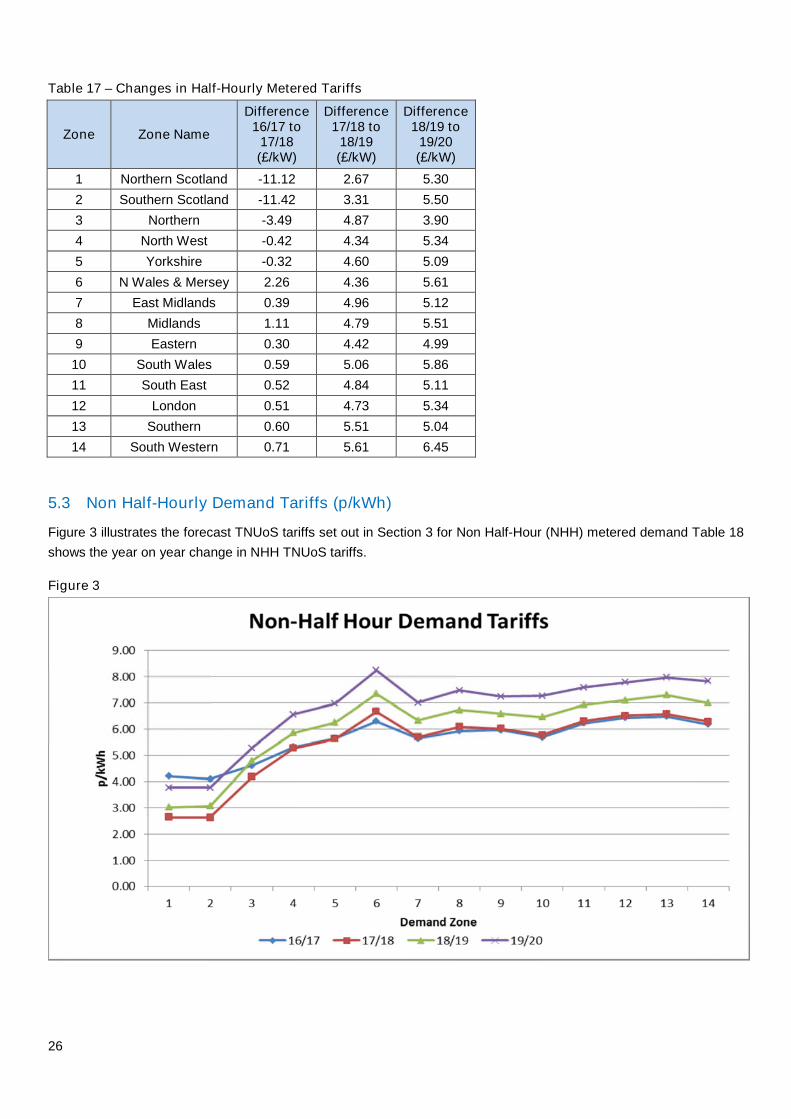
5.3 Non Half-Hourly Demand Tariffs (p/kWh)
Figure 3 illustrates the forecast TNUoS tariffs set out in Section 3 for Non Half-Hour (NHH) metered demand Table 18
shows the year on year change in NHH TNUoS tariffs.
Figure 3
27
Table 18 – Changes in Non-Half-Hour Metered Tariffs
Zone Zone Name
Difference16/17 to
17/18(p/kWh)
Difference17/18 to
18/19(p/kWh)
Difference18/19 to
19/20(p/kWh)
1 Northern Scotland -1.56 0.38 0.75
2 Southern Scotland -1.46 0.42 0.71
3 Northern -0.43 0.62 0.50
4 North West -0.04 0.57 0.71
5 Yorkshire -0.03 0.64 0.72
6 N Wales & Mersey 0.37 0.68 0.89
7 East Midlands 0.07 0.64 0.67
8 Midlands 0.16 0.64 0.75
9 Eastern 0.05 0.57 0.66
10 South Wales 0.09 0.68 0.80
11 South East 0.08 0.62 0.66
12 London 0.08 0.59 0.68
13 Southern 0.10 0.72 0.67
14 South Western 0.11 0.71 0.83
5.4 Residual Demand Changes
The Residual element of the demand charge is affected by the following variables:
Generation and Demand split – discussed in Section 6.
Revenue assumptions - Discussed in Section 3.5.
Demand charging base – Discussed in Section 3.6
Reductions in the demand charging base, coupled with the cap on average annual generation charges with
increasing revenue, generally increases the demand residual over the forecast period.
The information in Sections 6 and 7 can be used to alter the demand charging bases to see the effect on the residual.
5.5 Locational Demand Changes
5.5.1 2016/17 to 2017/18
The major driver for change in tariffs in from 2016/17 to 2017/18 is the commissioning of the Western HVDC link. This
increases demand tariffs in zones at the receiving end of the link, i.e. Zones 6 and 8, whilst reducing demand tariffs in
zones who export through the link, i.e. Zones 1 and 2. Appendix B shows 2017/18 tariffs without the HVDC link to
allow users to gauge its effect.
5.5.2 2017/18 to 2018/19
Demand tariffs in Scotland and the North increase less than the increase in the residual due to the connection of new
generation. This may be reversed if there are any large closures of generation not yet announced.
5.5.3 2018/19 to 2019/20
Increases in Generation in the East and South East alter flows in the South of England particularly west to East flows,
resulting in an increase in tariffs in the South West and South Wales. Zone 3 has a lower increase due to the planned
connection of the Norwegian Interconnector in that zone.

28
6. Generation and Demand Revenue Proportions
Until recently the charging methodology fixed the proportion of revenue collected from Generation (G) at 27% and the
proportion from Demand (D) at 73%. CMP224 modifies the charging methodology such that the proportions alter to
comply with EU Regulation ECR 838/2010 which limits the revenue that can be recovered from Generation to an
average of €2.5/MWh per annum.
The proportions will change due to forecast increases in revenue and the Euro and lower demand. The proportions of
TNUoS revenue to be recovered from Generation (G) and from Demand (D) are given by the formulas:
RX
ELG
RX
ELD 1
Where:
G is the proportion of TNUoS revenue recovered from Generation
D is the proportion of TNUoS revenue recovered from Demand
E is the total energy consumed by demand over a year
L is the average generator charge cap per kWh (taking account of any risk adjustment)
R is the total TNUoS revenue to be recovered.
X is the Euros/Sterling exchange rate
Table 19 shows how the G and D proportions vary over time based on forecast revenues. As average annual
generator charges are limited, any changes in revenue only affect demand resulting in changes to the G and D
proportions.
Table 19 – Calculation of Generator and Demand Revenue Proportions
G/D split 2016/17 2017/18 2018/19 2019/20
E (TWh) 318.68 317.92 314.58 309.89
L (€/MWh) 2.34 2.34 2.34 2.34
R (£m) 2,873.0 2,805.8 3,013.2 3,244.6
X (€/£) 1.25 1.23 1.21 1.19
G 0.208 0.216 0.202 0.188
D 0.792 0.784 0.798 0.812
G.R (£m) 596.6 604.8 608.4 609.4
D.R (£m) 2276.4 2201.0 2404.9 2635.2
29
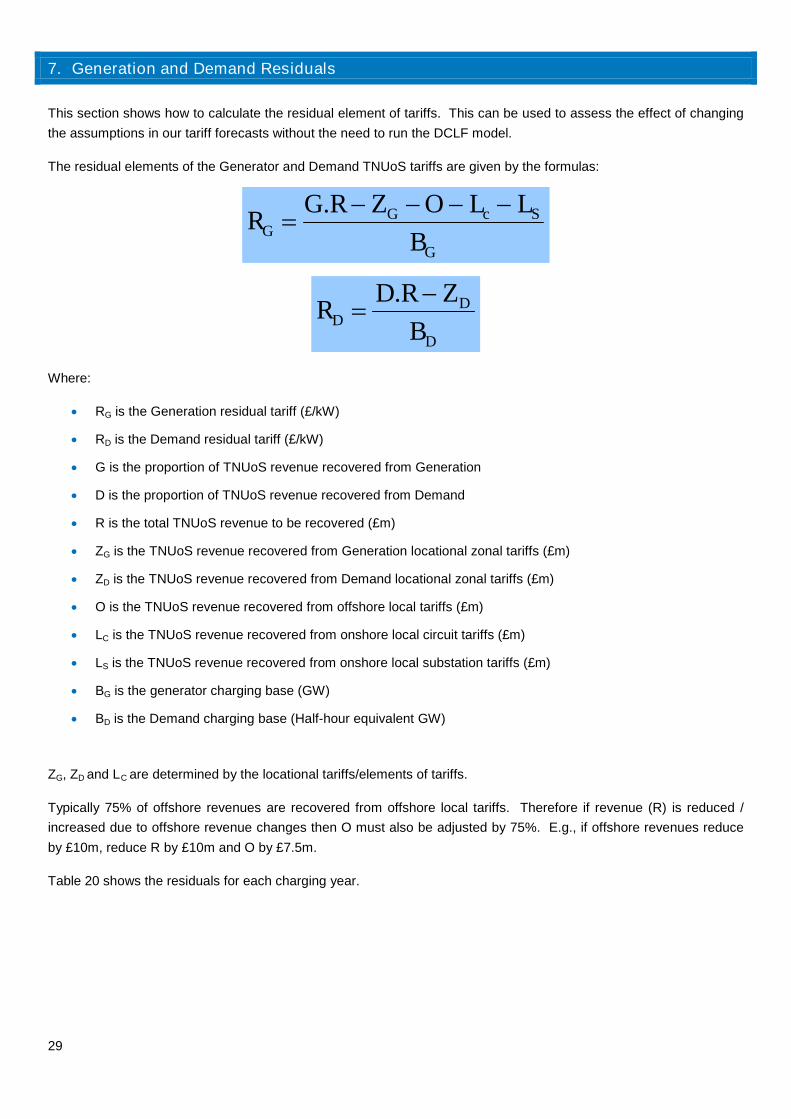
7. Generation and Demand Residuals
This section shows how to calculate the residual element of tariffs. This can be used to assess the effect of changing
the assumptions in our tariff forecasts without the need to run the DCLF model.
The residual elements of the Generator and Demand TNUoS tariffs are given by the formulas:
G
ScGG
B
LLOZRGR
.
D
DD
B
ZRDR
.
Where:
RG is the Generation residual tariff (£/kW)
RD is the Demand residual tariff (£/kW)
G is the proportion of TNUoS revenue recovered from Generation
D is the proportion of TNUoS revenue recovered from Demand
R is the total TNUoS revenue to be recovered (£m)
ZG is the TNUoS revenue recovered from Generation locational zonal tariffs (£m)
ZD is the TNUoS revenue recovered from Demand locational zonal tariffs (£m)
O is the TNUoS revenue recovered from offshore local tariffs (£m)
LC is the TNUoS revenue recovered from onshore local circuit tariffs (£m)
LS is the TNUoS revenue recovered from onshore local substation tariffs (£m)
BG is the generator charging base (GW)
BD is the Demand charging base (Half-hour equivalent GW)
ZG, ZD and LC are determined by the locational tariffs/elements of tariffs.
Typically 75% of offshore revenues are recovered from offshore local tariffs. Therefore if revenue (R) is reduced /
increased due to offshore revenue changes then O must also be adjusted by 75%. E.g., if offshore revenues reduce
by £10m, reduce R by £10m and O by £7.5m.
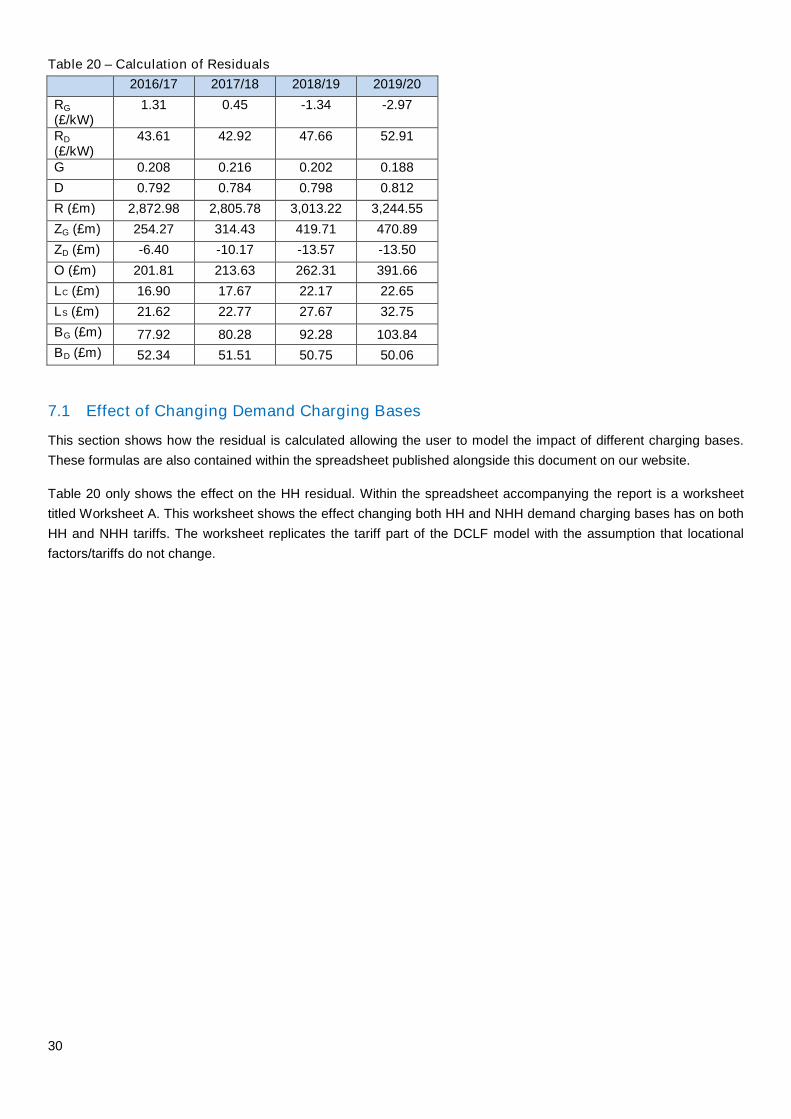
Table 20 shows the residuals for each charging year.
30
Table 20 – Calculation of Residuals
2016/17 2017/18 2018/19 2019/20
RG
(£/kW)1.31 0.45 -1.34 -2.97
RD
(£/kW)43.61 42.92 47.66 52.91
G 0.208 0.216 0.202 0.188
D 0.792 0.784 0.798 0.812
R (£m) 2,872.98 2,805.78 3,013.22 3,244.55
ZG (£m) 254.27 314.43 419.71 470.89
ZD (£m) -6.40 -10.17 -13.57 -13.50
O (£m) 201.81 213.63 262.31 391.66
LC (£m) 16.90 17.67 22.17 22.65
LS (£m) 21.62 22.77 27.67 32.75
BG (£m) 77.92 80.28 92.28 103.84
BD (£m) 52.34 51.51 50.75 50.06
7.1 Effect of Changing Demand Charging Bases
This section shows how the residual is calculated allowing the user to model the impact of different charging bases.
These formulas are also contained within the spreadsheet published alongside this document on our website.
Table 20 only shows the effect on the HH residual. Within the spreadsheet accompanying the report is a worksheet
titled Worksheet A. This worksheet shows the effect changing both HH and NHH demand charging bases has on both
HH and NHH tariffs. The worksheet replicates the tariff part of the DCLF model with the assumption that locational
factors/tariffs do not change.

31
8. Tools and Supporting Information
8.1 Discussing Tariff Changes
National Grid is keen to ensure that customers understand the current charging arrangements and the reasons why
charges have changed from year to year. Therefore, we expect to attend a future charging methodology forum to
discuss these forecasts
8.2 Future Updates to Tariff Forecasts
Final tariffs for 2015/16 will be published 30 January 2015.
National Grid will update the forecast of 2016/17 tariffs throughout 2015. The timetable for this is yet to be confirmed
but will be at least done on a quarterly basis. This will allow customers to gauge the impact of changes to the key
inputs into the charging model such as TEC reductions and allowed revenue ahead of the publication of draft and final
TNUoS tariffs.
8.3 Charging Models
Customers can receive a copy of National Grid’s charging models to conduct sensitivity analysis on alternative
developments of Generation and Demand. These models are based on the contracted TEC background which differs
from National Grid’s view that has been used to calculate the tariffs in this update. We are unable to provide a
breakdown of National Grid’s view as it may be based on commercially sensitive information.
If you would like a copy of any of the models please contact us. Please note that, while the model is available free of
charge, it is provided under licence to restrict, among other things, its distribution and commercial use.
8.4 Tools and Useful Guides
National Grid has prepared a number of tools and guidance notes to help customers understand the charging
arrangements. These include:
Annual Load Factors 2014-15
Offshore Charging Guidance
http://www2.nationalgrid.com/UK/Industry-information/System-charges/Electricity-transmission/Transmission-Network-Use-
of-System-Charges/Tools-and-Data/

32
9. Comments & Feedback
As part of our commitment to customers, National Grid welcomes comments and feedback on the information
contained in this document. In particular, to ensure that information is provided and presented in a way that is of most
use to customers, we would welcome specific feedback on:
the level of numeric detail provided to explain tariff changes;
the quality of the explanation given to describe and explain tariff changes;
information that is not useful and could be omitted; and
information that is missing that could be added.
These should be sent to:
Mary Owen [email protected] or Stuart boyle [email protected]
National Grid
Warwick Technology Park
Warwick
CV34 6DA

33
Appendices
Appendix A : Treatment of HVDC Links
Appendix B : TNUoS Tariffs without HVDC Links
Appendix C : Revenue Analysis
Appendix D : Contracted Generation Changes from 16/17 to 19/20
Appendix E : Zonal Summaries of Modelled Demand
Appendix F : Generation Zone Map
Appendix G : Demand Zone Map
34
Appendix A : Treatment of HVDC Links
Link Flows
Due to the nature of this technology, the flow on an HVDC link, such as the Western HVDC, will be selectively
controlled by the System Operator rather than determined by the impedance of the circuit. The flow determined by the
System Operator will depend upon operational conditions at the time, and the resulting decision will take a range of
factors into account.
As TNUoS tariffs vary depending on the flow assumed in the transport model, an algorithm in the transport model will
objectively determine the desired flow on the HVDC link. This is then used to set the impedance of each HVDC link
within the transport model. The following example explains how this algorithm is applied.
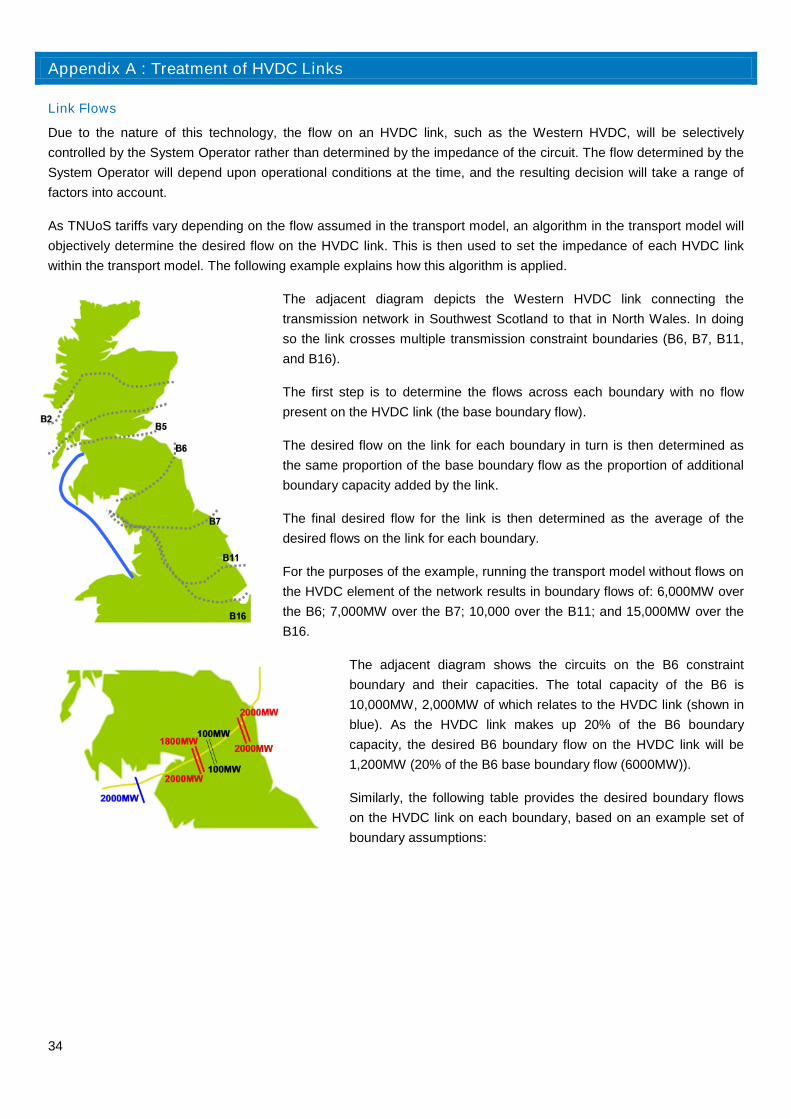
The adjacent diagram depicts the Western HVDC link connecting the
transmission network in Southwest Scotland to that in North Wales. In doing
so the link crosses multiple transmission constraint boundaries (B6, B7, B11,
and B16).
The first step is to determine the flows across each boundary with no flow
present on the HVDC link (the base boundary flow).
The desired flow on the link for each boundary in turn is then determined as
the same proportion of the base boundary flow as the proportion of additional
boundary capacity added by the link.
The final desired flow for the link is then determined as the average of the
desired flows on the link for each boundary.
For the purposes of the example, running the transport model without flows on
the HVDC element of the network results in boundary flows of: 6,000MW over
the B6; 7,000MW over the B7; 10,000 over the B11; and 15,000MW over the
B16.
The adjacent diagram shows the circuits on the B6 constraint
boundary and their capacities. The total capacity of the B6 is
10,000MW, 2,000MW of which relates to the HVDC link (shown in
blue). As the HVDC link makes up 20% of the B6 boundary
capacity, the desired B6 boundary flow on the HVDC link will be
1,200MW (20% of the B6 base boundary flow (6000MW)).
Similarly, the following table provides the desired boundary flows
on the HVDC link on each boundary, based on an example set of
boundary assumptions:

35
Boundary Total
Capacity
(MW)
HVDC
Capacity
(MW)
HVDC
Capacity
Proportion
Base Boundary
Flow (MW)
Desired
Boundary flow
on HVDC link
(MW)
B6 10,000 2,000 20% 6,000 1,200
B7 14,000 2,000 14.3% 7,000 1,000
B11 25,000 2,000 8.0% 10,000 800
B16 30,000 2,000 6.7% 15,000 1,000
The overall desired flow on the link is determined by taking the average of each of the desired boundary flow on the
HVDC link. In this case the desired flow on the link is 1,000MW. Following this calculation, an iterative process is
undertaken in the transport model to determine the impedance required to result in the desired flow on the HVDC link.
Link Costs
Each HVDC link will have its own individual Expansion Factor so that the costs of the circuit are accurately reflected in
tariffs. Within the transport model this is achieved by expanding the length of the circuit within the transport model
rather than having an actual definitive Expansion Factor.
Actual cost information relating to the project cannot be gathered early on in the project’s lifetime as tenders and
negotiations are still ongoing and this information is commercially sensitive.
For both the Caithness Moray and Western HVDC links we followed the approach taken in the CMP213 workgroup
and based figures on previously published cost information for HVDC subsea cable and converter costs7. We will look
to update information as and when we receive it.
7http://www.nationalgrid.com/NR/rdonlyres/26AE1FA4-2C3B-4895-BC0B-7B2EF0229BFE/49226/Part5AppendixD.pdf
36
Appendix B : TNUoS Tariffs without HVDC Links
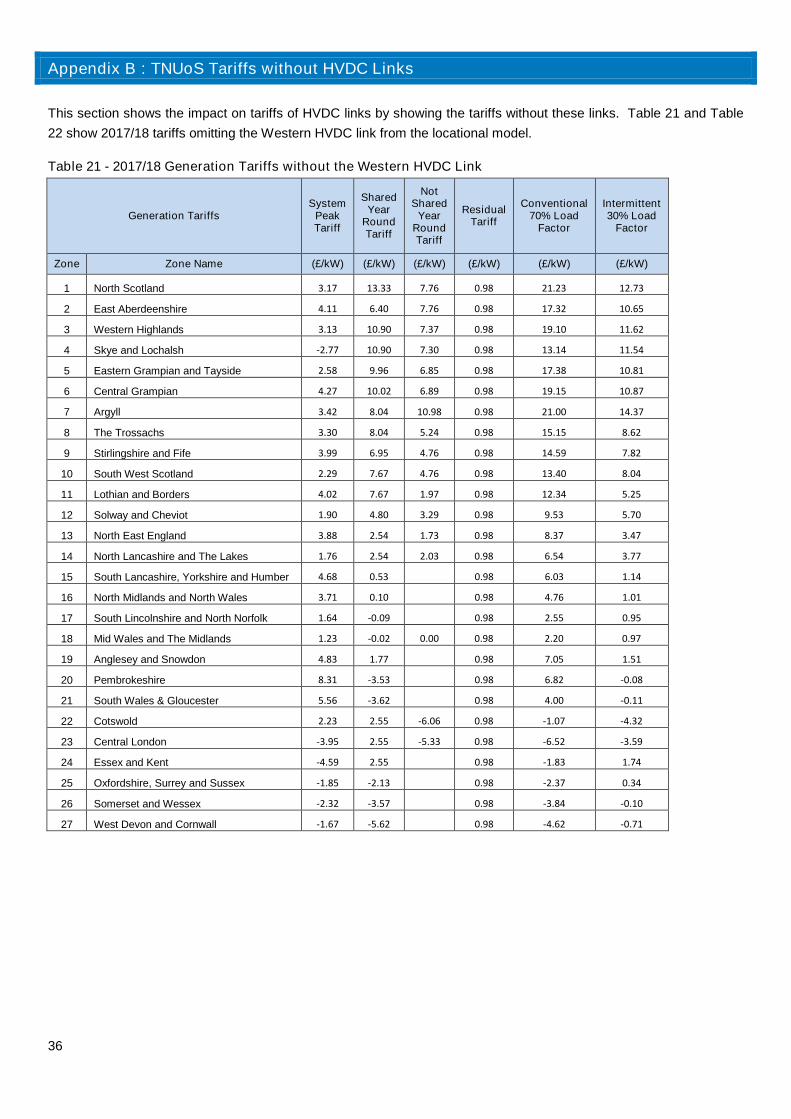
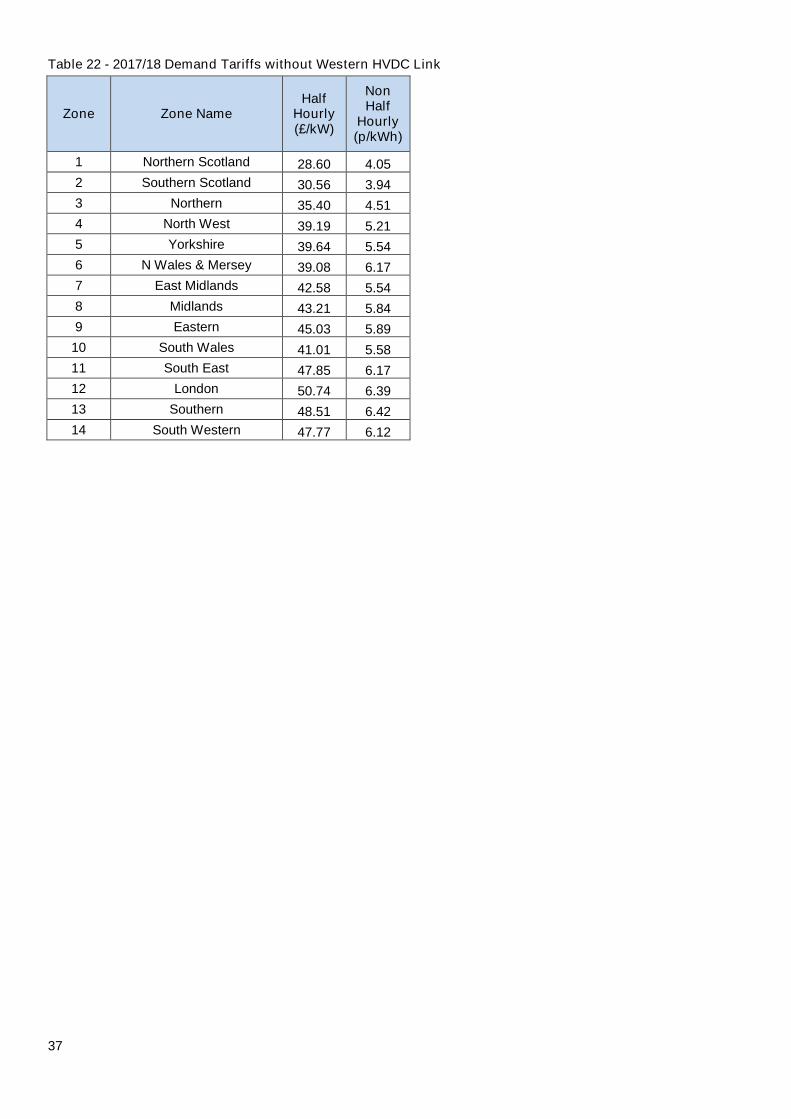
This section shows the impact on tariffs of HVDC links by showing the tariffs without these links. Table 21 and Table
22 show 2017/18 tariffs omitting the Western HVDC link from the locational model.
Table 21 - 2017/18 Generation Tariffs without the Western HVDC Link
Generation TariffsSystem
PeakTariff
SharedYear
RoundTariff
NotShared
YearRoundTariff
ResidualTariff
Conventional70% Load
Factor
Intermittent30% Load
Factor
Zone Zone Name (£/kW) (£/kW) (£/kW) (£/kW) (£/kW) (£/kW)
1 North Scotland 3.17 13.33 7.76 0.98 21.23 12.73
2 East Aberdeenshire 4.11 6.40 7.76 0.98 17.32 10.65
3 Western Highlands 3.13 10.90 7.37 0.98 19.10 11.62
4 Skye and Lochalsh -2.77 10.90 7.30 0.98 13.14 11.54
5 Eastern Grampian and Tayside 2.58 9.96 6.85 0.98 17.38 10.81
6 Central Grampian 4.27 10.02 6.89 0.98 19.15 10.87
7 Argyll 3.42 8.04 10.98 0.98 21.00 14.37
8 The Trossachs 3.30 8.04 5.24 0.98 15.15 8.62
9 Stirlingshire and Fife 3.99 6.95 4.76 0.98 14.59 7.82
10 South West Scotland 2.29 7.67 4.76 0.98 13.40 8.04
11 Lothian and Borders 4.02 7.67 1.97 0.98 12.34 5.25
12 Solway and Cheviot 1.90 4.80 3.29 0.98 9.53 5.70
13 North East England 3.88 2.54 1.73 0.98 8.37 3.47
14 North Lancashire and The Lakes 1.76 2.54 2.03 0.98 6.54 3.77
15 South Lancashire, Yorkshire and Humber 4.68 0.53 0.00 0.98 6.03 1.14
16 North Midlands and North Wales 3.71 0.10 0.00 0.98 4.76 1.01
17 South Lincolnshire and North Norfolk 1.64 -0.09 0.00 0.98 2.55 0.95
18 Mid Wales and The Midlands 1.23 -0.02 0.00 0.98 2.20 0.97
19 Anglesey and Snowdon 4.83 1.77 0.00 0.98 7.05 1.51
20 Pembrokeshire 8.31 -3.53 0.00 0.98 6.82 -0.08
21 South Wales & Gloucester 5.56 -3.62 0.00 0.98 4.00 -0.11
22 Cotswold 2.23 2.55 -6.06 0.98 -1.07 -4.32
23 Central London -3.95 2.55 -5.33 0.98 -6.52 -3.59
24 Essex and Kent -4.59 2.55 0.00 0.98 -1.83 1.74
25 Oxfordshire, Surrey and Sussex -1.85 -2.13 0.00 0.98 -2.37 0.34
26 Somerset and Wessex -2.32 -3.57 0.00 0.98 -3.84 -0.10
27 West Devon and Cornwall -1.67 -5.62 0.00 0.98 -4.62 -0.71
37
Table 22 - 2017/18 Demand Tariffs without Western HVDC Link
Zone Zone NameHalf
Hourly(£/kW)
NonHalf
Hourly(p/kWh)
1 Northern Scotland 28.60 4.05
2 Southern Scotland 30.56 3.94
3 Northern 35.40 4.51
4 North West 39.19 5.21
5 Yorkshire 39.64 5.54
6 N Wales & Mersey 39.08 6.17
7 East Midlands 42.58 5.54
8 Midlands 43.21 5.84
9 Eastern 45.03 5.89
10 South Wales 41.01 5.58
11 South East 47.85 6.17
12 London 50.74 6.39
13 Southern 48.51 6.42
14 South Western 47.77 6.12
38
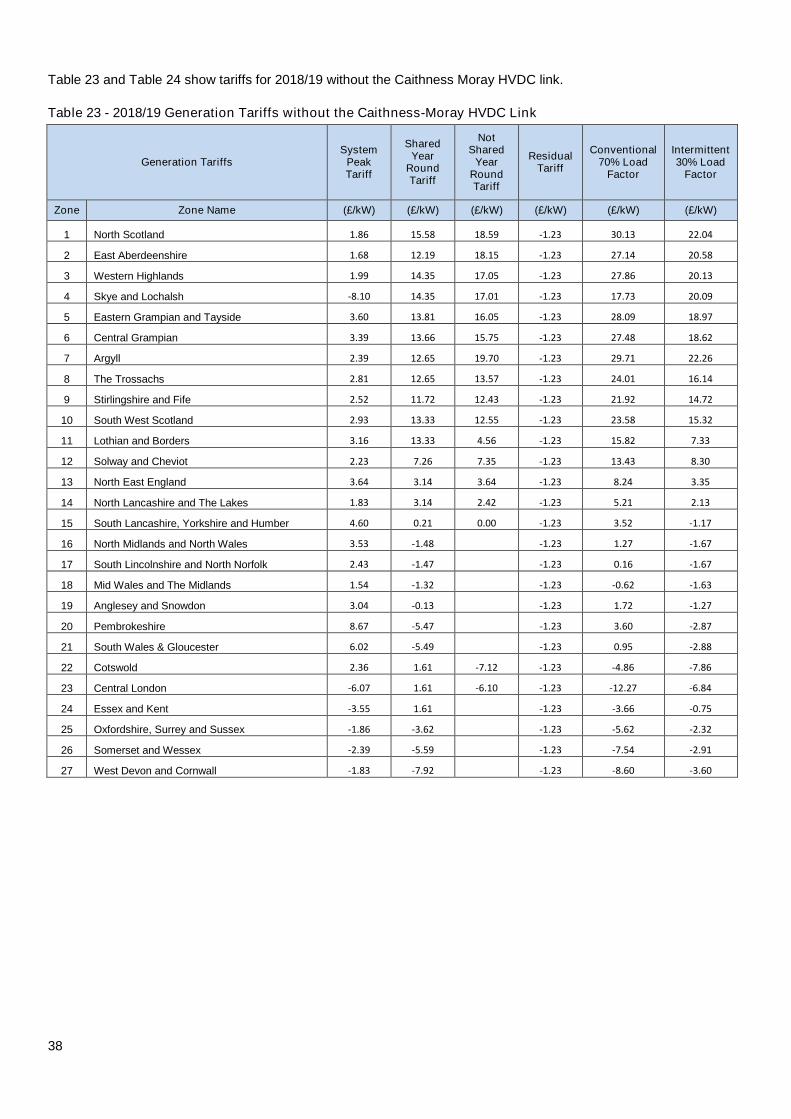
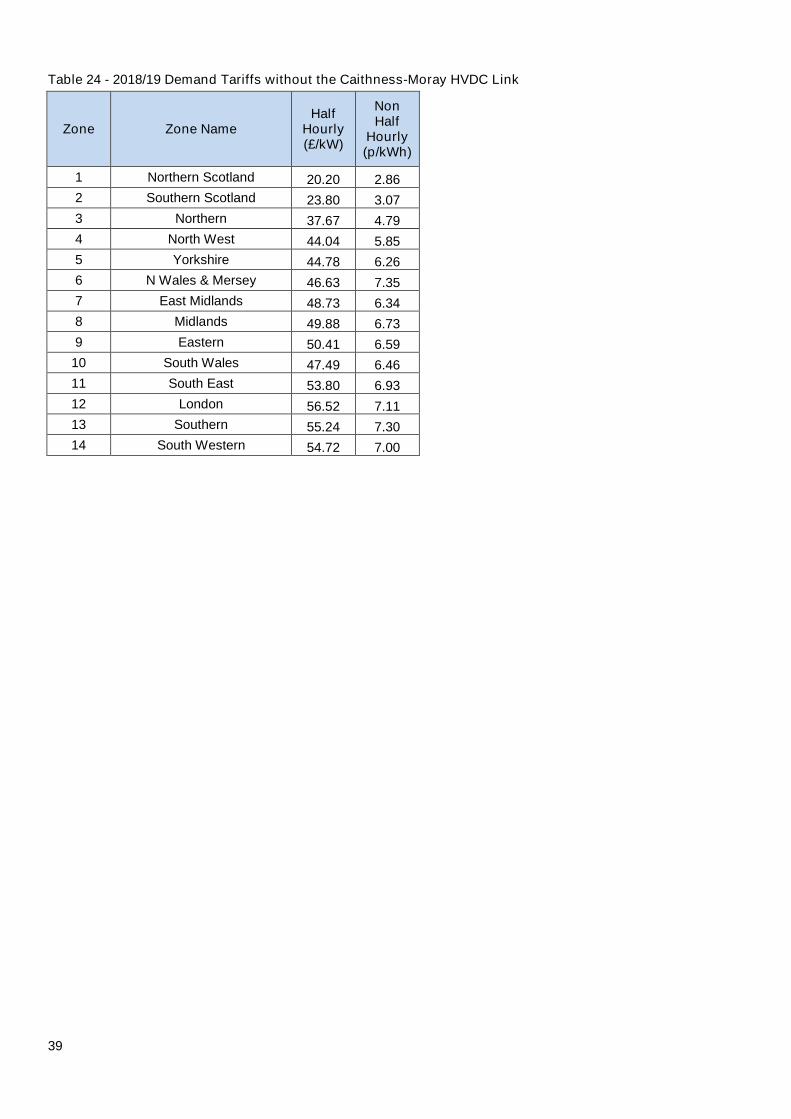
Table 23 and Table 24 show tariffs for 2018/19 without the Caithness Moray HVDC link.
Table 23 - 2018/19 Generation Tariffs without the Caithness-Moray HVDC Link
Generation TariffsSystem
PeakTariff
SharedYear
RoundTariff
NotShared
YearRoundTariff
ResidualTariff
Conventional70% Load
Factor
Intermittent30% Load
Factor
Zone Zone Name (£/kW) (£/kW) (£/kW) (£/kW) (£/kW) (£/kW)
1 North Scotland 1.86 15.58 18.59 -1.23 30.13 22.04
2 East Aberdeenshire 1.68 12.19 18.15 -1.23 27.14 20.58
3 Western Highlands 1.99 14.35 17.05 -1.23 27.86 20.13
4 Skye and Lochalsh -8.10 14.35 17.01 -1.23 17.73 20.09
5 Eastern Grampian and Tayside 3.60 13.81 16.05 -1.23 28.09 18.97
6 Central Grampian 3.39 13.66 15.75 -1.23 27.48 18.62
7 Argyll 2.39 12.65 19.70 -1.23 29.71 22.26
8 The Trossachs 2.81 12.65 13.57 -1.23 24.01 16.14
9 Stirlingshire and Fife 2.52 11.72 12.43 -1.23 21.92 14.72
10 South West Scotland 2.93 13.33 12.55 -1.23 23.58 15.32
11 Lothian and Borders 3.16 13.33 4.56 -1.23 15.82 7.33
12 Solway and Cheviot 2.23 7.26 7.35 -1.23 13.43 8.30
13 North East England 3.64 3.14 3.64 -1.23 8.24 3.35
14 North Lancashire and The Lakes 1.83 3.14 2.42 -1.23 5.21 2.13
15 South Lancashire, Yorkshire and Humber 4.60 0.21 0.00 -1.23 3.52 -1.17
16 North Midlands and North Wales 3.53 -1.48 0.00 -1.23 1.27 -1.67
17 South Lincolnshire and North Norfolk 2.43 -1.47 0.00 -1.23 0.16 -1.67
18 Mid Wales and The Midlands 1.54 -1.32 0.00 -1.23 -0.62 -1.63
19 Anglesey and Snowdon 3.04 -0.13 0.00 -1.23 1.72 -1.27
20 Pembrokeshire 8.67 -5.47 0.00 -1.23 3.60 -2.87
21 South Wales & Gloucester 6.02 -5.49 0.00 -1.23 0.95 -2.88
22 Cotswold 2.36 1.61 -7.12 -1.23 -4.86 -7.86
23 Central London -6.07 1.61 -6.10 -1.23 -12.27 -6.84
24 Essex and Kent -3.55 1.61 0.00 -1.23 -3.66 -0.75
25 Oxfordshire, Surrey and Sussex -1.86 -3.62 0.00 -1.23 -5.62 -2.32
26 Somerset and Wessex -2.39 -5.59 0.00 -1.23 -7.54 -2.91
27 West Devon and Cornwall -1.83 -7.92 0.00 -1.23 -8.60 -3.60
39
Table 24 - 2018/19 Demand Tariffs without the Caithness-Moray HVDC Link
Zone Zone NameHalf
Hourly(£/kW)
NonHalf
Hourly(p/kWh)
1 Northern Scotland 20.20 2.86
2 Southern Scotland 23.80 3.07
3 Northern 37.67 4.79
4 North West 44.04 5.85
5 Yorkshire 44.78 6.26
6 N Wales & Mersey 46.63 7.35
7 East Midlands 48.73 6.34
8 Midlands 49.88 6.73
9 Eastern 50.41 6.59
10 South Wales 47.49 6.46
11 South East 53.80 6.93
12 London 56.52 7.11
13 Southern 55.24 7.30
14 South Western 54.72 7.00

40
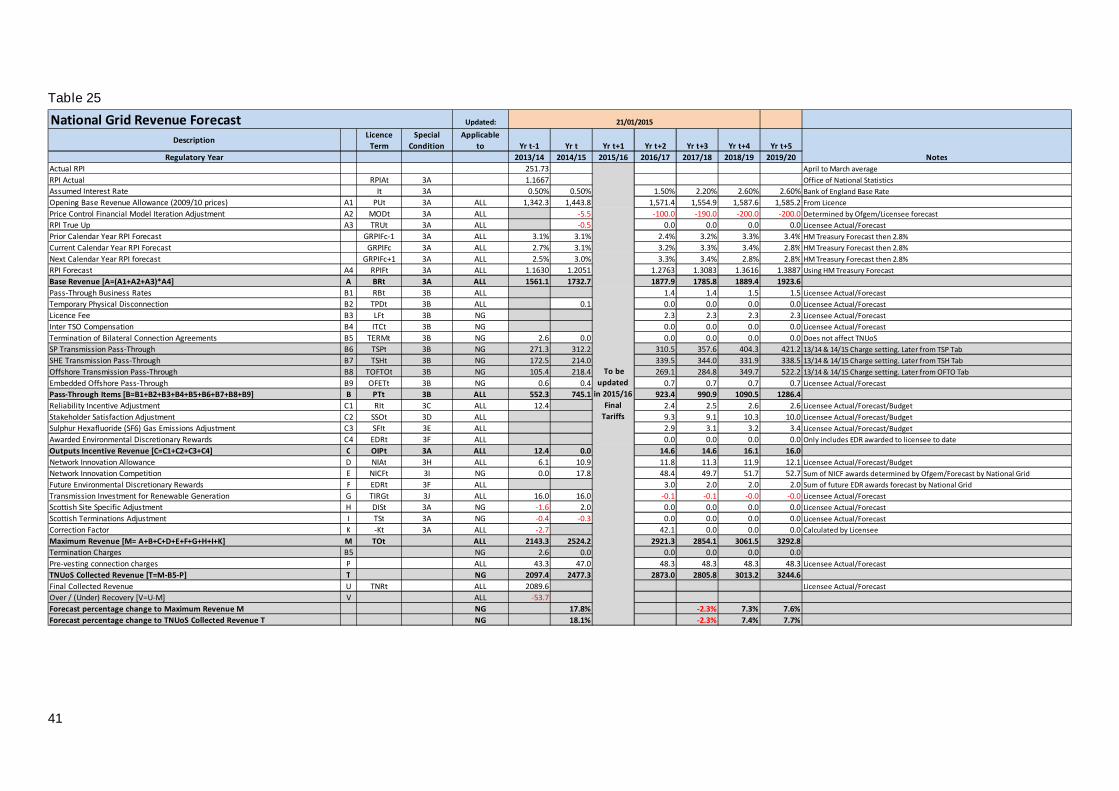
Appendix C : Revenue Analysis
These pages provide more detail on the price control forecasts for National Grid, Scottish Power Transmission and
SHE Transmission. Forecasts are also provided for offshore networks with forecasts by National Grid where these
have yet to be transferred to the Offshore Transmission Owner or are still to be constructed.
Notes:
All monies are quoted in millions of pounds, accurate to one decimal place and are in nominal ‘money of the day’
prices unless stated otherwise.
Licensee forecasts and budgets are subject to change especially where they are influenced by external stakeholders.
Greyed out cells are either calculated or not applicable in the year concerned due to the way the licence formula are
constructed.
Network Innovation Competition Funding is included in the National Grid price control but is additional to the price
controls of other Transmission Owners who receive funding. NIC funding is therefore only shown in the National Grid
table.
All reasonable care has been taken in the preparation of these illustrative tables and the data therein. National Grid
and other TOs offer this data without prejudice and cannot be held responsible for any loss that might be attributed to
the use of this data. Neither National Grid nor other TOs accept or assume responsibility for the use of this
information by any person or any person to whom this information is shown or any person to whom this information
otherwise becomes available.
The base revenues forecasts reflect the figures authorised by Ofgem in the RIIO-T1 or offshore price controls.
Within the bounds of commercial confidentiality these forecasts provide as much information as possible. Generally
allowances determined by Ofgem are shown, whilst those for which Ofgem determinations are expected are not. This
respects commercial confidentiality and disclosure considerations and actual revenues may vary for these forecasts.
It is assumed that there is only one set of price changes each year on 1 April.
41
Table 25
Updated:
DescriptionLicence
Term
Special
Condition
Applicable
to Yr t-1 Yr t Yr t+1 Yr t+2 Yr t+3 Yr t+4 Yr t+5
Regulatory Year 2013/14 2014/15 2015/16 2016/17 2017/18 2018/19 2019/20
Actual RPI 251.73 April to March average
RPI Actual RPIAt 3A 1.1667 Office of National Statistics
Assumed Interest Rate It 3A 0.50% 0.50% 1.50% 2.20% 2.60% 2.60% Bank of England Base Rate
Opening Base Revenue Allowance (2009/10 prices) A1 PUt 3A ALL 1,342.3 1,443.8 1,571.4 1,554.9 1,587.6 1,585.2 From Licence
Price Control Financial Model Iteration Adjustment A2 MODt 3A ALL -5.5 -100.0 -190.0 -200.0 -200.0 Determined by Ofgem/Licensee forecast
RPI True Up A3 TRUt 3A ALL -0.5 0.0 0.0 0.0 0.0 Licensee Actual/Forecast
Prior Calendar Year RPI Forecast GRPIFc-1 3A ALL 3.1% 3.1% 2.4% 3.2% 3.3% 3.4% HM Treasury Forecast then 2.8%
Current Calendar Year RPI Forecast GRPIFc 3A ALL 2.7% 3.1% 3.2% 3.3% 3.4% 2.8% HM Treasury Forecast then 2.8%
Next Calendar Year RPI forecast GRPIFc+1 3A ALL 2.5% 3.0% 3.3% 3.4% 2.8% 2.8% HM Treasury Forecast then 2.8%
RPI Forecast A4 RPIFt 3A ALL 1.1630 1.2051 1.2763 1.3083 1.3616 1.3887 Using HM Treasury Forecast
Base Revenue [A=(A1+A2+A3)*A4] A BRt 3A ALL 1561.1 1732.7 1877.9 1785.8 1889.4 1923.6
Pass-Through Business Rates B1 RBt 3B ALL 1.4 1.4 1.5 1.5 Licensee Actual/Forecast
Temporary Physical Disconnection B2 TPDt 3B ALL 0.1 0.0 0.0 0.0 0.0 Licensee Actual/Forecast
Licence Fee B3 LFt 3B NG 2.3 2.3 2.3 2.3 Licensee Actual/Forecast
Inter TSO Compensation B4 ITCt 3B NG 0.0 0.0 0.0 0.0 Licensee Actual/Forecast
Termination of Bilateral Connection Agreements B5 TERMt 3B NG 2.6 0.0 0.0 0.0 0.0 0.0 Does not affect TNUoS
SP Transmission Pass-Through B6 TSPt 3B NG 271.3 312.2 310.5 357.6 404.3 421.2 13/14 & 14/15 Charge setting. Later from TSP Tab
SHE Transmission Pass-Through B7 TSHt 3B NG 172.5 214.0 339.5 344.0 331.9 338.5 13/14 & 14/15 Charge setting. Later from TSH Tab
Offshore Transmission Pass-Through B8 TOFTOt 3B NG 105.4 218.4 269.1 284.8 349.7 522.2 13/14 & 14/15 Charge setting. Later from OFTO Tab
Embedded Offshore Pass-Through B9 OFETt 3B NG 0.6 0.4 0.7 0.7 0.7 0.7 Licensee Actual/Forecast
Pass-Through Items [B=B1+B2+B3+B4+B5+B6+B7+B8+B9] B PTt 3B ALL 552.3 745.1 923.4 990.9 1090.5 1286.4
Reliability Incentive Adjustment C1 RIt 3C ALL 12.4 2.4 2.5 2.6 2.6 Licensee Actual/Forecast/Budget
Stakeholder Satisfaction Adjustment C2 SSOt 3D ALL 9.3 9.1 10.3 10.0 Licensee Actual/Forecast/Budget
Sulphur Hexafluoride (SF6) Gas Emissions Adjustment C3 SFIt 3E ALL 2.9 3.1 3.2 3.4 Licensee Actual/Forecast/Budget
Awarded Environmental Discretionary Rewards C4 EDRt 3F ALL 0.0 0.0 0.0 0.0 Only includes EDR awarded to licensee to date
Outputs Incentive Revenue [C=C1+C2+C3+C4] C OIPt 3A ALL 12.4 0.0 14.6 14.6 16.1 16.0
Network Innovation Allowance D NIAt 3H ALL 6.1 10.9 11.8 11.3 11.9 12.1 Licensee Actual/Forecast/Budget
Network Innovation Competition E NICFt 3I NG 0.0 17.8 48.4 49.7 51.7 52.7 Sum of NICF awards determined by Ofgem/Forecast by National Grid
Future Environmental Discretionary Rewards F EDRt 3F ALL 3.0 2.0 2.0 2.0 Sum of future EDR awards forecast by National Grid
Transmission Investment for Renewable Generation G TIRGt 3J ALL 16.0 16.0 -0.1 -0.1 -0.0 -0.0 Licensee Actual/Forecast
Scottish Site Specific Adjustment H DISt 3A NG -1.6 2.0 0.0 0.0 0.0 0.0 Licensee Actual/Forecast
Scottish Terminations Adjustment I TSt 3A NG -0.4 -0.3 0.0 0.0 0.0 0.0 Licensee Actual/Forecast
Correction Factor K -Kt 3A ALL -2.7 42.1 0.0 0.0 0.0 Calculated by Licensee
Maximum Revenue [M= A+B+C+D+E+F+G+H+I+K] M TOt ALL 2143.3 2524.2 2921.3 2854.1 3061.5 3292.8
Termination Charges B5 NG 2.6 0.0 0.0 0.0 0.0 0.0
Pre-vesting connection charges P ALL 43.3 47.0 48.3 48.3 48.3 48.3 Licensee Actual/Forecast
TNUoS Collected Revenue [T=M-B5-P] T NG 2097.4 2477.3 2873.0 2805.8 3013.2 3244.6
Final Collected Revenue U TNRt ALL 2089.6 Licensee Actual/Forecast
Over / (Under) Recovery [V=U-M] V ALL -53.7
Forecast percentage change to Maximum Revenue M NG 17.8% -2.3% 7.3% 7.6%
Forecast percentage change to TNUoS Collected Revenue T NG 18.1% -2.3% 7.4% 7.7%
National Grid Revenue Forecast 21/01/2015
Notes
To be
updated
in 2015/16
Final
Tariffs
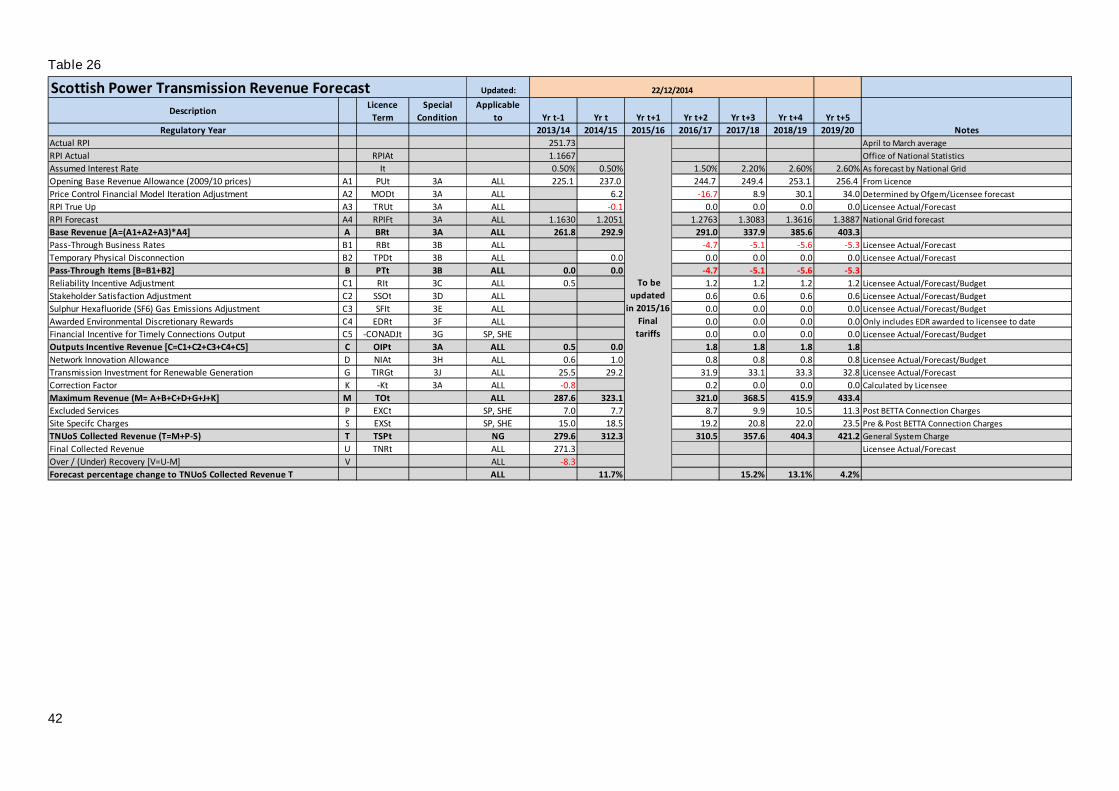
42
Table 26
Updated:
DescriptionLicence
Term
Special
Condition
Applicable
to Yr t-1 Yr t Yr t+1 Yr t+2 Yr t+3 Yr t+4 Yr t+5
Regulatory Year 2013/14 2014/15 2015/16 2016/17 2017/18 2018/19 2019/20
Actual RPI 251.73 April to March average
RPI Actual RPIAt 1.1667 Office of National Statistics
Assumed Interest Rate It 0.50% 0.50% 1.50% 2.20% 2.60% 2.60% As forecast by National Grid
Opening Base Revenue Allowance (2009/10 prices) A1 PUt 3A ALL 225.1 237.0 244.7 249.4 253.1 256.4 From Licence
Price Control Financial Model Iteration Adjustment A2 MODt 3A ALL 6.2 -16.7 8.9 30.1 34.0 Determined by Ofgem/Licensee forecast
RPI True Up A3 TRUt 3A ALL -0.1 0.0 0.0 0.0 0.0 Licensee Actual/Forecast
RPI Forecast A4 RPIFt 3A ALL 1.1630 1.2051 1.2763 1.3083 1.3616 1.3887 National Grid forecast
Base Revenue [A=(A1+A2+A3)*A4] A BRt 3A ALL 261.8 292.9 291.0 337.9 385.6 403.3
Pass-Through Business Rates B1 RBt 3B ALL -4.7 -5.1 -5.6 -5.3 Licensee Actual/Forecast
Temporary Physical Disconnection B2 TPDt 3B ALL 0.0 0.0 0.0 0.0 0.0 Licensee Actual/Forecast
Pass-Through Items [B=B1+B2] B PTt 3B ALL 0.0 0.0 -4.7 -5.1 -5.6 -5.3
Reliability Incentive Adjustment C1 RIt 3C ALL 0.5 1.2 1.2 1.2 1.2 Licensee Actual/Forecast/Budget
Stakeholder Satisfaction Adjustment C2 SSOt 3D ALL 0.6 0.6 0.6 0.6 Licensee Actual/Forecast/Budget
Sulphur Hexafluoride (SF6) Gas Emissions Adjustment C3 SFIt 3E ALL 0.0 0.0 0.0 0.0 Licensee Actual/Forecast/Budget
Awarded Environmental Discretionary Rewards C4 EDRt 3F ALL 0.0 0.0 0.0 0.0 Only includes EDR awarded to licensee to date
Financial Incentive for Timely Connections Output C5 -CONADJt 3G SP, SHE 0.0 0.0 0.0 0.0 Licensee Actual/Forecast/Budget
Outputs Incentive Revenue [C=C1+C2+C3+C4+C5] C OIPt 3A ALL 0.5 0.0 1.8 1.8 1.8 1.8
Network Innovation Allowance D NIAt 3H ALL 0.6 1.0 0.8 0.8 0.8 0.8 Licensee Actual/Forecast/Budget
Transmission Investment for Renewable Generation G TIRGt 3J ALL 25.5 29.2 31.9 33.1 33.3 32.8 Licensee Actual/Forecast
Correction Factor K -Kt 3A ALL -0.8 0.2 0.0 0.0 0.0 Calculated by Licensee
Maximum Revenue (M= A+B+C+D+G+J+K] M TOt ALL 287.6 323.1 321.0 368.5 415.9 433.4
Excluded Services P EXCt SP, SHE 7.0 7.7 8.7 9.9 10.5 11.3 Post BETTA Connection Charges
Site Specifc Charges S EXSt SP, SHE 15.0 18.5 19.2 20.8 22.0 23.5 Pre & Post BETTA Connection Charges
TNUoS Collected Revenue (T=M+P-S) T TSPt NG 279.6 312.3 310.5 357.6 404.3 421.2 General System Charge
Final Collected Revenue U TNRt ALL 271.3 Licensee Actual/Forecast
Over / (Under) Recovery [V=U-M] V ALL -8.3
Forecast percentage change to TNUoS Collected Revenue T ALL 11.7% 15.2% 13.1% 4.2%
Scottish Power Transmission Revenue Forecast 22/12/2014
Notes
To be
updated
in 2015/16
Final
tariffs
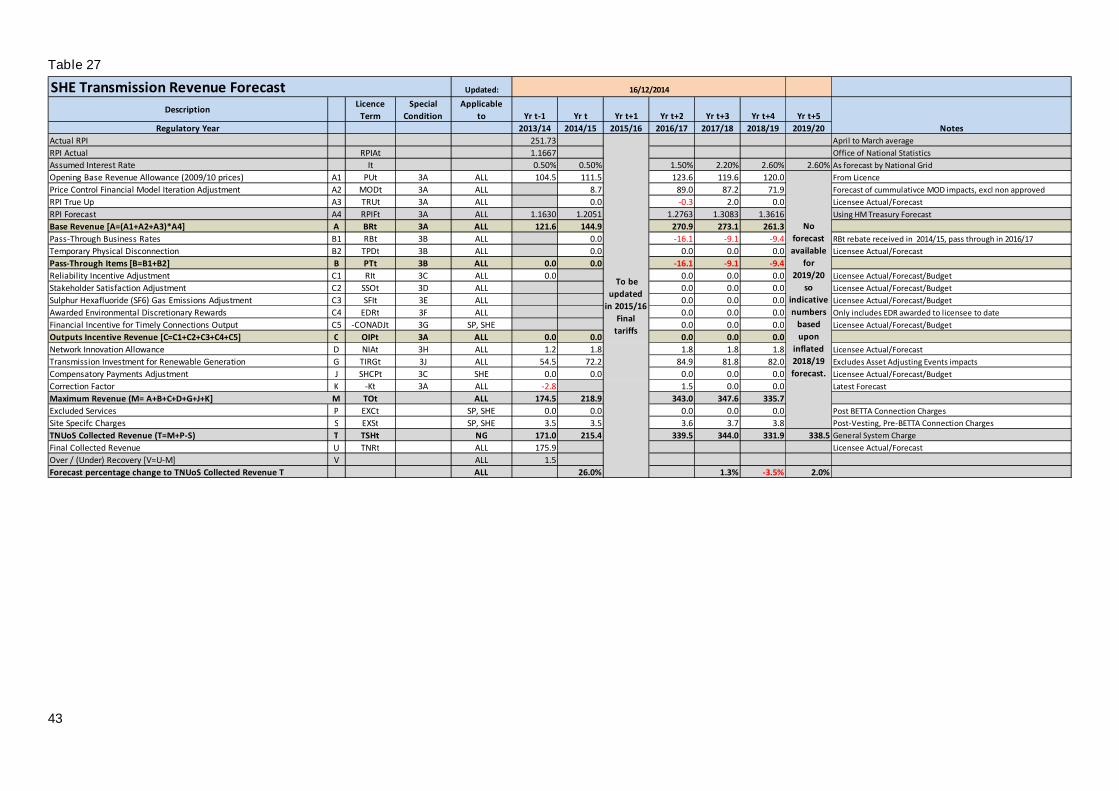
43
Table 27
Updated:
DescriptionLicence
Term
Special
Condition
Applicable
to Yr t-1 Yr t Yr t+1 Yr t+2 Yr t+3 Yr t+4 Yr t+5
Regulatory Year 2013/14 2014/15 2015/16 2016/17 2017/18 2018/19 2019/20
Actual RPI 251.73 April to March average
RPI Actual RPIAt 1.1667 Office of National Statistics
Assumed Interest Rate It 0.50% 0.50% 1.50% 2.20% 2.60% 2.60% As forecast by National Grid
Opening Base Revenue Allowance (2009/10 prices) A1 PUt 3A ALL 104.5 111.5 123.6 119.6 120.0 From Licence
Price Control Financial Model Iteration Adjustment A2 MODt 3A ALL 8.7 89.0 87.2 71.9 Forecast of cummulativce MOD impacts, excl non approved
RPI True Up A3 TRUt 3A ALL 0.0 -0.3 2.0 0.0 Licensee Actual/Forecast
RPI Forecast A4 RPIFt 3A ALL 1.1630 1.2051 1.2763 1.3083 1.3616 Using HM Treasury Forecast
Base Revenue [A=(A1+A2+A3)*A4] A BRt 3A ALL 121.6 144.9 270.9 273.1 261.3
Pass-Through Business Rates B1 RBt 3B ALL 0.0 -16.1 -9.1 -9.4 RBt rebate received in 2014/15, pass through in 2016/17
Temporary Physical Disconnection B2 TPDt 3B ALL 0.0 0.0 0.0 0.0 Licensee Actual/Forecast
Pass-Through Items [B=B1+B2] B PTt 3B ALL 0.0 0.0 -16.1 -9.1 -9.4
Reliability Incentive Adjustment C1 RIt 3C ALL 0.0 0.0 0.0 0.0 Licensee Actual/Forecast/Budget
Stakeholder Satisfaction Adjustment C2 SSOt 3D ALL 0.0 0.0 0.0 Licensee Actual/Forecast/Budget
Sulphur Hexafluoride (SF6) Gas Emissions Adjustment C3 SFIt 3E ALL 0.0 0.0 0.0 Licensee Actual/Forecast/Budget
Awarded Environmental Discretionary Rewards C4 EDRt 3F ALL 0.0 0.0 0.0 Only includes EDR awarded to licensee to date
Financial Incentive for Timely Connections Output C5 -CONADJt 3G SP, SHE 0.0 0.0 0.0 Licensee Actual/Forecast/Budget
Outputs Incentive Revenue [C=C1+C2+C3+C4+C5] C OIPt 3A ALL 0.0 0.0 0.0 0.0 0.0
Network Innovation Allowance D NIAt 3H ALL 1.2 1.8 1.8 1.8 1.8 Licensee Actual/Forecast
Transmission Investment for Renewable Generation G TIRGt 3J ALL 54.5 72.2 84.9 81.8 82.0 Excludes Asset Adjusting Events impacts
Compensatory Payments Adjustment J SHCPt 3C SHE 0.0 0.0 0.0 0.0 0.0 Licensee Actual/Forecast/Budget
Correction Factor K -Kt 3A ALL -2.8 1.5 0.0 0.0 Latest Forecast
Maximum Revenue (M= A+B+C+D+G+J+K] M TOt ALL 174.5 218.9 343.0 347.6 335.7
Excluded Services P EXCt SP, SHE 0.0 0.0 0.0 0.0 0.0 Post BETTA Connection Charges
Site Specifc Charges S EXSt SP, SHE 3.5 3.5 3.6 3.7 3.8 Post-Vesting, Pre-BETTA Connection Charges
TNUoS Collected Revenue (T=M+P-S) T TSHt NG 171.0 215.4 339.5 344.0 331.9 338.5 General System Charge
Final Collected Revenue U TNRt ALL 175.9 Licensee Actual/Forecast
Over / (Under) Recovery [V=U-M] V ALL 1.5
Forecast percentage change to TNUoS Collected Revenue T ALL 26.0% 1.3% -3.5% 2.0%
SHE Transmission Revenue Forecast 16/12/2014
Notes
No
forecast
available
for
2019/20
so
indicative
numbers
based
upon
inflated
2018/19
forecast.
To be
updated
in 2015/16
Final
tariffs
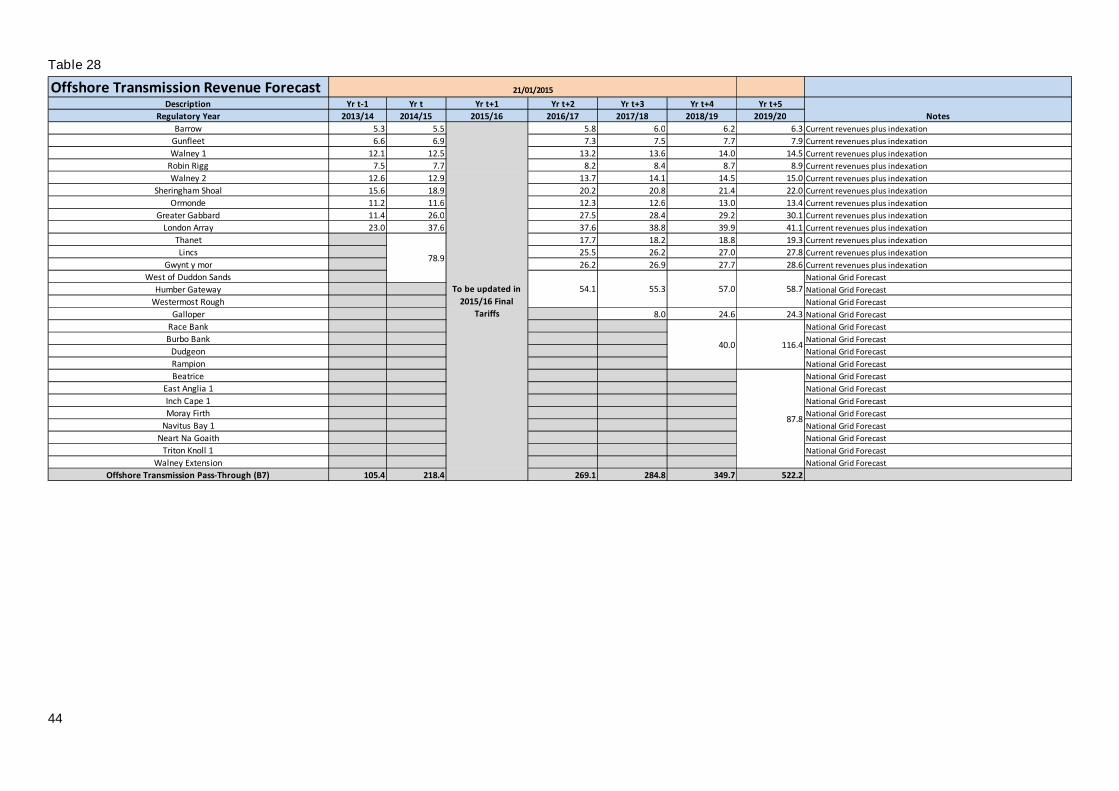
44
Table 28
Offshore Transmission Revenue ForecastDescription Yr t-1 Yr t Yr t+1 Yr t+2 Yr t+3 Yr t+4 Yr t+5
Regulatory Year 2013/14 2014/15 2015/16 2016/17 2017/18 2018/19 2019/20
Barrow 5.3 5.5 5.8 6.0 6.2 6.3 Current revenues plus indexation
Gunfleet 6.6 6.9 7.3 7.5 7.7 7.9 Current revenues plus indexation
Walney 1 12.1 12.5 13.2 13.6 14.0 14.5 Current revenues plus indexation
Robin Rigg 7.5 7.7 8.2 8.4 8.7 8.9 Current revenues plus indexation
Walney 2 12.6 12.9 13.7 14.1 14.5 15.0 Current revenues plus indexation
Sheringham Shoal 15.6 18.9 20.2 20.8 21.4 22.0 Current revenues plus indexation
Ormonde 11.2 11.6 12.3 12.6 13.0 13.4 Current revenues plus indexation
Greater Gabbard 11.4 26.0 27.5 28.4 29.2 30.1 Current revenues plus indexation
London Array 23.0 37.6 37.6 38.8 39.9 41.1 Current revenues plus indexation
Thanet 17.7 18.2 18.8 19.3 Current revenues plus indexation
Lincs 25.5 26.2 27.0 27.8 Current revenues plus indexation
Gwynt y mor 26.2 26.9 27.7 28.6 Current revenues plus indexation
West of Duddon Sands National Grid Forecast
Humber Gateway National Grid Forecast
Westermost Rough National Grid Forecast
Galloper 8.0 24.6 24.3 National Grid Forecast
Race Bank National Grid Forecast
Burbo Bank National Grid Forecast
Dudgeon National Grid Forecast
Rampion National Grid Forecast
Beatrice National Grid Forecast
East Anglia 1 National Grid Forecast
Inch Cape 1 National Grid Forecast
Moray Firth National Grid Forecast
Navitus Bay 1 National Grid Forecast
Neart Na Goaith National Grid Forecast
Triton Knoll 1 National Grid Forecast
Walney Extension National Grid Forecast
Offshore Transmission Pass-Through (B7) 105.4 218.4 269.1 284.8 349.7 522.2
40.0 116.4
87.8
21/01/2015
Notes
78.9
54.1 55.3 57.0 58.7To be updated in
2015/16 Final
Tariffs
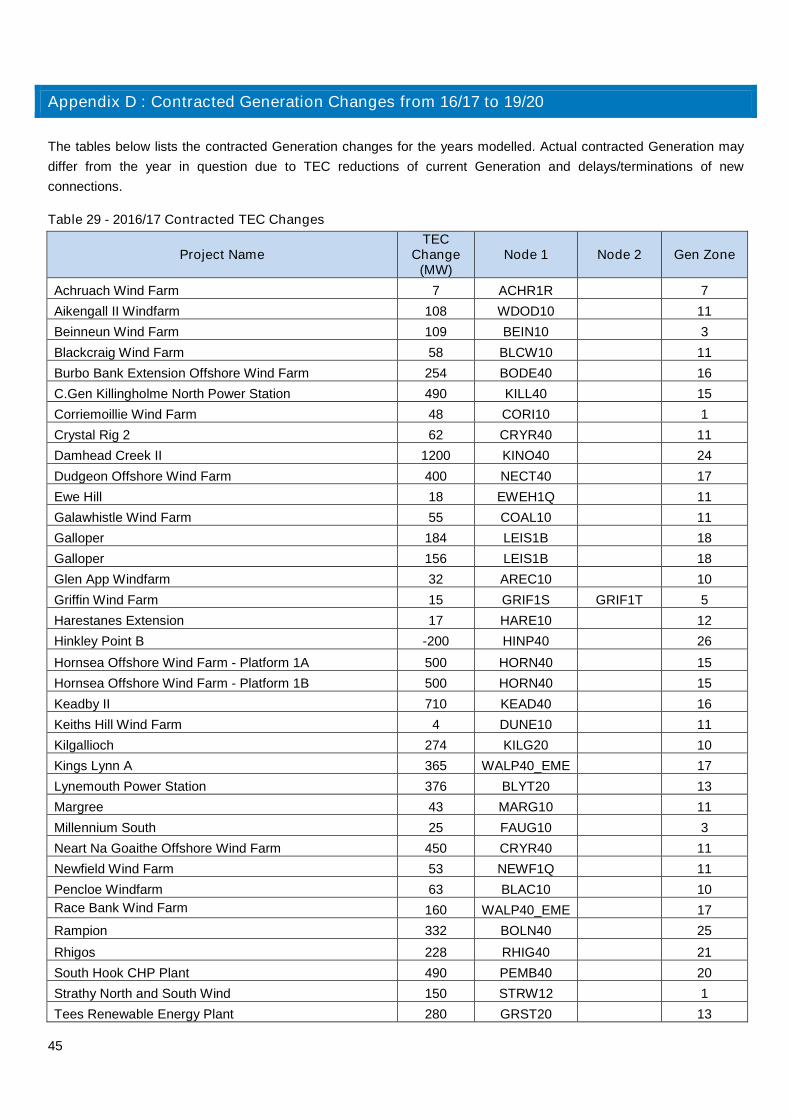
45
Appendix D : Contracted Generation Changes from 16/17 to 19/20
The tables below lists the contracted Generation changes for the years modelled. Actual contracted Generation may
differ from the year in question due to TEC reductions of current Generation and delays/terminations of new
connections.
Table 29 - 2016/17 Contracted TEC Changes
Project NameTEC
Change(MW)
Node 1 Node 2 Gen Zone
Achruach Wind Farm 7 ACHR1R 7
Aikengall II Windfarm 108 WDOD10 11
Beinneun Wind Farm 109 BEIN10 3
Blackcraig Wind Farm 58 BLCW10 11
Burbo Bank Extension Offshore Wind Farm 254 BODE40 16
C.Gen Killingholme North Power Station 490 KILL40 15
Corriemoillie Wind Farm 48 CORI10 1
Crystal Rig 2 62 CRYR40 11
Damhead Creek II 1200 KINO40 24
Dudgeon Offshore Wind Farm 400 NECT40 17
Ewe Hill 18 EWEH1Q 11
Galawhistle Wind Farm 55 COAL10 11
Galloper 184 LEIS1B 18
Galloper 156 LEIS1B 18
Glen App Windfarm 32 AREC10 10
Griffin Wind Farm 15 GRIF1S GRIF1T 5
Harestanes Extension 17 HARE10 12
Hinkley Point B -200 HINP40 26
Hornsea Offshore Wind Farm - Platform 1A 500 HORN40 15
Hornsea Offshore Wind Farm - Platform 1B 500 HORN40 15
Keadby II 710 KEAD40 16
Keiths Hill Wind Farm 4 DUNE10 11
Kilgallioch 274 KILG20 10
Kings Lynn A 365 WALP40_EME 17
Lynemouth Power Station 376 BLYT20 13
Margree 43 MARG10 11
Millennium South 25 FAUG10 3
Neart Na Goaithe Offshore Wind Farm 450 CRYR40 11
Newfield Wind Farm 53 NEWF1Q 11
Pencloe Windfarm 63 BLAC10 10
Race Bank Wind Farm 160 WALP40_EME 17
Rampion 332 BOLN40 25
Rhigos 228 RHIG40 21
South Hook CHP Plant 490 PEMB40 20
Strathy North and South Wind 150 STRW12 1
Tees Renewable Energy Plant 280 GRST20 13

46
Project NameTEC
Change(MW)
Node 1 Node 2 Gen Zone
Ulzieside 30 GLGL1Q GLGL1R 10
Walney Extension Power Station A Offshore Wind Farm 330 HEYS40 14
Walney Extension Power Station B Offshore Wind Farm 330 HEYS40 14
Whiteside Hill Wind Farm 27 GLGL1Q GLGL1R 10
Wilton 42 GRST20 13
France Interconnector 1000 SELL40 24
Total 9774
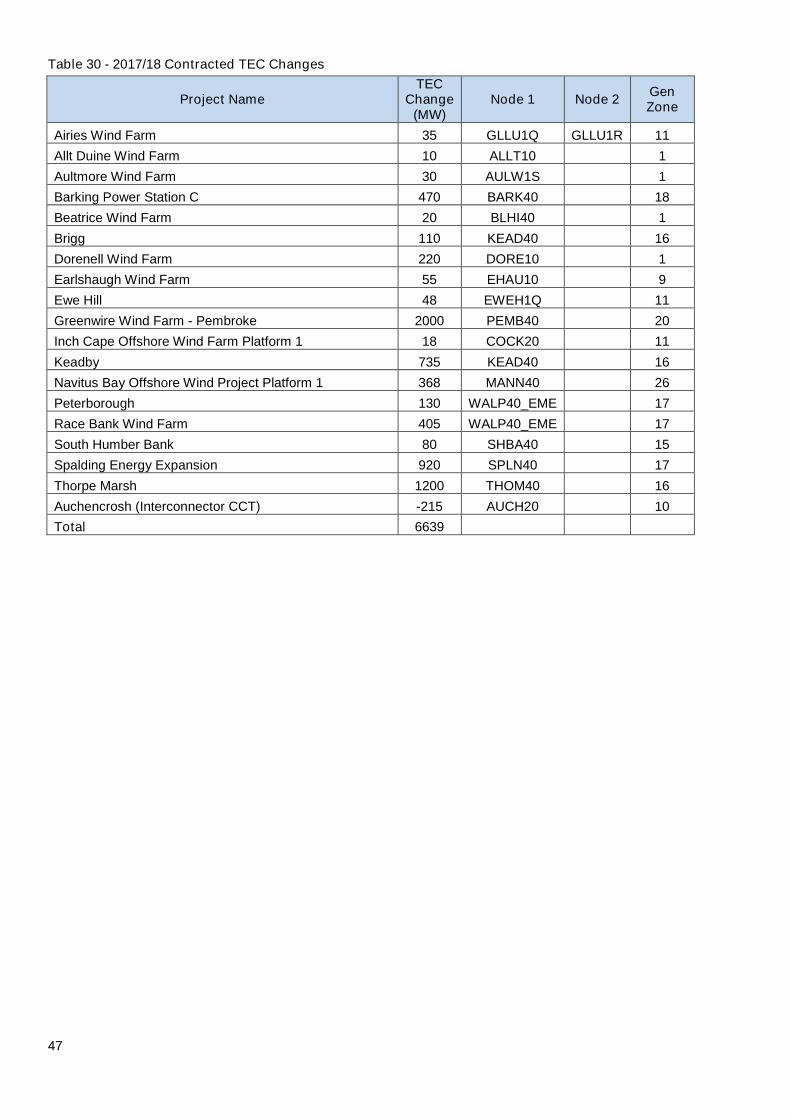
47
Table 30 - 2017/18 Contracted TEC Changes
Project NameTEC
Change(MW)
Node 1 Node 2GenZone
Airies Wind Farm 35 GLLU1Q GLLU1R 11
Allt Duine Wind Farm 10 ALLT10 1
Aultmore Wind Farm 30 AULW1S 1
Barking Power Station C 470 BARK40 18
Beatrice Wind Farm 20 BLHI40 1
Brigg 110 KEAD40 16
Dorenell Wind Farm 220 DORE10 1
Earlshaugh Wind Farm 55 EHAU10 9
Ewe Hill 48 EWEH1Q 11
Greenwire Wind Farm - Pembroke 2000 PEMB40 20
Inch Cape Offshore Wind Farm Platform 1 18 COCK20 11
Keadby 735 KEAD40 16
Navitus Bay Offshore Wind Project Platform 1 368 MANN40 26
Peterborough 130 WALP40_EME 17
Race Bank Wind Farm 405 WALP40_EME 17
South Humber Bank 80 SHBA40 15
Spalding Energy Expansion 920 SPLN40 17
Thorpe Marsh 1200 THOM40 16
Auchencrosh (Interconnector CCT) -215 AUCH20 10
Total 6639
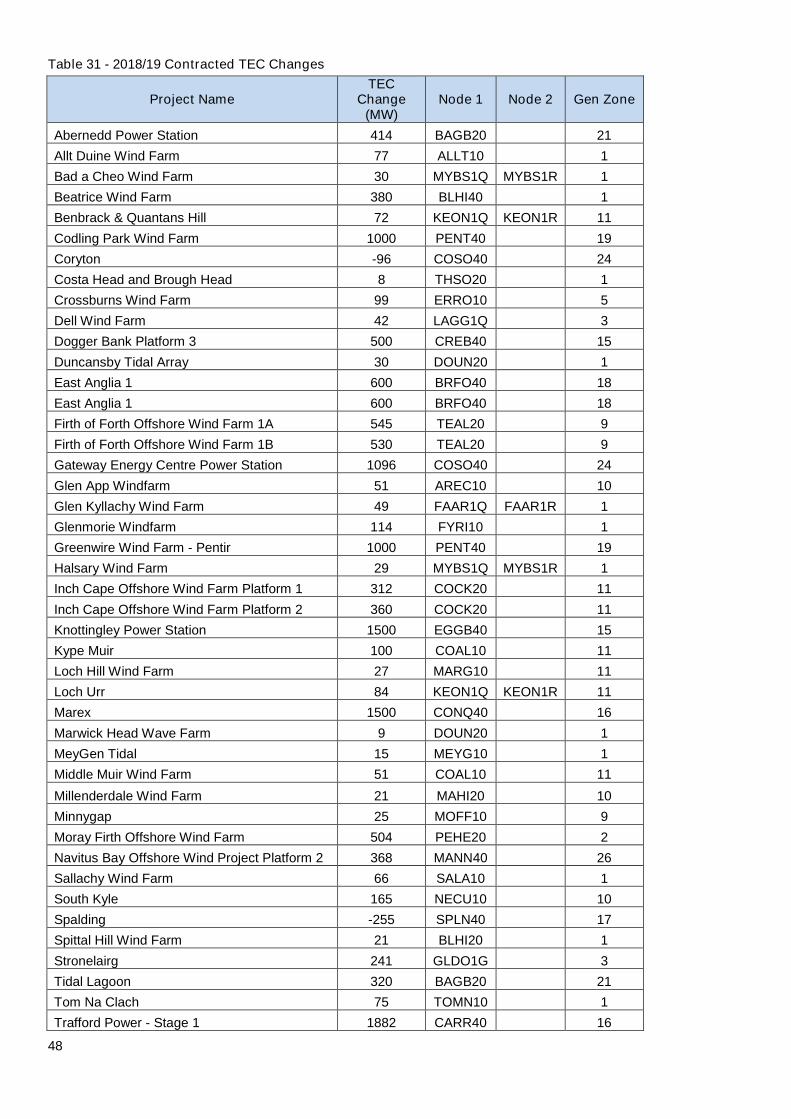
48
Table 31 - 2018/19 Contracted TEC Changes
Project NameTEC
Change(MW)
Node 1 Node 2 Gen Zone
Abernedd Power Station 414 BAGB20 21
Allt Duine Wind Farm 77 ALLT10 1
Bad a Cheo Wind Farm 30 MYBS1Q MYBS1R 1
Beatrice Wind Farm 380 BLHI40 1
Benbrack & Quantans Hill 72 KEON1Q KEON1R 11
Codling Park Wind Farm 1000 PENT40 19
Coryton -96 COSO40 24
Costa Head and Brough Head 8 THSO20 1
Crossburns Wind Farm 99 ERRO10 5
Dell Wind Farm 42 LAGG1Q 3
Dogger Bank Platform 3 500 CREB40 15
Duncansby Tidal Array 30 DOUN20 1
East Anglia 1 600 BRFO40 18
East Anglia 1 600 BRFO40 18
Firth of Forth Offshore Wind Farm 1A 545 TEAL20 9
Firth of Forth Offshore Wind Farm 1B 530 TEAL20 9
Gateway Energy Centre Power Station 1096 COSO40 24
Glen App Windfarm 51 AREC10 10
Glen Kyllachy Wind Farm 49 FAAR1Q FAAR1R 1
Glenmorie Windfarm 114 FYRI10 1
Greenwire Wind Farm - Pentir 1000 PENT40 19
Halsary Wind Farm 29 MYBS1Q MYBS1R 1
Inch Cape Offshore Wind Farm Platform 1 312 COCK20 11
Inch Cape Offshore Wind Farm Platform 2 360 COCK20 11
Knottingley Power Station 1500 EGGB40 15
Kype Muir 100 COAL10 11
Loch Hill Wind Farm 27 MARG10 11
Loch Urr 84 KEON1Q KEON1R 11
Marex 1500 CONQ40 16
Marwick Head Wave Farm 9 DOUN20 1
MeyGen Tidal 15 MEYG10 1
Middle Muir Wind Farm 51 COAL10 11
Millenderdale Wind Farm 21 MAHI20 10
Minnygap 25 MOFF10 9
Moray Firth Offshore Wind Farm 504 PEHE20 2
Navitus Bay Offshore Wind Project Platform 2 368 MANN40 26
Sallachy Wind Farm 66 SALA10 1
South Kyle 165 NECU10 10
Spalding -255 SPLN40 17
Spittal Hill Wind Farm 21 BLHI20 1
Stronelairg 241 GLDO1G 3
Tidal Lagoon 320 BAGB20 21
Tom Na Clach 75 TOMN10 1
Trafford Power - Stage 1 1882 CARR40 16

49
Project NameTEC
Change(MW)
Node 1 Node 2 Gen Zone
Tralorg Wind Farm 20 MAHI20 10
Triton Knoll Offshore Wind Farm 1 200 BICF4A BICF4B 16
Viking Wind Farm 412 BLHI20 1
Windy Standard III Wind Farm 44 DUNH1Q 10
Belgium Interconnector 1000 CANT40 24
Total 16236
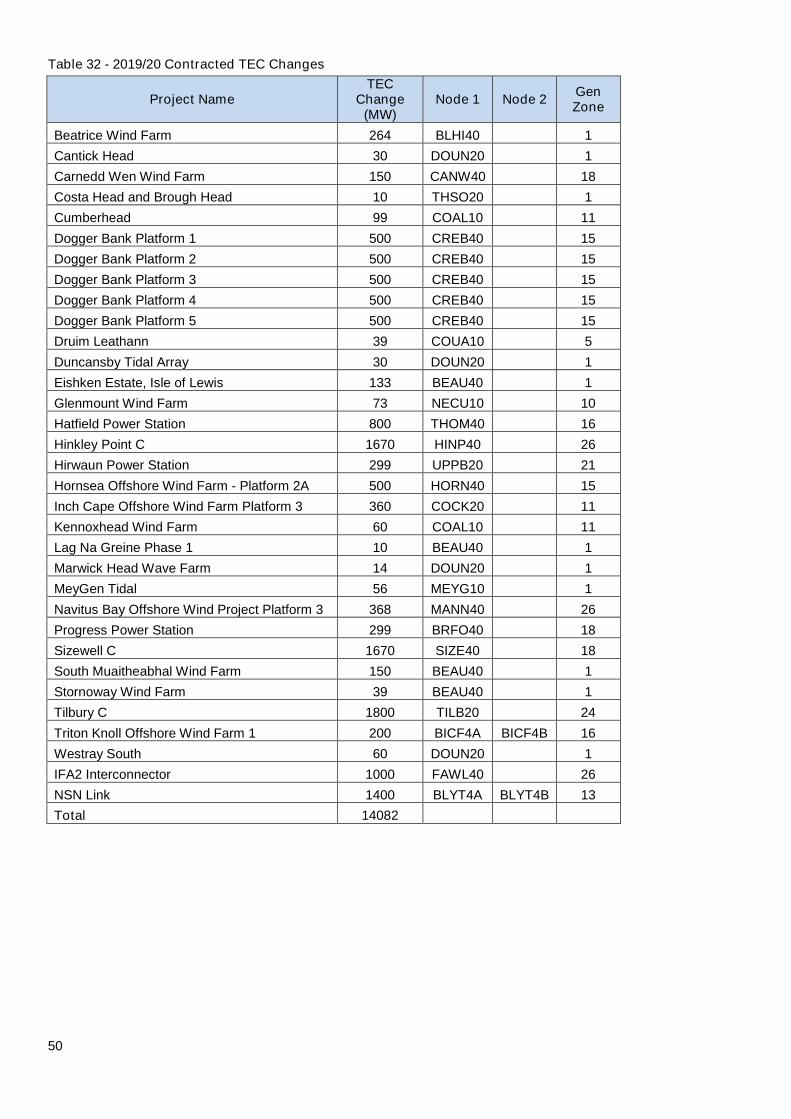
50
Table 32 - 2019/20 Contracted TEC Changes
Project NameTEC
Change(MW)
Node 1 Node 2GenZone
Beatrice Wind Farm 264 BLHI40 1
Cantick Head 30 DOUN20 1
Carnedd Wen Wind Farm 150 CANW40 18
Costa Head and Brough Head 10 THSO20 1
Cumberhead 99 COAL10 11
Dogger Bank Platform 1 500 CREB40 15
Dogger Bank Platform 2 500 CREB40 15
Dogger Bank Platform 3 500 CREB40 15
Dogger Bank Platform 4 500 CREB40 15
Dogger Bank Platform 5 500 CREB40 15
Druim Leathann 39 COUA10 5
Duncansby Tidal Array 30 DOUN20 1
Eishken Estate, Isle of Lewis 133 BEAU40 1
Glenmount Wind Farm 73 NECU10 10
Hatfield Power Station 800 THOM40 16
Hinkley Point C 1670 HINP40 26
Hirwaun Power Station 299 UPPB20 21
Hornsea Offshore Wind Farm - Platform 2A 500 HORN40 15
Inch Cape Offshore Wind Farm Platform 3 360 COCK20 11
Kennoxhead Wind Farm 60 COAL10 11
Lag Na Greine Phase 1 10 BEAU40 1
Marwick Head Wave Farm 14 DOUN20 1
MeyGen Tidal 56 MEYG10 1
Navitus Bay Offshore Wind Project Platform 3 368 MANN40 26
Progress Power Station 299 BRFO40 18
Sizewell C 1670 SIZE40 18
South Muaitheabhal Wind Farm 150 BEAU40 1
Stornoway Wind Farm 39 BEAU40 1
Tilbury C 1800 TILB20 24
Triton Knoll Offshore Wind Farm 1 200 BICF4A BICF4B 16
Westray South 60 DOUN20 1
IFA2 Interconnector 1000 FAWL40 26
NSN Link 1400 BLYT4A BLYT4B 13
Total 14082
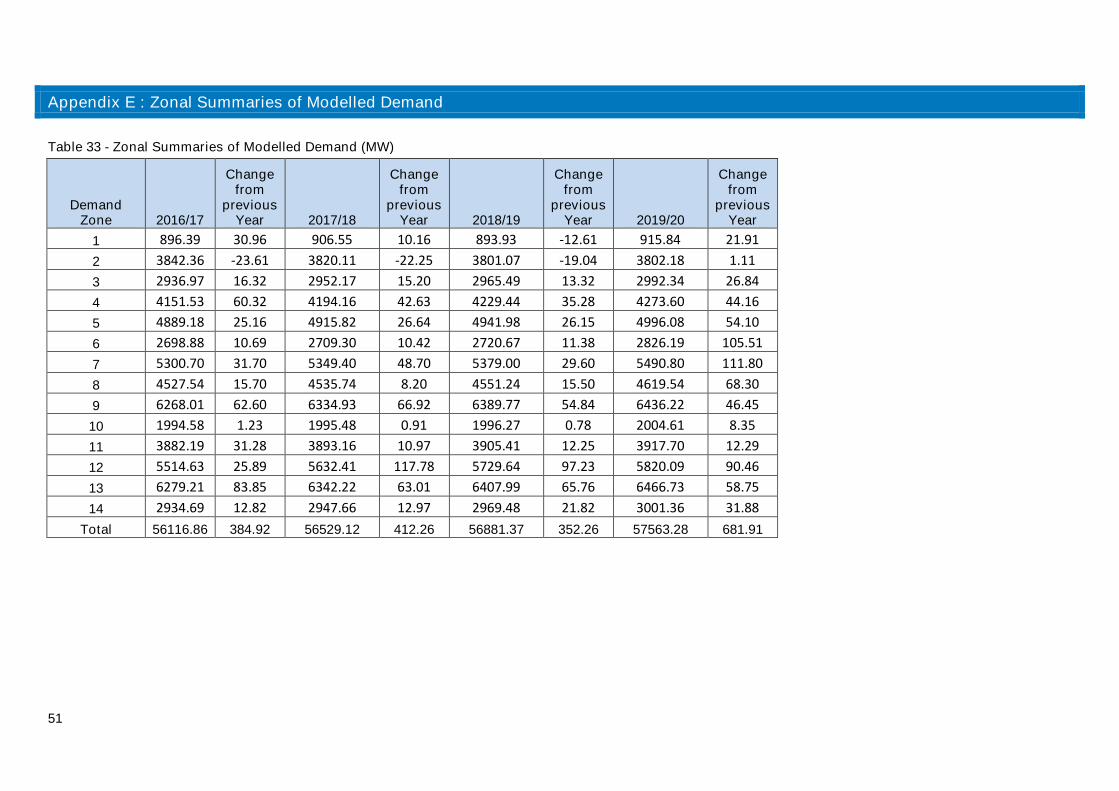
51
Appendix E : Zonal Summaries of Modelled Demand
Table 33 - Zonal Summaries of Modelled Demand (MW)
DemandZone 2016/17
Changefrom
previousYear 2017/18
Changefrom
previousYear 2018/19
Changefrom
previousYear 2019/20
Changefrom
previousYear
1 896.39 30.96 906.55 10.16 893.93 -12.61 915.84 21.91
2 3842.36 -23.61 3820.11 -22.25 3801.07 -19.04 3802.18 1.11
3 2936.97 16.32 2952.17 15.20 2965.49 13.32 2992.34 26.84
4 4151.53 60.32 4194.16 42.63 4229.44 35.28 4273.60 44.16
5 4889.18 25.16 4915.82 26.64 4941.98 26.15 4996.08 54.10
6 2698.88 10.69 2709.30 10.42 2720.67 11.38 2826.19 105.51
7 5300.70 31.70 5349.40 48.70 5379.00 29.60 5490.80 111.80
8 4527.54 15.70 4535.74 8.20 4551.24 15.50 4619.54 68.30
9 6268.01 62.60 6334.93 66.92 6389.77 54.84 6436.22 46.45
10 1994.58 1.23 1995.48 0.91 1996.27 0.78 2004.61 8.35
11 3882.19 31.28 3893.16 10.97 3905.41 12.25 3917.70 12.29
12 5514.63 25.89 5632.41 117.78 5729.64 97.23 5820.09 90.46
13 6279.21 83.85 6342.22 63.01 6407.99 65.76 6466.73 58.75
14 2934.69 12.82 2947.66 12.97 2969.48 21.82 3001.36 31.88
Total 56116.86 384.92 56529.12 412.26 56881.37 352.26 57563.28 681.91
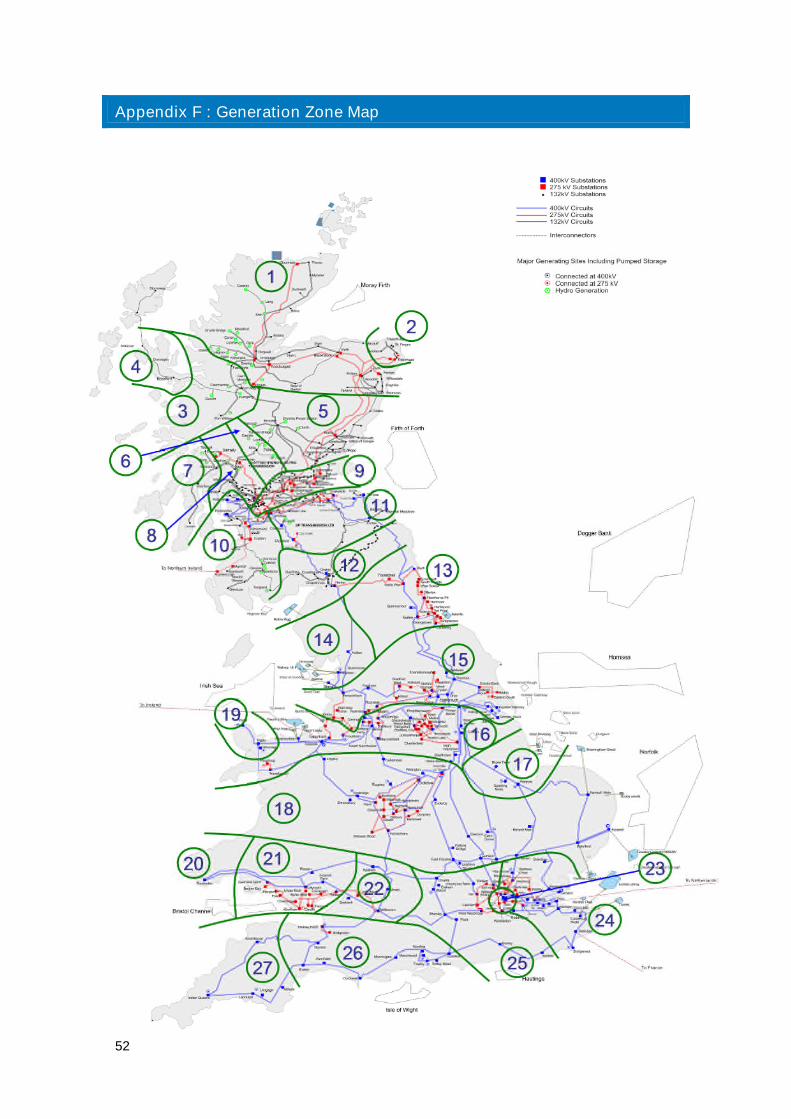
52
Appendix F : Generation Zone Map
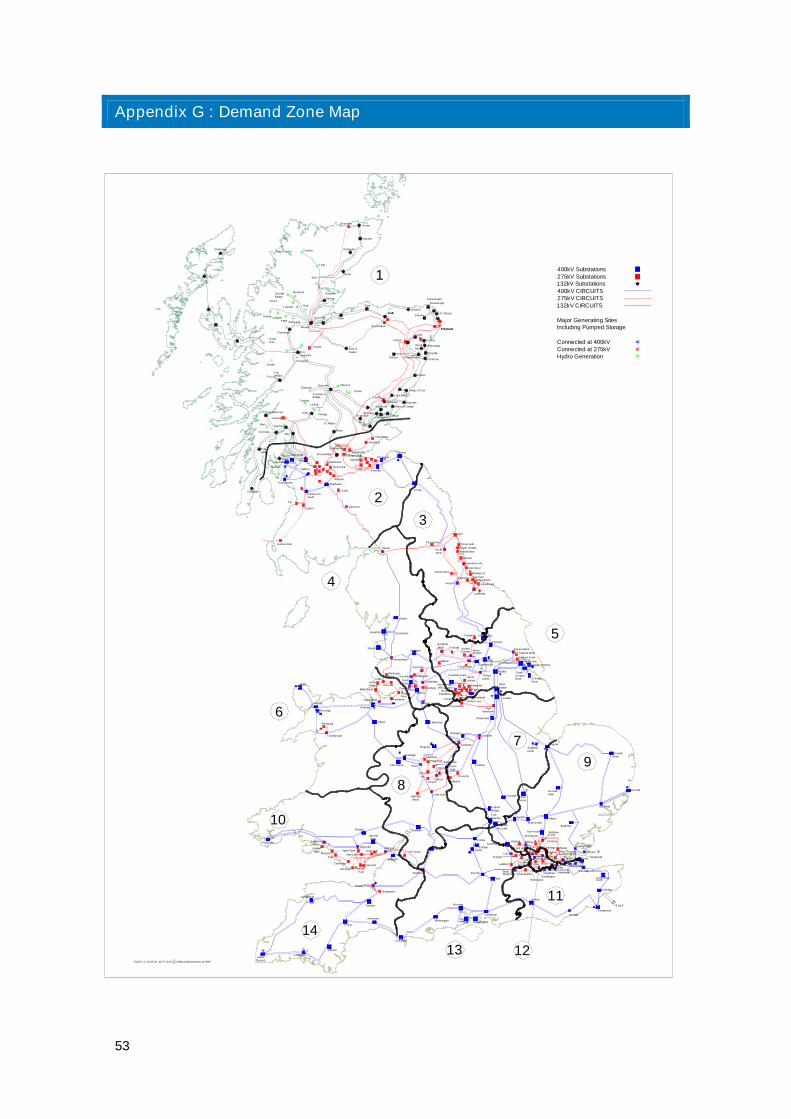
53
Appendix G : Demand Zone Map
BaglanBay
LeightonBuzzard
PatfordBridge
Northfleet EastSinglewell
Fourstones
Humber Refinery
Spald ing
North
West Thurrock
ISSUE A 04-03-05 41/177145 C Collins Bartholomew Ltd 1999
Dingwall
Dounreay
Newarthill
Easterhouse
Kincard ine
Wishaw
Strathaven
KilmarnockSouth
Ayr
Coylton
Saltend South
Hackney
Coryton
Ratclif feWillington
Drakelow
Shre wsbury
Cross
Weybridge
Cross
Wood
North
West
FrystonGrange
Ferry
Winco Bank
Norton Lees
Creyke Beck
Saltend North
GrimsbyWest
Drax
Lackenby
Greystones
GrangetownSaltholme
Norton
Spennymoor
Tod Point
Hartlepool
Hart Moor
Hawthorne Pit
O fferton
West Boldon
South Shields
Tynemouth
Ste llaWest
Harker
Eccles
B lyth
IndianQueens
Landulph
Abham
Exeter
Axminster
Chickerell
Mannington
Taunton
Alverdiscott
Hinkley Point
Bridgwater
Aberthaw
Cowbridge
Pyle
Margam
SwanseaNorth
Card iffEast
Tremorfa
A lpha Steel
UskmouthUpper Boat
Cilfynydd
Imperia lPark
Rassau
Whitson
Seabank
Iron Acton
Walham
Melksham
Minety DidcotCulham
Cowley
Bramley
Fleet
Nursling
Fawley Botley Wood
Lovedean
Bolney
Ninfield
Dungeness
Sellindge
Canterbury
E de F
Kemsley
Grain
K ingsnorth
Rayle igh Main
Northfleet
L ittlebrook
Tilbury
Warley
Barking
Redbridge
W.HamCity Rd
Tottenham
Brimsdown
Waltham
Ealing
Mill HillWillesden
Watford
St Johns
Wimbledon
New Hurst
E lstree
Rye House
N.Hyde
Sundon
Laleham
Iver
Amersham Main
Wymondley
Pelham
Braintree
BurwellMain
Bramford
EatonSocon
Grendon
East
Claydon
Enderby
Walpole
NorwichMain
Coventry
Berkswell
Rugeley
Cellarhead
IronbridgeBushbury
Penn
Willenhall
OckerHill
K itwellO ldbury
Bustleholm
NechellsHamsHall
B ishopsWood
Feckenham
Legacy
Trawsfynydd
Ffestin iog
Dinorwig
Pentir
Wylfa
Deeside
Capenhurst Frodsham
Fiddlers
Rainhill
K irkby
ListerDrive
Birkenhead
Washway
Farm
Penwortham
Carrington
SouthManchester
Daines
Macclesfield
Bredbury
Sta lybridge
Rochdale
WhitegateKearsley
E lland
Stocksbridge
West
Melton
Aldwarke
Thurcroft
BrinsworthJordanthorpe
Chesterfield
Sheffie ld CityNeepsend
Pitsmoor
Templeborough Thorpe
Marsh
Keadby
West
Burton
Cottam
HighMarnham
Staythorpe
Stanah
Heysham
Padiham
Hutton
BradfordWest K irkstall Skelton
Poppleton
Thornton
Quernmore
Monk
EggboroughFerrybrid ge
Killingholme
SouthHumberBank
Sizewell
Pembroke
Osbaldwick
Rowdown
BeddingtonChessington
West
Inveraray
Auchencrosh
400kV Substations
275kV Substations132kV Substations
400kV CIRCUITS275kV CIRCUITS
132kV CIRCUITS
Major Generating SitesIncluding Pumped Storage
Connected at 400kV
Connected at 275kVHydro Generation
11
12
Fasnakyle
Beauly
Deanie
Lairg
Shin
Nairn
K intore
B la ckhillock
E lg in
Keith
Peterhead
Persley
Fraserburgh
Invergarry
Quoich
CulligranAlgas
Kilmorack
GrudgieBridge
Mossford
OrrinLuichart
A lness
Brora
Cassley Dunbeath
Mybster
St. FergusStrichen
Macduff
Boat of
Garten
Redmoss
Willowdale
Clayhills
Dyce
Craig iebuckler
Wood
Hill
Tarland
Dalmally
K illin
Errochty
Tealing
Braco
GlenagnesDudhope
Milton of Cra ig ie
Dudhope
Lyndhurst
CharlstonBurghmuir
Arbroath
Fiddes
Bridge of Dun
Luna Head
St. Fillans
Fin larig
Lochay
Cashley
Rannoch
TummelBridge
Clunie
K ilchrennan
NantClachan
PortAnn
Carradale
1
2
3
4
5
6
7
8
9
10
13
14
Windyhill
Dunoon
Inverkip
DevolMoor
Hunterstone
Sloy
FortWilliam
Bonnybridge
Neilson
GreatG len
Conon
FortAugustus
Foyers
Inverness
Stornoway
Elvanfoot
Smeaton
Glenrothes
Westfie ld
Cume
Grangemouth
Longannet
L inmill
S ighthill
P it iochry
Torness
Cockenzie
Keith
Peterhead
Fraserburgh
Thurso
Related Documents