JANUARY 2022 FORECAST FOR FAILURE HOW A BROKEN FORECASTING SYSTEM IS AT THE ROOT OF THE GTAH’S HOUSING SHORTAGE AND HOW IT CAN BE FIXED

Welcome message from author
This document is posted to help you gain knowledge. Please leave a comment to let me know what you think about it! Share it to your friends and learn new things together.
Transcript
IV | Smart Prosperity Institute Extending the Funding Canopy | PB
JANUARY 2022
FORECAST FOR FAILUREHOW A BROKEN FORECASTING SYSTEM IS AT THE ROOT OF THE GTAH’S HOUSING SHORTAGE AND HOW IT CAN BE FIXED

ii
Acknowledgements
This report was written by Mike Moffatt and Mohsina Atiq, with funding from the Building Industry and
Land Development Association (BILD). Responsibility for the final product and its conclusions is Smart
Prosperity Institute's alone and should not be assigned to the reviewers, interviewees, or any external
party. Being interviewed for or reviewing this report does not mean endorsement, and any errors
remain the authors' responsibility.
About Smart Prosperity Institute
Smart Prosperity Institute is a national research network and policy think tank based at the University of
Ottawa. We deliver world-class research and work with public and private partners – all to advance
practical policies and market solutions for a stronger, cleaner economy.
About BILD
The Building Industry and Land Development Association (BILD) is the voice of the home building, residential and non-residential land development and professional renovation industries in the Greater Toronto Area. Our more than 1,300 member companies come from all corners of the industry. In addition to home builders, land developers, and professional RenoMark™ renovators, BILD members include financial and professional service companies, trade contractors, and manufacturers and suppliers of all types of home-oriented products. BILD is affiliated with the Ontario Home Builders' Association and the Canadian Home Builders' Association

iii
FORECAST FOR FAILURE
Executive summary
This report tells a simple but important story, which can be summarized as follows:
The population forecasts underpinning Ontario's Growth Plan for the Greater Golden Horseshoe
substantially underestimated population growth since 2016 from international sources, specifically
immigration and international students, particularly in the Greater Toronto Area and Hamilton (GTAH)
region. In just five years, Ontario's population of adults grew by several hundred thousand more than
forecasted, each of whom needs a place to call home.
Despite the population growing more rapidly than forecasted, the housing stock in 2021 in most GTAH
communities fell short of the forecasts made in 2012.
The underproduction of new housing supply coupled with population growth exceeding forecasts
created excess demand for housing in the GTAH. This imbalance between housing demand and supply
contributed to high housing prices and the migration of young families out of the GTAH to other parts of
the province that occurred well before the pandemic. In each of the three years before the pandemic,
over 40,000 persons, on net, moved out of the GTAH to other parts of the province, over double the
pre-2014 average. Despite Ontario's booming population growth, the GTAH's population grew slower
than forecast due to out-migration from a lack of building homes.
There is a genuine (and we would argue quite likely) possibility that the future may look a great deal like
the past and that current forecasts are underestimating population growth and overestimating future
housing completions. Past forecasts underestimated GTAH population growth from international
sources by roughly 120,000 persons from 2016-21 while overestimating the size of the housing stock by
approximately 26,000 units, contributing to the excess demand for housing.
Two plausible scenarios could cause population growth from international sources to be approximately
120,000 persons higher than currently forecasted in 2021-26. In one scenario, GTAH population growth
through immigration is 20% higher than forecasted; in the other, the boom in net non-permanent
residents lasts five years longer than currently forecasted. In the former scenario, the excess demand for
housing in the GTAH from 2021-26 is roughly 36,000 units; in the latter, housing demand grows more
slowly as the new population is primarily students who live in more crowded conditions. However, as
those students age and form families, their housing needs match the immigration scenario.
In general, population forecasts (and by extension, housing demand forecasts) are highly sensitive to the
assumptions made on future immigration targets and international student trends, and thus housing
demand forecasts for the GTAH could be off by over a hundred thousand units a decade. Similarly,
housing completion forecasts can also be off by as much as a hundred thousand units in a decade. As
such, planners should consider a range of potential scenarios rather than assuming current forecasts will
necessarily prove accurate. We provide ten recommendations to improve forecasting and planning,
including creating annual population, employment, and housing forecasts.

iv
FORECAST FOR FAILURE
Ten key points from this report
1. The Growth Plan for the Greater Golden Horseshoe (GGH) and the municipal plans built on that
plan are grounded in housing and population forecasts. These forecasts become stale quickly, as
populations grow faster than anticipated, as forecasts do not anticipate policy changes that lead
to faster population growth. Municipal plans are not revised to reflect the new reality despite
forecasts rapidly becoming outdated.
2. Housing shortages occurred in the GTAH (Greater Toronto Area and Hamilton), partly because
populations grew faster than forecast and partly because housing completions in municipalities
did not hit the (already too low) minimums set out in the Growth Plan.
3. Relative to a 2012 forecast, the GTAH's population growth from 2016-21 from international
sources was over 120,000 more than forecast, yet it currently has 26,000 fewer housing units
than forecasted in 2012.
4. The lack of housing causes a significant and unforecasted exodus of young families out of the
GTAH who drive until they qualify to other parts of the province. In 2012, it was forecasted that,
on net, 36,000 people would move out of the GGH to other parts of the province from 2016-21.
The actual number was over 100,000. This exodus caused the housing shortage to spread across
Southern Ontario, leading to one of the planet's least affordable real estate markets.
5. This lack of housing also acts as a drag on the economy of the GTAH, as workers are priced out
of working in the region (since they cannot afford to live there) and are forced to work lower-
wage, lower-productivity jobs in other parts of the country.
6. These trends will continue unless more housing is built across Ontario. The report Baby Needs a
New Home examines Ministry of Finance population projections to estimate the number of new
homes needed in each of Ontario's 49 census divisions, taking into account generational
'turnover' of housing. It finds that, on net, the province will need one million net new homes in
the next ten years, with over half of those in the GTAH.
7. This report builds on Baby Needs a New Home by examining Hemson's housing and population
forecasts, which inform the Growth Plan and asks what happens if those forecasts are wrong?
By performing a series of sensitivity analyses, we find that if current population growth forecasts
from international migration are as off as past ones, the GTAH could require over 100,000
additional housing units over the next decade.
8. The distinction between Hemson's population forecasts and the Ministry of Finance's
projections is crucial as they have significant differences. Finance projects the GTAH's
population to grow by over 700,000 between 2021-26, whereas Hemson's forecast is less than
600,000. Much of this difference can be explained by the continued growth of the international
student population, as the Ministry of Finance is projecting much higher growth in international
students than Hemson forecasts. That the two come to substantially different conclusions
illustrates the importance of sensitivity analyses and building contingency slack into plans.
9. The province has a population forecast and a population projection that make substantially
different predictions which exemplifies the lack of coordination and data at the core of Ontario's
housing shortages. To address how Ontario has forecast for failure, we provide ten

v
recommendations, one of which is that Ontario should prepare a population, employment, and
housing stock forecast, released annually, which would adopt the best elements of both the
existing forecasts and the Ministry of Finance population projections. This would create a
unified set of numbers to replace the existing Ministry of Finance population projections.
10. It is vital to continue to attract international talent to the GTAH to support the economic
growth, quality of life and cultural diversity of Canada's economic heartland. Ensuring adequate
housing supply for existing and future residents should be core to the region's economic and
social policy objectives. Cooling demand by slowing population growth is not the solution to the
region's housing shortages.
vi
FORECAST FOR FAILURE
Table of Contents Acknowledgements ....................................................................................................................................................... ii
Executive summary ....................................................................................................................................................... iii
Ten key points from this report .................................................................................................................................... iv
Introduction: Housing shortages are likely to persist in the GTAH unless we change how we plan and forecast
....................................................................................................................................................................................... 7
Housing shortages have plagued Southern Ontario. Why did they happen, and can we expect more of the
same?........................................................................................................................................................................... 10
Why did population growth from international sources accelerate, and why did our forecasts miss it? ................... 26
The economic burden of the GTAH's housing shortages............................................................................................. 30
The issue is a lack of policy coherence, not immigration ............................................................................................ 31
Drive until you qualify: Quantifying the role the housing shortage played in the exodus from the GTAH ................. 32
How can we avoid future housing shortages? ............................................................................................................. 37
How much larger could the housing shortages become? Constructing our sensitivity analyses ................................ 43
Unless we change how we forecast and plan, housing completions could lag demand by tens of thousands of
units each year............................................................................................................................................................. 58
Conclusion and recommendations .............................................................................................................................. 60
Appendix I: Baseline population forecast for Durham ................................................................................................ 63
Appendix II: Baseline population forecast for Halton .................................................................................................. 65
Appendix III: Baseline population forecast for Hamilton............................................................................................. 67
Appendix IV: Baseline population forecast for Peel .................................................................................................... 69
Appendix V: Baseline population forecast for Simcoe................................................................................................. 71
Appendix VI: Baseline population forecast for Toronto .............................................................................................. 73
Appendix VII: Baseline population forecast for York ................................................................................................... 75
Data sources used in the report .................................................................................................................................. 77
References ................................................................................................................................................................... 77

7
Introduction: Housing shortages are likely to persist in the GTAH unless we change how we plan and forecast Even before the beginning of the pandemic, southern Ontario experienced high and rising home prices
and a substantial number of families leaving the Greater Toronto Area and Hamilton (GTAH) in search of
available and attainable housing, in a phenomenon known as drive until you qualify1. These trends,
which accelerated in 2016, can be traced back to high demand levels due to unanticipated population
growth and low supply levels due to housing completions falling somewhat short of forecasts.
Two causes of post-2016 housing shortages in the GTAH and southern Ontario Cause 1 of the housing shortage – Population growth since 2016 has been consistently higher than
past forecasts: Past projections and forecasts have underestimated Ontario's population growth rate
from international sources, and they may do so again in the future. In 2005, Hemson Consulting Ltd.
(Hemson) forecasted that 2016-21 GTAH population growth from international sources would be under
400,000 persons. In 2012, this forecast was increased to 480,000, and by 2020, the forecast stood at
607,000. Despite immigration targets continuing to rise, the continued reliance of Ontario colleges and
universities on growth from international students, and advocacy from groups that recognize the need
to attract global talent, current Ontario population growth forecasts show little change to growth levels
from international sources. This unforecasted population growth causes a shortage of housing, as official
plans underestimate housing demand as they are based on population forecasts that are too low.
Cause 2 of the housing shortage – Housing completions underperformed forecasts: Past housing
projections have overestimated increases in the housing stock. There is a real risk that this will continue
in the future. Despite accelerated population growth, Hemson's forecasted 2021 housing stock for the
GTAH was smaller in the 2020 forecast relative to the one made in 2012.
In short, if population growth in the GTAH continues to be higher than forecast, then housing demand
will grow faster than planned. If housing completions in the GTAH continue to be lower than forecast,
the housing supply will grow slower than planned. This mismatch between demand growth and supply
growth will further exacerbate existing housing issues in the GTAH, causing cascading shortages and high
prices across southern Ontario.
Accelerated population growth combined with a smaller housing stock than forecast causes excess
demand for housing in the GTAH. This excess demand can be resolved in several ways, including families
moving out of the GTAH and adults under 35 living with their parents at increased rates. The report
Baby Needs a New Home2 found that nearly 65,000 fewer housing units (of all types) were built between
2016 and 2021 than were needed to support population growth across Ontario. This excess demand for
housing will continue if the province underestimates future population growth and overestimates future
housing completions.
1 As explained by CMHC (2019), “The expression drive until you qualify has become popular in recent years. It refers to the response households have had to rising home prices. Because of rising prices, many households can’t afford to buy homes in the urban, central sectors of their cities. Households therefore drive further and further… until they find housing they can afford (and a mortgage they can qualify for).” 2 Moffatt (2021a)

8
Past housing shortages naturally lead to the question, how much larger could the excess demand for
housing get if we continue on our current path?
Estimating past excess demand for housing in the GTAH To answer our question, we start by estimating excess demand in past years by considering the number
of individuals moving out of the GTAH to other parts of the province. This estimate helps us understand
how many additional units the GTAH would have needed to build to have prevented the exodus of
young families out of the region. It also allows us to forecast how many extra housing units would need
to be built to prevent the current exodus from escalating. Our method of estimating excess demand
provides a highly conservative estimate, as it excludes the other channels through which excess demand
can be resolved, such as adults continuing to live with their parents rather than moving out and
beginning new families.
Our interest is in conducting a sensitivity analysis to determine what impact this excess demand may
have had at a local level for six census divisions: Durham, Halton, Peel, Simcoe, Toronto, and York. A
complicating factor is that much of the current forecasts are at the GTAH level, which includes Hamilton
but excludes Simcoe. When examining the performance of past forecasts, we will primarily be examining
the GTAH. We will add Simcoe into our sensitivity analysis while retaining Hamilton when conducting
that analysis.
In the nine years from 2006-07 to 2014-15, on average, just over 15,000 people, on net, moved out of
the GTAH to other parts of the province. Using a methodology adapted from the report Baby Needs a
New Home3, we find that those 15,000 people could expect to occupy 4,366 ground-level housing units
and 1,662 apartment units, which we can use as our conservative estimate of GTAH-level excess
demand in the pre-2015 period.
In the five years from 2015-16 to 2019-20, the yearly average net intraprovincial4 out-migration from
the GTAH increased to 42,749 persons. Our yearly excess demand estimates rise to 10,893 ground-level
units and 4,742 apartment units, respectively. Unexpectedly high population growth, coupled with
housing completions under forecast, caused excess demand for housing to nearly triple after 2015.
Creating a baseline projection for future excess demand for housing in the GTAH and conducting a scenario analysis To apply a similar method to estimate future excess demand in the GTAH, we require a population
projection or forecast of net intraprovincial out-migration from the GTAH by year and age.
Unfortunately, while Ontario has both a set of population forecasts, prepared by Hemson Consulting
Ltd5., and a set of population projections, prepared by the Ontario Ministry of Finance6, neither contains
this information. The Hemson numbers include five-year forecasts of net intraprovincial migration from
the GTAH. Still, it lacks information on their ages and detailed population estimates by age and gender
for the census divisions that make up the GTAH. The Ministry of Finance population projections, on the
3 Moffatt (2021) 4 Intraprovincial migration refers to persons moving from one part of Ontario to another. Interprovincial migration, in contrast, refers to people moving to (or from) Ontario from (or to) another province. 5 Hemson (2020b) 6 Ontario Ministry of Finance (2021)
9
other hand, do include complete population pyramids, by year, for each of Ontario's 49 census divisions.
However, they lack information on intraprovincial migration. Furthermore, Hemson's population
forecasts and the Ministry's population projections differ substantially at a local level, as Hemson's
forecasts consider supply-side constraints (making them forecasts rather than projections). In contrast,
the ones from the Ministry of Finance do not.
To address this problem, we create a demographic model that incorporates elements from both
Hemson's forecast and the Ministry's projections, along with past intraprovincial migration trends. A
demographic model allows us to create a projection of future net intraprovincial out-migration from the
GTAH by age and a rough estimate of population pyramids based on the Hemson population forecast.
We find that both population and housing demand estimates are very sensitive to the assumptions
made. Minor changes compound over time, leading to exponentially increasing (or decreasing) housing
demand. Furthermore, the source of unexpected population growth matters; immigration-based
population growth tends to be clustered in a few centres and immediately increases the need for
housing. An increase in the international student population tends to delay the need for family-sized
housing as the population is relatively young. However, after graduating, those students often stay in
Canada, eventually gaining permanent residency and forming families, creating demand for family-
friendly housing in the GTAH.
Our analysis constructs a series of scenarios involving net immigration and net non-permanent7
populations being higher than forecast, along with housing completions being lower than forecast.
Given that past forecasts have underestimated population growth and overestimated the size of the
housing stock, we believe such an analysis is both prudent and necessary. The analysis shows that excess
housing demand could be over 100,000 units more than forecast under plausible conditions for any
given five-year period.
Our purpose for conducting these scenario analyses is not to improve Hemson's forecast. Rather, it is to
show that there is a range of possible outcomes for population growth and housing completions. There
is a genuine possibility that Ontario's Growth Plan, which uses Hemson's forecasts as a foundation, could
be creating the conditions for the GTAH's existing housing shortage to persist. Because the future
contains many unknowns, and because the economic, social, and environmental costs of underbuilding
housing in the GTAH are so high, we believe policymakers must be humble and incorporate contingency
buffers into their planning processes, rather than assuming forecasts will be perfectly accurate.
In the conclusion of this paper, we provide ten recommendations to improve forecasting, data, and
policy coherence in planning. The first two recommendations are of particular importance:
Recommendation 1: Ontario should prepare a population, employment, and housing stock
forecast, released annually, which would adopt the best elements of both the existing forecasts
7 Included in the category of non-permanent residents are “persons with a usual place of residence in Canada who are claiming refugee status and the family members living with them”, “persons with a usual place of residence in Canada who hold study permits and the family members living with them”, and “persons with a usual place of residence in Canada who hold work permits and the family members living with them.” As shown in Moffatt (2021a), the overwhelming majority of new non-permanent residents in Ontario are individuals holding study permits (and their family members) and former holders of study permits who now hold work permits under the post-graduation work permit program. The term non-permanent should not be taken too literally, as many non-permanent residents eventually become permanent ones.

10
and the Ministry of Finance population projections. This would create a unified set of numbers
to replace the existing Ministry of Finance population projections.
Recommendation 2: Growth plans should be set to population estimates that are higher than
forecast to allow for unavoidable errors in forecasting. Just as government budgets typically
have contingency buffers to accommodate unplanned events, so too should growth plans.
Tackling the GTAH and Simcoe's housing shortages will take concerted action from all three levels of
government. As such, our recommendations include actions that each can undertake.
Housing shortages have plagued Southern Ontario. Why did they happen, and can we expect more of the same?
The core question that underlies this report can be summarized as follows:
Past forecasts have overestimated future housing completions and underestimated future
population growth, contributing to regional housing shortages. Why did this happen, and what
will happen if this continues to occur in the future?
Although skyrocketing home prices across Ontario during the pandemic have captured Canada's (and
the world's) attention, the province's housing supply issues predate the pandemic. Since approximately
2015, the GTAH has experienced high excess demand for housing, leading to high home prices and out-
migration of young families from the region to other parts of Ontario8. This excess demand can be
traced to unusually rapid (and unexpected) population growth, coupled with housing completions falling
under forecasts.
To understand how the future may be like the past, we examine the linkages between existing housing
shortages, forecasts, and growth planning. As we will see, the forecasts are essential, as they are not
simply predictions, but they are used as a foundation for public policy.
Population and housing forecasts, projections, and why they matter
To inform regional planning, the Province of Ontario tasks the private-sector firm Hemson Consulting
Limited with developing a technical report, which contains a set of growth forecasts for the Greater
Golden Horseshoe region. The most recent technical report, published on August 26, 2020, titled
Greater Golden Horseshoe: Growth Forecasts to 20519, provides a background on the purpose of their
forecasts:
This report presents long-term growth forecasts for the Greater Golden Horseshoe
(GGH)…[which] form part of a review of population and employment forecasts contained in
Schedule 3 of the Provincial plan A Place to Grow: Growth Plan for the Greater Golden
Horseshoe, 2019 (A Place to Grow or APTG).
8 Moffatt (2021a) provides an in-depth analysis to the scope and causes of outmigration from the GTAH. 9 Hemson (2020b)

11
For the last 15 years, the Government of Ontario has been implementing policy changes that will
fundamentally affect the way in which the GGH will develop. A key component of the changes is
A Place to Grow, which, together with other provincial plans, sets the framework for planning
and managing growth in the region. Conformity with A Place to Grow is a statutory requirement
and municipalities in the GGH have revised land use, housing, employment, infrastructure, and
financial plans accordingly…
Two broad regions within the GGH are defined:
- The Greater Toronto Area and Hamilton (GTAH), incorporating the Cities of Toronto and
Hamilton and the Regions of Halton, Peel, York, and Durham; and
- The Outer Ring, surrounding the GTAH, containing the Regions of Niagara and Waterloo, the
Counties of Northumberland, Peterborough, Simcoe, Dufferin, Wellington, Brant, and
Haldimand, and the Cities of Peterborough, Kawartha Lakes, Barrie, Orillia, Guelph, and
Brantford.
The population growth and accompanying housing demand forecasts inform the growth plan, though it
is important to note that "policies of [the growth plan] represent minimum standards. Within the
framework of the provincial policy-led planning system, decision-makers are encouraged to go beyond
these minimum standards to address matters of importance."10
In 2015, the Ontario government tasked David Crombie with assembling an expert panel to conduct a
coordinated review of the Growth Plan. Their findings, published in late 2015 under the title Planning for
Health, Prosperity and Growth, was unequivocal about the importance of forecasting in municipal
planning and the Growth Plan:
Forecasts are fundamental to the Growth Plan and essential to its effectiveness because they
enable municipalities to plan for and manage the growth that is coming, and to assess whether
they have enough land to accommodate forecast growth within existing settlement areas. 11
Given the importance of these forecasts to the planning process, their predictions must be accurate as
possible. To analyze their accuracy, we examine three sets of past Hemson forecasts:
- The Growth Outlook for the Greater Golden Horseshoe, published in January 2005. We will
refer to this as Hemson-05.12 This set of forecasts, which covered 2001-31, served as the
foundation for the Growth Plan for the Greater Golden Horseshoe 2006.13
- Greater Golden Horseshoe Growth Forecasts to 2041, published in November 2012. We will
refer to this as Hemson-12.14 There was a minor addendum to this report, published in June
2013.15 This set of forecasts, which extended through 2041, served as the foundation for the
10 Government of Ontario (2020) 11 Government of Ontario (2015) 12 Hemson (2005) 13 Government of Ontario (2006) 14 Hemson (2012) 15 Hemson (2013)

12
Growth Plan for the Greater Golden Horseshoe 2017.16 Despite this Growth Plan going into
effect on July 1, 2017, it relied on forecasts from 2012-13.
- Greater Golden Horseshoe: Growth Forecasts to 2051, published in August 2020. We will
refer to this as Hemson-20.17 This is an update of a June 2020 release.18 This set of forecasts,
which covered 2021-51, served as the foundation for the Growth Plan for the Greater
Golden Horseshoe 2019 and Amendment 1 (2020) to the Growth Plan for the
- Greater Golden Horseshoe 2019.19
The purpose of this examination is not to audit Hemson's performance as a forecaster. Instead, it shows
that predictions of population growth are inherently tricky, as they are highly dependent on future
policy changes, such as changes to immigration targets or international student policies, which are
unknowable to forecasters. As such, it is essential that we recognize the limits of forecasting, that our
forecasts be updated frequently and be based on easily accessible data, and that housing policy builds in
a contingency buffer for unanticipated population growth. This report makes ten recommendations to
help improve planning and avoid housing shortages in the future.
The Hemson forecasts are not the only predictions for future population growth. Once a year, the
Ontario Ministry of Finance releases population projections for each of Ontario's 49 census divisions for
the next 25 years.20 They were used as the basis for the Smart Prosperity Institute report, Baby Needs a
New Home21, which estimated that the province needs to build one million net new homes between
2021 and 2031, to support future population growth and address existing housing shortfalls.
Examining the three sets of Hemson releases sheds light on two causes of the housing shortage plaguing
Southern Ontario.
Cause 1: Population growth from international sources has been higher than past forecasts
Between 2006-07 and 2013-14, the GTAH's net population growth from international sources, including
permanent and non-permanent residents, was consistently between 80,000 and 100,000 persons per
year, as shown by Figure 1. This dipped in 2014-15, only to heavily rebound in the following years. In the
ten years of 2007-16, the GTAH's population growth from international sources grew by less than 85,000
persons per year. In the four years that followed, it averaged over 130,000. The other two regions of
Ontario (the GGH's Outer Ring and the rest of Ontario outside the GGH) saw their average yearly
population growth from international sources triple between the two periods, albeit from a much lower
base.
16 Government of Ontario (2017) 17 Hemson (2020b) 18 Hemson (2020a) 19 Government of Ontario (2020) 20 Ontario Ministry of Finance (2021) 21 Moffatt (2021a)

13
Figure 1: Net International Migration by Ontario Region and Year, 2006-07 to 2019-20.22
This rapid population growth from international sources was not anticipated, which is reflected in
Hemson's population forecasts. Hemson's 2005 forecast (Hemson-05) expected that population growth
from international sources would be 398,000 in each of the five-year periods of 2011-16 and 2016-21.
These estimates were revised upwards in the 2012 forecast release (Hemson-12) to 450,47023 and
479,620. As shown in Figure 2, Hemson's 2020 forecast (Hemson-20) for 2016-21 was revised
substantially upward to 607,000, an increase of over 120,000 from Hemson-12 and over 200,000 from
Hemson-05.
22 Data Source: Statistics Canada Table 17-10-0140-01. Populations (and changes) measured from July 1 of each year, so on the above graph ‘2020’ refers to the changes that occurred between July 1, 2019 and July 1, 2020. 23 Due to the one-year dip in the 2014-15 numbers, the Hemson-12 forecast for 2011-16 was an instance where population growth was over, rather than under, estimated.
0
20,000
40,000
60,000
80,000
100,000
120,000
140,000
160,000
2007 2008 2009 2010 2011 2012 2013 2014 2015 2016 2017 2018 2019 2020
Net International Migration by Ontario Region and Year, 2006-07 to 2019-20
GTAH GGH Outer Ring All Else ON

14
Figure 2: Population Growth from International Sources by 5-Year Period, for the GTAH, from Hemson's
2005, 2012 and 2020 Forecasts.24
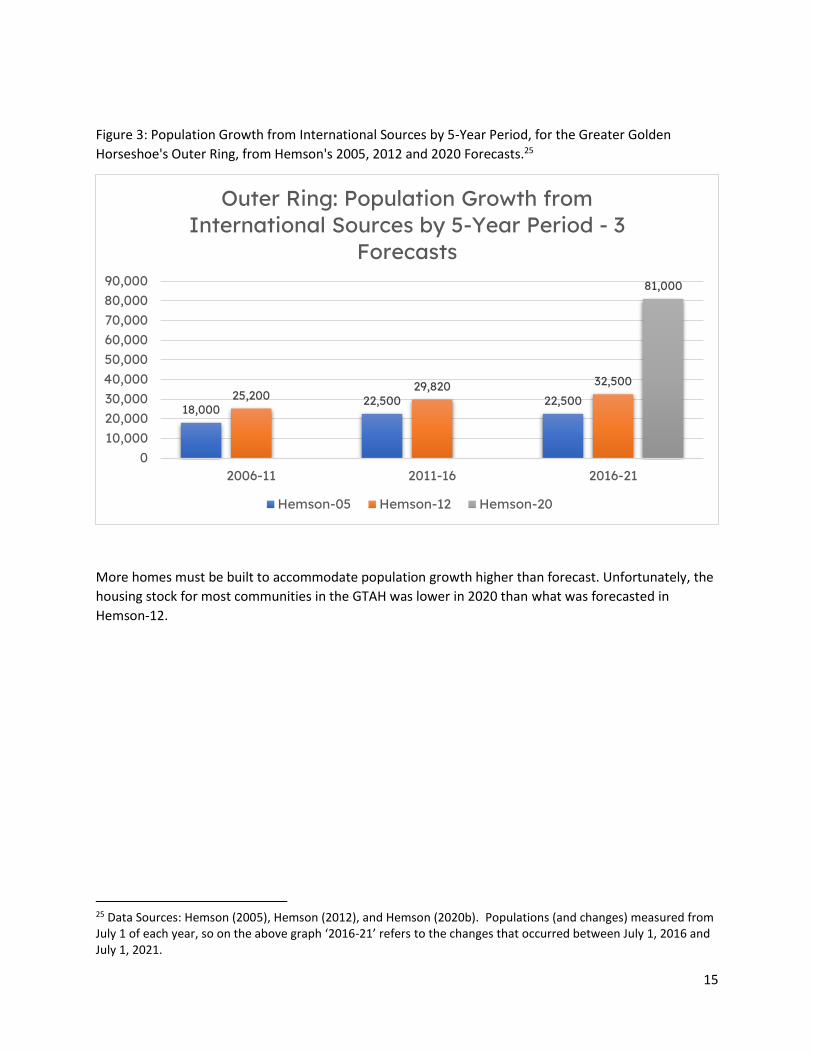
The Greater Golden Horseshoe's (GGH) Outer Ring forecasts illustrate a similar dynamic. As Figure 3
shows, the population growth forecasts were revised upward from Hemson-05 to Hemson-12, then
again in Hemson-20. The 2016-21 international population growth figures were revised from 22,500 to
32,500 in 2012, jumping to a whopping 81,000 in 2020.
24 Data Sources: Hemson (2005), Hemson (2012), and Hemson (2020b). Populations (and changes) measured from July 1 of each year, so on the above graph ‘2016-21’ refers to the changes that occurred between July 1, 2016 and July 1, 2021.
450,500398,000 398,000
455,450
450,470479,620
607,000
0
100,000
200,000
300,000
400,000
500,000
600,000
700,000
2006-11 2011-16 2016-21
GTAH: Population Growth from International Sources by 5-Year Period - 3 Forecasts
Hemson-05 Hemson-12 Hemson-20
15
Figure 3: Population Growth from International Sources by 5-Year Period, for the Greater Golden
Horseshoe's Outer Ring, from Hemson's 2005, 2012 and 2020 Forecasts.25
More homes must be built to accommodate population growth higher than forecast. Unfortunately, the
housing stock for most communities in the GTAH was lower in 2020 than what was forecasted in
Hemson-12.
25 Data Sources: Hemson (2005), Hemson (2012), and Hemson (2020b). Populations (and changes) measured from July 1 of each year, so on the above graph ‘2016-21’ refers to the changes that occurred between July 1, 2016 and July 1, 2021.
18,00022,500 22,50025,200
29,820 32,500
81,000
010,00020,00030,00040,00050,00060,00070,00080,00090,000
2006-11 2011-16 2016-21
Outer Ring: Population Growth from International Sources by 5-Year Period - 3
Forecasts
Hemson-05 Hemson-12 Hemson-20

16
Cause 2: GTAH housing completions have been lower than forecasts
Hemson's outlook reports provide forecasts on population, employment, and the future size of the
housing stock. They have used different ways to categorize housing into types; for example, the August
2020 report26 breaks housing into four classifications: single and semi-detached houses, rowhouses,
accessory units, and apartment units. For simplicity, this report will adopt the approach of Hemson's July
2020 report27, which classifies housing into apartment units and ground-level units, which are simply all
housing types that are not apartments.
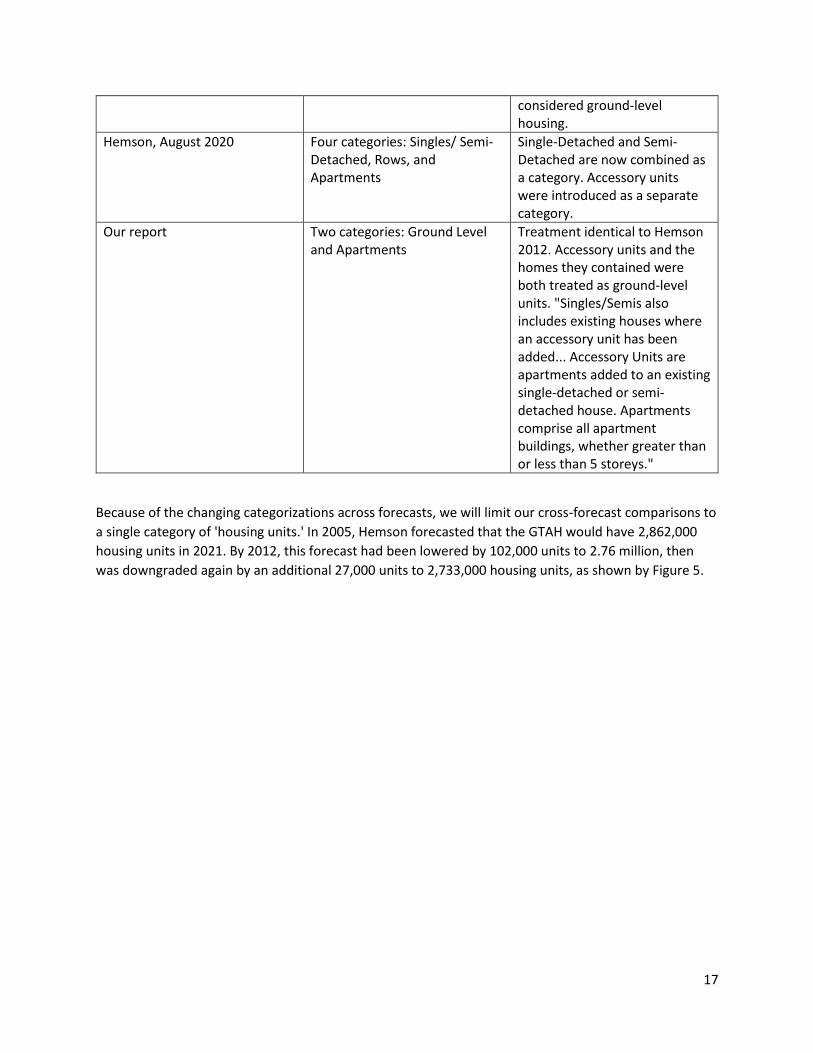
Comparing housing forecasts across reports is difficult due to the changing housing classifications,
particularly regarding accessory units. Figure 4 provides details on the classification systems used in the
four Hemson reports and how to reconcile them:
Figure 4: Housing Classification Types in Hemson Outlook Reports28
Report Classification Types Treatment of Accessory Units
Hemson, 2005 Four categories: Single-Detached, Semi-Detached, Rows, and Apartments.
Both the accessory unit and the house containing the unit are treated as apartments: "Single, semi and row units generally follow the common usage definition of these units, though none of these definitions allow for stacking of units. Stacked rowhouses or singles/semis with accessory units become apartments (e.g. a house with a basement suite is counted as two duplex apartment units)."
Hemson, 2012 Four categories: Single-Detached, Semi-Detached, Rows, and Apartments
No indication in the report of how accessory units are treated. It appears they are treated identically to Hemson 2012.
Hemson, July 2020 Two categories: Ground-related and apartments.
No indication in the report of how accessory units are treated. Apartments are now defined as units in "apartment buildings." Accessory units and the houses that contain them are now not considered apartments but are instead
26 Hemson (2020b) 27 Hemson (2020a) 28 Hemson (2005, 2012, 2020a, 2020b)
17
considered ground-level housing.
Hemson, August 2020 Four categories: Singles/ Semi-Detached, Rows, and Apartments
Single-Detached and Semi-Detached are now combined as a category. Accessory units were introduced as a separate category.
Our report Two categories: Ground Level and Apartments
Treatment identical to Hemson 2012. Accessory units and the homes they contained were both treated as ground-level units. "Singles/Semis also includes existing houses where an accessory unit has been added... Accessory Units are apartments added to an existing single-detached or semi-detached house. Apartments comprise all apartment buildings, whether greater than or less than 5 storeys."
Because of the changing categorizations across forecasts, we will limit our cross-forecast comparisons to
a single category of 'housing units.' In 2005, Hemson forecasted that the GTAH would have 2,862,000
housing units in 2021. By 2012, this forecast had been lowered by 102,000 units to 2.76 million, then
was downgraded again by an additional 27,000 units to 2,733,000 housing units, as shown by Figure 5.

18
Figure 5: Forecasted Number of Housing Units by Year for the GTAH in Three Hemson Forecasts: 2005,
2012, and 2020.29
When breaking the GTAH data down by census division, we see that only one of the six communities
(Toronto) did the 2021 housing stock forecast in 2020 exceed that in 2012, as shown by Figure 6.
Although final 2021 housing stock numbers were not in when Hemson published the forecast in August
2020, it is almost certainly likely that five of the six census divisions will have underbuilt homes
compared to their 2012 forecasts. In Figure 7, we have also included data for the Simcoe Census
division, which also experienced a reduction in the forecasted size of the housing stock.30
29 Data Sources: Hemson (2005), Hemson (2012), and Hemson (2020b). 30 Hemson-20 lowered the forecasted size of the housing stock, relative to Hemson-12 by 440 in Simcoe county, 810 units in Barrie, and 640 in Orillia.
1,968
2,429
2,862
1,969
2,371
2,760
2,371
2,733
0
500
1,000
1,500
2,000
2,500
3,000
3,500
2001 2011 2021
GTAH: Forecasted Number of Housing Units by Year and Forecast (000s)
Hemson-05 Hemson-12 Hemson-20

19
Figure 6: Change in Total Housing Stock Forecast, for each GTAH Census Division, between Hemson's
2020 and 2012 Forecasts.31
Not surprisingly, when communities build less housing than forecast, their populations rise less than
forecast. We do not currently have final population numbers for 2021, but we do have Hemson's
population forecast, along with the population projections from the Ontario Ministry of Finance.
Although there are significant differences between Finance's projections and Hemson's forecasts (likely
due to differences in assumptions regarding the return of international students during the pandemic),
both show that in four of the six Census Divisions that comprise the GTAH, the population grew slower
than forecast in 2016-21, with total GTAH population falling over 100,000 persons short of projections
(refer to Figure 7).
31 Data Sources: Hemson (2012) and Hemson (2020b).
-16,590 -13,280-5,840 -9,140
32,960
-14,860
-26,750
-9,250
-30,000
-20,000
-10,000
0
10,000
20,000
30,000
40,000
Durham Halton Hamilton Peel Toronto York GTAHTotal
Simcoe
2021 Housing Stock Forecast Relative to 2012 Forecast

20
Figure 7: Ministry of Finance Population Projection and Hemson's 2020 Population Forecast for 2021
Relative to Hemson's 2012 Forecast for 2021.32
The total population for the GTAH for the year 2021 was substantially revised in Hemson's 2020 forecast
relative to Hemson-12. Specifically, the 2020 forecast projected 120,000 fewer individuals in 2021
compared to the forecasting exercise conducted in 2012. However, Hemson-20 also forecasted in-
migration from international sources to be 120,000 persons higher in 2016-21 than in Hemson-12.
Despite the higher-than-expected population growth in the GTAH from international sources, the overall
population increase was offset by people out-migrating to other parts of the province due to housing
shortages.
The Exodus from the GTAH
Per the 2005 Hemson forecasts, the GTAH was set to experience a net out-migration of 123,000
individuals from 2016-2021 to the rest of the province. By 2012, that forecast was increased to 157,250;
it was further increased by 231,000 in 2020 (see Figure 8).
32 Data Sources: Hemson (2012), Hemson (2020b), Ontario Ministry of Finance (2021).
-200,000
-150,000
-100,000
-50,000
0
50,000
100,000
Durham Halton Hamilton Peel Toronto York TOTAL
Ministry of Finance Population Projection and Hemson-20 Population Forecast for 2021 Relative
to Hemson-12 Forecast for 2021
Ministry of Finance Hemson-20

21
Figure 8: Forecasted Net Intraprovincial Migration for the GTAH by Five-Year Period in Three Hemson
Forecasts: 2005, 2012, and 2020.33
Some of these individuals were migrating out of the GTAH area into the outer ring of the Greater Golden
Horseshoe.34 Specifically, this intraprovincial migration for the 2016-2021 period was forecasted to be
118,000 in 2005, 121,500 in 2012, and 125,000 in 2020, as shown by Figure 9.
33 Data Sources: Hemson (2005), Hemson (2012), and Hemson (2020b). Populations (and changes) measured from July 1 of each year, so on the above graph ‘2016-21’ refers to the changes that occurred between July 1, 2016 and July 1, 2021. 34 The Outer Ring, surrounding the GTAH, containing the Regions of Niagara and Waterloo, the Counties of Northumberland, Peterborough, Simcoe, Dufferin, Wellington, Brant, and Haldimand, and the Cities of Peterborough, Kawartha Lakes, Barrie, Orillia, Guelph, and Brantford.
-94,000 -123,000 -123,000
-87,390
-128,170 -157,520
-231,000-250,000
-200,000
-150,000
-100,000
-50,000
02006-11 2011-16 2016-21
GTAH: Population Growth from Intraprovincial Migration - 3 Forecasts
Hemson-05 Hemson-12 Hemson-20

22
Figure 9: Forecasted Net Intraprovincial Migration for the Greater Golden Horseshoe's Outer Ring by
Five-Year Period in Three Hemson Forecasts: 2005, 2012, and 2020.35
Beyond these patterns, the most significant change was the forecasts of net intraprovincial migration to
the rest of the province over the 2016-2021 period. Specifically, around 5,000 people were forecasted to
move from the GGH to other parts of Ontario in Hemson-05. This forecast jumped to 36,020 in Hemson-
12 and to 106,000 in Hemson-20, a 21-fold increase from 2005's forecast (see Figure 10).
35 Data Sources: Hemson (2005), Hemson (2012), and Hemson (2020b). Populations (and changes) measured from July 1 of each year, so on the above graph ‘2016-21’ refers to the changes that occurred between July 1, 2016 and July 1, 2021.
89,000
118,000 118,000
59,160
107,390121,500125,000
0
20,000
40,000
60,000
80,000
100,000
120,000
140,0002006-11 2011-16 2016-21
Outer Ring: Population Growth from Intraprovincial Migration - 3 Forecasts
Hemson-05 Hemson-12 Hemson-20
23
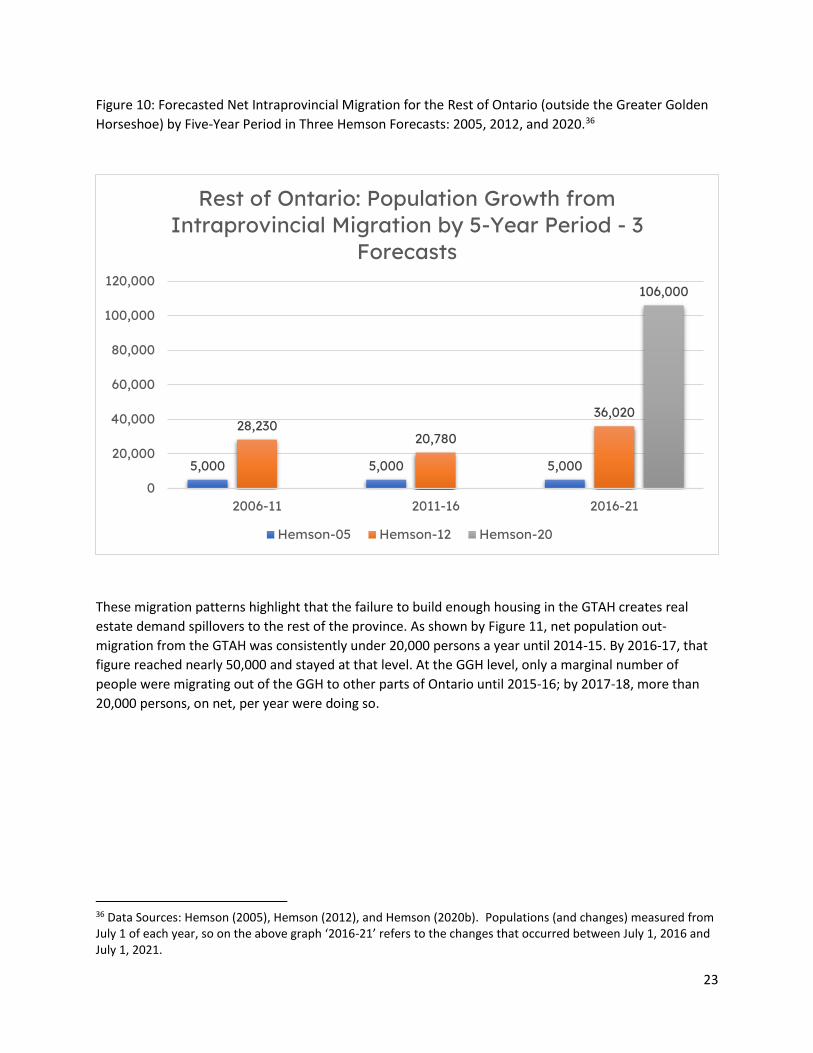
Figure 10: Forecasted Net Intraprovincial Migration for the Rest of Ontario (outside the Greater Golden
Horseshoe) by Five-Year Period in Three Hemson Forecasts: 2005, 2012, and 2020.36
These migration patterns highlight that the failure to build enough housing in the GTAH creates real
estate demand spillovers to the rest of the province. As shown by Figure 11, net population out-
migration from the GTAH was consistently under 20,000 persons a year until 2014-15. By 2016-17, that
figure reached nearly 50,000 and stayed at that level. At the GGH level, only a marginal number of
people were migrating out of the GGH to other parts of Ontario until 2015-16; by 2017-18, more than
20,000 persons, on net, per year were doing so.
36 Data Sources: Hemson (2005), Hemson (2012), and Hemson (2020b). Populations (and changes) measured from July 1 of each year, so on the above graph ‘2016-21’ refers to the changes that occurred between July 1, 2016 and July 1, 2021.
5,000 5,000 5,000
28,23020,780
36,020
106,000
0
20,000
40,000
60,000
80,000
100,000
120,000
2006-11 2011-16 2016-21
Rest of Ontario: Population Growth from Intraprovincial Migration by 5-Year Period - 3
Forecasts
Hemson-05 Hemson-12 Hemson-20
24
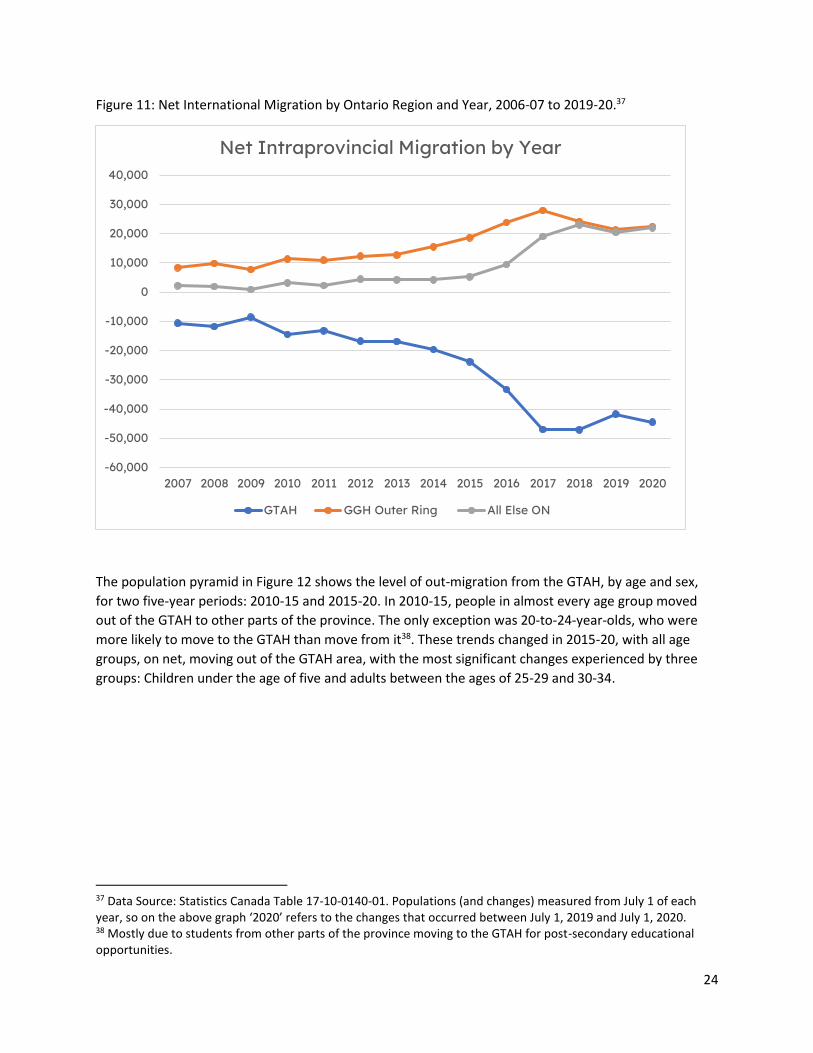
Figure 11: Net International Migration by Ontario Region and Year, 2006-07 to 2019-20.37
The population pyramid in Figure 12 shows the level of out-migration from the GTAH, by age and sex,
for two five-year periods: 2010-15 and 2015-20. In 2010-15, people in almost every age group moved
out of the GTAH to other parts of the province. The only exception was 20-to-24-year-olds, who were
more likely to move to the GTAH than move from it38. These trends changed in 2015-20, with all age
groups, on net, moving out of the GTAH area, with the most significant changes experienced by three
groups: Children under the age of five and adults between the ages of 25-29 and 30-34.
37 Data Source: Statistics Canada Table 17-10-0140-01. Populations (and changes) measured from July 1 of each year, so on the above graph ‘2020’ refers to the changes that occurred between July 1, 2019 and July 1, 2020. 38 Mostly due to students from other parts of the province moving to the GTAH for post-secondary educational opportunities.
-60,000
-50,000
-40,000
-30,000
-20,000
-10,000
0
10,000
20,000
30,000
40,000
2007 2008 2009 2010 2011 2012 2013 2014 2015 2016 2017 2018 2019 2020
Net Intraprovincial Migration by Year
GTAH GGH Outer Ring All Else ON

25
Figure 12: Net Intraprovincial Population Loss by Age and Sex for the GTAH by two Five Year Periods,
2010-15 to 2015-20.39
Figure 13 illustrates these movement patterns by examining the five age categories with the most
significant net intraprovincial out-migration. In 2010-15, the list was dominated by 45-to-64-year-olds.
By 2015-20, 25–34-year-olds were near the top spots.
Figure 13: Net Intraprovincial Population Loss by Age and Sex, Ranked in Order of Largest Net Out-
migration, for the GTAH by two Five Year Periods, 2010-15 to 2015-20.40
Rank 2010-15 Group 2010-15 # 2015-20 Group 2015-20 #
#1 45-to-49 12,237 0-to-4 23,160
#2 0-to-4 10,913 25-to-29 21,257
#3 50-to-54 9,994 50-to-54 18,581
#4 55-to-59 8,481 45-to-49 18,559
#5 60-to-64 6,924 30-to-34 18,503
In other words, both the amount and the composition of intraprovincial out-migration from the GTAH
changed after 2015. Before 2015, it was dominated by middle-aged adults. After 2015, mostly younger
39 Data Source: Statistics Canada Table 17-10-0140-01. Populations (and changes) measured from July 1 of each year, so on the above graph ‘2015-20’ refers to the changes that occurred between July 1, 2015 and July 1, 2020. 40 Data Source: Statistics Canada Table 17-10-0140-01. Populations (and changes) measured from July 1 of each year, so on the above graph ‘2015-20’ refers to the changes that occurred between July 1, 2015 and July 1, 2020.
-12,000 -7,000 -2,000 3,000 8,000
0 to 4
10 to 14
20 to 24
30 to 34
40 to 44
50 to 54
60 to 64
70 to 74
80 to 84
90 Plus
GTAH: Net Intraprovincial Population Loss by Age and Sex Per Five Year Period
2010-15 M 2010-15 F 2015-20 M 2015-20 F
26
people, specifically young parents and their preschool-aged children, moved out of the GTAH. This
group's lack of housing options caused them to drive until they qualify to other parts of the province,
often out of the Greater Golden Horseshoe area entirely to elsewhere in Ontario.
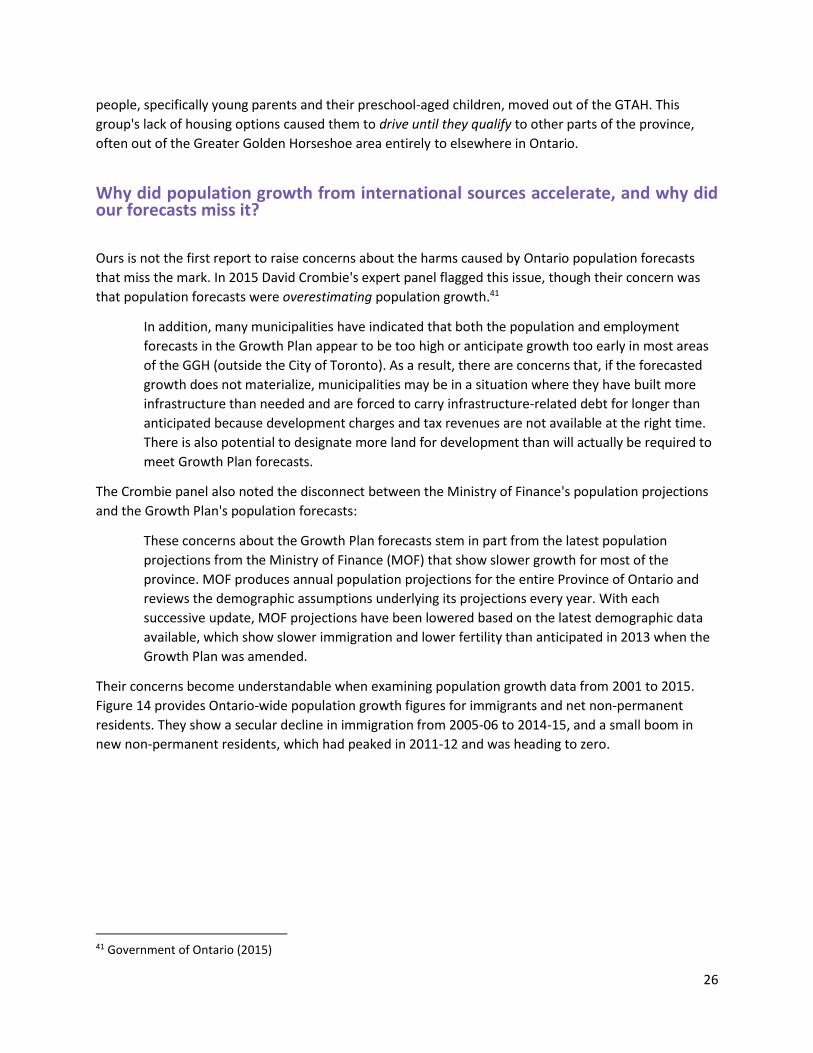
Why did population growth from international sources accelerate, and why did our forecasts miss it?
Ours is not the first report to raise concerns about the harms caused by Ontario population forecasts
that miss the mark. In 2015 David Crombie's expert panel flagged this issue, though their concern was
that population forecasts were overestimating population growth.41
In addition, many municipalities have indicated that both the population and employment
forecasts in the Growth Plan appear to be too high or anticipate growth too early in most areas
of the GGH (outside the City of Toronto). As a result, there are concerns that, if the forecasted
growth does not materialize, municipalities may be in a situation where they have built more
infrastructure than needed and are forced to carry infrastructure-related debt for longer than
anticipated because development charges and tax revenues are not available at the right time.
There is also potential to designate more land for development than will actually be required to
meet Growth Plan forecasts.
The Crombie panel also noted the disconnect between the Ministry of Finance's population projections
and the Growth Plan's population forecasts:
These concerns about the Growth Plan forecasts stem in part from the latest population
projections from the Ministry of Finance (MOF) that show slower growth for most of the
province. MOF produces annual population projections for the entire Province of Ontario and
reviews the demographic assumptions underlying its projections every year. With each
successive update, MOF projections have been lowered based on the latest demographic data
available, which show slower immigration and lower fertility than anticipated in 2013 when the
Growth Plan was amended.
Their concerns become understandable when examining population growth data from 2001 to 2015.
Figure 14 provides Ontario-wide population growth figures for immigrants and net non-permanent
residents. They show a secular decline in immigration from 2005-06 to 2014-15, and a small boom in
new non-permanent residents, which had peaked in 2011-12 and was heading to zero.
41 Government of Ontario (2015)

27
Figure 14: Immigrants and Net Non-Permanent Residents in Ontario, by Year.42
These trends, however, would suddenly reverse course. In Figure 15, we see that both the number of
new immigrants and non-permanent residents to Ontario increased substantially from 2015-16 to 2018-
19.43
42 Data Source: Statistics Canada Table 17-10-0140-01. Populations (and changes) measured from July 1 of each year, so on the above graph ‘2015’ refers to the changes that occurred between July 1, 2014 and July 1, 2015. 43 The year 2018-19 is the last full non-pandemic year.
020,00040,00060,00080,000
100,000120,000140,000160,000180,000
2001 2002 2003 20042005 2006 2007 2008 2009 2010 2011 2012 2013 2014 2015
Components of Population Growth for Ontario: New Immigrants and Net New Non-Permanent
Residents, by Year
Immigrants Net non-permanent residents

28
Figure 15: Immigrants and Net Non-Permanent Residents in Ontario, by Year.44
However, despite this rapid change in population dynamics in 2015-16, the 2017 Growth Plan continued
to rely on population projections from 2012-13, which pre-dated the rapid growth in international
students.
Hemson-20 provides insights on why the immigration and net non-permanent resident numbers
suddenly rose after 2014-15 and why their 2012 forecast missed the mark. On immigration, they note
that changes to federal immigration targets played a key role, stating that the Canada-wide
"immigration target for 2019 was 330,800, with a plan for 341,000 in 2020 and 350,000 in 2021… [t]his
represents a significant increase from the target range of 240,000 to 265,000 in 2012". They also note
that Ontario's proportion of new immigrants rose after the "introduction of the Express Entry system for
skilled workers in 2015."45
The sudden increase in net non-permanent residents is due to a rapid increase in the number of
international students studying in Ontario. Hemson notes that the term non-permanent resident is a bit
of a misnomer, as studying in Canada is a gateway to permanent residency. In their words:
Non-permanent residents (NPRs) from another country who had a work or study permit, or who
were refugee claimants at the time of the Census, as well as family members living with them in
Canada, are counted in the Census. As such, NPRs are included in the base population for all
data used in the Schedule 3 forecasts, such as households, housing and labour force activity.
44 Data Source: Statistics Canada Table 17-10-0140-01. Populations (and changes) measured from July 1 of each year, so on the above graph ‘2015’ refers to the changes that occurred between July 1, 2019 and July 1, 2015. 45 Hemson (2020b)
020,00040,00060,00080,000
100,000120,000140,000160,000
2005 2006 2007 2008 2009 2010 2011 2012 2013 2014 2015 2016 2017 2018 2019
Components of Population Growth for Ontario: New Immigrants and Net New Non-Permanent Residents, by
Year
Immigrants Net non-permanent residents

29
Prior to 2013, the NPR population in Ontario had never exceeded 300,000; it is currently about
580,000.
Much of the recent growth in NPRs is due to international students and their families settling in
the GGH. Canada's stable immigration system, which offers an easy pathway to employment
and permanent residency after graduation, together with successful recruiting strategies by
public and private colleges and universities, have made the GGH very attractive for international
students.
Although the majority of these students become permanent residents, information about where
they ultimately settle is limited. Consistent with the Ministry of Finance Population Projections,
the Schedule 3 forecasts assume that the number of NPR students will remain high even as the
rate of NPR student growth slows.46
Several federal policy changes have made post-secondary education a more attractive pathway to
permanent residency. There were many significant changes, including the introduction of the Express
Entry system. However, there are two that stand out as being particularly important:
- Introduction of the Canadian Experience Class (CEC) in 2008, which provides a pathway for
international students to obtain permanent residency. Included in the reforms were rules
that allowed international students to obtain a 3-year work permit after graduation, up from
the previous 1-2 years.47
- Reforms that allow international students to work off-campus, for 20 hours a week during
study terms, and full-time during regularly scheduled breaks, without applying for a work
permit. These reforms went into effect on July 1, 2014, making it easier for international
students to finance their studies and accommodations.48
It is important to note that these reforms were designed to have post-secondary education be an ever-
increasing path to permanent residency. In 2008, then Minister of Citizenship and Immigration, Diane
Finley indicated that the federal reforms "will help create a pool of individuals who, with work
experience, will find it easier to apply to immigrate to Canada… our ability to retain international
graduates with Canadian qualifications, work experience and familiarity with Canadian society, will help
increase our competitiveness and benefit Canada as a whole."49
In retrospect, the reforms of 2008 and 2014 were more transformative than Ontario policymakers and
forecasters recognized at the time. Ministry of Finance population projections did not anticipate
population growth driven by international students, nor did Hemson's 2012 population forecasts. The
Crombie report of 2015 was (understandably) concerned about falling, rather than rising, population
growth from international sources. The report makes no mention of international students at all. The
2017 Growth Plan was not updated to reflect the changes in international student rules in 2014, and the
introduction of Express Entry in 2015, choosing to instead to use population forecasts from 2012-13,
which predate those reforms. And these trends are still poorly understood today, with a December 2021
46 Hemson (2020b) 47 CanadaVisa (2021) 48 Government of Canada (2021) 49 Government of Canada (2008)

30
Auditor General's report (correctly) acknowledging the difficulty in making population forecasts but
framing the discussion of immigration forecasts being too high rather than too low:50
The gap between actual and forecast growth can be due to a number of factors that are beyond
municipalities' control, such as an erroneous methodology or assumptions in calculating growth
forecasts, a prolonged economic downturn, restrictive immigration policies and people's
preferences about where to live.
For Hemson to have accurately forecasted population growth from international sources in 2012, they
would have needed to anticipate the 2014 reforms to off-campus work rules for international students,
the introduction of the Express Entry system, and then estimate the impact those would have on
population growth. That is an exceptionally tall order, particularly considering that the effects of past
policy changes are still poorly understood, as shown by the Auditor General's report. Developing
accurate long-run forecasts in an environment of rapid policy changes is a Herculean task. It illustrates
the need for more regularly updated forecasting, along with uncertainty built into existing forecasts.
These out-of-date forecasts underestimated the need for housing within the GTAH, leading to an
accelerated exodus of young families to the Outer Ring of the GGH and out of the GGH entirely. This
exodus created lasting economic harm to the GTAH.
The economic burden of the GTAH's housing shortages
A lack of housing options and an exodus of young families from the GTAH have negative economic
consequences. In a 2021 report titled The Cost of Inaction, the Toronto Region Board of Trade (TRBOT)
estimated the housing "affordability crisis" due to a shortage of housing costs the GTA51 between $5.88
and $7.98 billion per year. These costs come from various sources, including families driving until they
qualify out of the GTA. The breakdown of estimated costs are as follows:
- $3.05 billion in lost economic output due to workers driving until they qualify outside of the
GTA.
- $2.0-2.8 billion in additional wages paid to existing GTA workers to compensate for higher
regional housing costs.
- $0.18 billion in additional costs due to the need for increased employer recruitment to hire
workers lost to drive until you qualify.
- $0.65-$1.95 billion in lost productivity from workers commuting longer distances from home
to work due to a lack of local housing.
These costs are likely underestimated, as additional costs are not considered in this analysis, such as the
additional greenhouse gas emissions from those longer commutes and the loss of farmland and
wetlands. And those economic costs will rise in the future; a second TRBOT report, titled Priced Out52,
examines the jobs likely to be created in the warehousing, distribution, and cleantech manufacturing
industries in the GTAH that may go unfilled due to a lack of housing. The region must have an adequate
50 Office of the Auditor General of Ontario (2021) 51 Which TROBOT defines as the Toronto CMA (Census Metropolitan Area) 52 Moffatt, Atiq, and Islam (2021)

31
supply of housing to attract and retain talent, including the skilled trades workers needed to build that
necessary housing.
The issue is a lack of policy coherence, not immigration
Given the housing shortage, we do not doubt that some will conclude that the problem is that
immigration levels are too high. They will argue that the GTAH could solve the housing supply issue by
simply reducing immigration targets. We believe this is a gross misreading of the situation and would
cause substantial economic harm. It misses the mark for four reasons:
1. Increased immigration targets did not primarily cause Ontario's increased population growth.
There were several causes, the largest and most important of which was a series of federal
policy changes that increased the number of international students and graduates residing in
Canada.
2. There are substantial benefits to having international talent obtain their credentials in Canada
before gaining immigration status due to difficulties assessing the value of foreign credentials.
3. Ontario's Growth Plan is built on a population growth forecast, and that forecast did not account
for increased population growth. Had Ontario's Growth Plan anticipated higher levels of
population growth or had a contingency buffer, an adequate supply of housing could have been
built in the GTAH to accommodate this growth.53
4. Immigration is necessary for the competitiveness of the GTAH and to ensure an adequate supply
of skilled labour to offset population ageing.
Offsetting population ageing is particularly important to Canada's economy. A 2019 study by the
Conference Board of Canada54 estimates that between 2018 and 2040, 13.4 million workers will leave
the Canadian labour force due to population ageing, but only 11.8 million Canadians will leave school
and join the labour force, a gap of 2.2 million workers. The report suggests that gradually increasing
Canada's immigration rate to 1 percent of the population (from the current 0.8 percent level) would
"contribute some 5.3 million workers to the labour force and one-third of the economic growth rate
between 2018 and 2040."
Immigration also plays a crucial role in innovation. A December 2021 report by Canada's Century
Initiative55 finds that despite immigrants making up only 22 percent of Canada's population, they are
founders or co-founders of one-third of Canada's high-growth private tech companies. Given the
importance of the tech industry to the prosperity of the GTAH, trying to solve the housing shortage
through reduced immigration would be simply trading one problem for another. Instead, the solution
53 A counter argument to this point is that the Growth Plan, and the population forecasts that underpin it, play no role in the amount of housing that actually gets built in the GTAH, and that higher population forecasts would not have had a meaningful effect in changing the amount of housing that was built. We share the viewpoint of the Crombie panel of the importance of these forecasts and that they do play a meaningful role. With that in mind, we do believe it is worth examining the utility that population forecasts play in planning, to determine their usefulness. 54 McArthur-Gupta, El-Assal, and Bajwa (2019) 55 Century Initiative (2021)
32
should be to find ways to improve our forecasting and planning processes to accommodate higher
population growth rates.
Drive until you qualify: Quantifying the role the housing shortage played in the exodus from the GTAH
The narrative so far in this report can be summarized as follows:
1. Between 2016 and 2021, the population grew faster than forecast due to higher growth from
international sources than in 2012’s forecast.
2. Despite this rapid population growth, the number of housing units in the GTAH is below 2012's
forecasts.
3. Increased population growth coupled with a smaller than forecasted housing stock caused
existing GTAH residents to drive until you qualify to other parts of the province.
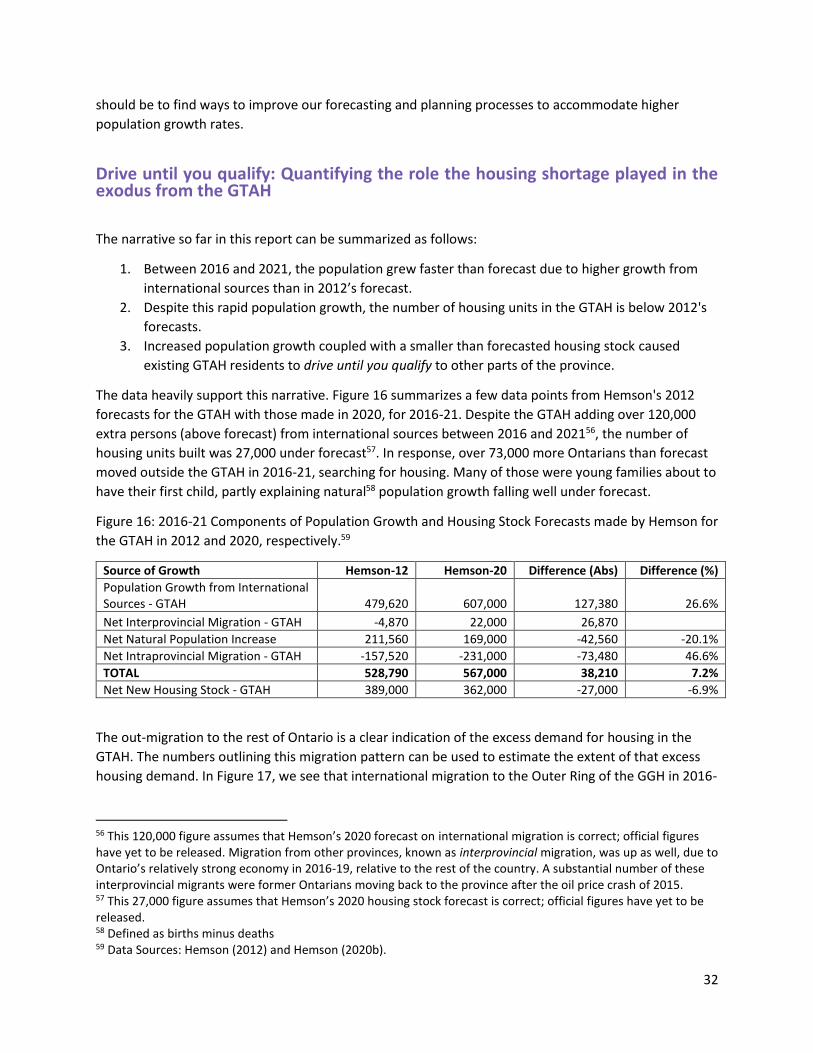
The data heavily support this narrative. Figure 16 summarizes a few data points from Hemson's 2012
forecasts for the GTAH with those made in 2020, for 2016-21. Despite the GTAH adding over 120,000
extra persons (above forecast) from international sources between 2016 and 202156, the number of
housing units built was 27,000 under forecast57. In response, over 73,000 more Ontarians than forecast
moved outside the GTAH in 2016-21, searching for housing. Many of those were young families about to
have their first child, partly explaining natural58 population growth falling well under forecast.
Figure 16: 2016-21 Components of Population Growth and Housing Stock Forecasts made by Hemson for
the GTAH in 2012 and 2020, respectively.59
Source of Growth Hemson-12 Hemson-20 Difference (Abs) Difference (%) Population Growth from International Sources - GTAH 479,620 607,000 127,380 26.6%
Net Interprovincial Migration - GTAH -4,870 22,000 26,870 Net Natural Population Increase 211,560 169,000 -42,560 -20.1% Net Intraprovincial Migration - GTAH -157,520 -231,000 -73,480 46.6% TOTAL 528,790 567,000 38,210 7.2% Net New Housing Stock - GTAH 389,000 362,000 -27,000 -6.9%
The out-migration to the rest of Ontario is a clear indication of the excess demand for housing in the
GTAH. The numbers outlining this migration pattern can be used to estimate the extent of that excess
housing demand. In Figure 17, we see that international migration to the Outer Ring of the GGH in 2016-
56 This 120,000 figure assumes that Hemson’s 2020 forecast on international migration is correct; official figures have yet to be released. Migration from other provinces, known as interprovincial migration, was up as well, due to Ontario’s relatively strong economy in 2016-19, relative to the rest of the country. A substantial number of these interprovincial migrants were former Ontarians moving back to the province after the oil price crash of 2015. 57 This 27,000 figure assumes that Hemson’s 2020 housing stock forecast is correct; official figures have yet to be released. 58 Defined as births minus deaths 59 Data Sources: Hemson (2012) and Hemson (2020b).

33
21 was 150% higher than forecast, and migration out of the GGH to the rest of the province was almost
200% higher than forecast.
Figure 17: 2016-21 Components of Population Growth made by Hemson for the GTAH in 2012 and 2020,
respectively.60
Source of Growth Hemson-12 Hemson-20 Difference (Abs) Difference (%) Population Growth from International Sources - Outer Ring 32,500 81,000 48,500 149.2% Net Intraprovincial Migration - Outer Ring 121,500 125,000 3,500 2.9% Net Intraprovincial Migration - Rest of Ontario 36,020 106,000 69,980 194.3%
Unfortunately, Hemson-12 does not break down forecasted population growth into immigration and
non-permanent residents. This matters as the age and location profiles of the two groups differ, which
affects the demand for housing in terms of quantities and locations. Arriving non-permanent residents
are primarily international students in their late teens and early twenties and tend to live in proximity to
a college or university. Immigrants have a much more diverse age profile, with the largest groups being
in their late 20s and early 30s.
While this lack of data and disclosure does pose limitations, with the information that is provided, we
can estimate excess demand for housing in the GTAH.
Estimating past excess demand for housing in the GTAH
Excess demand for housing can be resolved in several ways, including out-migration to other parts of the
province, particularly unforecasted out-migration. We can use out-migration data, particularly out-
migration that was higher than forecast, to provide a conservative estimate for the excess demand for
housing in the GTAH.
This intraprovincial out-migration data provides us with a place to start creating excess demand
estimates for the GTAH by asking: How many homes would we need for out-migration from the GTAH to
return to historical norms?
To create an estimate of excess demand, we need a methodology to convert population estimates into
estimates of the number of households (and, by extension, the number of housing units). As described
in Baby Needs a New Home, there is not a simple formula to do so, as housing needs are highly
dependent on the age of the persons being added to the population:61
The relationship between population growth and household formation (and thereby housing
demand) is not straightforward. A family having a second child adds to the province's
population, though it does not change the number of households in the province, whereas a
person moving out of their parents' house into their first apartment in the same city does not
raise the province's population, but it increases the number of households by one. And finally,
60 Data Sources: Hemson (2012) and Hemson (2020b). 61 Moffatt (2021a)
34
the expectation of a family's first child may not change the number of households but does
change the type of home in which they wish to live.
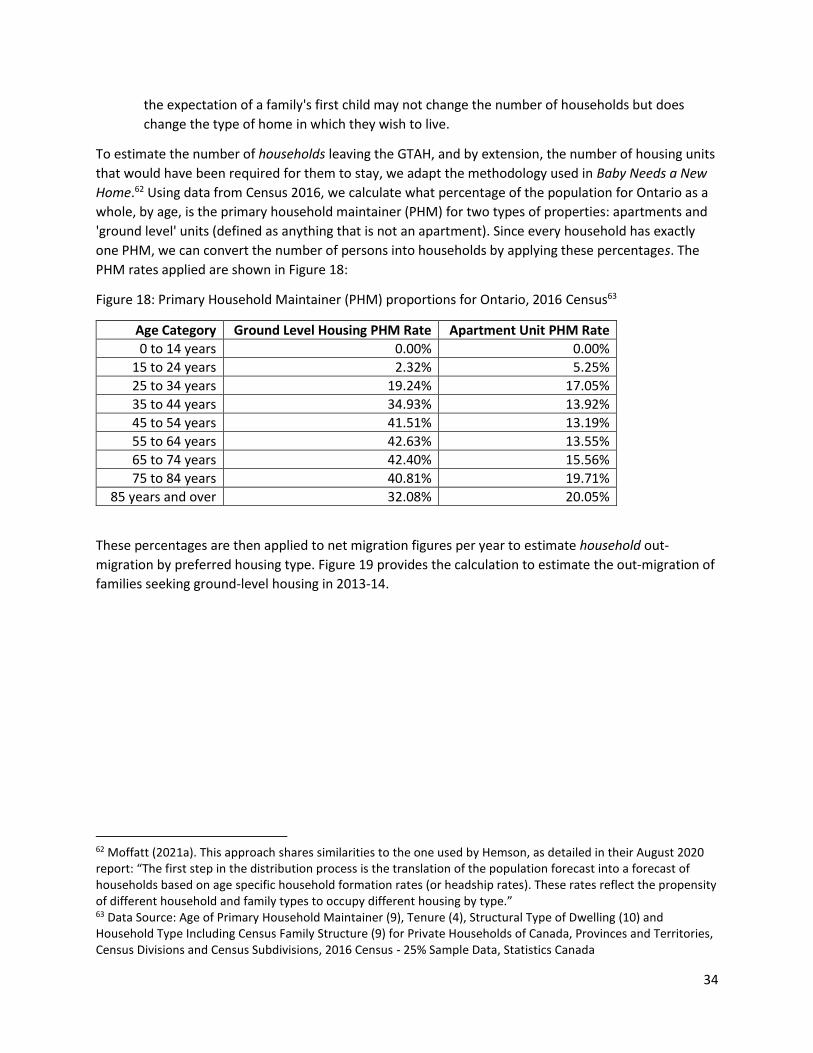
To estimate the number of households leaving the GTAH, and by extension, the number of housing units
that would have been required for them to stay, we adapt the methodology used in Baby Needs a New
Home.62 Using data from Census 2016, we calculate what percentage of the population for Ontario as a
whole, by age, is the primary household maintainer (PHM) for two types of properties: apartments and
'ground level' units (defined as anything that is not an apartment). Since every household has exactly
one PHM, we can convert the number of persons into households by applying these percentages. The
PHM rates applied are shown in Figure 18:
Figure 18: Primary Household Maintainer (PHM) proportions for Ontario, 2016 Census63
Age Category Ground Level Housing PHM Rate Apartment Unit PHM Rate
0 to 14 years 0.00% 0.00%
15 to 24 years 2.32% 5.25%
25 to 34 years 19.24% 17.05%
35 to 44 years 34.93% 13.92%
45 to 54 years 41.51% 13.19%
55 to 64 years 42.63% 13.55%
65 to 74 years 42.40% 15.56%
75 to 84 years 40.81% 19.71%
85 years and over 32.08% 20.05%
These percentages are then applied to net migration figures per year to estimate household out-
migration by preferred housing type. Figure 19 provides the calculation to estimate the out-migration of
families seeking ground-level housing in 2013-14.
62 Moffatt (2021a). This approach shares similarities to the one used by Hemson, as detailed in their August 2020 report: “The first step in the distribution process is the translation of the population forecast into a forecast of households based on age specific household formation rates (or headship rates). These rates reflect the propensity of different household and family types to occupy different housing by type.” 63 Data Source: Age of Primary Household Maintainer (9), Tenure (4), Structural Type of Dwelling (10) and Household Type Including Census Family Structure (9) for Private Households of Canada, Provinces and Territories, Census Divisions and Census Subdivisions, 2016 Census - 25% Sample Data, Statistics Canada

35
Figure 19: Estimated Net Number of Net Intraprovincial Outmigrating Ground-Level Housing Households
from the GTAH, 2013-14.64
Age Category Ground Level Housing PHM Rate
Net Migration (Individuals)
Number of Households for
Ground Level Housing
15 to 24 years 2.32% -247 -6
25 to 34 years 19.24% -2,530 -487
35 to 44 years 34.93% -1,832 -640
45 to 54 years 41.51% -4,770 -1,980
55 to 64 years 42.63% -3,339 -1,423
65 to 74 years 42.40% -1,558 -661
75 to 84 years 40.81% -590 -241
85 years and over 32.08% -128 -41
TOTAL -5,478
Our estimates for the number of households out-migrating from the GTAH to other parts of the province
are contained in Figure 20. From 2006-07 to 2014-15, an average of 6,000 households left the GTAH for
other parts of Ontario, occupying 4,366 ground-level housing units and 1,662 apartment units. In the
five years between 2015-16 to 2019-20, the average increased to over 15,000 households, with an
estimated 10,893 of those households occupying ground-level units and an additional 4,742 occupying
apartment units.
64 Data Source: Author’s Calculation

36
Figure 20: Excess Demand for Housing, by Housing Type and Year, for the GTAH.65
This report will use this estimate of household out-migration as a proxy for excess demand for the
GTAH. That is, we estimate that in 2019-20, 15,503 households, on net, left the GTAH to move to other
parts of the province; thus, our estimate for the excess of demand for housing in 2019-20 is 15,503.
The concept of excess demand is inherently subjective because the term excess is a relative one, and the
choice of the baseline is inherently subjective. This paper will only examine excess demand above that
already forecasted. We will only be considering excess demand for housing above the baseline
established in Hemson-20.
Taken as a whole, this method of estimating excess demand is inherently conservative, as it ignores the
other ways excess demand could manifest itself. Instead of moving out of the GTAH, a lack of housing
could cause younger people to live with family members longer than create new households or live in
overcrowded conditions. Out-migration, however, is significant due to the economic consequences of
drive until you qualify.
65 Data Source: Author’s Calculation. Populations (and changes) measured from July 1 of each year, so on the above graph ‘2015’ refers to the changes that occurred between July 1, 2014 and July 1, 2015. 65 Hemson (2020b)
-3,285 -3,544 -2,868 -4,272 -3,839 -4,728 -4,763 -5,478 -6,517-9,130
-12,170-11,949-10,489-10,727-1,173 -1,299
-951-1,618 -1,437
-1,818 -1,875-2,165
-2,622
-3,748
-5,254 -5,236-4,668 -4,803
-20,000-18,000-16,000-14,000-12,000-10,000-8,000-6,000-4,000-2,000
02007 2008 2009 2010 2011 2012 2013 2014 2015 2016 2017 2018 2019 2020
GTAH Housing Demand Lost Due to Net Intraprovincial Migration by Type
Ground Level Apartments

37
How can we avoid future housing shortages?
To avoid future housing shortages, the housing supply must keep up with population growth and make
up for past housing shortfalls. The Smart Prosperity Institute report, Baby Needs a New Home66,
provides housing demand projections based on Ministry of Finance population projections by age and
sex. It finds that nearly 1,000,000 net new homes will need to be built in the next ten years across
Ontario to keep up with net new household formations and pent-up demand, as shown by Figure 21:
Figure 21: Projected Housing Demand in Ontario, 2021-203167
Years Projected Net New Household Formations
New Housing Completions (As of July 1, 2021) Difference
2016-21 413,753 349,039 64,714 2021-26 489,947 489,947 2026-31 421,400 421,400 TOTAL 1,325,100 349,039 976,061
It is important to note that these are net new households, so they include generational housing
turnover, as shown by Figure 22. The report projects that 1.48 million new households will be formed by
families where the head-of-household is currently under the age of 55, which will be offset by a loss of
approximately 570,000 households where the current head-of-household is over the age of 55.
Figure 22: Projected Household Formation in Ontario: 2021 to 2031
Age TOTAL
Net New Households (Under 55) 1,480,644
Net New Households (55+) -569,297
Total Net New 911,347
The net new household formation estimates (and thus the housing demand estimates) were calculated
for each of Ontario's 49 Census Divisions in five-year periods between 2016 and 2046. Figure 23 gives
the estimates for the GTAH along with Simcoe Census Division.
66 Moffatt (2021a). 67 Moffatt (2021a)

38
Figure 23: Net New Households by Census Division68
Census Division 2016-21 2021-26 2026-31 2031-36 2036-41 2041-46 Toronto 82,107 115,711 87,243 81,155 73,005 67,553 Durham 21,361 21,492 21,688 21,232 20,113 18,592 Halton 20,681 23,914 25,747 26,254 25,943 24,951 Peel 45,036 59,573 55,809 55,409 53,639 51,956 York 29,207 30,951 31,317 29,977 28,505 26,353 Hamilton 14,797 17,337 16,207 16,102 15,874 15,202 Simcoe 22,119 21,980 19,712 18,542 17,182 15,729
Although planning is based on Hemson population forecasts, the Baby Needs a New Home report used
Ministry of Finance population estimates to construct housing demand projections. The choice to use
Ministry population estimates was due to data availability; the Ministry of Finance publicly discloses the
population estimates, by age and sex, necessary for this analysis, whereas Hemson does not. Using
Finance data was necessary, but it was not ideal, as the Growth Plan is based on the Hemson numbers.
The report acknowledges this and discusses the differences that using Ministry of Finance numbers
causes69:
The Ministry of Finance sees a much faster rise in population growth in Toronto and Peel,
whereas Hemson, which considers housing supply, sees much higher growth occurring on the
periphery of the GTA, due, in part, to drive until you qualify. The total population growth for the
Greater Golden Horseshoe region in the Hemson report is 210,008 lower than in the Ministry of
Finance numbers, likely due to families driving until they qualify to other parts of the province.
Despite the slower population growth in the Greater Golden Horseshoe, Hemson forecasts the
supply of units to be 27,977 higher than the projected demand. The mismatch is due to the type
of units being produced. Hemson's forecasts involve the construction of smaller, one-person
units to be built.
This difference in the type of units is clearly illustrated by the difference in net new people per
new unit. Hemson forecasts that there will be 2.18 people per new unit, while the supply
projection indicates that the demand is for 2.59 people per new unit. In Hemson's forecast, new
households in the Greater Golden Horseshoe (GGH) area are smaller, due to a combination of
individuals living in smaller units (rather than coming together as a single household in a larger
unit) and families with children having to drive until they qualify to other parts of the province to
find family-friendly housing.
This report builds on Baby Needs a New Home and seeks to address the issues caused by using Ministry
of Finance projections by constructing a demographic model for the GTAH, based on Hemson's
population forecasts, to allow us to create housing demand forecasts that align with the assumptions
underpinning the Growth Plan. Furthermore, we go a step further than Baby Needs a New Home by
68 Moffatt (2021a) 69 Moffatt (2021a)
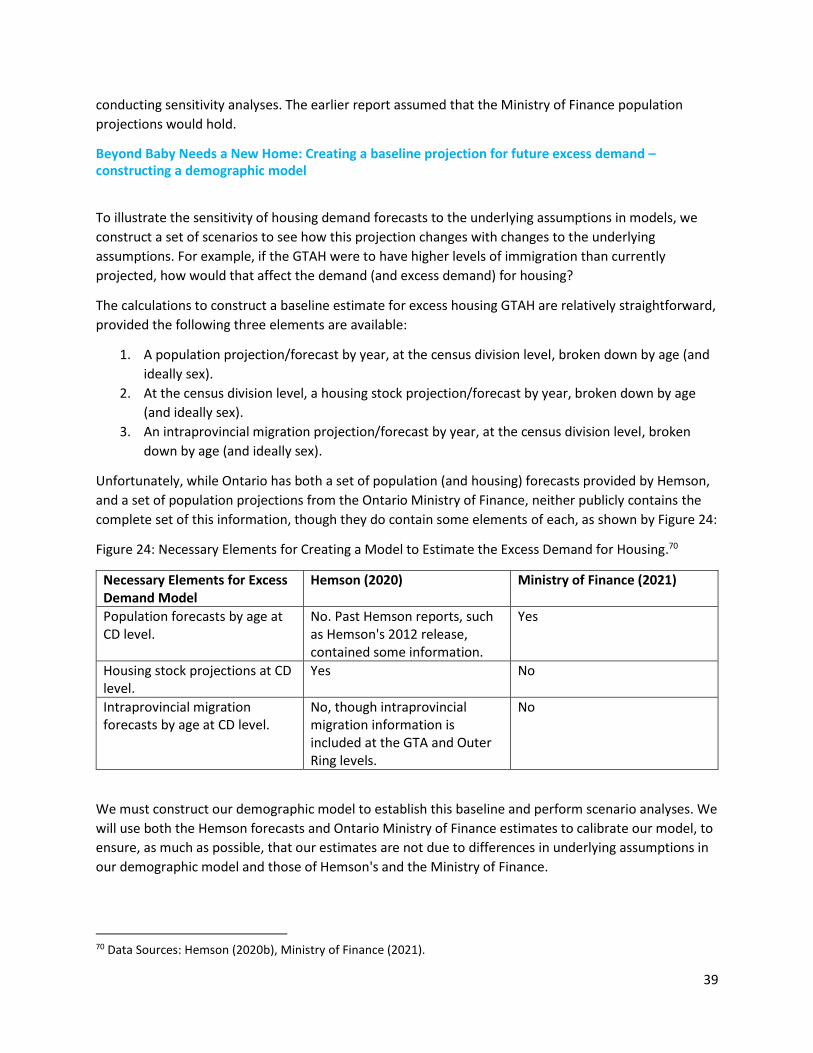
39
conducting sensitivity analyses. The earlier report assumed that the Ministry of Finance population
projections would hold.
Beyond Baby Needs a New Home: Creating a baseline projection for future excess demand – constructing a demographic model
To illustrate the sensitivity of housing demand forecasts to the underlying assumptions in models, we
construct a set of scenarios to see how this projection changes with changes to the underlying
assumptions. For example, if the GTAH were to have higher levels of immigration than currently
projected, how would that affect the demand (and excess demand) for housing?
The calculations to construct a baseline estimate for excess housing GTAH are relatively straightforward,
provided the following three elements are available:
1. A population projection/forecast by year, at the census division level, broken down by age (and
ideally sex).
2. At the census division level, a housing stock projection/forecast by year, broken down by age
(and ideally sex).
3. An intraprovincial migration projection/forecast by year, at the census division level, broken
down by age (and ideally sex).
Unfortunately, while Ontario has both a set of population (and housing) forecasts provided by Hemson,
and a set of population projections from the Ontario Ministry of Finance, neither publicly contains the
complete set of this information, though they do contain some elements of each, as shown by Figure 24:
Figure 24: Necessary Elements for Creating a Model to Estimate the Excess Demand for Housing.70
Necessary Elements for Excess Demand Model
Hemson (2020) Ministry of Finance (2021)
Population forecasts by age at CD level.
No. Past Hemson reports, such as Hemson's 2012 release, contained some information.
Yes
Housing stock projections at CD level.
Yes No
Intraprovincial migration forecasts by age at CD level.
No, though intraprovincial migration information is included at the GTA and Outer Ring levels.
No
We must construct our demographic model to establish this baseline and perform scenario analyses. We
will use both the Hemson forecasts and Ontario Ministry of Finance estimates to calibrate our model, to
ensure, as much as possible, that our estimates are not due to differences in underlying assumptions in
our demographic model and those of Hemson's and the Ministry of Finance.
70 Data Sources: Hemson (2020b), Ministry of Finance (2021).

40
To calibrate our model, we incorporate elements from both Hemson's population (and housing) forecast
and the Ontario Ministry of Finance's population projections, along with past migration trends. In
practice, reconciling the two is quite difficult for two reasons. The first is that Hemson's numbers are a
forecast, which incorporates restrictions on housing construction, such as the availability of land. In
contrast, the Ontario Ministry of Finance numbers project past trends into the future and do not apply
housing constraints. Secondly, the two make very different assumptions regarding population growth.
These differences become apparent when examining overall population levels for the GTAH. As shown
by Figure 25, the 2026-46 population projections from the Ministry of Finance for the GTAH are
consistently higher than the forecasts provided by Hemson.
Figure 25: Population Forecasts for the GTAH, Ministry of Finance's 2021 Population Projection and
Hemson's 2020 Forecast71
Year Ministry of Finance Hemson-20 Difference
2026 8,416,709 8,332,000 84,709
2031 9,021,605 8,882,000 139,605
2036 9,611,504 9,437,000 174,504
2041 10,186,892 10,003,000 183,892
2046 10,747,394 10,588,000 159,394
Until 2041, the Ontario Ministry of Finance projects higher population growth, in terms of absolute
numbers, than Hemson, with the most significant differences between the two arising in the 2021-26
period, as shown by Figure 26.
71 Data Sources: Ontario Ministry of Finance (2021) and Hemson (2020b).
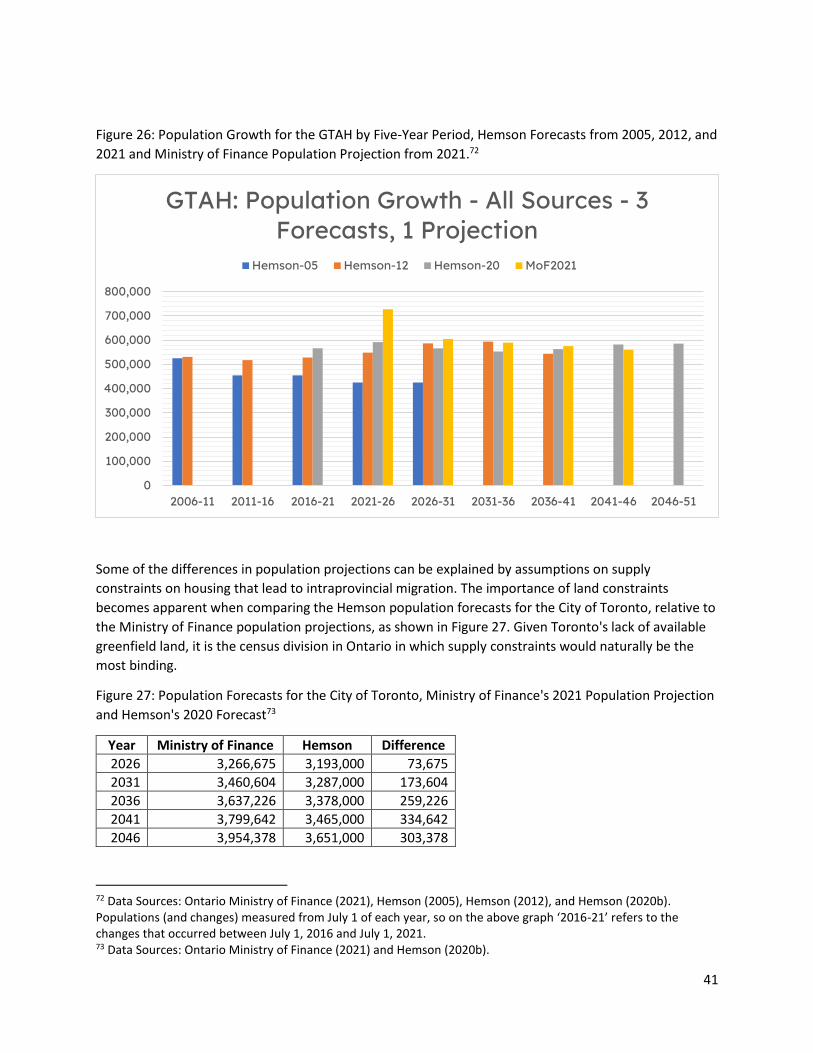
41
Figure 26: Population Growth for the GTAH by Five-Year Period, Hemson Forecasts from 2005, 2012, and
2021 and Ministry of Finance Population Projection from 2021.72
Some of the differences in population projections can be explained by assumptions on supply
constraints on housing that lead to intraprovincial migration. The importance of land constraints
becomes apparent when comparing the Hemson population forecasts for the City of Toronto, relative to
the Ministry of Finance population projections, as shown in Figure 27. Given Toronto's lack of available
greenfield land, it is the census division in Ontario in which supply constraints would naturally be the
most binding.
Figure 27: Population Forecasts for the City of Toronto, Ministry of Finance's 2021 Population Projection
and Hemson's 2020 Forecast73
Year Ministry of Finance Hemson Difference
2026 3,266,675 3,193,000 73,675
2031 3,460,604 3,287,000 173,604
2036 3,637,226 3,378,000 259,226
2041 3,799,642 3,465,000 334,642
2046 3,954,378 3,651,000 303,378
72 Data Sources: Ontario Ministry of Finance (2021), Hemson (2005), Hemson (2012), and Hemson (2020b). Populations (and changes) measured from July 1 of each year, so on the above graph ‘2016-21’ refers to the changes that occurred between July 1, 2016 and July 1, 2021. 73 Data Sources: Ontario Ministry of Finance (2021) and Hemson (2020b).
0
100,000
200,000
300,000
400,000
500,000
600,000
700,000
800,000
2006-11 2011-16 2016-21 2021-26 2026-31 2031-36 2036-41 2041-46 2046-51
GTAH: Population Growth - All Sources - 3 Forecasts, 1 Projection
Hemson-05 Hemson-12 Hemson-20 MoF2021

42
The distinction between a projection and a forecast is essential here. The Ontario Ministry of Finance
numbers takes existing population trends and projects them into the future. Hemson, on the other
hand, incorporates a broader set of variables to create a forecast. Hemson (2020) describes the
difference as follows74:
[M]ethodological differences result in somewhat different population outlooks in some parts of
the [Greater Golden Horseshoe] GGH. The key difference is that the Ministry of Finance
projections assume that population growth will reflect recent migration trends and the
continuing evolution of long-term fertility and mortality patterns. They do not explicitly account
for long-term structural changes in the economy, housing market demand, and Provincial
policies, plans, and investment that seek to influence the form and location of development in
the GGH.
The different approach explains why, for example, Ministry of Finance projections for Peel
Region, which has a relative shortage of land for new housing, are typically higher than the
[Hemson-based] Schedule 3 forecasts. Similarly, the Schedule 3 employment forecasts for
Durham Region, where A Place to Grow policies seek to increase the mix of people and jobs and
significant investment in Federal, Provincial, and municipal infrastructure is planned, tend to be
higher than Ministry of Finance projections.
The Hemson figures are likely assuming higher levels of out-migration from the GTAH than the Ontario
Ministry of Finance.75
Another likely source of differences is the future path of net international migration. A direct head-to-
head comparison is impossible, as Hemson only publishes net international migration forecasts at the
GTAH and Outer Ring levels. In contrast, the Ontario Ministry of Finance only publishes net international
migration forecasts at the province-wide level. While an apples-to-apples comparison is impossible, it is
noteworthy that the Hemson numbers show international migration rising after 2031. In contrast, the
Ontario Ministry of Finance does not, as shown in Figure 28.
Figure 28 Population Growth through International Migration, Five-Year Periods, Hemson's 2020
Forecast and Ontario Ministry of Finance's 2021 Projection.76
Period Hemson - GTAH Hemson - Outer Ring
Ministry of Finance - Ontario-Wide
Ontario Minus Hemson (Total)
2021-26 639,000 47,000 1,093,656 407,656
2026-31 600,000 35,000 851,716 216,716
2031-36 628,000 38,000 845,209 179,209
2036-41 662,000 40,000 847,289 145,289
2041-46 695,000 42,000 846,697 109,697
74 Hemson (2020b) 75 The Ontario Ministry of Finance does not release intraprovincial migration projections. 76 Data Sources: Ontario Ministry of Finance (2021) and Hemson (2020b).

43
These numbers are a bit of an apples-to-oranges comparison since the Ontario Ministry of Finance
numbers include parts of Ontario outside of the Greater Golden Horseshoe. In contrast, the Ontario
Ministry of Finance does not. However, for these numbers not to be contradictory, it would require the
rest of Ontario to experience a rapid secular decline in international in-migration. There is no reason
why this should be true. Instead, the differences appear to stem from Hemson assuming immigration
targets will continue to rise over time and the Ontario Ministry of Finance keeping immigration targets
at existing levels.
The significant discrepancy for the international migration numbers in 2021-26 appears to be due to
differences in assumptions around the growth in the number of international students. In the 2021-26
period, Finance is projecting that net non-permanent residents (primarily international students) will
grow by roughly 340,000 persons. Historically, 50-60% of Ontario's non-permanent residents settle in
the GTAH, giving an estimate of between 170,000 and 204,000 net new non-permanent residents to the
region. However, Hemson is forecasting the GTAH population to grow by roughly 100,000 during that
period, a difference of roughly 100,000 persons. The disconnect between the Ministry of Finance
population projections and Hemson population forecasts is not new. In 2015, the Crombie report
acknowledged how the two often diverge and recommended they be better aligned.77
These details illustrate the difficulty in creating population projections and forecasts and the need to
build contingency buffers into housing plans. If the Ministry of Finance's projections prove prescient,
and in 2026 the GTA has 100,000 more international students than forecasted by Hemson, then
additional housing will be required. Given that this housing cannot be built overnight, it is prudent to
incorporate contingencies into the planning process.
How much larger could the housing shortages become? Constructing our sensitivity analyses
Because of the economic, social, and environmental costs of not building enough housing in the GTAH
and Simcoe census division, we believe it is necessary to conduct a set of scenario analyses to show a
range of potential futures. We are not suggesting that these scenarios are necessarily more likely than
Hemson's baseline forecast; simply that these are highly plausible and should be considered by
planners. Government budgets build in contingency margins and conduct sensitivity analyses on
questions such as What if interest rates are higher than forecast? We believe planning processes should
also build in contingency and conduct sensitivity analyses, whether in the Growth Plan or the municipal
level.
There are two broad ways that forecasts could be 'off' leading to an increase in excess demand for
housing. Either housing completions are lower than forecast, or population growth is higher. There are
several plausible ways that the population of the GTAH and Simcoe could grow faster than current
forecasts. These include, but are not limited to:
77 Government of Ontario (2015)

44
- An influx of residents due to climate change, which could include, but is not limited to, new
residents moving in from British Columbia to escape wildfires, as well as increased numbers
of refugees from outside of Canada.
- An increase in the number of Canadians moving to Ontario for economic reasons.
- An increase in life expectancy.
- Reduced net out-migration to the rest of Ontario.
- An increase in the birth rate.
Policymakers should be aware of these possibilities when planning. There are two sets of scenarios that
we believe warrant particular consideration as they have a high probability of occurring:
1. Canada's immigration targets have risen over time, and Ontario's share of immigrants has risen
in recent years, causing immigration to Ontario to rise faster than previous trends. What if this
continues?
2. Ontario has experienced a boom in international students, causing the population of net non-
permanent residents to rise. Eventually, the number of non-permanent residents will reach a
critical mass where the number of new international students plateaus and the number of
international students entering the system is close to the number of leaving the system, causing
overall net growth to be near zero. There is a disagreement between Hemson’s population
forecast and the Ministry of Finance’s population projection on how big the international
student population will get and how long it will take to plateau, with the Ministry of Finance
projecting a higher level of growth from net non-permanent residents. What if the international
student boom lasts longer than Hemson forecasts?
These two sets of scenarios differ in some critical ways. In the immigration scenarios, additional persons
are added to the population each year for the next 30 years, causing yearly population growth to be
consistently higher than current forecasts. In the international student scenarios, most of the additional
population growth happens over the next decade. However, the population continues to rise somewhat
after that, as the new residents form families and have children.
The two sets of scenarios also differ in the composition of new arrivals, with international student
growth skewing younger, as most are in their late teens or early 20s. This affects the form and amount
of housing demand, as students typically live in more crowded conditions. It also affects the timing of
forming new households and having children. These details illustrate why it is not simply enough to have
high and low population forecasts (to accompany the reference forecast) as Hemson does. We need to
know the demographic composition of the additional residents to estimate their demand for housing
over time.
The type of additional population growth also affects where in the GTAH the additional demand will be.
Figure 29 provides data for the five-year 2015-20 period on the proportion of immigrants and non-
permanent residents that settle in each census division.

45
Figure 29: Proportion of immigrants and non-permanent residents (NPRs) that settle in each census
division, as a percentage of Ontario as a whole.78
Census Division Immigration Proportion NPR Proportion
Durham 2.32% 1.73%
Halton 3.97% 1.60%
Hamilton 2.49% 3.42%
Toronto 38.25% 25.62%
Peel 24.75% 21.07%
York 8.75% 4.46%
GTAH Total 80.53% 57.92%
Simcoe 0.82% 2.07%
Rest of Ontario (excl. GTAH and Simcoe) 18.64% 40.01%
To know more about the additional residents in our set of scenarios, we construct a demographic model
using the publicly available information from the Hemson-20 forecast. We can use this model to
construct population pyramids for each of the GTAH's six census divisions and Simcoe census division
and forecast excess housing demand.
We can then conduct a sensitivity analysis to address population growth from immigration and
international students and housing completions falling under forecast with our baseline established. We
believe these are reasonable questions to ask, given that for the 2016-21 period, international
population growth was 27% higher, and net new housing stock was 7% lower in Hemson-20 relative to
Hemson-12. Furthermore, the Ministry of Finance projects that the GTAH’s population in 2021-26 will
grow by nearly 730,000 persons, while Hemson’s forecast pegs the difference at under 600,000, a
difference of 23 percent.79 As such, we believe that a sensitivity analysis is not just prudent but
necessary.
In our first set of sensitivity analyses, we ponder the question, “what if immigration is higher than
existing forecasts?”
Sensitivity analysis: Immigration higher than forecast
To answer this question, we first need the current immigration forecasts. Unfortunately, Hemson-20
does not provide numerical values for net international migration to the GTAH, broken down by
immigration and non-permanent residents. Fortunately, however, they provide a small bar graph with
these details on page 11 of their report, which allows for a visual estimation. Based on that graph, we
78 Data Source: Statistics Canada Table 17-10-0140-01. 79 While the 2021-26 growth figures differ by more than 130,000 it is noteworthy that the Ministry of Finance’s 2026 total population projection for the GTAH is only 84,709 persons higher than that forecast in Hemson-20. This is due to differences in estimates of the population growth of the GTAH in 2020-21. Not only do the two differ on what will happen in the future, they also differ on what happened in the past.
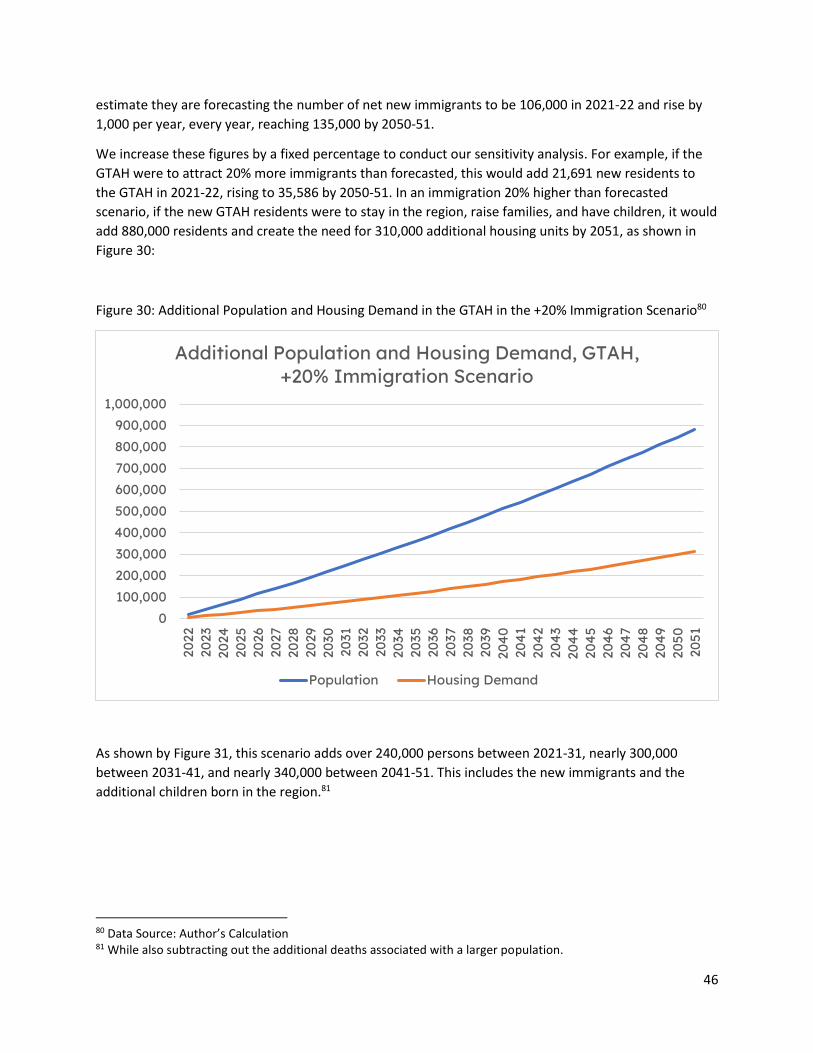
46
estimate they are forecasting the number of net new immigrants to be 106,000 in 2021-22 and rise by
1,000 per year, every year, reaching 135,000 by 2050-51.
We increase these figures by a fixed percentage to conduct our sensitivity analysis. For example, if the
GTAH were to attract 20% more immigrants than forecasted, this would add 21,691 new residents to
the GTAH in 2021-22, rising to 35,586 by 2050-51. In an immigration 20% higher than forecasted
scenario, if the new GTAH residents were to stay in the region, raise families, and have children, it would
add 880,000 residents and create the need for 310,000 additional housing units by 2051, as shown in
Figure 30:
Figure 30: Additional Population and Housing Demand in the GTAH in the +20% Immigration Scenario80
As shown by Figure 31, this scenario adds over 240,000 persons between 2021-31, nearly 300,000
between 2031-41, and nearly 340,000 between 2041-51. This includes the new immigrants and the
additional children born in the region.81
80 Data Source: Author’s Calculation 81 While also subtracting out the additional deaths associated with a larger population.
0
100,000
200,000
300,000
400,000
500,000
600,000
700,000
800,000
900,000
1,000,000
2022
2023
2024
2025
2026
2027
2028
2029
2030
2031
2032
2033
2034
2035
2036
2037
2038
2039
204
020
41
204
220
43
204
420
45
204
620
47
2048
204
920
5020
51
Additional Population and Housing Demand, GTAH, +20% Immigration Scenario
Population Housing Demand

47
Figure 31: Additional Population Growth in the GTAH in the +20% Immigration Scenario82
Figure 32 shows a range of potential increased immigration scenarios, from being 1% higher than
forecast to 40% higher. Immigration levels that are one percentage point above the baseline cause the
GTAH’s population to grow by 5,755 persons more than the baseline in 2021-26, leading to the GTAH’s
population being 44,107 persons higher than the baseline by 2051. If immigration rates are 40% higher
than the baseline, the GTAH’s 2051 population will be over 1.7 million persons higher than the baseline.
82 Data Source: Author’s Calculation
1,135,000 1,121,000 1,169,000
246,017 297,912338,204
0
200,000
400,000
600,000
800,000
1,000,000
1,200,000
1,400,000
1,600,000
2021-31 2031-41 2041-51
Additional Population Growth by Decade, GTAH, +20% Immigration Scenario
Baseline Additional Population

48
Figure 32: Population Growth, Relative to Baseline, in the GTAH, by 5-Year Periods, for Higher Levels of
Immigration83
Scenario 2021-26 2026-31 2031-36 2036-41 2041-46 2046-51 2051 Population
Relative to Baseline
1% Higher 5,755 6,546 7,193 7,702 8,184 8,726 44,107
5% Higher 28,776 32,728 35,966 38,512 40,921 43,630 220,533
10% Higher 57,552 65,456 71,933 77,023 81,842 87,260 441,066
20% Higher 115,105 130,912 143,865 154,047 163,684 174,521 882,133
40% Higher 230,209 261,824 287,731 308,093 327,367 349,042 1,764,266
The 20% higher scenario is particularly noteworthy, as it leads to an additional 115,105 persons being
added to the GTAH in the next five years. In the 2016-21 period, population growth in the GTAH from
international sources was approximately 120,000 persons higher than the baseline projection set in
Hemson-12. Furthermore, this gap is roughly the same size as the difference between Hemson-20’s
population forecast and the Ministry of Finance’s population projection for 2021-2684. In short, there is
precedent for a miss of this magnitude.
It is important to note that not all of this population growth comes directly from the immigrants
themselves, as an increased population also leads to increased births and deaths. The increased births
play a non-trivial role in the population increase (above baseline) in the GTAH. The population pyramids
of Figure 33 show the increase in the preschool-aged population to be quite substantial in both 2031
and 2041.85
83 Data Source: Author’s Calculation 84 Though the difference between Hemson-20 and the Ministry of Finance is caused more by differences in assumptions involving non-permanent residents than immigrants. 85 In our demographic model, we have assumed that the fertility rates of the new Ontarians are identical to that of existing residents.

49
Figure 33: Population Pyramids, Relative to Baseline, in the GTAH in the +20% Immigration Scenario86
The increase in the number of families leads to increased demand for homes. Using the methodology
described earlier in the paper, we find that if the GTAH attracts 20% more immigrants each year, relative
to the baseline forecast, then by 2051, housing demand should be over 310,000 units higher than
baseline as shown by Figure 34.
86 Data Source: Author’s Calculation
-35,000 -25,000 -15,000 -5,000 5,000 15,000 25,000 35,000
0 to 45 to 9
10 to 1415 to 1920 to 2425 to 2930 to 3435 to 39
40 to 4445 to 4950 to 5455 to 5960 to 6465 to 6970 to 7475 to 7980 to 8485 to 8990 Plus
GTAH: Additional Population in +20% Immigration Scenario, by Age, Sex and Year
2031 M 2031 F 2041 M 2041 F

50
Figure 34: Housing Demand Growth in the GTAH in the +20% Immigration Scenario87
Returning to our range of scenarios, Figure 35 provides housing demand estimates, by five-year periods,
for five different immigration-boosted scenarios. A small bump in immigration only leads to excess
housing demand increasing by a few thousand units per five-year period, whereas in the 40% scenario,
the figure can be over 100,000.
Figure 35: Excess Housing Demand over Baseline, 5 Year Periods, GTAH.88
Scenario 2021-26 2026-31 2031-36 2036-41 2041-46 2046-51 Total 2021-51
1% Higher 1,819 2,149 2,459 2,749 3,035 3,362 15,572
5% Higher 9,094 10,746 12,295 13,743 15,173 16,809 77,859
10% Higher 18,188 21,491 24,589 27,485 30,347 33,617 155,718
20% Higher 36,376 42,982 49,179 54,970 60,693 67,234 311,435
40% Higher 72,753 85,964 98,358 109,941 121,387 134,468 622,870
We also need to consider where in the GTAH this excess demand for housing is likely to occur, noting
that with drive until you qualify, excess demand is not particularly localized, as it spills into the
surrounding region. Keeping that in mind, we estimate the population increase in each of the six census
divisions of the GTAH by considering their share of GTAH immigration from 2015-20. We also add
Simcoe into our analysis. In the 2015-20 period, Simcoe’s immigration levels were just over 1% of the
87 Data Source: Author’s Calculation 88 Data Source: Author’s Calculation
504,000 451,000 432,700
79,358104,149 127,927
0
100,000
200,000
300,000
400,000
500,000
600,000
700,000
2021-31 2031-41 2041-51
Housing Demand Growth by Decade, GTAH, +20% Immigration Scenario
Baseline Housing Demand New Excess Housing Demand
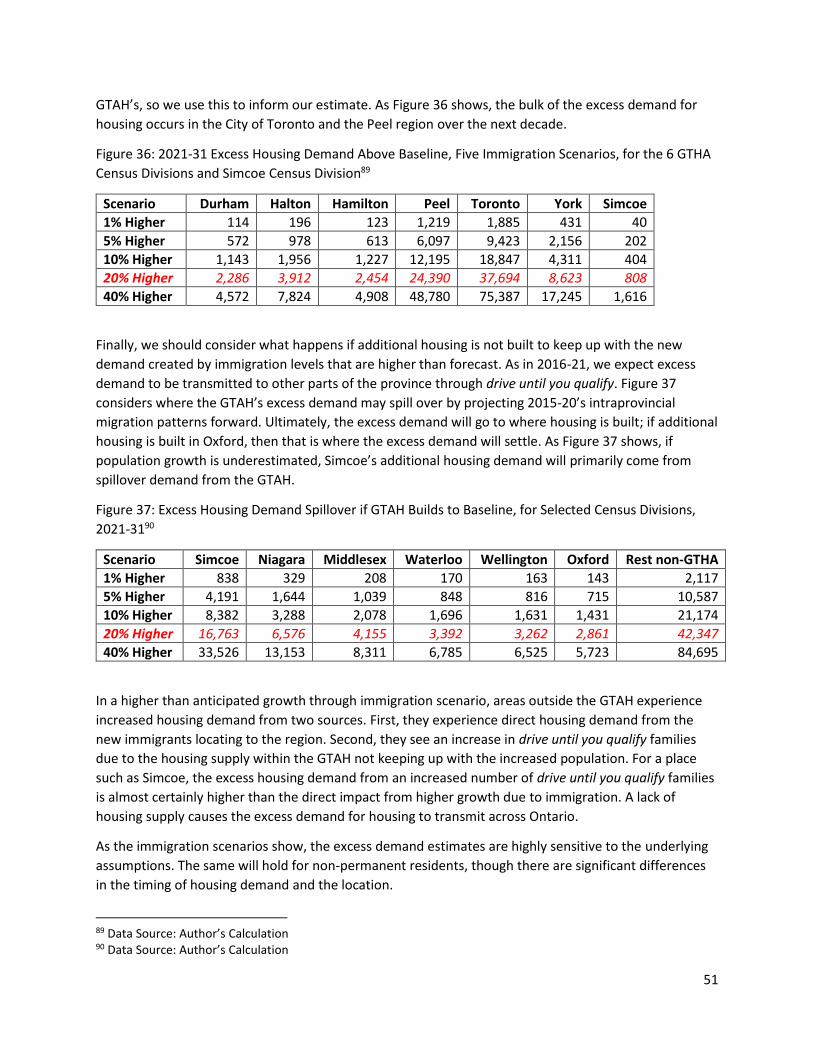
51
GTAH’s, so we use this to inform our estimate. As Figure 36 shows, the bulk of the excess demand for
housing occurs in the City of Toronto and the Peel region over the next decade.
Figure 36: 2021-31 Excess Housing Demand Above Baseline, Five Immigration Scenarios, for the 6 GTHA
Census Divisions and Simcoe Census Division89
Scenario Durham Halton Hamilton Peel Toronto York Simcoe
1% Higher 114 196 123 1,219 1,885 431 40
5% Higher 572 978 613 6,097 9,423 2,156 202
10% Higher 1,143 1,956 1,227 12,195 18,847 4,311 404
20% Higher 2,286 3,912 2,454 24,390 37,694 8,623 808
40% Higher 4,572 7,824 4,908 48,780 75,387 17,245 1,616
Finally, we should consider what happens if additional housing is not built to keep up with the new
demand created by immigration levels that are higher than forecast. As in 2016-21, we expect excess
demand to be transmitted to other parts of the province through drive until you qualify. Figure 37
considers where the GTAH’s excess demand may spill over by projecting 2015-20’s intraprovincial
migration patterns forward. Ultimately, the excess demand will go to where housing is built; if additional
housing is built in Oxford, then that is where the excess demand will settle. As Figure 37 shows, if
population growth is underestimated, Simcoe’s additional housing demand will primarily come from
spillover demand from the GTAH.
Figure 37: Excess Housing Demand Spillover if GTAH Builds to Baseline, for Selected Census Divisions,
2021-3190
Scenario Simcoe Niagara Middlesex Waterloo Wellington Oxford Rest non-GTHA
1% Higher 838 329 208 170 163 143 2,117
5% Higher 4,191 1,644 1,039 848 816 715 10,587
10% Higher 8,382 3,288 2,078 1,696 1,631 1,431 21,174
20% Higher 16,763 6,576 4,155 3,392 3,262 2,861 42,347
40% Higher 33,526 13,153 8,311 6,785 6,525 5,723 84,695
In a higher than anticipated growth through immigration scenario, areas outside the GTAH experience
increased housing demand from two sources. First, they experience direct housing demand from the
new immigrants locating to the region. Second, they see an increase in drive until you qualify families
due to the housing supply within the GTAH not keeping up with the increased population. For a place
such as Simcoe, the excess housing demand from an increased number of drive until you qualify families
is almost certainly higher than the direct impact from higher growth due to immigration. A lack of
housing supply causes the excess demand for housing to transmit across Ontario.
As the immigration scenarios show, the excess demand estimates are highly sensitive to the underlying
assumptions. The same will hold for non-permanent residents, though there are significant differences
in the timing of housing demand and the location.
89 Data Source: Author’s Calculation 90 Data Source: Author’s Calculation
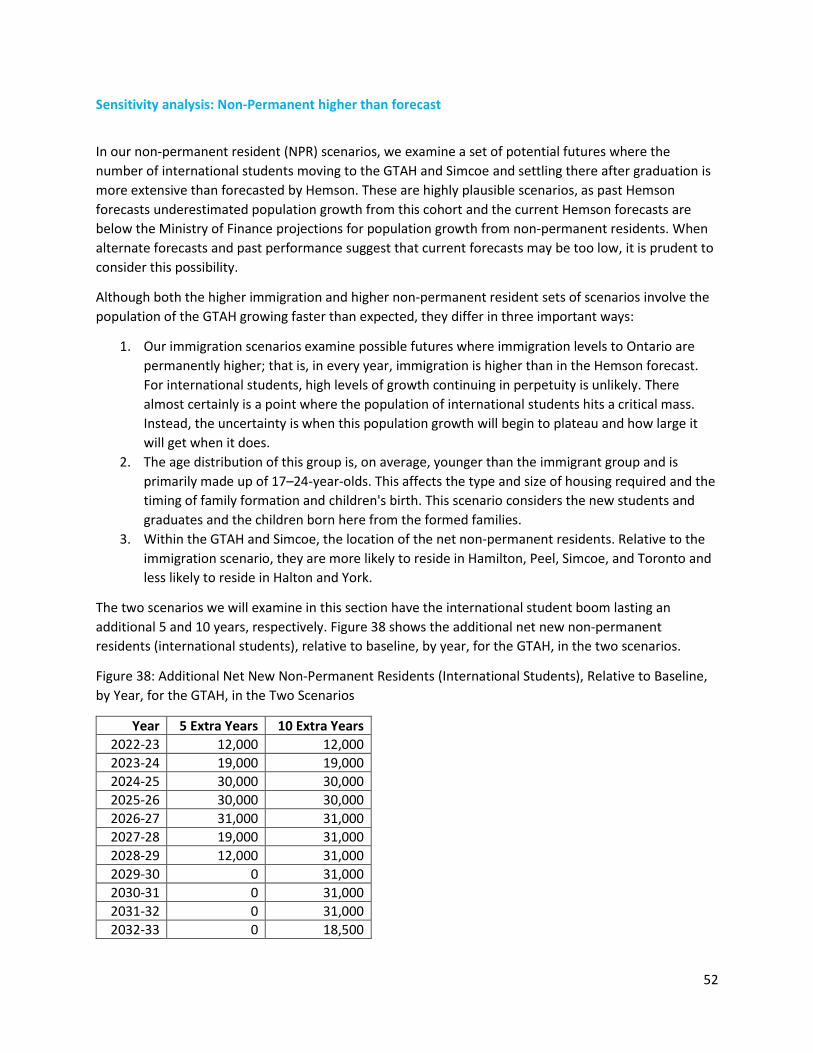
52
Sensitivity analysis: Non-Permanent higher than forecast
In our non-permanent resident (NPR) scenarios, we examine a set of potential futures where the
number of international students moving to the GTAH and Simcoe and settling there after graduation is
more extensive than forecasted by Hemson. These are highly plausible scenarios, as past Hemson
forecasts underestimated population growth from this cohort and the current Hemson forecasts are
below the Ministry of Finance projections for population growth from non-permanent residents. When
alternate forecasts and past performance suggest that current forecasts may be too low, it is prudent to
consider this possibility.
Although both the higher immigration and higher non-permanent resident sets of scenarios involve the
population of the GTAH growing faster than expected, they differ in three important ways:
1. Our immigration scenarios examine possible futures where immigration levels to Ontario are
permanently higher; that is, in every year, immigration is higher than in the Hemson forecast.
For international students, high levels of growth continuing in perpetuity is unlikely. There
almost certainly is a point where the population of international students hits a critical mass.
Instead, the uncertainty is when this population growth will begin to plateau and how large it
will get when it does.
2. The age distribution of this group is, on average, younger than the immigrant group and is
primarily made up of 17–24-year-olds. This affects the type and size of housing required and the
timing of family formation and children's birth. This scenario considers the new students and
graduates and the children born here from the formed families.
3. Within the GTAH and Simcoe, the location of the net non-permanent residents. Relative to the
immigration scenario, they are more likely to reside in Hamilton, Peel, Simcoe, and Toronto and
less likely to reside in Halton and York.
The two scenarios we will examine in this section have the international student boom lasting an
additional 5 and 10 years, respectively. Figure 38 shows the additional net new non-permanent
residents (international students), relative to baseline, by year, for the GTAH, in the two scenarios.
Figure 38: Additional Net New Non-Permanent Residents (International Students), Relative to Baseline,
by Year, for the GTAH, in the Two Scenarios
Year 5 Extra Years 10 Extra Years
2022-23 12,000 12,000
2023-24 19,000 19,000
2024-25 30,000 30,000
2025-26 30,000 30,000
2026-27 31,000 31,000
2027-28 19,000 31,000
2028-29 12,000 31,000
2029-30 0 31,000
2030-31 0 31,000
2031-32 0 31,000
2032-33 0 18,500

53
2033-34 0 11,500
2034-35 0 0
We assume that these net new non-permanent residents eventually become permanent residents in
these scenarios. Note that the net population growth continues after 2034-35, as a large population
leads to an increased number of births.
Figure 39 contains a forecast of the additional population, over baseline, and increased excess housing
demand for the scenario where the international student boom lasts an additional five years. By 2029,
the population of the GTAH will be roughly 170,000 persons higher than in the Hemson forecast.
Although the population of non-permanent residents plateaus then, the additional population over
baseline increases to 250,000 by 2050. The excess demand for housing is slower to grow, as students
typically occupy more crowded living conditions. However, by 2035, the excess demand for housing in
the GTAH will reach 50,000 units.
Figure 39: Additional Population and Housing Demand in the GTAH in the NPR Boom Lasts An Additional
5 Years Scenario91
This is further illustrated by Figure 40, which shows the population growth dynamics for the ten-year
periods of 2021-31, 2031-41, and 2041-51. While the bulk of the additional population growth is in
91 Data Source: Author’s Calculation
0
50,000
100,000
150,000
200,000
250,000
300,000
2022
2023
2024
2025
2026
2027
2028
2029
2030
2031
2032
2033
2034
2035
2036
2037
2038
2039
204
020
41
204
220
43
204
420
45
204
620
47
204
820
49
2050
2051
Additional Population and Housing Demand, GTAH, NPR Boom Lasts Additional 5 Years Scenario
Population Housing Demand

54
2021-31, the increase in the population (over baseline) continues past the end of the international
student boom in 2029 due to increased births.
Figure 40: Additional Population Growth in the GTAH in the NPR Boom Lasts an Additional 5 Years
Scenario92
Figure 41 shows the population increase over baseline for two scenarios; one where the international
student boom lasts an additional five years, and one where it lasts an additional ten. In both cases,
population growth continues to be higher than baseline, even when the number of international
students plateaus due to increased births from a larger population. The 10-year scenario sees
exceptionally high levels of population growth at this end of the decade.
Figure 41: Population Growth, Relative to Baseline, in the GTAH, by 5-year periods, for Two Net Non-
Permanent Population Growth Scenarios93
Scenario 2021-26 2026-31 2031-36 2036-41 2041-46 2046-51 Total 2021-51
5 Years 95,017 74,601 22,802 28,521 20,595 9,221 250,758
10 Years 95,017 168,722 88,694 39,230 36,852 22,182 450,698
Because our net non-permanent residents are overwhelmingly international students, the population
pyramid of the additional population is highly concentrated in a few age groups. Figure 42 provides
population pyramids for the boom lasts an additional five years scenario. We see by 2031 a high number
92 Data Source: Author’s Calculation 93 Data Source: Author’s Calculation
1,135,000 1,121,000 1,169,000
169,61851,323 29,816
0
200,000
400,000
600,000
800,000
1,000,000
1,200,000
1,400,000
2021-31 2031-41 2041-51
Population Growth by Decade, GTAH, NPR Boom Lasts Additional 5 Years Scenario
Baseline Additional Population
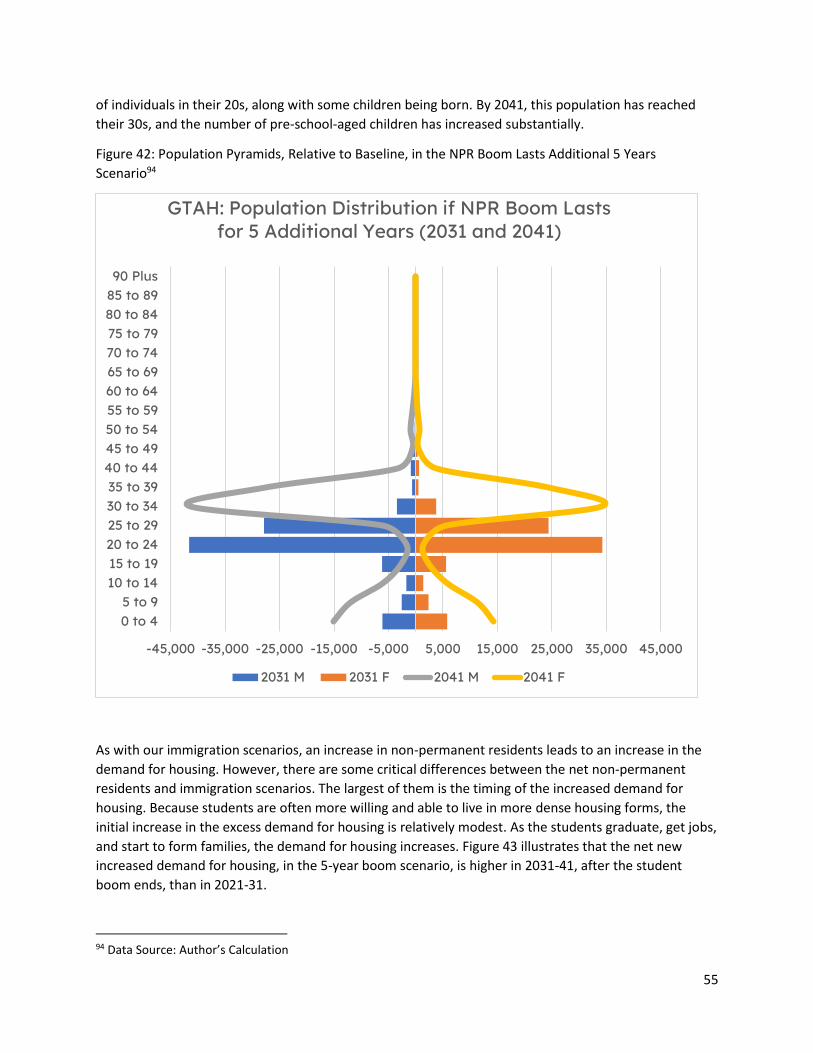
55
of individuals in their 20s, along with some children being born. By 2041, this population has reached
their 30s, and the number of pre-school-aged children has increased substantially.
Figure 42: Population Pyramids, Relative to Baseline, in the NPR Boom Lasts Additional 5 Years
Scenario94
As with our immigration scenarios, an increase in non-permanent residents leads to an increase in the
demand for housing. However, there are some critical differences between the net non-permanent
residents and immigration scenarios. The largest of them is the timing of the increased demand for
housing. Because students are often more willing and able to live in more dense housing forms, the
initial increase in the excess demand for housing is relatively modest. As the students graduate, get jobs,
and start to form families, the demand for housing increases. Figure 43 illustrates that the net new
increased demand for housing, in the 5-year boom scenario, is higher in 2031-41, after the student
boom ends, than in 2021-31.
94 Data Source: Author’s Calculation
-45,000 -35,000 -25,000 -15,000 -5,000 5,000 15,000 25,000 35,000 45,000
0 to 45 to 9
10 to 1415 to 1920 to 2425 to 2930 to 3435 to 39
40 to 4445 to 4950 to 5455 to 5960 to 6465 to 6970 to 7475 to 7980 to 8485 to 8990 Plus
GTAH: Population Distribution if NPR Boom Lasts for 5 Additional Years (2031 and 2041)
2031 M 2031 F 2041 M 2041 F

56
Figure 43: Housing Demand Growth in the GTAH in the NPR Boom Lasts Additional 5 Years Scenario95
Figure 44 provides housing demand estimates, by five-year periods, for our two scenarios: one where
the international student boom lasts an additional five years, and a second where it lasts an additional
ten. The most significant increase in housing demand occurs when international students graduate and
form families in both scenarios.
Figure 44: Excess Housing Demand over Baseline, 2 NPR Scenarios, 5 Year Periods, GTAH.96
Scenario 2021-26 2026-31 2031-36 2036-41 2041-46 2046-51 Total 2021-51
5 Years 9,638 20,437 22,644 10,062 11,334 7,284 81,397
10 Years 9,638 30,261 43,162 32,844 21,243 18,001 155,148
As in our immigration scenarios, we will then consider where this excess demand is likely to originate,
noting that demand for housing spills over through a drive until you qualify process. Figure 45 provides
the net new excess demand for housing estimates for our seven census divisions, in both the five-year
and ten-year NPR boom scenarios, for the 2021-31 period.
95 Data Source: Author’s Calculation 96 Data Source: Author’s Calculation
504,000451,000 432,700
30,07432,706
18,617
0
100,000
200,000
300,000
400,000
500,000
600,000
2021-31 2031-41 2041-51
Housing Demand Growth by Decade, GTAH, NPR Boom Lasts Additional 5 Years Scenario
Housing Demand Baseline Housing Demand Additional Population
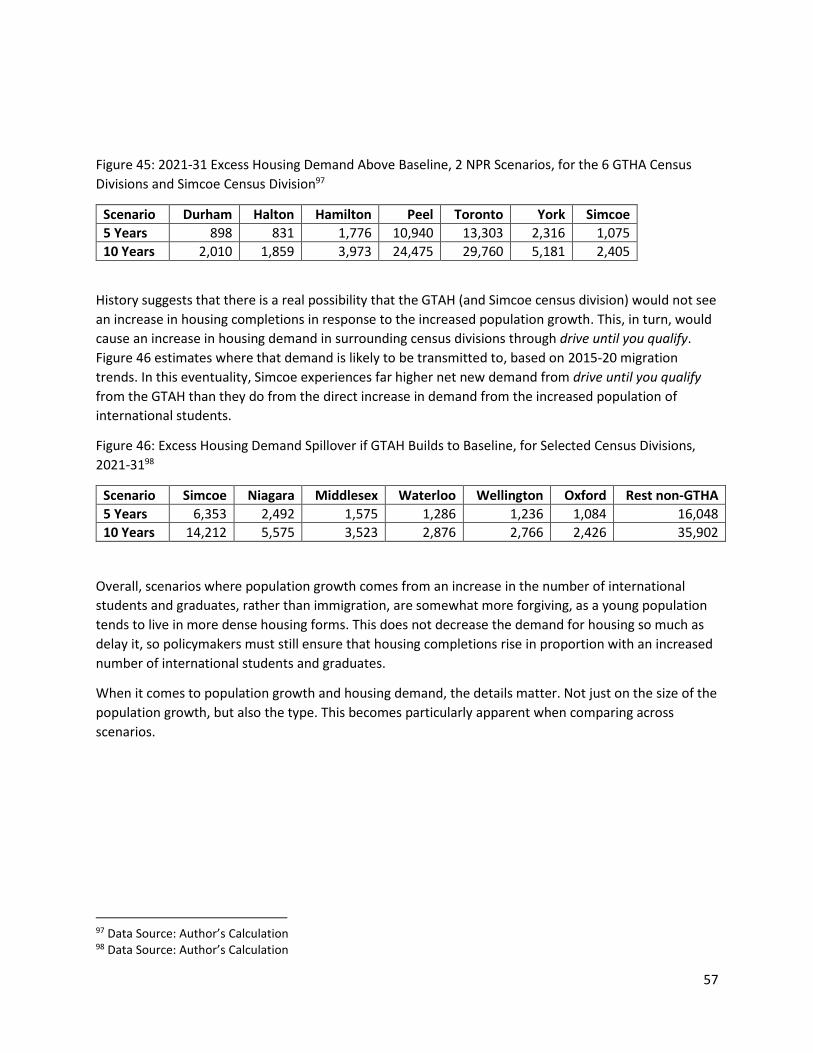
57
Figure 45: 2021-31 Excess Housing Demand Above Baseline, 2 NPR Scenarios, for the 6 GTHA Census
Divisions and Simcoe Census Division97
Scenario Durham Halton Hamilton Peel Toronto York Simcoe
5 Years 898 831 1,776 10,940 13,303 2,316 1,075
10 Years 2,010 1,859 3,973 24,475 29,760 5,181 2,405
History suggests that there is a real possibility that the GTAH (and Simcoe census division) would not see
an increase in housing completions in response to the increased population growth. This, in turn, would
cause an increase in housing demand in surrounding census divisions through drive until you qualify.
Figure 46 estimates where that demand is likely to be transmitted to, based on 2015-20 migration
trends. In this eventuality, Simcoe experiences far higher net new demand from drive until you qualify
from the GTAH than they do from the direct increase in demand from the increased population of
international students.
Figure 46: Excess Housing Demand Spillover if GTAH Builds to Baseline, for Selected Census Divisions,
2021-3198
Scenario Simcoe Niagara Middlesex Waterloo Wellington Oxford Rest non-GTHA
5 Years 6,353 2,492 1,575 1,286 1,236 1,084 16,048
10 Years 14,212 5,575 3,523 2,876 2,766 2,426 35,902
Overall, scenarios where population growth comes from an increase in the number of international
students and graduates, rather than immigration, are somewhat more forgiving, as a young population
tends to live in more dense housing forms. This does not decrease the demand for housing so much as
delay it, so policymakers must still ensure that housing completions rise in proportion with an increased
number of international students and graduates.
When it comes to population growth and housing demand, the details matter. Not just on the size of the
population growth, but also the type. This becomes particularly apparent when comparing across
scenarios.
97 Data Source: Author’s Calculation 98 Data Source: Author’s Calculation
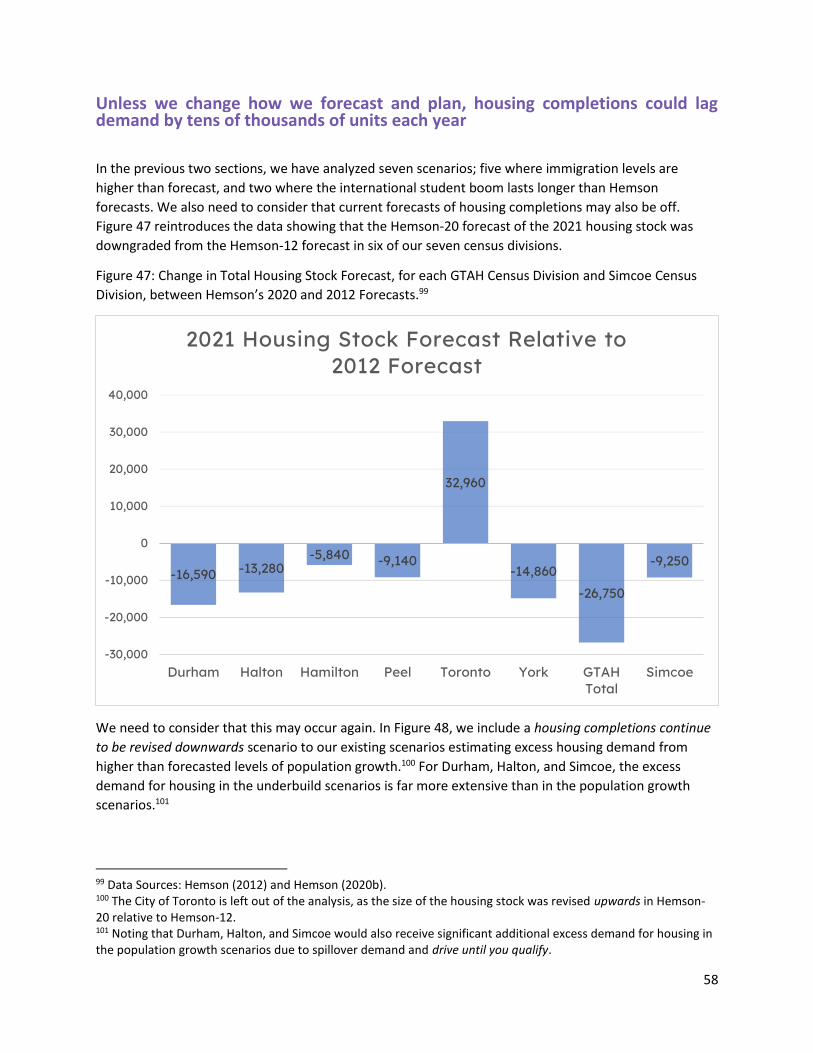
58
Unless we change how we forecast and plan, housing completions could lag demand by tens of thousands of units each year
In the previous two sections, we have analyzed seven scenarios; five where immigration levels are
higher than forecast, and two where the international student boom lasts longer than Hemson
forecasts. We also need to consider that current forecasts of housing completions may also be off.
Figure 47 reintroduces the data showing that the Hemson-20 forecast of the 2021 housing stock was
downgraded from the Hemson-12 forecast in six of our seven census divisions.
Figure 47: Change in Total Housing Stock Forecast, for each GTAH Census Division and Simcoe Census
Division, between Hemson’s 2020 and 2012 Forecasts.99
We need to consider that this may occur again. In Figure 48, we include a housing completions continue
to be revised downwards scenario to our existing scenarios estimating excess housing demand from
higher than forecasted levels of population growth.100 For Durham, Halton, and Simcoe, the excess
demand for housing in the underbuild scenarios is far more extensive than in the population growth
scenarios.101
99 Data Sources: Hemson (2012) and Hemson (2020b). 100 The City of Toronto is left out of the analysis, as the size of the housing stock was revised upwards in Hemson-20 relative to Hemson-12. 101 Noting that Durham, Halton, and Simcoe would also receive significant additional excess demand for housing in the population growth scenarios due to spillover demand and drive until you qualify.
-16,590 -13,280-5,840 -9,140
32,960
-14,860
-26,750
-9,250
-30,000
-20,000
-10,000
0
10,000
20,000
30,000
40,000
Durham Halton Hamilton Peel Toronto York GTAHTotal
Simcoe
2021 Housing Stock Forecast Relative to 2012 Forecast
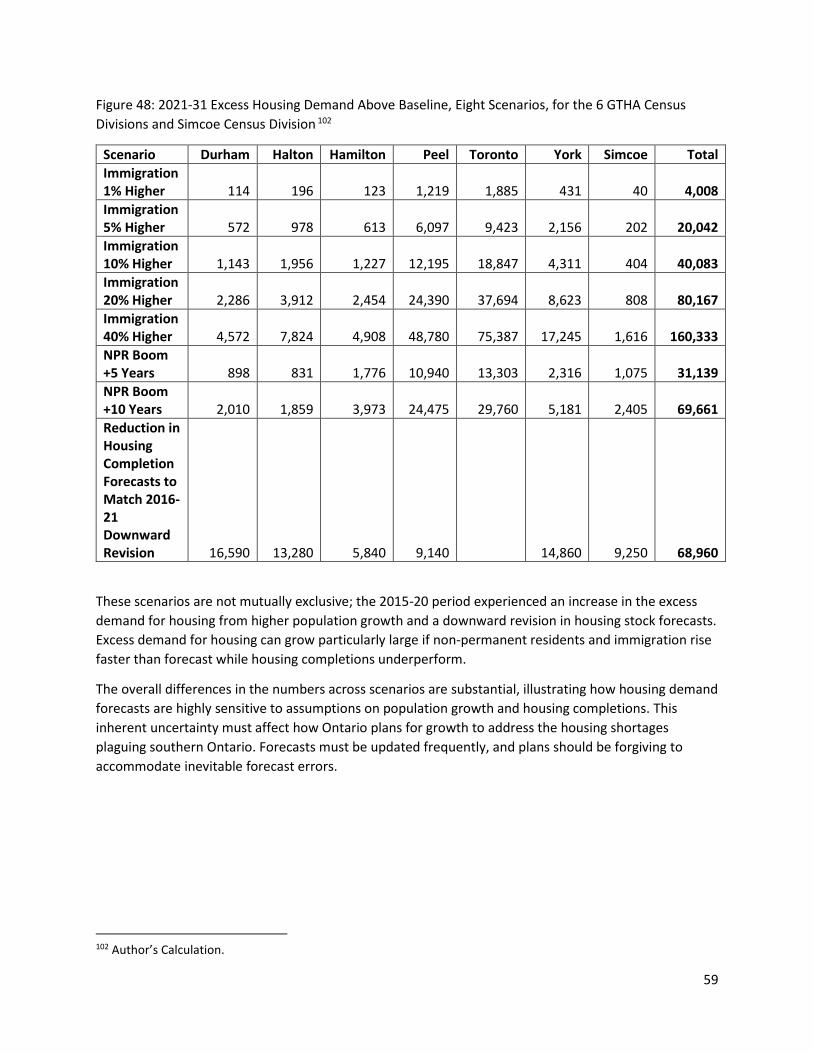
59
Figure 48: 2021-31 Excess Housing Demand Above Baseline, Eight Scenarios, for the 6 GTHA Census
Divisions and Simcoe Census Division 102
Scenario Durham Halton Hamilton Peel Toronto York Simcoe Total Immigration 1% Higher 114 196 123 1,219 1,885 431 40 4,008 Immigration 5% Higher 572 978 613 6,097 9,423 2,156 202 20,042 Immigration 10% Higher 1,143 1,956 1,227 12,195 18,847 4,311 404 40,083 Immigration 20% Higher 2,286 3,912 2,454 24,390 37,694 8,623 808 80,167 Immigration 40% Higher 4,572 7,824 4,908 48,780 75,387 17,245 1,616 160,333 NPR Boom +5 Years 898 831 1,776 10,940 13,303 2,316 1,075 31,139 NPR Boom +10 Years 2,010 1,859 3,973 24,475 29,760 5,181 2,405 69,661 Reduction in Housing Completion Forecasts to Match 2016-21 Downward Revision 16,590 13,280 5,840 9,140 14,860 9,250 68,960
These scenarios are not mutually exclusive; the 2015-20 period experienced an increase in the excess
demand for housing from higher population growth and a downward revision in housing stock forecasts.
Excess demand for housing can grow particularly large if non-permanent residents and immigration rise
faster than forecast while housing completions underperform.
The overall differences in the numbers across scenarios are substantial, illustrating how housing demand
forecasts are highly sensitive to assumptions on population growth and housing completions. This
inherent uncertainty must affect how Ontario plans for growth to address the housing shortages
plaguing southern Ontario. Forecasts must be updated frequently, and plans should be forgiving to
accommodate inevitable forecast errors.
102 Author’s Calculation.

60
Conclusion and recommendations
While population and housing forecasts that missed the mark are not the sole factors in Southern
Ontario’s housing shortage, they played a contributing role and may well do so in the future. The
province saw a mass and unforecasted exodus of young families from the GGH due to a lack of housing.
When forecasts on the size of the current housing stock fall and forecasts of the population growth from
international sources increase by over one hundred thousand individuals in five years, you have the
recipe for too few homes to support the local population. Given the importance of immigration to the
innovation economy of the GTAH, and given the value of having global talent acquire their credentials in
Canada before they gain permanent residency status, the solution should not be to look to reduce
population growth. The underlying issue is not population growth but rather an inflexible planning and
forecasting system that underestimates that growth level. It lacks a corrective mechanism to
accommodate forecast errors.
Ontario’s housing shortages could have been reduced with a more agile forecasting process and
contingency buffers built into the Growth Plan so unanticipated increases in population could be
housed. Things may have been different had the Ontario government not used population forecasts
from 2012-13, which predated transformative changes to international student and immigration policies
in 2014 and 2015, in the 2017 Growth Plan. A lack of policy coherence led Ontario to forecast to failure.
When providing policy recommendations, it is crucial never to lose sight of the question what
problem(s) are you trying to solve? The problems identified in this report can be divided into two
categories: how forecasts are conducted in growth planning and the lack of a contingency buffer in
growth planning to accommodate unavoidable forecast errors.
Identified issues with the forecasts underpinning the Growth Plan Ontario’s Growth Plan forecasting issues summarized:
1. The population, employment, and housing stock forecasts used in planning are only updated
every seven to eight years and quickly become stale due to changes in policy and other external
factors.
2. The population forecasts used in planning do not disclose critical information for planners and
analysts, such as forecasted migration patterns between census divisions and complete
population pyramids.
3. A population forecast and a population projection, which provide conflicting predictions, creates
confusion for policymakers, planners, and analysts.
To address these issues, we make the following recommendation:
Recommendation 1: Ontario should prepare a population, employment, and housing stock
forecast, released annually, which would adopt the best elements of both the existing forecasts
and the Ministry of Finance population projections. This would create a unified set of numbers
to replace the existing Ministry of Finance population projections.
These unified should retain essential features from the existing forecasts, including being released
annually providing province-wide coverage at the census division level, including full yearly population

61
projections, by age and sex. It would also retain critical elements of the Hemson forecasts, including
consideration of land availability and other constraints, making them forecasts rather than projections.
Like the existing Hemson approach, it would include forecasts on employment and the size of the
housing stock, not just population. They should also include elements not currently found in either the
Ministry of Finance or Hemson releases, such as yearly forecasts of the various components of
population growth at the census division level.
Identified issues with the lack of a contingency buffer in the Growth Plan Even the best forecasts will not be perfect. Forecasts can underestimate population growth or
overestimate housing completions, which is problematic as the social, economic, and environmental
costs of failing to build enough housing to support population growth are high.
Recommendation 2: Growth plans should be set to population estimates that are higher than
forecast to allow for unavoidable errors in forecasting. Just as government budgets typically
have contingency buffers to accommodate unplanned events, so too should growth plans.
These reforms are needed to ensure there is a place for every Ontarian to call home. We believe
adopting these recommendations will address most of the issues identified in this report. But they alone
are not enough, as there is also a need for better policy coordination, better data and better tools. We
offer the following secondary recommendations to address those three betters:
Better policy coordination
Recommendation 3: The federal government should set immigration targets five years in
advance to give provinces and municipalities enough time to ensure the housing stock can
support the additional population. The timing of updates to growth plans should be
synchronized with the release of immigration targets.
Recommendation 4: Federal policies affecting population growth, such as rules governing
international students, should be designed through coordination and consultation across all
three levels of government. While the federal government ultimately sets federal policies,
increased consultation can lead to enhanced policy coherence across levels of government.
Recommendation 5: If significant changes are made to programs that affect the size of the
population, such as policies governing international students, new sets of population forecasts
should be generated immediately, and growth plans altered as needed.
Recommendation 6: Each Ontario post-secondary institution should issue five-year targets for
international student growth, and these targets should be incorporated into population growth
forecasts and growth plans.

62
Better data
Recommendation 7: Statistics Canada should include housing starts and completion data at a
municipal level, not just CMA level.
Recommendation 8: Statistics Canada should create a one-stop portal for municipal-level data
relevant to housing. At a minimum, this should include draft plan approved and zoned units,
registered units, and residential building permits issued.
Recommendation 9: The Statistics Canada series Interprovincial and intraprovincial migrants, by
census metropolitan area and census agglomeration of origin and destination should be
expanded to include data at the census division level.
Better tools
Recommendation 10: Ontario should create an open-access online population and housing
model, accessible to all, which would allow users to ‘stress test’ the assumptions underlying
growth plans which would allow municipalities to better contingency plan. This would allow
policymakers to quickly determine the impact on housing demand from a change to immigration
targets, an increase in the birth rate, or other factors that could impact the size of the local
population.
A better Ontario is possible, where every family has an available and attainable home. The future is not
just something we forecast but rather something we create through our collective actions.

63
Appendix I: Baseline population forecast for Durham
Population forecast, total population, by age cohort for Durham
Year Total 0 to 9
10 to
19
20 to
29
30 to
39
40 to
49
50 to
59
60 to
69
70 to
79
80 to
89 90 +
2022
736,900
85,100
89,300
97,200
102,600
96,700
98,800
87,800
52,400
21,900
5,100
2023
752,100
87,500
90,700
97,900
106,800
98,800
96,300
91,000
54,700
23,000
5,400
2024
766,900
89,700
92,000
98,500
110,700
101,400
93,900
94,000
57,200
23,900
5,600
2025
782,100
91,900
93,700
98,800
114,500
104,100
92,300
96,200
59,700
25,000
5,900
2026
797,100
94,000
95,400
98,900
118,300
107,200
91,200
97,600
62,100
26,300
6,100
2027
815,200
97,100
97,300
100,000
122,700
110,500
90,800
98,000
64,100
28,400
6,300
2028
833,800
100,200
99,300
101,300
126,700
114,200
91,100
97,800
66,400
30,300
6,500
2029
852,200
103,200
101,500
102,400
130,100
118,400
91,700
97,000
69,100
32,000
6,800
2030
870,600
105,900
103,800
103,600
132,900
123,000
92,500
96,000
72,000
33,700
7,200
2031
889,100
108,500
106,400
105,000
135,000
127,800
93,700
94,600
75,100
35,500
7,500
2032
908,400
111,300
109,000
106,700
137,100
132,800
95,500
93,000
78,000
37,200
7,800
2033
927,800
113,800
112,100
108,500
138,700
137,600
97,700
91,100
81,000
39,000
8,300
2034
947,200
116,100
115,200
110,300
140,200
142,400
100,300
89,200
83,800
40,900
8,800
2035
966,500
118,300
118,400
112,300
141,200
147,200
103,200
87,900
85,800
42,900
9,300
2036
985,900
120,400
121,600
114,500
142,000
151,900
106,500
87,100
87,200
44,800
9,900
2037
1,006,000
122,500
125,000
116,700
143,500
156,300
109,900
86,900
87,700
46,600
10,900
2038
1,026,600
124,500
128,400
119,000
145,200
160,400
113,700
87,300
87,800
48,500
11,800
2039
1,046,600
126,500
131,600
121,500
146,700
163,900
117,900
87,900
87,400
50,700
12,500
2040
1,066,800
128,400
134,800
124,100
148,200
166,900
122,600
88,700
86,900
53,000
13,200
2041
1,087,200
130,400
137,700
127,100
149,800
169,300
127,400
89,900
86,100
55,500
14,000
2042
1,108,200
132,600
140,700
130,200
151,900
171,500
132,200
91,600
84,900
57,900
14,700

64
2043
1,129,400
134,800
143,500
133,500
154,000
173,400
137,000
93,800
83,600
60,300
15,500
2044
1,150,700
137,100
146,100
137,000
156,100
175,000
141,700
96,400
82,300
62,600
16,400
2045
1,171,800
139,400
148,600
140,500
158,400
176,300
146,400
99,200
81,400
64,300
17,300
2046
1,193,100
141,700
151,000
144,100
160,700
177,400
151,000
102,500
81,000
65,500
18,200
2047
1,213,600
144,500
153,500
148,100
162,800
179,400
154,800
105,100
81,300
65,000
19,100
2048
1,234,100
146,800
155,700
151,800
164,800
181,100
158,600
108,700
81,400
65,100
20,100
2049
1,254,800
149,100
157,900
155,400
166,900
182,800
161,900
112,700
81,700
65,200
21,200
2050
1,275,300
151,400
160,100
158,800
169,100
184,400
164,700
117,100
82,200
65,200
22,300
2051
1,296,000
153,700
162,200
161,900
171,800
186,100
167,000
121,600
83,000
65,200
23,500
Population pyramid for Durham, by age and sex, for 2031 and 2041
-45,000 -35,000 -25,000 -15,000 -5,000 5,000 15,000 25,000 35,000 45,000
0 to 45 to 9
10 to 1415 to 1920 to 2425 to 2930 to 3435 to 39
40 to 4445 to 4950 to 5455 to 5960 to 6465 to 6970 to 7475 to 7980 to 8485 to 8990 Plus
Durham Population Distribution (2031 and 2041)
2031 M 2031 F 2041 M 2041 F

65
Appendix II: Baseline population forecast for Halton
Population forecast, total population, by age cohort for Halton
Year Total 0 to 9
10 to
19
20 to
29
30 to
39
40 to
49
50 to
59
60 to
69
70 to
79
80 to
89 90 +
2022
626,900
66,300
85,600
79,200
77,300
90,200
88,200
67,700
45,500
21,500
5,400
2023
642,000
67,600
86,200
82,700
81,000
90,400
88,300
70,500
47,000
22,600
5,700
2024
657,100
69,000
86,700
86,000
85,000
90,800
88,200
73,100
48,700
23,700
5,900
2025
672,100
70,800
87,100
88,500
89,200
91,300
88,300
75,400
50,600
24,800
6,100
2026
687,000
72,600
87,500
90,800
93,300
92,400
88,500
77,200
52,400
26,000
6,300
2027
703,000
74,900
87,800
93,200
97,700
93,900
88,700
78,600
53,700
27,900
6,600
2028
719,100
77,700
87,900
95,200
102,000
95,800
88,900
79,700
55,500
29,500
6,900
2029
735,200
80,400
88,200
97,000
105,800
98,200
89,200
80,500
57,700
31,000
7,200
2030
750,900
83,000
88,900
98,400
109,000
101,300
89,100
81,300
60,000
32,400
7,500
2031
766,900
85,800
89,700
99,700
111,700
104,700
89,200
81,800
62,700
33,700
7,900
2032
783,300
88,300
91,000
100,900
114,300
108,600
89,400
82,300
65,200
35,000
8,300
2033
799,400
90,600
92,700
102,000
116,500
112,400
90,100
82,200
67,700
36,400
8,800
2034
815,600
92,800
94,500
103,000
118,500
116,500
91,100
82,000
70,100
37,800
9,300
2035
831,900
94,900
96,600
103,900
120,100
120,600
92,100
82,100
72,200
39,500
9,900
2036
847,900
96,800
98,700
105,000
121,500
124,600
93,700
82,300
73,800
41,100
10,400
2037
864,500
98,800
101,100
106,000
123,100
128,600
95,500
82,600
75,000
42,400
11,400
2038
881,300
100,700
103,800
106,800
124,700
132,400
97,700
82,900
76,000
44,100
12,200
2039
898,000
102,500
106,500
107,900
126,100
135,700
100,400
83,300
76,700
46,000
12,900
2040
914,400
104,200
109,100
109,200
127,400
138,500
103,700
83,400
77,400
48,000
13,500
2041
931,000
105,900
111,800
110,600
128,800
140,900
107,100
83,800
77,800
50,200
14,100
2042
948,400
107,800
114,300
112,600
130,400
143,000
110,800
84,300
78,200
52,300
14,700
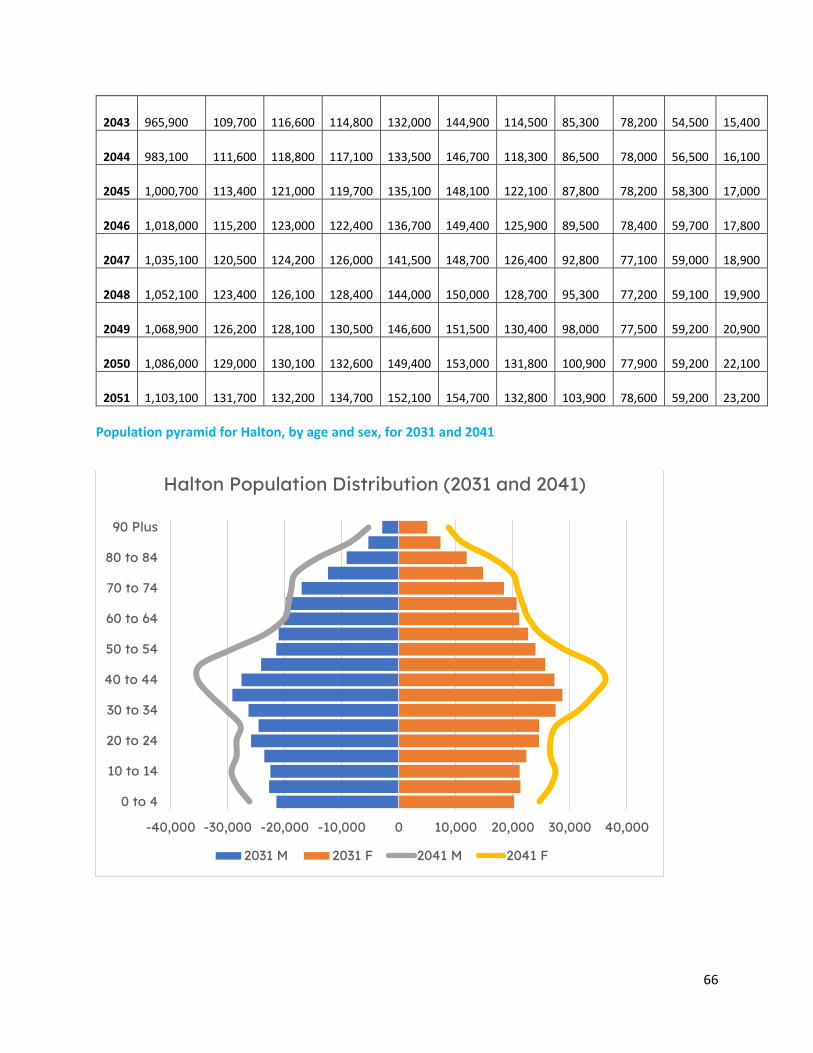
66
2043
965,900
109,700
116,600
114,800
132,000
144,900
114,500
85,300
78,200
54,500
15,400
2044
983,100
111,600
118,800
117,100
133,500
146,700
118,300
86,500
78,000
56,500
16,100
2045
1,000,700
113,400
121,000
119,700
135,100
148,100
122,100
87,800
78,200
58,300
17,000
2046
1,018,000
115,200
123,000
122,400
136,700
149,400
125,900
89,500
78,400
59,700
17,800
2047
1,035,100
120,500
124,200
126,000
141,500
148,700
126,400
92,800
77,100
59,000
18,900
2048
1,052,100
123,400
126,100
128,400
144,000
150,000
128,700
95,300
77,200
59,100
19,900
2049
1,068,900
126,200
128,100
130,500
146,600
151,500
130,400
98,000
77,500
59,200
20,900
2050
1,086,000
129,000
130,100
132,600
149,400
153,000
131,800
100,900
77,900
59,200
22,100
2051
1,103,100
131,700
132,200
134,700
152,100
154,700
132,800
103,900
78,600
59,200
23,200
Population pyramid for Halton, by age and sex, for 2031 and 2041
-40,000 -30,000 -20,000 -10,000 0 10,000 20,000 30,000 40,000
0 to 4
10 to 14
20 to 24
30 to 34
40 to 44
50 to 54
60 to 64
70 to 74
80 to 84
90 Plus
Halton Population Distribution (2031 and 2041)
2031 M 2031 F 2041 M 2041 F
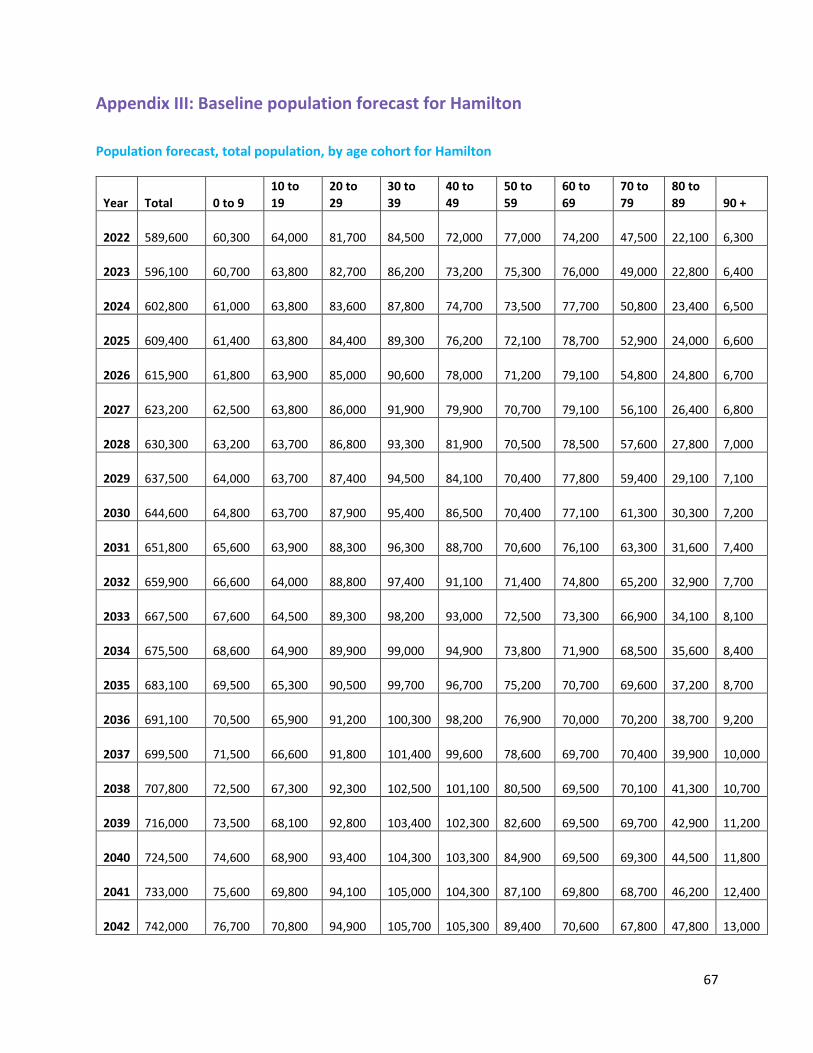
67
Appendix III: Baseline population forecast for Hamilton
Population forecast, total population, by age cohort for Hamilton
Year Total 0 to 9
10 to
19
20 to
29
30 to
39
40 to
49
50 to
59
60 to
69
70 to
79
80 to
89 90 +
2022
589,600
60,300
64,000
81,700
84,500
72,000
77,000
74,200
47,500
22,100
6,300
2023
596,100
60,700
63,800
82,700
86,200
73,200
75,300
76,000
49,000
22,800
6,400
2024
602,800
61,000
63,800
83,600
87,800
74,700
73,500
77,700
50,800
23,400
6,500
2025
609,400
61,400
63,800
84,400
89,300
76,200
72,100
78,700
52,900
24,000
6,600
2026
615,900
61,800
63,900
85,000
90,600
78,000
71,200
79,100
54,800
24,800
6,700
2027
623,200
62,500
63,800
86,000
91,900
79,900
70,700
79,100
56,100
26,400
6,800
2028
630,300
63,200
63,700
86,800
93,300
81,900
70,500
78,500
57,600
27,800
7,000
2029
637,500
64,000
63,700
87,400
94,500
84,100
70,400
77,800
59,400
29,100
7,100
2030
644,600
64,800
63,700
87,900
95,400
86,500
70,400
77,100
61,300
30,300
7,200
2031
651,800
65,600
63,900
88,300
96,300
88,700
70,600
76,100
63,300
31,600
7,400
2032
659,900
66,600
64,000
88,800
97,400
91,100
71,400
74,800
65,200
32,900
7,700
2033
667,500
67,600
64,500
89,300
98,200
93,000
72,500
73,300
66,900
34,100
8,100
2034
675,500
68,600
64,900
89,900
99,000
94,900
73,800
71,900
68,500
35,600
8,400
2035
683,100
69,500
65,300
90,500
99,700
96,700
75,200
70,700
69,600
37,200
8,700
2036
691,100
70,500
65,900
91,200
100,300
98,200
76,900
70,000
70,200
38,700
9,200
2037
699,500
71,500
66,600
91,800
101,400
99,600
78,600
69,700
70,400
39,900
10,000
2038
707,800
72,500
67,300
92,300
102,500
101,100
80,500
69,500
70,100
41,300
10,700
2039
716,000
73,500
68,100
92,800
103,400
102,300
82,600
69,500
69,700
42,900
11,200
2040
724,500
74,600
68,900
93,400
104,300
103,300
84,900
69,500
69,300
44,500
11,800
2041
733,000
75,600
69,800
94,100
105,000
104,300
87,100
69,800
68,700
46,200
12,400
2042
742,000
76,700
70,800
94,900
105,700
105,300
89,400
70,600
67,800
47,800
13,000

68
2043
750,700
77,700
71,800
95,800
106,500
106,200
91,400
71,700
66,700
49,300
13,600
2044
759,300
78,800
72,700
96,600
107,200
107,100
93,300
72,900
65,700
50,700
14,300
2045
768,200
79,800
73,700
97,600
108,000
107,900
95,200
74,300
64,900
51,800
15,000
2046
777,100
80,900
74,800
98,600
108,700
108,700
96,800
75,900
64,500
52,400
15,800
2047
786,300
81,800
75,400
100,500
109,900
109,100
98,600
77,100
64,600
52,700
16,600
2048
795,400
82,800
76,200
101,900
110,700
110,100
100,000
78,800
64,600
52,800
17,500
2049
804,400
83,900
77,100
103,300
111,400
111,000
101,200
80,700
64,600
52,800
18,400
2050
813,700
85,000
78,000
104,600
112,300
111,800
102,200
82,900
64,700
52,800
19,400
2051
823,000
86,100
78,900
105,800
113,400
112,700
102,900
85,000
64,900
52,800
20,500
Population pyramid for Hamilton, by age and sex, for 2031 and 2041
-35,000 -25,000 -15,000 -5,000 5,000 15,000 25,000 35,000
0 to 45 to 9
10 to 1415 to 1920 to 2425 to 2930 to 3435 to 39
40 to 4445 to 4950 to 5455 to 5960 to 6465 to 6970 to 7475 to 7980 to 8485 to 8990 Plus
Hamilton Population Distribution (2031 and 2041)
2031 M 2031 F 2041 M 2041 F

69
Appendix IV: Baseline population forecast for Peel
Population forecast, total population, by age cohort for Peel
Year Total 0 to 9
10 to
19
20 to
29
30 to
39
40 to
49
50 to
59
60 to
69
70 to
79
80 to
89 90 +
2022
1,603,900
169,800
193,900
259,600
245,400
207,000
203,300
169,000
103,400
43,300
9,200
2023
1,634,000
172,800
194,300
262,700
255,400
211,300
199,900
174,700
107,600
45,600
9,700
2024
1,661,000
176,500
192,900
265,100
264,100
216,200
196,400
179,600
112,100
47,900
10,200
2025
1,687,900
180,800
191,400
266,900
272,000
221,500
193,800
183,300
117,300
50,200
10,700
2026
1,714,900
185,300
189,700
269,100
278,700
227,200
192,500
186,300
121,900
52,800
11,400
2027
1,737,500
188,800
188,500
270,300
283,900
233,000
191,300
187,600
125,700
56,500
11,900
2028
1,760,200
192,600
187,100
270,600
288,700
240,000
190,200
188,500
129,800
60,100
12,600
2029
1,782,800
196,500
186,200
271,500
291,600
247,600
189,700
188,800
134,100
63,500
13,300
2030
1,805,600
200,100
186,300
273,100
292,500
255,900
189,900
187,900
139,100
66,700
14,100
2031
1,828,200
202,700
187,800
275,300
292,200
263,800
191,100
186,500
143,900
70,000
14,900
2032
1,849,800
205,500
188,600
277,400
291,700
271,600
193,000
184,400
148,700
73,200
15,700
2033
1,871,500
207,700
191,000
279,300
291,100
278,600
195,900
181,200
153,600
76,400
16,700
2034
1,893,300
209,700
194,000
280,700
290,900
285,100
199,500
178,100
157,900
79,700
17,700
2035
1,915,100
211,600
197,100
282,200
290,700
290,900
203,500
175,700
161,100
83,600
18,700
2036
1,937,000
213,300
200,400
283,800
291,000
295,800
207,900
174,200
163,500
87,100
20,000
2037
1,959,200
215,200
203,100
286,100
291,900
300,100
212,900
173,300
164,800
90,100
21,700
2038
1,981,400
217,000
206,000
288,200
292,700
304,000
218,800
172,300
165,600
93,500
23,300
2039
2,003,600
219,000
209,000
290,500
293,800
306,400
225,200
171,900
166,100
96,900
24,800
2040
2,026,000
221,000
211,800
293,400
295,300
307,300
232,300
172,100
165,600
100,900
26,300
2041
2,047,900
223,100
213,700
297,300
297,200
307,400
239,000
173,100
164,700
104,700
27,700
2042
2,071,100
225,400
216,100
301,100
299,500
307,300
245,800
174,900
163,400
108,500
29,100
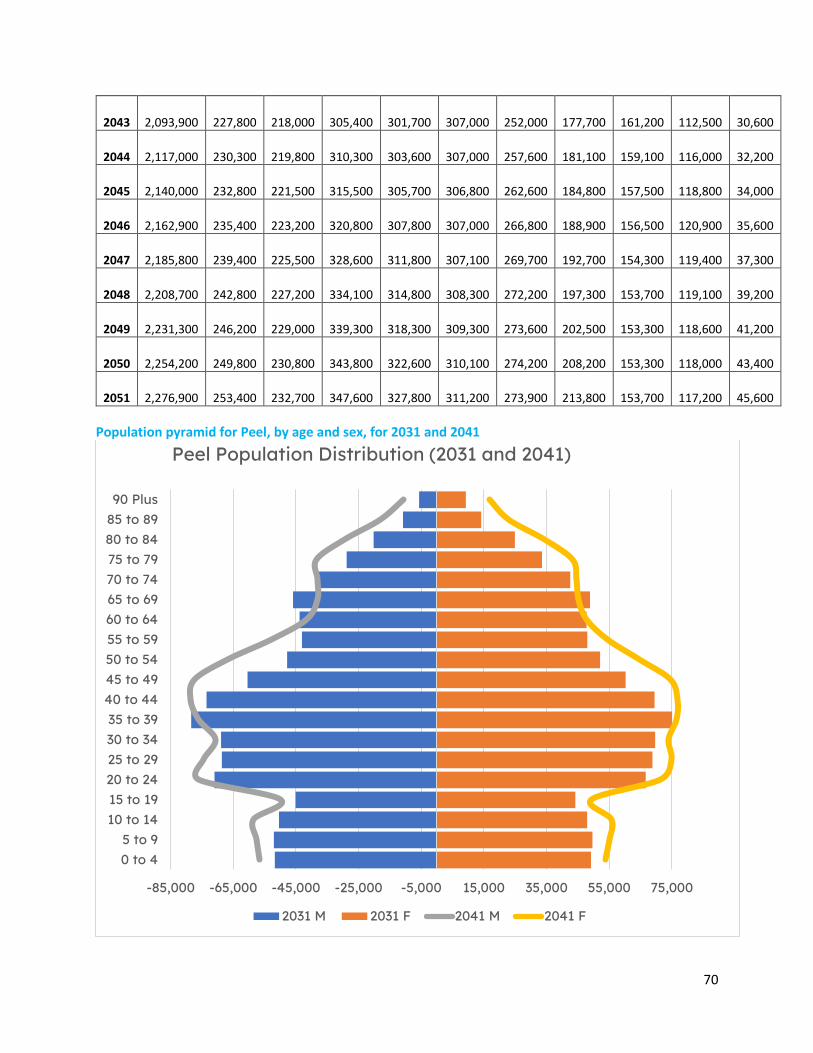
70
2043
2,093,900
227,800
218,000
305,400
301,700
307,000
252,000
177,700
161,200
112,500
30,600
2044
2,117,000
230,300
219,800
310,300
303,600
307,000
257,600
181,100
159,100
116,000
32,200
2045
2,140,000
232,800
221,500
315,500
305,700
306,800
262,600
184,800
157,500
118,800
34,000
2046
2,162,900
235,400
223,200
320,800
307,800
307,000
266,800
188,900
156,500
120,900
35,600
2047
2,185,800
239,400
225,500
328,600
311,800
307,100
269,700
192,700
154,300
119,400
37,300
2048
2,208,700
242,800
227,200
334,100
314,800
308,300
272,200
197,300
153,700
119,100
39,200
2049
2,231,300
246,200
229,000
339,300
318,300
309,300
273,600
202,500
153,300
118,600
41,200
2050
2,254,200
249,800
230,800
343,800
322,600
310,100
274,200
208,200
153,300
118,000
43,400
2051
2,276,900
253,400
232,700
347,600
327,800
311,200
273,900
213,800
153,700
117,200
45,600
Population pyramid for Peel, by age and sex, for 2031 and 2041
-85,000 -65,000 -45,000 -25,000 -5,000 15,000 35,000 55,000 75,000
0 to 45 to 9
10 to 1415 to 1920 to 2425 to 2930 to 3435 to 39
40 to 4445 to 4950 to 5455 to 5960 to 6465 to 6970 to 7475 to 7980 to 8485 to 8990 Plus
Peel Population Distribution (2031 and 2041)
2031 M 2031 F 2041 M 2041 F

71
Appendix V: Baseline population forecast for Simcoe
Population forecast, total population, by age cohort for Simcoe
Year Total 0 to 9
10 to
19
20 to
29
30 to
39
40 to
49
50 to
59
60 to
69
70 to
79
80 to
89 90 +
2022
560,800
57,300
61,600
70,600
73,500
68,000
78,400
75,300
50,100
21,400
4,600
2023
572,700
58,400
62,300
71,700
75,700
69,400
77,500
78,200
51,900
22,700
4,900
2024
584,600
59,600
62,700
72,900
78,000
70,900
76,500
80,900
54,100
23,900
5,100
2025
596,300
60,700
63,500
73,600
80,100
72,700
75,800
83,100
56,400
25,000
5,400
2026
608,100
61,800
64,200
74,500
82,100
74,400
75,800
84,700
58,700
26,300
5,600
2027
620,400
63,000
65,000
75,300
84,200
76,500
76,200
85,400
60,400
28,500
5,900
2028
632,500
64,200
65,600
76,200
86,200
78,700
76,700
86,000
62,300
30,400
6,200
2029
644,500
65,600
66,300
76,900
87,800
81,100
77,300
86,200
64,800
32,000
6,500
2030
656,700
66,900
67,100
77,600
89,100
83,900
77,800
86,400
67,500
33,600
6,800
2031
669,000
68,100
68,100
78,400
90,000
86,800
78,600
86,300
70,300
35,200
7,200
2032
680,900
69,400
68,900
79,400
90,900
89,400
79,500
85,900
73,100
36,800
7,600
2033
693,100
70,600
70,200
80,300
91,700
91,800
81,000
85,000
75,900
38,400
8,200
2034
705,100
71,700
71,500
81,000
92,500
94,300
82,500
84,100
78,500
40,200
8,800
2035
716,900
72,700
72,600
82,100
93,000
96,600
84,400
83,400
80,700
42,100
9,300
2036
729,000
73,800
73,900
83,100
93,600
98,800
86,300
83,400
82,200
44,000
9,900
2037
740,500
74,800
75,100
84,100
94,200
100,800
88,300
83,700
83,000
45,600
10,900
2038
752,300
75,700
76,400
85,000
95,000
102,800
90,600
84,000
83,600
47,400
11,800
2039
763,800
76,700
77,700
85,900
95,700
104,300
93,100
84,500
83,900
49,500
12,500
2040
775,500
77,700
79,100
86,900
96,200
105,600
96,000
85,000
84,100
51,700
13,200
2041
787,000
78,700
80,300
88,200
96,900
106,400
98,800
85,600
84,100
54,100
13,900
2042
798,700
79,700
81,500
89,400
97,800
107,200
101,600
86,600
83,900
56,400
14,600

72
2043
810,600
80,800
82,700
90,800
98,700
107,900
104,200
88,100
83,200
58,800
15,400
2044
822,500
81,900
83,800
92,300
99,400
108,700
106,800
89,800
82,500
61,000
16,300
2045
834,300
83,000
84,900
93,700
100,400
109,200
109,200
91,700
82,100
62,900
17,200
2046
846,000
84,100
86,000
95,300
101,300
109,700
111,500
93,600
82,200
64,200
18,100
2047
857,200
85,300
86,900
97,000
102,300
110,400
113,800
95,900
82,500
64,000
19,100
2048
868,500
86,500
87,900
98,500
103,000
111,200
115,800
98,200
82,900
64,400
20,100
2049
879,700
87,600
88,800
100,000
103,900
112,000
117,400
100,700
83,400
64,700
21,200
2050
890,800
88,800
89,800
101,400
104,800
112,600
118,600
103,500
84,000
64,900
22,400
2051
901,900
89,900
90,800
102,700
105,900
113,300
119,500
106,300
84,700
65,100
23,700
Population pyramid for Simcoe, by age and sex, for 2031 and 2041
-30,000 -20,000 -10,000 0 10,000 20,000 30,000
0 to 45 to 9
10 to 1415 to 1920 to 2425 to 2930 to 3435 to 39
40 to 4445 to 4950 to 5455 to 5960 to 6465 to 6970 to 7475 to 7980 to 8485 to 8990 Plus
Simcoe Population Distribution (2031 and 2041)
2031 M 2031 F 2041 M 2041 F

73
Appendix VI: Baseline population forecast for Toronto
Population forecast, total population, by age cohort for Toronto
Year Total 0 to 9
10 to
19
20 to
29
30 to
39
40 to
49
50 to
59
60 to
69
70 to
79
80 to
89 90 +
2022
3,058,000
273,400
282,100
494,100
547,600
404,200
378,900
327,400
209,800
107,800
32,700
2023
3,093,200
273,500
281,500
499,800
557,800
413,800
371,900
335,600
216,800
108,900
33,600
2024
3,127,900
275,500
279,600
504,200
567,100
424,100
365,100
343,100
224,300
110,900
34,000
2025
3,163,300
278,800
277,400
506,100
575,900
435,700
360,300
348,400
232,800
113,300
34,600
2026
3,193,000
281,900
274,200
506,300
582,200
447,600
357,100
351,200
240,700
116,600
35,200
2027
3,212,000
282,100
270,500
506,500
584,200
458,800
355,000
350,700
246,100
122,200
35,900
2028
3,230,900
283,100
266,500
505,800
585,000
470,900
353,300
350,100
251,800
127,800
36,600
2029
3,249,700
284,600
262,600
504,700
584,500
483,200
352,400
349,200
258,000
133,200
37,300
2030
3,268,400
285,800
259,500
502,400
583,700
495,400
353,000
346,700
265,200
138,600
38,100
2031
3,287,000
285,800
258,000
500,900
582,500
505,900
355,300
343,700
272,100
144,100
38,700
2032
3,305,200
287,100
255,200
501,400
580,200
514,500
359,600
339,500
278,400
149,700
39,600
2033
3,323,200
287,800
253,700
503,300
577,000
521,100
365,600
333,200
285,600
155,300
40,600
2034
3,341,200
288,200
253,100
504,300
574,500
526,800
372,400
326,800
292,000
161,200
41,900
2035
3,359,300
288,700
252,900
505,200
571,400
531,700
380,200
321,800
296,300
167,700
43,400
2036
3,377,300
289,400
252,800
505,700
568,900
535,400
388,800
318,300
298,700
174,000
45,300
2037
3,394,800
290,500
252,000
505,800
568,100
537,400
397,900
316,600
298,900
179,000
48,600
2038
3,411,900
291,400
251,400
505,400
567,900
538,500
407,600
315,000
298,900
184,100
51,700
2039
3,429,100
292,500
251,400
505,000
567,500
538,300
417,800
314,100
298,500
189,600
54,400
2040
3,446,500
293,600
251,300
505,200
566,100
537,800
428,100
314,500
297,000
195,800
57,100
2041
3,463,700
294,900
250,400
506,900
565,000
536,700
437,000
316,300
295,000
201,800
59,700
2042
3,481,700
296,300
251,000
507,600
565,500
535,200
444,600
319,900
292,000
207,400
62,200

74
2043
3,499,700
297,800
251,500
508,700
566,400
533,400
450,700
325,200
287,400
213,700
64,900
2044
3,517,600
299,200
251,900
511,000
566,400
532,100
456,000
331,100
282,700
219,500
67,700
2045
3,535,500
300,500
252,300
514,000
566,400
530,200
460,600
337,900
279,000
223,700
70,900
2046
3,553,700
301,700
253,100
517,500
566,300
528,700
464,100
345,300
276,600
226,200
74,200
2047
3,574,200
302,500
255,700
521,400
569,600
533,000
469,200
345,700
272,900
225,800
78,400
2048
3,593,600
303,400
257,000
526,000
569,600
535,400
471,800
351,500
271,200
225,300
82,400
2049
3,612,800
304,100
258,400
531,300
569,600
537,500
473,200
357,900
269,800
224,500
86,500
2050
3,631,900
304,800
259,800
536,500
570,400
538,900
473,300
365,100
268,800
223,300
91,000
2051
3,651,000
305,400
261,200
541,100
572,800
540,400
472,500
371,700
268,500
221,800
95,600
Population pyramid for Toronto, by age and sex, for 2031 and 2041
-150,000 -100,000 -50,000 0 50,000 100,000 150,000
0 to 4
10 to 14
20 to 24
30 to 34
40 to 44
50 to 54
60 to 64
70 to 74
80 to 84
90 Plus
Toronto Population Distribution (2031 and 2041)
2031 M 2031 F 2041 M 2041 F
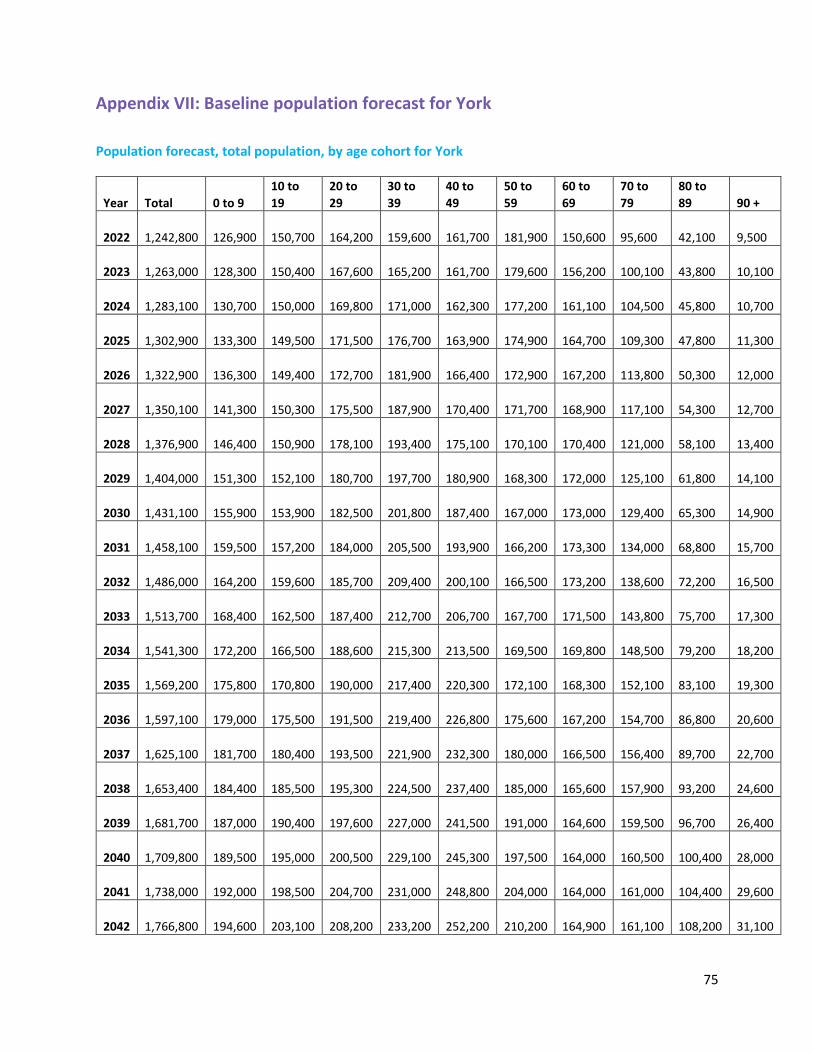
75
Appendix VII: Baseline population forecast for York
Population forecast, total population, by age cohort for York
Year Total 0 to 9
10 to
19
20 to
29
30 to
39
40 to
49
50 to
59
60 to
69
70 to
79
80 to
89 90 +
2022
1,242,800
126,900
150,700
164,200
159,600
161,700
181,900
150,600
95,600
42,100
9,500
2023
1,263,000
128,300
150,400
167,600
165,200
161,700
179,600
156,200
100,100
43,800
10,100
2024
1,283,100
130,700
150,000
169,800
171,000
162,300
177,200
161,100
104,500
45,800
10,700
2025
1,302,900
133,300
149,500
171,500
176,700
163,900
174,900
164,700
109,300
47,800
11,300
2026
1,322,900
136,300
149,400
172,700
181,900
166,400
172,900
167,200
113,800
50,300
12,000
2027
1,350,100
141,300
150,300
175,500
187,900
170,400
171,700
168,900
117,100
54,300
12,700
2028
1,376,900
146,400
150,900
178,100
193,400
175,100
170,100
170,400
121,000
58,100
13,400
2029
1,404,000
151,300
152,100
180,700
197,700
180,900
168,300
172,000
125,100
61,800
14,100
2030
1,431,100
155,900
153,900
182,500
201,800
187,400
167,000
173,000
129,400
65,300
14,900
2031
1,458,100
159,500
157,200
184,000
205,500
193,900
166,200
173,300
134,000
68,800
15,700
2032
1,486,000
164,200
159,600
185,700
209,400
200,100
166,500
173,200
138,600
72,200
16,500
2033
1,513,700
168,400
162,500
187,400
212,700
206,700
167,700
171,500
143,800
75,700
17,300
2034
1,541,300
172,200
166,500
188,600
215,300
213,500
169,500
169,800
148,500
79,200
18,200
2035
1,569,200
175,800
170,800
190,000
217,400
220,300
172,100
168,300
152,100
83,100
19,300
2036
1,597,100
179,000
175,500
191,500
219,400
226,800
175,600
167,200
154,700
86,800
20,600
2037
1,625,100
181,700
180,400
193,500
221,900
232,300
180,000
166,500
156,400
89,700
22,700
2038
1,653,400
184,400
185,500
195,300
224,500
237,400
185,000
165,600
157,900
93,200
24,600
2039
1,681,700
187,000
190,400
197,600
227,000
241,500
191,000
164,600
159,500
96,700
26,400
2040
1,709,800
189,500
195,000
200,500
229,100
245,300
197,500
164,000
160,500
100,400
28,000
2041
1,738,000
192,000
198,500
204,700
231,000
248,800
204,000
164,000
161,000
104,400
29,600
2042
1,766,800
194,600
203,100
208,200
233,200
252,200
210,200
164,900
161,100
108,200
31,100
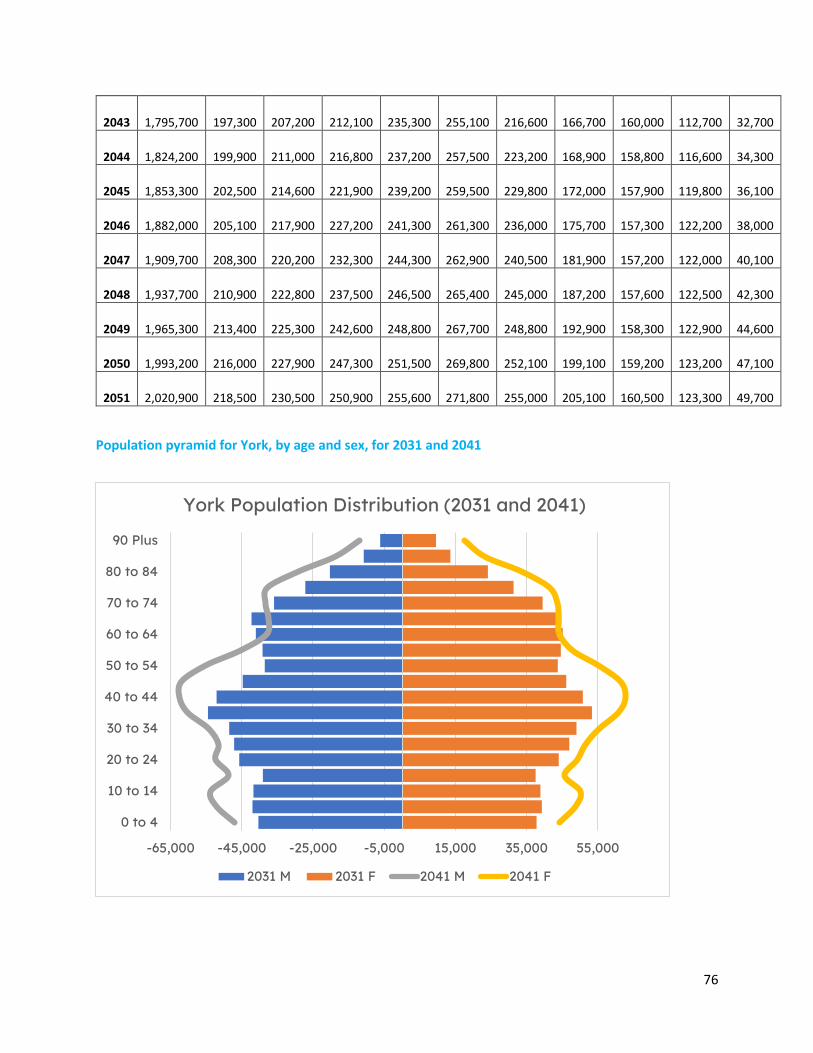
76
2043
1,795,700
197,300
207,200
212,100
235,300
255,100
216,600
166,700
160,000
112,700
32,700
2044
1,824,200
199,900
211,000
216,800
237,200
257,500
223,200
168,900
158,800
116,600
34,300
2045
1,853,300
202,500
214,600
221,900
239,200
259,500
229,800
172,000
157,900
119,800
36,100
2046
1,882,000
205,100
217,900
227,200
241,300
261,300
236,000
175,700
157,300
122,200
38,000
2047
1,909,700
208,300
220,200
232,300
244,300
262,900
240,500
181,900
157,200
122,000
40,100
2048
1,937,700
210,900
222,800
237,500
246,500
265,400
245,000
187,200
157,600
122,500
42,300
2049
1,965,300
213,400
225,300
242,600
248,800
267,700
248,800
192,900
158,300
122,900
44,600
2050
1,993,200
216,000
227,900
247,300
251,500
269,800
252,100
199,100
159,200
123,200
47,100
2051
2,020,900
218,500
230,500
250,900
255,600
271,800
255,000
205,100
160,500
123,300
49,700
Population pyramid for York, by age and sex, for 2031 and 2041
-65,000 -45,000 -25,000 -5,000 15,000 35,000 55,000
0 to 4
10 to 14
20 to 24
30 to 34
40 to 44
50 to 54
60 to 64
70 to 74
80 to 84
90 Plus
York Population Distribution (2031 and 2041)
2031 M 2031 F 2041 M 2041 F
77
Data sources used in the report
1. Age of Primary Household Maintainer (9), Tenure (4), Structural Type of Dwelling (10) and
Household Type Including Census Family Structure (9) for Private Households of Canada,
Provinces and Territories, Census Divisions and Census Subdivisions, 2016 Census - 25% Sample
Data, Statistics Canada
2. Canada Mortgage and Housing Corporation, housing starts, under construction and completions,
all areas, quarterly, Statistics Canada, Table: 34-10-0135-01,
https://www150.statcan.gc.ca/t1/tbl1/en/tv.action?pid=3410013501
3. Canada Mortgage and Housing Corporation Housing Portal, https://www03.cmhc-
schl.gc.ca/hmip-pimh/en#Profile/1/1/Canada
4. Components of population change by Census Division, 2016 boundaries, Statistics Canada, Table:
17-10-0140-01, https://www150.statcan.gc.ca/t1/tbl1/en/tv.action?pid=1710014001
5. Estimates of the components of demographic growth, annual, Statistics Canada, Table: 17-10-
0008-01, https://www150.statcan.gc.ca/t1/tbl1/en/tv.action?pid=1710000801
6. Ontario population projections, June 23, 2021, Ontario Ministry of Finance,
https://www.ontario.ca/page/ontario-population-projections
7. Population estimates on July 1st, by age and sex, Statistics Canada, Table: 17-10-0005-01,
https://www150.statcan.gc.ca/t1/tbl1/en/tv.action?pid=1710000501
8. Population estimates, July 1, by Census Division, 2016 boundaries, Statistics Canada, Table: 17-
10-0139-01, https://www150.statcan.gc.ca/t1/tbl1/en/tv.action?pid=1710013901
9. Population estimates, July 1, by Census Subdivision, 2016 boundaries, Statistics Canada, Table:
17-10-0142-01, https://www150.statcan.gc.ca/t1/tbl1/en/tv.action?pid=1710014201
10. Temporary Residents: Study Permit Holders – Monthly IRCC Updates, Open Government Canada,
https://open.canada.ca/data/en/dataset/90115b00-f9b8-49e8-afa3-b4cff8facaee
11. Temporary Residents: Temporary Foreign Worker Program (TFWP) and International Mobility
Program (IMP) Work Permit Holders – Monthly IRCC Updates, Open Government Canada,
https://open.canada.ca/data/en/dataset/360024f2-17e9-4558-bfc1-3616485d65b9
References
1. CanadaVisa (2021) Canadian Experience Class Eligibility Criteria
https://www.canadavisa.com/canadian-experience-class.html
2. Century Initiative (2021) Driving innovation and entrepreneurship in Canada: The benefits of
immigration https://uploads-
ssl.webflow.com/5f931bff6aee7ca287dbada2/61b77e0e0f07f59ea83dba78_Key-Insight-
Report%232-FINAL.pdf
3. City of Ottawa (2019) Growth Projections for the New Official Plan: Methods and Assumptions for
Population, Housing and Employment 2018 to 2046.
https://engage.ottawa.ca/8204/widgets/36458/documents/33928
78
4. City of Toronto (2021) Right-Sizing Housing and Generational Turnover.
https://www.toronto.ca/ext/digital_comm/pdfs/city-planning/right-sizing-housing-generational-
turnover.pdf
5. CMHC (2019) Driving Until You Qualify: Worth It In Montréal. https://www.cmhc-
schl.gc.ca/en/blog/2019-housing-observer/driving-until-you-qualify-worth-it-in-montreal
6. Government of Canada (2008) Government of Canada introduces changes to work permits for
international students, making Canada more attractive for skilled individuals
https://www.canada.ca/en/news/archive/2008/04/government-canada-introduces-changes-
work-permits-international-students-making-canada-more-attractive-skilled-individuals.html
7. Government of Canada (2021) Study Permits: Off-campus work
https://www.canada.ca/en/immigration-refugees-citizenship/corporate/publications-
manuals/operational-bulletins-manuals/temporary-residents/study-permits/campus-work.html
8. Government of Ontario (2006) Growth Plan for the Greater Golden Horseshoe
http://www.hns.barrie.ca/reports/fplan-eng-web-all.pdf
9. Government of Ontario (2015) Planning for Health, Prosperity and Growth in the Greater Golden
Horseshoe: 2015-2041
http://ossga.com/multimedia/0/planning_for_health_prosperity_and_growth_-
_expert_panel_report.pdf
10. Government of Ontario (2017) Growth Plan for the Greater Golden Horseshoe
https://files.ontario.ca/appendix_-_growth_plan_2017_-_oc-10242017.pdf
11. Government of Ontario (2020) A Place to Grow Growth Plan for the Greater Golden Horseshoe
https://files.ontario.ca/mmah-place-to-grow-office-consolidation-en-2020-08-28.pdf
12. Hemson (2005) The Growth Outlook for the Greater Golden Horseshoe https://hemson.com/wp-
content/uploads/2016/03/GrowthOutlookForGGH-17Jan2005.pdf
13. Hemson (2012) Greater Greater Golden Horseshoe Growth Forecast to 2041: Technical Report
https://hemson.com/wp-content/uploads/2016/03/HEMSON-Greater-Golden-Horseshoe-
Growth-Forecasts-to-2041-Technical-Report-Nov2012.pdf
14. Hemson (2013) Greater Greater Golden Horseshoe Growth Forecast to 2041: Technical Report
Addendum https://www.hemson.com/wp-content/uploads/2016/03/HEMSON-Greater-Golden-
Horseshoe-Growth-Forecasts-to-2041-Technical-Report-Addendum-and-Rev.-Appendix-B-
Jun2013.pdf
15. Hemson (2020b) Greater Golden Horseshoe: Growth Forecasts to 2051. (June 16, 2020 version)
https://www.hemson.com/wp-content/uploads/2020/06/HEMSON-Schedule-3-Forecasts-FINAL-
16JUN20.pdf
16. Hemson (2020a) Greater Golden Horseshoe: Growth Forecasts to 2051. (August 26, 2020 version)
https://www.hemson.com/wp-content/uploads/2020/08/HEMSON-GGH-Growth-Outlook-
Report-26Aug20.pdf
17. McArthur-Gupta, El-Assal, and Bajwa (2019) Can’t Go it Alone: Immigration Is Key to Canada’s
Growth Strategy https://www.conferenceboard.ca/e-library/abstract.aspx?did=10150
18. Moffatt (2021a) Baby Needs a New Home: Projecting Ontario’s Growing Number of Families and
their Housing Needs https://institute.smartprosperity.ca/publications/growing-number-
households
19. Moffatt (2021b) The Big Shift https://fsc-ccf.ca/research/the-big-shift-changes-in-canadian-
manufacturing-employment-2003-2018-executive-summary/

79
20. Moffatt, Atiq, and Islam (2021) Priced Out: A lack of housing options for working families in the
Goods Production & Distribution District of Canada’s Innovation Corridor
https://www.bot.com/Portals/0/PDFs/Priced_Out_Workforce_Housing_Affordability_GPDD.pdf
21. Office of the Auditor General of Ontario (2021) Value-for-Money Audit: Land-Use Planning in the
Greater Golden Horseshoe
https://www.auditor.on.ca/en/content/annualreports/arreports/en21/AR_LandUse_en21.pdf
22. Ontario Ministry of Finance (2021) Ontario population projections, June 23, 2021.
https://www.ontario.ca/page/ontario-population-projections
23. Parliamentary Budget Office. (2016) Household Formation and the Housing Stock A Stock-Flow
Perspective. https://www.pbo-
dpb.gc.ca/web/default/files/Documents/Reports/2016/Household%20Formation/Household%20
Formation%20EN.pdf
24. Perrault (2021) Estimating the Structural Housing Shortage in Canada: Are We 100 Thousand or
Nearly 2 Million Units Short? https://www.scotiabank.com/content/dam/scotiabank/sub-
brands/scotiabank-economics/english/documents/housing-note/housing_note_2021-05-12.pdf
25. Watson and Associates (2019) Population, Housing and Employment Growth Forecast, 2016 to
2046
https://www.cityofkingston.ca/documents/10180/31619068/Projects_Planning_PopulationHousi
ngEmploymentForecast_Final-Report_March2019.pdf/d39310e1-e11c-4f05-b1fb-2695b9a9ea71

80
Related Documents