Evidence of Causality between the Atmospheric Concentration Level of Carbon Dioxide and Temperature Kevin F. Forbes School of Business and Economics The Catholic University of America Washington, DC [email protected] 22 April 2015

Forbes co2 and temperature presentation for earth day at cua april 22 2015 updated
Jan 08, 2017
Welcome message from author
This document is posted to help you gain knowledge. Please leave a comment to let me know what you think about it! Share it to your friends and learn new things together.
Transcript

Evidence of Causality between the Atmospheric
Concentration Level of Carbon Dioxide and Temperature
Kevin F. Forbes
School of Business and Economics
The Catholic University of America
Washington, DC
22 April 2015
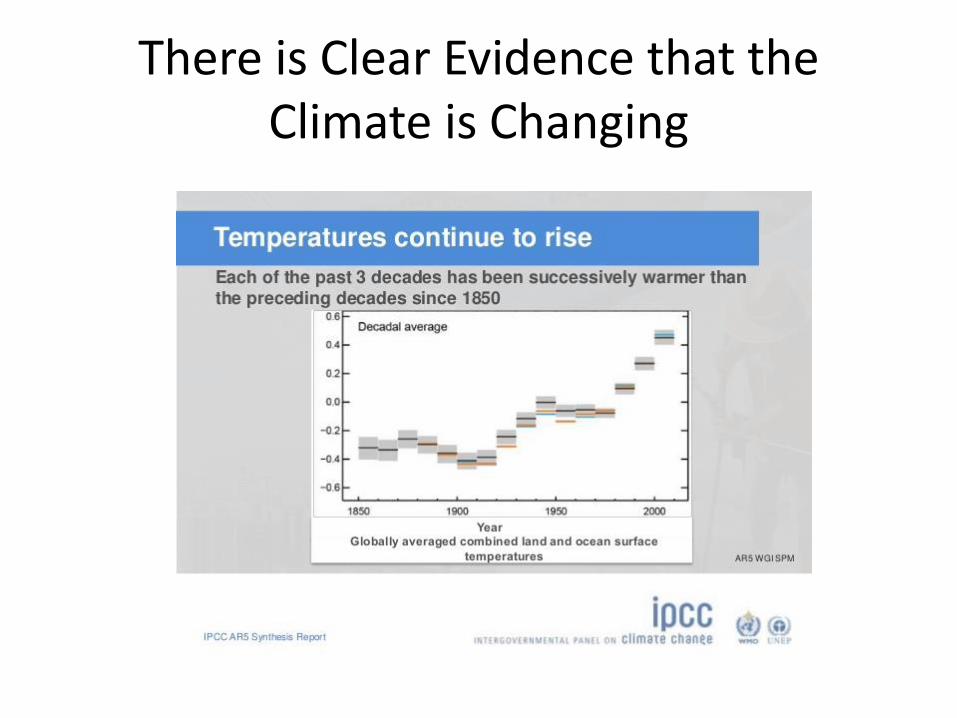
There is Clear Evidence that the Climate is Changing

Changes in the Climate Could Impose Large Costs on Future Generations

Why is the Climate Changing ? • The vast majority of climate scientists have concluded that the
changes in the climate can be attributed to human activity [Doran and Zimmerman, 2009].
• The latest IPCC report states
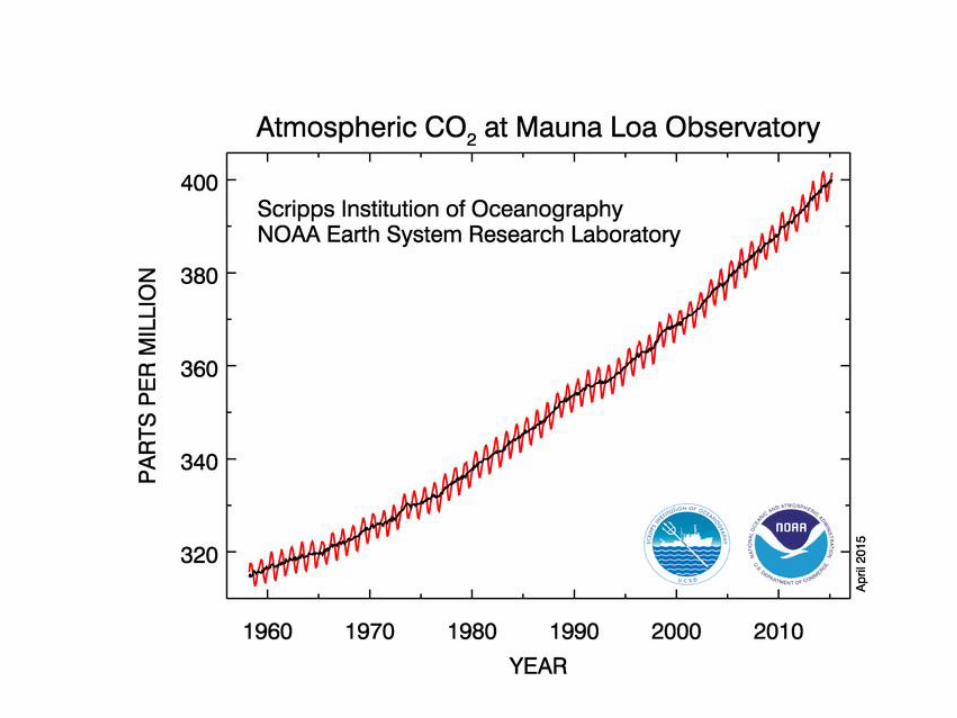
“Anthropogenic greenhouse gas emissions have increased since the pre-industrial era, driven largely by economic and population growth, and are now higher than ever. This has led to atmospheric concentrations of carbon dioxide, methane and nitrous oxide that are unprecedented in at least the last 800,000 years. Their effects, together with those of other anthropogenic drivers, have been detected throughout the climate system and are extremely likely to have been the dominant cause of the observed warming since the mid-20th century. “ IPCC, SPM 1.2, 2014
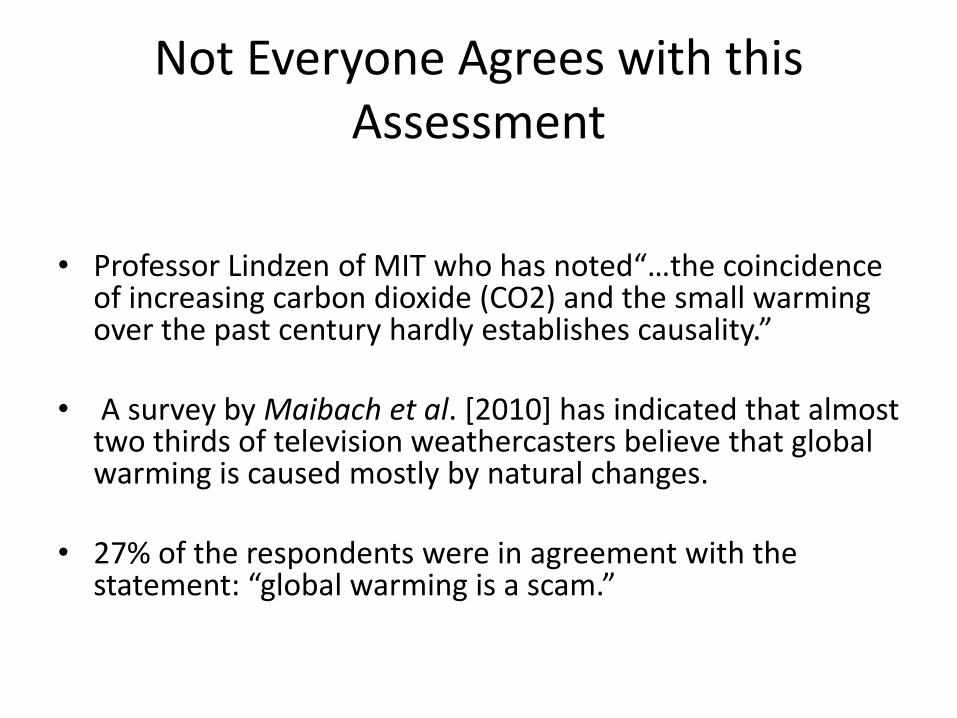
Not Everyone Agrees with this Assessment
• Professor Lindzen of MIT who has noted“…the coincidence of increasing carbon dioxide (CO2) and the small warming over the past century hardly establishes causality.”
• A survey by Maibach et al. [2010] has indicated that almost two thirds of television weathercasters believe that global warming is caused mostly by natural changes.
• 27% of the respondents were in agreement with the statement: “global warming is a scam.”
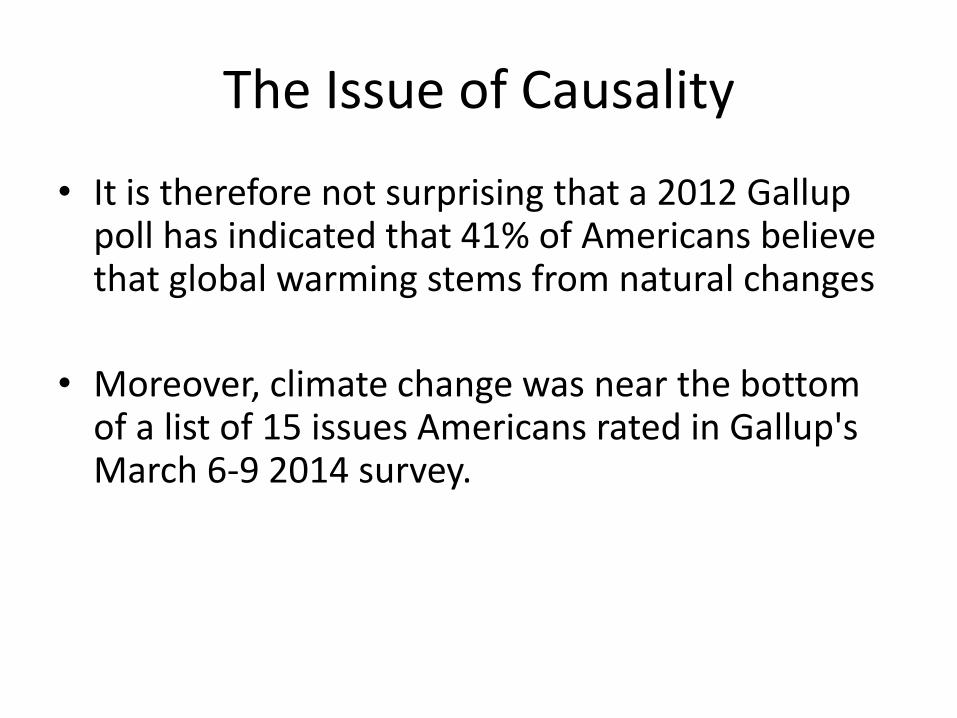
The Issue of Causality
• It is therefore not surprising that a 2012 Gallup poll has indicated that 41% of Americans believe that global warming stems from natural changes
• Moreover, climate change was near the bottom of a list of 15 issues Americans rated in Gallup's March 6-9 2014 survey.

The Lack of Causal Evidence has Undermined Climate Policy
• A recent review article notes that there has been an exceptionally high incidence of extreme weather events over the past decade and that some of the events can be linked to climate change. However, it is conceded that particular events “cannot be directly attributed to global warming.”
• Similarly, the World Meteorological Organization has noted that …“it is impossible to say that an individual weather or climate event was “caused” by climate change….”
• This qualification leaves the causes of extreme events open to question, allowing some climate skeptics to attribute the increased incidence of extreme events to so-called “natural variability.”
• Other skeptics attribute the change in climate and weather to solar activity.

Establishing Causality
• Traditional correlation analysis is not capable of addressing whether there is a causal relationship between CO2 and temperature because statistical methods alone cannot render results that establish or reject causality between two variables that are contemporaneously correlated.
• In any event, the relationship between CO2 and temperature is not readily apparent to the naked eye.

A Scatter Diagram of Hourly CO2 and Temperature Levels at the Mauna Loa Observatory in Hawaii, 1
January 1977 through 31 December 2010

The Approach of this Paper
• This paper focuses on weather, not climate.
• The starting point is that meteorologists do not explicitly take CO2 levels into account when forecasting weather. This provides an opportunity to test for the effect of CO2 on temperature while statistically controlling for the weather conditions expected by meteorologists as well as other relevant factors.
• This paper addresses the issue of causality between CO2 and temperature by following Granger [1969], who defined causality in terms of whether lagged values of a variable lead to more accurate predictions of some other variable.
• In his words, “The definition of causality …is based entirely on the predictability of the some series, say Xt. If some other series Yt , contains information in past terms that helps in the prediction of Xt and if this information is contained in no other series used in the predictor, then Yt is said to cause Xt.” [Granger, 1969, p 430].
• This study embraces Granger’s view of causality by examining whether lagged values of CO2 lead to more accurate forecasts of temperature.
Notes of Caution
• Granger’s approach can lead to a spurious attribution of causality if important explanatory variables are omitted.
• It is common to test for Granger causality using within-sample observations but this has been shown to be a questionable approach.
• There is also the risk that a researcher might be unable to find evidence of causality if the relationship under scrutiny is nonlinear but a linear specification is assumed.
The analysis here will take a number of
precautions:
• The model will include over 400 explanatory
variables with most of these variables being unquestionably of merit in explaining hourly temperature.
• The analysis will not presume linearity but will instead let the data speak to the issue of functional form
• The model will be evaluated using 5,371 out-of-sample observations.

The Approach of this Paper
• The analysis makes use of lagged hourly CO2 atmospheric concentration data from the Mauna Loa Observatory (MLO) in Hawaii, data on the hourly temperature at the nearby Hilo international Airport, and day-ahead hourly forecast data for the Hilo location.
• The day-ahead forecast data include hourly forecasts for temperature, dewpoint, humidty, probability of precipation, visibility, and measures of cloud cover.
• The day-ahead hourly forecast variables are included to control for confounding influences. They are also included to model their possible interactions with the CO2 variable.

The Approach of this Paper (Continued)
• The study controls for seasonality by including binary variables for each day of the year.
• The study also statistically controls for the level of solar irradiance for each hour.
• Solar irradiance is a key driver of the weather/climate system because it measures the energy from the sun that passes through the atmosphere and reaches the Earth’s surface.

Data Sources
• The hourly CO2 data were obtained from NOAA’s Earth System Research Laboratory.
• The Solar Irradiance data was obtained from NOAA’s Earth System Research Laboratory.
• The hourly temperature data were obtained from NOAA
• The forecast data were obtained from CustomWeather, a San Francisco based weather forecasting firm that generates forecasts for approximately 70,000 locations in 200 countries.
Attributes of the Data
• The level of solar irradiance is seasonal
• CO2 concentrations have a seasonal and diurnal pattern

The Downwelling Level of Total Solar
Irradiance at the Mauna Loa
Observatory, 1 – 31 December 2010 0
200
400
600
800
100
0
watts/s
qu
are
-mete
r
9 Dec
201
0
18 D
ec 2
010
27 D
ec 2
010
UT
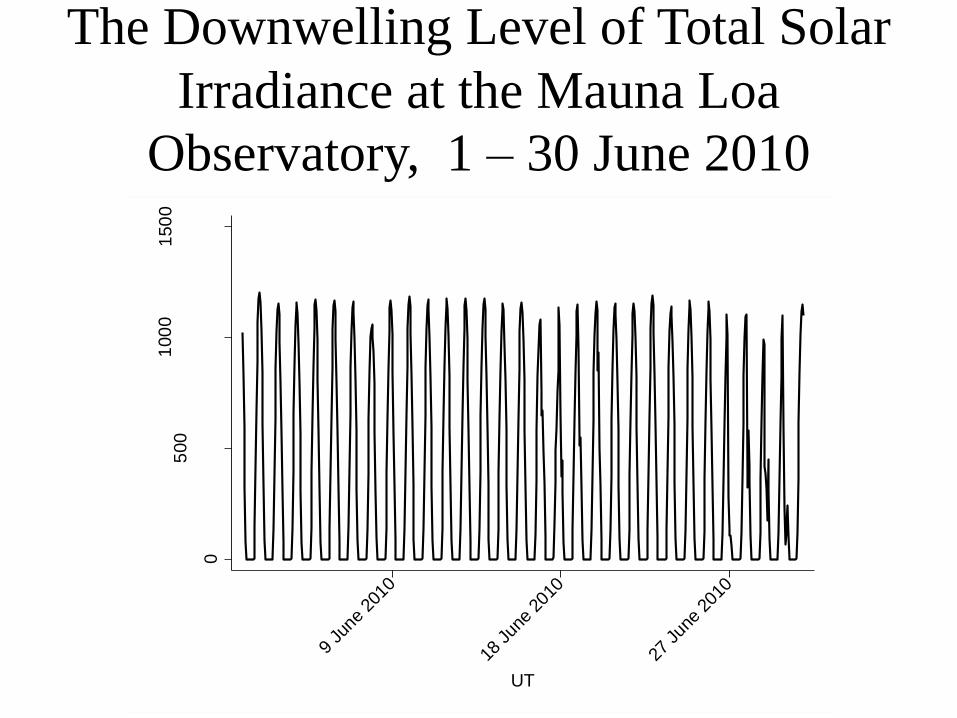
The Downwelling Level of Total Solar
Irradiance at the Mauna Loa
Observatory, 1 – 30 June 2010 0
500
100
01
50
0
watts/s
qu
are
-mete
r
9 Ju
ne 2
010
18 Jun
e 20
10
27 Jun
e 20
10
UT
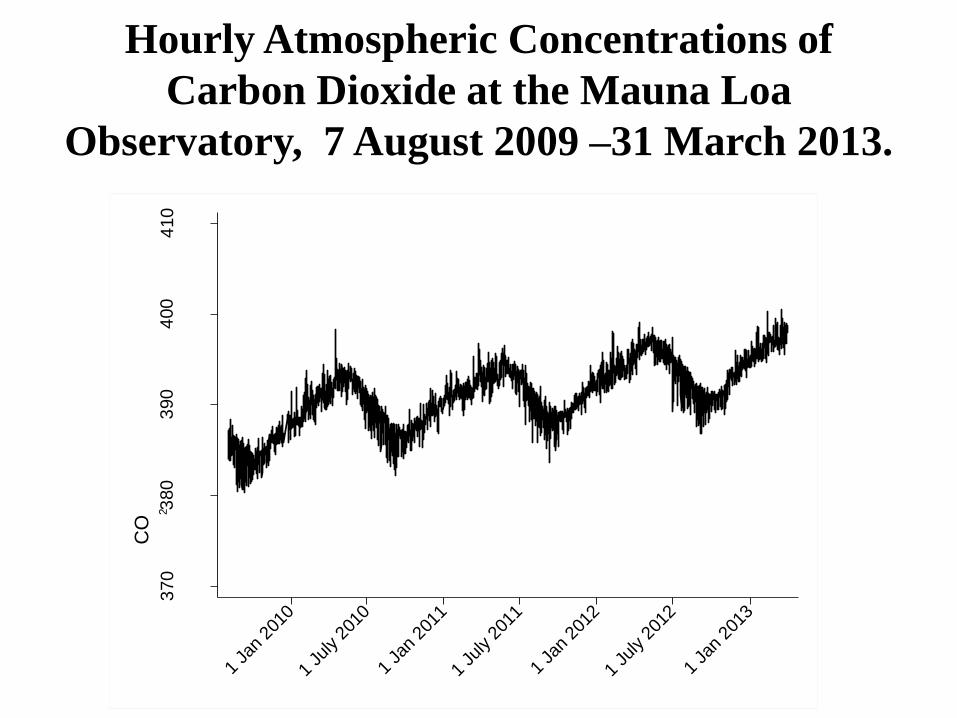
Hourly Atmospheric Concentrations of
Carbon Dioxide at the Mauna Loa
Observatory, 7 August 2009 –31 March 2013. 3
70
380
390
400
410
CO
2
Co
nce
ntr
atio
n L
eve
l (P
PM
)
1 Ja
n 20
10
1 Ju
ly 2
010
1 Ja
n 20
11
1 Ju
ly 2
011
1 Ja
n 20
12
1 Ju
ly 2
012
1 Ja
n 20
13

The Autocorrelations in the Hourly CO2
Concentration Levels at MLO, 7 August 2009 – 31
March 2013. -0
.50
0.0
00
.50
1.0
0
Au
tocorr
ela
tion
s in th
e C
O
2
Co
nce
ntr
atio
n L
evel
0 400 600 80024
Lag (Hours)
Exploiting the Diurnal Nature of the Variation in CO2
• Establishing causality requires the use of lagged CO2 values
• The CO2 concentration level in hour t – 24 is used as an explanatory variable.
• This variable is highly correlated with the CO2 level in hour t but is obviously itself unaffected by the temperature in period t.
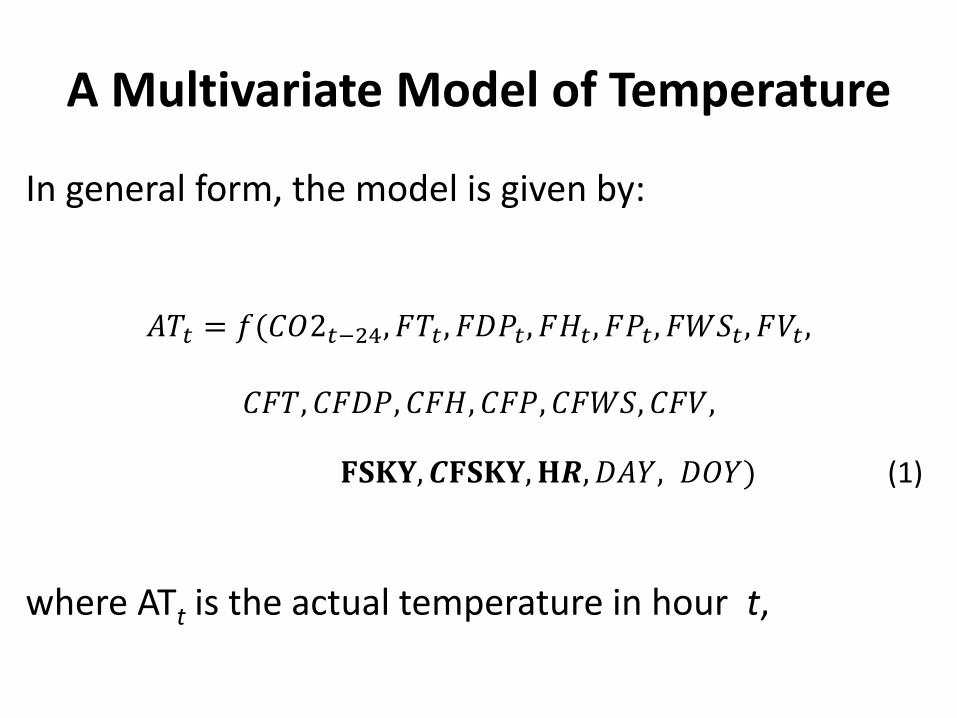
A Multivariate Model of Temperature
In general form, the model is given by:
𝐴𝑇𝑡 = 𝑓(𝐶𝑂2𝑡−24, 𝐹𝑇𝑡, 𝐹𝐷𝑃𝑡, 𝐹𝐻𝑡 , 𝐹𝑃𝑡, 𝐹𝑊𝑆𝑡 , 𝐹𝑉𝑡 ,
𝐶𝐹𝑇, 𝐶𝐹𝐷𝑃, 𝐶𝐹𝐻, 𝐶𝐹𝑃, 𝐶𝐹𝑊𝑆, 𝐶𝐹𝑉, 𝐅𝐒𝐊𝐘, 𝑪𝐅𝐒𝐊𝐘,𝐇𝑹,𝐷𝐴𝑌, 𝐷𝑂𝑌) (1)
where ATt is the actual temperature in hour t,
The Estimated Equation has Two Components
• Structural Component : reflects the CO2 concentration level, forecasted weather, solar irradiance, and the seasonality variables
• ARMA Component : This component takes into account that the weather outcome at time period t is not independent from the weather outcomes in t-1, t-2, t -3, … t-k where k is the maximum lag incorporated into the model.
The Estimated Results
• CO2 has a statistically significant effect on temperature
• The effect is highly contingent on forecasted weather conditions (e.g. forecasted humidity)
• The model has an R-squared equal to 0.928
Out-of-Sample Results
• The out-of-sample evaluation period is from 1 April 2013 to 31 December 2013.
• There are 5,371 hours in the evaluation period
• The evaluation focuses on the accuracy of the structural forecasts and the hour-ahead forecasts
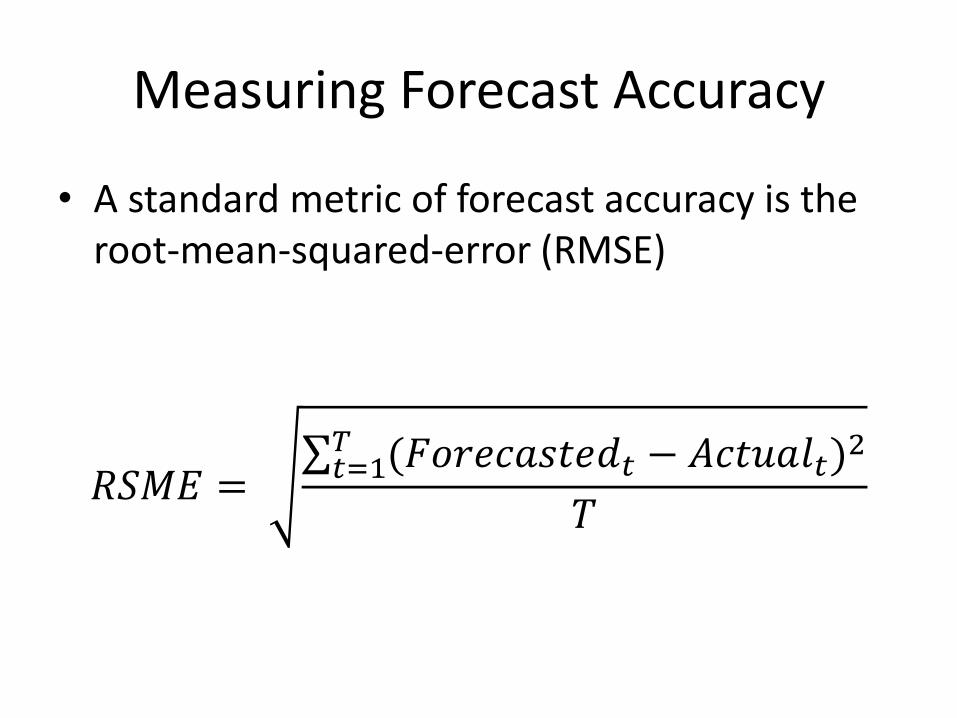
Measuring Forecast Accuracy
• A standard metric of forecast accuracy is the root-mean-squared-error (RMSE)
𝑅𝑆𝑀𝐸 = (𝐹𝑜𝑟𝑒𝑐𝑎𝑠𝑡𝑒𝑑𝑡 − 𝐴𝑐𝑡𝑢𝑎𝑙𝑡)
2𝑇𝑡=1
𝑇

Out-of-Sample Structural Forecasts
• A structural forecast does not consider the estimated ARMA terms
• Two structural forecasts were calculated
• The first structural forecast considers all the estimated coefficients exclusive of the ARMA terms
• The second structural forecast assumes that the estimated effects of CO2 are equal to zero

• The first structural forecast is more accurate than CustomWeather’s. It is also more accurate than NOAA’s day-ahead forecast for the same location.
• The second structural forecast that has a very large RMSE. It is also severely biased in the sense that it underestimates temperature.

Actual Temperature at the Hilo International
Airport and NOAA’s Temperature Forecast,
1 April – 31 December 2013 0
51
01
52
02
53
03
54
0
Actu
al T
em
pe
ratu
re (
oC
)
0 5 10 15 20 25 30 35 40
Day-Ahead Forecasted Temperature (oC)
RMSE = 2.36 o C
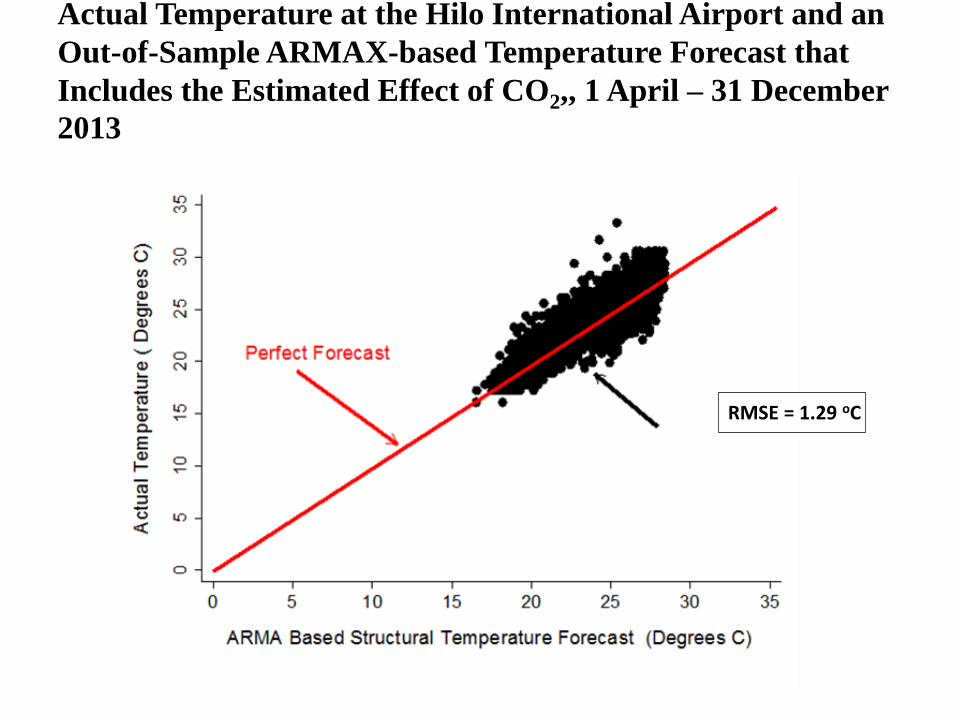
Actual Temperature at the Hilo International Airport and an
Out-of-Sample ARMAX-based Temperature Forecast that
Includes the Estimated Effect of CO2,, 1 April – 31 December
2013
RMSE = 1.29 oC
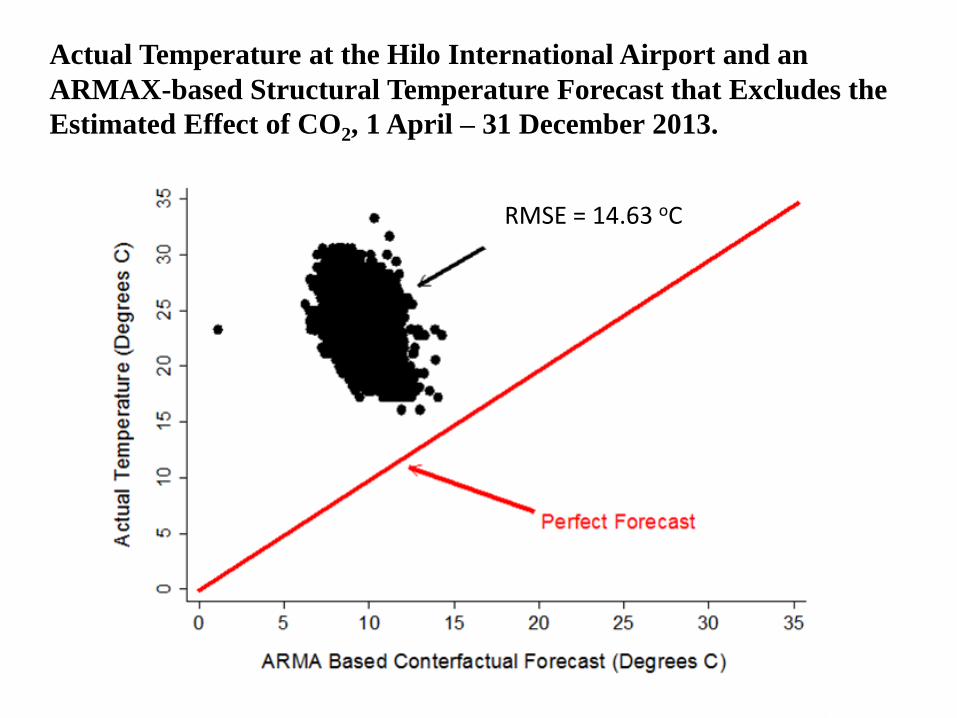
Actual Temperature at the Hilo International Airport and an
ARMAX-based Structural Temperature Forecast that Excludes the
Estimated Effect of CO2, 1 April – 31 December 2013.
RMSE = 14.63 oC

Hour Ahead Forecasts
• Two hour-ahead forecasts were created.
• Both of these forecasts incorporate the estimated ARMA terms
• The first hour-ahead forecast incorporates the estimated effect of CO2
• The second hour-ahead forecast ignores the estimated effect of CO2

Actual Temperature at the Hilo International Airport and an ARMAX-
based Hour-Ahead Temperature Forecast that Includes the Estimated
Effect of CO2, 1 April – 31 December 2013
05
10
15
20
30
35
25
Actu
al T
em
pe
ratu
re (
oC
)
0 5 10 15 20 25 30 35
Predicted Temperature (oC )
RMSE = 0.78 oC
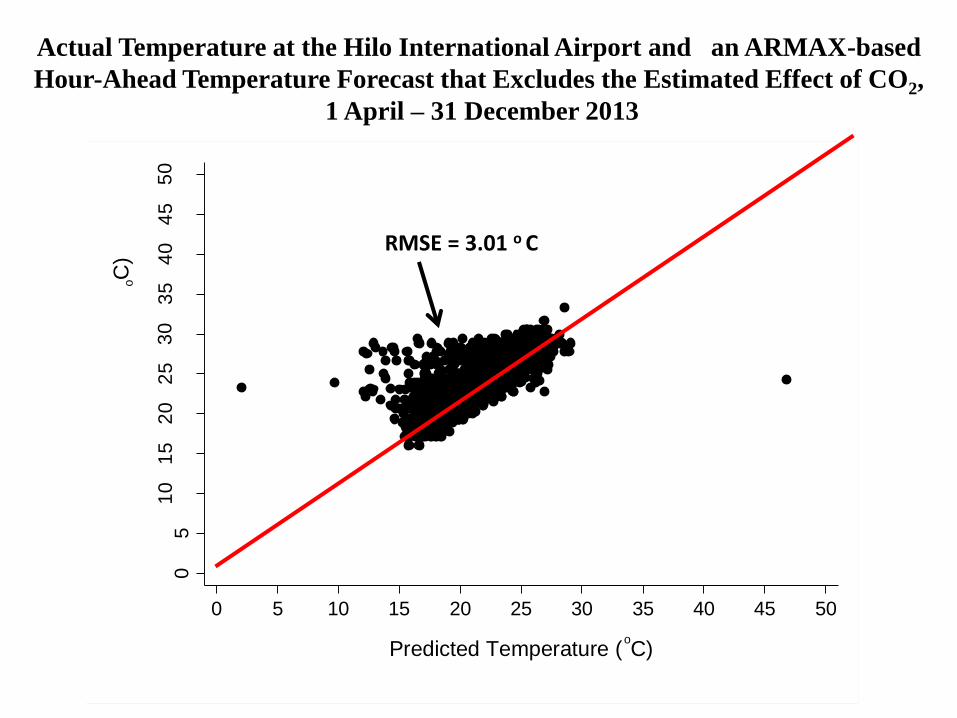
Actual Temperature at the Hilo International Airport and an ARMAX-based
Hour-Ahead Temperature Forecast that Excludes the Estimated Effect of CO2,
1 April – 31 December 2013
05
10
15
20
25
30
35
40
45
50
Actu
al T
em
pe
ratu
re (
oC
)
0 5 10 15 20 25 30 35 40 45 50
Predicted Temperature (oC)
RMSE = 3.01 o C

Conclusion
• The out-of-sample results are consistent with causality between CO2 and temperature.
• In the absence of methodological and/or data issues, the only other explanation for the reported results is that there is an omitted relevant explanatory variable.
• Such a variable would need to be one that is highly correlated with the CO2 concentration level, whose contribution to temperature is consistent with scientific principles, but one which is somehow ignored by leading meteorologists.
• Moreover, the inclusion of this possibly nonexistent variable in a forecasting model would need to give rise to an out-of-sample temperature forecast that has a RMSE of less than 0.78 oC.
Future Research Efforts • The research will make use of CO2 data from
other locations such as Barrow, Alaska; West Branch Iowa; Moody, Texas; Walnut Grove California; Beech Island South Carolina; and even the South Pole.
• Depending on data availability, the possible contributions of methane (CH4) and other greenhouse gases will be examined.
• The relationship between CO2 and other measures of weather (e.g. precipitation) will also be explored.
Future Research Efforts
• A longer-term research objective is the establishment of a forecasting institute.
• Users of the institute’s services would obtain accurate temperature forecasts consistent with actual CO2 levels.
• Users would also be provided with counterfactual forecasts
that assume CO2 levels such as 350 PPM • Given the importance of weather in people’s lives, these
two sets of forecasts could lead to a more reasoned assessment of the policy options.

Acknowledgments
The results presented in this paper rely on the data collected at the Mauna Loa Observatory. I thank the Earth System Research Laboratory (ESRL), Global Monitoring Division (GMD), of the National Oceanic and Atmospheric Administration (NOAA) for supporting the operations of this observatory. I thank NOAA’s National Climatic Data Center for its data. I thank CustomWeather for providing me with the forecast data. I am particularly grateful to Richard Reed and Agustin Diaz for answering my many questions about the forecast data. The modeling expertise necessary to complete this research has been enhanced by a research grant from the U.S. National Science Foundation [Award #0921964]. I have benefited from discussions on the topic of nonstationary and ARMA modeling with my colleague and frequent coauthor Ernest Zampelli. I thank Gustavo Sanchez of StataCorp LP for sharing his expertise. I thank Michael A. Forbes for writing the software to automate the downloading of NOAA’s day-ahead forecast data for the out-of-sample evaluation period. Any errors are the full responsibility of the author.
Related Documents