A Plan for Los Angeles County Trans p 0 r tat ion for the st entur ~ LOS ANGELES COUNTY ~ , METROPOLITAN .'.. TRANSPORTATION Adopted March 1995

Welcome message from author
This document is posted to help you gain knowledge. Please leave a comment to let me know what you think about it! Share it to your friends and learn new things together.
Transcript

A Plan forLos Angeles County
Tr a n s p0 r tat ion for the
st entur~ LOS ANGELES COUNTY
~ , METROPOLITAN
. '.. TRANSPORTATION
Adopted March 1995
LIST OF EXHIBITS
• Exhibit 2-1: SCAG Region Population Estimates: 1990 and 2015....... 22
• ' Exhibit 2-2: Population Density per Acre: 1990 and 2015 23
• Exhibit 2-3: Population Growth: 1990 - 2015 24
• Exhibit 2-4: ,SCAG Regional Employment Estimates: 1990 and 2015 .. 25
• Exhibit 2-6: Employment Growth: 1990 - 2015 28
• Exhibit 2-7: AM Peak Period Average Freeway Speed: 1990 and ,2015...................................................................... 30
• Exhibit 2-8: AM Peak Hour Freeway Level of Service: 1990 and2015...................... 31
• Exhibit 2-9: AM Peak Period Average Arterial Speed: 1990 and2015............... 32
• E~bit 2-10: MIA Average Systemwide Bus Speed 33
• Exhibit 3-2: Major Projects (Map) : 45
• Exhibit 3-3: List of Projects and Programs 46
• Exhibit 3-4: Candidate Areas for Mobility Allowance (Map) 53
• Exhibit 3-5: Fixed Route Bus Expansion Schedule 54
• Exhibit 3-6: Rail Projects (Map) 58

LIST OF EXHIBITS
• Exhibit 3-8:· Rail Project Schedules 60
• Exhibit 3-9: Railbus Corridor Examples (Map) 63
• Exhibit 3-10: Highway/HOV Projects (Map) 68 '
• Exhibit 3-11: High Occupancy Vehicle Lane Miles............................. 69
• Exhibit: 3-12: Highway Project Schedule 70
. • Exhibit 3-14: Peak Period Average Freeway Speed (Baseline Vs.Adopted Plan)........................................................ 88
• Exhibit 3-15: Peak Hour Freeway Level of Service (Baseline Vs.Adopted Plan)........................................................ 89
• Exhibit 3-16: Peak Period Average Arterial Speed (Baseline Vs.Adopted Plan)........................................................ 90
• Exhibit 3-17: Year 2015 Average AM Period Mode/Facility SpeedBy Scenario........................................................... 92
• Exhibit 3-18: Year 2015 Average Door to Door SpeedBy Scenario 93
• Exhibit 4-1: Sales Tax Revenue Projections-30 Year PlanVs. Long Range Plan.......... 95
• Exhibit 4-2: Financial Summary - 20 Year Sources of Funds 99
• Exhibit 4-3: Financial Summary - 20 Year Use of Funds ·. 100
• Exhibit 4-4: Financial Summary 101
]
]]
]
]
]
],
-,a~
J]
]
]
]
"lJIJn)
• Exhibit 4-5: Projects and Programs (includes complete listingwith total costs)................................................. 102
• Exhibit 4-6: Projects and Programs (cost detail by revenuesource)......................... 104
• Exhibit 4-7: Funding Source ~ligibility................................................ 137
• Exhibit T-1: Plan Development Methodology....................................... I
• Exhibit A-I: Travel Forecasting Model Process 4
• Exhibit A-2: Travel Forecasting ModeL 6
• Exhibit A-4: Individual Projects and Programs Evaluated.................... 10
• Exhibit A-5; Call for Projects Analysis Procedure 11
• Exhibit A-6: Cost Effectiveness Vs. Mobility Index(Call for Projects)................................................. 12
• Exhibit A-7: Cost Effectiveness Vs. Air Quality Index Reductions(Call for Projects).................................................. 14
• Exhibit A-8: Cost Effectiveness Vs. Mobility Index(HighwayProjects) 15
• Exhibit A-9: Cost Effectiveness Vs. Air Quality Index Reductions(Highway Projects) :.......................... 16
LIST OF EXHIBITS
• Exhibit A-IO: Cost Effectiveness Vs. Mobility Index(Rail Projects)....................................................... 17
• Exhibit A-II: Cost Effectiveness Vs. Air Quality Index Reductions(Rail Projects)....................................................... 19
• Exhibit A-I2: Cost Effectiveness Vs. Mobility Index(All Projects)....................................................... 20
• Exhibit A-I3: Cost Effectiveness Vs. Air Quality Index Reductions(All Projects)......................................................... 21
• Exhibit A-IS: Home to Work Trip Mode Shares 24
• Exhibit A-I6: Year 2015 Rail Ridership Estimates(Daily)................................................................... 25
• Exhibit A-I7: Year 2015 Rail Ridership Estimates(New Daily)........................................................... 26
• Exhibit A-I8: Mobility and Cost Effectiveness (By Scenario) 27
• Exhibit A-19: Air Quality and Cost Effectiveness (By Scenario) 29
• Exhibit A-20: Average AM Peak Period ModelFacility Speed 30
• Exhibit A-21: Average Door to Door Speed 31
• Exhibit A-22: Home to Work Trip Mode Shm:es 34
• Exhibit A-23: Mobility and Cost Effectiveness 35
• Exhibit A-24: Air Quality and Cost Effectiveness 36
JnIJ]
]
3D11.. •.•...
I
]
]
Jn!]].",
.l:1
n]
]
j

LIST OF EXHIBITS
• Exhibit A-25: Year 2015 Average AM Period Mode/Facility SpeedBy Scenario 38
• Exhibit A-26:Year 2015 Average Door to Door SpeedBy Scenario............. 39
• Exhibit A-27: Letter from Modeling Peer Review PaneL 40
• Exhibit A-28:Metropolitan Planning Factors (Matrix) 42
• Exhibit B-1: Baseline Projects and Programs (includes listing withtotal costs)........................................................... 49

PREFACE'
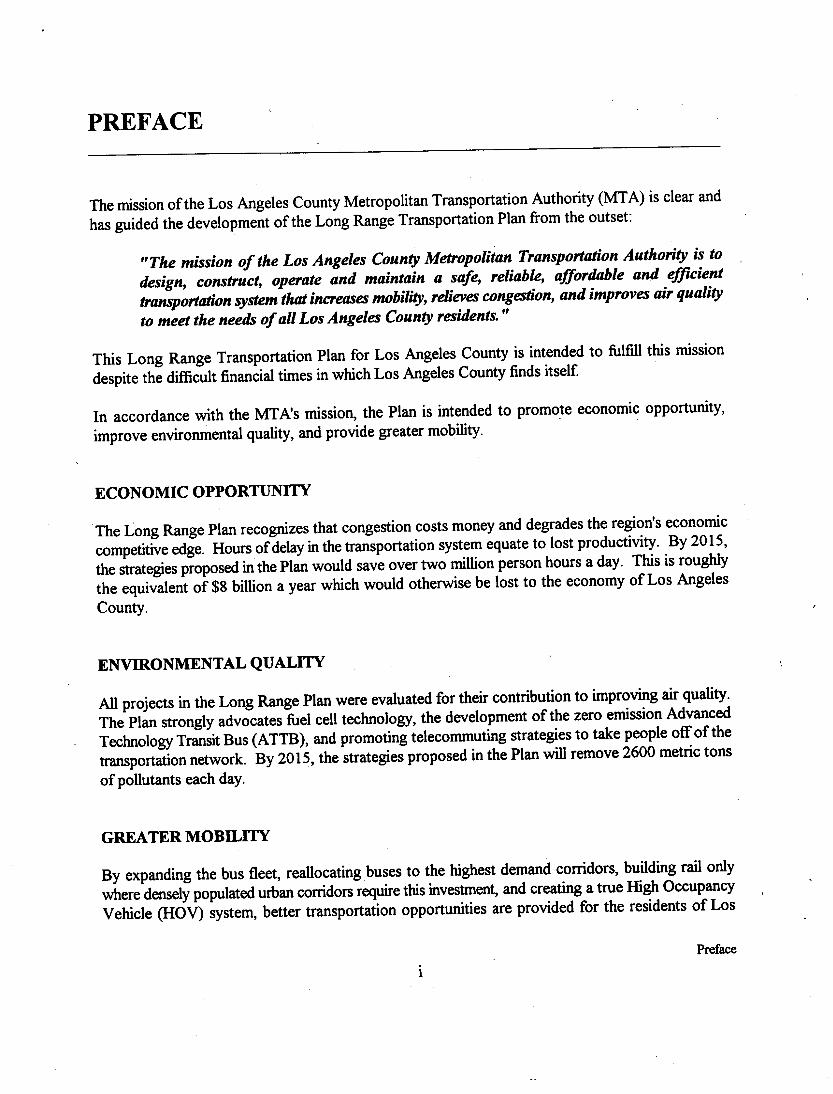
The mission of the Los Angeles County Metropolitan Transportation Authority (MTA) is clear andhas guided the development of the Long Range Transportation Plan from the outset:
"The mission of the Los Angeles County Metropolitan Transportation Authority is todesign, construct, operate and maintain a safe, reliable, affordable and efficienttransportationsystem that increasesmobility,relievescongestion, and improves air qualityto meet the needs of all Los Angeles County residents. "
This Long Range Transportation Plan for Los Angeles County is intended to fulfill this missiondespite the difficult financial times in which Los Angeles County finds itself
In accordance with the MTA's mission, the Plan is intended to promo~e economic opportunity,improve environmental quality, and provide greater mobility.
The Long Range Plan recognizes that congestion costs money and degrades the region's economiccompetitive edge. Hours of delay in the transportation system equate to lost productivity. By 2015,the strategies proposed in the Plan would save over two million person hours a day. This is roughlythe equivalent of $8 billion a year which would otherwise be lost to the economy of Los AngelesCounty.
All projects in the Long Range Plan were evaluated for their contribution to improving air quality.The Plan strongly advocates fuel cell technology, the development of the zero emission AdvancedTechnology Transit Bus (ATTB), and promoting telecommuting strategies to take people off of thetransportation network. By 2015, the strategies proposed in the Plan will remove 2600 metric tonsof pollutants each day.
By expanding the bus fleet, reallocating.buses to the highest demand corridors, building rail onlywhere densely populated urban corridors require this investment, and creating a true High OccupancyVehicle (HOV) system, better transportation opportunities are provided for the residents of Los
Angeles County. Through a mobility allowance program, people will be provided with a wide arrayof transit options to better meet their needs. By 2015, the strategies in the Long Range Plan willactually increase the number and percentage of people using transit for work trips.
The Long Range Plan projects $72.4 billion in revenues over the next 20 years and is financiallyconstrained. Given the magnitude of the mobility challenge facing Los Angeles County, the programenvisioned in the Long Range Plan must be delivered as cost effectively and efficiently as possible.To that end, the MTA has undertaken an aggressive cost containment program. To the extent thatsignificant cost reductions can be achieved in the Long Range Plan, additional projects and programscould be added to the Plan.
])
)
]
]
]~.'.•J
]
]
l]
]
]
]
]
1]]

EXECUTIVE SUMMARY

EXECUTIVE SUMMARY
The Los Angeles County Metropolitan Transportation Authority (MT A) was created by theCalifornia State Legislature to administer and plan transportation services for Los Angeles County.The MT A Board adopted a statement of the agency's mission in Eebruary 1994:
"The mission of the Los Angeles County Metropolitan Transportation Authority is todesign, construct, operate and maintain a safe, reliable, affordable and, efficienttransportationsystem that increasesmobility,relievescongestion, and improves air qualityto meet the needs of all Los Angeles County 'residents." .
This Transportation Plan for Los Angeles County, known as the Long Range Plan, is the strategicplan of the MTA and establishes the framework that will guide the MTA in fulfilling its mission. TheLong Range Plan takes. into account economic realities and offers reasonable, workable andachievable solutions to the transportation problems facing Los Angeles County.
, The basic premise of the Long Range Plan is that Los Angeles County residents will use publictransportation ifit is safe, convenient~clean, on time, and affordable. The MTA intends to make surethat the Los Angeles County transportation system is all of these.
This Executive Summary will cover the Resolutions adopted by the MT A Board and will alsohighlight:
• Major Project and Program ,Elements of the Long Range Plan
RESOLUTION
RESOLVED,. that the Board of Directors of the Los Angeles County MetropolitanTransportationAuthorityadopts, at itsMarch 22, 1995meeting,the Long Range Transportation Planwhich includes:
a. a report back on an implementationplanfor a demonstrationprogram of the MobilityAllowance Concept in FY 1995-96~
b. a report back on a study of the feasibility of using Diesel Multiple Unit (DMU)technology on the MTA owned rights-of-way~
c. a report back on potential cost savings measures in areas of the constructionprogram~
d. requiringspecific action for approyalof each project and program in the Long RangePlan~
e. establishing a formal review and readoption of the Long Range Plan every twoyears~
g. utilization of the Long Range Transportation Plan as a strategic planning tool toassist in the development of other plans~
a. no MTA funds be allocated to the Alameda Corridor Project until either the ThirdAmendmentis repealed and full power is restored to the Governing Board on whichthe MTA is represented, or MTA has a seat on the Finance Committee~
b. the CEO work with the Alameda Corridor Transportation Authority on a valueengineering review to identifypotential cost savings opportunities~
c. the CEO direct affected project area teams to meet with corridor eities and reportback to the Board within90 dayswith a range of options for lessening the deleteriouseffectsof the increased freight traffic associated with the Alameda Corridor Project~and
d. any local contributions to the Alameda Corridor be applied to meet the minimum localmatch requirements to all future phases in Los Angeles County.
a. a cost containment plan be developed by staff for Board approval within the next 90days which includes a report on design and construction savings, potential newrevenue as well as a forecast of operational costs for the next 20 years;
b. a 5-year implementation plan be developed for Board approval within 180 days, whichwould incorporate the cost constraints presented in the Cost Containment Plan, bydetailing timeline, actions, criteria, and projects to be pursued;
c. staff deveiop within 180 days an implementation strategy for the Mobility AllowanceProgram detailing its target population, funding, criteria, and resource deployment;and
d. coordinate staff efforts with SCAG to ensure that the Long Range TransportationPlan is in conformance with the Regional Mobility Element;
RESOLVED FURTHER, that the second phase of the East-West Valley rail line, from the405 Freeway to the Warner Center, be included as part of the group of five rail linesscheduled for inclusion in the Long Range Plan should funds become available in the 2nddecade of the Plan;
RESOLVED FURTHER, that the MT A continue to work with the Los Angeles CountyDepartment of Airports and any other agency or entity that may be appropriate in an effortto secure the construction of a rail connection between the Metro Green Line and the LAXCentral Terminal Area, and report back on a quarterly basis beginning July 1, 1995, theprogress of the effort;
RESOLVED FURTHER, that Caltrans present their 1995-1996 and long-range soundwallprograms within 60 days to the MT A's Planning and Programming Committee; which shallinclude alternate funding scenarios to accelerate the program in Los Angeles County withnotice of the presentation to be given to all affected jurisdictions within Los Angeles County;
RESOLVED FUR'qIER, that the Board reaffirms its policy to only support projects that areenvironmentally addressed. With regard to the 710 Gap Closure project, the fundsprogrammed in the Long Range Transportation Plan shall not be released until theenvironmental issues raised by EI Sereno and other cities are fully addressed; and
RESOL VED FURTHER, that the Canoga right-of-way from the Chatsworth MetrolinkStation to Warner Center is included as a candidate corridor in the DMU-Rail-Bus OptionElement, during the development of the plans to implement the DMU technology in variousareas; and
RESOLVED FURTHER, that Director Alatorre's motion regarding the Pasadena Blue Line,Director Fasana's motion regarding Pasadena Rail Line and HOV lanes, and Director Cragin'smotion regarding extension of the Green Line into the Galleria Shopping Mall, are referredto a Cost Containment Workshop for-further review and analysis.
THE MOBILITY CHALLENGE
Based on demographic forecasts prepared by the Southern California Association of Governments(SCAG), population and employment in Los Angeles County, in terms of both growth and density,will increase dramatically in the next two decades.
• Los Angeles County population will increase by almost 3 million people by the year 2015.This is an increase of over 35% from the 1990 population and is equivalent to adding a citythe size of Los Angeles to the County population.
• Los Angeles County employment ~ increase by over 1.3 millionjobs by the year 2015. Thisis an increase of almost 29% from the 1990 employment base.
Without improvements to our current transportation system or changes in the behavior of thetraveling public, the projected increase in population and employment would reduce averagecountywide morning peak period speeds from a current level of 30 to 40 miles per hour to 15 milesper hour or, in some rapidly growing outlying areas, to less than 10 miles per hour.
While demands on the transportation system continue to grow, the amount offunding projected tobe available during the next 20 years to improve the system is limited. This is mainly due to theprolonged recession which has led to structural changes in the Los Angeles County economy. Thesechanges will result in a reduction in anticipated future sales tax revenues.
With significant population and employment growth, and given constrained financial resources, theregion must judiciously focus its resources on maximizing the use of the existing transportationsystem and implementing new projects, programs and strategies that most effectively improve transitcapacity and speed. This strategy will provide viable alternatives to the single occupant automobiletrip.

DEVELOPMENT OF THE LONG RANGE PLAN
The Long Range Plan is the end-product of an intensive six month planning process during which theMT A analyzed and considered various planning and financial scenarios. It was an open process inwhich the MT A Board, interested parties, and the public were invited to review and comment on theresults of planning and financial analyses conducted up to that point and to provide direction forfuture steps.
• Establish the Baseline - A baseline list of projects and programs which were either underconstruction or fully funded was developed as the starting point for the Long Range Plan.
• Detennine MTA Financial Capacity - An analysis was completed to estimate the amountof revenues available to fund additional projects and programs beyond the Baseline.
• Establish List of Additional Projects and Programs - A list was created of additionalprojects and programs that would enhance the Baseline transportation system.
• Analyze the Impacts of Projects and Programs - Using a computer simulation model, arigorous technical analysis was conducted to determine mobility, air quality, and cost-effectiveness contributions of the Baseline system, and each individual new project andprogram, to projected year 2015 conditions.
• Establish Planning Scenarios - Financially constrained scenarios were developed whichincluded different combinations of bus, rail and highway projects and programs.
• Analyze Impacts of Scenarios - Each of the planning scenarios were analyzed to determinetheir mobility, air quality, and cost-effectiveness impacts along with their impacts on transitmode share.
• DevelopAdopted Long Range Plan - The A~opted Long Range Plan was developed basedon the analysis and process described above.
• Evaluate and Implement Cost Savings - The MT A Board established a Board committeethat will evaluate existing and planned construction projects for potential cost savings.
In part, the Long Range Plan is being developed to provide a strategic planning tool for use in. developing other planning and programming documents. These include plans developed by theSouthern California Association ofGovemments (SCAG), the officially designated regional planningagency.

the exi~ing Regional Mobility Element (RME) as well as in compliance with federal ISTEA planningand air quality requirements. The RME of the Regional Comprehensive Plan is SCAG's major policyand planning statement on the region's transportation issues and goals. The Long Range Plan willalso be an important building block in the regional planning process and will assist SCAG in preparingfor future updates of the RME. The Plan is not a substitute for the adopted RME or regionalplanning process, rather, it is an input to the process.
MAJOR ELEMENTS OF THE LONG RANGE PLAN
The Long Range Plan vision is to develop a multimodal system that better serves the needs of transitdependent riders, while also providing a network that will attract solo drivers out of their cars,primarily through faster transit speeds, improved quality of service and more conpnute choices.
The Long Range Plan sets forth major policy directions which will guide the MT A in accomplishingits mission to construct and operate a safe, reliable, affordable and efficient transportation system:
• Maintain existing revenue sources and aggressively pursue new transportation revenues forLos Angeles County. In particular, seek to maintain a 50% federal contribution to currentand future rail lines. This Plan assumes that approximately 50% of the funding for Red LineSegments 2 and 3 will come from federal contributions to the projects, as consistent with theFull Func;ling Grant Agreement. The assumption of a 50% federal contribution is carriedforward for the funding of three future rail lines: San Fernando Valley EastlWest and theEastern and Western extensions of the Metro Red Line. Ifthefederal contribution, eitheron an annual or a total basis, is lower than anticipated, the timing and delivery of theabove projects will be impacted
• Improve bus transit service by targeting highly transit dependent areas with better, morefrequent service. Create financial allowances, through the Mobility Allowance program, tofund flexible transit options such as smart shuttles, vans, community based transit,neighborhood collectors, shared taxis for off-peak service and other alternative servicedelivery strategies. Add 300 buses to the total countywide peak bus fleet to improve servicequality in high demand areas and, as rail lines open, eliminate duplicate bus routes and thereby'reallocate up to 140 additional buses for other needed services.
The development of the Advanced Technology Transit Bus (ATTB) is a key component ofthe MT A's strategy to improve the comfort, convenience, cost efficiency, and operatingquality of bus service throughout Los Angeles County. In conjunction with the ATTBdevelopment, a Fuel Cell Buyers' Consortium has also been formed to achieve the rapid andsuccessful transition to zero emission buses. This conversion will help to improve air qualityand will support defense conversion efforts and the creation of new advanced technology jobsin Los Angeles County.
~
]
.]
)
j
).
]
]
]
]
]]
]
]
]
]
]
]
]

• Continue developing Los Angeles County's rail network by opening the Metro Green Linesystem, building the Pasadena. Line, building a rail line in the San Fernando Valley andcompleting the Eastern and Western. extensions of the Metro Red Line. Six additionalprojects that performed well are still under consideration in the second decade of the Plan ifadditional funds become available. These projects are Crenshaw Corridor; DowntownConnector; Exposition Line (Downtown to USe); Glendalel Burbank Line; San FernandoValley East-West (405 Fwy to Warner Center); and the 10/60 Corridor. Certain otherprojects had lower overall performance; however, future funding changes (such as creationof special programs at the State or Federal level) may warrant special consideration of theseprojects. For example, if a special funding source for intermodal connections becomesavailable, the Green Line eastern extension to Norwalk might become a viable project.
• Improve highway transit speeds and service by constructing 279 miles ofROV lanes andgap closures on freeways and major streets, adding 130 miles of arterial bus lanes on surfacestreets and increasing traffic signal synchronization efforts throughout the county.
• Promote and implement innovative strategies that encourage mass transit usage byidentifYingcustomer needs and providing a system that meets those needs. These strategiesinclude methods of optimizing the current system by making it more efficient and reliable, aswell as methods that make transit easier to use through market research of both transit usersand non-transit users and implementation of transit-related advancements such as improvedpassenger information systems and smart fare cards.
• Make use of existing rights-of-way by enhancing commuter rail service and exploring theoption of using railbus (DMU) technology to provide a lower cost alternative to light railsystems in corridors such as Glendale/Burbank, and the extension to the Pasadena Line.
• Participate as a financial partner in the Alameda Corridor project to help to ensure theeconomic success of the region by facilitating the efficient movement of goods.
• Promote changes in behaviors of the commuting public by exploring and advancingpolicies that discourage single occupancy vehicle travel and encourage greater reliance ontransit, ridesharing, and innovative alternatives such as telecommuting. These policy changeswill also encourage local jurisdictions to implement parking management and land use.strategies that are favorable to public transportation.
• Implement cost savings measures to increase the cost efficient delivery of both transitservices and capital projects.
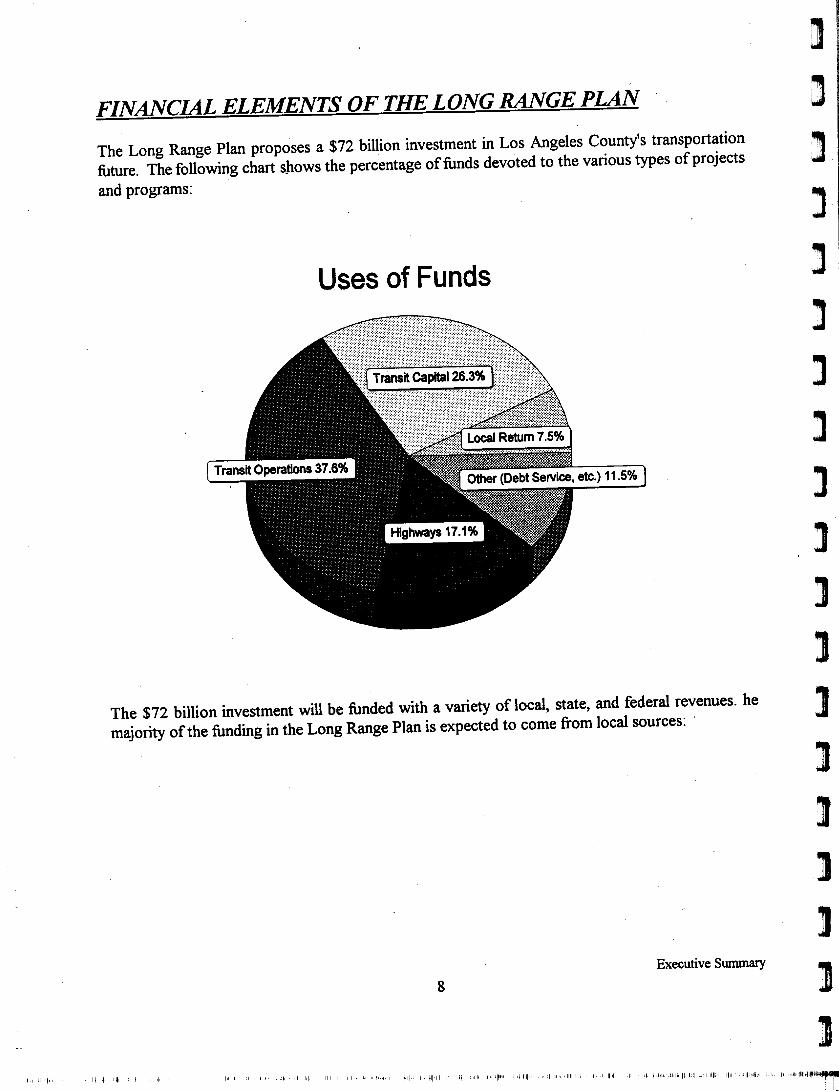
FINANCIAL ELEMENTS OF THE LONG RANGE PLAN .
The Long Range Plan proposes a $72 billion investment in Los Angeles County's transportationfuture. The following chart spows the percentage of funds devoted to the various types of projectsand programs:
Uses of Funds
The $72 billion investment will be funded with a variety of local, state, and federal revenues. hemajority of the funding in the Long Range Plan is expected to come from local sources:
m
J]
JJ)
]
]
]
]]
]
]]]
]
]
]
]
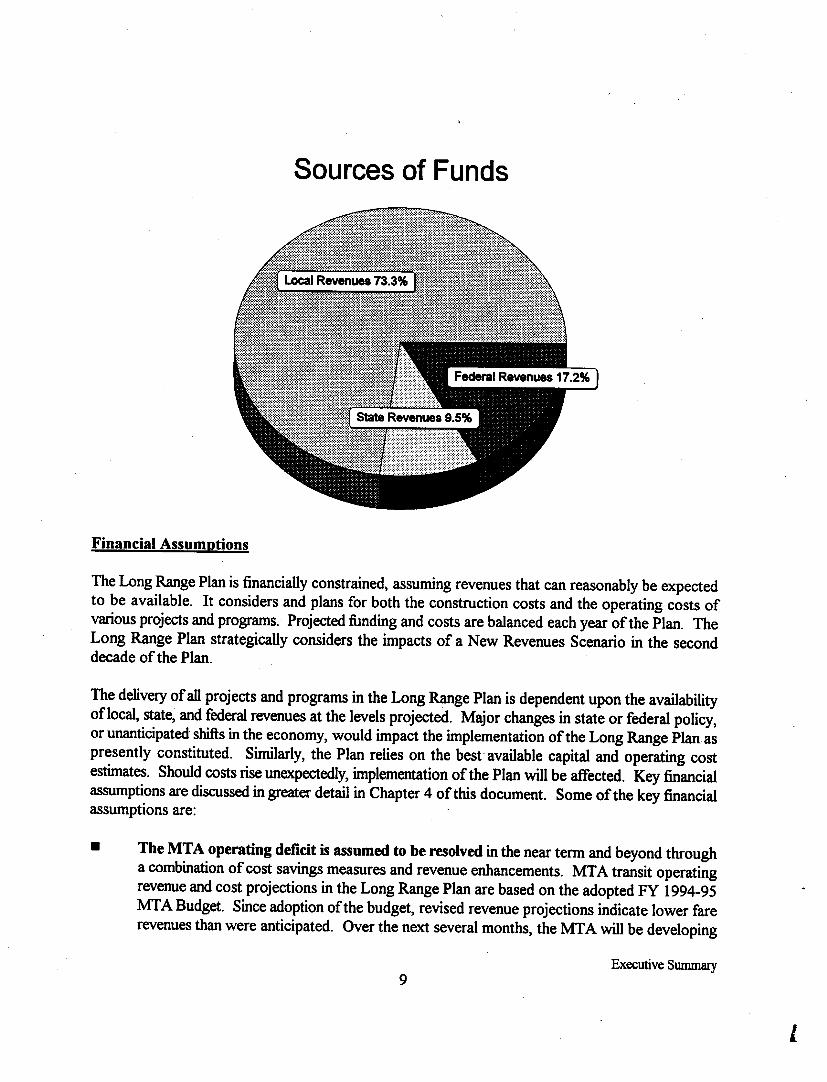
Sources of Funds
The Long Range Plan is financially constrained; assuming revenues that can reasonably be expectedto be available. It considers and plans for both the construction costs and the operating costs ofvarious projects and programs. Projected funding and costs are balanced each year of the Plan. TheLong Range Plan strategically considers the impacts of a New Revenues Scenario in the seconddecade of the Plan.
The delivery of all projects and programs in the Long Range Plan is dependent upon the availabilityoflocal, state, and federal revenues at the levels projected. Major changes in state or federal policy,or unanticipated shifts in the economy, would impact the implementation of the Long Range Plan. aspresently constituted. Similarly, the Plan relies on the best' available capital and operating costestimates. Should costs rise unexpectedly, implementation of the Plan will be affected. Key financialassumptions are discussed in greater detail in Chapter 4 of this document. Some of the key financialassumptions are:
• The MTA operating deficit is assumed to be resolved in the near term and beyond througha combination of cost savings measures and revenue enhancements. MTA transit operatingrevenue and cost projections in the Long Range Plan are based on the adopted FY 1994-95MTABudget. Since adoption of the budget, revised revenue projections indicate lower farerevenues than were anticipated. Over the next several months, the MT A will be developing
a balanced budget for FY 1995-96 that will use updated revenue forecasts and may requirechanges in the way that the MT A delivers and funds its current programs. As the Budget isdeveloped, impacts on the Long Range Plan will be analyzed and incorporated.
The September 1994 UCLA Business Forecasting Project Long Term Forecastfor LosAngeles County is used in the Long Range Plan to project future sales tax revenues totalling$33 billion in the plan period. These revenues constitute over 45% of the total funding in thePlan and are used in part to fund debt service on bonds for rail and highway constructionprojects. If sales tax revenues are lower than projected, planned projects would be delayeduntil bonds could be issued, unless comparable new revenues were identified or cost savingsmeasures were implemented.
No new revenue sources are assumed to be available over and above those local, state, andfederal revenue sources that are currently available. It is assumed that the MT A will maintainthe level offunding provided by its current revenue sources and that this level of funding willincrease with inflation. In particular, the Plan assumes that approximately 50% of the fundingfor Red Line Segments 2 and 3 will come from federal contributions to the projects, asconsistent with the Full Funding Grant Agreement. The assumption of a 50% federalcontribution is carried forward for the funding of three future rail lines: San Fernando ValleyEast/W est and the Eastern and Western extensions of the Metro Red Line. If the federalcontribution, .either on an annual or a total basis, is lower than anticipated, the timingand delivery of the aboveprojects will be impacted.
A contingency / reserve fund is established in the second decade of the Plan. The Plan setsaside revenues of approximately $700 million, or less than 1% of the total planned revenues,for this reserve/contingency fund. In order to receive federal funds for future rail projects,the MTA will most likely be required to maintain a reserve fund. Also, this contingency fundguards against the impacts of future unanticipated reductions in planned revenues or increasesin project and program budgets.
/
]
J]
JJj
] !
]
]
J]
]
]]
]
J]
J]

CHAPTERlINTRODUCTION
CHAPTER 1: INTRODUCTION
In April 1992, the Los Angeles County Transportation Commission adopted a 30-Year IntegratedTransportation Plan and committed to update the plan every two years. Since that first plan, a newpublic agency known as the Los Angeles County Metropolitan Transportation Authority (MT A) wascreated to merge the countywide public transportation responsibilities of the Commission and theregional transit responsibilities of the Southern California Rapid Transit District. The MT A has abroad scope of responsibilities which encompass programming of the region's transportation funds,coordination of various transportation services, construction and operation of the public transitsystem, and integration of transit and highway systems and programs throughout the County.
The MT A Board adopted a statement of its mission as a new agency in February 1994:
"The mission of the Los Angeles County Metropolitan Transportation Authority is to design,construct, operate and maintain a safe, reliable, affordable and efficient transportationsystem that increases mobility, relieves congestion, and improves air quality to meet theneeds of all Los Angeles County residents. "
This new Transportation Plan for Los Angeles County, known as the Long Range Plan, implementsthe MTA's mission and is driven by the following goals:
• INTEGRA TED, MULTIMODAL SYSTEM: Provide for a mix of transportation. alternatives that is capable of meeting the continuing need for personal mobility and themovement of goods. Continue to build on and improve the significant investment alreadymade in highways and transit in Los Angeles County.
• FISCAL STABILITY: Reduce costs and increase cost efficiency, to "live within ourmeans", without compromising services. Undertake new or expand existing projects andprograms only as existing or new revenues permit. Focus on maintaining and expandingexisting revenue sources and obtaining new revenues.
• CUSTOMER SERVICE: Pursue technologies that make using public transportation moreattractive and improve our service and communication to customers. Increase systemreliability and efficiency by ensuring that trains and buses run on time and that adequateresources are made available to ensure a clean, safe environment for transit passengers.

• EQUITY AND ECONOMIC DEVELOPMENT: Ensure that the $72 billion investmentrepresented by the Long Range Plan is equitably distributed, based on transportation needs,and that the economic impacts are managed to maximize community benefit. Facilitateeconomic development in conjunction with transit improvements. Also, focus on equity withrespect to cost, quality and access to service.
• ENVIRONMENT: Continue pursuing alternate fuel technologies and other initiatives toimprove air quality.
The Plan is multimodal, recognizing that we must provide r~sidents and visitors with more choiceson how to get from point A to point B, whether their destinations are work, shopping or recreation.While the automobile will continue to be the most popular mode of travel in Los Angeles, increasingtraffic congestion and air quality concerns demand that we provide residents with alternatives todriving alone. The challenge is to ensure that alternative modes of travel are safe, reliable, efficient,and affordable.
Affordability is a key component of the plan, at two levels. A large percentage ofMTA riders aretransit-dependent, relying on public transportation to reach their jobs, run errands, and visit friendsand family. Affordable transportation alternatives must be provided for these residents, as well as forall transit users to maintain and increase transit ridership. At another level, the MTA is requiredunder new federal directives to develop a long-range transportation plan that is affordable and canbe delivered with revenues estimated to be available over the next twenty years. In order to receivefederal funds made available through the Intermodal Surface Transportation Efficiency Act of 1991(ISTEA), the MTA must demonstrate that its long range plan for constructing highway and railprojects and operating the transit system is a balanced and fiscally-constrained one.
The 20-year mobility challenge is daunting. The percentage of people using transit and ridesharinghas continued to decline, while the amount of travel in Los Angeles continues to rise. Additionally,more than 3 million new residents and 1.3 million new jobs will be added to the Los Angeles regionover the next two decades. Without improvements to our current transportation system or changesin the behavior of the traveling public, average countywide commuting speeds currently at 30 to 40miles per hour will decline to 15 miles per hour or, in some rapidly growing outlying areas, to lessthan 10 miles per hour. Improved transit speeds, ridesharing and aggressive, perhaps painful, demandmanagement measures will be needed to keep pace with the population growth and essential. .econonuc expansIon.
While the demands on the transportation system continue to grow, the amount of funding projectedto be available during the next 20-years to improve the system is limited. The 30-Year Plan hadestimated that more than $100 billion would be. available over 20 years to support an ambitiouscollection of transit and highway projects. The prolonged recession has led to structural changes to
J!::]
]
j
j
]
]
]
]
]
]
]
]
]
]
JJJ]
the Los Angeles County economy, reducing the anticipated future sales tax revenue receipts byalmost one third in the same time frame.
\
With constrained financial resources, projected decreasing transit usage, and significant populationand employment growth, the MTA must focus its resources on projects, programs and strategies thatmost effectively improve the capacity and speed of transit to provide viable alternatives to the singleoccupant automobile trip.
The Adopted Plan proposes a $72 billion investment in Los Angeles County's transportation system.These funds will be used to maintain and improve transit service levels throughout the County, buynew buses, build highway projects such as high occupancy vehicle lanes, construct new rail lines,implement strategies to improve transit speeds, and test innovative services such as smart shuttles andcommunity-based transit. This investment will be funded with a variety of local, state and federalrevenues.
The Long Range Transportation Plan is the end-product of a six month planning process duringwhich the MT A analyzed and considered various planning and financial scenarios. It was an openprocess in which the MT A Board, interested parties, and the public were invited to review andcomment on the results of planning and financial analyses conducted up to that point and to providestaff with direction for future steps. This was done through a series of six MT A Board publicworkshop presentations. Additionally, these workshop presentations were reviewed with electedofficials, local agenpies, community groups, and business organizations.
Anticipating regional transportation demands over a 20 year period is a complex, time-consumingtask which requires the use of computer models for data analysis, coupled with sound planningjudgment. During the planning process, data was reviewed which indicated where and what thecurrent transportation demands are, where growth is expected to occur in the region, how this willaffect future mobility, and which transportation modes best meet the unique needs of residents livingin different areas.
1. Establish the Baselin~: A baseline list of projects was developed as the starting point forthe reassessment of the Long Range Plan. It included those projects currently underconstruction or having a full funding commitment. These projects are listed in Appendix B..
2. Detennine MTA Financial Capacity: After the baseline list of projects is funded, additionallocal, state and federal revenues are available to fund new projects and programs within thetwenty year period.

Establish List of Additional Projects and Programs: A list was created of additionalprojects and programs above the baseline which would enhance the baseline list of projectsand programs and provide further solutions to transportation problems. These projects andprograms do not currently have a firm funding commitment.
Analyze the Impacts of Projects and Programs: Using a computer simulation model, arigorous technical analysis was conducted of the impacts of the Baseline system and eachindividual new project to determine cost-effectiveness, mobility, and air quality impactsassociated with these projects. This quantitative method of evaluating projects wasaccompanied by a more qualitative method, based on ISTEA Metropolitan Planning Factors,which address the environmental, social and economic impacts of projects as well as theircontribution to an intermodal system.
Establish Planning Scenarios: Using the results of the steps above, potential scenarios weredeveloped which included different combinations of bus, rail and highway projects andprograms. Each of these scenarios was financially-constrained, based on currently projectedrevenues available.
Analyze the Impacts of Scenarios: Eachofthe potential scenarios were analyzed, as before,to determine their cost-effectiveness, mobility, and air quality impacts, along with theirimpacts on transit mode share.
Develop Adopted Long Range Plan: The Adopted Long Range Plan was established basedon the results of all the above steps. The Adopted Plan incorporates the scenario whichperformed the best overall. It is important to note that the delivery of all projects andprograms contained in the Adopted Plan is dependent on local, state, and federal revenuescurrently available over the next two decades. The economic assumptions are based on thebest information available at the present time. Major changes in current policy at the state orfederal level, or unanticipated shifts in the economy, would impact our ability to implementthe Adopted Plan as presently constituted.
Evaluate and Implement Cost Savings Initiatives: The MT A Board established a Boardcommittee that will evaluate existing and planned construction projects for potential costsavings. These and other cost savings initiatives will be ongoing and recommendations,results, and impacts on the Long Range Plan will be reported back to the Board.
Any cost savings achieved through these initiatives would result in additional revenues whichcould be used to mitigate the effects of unanticipated reductions in local, state or federalrevenues, to fund unanticipated increases in project or program costs, or to fund additionalprojects and programs beyond those in the Adopted Plan. The Adopted Long Range"Plan willbe updated to reflect new cost information as well as other changes and additions to the Planresulting from cost savings.
~
'.'.:WI
]
J]
]
j
]
]
]
]
]
]
]
]
]
]
]
]

The LACTC Board adopted the 30-Year Plan in 1992 with the guiding recommendations that includean annual update to the Board and formal review and readoption of the Plan every two years. TheAdopted Plan provides much more than a fo~al review of the. existing Plan; it includes newdirections and policies for a new agency facing major challenges.
Since the 1992 adoption of the Plan, significant and profound changes have occurred which have far-reaching and permanent impacts on.the MTA in terms of providing solutions to the transportationproblems facing Los Angeles County. These major events include:
Merger: The merger of the Los Angeles County Transportation Commission with theSouthern California Rapid Transit District to create the Los Angeles County MetropolitanTransportation Authority. The merger united within one agency all the planning,programming and operating functions for Los Angeles County's regional transportationsystem. As a new organization, the MT A has had to reorganize and redefine many of itsinternal and external goals;
Recession: The most severe and protracted recession in Los Angeles County since the GreatDepression. Economic forecasts conducted subsequent to the 1992 adoption of the 30-YearPlan estimate that sales tax revenues will decrease by as much as $6 billion due to therecession's structural impact on the region's economy. Economic conditions combined withthe delay in the construction of Los Angeles County's transportation system have alsoimpacted the availabilityof other local, state and federal revenues. For example, the amountof bonds issued has decreased by $10 billion, transit fares and other local revenues arereduced by $7 billion, and state and federal revenues are reduced by $9 billion. Overall, therevenue reduction over the 20 year period equals more than $30 billion.
State Funding Shortfalls: A $5 billion shortfall in the State Transportation ImprovementProgram (STIP), resulting in a loss of revenues to the MT A and project delays;
Together, these events result in substantially lower revenue projections, some higher project costsdue to delays, and new priorities, requiring a reduction in the transportation program envisioned inthe adopted 30-Year Plan.
Also reflected in the Adopted Plan is the MTA's decision to shorten the planning time frame fromthirty to twenty years. This decision is based in part on the Intermodal Surface TransportationEfficiency Act of 1991 (ISTEA) requirement that long-range metropolitan plans be fiscally-constrained within a 20-year time frame. Also, a twenty year time period is more realistic to forecastfuture issues and conditions.
The Long Range Plan was designed to provide a flexible policy framework and planning tool for theevaluation of complex transportation policy choices and funding decisions within the 20-year planninghorizon. While the Plan provides a framework and overall policy direction for these otherplans and processes, it is not a substitute for separate, specific MTA Board action on thesedocuments. In addition, the fact that a project is included in the Long Range Plan is not a substitutefor Board action on the proJect. All review, approval, and regulatory requirements related to eachspecific project are performed independently of the Long Range Plan.
The Long Range Plan provides a framework for the following plans or documents prepared by theMTA:
• Transportation Improvement Programs• Short Range Transit Plans• Multi- Year Call for Projects• MTA Annual Budget• Congestion Management Plan
• Regional Mobility Element• Air Quality Management Plan• Regional Transportation Improvement Program
Chapter 2, The Mobility Challenge: Regional Transportation and Demographic Conditions,describes the context in which the region's transportation system operates through a discussion ofpopulation and employment projections, development patterns, and travel and environmentalconditions. Additionally, it raises key issues to be considered in improving the system.
Chapter 3, The Plan, describes the proposed transportation system by element: TRANSIT,HIGHWAY, MULTIMODAL,and TRANSPORTATION POLICY. Each element includes adiscussion of the various strategies incorporated in that element. The chapter concludes with adescription of how the Plan performs in light of performance measure indices, mode split, transitspeeds, and highway and freeway speeds.
Chapter 4, FinancialElement, describes the economic conditions affecting the County and outlinesthe key financial policies and assumptions t~at underlie the Long Range Plan. It includes a
]~WI
rI,'WI
JJ]
Jj
]
]
]
]
]
]
]
]
','JI
]
]

description of current project and program costs by element and the revenues available to fund thetransportation system over the next 20 years.
Finally, the Technical Appendices provide additional information on the project evaluation processused in the development of the Plan, a description of the baseline program, and other technical andreference materials.

CHAPTER 2THE MOBILITY CHALLENGE

CHAPTER 2: THE MOBILITY' CHALLENGERegional Transportation and Demographic Conditions
Before undertaking a plan of action, the environment in which the plan is to unfold must first beanticipated. The Long Range Transportation Plan provides a blueprint for addressing not onlythe present conditions, but the future that the plan is to encompass. That future has beenestablished as the next twenty years culminatingat the Year 2015. What does the future hold forLos Angeles County growth and travel conditions? Answering this question is·the first step indetermining the most prudent options that will best accommodate that future. This is the mobilitychallenge.
There are known factors upon which the future can be postulated. The trends in demographicgrowth, travel behavior, existing transportation systems and previously adopted transportationcommitments all point to a future that will occur if no fundamental change in these elementsoccur. This is the Baseline Scenario that was analyzed to identify the magnitude of thetransportation problem facing Los Angeles County by the Year 2015. This chapter providesadditional detail on the sources of information used to forecast Baseline Scenario conditions.Using the deficiencies identified in this analysis, potential alternatives designed to mitigate theeffects can be identifiedand evaluated in subsequent steps of the planningprocess.
Demographic forecasts for Los Angeles County are prepared by the Southern CaliforniaAssociation of Governments (SCAG). As the federally-mandated Metropolitan PlanningOrganization covering Los Angeles and neighboringcounties, it is required that these populationand employment forecasts be used in planning studies that may lead to federal and state funding.SCAG's forecasting process subdivides county-level control forecasts, provided by the StateDepartment of Finance, into each of, the census tracts (approximately 1,650 in Los AngelesCounty) on the basis of the general land use plans provided by the various jurisdictions in theregion. This forecast of census tract demographics is used in the MTA computerized travelsimulation forecasting model. The MTA Long Range Transportation Plan utilizes the Year 2015Forecast prepared by SCAG in April 1994.
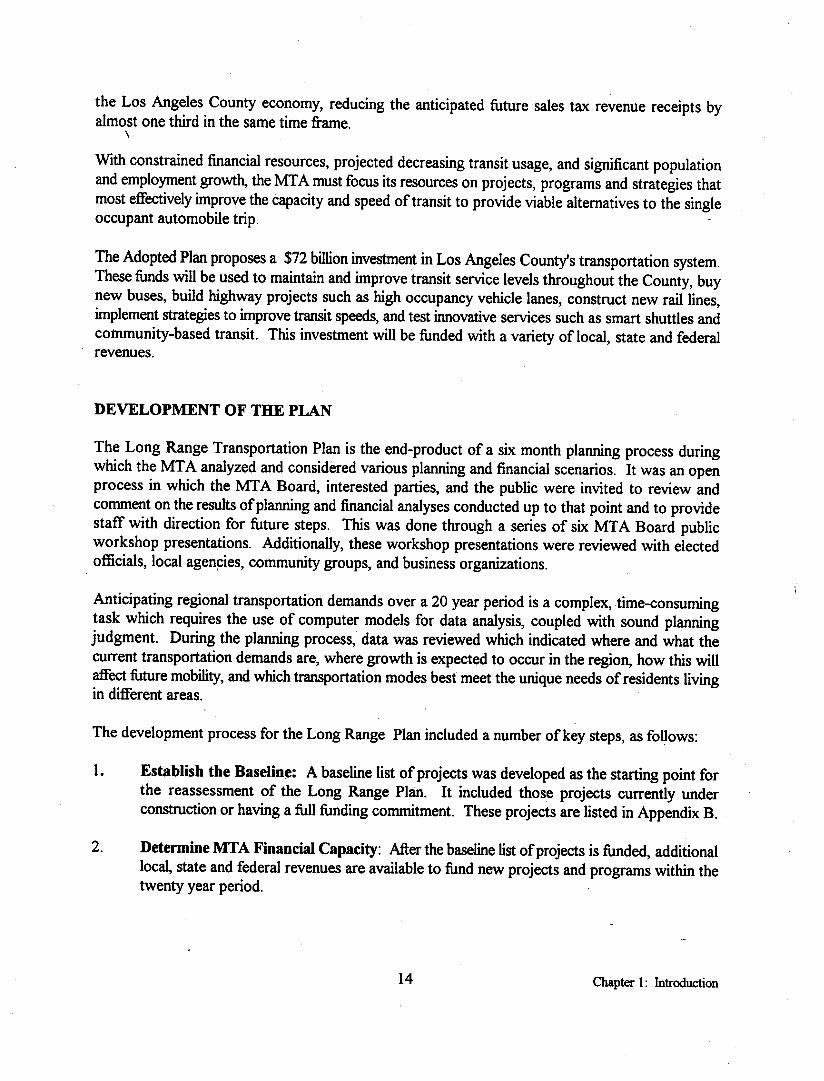
In 1990, the Census Bureau recorded approximately 8.9 million people living in Los AngelesCounty (Exhibit 2-1). By the Year 2015, this population is expected to grow to 11.8 million.This represents an increase of nearly three million and 35 percent more than currently reside inLos Angeles County. It is noteworthy that this projected increase, alone, is more than currentlyreside in Orange County today, and nearly the equivalent of adding another city of Los Angeles tothe existing county population.
Currently, the highest population density in Los Angeles County occurs in the central area in andaround downtown Los Angeles (Exhibit 2-2), with medium densities in the Beach Cities and LongBeach areas. By the Year 2015, the Burbank-North Hollywood and Glendale-North Los Angelesareas will reach the medium density level, while the East San Gabriel Valley, North San FernandoValley and Santa Monica areas will achieve the low-medium density category.
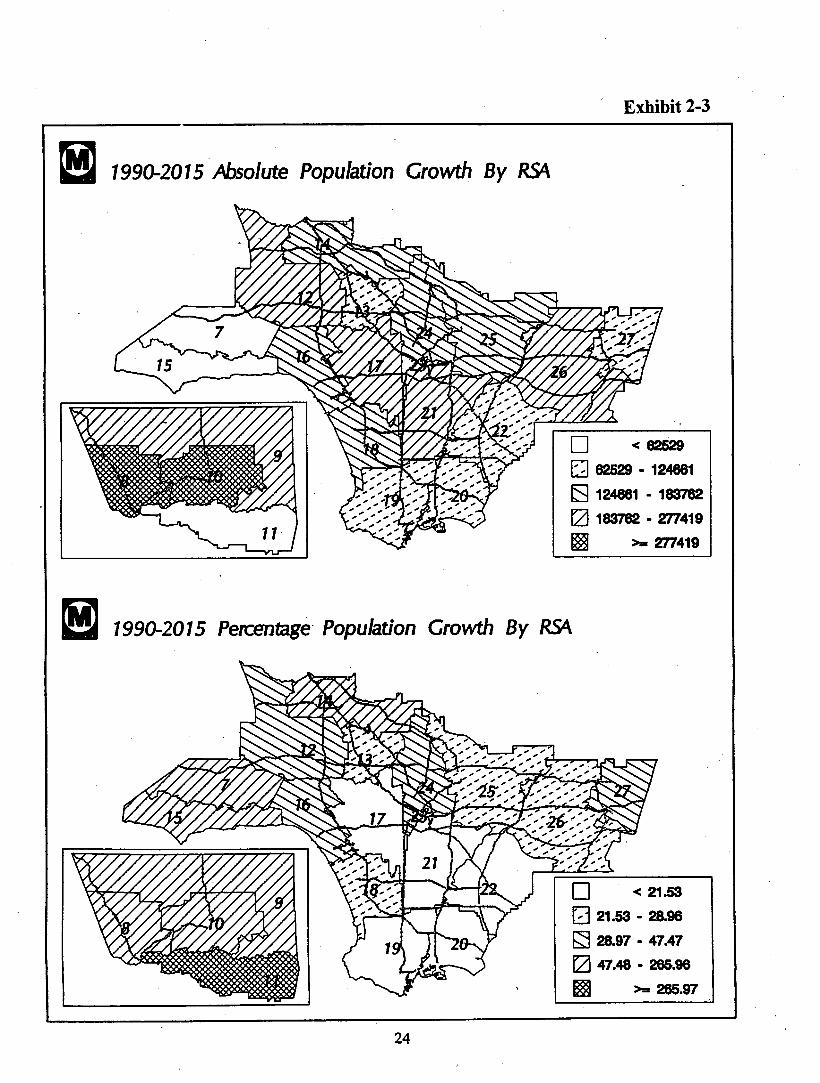
The SCAG population forecast indicates considerable growth throughout Los Angeles Countywith only Malibu, Calabasas and the Atlgeles Forest areas showing comparatively little growth.The largest increases in population are projected to occur in the communities of Palmdale andSanta Clarita where each will add more than 275,000 people over the next twenty years(Exhibit 2-3). These communities are followed by Lancaster, west San Fernando Valley, SanGabriel Valley, and the central communities immediatelyeast and west of downtown Los Angelesthat will each add more than 180,000 people. However, with the already substantial populationdensity in the central communities of the basin, the percentage growth of these communities willbe less than twenty percent. In contrast, the less dense areas in North County and the AngelesForest are expected to double, and sometimes more than triple, their current population over thenext twenty years.
Employment Forecasts
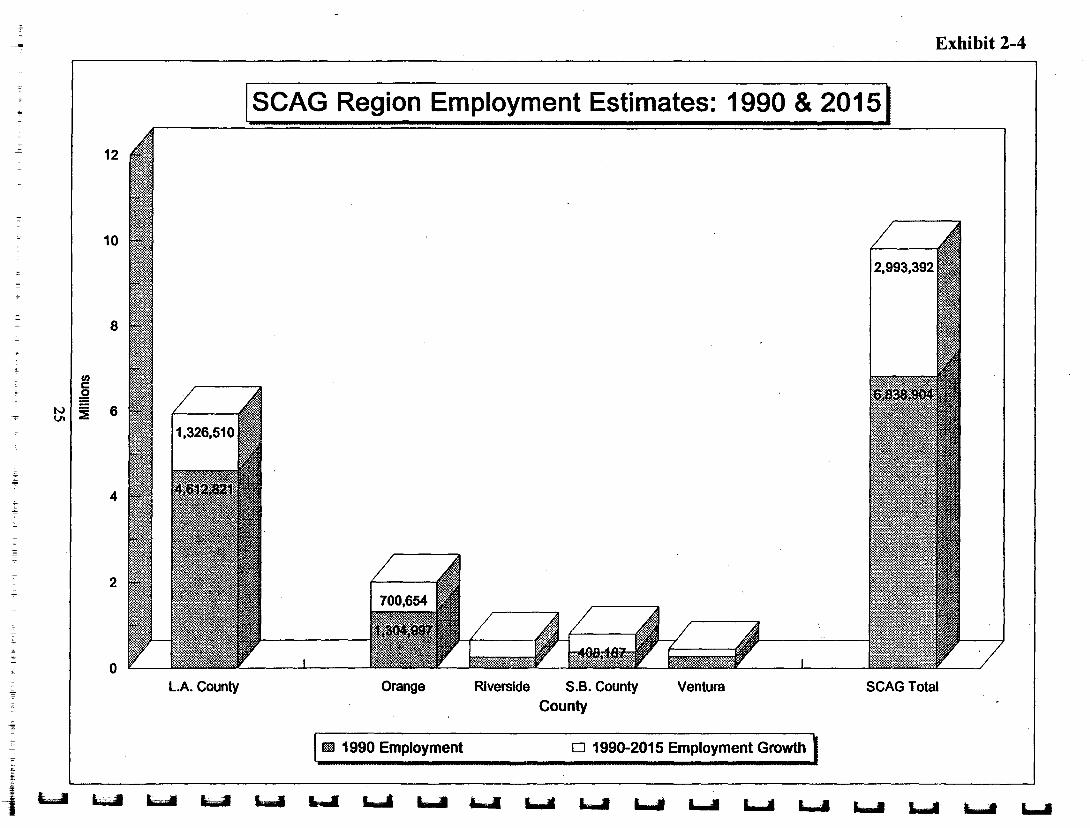
Similar to the projections for population, Los Angeles County employment will also growsignificantly over the next twenty years. From the 1990 level of 4.6 millionjobs in the County,another 1.3 million (29%) jobs will be added by the Year 2015 for a total of nearly sixmillionjobs(Exhibit 2-4). This will account for nearly sixty percent of alljobs in the SCAG region.
The highest current employment densities are in downtown and west Los Angeles where there aremore than ten jobs per acre (Exhibit 2-5). The communities in the Beach Cities, Mid East Cities,Long Beach, and Burbank-North HollyWood are in the next highest category of currentemployment. By the Year 2015, the Mid East and Beach Cities are projected to join thedowntown and westside in the highest employment densities in the county. The west SanFernando Valley, Palos- Verdes-San Pedro and Southeast Cities are forecasted to attain themedium-high category of employment density.

15(I)c
N ~N ~
10
ISCAG Region Population Estimates: 1990 & 20151
Riverside S.B. CountyCounty

1990 Population Density Per k.re By RSA.
LegendD <.7.20o 7.20 - 11.99E:) 12.00 18.121 18.37 24.38~ >= 24.39
2015 Population Density Per k.re By RSA.
t!J 1990-2015 Absolute Population Growth By ~
< 82529
62529 - 124681
124681 - 183782
183782 - 277419>= 277419
1990-2015 Percentage· Population Growth By RSA.
D < 21.53
o 21.53 - 28.98
~ 28.97 - 47.47
I2J 47.48 - 266.96~ >= 265.97
=~10
~~~
-8
enc;e
~-
tv :i 6VI
'io
4-
-----
2
ISCAG Region Employment Estimates: 1990 & 20151
Riverside S.B. CountyCounty
r
~'"i~~~~~~~~~~~~~~~~~~~
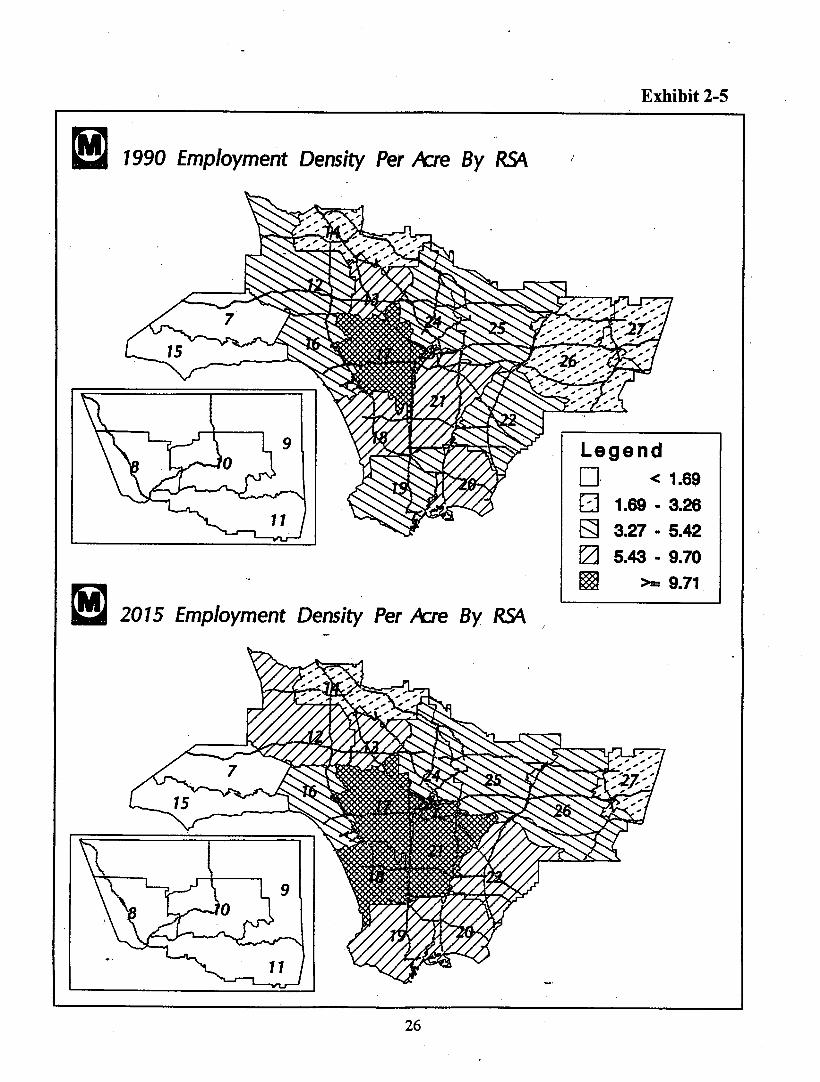
1990 Employment Density Per kre By RS4.
LegendD· < 1.69o 1.69· 3.268) 3.27· 5.42(2] 5.43· 9.70~ >- 9.71
2015 Employment Density Per kre By RS4. I
The total jobs over the next twenty years are projected to increase more than 100,000 in theBeach Cities and East San Gabriel Valley commuruties (Exhibit 2-6). An eastern corridor ofcommunities, generally bounded by the Harbor-Pasadena and 1-605 Freeway, are projected to bethe next fastest in job growth. Job growth in this corridor may be spurred by the opportunitiesassociated with the Alameda Corridor project, On a relative basis, job growth in Santa Claritaand Palmdale is projected to triple over the next twenty years; while Lancaster, the East SanGabriel Valley and Pomona will see increases of at least fifty percent. Even the central areas ofthe Los Angeles County basin will grow at least eleven -percent by the Year 2015.
BASELINE SCENARIO PERFORMANCE,
The Baseline Scenario is the starting point for the development of the Long Range Plan.The Baseline Scenario transportation system is composed of those projects and programs that areeither fully funded or currently under construction (Appendix B).
The following discussion summarizes the performance of the baseline system only, not theperformance of the full long range plan program. Several additional projects and programswere evaluated and the best performing of these were added to the baseline system. The baselinesystem, and these additional projects and programs, constitute the Long Range Plan which isdiscussed in the next chapter of this document.
It is noteworthy that the increases (30% or more) in population and employment projected for theYear 2015 are not accompanied by similar increases in the transportation system infrastructure asrepresented by the Baseline Scenario. Serious implications for personal travel in Los AngelesCounty can be expected in this Baseline Scenario assuming that current travel behaviors continue.An analysis of the projected Baseline Scenario transportation system performance helps to identifypotential mobility problems for Los Angeles County. Resources are very limited for resolving theprojected Baseline Scenario problems, but the Adopted MTA Long Range Transportation Planwill focus on the most effective actions for mitigating these problems.
In general, travel movements will increase between all parts of the county in parallel to theincreases in population and e~ployment. Los Angeles County daily home-to-work trips willincrease from five million in 1990 to nearly seven million by the year 2015. This home-to-worktravel is but a small portion of total daily travel which increases from 29 million person trips tomore than 38 million p~rson trips in Los Angeles' County by the year 2015. Many of thenon-work person trips, both now and in the future, occur during the peak commuter periods,especially during the evening commute, which will lead to further transportation system. congestion. Without changes to current conditions, by the year 2015, there will be an additional

1990-2015 Absolute Employment Growth By RSt\
< 8252982529 • 124881
124881 • 183782
183762 • 277419
>- 277419
1990-2015 Percentage Employment Growth By ~
o < 21.53
Q 21.63 • 28.98I;j 28.97 • 47.47
o 47.48 • 266.98
~ >- 266.97
1.5 million single-occupant commuter autos on Los Angeles County streets than there are today.The largest increases in travel are projected from the North County to the basin, from suburb tosuburb, and to and from the Alameda Corridor cities.
If the transportation system improvements were limited to those elements in the BaselineScenario, this projected increase in work and non-work travel would lead to severe highwaycongestion in the Los Angeles County. This congestion will reduce accessibility to and fromvarious communities as it will take considerably longer to travel from one place to another.Similarly,the increased highway congestion will slow bus transit travel as well.
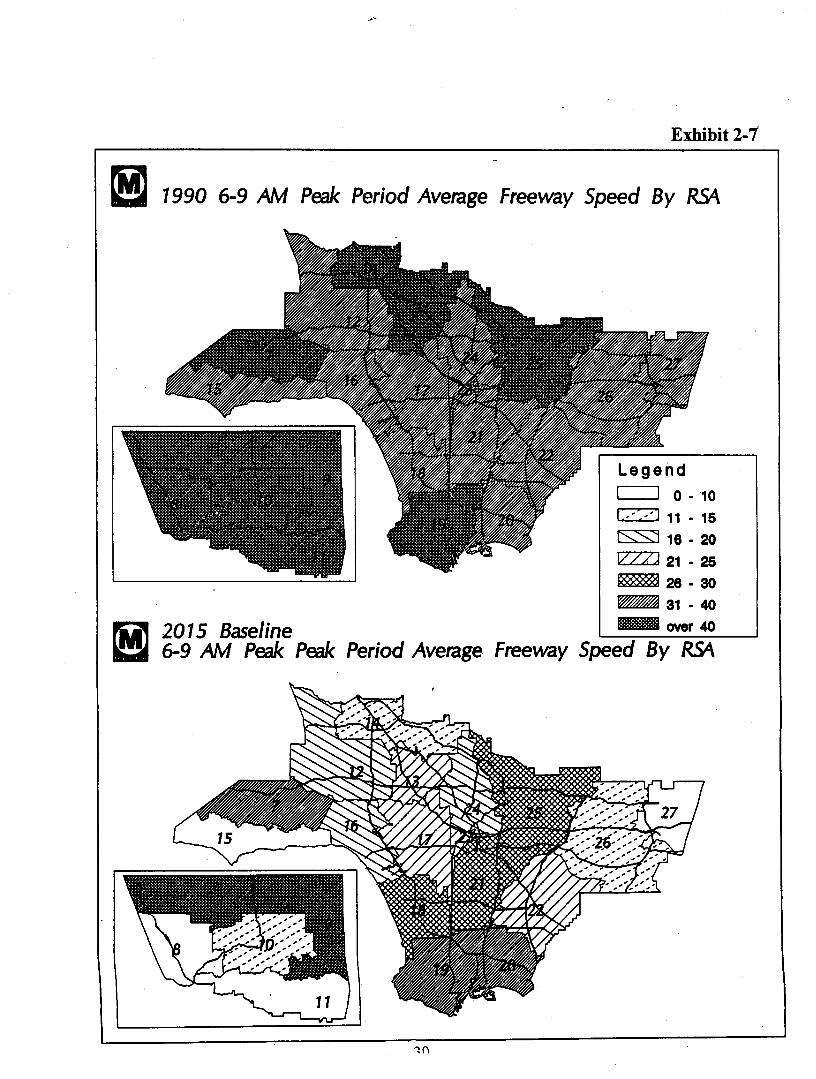
During the 3-hour morning peak period, average mixed-flow (all vehicles) freeway travel speedsare projected to decline from nearly 41 mph in 1990 to less than 17 mph under the BaselineScenario by the Year 2015. The decline is most pronounced in the areas that are projected tohave the highest growth, namely in North County and the East San Gabriel Valley (Exhibit 2-7).Segments of the freeway system will decline to less than 10 mph during the most congested peakone hour of the morning commute (Exhibit 2-8). Freeway carpool lanes, assuming continuationof the two-person occupancy requirement, will not fare much better as average morning peakperiod speeds are projected to decline from over 45 mph in 1990 to 21 mph by the Year 2015.
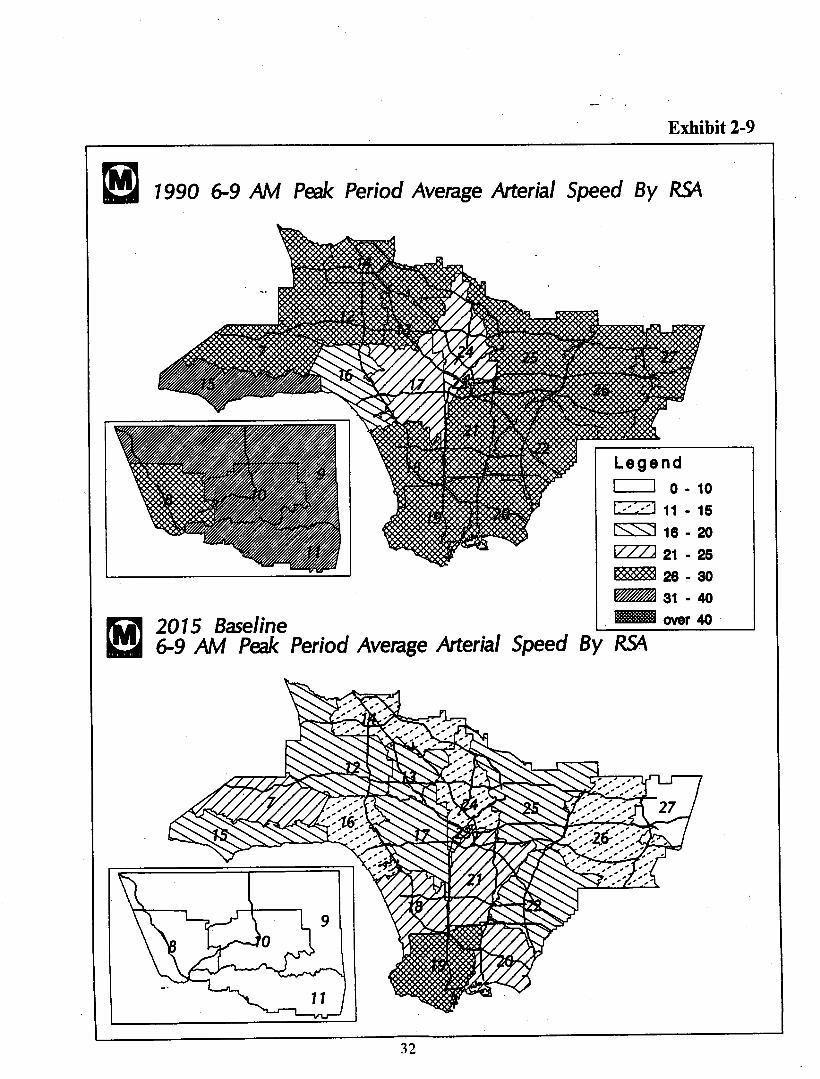
The average arterial street speed is projected to decline from nearly 27 mph in 1990 to less than11 mph under the Baseline Scenario in the Year 2015. In addition to the North County and theEast San Gabriel Valley, many parts of Los Angeles County will encounter arterial street speedsless than 10 mph (Exhibit 2-9). The present-day ability of knowledgeable drivers to travel fasteron arterials than on the freeways will become a thing of the past by the Year 2015.
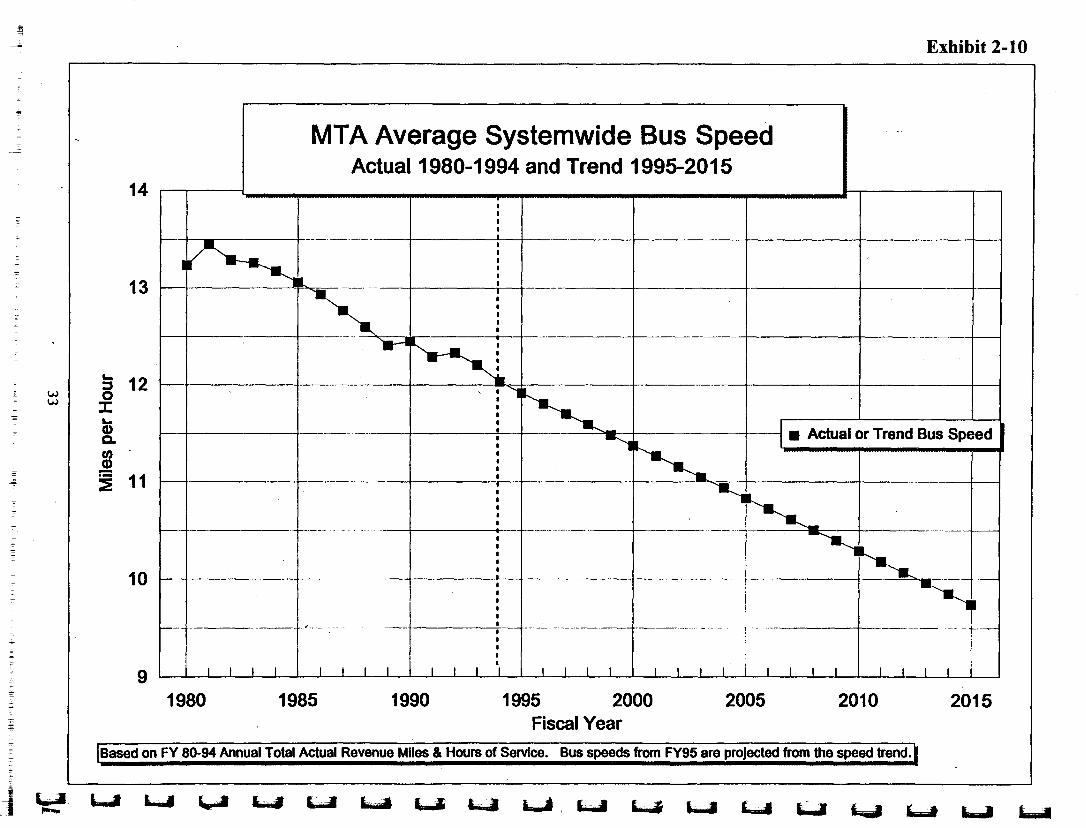
With the increased congestion on arterial streets, bus transit speed will be severely reduced,making transit a less desirable means of travel. A declining speed trend has been observed overthe past 15 years, based upon recorded MTA bus miles and hours of service, where averagesystemwide speed has dropped from 13.5 mph in 1981 to 12 mph in 1994 (Exhibit 2-10). This islargely attributable to increasing street congestion. If this trend continues, average MTAsystemwide speed will be under 10 mph by the Year 2015. The implications of this trend aresignificant for the County's ability to maintain transit mode share and constrain bus transitoperating costs. The decline in bus transit speed will be even more severe for many municipaloperators in areas of high demographic growth than is projected for MTA bus operations in thecentral area where speed declines are not as severe. The speed declines would likely result inhigher operating costs fora lower level of transit service. Additionally, the rail system will not
]
]
JJJIIIDI~
~,a,j
j
]
1'Jl
.-
t!J 1990 6-9 AM Peak Period AvelClge Freeway Speed By RS<\
LegendI I 0 .101»-] 11 • 15
lSS116·20vZZJ 21 • 25
~26·30~ 31·40
2015 Baseline Im!- over 406-9 AM Peak Peak Period Average. Freeway Speed By R£\

Long Range Transportation Plan7-8 AM Peak Hour Freewa Level of Service
Exh·b· ]. I It 2-8
MIIp Plwpnd ~ lACMTA ~ PIInI*1g OMSIll5 .14411«]
)
~ 1990 6-9 AM Peak Period Avemge Arterial Speed By RSo\
LegendI I 0 - 10t»-] 11 - 16lSS416-20vZZJ 21 - 26m26-30~ 31 - 40
2015 Baseline 1lllII"il1iii!!IllIMover 40
6-9 AM Peak Period Avel3ge Arterial Speed By R£\
MTA Average Systemwide Bus SpeedActual 1980-1994 and Trend 1995-2015
~ 12o:I:•••Q)CoenQ)
~ 11
-- --~-
--- .._-_.-.T---I
I
1995 2000Fiscal Year
IBased on FY 80-94 Annual Total Actual Revenue Miles & Hours of Service. Bus speeds from FY95 are projected from the speed trend. I
perform up to its potential as the bus system slows since many patrons may be discouraged fromusing the rail system due to the reduced bus access service.
There are several observations that are evident from the analysis of the Baseline Scenario. TheAdopted MT A Long Range Transportation Plan will be successful to the extent it addresses theseIssues:
• The continuation of current travel behavior and the projected growth in Los AngelesCounty will only exacerbate future transportation system deficiencies. .The projecteddemographic growth is unlikely to occur if the Baseline Scenario transportationdeficiencies become reality. This has potentially adverse implications for the localeconomy.
• Many areas lack the infrastructure to accommodate the projected growth. It isinconceivable that the highway system capacity will match the same 50-300%demographic growth projected for some areas of the county. The demand-to-capacity gapmust be resolved through more efficient utilization of the Baseline Scenario transportationsystem capacity.
• Without improvements to bus transit for access, the capacity provided by rail transit willnot be fully utilized. Bus transit is projected to be the primary means of access to the railsystem. If the bus is a less viable mode of travel, the rail system will also be less viable. Amix of both buses and rail is needed to address the transportation problem.
• There are insufficient funding resources to address a very large transportation problem -new resources are urgently needed. Funds are as severely constrained for operations andmaintenance as they are for capital. Implementation of low-cost, solutions and policies,such as congestion pricing and parking management, can be just as effective as majorcapital improvements.
• . New facilities will only partially address mobility needs. Transportation Demand policiesand programs are required to induce the travel behavior changes needed to moreefficiently use existing facilities. The transportation system will have considerably morecarrying capacity than will be used - especially with the propensity for commuters todrive alone' during the peak travel periods. An example of a transportation demand policyis Telecommuting/Teleservices allowing employers and employees to take advantage ofinformation technology and services thus altering the need for travel.
• In allocating our limited funds, every eff0T!must be made to:
ensure modal and social equity to provide mobility for those with limited economicoptions.
• Given our constrained resources and the enormity of the problem, it is imperative thatgreat wisdom is exercised in making future transportation investments. The availabletransportation funding cannot be ill-spent on projects and programs that do not achievethe most mobility benefit. Otherwise, Los Angeles County will sacrifice economiccompetitiveness and potential growth.
The performance of the Adopted Plan is summarized in Chapter 4 and explained in greater detailin the Technical Appendix to ~he Plan. '
J]
Jj
]
]
lJ]
J]]
]]
JJJDI,

CHAPTER 3THE PLAN
CHAPTER3: THE PLAN
The Long Range Plan vision is to develop a multimodal system that better serves the needs of ourtransit dependent riders, while also providing a network that will attract solo drivers out of theircars, primarily through faster transit speeds, improved quality of service and more commutechoices.
The Plan starts with the premise that the bus network will continue to serve as the backbone ofthe transit system, and includes strategies which build more transit capacity into strategic links inthe transportation system while also ensuring that the current transit system is used to its fullestpotential. The bus system will be expanded and transit preference corridors will be created so thatthose travelling in buses or vans will have a faster, more convenient travel alternative. Flexible,community-based transit services will supplement the heavy-demand lines in the urban core, andprovide improved mobility to the less-populated outlying areas, with funding provided throughthe creation of a Mobility Allowance program. Rail will only be built in the highest-demandcorridors where more cost-effective alternatives are not feasible.
The Long Range Plan sets forth major policy directions which will guide the MTA inaccomplishing its mission to construct and operate a safe, reliable, affordable and efficienttransportation system:
• Maintain existing revenue sources and aggressively pursue new transportation revenuesfor Los Angeles County. In particular, maintain a 50% federal contribution to current andfuture rail lines. This Plan assumes that approximately 50% of the funding for Red LineSegments 2 and 3 will come from federal contributions to the projects, as consistent withthe Full Funding Grant Agreement The assumption of a 50% federal contribution iscarried forward for the funding of three future rail lines: San Fernando Valley East/Westand the Eastern and Western extensions of the Metro Red Line. 'If the federalcontribution, either on an annual or a total basis, is lower than anticipated, the timingand delivery of the aboveprojects will be impacted.
• Improve bus transit service by targeting highly transit dependent areas with better, morefrequent service. Create financial allowances, through the Mobility Allowance program,to fund flexible transit options such as smart shuttles, vans, community based transit,neighborhood .collectors, shared taxis for off-peak service and other alternative servicedelivery strategies. Add 300 buses to the total countywide peak bus fleet to improveservice quality in high demand areas and, as rail lines open, eliminate duplicate bus routesand thereby reallocate up to 140 additional buses for other needed services.
The development of the Advanced Technology Transit Bus (ATTB) is a key componentof the MTA's strategy to improve the comfort, convenience, cost efficiency, and operatingquality of bus service throughout Los Angeles County. In conjunction with the ATTBdevelopment, a Fuel Cell Buyers' Consortium has also been formed to achieve the rapidand successful transition to zero emission buses. This conversion will help to improve airquality and will support defense conversion efforts and the creation of new advancedtechnology jobs in Los Angeles County.
Continue developing Los Angeles County's rail network by opening the Metro GreenLine system, building the Pasadena Line, building a rail line in the San Fernando Valleyand completing the Eastern and Western extensions of the Metro Red Line. Sixadditional projects that performed well are still under consideration in the second decadeof the Plan if additional funds become available. These projects are CrenshawCorridor; Downtown Connector; Exposition Line (Downtown to USe); Glendale!Burbank Line; San Fernando Valley East-West (405 Fwy to Warner Center); and the10/60 Corridor. Certain other projects had lower overall performance; however, futurefunding changes (such as creation of special programs at the State or Federal level) maywarrant special consideration of these projects. For example, if a special funding sourcefor intermodal connections becomes available, the Green Line eastern extension toNorwalk might become a viable project.
Improve highway transit speeds and service by constructing 279 miles of HOV lanesand gap closures on freeways and major streets, adding 130 miles of arterial bus lanes onsurface streets and increasing traffic signal synchronization efforts throughout the county.
Promote and implement innovative strategies that encourage mass transit usage byidentifying customer needs and providing a system that meets those needs. Thesestrategies include methods of optimizing the current system by making it more efficientand reliable, as well as methods that make transit easier to use through market research ofboth transit users and non-transit users and implementation of transit-relatedadvancements such as improved passenger information systems and smart fare cards.
Make use of existing rights-of-way by enhancing commuter rail service and exploringthe option of using railbus (DMU) technology to provide a lower cost alternative to lightrail systems in corridors such as Glendale/Burbank and the eastern extension to thePasadena Line.
Participate as a financial partner in the Alameda Corridor project to help to ensurethe economic success of the region by facilitating the efficient movement of goods.
• Promote changes in behaviors of the commuting public by exploring and advancingpolicies that discourage single occupancy vehicle travel and encourage greater reliance ontransit, ridesharing, and innovative alternatives such as telecommuting. These policychanges will also encourage local jurisdictions to implement parking management and landuse strategies that are favorable to public transportation.
• Implement cost savings measures to increase the cost efficient delivery of both transitservices and capital projects.
The Los Angeles area is a diverse combination of high-density, high-demand urban corridors andlower-density suburban areas. As mentioned earlier in this Plan, travel demand in all corridors isexpected to increase dramatically in all areas, with particular problems in the central, western,northern and eastern corridors. Congestion is also a problem in the southern corridor, but not assevere. This ,is due, in part, to the fact that some improvements are already in place, such as theBlue Line to Long Beach, the Green Line, the Century Freeway and the Harbor FreewayTransitway. Travel patterns throughout the County are expected to be more dispersed. Coupledwith this trend, rising incomes will increase reliance on the private automobile.
At the same time travel in the suburbs and outlying areas is increasing, congestion in the centralcity, and portions of East, West and South Los Angeles closest to the urban core will slow speedsof autos and buses. Because of this slowing, more buses will be required simply to make up forlosses in speed in the central areas. While buses of various sizes and service configurations willcontinue to be the workhorse of the system, there will be some corridors where adding buses willnot keep up with congestion and anticipated travel demand. In this very limited number ofcorridors, high-capacity rail lines will need to be constructed.
Exhibit 3-1 summarizes key strategies. These strategies are oriented around the basic principlesoutlined below and are described in more detail later in this chapter.
Recognizing that the transit system of the future will need to be very different from today's, thePlan calls for significant departures from the status quo. In order to meet the needs of our corecustomer, the transit dependent, 300 additional buses are concentrated in our highest-demandcorridors. In addition, more flexible service is planned for community access, outlying areas andoff-peak periods such as nights and weekends. The Plan proposes creation of a MobilityAllowance from subsidies currently assigned to MT A's lower-demand lines and service hours.This funding would be combined with that of local jurisdictions to create a flexible, demand- and
customer-oriented family of services, including DASH-like shuttles, community-operatedvanpools and jitneys and shared-ride taxis.
Systems of the future will be designed to enhance livable commuruties through mixed usedevelopments at transit centers designed around commuter and heavy rail stations, transitwaystops and major commercial and community activity centers. Non-motorized access will beimproved through completion of key bikeway gaps and improving the pedestrian environmentaround transit stations and linkages between transit stations and major activity centers.
Transit-oriented street and highway improvements will speed bus movement in high-demandcorridors and improve the overall productivity and cos~-effectivenessof the system.· The Plancalls for creation of transit priority corridors on streets predominantly used by buses, including acombination of bus-only lanes, signal priority for buses and enhanced bus stops. Since auto trafficwill be slowed somewhat on these streets, the Plan also envisions creation of parallel auto prioritycorridors, where both bus and auto traffic are speeded through creation.of areawide coordinatedsignal systems and smart corridors.
Freeway bus, vanpool and carpool speed will be enhanced by creation of a 279-mile network ofhigh-occupancy vehicle lanes. Increased emphasis will be placed on building these lanes as asystem, so that travelers can use HOVs to get from one major destination to another withoutgetting off of the system. The network will also focus on making key inter-county connections ascost-effectively as possible and at considering lower-cost ways of providing HOV lanes, includinghigh-occupancy toll lanes, reversible lanes and lane conversions. To make the overall trafficsystem operate more smoothly, the Traffic .Operations System being undertaken by Caltrans willbe enhanced and completed, with an emphasis on safety and efficient movement of traffic,includingbuses.
Using of rights-of-way to move people and freight more efficiently is another key strategy in thePlan. Toward this end, the Plan places a high priority on completion of the Alameda Corridorproject, which will serve ports and freight needs of the future and increase the economiccompetitiveness and vitality of the region. As an additional benefit, the Alameda Corridor projectwill improve auto and bus traffic flow in the area and improve air quality. To make the best useof some ofMT A's remaining rights-of-way, in the second decade the Plan includes study of a low-cost alternative to light rail in commuter rail corridors, the railbus or diesel multiple unit.
]]
]
]
]
J)
)
]
JJ)
]
j
j
j
J)
jl
Transit systems development will be coordinated with major planning efforts and studies by otherjurisdictions and agencies. Major developments such as those envisioned in the City of LosAngeles Department of Airports Masterplan and ground access program, and the associatedtransportation and traffic mitigations, will require careful coordination with the policies· andprograms in the Long Range Plan. Projects that serve both the Long Range Plan goals andprovide congestion relief and increased mobility in the LAX area will be given additionalconsideration in coordinating the Long Range Plan with the Airport Masterplan.
Customer convenience and overall system efficiency will be improved by the expenditure ofCongestion Mitigation and Air Quality (CMAQ) resources to provide an enhanced TransportationDemand Management approach, which will include customer surveys, passenger-orientedtechnologies such as smart farecards and advanced transit systems such as automatic vehiclelocators and enhanced passenger information systems.
KEY PLAN STRATEGIES
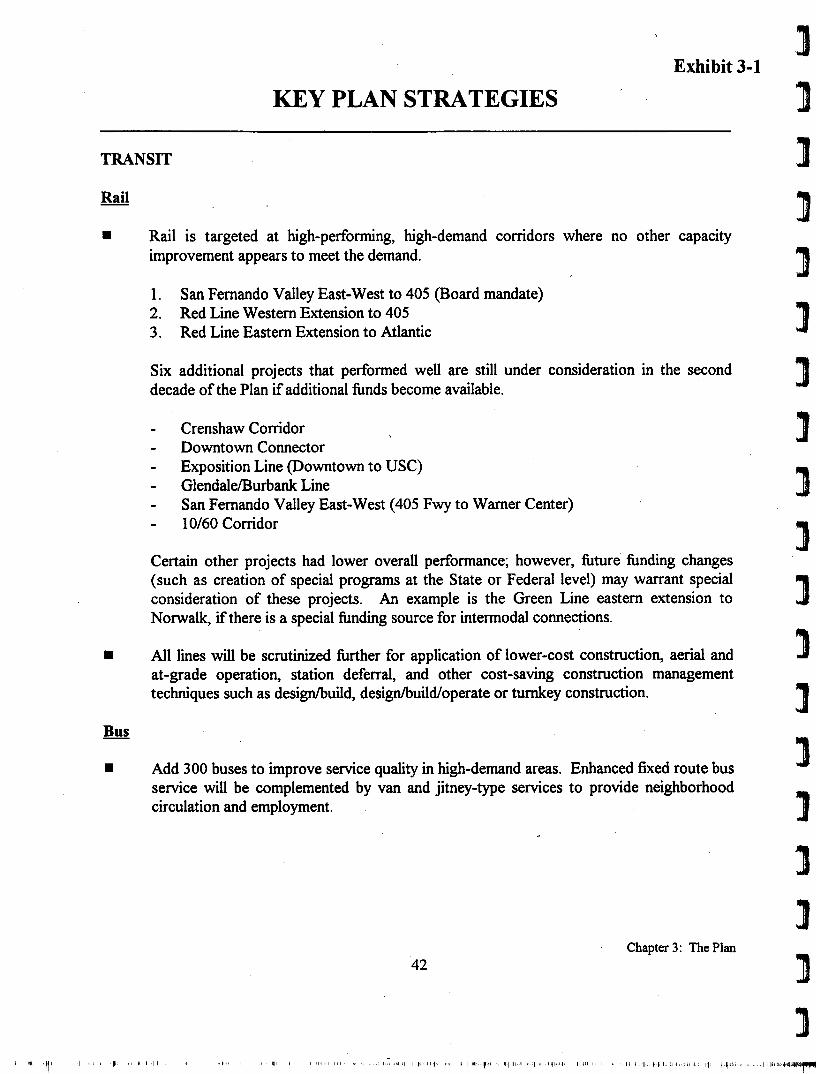
• Rail is targeted at high-performing, high-demand corridors where no other capacityimprovement appears to meet the demand.
1. San Fernando ValleyEast-West to 405 (Board mandate)2. Red Line Western Extension to 4053. Red Line Eastern Extension to Atlantic
Six additional projects that performed well are still under consideration in the seconddecade of the Plan if additional funds become available.
Crenshaw CorridorDowntown ConnectorExposition Line (Downtown to USC)GlendalelBurbank LineSan Fernando ValleyEast-West (405 Fwy to Warner Center)10/60 Corridor .
Certain other projects had lower overall performance; however, future funding changes(such as creation of special programs at the State or Federal level) may warrant specialconsideration of these projects. An example is the Green Line eastern extension toNorwalk, if there is a special funding source for intermodal connections.
• All lines will be scrutinized further for application of lower-cost construction, aerial andat-grade operation, station deferral, and other cost-saving construction managementtechniques such as design/build, design/build/operate or turnkey construction.
• Add 300 buses to improve service quality in high-demand areas. Enhanced fixed route busservice will be complemented by van and jitney-type services to provide neighborhoodcirculation and employment.
KEY PLAN STRATEGIES
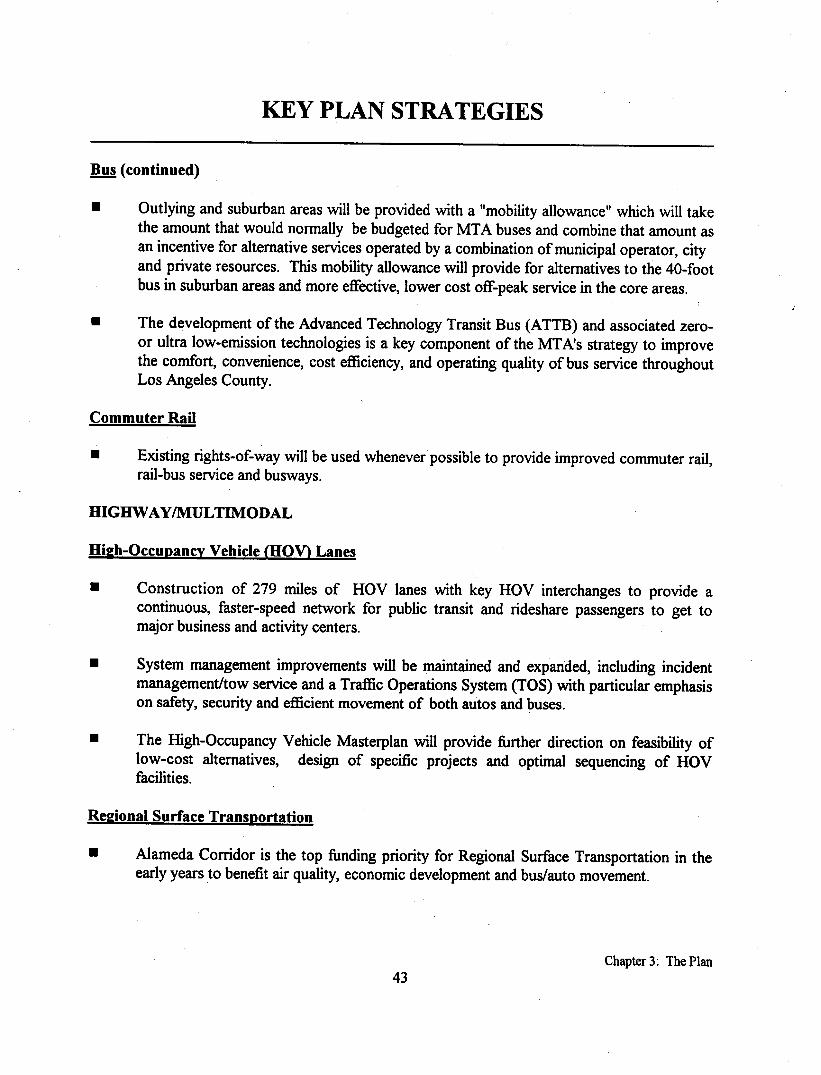
• Outlying and suburban areas will be provided with a "mobility allowance" which will takethe amount that would normally be budgeted for MTA buses and combine that amount asan incentive for alternative services operated by a combination of municipal operator, cityand private resources. This mobility allowance will provide for alternatives to the 40-footbus in suburban areas and more effective, lower cost off-peak service in the core areas.
• The development of the Advanced Technology Transit Bus (ATTB) and associated zero-or ultra low-emission technologies is a key component of the MT A's strategy to improvethe comfort, convenience, cost efficiency, and operating quality of bus service throughoutLos Angeles County.
• Existing rights-of-way will be used whenever possible to provide improved commuter rail,rail-bus service and busways.
• Construction of 279 miles of HOV lanes with key HOV interchanges to provide acontinuous, faster-speed network for public transit and rideshare passengers to get tomajor business and activity centers.
• System management improvements will be maintained and expanded, including incidentmanagement/tow service and a Traffic Operations System (TOS) with particular emphasison safety, security and efficient movement of both autos and buses.
• The High-Occupancy Vehicle Masterplan will provide further direction on feasibility oflow-cost alternatives, design of specific projects and optimal sequencing of HOVfacilities.
• Alameda Corridor is the top funding priority for Regional Surface Transportation in theearly years to benefit air quality, economic development and bus/auto movement.
KEY PLAN STRATEGIES
• Later year projects will be concentrated on troubleshooting key bottlenecks and freewayaccess.
• Aggressive implementation of transit-enhancing transportation systems managementprojects (such as bus priority lanes, signal priority and transit bypass) on key transit streetsto allow maximum benefit to transit users and operational savings to transit operators.Approximately 130 miles of streets have heavy transit use warranting priority treatment.
• Improvement of parallel travel for autos and buses through broad countywideimplementation of signal coordination, centralized control and Smart Corridors.
• Major direction will be given to travel market efficiency through pricing demonstrationand incentives, including congestion and parking pricing.
• Market research will be conducted to determine transit passenger and non-user needs toincrease transit ridership.
• Fund transit-related advancements that make transit travel easier, such as informationsystems, smart buses! AVL, smart farecards.
• Transit centers and enhanced bus stops (similar to Inner City Transit Study and SanFernando Valley Bus Restructuring recommendations) will be budgeted for and providedthrough the Call for Projects.
• Pedestrian improvements to create a transit-oriented environment to benefit transit usersare combined with Regional Bikeways into a new Nonmotorized Transportation program.
• MT A bikeway involvement will be limit~d to major inteIjurisdictional connections,bottlenecks and demonstrated bicycle commute corridors.
]
J]
JJ]
J],
j
JJ]
]
]
]
]
]
l]
~-
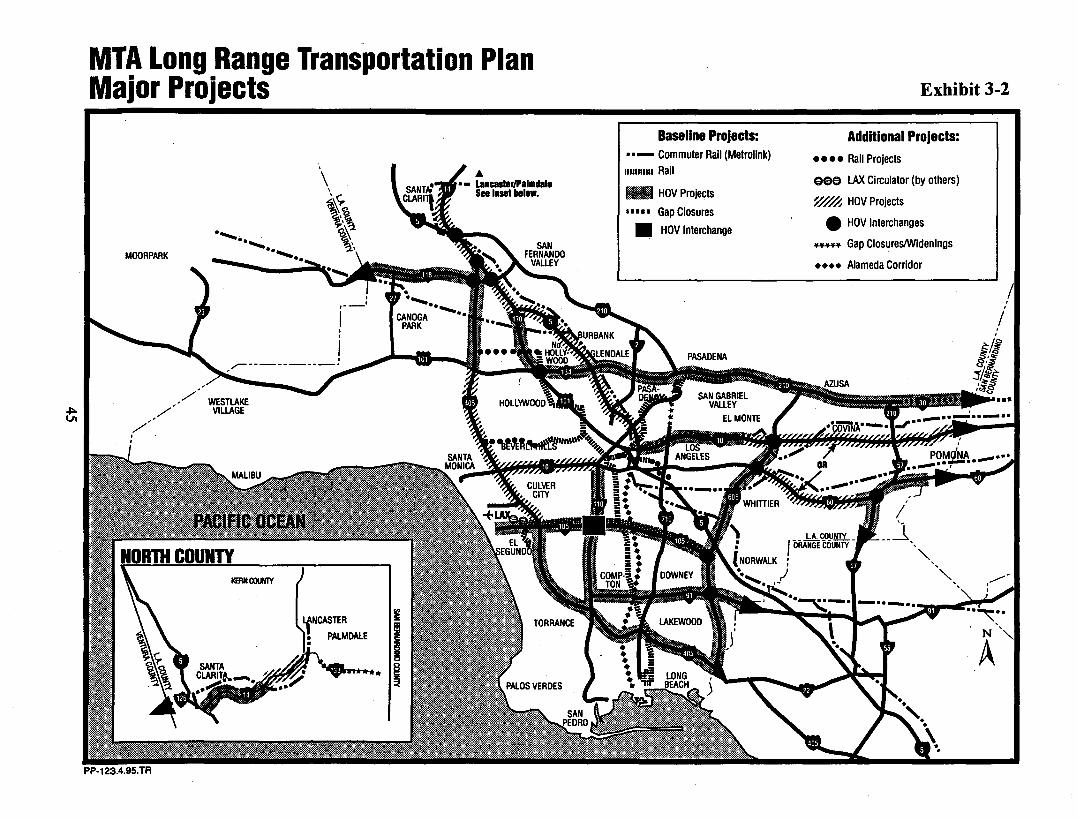
MTA Long Range Transportation PlanMajor Projects
Baseline Projects:•• - Commuter Rail (Metrolink)11111111111 Rail
•.••...••... '
••••••••• ....•....
•• HOV Projects
II II. Gap Closures
• HOV Interchange
Additional Projects:•••• Rail Projects
GGG LAX Circulator (by others)
~ HOV Projects
• HOV Interchanges
•.•.•..•.• Gap ClosuresIWidenings
• ••• Alameda Corridor
,,--'I,,I

Exhibit 3-3
MTA Long Range Transportation Plan·List of Projects and Programs
RAIL RED LINE Segment 1RED LINE Segment 2RED LINE Segment 3- North Hollywood- Westside to Pico/San Vicente- Eastern to First/Lorena
PASADENA LINE Union Station to Sierra Madre VillaSan Fernando Valley East/WestRED LINE Western Extension to 1-405 Fwy.RED LINE Eastern Extension to Whittier/AtlanticRED LINE Segments 2 and 3 Station EnhancementsGREEN LINE Norwalk to EI SegundoMetrolinkLA CarMiscellaneous Rail/Rehabilitation 1
Environmental Clearance/Studies
BUS Replacement/Maintenance/Expansion
OTHER Union Station Gateway Transit CenterDiesel Multiple Unit (DMU)/Rail-Bus Technology
Corridor to be determined through feasibility study.Potential corridors include Glendale-Burbank, NorthernSan Gabriel Valley, Harbor Subdivision, Exposition, andBurbank Branch West.
RAIL Operation ofMTA System Described Aboveand Current Metrolink System
:lJj
j
Jj
j
j
j
j
]
]
]
]
]
]
]
]
1
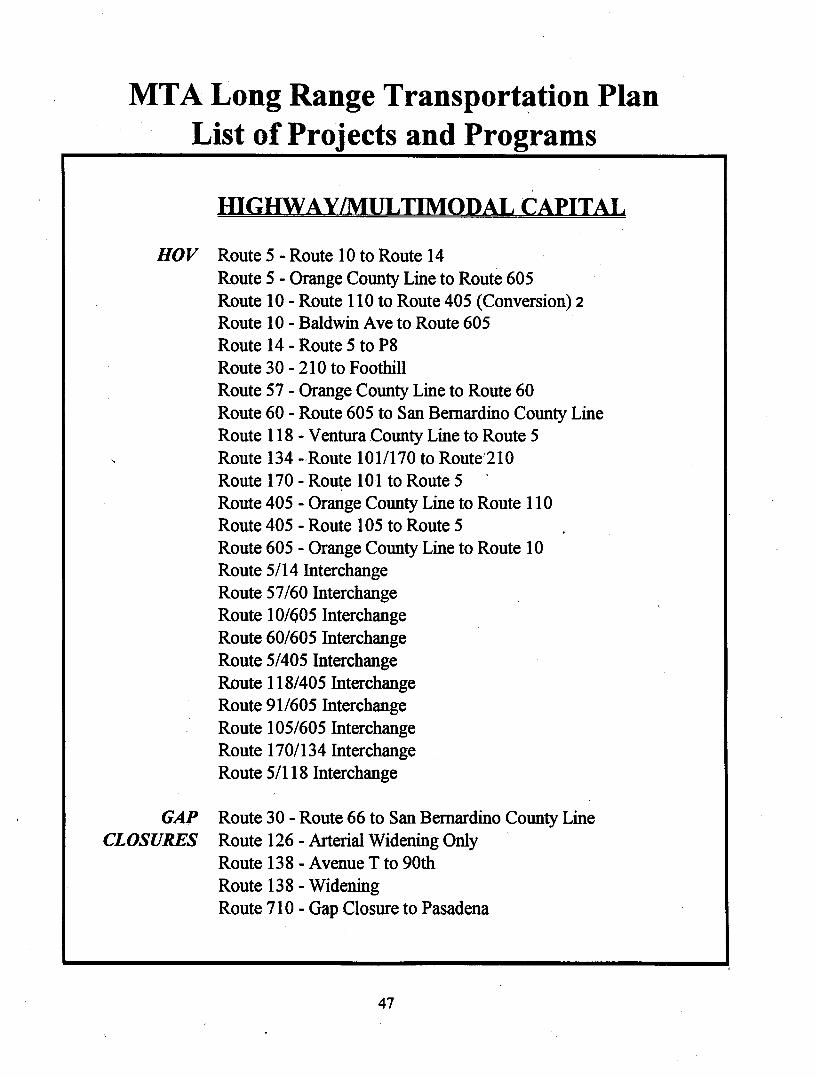
MTA Long Range Transport~tion PlanList of Projects and Programs
HOV Route 5 - Route 10 to Route 14Route 5 - Orange County Line to Route 605Route 10 - Route 110 to Route 405 (Conversion) 2Route 10 - Baldwin Ave to Route 605Route 14 - Route 5 to P8Route 30 - 210 to FoothillRoute 57 - Orange County Line to Route 60Route 60 - Route 605 to San Bernardino County LineRoute 118 - Ventura County Line to Route 5Route 134 -,Route 1011170 to Route'210Route 170 - Route 101 to Route 5Route 405 - Orange County Line to Route 110Route 405 - Route 105 to Route 5Route 605 - Orange County Line to Route 10Route 5/14 InterchangeRoute 57/60 InterchangeRoute 10/605 InterchangeRoute 60/605 InterchangeRoute 5/405 InterchangeRoute 118/405 InterchangeRoute 911605 InterchangeRoute 105/605 InterchangeRoute 170/134 InterchangeRoute 5/118 Interchange
GAP Route 30 - Route 66 to San Bernardino County LineCLOSURES Route 126 - Arterial Widening Only
Route 138 - Avenue T to 90thRoute 138 - WideningRoute 710 - Gap Closure to Pasadena
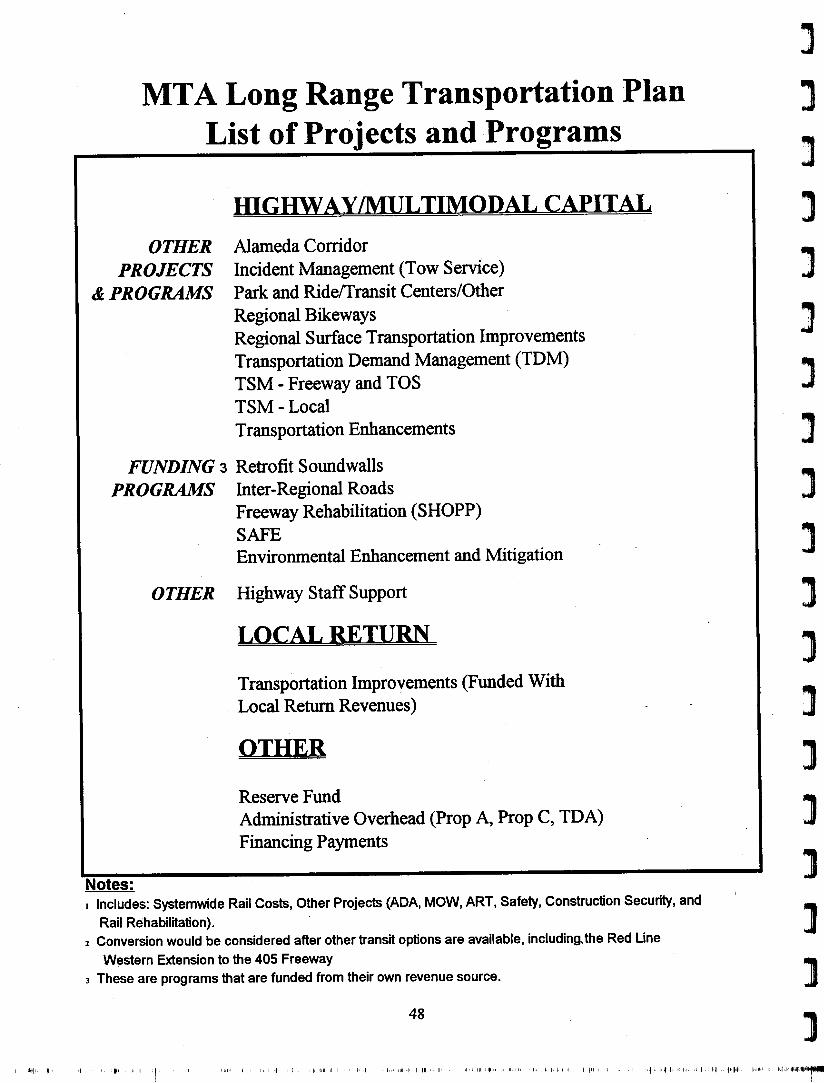
MTA Long Range Transportation Plan .List of Projects and Programs
OTHERPROJECTS
& PROGRAMS
Alameda CorridorIncident Management (Tow Service)Park and Ride/Transit Centers/OtherRegional BikewaysRegional Surface Transportation ImprovementsTransportation Demand Management (TDM)TSM - Freeway and TOSTSM - LocalTransportation Enhancements
FUNDING 3 Retrofit SoundwallsPROGRAMS Inter-Regional Roads
Freeway Rehabilitation (SHOPP)SAFEEnvironmental Enhancement and Mitigation
Transportation Improvements (Funded WithLocal Return Revenues)
OTHER
Reserve FundAdministrative Overhead (Prop A, Prop C, TDA)Financing Payments
Notes:I Includes: Systemwide Rail Costs, Other Projects (ADA, MOW, ART, Safety, Construction Security, and
Rail Rehabilitation).2 Conversion would be considered after other transit options are available, including. the Red Une
Western Extension to the 405 Freeway3 These are programs that are funded from their own revenue source.
]
JJJJJj
j
JJ]
]]]]]
]]
]

THE TRANSIT ELEMENT:BUS TRANSIT
This element includes a variety of service delivery options that has been developed through amodeling and planning analysis to recommend an integrated system that includes the followingbasic strategies:
• Add 300 buses for total Countywide peak fleet of 2,871 to improve service quality in highdemand areas. Enhanced fixed route bus service will be complemented by van and jitney-type services to provide neighborhood circulation and potential community employment.
• Outlying and suburban areas with lower transit demand will be provided with a "mobilityallowance" which will take the amount that would normally be budgeted for MT A busesand combine that amount as an incentive for alternative services operated by a combin-ation of municipal operator, city and private resources. This concept would also apply toareas where demand during times of the day or days of the week might indicate the needfor alternative service delivery options.
• As rail transit lines open, bus service will be modified to feed rail stations and eliminateroute duplication, freeing 140 extra buses for other needed services.
• The implementation of bus priority and preference treatments on 130 miles of key buslines will improve bus speeds.
• As buses are replaced, vehicles with larger capacities will be utilized on high demandcorridors so that more people can be carried per bus. Priority and preference treatmentswill also be used to increase bus speeds in selected corridors.
• The development of the Advanced Technology Transit Bus (ATTB) is a key componentof the MT A's strategy to improve the comfort, convenience, cost efficiency, and operatingquality of bus service throughout Los Angeles County. In conjunction with the ATTBdevelopment, a Fuel Cell Buyers' Consortium has also been formed to achieve the rapidand successful transition to zero emission buses. This conversion will help to improve airquality and will support defense conversion efforts and the creation of new advancedtechnology jobs in Los Angeles County.
• Expanded market research, marketing and customer convenience activities funded throughthe TDM program will increase transit and carpool mode share.
• The focus of the service delivery program will be to best match the most cost effectivesupply with the service demand.

One of the cornerstone principles of the bus element, of the Long Range Plan is to better matchsupply and demand in a more cost-efficient manner. Thus, high demand areas would be servedwith a combination of high capacity buses and supplemental shuttle and jitney-type services.
In areas of reduced demand, a "Mobility Allowance" would be created consisting of the resourcesnormally budgeted for MT A service that would be made available to local jurisdictions toconsider alternative operational and funding scenarios.
The Mobility Allowan~e offers a number of opportunities to change business as usual. It wouldcreate a better coordinated partnership between the local jurisdiction and the MT A resulting in anintegrated transportation system. Also, it would provide the potential to extend and expand thevalue of funds and promote more innovative alternative service delivery options.
From a coordination perspective, although a number of jurisdictions operate locally funded fixedroute and demand responsive services, the focus of these has typically been to serve separatemarkets from the MT A. By making resources available to local jurisdictions, there would be thepotential to coordinate planning activities to create nodes of intercept with the high demandcorridors while meeting the circulation needs of the local jurisdictions.
On the funding side, there would be an opportunity to augment the Mobility Allowance with localjurisdiction funds, such as the Proposition A and C Local Return Program, or to use privatesector funding, such as developer fees. Also, since Municipal Operators and private sectorproviders typically have operated at a lower cost than the MT A, there could be potential to offermore service for the dollar expended.
Operational flexibility is the primary benefit of the Mobility Allowance concept. Operator optionswould include the MT A, Municipal Operators, private sector providers or community-basedorganizations. The size and type of vehicle would be geared to again match supply with demand.Operational modes could include fixed route, route deviation and demand responsive dependingon the characteristics of the area.
One of the more innovative proposals of recent years is the Smart Shuttle, which would usetoday's technology of dynamic scheduling and dispatch, mobile data terminals and automaticvehicle locator system with future technological improvements to develop a multiple use vehiclethat could, for example, connect with Metrolink Stations in the morning and evening peak,provide multi-purpose center or non-emergent health care trips in the mid-day and finish withevening and owl service on lower demand corridors.
The last example further demonstrates the potential flexibility of the Mobility Allowance concept,where alternative service could be provided at different times of the day or days of the weekdepending on demand; for example, weekend service in many parts of the San Fernando Valley
JJ)
JJ]
j
]
Jj'.. . ~
]'I.JJ
]
j
]
J]
)
]

or evening and owl service in South Central and East Los Angeles might use smaller buses orSmart Shuttles.
In the baseline, the size of the bus fleet was assumed to be that which exists today. Other factorswere considered to determine the future need. First, the growth in population was analyzedregarding the effect on the bus network. Next, the net result of the rail system development onthe bus fleet was analyzed, which included' deletion of duplicating service and modification toimprove feeder services. Further analysis indicated that more effective service would be providedin the areas of anticipated heavy demand through the use of higher capacity vehicles, such asarticulated buses.
The impact of reduced operating speeds was mitigated by the inclusion of 130 miles of buspriority and prt(ference lanes in the Plan, resulting in the recommendation to add 300 vehicles tothe future fleet, which would be reconfigured to include a mix of higher capacity and smallervehicles for the variety of service deliveries described below.
The operating cost of bus transit can vary significantly depending on what assumptions are madeas to who operates the service and how the service is provided. It would be imprudent todisregard the current institutional and infrastructure conditions where MT A operates the majorityof the service. However, from a long term perspective, the goal of anticipating and implementingchanges in service delivery to improve cost efficiency and service effectiveness appears to belogical. Therefore, the Adopted Plan includes realistic current costs and the potential to decreasefuture costs through well-planned alternative service delivery options. These would be deliveredthrough restructuring studies, similar to the San Fernando Valley study,'but would be expanded tomore aggressively link ridership demand with a variety of service and supply options.
The operating plan includes a well structured bus/rail interface plan that eliminates directduplication and reinforces rail access connectivity. These principles have been incorporated forlight and heavy rail services, with these services envisioned as 'providing replacement for many ofthe high cost commuter bus lines and duplicative services on parallel routes.
Another critical linkage is with the Transportation System Management (TSM) program and, inparticular, the transit priority and preference measures proposed. Targeting transit relatedimprovements, such as bus lanes and signal priority, on the street segments most heavily travelledby'transit vehicles would significantly improve travel speeds, thus reducing the number of peakvehicles required. For example, the initial identification of 130 miles of priority segments would
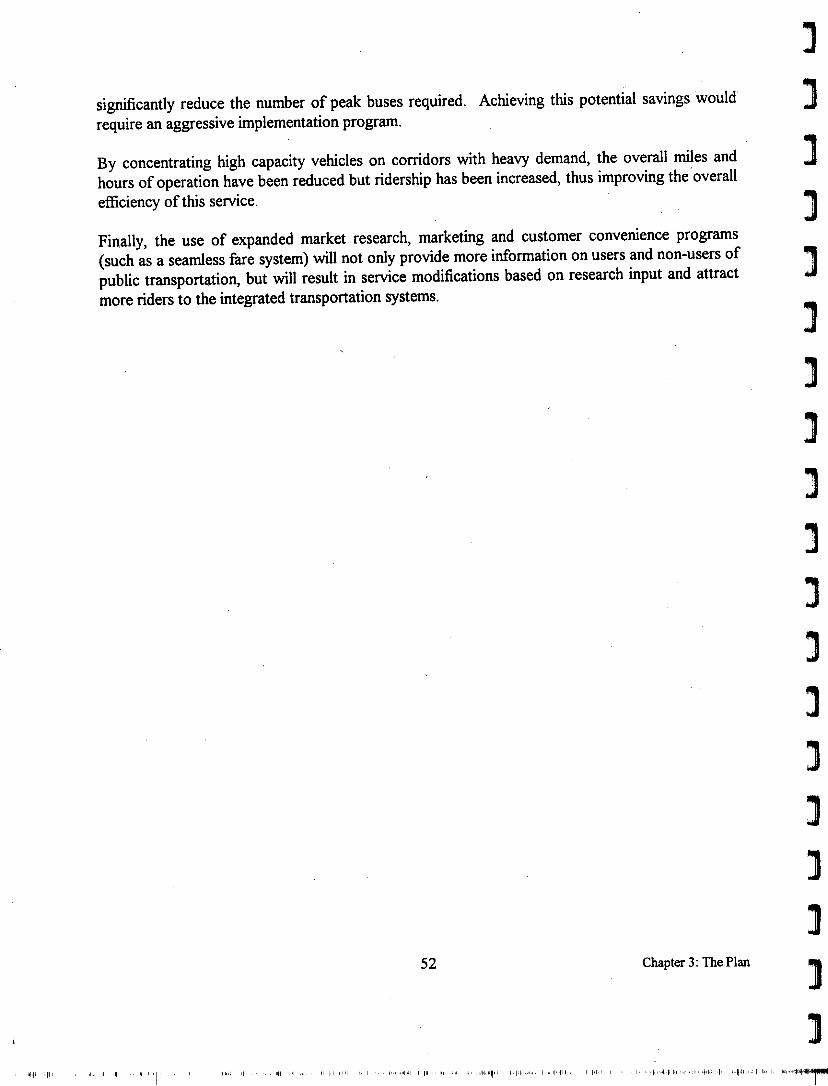
significantly reduce the number of peak buses required. Achieving this potential savings would'require an aggressive implementation program.
By concentrating high capacity vehicles on corridors with heavy demand, the overall miles andhours of operation have been reduced but ridership has been increased, thus improving the' overallefficiency of this service.
Finally, the use of expanded market research, marketing and customer convenience programs(such as a seamless fare system) will not only provide more information on users and non-users ofpublic transportation, but will result in service modifications based on research input and attractmore riders to the integrated transportation systems.
JJJ]
]
]
]
]
]j
J]]
]
]
]
]
]
]
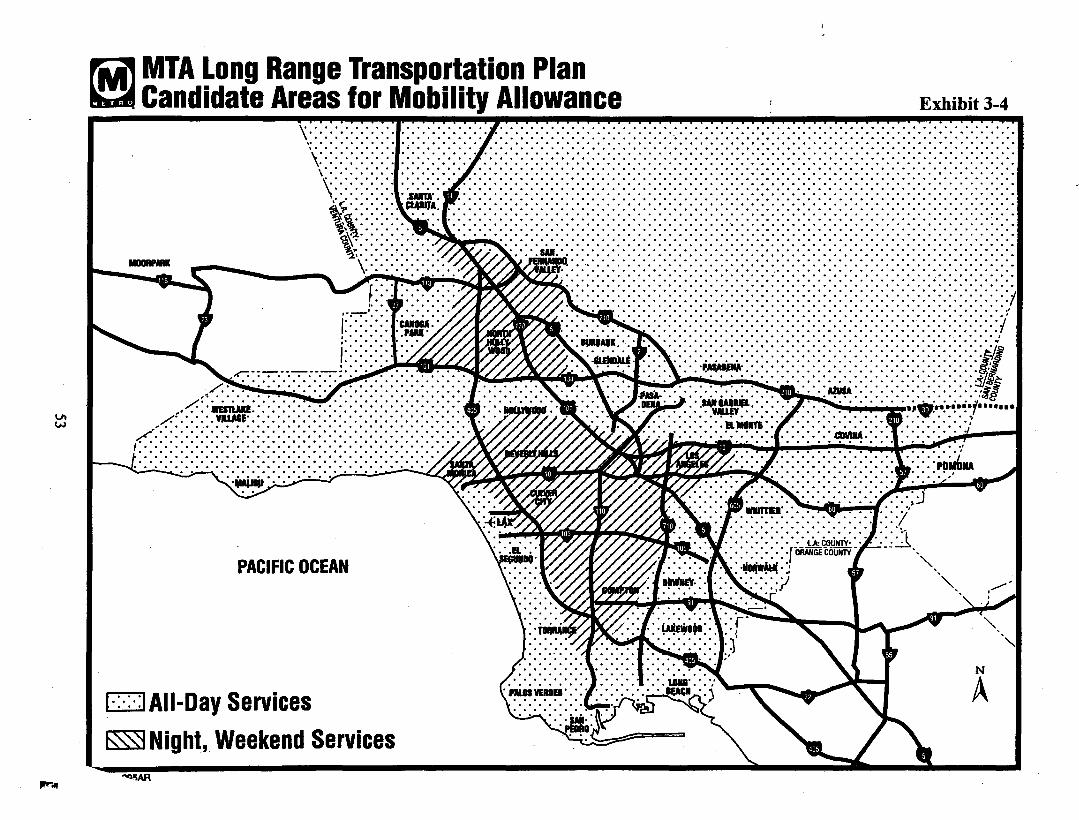
~ MTA Long Range Transportation Plan.'.Candidate Areas for Mobility Allowance Exhibit 3-4
\::::::::::::::::: ::::::::::::::::. :::::::::::::::::::::::::::::::::::::::::::::::::::::::::::::::::::::::::::::::::::::::::::::::::::::
\}}!<f:>\/}:{{i}:{{{{i!{iU!iiH{ii{{{{i}}U}<}::.~. . . .. . . . . . . . . . . . . . . . . . . . . . . . . . . . . . . . . . . . . . . . . . . . . . . . .\'" . . . . .•...•...,... . . . . . . . . . . . . . . . . . . . . . . . . . . . . . . . . . . . . . . . . . . . . . . . . . . . . . . .~\:::::::::::.':::.:::::::::::::::::::::::::::::::::::::::::::::::::::::::::::::::::::::::::::::::::::::::::::::::::::::::::::::~\'.. . . . . . . .~.'.'.'.~.'.'.'. .. ·.·.·.IU.·.·.·.·.·.·.·.·.·.·.·.·.·.·.·.·.·.·.·.·.·.·.· .
IIlIORP_ \> > > >.>.>. >. >.... ~. :.:--:.:.:. : . :. : . : .:.:.:.:.:.:.:. :.:.:.:.:.:.:.:. :. :. : . :.:.:. :.:.:. :.:.: . :. : . :.:. :.:.: .. . . . . . . . . . . . . . . . . . . . . . . . . . . . . . . . . . . . " .'. . .
~:>:::-:'.-:::>,..,-.- ./>:-:-:-: :~.'(:::::::. ::-.
DAII-Day Services~ Night, Weekend Services
MTA Long Range Transportation PlanFixed-Route Bus Expansion Schedule
THE TRANSIT ELEMENT:URBAN RAIL TRANSIT
The Baseline system, which includes projects that are fully funded and/or under construction,describes several rail lines serving diverse markets. Already constructed are the Blue Line fromthe Los Angeles CBD to Long Beach and Red Line Segment 1, stretching from Union Station toMacArthur Park. The Green Line from Norwalk to El Segundo is scheduled to open in mid-1995. Further extensions of the Red Line will open in the next 10 years: an eastern extension toFirst and Lorena, a western extension to Pico/San Vicente and a northern extension to NorthHollywood.
While MT A had previously undertaken an aggressive funding and construction program for railprojects, declining revenues and changing markets have led to a rethinking of rail serviceprovision in Los Angeles County. After analyzing future travel demand and congestion levels inkey corridors, staff has determined that urban rail is necessary, but only in limited instances. Forexample, in the western corridor between the CBD and the 405 freeway, traffic congestion andtravel demand is expected to grow to the level where sufficient buses cannot be provided to meetthe demand, even with on-street bus priority.
• Rail is targeted at high-performing, high-demand corridors where no other capacityimprovement appears to meet the demand.
• The following sequence is incorporated in the Adopted Plan, based on Board mandatesand capacity needs: .
1. San Fernando Valley East-West Line to the 405 Freeway (Board Mandate)2. Red Line Western Extension from Pico/San Vicente to the 405
Freeway/UCLA.3. Red Line Eastern Extension from Indiana to Atlantic
• Cost reductions identified for the San Fernando Valley East-West line to the 405 Freewaywill be carried forward into the EIS/MIS process.
• The San Fernando Valley line, the Red Line East to Atlantic and West to the 405 will beadvanced for potential federalization under ISTEA II.
• The connection between the Green Line Aviation Station and Los Angeles InternationalAirport is included as a people-mover system, funded by non-MT A revenues.
Consistent with Board direction, lower cost options are being explored·and modeled forthe following lines: Crenshaw Corridor, Exposition to USC, 10/60 Corridor, Burbank-Glendale Line, the Downtown Connector, and the San Fernando Valley East-West (405Fwy to Warner Center). As described in Chapter 4. one or more lines could beconstructed in the second decade if additional revenues are available.
]]
]
J]
]
]
]
]
]
JJ]
J]
]
]
]
]
The commuter rail lines are planned, constructed, and operated by the Southern CaliforniaRegional Rail Authority (SCRRA), a Joint Powers Agency established by legislation in June,1990. The Long Range Plan provides funds sufficient to support the operational and capitalrequirements of the existing 201 mile commuter rail system in Los Angeles County.
Metrolink is a high quality, efficient five-county commuter train system linkingcommunities to employment and activity centers. TheMetrolink meets a major regionaldemand for improved transportation services and mobility, and improves the quality oflifefor residents and businesses.
• The SCRRA is in the process of updating its capital 20-year plan. This information will beavailable in approximately 18 months and will be evaluated in the next update of the LongRange Plan. Capital expenditures include items such as rolling stock, new facilitIes, newtrack, equipment, communications, signage, street vehicles, etc.
• There are currently 201 commuter. route miles in operation within Los Angeles Countythat serves a basis for computing MTA's funding contribution to Metrolink operations.The SCRRA currently receives over fifty percent of its funding from the MT A. However,as future commuter route miles outside of Los Angeles County come into operation, thepercentage ofMT A funds should drop to less than fifty percent.
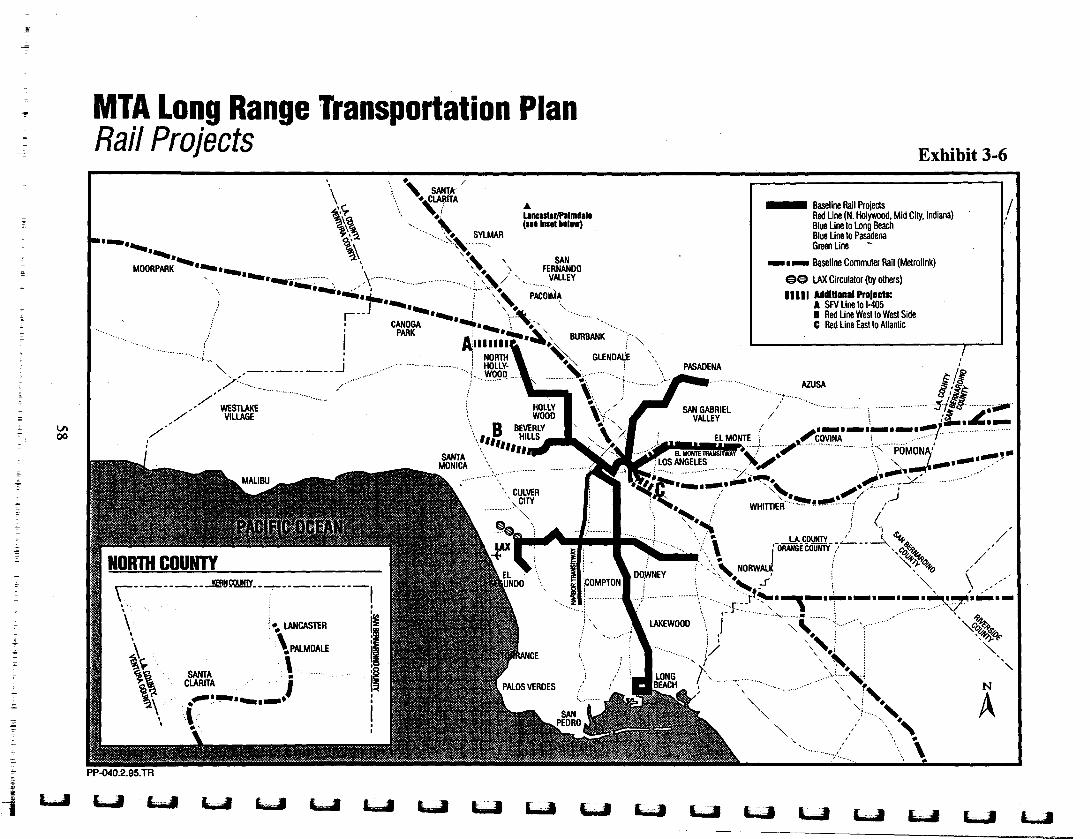
MTA Long Range Transportation PlanRail Projects
_._ Baseline Rail Projects /Red Line (N. Holywood. Mid City, Indiana)Blue Line to Long BeachBlue Line to PasadenaGreen Line -
_. _ Baseline Commuter Rail (Metrolink)
ee lAX Circulator (by others)IIIII MdlUonal Protects:
A SFV Line to 1-405• Red Line West 10 West SideC Red Line Easlto Atlantic
,.""'_ ,. -1/)' •...• '0.... /
,// WESTLAKE/~/ VILLAGE
/II
HOLLYWOOD
B BEVERLY.... '" HILLS
\, """SANTA "-MONICA
'- CULVER, CITY"':-"'"''
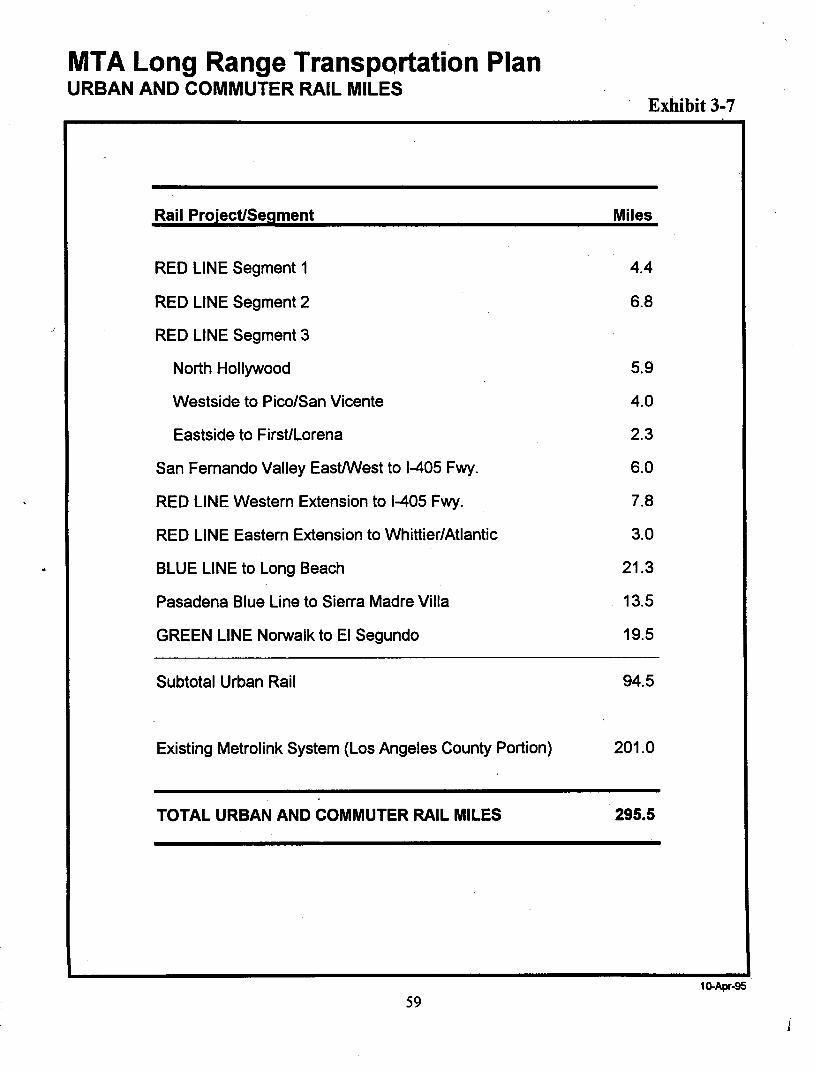
MTA Long Range Transportation PlanURBAN AND COMMUTER RAIL MILES
Rail Project/Segment
RED LINE Segment 1
RED LINE Segment 2
RED LINE Segment 3
North Hollywood 5.9
San Fernando Valley EastlWest to 1-405 Fwy. 6.0
RED LINE Western Extension to 1-405 Fwy. 7.8
RED LINE Eastern Extension to Whittier/Atlantic 3.0
BLUE LINE to Long Beach 21.3
Pasadena Blue Line to Sierra Madre Villa 13.5
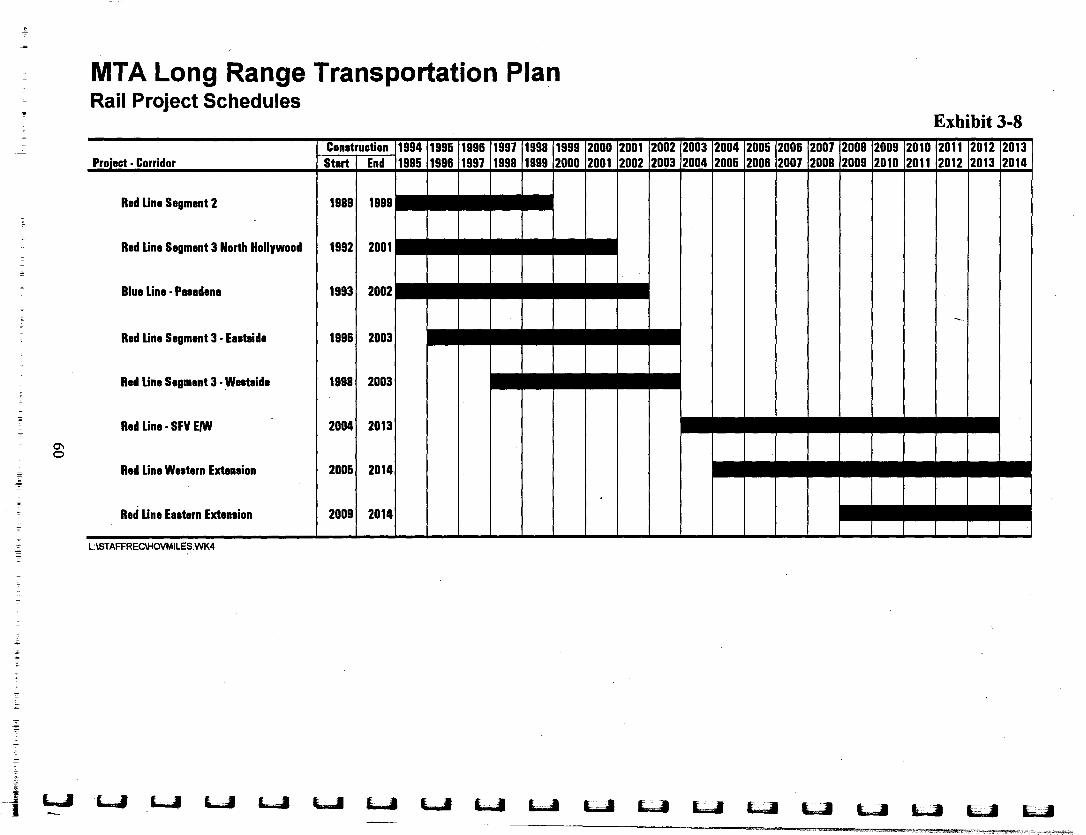
MTA Long Range Transportation PlanRail Project Schedules-
- Construction- Pro"ect·Corridor Start End
Red LineSegment 2 1989 1999~
Red LineSegment 3 North Hollywood 1992 2001-
Blua Line"Pasadena 1993 2002
Red LineSegment 3 .Eastside 1996 2003
Red LineSegment 3 "Westside 1998 2003
- Red line·SFV EIW 2004 2013-
0'10
- Red lineWestern Extension 2005 2014-
-
~Red lineEasternExtension 2009 2014
~L:\STAFFREC\HOVMILES.WK4--
-
1994 1995 1996 1991 1998 1999 2000 2001 2002 2003 2004 2005 2006 2001 2008 2009 2010 2011 2012 20131995 1996 1991 1998 1999 2000 2001 2002 2003 2004 2005 2006 2001 2008 2009 2010 2011 2012 2013 2014
THE TRANSIT ELEMENT:DMUIRAIL-BUS OPTION
In an effort to maximize the effectiveness of our transportation investment, MT A is evaluatingDiesel Multiple Unit (DMU) technology. If this technology is found to be feasible and cost-effective, it will be implemented in selectedMT A rights-of-way. The DMU is called by a numberof different names, including rail diesel car (RDC), diesel railcar, and railbus. In each case, thebasic concept is the same: a single rail car which is, the approximate size of a light rail transit(LRT) vehicle, operates frequent service, but is powered by a diesel engine. Because the DMUrides on conventional railroad tracks and does not require an electric power system, it can providemany of the advantages of LR T at greatly reduced cost.
Before MT A can commit to implementing a DMU line, there must be a detailed feasibility studyexploring various technology and implementation issues. The first phase of the study will look atthe different types of DMUs to determine their operating characteristics, design parameters, andpotential for use in the United States. The next phases will look at specific corridors to developplans and cost estimates for implementation. Exhibit 3-9 shows potential corridors for a DMUanalysis. These corridors are:
Based on preliminary cost estimates and analysis, funding would be available in the Long RangePlan to construct and operate DMU / Railbus lines on up to two of the proposed corridors.

Drn
.~
oa~
~
~
]] !
JJ]
j
:lJ]
]
]
Technology Transfer: DMUs are widely used in Europe, Asia, Australia, South America, andCanada, but not in the United States. The current models do not meet federal requirements forcar body strength (for service on freight lines), disabled access, air emissions, or domestic content.Introduction of the DMU in the United States may require development of a new model whichbetter meets US standards, while some federal regulations may need to be revised. In addition,the DMU has different operating characteristics than LRT, so it may be necessary to modify LRTplans to accommodate the DMU. There must also be an evaluation of the DMU's impact onregional air quality conformity.
Financiaillnstitutional Constraints: Since the DMU isa hybrid of urban rail, commuter rail,and bus, a number of financial and institutional issues must be resolved. Each transit mode has itsown set of rules for such items as environmental clearance, financing sources, and selection of anoperating entity. MT A must therefore develop a framework that will be most effective for theplanning, construction, and operation of DMU technology. One particular issue is the financingof the DMU from federal rail funds or from the Proposition C 10% account for commuter rail,park-and-ride, and transit centers. Before a DMU project can be funded from these sources,MT A must consider its priorities relative to other competing uses for these funds.
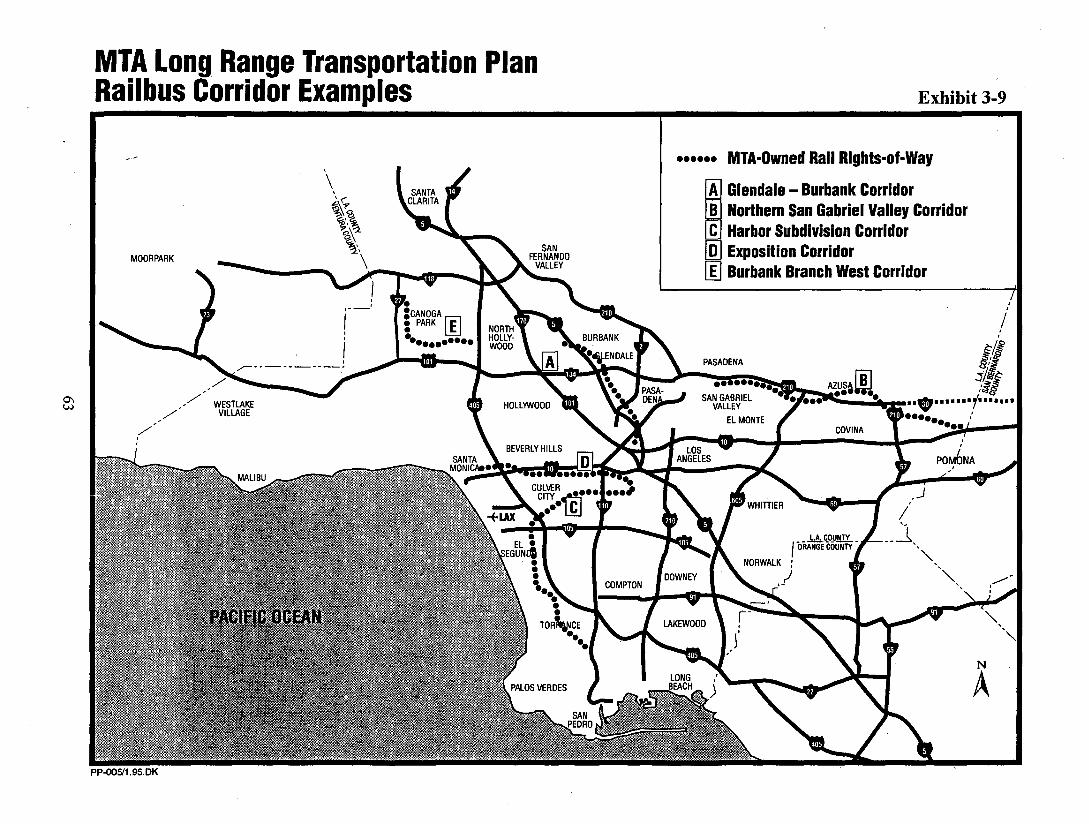
MTA Long Range Transportation PlanRailbus Corridor Examples
•••••• MTA-Owned Rail Rights-of-Way
~
Glendale - Burbank CorridorB Northern San Gabriel Valley CorridorC Harbor Subdivision Corridor
[ID Exposition Corridor[ID Burbank Branch West Corridor

THE TRANSIT ELEMENT:GATEWAY INTERMODAL TRANSIT CENTER
AT UNION STATION
The Los Angeles County Metropolitan Transportation Authority (MT A) is constructing theGateway Intermodal Transit Center, adjacent to the historical Union Station, in downtown LosAngeles. This intermodal facility will change the way the region's 18 million residents move toand through the City of Los Angeles and the region, redefining access for individuals andcommunities to jobs and schools, as well as cultural and recreational opportunities. It will be thepremier intermodal center in the western United States and the essential new entrance or gatewayto downtown Los Angeles and the region.
The need for such an intermodal facility was initially identified as a mitigation measure in the 1983Metro Rail Environmental Impact Statement/Subsequent Environmental Impact Report.The report identified a need for a bus terminal with bus bays and bus layover spaces, a transitplaza to serve passengers, public parking for up to 2,500 cars, ingress and egress to the site,freeway ramp improvements, and roadway realignments.
Construction began in February 1993 on the $149.5 million Gateway Transit Center. Whencompleted in September 1995, this intermodal facility will be the regional transportation hubconnecting Los Angeles, Orange, Riverside, San Bernardino, and Ventura counties. It will link allmajor transit modes including: Regional and local bus lines, commuter rail lines, heavy and lightrail lines, carpool, taxi and shuttle services, and regional and local freeway systems. As designed,the Gateway Transit Center will accommodate more than 100 buses every hour and serve morethan 115,000 multimodal transit users daily.
• A Bus Plaza which will link the public transit and parking elements to create a highlyvisible public space. It is projected this intermodal transit facility will increase daily busridership by as much as 15,000 riders per day.
• The Portal Pavilion, located adjacent to the Bus Plaza, will serve 30,000 awaiting anddisembarking passengers transferring between various transit modes each day.
• A Park-and-Ride Facility will provide 2,500 spaces adjacent to six heavily travelledfreeways, encouraging automobile commuters to complete their commute using alternativemodes of transit. This facility is expected to serve an estimated 8,000 car-poolingcommuters per day.
]
J],JI
J)'II
I~
nilWI
Imt.,
~
3]
~
]
]
].]
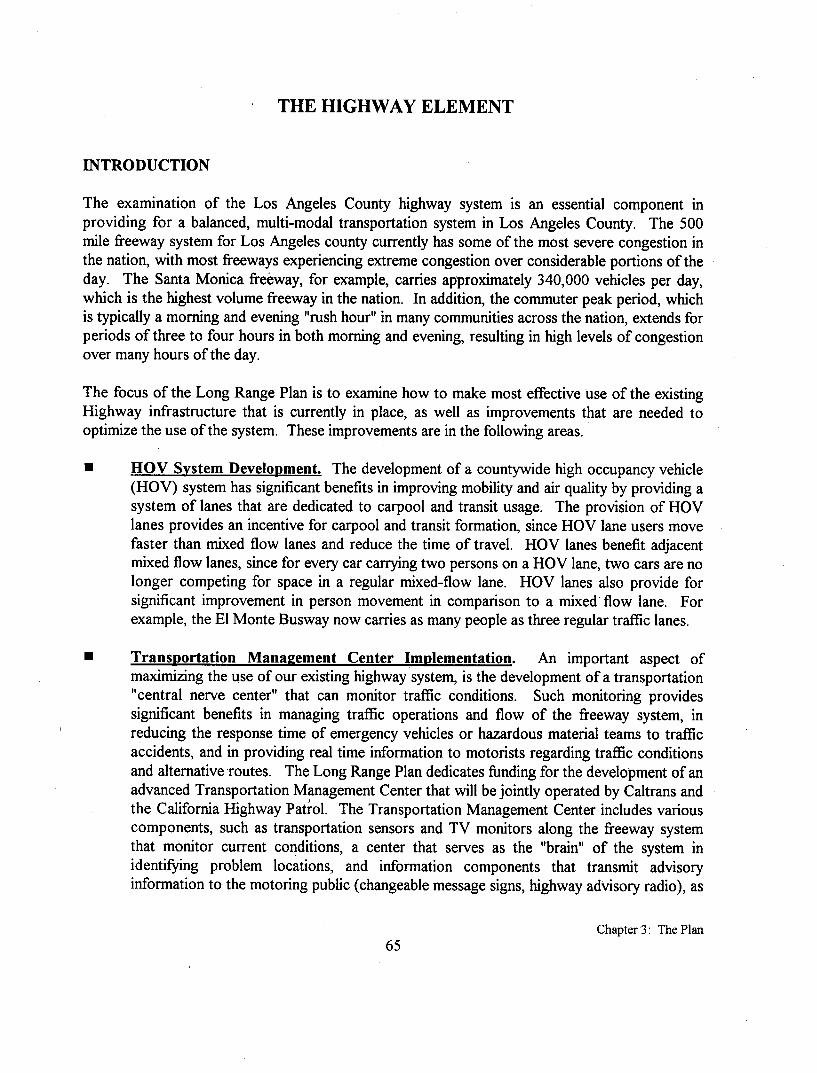
The examination of the Los Angeles County highway system is an essential component inproviding for a balanced, multi-modal transportation system in Los Angeles County. The 500mile freeway system for Los Angeles county currently has some of the most severe congestion inthe nation, with most freeways experiencing extreme congestion over considerable portions of theday. The Santa Monica freeway, for example, carries approximately 340,000 vehicles per day,which is the highest volume freeway in the nation. In addition, the commuter peak period, whichis typically a morning and evening "rush hour" in many communities across the nation, extends for'periods of three to four hours in both morning and evening, resulting in high levels of congestionover many hours of the day.
The focus of the Long Range Plan is to examine how to make most effective use of the existingHighway infrastructure that is currently in place, as well as improvements that are needed tooptimize the use of the system. These improvements are in the following areas.
• BOV System Development. The development of a countywide high occupancy vehicle(HOV) system has significant benefits in improving mobility and air quality by providing asystem of lanes that are dedicated to carpool and transit usage. The provision of HOVlanes provides an incentive for carpool and transit formation, since HOV lane users movefaster than mixed flow lanes and reduce the time of travel. HOV lanes benefit adjacentmixed flow lanes, since for every car carrying two persons on a HOV lane, two cars are nolonger competing for space in a regular mixed-flow lane. HOV lanes also provide forsignificant improvement in person movement in comparison to a mixed' flow lane. Forexample, the EI Monte Busway now carries as many people as three regular traffic lanes.
• Transportation Management .Center Implementation. An important aspect ofmaximizing the use of our existing highway system, is the development of a transportation"central nerve center" that can monitor traffic conditions. Such monitoring providessignificant benefits in managing traffic operations and flow of the freeway system, inreducing the response time of emergency vehicles or hazardous material teams to trafficaccidents, and in providing real time information to motorists regarding traffic conditionsand alternative routes. The Long Range Plan dedicates funding for the development of anadvanced Transportation Management Center that will be jointly operated by Caltrans andthe California Highway Patrol. The Transportation Management Center includes variouscomponents, such as transportation sensors and TV monitors along the freeway systemthat monitor current conditions, a center that serves as the "brain" of the system inidentifying problem locations, and information components that transmit advisoryinformation to the motoring public (changeable message signs, highway advisory radio), as
well as providing information to ClIP officers and incident response teams necessary toimmediatelyrespond to traffic accidents.
The importance of a Transportation Management Center with its ancillary system ofdetection and support was vividly illustrated during the recovery from the NorthridgeEarthquake. The Santa Monica Freeway carrying 340,000 vehicles a day was completelyblocked. The Antelope Valley Freeway (Route 14) and Golden State Freeway (Route 5)interchange was destroyed, along with the Route 5 Gavin Canyon bridge. Detours werecreated, transit service was supplemented, and the adjacent streets system was utilized tohandle massive traffic volumes. The establishment of a Transportation ManagementCenter is important in the quick response to wide traffic delays, ranging from naturaldisasters such as the Northridge earthquake, as well as day to day occurrences such astraffic accidents, special events traffic, or peak hour congestion.
• Gap Closures. The Long Range Plan has identified several key gaps in the Countyhighway system where system segments need to be constructed to ensure systemcontinuity. These gap closures are on Route 710 and Route 30, as well as the widening ofRoute 138 near Palmdale. The completion of gap closures is important in order to ensureproper balance on the freeway system, necessary to reduce congestion and improve airquality.
The objective of the HOV Program is to increase carpool and transit use and to reduce surfacestreet congestion by creating a cost-effective, connected system of highway-occupancy vehiclelanes serving major origins and destinations, including intercounty.trips. The Long Range Planperformance criteria have demonstrated that the development of an HOV system is a highlyeffective ~eans of increasing person through-put on the system as well as a cost-effectivecomponent of the transportation system.
The objective of developing highway system improvements is accomplished through the followingstrategies:
• Construct 279 miles of new HOV lanes with key HOV interchanges to provide acontinuous, faster-speed network for public transit and rideshare passengers to get tomajor business and activity centers.
• In keeping with the spirit of ISTEA and the Metropolitan Planning Factors, priority infunding and sequencing will be given to meeting up with HOV projects coming in fromadjacent counties.
• Given the gap between available funds and needs for additional capacity, considerationwill be given to converting an existing lane to HOV in high-demand corridors as aalternative to double-decking or other high-cost alternatives.
• High-occupancy toll lanes and private sector-sponsored projects will be investigated in atleast one or two corridors for possible future demonstration.
• Complete the development and implementation of a Transportation Management Centerto provide two-way communication to motorists and emergency services in avoidingcongestion and incidence bottle-necks through real-time information.
• Identify additional projects that are priorities for implementing if funding becomesavailable.
• Conduct the HOV System Integration Plan over the next year, to examine systemintegration, operational and design issues. This study will ensure that the prioritiesidentified in the Long Range Plan, as well as any additional projects identified for newfunding, are designed and implemented in the most cost-effectivci manner possible, andthat appropriate supporting infrastructure (park-and-ride lots, transit service andinfrastructure) are considered hand-in-hand with HOV system development.
The HOV System Integration Plan will provide the MTA with a planning basis from whichto evaluate the cost and sequencing of the projects in the Long Range Plan. This willallow the MTA and Caltrans to allocate funding and construct the HOV system, includingHOV interchanges, in the most efficient and cost effective manner. The integration Planwill address cost savings measures that could allow for current project schedules to beadvanced and additional projects to be added to the Long Range Plan. For example, theRoute 10 / Route 60 Corridors will be analyzed for alternatives that could accelerateprojects in, that region. Other options for enhancing the HOV system include exploringpartnerships with local government agencies and/or the private sector for key projectssuch as the Route 5 / Route 134 HOV interchange and considering innovative HOVdelivery options such as HOV toll lanes and private sector financing.
Exhibit 3-10 identifies HOV projects that are recommended for implementation over the nexttwenty years. It should be noted that in the San Gabriel Valley Corridor, two alternative corridorshave been identified. Within existing funding resources and current federal requirements, only oneof these alternative projects can be funded. The HOV System Integration Plan will examine thesetwo corridors and develop a recommendation for HOV development that maximizes mobilityneeds and system integration.

MTA Long Range Transportation PlanHighway/HOV Projects
Baseline HOV ProJects
• • • • • Baseline Gap Closures
AddlUonal ProJecll:
W/. HOV Lana
• HOV Inlerchangn
•• • • Gap Closures and Wldenlngs
•••• Alameda Corridor
1. Rte 5: Rte 170 - Ate 142. Rte 5/141nterchanoe3. Rte 14: Rte 5 - san Fernando Rd4. Rte 57160 Interchange
,//' WESTLAKE
,/" VILLAGE
/'
PP-044.2.95.EH••• 1..1
5. Rte 5: Rte 605 - Orange County Line6. Rte 405: Ate 101 - Rte 107. Rte 405: Ate 10 - Rte 1058. Rte 14: Escondido - Pearblossom9. Ate 10: Rte 110 - Rte 405 (lane conversion)10. Ate 10: 8aldwln - Rte 60511. East SGV HOV Complellon Options
A. Ate 10: Ate 605 • san~ernardlno County LineB. Rte 60: Rte 605 • Brea Canyon Rd. wtth HOV Interchanges
12. Rte 14: Pearblossom - P-813. Ate 5: Ate 170· Ate 13414. Other Identlfled HOV Interchanges15. Ate. 5: Rte. 134-Ate 1016. Ate 138· Widen 90th EasIlO 165th17. Ate 710 - begin construcllon
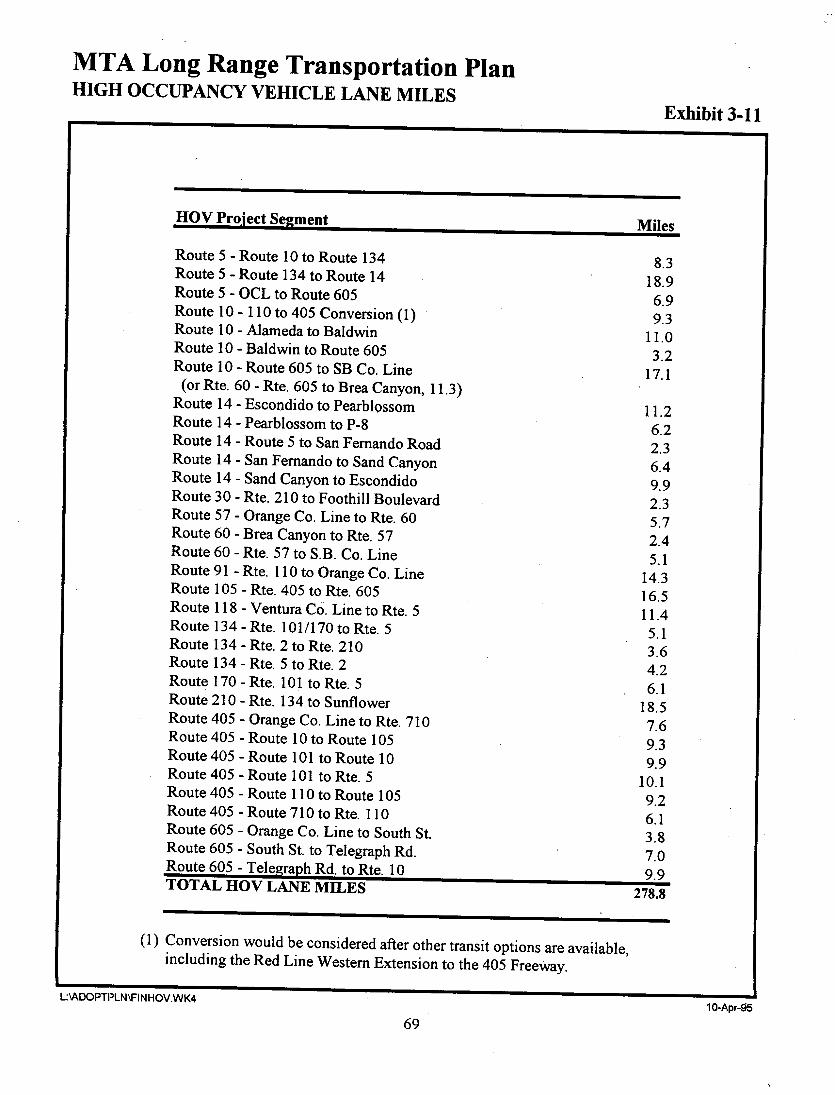
MT A Long Range Transportation PlanHIGH OCCUPANCY VEHICLE LANE MILES
HOV Pro,ject Segment
Route 5 - Route 10 to Route 134Route 5 - Route 134 to Route 14Route 5 - OCL to Route 605Route 10 - 110 to 405 Conversion (1)Route 10 - Alameda to BaldwinRoute 10 - Baldwin to Route 605Route 10 - Route 605 to SB Co, Line
(or Rte, 60 - Rte, 605 to Brea Canyon, 11,3)Route 14 - Escondido to PearblossomRoute 14 - Pearblossom to P-8Route 14 - Route 5 to San Fernando RoadRoute 14 - San Fernando to Sand CanyonRoute 14 - Sand Canyon to EscondidoRoute 30 - Rte, 210 to Foothill BoulevardRoute 57 - Orange Co, Line to Rte, 60Route 60 - Brea Canyon to Rte, 57Route 60 - Rte, 57 to S,B, Co, LineRoute 91 - Rte, 110 to Orange Co, LineRoute 105 - Rte, 405 to Rte, 605Route 118 - Ventura Co, Line to Rte, 5Route 134 - Rte, 101/170 to Rte, 5Route 134 - Rte, 2 to Rte, 210Route 134 - Rte, 5 to Rte, 2Route 170 - Rte, 101 to Rte, 5Route 210 - Rte, 134 to SunflowerRoute 405 - Orange Co. Line to Rte, 710Route 405 - Route 10 to Route 105Route 405 - Route 101 to Route 10Route 405 - Route 101 to Rte, 5Route 405 - Route 110 to Route 105Route 405 - Route 710 to Rte, 110Route 605 - Orange Co, Line to South S1,Route 605 - South S1,to Telegraph Rd,Route 605 - Telegraph Rd, to Rte, 10TOTAL HOV LANE MILES
8,318,9
6,99.3
11,03,2
17.1
11,26,22,36.4
9,92,35,72.4
5,114.316.511,4
5,13.64.26.1
18,57.69.39,9
10,19,26,13,87,09,9
278.8
(1) Conversion would be considered after other transit options are available,including the Red Line Western Extension to the 405 Freeway,
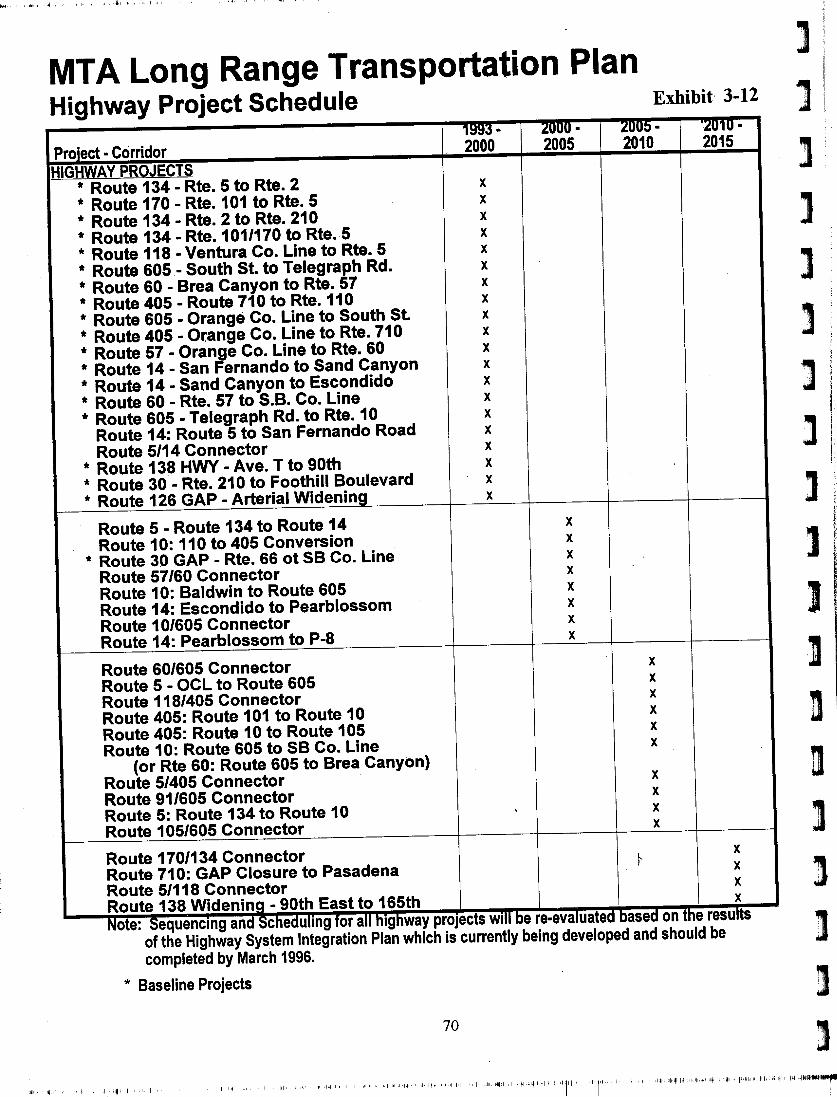
MTA Long Range Transportation PlanHighway Project Schedule Exhibit 3-12
Pro·ect· CorridorHIGHWAYPROJECTS
• Route 134 - Rte. 5 to Rte. 2• Route 170 - Rte. 101 to Rte. 5• Route 134 - Rte. 2 to Rte. 210• Route 134 - Rte. 101/170to Rte.5• Route 118 - Ventura Co. Line to Rte. 5• Route 605 - South St. to Telegraph Rd.• Route 60 - Brea Canyon to Rte. 57• Route 405 - Route 710 to Rte. 110• Route 605 - Orange Co. Line to South St.• Route 405 - Orange Co. Line to Rte. 710• Route 57 - Orange Co. Line to Rte. 60• Route 14 - San Fernando to Sand Canyon• Route 14 - Sand Canyon to Escondido• Route 60 - Rte. 57 to S.B. Co. Line• Route 605 - Telegraph Rd. to Rte. 10
Route 14: Route 5 to San Fernando RoadRoute 5/14 Connector
• Route 138 HWY- Ave. T to 90th• Route 30 - Rte. 210 to Foothill Boulevard• Route 126 GAP - Arterial Widenin
Route 5 - Route 134 to Route 14 xRoute 10: 110 to 405 Conversion x
• Route 30 GAP - Rte. 66 ot SB Co. Line xRoute 57/60 Connector xRoute 10: Baldwin to Route 605 xRoute 14: Escondido to Pearblossom xRoute 10/605Connector xRoute 14: Pearblossom to P-8 x
Route 60/605 Connector xRoute 5 - OCl to Route 605 xRoute 118/405Connector xRoute 405: Route 101 to Route 10 xRoute 405: Route 10 to Route 105 xRoute 10: Route 605 to SB Co. Line x
(or Rte 60: Route 605 to Brea Canyon)Route 5/405 Connector xRoute 91/605 Connector xRoute 5: Route 134 to Route 10 xRoute 105/605Connector x
Route 170/134ConnectorRoute 710: GAP Closure to Pasadena ~Route 5/118 ConnectorRoute 138Widenin - 90th East to 165th
ote: equencmg an c e u 109 or a Ig way projects WI e re·eva uate ase on t e resu tsof the Highway System Integration Plan which is currently being developed and should becompleted by March 1996.
* Baseline Projects

The Incident Management program has two components: Major Incident Response and FreewayService Patrol program. Both of these programs are administered jointly by the MT A, Caltransand the California Highway Patrol (CHP). The purpose of these programs is to reducecongestion, improve air quality and improve the efficient and safe flow of traffic on the freewaysystem by assisting motorists with disabled vehicles. Freeway Service Patrol/disabled vehicleassistance is provided under contract by private sector towing companies and is offered free ofcharge to the motorist.
The Metro Freeway Service Patrol covers 75 percent of the freeway system in Los AngelesCounty. The service is provided Monday through Friday during commuter rush hours (6:00 -10:00 a.m. and 3:00 - 6:00 p.m.). The service operates 144 vehicles in an effort to respond toincidents within ten minutes.
Caltrans estimates that for every dollar spent on the Freeway Service Patrol, $11 in savings isgenerated. This savings is realized in the form of:
• Reduced traffic congestion which improves traffic flow and decreases excess pollutioncaused by idling vehicles.
• Increased motorist safety by reducing congestion and keeping traffic lanes clear ofobstructions which decreases the amount of "secondary" accidents.
• Better allocation of CHP resources, allowing CHP officers to focus more on lawenforcement duties.
The Major Incident Response Program is designed to reduce clearance time for multi-lanefreeway blockages, typically known as "Sig-Alerts" by radio broadcasters. Coordination isimproved through intragency workshops. Portable field command equipment is being developedand communications technology is being enhanced.
• The program will c6ntinue to provide Freeway Service Patrol service through coordinatedefforts with the MT A, Caltrans an~ the CHP.
• New technology will be incorporated into Major Incident Response to deal withcommunications enhancing the CHP central dispatching, and detecting and handlinghazardous spills.
• Revenues for the program include local Prop C 25% funds, budget change proposedfunds, as well as HOV Violation Revenues that are expected to increase as new HOV lanemiles come into operation.
THE MULTI MODAL ELEMENT:(CALL FOR PROJECTS CATEGORIES)
The Multimodal Element includes countywide programs administered by MT A, but in whichprojects are frequently implemented by other agencies such as cities and municipal transitoperators. The individual projects are typically selected through the MTA's Call for Projects, inwhich local jurisdictions and others submit project applications, which are then prioritized andfunded based on a countywide competition. '
• Signal Synchronization and Bus Speed Improvements will be directed at maximizing theperson-carrying efficiency of arterial streets, reducing transit operations costs by fundingprojects which directly increase bus speeds and integrating local traffic signal systems.
• Transportation Demand Management will increase transit and carpool mode splits,determining and designing for user needs, pricing the auto trip appropriately and" .IncreaSIng passenger converuence.
• The Alameda Corridor will be implemented with other funding partners, to consolidategoods movement for the region, improve air quality and minimize traffic delays.
• Regional Surface Transportation Improvements will mitigate traffic congestion byimplementing capital improvements at key system bottlenecks.
• Transit Centers and Park-and-Ride will increase transit mode split and reduce passengertravel time by providing passenger shelters and facilities for restructured transit services.
• Non-Motorized TranspoIit will better integrate the transportation system into surroundingcommunities by implementing bikeways that decrease drive-alone trips and pedestrianaccess improvements around transit stations.
Traffic signal synchronization optimizes traffic controls to provide relatively quick relief to trafficcongestion. With 89 local jurisdictions within Los Angeles County, coordination among thesystems maintained by these agencies is a critical step toward providing seamless travelthroughout the county.
Bus speed improvements, such as bus-only lanes, traffic signal pnonty and intersectionimprovements can also significantly enhance overall transportation and the delivery of transitservices, and increase the attractiveness of ridesharing to otherwise solo drivers. Theseimprovements have demonstrated very high cost-effectiveness and broad applicability throughoutthe county.
Implementation of these projects, particularly bus speed improvements, requires an exceptionallyhigh level of cooperation among parties: Street improvements must be approved and constructedby local public works agencies; the MT A is the major transit operator using the improvement;local businesses and residents could bear either the benefit or the burden of these projects; andenforcement of traffic restrictions are crucial to project success.
• Bus speed improvements will be aggressively pursued on streets heavily used by transit, tomaximize benefit to transit passengers and operational savings to transit operators.Roughly 130 miles of streets currently carry sufficient transit volumes to warrant prioritytreatment.
• Improvements will be made to parallel streets for autos and buses through broadcountywide implementation of signal coordination, centralized control and Smart Corridorprojects.
• The MT A will strongly e~phasize the need for community and multi-agency involvementin the development of bus speed improvement projects.
• The MTA's Call for Projects will be the primary mechanism through which these projectswill be funded. MT A will work in cooperation with local jurisdictions and others toidentify and develop cost effective projects.
Transportation Demand Management (TDM) actions decrease the volume of traffic and vehiclemiles traveled (VMT) by influencing the manner in which people travel. TDM generally includesincreasing the use of transit, carpooling and vanpooling, bicycling and walking, shortening trips,and avoiding trips altogether through telecommuting.
In order to significantly affect travel demand, travelers must be provided with options that bestmeet their individual needs. To be effective, the MTA's TDM program must therefore provide awide choice of alternatives to driving alone. It must also provide incentives to use thesealternatives, in cooperation with both the private and public sectors. I
• Major emphasis will be placed on market-based projects, through pricing demonstrationand incentive projects, including congestion ~nd parking pricing.
• Market research will be conducted to determine transit passenger and non-passengerneeds and to identify the most effective ways to increase transit ridership.
• Maximize commuter outreach by marketing MT A-funded as well as MTA-providedservices and programs through employers for transit, vanpooling, carpooling andinformation about HOV lane, Park-and-Ride lot and telebusiness center usage.
• Transit-related ad;vancements to make transit travel easier will continue to be explored,such as information systems, smart buses and vehicle locating systems, and smart farecards.
• Improved intermodal integration (such as bicycle/bus travel) will be emphasized, alongwith implementing land use/transit policies and trip avoidance strategies such astelecommuting.
• Limited shuttle funding will be provided to demonstrate potentially self-supporting or city-supported concepts such as smart shuttles, with high-efficiency dispatching, and jitneys.
• The MT A's Call for Projects will be the primary mechanism through which these projectswill be funded, with particular focus on leveraging local and private sector efforts.Funding levels will be increased over time as we evaluate the effectiveness of the programsand MT A's role.

The efficient movement of goods is a primary component of transportation for Los AngelesCounty, and to the economic vitality of the region. In spite of this fact, regional traffic congestionboth contributes to and is affected by conflicts between goods movement and gel)eral publictravel.
The Alameda Corridor project was developed to improve the inter-modal efficiency of ourtransportation system, by consolidating the operations of the three freight railroad. carriers intoone high-speed, high-capacity corridor. The route, to be constructed along Alameda Street, willinclude the elimination of all at-grade highway crossings of the railroad, while consolidating 90miles of branch line tracks into one 20-mile corridor.
A distinct improvement to the region will b,e the elimination of traffic conflicts at nearly 200 at-grade highway crossings of the tracks, saving an estimated 15,000 hours of delay per day forvehicles sitting and waiting to cross as trains pass. In addition, Alameda Street will be improvedto provide better access from the ports of Long Beach and Los Angeles to freeway ramps. In-doing so, the Alameda Corridor will accommodate the increase in rail and truck traffic associatedwith the ports' growth, while significantly reducing the negative impacts of that growth on theenvironment and neighboring communities.
,• MT A will join with other local, state, federal and private sources to pursue the project.
MTA involvement in the program will be to provide approximately $350 million infunding, contingent upon negotiation of key oversight and performance requirements.
• MT A will examine the applicability of goods movement improvements in other corridorsthroughout the county.

Regional Surface Transportation projects include improvements to major inter-jurisdictionalarterial streets, interchanges, grade separation projects, and goods movement projects.
These projects frequently provide significant reduction in traffic congestion and delays insurrounding areas, which benefit both transit users and general auto traffic. However,implementation of these projects has become more difficult in recent years due to increasingconcerns regarding their impact on air quality and the environment. MT A involvement willtherefore be limited to those projects which are clearly deliverable within limited time horizons.
MTA involvement in these projects is further reserved for major capital improvements toregionally significant arterial highways that are beyond the normal funding capability of theaffected local agency(ies). Of particular concern to MTA is the regional significance of theproject, its regional continuity (length), usage (traffic volume), and connectivity to major activitycenters or transportation facilities such as freeways and airports.
• Technical feasibility and project deliverability will be key crit~ria in the selection ofprojects to be funded.
• The MTA's Call for Projects will be the primary mechanism through which these projectswill be funded, with particular focus on leveraging local funds.
Provision of comfortable, safe, and convenient transfer points is a major determinant of the transitsystem's attractiveness and effectiveness at generating ridership. This is particularly true wheretransit restructuring studies result in recommendations for timed transfers and other strategieswhich concentrate transit passengers at particular locations. For park-and-ride and bus stopfacilities, integration with surrounding land uses and the community are also essential.
• Transit centers and enhanced bus stops (similar to those recommended in the Inner Cityand San Fernando Valley bus restructuring studies) will be funded through the Call forProjects.
I
• MT A funds dedicated to these purposes will increase over the 20-year period.
• In order to implement these projects in the near term,MTA will develop a leveragefunding formula through the Call for Projects to give local jurisdictions incentives to investin transit center and bus stop improvements. .
Bicycle, pedestrian and other non-motorized modes are in many ways the cleanest and most cost-effective forms of travel. Safe, attractive, and convenient access to transit and other non-motorized alternatives to auto travel are therefore an important part of the transportation system.
• MT A funding of bikeways will be limited to major interjurisdictional connections,bottlenecks and demonstrated bicycle commute corridors.
• Pedestrian access improvements to transit centers and stations will be encouraged andfunded through the Call for Projects. "
These programs include projects funded up to the available revenue level defined annually for theprogram. Each program is defined as a source and use of funds in the MTA's Financial Plan andis not fungible. These programs are administered and programmed by the State.
• State Highway Operation and Protection Program (SHOPP): provides resources foroperational integrity and safety of the State Highway System that includes rehabilitation,traffic safety, seismic safety and other small improvements; funded though the StateHighway Account.
• Service Authority for Freeway Emergencies (SAFE): provides resources for anintegrated freeway callbox system providing direct telephone links to the California StateHighway Patrol for notification of road hazards and emergencies; funded by an annualsurcharge on motor vehicle registration fees.
• ' Environmental Enhancement and Mitigation (EE&M): provides resources tomitigate environmental impacts of new public transportation facilities in three majorproject categories - Highway Landscape and Urban Forestry, Resource Lands andRoadside ReGreational facilities; funded through the State Highway Account.
• Inter-Regional Road: provides resources for improving inter-regional travel in areasoutside urbanized areas of the state; funded through the State Highway Account.
• Retrofit Soundwalls: provides resources for building freeway soundwalls for the purposeof reducing noise pollution generated by the freeway system; funded through the StateHighway Account.
These programs serve as part of the region's strategy to meet the goals of mobility, air quality, andcost-effectiveness and are assumed to continue throughout the 20-year period of the plan.
The transportation infrastructure improvements identified in earlier Chapters of the plandemonstrate considerable success in improving mobility. These projects successfully lead toincreasing ridership for transit and carpooling, which reverses a declining trend occurring acrossthe nation. However, even with these important improvements, Los Angeles will continue to facea daunting task in meeting its mobility challenge. High levels of congestion will continue to existand, in fact, single occupant vehicles could -stillaccount for as much as 77 percent of the home-to-work trip in our county.
It is clear that while facility improvements are necessary to improving mobility, such solutionsalone will not solve our mobility and air quality problems. This is in large part because of thedispersed travel patterns of our county which are difficult for our transit system to accommodate,as well as because the subsidies provided to the automobile (i.e., employer subsidized parking,low cost of user fees, free access to freeways regardless of construction costs) make theautomobile the most attractive transportation choice for many.
In order to meet mobility needs of the future, we need to re-examine our transportation policiesthat lead to a preferred use of the automobile, and consider a policy shift to strategies thatencourage greater reliance on transit and carpool use. It is appropriate to consider such policyshifts as an element of the Long Range Plan, because changes in policy must go hand in hand withsystem improvements, in order to ensure that policy changes are supported by readily availabletransportation alternatives in order to be successful.
The Long Range Plan has focused on five policy shifts that encourage greater reliance on transitand ridesharing. These are as follows:
• Increasing the minimum passenger occupancy for High Occupancy Vehicles from twopersons per vehicle to three persons per vehicle.
• Increasing Minimum Passenger Occupancy for High Occupan"cy Vehicles. With theexception of the EI Monte HOV facility, all High Occupancy Vehicle Lanes in operationor under development in Los Angeles County will require a minimum of two persons pervehicle. While this minimum standard is useful at this time in encouraging the effectiveutilization of new carpool lanes, our modeling analysis shows that these lanes will becomeincreasingly congested over the next twenty years. It is important to manage trafficcongestion on carpool lanes to maintain a free flow condition, as a free flow condition
" rewards carpoolers by allowing them' to arrive at their destination faster by travelingthrough less congestion than is found on normal mixed flow lanes. HOV lanes also have abenefit on improving congestion in normal mixed flow lanes, since every two personcarpool using an HOV lane removes two cars from the normal mixed flow lanes.Effective transit service using the carpool lanes has an even greater benefit in removingautomobiles.
The modeling for the Long Range Plan demonstrates that if carpool lanes remain at twopersons per vehicle over the next twenty years, they will be operating at approximately 20miles per hour. In order to maintain the time-competitive advantage with the mixed flowlanes that creates the incentive for carpool and transit use, the HOV system needs to bemanaged to maintain speeds of 40 miles per hour or greater. This will require that theminimum passenger occupancy be increased from two persons per vehicle to three personsper vehicle as carpool lane congestion increases over the next twenty years.
It is important that policy decisions on raising the HOV minimum requirements be madeconsidering the HOV system as a whole, rather than on a facility by' facility basis.Changing HOV policies on some segments while leaving them alone on others would onlycreate operational problems as, for example, two person carpools traveling on segmentswith different requirements might be required to exit on portions of the system restrictedto three persons or more.
Additionally, increasing minimum requirements can also displace eXistmg two personcarpools. It is possible that increasing HOV lane requirements in combination with otherstrategies may have the most desirable mobility benefit. Such strategies might include,incorporating three person HOV lanes with local parking policies, or to provide access toHOV lanes for two person carpools and single occupant vehicles at a fee. Opportunitiesmay also exist to restructure bus services to maximize utilization of transit on HOV lanes,as the greater the bus utilization of an HOV lane, the higher the person through-putproductivity of the facility. Such issues need to be considered to avoid unnecessarycongestion bottle-necks and to ensure the safe operation of the syst~m.

MT A, in partnership- with Caltrans and the Southern California Association ofGovernments, will be developing an HOV System Integration Plan which is scheduled forcompletion by early 1996. The HOV System Integration Plan will examine how HOVthresholds should be changed within a systemwide context, and result in a policyrecommendation to address this issue which can be incorporated into future updates of theMT A Long Range Plan. The issues mentioned in the above paragraph will all beconsidered as part of the HOV System Integration Plan analysis.
• Increase Telecommutingffeleservices. There appears to be growing public interest andreceptiveness to technological improvements that are bringing in the computer age and therevolutionary "information highway". As a result of this receptiveness, the implementationof a wide range of telecommunications strategies may be one of the most promisingstrategies, for encouraging the public to forgo certain trips. A growing number ofbusinesses are allowing employees to telecommute for one or more days per week. Withthe advent of on-line computer services and the Internet, there is a growing capability toorder information, goods, and services that may significantly alter the need for travel.
,
One of the most significant barriers to enhancing telecommuting strategies areorganizational and institutional concerns, related to the management, supervision andcommunication with employees that are not working on-site. There is an increasing bodyof research as to how employers have overcome such obstacles and developedtelecommuting programs that provide flexibility to employees that benefit from working athome or at an off-site location, while maintaining or increasing productivity andaccountability, which is of utmost importance to employers. We recommend that outreachprojects be initiated to coordinate with private and public sector interests to sharetelecommuting methods successfully used by other organizations, so as to reduceinstitutional issues and facilitate telecommuting. SCAG is currently funding MT A throughtheir Southern California Economic Partnership to conduct executive outreach. MT A mayalso wish to consider telecommuting demonstration projects in the TDM Category of theCall for Projects process.
• Parking Management. A wide range of parking strategies can be promoted, primarily bylocal jurisdictions, to discourage auto travel by affecting parking policy. Such policychanges could include:
• Expanding parking cashout programs which allow an employer to reduce theobligation to provide parking and through the savings, provide a cash allowancethat employees can use for transit or carpool alternatives.
• Restructuring parking fees. Fees could be raised in various ways, such as throughan across the board surcharge or by making changes to early-bird discounts. Suchchanges increase the cost of traveling by auto relative to transit, therebyencouraging the use of transit and carpools.
• Reducing the availability of parking supply to encourage greater reliance on transitand carpooling. This strategy may be particularly effective in urban centers.
Parking strategies are primarily implemented at the local level through local ordinance. Asa result,' considerable coordination must be' conducted with local jurisdictions to assistthem in implementing strategies. MT A is currently funding several demonstration projectsthrough the Call for Projects examining parking strategies at specific employer sites. Apreliminary evaluation these projects indicates that parking strategies can dramaticallyincrease rides~aring and transit use. MT A may wish to consider funding a variety ofpar}cing demonstration studies through the TDM Category of the Call for Projects. MT Amay also wish to create incentives for local jurisdictions to implement parking policystrategies by providing bonus points to jurisdictions that implement effective parkingpolicies in competing for MT A funds in future Call for Projects processes.
Focus Land Development Around Transit. A wide range of studies conducted byprivate sector, environmental and government groups have documented that landdevelopment focused around transit centers creates an environment that reduces vehicletrips and encourages the use of transit. MT A's review of this literature suggests thattransit friendly development constructed around rail stations may reduce vehicle trips by asmuch as 20 percent. Land use decisions are a local responsibility that require considerablepolicy integration in many areas, including zoning, general or ~pecific plan changes, andensuring supporting infrastructure and services are provided.
MT A should consider local jurisdiction demonstration projects through the TDMCategory of the Call for Projects that lead to land use changes around transit centers thatencourage transit use. MT A staff have also worked with jurisdictions in the developmentof land use/transportation strategies.
Regional Market Incentives. There is emerging interest at poth the State and regionallevel in examining market based incentives, such as facility pricing (i.e., toll facilities) orVMT fees that in essence charge based on the miles of auto use.
]
]
]
]
]
]
j
~
]
]],
].,1WI
J]
]
J]
]
SCAG and Caltrans have been awa(ded $1 million as part of an FHW A congestion pricingdemonstration study. This study will identify various market incentive strategies, gaugepublic acceptance of such strategies, and developing a strategy for further consideration ofthese concepts. MT A staff will actively participate in this process.
The policy changes identified above require changes to individual travel behavior that will bechallenging, as getting people to change habits is always difficult. However, just as publicattitudes toward smoking have drastically changed in recent years, so must attitudes toward singleoccupant vehicle use, if we are to provide for our future mobility needs. The identification ofpolicy changes in the Long Range Plan is a first step in identifying options that have complexconsequences. These consequences require considerable analysis and long term strategies inorder to build public support necessary for successful and effective implementation. It isimportant to begin the dialogue on policy options through the Long Range Plan process, andthrough MT A participation with regional and state agencies exploring these issues.
• Consider implementing appropriate demonstration studies that test the viability of policyoptions through the Call for Projects.
• Participate with state, regional, and local agencies in exanunmg the viability andconsequences of different strategies. Participate in on-going study efforts at the regionaland state level to explore policy options.
• Continue MT A staff efforts in identifying those policy shift options that work best for LosAngeles. As policy options are considered, MTA will work to forge broad consensus tofacilitate the development of effective strategies while minimizing any adverse impacts,and also. work toward educating the public regarding mobility needs, the need for changesin travel behavior, and the benefit the public will derive in terms of improvements tomobility, air quality, and the economy.
The components of the Adopted Plan were selected following several stages of travel simulationsand evaluations. First, each project and program was analyzed individually against the BaselineScenario. Then, the projects and programs were grouped into alternative scenarios to identify thebest combination. Additional analysis was conducted on several supportive policy alternatives tothe Adopted Plan. While the three performance indices (mobility, air quality, cost effectiveness)provided quantitative data on the relative merits of each alternative, the application of the ISTEAPlanning Factors was also conducted for the qualitative impacts of the alternatives. (The detailsof these analyses are presented in Appendix A.) This technical analysis and the public inputreceived from numerous briefings, workshops and community meetings contributed to the,development of the Adopted MT A Long Range Transportation Plan that will best meet thetransportation needs of Los Angeles County.
The transportation facilities and policies in the Adopted MTA Long Range Transportation Planwill lead to an improvement in countywide travel conditions as compared to the conditions thatmay have otherwise existed without those improvements. In the testing of various alternativescenarios, it was determined that the Adopted Plan provides the best mix of projects andsupporting elements to create an overall improvement in mobility and air quality (Exhibit 3-13).Simultaneously, the Adopted Plan was found to be cost effective in using the limited availableMTAfunds.
The Mobility Index is a multimodal performance measure that was used to evaluate the movementof people through the Los Angeles County transportation system. The Adopted Plan provides a26% improvement in the mobility index compared to the Baseline Scenario. The Adopted Planprovides travel speeds improvements for all modes of travel and encourages increased ride sharingthrough improvements for transit and carpool travel. However, the Adopted Long RangeTransportation Plan will not fully recover from the increasing congestion that led to the decliningMobility Index and deteriorating highway travel speeds by the Year 2015. Transportation policiesencouraging shifts. in travel behavior, which either provide incentives to ridesharing ordisincentives to single-occupancy travel, are needed to further improve mobility in Los AngelesCounty.

MTA Long Range Transportation Plan
Selected Performance Characteristics
BaselineScenario
Adopted Planw/o Policies with Policies
Air Quality Index (mobile source kg)
Cost Effectiveness Index ($/Hr Saved)
- MTA: Transit & HOV- MTA: All Travel- Total Public: Transit & HOV- Total Public: All Travel
NANANANA
NANANANA
$2.65$1.35$3.87$1.98
$1.68$0.91$2.46$1.33
- Transit- Carpool- Drive Alone
8.25%15.92%75.83%
7.28%13.85%78.87%
9.22%13.46%77.32%
9.90%14.29% .75.80%
The greatest improvement in air quality over the next twenty years will come from technology.As low- and zero-emission vehicles become more prevalent in the on-the-road fleet, air qualityimprovements will occur not unlike that which has occurred over the past twenty years withemission controls.
"
The MT A is taking a national leadership role in the development of low- and zero-emissionvehicles through its development of the Advanced Technology Transit Bus (ATTB) program.Strongly supported by the California Congressional delegation, the program was -initiated in 1992with a multi-year grant from the Federal Transit Administration and matching funds from theMT A. The objective is to develop a lightweight, low floor, advanced electronics, ultra lowemission bus ready to be field tested in the 1997-1999 time frame. The MT A is o.ne of 19 transitagencies throughout the country participating in the ATTB program. These agencies represent42% of the national bus fleet.
In conjunction with the ATTB development, a Fuel Cell Buyers' Consortium has been formed,consisting of thirty state and local government entities, public utilities and transit agencies. Theirpurpose is to achieve the rapid and successful transition to zero emission vehicles called for by theSouth Coast Air Quality Management Plan and to harness Southern California's buying power tosupport defense conversion and new technology jobs in a dynamic profitable fuel cell industry.The ATTB has been targeted as one of the points of entry for bringing fuel cells into thetransportation market.
Based on the emission factors for the Year 2015, supplied by the California Air Resources Board,the Baseline Scenario indicates that mobile source pollutant emissions will decline approximately60 percent. The Adopted Plan will provide a small amount of additional reductions in mobilesource emissions from the Baseline Scenario. The air quality improvement is largely attributableto the mode shift from single-occupant vehicles to transit and carpools. This not only reducesvehicle trips, but also enables the remaining vehicles to travel somewhat faster.
The performance measure used to evaluate the cost effectiveness of the Adopted Plan was thecost per hour of travel time saved. This measure was evaluated from the perspective of both thecost to the MT A and the total public cost of the Adopted Plan. In addition to the travel timesavings associated with transit and carpool travel, the measure was also used to measure traveltime savings for all modes including single-occupant vehiCles. One standard that can be applied toevaluate this measure is the minimum wage rate (currently $4.25/hour). Another is thegeneralized value of time obtained from travel surveys and calculated in econometric models(currently $10.50 based upon the SCAG 1991 Household Travel Survey). The composite costeffectiveness for the Adopted Plan passes the test in that the expenditures by either the MT A or

the public for an hour of travel time savings for either ridesharers or all travelers is significantlyless than either standard.
Given that the air quality consideration will largely be addressed by automotive technologicalimprovements, the largest remaining problem Los Angeles County faces is the increasing trafficcongestion. The three methods to reduce congestion are to reduce vehicular travel, to movevehicles more efficiently or to build more roads. The Adopted Plan includes elements of all threemethods, but primarily focusing on vehicular travel reductions and transportation systemsmanagement to facilitate bus and auto travel. The drive-alone commuter mode share declinesfrom 78.9% under the Baseline Scenario to 77.3% in the Adopted Plan resulting in a reduction of120,000 daily commuter auto trips. The transit mode share increases to 9.2% from 7.3% in the2015 Baseline Scenario. If the Adopted Plan is successful in achieving this transit modeshare, it would represent the reversal of a tOO-yeardecline. Carpooling declines~lightly from13.8% to 13.5% largely due to the transit improvements that encourage carpools in thosecorridors to switch to transit (only a small percentage of all carpools use freeway carpool lanes).
Still, the carpool projects and programs included in the Adopted Plan provide a foundation for. increased ridesharing with the adoption of supportive transportation policies. This was illustrated
in the evaluation of a policy scenario that imposed a 20 percent parking tax (50 percent aroundtransit stations) and a 5¢ per vehicle mile fee. The analysis showed that this policy scenario wouldreduce single-occupant vehicle mode share to less than the 1990 level and increase transit modeshare to nearly 10 percent. The total ridesharing mode share would be ma,tginally higher than in1990, but the increase in transit mode share (relative to carpooling) would contribute to fasterhighway speeds than would otherwise have been possible.
Travel speeds for all modes were improved by the highway and transit improvements included inthe Adopted Plan. Freeway travel speeds either increase or do not detenorate from already highBaseline Scenario levels (Exhibit 3-14). This is particularly notable in the communities ofPalmdale, Santa Monica, Burbank, Glendale, the Beach and Mid-Southeast Cities, and the SanFemando and San Gabriel Valleys. The peak hour travel speeds on specific freeways also show acomparable improvement (Exhibit 3-15). The freeway system in the Adopted Plan benefits fromthe expansion of capacity associated with the addition of HOV lanes on many facilities. Arterialtravel speeds are similarly improved in nearly every community (Exhibit 3-16).
These speed improvements are also notable on the various components of the transportationsystem. Following the dramatic declines from 1990 to the Year 2015 Baseline Scenario, speed

]
Jj
]
]
]
]
]
]
3',j!!i
]
]
]
]
]
JJ
2015 Baseline6-9 AM Peak Period Average Freeway Speed By R£\
Legendc=J 0 - 10[22J 11 - 15~ 16 - 20lZZ.ZJ 21 - 25
~26-30~31-4O
,.., 2015 Adopted Plan - over 40~ 6-9 AM Peak Peak Period Average Freeway Speed By R£\
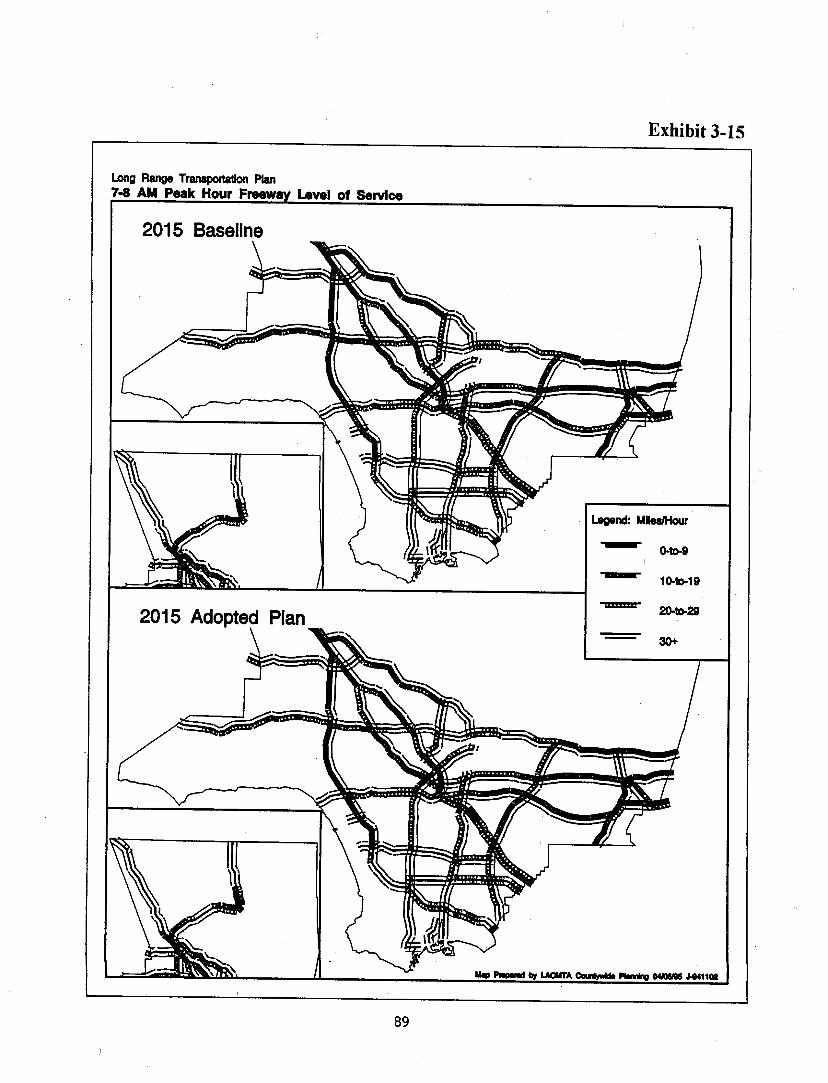
Long Range Tranaporta1Ion Plan7-8 AM Peak Hour Freewa Level of· service
2015 Adopted Plan
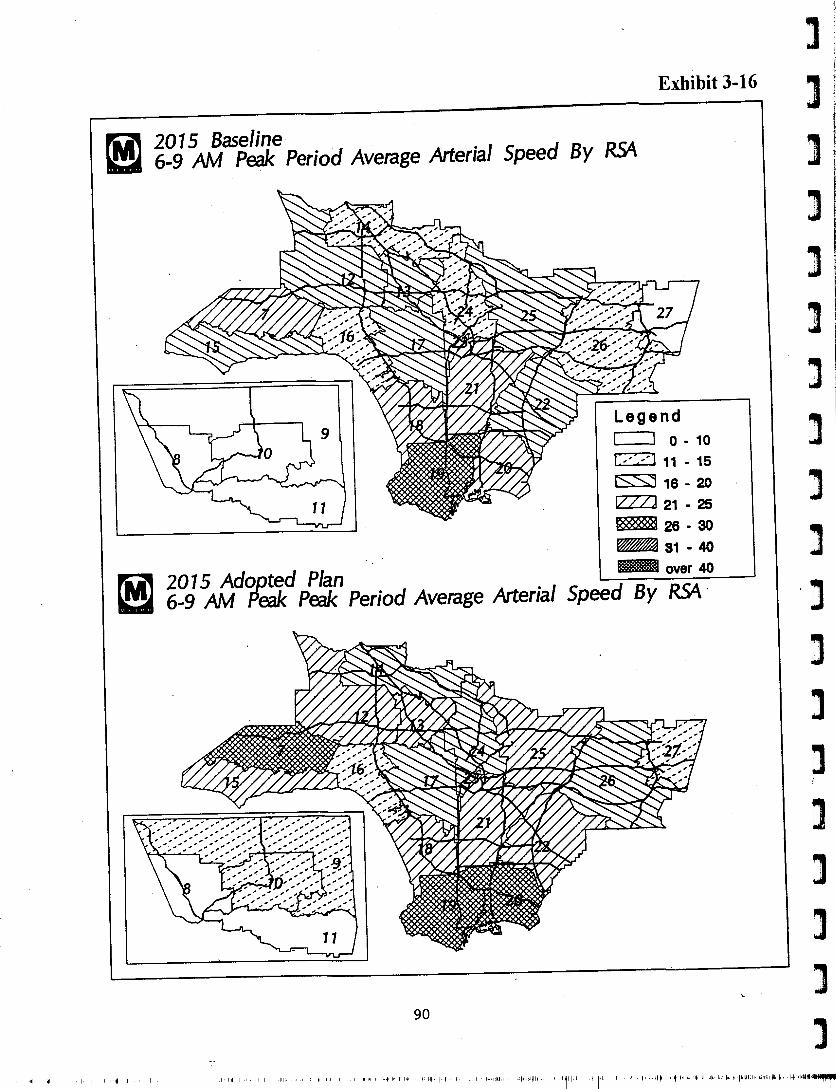
2015 Baseline6-9 AM Peak Period Average Arterial Speed By R9t
Legendc:=J 0 - 10C2J 11 - 15
~ 16 - 20IZZZJ 21 - 25~26-30
, ~31·4O
2015 Adopted Plan . - over 406-9 AM Peak Peak Period Average Arterial Speed By RSA.'
]
].;.;.. 11'
]
]
]
]
j
~
n],]
]
]
~I
3]
]
]
J
improvements ranging from 4-16 percent are projected for all highway and transit travel(Exhibit 3~17). As described earlier, the increase in transit mode share reduces the number ofvehicles using roadways resulting in speed improvements for all modes. Arterial speeds arefurther assisted by the implementation of traffic management systems on all major arterials. Thesetraffic management systems also improve bus travel speeds through the implementation of arterialbus lanes and preferential treatments in the heaviest transit service corridors. Rail transit speedsare improved through the provision of heavy rail extensions in grade separated rights-of-way.
The average door-to-door travel speed improvement (including walking, waiting and parkingtime) is even more dramatic (Exhibit 3-18). The door-to-door speed for the 1990 all-bus systemis estimated at 9.2 miles-per-hour in the MTA model. The three rail lines in the Adopted Planimprove transit speeds to 12 miles-per-hour. This represents a 32% increase over today'sdoor-to-door transit travel speed. The HOV and highway projects in the Adopted Planimprove auto speeds to over 20 miles-per-hout compared to 17 miles-per-hour in the BaselineScenario.
• The Adopted Plan strikes a balance between bus and rail improvements and provides thehighest level of ridesharing and transit ridership.
• Transit work trip mode share increases to 9.2% in the Adopted Plan, up from 8.2% in1990 and up from 7.3% in the 2015 Baseline Scenario.
• Rail development in the high demand corridors shown in the Adopted Plan will providemore mobility than bus improvements in those same corridors.
• Automotive technological improvements (zero- and low-emission vehicles) will reducemobile source emissions by the year 2015, but an wide-ranging congestion problem willremwn.
• The Adopted Plan improves upon Year 2015 Baseline Scenario performance, but does notrecover 1990 mobility levels.
• Behavioral changes are need to achieve greater utilization of transportation systemcapacity and further system performance. Some combinations of transportation policies, ifimplemented countywide, have the potential to reduce the drive-alone mode share andincrease the transit mode share to nearly 10 percent.

-
-
50-:~
~- 40-
.:c\0 •N (l,.
~
MTA LONG RANGE TRANSPORTATION PLANYear 2015 Average A.M. Period Mode/Facility Speed By Scenario
24.4--------------------------.- ..---...----- 22.3-·----~·---· 22.2-- ----------.--~-
21.3
Adopted Plan
DDIII Rail Line_ Freeway Lane - Carpool Lane
~J~~~~~~~~~~~~~~~~~~~
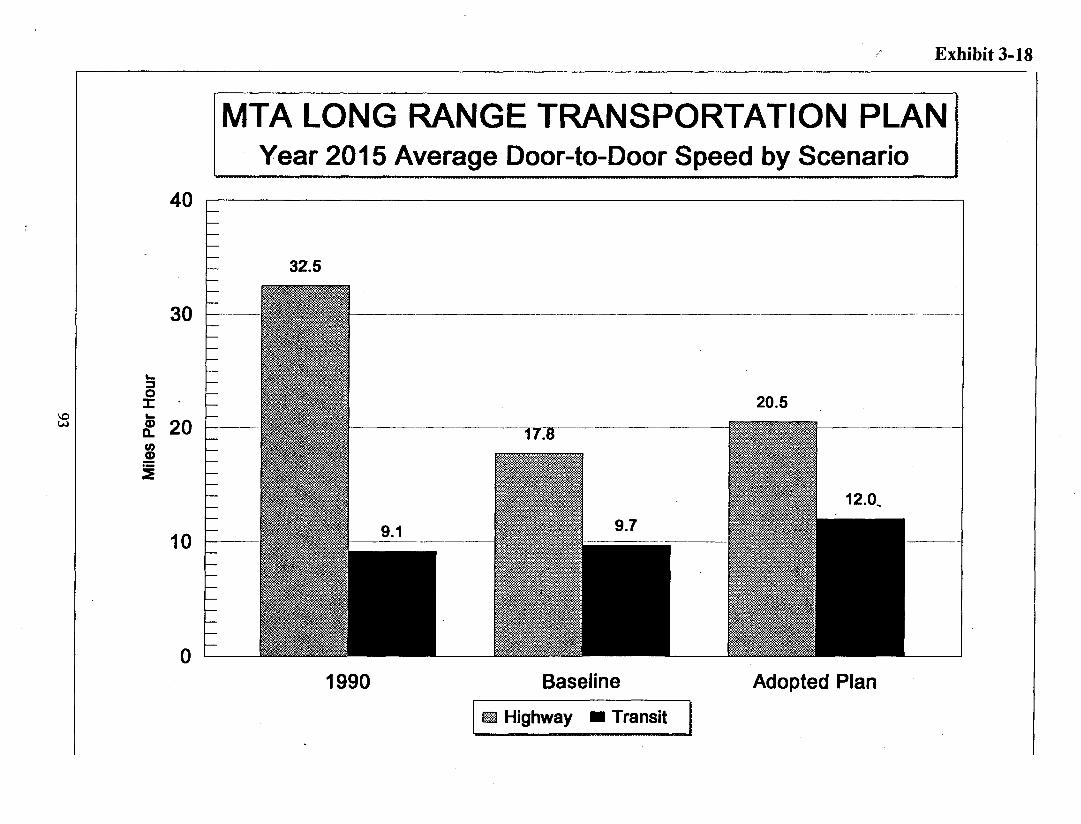
•..::so:r:: '•..8? 20~~
MTA LONG RANGE TRANSPORTATION PLANYear 2015 Average Door-to-Door Speed by Scenario
Baseline
I mID Highway - Transit
Adopted Plan

CHAPTER 4FINANCIAL ELEMENT
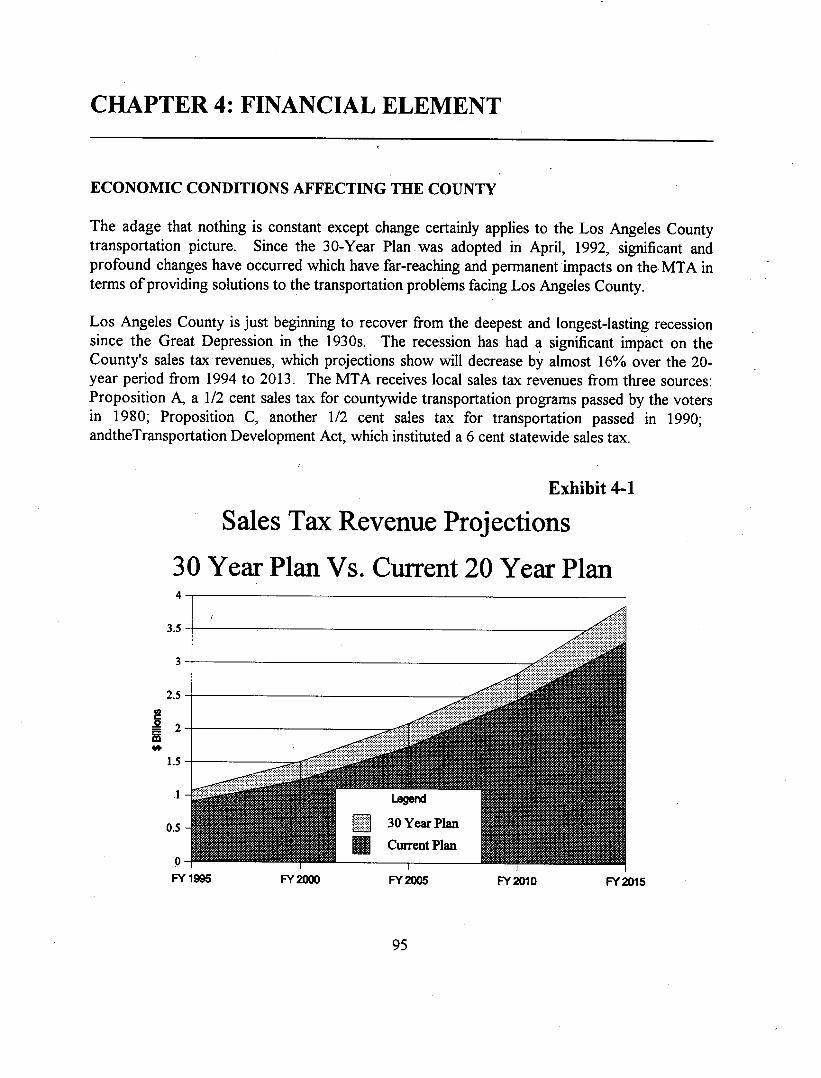
CHAPTER 4: FINANCIAL ELEMENT
The adage that nothing is constant except change certainly applies to the Los Angeles Countytransportation picture. Since the 30-Year Plan -was adopted in April, 1992, significant andprofound changes have occurred which have far-reaching and permanent impacts on theMTA interms of providing solutions to the transportation problems facing Los Angeles County.
Los Angeles County is just beginning to recover from the deepest and longest-lasting recessionsince the Great Depression in the 1930s. The recession has had a significant impact on theCounty's sales tax revenues, which projections show will decrease by almost 16% over the 20-year period from 1994 to 2013. The MT A receives local sales tax revenues from three sources:Proposition A, a 1/2 cent sales tax for countywide transportation programs passed by the votersin 1980; Proposition C, another 1/2 cent sales tax for transportation passed in 1990;andtheTransportation Development Act, which instituted a 6 cent statewide sales tax.
Exhibit 4-1
Sales Tax Revenue Projections30 Year Plan Vs. Current 20 Year Plan
oFY1995
Each year, the MTA relies on the Long Term Forecastfor Los Angeles County, prepared by theUCLA Business Forecasting Project, to project sales tax revenues over the long term. The 30-Year Plan, adopted in April 1992, was based on UCLA sales tax revenue projections fromOctober 1991, which estimated revenues of $40.3 billion over the 20-year period. The mostrecent UCLA forecast of August 1994 projected sales tax revenues of only $34 billion for thesame period, a reduction in the projection of over $6 billion dollars.
As defined by the program envisioned in the adopted 30 Year Plan, the projected reduction inlocal sales tax revenues adversely impacts the MT A's ability to fund transit operations, to issuebonds for capital construction projects, and to provide discretionary funds to cities, the Countyand other local agencies for regionally significant projects.
The recession and the resulting decrease in sales tax revenue projections also impacts the MT A'sability to match state and federal dollars, further reducing the revenues available. Many of thestate and federal transportation funds available to the MT A, such as ISTEA funds, require a localmatch. Sales tax revenues represent approximately 73% of the local funds available over the 20year period, so any reduction in this source has a significant impact on the availability of localmatching funds.
At the state level, a $5 billion shortfall in the State Transportation Improvement Program (STIP)has resulted in a loss or delay in revenue~ available to the MT A. Propositions 156 and 181 wouldhave provided $2 billion of rail bonds statewide, of which Los Angeles County would havereceived $800 million for the Pasadena Blue Line and the San Fernando Valley East/West Line.While the state has committed to honor its STIP obligations to Los Angeles County, these fundswill be significantly delayed, directly impacting project construction schedules since local fundsare not available to fully substitute for delayed state funds in the same time period.
At the federal level, the new Congress is looking at ways to cut federal spending. Transportationfunding and transit operating subsidies may be targeted for significant reductions. Section 9operating funds were already reduced by 11% in the last fiscal year.
While Los Angeles County continues to show the spirit and resolve to bounce back from.numerous setbacks, some of these setbacks, in particular the recession and resultant loss of jobs,.will have permanent adverse impacts. According to UCLA's Forecast, Los Angeles County hasalready lost over 400,000 jobs, or 10% of its base, since its 1990 peak. Before the recession isover, it is projected that the County will have lost an additional 60,000 jobs. Thus, while LACounty makes up 30% of the State's population, 70% of California's total recessionary job losswill be in Los Angeles County.
Further exacerbati~g the effects of recessionary job losses in LA County is the fact that most ofthe job losses are in the durable goods manufacturing sector, which is driven by aerospace andother high-tech jobs. This sector of the economy has lost 35% of its base since its peak in late
~
m
m
m
~
m
m
l..~
~
~
~
]
]
]
]
]
]
]
1985. LA County has suffered a permanent loss of many of these high-paying jobs and asignificant portion of these are being replaced by lower-wage, part-time positions in the serviceand trade sectors.

SUMMARY OF FINANCIAL CHART INFORMATION
This chart summarizes the type, amount, and percentage of federal,state and local funds that comprise the $72.4 billion Adopted LongRange Plan.
This chart summarizes the cost of the different components of the Plan,including bus and rail capital and operations, highway capital, localreturn, and other costs (debt service, etc.).
This chart combines the information presented in Exhibits 4-2 and 4-3.It shows the total costs for the different Plan components, as ~ell asthe type of revenues funding each component.
This chart provides a detailed listing of all projects and programs ineach component of the Adopted Plan, as well as their total costs.
\
Exhibit 4-6: Project and Program Cost Detail
This chart expands on Exhibit 4-5 by showing the various majorrevenue sources that fund each project and program in the AdoptedPlan.
!]
~
m
~
~
m'IIJJI.
~
]
~
~
,~
]
]
]
]
]
]
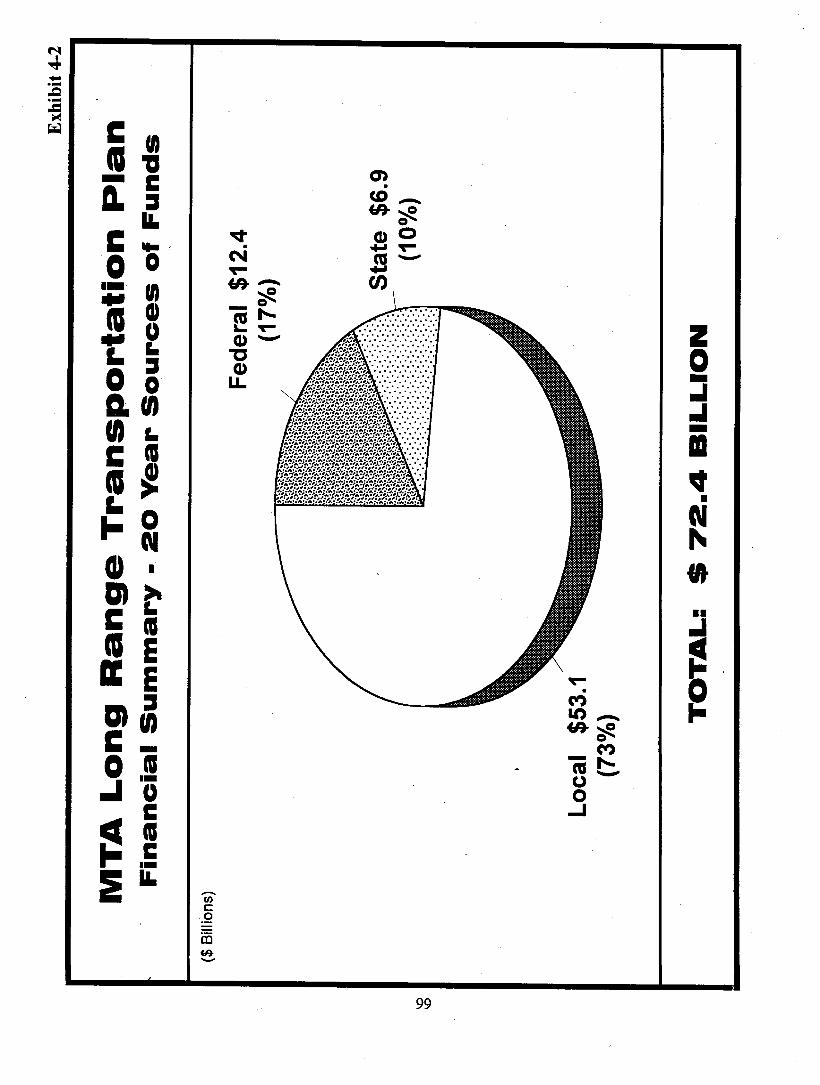
c ...o 0.- rn•• Q)ca 0•• L.I.o gCl.UJen L.C mca~I. 0I-NG)m~C mca Ea: Em::lC ~o .!..I 0
cmc••II.
cI-a.
zo-••••••-II~ •~
•••••••
~
~
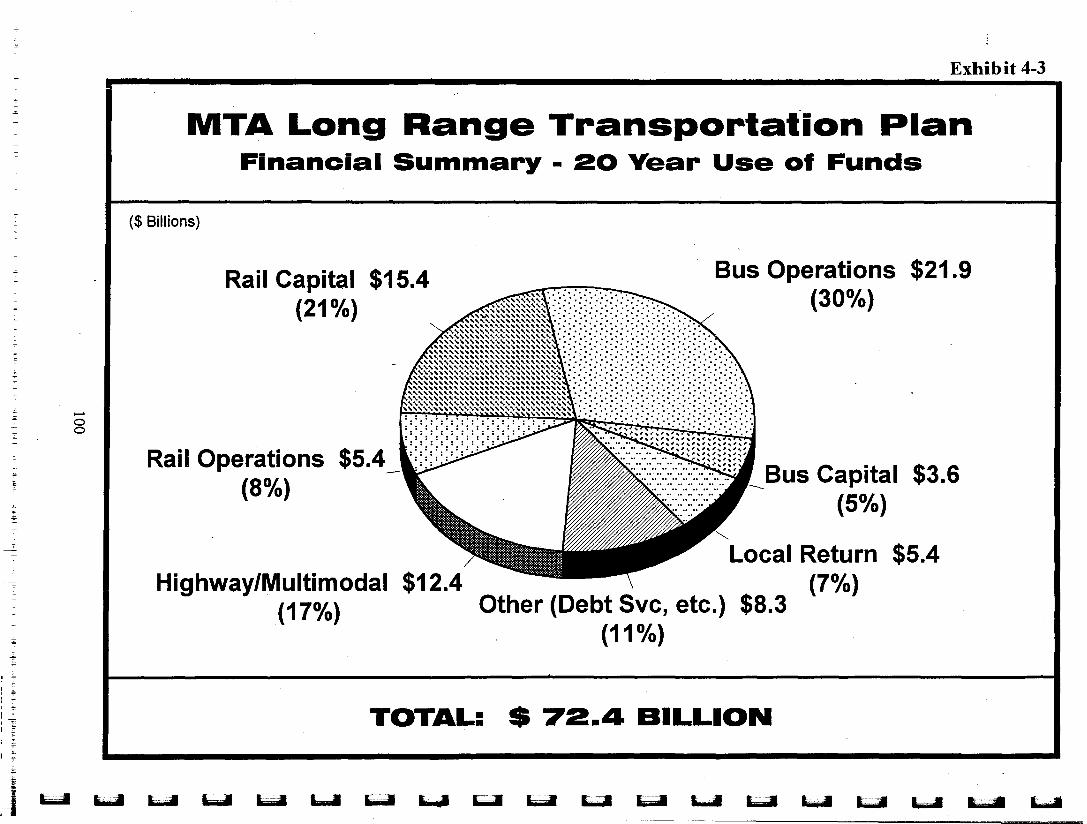
MTA Long Range Transportation PlanFinancial Summary • 20 Year Use of Funds
Rail Capital $15.4(21 °k)
Bus Operations $21.9(300/0)
Rail Operations $5.4(8°1'0) Bus Capital
(5%)$3.6
Highway/Multimodal(17%) Other (Debt Svc, etc.) $8.3
(11°k)
Local Return(7%)
$5.4
TOTAL: $ 72.4 BILLION
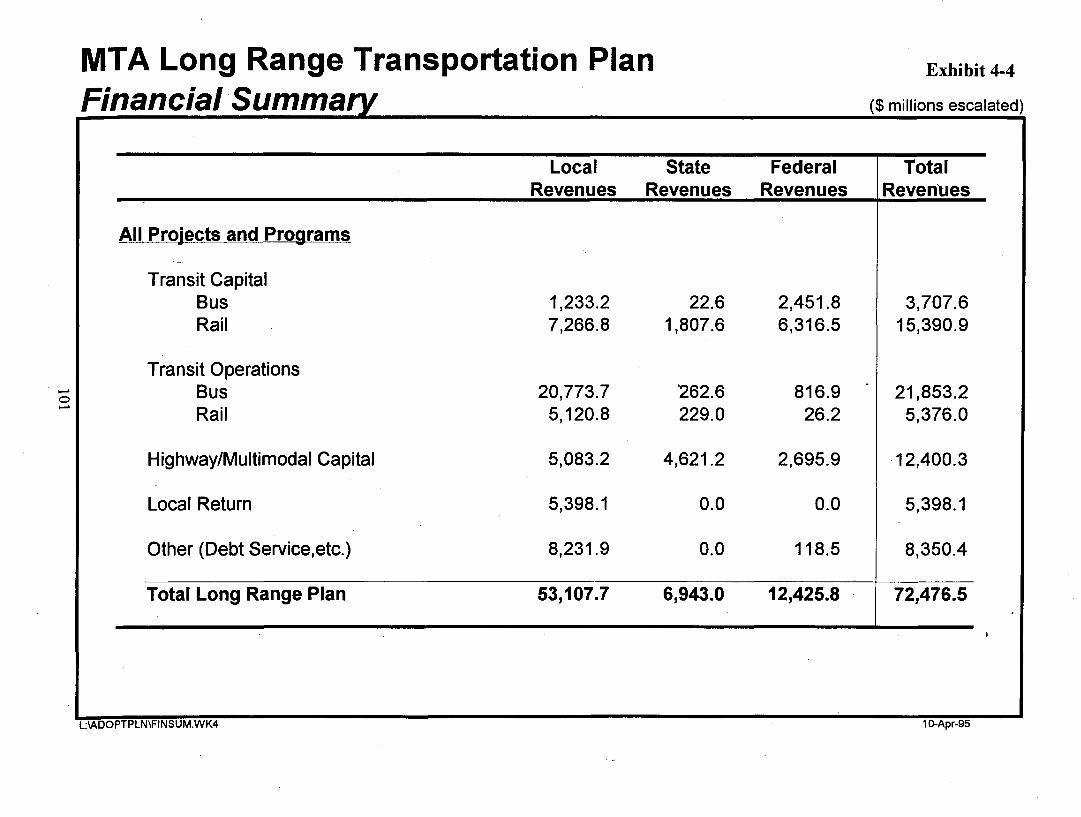
MTA Long Range Transportation PlanFinancial Summa
Local State Federal TotalRevenues Revenues Revenues Revenues
All Projects and Programs
Transit CapitalBus 1,233.2 22.6 2,451.8 3,707.6Rail 7,266.8 1,807.6 6,316.5 15,390.9
Transit Operations..- Bus 20,773.7 '262.6 816.9 21,853.20..- Rail 5,120.8 229.0 26.2 5,376.0
Highway/Multimodal Capital 5,083.2 4,621.2 2,695.9 ·12,400.3
Local Return 5,398,1 0.0 0.0 5,398.1
Other (Debt Service,etc.) 8,231.9 0.0 118.5 8,350.4
Total Long Range Plan 53,107.7 6,943.0 12,425.8 72,476.5
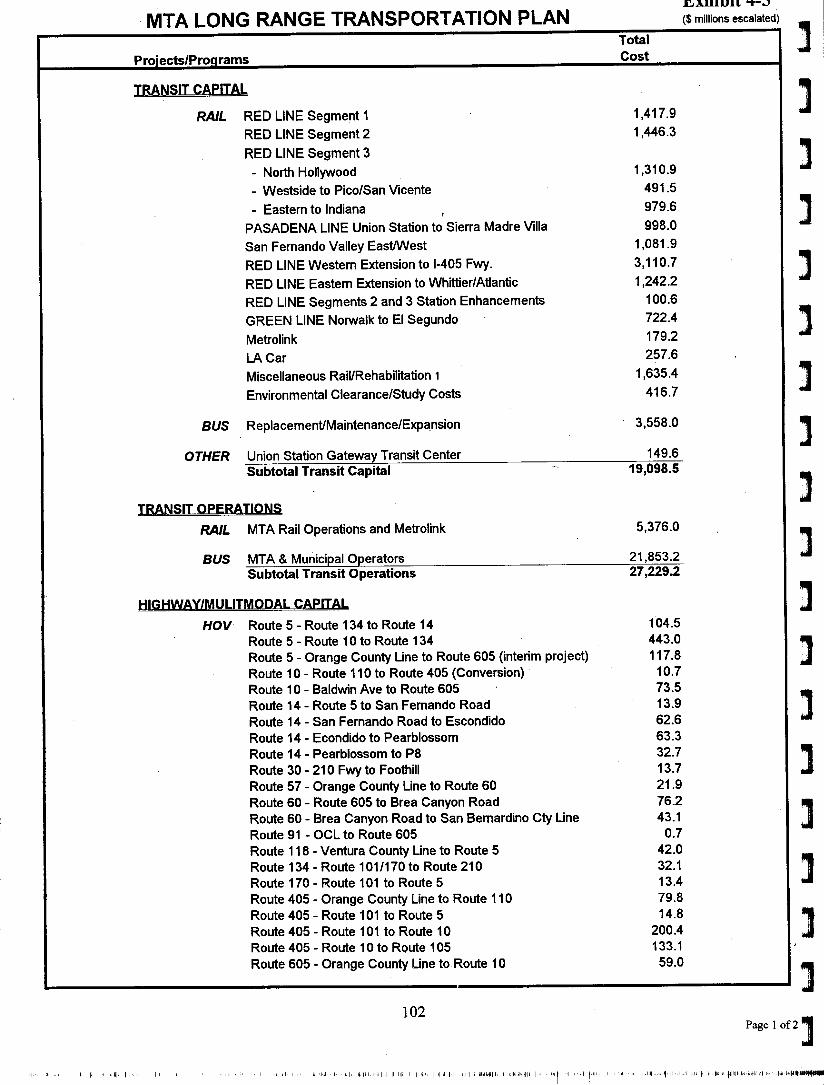
~xnlun 't-;:,($ millions escalated)
]
]'..J]
]
3]
]
]
]
~
]
]
]
]
]
1]
TRANSIT CAPITAL
RAIL RED LINE Segment 1RED LINE Segment 2RED LINE Segment 3
- North Hollywood- Westside to Pico/San Vicente- Eastern to Indiana
PASADENA LINE Union Station to Sierra Madre VillaSan Fernando Valley EastlWestRED LINE Western Extension to 1-405Fwy.RED LINE Eastern Extension to Whittier/AtlanticRED LINE Segments 2 and 3 Station EnhancementsGREEN LINE Norwalk to EI SegundoMetrolinkLA CarMiscellaneous Rail/Rehabilitation 1
Environmental Clearance/Study Costs
OTHER Union Station Gateway Transit CenterSubtotal Transit Capital
TRANSIT OPERATIONS
RAIL MTA Rail Operations and Metrolink
BUS MTA & Municipal OperatorsSubtotal Transit Operations
HIGHWAY/MULITMOOAL CAPITAL
HOV Route 5 - Route 134 to Route 14Route 5 - Route 10 to Route 134Route 5 - Orange County Line to Route 605 (interim project)Route 10 - Route 110 to Route 405 (Conversion)Route 10 - Baldwin Ave to Route 605Route 14 - Route 5 to San Fernando RoadRoute 14 - San Fernando Road to EscondidoRoute 14 - Econdido to PearblossomRoute 14 - Pearblossom to P8Route 30 - 210 Fwy to FoothillRoute 57 - Orange County Line to Route 60Route 60 - Route 605 to Brea Canyon RoadRoute 60 - Brea Canyon Road to San Bernardino Cty LineRoute 91 - OCl to Route 605Route 118 - Ventura County Line to Route 5Route 134 - Route 101/170 to Route 210Route 170 .; Route 101 to Route 5Route 405 - Orange County Line to Route 110Route 405 - Route 101 to Route 5Route 405 - Route 101 to Route 10Route 405 - Route 10 to Route 105Route 605 - Orange County Line to Route 10
TotalCost
1,417.91,446.3
1,310.9491.5979.6998.0
1,081.93,110.71,242.2
100.6722.4179.2257.6
1,635.4416.7
3,558.0
149.619,098.5
21,853.227,229.2
104.5443.0117.8
10.773.513.962.663.332.713.721.976.243.1
0.742.032.113.479.814.8
200.4133.1
59.0
Page 1 Of2]

OTHER PROJECTS& PROGRAMS
TotalCost
Route 5/14 InterchangeRoute 57/60 InterchangeRoute 1Q/605 InterchangeRoute 60/605 InterchangeRoute 5/405 InterchangeRoute 118/405 InterchangeRoute 911605 InterchangeRoute 105/605 InterchangeRoute 170/134 InterchangeRoute 5/118 Interchange
24.2123.729.790.763.154.868.261.863.988.0
Route 30 - Route 66 to San Bernardino County LineRoute 126 - Arterial WideningRoute 138 - Avenue T to 90thRoute 138 - Widen from 90th to 165thRoute 710 - ROW Preservation OnlyRoute 710 - Funding for Project Completion
342.246.530.562.45.1.
1,409.6
Alameda CorridorIncident Management (Tow Service)Park and RidelTransit Centers/DMUlOtherRegional BikewaysRegional Surface Transportation ImprovementsTransportation Demand ManagementTSM - Freeway and TOSTSM - LocalTransportation Enhancements
1,829.6653.1363.8301.4949.8584.3516.6
1,172.7301.8
Retrofit SoundwallsInter-Regional RoadsFreeway Rehabilitation (SHOPP)SAFEEnvironmental Enhancement and Mitigation
74.5230.0812.1178.520.0
Highway Staff SupportSubtotal Highway/Multimodal Capital
195.512,400.3
Reserve Fund (2nd decade of Plan)Administrative Overhead (Prop A, Prop C, TDA)Financing Payments
720.5983.6
6,646.3
72,476.5·
Notes:I Includes: Systemwide Rail Costs, Other Projects (ADA, MOW, ART, Safety, Construction Security, and Rail Rehabilitation)% These are programs that are funded from their own revenue source. •
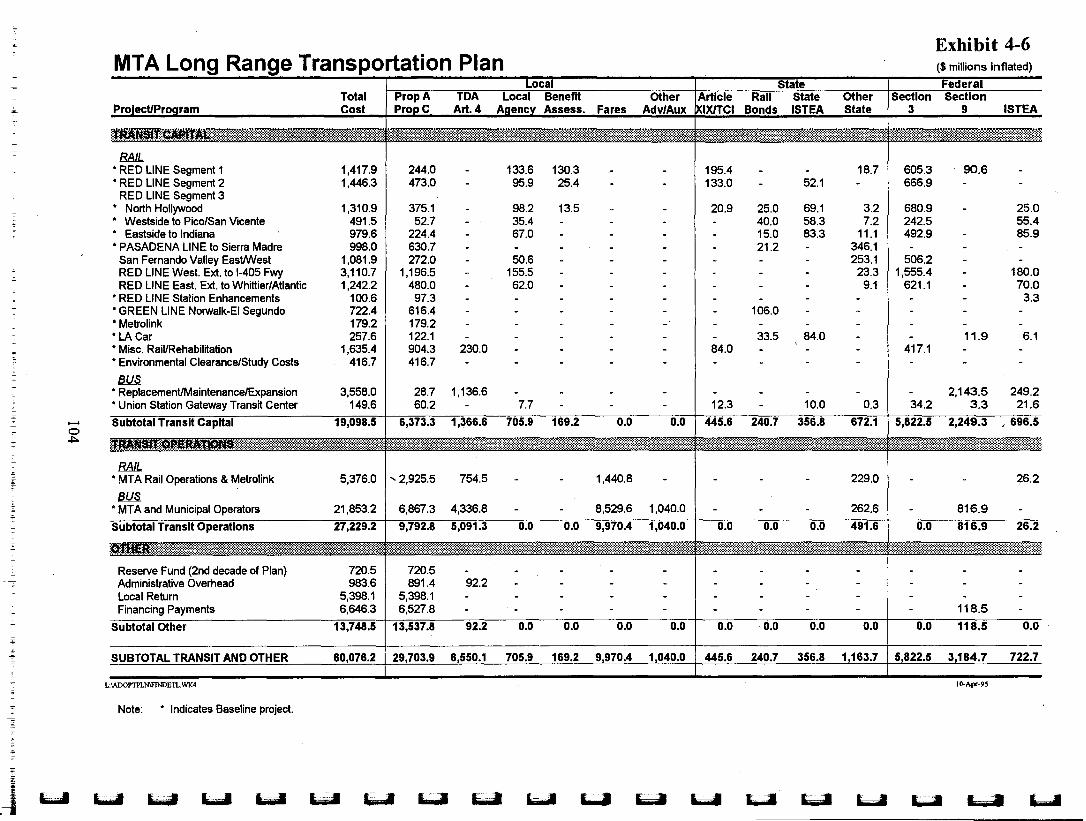
MTA Long Range Transportation PlanLocal State Federal
Total Prop A TDA Local Benefit Other Article Rail State Other Section SectionProlectlProaram Cost PrODC Art. 4 Aaencv Assess. Fares Adv/Aux XIXlTCI Bonds ISTEA State 3 9 ISTEA
:;:.:.......:........ :.i:.:::·..... :.. : '....:::~~~~~~:~~:;::~~~~~~~t;;*:;:~~:11111;~f:~;r~1?~~;;~;;;:;~:~:1:~i:?:~il1:1:11*f:l1~11:1f:l11:::1~111:j~~:::~1~~:11~~:~j:l:jljlj:ljj~~~:;:1:1:11111:1jj~::~:j:j:j:j:l:1f::j:~lj:~j:ljjljjljjl;ljjj~:j:l:11j:::jf:jl~:jjj:j:::j::jljl1jjltl1m:~j::jlf:f:l111f::::~jl1111jij:j:lij:jljjl:1:1:jj~:1:111:1:j:~1:11j:j:j:::jl1::1;ji:jj~:jj:jf:j:l~~~11j:j:i~:*j~1:1:~:111111iljjil:1jl1~1f:l111111:jijljjjl1~111:j:i:j:l111ijjl111:1jjjlil:1:111jlljil1ijl11jl1 11~jjlj~1::1iljjjjl1jijiiiil~i:jj~~1:~*f:::~:jtl1j;jl~j;j:~::~~;;~~~~~:~:~~~:~:~:~~~~~;~~~;:~
BAlL,RED LINE Segment 1 1,417.9 244.0 . 133.6 130.3 - - 195.4 . - 18.7 605.3 90.6 -,RED LINE Segment 2 1,446.3 473.0 . 95.9 25.4 - - 133.0 - 52.1 - 666.9 - -RED LINE Segment 3, North Hollywood 1,310.9 375.1 - 98.2 13.5 - - 20.9 25.0 69.1 3.2 680.9 - 25.0, Westside to Pica/San Vicente 491.5 52.7 - 35.4 - - - - 40.0 58.3 7.2 242.5 55.4, Eastside to Indiana 979.6 224.4 - 67.0 - - - - 15.0 83.3 11.1 492.9 - 85.9,PASADENA LINE to Sierra Madre 998.0 630.7 - . - - . - 21.2 - 346.1 - - -San Fernando Valley EastNVest 1,081.9 272.0 - 50.6 - - - - - - 253.1 506.2 - -RED LINE West. Ext. to 1-405Fwy 3,110.7 1,196.5 - 155.5 - - - - - - 23.3 1,555.4 - 180.0RED LINE East. Ext. to Whittier/Atlantic 1,242.2 480.0 - 62.0 - - - - - - 9.1 621.1 . 70.0,RED LINE Station Enhancements 100.6 97.3 - - - - - - - - - - - 3.3
'GREEN LINE Norwalk-EI Segundo 722.4 616.4 - - - - - - 106.0 - - - - -,Metrolink 179.2 179.2 - - - - - - - - - - - -,LA Car 257.6 122.1 - - - - - - 33.5 84.0 - . 11.9 6.1,Misc. Rail/Rehabilitation 1,635.4 904.3 230.0 - - - - 84.0 - - - 417.1 - -,Environmental Clearance/Study Costs 416.7 416.7 - - · - - - - - - - - -~,ReplacemenUMaintenancelExpansion 3,558.0 28.7 1,136.6 - - - - . - - - - 2,143.5 249.2,Union Station Gateway Transit Center 149.6 60.2 - 7.7 - - - 12.3 - 10.0 0.3 34.2 3.3 21.6
Subtotal Transit Capital 19,098.5 6,373.3 1,366.6 705.9 169.2 0.0 0.0 445.6 240.7 356.8 672.1 5,822.5 2,249.3 696.5
~mMJ!l'-.lI:~QP. '. .:~~~~~~~~~~~~;~~:~~~~11~:~~:~~:~;~~;;;;;~~~~~~;~:::~;~:;:~:~~~*~:~~~~~~~;~~;;~~;~~~~~~~1t~~:~~~~m~~::~~~~~~~:::~:~;~~~:~~~~~;;~~~;;;~~~~~~~~~~~~~~~~~~~~~~~~~mf:~~~~~:;~~~~~~;;~~;~~~~~~~~~~~~~~~~~m~~~~~~~~~~~~~~~~~~~~~~~~~~~~~~~~~~;~~~~~~~~~~1~~~~~~~~~~~~~~~~~~~~~~~;~~~~~~~~~~~~~~~~~~~~~~;~~~:~~~~~~;~~~~~~~~~~~~~~~~~~~~~~~~~~~;~;~~:~~~~~~~~~~;~;~~~~~~~~~~~~~~~~~t1~~~~;~::~~~~;~~~~~~m~~~~~~~~~~~~~~~~~~~~~f:~~;~~~~~~~:~~;~~~~~;;~~~~~~;~~~~~~;:~~~~~~:~~~~~~~~~~~~~~~~~~~~~~~1~~;~~~~~~~~~~~~~~~~~:~~~~~m~~~~~;~~~~~~~~~~~~~~~~~::~~~~~~~~~;;~m~~~~~;~~~~~~;~~;~~~;~::;~~~;~~
BAlL,MTA Rail Operations & Metrolink 5,376.0 .... 2,925.5 754.5 - - 1,440.8 - - - - 229.0 - - ~6.2
~'MTAand Municipal Operators 21,853.2 6,867.3 4,336.8 - - 8,529.6 1,040.0 - - - 262.6 - 816.9 -Subtotal Transit Operations 27,229.2 9,792.8 5,091.3 0.0 0.0 9,970.4 1,040.0 0.0 0.0 0.0 491.6 0.0 816.9 26.2
:.. .,' ..... .:~~~~~~~~f:~~:~~~~~~~~1~;~~;;~~;~~~~~~~~~~~:~;~;~~~~*~~~~~~~;~~~~~~;~~;~;~~~~~~;~~~1:~~~~~~~~~~;~;~~~~:~~~~1:11~:~~~~:~:~~f:~~:~~;::~~~~:1:;1~~~~~~~~;~~~~~~f:~~J~~~~~~~~f::;;;~~;;~~~~~m:~~~~~~~~~~~~::;~~;~~~~~~~~~~~~~~~~~~~;;~~;~~~~~1~;~~~;::~~;~~~~~~~~~~~;~~;~;~~~~~~~*~~f:~~~~~~~~~~~;~;;~~;;;~~~~~~~;~;~~~~~~~~~~~;~f:f:~;~1;~1;~1;;;;~~~~~~~~~~~~~~~~~;~~~~;;~;t;;~;;;;~~~;;~~~;~~~~~~;;~~~~~;~~~~~~~~;~:1~~~~~~~~;:;;;;~~~~~~~;~~~~~~~;~;;;~~~~~~~~~~~~~~~~~;11;;~;;;~;;~;;;~~~~~~~~~~;1~1;;~~;;;;;~~~;~~;~~~~~~;~~~~;~~~~~t;;;;;~~~~~~;~~~;;;~;;~;~~~~~~~~~~~~;~~~~~~~;~~~;~;~;~~~;~~~~~~;;;;~;;;~~;~~~~;:~;~~~~;;;~~~~~~~~~;~~;~;;;;~~~~;~~~~~~11~~;~~
Reserve Fund (2nd decade of Plan) 720.5 720.5 - - - - - - - - . - - -Administrative Overhead 983.6 891.4 92.2 - · - . - - - - - - -Local Return 5,398.1 5,398.1 - - · - - - - - . - - -Financing Payments 6,646.3 6,527.8 - . - - - . - - - - 118.5 -
Subtotal Other 13,748.5 13,537.8 92.2 0.0 0.0 0.0 0.0 0.0 0.0 0.0 0.0 0.0 118.5 0.0
SUBTOTAL TRANSIT AND OTHER 60.076.2 29.703.9 6,550.1 705.9 169.2 9,970.4 1,040.0 445.6 240.7 356.8 1 163.7 5,822.5 3,184.7 722.7
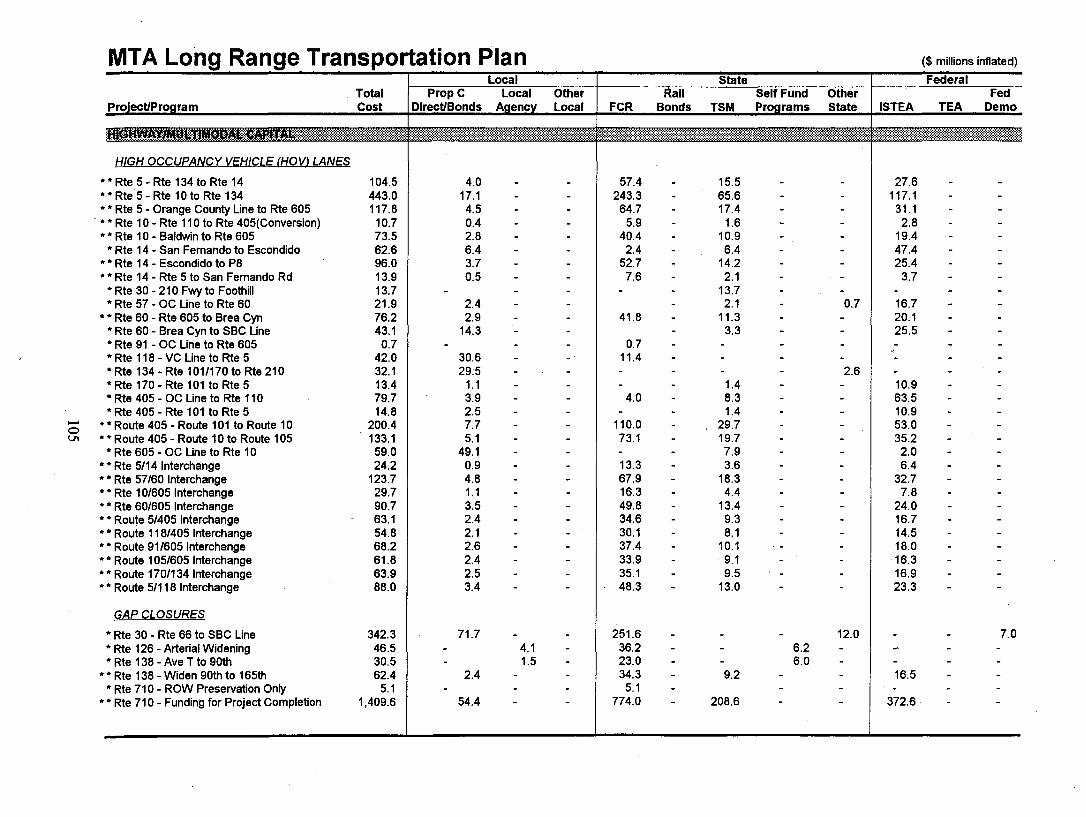
MTA Long Range Transportation PlanLocal State Federal
Total Prop C Local Other Rail Self Fund Other FedProlect/Proaram Cost DIrect/Bonds Agency Local FCR Bonds TSM Programs State ISTEA TEA Demo
:::..:............... ::.: ...... ::::: ..,',.,',:.......::t.·.:.... :0: : ;" •• :. :::~~~~~~~~~~~~~~~~;tt~::~~~~~~~~~~~~~~;;?:~~~~~~~~:~:::::;;~;~~:~:~1~t::11fs: ..~1:1111;11111~;;;;1~1111111~11~111~111;;;~~~~~~~;1;::111;~;~111111~tY:~11~11~1;;~;;;;;111111;11;;1;11111;111;;1111'~~;1;;;;1;11;::;;;~;;m;11;111~11;;11;;11;;;;;;1:1t;1~;;;;;;~;;;~;;;;;;;;;;;;;;;;;;~;;1;11;;;;;~;1;1~;;1;;~~11~~;;;;;1;;1;1~111;;;;;f::~;;:;:1~r:1;;~1~1~;;;;;;;;;;;;;1~11;;;;;;;;;1;11;;1;;;;1;;;;1;;11;;;;;;11;;;;;;;;;;111;;;;;~;;;1;;;~;;;;~;;;;;;m;;;;;;1;;;;;;;;;1~;;;;~1;;1;;;;;;;;;;;;~
H/GH OCCUPANCY VEH/CLE (HOVI LANES
* Rte 5 - Rte 134 to Rte 14 104.5 4.0 - - 57.4 - 15.5 - - 27.6 - -* Rte 5 - Rte 10 to Rte 134 443.0 17.1 - - 243.3 - 65.6 - - 117.1 - -* Rte 5 - Orange County Line to Rte 605 117.8 4.5 - - 64.7 - 17.4 - - 31.1 - -* Rte 10 - Rte 110 to Rte 405(Conversion) 10.7 0.4 - - 5.9 - 1.6 . - 2.8 - -* Rte 10 - Baldwin to Rte 605 73.5 2.8 - - 40.4 - 10.9 - - 19.4 - -* Rte 14 - San Fernando to Escondido 62.6 6.4 - - 2.4 - 6.4 - - 47.4 - -* Rte 14 - Escondido to P8 96.0 3.7 - - 52.7 - 14.2 - - 25.4 - -* Rte 14 - Rte 5 to San Fernando Rd 13.9 0.5 - - 7.6 - 2.1 - - 3.7 - -* Rte 30 - 210 Fwy to Foothill 13.7 - - - - - 13.7 - - - - -* Rte 57 - OC Line to Rte 60 21.9 2.4 - - - 2.1 - 0.7 16.7 - -* Rte 60 - Rte 605 to Brea Cyn 76.2 2.9 - - 41.8 - 11.3 - - 20.1 - -* Rte 60 - Brea Cyn to SBC Line 43.1 14.3 - - - 3.3 - - 25.5 - -* Rte 91 - OC Line to Rte 605 0.7 - - - 0.7 - - - - - - -* Rte 118 - VC Line to Rte 5 42.0 30.6 11.4
,,~'- - - - - - - - -* Rte 134 - Rte 1011170 to Rte 210 32.1 29.5 - - - - - - 2.6 - - -* Rte 170 - Rte 101 to Rte 5 13.4 1.1 - - - - 1.4 - - 10.9 - -* Rte 405 - OC Line to Rte 110 79.7 3.9 - - 4.0 - 8.3 - - 63.5 - -* Rte 405 - Rte101 to Rte 5 14.8 2.5 - - - - 1.4 - - 10.9 - -* Route 405 - Route 101 to Route 10 200.4 7.7 - - 110.0 - 29.7 - - 53.0 - -* Route 405 - Route 10 to Route 105 133.1 5.1 - - 73.1 - 19.7 - - 35.2 - -* Rte 605 - OC Line to Rte 10 59.0 49.1 - - - - 7.9 - - 2.0 - -* Rte 5/14 Interchange 24.2 0.9 - - 13.3 - 3.6 - - 6.4 - -* Rte 57/60 Interchange 123.7 4.8 - - 67.9 - 18.3 - - 32.7 - -* Rte 10/605 Interchange 29.7 1.1 - - 16.3 - 4.4 - - 7.8 - -* Rte 60/605 Interchange 90.7 3.5 - - 49.8 - 13.4 - - 24.0 - -* Route 5/405 Interchange 63.1 2.4 - - 34.6 - 9.3 - - 16.7 - -* Route 118/405 Interchange 54.8 2.1 - - 30.1 - 8.1 - - 14.5 - -* Route 91/605 Interchange 68.2 2.6 - - 37.4 - 10.1 - - 18.0 - -* Route 105/605 Interchange 61.8 2.4 - - 33.9 - 9.1 - - 16.3 - -* Route 1701134 Interchange 63.9 2.5 - - 35.1 - 9.5 - - 16.9 - -* Route 51118 Interchange 88.0 3.4 - - 48.3 - 13.0 - - 23.3 - -
GAP CLOSURES
* Rte 30 - Rte 66 to SBC Line 342.3 71.7 - - 251.6 - - - 12.0 - - 7.0* Rte 126 - Arterial Widening 46.5 - 4.1 - 36.2 - - 6.2 - -' - -* Rte 138 - Ave T to 90th 30.5 - 1.5 - 23.0 - - 6.0 - - - -* Rte 138 - Widen 90th to 165th 62.4 2.4 - - 34.3 - 9.2 - - 16.5 - -* Rte 710 - ROW Preservation Only 5.1 - - - 5.1 - - - - - -* Rte 710 - Funding for Project Completion 1,409.6 54.4 - - 774.0 - 208.6 - - 372.6 - -
- *oV1 *

MTA Long Range Transportation PlanLocal State Federal
Total Prop C Local Other Rail Self Fund Other FedProject/Program Cost Direct/Bonds Agency Local FCR Bonds TSM Proarams State ISTEA TEA Demo
OTHER PROJECTS & PROGRAMS
• Alameda Corridor ••• 1,829.6 70.7 1,045.0 - - 80.0 - - - 287.9 - 346.0• Park and RidefTransit CenterslDMU/Other 363.8 354.9 - - - - - - 8.9 - - -• Regional Bikeways 301.4 118.8 47.2 131.3 - - - - - 2.6 1.5 -• Regional Surface Trans. Improvements 949.8 502.0 280.6 - 122.8 - - - 0.5 37.5 - 6.4• Transportation Demand Management 584.3 29.6 112.6 5.0 - - - - - 437.1 - -• Freeway TSM and TOS 516.6 64.6 - - 242.4 - 68.5 - - 141.1 - -• Local TSM 1,172.7 875.2 248.4 - - - - - - 35.4 - 13.7
Transportation Enhancements 301.8 - - - - - - - - - 301.8 -• Incident Management (Tow Service) 653.1 644.4 - 8.7 - - - - - - - -
- - - - - - - -FUNDING PROGRAMS - - - - - - - -Retrofit Soundwalls 74.5 - - - - - - 74.5 - - - -Inter-Regional Roads 230.0 - - - - - - 230.0 - - - -Freeway Rehab. (SHOPP) 812.1 - - - - - - 812.1 - - - -SAFE 178.5 - - - - - - 178.5 - - - -Environmental Enhance. & Mitigation 20.0 - - - - - - 20.0 - - - -
OTHER COSTS
Highway Staff Support 195.5 195.5 - - - - - - - - - -Subtotal Hwy/Multlmodal Capital 12,400.3 3,198.8 1,739.4 145.0 2,571.6 80.0 617.6 1,327.3 24.7 2,019.5 303.3 373.1
TOTAL LONG RANGE PLAN 72,476.5
L:\ADOPTPLN\FINDETL.WK4 to-Apr-95
Notes: ~•• Indicates Baseline project
• • The Funding Plan shown is for Long Range Planning Purposes Only; Actual funding plans will be developed for each project and program through the annualTransportation Improvement Program (TIP) process based on revenue source availability, project requirements, fund source restrictions, andproject schedules.
• • • MTA Funds programmed for the Alameda Corridor project in future Call for Projects I TIPs will be federal formula funds, not local sales tax revenues (Proposition C).
One of the most significant changes brought about by the Federal Intermodal SurfaceTransportation Efficiency Act (ISTEA) is the requirement that long-range transportation plans befinancially constrained. Specifically, the law states that the 20-year regional plan will "include afinancial plan that demonstrates how the long-range plan will be implemented, indicates resourcesfrom public and private sources that are reasonably expected to be made available to carry out theplan, and recommends any innovative financing techniques such as value capture, tolls, andcongestion pricing." With this clauseJ ISTEA transformed the regional transportation plan froman illustrative list of projects and programs into a decision-making document.
The financial assumptions included in the Long Range Plan address the requirements of the 1991Federal ISTEA legislation. A fiscally constrained plan of projects and programs ensuresconsistency with MT A objectives by providing guidance for short and long term decisions relatingto multiyear funding commitments, budget decisions, and the TIP/Call for Projects process. Itprovides a benchmark against which the MTA can monitor and measure progress in meeting itsobjectives. In addition, it ensures that the MTA can demonstrate its financial capacity to outsideagenCIes.
The Long Range Plan includes revenue estimates based on current economic conditions andexisting revenue bases, and projects these estimates forward for 20 years. The Plan is structuredto be financially constrained throughout the twenty-year period. The Long Range Plan calls for a$72.4 billion investment in transportation in Los Angeles County over twenty years. As shown inExhibit 4-3, this investment includes both capital and operating expenses for all modes.
This investment envisioned in the Long Range Plan will require full participation by the threefunding partners: the federal, state, and the local sectors. Especially noteworthy is the localfunding share, which constitutes 73% of the overall transportation program resources,representing a significant commitment of local sales tax and private dollars to transportation inLos Angeles County (Exhibit 4-2).
In developing the Plan, emphasis was given to maximizing state and federal funding to the Countywhile meeting all conditions tied to these funding sources. For example, local matchingrequirements and the eligibility of modes for a particular funding source are considered inoptimizing funding in the Plan. Certain funding sources are relatively flexible, i.e. they can beused for different modes and for operating and capital expenses, while others have very specificrequirements on how they are to be used. A matrix showing the funding sources for each projectand program is provided in Exhibit 4-6. A matrix showing the eligibility of types of projects andprograms for key funding sources is provided in Exhibit 4-7.
Successful completion of the programs and projects in the Long Range Plan will require theMT A, its funding partners, and transit operating agencies to continue their aggressive pursuit oftransportation funding for Los Angeles County.
• Summary of Key Financial Assumptions
• Major Revenue Source Assumptions
• Highway Program Assumptions
• Multimodal Program Assumptions
• Other Funding Programs Assumptions
• Bus Program Assumptions
• Rail Program Assumptions
• New Revenue Assumptions
The Long Range Plan relies on numerous assumptions which reflect the best available estimate offuture trends in revenues and costs over the next twenty years. Existing MT A policies guide thedevelopment of the assumptions. However, there are many areas requiring future policydecisions. In developing the Long Range Plan, it was assumed that certain future policy decisionswill be made, consistent with the needs of the Plan. As specific policy and project decisions aremade by the MT A Board, they can be analyzed and the Plan can be adjusted accordingly.
In the Long Range Plan, no new revenue sources are assumed to be available over and abovethose local, state, and federal revenue sources that are currently available. The Plan does,however, assume that the MTA will maintain the level of funding provided by its current revenuesources and that this level of funding will increase with inflation. In particular, the Plan assumesthat the 50% federal contribution to Red Line Segments 2 and 3, as specified in the Full FundingGrant Agreement, will be maintained. Additionally, the Plan assumes that the 50% federalcontribution will be available to fund the San Fernando Valley Line and the Eastern and Westernextensions of the Red Line.
In order to !;ontinue to' receive federal funds for future rail lines, the MT A will most likely berequired to maintain a reserve fund. The Plan sets aside revenues for a reserve/contingency fund inthe second decade of the Plan, during the anticipated construction period for the future rail lines.
It is important to note that the delivery of all projects and programs in the Long Range Plan isdependent on the availability of local, state, and federal revenues at the levels projected. Majorchanges in state or federal policy, or anticipated shifts in the economy, would impact theimplementation of the Long Range Plan as presently constituted.
The Plan, and the assumptions upon which it was developed, do not replace MT A Board actionor policies. The Plan will be updated periodically to reflect separate, specific MTA actions. Toclearly identify assumptions requiring future policy decisions by the MT A, the notation POLICYDECISION appears after each assumption where these decisions would be required.
Detailed financial assumptions included in the Long Range Pian are discussed later in this chapter.The following are some of the major financial assumptions incorporated in the Long RangePlan along with a discussion of possible outcomes if these assumptions aren't realized:
• September 1994 UCLA Forecast - The Long Term Forecast for Los Angeles County,prepared by the UCLA Business Forecasting Project, was used to project sales taxrevenues totalling $33 billion in the plan period. These revenues constitute over 45% ofthe total funding in the Plan and are used in part to fund debt service on bonds for rail andhighway construction projects. If sales tax revenues are lower than projected, planned
projects would be delayed until bonds could be issued, unless comparable new revenues ]were identified or cost savings measures were implemented.
MT A Operating Deficit is Resolved - The Plan assumes that the MTA operating deficitin the near teflll and beyond is resolved through a 'combination of cost savings measuresand revenue enhancements. MTA transit operating revenue and cost projections in theLong Range Plan are based on the adopted FY 1994-95 MTA Budget. Since adoption ofthe budget, revised revenue projections indicate lower fare revenues than were anticipated.Over the next several months, the MTA will be developing a balanced budget for FY1995-96 that will use updated revenue forecasts and may require changes in the way thatthe MTA delivers and funds its current programs. As the Budget is developed, impacts onthe Long Range Plan will be analyzed and incorporated.
No New Revenue Sources - No new revenue sources are assumed to be available overand above those local, state, and federal revenue sources that are currently available. ThePlan assumes that the MTA will maintain the level of funding provided by its currentrevenue sources and that this level of funding will increase with the planned rate ofinflation. If current levels of funding are not maintained, projects and programs would bereduced or delayed accordingly unless comparable cost savings measures wereimplemented.
Current federal funding programs, except Section 9 operating assistance, continueand allocations increase with inflation - The Plan assumes the reauthorization of thefederal ISTEA legislation each .fiveyear period beginning in Fiscal Year 1997-98. Theplan also assumes that future allocations of federal formula funds (through ISTEA) willkeep pace with inflation, with the exception of Section 9 operating assistance, discussed inthe next section. If federal funds do not occur at the planned levels, planned highway, rail,and Call for Projects capital projects would be delayed accordingly unless comparableproject cost savings measures were implemented.
Federal Transit Administration (FTA) Section 9 operating assistance continues atcurrent year levels ($40.6 million) throughout the Plan period - If federal operatingsubsidies are reduced or eliminated, either transit .operations costs would also need to bereduced or other flexible funds would need to be used to cover the shortfall. If the federaloperating subsidy was eliminated, and if the resultant shortfall was made up entirely withflexible funds currently projected to be used to support future bond issues for the railconstruction program, bonding capacity, and hence, capital outlay, for that program wouldbe reduced by up to $500 million. This would cause up to a three year delay for currentand plannedrail projects along with higher construction costs for each project.
Los Angeles County continues to receive discretionary FTA Section 3 New StartFunds for future rail construction projects - The Plan assumes that each of the threerail lines planned in the second decade of the Plan will receive 50% funding from FTA
Section 3 discretionary funds. If this federal contribution were lower than 50%, projectconstruction would begin .on these projects later than currently planned. The level offederal funding for each future rail project would be agreed to with the federal governmentprior to beginning construction on a project. This would be through the form of a FullFunding Grant Agreement with the FTA. If the Federal contribution to the rail program,either on an annual or a total basis, is lower than anticipated, the timing and delivery ofthe rail program will be impacted
• First 2 years of METRO Green Line Operations costs will be funded with federalISTEA funds - The Plan assumes that the FTA will allow the MT A to use its federalformula funds for Green Line operations costs for the first two years of operations (FiscalYear 1995 - 96 and Fiscal Year 1996 - 97). This is consistent with federal guidelineswhich allow Congestion Mitigation and Air Quality Improvement Program (CMAQ) fundsto be used for the first two years of operation of a new transit service. A grantapplication has been filed with the FTA for this purpose. If the request to use CMAQfunds for Green Line operations is denied, other operating costs would need to ,be reducedor flexible funds currently used for rail construction would need to be used to fund GreenLine Operations. This could cause a one year delay in some currently scheduled railconstruction projects. I
• MTA transit fare revenues and operating costs increase with inflation - Thisassumption essentially means that a balanced MT A operations budget is assumed in thedevelopment of the Long Range Plan consistent with the assumption on the resolution ofthe MT A operating deficit discussed above. For bus operations, the basis for the costprojections is the adopted FY 1994-95 MT A budget. The Plan assumes a bus fareboxrecovery ratio and operating costs consistent with the current budget, adjusted forinflation.
Fare revenues can increase in two ways: revisions to the basic fare structure or increasedridership. To the extent that fare revenues, or any 'other revenues, increase at a rate lowerthan inflation, this can be mitigated by controlling costs so that costs also increase at a ratelower than inflation.
Over the next several months, the MT A will be developing a balanced budget for FY1995-96. This may require structural changes in the way that the MTA delivers and fundsits current programs. As the budget is developed, impacts on the Long Range Plan will beanalyzed and the Plan will be updated accordingly. [Policy Decision]
• Agreement is finalized on the City of Los Angeles' contribution to Red LineSegment 3 construction and approval of Benefit Assessment Districts for Red LineSegments 2 and 3 - MT A staff is working with the city staff to resolve this issue andreach agreement on the city's contribution to Red Line segment 3 construction. If thecity's contribution to the project does not materialize, this could cause up to a 2-3 year
delay in the construction of current and future rail projects along with associated costincreases due to the delay.
Contingency/Reserve fund established in second decade of the Plan - The Planincludes a contingency, or reserve, fund in the second decade of the Plan (starting in FY2004-05) totaling $720 million. This represents about 1% of the total value of the LongRange Plan. This fund could be used to mitigate unanticipated revenue reductions or cost.•,. _,_. . _ .1.. _mcreases sucn as:
Reductions in planned sales tax revenue receiptsFederal funding contribution to future rail lines at less than the planned level of50%Increases in planned rail construction costsReductions in planned fare revenuesUnanticipated costs or mandates
Additionally, this reserve could be used to satisfy federal program reserve requirementsthat would most likely be imposed by the federal government as a condition for receivingFTA Section 3 New Start funds for the San Fernando Valley East/West Line and thefuture Western and Eastern extensions to the Red Line. This would be consistent withrequirements in the current Full Funding Grant Agreement with' the FT A on Red LineSegments 2 and 3. [Policy Decision]
Leveraging State and Federal Funds - The Plan assumes that local funds are used tomatch state and federal funds consistent with the project and program prioritiesestablished in the Long range Plan. By leveraging these funds, more projects can beconstructed and operated over the next twenty years.
Use of Long-Term Debt - The Plan assumes that senior lien bonds will be issued in eachyear they are needed to meet capital requirements for major capital projects, constrainedby MT A debt service coverage ratio limitations. Debt service on the bonds is assumed tobe paid with Proposition A and Proposition C revenues. Given all other assumptions usedin the plan, debt financing is necessary for the completion of construction projects on theschedules assumed in the Plan. Actual bond issuances must be approved by separateaction of the MT A Board. [Policy Decision]
Establishing service levels for all programs - A balance of the transportation servicesamong all modes was sought in the Plan. Assumed service levels were determined usingexisting studies and plans for the various programs and projects. Additionally,transportation modeling and planning activities were performed on many of the projectsand programs. Decisions on specific increases in service levels and new services will bemade by the MT A Board as the programs are developed through the planning processes.[Policy Decision]
• STIP Shortfall - State shortfalls in transportation funding have resulted in a fundingshortfall in the California State Transportation Improvement Program (STIP) ofapproximately $4.0 - $5.0 billion. In light of this, the California Transportation
~Commission (CTC) has made funqing seismic retrofit and other essential safety andrehabilitation projects their top priority and delayed all other projects. However, MT Ahigh priority projects that assumed state funding Will be allowed to be advance-fundedlocally under state advanced construction provisions, where local funds can be used as up-front cash flow until state funds can be advanced or reimbursed at a future time. [PolicyDecision]
Operating and Capital Inflation - A 3.99% average annual inflation rate, based upon theSeptember, 1994 UCLA sales tax forecast for Los Angeles County, is applied to projectedrevenues and operating costs. The Plan assumes that the rate averages 4.08% over the firstdecade and 3.89% during the second decade. A 20-year annual average inflation rate of3.28% isapplied to projected transit capital cost items. The rate varies by decade as follows: first decadeis 3.36% and second decade is 3.20%. The rate is based on the relationship of the ConstructionCost Index (eCI) to the Consumer Price Index (CPI) which found that the CCI wasapproximately 82% of the CPl. The highway capital inflation rate, estimated by Caltrans, remainsconstant at 3.5% over the 20-year period.
Proposition A - These revenues are generated by a 1/2 cent sales tax for countywidetransportation programs passed by Los Angeles County voters in 1980. Pursuant to theProposition A Ordinance, these funds are used to improve public transit throughout Los AngelesCounty. A portion of the revenues are returned to local jurisdictions, based on population, foruse in public transit projects. Revenues are divided as follows:
Local Return program -Rail development -Discretionary -
25%35%40%
The estimated annual amount of Proposition A revenues over the 20 year period is based on theSeptember, 1994 UCLA Sales Tax Forecast for Los Angeles County. The plan assumes that allof the Proposition A 40% discretionary funds are used for bus operations. Proposition A localreturn revenues projected to be expended on bus operations are based on continuation of trendsidentified in the Short Range Transit Plans.
Proposition C - These revenues are generated by a 1/2 cent sales tax for countywidetransportation programs passed by Los Angeles County voters in 1990. The Proposition Cordinance specifies that funds are to be used for "public transit purposes." Revenues are dividedas follows:
Rail and bus security -Commuter rail/transit centers/park and ride -Transit related streets/state highways improvements -Local return -Discretionary-
5%10%25%20%40%
The estimated annual amount of Proposition C revenues over the 20 year period is based on theSeptember, 1994 UCLA Sales Tax Forecast for Los Angeles County. The plan assumes that the40% discretionary funds are split among rail capital and operations, bus capital and operations andbus service expansion. The relative share of the allocations between bus and rail capital andoperating requirements shifts over time to meet evolving system needs as projects are built andoperations begin. Although most of the 25% highway funds are programmed for highway relatedproject's such as high occupancy vehicle (HOV) lanes, these funds are also eligible to be used forportions of rail transit projects which have freeway alignments, such as the Pasadena Blue Line.Specific Board action through the Call for Projects and TIl? programming process must to betaken to program Proposition C funds to specific projects and programs. [Policy Decision]
Senior Lien Bonds are bonds which have a senior claim on an MTA pledged revenue source thatis superior to the claim of any other bonds or debt. The plan assumes that senior lien bonds willbe issued throughout the Plan as needed to support rail and highway capital requirements. Bondsare projected to be issued in each year they are needed to meet capital requirements. The :planassumes bond payments based on a 7% interest rate and 30 year term. These model generatedbond issuances do not substitute for specific Board action required to issue bonds. [PolicyDecision]
New COPs pledged by Federal Section 9 capital formula funds and TDA Article 4 funds are notassumed to be issued throughout the Plan for bus purchases. Debt service for COPs that wereissued in prior periods is included.
TDA Article 4 - Revenues are derived from one-quarter cent retail sales tax collected statewide.TDA Article 4 funds are available for both bus capital and operations. MT A staff estimates totalfund availability based on sales tax projections. Specifically, the amount of TDA Article 4 fundsare calculated as 51.86% of Proposition A, multiplied by 92-.2%. The majority of Article 4 fundsare allocated to bus operations based on historical data and projected needs and uses.
City of Los Ana:eles Funds - These funds represent the City's contributions to Metro Rail andUnion Station Gateway. The City's assumed contribution is an average of7% of the current totalcosts for Red Line Segments 1, 2 and 3 and a 5% contribution on the Red Line - San FernandoValley Extension, Westside Extension, and Eastside. Also, it is assumed that the City willcontribute local return funds to match federal and state revenues for the Union Station GatewayTransit Center project (approximately 5% or $7.7 million of the current project budget per theGateway funding plan). Negotiations are currently underway with the City that may affect thelevel of contributions to be made by the City of Los Angeles. [Policy Decision]

Benefit Assessments - The financial plan for the construction of the Metro Rail Red Lineincludes costs for station construction to be partially paid for by assessments levied on theproperties adjacent to stations, which will reap the financial benefits of close proximity to a majort-ransit system station. A benefit assessment district has been in place for Red Line Segment 1since 1985, producing revenues of $162 million'. An amount of $75 million was originallyprogrammed for Red Line Segments 2 and 3 (MTA Board action, September 28, 1993). Recentnegotiations with potential assessment district property owners lead staff to conclude that twodistricts may elect out of district formation. The Plan assumes that approximately 52% ($39.1million) of the anticipated benefit assessment revenues originally programmed for Red LineSegments 2 and 3 will be lost due to this anticipated action.
Bus farebox revenue is calculated by multiplying the farebox recovery ratio by the annualoperations and maintenance cost (O&M) cost.
,MTA: MTA's assumed bus fare revenue of is based on the farebox recovery ratio in the FiscalYear 1994 - 95 Budget, which is approximately 44%, and projected out at the rate of inflation.Over the next several months, the MT A will be developing a balanced budget for Fiscal year 1995- 96. This may tequire structural changes in the way that the MTA delivers and funds its currentprograms. Any structural changes impacting the Plan will be incorporated.
Municipal Transit Operators: For Fiscal Year 1994-1995 through Fiscal Year 1997-1998, busfare revenues for the municipal transit operators' are based on information in their Short RangeTransit Plans. The farebox recovery ratio for this time period is approximately 28%, not includinglocal return funds. For Fiscal Year 1998-1999 and beyond, bus fare revenues were escalated withinflation. This method of projecting fare revenues assumes that these revenues increase inproportion to O&M costs.
Rail farebox revenue is calculated by multiplying the estimated fare per boarding by the projectedannual ridership. Fares and ridership figures for the current system are based on existing figureswhich have been projected out, while fare and ridership information for future lines and extensionsis based on informatio.n from the Long Range Plan travel demand model. The farebox recoveryratio increases to approximately 34% as the rail system expands to the system envisioned in theLong Range Plan. The MTA is currently updating its rail operations and maintenance (O&M)cost model to reflect the MT A's current operating cost structure and industry standards. TheLong Range Plan will be updated once this new data is available.
Flexible Congestion Relief - The Flexible Congestion Relief (FCR) Program is a statewidecapital program for highway and fixed guideway capacity improvements. Funding for thisprogram is composed of state and federal gas tax revenues. FCR funds are targeted in theAdopted Long Range Plan for gap closures, major arterial improvements, and high occupancyvehicle lanes. Revenues anticipated through Fiscal Year 1998 - 1999 are those programmed inthe 1992 Revised State Transportation Improvement Program (STIP). Due to funding shortfallsat the State level, no funds are assumed to be available for new projects for Fiscal Years 1999 -2000 through 2002 - 2003. FCR revenues are assumed to remain at a constant level beginning inFiscal Year 2003 - 2004. This annual revenue estimate is based on historical data on countyminimums as well as discussions with California Transportation Commission (CTC) staff TheMT A must take separate action on the programming of FCR funds to specific projects throughthe Call for Projects and TIP programming process. [Policy Decision]
State Rail Bonds - Propositions 108 and 116 were passed by California voters in 1990.Proposition 108 authorized the state to sell $1 billion in general obligation bonds to provide fundsfor rail capital outlay .. It also authorized two additional state rail bonds measures of $1 billioneach. The 1992 and 1994 bond measure did not pass. Through the 1992 STIP, and the StateAllocation Plan, the state will use·other funds for the bond funds. This will cause a delay in statefunds for many projects. These anticipated delays have been incorporated in the Long RangePlan. Projects receiving Proposition 108 funds must be completed no later than June 30, 2001.Proposition 116 authorizes the state to sell $1.99 billion in general obligation bonds to providefunds for rail capital outlay as well as bikeway facilities. The state rail bond amounts assumed tobe available for Los Angeles County are projected by MT A staff, based on past CTCappropriations and discussions with CTC staff State rail bonds are projected to fund Metro Rail,commuter rail, the LA Car, bikeways projects and the Alameda Corridor.
ISTEA (STP, CMAQ) - As part of the Intermodal Surface Transportation Efficiency Act(ISTEA) of 1991, the Federal government created new flexible funding programs, the SurfaceTransportation Program (STP) and the Congestion Mitigation and Air Quality ImprovementProgram (CMAQ). STP funds are intended to be used for congestion relief in urban areas.Eligible uses include transit capital projects, Transportation Demand Management (TDM), andimprovements to highways and arterial roads. The CMAQ program is designed to fund projectsthat contribute to the attainment of national ambient air quality standards. CMAQ funds cannotbe used to construct facilities that provide additional capacity for single-occupancy vehicles.Revenues anticipated during the 20-year period are based on historical allocations through FiscalYear 1994 - 1995. The Plan assumes the federal reauthorization of the Transportation Act.Beginning in Fiscal Year 1997 - 1998 and at the end of each five-year federal reauthorizationperiod, the plan assumes that the total amount available will be escalated by CPI and held constant
for the 5-year period. Board action will be required through the Call for Projects and TIPprogramming process to program ISTEA funds to specific projects./Policy Decision}
Section 3 New Rail Starts - These funds, which are to be used for rail transit capitalimprovements, come from mass transit funds, generated by one cent of the nine cent federal gastax. Section 3 New Starts are earmarked by Congress to specific projects - in the case of LosAngeles County, to Metro Rail. Full Funding Grant Agreements for Red Line Segments 1, 2 and3 are negotiated by MTA with the Federal Transit Administration. Section 3 New Starts fundsare a discretionary source of federal funds that is reauthorized every five years. The total fundinglevel is assumed to escalate at the CPI rate beginning in Fiscal Year 1997 - 1998 (aftercommitments for Red Line are completed) and every five year reauthorization period thereafter.
Section 3 Rail Modernization Section 3 Rail Modernization funds are used in the Plan for railrehabilitation and other minor rail capital expenses. The funding level is assumed to escalate atthe CPI rate beginning in Fiscal Year 1997 - 1998 and every five year r~authorization periodthereafter. An incremental increase in funding is projected as rail projects are completed and railmileage in Los Angeles County increases.
Section 9 Capital - The current funding level is assumed to remain constant though Fiscal Year1996 - 1997. Beginning in Fiscal Year i997 - 1998, and at the end of each five-year federalreauthorization period, the Plan assumes that the total amount available will be escalated by CPIand held constant for the five year period. The Plan assumes that these funds will be allocated toall eligible bus operators for identified capital requirements. [Policy Decision]
Section 9 Operating - Section 9 allocations for transit operations are assumed to remain constantat Fiscal Year 1995 levels throughout the 20-year period. This federal revenue source was notescalated as were others because some federal officials are proposing to reduce and, possibly,eliminate operating assistance subsidies in the coming years. If this funding source is actuallyeliminated in future adopted Federal budgets, transit operations in Los Angeles County could beseverely impacted.
The Highway component of the Long Range Plan focuses on mobility and air quality and fundsprojects such as HOV lanes, Traffic Systems Management efforts and other highway programs.
Project construction costs were provided by Caltrans and are inflated at 3% for Fiscal Year 1994- 1995 and increased to 3.5% thereafter. Right-of-Way inflation rates, initially 6% for Fiscal Year1993 - 1994, follows the CPI rate.
Freeway Incident ManaKement The Freeway Incident Management program, funded primarilythrough Proposition C (25%) and HOV violation funds, will continue to be funded at currentlevels. The CPI rate for transit operations described in the major revenue assumptions section wasused to escalate the costs for the program over the 20-year period.
Freeway Traffic Syste!"sManagement (TSM) & Traffic Operations System (TOS) ThePlan assumes that operating costs for freeway TSM measures will be covered through theCaltrans operating budget. Beginning in FY 1997 -1998, $300 million is included in the Plan tocomplete the TOS system.
Funding sources for Freeway TSM and TOS consist of the following sources: Prop C (25%),ISTEA (TSM match), and ISTEA (STP).
High Occupancy Vehicle (HOV> Carpool Lanes HOV project costs are based upon estimatesprovided by Caltrans, District 7. A total of approximately $380 million in Baseline projects wereprogrammed through the competitive FY 1993-94 Multi-year Call for Projects. The Plan willprovide approximately $1.9 .billion .over the 20-year period to complete the HOV program,including connectors, beyond baseline commitments.
Funding sources for HOV lanes consist of the following: Prop C 25%, StatelLocal Partnerships,State TSM (discretionary), TSM (ISTEA match), ISTEA (CMAQ), ISTEA (STP), and FlexibleCongestion Relief funds.
Gap Closures & Arterial WideninKs The costs for gap closures and arterial widenings arebased upon estimates provided by Caltrans, District 7.
Funding sources for gap closures consist of the following: Prop C, Local Agency/Other (private)Funds, StatelLocal Partnership, Flexible Congestion Relief, Inter-regional funds, and Federal -Highway Demonstration funds.
MULTI MODAL PROGRAM ASSUMPTIONS(CALL FOR PROJECTS CATEGORIES)
Local Transportation Systems Management (TSM) Local TSM projects receive fundingunder the TSM category of the Call for Projects and are eligible for project support funding aswell as capital outlay funding from the State Highway Account. Local TSM project fundinglevels are determined through the Multi-Year Call for Projects.
Funding sources for Local TSM consist of the following: Prop C (25%), Local Agency Funds,and Federal ISTEA funds.
Transportation Demand Management (TDMlRidesharing) The funding level is focused onleveraging local and private sector efforts. Lower funding levels will be set in the beginning yearsas the program is evaluated for its effectiveness. Moderate funding levels begin in FY 2000 -2001, concurrent with the opening of additional rail and HOV facilities. Sources of funding forTDM consist of the following: Combined Road Plan Cash/Prop A, Federal ISTEA funds, StateTSM, and Prop C (25%).
Regional Bikeways Funding sources for Regional Bikeways consist of the following: Prop C(25%), Prop 116, Federal ISTEA funds, and TDA Article 3 funds.
Regional Surface Transportation Improvements (RSTI) Funding for the AlamedaConsolidated Transportation Corridor and other improvement projects are included in thiscategory. Funding sources for RSTI projects are Proposition C 25%, Local Agency Funds,Proposition 116, Federal Highway Demonstration Funds, and Federal ISTEA funds.
Alameda Consolidated Transportation Corridor The preliminary engineering and right-of-way acquisition are partially funded. $8.6 million has been programmed through the Call forProjects through FY 1994 - 1995. The Plan includes MTA's contribution to the project asfollows:
Prop C 25%ISTEA (STP)ISTEA (CMAQ)Total
$70.7$38.7
$249.2$358.6
Additional agreements with the Alameda Corridor Transportation Authority need to benegotiated prior to the allocation of funds to this project.
Park and Ride Facilitiesffransit Centers Funding for Park and Ride Facilities and TransitCenters consist of the following: Prop C (10% & 25%), and TP&D TCI. Beginning in FY 1998- 99, funding for this category is allocated from Prop C 10%.

Transportation Enhancements Funding for specific transportation enhancement projects willbe programmed through the Call for Projects process. The Plan assumes federal reauthorization.Revenue received is expected to be expended in accordance with schedules supporting approvedapplications. This program is administered by the State.
Service Authority for Freeway Emergencies (SAFE) Revenue is based on a $1 annualsurcharge on each motor vehicle registration in Los Angeles County. Cost estimates andassumptions are based on the SAFE ten-year Financial Plan and include capital requirements andoperations/maintenance expenses.
State Highway Operation and Protection Program (SHOPP) - Freeway Rehabilitation TheSHOPP program was formerly referred to as the Highway Systems Operation and Protection Plan(HSOPP). Cost estimates through Fiscal Year 1994 -1995 are from the FY 1993 - 99 TIP. Nofunds are included in the Plan for Fiscal Years 1995 - 1996 through 1997 - 1998 due to the fundsbeing diverted for seismic retrofit and earthquake restoration. Funding is a~sumed to begin inFiscal Year 1998 - 1999 at a constant level adjusted for inflation and to continue to the end of thePlan period. This program is administered by the State.
Inter-regional Road System Caltrans provides estimates for the total need to makeimprovements for inter-regional traffic on state highways outside urban limit lines. Funding is notavailable for this program in the first decade based on the STIP shortfall. Beginning in FiscalYear 2003 - 2004, $23 million per year is allocated to the program. The funding for the Inter-regional Road Systems is provided through the State Highway Account and is administered by theState ..
Retrofit Soundwalls Funding is programmed through Fiscal Year 1998 - 1999 based onCaltrans' programming information and priorities. The funding for Retrofit Soundwalls isprovided through the State Highway Account and is administered by the State.
Environmental Enhancement & Mitigation Although this program is funded through the StateHighway Account, it is not included in the STIP. ~roposition 111 legislation allows allocation of$10 million annually statewide over a ten-year period from Fiscal Year 1991 - 1992 to Fiscal Year2000 - 2001. .
The Plan estimates that Los Angeles County's fair share provision follows Sections 187 and 188of the Streets and Highways Code which allocates 40 percent of the total amount to projects innorthern counties and 60 percent to projects in southern counties. This includes San Luis Obispo,Kern, Mono, Tulare, Inyo, Santa Barbara, Ventura, Los Angeles, San Bernardino, Orange,Riverside, San Diego and Imperial. All other counties are considered northern counties. The Planassumes that Los Angeles County will receive $2.5 million annually through the life of theprogram. Revenues received are expected to be expended in accordance with schedulessupporting approved applications and is administered by the State.
• Antelope Valley Transit Authority• Arcadia• Claremont• Commerce Municipal Bus Lines• Culver City Municipal Bus Lines• Foothill Transit• Gardena Municipal Bus Lines.• La Mirada Transit• Long Beach Transit• Los Angeles Department of Transportation (LADOT)• Montebello Municipal Bus Lines• MT A Operations• Norwalk Transit• Redondo Beach• Santa Clarita Transit• Santa Monica Municipal Bus Lines• Torrance Transit
The Plan includes funding for vehicles replacement, facilities rehabilitation and replacement, andsupport equipment, as described below:
Clean Fuels Air Quality Maintenance District (AIR QUALITY MAINTENANCE DISTRICT(AQMD)) requirements are assumed to be met by converting vehicles and facilities to clean fuels(i.e. alternative fuel vehicles) and by increasing transit service so that work trips on transit as apercentage of all regional trips increases by the year 2013.

Vehicle Replacement Schedule Vehicle replacement is based on the following retirementschedule:
Transit Buses (35 and 40 foot) -Heavy Duty Smaller Buses-Dial-A-Ride Vehicles-
12 years10 years5 years for light duty, mid-sized buses, approximately 25 to 35feet in length
4 years for light duty, small buses, cutaways, or modified vans16 to 28 feet in length
Vehicle Costs Total vehicle costs, including wheelchair lifts, for each technology, are presentedbelow in 1995 dollars. This purchase price assumes replacement with alternative fueled vehicles.
Buses - 40 foot, :rv,t:TA.Buses - 40 foot, Municipal OperatorsSmall to Mid-sized BusesVans
$324,000$300,000$200,000$50,000
The MT A purchase price is based on a recent procurement of Compressed Natural Gas (CNG)Vehicles. The purchase price for the Municipal Operators was estimated by the bus operators fora generic alternative-fueled vehicle. A decision has not been made on the technology of future busprocurements. The MT A purchase price is higher than the Municipal Operators' purchase pricebecause on different specifications on added equipment. A feasibility analysis for a countywidebus procurement standard will be undertaken to determine future cost savings. {Policy Decision)
Facilities Maintenance facilities are assumed to have a useful life of 50 years. Renovation andrehabilitation costs of existing facilities are estimated to average about 30% of the constructioncosts in 1994 dollars every 15 years. These costs are calculated as the total square footage for allthe facilities multiplied by the assumed cost of construction. These costs were distributed at 2%per year over the life of a facility. The fully escalated cost of facility replacement was assumed inyear 50.
Support Equipment This category includes costs of minor capital items such as supportvehicles, spare parts, and miscellaneous support equipment. Spare equipment costs are assumed at15% of the total vehicle replacement and facilities rehabilitation and replacement costs, based onan analysis of the municipal operators' allocation patterns.
COP Payments Debt payments for existing Certificates of Participation issued for the MT A,Torrance Transit, and Culver City Municipal Bus Lines are assumed in the Plan.
Union Station Gateway Intermodal Transit Center The Union Station Gateway IntermodalTransit Center will be a major intermodal center which includes light rail, heavy rail, bus,commuter rail, and intercity rail. Included facilities consist of a bus plaza, portal pavilion, a 2,500park-and-ride lot, and off-site improvements designed to serve the transit center. As designed,the Gateway Transit Center will accommodate more than 100 buses every hour and serve morethan 115,000 multimodal transit users daily. The Plan includes $149.5 million for the projectbased on the fundin~ plan. This facility is scheduled to be completed in Fiscal Year 1996 - 1997.
ADAlParatransit Cost projections to implement the mandates of the American with DisabilitiesACT (ADA) for the first decade of the Plan were based on estimates provided by Access ServicesInc.(ASI) as part of their 1994 Annual Update to the Los Angeles County CoordinatedParatransit Plan. Projections beyond Fiscal Year 2002 - 2003 were escalated using the costinflation factors previously discussed. .
Unmet Needs In the preparation of the Fiscal Year 1994-95 SRTPs, Los Angeles County BusOperators, including the MT A, identified what they believe to be unmet bus capital needs. TheMT A's Planning and Programming unit will continue to meet with operators during the next yearto further define bus capital needs in light of the Long Range Plan, the SRTP process, and theTIP/Call for Projects.
MT A Operations and maintenance cost projections are based on the Fiscal Year 1994 - 1995Budget and are assumed to grow with the rate of inflation. The Plan includes the revenueprojections sufficient to support the existing service levels since the Plan assumes the baselineregional bus system will not grow beyond the peak fleet and revenue service hours reflected in theMTA Fiscal Year 1995 - 1998 Short Range Transit Plan. The Formula Allocation Program(FAP) is assumed to continue in future years for TDA Article 4, Proposition A, STA, and Section9 operating funds. The Plan assumes the MT A operating deficit, both in the near term andbeyond, is resolved.
Municipal Operators Operations and maintenance costs were based on data included in thetransit operators' Fiscal Year 1995 - 1998 Short Range Transit Plans. The Fiscal Year 1997 -1998 cost estimates are used as the basis for future years' cost projections and escalated using theinflati'on factors discussed in the inflation factors section. The Baseline assumption is that thebaseline regional bus system will not grow beyond the peak fleet and revenue service hoursreflected in the Fiscal Year 1995 - 1998 Short Range Transit Plan. The Formula AllocationProgram (FAP) is assumed to continue in future years for TDA Article 4, p'roposition A, STA,and Section 9 operating funds. The following transit operators are included in this category:
• Antelope Valley Transit Authority• Arcadia• Claremont

• Commerce Municipal Bus Lines• Culver City Municipal Bus Lines• Foothill Transit• Gardena Municipal Bus Lines• La Mirada Transit• Long Beach Transit• Los Angeles Department of Transportation (LADOT)• Montebello Municipal Bus Lines• Norwalk Transit• Redondo Beach• Santa Clarita Transit• Santa Monica Municipal Bus Lines• Torrance Transit
Expansion A countywide 300 bus expansion program is included in the Plan. Operating costs of$581.6 million through 2013 were estimated using a marginal cost per bus calculation (67% oftotal operating costs) based on the MTA's Fiscal Year 1994 - 1995 budgeted cost per bus andFiscal Year 1994 - 1995 data from the municipal operators' SRTPs. The operating costs wereincluded in the Plan assuming 80% MT A operations and 20% Municipal Operators' for purposesof planning calculations only. Actual fleet expansion will depend on factors relevant to theoperating environment. Expansion farebox revenues were estimated using a marginal fareboxrecovery ratio of 20%, since the expansion buses will be used to improve service as well as attractnew riders.
The actual assignment of bus expansion by operator has not been assumed in this Plan.This decision will be made separately through the TIP and Call for Projects processes.[Policy Decision]
ADAlParatransit Cost projections to implement the mandates of the American with DisabilitiesACT (ADA) for the first decade of the Plan were based on estimates provided by theConsolidated Transportation Services Agency (CTSA, aka ASI) as part of their 1994 AnnualUpdate to the Los Angeles County Coordinated Paratransit Plan. Projections beyond 2003 wereescalated using the cost inflation factors discussed in the inflation factors section.

Rail Projects Capital Cost Estimates Costs for rail projects that have MTA approved plans andbudgets are shown as an annual ca,sh flow based on the approved budget. Costs for rail projectswith no existing budgets are calculated based on MT A's cost estimation guidelines. The costestimation process considers factors such as the estimated construction cost in current dollars, theconstruction start date based on available resources, and the construction duration and curvebased on experience with past or current projects.
All costs detailed below are in escalated dollars, based on when a project is anticipated to beconstructed.
Metro Rail Se2ment 1 The first three segments of the downtown Los Angeles Metro railsystem are called the "Metro Red Line". Metro Red Line Segment 1 operates from Union Stationto the WestlakelMacArthur Park station. The 4.4 mile, 5 station Red Line Segment 1 projectopened for revenue service in January 1993.
Local Funds:State Funds:Federal Funds:
$508$214$696
36%15%49%
Metro Rail Segment 2 Metro Red Line Segment 2 consists of two rail corridors, totalling 6.8miles. The Wilshire Corridor extends from the WestlakelMacArthur Lake station northwest toWiIshireNermont, and west along Wilshire Boulevard to Western Avenue, terminating at theWilshire/Western station. The Vermont/Hollywood Corridor extends north fromWilshireN ermont along Vermont Avenue, turning west along Hollywood Boulevard to theHollywoodNine station. These segments are anticipated to open for revenue service in FiscalYear 1996 - 1997 and Fiscal Year 1998 - 1999, respectively.
Local FundsState Funds:Federal Funds:
$594$185$667
41%13%46%
Metro Rail Segment 3 The Metro Red Line Segment 3 project consists of three segments. TheNorth Hollywood segment is a 5.9 mile project with three stations, which begins just west of theSegment 2 Hollywood/Vine station and continues west under Hollywood Boulevard to theHollywood/Highland station and north under the Santa Monica mountains to its terminus in NorthHollywood. The Mid-City portion is a 2.3 mile project with two stations that begins west of theWilshire/Western station, passes through the Crenshaw/Olympic station, and terminates at thePico/San Vicente station. The eastern extension is a 4 mile, 4 station alignment running east fromUnion station to First and Lorena Street. The North Hollywood portion of the project isanticipated to open for service in Fiscal Year 2000 - 2001, with the Eastside and Westsideportions both opening in Fiscal Year 2002 - 2003.
Local Funds:State Funds:Federal Funds:
$866$333$1,583
31%12%57%
I
Metro Blue Line The Metro Blue Line is a 22-mile light rail line with 22 stations which extendfrom downtown Long Beach to Seventh and Flower streets in downtown Los Angeles.Operation of this line began in Fiscal Year 1990 - 1991,
Lpcal Funds:State Funds:Federal Funds:
$877$0$0
Metro Green Line The Metro Green Line light rail line extends 20 miles along the center of the105 Freeway from Studebaker Road and the 605 Freeway in Norwalk to Freeman Blvd. andMarine Avenue in Redondo Beach, with 14 stations. The revenue operations date of this line isscheduled for Fiscal Year 1995 - 1996.
Local Funds:State Funds:Federal Funds:
$616$106$0
85%15%
Pasadena Blue Line The Metro Blue Line light rail line extending from Sierra Madre Villa inPasadena to Union Station in downtown Los Angeles is currently under construction. This linewill cover 13.5 miles and have 14 stations. This rail line is anticipated to be open for service inFiscal Year 2002 - 2003.
Local Funds:State Funds:Federal Funds:
$631$367$0
63%37%
Because of the state funding shortfall and the resultant delay in the availability of state funding, itis assumed that the state will delete the requirement that the state funds for this project be drawn-down by the year 2000.
Red Line - San Fernando Valley EastlWest The San Fernando Valley East/West Line connectsthe North Hollywood area with the San Fernando Valley. The 3-station, 6 mile subway lineextends from the terminus of the Metro Red Line Segment 3 station in North Hollywood atChandler Blvd. to Sepulveda Blvd., just east of the San Diego 405 Freeway. Construction of thisline, which will stretch over 9 years, is anticipated to begin in Fiscal Year 2003 - 2004, withrevenue service starting in Fiscal Year 2012 - 2013.
Local Funds:State Funds:Federal Funds:
$323$253$506
30%23%47%
Because of the state funding shortfall and the resultant delay in the availability of state funding, itis assumed that the state will delete the requirement that the state funds for this project be drawn-down by the year 2000.
Red Line - Westside Extension The Westside Extension of the Metro Red Line extends fromPico/San Vacandi to the San Diego Freeway (Route 405). The 6-station, 7.8 mile line will beginconstruction in Fiscal Year 2004 - 2005 and is anticipated to open for revenue service in FiscalYear 2013 - 2014.
Local FundsState FundsFederal Funds:
$1,352$23$1,735
43%1%56%
Red Line -Eastern Extension The Eastern Extension of the Metro Red Line extends fromIndiana Avenue in East Los Angeles to Atlantic/Whittier. The 3-station, 3 mile segment willbegin construction in Fiscal Year 2008 - 2009 and is anticipated to open for revenue service inFiscal Year 2013 - 2014.
Local Funds:State Funds:Federal Funds:
$600$12$792
43%1%56%
LA Car The Los Angeles Light rail procurement consists of a base order of 72 standard cars and2' prototype vehicles for a total of 74 light rail vehicles. The standard cars will be used on theMetro Blue Line, Pasadena Line, and planned extensions of the lines.
Local Funds:State Funds:Federal Funds:
$122$118$18
47%46%7%
Commuter Lines The Southern California Regional Rail Authority (SCRRA) is a Joint PowersAgency which plans, constructs, and operates Southern California's commuter rail system. TheLACMT A funds a portion of the capital and operating costs for commuter rail projects locatedwithin Los Angeles County, including:
• Los Angeles / San Bernardino• Los Angeles/San BernardinolRiversidelFullerton• Los Angeles / Moorpark• Los Angeles / Santa Clarita / Palmdale / Lancaster• Los Angeles / Oceanside
]]]
]
]
]
]
]
]
]
]
]
]
]
]
J]
]
]
• Los Angeles / Riverside (Union Pacific)• Fullerton/LAUPT• Shared Facility
The SCRRA current system includes 346 route miles, 201 of which are in Los Angeles County.The Plan assumes continued funding for the current commuter rail system. Operating costprojections were provided by SCRRA staff Los Angeles County's share of commuter rail costsis funded with Proposition C 10% revenues, which is consistent with MT A's funding policiesadopted in Fiscal Year 1994 - 1995. Over the 20-year period of the Plan, the Plan includes thefollowing costs:
Total Operating Needs: $1.170 billion. MTA Share of Operating Needs: $666 million (56.92%)
Diesel Multiple Unit (DMU) Diesel Multiple Unit options will be explored as a transportationalternative to more expensive light rail systems in selected corridors. Before these projects could.be implemented, a feasibility analysis would need to be completed. DMU projects could befunded with Prop. C 10% funds.
Rehabilitation and Replacement Projected rehabilitation and replacement costs are based on amethodology developed by Robert Peskin ofKMPG Marwick. This methodology was developedbased on actual costs experienced by the Washington Metropolitan Area Transit Authority(WMA TA). Actual WMA TA rehabilitation and replacement costs were compared to theiroriginal installation capital costs. The MTA Rail rehabilitation and replacement costs werecalculated in the same manner based on the Metro Blue, Red, and Green Line original installationcapital costs. The first rehabilitation and replacement costs are estimated to begin five years aftera rail line begins revenue operations.
Based on the Peskin Model, the rehabilitation and replacement costs for the 20-year period are asfollows:
Blue Line - LA to Long BeachRed Line Segments 1,2 and 3Green Line - Norwalk to El SegundoBlue Line - LA to Pasadena
$370 million$830 million$146 million$56 million

The costs for rehabilitation and replacement of rail capital are funded with a combination of localProposition A, C and TDA revenues, state TCI revenues, and Federal Section 3 RailModernization revenues, as follows:
Local Revenues:State Revenues:Federal Revenues:
$985 million$0 million$417 million
Systemwide Rail Capital/Other Projects/Station Enhancements In addition to the costsassociated with the construction of each individual rail line, there are costs related to developingthe rail system. These include the procurement of computer software and hardware, safety andsecurity measures, legal support, studies, facilities, Americans With Disabilities Act (ADA)requirements, and transit station access improvements.
Local Revenues:State Revenues:Federal Revenues:
$250$0$10
Capitalized Environmental Clearance/Study Costs Capitalized environmental clearance/studycosts are determined each year through the MT A Budget process. This category includes thecosts for environmental studies, staff support, overhead, and Board-directed studies. Over the 20year period, the costs are estimated to be as follows:
Local Revenues:State Revenues:Federal Revenues:
$417$0$0
Rail operations costs are based on an operating and maintenance (O&M) cost model that wasdeveloped during the analysis for the 30-Year Plan. The model is a disaggregate, resource build-up model, consistent with the methodology specified by the Federal Transit Administration (FTA)for Alternatives Analysis studies. Staffing requirements, labor costs, and non-labor expenses are-calculated based on the projected quantity of service supplied (e.g., peak vehicles, revenuesvehicle-miles) and the physical size of the system (e.g., route-miles, number of stations). Themodel reflects the former RTD's organizational structure at the time the 30-Year Plan was being
developed, but is largely based on industry standards since Los Angeles' County's rail system wasstill in its infancy when the model was created.
The same O&M cost model has been used to develop preliminary estimates for rail operatingcosts in the current 20- Year Long Range Plan. To the extent possible, the cost model has beenrecalibrated based on updated information, including the current budget. The MTA is currentlyupdating the O&M cost model to reflect the MTA's current operating cost structure andindustry standards. The Long Range Plan will be updated once this new data is available.Any savings resulting from this update will be included in the cost savings initiatives study whichwill be completed in the near future.
,Los Angeles County's portion of commuter rail operating costs is based on the current budget andestimates from the Southern California Regional Rail Authority (SCRRA).
Based on the O&M cost model and SCRRA's commuter rail estimates, the rail operating costs(including security) for the twenty year period are as follows:
RED LINE $2,144 millionSegment 1,2 and 3Western ExtensionEastern ExtensionSan Fernando Valley EastlWest
BLUE LINE $1,824 millionLong BeachPasadena
GREEN LINE $742 millionNorwalk/EI Segundo
COMMUTER RAIL $666 millionCurrent System (LA Portion Only)
Staff has been actively pursuing potential new revenue sources through a variety of initiatives,including active participation in the California Consensus Project which, in conjunction with theCalifornia Transportation Commission (CTC), is working to identify and advocate additionalrevenue sources for transportation projects and programs in California. Any new revenues couldbe used to fund additional projects that were not included in the fiscally constrained plan due tolimited resources. If any new revenues become a reality, staffwill present recommendations to theBoard as to what additional projects and programs could be included in the Plan.
Before a new revenue source can become a reality, the following conditions should exist whichwould be conducive to legislative and/or voter approval of new revenues:
• Evidence that current transportation projects and programs, both capital andoperating, are being managed and delivered in a cost efficient manner;
• Voter perception that the current transportation system is deteriorating and congestion. .IS worserung;
• Proof that current revenue sources are inadequate to address identified transportationneeds;
• Assurance that any new revenues will be used to fund clearly identified projects andprograms;
• Current projects, including Metro Red Line Segment 3 and Pasadena Line, arecompleted on schedule and within budget ..
Any of the following new revenue sources would provide about $230 million (Fiscal Year 1994dollars) annually for Los Angeles County:
In addition to the above, other funding sources will be explored such as the potential for accessingno-traditional funding sources, including funding programs administered by the Department ofHealth and Human Services.
An example of the additional program that could be funded with new revenues is shown below.Based on the assumption that $4.3 billion in new revenues would be available in the seconddecade of the Plan. and assuming some flexibility of use and the issuance of bonds secured by newrevenues, the program of projects listed below could be funded with new revenues:
• Depending upon the cost of each rail line, between three and six rail lines could beconstructed and operated in the second decade. These could include:• Crenshaw Corridor• Downtown Connector• Exposition Line (Downtown to US C)• Glendale/Burbank Line• San Fernando Valley East-West (405 Fwy to Warner Center)• 10/60 Corridor
• The equivalent of350 to 400 additional full-size buses could be procured and operatedin the second decade to enhance current service or to add new service such as railfeeder or dedicated HOV system service;
• Construction schedules for highway projects currently included in the Plan could beadvanced or additional major capital projects could be funded. These could include:• Route 5 Gap Closure from Route 605 to Orange County Line• Route 126 Gap Closure from Route 5 to Route 14• Route 71 Gap Closure from Route 60 to Route 10'• Route 138 (Ave. P-8) from Route 14 to Avenue 50
• Additional funding could be made available to program for projects in the Call forProjects categories;
• Advanced transportation technologies recommended by the Southern CaliforniaAssociation of Governments (SCAG) could be funded, such as, electric vehicles,alternative fuel vehicles, advanced Smart Shuttle transit, passenger-orientedtechnologies, intelligent vehicle highway systems, and increased telecommunicationsinitiatives.
Some combination of the above examples of projects.
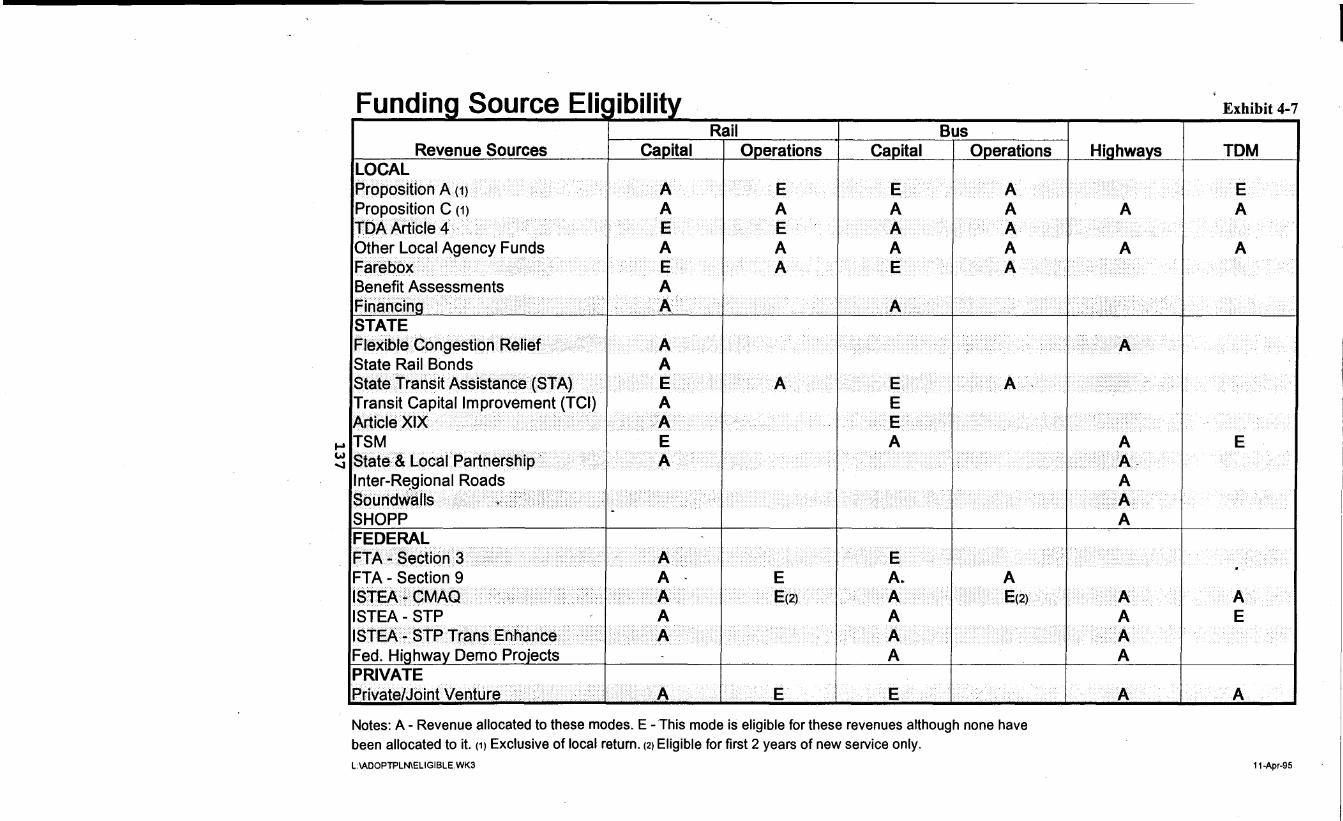
Fundin Source EliRevenue Sources
LOCALProposition A(1)Proposition C (1)
TOA ActiCle4()therLocal Agency FundsFateboxBenefit AssessmentsFinaHCihSTATEFlexfbleCongestioflReliefState Rail BondsState··Tral1sit••·Assista.nde.fSTA)Transit Capitallmprovement(TCI)ArticleXtX
•..•TSM~ StatEf&. LocafPartl1ership'i
Inter-R~gional RoadsSOurlawallsSHOPPFEDERALFTA·'$e6tioli· ••.3FTA - Section 9ISie,A.""CMAa
,---,." . _.
ISTEA - STPISTEA-STF)Tral1sEhHanceFed. Hi hwa Demo Pro'ectsPRIVATEPrivatelJoint Venture
Railo erations
BusCa ital 0 erations
Notes: A - Revenue allocated to these modes. E - This mode is eligible for these revenues although none havebeen allocated to it. (1) Exclusive of local return. (2) Eligible for first 2 years of new service only.L :IADOPTPLN\ELIGIBLE.WK3
Related Documents


