For Review Only Improving Telmisartan Mechanical Properties through the Formation of Telmisartan and Oxalic Acid Co-Crystal by using Slow Evaporation (SE) and Ultrasound Assisted Co- Crystallization from Solution (USSC) Methods Journal: Songklanakarin Journal of Science and Technology Manuscript ID SJST-2018-0151.R2 Manuscript Type: Original Article Date Submitted by the Author: 02-Sep-2018 Complete List of Authors: Ratih, Hestiary; School of Pharmacy, Institut Teknologi Bandung, Pharmaceutics; Faculty of Pharmacy, University of Jenderal Achmad Yani, Pharmaceutics Pamudji, Jessie; School of Pharmacy, Institut Teknologi Bandung, Pharmaceutics Alatas, Fikri; Faculty of Pharmacy, University of Jenderal Achmad Yani, Pharmaceutics Soewandhi, Sundani; School of Pharmacy, Institut Teknologi Bandung, Pharmaceutics Keyword: telmisartan, oxalic acid, co-crystal, slow evaporation, ultrasound assisted co-crystallization from solution, Chemistry and Pharmaceutical Sciences For Proof Read only Songklanakarin Journal of Science and Technology SJST-2018-0151.R2 Ratih

Welcome message from author
This document is posted to help you gain knowledge. Please leave a comment to let me know what you think about it! Share it to your friends and learn new things together.
Transcript

For Review Only
Improving Telmisartan Mechanical Properties through the
Formation of Telmisartan and Oxalic Acid Co-Crystal by using Slow Evaporation (SE) and Ultrasound Assisted Co-
Crystallization from Solution (USSC) Methods
Journal: Songklanakarin Journal of Science and Technology
Manuscript ID SJST-2018-0151.R2
Manuscript Type: Original Article
Date Submitted by the Author: 02-Sep-2018
Complete List of Authors: Ratih, Hestiary; School of Pharmacy, Institut Teknologi Bandung,
Pharmaceutics; Faculty of Pharmacy, University of Jenderal Achmad Yani, Pharmaceutics Pamudji, Jessie; School of Pharmacy, Institut Teknologi Bandung, Pharmaceutics Alatas, Fikri; Faculty of Pharmacy, University of Jenderal Achmad Yani, Pharmaceutics Soewandhi, Sundani; School of Pharmacy, Institut Teknologi Bandung, Pharmaceutics
Keyword: telmisartan, oxalic acid, co-crystal, slow evaporation, ultrasound assisted co-crystallization from solution, Chemistry and Pharmaceutical Sciences
For Proof Read only
Songklanakarin Journal of Science and Technology SJST-2018-0151.R2 Ratih

For Review Only
Type of Article (Original Article)
Improving Telmisartan Mechanical Properties through the Formation of
Telmisartan and Oxalic Acid Co-Crystal by Slow Evaporation (SE) and Ultrasound
Assisted Co-Crystallization from Solution (USSC) Methods
Hestiary Ratih1,2*, Jessie Sofia Pamudji1, Fikri Alatas2, and
Sundani Nurono Soewandhi1
1Pharmaceutics group, School of Pharmacy, Institut Teknologi Bandung, Bandung,
Indonesia
2Pharmaceutics group, Faculty of Pharmacy, University of Jenderal Achmad Yani, Cimahi, Indonesia
* Corresponding author, Email address: [email protected]
Abstract
Telmisartan (TMS) used for the prevention and treatment of hypertension has poor
mechanical properties. The purpose of this research is to improve the mechanical properties
of TMS through the formation of co-crystal TMS with oxalic acid (OXA) and to compare
mechanical properties of TMS-OXA 1:1 co-crystal obtained from the different co-
crystallization technique. Co-crystal was prepared by slow evaporation (SE) and ultrasound
assisted co-crystallization from solution (USSC). The tabletability profiles were plotted
between compaction force in the range of 4.98 to 29.89 kN vs tensile strength. The tablet
tensile strength of TMS in compaction force >14.98 kN had severe capping or lamination.
In contrast, the tablet tensile strength of TMS-OXA SE and USSC co-crystals were higher
and it could be easily formed to be tablets in all of the compaction force. It can be
concluded that the TMS-OXA co-crystals prepared by SE and USSC have improved
mechanical properties of telmisartan tablet.
Page 2 of 32
For Proof Read only
Songklanakarin Journal of Science and Technology SJST-2018-0151.R2 Ratih
123456789101112131415161718192021222324252627282930313233343536373839404142434445464748495051525354555657585960

For Review Only
Keywords: telmisartan, oxalic acid, co-crystal, slow evaporation, ultrasound assisted co-crystallization from solution.
1. Introduction
Active pharmaceutical ingredients (APIs) are often given to the patients in solid
dosage forms such as tablets, capsules, and others (Morissette et al., 2004). The ability to
deliver the drug to the patients in a safe, efficacious and cost-effective manner depends on
the physicochemical properties of the APIs and is a challenge for the pharmaceutical
industry to design pharmaceutical solid materials with specific physicochemical properties
(Basavoju, Boström, & Velaga, 2008). One of the continuous challenges in the
development and manufacture of drugs is the poor mechanical properties. Difficulties often
arise during grinding, filling and compaction process due to the poor mechanical properties
of powder (C. Sun & Grant, 2001).
Telmisartan (TMS) is used for the prevention and treatment of hypertension that is
commercially available as Micardis® categorized as angiotensin II receptor antagonist.
TMS is class II drug in biopharmaceutical classification system (BCS) which has low
solubility and high permeability. Three forms of TMS crystals, i.e. one solvate and two
polymorphics (forms A and B) has been reported by Dinnebier (Dinnebier, Sieger, Nar,
Shankland, & David, 2000). The crystal habit may affect the orientation of particles,
therefore it will cause the changes of the properties such as flowability, compression, and
dissolution of an APIs. In the previous study conducted by Banga (2007), celecoxib which
has properties similar to TMS, through modification of crystal habits can overcome
manufacturing problems as it has cohesive needle-shape crystals, high surface energy and
Page 3 of 32
For Proof Read only
Songklanakarin Journal of Science and Technology SJST-2018-0151.R2 Ratih
123456789101112131415161718192021222324252627282930313233343536373839404142434445464748495051525354555657585960
For Review Only
electric charge which tend to agglomerate together during mixing that may lead to content
non-uniformity during capsule filling operations (Banga, Chawla, Varandani, Mehta, &
Bansal, 2007).
Crystal engineering through the co-crystal formation is one of the approaches of
increasing the physicochemical properties of the APIs including solubility and mechanical
properties (Almarsson & Zaworotko, 2004). Co-crystal is defined as a material containing
two or more different molecules that make up the new crystalline (Trask & Jones, 2005).
The formation of the caffeine-methylgallate co-crystal can modify the powder
compactibility of pure caffeine (C. C. Sun & Hou, 2008); The mechanical properties of
paracetamol co-crystals with theophylline, oxalic acid, naphthalene, phenazine and 5-nitro
isophthalic acid have better compression compared to paracetamol form I (Hiendrawan et
al., 2016; Karki et al., 2009). The formation of co-crystal depends on the presence
supramolecular synthon between the API and the coformer. TMS contains two imidazole
rings and an aromatic carboxylic acid which causes the TMS to have several hydrogen
bond acceptors and hydrogen bond donors (Figure 1). Many types of research have been
conducted on the TMS co-crystal formation. In the previous study, the solubility and
dissolution rate of TMS have been increased through the TMS-oxalic acid (OXA) co-
crystal formation, and the crystal habit of TMS-OXA co-crystal was rhomboid-shaped that
generally has good mechanical properties when developed to tablet dosage form (Alatas,
Ratih, & Soewandhi, 2015). As a continuation a study on the mechanical properties of the
TMS-OXA co-crystal such as flowability and tensile strength has been conducted. In this
study, the aim of the preparation of the TMS-OXA co-crystal by slow evaporation method
was to achieve the larger crystal size, whilst by ultrasound assisted co-crystallization from
Page 4 of 32
For Proof Read only
Songklanakarin Journal of Science and Technology SJST-2018-0151.R2 Ratih
123456789101112131415161718192021222324252627282930313233343536373839404142434445464748495051525354555657585960
For Review Only
solution (USSC) was to produce large quantities of co-crystals for scale-up purposes. The
purpose of this research was to study the influence of TMS-OXA co-crystal that prepared
from two co-crystallization techniques (SE and USSC) on the mechanical and compaction
properties of TMS.
2. Materials and Methods
2.1.1. Materials
TMS commercial material with a purity of >99% was obtained from Glenmark
Pharmaceutical Limited, Mumbai, India (batch no. 0171200922). Oxalic acid dihydrate
(OXA) was obtained from Merck Chemicals Indonesia, methanol and other reagents were
purchased from Merck Chemicals Indonesia without any purification.
2.1.2. Methods
(i) Telmisartan/oxalic acid 1:1 co-crystal preparation
a. Slow evaporation (SE)
TMS-OXA co-crystal with a 1:1 molar ratio prepared by slow evaporation method in
methanol solvent. 5 g of TMS, 1.22 g of OXA, and 700 mL methanol were put in closed
Erlenmeyer flask, and shaked in waterbath shaker at about 70°C until a clear solution
obtained. After that, the solution was filtered and allowed to evaporate at room temperature
until co-crystal was formed. The co-crystal was characterized by powder X-ray diffraction
(PXRD), polarization microscope, differential scanning calorimeter (DSC) and fourier
transform infrared (FTIR) spectroscopy.
b. Ultrasound Assisted Cocrystallization from Solution (USSC)
Page 5 of 32
For Proof Read only
Songklanakarin Journal of Science and Technology SJST-2018-0151.R2 Ratih
123456789101112131415161718192021222324252627282930313233343536373839404142434445464748495051525354555657585960
For Review Only
The equipment consisted of a probe and high-intensity ultrasonic processor/sonifier
(Branson, Model 3510E-DTH, Danbury, USA) with 40°C temperature controller and was
operated at 42 kHz that capable to induce a maximum power output of 100 W. 5 g of TMS,
1.22 g of OXA was placed in glass beaker with 100 mL methanol, and sonicated for 5-10
minutes. The solid mixture was taken every one minute and observed under a microscope
until rhomboid-shaped crystals were formed. The solid mixture was separated by filtration
and dried at ambient temperature. The dried solid was kept in desiccator until further study.
(ii). Characterization of Co-Crystals
a. Powder X-ray diffraction (PXRD)
PXRD was performed using a Philips PW1710 X-ray diffraction system. Data were
collected from 5 to 35º 2θ using continuous scanning, with a scan rate of 2º/min. The X-ray
tube was operated at 40 kV, 30 mA.
a. Differential Scanning Calorimetry (DSC)
The thermal analysis of the samples was performed on DSC Q20 (TA Instruments, DE,
USA) calibrated for the temperature and cell constant using indium. The samples (1-3 mg)
were heated from a temperature of 50 to 300 °C with a heating rate of 10 °C/min. The
samples were continuously purged with nitrogen at 50 mL/min.
b. Fourier Transform Infrared (FTIR) Spectroscopy
IR spectra of the compounds were recorded on an FTIR Affinity-1 spectrophotometer
(DRS-8000) Shimadzu, Japan. Forty-five scans were obtained from 4000 to 400 cm-1.
c. Scanning Electron Microscopy (SEM)
The morphology of the samples (crystal habit) was examined using a scanning electron
microscopy (JEOL JSM-6360LA, Japan). The specimens were placed on the metal sample
Page 6 of 32
For Proof Read only
Songklanakarin Journal of Science and Technology SJST-2018-0151.R2 Ratih
123456789101112131415161718192021222324252627282930313233343536373839404142434445464748495051525354555657585960

For Review Only
holder with a diameter of 12 mm using a double-side adhesive tape and coated with gold-
palladium under vacuum.
d. Particle size analysis
A Beckman Coulter LS 13 1320 laser diffraction particle analyser equipped with an R5 lens
(measuring range 0.375-2000 µm) was used for the determination of volume-weighed
particle size of TMS, TMS-OXA co-crystal SE and USSC.
e. Helium picnometry
True densities of TMS and TMS-OXA co-crystal SE and USSC were determined using a
helium pycnometer (ultrapycnometer 1000e version 4, Quantachrome Instruments, USA).
The input gas pressure was 17 psi and the equilibrium time was 1 min. The mean of 3
determinations was reported with a run standard deviation of 0.05%.
f. Flowability studies
The compressibility and flowability were determined by measuring the bulk density (ρb)
and tap density (ρt). The volume before and after tapping was used to determine ρb and ρt,
respectively. The Carr index and the Hausner ratio were calculated using the equation (1)
and (2):
Carr index= ρt-ρb
ρt x 100% Eq.1
Hausner ratio= ρb
ρt Eq.2
g. Powder Compaction
Approximately 300 mg of powder (TMS, TMS-OXA co-crystal SE, and USSC was filled
into a tableting die and compressed at pressures (4.9-29.4 kN) using hydraulic press
equipment (Perkin Elmer, MA, USA) with 11 mm-flat round punch. This flat round punch
Page 7 of 32
For Proof Read only
Songklanakarin Journal of Science and Technology SJST-2018-0151.R2 Ratih
123456789101112131415161718192021222324252627282930313233343536373839404142434445464748495051525354555657585960

For Review Only
was lubricated each time with magnesium stearate before the compaction process. Tablets
after being compressed were left overnight before their diameter, thickness and hardness
were measured. The diameter and thickness of tablets were measured using a thickness
gauge (Mitutoyo, Japan) and tablets hardness was tested using a hardness tester (Type PTB
111, Pharma Test, Germany). The breaking force, tablet diameter and tablet thickness were
used to calculate the tensile strength according to Eq.2
� =��
��� Eq.3
Where F is the breaking force (N), D is the tablet diameter (mm), and T is the thickness of
tablet (mm).
The elastic recovery (ER) is correlated with the amount of elastic energy stored during the
compression process and released after compression process. The elastic recovery could be
calculated using the diameter before (Ho) and after (H) being stored for 24 h using the
following equation 4 (Sun and Grant, 2001):
%ER=H-Ho
Ho x 100 Eq.4
h. In-vitro dissolution test
Dissolution experiments for TMS and TMS-OXA co-crystal SE and USSC were carried
using 900 mL pH 7.5 phosphate buffer solution as a dissolution medium (37±0.5ºC, 75
rpm) for 60 min using the USP XXIII paddle apparaturs (ZRS-6G, Tianjin, China). 40 mg
TMS and TMS-OXA co-crystal (SE and USSC) equivalent to 40 mg TMS were added, and
a 10 mL aliquot was withdrawn at different intervals and filtered using a 0.45 µm
Page 8 of 32
For Proof Read only
Songklanakarin Journal of Science and Technology SJST-2018-0151.R2 Ratih
123456789101112131415161718192021222324252627282930313233343536373839404142434445464748495051525354555657585960

For Review Only
membrane filter. The drug concentration was analyzed using a Shimadzu 1601-PC
spectrophotometer at a wavelength of 295 nm.
3. Results and Discussion
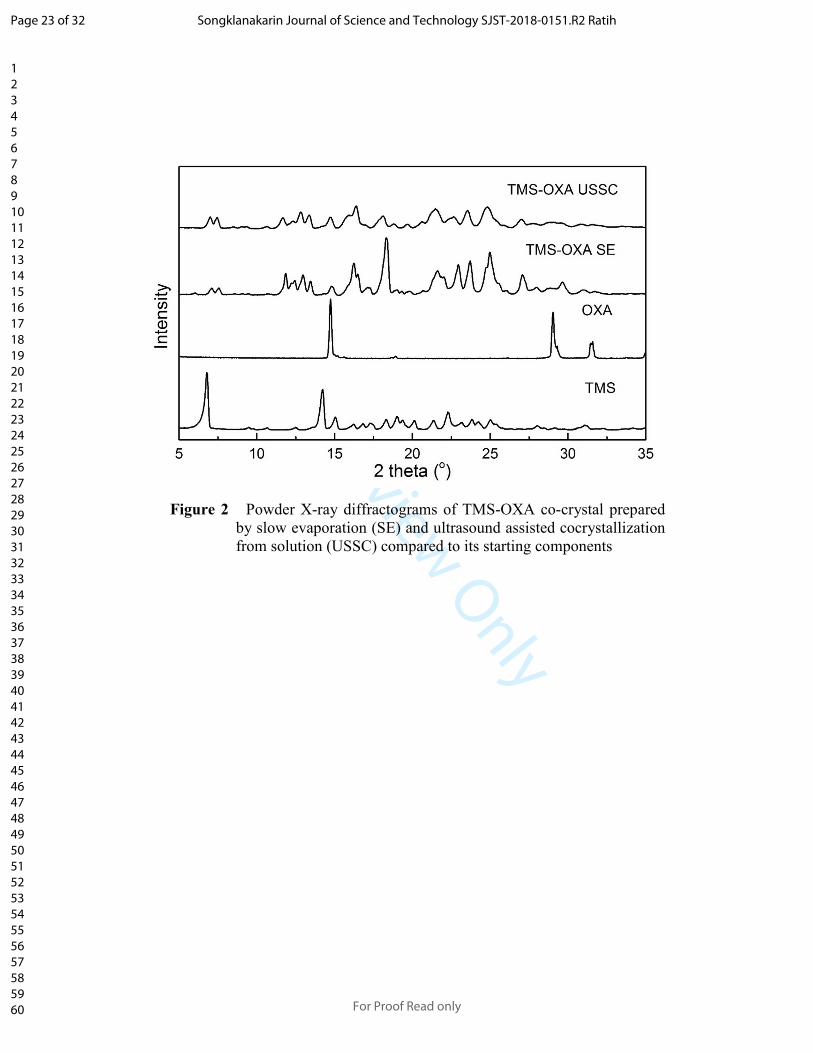
PXRD is a reliable method for characterizing the formation of a new crystalline
phase in the solid state. The product obtained after the process of co-crystallization which
showed the different PXRD pattern of individual component confirmed the formation of a
new crystalline phase (Goud, Suresh, Sanphui, & Nangia, 2012; Hiendrawan et al., 2016).
The PXRD pattern for TMS, OXA, and TMS-OXA co-crystal prepared by SE (slow
evaporation) and USSC (ultrasound assisted co-crystallization from solution) were shown
in Figure 2. TMS showed characteristic crystalline peaks at 2θ values of 6.79, 14.21, 15.02,
19.10, 21.36, 22.33 and 25.07°, while OXA showed characteristic crystalline peaks at 2θ
values of 14.75, 29.00, and 31.53°. The main peaks of TMS and OXA disappear and new
peaks appear on the formation of TMS-OXA co-crystals which indicate the formation of a
new crystalline phase. The main peaks of the co-crystal TMS-OXA (1: 1) are located at 2θ
with a value of 7.06, 7.54, 11.79, 12.98, 13.46, 14.86, 16.2, 16.5, 18.35, 21.64, 22.93,
23.67, 24.96, and 27.06°. The PXRD pattern of co-crystal prepared by SE and USSC
showed no difference. The PXRD spectra showed that the product produced by USSC
method has a lower crystallinity than SE method. In the SE method, the process of co-
crystal recrystallization was so slow that the crystals formed took a longer time to form
larger crystals resulting in higher crystallinity than co-crystal produced by USSC method.
DSC experiments were conducted to determine the thermal behavior of TMS, OXA,
TMS-OXA SE and USSC co-crystal (Figure 3). The TMS-OXA SE and USSC co-crystals
melt at a temperature of 230.7 and 231.5 oC, respectively. The melting point of co-crystal is
Page 9 of 32
For Proof Read only
Songklanakarin Journal of Science and Technology SJST-2018-0151.R2 Ratih
123456789101112131415161718192021222324252627282930313233343536373839404142434445464748495051525354555657585960
For Review Only
between TMS and OXA melting point showed their physical interaction to produce co-
crystal.
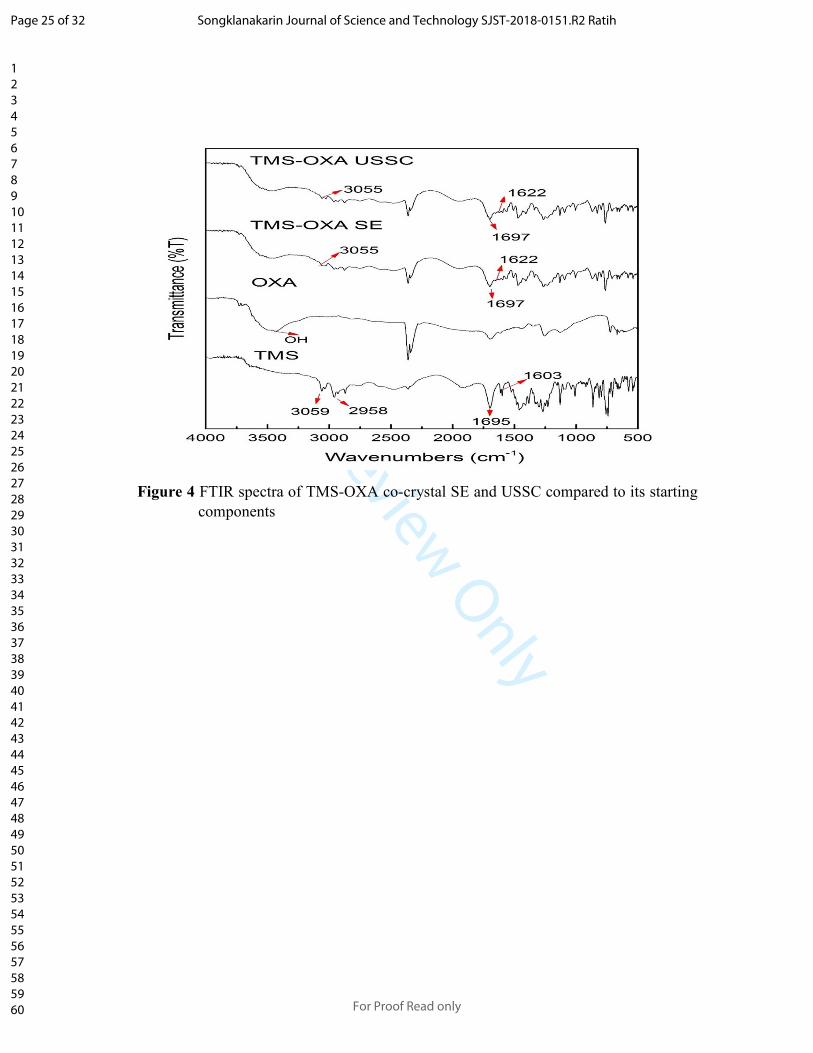
FTIR is a very common spectroscopic technique in determining the chemical
conformation of compounds and is a very reliable tool for detecting co-crystal formation,
especially when using carboxylic acid as a coformer and/or when an acid and a base formed
a neutral O-H----N hydrogen bond (Qiao et al., 2011; Schultheiss & Newman, 2009). This
interaction can be detected by the presence of the vibrational frequency changes of the
functional groups (Aitipamula, Wong, Chow, & Tan, 2014; Chadha, Saini, Jain, &
Venugopalan, 2012). FTIR spectrum of co-crystals obtained by SE and USSC are shown
in Figure 4. The FTIR spectrum of TMS showed peaks at 3059, 2958, 1695 and 1603 cm-1,
corresponding to the aromatic –CH stretch, aliphatic –CH stretch, -C=O stretch and imin
C=N stretch, respectively. An increase in the –C=O stretch frequency of TMS from 1695
cm-1 to 1697 cm-1 and C=N stretch from 1603 cm-1 to 1622 cm-1 in TMS-OXA SE and
USSC implies supra molecular hetero synthon formation of the co-crystal (Alatas et al.,
2015). The FTIR spectrum of TMS-OXA co-crystal which is obtained from SE and USSC
method showed the same peaks and did not show the different spectrum.
SEM images of co-crystals obtained by SE and USSC are shown in Figure 5. In
both cases, rhomboid shape crystal habit was observed. Some studies have described that
more regular shape crystal habit makes more free flowing powder and has good
tabletability properties. The polyhedral crystallized form of paracetamol produced stronger
tablets than elongated untreated crystals of paracetamol (Kaialy, Larhrib, Chikwanha,
Shojaee, & Nokhodchi, 2014). Orthorombic paracetamol exhibits better tabletability than
Page 10 of 32
For Proof Read only
Songklanakarin Journal of Science and Technology SJST-2018-0151.R2 Ratih
123456789101112131415161718192021222324252627282930313233343536373839404142434445464748495051525354555657585960

For Review Only
the monoclinic form (Joiris et al., 1998). Co-crystals obtained from SE method has a wide
particle size range from 20-170 µm. This size variation resulted from the slow removal of
solvent along with the decreasing temperature of the solution so that the crystal may grow
well. On the other hand, a product of USSC produces crystals of a much narrower size
range (5 – 20 µm) than SE method. USSC co-crystals were in the form agglomerates of
rhomboid shape crystals (Figure 5d). The USSC method has the advantage of being able to
produce small size particles in a narrow size using a single step process, whereas SE
crystals need to be milled further to obtain the particles uniform small size (Aher, Dhumal,
Mahadik, Paradkar, & York, 2010). During the application of ultrasound for USSC
solution, the nucleation of the particles free solution is influenced by the presence of
ultrasonic wave cavitation energy. The primary nucleation at lower saturation level can be
induced by the phenomenon of cavitation by reducing the induction period and the width of
metastable zones (Li, Li, Guo, & Liu, 2006; Luque de Castro & Priego-Capote, 2007;
Ruecroft, Hipkiss, Ly, Maxted, & Cains, 2005). Therefore, in the USSC method, a growing
number of primary nuclei are formed and ultimately present finer and more uniform
particles than SE method which provides uncontrolled nucleation and crystal growth
environments resulting in a wide particle size distribution (Aher et al., 2010).
The micromeritic properties such as flowability of co-crystals and pure drug are
shown in Table 1. Pure TMS has a lower tapped density than the TMS-OXA co-crystal (SE
and USSC methods). This could be attributed to the presence of internal friction among
TMS particles that was high enough so that a lot of empty space was not filled because of
the needle-shaped TMS habit. From the result of Carr Index and Hausner Ratio, it was
found that co-crystals (SE & USSC) had better flowability than that of pure TMS. The high
Page 11 of 32
For Proof Read only
Songklanakarin Journal of Science and Technology SJST-2018-0151.R2 Ratih
123456789101112131415161718192021222324252627282930313233343536373839404142434445464748495051525354555657585960

For Review Only
flowability of co-crystals compared to TMS might result from the decreasing cohesiveness
of co-crystals. Less irregular degradation of the TMS-OXA co-crystal habit compared to
TMS crystal habit resulted in a decrease in the contact area of the particles, leading to
decreased cohesion properties among particles (Kaialy et al., 2014). This could be
confirmed by the crystal morphological analysis of the SEM analysis is shown in Figure 5.
TMS-OXA co-crystal (USSC) has a lower flowability than TMS-OXA co-crystal (SE). In
general, particles of smaller size tend to be more cohesive and thus have lower flowability
than those of larger particle sizes (Kaialy, Larhrib, Ticehurst, & Nokhodchi, 2012).
The high Carr Index (CI) values in the TMS (Table 1) might result from the powder
aggregation arising from a high degree of mechanical interlocking between needle-shaped
TMS crystals (Figure 5a). On the other hand, the decreased CI values for TMS-OXA co-
crystal (SE and USSC) might result from the relatively decreased inter-particle contact
areas so that the cohesion decreased compared to TMS which resulted in fewer points of
physical contact and higher true density (Kaialy et al., 2014).
The flowability and tabletability are the important factors in tablet manufacturability
of a powder. Tabletability is defined as the capacity of the powder material to be
transformed into a tablet of specified strength under the effect of compaction pressure (Jain,
Khomane, & Bansal, 2014). Figure 6 shows the tabletability plot for TMS, TMS-OXA SE
and USSC co-crystal. The tabletability profiles were measured by a compaction pressure
range of 4.98 to 29.89 kN. TMS can be compressed at the range of 4.98 - 14.98 kN but if
the compaction force is above 14.98 kN, the TMS would have a brittle or fracture. It can be
seen in the capping on TMS tablets above 14.98 kN pressure so that the tensile strength
cannot be measured.
Page 12 of 32
For Proof Read only
Songklanakarin Journal of Science and Technology SJST-2018-0151.R2 Ratih
123456789101112131415161718192021222324252627282930313233343536373839404142434445464748495051525354555657585960

For Review Only
According to Dinnebier, TMS form A consisting of a needle-shaped crystal habit
has some unfavorable properties for the drug manufacturing process that have high
electrostatic forces, poor flowability and low density, resulting in TMS particles
experiencing high internal friction or cohesiveness so that a lot of empty space on the die is
not filled at compaction process. Consequently, There is some air entangled in the die
resulting in capping (Dinnebier et al., 2000; Kaialy et al., 2014). In contrast, the tablet
tensile strength of TMS-OXA SE and USSC co-crystal can be formed in tablets in all of the
compaction force. The TMS-OXA USSC co-crystal has a higher tensile strength value
when compared with TMS-OXA SE co-crystal, indicating that TMS-OXA USSC co-crystal
tabletability was better than TMS-OXA SE co-crystal. At the lowest compaction pressure
of 4.8 kN, TMS-OXA USSC co-crystal has yielded a tensile strength of 2.22 MPa which
increased continuously to 2.98 MPa at a compaction pressure of 29.89 kN. The tensile
strength of the tablet must reach 2 MPa in order to form a good tablet that is considered
being able to produce (Perumalla & Sun, 2014). TMS-OXA USSC co-crystal has met these
criteria and in its manufacturing, there is no problem in tabletability. There is no capping or
lamination tendency in the TMS-OXA USSC co-crystal tablet as seen in Figure 7. The
tensile strength of TMS-OXA SE co-crystal only reached 1.64 Mpa at 19.93 kN
compaction force, but the result showed that it was still better than pure TMS which had the
tendency of capping or lamination at > 14.98 kN. In general, the ability of powder
compaction with smaller particle sizes is better than that of larger particle size powders due
to the increasing surface area of the powder with small particle sizes that can be used for
bonding compared to larger particle size powders. The result showed that TMS-OXA
USSC co-crystal powder had a smaller particle size compared to TMS-OXA SE co-crystal
Page 13 of 32
For Proof Read only
Songklanakarin Journal of Science and Technology SJST-2018-0151.R2 Ratih
123456789101112131415161718192021222324252627282930313233343536373839404142434445464748495051525354555657585960
For Review Only
powder (Table 2), so the tablet tensile strength TMS-OXA USSC co-crystal is better than
TMS-OXA SE (Hiendrawan et al., 2016; C. Sun & Grant, 2001).
The compaction properties of bulk powders of viscoelastic materials are measured
by the relative predominance of elastic and plastic deformation components. During the
process of powder compaction, inter-particulate bonding area develops as a result of
particle rearrangement and deformation under mechanical stress. An intact tablet is formed
only if an adequate amount of inter-particulate bonding area is maintained after the
compaction pressure is removed and the tablet is ejected out of the die. Therefore, materials
with a low plasticity show poor powder compaction properties due to the difficulty in the
formation of a sufficiently amount of bonding area after compaction (Chattoraj et al.,
2014). TMS tablets at compaction pressure >14.98 kN could not be determined due to the
capping/lamination when the tablet is ejected out of the die, so that the elastic recovery
cannot be measured. It was clear that the plasticity of TMS crystal was low as supported by
the relative high elastic recovery (ER) of TMS during decompression, e.g., ± 0.95 % at
14.98 kN (Figure 8). Based on the result of tabletability profile and % ER, it showed that
TMS-OXA co-crystal SE and USSC having a higher degree of interparticulate bonding
such as bonding area and bonding strength resulted in higher plasticity than TMS. It
implied that the co-crystal has a low porosity and a stronger tablet at the same compaction
pressure compared to TMS (Aher, Dhumal, Mahadik, Ketolainen, & Paradkar, 2011).
Several reports also showed that slip planes in the crystal lattice allow easier slip, enable
greater plasticity (greater bonding area), hence produce stronger tablets (Jain et al., 2014;
C. C. Sun & Hou, 2008). Further research should be conducted to investigate the crystal
structure of TMS and TMS-OXA and its relationship with tablet properties improvement.
Page 14 of 32
For Proof Read only
Songklanakarin Journal of Science and Technology SJST-2018-0151.R2 Ratih
123456789101112131415161718192021222324252627282930313233343536373839404142434445464748495051525354555657585960

For Review Only
In addition, the co-crystals obtained with two different techniques (SE and USSC)
exhibit the same habit (rhomboid shape), but these different elastic properties of crystals
showed different compaction properties, and it needs to be studied further as different co-
crystallization techniques. It has been previously demonstrated that the USSC application in
crystallization has shown morphology changes such as crystal surface properties which
include particle size, flowability and elastic property, and different properties compared to
slow evaporation resulting in very different compaction behavior (Aher et al., 2011; Amara,
Ratsimba, Wilhelm, & Delmas, 2001; Dhumal, Biradar, Paradkar, & York, 2008; Guo,
Zhang, Li, Wang, & Kougoulos, 2005).
Besides the mechanical properties, dissolution is also essential to formulate a solid
dosage oral form as it is closely connected with bioavailability. The profile of powder
dissolution for the release of TMS from pure drug and co-crystals (SE and USSC) in pH 7.5
phosphate buffer are shown in Figure 9. The dissolution rate showed that TMS-OXA SE
and USSC co-crystal has the percentage of TMS dissolved after 60 min or dissolution
percentage (DP 60 min) higher than pure TMS. (DP 60 min) for pure TMS, TMS-OXA SE and
TMS-OXA USSC were 7.7, 55.7 and 59.9%, respectively.
4. Conclusions
In this research, co-crystal formation between TMS with OXA was prepared by
slow evaporation (SE) and ultrasound assisted cocrystallization from solution (USSC)
methods. Characterization of co-crystals includes PXRD, DSC, FTIR, and SEM. The
formation of TMS-OXA co-crystals by SE and USSC methods has improved mechanical
properties and produced a better tableting performance compared to pure TMS. Co-crystal
Page 15 of 32
For Proof Read only
Songklanakarin Journal of Science and Technology SJST-2018-0151.R2 Ratih
123456789101112131415161718192021222324252627282930313233343536373839404142434445464748495051525354555657585960
For Review Only
obtained by different co-crystallization techniques showed similar crystal habit, but it has
different mechanical properties. Therefore, the crystal surface properties need to be studied
further in order to understand the differences in compacting behavior as well as
investigating the crystal structure of TMS and TMS-OXA and its relationship with tablet
properties improvement. The dissolution profile of TMS-OXA co-crystal can increase the
dissolution rate of TMS. The results of this study offer a better approach of improving
mechanical properties and dissolution of TMS by co-crystallization with OXA.
5. Acknowledgement
We would like to thank Directorate General of Higher Education, Indonesia
Ministry of Education and Culture for the doctoral educational program scholarship.
Page 16 of 32
For Proof Read only
Songklanakarin Journal of Science and Technology SJST-2018-0151.R2 Ratih
123456789101112131415161718192021222324252627282930313233343536373839404142434445464748495051525354555657585960

For Review Only
References
Aher, S., Dhumal, R., Mahadik, K., Ketolainen, J., & Paradkar, A. (2011). Effect of
cocrystallization techniques on compressional properties of caffeine/oxalic acid 2:1
cocrystal. Pharmaceutical Development and Technology, 18(June 2011), 1–6.
doi:10.3109/10837450.2011.618950
Aher, S., Dhumal, R., Mahadik, K., Paradkar, A., & York, P. (2010). Ultrasound assisted
cocrystallization from solution (USSC) containing a non-congruently soluble cocrystal
component pair: Caffeine/maleic acid. European Journal of Pharmaceutical Sciences,
41(5), 597–602. doi:10.1016/j.ejps.2010.08.012
Aitipamula, S., Wong, A. B. H., Chow, P. S., & Tan, R. B. H. (2014). Pharmaceutical Salts
of Haloperidol with Some Carboxylic Acids and Artificial Sweeteners: Hydrate
Formation, Polymorphism, and Physicochemical Properties. doi: 10.1021/cg500245e
Alatas, F., Ratih, H., & Soewandhi, S. N. (2015). Enhancement of solubility and dissolution
rate of telmisartan by telmisartan-oxalic acid co-crystal formation. International
Journal of Pharmacy and Pharmaceutical Sciences, 7(3), 423–426.
Almarsson, �rn, & Zaworotko, M. J. (2004). Crystal engineering of the composition of
pharmaceutical phases. Do pharmaceutical co-crystals represent a new path to
improved medicines? Chemical Communications, (17), 1889. doi:10.1039/b402150a
Amara, N., Ratsimba, B., Wilhelm, A. M., & Delmas, H. (2001). Crystallization of potash
alum: Effect of power ultrasound. Ultrasonics Sonochemistry, 8(3), 265–270.
doi:10.1016/S1350-4177(01)00087-6
Banga, S., Chawla, G., Varandani, D., Mehta, B. R., & Bansal, A. K. (2007). Modification
of the crystal habit of celecoxib for improved processability. The Journal of Pharmacy
Page 17 of 32
For Proof Read only
Songklanakarin Journal of Science and Technology SJST-2018-0151.R2 Ratih
123456789101112131415161718192021222324252627282930313233343536373839404142434445464748495051525354555657585960

For Review Only
and Pharmacology, 59(1), 29–39. doi:10.1211/jpp.59.1.0005
Basavoju, S., Boström, D., & Velaga, S. P. (2008). Indomethacin-saccharin cocrystal:
Design, synthesis and preliminary pharmaceutical characterization. Pharmaceutical
Research, 25(3), 530–541. doi:10.1007/s11095-007-9394-1
Chadha, R., Saini, A., Jain, D. S., & Venugopalan, P. (2012). Preparation and solid-state
characterization of three novel multicomponent solid forms of oxcarbazepine:
Improvement in solubility through saccharin cocrystal. Crystal Growth and Design,
12(8), 4211–4224. doi:10.1021/cg3007102
Chattoraj, S., Shi, L., Chen, M., Alhalaweh, A., Velaga, S., & Sun, C. C. (2014). Origin of
deteriorated crystal plasticity and compaction properties of a 1:1 cocrystal between
piroxicam and saccharin. Crystal Growth and Design, 14(8), 3864–3874.
doi:10.1021/cg500388s
Dhumal, R. S., Biradar, S. V., Paradkar, A. R., & York, P. (2008). Ultrasound assisted
engineering of lactose crystals. Pharmaceutical Research, 25(12), 2835–2844.
doi:10.1007/s11095-008-9653-9
Dinnebier, R. E., Sieger, P., Nar, H., Shankland, K., & David, W. I. F. (2000). Structural
characterization of three crystalline modifications of telmisartan by single crystal and
high-resolution X-ray powder diffraction. Journal of Pharmaceutical Sciences, 89(11),
1465–1479. doi:10.1002/1520-6017(200011)89:11<1465::AID-JPS9>3.0.CO;2-C
Goud, N. R., Suresh, K., Sanphui, P., & Nangia, A. (2012). Fast dissolving eutectic
compositions of curcumin. International Journal of Pharmaceutics, 439(1–2), 63–72.
doi:10.1016/j.ijpharm.2012.09.045
Guo, Z., Zhang, M., Li, H., Wang, J., & Kougoulos, E. (2005). Effect of ultrasound on anti-
Page 18 of 32
For Proof Read only
Songklanakarin Journal of Science and Technology SJST-2018-0151.R2 Ratih
123456789101112131415161718192021222324252627282930313233343536373839404142434445464748495051525354555657585960

For Review Only
solvent crystallization process. Journal of Crystal Growth, 273(3–4), 555–563.
doi:10.1016/j.jcrysgro.2004.09.049
Hiendrawan, S., Veriansyah, B., Widjojokusumo, E., Soewandhi, S. N., Wikarsa, S., &
Tjandrawinata, R. R. (2016). Physicochemical and mechanical properties of
paracetamol cocrystal with 5-nitroisophthalic acid. International Journal of
Pharmaceutics, 497(1–2), 106–113. doi:10.1016/j.ijpharm.2015.12.001
Jain, H., Khomane, K. S., & Bansal, A. K. (2014). Implication of microstructure on the
mechanical behaviour of an aspirin–paracetamol eutectic mixture. CrystEngComm,
16(36), 8471–8478. doi:10.1039/x0xx00000x
Joiris, E., Di Martino, P., Berneron, C., Guyot-Hermann, A.-M., & Guyot, J.-C. (1998).
Compressive Behaviour of Orthorhombic Paracetamol. Pharmaceutical Research,
15(7), 1122–1130. http://dx.doi.org/10.1023/A:1011954800246
Kaialy, W., Larhrib, H., Chikwanha, B., Shojaee, S., & Nokhodchi, A. (2014). An approach
to engineer paracetamol crystals by antisolvent crystallization technique in presence of
various additives for direct compression. International Journal of Pharmaceutics,
464(1–2), 53–64. doi:10.1016/j.ijpharm.2014.01.026
Kaialy, W., Larhrib, H., Ticehurst, M., & Nokhodchi, A. (2012). Influence of batch cooling
crystallization on mannitol physical properties and drug dispersion from dry powder
inhalers. Crystal Growth and Design, 12(6), 3006–3017. doi:10.1021/cg300224w
Karki, S., Friščić, T., Fabián, L., Laity, P. R., Day, G. M., & Jones, W. (2009). Improving
mechanical properties of crystalline solids by cocrystal formation: new compressible
forms of paracetamol. Advanced Materials, 21(38–39), 3905–3909.
doi:10.1002/adma.200900533
Page 19 of 32
For Proof Read only
Songklanakarin Journal of Science and Technology SJST-2018-0151.R2 Ratih
123456789101112131415161718192021222324252627282930313233343536373839404142434445464748495051525354555657585960

For Review Only
Li, H., Li, H., Guo, Z., & Liu, Y. (2006). The application of power ultrasound to reaction
crystallization. Ultrasonics Sonochemistry, 13(4), 359–363.
doi:10.1016/j.ultsonch.2006.01.002
Luque de Castro, M. D., & Priego-Capote, F. (2007). Ultrasound-assisted crystallization
(sonocrystallization). Ultrasonics Sonochemistry, 14(6), 717–724.
doi:10.1016/j.ultsonch.2006.12.004
Morissette, S. L., Almarsson, Ö., Peterson, M. L., Remenar, J. F., Read, M. J., Lemmo, A.
V., Gardner, C. R. (2004). High-throughput crystallization: Polymorphs, salts, co-
crystals and solvates of pharmaceutical solids. Advanced Drug Delivery Reviews,
56(3), 275–300. https://doi.org/10.1016/j.addr.2003.10.020
Perumalla, S. R., & Sun, C. C. (2014). Enabling tablet product development of 5-
fluorocytosine through integrated crystal and particle engineering. Journal of
Pharmaceutical Sciences, 103(4), 1126–1132. doi:10.1002/jps.23876
Qiao, N., Li, M., Schlindwein, W., Malek, N., Davies, A., & Trappitt, G. (2011).
Pharmaceutical cocrystals: An overview. International Journal of Pharmaceutics,
419(1–2), 1–11. doi:10.1016/j.ijpharm.2011.07.037
Ruecroft, G., Hipkiss, D., Ly, T., Maxted, N., & Cains, P. W. (2005). Sonocrystallization:
The use of ultrasound for improved industrial crystallization. Organic Process
Research and Development, 9(6), 923–932. doi:10.1021/op050109x
Schultheiss, N., & Newman, A. (2009). Pharmaceutical cocrystals and their
physicochemical properties. Crystal Growth and Design, 9(6), 2950–2967.
doi:10.1021/cg900129f
Sun, C. C., & Hou, H. (2008). Improving Mechanical Properties of Caffeine and Methyl
Page 20 of 32
For Proof Read only
Songklanakarin Journal of Science and Technology SJST-2018-0151.R2 Ratih
123456789101112131415161718192021222324252627282930313233343536373839404142434445464748495051525354555657585960

For Review Only
Gallate Crystals by Cocrystallization Improving Mechanical Properties of Caffeine
and Methyl Gallate Crystals by Cocrystallization. Crystal Growth & Design, (Scheme
1). doi:10.1021/cg700843s
Sun, C., & Grant, D. (2001). Effects of initial particle size on the tableting properties of L-
lysine monohydrochloride dihydrate powder. International Journal of Pharmaceutics,
215(1–2), 221–228. doi:10.1016/S0378-5173(00)00701-8
Trask, A. V, & Jones, W. (2005). Crystal Engineering of Organic Cocrystals by the Solid-
State Grinding Approach, 41–70. doi:10.1007/b100995
Page 21 of 32
For Proof Read only
Songklanakarin Journal of Science and Technology SJST-2018-0151.R2 Ratih
123456789101112131415161718192021222324252627282930313233343536373839404142434445464748495051525354555657585960

For Review Only
Figure 1 Chemical structure of telmisartan (TMS) and oxalic acid (OXA)
Page 22 of 32
For Proof Read only
Songklanakarin Journal of Science and Technology SJST-2018-0151.R2 Ratih
123456789101112131415161718192021222324252627282930313233343536373839404142434445464748495051525354555657585960
For Review Only
Figure 2 Powder X-ray diffractograms of TMS-OXA co-crystal prepared
by slow evaporation (SE) and ultrasound assisted cocrystallization
from solution (USSC) compared to its starting components
Page 23 of 32
For Proof Read only
Songklanakarin Journal of Science and Technology SJST-2018-0151.R2 Ratih
123456789101112131415161718192021222324252627282930313233343536373839404142434445464748495051525354555657585960

For Review Only
Figure 3 DSC thermograms of TMS-OXA co-crystal prepared by slow
evaporation (SE) and ultrasound assisted cocrystallization from
solution (USSC) compared to its starting components
Page 24 of 32
For Proof Read only
Songklanakarin Journal of Science and Technology SJST-2018-0151.R2 Ratih
123456789101112131415161718192021222324252627282930313233343536373839404142434445464748495051525354555657585960
For Review Only
Figure 4 FTIR spectra of TMS-OXA co-crystal SE and USSC compared to its starting
components
Page 25 of 32
For Proof Read only
Songklanakarin Journal of Science and Technology SJST-2018-0151.R2 Ratih
123456789101112131415161718192021222324252627282930313233343536373839404142434445464748495051525354555657585960

For Review Only
Figure 5 SEM images of (a) TMS, (b) OXA, (c) TMS-OXA co-crystal SE, and
(d) TMS-OXA co-crystal USSC
Page 26 of 32
For Proof Read only
Songklanakarin Journal of Science and Technology SJST-2018-0151.R2 Ratih
123456789101112131415161718192021222324252627282930313233343536373839404142434445464748495051525354555657585960

For Review Only
Figure 6 Tabletability profiles of TMS, TMS-OXA co-crystal SE
and USSC
0
0.5
1
1.5
2
2.5
3
0 5 10 15 20 25 30
Tensile Strength (MPa)
Compaction Pressure (KN)
TMS TMS-OXA Co-Crystal (SE) TMS-OXA Co-Crystal (USSC)
Page 27 of 32
For Proof Read only
Songklanakarin Journal of Science and Technology SJST-2018-0151.R2 Ratih
123456789101112131415161718192021222324252627282930313233343536373839404142434445464748495051525354555657585960

For Review Only
Figure 7 Tablet overview of a) TMS (capping), b) TMS-OXA co-crystal SE,
c) TMS-OXA co-crystal USSC in compaction force 19.98 kN
Page 28 of 32
For Proof Read only
Songklanakarin Journal of Science and Technology SJST-2018-0151.R2 Ratih
123456789101112131415161718192021222324252627282930313233343536373839404142434445464748495051525354555657585960

For Review Only
Figure 8 Elastic recovery of TMS, TMS-OXA co-crystal SE and USSC
0
0.5
1
1.5
2
2.5
3
0 5 10 15 20 25 30 35
Ela
stic
Re
cov
ery
(%
)
Compaction Pressure (kN)
TMS TMS-OXA Co-crystal SE TMS-OXA Co-crystal USSC
Page 29 of 32
For Proof Read only
Songklanakarin Journal of Science and Technology SJST-2018-0151.R2 Ratih
123456789101112131415161718192021222324252627282930313233343536373839404142434445464748495051525354555657585960

For Review Only
Figure 9 Dissolution profile of TMS, TMS-OXA co-crystal SE and USSC in
phosphate buffer pH 7.5
0
10
20
30
40
50
60
70
80
90
100
0 10 20 30 40 50 60
% Drug Release
Time (min)
TMS TMS-OXA SE TMS-OXA USSC
Page 30 of 32
For Proof Read only
Songklanakarin Journal of Science and Technology SJST-2018-0151.R2 Ratih
123456789101112131415161718192021222324252627282930313233343536373839404142434445464748495051525354555657585960

For Review Only
Table 1. Physical Properties of TMS, TMS-OXA Co-Crystal (SE and USSC)
Sample Tapped Density True Density Carr
Index (%)
Hausner
Ratio
Flow
Character
TMS 0.223 ± 0.003 1.394 ± 0.004 36.4 ± 2.53 1.57 ± 0.31 Poor
TMS-OXA SE 0.754 ± 0.007 1.425 ± 0.007 13.8 ± 2.19 1.16 ± 0.99 Good
TMS-OXA USSC 0.521 ± 0.006 1.755 ± 0.008 17.9±2.25 1.21±0.12 Fair
Page 31 of 32
For Proof Read only
Songklanakarin Journal of Science and Technology SJST-2018-0151.R2 Ratih
123456789101112131415161718192021222324252627282930313233343536373839404142434445464748495051525354555657585960

For Review Only
Table 2. Particle Size Distribution for TMS, TMS-OXA Co-crystal (SE and USSC)
Particle Size
Distribution
TMS TMS-OXA (SE)
Co-crystal
TMS-OXA (USSC)
Co-crystal
d10 (µm) 0.928 1.307 0.493
d50 (µm) 4.180 5.852 1.598
d90 (µm) 11.24 11.8 2.185
Page 32 of 32
For Proof Read only
Songklanakarin Journal of Science and Technology SJST-2018-0151.R2 Ratih
123456789101112131415161718192021222324252627282930313233343536373839404142434445464748495051525354555657585960
Related Documents