ASX announcement 22 August 2018 Highlights An updated Mineral Resource estimate reported in accordance with the 2012 JORC Code and Guidelines has been completed for the Carey’s Well deposit at Poochera in South Australia. A resource increase from 16.3 million tonnes to 23.9 million tonnes of “bright white” kaolinised granite is estimated using an ISO Brightness R457 cut‐off of 75 for minus 45 micron kaolin product. The 23.9 million tonnes of in situ “bright white” kaolinised granite will yield 12.7 million tonnes of minus 45 micron quality kaolin product. Planning and permitting for a large‐scale bulk sampling program for processing and end‐user approvals has commenced. Results from the HPA testing for a potential 4N HPA product are expected in August/September. Summary Andromeda Metals Limited (ASX Code: ADN) is pleased to report an updated Mineral Resource estimate reported in accordance with the 2012 JORC Code and Guidelines for the Carey’s Well kaolin deposit located on EL 5814 near Poochera on the west coast of South Australia’s Eyre Peninsula. The Carey’s Well kaolin resource is one of a number of kaolin (+halloysite) prospects which are included under a Joint Venture agreement in place with Minotaur Exploration Limited (ASX: MEP). This updated resource estimate, replaces previous estimates by Minotaur in 2009 and 2012 reported under the 2004 JORC Code. A summary of the new Mineral Resource is given below in Table 1, and a full report prepared by independent geological consultancy group H&S Consultants Pty Ltd is included as an Appendix to this release. Table 1 – New Mineral Resource Category Kaolinised Granite (Mt) ‐45µm Recovery % Measured 8.7 52.8 Indicated 10.9 51.9 Inferred 4.3 56.9 Total 23.9 53.1 Andromeda Metals Limited ABN: 75 061 503 375 Corporate details: ASX Code: ADN Cash: $1.737 million Issued Capital: 1,079,361,560 ordinary shares 486,280,451 ADNOB options 2,476,507 unlisted options Directors: Rhod Grivas Non-Executive Chairman James Marsh Managing Director Nick Harding Executive Director and Company Secretary Andrew Shearer Non-Executive Director Contact details: 69 King William Road, Unley, South Australia 5061 PO Box 1210 Unley BC SA 5061 Tel: +61 8 8271 0600 Fax: +61 8 8271 0033 [email protected] www.andromet.com.au Mineral Resource update for the Poochera Kaolin Project For personal use only

Welcome message from author
This document is posted to help you gain knowledge. Please leave a comment to let me know what you think about it! Share it to your friends and learn new things together.
Transcript

ASX announcement 22 August 2018
Highlights
An updated Mineral Resource estimate reported in accordance with the 2012
JORC Code and Guidelines has been completed for the Carey’s Well deposit at
Poochera in South Australia.
A resource increase from 16.3 million tonnes to 23.9 million tonnes of “bright
white” kaolinised granite is estimated using an ISO Brightness R457 cut‐off of
75 for minus 45 micron kaolin product.
The 23.9 million tonnes of in situ “bright white” kaolinised granite will yield
12.7 million tonnes of minus 45 micron quality kaolin product.
Planning and permitting for a large‐scale bulk sampling program for
processing and end‐user approvals has commenced.
Results from the HPA testing for a potential 4N HPA product are expected in
August/September.
Summary
Andromeda Metals Limited (ASX Code: ADN) is pleased to report an updated
Mineral Resource estimate reported in accordance with the 2012 JORC Code and
Guidelines for the Carey’s Well kaolin deposit located on EL 5814 near Poochera
on the west coast of South Australia’s Eyre Peninsula.
The Carey’s Well kaolin resource is one of a number of kaolin (+halloysite)
prospects which are included under a Joint Venture agreement in place with
Minotaur Exploration Limited (ASX: MEP). This updated resource estimate,
replaces previous estimates by Minotaur in 2009 and 2012 reported under the
2004 JORC Code.
A summary of the new Mineral Resource is given below in Table 1, and a full
report prepared by independent geological consultancy group H&S Consultants
Pty Ltd is included as an Appendix to this release.
Table 1 – New Mineral Resource
Category Kaolinised Granite (Mt) ‐45µm Recovery %
Measured 8.7 52.8
Indicated 10.9 51.9
Inferred 4.3 56.9
Total 23.9 53.1
Andromeda Metals Limited
ABN: 75 061 503 375
Corporate details:
ASX Code: ADN
Cash: $1.737 million
Issued Capital:
1,079,361,560 ordinary shares
486,280,451 ADNOB options
2,476,507 unlisted options
Directors:
Rhod Grivas
Non-Executive Chairman
James Marsh
Managing Director
Nick Harding
Executive Director and
Company Secretary
Andrew Shearer
Non-Executive Director
Contact details:
69 King William Road,
Unley, South Australia 5061
PO Box 1210
Unley BC SA 5061
Tel: +61 8 8271 0600
Fax: +61 8 8271 0033
www.andromet.com.au
Mineral Resource update for the Poochera Kaolin Project
For
per
sona
l use
onl
y

Drill – Discover – Develop P a g e | 2
The estimate of 23.9Mt of kaolinised granite, with minimum raw kaolin ISO brightness (R457) of 75, includes
8.7Mt in Measured, 10.9Mt in Indicated, and 4.3Mt in Inferred for the resource categories. This material will
yield 12.7Mt of “bright white” kaolin product based on an average kaolin grade of 53.1% with the remainder
being largely residual quartz from the weathering process.
Previous Estimate of Mineral Resources
A previous resource estimate (see Table 2 below) for the Carey’s Well kaolin deposit (Minotaur Exploration ASX
release of 8 February, 2012) outlined a Measured Resource of 16.3 million tonnes within a total Mineral Resource
of 20 million tonnes of “bright white” kaolinised granite. The estimation was based on infill drilling during 2011
over an area of approximately 96 hectares with key commercial considerations being raw ISO brightness values
and iron and titanium content. The 16.3 million tonnes of “bright white” (>75 R457 raw brightness) kaolinised
granite was estimated to yield 8.0 million tonnes of ‐45 micron kaolin. This Measured Resource was subdivided
into a number of bodies of differing brightness categories based on ISO brightness values as below.
Ultra‐high brightness kaolin with ISO Brightness >84 and very low iron and titanium content.
High brightness kaolin with ISO Brightness >80 but <84 with low iron and titanium content.
Moderate brightness kaolin with ISO Brightness >75 but <80 with low iron and titanium content.
Table 2– Previous Carey’s Well Mineral Resource Estimate (JORC 2004)
Brightness Category
ISO Brightness
R457
JORC Resource Category
Kaolinised Granite (Mt)
Average 45µm kaolin
(%)
45µm kaolin (Mt)
AVE Fe (%)
AVE Ti(%)
Ultra‐High >84 Measured 6.9 59 4.1 0.28 0.21
High >80 <84 Measured 4.9 54 2.6 0.33 0.23
Moderate >75 <80 Measured 4.5 29 1.3 0.42 0.19
Total Bright White
>75 Measured 16.3 49 8.0 0.32 0.21
Refer Minotaur Exploration ASX announcement 8 February 2012.
The 2018 estimation is a significant increase in total kaolinised granite (23.9 Mt vs 20 Mt) compared to the
2012 estimation. Applying the minus 45 micron recovery factor to the updated Mineral Resource, the
following contained kaolin estimates were determined as displayed in Table 3 below:
Table 3 – Aug 2018 Estimate of the Carey’s Well Mineral Resource (JORC 2012)
Category Mt ISO Brightness
R457 PSD
‐2µm % Al2O3
% Fe2O3
% SiO2
% TiO2
%
Measured 4.6 82.5 68.8 37.0 0.58 47.5 0.41
Indicated 5.7 82.3 68.8 36.8 0.58 47.8 0.44
Inferred 2.4 84.0 68.6 37.5 0.49 47.0 0.54
Total 12.7 82.7 68.7 37.0 0.56 47.5 0.45
The contained kaolin of 10.3 Mt within the Measured and Indicated Resource categories is an increase of
2.3Mt over the previous 2012 estimation of 8.0Mt.
James Marsh
Managing Director
For
per
sona
l use
onl
y

Drill – Discover – Develop P a g e | 3
Appendix ‐ Resource estimation report prepared by independent geological consultancy group H&S Consultants Pty Ltd
Updated Resource Estimates for the Carey’s Well Kaolin Deposit, SA
H&S Consultants Pty Ltd (“H&SC”) was commissioned by Andromeda Metals Limited (“ADN”) to
complete updated Mineral Resource estimates for the Carey’s Well Kaolin Deposit at Poochera in
South Australia, 130kms south east of Ceduna. Development of the project is a joint venture between
ADN and Minotaur Exploration (“MEP”). The target commodity is kaolin with the capacity to be
processed to give high purity alumina (“HPA”) with a second stream of raw feed material as direct
shipping ore. The estimates have been reported in accordance with the 2012 JORC Code and
Guidelines.
The deposit comprises flat‐lying kaolin, between 8 and 24m below surface, generated from extensive
weathering of a granite. The current estimates cover an area of roughly 1.3km by 1km with a kaolin
thickness ranging from 3m to 28m with the deposit open to the north east and south/south east.
Overburden consists of a thin soil layer overlying calcrete which in turn overlies a mixed sequence
of alluvial clays, sands and gravels. The top of the kaolin is silicified and the base of silicification
marks the top of the kaolin resource whilst the change in weathering intensity marks the base of the
kaolin resource.
MEP has supplied the drillhole database for the deposit, which H&SC has accepted in good faith as
an accurate, reliable and complete representation of the available data. The responsibility for quality
control for the 2008 and 2011 drilling resides solely with MEP. The 2013 drilling has been used for
geological interpretation only and for check modelling. H&SC performed very limited validation
of the data and noted no sample recovery data was available along with limited QAQC data and
possible issues with the density data. However, the drillhole database for Poochera is satisfactory
for resource estimation purposes.
A brief review of the limited QAQC procedures and outcomes indicates no obvious issues with the
sampling or analysis data.
The new resource estimates for Carey’s Well are based almost entirely on the MEP 2011 drilling (153
holes for 3,794.6m) on approximately 100m centres. Additionally, 6 MEP Calweld large diameter
drillholes completed in 2008 have been included along with geological input from 27 holes drilled
in 2013 by Adelaide Brighton (“ABC”) for 882m. All drillholes are vertical intersecting the flat‐lying
mineralisation at right angles and nearly all holes intersected upper (hangingwall) and lower
(footwall) contacts to the mineralisation.
H&SC completed a new geological interpretation on a combination of 50m and 100m spaced E‐W
sections for the deposit area under investigation. This work used the drillhole logging of kaolin,
assayed samples and geological sense resulting in the creation of 3D surfaces for the base of soil, the
base of calcrete, the top and base of kaolin with the surfaces snapped to drillholes. It is apparent
that mineralisation forms both sharp and gradational contacts with the decomposed granite and the
overlying alluvial sediments.
A total of 214 five metre composites were extracted from the drillhole database constrained by the
kaolin wireframes. Grade interpolation was completed for the minus45 micron recovered material,
along with Al2O3, Fe2O3, SiO2, TiO2, R457 (reflectance ‐ ISO‐brightness) and PDS2 micron particle
For
per
sona
l use
onl
y

Drill – Discover – Develop P a g e | 4
size data, all obtained on the minus45 micron material. Statistical analysis of the composite data
indicated nominally normal distributions, reasonably well‐structured data and very low coefficients
of variation, all of which resulted in no top cuts being applied. Variography showed weak to
reasonable continuity for all elements.
Ordinary Kriging was applied for the grade interpolation using the H&SC in‐house GS3 modelling
software. A single search domain was used for the element grade interpolation reflecting the
reasonable overall consistency in strike and dip of the mineralisation. Block size was 50m by 50m
by 5m (X, Y & Z) with 12.5m by 12.5m by 1.25m sub‐blocking. A 3 pass search strategy was
employed with an initial Measured Resource search (Pass 1) of 150m by 150m by 7.5m with a
minimum number of 12 data and 4 octants. This was expanded in two stages to an Indicated
Resource (Pass 2) and Inferred Resource (Pass 3) with a maximum search of 250m by 250m by 12.5m
with a minimum of 8 data and 4 octants for Indicated and a minimum 4 data and 2 octants for
Inferred. Modelling was unconstrained on the lateral peripheries of the deposit with the maximum
extrapolation being approximately 200m. The only hard boundaries were the kaolin mineral
bounding wireframes.
Eight samples were selected to represent a range of kaolinised granite types. The selected samples
had been in open storage for over 2 years and were considered by MEP to be thoroughly dried. Dry
samples were accurately weighed. Each sample was then completely sealed by spraying with artist’s
epoxy sealant. Several coats of spray were applied to ensure the sample was completely sealed.
Water displacement of the sample was measured by carefully lowering each sample into a modified
clear plastic cylinder and collecting the displaced water i.e. a measured volume. Bulk density was
then calculated based on dry weight and volume of the sample. The measured bulk densities were
reasonably constant ranging from 1.63 to 1.81t/m3. The average bulk density of dry Carey’s Well
kaolinised granite is determined at 1.7t/m3. This value has been used as a default density value for
subsequent resource estimation. The default density value is considered reasonable, possibly
slightly conservative, although it is uncertain where the samples are from and how representative
of the mineralisation they are. The number of samples is considered small and would benefit from
more data.
Block model validation consisted of a visual comparison of block grades with drillhole assays and
composite values, a review of the summary statistics for the block grades and composite values,
including analyses of cumulative frequency curves for each element. No significant issues were
noted. A check model for a sub‐area of the deposit, based on the ABC 2013 drilling using calculated
kaolin grades compared to minus45 micron material, resulted in a <6% difference in estimated
amount of contained kaolin with the H&SC model. Comparison of the H&SC model with the MEP
2012 resource estimate shows no major difference in the estimated amount of contained kaolin
despite the increase in sophistication of the H&SC modelling method.
Reporting of the updated Mineral Resource estimates for the Carey’s Well deposit uses block
centroids with interpolated grade within the two kaolin wireframes for an ISO‐brightness (R457 nm)
cut off of 75 (on a 0‐100 scale as per the MEP 2012 estimate). Another spatial constraint is blocks
with centroids inside the 2009 MEP Inferred Resource outline (which has a very minor adjustment
to accommodate the outcomes of the 2011 drilling).
ADN has informed H&SC that they intend to selectively mine the deposit in an open pit scenario.
The resource estimates have been modelled and classified on this assumption. The resource
estimates are classified as Measured, Indicated and Inferred. The classification of the resources is
For
per
sona
l use
onl
y
Drill – Discover – Develop P a g e | 5
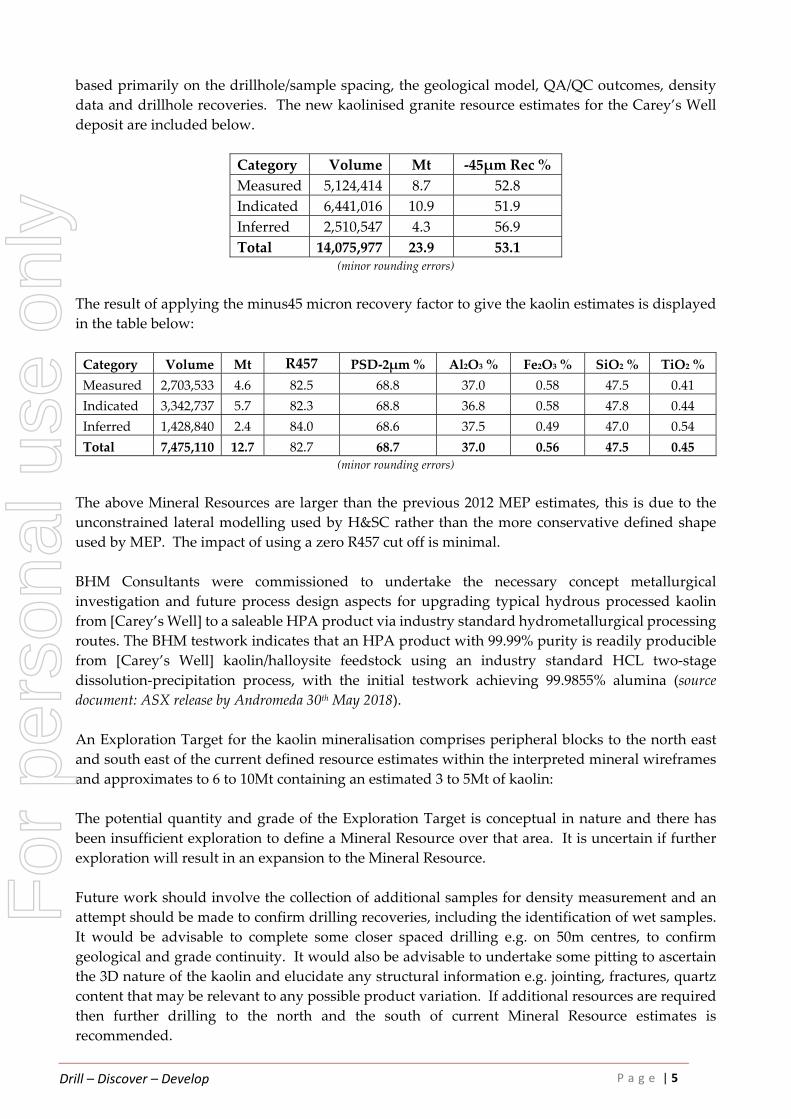
based primarily on the drillhole/sample spacing, the geological model, QA/QC outcomes, density
data and drillhole recoveries. The new kaolinised granite resource estimates for the Carey’s Well
deposit are included below.
Category Volume Mt ‐45μm Rec %
Measured 5,124,414 8.7 52.8
Indicated 6,441,016 10.9 51.9
Inferred 2,510,547 4.3 56.9
Total 14,075,977 23.9 53.1 (minor rounding errors)
The result of applying the minus45 micron recovery factor to give the kaolin estimates is displayed
in the table below:
Category Volume Mt R457 PSD‐2μm % Al2O3 % Fe2O3 % SiO2 % TiO2 %
Measured 2,703,533 4.6 82.5 68.8 37.0 0.58 47.5 0.41
Indicated 3,342,737 5.7 82.3 68.8 36.8 0.58 47.8 0.44
Inferred 1,428,840 2.4 84.0 68.6 37.5 0.49 47.0 0.54
Total 7,475,110 12.7 82.7 68.7 37.0 0.56 47.5 0.45
(minor rounding errors)
The above Mineral Resources are larger than the previous 2012 MEP estimates, this is due to the
unconstrained lateral modelling used by H&SC rather than the more conservative defined shape
used by MEP. The impact of using a zero R457 cut off is minimal.
BHM Consultants were commissioned to undertake the necessary concept metallurgical
investigation and future process design aspects for upgrading typical hydrous processed kaolin
from [Carey’s Well] to a saleable HPA product via industry standard hydrometallurgical processing
routes. The BHM testwork indicates that an HPA product with 99.99% purity is readily producible
from [Carey’s Well] kaolin/halloysite feedstock using an industry standard HCL two‐stage
dissolution‐precipitation process, with the initial testwork achieving 99.9855% alumina (source
document: ASX release by Andromeda 30th May 2018).
An Exploration Target for the kaolin mineralisation comprises peripheral blocks to the north east
and south east of the current defined resource estimates within the interpreted mineral wireframes
and approximates to 6 to 10Mt containing an estimated 3 to 5Mt of kaolin:
The potential quantity and grade of the Exploration Target is conceptual in nature and there has
been insufficient exploration to define a Mineral Resource over that area. It is uncertain if further
exploration will result in an expansion to the Mineral Resource.
Future work should involve the collection of additional samples for density measurement and an
attempt should be made to confirm drilling recoveries, including the identification of wet samples.
It would be advisable to complete some closer spaced drilling e.g. on 50m centres, to confirm
geological and grade continuity. It would also be advisable to undertake some pitting to ascertain
the 3D nature of the kaolin and elucidate any structural information e.g. jointing, fractures, quartz
content that may be relevant to any possible product variation. If additional resources are required
then further drilling to the north and the south of current Mineral Resource estimates is
recommended.
For
per
sona
l use
onl
y

Drill – Discover – Develop P a g e | 6
A series of figures and tables appear in Appendix 1.
A brief QAQC report is included in Appendix 2.
Simon Tear Director and Consulting Geologist
H&S Consultants Pty Ltd
The data in this report that relates to the Minotaur Exploration Results for the Carey’s Well Kaolin Project is
based on information evaluated by Dr Antonio Belperio who is a fellow of the Australasian Institute of Mining
and Metallurgy, an executive director of Minotaur and part‐time consultant to Andromeda. Dr Belperio has
sufficient experience relevant to the style of mineralisation and type of deposit under consideration and to the
activity which he is undertaking to qualify as a Competent Person as defined in the 2012 Edition of the
Australasian Code for Reporting of Exploration Results, Mineral Resources and Ore Reserves (the “JORC
Code”). Dr Belperio consents to inclusion in this document of the information in the form and context in
which it appears.
The data in this report that relates to Mineral Resource Estimates including Exploration Target for the Carey’s
Well Kaolin Project is based on information evaluated by Mr Simon Tear who is a Member of The Australasian
Institute of Mining and Metallurgy (MAusIMM) and who has sufficient experience relevant to the style of
mineralisation and type of deposit under consideration and to the activity which he is undertaking to qualify
as a Competent Person as defined in the 2012 Edition of the Australasian Code for Reporting of Exploration
Results, Mineral Resources and Ore Reserves (the “JORC Code”). Mr Tear is a Director of H&S Consultants
Pty Ltd and he consents to the inclusion in the report of the Mineral Resource in the form and context in which
they appear.
Some of the data in this report that relates to Product Specification for the Carey’s Well Kaolin Project which
is based on information evaluated by Mr Graham Lee who is a Fellow of The Australasian Institute of Mining
and Metallurgy (FAusIMM) and who has sufficient experience relevant to the style of mineralisation and type
of deposit under consideration and to the activity which he is undertaking to qualify as a Competent Person as
defined in the 2012 Edition of the Australasian Code for Reporting of Exploration Results, Mineral Resources
and Ore Reserves (the “JORC Code”). Mr Lee is an Associate of H&S Consultants Pty Ltd and he consents
to the inclusion in the report of the Mineral Resource in the form and context in which they appear.
For
per
sona
l use
onl
y

Drill – Discover – Develop P a g e | 7
Appendix 1
The map below shows the location of the Poochera Project in South Australia.
Poochera Kaolin Project Location Map
(source: MEP)
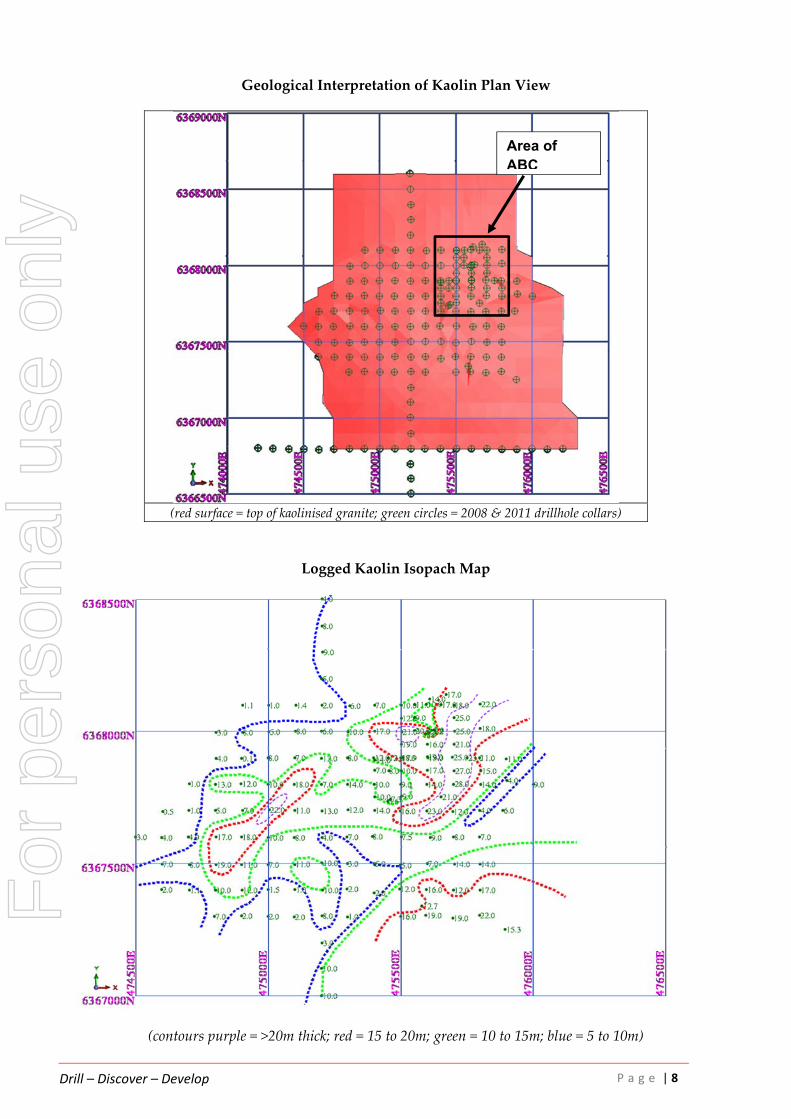
A plan view of the geological interpretation for the kaolin body is included below. Definition of the
kaolin material is based on the “KG” logged geology code in combination with composite samples
with assays. The limitation of the 1m sample interval from the aircore drilling and the gradational
boundaries associated with the granite weathering meant that no other geological domains within
the kaolin were used as either hard or soft boundaries.
A second image below shows the isopach map for the logged kaolin from all drilling. It shows a
thicker central zone with an approximate elongate strike direction of ENE. A second zone of
increased thickness occurs in the SE corner of the drilling grid.
The map also shows areas of where the deposit could be considered open ie to the NE and SE.
For
per
sona
l use
onl
y
Drill – Discover – Develop P a g e | 8
Geological Interpretation of Kaolin Plan View
(red surface = top of kaolinised granite; green circles = 2008 & 2011 drillhole collars)
Logged Kaolin Isopach Map
(contours purple = >20m thick; red = 15 to 20m; green = 10 to 15m; blue = 5 to 10m)
Area of ABC
For
per
sona
l use
onl
y
Drill – Discover – Develop P a g e | 9
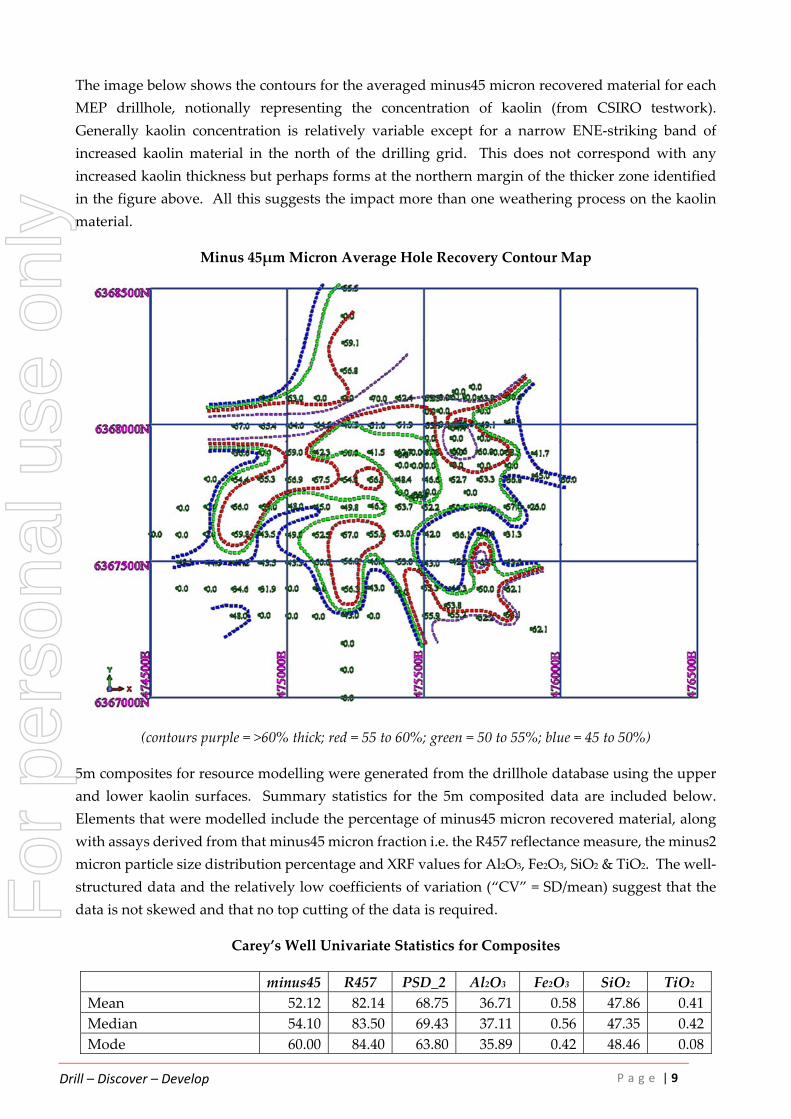
The image below shows the contours for the averaged minus45 micron recovered material for each
MEP drillhole, notionally representing the concentration of kaolin (from CSIRO testwork).
Generally kaolin concentration is relatively variable except for a narrow ENE‐striking band of
increased kaolin material in the north of the drilling grid. This does not correspond with any
increased kaolin thickness but perhaps forms at the northern margin of the thicker zone identified
in the figure above. All this suggests the impact more than one weathering process on the kaolin
material.
Minus 45μm Micron Average Hole Recovery Contour Map
(contours purple = >60% thick; red = 55 to 60%; green = 50 to 55%; blue = 45 to 50%)
5m composites for resource modelling were generated from the drillhole database using the upper
and lower kaolin surfaces. Summary statistics for the 5m composited data are included below.
Elements that were modelled include the percentage of minus45 micron recovered material, along
with assays derived from that minus45 micron fraction i.e. the R457 reflectance measure, the minus2
micron particle size distribution percentage and XRF values for Al2O3, Fe2O3, SiO2 & TiO2. The well‐
structured data and the relatively low coefficients of variation (“CV” = SD/mean) suggest that the
data is not skewed and that no top cutting of the data is required.
Carey’s Well Univariate Statistics for Composites
minus45 R457 PSD_2 Al2O3 Fe2O3 SiO2 TiO2
Mean 52.12 82.14 68.75 36.71 0.58 47.86 0.41
Median 54.10 83.50 69.43 37.11 0.56 47.35 0.42
Mode 60.00 84.40 63.80 35.89 0.42 48.46 0.08
For
per
sona
l use
onl
y

Drill – Discover – Develop P a g e | 10
Standard Deviation (SD) 9.54 4.33 7.56 1.87 0.21 2.18 0.33
Sample Variance 91.01 18.74 57.13 3.49 0.04 4.76 0.11
Coeff of Variation (CV) 0.18 0.05 0.11 0.05 0.37 0.05 0.80
Kurtosis ‐0.35 1.19 19.83 8.77 3.57 11.28 3.91
Skewness ‐0.56 ‐1.09 ‐2.65 ‐2.45 0.96 2.73 1.35
Range 46 24.30 74.98 12.76 1.57 17.07 2.18
Minimum 25 65.50 7.02 26.36 0.16 44.61 0.05
Maximum 71 89.80 82 39.11 1.73 61.68 2.23
Count 214 214 214 213 213 213 213
(one sample had no XRF analysis)
An example of the Poochera composite distribution for the minus45 micron material is included
below. It is worth noting that MEP has stated that CSIRO studies have indicated that nearly all the
minus45 micron material is kaolin.
Carey’s Well Composite Data Distribution minus 45μm Material Plan
Of interest is the higher grades observed at the south eastern and north eastern edges of the deposit
indicating the deposit is open in both of those areas.
The drillhole sample compositing has generated a limitation on the ability to analyse any subtleties
in the chemical/mineralogical variation of the kaolin. As a result, variography is considered only
474600 474800 475000 475200 475400 475600 475800 476000
6367200
6367400
6367600
6367800
6368000
6368200
6368400
Plan Plot of minus45
RLs: 69.0 to 124.0
East
No
rth
0.00 - 35.00
35.00 - 45.00
45.00 - 55.00
55.00 - 60.00
60.00 - 65.00
65.00 - 75.00
minus45 Range
Point Data
UNIVARIATE STATISTICS
Mean: 52.11942
Variance: 90.58690
CV: 0.18261
Minimum: 25.00
Q1: 45.00
Median: 54.00
Q3: 59.200
Maximum: 71.00
No. of Data: 214
For
per
sona
l use
onl
y

Drill – Discover – Develop P a g e | 11
modest mainly due to a lack of data that makes it difficult to delineate structure in the data and
hence inform on grade continuity.
The XY variogram maps for the minus45 micron material, the R457 reflectance, Al2O3 and SiO2 are
included below. There are strong indications of an E‐W grade continuity direction. The reason for
this direction is uncertain but may be a function of an E‐W fault that has allowed for more
intense/penetrative weathering of the granite. It may also be due to a fundamental granite foliation
or some other primary mineralogical variation in granite composition.
Example of Variogram Maps for 5m Composites
An example of variograms and the variogram model for the minus45 micron material are included
below. The impact of the 5m compositing and lack of structure is evident in the downhole
variogram. The Variogram model is a flat ellipse slightly rotated north of east.
For
per
sona
l use
onl
y

Drill – Discover – Develop P a g e | 12
Example of Variograms for the minus 45μm Material
Downhole E‐W Direction 1
N‐S Direction 2 Variogram Model (plan view)
Details of the search parameters for the resource modelling are included in the table below.
Search Parameters for Grade Interpolation
Pass 1 Pass 2 Pass 3 Rotations
X 150 250 250 0
Y 150 250 250 0
Z 7.5 12.5 12.5 0
Min Data 8 8 4
Max Data 32 32 32
Min Octants 4 4 2
(trigonometrical convention for rotations)
Estimation results for the pass categories for the Carey’s Well Deposit are reported below for block
centroids between the upper and lower kaolin wireframe surfaces at a 75 R457 reflectance cut off
grade constrained by the MEP 2009 Inferred Resource outline (contains a minor modification in the
SW corner to take into account the 2011 drilling outcomes).
0 5 10 150
0.2
0.4
0.6
0.8
1.0
1.2
Variogram: minus45_azm0pln90
lag distance (h)
Variogram Y(h)
116
51
22
5
0 117 234 351 468 585 702 8190
0.2
0.4
0.6
0.8
1.0
1.2
Variogram: minus45_azm0pln0
lag distance (h)
Variogram Y(h)
557
398
230
33
29
0 114 228 342 456 570 684 7980
0.2
0.4
0.6
0.8
1.0
1.2
Variogram: minus45_azm90pln0
lag distance (h)
Variogram Y(h)
556
550575
221
200
10
For
per
sona
l use
onl
y

Drill – Discover – Develop P a g e | 13
Carey’s Well Raw Feed Global Estimation Results
Category Volume Tonnes ‐45μm Rec %
Pass 1 5,124,414 8,711,504 52.8
Pass 2 6,441,016 10,949,727 51.9
Pass 3 2,510,547 4,267,930 56.9
Total 14,075,977 23,929,160 53.1 (use of significant figures does not imply accuracy)
If the minus45 micron grade is applied as a recovery factor (volume adjustment factor) and assuming
that all of that that material is kaolin, the following kaolin estimate is generated.
Carey’s Well Kaolin Estimation Results
Category Volume Tonnes R457 PSD‐2μm % Al2O3 % Fe2O3 % SiO2 % TiO2 %
Pass 1 2,703,533 4,596,007 82.5 68.8 37.0 0.58 47.5 0.41
Pass 2 3,342,737 5,682,652 82.3 68.8 36.8 0.58 47.8 0.44
Pass 3 1,428,840 2,429,029 84.0 68.6 37.5 0.49 47.0 0.54
Total 7,475,110 12,707,688 82.7 68.7 37.0 0.56 47.5 0.45
(use of significant figures does not imply accuracy)
An example of the block grade distribution for the minus45 micron material is included below. The
blocks shown represent the top of the kaolin deposit.
For
per
sona
l use
onl
y

Drill – Discover – Develop P a g e | 14
Carey’s Well minus 45μm Material Block Grade Distribution
(brown line = MEP 2009 Inferred Resource outline)
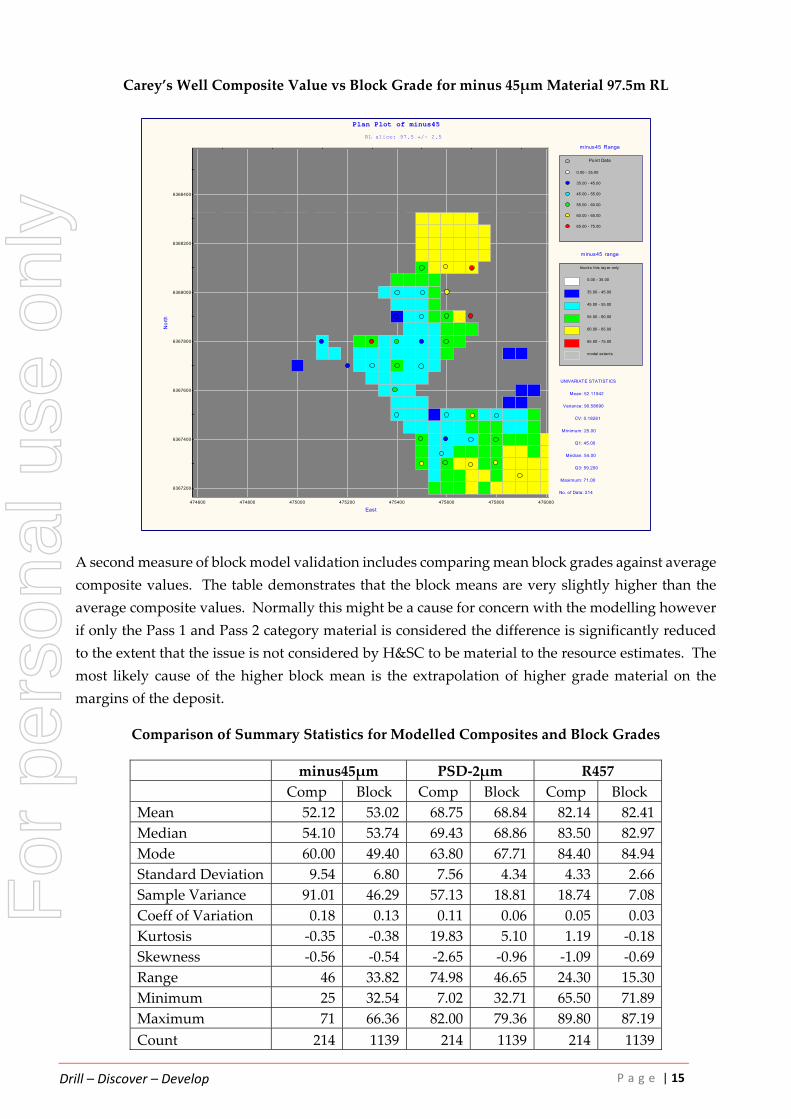
Validation of the H&SC block model has involved a visual comparison of block grades with drillhole
assay values. No issues were noted. An example of composite value versus block grade for the
97.5mRL is included below.
For
per
sona
l use
onl
y
Drill – Discover – Develop P a g e | 15
Carey’s Well Composite Value vs Block Grade for minus 45μm Material 97.5m RL
A second measure of block model validation includes comparing mean block grades against average
composite values. The table demonstrates that the block means are very slightly higher than the
average composite values. Normally this might be a cause for concern with the modelling however
if only the Pass 1 and Pass 2 category material is considered the difference is significantly reduced
to the extent that the issue is not considered by H&SC to be material to the resource estimates. The
most likely cause of the higher block mean is the extrapolation of higher grade material on the
margins of the deposit.
Comparison of Summary Statistics for Modelled Composites and Block Grades
minus45μm PSD‐2μm R457
Comp Block Comp Block Comp Block
Mean 52.12 53.02 68.75 68.84 82.14 82.41
Median 54.10 53.74 69.43 68.86 83.50 82.97
Mode 60.00 49.40 63.80 67.71 84.40 84.94
Standard Deviation 9.54 6.80 7.56 4.34 4.33 2.66
Sample Variance 91.01 46.29 57.13 18.81 18.74 7.08
Coeff of Variation 0.18 0.13 0.11 0.06 0.05 0.03
Kurtosis ‐0.35 ‐0.38 19.83 5.10 1.19 ‐0.18
Skewness ‐0.56 ‐0.54 ‐2.65 ‐0.96 ‐1.09 ‐0.69
Range 46 33.82 74.98 46.65 24.30 15.30
Minimum 25 32.54 7.02 32.71 65.50 71.89
Maximum 71 66.36 82.00 79.36 89.80 87.19
Count 214 1139 214 1139 214 1139
0.00 - 35.00
35.00 - 45.00
45.00 - 55.00
55.00 - 60.00
60.00 - 65.00
65.00 - 75.00
model extents
minus45 range
blocks this lay er only
474600 474800 475000 475200 475400 475600 475800 476000
6367200
6367400
6367600
6367800
6368000
6368200
6368400
Plan Plot of minus45
RL slice: 97.5 +/- 2.5
East
No
rth
0.00 - 35.00
35.00 - 45.00
45.00 - 55.00
55.00 - 60.00
60.00 - 65.00
65.00 - 75.00
minus45 Range
Point Data
UNIVARIATE STATISTICS
Mean: 52.11942
Variance: 90.58690
CV: 0.18261
Minimum: 25.00
Q1: 45.00
Median: 54.00
Q3: 59.200
Maximum: 71.00
No. of Data: 214
For
per
sona
l use
onl
y
Drill – Discover – Develop P a g e | 16
Al2O3 Fe2O3 TiO2 SiO2
Comp Block Comp Block Comp Block Comp Block
Mean 36.71 36.83 0.58 0.57 0.41 0.43 47.86 47.72
Median 37.11 37.09 0.56 0.59 0.42 0.46 47.35 47.29
Mode 35.89 37.92 0.42 0.56 0.08 0.52 48.46 46.16
Standard Deviation 1.87 1.49 0.21 0.12 0.33 0.20 2.18 1.84
Sample Variance 3.49 2.23 0.04 0.02 0.11 0.04 4.76 3.39
Coeff of Variation 0.05 0.04 0.37 0.22 0.80 0.46 0.05 0.04
Kurtosis 8.77 7.10 3.57 ‐0.25 3.91 0.96 11.28 10.04
Skewness ‐2.45 ‐2.22 0.96 ‐0.49 1.35 0.35 2.73 2.68
Range 12.76 10.05 1.57 0.77 2.18 1.54 17.07 13.68
Minimum 26.36 28.52 0.16 0.22 0.05 0.06 44.61 45.33
Maximum 39.11 38.57 1.73 0.99 2.23 1.60 61.68 59.01
Count 213 1139 213 1139 213 1139 213 1139
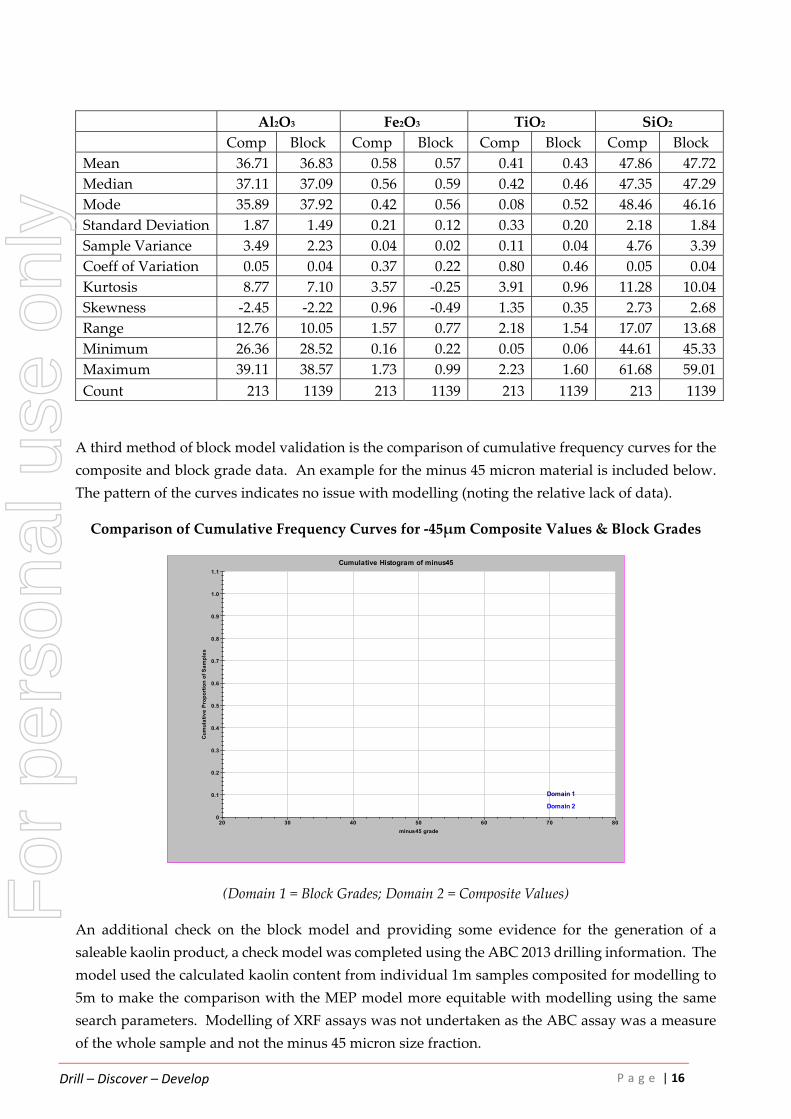
A third method of block model validation is the comparison of cumulative frequency curves for the
composite and block grade data. An example for the minus 45 micron material is included below.
The pattern of the curves indicates no issue with modelling (noting the relative lack of data).
Comparison of Cumulative Frequency Curves for ‐45μm Composite Values & Block Grades
(Domain 1 = Block Grades; Domain 2 = Composite Values)
An additional check on the block model and providing some evidence for the generation of a
saleable kaolin product, a check model was completed using the ABC 2013 drilling information. The
model used the calculated kaolin content from individual 1m samples composited for modelling to
5m to make the comparison with the MEP model more equitable with modelling using the same
search parameters. Modelling of XRF assays was not undertaken as the ABC assay was a measure
of the whole sample and not the minus 45 micron size fraction.
20 30 40 50 60 70 800
0.1
0.2
0.3
0.4
0.5
0.6
0.7
0.8
0.9
1.0
1.1
minus45 grade
Cu
mu
lati
ve
Pro
po
rtio
n o
f S
am
ple
s
Domain 2
Domain 1
Cumulative Histogram of minus45
For
per
sona
l use
onl
y
Drill – Discover – Develop P a g e | 17
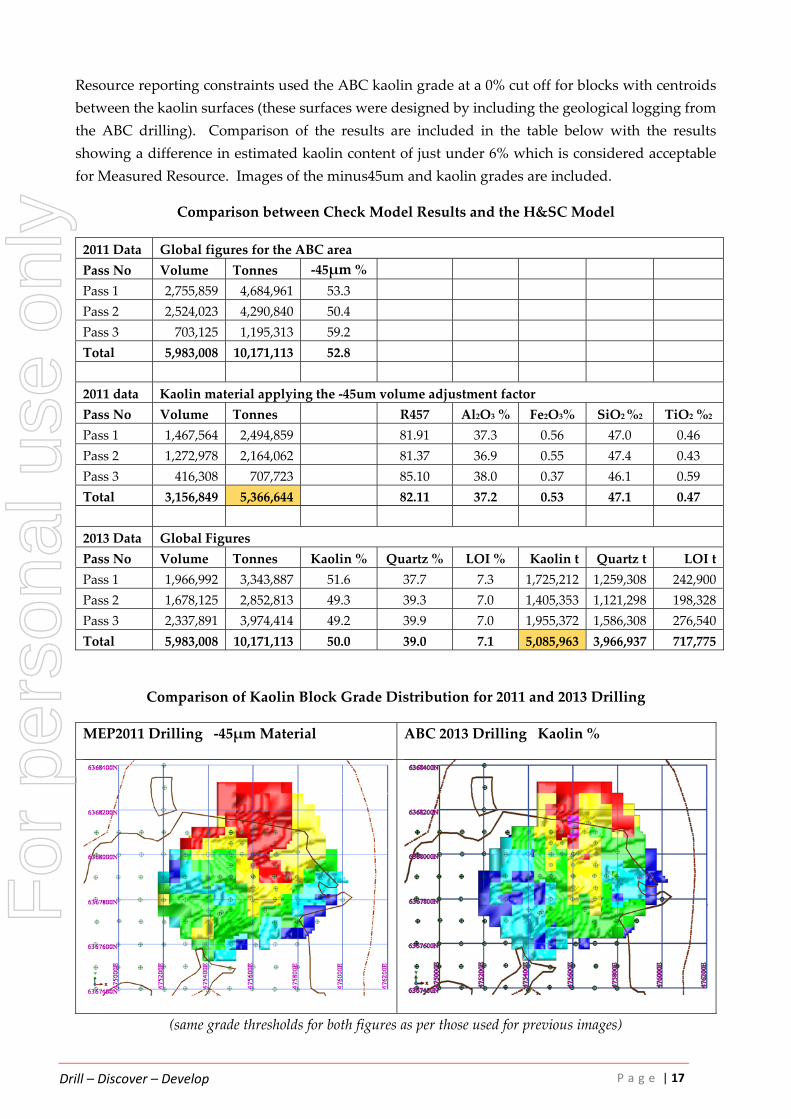
Resource reporting constraints used the ABC kaolin grade at a 0% cut off for blocks with centroids
between the kaolin surfaces (these surfaces were designed by including the geological logging from
the ABC drilling). Comparison of the results are included in the table below with the results
showing a difference in estimated kaolin content of just under 6% which is considered acceptable
for Measured Resource. Images of the minus45um and kaolin grades are included.
Comparison between Check Model Results and the H&SC Model
2011 Data Global figures for the ABC area
Pass No Volume Tonnes ‐45μm %
Pass 1 2,755,859 4,684,961 53.3
Pass 2 2,524,023 4,290,840 50.4
Pass 3 703,125 1,195,313 59.2
Total 5,983,008 10,171,113 52.8
2011 data Kaolin material applying the ‐45um volume adjustment factor
Pass No Volume Tonnes R457 Al2O3 % Fe2O3% SiO2 %2 TiO2 %2
Pass 1 1,467,564 2,494,859 81.91 37.3 0.56 47.0 0.46
Pass 2 1,272,978 2,164,062 81.37 36.9 0.55 47.4 0.43
Pass 3 416,308 707,723 85.10 38.0 0.37 46.1 0.59
Total 3,156,849 5,366,644 82.11 37.2 0.53 47.1 0.47
2013 Data Global Figures
Pass No Volume Tonnes Kaolin % Quartz % LOI % Kaolin t Quartz t LOI t
Pass 1 1,966,992 3,343,887 51.6 37.7 7.3 1,725,212 1,259,308 242,900
Pass 2 1,678,125 2,852,813 49.3 39.3 7.0 1,405,353 1,121,298 198,328
Pass 3 2,337,891 3,974,414 49.2 39.9 7.0 1,955,372 1,586,308 276,540
Total 5,983,008 10,171,113 50.0 39.0 7.1 5,085,963 3,966,937 717,775
Comparison of Kaolin Block Grade Distribution for 2011 and 2013 Drilling
MEP2011 Drilling ‐45μm Material ABC 2013 Drilling Kaolin %
(same grade thresholds for both figures as per those used for previous images)
For
per
sona
l use
onl
y

Drill – Discover – Develop P a g e | 18
Classification of the resource estimates is derived from the search passes and is detailed below.
Rockface Resource Classification
Classification Pass Category
Measured Pass 1
Indicated Pass 2
Inferred Pass 3
Other considerations in the classification include the following:
Positive
Aircore drilling is recent on a systematic 100m by 100m grid
Reasonably spaced drilling adequate for Measured and Indicated Resources
Composite data does not appear to be skewed such that Ordinary Kriging is an appropriate
modelling method
A reasonably good geological understanding of the deposit and the controls to
mineralisation.
Limited QAQC for the recent drilling has indicated no obvious issues with the sample
preparation or analysis.
Robust resources by comparison with the 2012 MEP Mineral Resources and a check model
based on the 2013 ABC drilling.
Preliminary testwork on alumina content and the ability to produce HPA previously carried
out with Bureau Veritas, UniSA and the University of Newcastle showed that the [Poochera]
product would be suitable for HPA generation with the added bonus that it gives a
significantly higher alumina mass yield than comparable Australian kaolin deposits.
BHM Consultants were commissioned to undertake the necessary concept metallurgical
investigation and future process design aspects for upgrading typical hydrous processed
kaolin from [Poochera] to a saleable HPA product via industry standard hydrometallurgical
processing routes. The BHM testwork indicates that an HPA product with 99.99% purity is
readily available from [Poochera] kaolin/halloysite feedstock using an industry standard
HCL two‐stage dissolution‐precipitation process, with the initial testwork achieving
99.9855% alumina.
Negative
Lack of any close spaced drilling to confirm grade continuity lending itself to relatively
weak/modest variography
No drilling recoveries.
Possible uncertainties to the base of mineralisation with the chance of an undulating surface
to the kaolin.
Limited QAQC data.
Lack of density data and uncertainty over sample representivity for the deposit.
The figures below represent the Mineral Resources for the Carey’s Well Kaolin Deposit at a cut‐off
grade of 75% R457 reflectance within the 2009 MEP Inferred resource outline.
For
per
sona
l use
onl
y

Drill – Discover – Develop P a g e | 19
Carey’s Well Raw Feed Material Global Resource Estimates
Category Mt ‐45μm Rec %
Measured 8.7 52.8
Indicated 10.9 51.9
Inferred 4.3 56.9
Total 23.9 53.1 (minor rounding errors)
If the minus 45 micron recovery factor is applied the estimated amount of kaolin is shown below:
Category Volume Mt R457 PSD‐2μm % Al2O3 % Fe2O3 % SiO2 % TiO2 %
Measured 2,703,533 4.6 82.5 68.8 37.0 0.58 47.5 0.41
Indicated 3,342,737 5.7 82.3 68.8 36.8 0.58 47.8 0.44
Inferred 1,428,840 2.4 84.0 68.6 37.5 0.49 47.0 0.54
Total 7,475,110 12.7 82.7 68.7 37.0 0.56 47.5 0.45
(minor rounding errors)
An example of the classification of the Carey’s Well resource estimates is included below.
Carey’s Well Resource Category for Blocks
(red = Measured; green = Indicated; blue = Inferred)
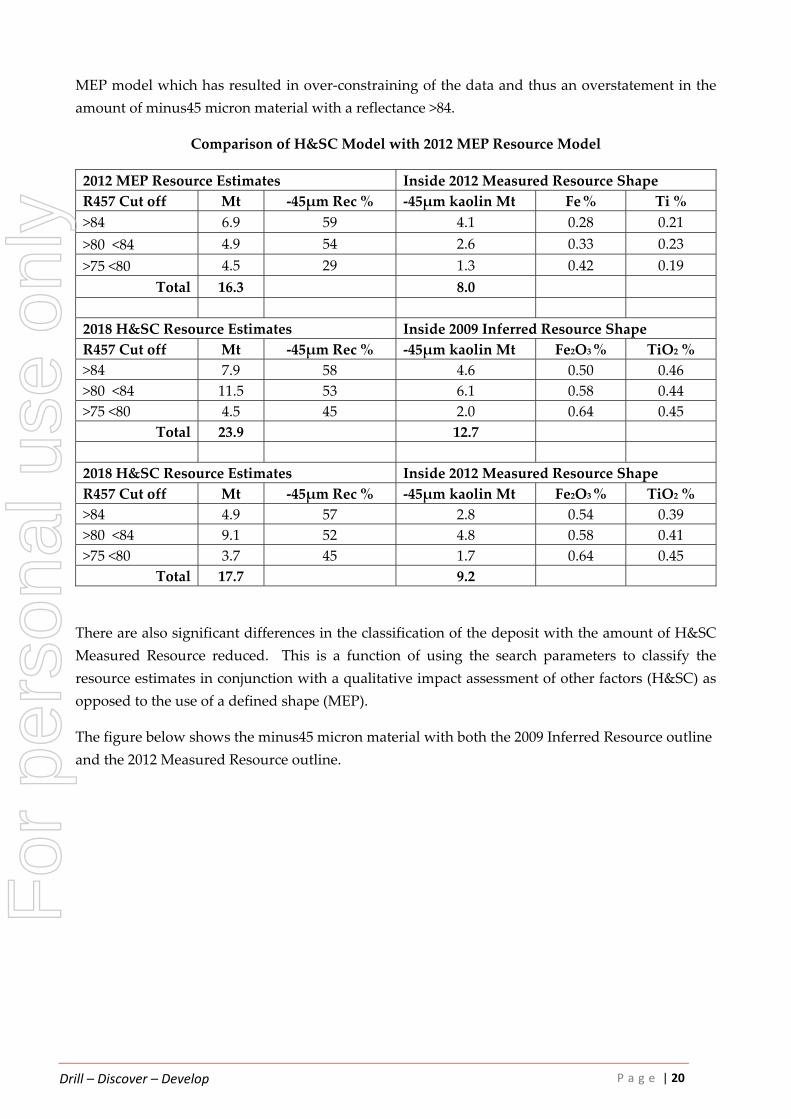
Comparison between the 2012 MEP resource estimates and the updated figures is shown in the table
below. The H&SC estimates are presented for both within the 2009 MEP Inferred Resource zone
and the 2012 Measured Resource zone. The H&SC estimates are larger for both the amount of
kaolinised granite and kaolin material at slightly lower minus45 micron recoveries. However, the
ratio of ultra‐high reflectance grade material to high reflectance material is significantly different.
H&SC suspects that this is due to the use of hard boundary domains for the reflectance grade in the
For
per
sona
l use
onl
y
Drill – Discover – Develop P a g e | 20
MEP model which has resulted in over‐constraining of the data and thus an overstatement in the
amount of minus45 micron material with a reflectance >84.
Comparison of H&SC Model with 2012 MEP Resource Model
2012 MEP Resource Estimates Inside 2012 Measured Resource Shape
R457 Cut off Mt ‐45μm Rec % ‐45μm kaolin Mt Fe % Ti %
>84 6.9 59 4.1 0.28 0.21
>80 <84 4.9 54 2.6 0.33 0.23
>75 <80 4.5 29 1.3 0.42 0.19
Total 16.3 8.0
2018 H&SC Resource Estimates Inside 2009 Inferred Resource Shape
R457 Cut off Mt ‐45μm Rec % ‐45μm kaolin Mt Fe2O3 % TiO2 %
>84 7.9 58 4.6 0.50 0.46
>80 <84 11.5 53 6.1 0.58 0.44
>75 <80 4.5 45 2.0 0.64 0.45
Total 23.9 12.7
2018 H&SC Resource Estimates Inside 2012 Measured Resource Shape
R457 Cut off Mt ‐45μm Rec % ‐45μm kaolin Mt Fe2O3 % TiO2 %
>84 4.9 57 2.8 0.54 0.39
>80 <84 9.1 52 4.8 0.58 0.41
>75 <80 3.7 45 1.7 0.64 0.45
Total 17.7 9.2
There are also significant differences in the classification of the deposit with the amount of H&SC
Measured Resource reduced. This is a function of using the search parameters to classify the
resource estimates in conjunction with a qualitative impact assessment of other factors (H&SC) as
opposed to the use of a defined shape (MEP).
The figure below shows the minus45 micron material with both the 2009 Inferred Resource outline
and the 2012 Measured Resource outline.
For
per
sona
l use
onl
y

Drill – Discover – Develop P a g e | 21
Minus 45μm Block Grade Distribution with Constraining Resource Outlines
(brown dash line = 2009 Inferred Resource outline; solid brown line = 2012 Measured Resource outline)
Exploration potential for the Carey’s Well kaolin deposit comprises blocks within the 2009 MEP
Inferred Resource that have no interpolated grade (red stars in the figure below). This amounts to
an Exploration Target of approximately 6‐10Mt with an estimated kaolin tonnage of 3 to 5Mt at
depths from surface of 6 to 18m. There may be scope for further resource extensions outside the
2009 Inferred Shape as the E‐W line of holes to the south of the deposit (black ellipse in the figure
below) contain significant intervals of kaolin based on the geological logging at roughly 12 to 29m
below surface.
The potential quantity and grade of the Exploration Target is conceptual in nature and there has
been insufficient exploration to define a Mineral Resource. It is uncertain if further exploration will
result in the determination of a Mineral Resource.
For
per
sona
l use
onl
y

Drill – Discover – Develop P a g e | 22
Areas of Exploration Potential for Carey’s Well
For
per
sona
l use
onl
y

Drill – Discover – Develop P a g e | 23
Appendix 2
QAQC Report for Carey’s Well Kaolin Deposit, Poochera, South Australia
H&SC has been supplied what it believes to be the full QAQC data for the 2011 aircore drilling
completed by Minotaur Exploration for the Carey’s Well Kaolin Deposit in South Australia. The
additional drilling on the deposit has been completed by MEP in 2008 (6 Calweld holes) and
Adelaide Brighton in 2013 (27 Calweld holes). The resource estimates have been based on the
2008 and 2011 drilling. It should be noted that the number of composited samples from the 2008
drilling is approximately 5% of the total. The original drilling samples were 1m in length but
composite samples were produced by MEP based on visual reflectance estimates and drill logs.
The composited lengths ranged from 1m to 5m.
1. Recoveries
No drill sample recovery data was supplied.
2. Standards
No standards or blanks were used.
0
20
40
60
80
100
120
Frequency
Interval
Poochera Composited Samples (MEP Drilling)
Frequency
For
per
sona
l use
onl
y

Drill – Discover – Develop P a g e | 24
3. Field Duplicates
No drillhole duplicates were collected for the 1m intervals.
4. Sample Prep (Lab) Duplicates
From the composited drillhole samples 23 duplicate samples were generated. These duplicates
were repeated composites from the original 1m interval sample bags. Data for the recovery of
the minus 45um material was available for only 15 samples. The data indicated a slight bias of
higher recoveries for the duplicate sample (see figure below). H&SC is uncertain as to why this
should be so but it is not considered significant.
5. Analytical Duplicates (Replicates)
Duplicates assays were supplied for the CSIRO XRF data. These assays were derived from the
duplicate sample prep material mentioned above. The dataset comprised a total of 13 samples.
Plots of original versus duplicate are included for Al2O3, SiO2, Fe2O3 and TiO2. No significant
issues are noted with the data. One outlier sample exists associated with low kaolin
composition.
0
10
20
30
40
50
60
70
0 10 20 30 40 50 60 70
Duplicate ‐45um Recovery %
Original ‐45um Recovery %
Poochera Sample Prep Duplicates ‐45um ( n=15 )
For
per
sona
l use
onl
y

Drill – Discover – Develop P a g e | 25
25
27
29
31
33
35
37
39
25 27 29 31 33 35 37 39
Duplicate CSIRO XRF Analysis Al2O3 %
Original CSIRO XRF Analysis Al2O3 %
Poochera Duplicates XRF Analysis Al2O3 ( n=13 )
40
42
44
46
48
50
52
54
56
58
60
40 42 44 46 48 50 52 54 56 58
Duplicate CSIRO XRF Analysis SiO2 %
Original CSIRO XRF Analysis SiO2 %
Poochera Duplicates XRF Analysis SiO2 ( n=13 )
For
per
sona
l use
onl
y

Drill – Discover – Develop P a g e | 26
Duplicate analyses of the R457 reflectance was completed on 23 samples. The results were
acceptable for the majority of the data but two outliers are noted for the duplicate samples.
H&SC is uncertain as to why this should be so but it is not considered significant.
0
0.2
0.4
0.6
0.8
1
1.2
0 0.2 0.4 0.6 0.8 1 1.2
Duplicate CSIRO XRF Analysis Fe2
O3 %
Original CSIRO XRF Analysis Fe2O3 %
Poochera Duplicates XRF Analysis Fe2O3 ( n=13 )
0
0.2
0.4
0.6
0.8
1
1.2
0 0.1 0.2 0.3 0.4 0.5 0.6 0.7 0.8 0.9 1
Duplicate CSIRO XRF Analysis TiO2 %
Original CSIRO XRF Analysis TiO2 %
Poochera Duplicates XRF Analysis TiO2 ( n=13 )
For
per
sona
l use
onl
y

Drill – Discover – Develop P a g e | 27
6. Second Lab Checks
No second lab checks were completed.
7. Twin Holes
No twin holes were completed by MEP for the 2011 drilling. The ABC drilling targeted a sub‐
area of the deposit and included 5 pairs of holes twinned with the MEP 2011 drilling. Details of
the twinned pairs are included in the table below. The comparison is made between the logged
kaolinised granite intervals from both sets of drill logs. There are some variations in the logged
intervals – see cumulative interval differences. However, the overall weighted average
difference of kaolin between the 2011 and 2013 intervals is just under 7%.
Logged Kaolinised Granite Logged Kaolinised Granite
2011 Hole Interval From ‐45um % 2013 Hole Interval From Kaolin % Hole Dist
CW11AC044 12m 12m 42.67 CW13RC025 9m 11m 36.25 10m
CW11AC045 18m 12m 47.83 CW13RC010 17m 13m 47.43 2.6m
CW11AC046 20m 16m 60.63 CW13RC011 20m 15m 64.53 4.1m
CW11AC057 21m 18m 53.57 CW13RC005 17m 22m 59.7 1.4m
CW11AC065 10m 13m 59.50 CW13RC022 10m 13m 58.82 1.6m
Total 81m wt ave 46.84 Total 73m wt ave 55.63
(assumption: all of the ‐45um material is kaolin)
Simon Tear
Director and Consulting Geologist
H&S Consultants Pty Ltd
60
65
70
75
80
85
90
95
60 65 70 75 80 85 90
Duplicate Sample Reflectan
ce R457
Original Sample Reflectance R457
Poochera Duplicates R457 ( n=23 )
For
per
sona
l use
onl
y

Drill – Discover – Develop P a g e | 28
JORC Code, 2012 Edition – Table 1 Poochera Kaolin Deposit
Section 1 Sampling Techniques and Data (Criteria in this section apply to all succeeding sections.)
Criteria JORC Code explanation Commentary
Sampling techniques Nature and quality of sampling (e.g. cut channels, random chips, or specific specialised industry standard measurement tools appropriate to the minerals under investigation, such as down hole gamma sondes, or handheld XRF instruments, etc). These examples should not be taken as limiting the broad meaning of sampling.
Include reference to measures taken to ensure sample representivity and the appropriate calibration of any measurement tools or systems used.
Aspects of the determination of mineralisation that are Material to the Public Report.
In cases where ‘industry standard’ work has been done this would be relatively simple (e.g. ‘reverse circulation drilling was used to obtain 1 m samples from which 3 kg was pulverised to produce a 30 g charge for fire assay’). In other cases more explanation may be required, such as where there is coarse gold that has inherent sampling problems. Unusual commodities or mineralisation types (e.g. submarine nodules) may warrant disclosure of detailed information.
Aircore drilling of vertical holes to industry standard completed by Minotaur (“MEP”) generating 1m chip samples. A total of 153 holes for 3,795m completed in 2011. Drilling generally penetrated beyond the kaolinite to the partially decomposed parent granite. Maximum drilling depth is 48m.
Samples composited based on perceived reflectance levels. Composite intervals range from 1‐5m
Sample preparation and initial testing was carried out at Minotaur’s pilot kaolin processing facility at Streaky Bay, South Australia.
Sample processing generated results for minus45 micron material with follow up assaying consisting of industry standard XRF analysis, ICP analysis and reflectance measurement suite. Additional analysis for halloysite was undertaken as a separate phase.
Kaolinite is a white, weathered clay product easily distinguished in drilling. The mineralisation forms a flat lying blanket atop a partially decomposed granite. Cover material comprises alluvial clays and sands and calcrete. The kaolinite is capped by a silicified zone generally logged as 1m thick.
The anticipated product for the 2011 drilling was a high quality high reflectance material for use in paper coating. Andromeda (“ADN”) are looking at several different options including supply of raw material feed and semi‐processed product for ceramics applications.
6 Calweld holes for 142m were drilled in 2008 by MEP in order to supply bulk samples. These holes are included in the new resource estimates.
Additional drilling of 27 reverse circulation (RC) holes for 882m by Adelaide Brighton (“ABC”) was completed in 2013. Drilling comprised a sub‐area of the MEP‐defined kaolinite body with the anticipated product being suitable as a cement filler. Sampling and analysis was different to the MEP work and has not been used to numerically help define the Mineral Resources.
Drilling techniques Drill type (e.g. core, reverse circulation, open‐hole hammer, rotary air blast, auger, Bangka, sonic, etc) and details (e.g.
2011 MEP : Drilling completed by contractor Johannsen Drilling using an Edson 2000 drill rig. Some drillholes were pre‐collared using a rotary air blast
For
per
sona
l use
onl
y

Drill – Discover – Develop P a g e | 29
Criteria JORC Code explanation Commentary
core diameter, triple or standard tube, depth of diamond tails, face‐sampling bit or other type, whether core is oriented and if so, by what method, etc).
(RAB) open hole hammer technique to penetrate hard bands of shallow calcrete and, where present, a silcrete horizon at the top of the kaolinised granite. The majority of the drilled metres were completed with 75mm diameter aircore drilling technique.
2013 ABC : Reverse circulation (RC) drilling completed by Coughlan Drilling contractors; diameter and drill bit unspecified however ABC drilling data have not been used to numerically help define the Mineral Resources.2008 MEP: Drilling completed by contractor Kim Thiele using a Calweld rig to drill 810mm diameter holes enabling collection of approximately 1 tonne of kaolinised material per downhole metre drilled.
Drill sample recovery Method of recording and assessing core and chip sample recoveries and results assessed.
Measures taken to maximise sample recovery and ensure representative nature of the samples.
Whether a relationship exists between sample recovery and grade and whether sample bias may have occurred due to preferential loss/gain of fine/coarse material.
2011 aircore MEP: No recovery data were available. Damp intervals were recorded in logging. The depth of penetration of the drill bit was noted and the downhole interval recorded for each aircore sample.
2013 RC ABC: No recovery data were available. Damp intervals were recorded in logging. The depth of penetration of the drill bit was noted and the downhole interval recorded for each RC sample.
2008 Calweld MEP: No recovery data were available. Damp intervals were recorded in logging. The depth of penetration of the drill bit was noted and the downhole interval recorded for each bulka bag filled with Calweld sample.
Geological logging was undertaken by the onsite geologist during each drilling programme. Determination of optimal samples and, conversely, intervals of poor recovery were based on visual observation of kaolinised material collected from each metre drilled.
Sample recovery is expected to have minimal negative impact on samples collected.
There was no obvious evidence of bias in the samples.
Logging Whether core and chip samples have been geologically and geotechnically logged to a level of detail to support appropriate Mineral Resource estimation, mining studies and metallurgical studies.
Whether logging is qualitative or quantitative in nature. Core (or costean, channel, etc) photography.
The total length and percentage of the relevant
2011 aircore MEP: All drill samples were logged by an experienced geologist on‐site at the time of drilling. Observations on lithology, colour, degree of weathering, mineralisation and alteration for sampled material were recorded.
2013 RC ABC: All drill samples were logged by an experienced geologist on‐site at the time of drilling. Observations on lithology, colour, and mineralisation for sampled material were recorded. F
or p
erso
nal u
se o
nly
Drill – Discover – Develop P a g e | 30
Criteria JORC Code explanation Commentary
intersections logged. 2008 Calweld MEP: All drill samples were logged by an experienced geologist on‐site at the time of drilling. Observations on lithology, colour, degree of weathering, mineralisation and alteration for sampled material were recorded.
All relevant intersections were logged.
All logging for 2008 and 2011 drilling has been converted to quantitative codes in the MEP database.
Data from the 2013 drilling has not been used to numerically help define the Mineral Resources.
Sub‐sampling techniques and sample preparation
If core, whether cut or sawn and whether quarter, half or all core taken.
If non‐core, whether riffled, tube sampled, rotary split, etc and whether sampled wet or dry.
For all sample types, the nature, quality and appropriateness of the sample preparation technique.
Quality control procedures adopted for all sub‐sampling stages to maximise representivity of samples.
Measures taken to ensure that the sampling is representative of the in situ material collected, including for instance results for field duplicate/second‐half sampling.
Whether sample sizes are appropriate to the grain size of the material being sampled.
2011 aircore MEP:. Sample compositing consisted of only contiguous 1m drill samples up to 5m in total length, based on drill logs and visual estimation of whiteness of material i.e. reflectance. Sample composites were prepared with the aim of including kaolinised granite of similar quality within each composite, although in some cases narrow bands of discoloured kaolinised granite were included in the composite to determine if poorer quality could be carried within the interval. Composite samples ideally weighed between 10 and 15 kg with equal amounts of kaolinised granite being taken from each 1m drillhole sample. In a few cases, because of a lack of sample, the composite samples weighed less than 10kg. When sample processing commenced it was soon found that a minimum sample weight of about 8kg was required for satisfactory blunging and processing. Consequently, a very few composite samples could not be processed. A total of 270 composite samples were prepared from 93 drillholes within the drilled resource definition area. Depending upon sufficient sample being available, about every tenth sample was duplicated, and was processed as a separate sample. 23 duplicate samples were prepared.
2011 aircore MEP samples were processed by blunging at high solids content in a high shear blunger with sodium polyacrylate dispersant to ensure kaolin was fully dispersed and then screened and decanted to remove quartz and mica, to produce a minus 45 micron kaolin sample. Particle sizing was confirmed (>99% minus 45 micron) on site using a Sedigraph 5100 particle size analyser. Based on the measured solids content of the blunged kaolinised granite slurry, the minus 45 micron kaolin percentage was determined by difference, after the plus 45 micron percentage was determined by wet screening and weighing.
For
per
sona
l use
onl
y

Drill – Discover – Develop P a g e | 31
Criteria JORC Code explanation Commentary
2013 RC ABC: All 1 metre samples from the 2013 RC drillholes were analysed in ABC’s laboratory. Major elements (XRF) data were provided to MEP but not sub‐sampling and sample preparation methodologies. Data from the 2013 drilling have not been used to numerically help define the Mineral Resources.
2008 Calweld MEP : Selected bulk samples from the 2008 Carey’s Well drilling were sub‐sampled and processed at Minotaur’s Streaky Bay kaolin processing facility to produce a range of hydrous kaolin products, including ParlaWhite90 (PW90). Full product characterisation was undertaken, including analysis of particle size distribution, ISO brightness, colour, +45µ grit content, oil absorption, surface area, major and minor elements and mineralogy. 100% of mineralised intervals of the Calweld drilling were sub-sampled from bulka bags at the Minotaur kaolin processing facility in Streaky Bay in 2012. Sub-samples were mixed with water then processed by blunging at high solids content in a high shear blunger with sodium polyacrylate dispersant to ensure kaolin was fully dispersed and then screened and decanted to remove quartz and mica to produce a minus 45 micron kaolin sample.
All MEP 2011 and 2008 sampling methods and sample sizes are deemed appropriate.
Quality of assay data and laboratory tests
The nature, quality and appropriateness of the assaying and laboratory procedures used and whether the technique is considered partial or total.
For geophysical tools, spectrometers, handheld XRF instruments, etc, the parameters used in determining the analysis including instrument make and model, reading times, calibrations factors applied and their derivation, etc.
Nature of quality control procedures adopted (e.g. standards, blanks, duplicates, external laboratory checks) and whether acceptable levels of accuracy (i.e. lack of bias) and precision have been established.
2011 aircore MEP: ISO Brightness (R457) and La*b* colour of the dried minus 45 micron kaolin powder were determined according to TAPPI standard T 534 om‐03 using a Technibrite 1B spectrophotometer at Minotaur’s Streaky Bay kaolin processing facility. The measured parameters of R457 brightness, L, a* and b* are internationally accepted spectral criteria for determinations of brightness, whiteness, redness and yellowness, respectively. Subsamples of minus 45 micron kaolin were forwarded to:
o ALS Minerals laboratories in Adelaide for determination of 60 elements using method ME‐MS61r (four acid digestion, ICP‐MS),
o CSIRO, Division of Land and Water, Urbrae for XRF analysis of 11 major elements plus Cl and determination of mineralogy by XRD.
The CSIRO data confirm that the minus 45 micron fraction is dominantly kaolin (kaolinite with halloysite in varying abundance) with traces of quartz, mica and microcline feldspar. F
or p
erso
nal u
se o
nly
Drill – Discover – Develop P a g e | 32
Criteria JORC Code explanation Commentary
2013 RC ABC All 1 metre samples from the 2013 RC drillholes were analysed in ABC’s laboratory for major elements (XRF), however sub‐sampling and sample preparation methodologies were not disclosed. Data from the 2013 drilling have not been used to numerically help define the Mineral Resources.
2008 Calweld MEPISO Brightness (R457) and La*b* colour of the dried minus 45 micron kaolin powder were determined according to TAPPI standard T 534 om‐03 using a Technibrite 1B spectrophotometer at Minotaur’s Streaky Bay kaolin processing facility. The measured parameters of R457 brightness, L, a* and b* are internationally accepted spectral criteria for determinations of brightness, whiteness, redness and yellowness, respectively. Subsamples of minus 45 micron kaolin were forwarded to:
o ALS Minerals laboratories in Adelaide for determination of 60 elements using method ME‐MS61r (four acid digestion, ICP‐MS),
o CSIRO, Division of Land and Water, Urbrae for XRF analysis of 11 major elements plus Cl and determination of mineralogy by XRD.
The CSIRO data confirm that the minus 45 micron fraction is dominantly kaolin (kaolinite with halloysite in varying abundance) with traces of quartz, mica and microcline feldspar.
No standards or blanks were used for the element assaying
All assay methods were appropriate at the time of undertaking.
No secondary lab checks were completed.
Analytical techniques used by BHM Process Consultants for HPA testing are considered appropriate and included test work through Nagrom Mineral Laboratories and independent verification through Labwest Minerals Analysis. BHM Process Consultants have a strong expertise in analysis of industrial minerals.
Verification of sampling and assaying
The verification of significant intersections by either independent or alternative company personnel.
The use of twinned holes.
Documentation of primary data, data entry procedures, data verification, data storage (physical and electronic) protocols.
Discuss any adjustment to assay data.
Sample and assay data from MEP 2008 Calweld and 2011 aircore drilling have been compiled and reviewed by the senior geologists involved in the logging and sampling of the drill core, cross‐checking assays with the geological logs and representative samples. No independent intercept verification has been undertaken. No twin holes were completed by MEP for the 2011 drilling.
5 pairs of twinned holes exist for the MEP 2011 drilling and the ABC 2013 drilling. The results indicate some variations in the logged intervals.
For
per
sona
l use
onl
y

Drill – Discover – Develop P a g e | 33
Criteria JORC Code explanation Commentary
However, the overall weighted average difference of between the amount of minus45micron material and the kaolinite content between the 2011 and 2013 intervals is just under 7%.
All 2008 and 2011 drilling and testing data have been validated within the MEP GBIS samples database.
Any below detection values were substituted with half lower detection limit values for resource estimation purposes
Location of data points Accuracy and quality of surveys used to locate drill holes (collar and down‐hole surveys), trenches, mine workings and other locations used in Mineral Resource estimation.
Specification of the grid system used.
Quality and adequacy of topographic control.
Survey pickup of 2011 aircore drilling collar locations by differential GPS accurately located and levelled all collars. Collar surveys completed by contractor Peter Crettenden using a Trimble R8 RTK (Real Time Kinematic) System with horizontal accuracy of +/‐ 20mm and vertical accuracy of +/‐ 30mm, cross‐checked against differential GPS survey data collected by licensed surveyors Hennig & Co in March 2011.
2013 ABC RC drilling collar locations located by handheld GPS (accuracy unspecified) at the time of drilling. Data from the 2013 drilling have not been used to numerically help define the Mineral Resources.
2008 Calweld drilling collar locations located by handheld GPS (horizontal accuracy unspecified) at the time of drilling. Collars levelled vertically in 2011 utilising survey data collected by contractor Peter Crettenden using a Trimble R8 RTK (Real Time Kinematic) System with vertical accuracy of +/‐ 30mm.
No downhole surveys have been completed – all holes are vertical and generally <30m deep
Grid projection is MGA94 Zone 53
A topographic surface has been created based on an accurate contour plan of the Poochera kaolin deposit area produced in March 2011 by licensed surveyors Hennig & Co. utilising differential GPS (+/‐0.2m accuracy).
Data spacing and distribution
Data spacing for reporting of Exploration Results.
Whether the data spacing and distribution is sufficient to establish the degree of geological and grade continuity appropriate for the Mineral Resource and Ore Reserve estimation procedure(s) and classifications applied.
Whether sample compositing has been applied.
2011 MEP : Drillhole spacing is 100m by 100m with downhole sampling at 1m intervals with sample compositing of only contiguous 1m samples up to 5m based on drill logs and visual estimation of whiteness of material i.e. reflectance.
2013 ABC: Drillhole spacing is 100m by 100m, locally at 50m, with downhole sampling at 1m intervals. Area covered is approximately 400m by 400m in F
or p
erso
nal u
se o
nly

Drill – Discover – Develop P a g e | 34
Criteria JORC Code explanation Commentary
the NE quadrant of the Poochera deposit. Data from the 2013 drilling have not been used to numerically help define the Mineral Resources.
2008 MEP : Variable drillhole spacing for bulk sampling at 1m downhole intervals. Area covered is approximately 1km x 1km within the Poochera deposit.
The drillhole spacing for the MEP work has established a high level of geological continuity for the kaolinite. The spacing is also suitable for establishing a reasonable level of grade continuity for the kaolinite and any impurities.
The sample compositing for the 2011 work has imposed a limitation on any detailed assessment of variability of kaolinite material for the deposit.
Orientation of data in relation to geological structure
Whether the orientation of sampling achieves unbiased sampling of possible structures and the extent to which this is known, considering the deposit type.
If the relationship between the drilling orientation and the orientation of key mineralised structures is considered to have introduced a sampling bias, this should be assessed and reported if material.
Vertical drilling generally achieved a very high angle of intercept with the flat‐lying, stratabound mineralisation.
Drilling orientations are considered appropriate with no obvious bias.
Sample security The measures taken to ensure sample security. The drill samples were collected by Minotaur personnel then delivered to the kaolin processing facility either by Minotaur personnel, or competent exploration contractor.
Transport of samples from the Streaky Bay kaolin processing facility to Adelaide and other locations for further testwork has been undertaken by competent exploration contractors. Remnant samples are stored securely at Minotaur Exploration premises in Streaky Bay or Adelaide.
Audits or reviews The results of any audits or reviews of sampling techniques and data.
No external audits or reviews of the sampling techniques or data have been completed
For
per
sona
l use
onl
y

Drill – Discover – Develop P a g e | 35
Section 2 Reporting of Exploration Results (Criteria listed in the preceding section also apply to this section.)
Criteria JORC Code explanation Commentary
Mineral tenement and land tenure status
Type, reference name/number, location and ownership including agreements or material issues with third parties such as joint ventures, partnerships, overriding royalties, native title interests, historical sites, wilderness or national park and environmental settings.
The security of the tenure held at the time of reporting along with any known impediments to obtaining a licence to operate in the area.
The Poochera Kaolin-Halloysite Project (Exploration Licences 5814, 6096 and 6202, which is a subsequent licence to EL5308) includes the Poochera (Carey’s Well) deposit, which is located on EL5814.
The Poochera Project is held by subsidiaries of Minotaur Exploration Limited and is joint ventured to Andromeda under terms detailed in the ADN ASX release dated 26 April 2018.
There are no known non-government royalties due beyond the Minotaur JV agreement terms.
The underlying land title is freehold that extinguishes Native Title. There are no known historical sites within the Carey’s Well/Poochera area
which preclude exploration or mineral development. All tenements are secure and compliant with Government of South Australia
Department for Energy and Mining requirements at the date of this report. Exploration done by other parties
Acknowledgment and appraisal of exploration by other parties. MEP has conducted exploration in the Carey’s Well/Poochera area since the tenement was granted in 2005.
The general area that is the subject of this report has been explored for kaolinitic products in the past by Transoil NL, SA Paper Clays ECC (Pacific) & Commercial Minerals Ltd. ADN has reviewed past exploration conducted by MEP.
Geology Deposit type, geological setting and style of mineralisation. Kaolin deposits, such as Poochera/Carey’s Well, developed in situ by lateritic weathering of the feldspar-rich Hiltaba Granite.
The resultant kaolin deposit at Carey’s Well is a sub-horizontal zone of kaolinised granite resting with a fairly sharp contact on unweathered granite. The kaolinised zone is overlain by loosely consolidated Tertiary and Quaternary sediments.
High quality kaolin‐halloysite deposits occur extensively across the Poochera Project area
Halloysite is a rare derivative of kaolin where the mineral occurs as nanotubes. Halloysite has a wide variety of industrial uses beyond simple kaolin and commands a significant premium above the average kaolin price. The Poochera kaolin deposits contain variable admixtures of kaolin and
For
per
sona
l use
onl
y

Drill – Discover – Develop P a g e | 36
Criteria JORC Code explanation Commentary
halloysite that appear amenable to selective mining to produce specific low, medium and high halloysite blends for the ceramic markets, new nanotechnology applications and as a strengthening additive in the cement and petroleum fracking industries.
Drill hole Information
A summary of all information material to the understanding of the exploration results including a tabulation of the following information for all Material drill holes: o easting and northing of the drill hole collar o elevation or RL (Reduced Level – elevation above sea level in
metres) of the drill hole collar o dip and azimuth of the hole o down hole length and interception depth o hole length.
If the exclusion of this information is justified on the basis that the information is not Material and this exclusion does not detract from the understanding of the report, the Competent Person should clearly explain why this is the case.
Exploration results have been reported in the public domain with an ASX release for the initial resource estimate publicised on 8 February 2012.
Exploration results not being reported.
Data aggregation methods
In reporting Exploration Results, weighting averaging techniques, maximum and/or minimum grade truncations (e.g. cutting of high grades) and cut‐off grades are usually Material and should be stated.
Where aggregate intercepts incorporate short lengths of high grade results and longer lengths of low grade results, the procedure used for such aggregation should be stated and some typical examples of such aggregations should be shown in detail.
The assumptions used for any reporting of metal equivalent values should be clearly stated.
Exploration results not being reported.
Relationship between mineralisation widths and intercept lengths
These relationships are particularly important in the reporting of Exploration Results.
If the geometry of the mineralisation with respect to the drill hole angle is known, its nature should be reported.
If it is not known and only the down hole lengths are reported, there should be a clear statement to this effect (e.g. ‘down hole length, true width not known’).
Exploration results not being reported.
Drill hole angle relative to mineralisation has been almost perpendicular. Generally, the stratabound intercepts are close to true width.
For
per
sona
l use
onl
y

Drill – Discover – Develop P a g e | 37
Criteria JORC Code explanation Commentary
Diagrams Appropriate maps and sections (with scales) and tabulations of intercepts should be included for any significant discovery being reported These should include, but not be limited to a plan view of drill hole collar locations and appropriate sectional views.
Exploration results not being reported.
Balanced reporting
Where comprehensive reporting of all Exploration Results is not practicable, representative reporting of both low and high grades and/or widths should be practiced to avoid misleading reporting of Exploration Results.
Exploration results not being reported.
Other substantive exploration data
Other exploration data, if meaningful and material, should be reported including (but not limited to): geological observations; geophysical survey results; geochemical survey results; bulk samples – size and method of treatment; metallurgical test results; bulk density, groundwater, geotechnical and rock characteristics; potential deleterious or contaminating substances.
Metallurgical testwork conducted by BHM Process consultants utilising industry standard two-stage acid dissolution and precipitation product with chemical analysis through Nagrom Mineral Laboratories and Labwest Mineral Analysis.
Further work The nature and scale of planned further work (e.g. tests for lateral extensions or depth extensions or large‐scale step‐out drilling).
Diagrams clearly highlighting the areas of possible extensions, including the main geological interpretations and future drilling areas, provided this information is not commercially sensitive.
Further HPA metallurgical testwork and additional halloysite analyses will be conducted as part of future Scoping and Feasibility studies.
Section 3 Estimation and Reporting of Mineral Resources (Criteria listed in section 1, and where relevant in section 2, also apply to this section.
Criteria JORC Code explanation Commentary
Database integrity
Measures taken to ensure that data has not been corrupted by, for example, transcription or keying errors, between its initial collection and its use for Mineral Resource estimation purposes.
Data validation procedures used.
All relevant data were entered into an Access database where various validation checks were performed including duplicate entries, sample overlap, unusual assay values and missing data.
Data linked to Surpac for wireframing, block model creation and resource reporting.
Visual reviews of data were conducted to confirm consistency in logging and drillhole trajectories.
Assessment of the data confirms that it is suitable for resource estimation.
Site visits Comment on any site visits undertaken by the Competent Person and the outcome of those visits.
No site visit by H&SC personnel was completed due to time and budgetary constraints.
For
per
sona
l use
onl
y
Drill – Discover – Develop P a g e | 38
Criteria JORC Code explanation Commentary
If no site visits have been undertaken indicate why this is the case. Multiple site visits were completed by Tony Belperio, Executive Director of MEP
A site visit was recently completed by Rhod Grivas, Chairman of ADN. James Marsh, Managing Director of ADN has historically visited the area several times
Geological interpretation
Confidence in (or conversely, the uncertainty of) the geological interpretation of the mineral deposit.
Nature of the data used and of any assumptions made.
The effect, if any, of alternative interpretations on Mineral Resource estimation.
The use of geology in guiding and controlling Mineral Resource estimation.
The factors affecting continuity both of grade and geology.
The geological understanding is quite straightforward with the 2008 and 2011 MEP drilling density allowing for a high level of confidence.
Consistent logging has allowed for the definition of a series of 3D geological surfaces. These surfaces comprise a base of soil, a base of silcrete, a top of kaolinite mineralisation (generally coincides with the base of silicified kaolinite), a base of kaolinite (generally coincides with the top of partially decomposed granite) and a base of drilling surface.
The surfaces indicate the flat‐lying nature to the mineralisation although there are significant variations in thickness of the kaolinite.
In most cases the top and base of the kaolinite mineralisation is defined by where the material has been assayed.
The 2013 ABC drilling has been used to help define the geological surfaces where appropriate information exists.
Wireframe extrapolation is generally 100m beyond the last drillhole; termination of wireframes is due a combination of geology and a lack of drilling.
The existing interpretation honours all the available data; an alternative interpretation is unlikely to have a significant impact on the resource estimates.
Dimensions The extent and variability of the Mineral Resource expressed as length (along strike or otherwise), plan width, and depth below surface to the upper and lower limits of the Mineral Resource.
Mineralisation can be modelled for 1km of strike length, and down dip for 1.5km (very shallow dip of 2o to the east). The mineralised zone appears to comprise two parallel N‐S striking depressions with thicknesses ranging from 3 to 28m.
The depth below surface to the top of the mineralisation ranges between 8 and 24metres.
Estimation and modelling techniques
The nature and appropriateness of the estimation technique(s) applied and key assumptions, including treatment of extreme grade values, domaining, interpolation parameters and maximum distance of extrapolation from data points. If a computer assisted
Mineral wireframes and geological surfaces are based on interpretations completed on sections with strings snapped to drill holes.
Surpac mining software was used for the interpretation and block model reporting. The GS3 software was used for block grade interpolation.
For
per
sona
l use
onl
y

Drill – Discover – Develop P a g e | 39
Criteria JORC Code explanation Commentary
estimation method was chosen include a description of computer software and parameters used.
The availability of check estimates, previous estimates and/or mine production records and whether the Mineral Resource estimate takes appropriate account of such data.
The assumptions made regarding recovery of by‐products.
Estimation of deleterious elements or other non‐grade variables of economic significance (e.g. sulphur for acid mine drainage characterisation).
In the case of block model interpolation, the block size in relation to the average sample spacing and the search employed.
Any assumptions behind modelling of selective mining units.
Any assumptions about correlation between variables.
Description of how the geological interpretation was used to control the resource estimates.
Discussion of basis for using or not using grade cutting or capping.
The process of validation, the checking process used, the comparison of model data to drill hole data, and use of reconciliation data if available.
Wireframes were used to control the composite selection and the loading of subsequently modelled data into the block model.
Geostatistics were performed for minus45micron material, Al2O3, Fe2O3, SiO2, TiO2, R457 (reflectance) and 2micron particle size data. Halloysite percentage was also analysed
Correlation between the main economic elements was weak indicating possible mineral zonation, which is not an uncommon feature with the type of mineralisation.
Drillhole spacing is 100m with sample compositing up to 5m (predominantly 4 to 5m).
Parent block sizes were 50m in the X (east) direction, 50m in the Y (north) direction and 5m in the Z (RL) direction with sub‐blocking to 12.5m by 12.5m by 1.25m.
The Ordinary Kriging estimation method was used.
302 five metre (5m) composites were selected using the relevant wireframes; residuals of <2.5m were discarded.
No top cutting was applied; the coefficients of variation for the relevant composite datasets suggest that the data is not sufficiently skewed or unstructured to warrant top cutting.
3 estimation search passes were used with an increasing search radius and decreasing number of data points.
Search size: 150 by 150 by 7.5m (Measured), 250 by 250 by 15m (Indicated) to 250 by 250 by 15m (Inferred) with 8 minimum data (Measured) decreasing to 4 (Indicated and Inferred).
The first and second passes used an octant‐based search where at least 4 octants had to be estimated; the remaining pass 3 used a 2 octant based search.
Variography was modest mainly due to the amount of sample data, particularly in the down dip direction in combination with localised thinness of some of the mineral zones.
One search ellipse was used, orientated to follow the strike, dip and plunge trend of the mineral unit.
Model validation has consisted of visual comparison of block grades and composite values and indicated a good match. Comparison of summary statistics for block grades and composite values has indicated a very small
For
per
sona
l use
onl
y

Drill – Discover – Develop P a g e | 40
Criteria JORC Code explanation Commentary
risk of overestimation of grade for certain elements for certain lodes usually in the Inferred category. This is due to the deposit being open with zones of higher grade material on the margin.
There are relatively limited changes from the MEP 2012 global resource estimates and this provides a good level of confidence in the resource estimates and their classification.
The 2013 ABC drilling data was modelled as a check model as it only covers part of the deposit. This model used different data sources, namely kaolinite and silica percentages, rather than minus45micron and R457 reflectance values. The check model for this sub‐area reported only a 5% difference in the interpreted kaolinite content with the MEP model.
Moisture Whether the tonnages are estimated on a dry basis or with natural moisture, and the method of determination of the moisture content.
Tonnages are estimated on a dry weight basis.
Cut‐off parameters
The basis of the adopted cut‐off grade(s) or quality parameters applied.
Resource estimates have been reported at a 75 R457 reflectance within the upper and lower kaolinite surfaces. A second constraint uses block centroids inside the 2009 MEP Inferred resource outline as a proxy for the granite surface outcrop. The minus45micron values were used as a volume adjustment factor being indicative of kaolinite material.
There is a very limited amount of unassayed kaolinite material outside the new resource estimates
The cut‐off grade at which the resource is quoted reflects the intended bulk‐mining approach.
Mining factors or assumptions
Assumptions made regarding possible mining methods, minimum mining dimensions and internal (or, if applicable, external) mining dilution. It is always necessary as part of the process of determining reasonable prospects for eventual economic extraction to consider potential mining methods, but the assumptions made regarding mining methods and parameters when estimating Mineral Resources may not always be rigorous. Where this is the case, this should be reported with an explanation of the basis of the mining assumptions made.
H&SC’s understanding based on information supplied by ADN is for an open pit mining scenario.
The proposed mining method will be a truck-shovel operation Minimum mining dimensions are the sub‐block size of 12.5m by 12.5m by
1.25m.
The current assumptions for the mining dilution and recovery for the open pit mine are 5% dilution and 95% recovery. The initial plan for mining start up will be sell the product as direct shipping ore.
For
per
sona
l use
onl
y

Drill – Discover – Develop P a g e | 41
Criteria JORC Code explanation Commentary
Metallurgical factors or assumptions
The basis for assumptions or predictions regarding metallurgical amenability. It is always necessary as part of the process of determining reasonable prospects for eventual economic extraction to consider potential metallurgical methods, but the assumptions regarding metallurgical treatment processes and parameters made when reporting Mineral Resources may not always be rigorous. Where this is the case, this should be reported with an explanation of the basis of the metallurgical assumptions made.
Preliminary testwork on alumina content and the ability to produce HPApreviously carried out with Bureau Veritas, UniSA and the University ofNewcastle showed that the Poochera/Carey’s Well product would besuitable for HPA generation with the added advantage that it gives asignificantly higher alumina mass yield than comparable Australian kaolins.
BHM Process Consultants were commissioned to undertake the necessaryconcept metallurgical investigation and future process design aspects forupgrading typical hydrous processed kaolin from Poochera/Carey’s Well to asaleable HPA product via industry standard hydrometallurgical processingroutes. BHM have specific metallurgical experience and knowledge in thefield of HPA production principles as well as being hydrometallurgicalspecialists that understand the intricate processes involved in HPAproduction.
The BHM testwork indicates that an HPA product with 99.99% purity isreadily available from Poochera/Carey’s Well kaolin/halloysite feedstockusing an industry standard HCL two‐stage dissolution‐precipitation process,with the initial testwork achieving 99.9855% alumina. Key impurities in thefirst testwork include Silicon (66.84ppm), Sodium (30.16ppm) and Iron(28.28ppm), each of which can be expected to be further reduced byprocessing improvements moving forward.
Environmental factors or assumptions
Assumptions made regarding possible waste and process residue disposal options. It is always necessary as part of the process of determining reasonable prospects for eventual economic extraction to consider the potential environmental impacts of the mining and processing operation. While at this stage the determination of potential environmental impacts, particularly for a greenfields project, may not always be well advanced, the status of early consideration of these potential environmental impacts should be reported. Where these aspects have not been considered this should be reported with an explanation of the environmental assumptions made.
A 12 month baseline flora study has already been completed and consultants are being engaged to complete all the environmental studies required for a mining licence.
The Poochera/Carey’s Well deposit area is currently utilised for grazing and cereal cropping. There are also areas of unused ground
There will be no tailings. A storage area for the overburden will be required initially. If it is decided to dry semi-processing on site at a later stage there will be approx. 50% of sand rejects that may be stockpiled or used for backfilling.
No large river systems pass through the area.
Bulk density Whether assumed or determined. If assumed, the basis for the assumptions. If determined, the method used, whether wet or dry, the frequency of the measurements, the nature, size and representativeness of the samples.
Eight samples of kaolinised granite were selected from samples held in storage at MEP’s Adelaide office. The samples were selected to represent a range of kaolinised granite types.
The samples had been in open storage for over 2 years and were considered
For
per
sona
l use
onl
y

Drill – Discover – Develop P a g e | 42
Criteria JORC Code explanation Commentary
The bulk density for bulk material must have been measured by methods that adequately account for void spaces (vugs, porosity, etc), moisture and differences between rock and alteration zones within the deposit.
Discuss assumptions for bulk density estimates used in the evaluation process of the different materials.
to be thoroughly dried. Dry samples were accurately weighed. Each sample was then completely
sealed by spraying with artist’s epoxy sealant. Several coats of spray were applied to ensure the sample was completely sealed.
Water displacement of the sample was measured by carefully lowering each sample into a modified clear plastic cylinder and collecting the displaced water i.e. a measured volume.
Bulk density was then calculated based on dry weight and volume of the sample.
The measured bulk densities were reasonably constant ranging from 1.63 to 1.81t/m3 (based on sealed weight). Sample 6 was excluded as the result is considered to be anomalous, perhaps due to incorrect measurement of the displaced water.
The average bulk density of dry Poochera kaolinised granite is determined at 1.7t/m3. This value has been used as a default density value for subsequent resource estimation.
The default density value is considered reasonable, possibly slightly conservative) although it is uncertain where the samples are from and how representative of the mineralisation they are. The number of samples is considered small and would benefit from more data.
Classification The basis for the classification of the Mineral Resources into varying confidence categories.
Whether appropriate account has been taken of all relevant factors (i.e. relative confidence in tonnage/grade estimations, reliability of input data, confidence in continuity of geology and metal values, quality, quantity and distribution of the data).
Whether the result appropriately reflects the Competent Person’s view of the deposit.
Mineral Resources have been classified on the estimation search pass category subject to assessment of other impacting factors such as drillhole spacing (variography), sampling procedures, QAQC outcomes, density measurements, geological model and previous resource estimates.
The classification appropriately reflects the Competent Person’s view of the deposit.
Audits or reviews
The results of any audits or reviews of Mineral Resource estimates. No reviews or audits have been completed.
Discussion of relative accuracy/ confidence
Where appropriate a statement of the relative accuracy and confidence level in the Mineral Resource estimate using an approach or procedure deemed appropriate by the Competent Person. For example, the application of statistical or geostatistical procedures to quantify the relative accuracy of the resource within
The Mineral Resources have been classified using a qualitative assessment of a number of factors including the geological understanding in conjunction with the simplicity of mineralisation, the drillhole spacing, sample recoveries (the lack thereof), sampling procedure, QA/QC data and density data.
For
per
sona
l use
onl
y

Drill – Discover – Develop P a g e | 43
Criteria JORC Code explanation Commentary
stated confidence limits, or, if such an approach is not deemed appropriate, a qualitative discussion of the factors that could affect the relative accuracy and confidence of the estimate.
The statement should specify whether it relates to global or local estimates, and, if local, state the relevant tonnages, which should be relevant to technical and economic evaluation. Documentation should include assumptions made and the procedures used.
These statements of relative accuracy and confidence of the estimate should be compared with production data, where available.
The Mineral Resource estimates are considered to be accurate globally, but there is some uncertainty in the local estimates due to the sample compositing (and density data) giving a lack of detailed definition of any subtle variations in the deposit.
No mining of the deposit has taken place so no production data is available for comparison.
For
per
sona
l use
onl
y
Related Documents