RIGHT SOLUTIONS | RIGHT PARTNER 2013-14 Full Year Result Investor Presentation May 2014 Greg Kilmister – CEO Paul McPhee – Group General Manager Energy Division For personal use only

Welcome message from author
This document is posted to help you gain knowledge. Please leave a comment to let me know what you think about it! Share it to your friends and learn new things together.
Transcript

RIGHT S O L U T I O N S | RIGHT PARTNER
2013-14 Full Year Result
Investor Presentation
May 2014
Greg Kilmister – CEO
Paul McPhee – Group General Manager Energy Division
For
per
sona
l use
onl
y

• This presentation has been prepared by ALS Limited, (ALS or the Company). It contains general information
about the Company’s activities as at the date of the presentation. It is information given in summary form and
does not purport to be complete. The distribution of this presentation in jurisdictions outside Australia may be
restricted by law, and you should observe any such restrictions.
• This presentation is not, and nothing in it should be construed as, an offer, invitation or recommendation in
respect of securities, or an offer, invitation or recommendation to sell, or a solicitation of an offer to buy,
securities in any jurisdiction. Neither this document nor anything in it shall form the basis of any contract or
commitment. This presentation is not intended to be relied upon as advice to investors or potential investors
and does not take into account the investment objectives, financial situation or needs of any investor. All
investors should consider such factors in consultation with a professional advisor of their choosing when
deciding if an investment is appropriate.
• The Company has prepared this presentation based on information available to it, including information
derived from public sources that have not been independently verified. No representation or warranty, express
or implied, is provided in relation to the fairness, accuracy, correctness, completeness or reliability of the
information, opinions or conclusions expressed herein.
• This presentation includes forward-looking statements within the meaning of securities laws. Any forward-
looking statements involve known and unknown risks and uncertainties, many of which are outside the control
of the Company and its representatives. Forward-looking statements may also be based on estimates and
assumptions with respect to future business decisions, which are subject to change. Any statements,
assumptions, opinions or conclusions as to future matters may prove to be incorrect, and actual results,
performance or achievement may vary materially from any projections and forward-looking statements.
• Due care and attention should be undertaken when considering and analysing the financial performance of the
Company.
• All references to dollars are to Australian currency unless otherwise stated.
IMPORTANT NOTICE AND DISCLAIMER
2RIGHT SOLUTIONS | RIGHT PARTNER
For
per
sona
l use
onl
y

Company Profile
ALS Limited (ASX:ALQ) is an ASX 100 company that provides professional technical services to
the global Metals & Mining, Life Sciences, Oil & Gas, and Industrial sectors throughout the
world. The Reward business is an Australian distributer of non-perishable hospitality supplies.
Energy Division
Industrial Division
Life Sciences Division
Minerals Division
Reward Distribution
Environmental
Food - Pharma
Electronics
Consumer Products
Geochemistry
Metallurgy
Inspection
Mine Site Services
Asset Care
Tribology
Coal
Oil & Gas
Market Capitalisation
$3.1 bn
People
12,000
Revenue
$1.5 bn
EPS
45 cents
Dividend
39 cents
3RIGHT SOLUTIONS | RIGHT PARTNER
For
per
sona
l use
onl
y

OHS&E
4RIGHT SOLUTIONS | RIGHT PARTNER
Act ual
Score
PPI Tot al
Available
PPI
Achievement
4.98 6.25 6.25
1.78 6.25 6.25
10.24 6.25 0.00
842.00 6.25 6.25
3.00 12.50 12.50
2.00 12.50 12.50
0.97 12.50 12.50
0.98 12.50 12.26
0.98 12.50 12.24
1.02 12.50 12.50
93.25
Injury
Injury
Lost Time Injury Frequency Rate
(LTIFR) for chosen level
Average days lost per Lost Time
Injury (days)
2.00
10.00
Injury
Leadership
Leadership
Near Miss Report Submitted (2 per
year)
Number of Presentations of a safety
topic to staff (base employees and
management)
Manager participation in site safety
inspections (count)
2.00
Program
Program
Training
Close out of incident reports
reported on compliance portal (%)
Close out of Annual Compliance Sign-
off Corrective Actions (%)
New Employees completing
induction training including safety
components as outlined in ALS
minimum standard (%)
Total
Completion of Compliance Training
Sessions on PULSE (%)
ALS Group Compliance Portal
PPI Chart
Profile: ALS LimitedFinancial Year: April 2013 – March 2014Total Score: 93.25%
PPI Met ric Descript ion
Total recordable injury frequency
rate (TRIFR) for chosen level
Target
Score
5.90
Met ric
Injury
2.00
2.00
0.90
1.00
1.00
1.00Training
1.8
0
2
4
6
8
10
12
14
FY
2006
FY
2007
FY
2008
FY
2009
FY
2010
FY
2011
FY
2012
FY
2013
FY
2014
Group LTIFR
ASX top 100 average = 3.6
16.0
11.49.5
0
5
10
15
20
FY 2012 FY 2013 FY 2014
Severity rate- Average days lost per LTI
LTIFR = Lost Time Injuries per million hours worked
For
per
sona
l use
onl
y

Financial Summary
AUD$mn
FY14
Statutory
Significant
Differences1
FY14
Underlying
FY13
Underlying2
Change in
Underlying
Revenue 1503.4 0 1503.4 1455.6 +3.3%
EBITDA 325.7 (13.3) 339.0 406.0 -16.5%
Depreciation &
Amortisation(83.2) (7.0) (76.2) (55.4) +37.5%
EBIT 242.5 (20.3) 262.8 350.6 -25.0%
Finance Costs (26.8) (26.8) (19.6) +36.7%
Tax Expense (59.1) 2.8 (61.9) (89.5) -30.8%
Net Profit After Tax 154.4 (17.5) 171.9 238.3 -27.9%
Basic EPS (cents) 40.7 45.3 69.7 -35.0%
1Acquisition costs, Restructuring and other one-off costs, Amortisation of Intangibles, Divestments and Impairments
2Excluding discontinued operations (Deltrex and Panamex)
5RIGHT SOLUTIONS | RIGHT PARTNER
For
per
sona
l use
onl
y
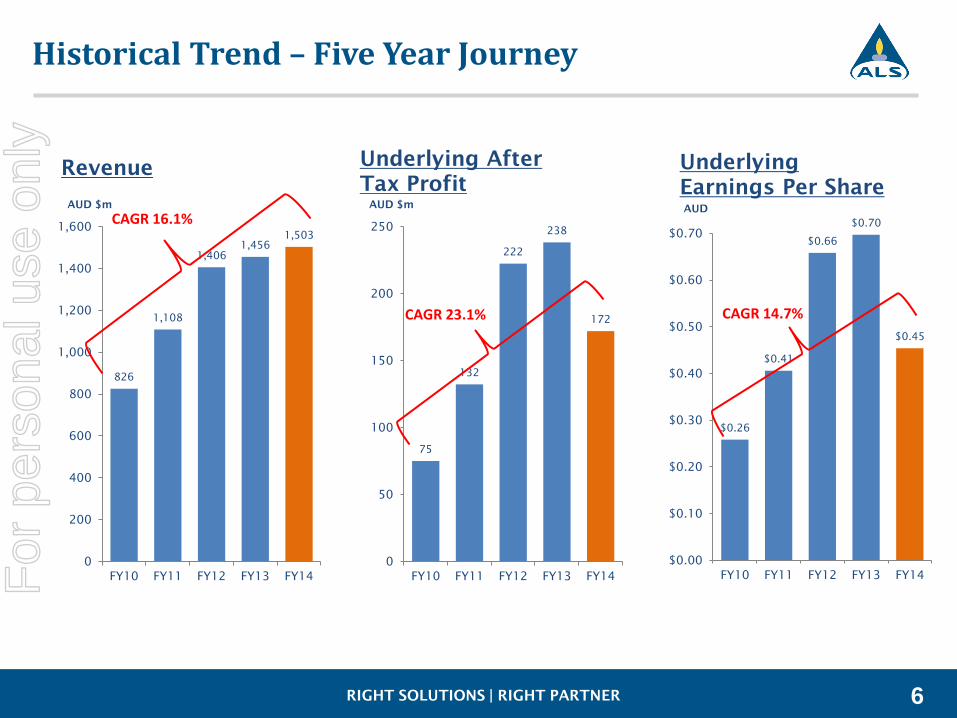
Historical Trend – Five Year Journey
826
1,108
1,406
1,456
1,503
0
200
400
600
800
1,000
1,200
1,400
1,600
FY10 FY11 FY12 FY13 FY14
AUD $m
Revenue
CAGR 16.1%
75
132
222
238
172
0
50
100
150
200
250
FY10 FY11 FY12 FY13 FY14
AUD $m
Underlying After
Tax Profit
CAGR 23.1%
$0.26
$0.41
$0.66
$0.70
$0.45
$0.00
$0.10
$0.20
$0.30
$0.40
$0.50
$0.60
$0.70
FY10 FY11 FY12 FY13 FY14
AUD
Underlying
Earnings Per Share
CAGR 14.7%
6RIGHT SOLUTIONS | RIGHT PARTNER
For
per
sona
l use
onl
y

FY14 – Revenue by Region by Division
North America
South America
Europe
Africa
Middle East
Asia
Australia
Life Sciences Division
Minerals Division
Energy Division
Industrial Division
Reward Distribution
7RIGHT SOLUTIONS | RIGHT PARTNER
For
per
sona
l use
onl
y

Foreign Currency Revenues
47%
21%
15%
5%
3%
3%3%3%
AUD
42%
USD
22%
CAD
14%
EURO
6%
GBP
7%
Krona
3%
ZAR
2%
Asia
4%
FY2014 revenue
AUD $1.503 billion
Average Exchange Rate
FY2014 FY2013 Change
USD 0.9235 1.0323 -10.5%
CAD 0.9776 1.0354 -5.6%
EURO 0.6880 0.8016 -14.2%
GBP 0.5796 0.6536 -11.3%
SEK 6.0287 6.8819 -12.4%
ZAR 9.3955 8.8238 +6.5%
SGD 1.1639 1.2806 -9.1%
Note: Krona includes SEK, NOK, DKK & FMM
Asia includes HKD, SGD, THB, MYR, IDR, CYN & TWD
Outer annulus FY14, Inner annulus FY13
8RIGHT SOLUTIONS | RIGHT PARTNER
For
per
sona
l use
onl
y

ALS (laboratories) Revenue Growth
• Organic Growth -18.0%
• Acquired Growth +17.5%
• Currency Impact +4.1%
Reported Growth 3.6%
0
250
500
750
1000
1250
Reven
ue (A
UD
$m
n)
Revenue Growth - laboratories
9
-40% -30% -20% -10% 0% 10% 20% 30% 40%
Minerals
Life Sciences
Energy
Industrial
Revenue Growth YoY
Organic Acquired FX Movement
+100%
RIGHT SOLUTIONS | RIGHT PARTNER
For
per
sona
l use
onl
y

9
13
1921
19
11
15
26
27
20
0
10
20
30
40
50
FY10 FY11 FY12 FY13 FY14
AUD
cents
Dividend
Full Year Dividend per Share
18% CAGR
• Payout ratio 93%
• Franked to 50%
• Dividend Reinvestment Plan
retained at 5% discount
10RIGHT SOLUTIONS | RIGHT PARTNER
For
per
sona
l use
onl
y

CAPEX (excluding land & building purchases) and Depreciation
11
$0
$5
$10
$15
$20Mill
ion
s
CAPEX Vs Depreciation & Amortisation1
Minerals Life Sciences Industrial Energy
CAPEX as a % of D&A
22% 91% 126% 70% 71% 58% 106% 64%
• Capacity CAPEX reduced substantially
in line with market conditions
• Replacement CAPEX being maintained
for inevitable market upswing
• Research and Development CAPEX
being maintained
• Higher near-future CAPEX required in
Oil & Gas and Food businesses during
the development phase
• Stronger business stream focus on
Return on Capital Employed
• Most major (hub) laboratory upgrades
now completed allowing footprint for
significant future capacity increases
1Amortisation does not include amortisation of goodwill
Reservoir Group acquired--
RIGHT SOLUTIONS | RIGHT PARTNER
For
per
sona
l use
onl
y

0
50
100
150
200
250
300
350
400
450
EBITDA Cash
Flow
EBITDA Cash
Flow
. EBITDA Cash
Flow
AUD$m
Cash Flow
Underlying EBITDA $328mn -19%
Operating Cash Flow $346mn -6%
CAPEX (excl. land & buildings) $68mn -16%
FY12 FY13 FY14
Cash Flow and Funding
Mar-14 Mar-13
Statistics
Gearing Ratio Comfort 45% 33.9% 29.3%
Leverage (net debt / EBITDA) Max 3.00 2.2 1.0
EBITDA interest cover Min 3.75 12.2 20.7
Balance Sheet Measures ($ mn)
Total Equity 1,419 997
Net debt 729 413
0
50
100
150
200
250
300
2014 2015 2016 2017 2018 2019 2020 2021 2022
AUD$m
Debt Maturity
21%
6%
3%
23%
26%
21%
12RIGHT SOLUTIONS | RIGHT PARTNER
For
per
sona
l use
onl
y

0
2,000
4,000
6,000
8,000
10,000
12,000
14,000
Q1FY12
Q2FY12
Q3FY12
Q4FY12
Q1FY13
Q2FY13
Q3FY13
Q4FY13
Q1FY14
Q2FY14
Q3FY14
Q4FY14
Environmental Food/Pharma Consumer Products Geochemistry
Metallurgy Inspection Engineering Coal Oil & Gas
Asset Care Tribology Reward Distribution
Employee Numbers - total head count
• Mineral Division head count down by 46%
from peak in June 2012…but expertise and
management structure retained
• Life Sciences Division head count growing as
we enter new geographies (South America,
United Kingdom) and develop Food/Pharma
footprint
• Coal business stream head count down by
38% from peak in September 2012…but
underlying capabilities and service coverage
maintained
• +1000 staff added due to move into the Oil
& Gas sector
Africa
Asia
Australia
Europe
Middle East
North America
South America
13RIGHT SOLUTIONS | RIGHT PARTNER
For
per
sona
l use
onl
y

Margin – peer comparison
18.8%
16.8% 16.7%
15.7%
13.2%
5.8%
31.1%
24.3%
21.9%
20.5%
19.0%
15.4%
12.9%
33.4%
0%
5%
10%
15%
20%
25%
30%
35%
ALS SGS B.V. Intertek Eurofins Mistras Core Labs
EBIT EBITDA
Note: FY Dec 13 for all companies excluding ALS (FY Mar 14) and MISTRAS (FY Jun 13)
EBIT and EBITDA underlying margins
Data from company reports
14RIGHT SOLUTIONS | RIGHT PARTNER
For
per
sona
l use
onl
y

0
200
400
600
800
1,000
1,200
1,400
1,600
0
200
400
600
800
1,000
1,200
1,400
1,600
FY04 FY05 FY06 FY07 FY08 FY09 FY10 FY11 FY12 FY13 FY14
Cum
ulative N
et M
&A
Spend $
million
PealStreet Ltd.
Dec-09
Ecowise
Environmental
Pty Ltd..
Nov-09
Campbell
Brothers Ltd.,
Major Laundry
& Detergent
Brands
Oct-04
QCC
Hospitality
Aug-04
Ecochem
Jan-06
ETL Group
Jan-06
Caterworld
Jan-06
QCC
Hospitality
Jun-05
McCarthys
Feb-07
Campbell
Brothers Ltd.,
Pest Control &
Washroom
Services
Jan-07
Consulchem
Nov-06
Abilab
Nov-06
Pandee
Services
Sep-06
Analytica AB
Jul-06
Witlab
Nov-07
ACIRL Pty Ltd
Oct-07
eLab
Analytical Inc.
Aug-07
JK Tech
Mineralogy
Aug-07
DataChem
Oct-08
IQA
May-08
Stavely
Services
May-08
Microtech
Technical
Services Ltd.
Apr-08
Analytical
Laboratory
Services Inc.
Dec-10
Ammtec Ltd.
Nov-10
Campbell
Brothers
Limited
Cleantec
Business
Nov-10
LabMark
Environmental
Laboratories
May-10
Columbia
Analytical
Services
Nov-11
Austpower
Engineering.
Oct-11
PearlStreet
Energy
Services
Jul-11
Stewart Group
Jul-11
PMS Micro
Jun-11
Severn Trent
Laboratories
Feb-13
Corplab
Laboratories.
Dec-12
Panamex
Pacific
Oct-12
Deltrex
Chemicals
Sep-12
Artek
Laboratories
Aug-12
Milana A.S.
Jul-12
Eclipse
Scientific
Group
Apr-12
BMP
Enterprises
Feb-14
ALS Taiwan
Jan-14
OilCheck Pty
Ltd.
Oct-13
AIT
Oct-13
Reservoir
Group Ltd.
Aug-13
PSI Inc.
Aug-13
EarthData Pty
Ltd.
Jul-13
Reliance
May-13
Environmental Food/Pharma Consumer Products Geochemistry Metallurgy Inspection Engineering Oil & Gas
Coal Asset Care Tribology Reward Distribution Chemical Campbell Brothers Services
FY2005
revenue
$448m
FY2009
revenue
$951m
FY2014
revenue
$1,503m
Revenue $
million
Acquisition
Divestment
ALS journey over the last decade
15RIGHT SOLUTIONS | RIGHT PARTNER
For
per
sona
l use
onl
y

-
200
400
600
800
1,000
1,200
1,400
FY06 FY07 FY08 FY09 FY10 FY11 FY12 FY13 FY14
AU
D$
m
illio
ns
-
50
100
150
200
250
300
350
400
450
FY06 FY07 FY08 FY09 FY10 FY11 FY12 FY13 FY14
AU
D$
m
illio
ns
Growth of non-Minerals Divisions
Life Sciences Energy Industrial Minerals
Lab Services Revenue Lab Services EBITDA
The non-Minerals revenue of ALS lab services is now more than ALS’ entire lab services revenue just three
years ago
Non-Mineral EBITDA margin
21% 21% 24% 20% 24% 23% 25% 25% 24%
16RIGHT SOLUTIONS | RIGHT PARTNER
For
per
sona
l use
onl
y

Overview
• Geochemistry EBIT margin 26.0% for full year
• Rationalization of Hub and Spoke laboratories to protect
margin
• Inspection EBIT margin improved from 9.5% to 20.3% YoY
• New metallurgical facility in Santiago (Chile) fully
operational
• Joint Venture Inspection business established in Tianjin
(China) now fully operational
• Mine Site strategy working
Outlook
• Improved margin performance in Metallurgy and
Inspection in FY15
• Geochemical sample flow to be down in H1FY15 pcp
before recovering in H2 to be flat pcp for full year
• Increase in market share due to new services and cyclical
recovery in H2
• Pricing to remain flat
• Focus on better data management/presentation for
clients
• Pipeline of Mine Site opportunities remains strong
2014 2013 Change
Revenue $426mn $608mn -30%
EBITDA $126mn $234mn -46%
EBIT $102mn $212mn -52%
EBIT Margin 24.0% 34.9%
Minerals Division
0
100
200
300
400
500
600
FY09 FY10 FY11 FY12 FY13 FY14
Revenue (A
UD
$m
n)
Geochemistry Metallurgy Inspection Other
17
geochemistry
metallurgy
inspection
mine site services
RIGHT SOLUTIONS | RIGHT PARTNER
For
per
sona
l use
onl
y

Overview
• Pricing pressure in Australia and Canada
• 6% organic growth in environmental revenue in Europe
• Operational issues in South America fixed
• Centre of Excellence (GLP laboratory) in Edmonton closed
• Exited Taiwan market
• New laboratory in Beijing - China
• New global Food LIMS and client portal developed
• Food/Pharma revenue grew 10% to $57mn
Outlook
• US market to continue improving
• New hub food chemistry lab to open in England in June
2014
• Focus on growing business in Latin America
• Acquisitions in the food sector
• Geographic expansion of environmental business
2014 2013 Change
Revenue $527mn $454mn +16%
EBITDA $124mn $114mn +9%
EBIT $94mn $90mn +5%
EBIT Margin 17.9% 19.9% -200bps
Life Sciences Division
0
100
200
300
400
500
600
FY10 FY11 FY12 FY13 FY14
Revenue (A
UD
$m
n)
Asia Australia Europe North America South America
CAGR 20.3%
18
environmental
food/pharma
electronics
consumer products
RIGHT SOLUTIONS | RIGHT PARTNER
For
per
sona
l use
onl
y

Overview
• Successful acquisition and integration of the Reservoir
Group and EarthData
• Operations in 60 countries with 1,650 staff
• Coring – soft in North America in Q4FY14
• Oil & Gas EBITDA 25.3% - weaker than expected
Outlook
• Australian coal market to remain challenging
• Oil & Gas operations to balance exploration Vs
production
• Margin improvement in Oil & Gas as integration benefits
flow
• Australian coal production and exports expected to grow
• Integration of Oil & Gas service offerings and geographic
leverage
2014 2013 Change
Revenue $248mn $105mn +136%
EBITDA $69.2mn $36.1mn +92%
EBIT $53.5mn $32.6mn +64%
EBIT Margin 21.6% 31.1% -950bps
Energy Division
0
50
100
150
200
250
FY10 FY11 FY12 FY13 FY14
Revenue (A
UD
$m
n)
Asia Australia Europe
North America South America Africa
Middle East
19
coal
oil & gas
RIGHT SOLUTIONS | RIGHT PARTNER
For
per
sona
l use
onl
y

Overview
• Revenue mix shifted from “outage” to construction
• Australian market price sensitivity impacted margins
• Declining power and welding & fabrication markets -
higher margin work
• Significant mobilization costs for LNG projects
• strong recovery in H2
• third LNG project secured in Feb-14
• Demand for in-service plant inspection continued to
grow
• Epicor (Asset Care LIMS) rolled out to 90% of sites
• OilCheck and AIT integrations completed
Outlook
• Restructured Asset Care business along market segment
lines cf. geographies - creating better focus and client
alignment
• Australian market to remain challenging
• Mining sector very cost focused
• Leveraging capabilities of AIT into Australian
construction projects
• Tribology to continue growing in line with previous years
2014 2013 Change
Revenue $183mn $169mn +8%
EBITDA $31.6mn $35.4mn -11%
EBIT $26.4mn $30.7mn -14%
EBIT Margin 14.4% 18.2% -380bps
Industrial Division
0
40
80
120
160
200
FY10 FY11 FY12 FY13 FY14
Revenue (A
UD
$m
n)
Australia South America North America
20
asset care
tribology
RIGHT SOLUTIONS | RIGHT PARTNER
For
per
sona
l use
onl
y
Related Documents