For Official Use MPSC/2021/2 1 Global Green Growth Institute Thirteenth Meeting of the Management and Program Sub-Committee June 7-11, 2021 │ E-Consultations June 17, 2021 │ Virtual Meeting E-Consultations Item #2 Results Report 2020 PURPOSE/ACTION REQUIRED Members of the MPSC will be invited to (please tick the relevant boxes and type in the details): ☒ Take note of the Results Report 2020 ☒ Provide feedback on the Results Report 2020 ☐ Endorse and recommend to Council __________ ☐ Other (please specify) _________ CONTEXT/BACKGROUND The Secretariat will present the 2020 Results Report on the programmatic and business (non- programmatic) results that GGGI achieved and delivered in 2020, primarily through its Work Program and Budget (WPB) 2019-2020. The 2020 Results Report includes the new country score cards which provide a summary highlighting the key CRF 2020 results of each country program including its project and budget performance. The Report covers a total of 148 country and global projects that were implemented in 2020. SUMMARY Despite the adverse global impact of the COVID-19 pandemic, GGGI outperformed its CRF targets for 2020 and ambitions in its Refreshed Strategy 2015-2020. Among its key achievements were the completion of a record number of 119 advisory outputs that informed the development of green growth policies, the delivery of 52 advisory outputs that informed decisions on green growth investments, and the adoption of 54 policies prepared by GGGI by Members and partner governments. By the end of 2020, GGGI had successfully catalyzed a cumulative total of USD 2.06 billion from 67 green investments deals since 2015. This increase was the result of the USD 476 million in green investment commitments catalyzed in 2020. Despite the pandemic, GGGI delivered 198 capacity building activities (with 42,415 participants mainly through virtual events) and published 155 knowledge products in the form of reports, toolkits, methodologies, and knowledge sharing with the aim of advancing the global green growth agenda and global and national actions. Also, 82 projects in 2020 included design features that addressed the various elements of social inclusion including poverty reduction, social safeguards, and gender equality. For the first time, GGGI published the attribution and contribution Strategic Outcome (SO) ex-ante project impacts in 2020 and its cumulative program impacts between 2017 and 2020. These initial SO impact results are collected for the first time and contain some “order-or-magnitude” estimates which will be improved in the next one to two years. There were other additional results that boosted GGGI’s achievements in 2020. GGGI supported Members and partner countries on green pandemic recovery

Welcome message from author
This document is posted to help you gain knowledge. Please leave a comment to let me know what you think about it! Share it to your friends and learn new things together.
Transcript

For Official Use MPSC/2021/2
1
Global Green Growth Institute
Thirteenth Meeting of the Management and Program Sub-Committee
June 7-11, 2021 │ E-Consultations
June 17, 2021 │ Virtual Meeting
E-Consultations Item #2
Results Report 2020
PURPOSE/ACTION REQUIRED
Members of the MPSC will be invited to (please tick the relevant boxes and type in the details):
☒ Take note of the Results Report 2020 ☒ Provide feedback on the Results Report 2020
☐ Endorse and recommend to Council
__________
☐ Other (please specify) _________
CONTEXT/BACKGROUND
The Secretariat will present the 2020 Results Report on the programmatic and business (non-
programmatic) results that GGGI achieved and delivered in 2020, primarily through its Work Program
and Budget (WPB) 2019-2020. The 2020 Results Report includes the new country score cards which
provide a summary highlighting the key CRF 2020 results of each country program including its
project and budget performance. The Report covers a total of 148 country and global projects that were
implemented in 2020.
SUMMARY
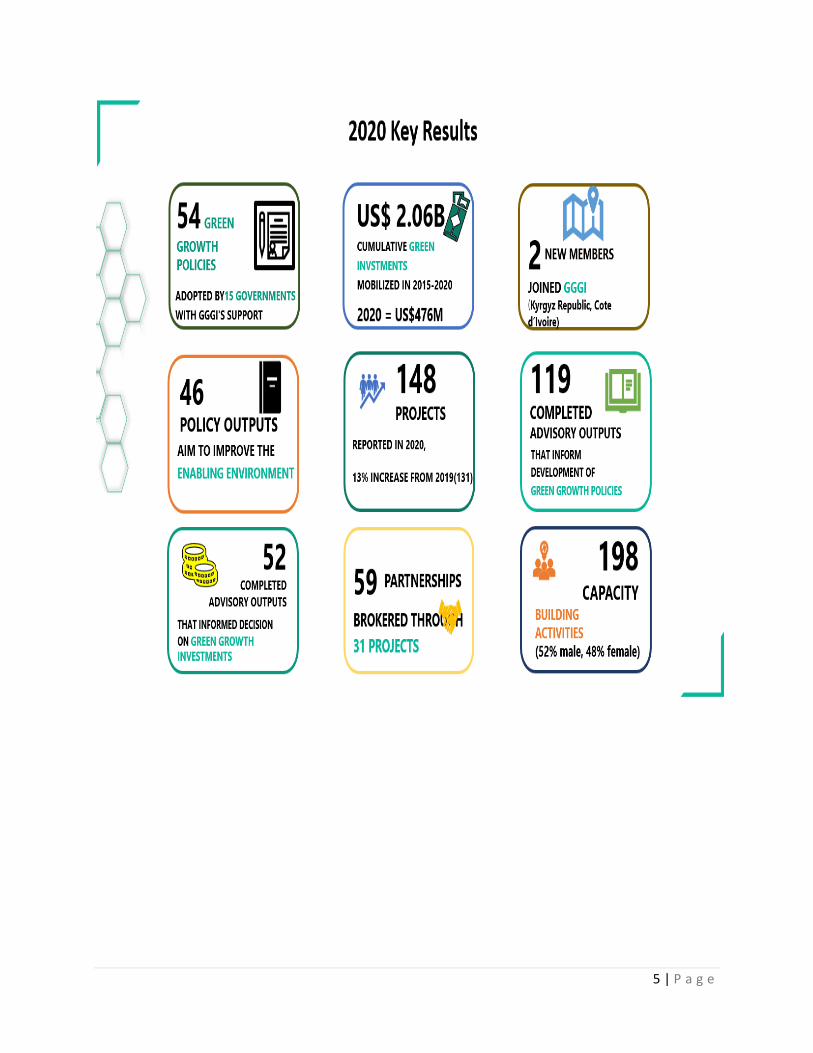
Despite the adverse global impact of the COVID-19 pandemic, GGGI outperformed its CRF targets for
2020 and ambitions in its Refreshed Strategy 2015-2020. Among its key achievements were the
completion of a record number of 119 advisory outputs that informed the development of green growth
policies, the delivery of 52 advisory outputs that informed decisions on green growth investments, and
the adoption of 54 policies prepared by GGGI by Members and partner governments. By the end of
2020, GGGI had successfully catalyzed a cumulative total of USD 2.06 billion from 67 green
investments deals since 2015. This increase was the result of the USD 476 million in green investment
commitments catalyzed in 2020. Despite the pandemic, GGGI delivered 198 capacity building
activities (with 42,415 participants mainly through virtual events) and published 155 knowledge
products in the form of reports, toolkits, methodologies, and knowledge sharing with the aim of
advancing the global green growth agenda and global and national actions. Also, 82 projects in 2020
included design features that addressed the various elements of social inclusion including poverty
reduction, social safeguards, and gender equality.
For the first time, GGGI published the attribution and contribution Strategic Outcome (SO) ex-ante
project impacts in 2020 and its cumulative program impacts between 2017 and 2020. These initial SO
impact results are collected for the first time and contain some “order-or-magnitude” estimates which
will be improved in the next one to two years. There were other additional results that boosted GGGI’s
achievements in 2020. GGGI supported Members and partner countries on green pandemic recovery

For Official Use MPSC/2021/2
2
plans through the development of New Green Deals and the provision of various tools and frameworks
to guide policy responses. In terms of resources mobilization, GGGI signed new earmarked funding
agreements worth USD 79 million in 2020 of which GGGI will implement USD 67.2 million. Another
major area of work for GGGI in 2020 was on Nationally Determined Contributions (NDC)
enhancement where the organization provided a range of support to 29 Members and partner countries.
GGGI continues to thrive and focus on the benefits generated by lessons learned to continue to improve
our project management and business processes and stays motivated by a continuing commitment to be
a results-based organization with increased scalability and “impactfulness” in its programmatic
interventions and results.

1 | P a g e

2 | P a g e
TABLE OF CONTENTS
Table of Contents ..................................................................................................................................................... 2
Acronyms .................................................................................................................................................................... 3
Executive Summary .................................................................................................................................................. 6
1.0 Introduction ........................................................................................................................................................ 7
2.0 Strategy and Results Framework .................................................................................................................. 8
3.0 Work Program and Budget 2019-2020 .................................................................................................. 10
4.0 Alignment of Projects to the Strategic Outcomes and SDGs .............................................................. 11
5.0 2020 Corporate Results and Impact ........................................................................................................ 12
6.0 COVID-19 Impact and Recovery Effort ..................................................................................................... 24
7.0 Other Key Results and Achievements ....................................................................................................... 27
8.0 Maximizing Organizational Effectiveness and Efficiency ...................................................................... 30
9.0 Country Scorecards ....................................................................................................................................... 31
Annex 1: Corporate Results Framework 2015-2020 ................................................................................ 101
Annex 2: 2020 Work Program Budget and Expenditure .......................................................................... 104
Annex 3: Completed Green Growth Advisory Outputs .............................................................................. 105
Annex 4: Adopted Green Growth Policies ..................................................................................................... 112
Annex 5: Update and Status of Green Investments Catalyzed: 2017-2019 ........................................ 115

3 | P a g e
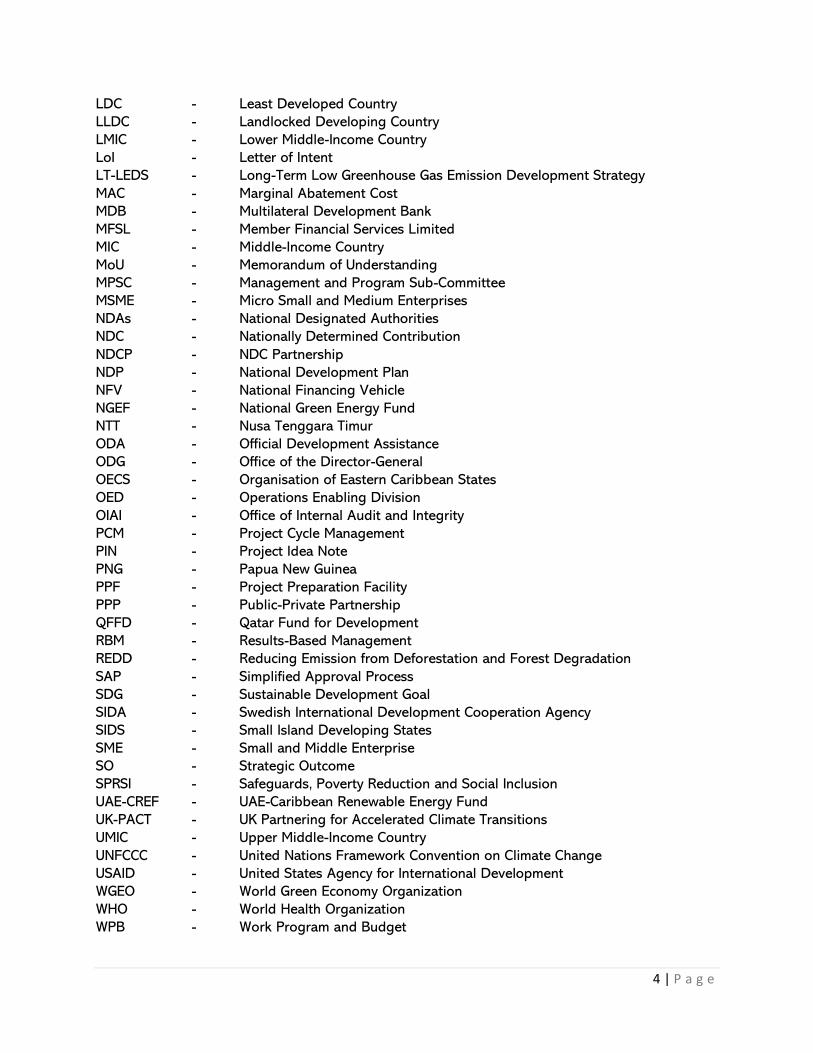
ACRONYMS
ADB - Asian Development Bank
ADFD - Abu Dhabi Fund for Development
AF - Adaption Fund
AFD - Agence Française de Développement
BRT - Bus Rapid Transit
CAEP - Climate Action Enhancement Package
CAID - Climate Action and Inclusive Development
CBA - Cost-Benefit Analysis
CBP - Country Business Plan
CPF - Country Planning Framework
CPRR - Country Program Results Report
CRF - Corporate Results Framework
CRGG - Climate-Resilient Green Growth
CRM - Customer Relationship Management
CSO - Civil Society Organization
DANIDA - Danish International Development Agency
DFAT - Department of Foreign Affairs and Trade
DFID - Department for International Development
EOY - End of Year
EU - European Union
FCPF - Forest Carbon Partnership Facility
FDB - Fiji Development Bank
FUNBAM - Environment Foundation Bank
FORNEWA - Rwanda Environment and Climate Change Fund
GAP - Growth Assessment Process
GBP - Global Business Plan
GCF - Green Climate Fund
GDP - Gross Domestic Product
GESI - Gender Equality and Social Inclusion
GGGI - Global Green Growth Institute
GGKP - Green Growth Knowledge Platform
GGPI - Green Growth Planning and Implementation
GHG - Green House Gas
GIAS - Green Investment Advisory Support
GIPD - Green Infrastructure Planning and Delivery
GIS - Green Investment Services
GO - GGGI Online
IDB - Inter-American Development Bank
iGROW - Business process reforms working group
IEU - Impact Evaluation Unit
IMELS - Italian Ministry for Environment, Land and Sea Protection
IO - Intermediate Outcome
IPA - Impact Pathway Approach
IPSD - Investment and Policy Solutions Division
KOICA - Korea International Cooperation Agency
4 | P a g e
LDC - Least Developed Country
LLDC - Landlocked Developing Country
LMIC - Lower Middle-Income Country
LoI - Letter of Intent
LT-LEDS - Long-Term Low Greenhouse Gas Emission Development Strategy
MAC - Marginal Abatement Cost
MDB - Multilateral Development Bank
MFSL - Member Financial Services Limited
MIC - Middle-Income Country
MoU - Memorandum of Understanding
MPSC - Management and Program Sub-Committee
MSME - Micro Small and Medium Enterprises
NDAs - National Designated Authorities
NDC - Nationally Determined Contribution
NDCP - NDC Partnership
NDP - National Development Plan
NFV - National Financing Vehicle
NGEF - National Green Energy Fund
NTT - Nusa Tenggara Timur
ODA - Official Development Assistance
ODG - Office of the Director-General
OECS - Organisation of Eastern Caribbean States
OED - Operations Enabling Division
OIAI - Office of Internal Audit and Integrity
PCM - Project Cycle Management
PIN - Project Idea Note
PNG - Papua New Guinea
PPF - Project Preparation Facility
PPP - Public-Private Partnership
QFFD - Qatar Fund for Development
RBM - Results-Based Management
REDD - Reducing Emission from Deforestation and Forest Degradation
SAP - Simplified Approval Process
SDG - Sustainable Development Goal
SIDA - Swedish International Development Cooperation Agency
SIDS - Small Island Developing States
SME - Small and Middle Enterprise
SO - Strategic Outcome
SPRSI - Safeguards, Poverty Reduction and Social Inclusion
UAE-CREF - UAE-Caribbean Renewable Energy Fund
UK-PACT - UK Partnering for Accelerated Climate Transitions
UMIC - Upper Middle-Income Country
UNFCCC - United Nations Framework Convention on Climate Change
USAID - United States Agency for International Development
WGEO - World Green Economy Organization
WHO - World Health Organization
WPB - Work Program and Budget
5 | P a g e

6 | P a g e
EXECUTIVE SUMMARY
The purpose of the 2020 Results Report is to present the programmatic and business (non-
programmatic) results and achievements that the Global Green Growth Institute (GGGI) delivered in
2020, primarily through its Work Program and Budget (WPB) 2019-2020. The Report includes the
new country scorecards, which provide a health assessment summary of each country program
covering its project performance, budget performance and key results achieved. This Report covers
a total of 148 country and global projects that were implemented in 2020.
Despite the difficulties and challenges posed by the COVID-19 pandemic, GGGI delivered a very solid
performance in 2020 outperforming its annual CRF targets as well as its ambitions and targets in
the Refreshed Strategy. Among its key achievement were the completion of a record number of 119
advisory outputs that informed the development of green growth policies, delivery of 52 advisory
outputs that informed decisions on green growth investments, and Members and partner
governments adopted 54 policies prepared by GGGI. By the end of 2020, GGGI had successfully
catalyzed a cumulative total of USD 2.06 billion from 67 green investments deals since 2015. This
increase was the result of the USD 476 million in green investment commitments that were catalyzed
in 2020. GGGI contributed to and played a key role in strengthening capacity and advocacy of its
Members in respect to green growth. Amid unprecedented externalities, GGGI was committed to
delivering 198 capacity building activities (with 42,415 participants mainly through virtual events),
and publishing 155 knowledge products in the form of reports, toolkits, methodologies, and
knowledge sharing with the aim of advancing the global green growth agenda and global and
national actions. Furthermore, 82 projects reported addressing the various elements of social
inclusion including poverty reduction, social safeguards, and gender equality. On the back of this
strong performance, GGGI also reported for the first time its attribution and contribution Strategic
Outcome (SO) ex-ante impacts in 2020 and its cumulative impacts between 2017 and 2020.
Although these initial SO impact results are still raw figures which will be improved in 1 to 2 years,
they show that GGGI has already exceeded its 2022 SO attribution impact targets for SO1, SO5 and
SO6. GGGI also expanded its membership by two countries in 2020 to include the Kyrgyz Republic
and Cote d’Ivoire bringing its total membership to 39 with operations in more than 30 countries.
There were other additional results that boosted GGGI’s achievements in 2020. GGGI supported
Members and partner countries to green pandemic recovery plans, including through the
development of New Green Deals and the provision of various tools and framework to guide policy
responses. In terms of resources mobilization, GGGI signed new earmarked funding agreements
worth USD 79 million in 2020 of which GGGI will implement USD 67.2 million. Another major area
of work for GGGI in 2020 was on Nationally Determined Contributions (NDC) enhancement where
GGGI provided a range of support to 29 Members and partner countries.
In 2020, GGGI continued to improve its business processes and systems including improving the
Project Cycle Management (PCM) 2 and 3, strengthening its project monitoring and reporting system,
modification of GGGI Online, its new project management information system and upgrading its
digital communications virtual meeting system. The Institute’s motivation was underpinned by a
continuing commitment to be a results-based organization with increased scalability and
impactfulness in its programmatic interventions and results. Overall, GGGI outperformed its goals
and delivered strong results in 2020, reflecting the organization’s ability to respond swiftly with
effective measures to maintain its program delivery and ensure sound financial and business
performance during a very difficult year.
7 | P a g e
1.0 INTRODUCTION
This is a report on GGGI’s 2020 corporate results and impacts that were achieved in the second year
of its biennium WPB 2019-2020. The results achieved were measured against the output, outcome
and SO impact indicators and targets in the Refreshed CRF 2015-2020. These results are used to
track the progress and delivery of GGGI’s strategic goals, and to be transparent and accountable to
donors, development partners and stakeholders on its performance and achievements.
The year 2020 was difficult all around as the COVID-19 pandemic unfolded to become the most
serious and unprecedented global economic, social and health crises of all time, which directly
impacted Members and caused disruptions to GGGI’s business operations. Nevertheless, under the
circumstances, GGGI responded swiftly and effectively focusing on supporting green recovery plans
for Members, adopting smarter ways to do business, and improving project implementation. More
importantly, GGGI demonstrated a solid performance despite the circumstances and achieved results
that outperformed its Strategy and CRF targets not only for 2020 but cumulatively for the last six
years.
The year 2020 was a transition year for GGGI as it crossed over from completing its first 6-year Strategy to the implementation of the new 10-year Strategy 2030 from January 1, 2021. During the year, GGGI took major progressive steps to shift its results reporting to the country program level focusing primarily on the outcomes and SO impact achieved in every country program using the Impact Pathway Approach (IPA). The impact pathway is the GGGI term for a results framework or theory of change at the country program level. It shows key outcomes and impact of the country program, grouped by programmatic solution areas, and aims to progressively capture all key outcomes/impacts from 2017-2030, aligning with the period of targets in GGGI’s Strategy 2030. To enable this, we have ensured the adoption of SOs in our project portfolio and proposals, and it will therefore emerge in our results reporting through the new Country Program Results Report (CPRR) that we have adopted. The end game is to have impact pathways and results in terms of SOs for every country program in 1 to 2 years. In addition, we have included for the first time the use of country scorecards in this report which presents a broader range of data and information than previously. These include key CRF results such as policy and investment work, actual budget spending and resources mobilized to assess the health of a country program. The 2020 annual results were compiled and aggregated from the End of Year (EOY) Country Program Reports submitted by the Country Teams in two parts: first, the submission of SO impact estimates through the CPRR; and second, the CRF results and progress of previous years’ green investment commitments using the modified online questionnaire in GGGI Online. The Strategy Unit in the Office of the Director-General (ODG) is responsible for processing and validating the results data and putting together the Results Report. The report consists of 9 chapters which cover: an overview of GGGI’s strategic and results framework,
WPB 2019-2020, 2020 projects in alignment with NDCs and SDGs, 2020 corporate results and
impact, other key results, COVID-19 impact and recovery, the organization’s institutional
effectiveness and efficiency, and the country scorecards.
8 | P a g e
2.0 STRATEGY AND RESULTS FRAMEWORK
GGGI’s 2020 corporate results represent its program and business achievements during the second
year of the biennium WPB 2019-2020 which was implemented within the framework of the
Refreshed Strategic Plan 2015-2020. The Refreshed Strategy has set the strategic direction and
program priorities for GGGI over the past six years since 2015, and 2020 was the final year of its
implementation. The Strategy focuses GGGI’s programmatic interventions on six SOs, which represent
the target impact areas where GGGI will make direct and indirect contribution to its Members and
partners’ achievement of the Sustainable Development Goals (SDGs) and NDCs.
The six SOs are:
i. Greenhouse Gas (GHG) emissions reduction.
ii. Creation of green jobs.
iii. Increased access to sustainable services such as clean affordable energy, sustainable public
transport, improved sanitation, and sustainable waste management.
iv. Improved air quality.
v. Adequate supply of ecosystem services.
vi. Enhanced adaptation to climate change.
The Strategy is cascaded down for implementation and action at the country level through the 5-
year Country Planning Frameworks (CPFs) and 2-year Country Business Plans (CBPs) which set the
countries’ program and project priorities in consultation with 39 Member countries and regional
integration organizations. The 2020 country and global programs and projects were developed
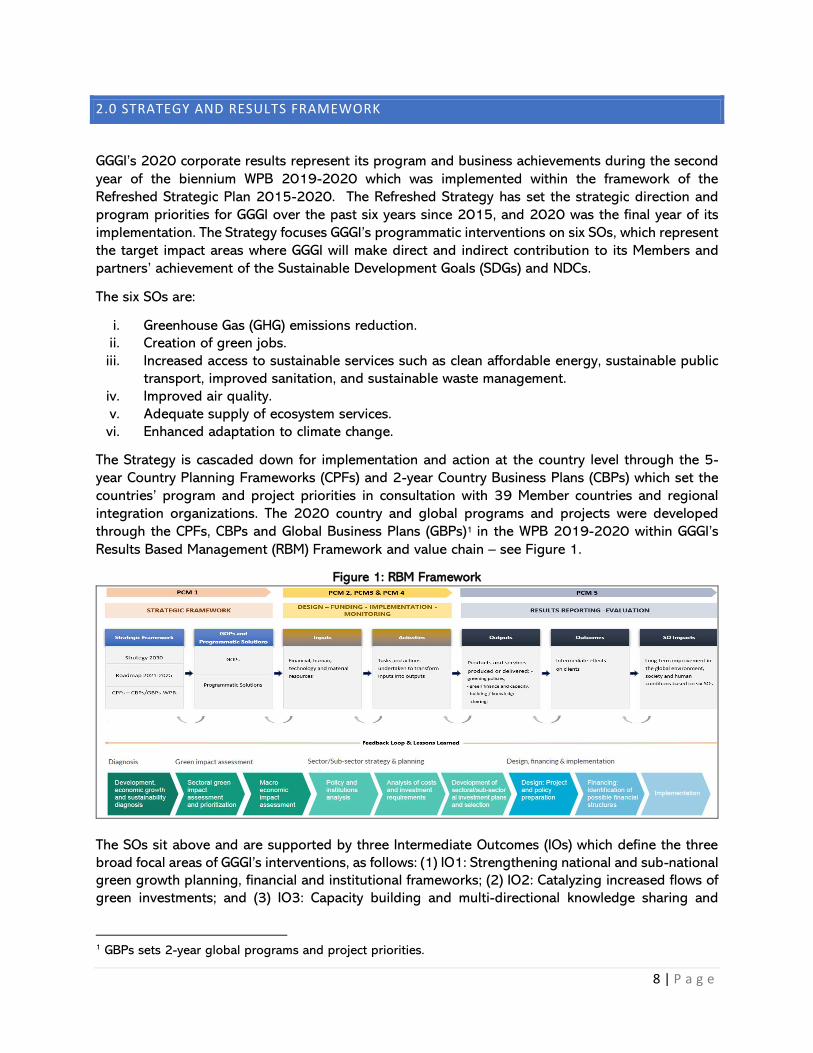
through the CPFs, CBPs and Global Business Plans (GBPs)1 in the WPB 2019-2020 within GGGI’s
Results Based Management (RBM) Framework and value chain – see Figure 1.
Figure 1: RBM Framework
The SOs sit above and are supported by three Intermediate Outcomes (IOs) which define the three
broad focal areas of GGGI’s interventions, as follows: (1) IO1: Strengthening national and sub-national
green growth planning, financial and institutional frameworks; (2) IO2: Catalyzing increased flows of
green investments; and (3) IO3: Capacity building and multi-directional knowledge sharing and
1 GBPs sets 2-year global programs and project priorities.
9 | P a g e
learning. GGGI’s programs are designed to deliver one or more of these three IOs under four core
thematic areas, namely, energy, sustainable landscapes, water and sanitation, and green cities. GGGI’s
programs and projects are delivered within the above thematic areas at the outputs, outcomes and
impact levels along the value chain following the PCMs 1-5 process. These levels of results, which
are reported annually through the End of Year (EOY) projects results reports, are then aggregated,
and measured against the CRF 2019-2020 and presented in both the annual results report and the
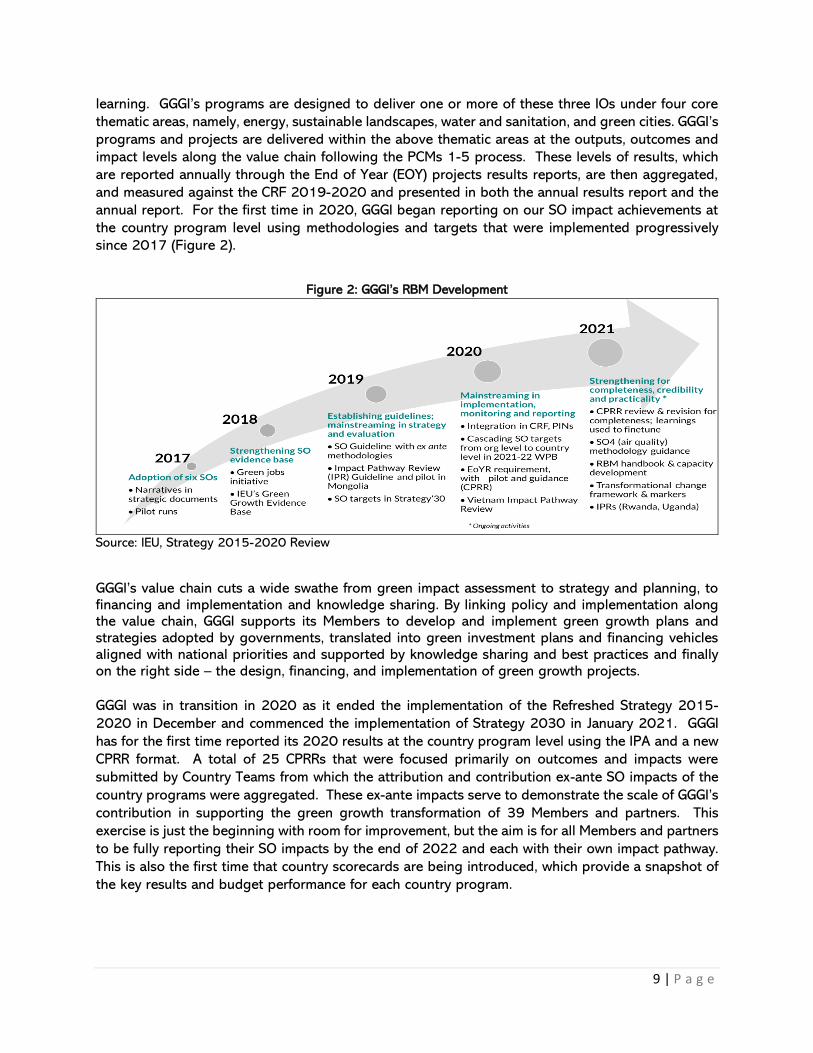
annual report. For the first time in 2020, GGGI began reporting on our SO impact achievements at
the country program level using methodologies and targets that were implemented progressively
since 2017 (Figure 2).
Figure 2: GGGI’s RBM Development
Source: IEU, Strategy 2015-2020 Review
GGGI’s value chain cuts a wide swathe from green impact assessment to strategy and planning, to financing and implementation and knowledge sharing. By linking policy and implementation along the value chain, GGGI supports its Members to develop and implement green growth plans and strategies adopted by governments, translated into green investment plans and financing vehicles aligned with national priorities and supported by knowledge sharing and best practices and finally on the right side – the design, financing, and implementation of green growth projects. GGGI was in transition in 2020 as it ended the implementation of the Refreshed Strategy 2015-
2020 in December and commenced the implementation of Strategy 2030 in January 2021. GGGI
has for the first time reported its 2020 results at the country program level using the IPA and a new
CPRR format. A total of 25 CPRRs that were focused primarily on outcomes and impacts were
submitted by Country Teams from which the attribution and contribution ex-ante SO impacts of the
country programs were aggregated. These ex-ante impacts serve to demonstrate the scale of GGGI’s
contribution in supporting the green growth transformation of 39 Members and partners. This
exercise is just the beginning with room for improvement, but the aim is for all Members and partners
to be fully reporting their SO impacts by the end of 2022 and each with their own impact pathway.
This is also the first time that country scorecards are being introduced, which provide a snapshot of
the key results and budget performance for each country program.
10 | P a g e
3.0 WORK PROGRAM AND BUDGET 2019-2020
The WPB 2019-2020 is the main programming and budgeting tool for implementing GGGI’s
strategies outlined in the Refreshed Strategic Plan 2015-2020. GGGI’s total budget expenditure in
2020 was USD 43 million funded through a mix of core and earmarked funds.
The WPB 2019-2020 has two components: (1) a policy component which lays out the planning
directions and strategic goals cascading from the CPFs and CBPs that GGGI will pursue during the
biennium period 2019-2020, thus shaping the programs and projects to be implemented; and (2)
the allocation of the budget, including financial and human resources, to support the implementation
of approved programs and projects, and enable GGGI’s operations.
The WPB 2019-2020 was the first WPB to be developed and implemented under the new envelope
method, and 2020 was its second year under its biennium timeline. Unlike previously where GGGI
implemented a program/project-based budget which saw the development and approval of fully
developed program/project proposals and their budgets at the start, the envelope method saw the
allocation of budget envelopes to each country comprising a mix of core and indicative earmarked
funding. Countries then developed their projects through the PCM 2 and PCM 3 process, for
implementation during the biennium budget period.
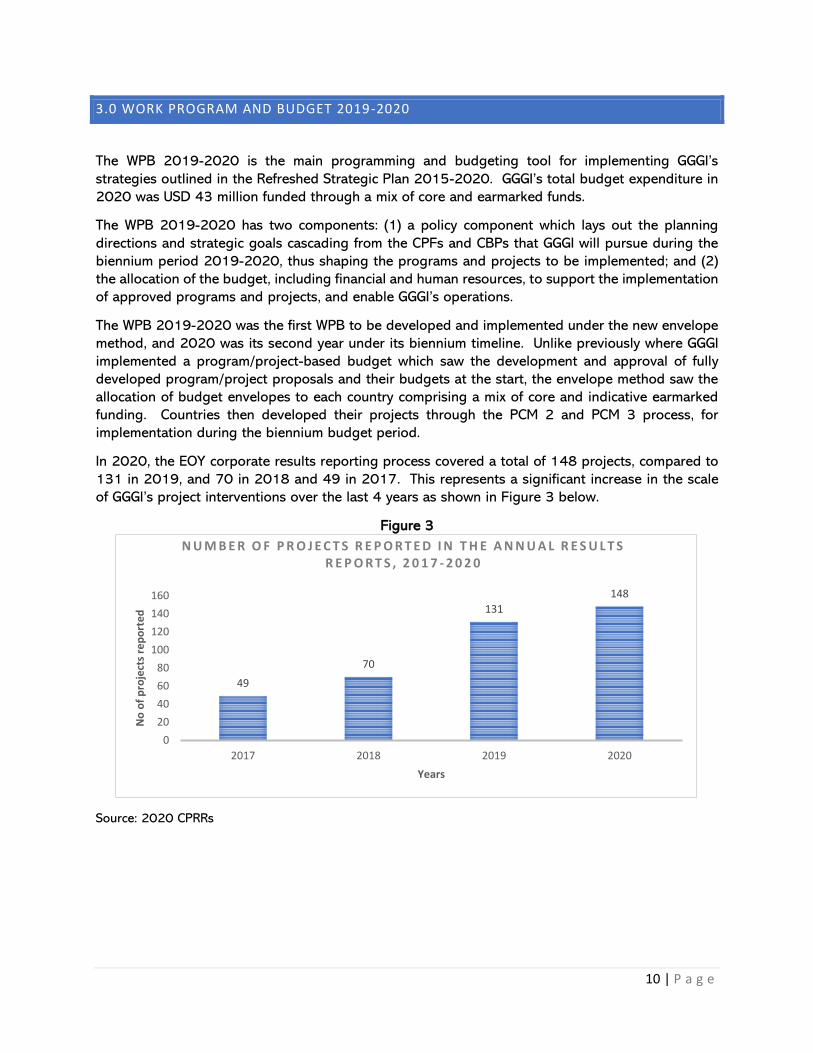
In 2020, the EOY corporate results reporting process covered a total of 148 projects, compared to
131 in 2019, and 70 in 2018 and 49 in 2017. This represents a significant increase in the scale
of GGGI’s project interventions over the last 4 years as shown in Figure 3 below.
Figure 3
Source: 2020 CPRRs
49
70
131
148
0
20
40
60
80
100
120
140
160
2017 2018 2019 2020
No
of
pro
ject
s re
po
rte
d
Years
N U M B E R O F P R O J E C T S R E P O R T E D I N T H E A N N U A L R E S U L T S R E P O R T S , 2 0 1 7 - 2 0 2 0

11 | P a g e
4.0 ALIGNMENT OF PROJECTS TO THE STRATEGIC OUTCOMES AND SDGS
Figure 5 shows the alignment of the 148 projects implemented by GGGI in 2020 to the six SOs.
Each project in the GGGI 2020 projects portfolio reported a link to an average of 2 SOs. The graph
reflects the volume of projects that GGGI is delivering under each of the six SOs. SO1 on GHG
emission reduction has the highest level of project alignment with 69%, followed by SO6 on
enhanced climate adaptation at 32%. SO5 on supply of ecosystem services has the least alignment
at 14%. Most of the projects that GGGI implemented in 2020 were focused on GHG emission
reduction. When compared to the SO alignment of projects in the WPB 2017-2018, a major
difference is the 11% increase in the number of projects aligned to SO6 showing the increase in
GGGI’s footprint in climate adaptation activities.
Figure 5
Source: 2020 CPRRs
Figure 6 shows the alignment of GGGI’s 148 projects implemented in 2020, with the SDGs
demonstrating GGGI’s strong support for its Members and partners. It is noticeable that GGGI’s
projects have the strongest alignment with SDG 13 on climate action at 45%, followed by SDG 7 on
clean energy at 28%, and SDG 11 on sustainable cities and communities at 13.5%.
Figure 6
Source: 2020 CPRRs
69%30%30%
16%14%
32%
0% 10% 20% 30% 40% 50% 60% 70% 80%
SO1SO2SO3SO4SO5SO6
Percentage of 148 projects
Stra
tegi
c O
utc
om
es
Alignment of 2020 projects with GGG's 6 SOs
4.1 5.41.4 0 0.7
4.7
28.4
1.4 2.7 0.7
13.5
2.7
44.6
1.4 3.40 2
0
10
20
30
40
50
Perc
enta
ge
SDGs 1-17
Alignment of 2020 projects with SDGs 1- 17
12 | P a g e
5.0 2020 CORPORATE RESULTS AND IMPACT
5.1 2020 Corporate Results
This chapter presents a summary of the 2020 corporate results and impact achieved by GGGI
primarily through the implementation of the WPB 2019-2020. These results and impact
demonstrate with evidence that GGGI’s work is leading to the adoption of green growth policies,
mobilizing green investment commitments, and enhancing green growth knowledge and institutional
capacity for Members and partners. In 2020, GGGI raised the reporting of its corporate results from
output to the country program level using the CPRR. The CPRR includes for the first time the
reporting of country program ex-ante SO impact using the SO methodologies that were adopted in
2019. The details of each CPRR can be accessed here. Each country program result is presented in
a country scorecard format in section 9.0 and forms the heart of the 2020 results report. The country
scorecards provide a condensed summary of each country program, its budget performance and key
results and achievements including its reported program SO ex-ante impact. The consolidated 2020
SO impact and corporate results are presented separately below.
5.2 2020 Strategic Outcome Ex-Ante Impacts
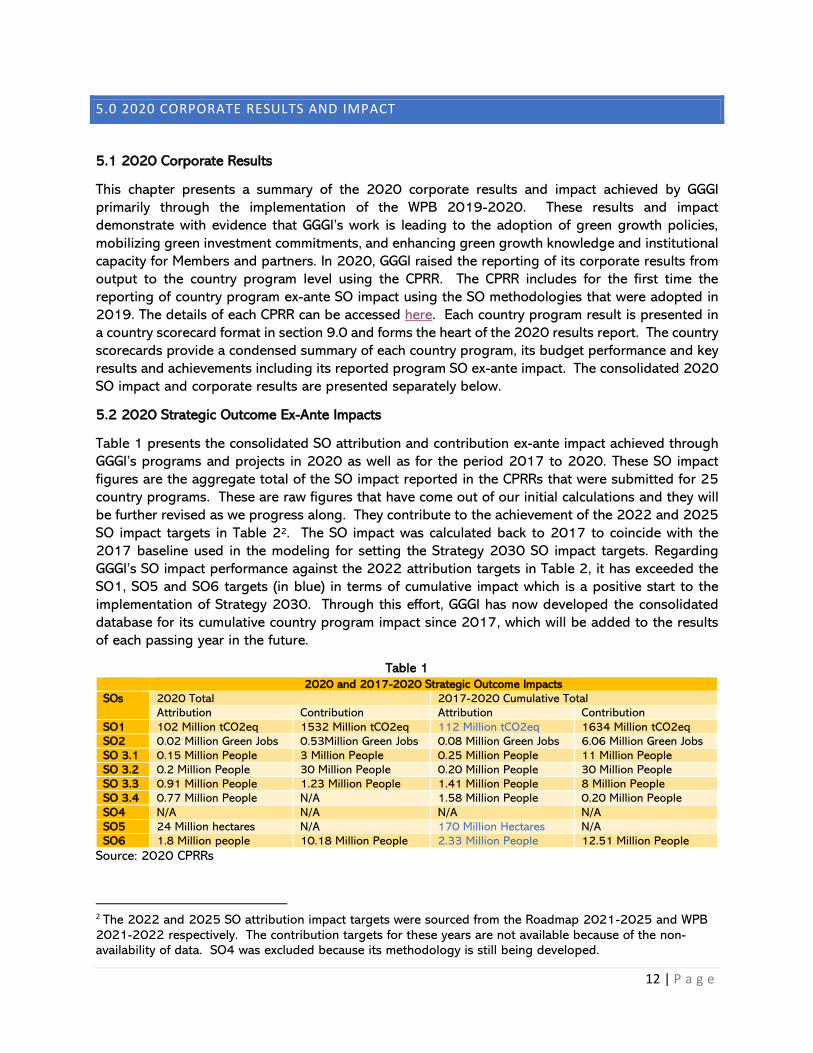
Table 1 presents the consolidated SO attribution and contribution ex-ante impact achieved through
GGGI’s programs and projects in 2020 as well as for the period 2017 to 2020. These SO impact
figures are the aggregate total of the SO impact reported in the CPRRs that were submitted for 25
country programs. These are raw figures that have come out of our initial calculations and they will
be further revised as we progress along. They contribute to the achievement of the 2022 and 2025
SO impact targets in Table 22. The SO impact was calculated back to 2017 to coincide with the
2017 baseline used in the modeling for setting the Strategy 2030 SO impact targets. Regarding
GGGI’s SO impact performance against the 2022 attribution targets in Table 2, it has exceeded the
SO1, SO5 and SO6 targets (in blue) in terms of cumulative impact which is a positive start to the
implementation of Strategy 2030. Through this effort, GGGI has now developed the consolidated
database for its cumulative country program impact since 2017, which will be added to the results
of each passing year in the future.
Table 1
2020 and 2017-2020 Strategic Outcome Impacts
SOs 2020 Total 2017-2020 Cumulative Total
Attribution Contribution Attribution Contribution
SO1 102 Million tCO2eq 1532 Million tCO2eq 112 Million tCO2eq 1634 Million tCO2eq
SO2 0.02 Million Green Jobs 0.53Million Green Jobs 0.08 Million Green Jobs 6.06 Million Green Jobs
SO 3.1 0.15 Million People 3 Million People 0.25 Million People 11 Million People
SO 3.2 0.2 Million People 30 Million People 0.20 Million People 30 Million People
SO 3.3 0.91 Million People 1.23 Million People 1.41 Million People 8 Million People
SO 3.4 0.77 Million People N/A 1.58 Million People 0.20 Million People
SO4 N/A N/A N/A N/A
SO5 24 Million hectares N/A 170 Million Hectares N/A
SO6 1.8 Million people 10.18 Million People 2.33 Million People 12.51 Million People
Source: 2020 CPRRs
2 The 2022 and 2025 SO attribution impact targets were sourced from the Roadmap 2021-2025 and WPB
2021-2022 respectively. The contribution targets for these years are not available because of the non-availability of data. SO4 was excluded because its methodology is still being developed.

13 | P a g e
Table 2: SOs Attribution Impact Targets 2022, 2025 and 2030
Strategic Outcomes (SOs) GGGI Attributed Outcomes Targets
2022 2025 2030
1. GHG emission reduction (Mton CO2e) 85 300 1000
2. Direct Green jobs (million jobs created) 0.1 0.5 2
3. Sustainable services (million people) 14 40 100
3.1. Energy access 3 10 30
3.2. Sanitation 2 4 10
3.3. Waste 7 20 80
3.4. Transport 2 6 20
4. Air Quality Improvement
n/a n/a n/a
5. Natural Capital protection (million hectare) 0.04 0.1 0.5
6. Adaptation services (million people)
0.7 2 8
Source: WPB 2021-2022
The reported attribution impact is an estimated ex-ante impact resulting exclusively from GGGI’s
project activities that have direct causal links to the SOs. Not all GGGI activities have direct causal
links to the SOs. Activities that have direct causal links to the SOs include the development of
bankable projects and investment proposals for which GGGI has received investor commitment and
the design and implementation of National Financing Vehicles (NFVs) for the mobilization of green
investments. Contribution impacts capture the level of impacts that GGGI activities contribute to
achieving its Members’ and partners’ NDCs and SDG targets. Activities that qualify under contribution
impact include policy development, investment, knowledge sharing and capacity development.
However, the figures for both types of SO impact are still incomplete because they are based only
on completed outcomes that have the necessary information to enable their SO impact calculation.
The SO impact results achieved and compiled so far are encouraging given the technical complexity
and institutional capacity constraints faced when rolling out this first-of-kind reporting format. The
attribution and contribution impact reported in Table 1 during the reporting period and the
cumulative attribution SO impact achieved between 2017 and 2020 are best compared to the 2022
attribution impact targets in Table 2. The individual SO impact which help demonstrate how GGGI
is helping the green growth transformation of Members’ and partner’ economies are explained in
more detail below:
SO1: GGGI’s primary goal is to support development interventions that result in low GHG emission
development pathways to reduce global warming. With 69% of the 2020 projects aligned to SO1
(see Figure 4) across countries in Africa, Asia, Latin America and the Caribbean region, the Middle
East and the Pacific, together they attribute for 102 MtCO2e of potential emissions being avoided
as well as contribute to 1532 MtCO2e to achieving the respective countries NDCs, national and
sectoral targets. Examples of such projects include the USD 9.5 million investment for the solar PV
conversion of 400 telecom towers in Colombia which will generate GHG reduction of 88,850 tCO2eq
during its project life and the USD 45 million investment for a 50MW solar PV plant in Bataan,
Philippines, which will generate GHG emissions reduction of 867,589 tCO2e during its 20 years
project life.
SO2: GGGI targets green jobs as a co-benefit of promoting economic activities to contribute to the
preservation or restoration of the environment and reducing their carbon footprint. In light of the
impact of the COVID-19 pandemic which has caused massive job losses and unemployment across
the globe, the creation of green jobs is a priority focal area of support for Members’ and partners’

14 | P a g e
green economic recovery and green New Deals. With 30% of 2020 projects aligned with SO2, they
attribute for 20,000 green jobs in 2020 and contributed 530,000 green jobs to countries’ national
plans and targets. Examples of such projects include the 5-year credit guarantee lending program
for agriculture SMEs in PNG which will generate 4,483 green jobs and the USD 60 million investment
for a Cactus Green Park in Kigali, Rwanda which will generate 26,880 green jobs.
SO3: The development of renewable energy and promotion of energy efficiencies, access to improved
sanitation facilities, access to solid waste management services and access to sustainable public
transport services are all designed to mitigate climate change and avoid potential GHG emissions.
But they also generate co-benefits to the service users and beneficiaries. With 30% of 2020 projects
aligned to SO3, the reported SO attribution impact in 2020 includes 150,000 people having access
to renewable and clean sources of energy, 200,000 people benefitting from the improvement in
sanitation services, 910,000 people benefitting from improved waste management services, and
770,000 people benefitting from access to sustainable public transport. GGGI’s SO contribution
impact has also enabled a larger number of people to benefit under NDCs and national and sectoral
targets set by the governments. Examples of such projects include the Nepal green citywide inclusive
sanitation plan in Mahalaxmi City which will provide access to sanitation services for 300,000 people
and the solar PV pilot ground source pump heating system at public schools in Songinokhairkhan
District, Ulaanbaatar City, Mongolia, that will benefit 250,000 students and schools’ staff, and the
USD 60 million investment for the municipal solid waste to energy plant in Bac Ninh, Vietnam which
will benefit 684,000 people.
SO4: Although 16% of 2020 projects are aligned with SO4, their impact in terms of clean air in
urban areas and cities were excluded in the absence of a methodology that is still under development.
SO5: This concerns the supply of ecosystem services that directly relates to agriculture, land-use
change and forestry which globally accounts for 27% of total GHG emissions.3 The focus is on the
land area of deforestation avoided, re-forestation achieved and sustainable land-use in agriculture
and other land-based activities. With 14% of 2020 projects aligned with SO5, they attribute for 24
million hectares and contribute to the achievement of the countries related to NDCs, national and
sectoral targets. An example is the Colombia long-term deforestation control and sustainable forest
management policy adopted by the government which will cover 1.22 million hectares for
conservation.
SO6: This concerns the number of people supported to cope with climate change through
interventions in enhanced climate adaptation in all economic sectors covering populations exposed
to adverse impacts of climate change. With 32% of 2020 projects aligned to SO6, they attribute for
1.8 million beneficiaries under these projects. An example of such a project is the introduction of
‘green business practices’ toolkits in the Philippines to help Shared Service Facilities cooperators
move towards sustainable and climate-resilient businesses that will benefit 165,000 people and
support 305 Micro Small Medium Enterprises (MSMEs).
The impact calculations for completed outcomes that currently do not have the necessary information
available will be done in the future when the information is available. Both the attribution and the
contribution impact outcomes are relevant in evaluating GGGI’s work and in capturing the impact
from the organization’s interventions. The calculation of SO impact is technically complex and
challenging but good progress has been achieved in this first cycle of the SO reporting. The aim is
3 GGGI, 2020. Technical Report No. 13. Achieving Green Growth and Climate Action Post-COVID-19.
15 | P a g e
that by the end of 2022, each Member and partner country will be fully reporting its SO impact and
have its own impact pathway.
5.3 Key CRF Results Delivered in 2020
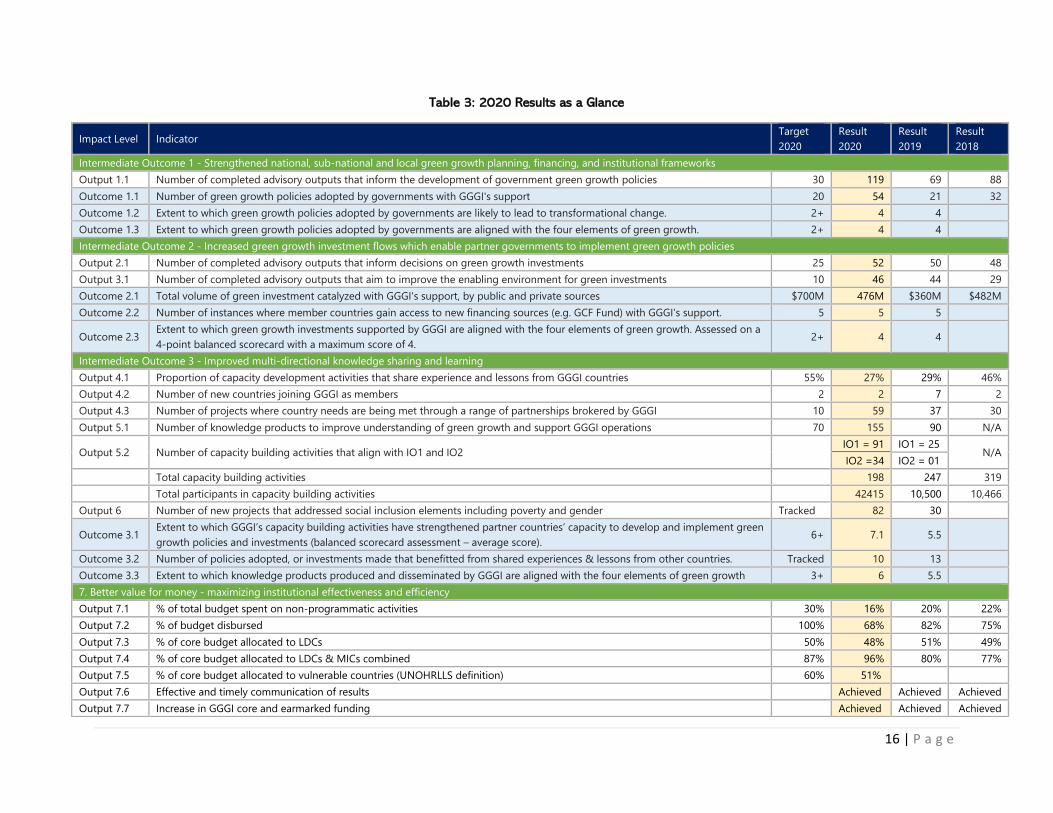
Table 3 below provides a summary of the key corporate results delivered by GGGI in 2020 against
the CRF targets.
5.3.1 Intermediate Outcome 1: developing green growth and national policy frameworks.
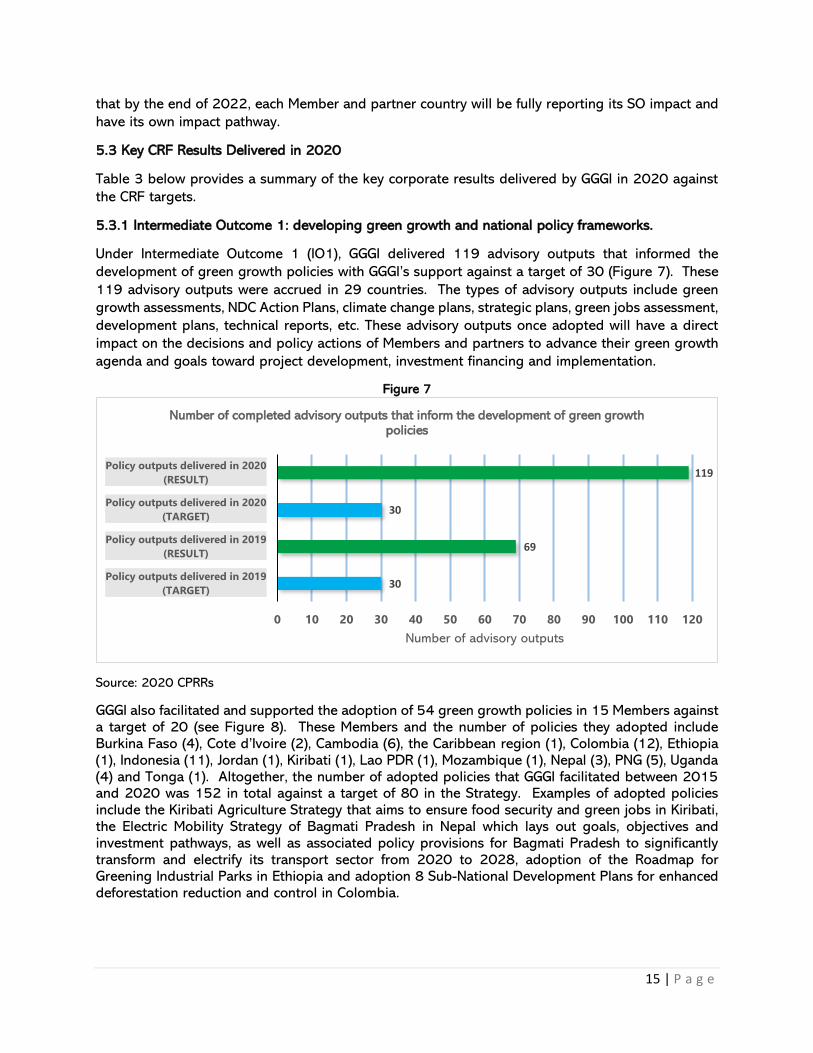
Under Intermediate Outcome 1 (IO1), GGGI delivered 119 advisory outputs that informed the
development of green growth policies with GGGI’s support against a target of 30 (Figure 7). These
119 advisory outputs were accrued in 29 countries. The types of advisory outputs include green
growth assessments, NDC Action Plans, climate change plans, strategic plans, green jobs assessment,
development plans, technical reports, etc. These advisory outputs once adopted will have a direct
impact on the decisions and policy actions of Members and partners to advance their green growth
agenda and goals toward project development, investment financing and implementation.
Figure 7
Source: 2020 CPRRs
GGGI also facilitated and supported the adoption of 54 green growth policies in 15 Members against a target of 20 (see Figure 8). These Members and the number of policies they adopted include Burkina Faso (4), Cote d’Ivoire (2), Cambodia (6), the Caribbean region (1), Colombia (12), Ethiopia (1), Indonesia (11), Jordan (1), Kiribati (1), Lao PDR (1), Mozambique (1), Nepal (3), PNG (5), Uganda (4) and Tonga (1). Altogether, the number of adopted policies that GGGI facilitated between 2015 and 2020 was 152 in total against a target of 80 in the Strategy. Examples of adopted policies include the Kiribati Agriculture Strategy that aims to ensure food security and green jobs in Kiribati, the Electric Mobility Strategy of Bagmati Pradesh in Nepal which lays out goals, objectives and investment pathways, as well as associated policy provisions for Bagmati Pradesh to significantly transform and electrify its transport sector from 2020 to 2028, adoption of the Roadmap for Greening Industrial Parks in Ethiopia and adoption 8 Sub-National Development Plans for enhanced deforestation reduction and control in Colombia.
30
69
30
119
0 10 20 30 40 50 60 70 80 90 100 110 120
Policy outputs delivered in 2019
(TARGET)
Policy outputs delivered in 2019
(RESULT)
Policy outputs delivered in 2020
(TARGET)
Policy outputs delivered in 2020
(RESULT)
Number of advisory outputs
Number of completed advisory outputs that inform the development of green growth policies
16 | P a g e
Table 3: 2020 Results as a Glance
Impact Level Indicator Target
2020
Result
2020
Result
2019
Result
2018
Intermediate Outcome 1 - Strengthened national, sub-national and local green growth planning, financing, and institutional frameworks
Output 1.1 Number of completed advisory outputs that inform the development of government green growth policies 30 119 69 88
Outcome 1.1 Number of green growth policies adopted by governments with GGGI's support 20 54 21 32
Outcome 1.2 Extent to which green growth policies adopted by governments are likely to lead to transformational change. 2+ 4 4
Outcome 1.3 Extent to which green growth policies adopted by governments are aligned with the four elements of green growth. 2+ 4 4
Intermediate Outcome 2 - Increased green growth investment flows which enable partner governments to implement green growth policies
Output 2.1 Number of completed advisory outputs that inform decisions on green growth investments 25 52 50 48
Output 3.1 Number of completed advisory outputs that aim to improve the enabling environment for green investments 10 46 44 29
Outcome 2.1 Total volume of green investment catalyzed with GGGI's support, by public and private sources $700M 476M $360M $482M
Outcome 2.2 Number of instances where member countries gain access to new financing sources (e.g. GCF Fund) with GGGI’s support. 5 5 5
Outcome 2.3 Extent to which green growth investments supported by GGGI are aligned with the four elements of green growth. Assessed on a
4-point balanced scorecard with a maximum score of 4. 2+ 4 4
Intermediate Outcome 3 - Improved multi-directional knowledge sharing and learning
Output 4.1 Proportion of capacity development activities that share experience and lessons from GGGI countries 55% 27% 29% 46%
Output 4.2 Number of new countries joining GGGI as members 2 2 7 2
Output 4.3 Number of projects where country needs are being met through a range of partnerships brokered by GGGI 10 59 37 30
Output 5.1 Number of knowledge products to improve understanding of green growth and support GGGI operations 70 155 90 N/A
Output 5.2 Number of capacity building activities that align with IO1 and IO2
IO1 = 91 IO1 = 25 N/A
IO2 =34 IO2 = 01
Total capacity building activities 198 247 319
Total participants in capacity building activities 42415 10,500 10,466
Output 6 Number of new projects that addressed social inclusion elements including poverty and gender Tracked 82 30
Outcome 3.1 Extent to which GGGI’s capacity building activities have strengthened partner countries’ capacity to develop and implement green
growth policies and investments (balanced scorecard assessment – average score). 6+ 7.1 5.5
Outcome 3.2 Number of policies adopted, or investments made that benefitted from shared experiences & lessons from other countries. Tracked 10 13
Outcome 3.3 Extent to which knowledge products produced and disseminated by GGGI are aligned with the four elements of green growth 3+ 6 5.5
7. Better value for money - maximizing institutional effectiveness and efficiency
Output 7.1 % of total budget spent on non-programmatic activities 30% 16% 20% 22%
Output 7.2 % of budget disbursed 100% 68% 82% 75%
Output 7.3 % of core budget allocated to LDCs 50% 48% 51% 49%
Output 7.4 % of core budget allocated to LDCs & MICs combined 87% 96% 80% 77%
Output 7.5 % of core budget allocated to vulnerable countries (UNOHRLLS definition) 60% 51%
Output 7.6 Effective and timely communication of results Achieved Achieved Achieved
Output 7.7 Increase in GGGI core and earmarked funding Achieved Achieved Achieved

17 | P a g e
Figure 8
Source: 2020 CPRRs
Additional results achieved under IO1 include:
• A balanced scorecard was used to measure the extent to which the 54 adopted green growth
policies were likely to lead to transformational change (in the countries concerned) under
four criteria including the alignment of the policy to the four elements of green growth,
namely: economic growth, poverty reduction, environmental sustainability and social
inclusion, whether resources were allocated for its implementation, whether arrangements
were made for its implementation, and whether it is related to specific actions or investments.
Out of a random sample of 8 Members, the average score was 4 out of a maximum score of
4. This result indicates that the adopted policies are likely to have a strong transformational
impact on the Members concerned.
• A balanced scorecard was used to measure the extent to which the 54 adopted policies are
aligned with the four elements of green growth under four criteria including whether an
adopted policy supports economic growth, poverty reduction, environmental sustainability
or climate action and social inclusion including gender equality. Out of a random sample of
8 Members, the average score was 4 out of a maximum score of 4. This result indicates that
the adopted policies are strongly aligned with green growth and will directly progress the
Members’ green growth ambitions and transformation.
5.3.2 Intermediate Outcome 2: Catalyzing Green Growth Investments
Under Intermediate Outcome 2 (IO2), GGGI works directly with its Members and partners to catalyze
investment financing from both the public and private sectors to fund green growth projects. GGGI’s
work focuses primarily on developing NFVs to mobilize investment funds, bankable projects,
investment proposals, designing de-risking mitigation instruments, and enabling policies and
legislations which ultimately increase public sector and private sector capital flows towards the
development of green investment projects.
While it seemed challenging at the beginning, at the end of 2020, GGGI had successfully catalyzed
a cumulative total of USD 2.06 billion in green investments since 2015, up from USD 1.6 billion in
2019 (Figure 9). Since 2015, a total of 24 countries has completed a cumulative total of 70
20
21
20
54
0 10 20 30 40 50 60
Policy outputs to be adopted in 2019
(TARGET)
Policy outputs adopted in 2019
(RESULT)
Policy outputs to be adopted in 2020
(TARGET)
Policy outputs adopted in 2020
(RESULT)
Number of adopted policies
Number of green growth policies adopted by Governments
18 | P a g e
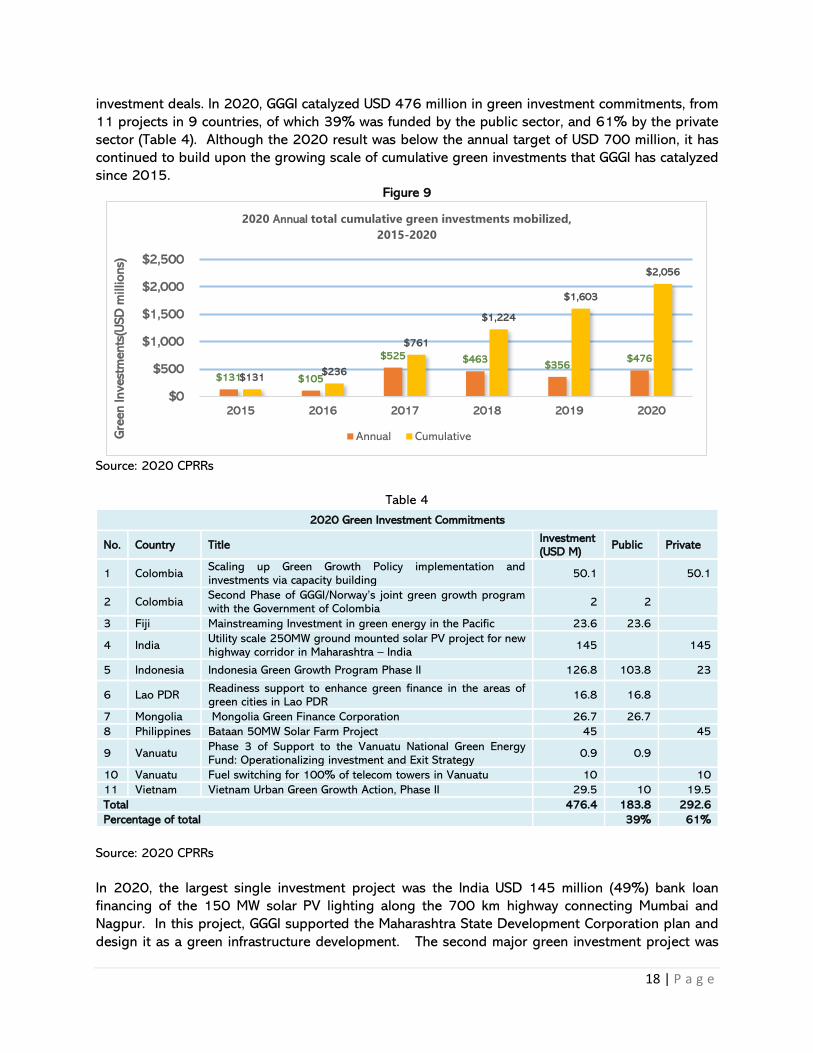
investment deals. In 2020, GGGI catalyzed USD 476 million in green investment commitments, from
11 projects in 9 countries, of which 39% was funded by the public sector, and 61% by the private
sector (Table 4). Although the 2020 result was below the annual target of USD 700 million, it has
continued to build upon the growing scale of cumulative green investments that GGGI has catalyzed
since 2015. Figure 9
Source: 2020 CPRRs
Table 4
2020 Green Investment Commitments
No. Country Title Investment (USD M)
Public Private
1 Colombia Scaling up Green Growth Policy implementation and investments via capacity building
50.1 50.1
2 Colombia Second Phase of GGGI/Norway’s joint green growth program with the Government of Colombia
2 2
3 Fiji Mainstreaming Investment in green energy in the Pacific 23.6 23.6
4 India Utility scale 250MW ground mounted solar PV project for new highway corridor in Maharashtra – India
145 145
5 Indonesia Indonesia Green Growth Program Phase II 126.8 103.8 23
6 Lao PDR Readiness support to enhance green finance in the areas of green cities in Lao PDR
16.8 16.8
7 Mongolia Mongolia Green Finance Corporation 26.7 26.7
8 Philippines Bataan 50MW Solar Farm Project 45 45
9 Vanuatu Phase 3 of Support to the Vanuatu National Green Energy Fund: Operationalizing investment and Exit Strategy
0.9 0.9
10 Vanuatu Fuel switching for 100% of telecom towers in Vanuatu 10 10
11 Vietnam Vietnam Urban Green Growth Action, Phase II 29.5 10 19.5
Total 476.4 183.8 292.6
Percentage of total 39% 61%
Source: 2020 CPRRs
In 2020, the largest single investment project was the India USD 145 million (49%) bank loan
financing of the 150 MW solar PV lighting along the 700 km highway connecting Mumbai and
Nagpur. In this project, GGGI supported the Maharashtra State Development Corporation plan and
design it as a green infrastructure development. The second major green investment project was
$131 $105
$525 $463 $356
$476
$131 $236
$761
$1,224
$1,603
$2,056
$0
$500
$1,000
$1,500
$2,000
$2,500
2015 2016 2017 2018 2019 2020
Gre
en Invest
ments
(USD
millions)
2020 Annual total cumulative green investments mobilized,
2015-2020
Annual Cumulative
19 | P a g e
the Indonesia USD 127 million (13%) forestry conservation and restoration project consisting of GCF
REDD results-based payment funding (79%) and private sector Landscape Finance Facility and
Lestari Capital Funding (18%). The balance is spread among the remaining 7 countries. Apart from
the above projects, the remaining 6 investment deals had values of around USD 52 million and less.
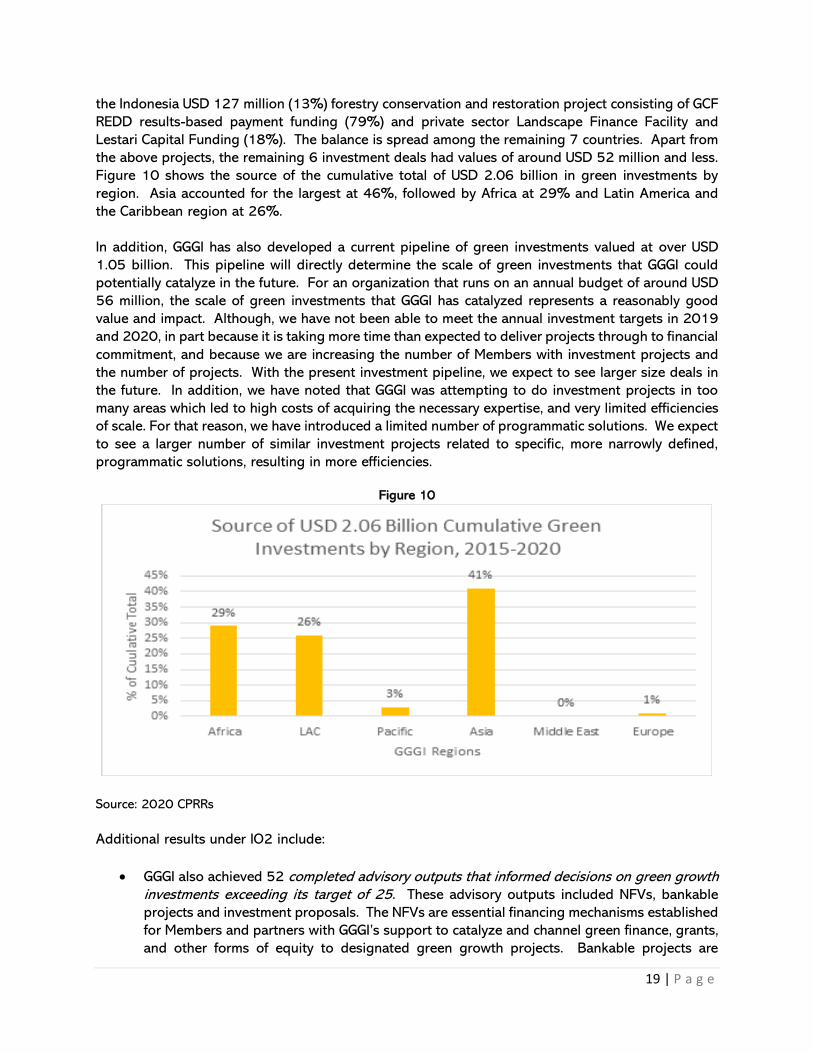
Figure 10 shows the source of the cumulative total of USD 2.06 billion in green investments by
region. Asia accounted for the largest at 46%, followed by Africa at 29% and Latin America and
the Caribbean region at 26%.
In addition, GGGI has also developed a current pipeline of green investments valued at over USD
1.05 billion. This pipeline will directly determine the scale of green investments that GGGI could
potentially catalyze in the future. For an organization that runs on an annual budget of around USD
56 million, the scale of green investments that GGGI has catalyzed represents a reasonably good
value and impact. Although, we have not been able to meet the annual investment targets in 2019
and 2020, in part because it is taking more time than expected to deliver projects through to financial
commitment, and because we are increasing the number of Members with investment projects and
the number of projects. With the present investment pipeline, we expect to see larger size deals in
the future. In addition, we have noted that GGGI was attempting to do investment projects in too
many areas which led to high costs of acquiring the necessary expertise, and very limited efficiencies
of scale. For that reason, we have introduced a limited number of programmatic solutions. We expect
to see a larger number of similar investment projects related to specific, more narrowly defined,
programmatic solutions, resulting in more efficiencies.
Figure 10
Source: 2020 CPRRs
Additional results under IO2 include:
• GGGI also achieved 52 completed advisory outputs that informed decisions on green growth
investments exceeding its target of 25. These advisory outputs included NFVs, bankable
projects and investment proposals. The NFVs are essential financing mechanisms established
for Members and partners with GGGI’s support to catalyze and channel green finance, grants,
and other forms of equity to designated green growth projects. Bankable projects are
20 | P a g e
projects with sufficient cash flow to cover all project-related costs as well as a reasonable
rate of return for investors. Investment proposals are usually developed for an investment
opportunity to attract potential investors.
• A key challenge in the promotion of green investments are the inherent market imperfections
that are barriers to investment. One of GGGI’s focal areas of intervention is to break down
these investment barriers and create an enabling environment for investment. This involves
determining how to create the necessary financial conditions, removing the identified
investment barriers, attracting domestic and international finance, and ultimately catalyzing
interests and commitments for investment. In this regard, GGGI in 2020 delivered 46
advisory outputs that aim to improve the enabling environment for green investments,
against a target of 10. These advisory outputs which include de-risking instruments, enabling
regulations and tax incentives aim to remove barriers to investment and improve the
feasibility of investment projects.
5.3.3. Green Climate Fund (GCF)
The Green Climate Fund (GCF) has become a critical source of climate finance. GGGI has become one of GCF’s major Readiness delivery partners. GGGI assists National Designated Authorities (NDAs) in developing and implementing the Readiness Programme which aims to develop policies, strategies, and mechanisms for low-emission climate-resilient investments. The goal of the readiness work is, of course, for countries to access GCF’s climate finance. GGGI also helps to expand funding windows for developing countries to directly access GCF funds by supporting the accreditation of national entities. Currently, 28 countries have requested GGGI as a Readiness Delivery Partner, to implements readiness projects in 25 countries i.e., Burkina Faso, Cambodia, Colombia, Cote d’Ivoire, Fiji, Guyana, Indonesia, Jordan, Lao PDR, Morocco, Mongolia, Myanmar, Papua New Guinea, Paraguay, Philippines, Rwanda, Sri Lanka, Thailand, Uganda, and Vanuatu. Our teams on the ground have completed readiness support in 8 countries (Vanuatu, Mongolia, Thailand, Rwanda, Lao PDR, Guyana, Papua New Guinea, and Indonesia). Although GGGI is not an accredited entity, we have been working with our partner governments and national accredited entities to develop funding proposals for submission to the GCF. To date, the total value of the projects supported amounts to over USD 1 billion, of which GCF contribution is over USD 600 million. In 2020, GGGI helped develop 3 funding proposals worth over USD 160 million (i.e., Indonesia REDD+ Results Based Payments for Results Period 2014-2016, Fiji AgroPhotovoltaic Project in Ovalau, and Mongolia Green Finance Corporation) that were approved by the GCF Board. GGGI has done this through technical support on concept development and/or the conduct of feasibility studies for funding proposal development.
5.3.4 Update on the status of green investment commitments catalyzed in 2017 to 2019
GGGI tracks the progress and status of the green investment commitments catalyzed with GGGI’s support from previous years, since 2017. Overall, out of the 53 green investments catalyzed, around two-thirds of the projects have progressed beyond the initial investment commitment stage to secure signed investment agreements or the disbursement stage. This shows that the majority of GGGI’s projects is progressing toward implementation after GGGI’s exit. Out of the 10 green investments catalyzed in 2017 for a total of USD 524 million, two projects have been completed, namely the Bangalore (India) Metropolitan Transport Cooperation with USD 80 million mobilized in 2019, and the USD 0.67 million seed funding for National Green Energy Fund (NGEF) provided by the
21 | P a g e
Government of Vanuatu while the Costa Rica Environmental Bank Foundation (FUNBAM) project was terminated because of a change in government policy. Out of the 21 green investments reported in 2018 valued at USD 462 million, the Senegal Rice Husk Waste to Energy Project for 3 rice mills with an installed capacity of 1.5MW, the Vanuatu NGEF financing the energy component of MFSL’s 100M Green Affordable Housing Scheme and Thailand First SME-only NEFP target at replacing Lighting, Motors and Variable Speed Drives has been cancelled. Also, in 2018, the Mozambique Solar Irrigation Systems for 150 Farms in Manica Province was completed along with the Cotco Metal Works project in Thailand. In 2019, out of the 22 projects that were catalyzed totaling USD 356 million, two projects, namely the Fiji Solar PV project in Ovalau (4.7 MW) and Indonesia Forest Carbon Partnership Facility Emission Reduction were completed while the other 19 projects are still ongoing.
5.3.5 Intermediate Outcome 3: Multi-country knowledge sharing and capacity building
Intermediate Outcome 3 (IO3) underscores the importance of both knowledge development and
sharing, and capacity building to advancing the global green growth agenda and regional and
national action of Members and partners. Our theory of change in relation to IO3 is that sharing of
knowledge, lessons and experience through capacity building, institutional relationships and
partnerships and knowledge networks will drive learning, understanding, reduce knowledge gaps
and ultimately spur action on green growth. This highlights GGGI’s strategic role as a broker of
green growth knowledge and learning between countries and regional integration organizations.
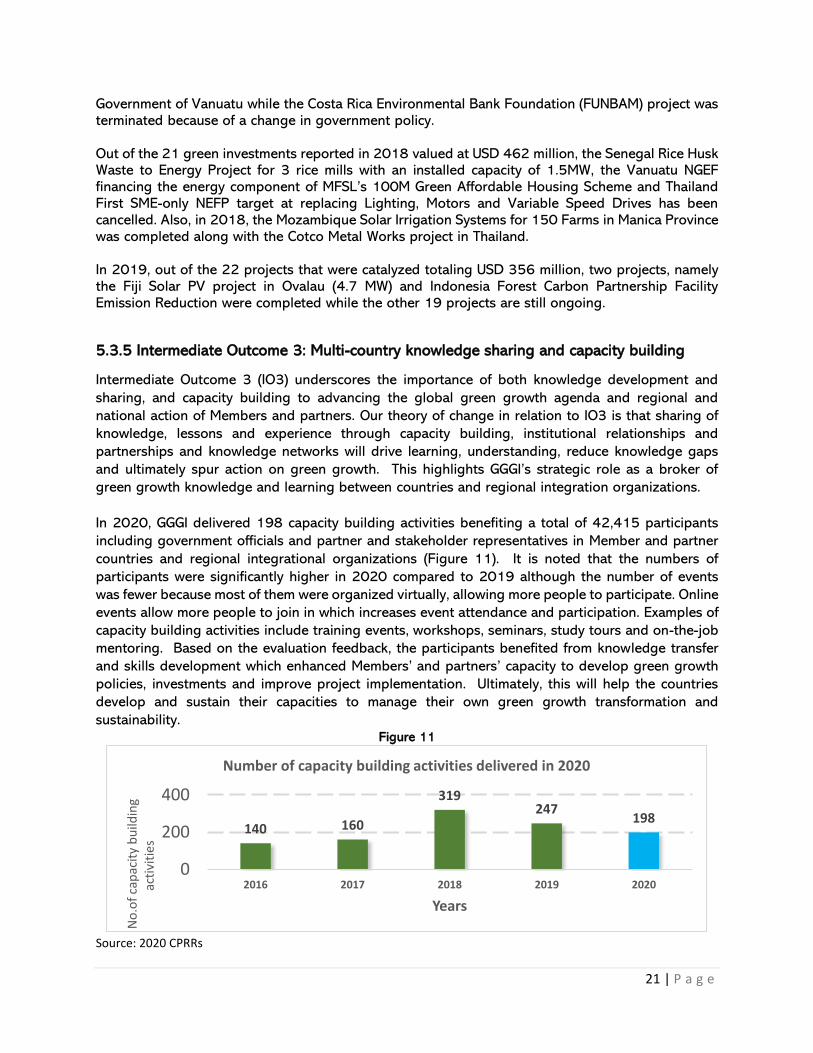
In 2020, GGGI delivered 198 capacity building activities benefiting a total of 42,415 participants
including government officials and partner and stakeholder representatives in Member and partner
countries and regional integrational organizations (Figure 11). It is noted that the numbers of
participants were significantly higher in 2020 compared to 2019 although the number of events
was fewer because most of them were organized virtually, allowing more people to participate. Online
events allow more people to join in which increases event attendance and participation. Examples of
capacity building activities include training events, workshops, seminars, study tours and on-the-job
mentoring. Based on the evaluation feedback, the participants benefited from knowledge transfer
and skills development which enhanced Members’ and partners’ capacity to develop green growth
policies, investments and improve project implementation. Ultimately, this will help the countries
develop and sustain their capacities to manage their own green growth transformation and
sustainability. Figure 11
Source: 2020 CPRRs
140 160
319247
198
0
200
400
2016 2017 2018 2019 2020
No
.of
cap
acit
y b
uild
ing
acti
viti
es
Years
Number of capacity building activities delivered in 2020
22 | P a g e
The primary purpose of knowledge development and sharing is to build the capacity of partner
governments and local agents to support the development and implementation of green growth
policies and investments. In 2020, GGGI delivered 155 knowledge products against a target of 70.
Examples of knowledge products delivered include publications (such as the GGGI Technical Report
No. 13: Achieving Green Growth and Climate Action Post-COVID-19, GGGI Insight Brief No. 3: Green
Deals to Accelerate Climate Action Post-COVID-19, and Technical Report - Employment Assessment
of Renewable Energy: Power sector pathways compatible with NDCs and national energy plans)
training modules, toolkits, methodologies and collaboration on global knowledge platforms like
Green Growth Knowledge Platform (GGKP).
Additional results under IO3 include:
• Approximately 27% of all capacity building activities shared experiences and lessons from
other countries.
• GGGI’s business model encourages the delivery of programs and projects on a platform of
partnerships with stakeholders other than its government counterparts. In 2020, 31 projects
brokered 59 partnerships.
• The extent to which GGGI’s capacity building activities have directly strengthened Members’
and partners’ capacity to develop and implement green growth policies and investments was
measured using a 6-point balanced scorecard with an average score of 7.1 out of a maximum
score of 10. The six criteria include skills and knowledge relevance and gain, use of
knowledge gained, alignment with country objectives in the WPB, and inclusion of
government and public sector officials.
• A 6-point balanced scorecard was used to measure the extent to which knowledge products
produced and disseminated by GGGI are aligned with the four elements of green growth and
have a quality impact. The average balance scorecard assessment for all countries was 5.6
out of a maximum score of 6.
• Two new member countries joined GGGI in 2020, Cote d’Ivoire and the Kyrgyz Republic,
increasing GGGI’s total membership to 39.
• Out of the 148 projects in 2020, 31 projects brokered 59 partnerships.
5.3.6. Gender Mainstreaming
GGGI now tracks the number of GGGI projects that have addressed the social inclusion elements of
green growth including poverty reduction, social safeguards and gender equality. In 2020, 82 out
of 148 projects reported to have addressed these elements in their design and implementation in
aiming to provide broader development benefits to their target population. Examples of projects
with gender equality initiatives include:
i. GGGI supported the Government of PNG (DFAT supported) on the CRGG project whose
broader vision is to eventually see inclusive CRGG priorities systematically mainstreamed into
regular planning, budgeting and project management systems of provincial governments. A
gender and social assessment coupled with a Gender Action Plan (GAP) was developed in
2020 which identified key entry points for mainstreaming gender-inclusive considerations
throughout the project, and potential projects for W+ certification standards. One of the
selection criteria used to determine provincial priorities was inclusion and women’s

23 | P a g e
empowerment, with the result that of the 9 identified project ideas, 3 have the potential to
create increased social and economic benefits for women.
ii. The Government of Burkina Faso through the NDC CAEP successfully incorporated gender
and social inclusion into the NDC revision processes. GGGI supported the gender and social
analysis of the NDC sectors (and gender action plan per sector), capacity building on gender
mainstreaming in the NDCs, inclusive stakeholder consultations with civil society
organizations and women’s groups, and collection of sex-disaggregated data. These inclusive
approaches have resulted in the articulation of clear gender and social targets in the country’s
NDC implementation plan.
iii. Through the Viet Nam Green Bond Readiness Program, GGGI supported the Government of
Vietnam in incorporating gender equality and social safeguards from its inception phase. In
2020, the program did a rapid gender assessment, facilitated broader stakeholder
engagement in the design of the bond and financing criteria aligning it with the country’s
gender and social policies. The social and gender considerations have been incorporated in
the country’s Corporate Green Bond Pilot Issuance, the overall regulatory framework for
green bond development, and across the project outputs.
GGGI continued making incremental steps toward the capacity to effectively manage and measure
results on gender and social inclusion by preparing its new Gender and Social Inclusion Strategy
2021-2025 and Action Plan 2021-2022. A key focus is to strengthen the application of gender
equality and poverty markers on GGGI’s programs through capacity building and appointment of
Regional GESI Focal Points. The Strategy is well aligned with the 2030 Strategy and outlines an
impact framework for GESI and linkages to GGGI’s Programmatic Solutions. Introduction of sex-
disaggregated indicator on beneficiaries of GGGI programs in its Corporate Results Framework 2021-
2022 is another important step towards enhanced impact measurements and reporting.
24 | P a g e
6.0 COVID-19 IMPACT AND RECOVERY EFFORT
This chapter is intended to report especially on the impact of the COVID-19 pandemic on GGGI’s
business operations, and the specific measures it took to support the green recovery plans of
Members, partners, and regional integration organizations.
The year 2020 was not a normal year for GGGI by any means. The global shock from the widespread
health, trade and socio-economic impacts of COVID-19 was unprecedented. The pandemic spread
with alarming speed, infecting millions of people and forcing a global lockdown in 120 countries,4
bringing economic activity to a near standstill as countries-imposed restrictions on cross-border and
internal movement to halt the spread of the virus. Governments have had to respond boldly to the
fallout of the COVID-19 pandemic giving priority to immediate short-term measures to contain and
reverse the public health crises, flatten the epidemic curve through border lockdowns and travel
restrictions, and implement emergency economic rescue and recovery packages to address
widespread unemployment, debt, and fiscal problems.
Since mid-2020, GGGI has supported the design and implementation of the green COVID-19
recovery plans of Members and partner countries coinciding with the green economy approach
discussed above. The COVID-19 recovery integration into the Roadmap 2021-2025 and WPB 2021-
2022 programming have enabled GGGI to achieve both the short-term objective of economic
recovery and the long-term one of economic growth that is socially inclusive and environmentally
sustainable. The diverse programs and projects range from climate smart agriculture to agri value-
chains, off grid energy, green urban infrastructure, forest restoration, digital solutions for energy
efficiency, waste management, electric mobility, smart cities, circular economy, sustainable forest and
agriculture value chain, and green tourism development. These are all supported by accelerated
access to green investments and aligned with increased climate actions to implement the NDC
commitments ensuring that the COVID-19 recovery addresses the needs of women, indigenous
populations, and the poor. Given that small and medium enterprises provide most of the
employment, particularly for lower income groups in developing countries, GGGI has developed
programs to support entrepreneurs build green businesses and create green jobs. Such programs,
called Greenpreneurs, are particularly relevant to support recovery from the pandemic, and GGGI is
implementing such programs in the Pacific and Caribbean small island developing states, with
support from Qatar Fund For Development (QFFD), as well as in a number of additional countries,
including Colombia, Philippines, and Vietnam.
GGGI supported 26 Members and partners in 2020 to revise and enhance their NDCs for
resubmission to the Paris Agreement and has prioritized supporting Members and partners to green
their recovery from the pandemic, in a manner that accelerates climate action. In July 2020, GGGI
published a report that analyzed opportunities for a green recovery5, as well as a model Green New
Deal appropriate for developing and emerging economies6. In Mexico, GGGI developed detailed
green recovery recommendations at the sub-national level for three states, published in January
4 GGGI Technical Report No. 13, Green Growth and Climate Action Post-COVID-19, 2020. 5 GGGI Technical Report 13, “Achieving Green growth and Climate Action Post-COVID19” https://gggi.org/report/achieving-green-growth-and-climate-action-post-covid-19/ 6 GGGI Insight Brief 3, “Green Deals to accelerate Climate Action Post-COVID19” https://gggi.org/report/greendeal-to-accelerate-climate-action-post-covid-19_202010-4-2/

25 | P a g e
2021.7 GGGI has been using 6 main approaches to support the green recovery and green new deal
projects for Members and partners in emerging and developing economies, as outlined in Figure 12.
GGGI also worked with donor agencies and Members to develop projects to support a green recovery
and is currently supporting 13 Members and partner organizations in developing green recovery,
green new deal plans and investment projects with financial support from Denmark, GCF, the
Republic of Korea, NDCP, Norway, QFFD and UK-PACT. The distribution of the interventions per
region is as follows:
• Asia and the Pacific: Fiji - Greening Tourism Recovery; Lao PDR – Resilient Recovery Rapid
Readiness Support; Mongolia - Assessing green jobs from renewable energy/Post-Coal
future.
• Africa: Burkina Faso - Greening next national 5-year plan; Cote d’Ivoire – Green Recovery;
Rwanda - Green jobs from greening affordable; Senegal – Green recovery and Sustainable
Landscapes; Uganda – NDC Partnership Economic advisory support.
• Europe: Hungary – Co-benefits of the Green New Deal.
• Latin America and the Caribbean region: Colombia - national "post-coal" green jobs
strategy; Mexico - Implementing Subnational Green Recovery Initiatives; OECS - Use of
the Green Growth Index Simulation tool to assess greening of recovery in OECS countries;
Peru - national Green New Deal.
Figure 12
Source: CAID, 2021
In addition to the above, GGGI also developed four main tools and frameworks to support Members
and partners formulate their Green COVID-19 Recovery Plans and Green New Deals Together with
the six approaches presented in Figure 13, they form the foundation of GGGI’s growing expertise to
strengthen its position as trusted green growth advisors to our Members and partners during and
in the post-COVID era. The four tools are:
7 GGGI, CAID

26 | P a g e
i. Employment and economic analysis tool – to assess the occupations and skills requirement
at different levels of the renewable energy sector value chain.
ii. Green economy model – to generate integrated cost-benefit analysis by intervention types
such as project and policy.
iii. Marginal abatement cost analysis tool – to assess the cost of low carbon technologies and
measures per ton of carbon abated.
iv. Green growth index and simulation tool – to assess green growth performance integrating
SDG indicators and targets relevant to the four dimensions of green growth including efficient
and sustainable resource use, natural capital protection, green economic opportunities, and
social inclusion.
As widely experienced by many international development organizations around the world, the
impacts of the COVID-19 pandemic also directly and indirectly challenged GGGI’s business operation
and the implementation of its programs and projects. First, the country’s environments became
difficult to do business in with the lockdowns, social distancing, curfews, and health risks. The border
lockdowns had restricted international travel for staff and limited the hire of consultants. In a lot of
instances, expatriate staff had to return to their home countries and work from a distance for
prolonged periods. GGGI’s core funding was also reduced by USD 3.9 million while there were delays
in the signing of some earmarked project agreements which delayed project implementation.
GGGI responded swiftly and efficiently to adapt and adjust its operations to address these profound
changes and plug the funding gap. GGGI had to adapt and resort to the use of digitized
communications tools and technology to maintain connectivity across the organization around the
world and with development partners to sustain programming and operations and green growth-
related development dialogue. Other key measures included strengthening project monitoring and
implementation, cutting back on staff mission travel, initiating a 5-month salary cut, write back of
staff leave provisions, freezing core funded staff recruitment and capital expenditures, and tightening
financial controls on operational expenditures. These measures not only resulted in a very strong
programmatic performance and results in 2020 as is explained in the report, but they also reduced
the operating deficit to USD 1.69 million only.
27 | P a g e
7.0 OTHER KEY RESULTS AND ACHIEVEMENTS
In 2020, GGGI achieved other additional key results and achievements that fall outside the ambit of
the CRF. These key results are covered in this chapter.
7.1 Resources Mobilization
GGGI’s operations are made possible through the support of a growing number of resource partners that share the Institute’s goals and objectives. GGGI actions center on developing more sustainable, stronger, and more diversified funding for GGGI operations – including maintaining core (unrestricted) funding and prioritizing multi-year programmatic and project earmarked (restricted) contributions to enhance funding predictability.
GGGI’s core funding is provided by the Governments of Denmark, the Republic of Korea, Norway, and the United Kingdom. GGGI has also benefitted from its growing number of resource partners that provide earmarked funding for specific programs and projects. The increased flow in earmarked funding has seen a significant increase in earmarked spending from USD 9.5 million in 2015 compared to USD 23.5 million in 2020. This robust level of core and earmarked funding allows GGGI to be mission-focused on emerging areas of work – laying the foundation for the transition to GGGI’s Strategy 2030.
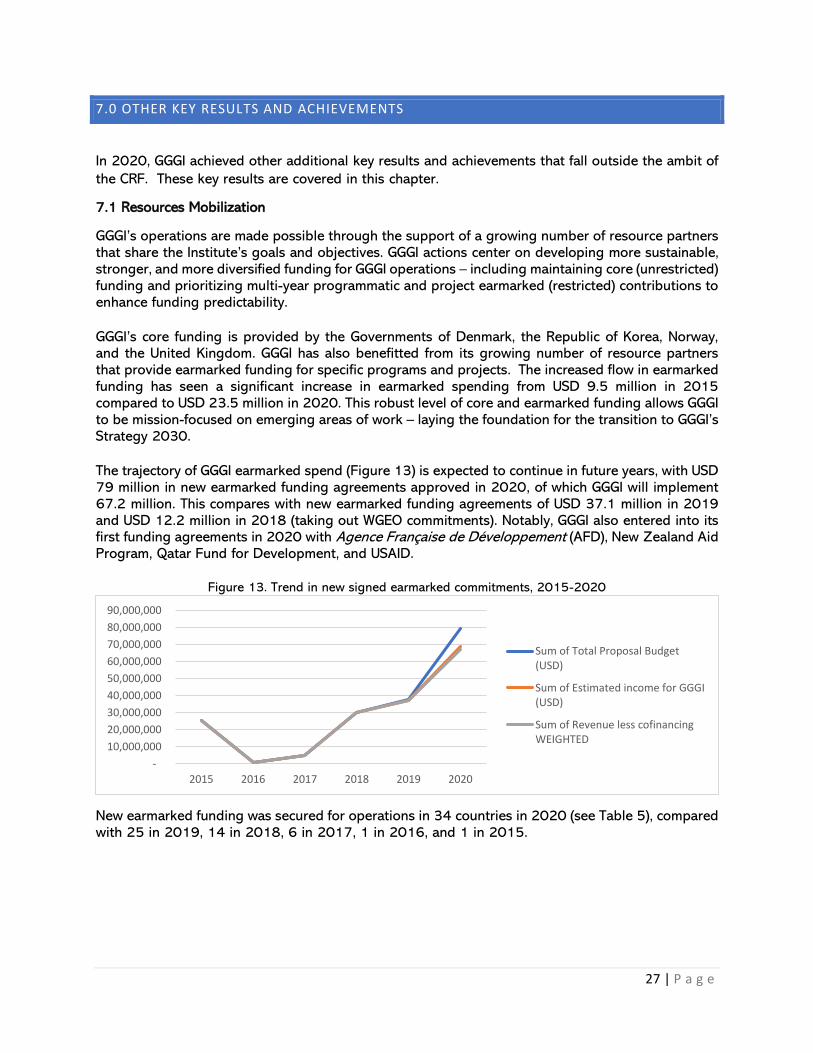
The trajectory of GGGI earmarked spend (Figure 13) is expected to continue in future years, with USD 79 million in new earmarked funding agreements approved in 2020, of which GGGI will implement 67.2 million. This compares with new earmarked funding agreements of USD 37.1 million in 2019 and USD 12.2 million in 2018 (taking out WGEO commitments). Notably, GGGI also entered into its first funding agreements in 2020 with Agence Française de Développement (AFD), New Zealand Aid Program, Qatar Fund for Development, and USAID.
Figure 13. Trend in new signed earmarked commitments, 2015-2020
New earmarked funding was secured for operations in 34 countries in 2020 (see Table 5), compared with 25 in 2019, 14 in 2018, 6 in 2017, 1 in 2016, and 1 in 2015.
-
10,000,000
20,000,000
30,000,000
40,000,000
50,000,000
60,000,000
70,000,000
80,000,000
90,000,000
2015 2016 2017 2018 2019 2020
Sum of Total Proposal Budget(USD)
Sum of Estimated income for GGGI(USD)
Sum of Revenue less cofinancingWEIGHTED

28 | P a g e
Table 5: Earmarked funding by countries Africa Asia LAC Europe and
Middle East Pacific
Program operations
Burkina Faso, Ethiopia, Rwanda, Senegal, Uganda
Cambodia, India, Indonesia, Lao PDR, Mongolia, Myanmar, Nepal Philippines, Viet Nam
Colombia, Peru Jordan Fiji, Kiribati, PNG, Pacific (2)**
Project operations
Morocco, Mozambique, Togo
Sri Lanka,
Caribbean (4)*, Guyana
Hungary Marshall Islands, Tonga
Total 2020 8 10 7 2 7
* Includes Antigua and Barbuda, Dominica, Grenada, St Lucia, ** Includes Samoa and Tuvalu
7.2 Nationally Determined Contributions Enhancement
Another major area of work for GGGI in 2020 was on NDC enhancement. There was much at stake
in 2020 as parties to the Paris Agreement were set to submit updated NDCs in response to the
perceived “shortfall” in countries’ ambitions against the goals of the Paris Agreement. There were
heightened expectations that high emitting and developed countries should raise their ambitions for
mitigation to keep in line with the global target of keeping global warming at below 2°C and close
to 1.5°C below pre-industrial levels. At the same time, SIDS and the least developed vulnerable
countries needed to step up their adaptation efforts to enhance their climate resilience.
Among high emitting members that have submitted updated NDCs, several have increased their
ambitions compared with the first NDCs. Others have failed to submit higher ambitions. The COVID-
19 recovery is a unique opportunity to accelerate climate action if – but only if – policymakers decide
to gear stimulus packages towards green and sustainable initiatives and sectors. Failing to achieve
green recovery in the years to come, could significantly jeopardize our ability to make the required
shifts onto sustainable, low-emission development pathways.
In 2020, GGGI provided a range of support to 29 Members and partner countries. The range of
services provided is presented in Table 6. Support was provided primarily through the NDC
Partnership Climate Action Enhancement Package (CAEP), the Pacific NDC Hub, Sida, GCF
Readiness, GGGI core funding, and the Norwegian Ministry of Climate and Environment
and the Swedish Energy Agency on carbon pricing.

29 | P a g e
Table 6: Types of GGGI support to NDC enhancement
1. Enhanced ambition and NDC revision
2. NDC implementation acceleration
3. MRV and transparency
4. Article 6 readiness and transactions
5. Adaptation 6. Long-term strategies
7.Socio-economic co-benefits and GESI
Sector level planning and target setting. NDC revision support Stakeholder engagement plans
NDC implementation plans and NDC roadmaps. NDC financial plans and budget tracking tools Community Engagement
GHG inventory and database management and peer reviews National, subnational MRV systems Sectoral and project level MRV system development
NDC MRV systems
Carbon pricing and transaction scoping and readiness Development of policy approaches or projects for Article 6 transactions
National Adaptation Planning Vulnerability/ risk assessment
Adaptation targets
Adaptation solutions Develop green paper for scenarios for national climate insurance scheme.
Stakeholders’ engagement and institutional structure Vision building Baseline assessment Development of low emission development scenarios Prioritization of actions Implementation, finance, and monitoring
Assessment of employment potential under NDC targets SDG alignment Gender Equality and Social inclusion NDC support
Antigua and Barbuda, Colombia, Lao PDR, Nepal, Papua New Guinea, Cambodia, TongaSamoa, St. Lucia, Burkina Faso, Senegal, Mongolia, Morocco, Myanmar
Antigua and Barbuda, Indonesia, Kiribati, Fiji, Samoa, Tuvalu, Tonga, St. Lucia, Jordan, Marshall Island, Mexico
Antigua and Barbuda, Grenada, Peru, Republic of Marshal Island, Solomon Island, Tonga, Fiji, Papua New Guinea, Vanuatu, Colombia, Burkina Faso, Ethiopia, Myanmar
Colombia, Indonesia, Mexico, Morocco, Peru, Senegal, Thailand, Viet Nam Ethiopia, Nepal, Cambodia
Antigua and Barbuda, Rwanda, Lao PDR
Hungary, Tonga, Cambodia (waste sector), Vanuatu and Solomon Islands (in preparation phase)
Antigua and Barbuda, Burkina Faso, Indonesia, Mexico, Rwanda
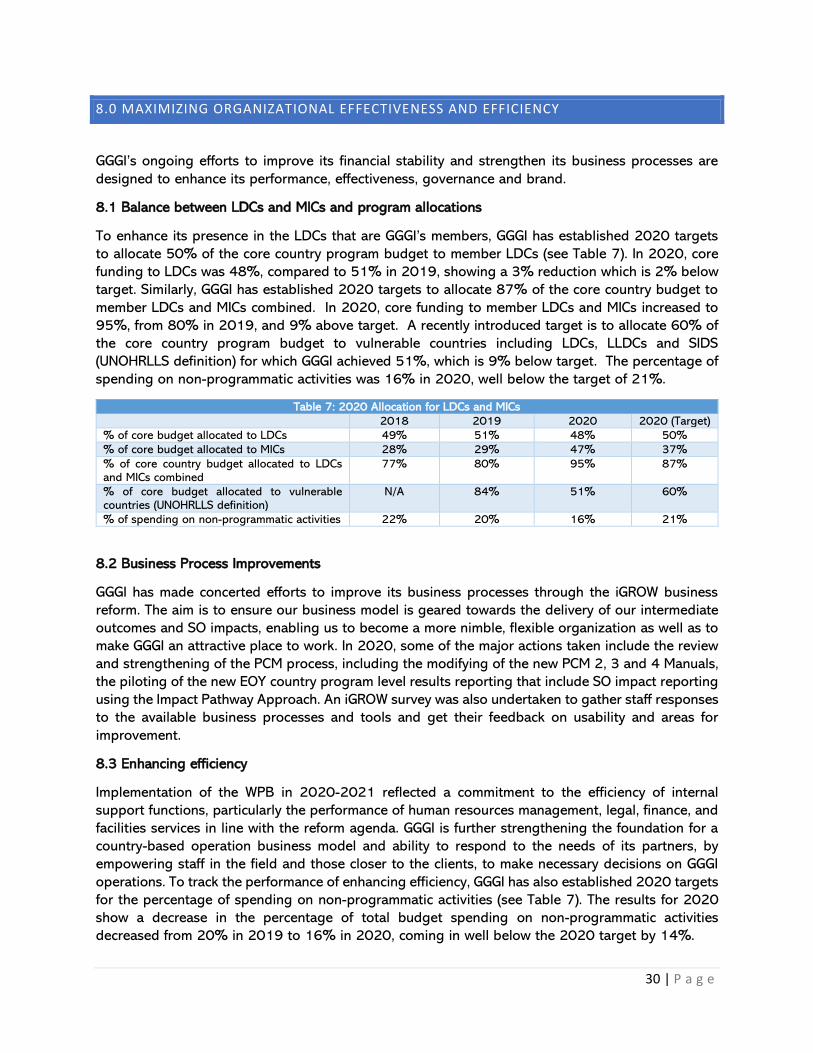
30 | P a g e
8.0 MAXIMIZING ORGANIZATIONAL EFFECTIVENESS AND EFFICIENCY
GGGI’s ongoing efforts to improve its financial stability and strengthen its business processes are
designed to enhance its performance, effectiveness, governance and brand.
8.1 Balance between LDCs and MICs and program allocations
To enhance its presence in the LDCs that are GGGI’s members, GGGI has established 2020 targets
to allocate 50% of the core country program budget to member LDCs (see Table 7). In 2020, core
funding to LDCs was 48%, compared to 51% in 2019, showing a 3% reduction which is 2% below
target. Similarly, GGGI has established 2020 targets to allocate 87% of the core country budget to
member LDCs and MICs combined. In 2020, core funding to member LDCs and MICs increased to
95%, from 80% in 2019, and 9% above target. A recently introduced target is to allocate 60% of
the core country program budget to vulnerable countries including LDCs, LLDCs and SIDS
(UNOHRLLS definition) for which GGGI achieved 51%, which is 9% below target. The percentage of
spending on non-programmatic activities was 16% in 2020, well below the target of 21%.
Table 7: 2020 Allocation for LDCs and MICs
2018 2019 2020 2020 (Target)
% of core budget allocated to LDCs 49% 51% 48% 50%
% of core budget allocated to MICs 28% 29% 47% 37%
% of core country budget allocated to LDCs and MICs combined
77% 80% 95% 87%
% of core budget allocated to vulnerable countries (UNOHRLLS definition)
N/A 84% 51% 60%
% of spending on non-programmatic activities 22% 20% 16% 21%
8.2 Business Process Improvements
GGGI has made concerted efforts to improve its business processes through the iGROW business
reform. The aim is to ensure our business model is geared towards the delivery of our intermediate
outcomes and SO impacts, enabling us to become a more nimble, flexible organization as well as to
make GGGI an attractive place to work. In 2020, some of the major actions taken include the review
and strengthening of the PCM process, including the modifying of the new PCM 2, 3 and 4 Manuals,
the piloting of the new EOY country program level results reporting that include SO impact reporting
using the Impact Pathway Approach. An iGROW survey was also undertaken to gather staff responses
to the available business processes and tools and get their feedback on usability and areas for
improvement.
8.3 Enhancing efficiency
Implementation of the WPB in 2020-2021 reflected a commitment to the efficiency of internal
support functions, particularly the performance of human resources management, legal, finance, and
facilities services in line with the reform agenda. GGGI is further strengthening the foundation for a
country-based operation business model and ability to respond to the needs of its partners, by
empowering staff in the field and those closer to the clients, to make necessary decisions on GGGI
operations. To track the performance of enhancing efficiency, GGGI has also established 2020 targets
for the percentage of spending on non-programmatic activities (see Table 7). The results for 2020
show a decrease in the percentage of total budget spending on non-programmatic activities
decreased from 20% in 2019 to 16% in 2020, coming in well below the 2020 target by 14%.
31 | P a g e
9.0 COUNTRY SCORECARDS
GGGI has for the first time GGGI has introduced Country Score Cards in its EOY results report which
are presented in this section by region, namely Asia, Latin America and the Caribbean, Pacific, the
Middle-East and Africa. There are 34 country scorecards altogether (when reading the scorecards,
blank spaces imply countries have not results to report or that information was not available).
These scorecards which were developed for every Member provide a snapshot of each country
programs’ including the number of projects implemented, project status and performance,
information on budget vs expenditure, SO impact estimates for both 2020 and 2017-2020
cumulative total, key CRF results including green investments mobilized, resources mobilized, and
poverty and gender markers. Unlike previous years when reporting was done at the project level, the
reporting of the 2020 results has been aggregated at the country program level focusing primarily
on outcomes and impacts drawing on the countries’ CPRRs.
The details of the countries’ SO impact contribution can be accessed through the individual CPRRs.
Not all country programs have CPRRs and for 2020, 25 of the 27 eligible country programs have
CPRRs which can be found here. The country programs that have CPRRs are based on their size and
maturity. To lessen the burden of reporting, small and mostly new country programs that have
budgets lower than USD 100,000, were excluded from submitting a CPRR in 2020. For example,
Côte d'Ivoire, Mozambique, Thailand, Sri Lanka, China, Qatar, Paraguay and the Caribbean Regional
Program were excluded but all these countries will have CPRRs and a country IPA to report their
results and SO impact by end of 2022.

32 | P a g e
7.1 Asia: Cambodia, China, India, Indonesia, Lao PDR, Mongolia, Myanmar, Nepal, Philippines, Sri Lanka, Thailand, Vietnam
1. Name of Program Cambodia 2. Year/Period 2020/1 January-31 December
Projects implemented
No. Project Code
3. Project Title Status (Completed, On Track, At Risk, Off Track)
4. Project Budget Vs. Expenditure (USD)
Total Core USD/%
EM USD/%
1 KH08 Promotion of Sustainable Energy Practices in the Garment Sector in Cambodia On Track
414,742 11% 89%
2 KH09 Waste to Energy in Phnom Penh At risk 110,749 100% 0%
3 KH11 Greening Mobility through Electric Motorcycles in Cambodia On Track
189,444 0% 100%
4 KH12 Green City Capacity Development On Track 165,624 100% 0%
5 KH15 Support the update of Nationally Determined Contributions (NDC) in Cambodia for the Industry Sector
Completed
94,186 39% 61%
6 KH16 Green Mobility Phase II On Track 45,247 100% 0%
7 KH22 Waste management in Cambodia Phase II On Track 41,488 100% 0%
8 KHPM Program Management 123,145 100% 0%
Country Resources Overlay
5. Country Budget (USD) 6. Expenditure (USD) 7. Expenditure/Budget % 8. Staffing numbers
Core: 570,095 Core: 532,864 Core: 93% 6
Earmarked: 614,532 EM: 407,430 EM: 66%
Total: 1,184,628 Total: 940,294 Total: 79%
9. Strategic Outcomes (SOs) Link to CPRR Country Program Results Report 2020 Total 2017-2020 Cumulative Total
SO # Attribution Contribution Attribution Contribution
SO1 N/A N/A 1.5 Million tCO2eq 0.727 Million tCO2eq
SO2 N/A N/A 750 Jobs N/A
SO3 N/A N/A SO 3.1: 0.08 Million SO 3.1: 8 Million
SO4 N/A N/A N/A N/A
SO5 N/A N/A N/A N/A
SO6 N/A N/A N/A N/A
Policy based results
10. No. of completed policy advisory outputs informing development of green growth policies (CRF output 1.1) Total: 6 - KH11 (1), KH12 (1), KH15 (4)
11. No. of green growth policies adopted by government with GGGI’s support (CRF outcome 1.2) Total: 6 - KH12 (5), KH15 (1)
Mobilized Green Investment Commitments
12. No of completed advisory outputs that inform decisions on green investments (CRF output 2.1) Total: 1 - KH12 (1)
0
200,000
400,000
600,000
800,000
KH08 KH09 KH11 KH12 KH15 KH16 KH22 KHPM
Annual Budget vs Expenditure
Annual Budget Expenditure

33 | P a g e
13. Green investment commitments mobilized (CRF outcome 2.1) 940,294
14. Green Investment Pipeline: Number of Projects – USD Value KH08: 25M, KH09: 20M, KH11: 15M. KH16: 10M
Value for Money (VfM)
15. Spending – (cost of delivery) (USD)
16. Equity (is country an LDC LLDC, SIDS or MIC (non-vulnerable counties) LDC ☒ LLDC ☐ SIDS ☐ MIC (non-vulnerable countries) ☐
Resources Mobilized Pipeline and Approved
17. No. of projects in RM pipeline 3
18. No. of submitted RM proposals 3
19. RM Earmarked funding secured (USD) 2, 720,000
20. List of Earmarked Donors 1. Ministry of Public Works and Transport of Cambodia, 2. World Bank, 3. KOICA, 4. EU Switch Asia 5. SEA
Environmental and Social Safeguards
21. No. of projects with poverty and gender markers (indicate using project code) KH08, KH11, KH12, KH15, KH22
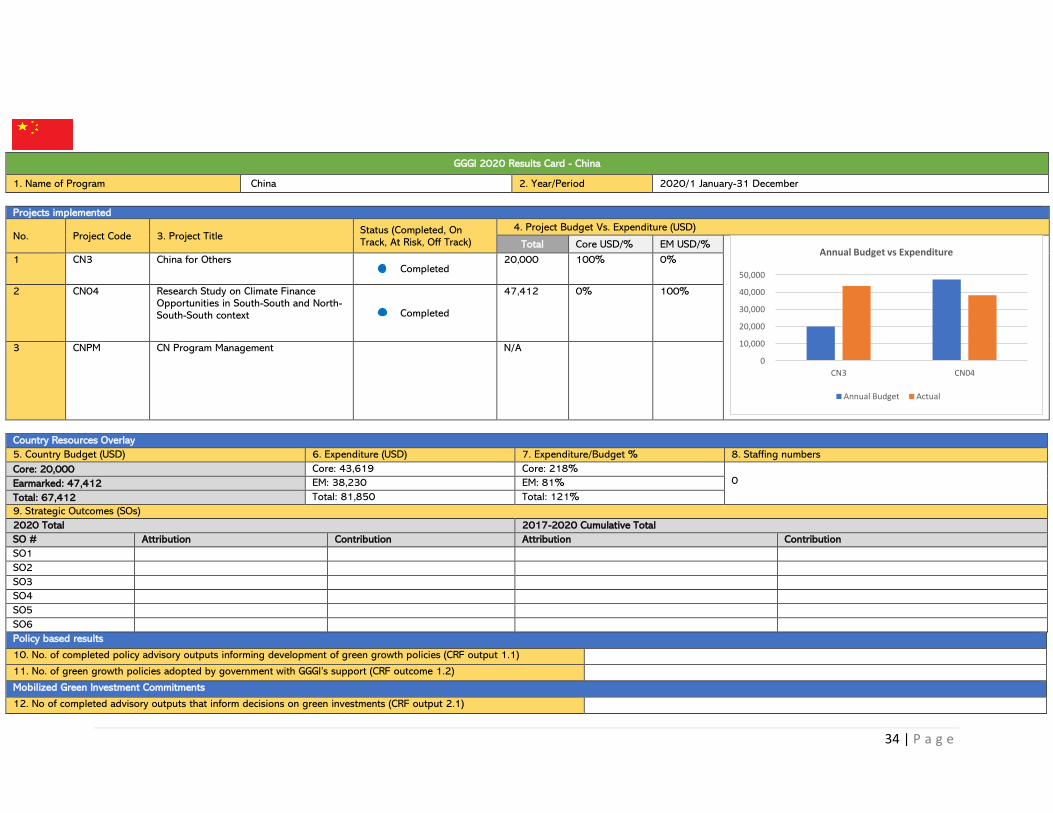
34 | P a g e
GGGI 2020 Results Card - China
1. Name of Program China 2. Year/Period 2020/1 January-31 December
Projects implemented
No. Project Code 3. Project Title Status (Completed, On Track, At Risk, Off Track)
4. Project Budget Vs. Expenditure (USD)
Total Core USD/% EM USD/%
1 CN3 China for Others Completed
20,000 100% 0%
2 CN04 Research Study on Climate Finance Opportunities in South-South and North-South-South context Completed
47,412 0% 100%
3 CNPM CN Program Management N/A
Country Resources Overlay
5. Country Budget (USD) 6. Expenditure (USD) 7. Expenditure/Budget % 8. Staffing numbers
Core: 20,000 Core: 43,619 Core: 218% 0 Earmarked: 47,412 EM: 38,230 EM: 81%
Total: 67,412 Total: 81,850 Total: 121%
9. Strategic Outcomes (SOs)
2020 Total 2017-2020 Cumulative Total
SO # Attribution Contribution Attribution Contribution
SO1
SO2
SO3
SO4
SO5
SO6
Policy based results
10. No. of completed policy advisory outputs informing development of green growth policies (CRF output 1.1)
11. No. of green growth policies adopted by government with GGGI’s support (CRF outcome 1.2)
Mobilized Green Investment Commitments
12. No of completed advisory outputs that inform decisions on green investments (CRF output 2.1)
0
10,000
20,000
30,000
40,000
50,000
CN3 CN04
Annual Budget vs Expenditure
Annual Budget Actual

35 | P a g e
13. Green investment commitments mobilized (CRF outcome 2.1)
14. Green Investment Pipeline: Number of Projects – USD Value
Value for Money (VfM)
15. Spending – (cost of delivery) (USD) 81,850
16. Equity (is country an LDC LLDC, SIDS or MIC (non-vulnerable counties) LDC ☐ LLDC ☐ SIDS ☐ MIC (non-vulnerable countries) ☒
Resources Mobilized Pipeline and Approved
17. No. of projects in RM pipeline
18. No. of submitted RM proposals
19. RM Earmarked funding secured (USD)
20. List of Earmarked Donors
Environmental and Social Safeguards
21. No. of projects with poverty and gender markers (indicate using project code) CN04
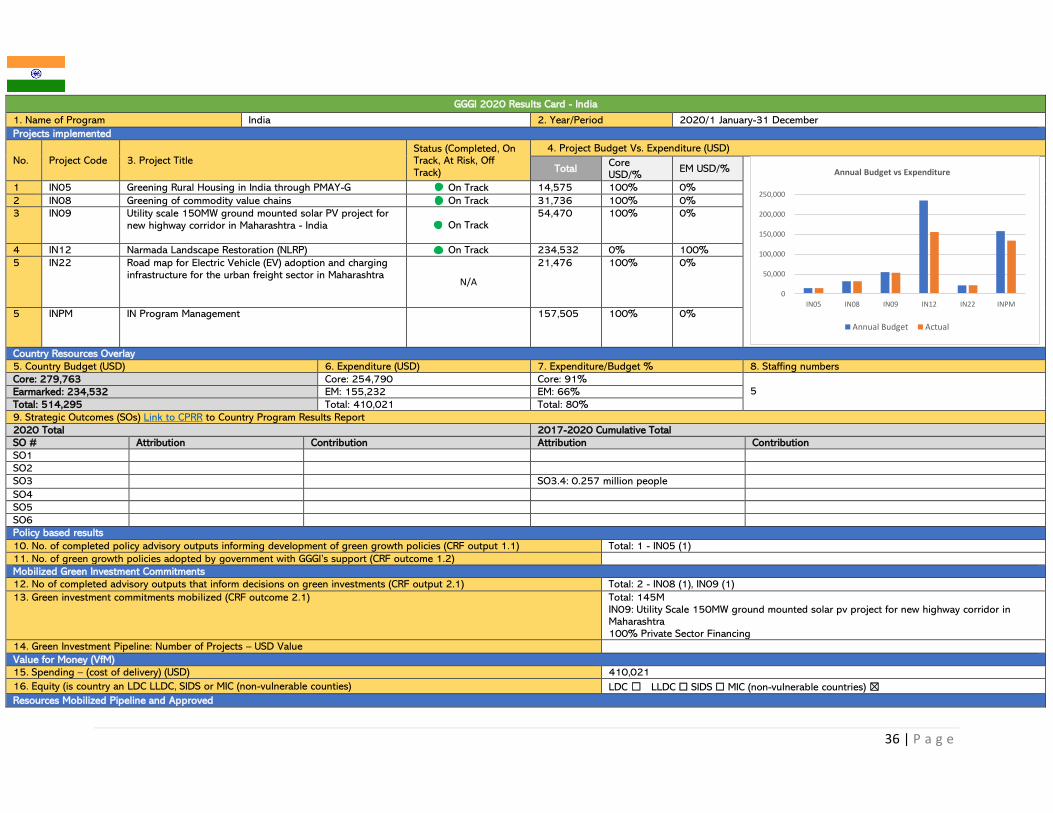
36 | P a g e
GGGI 2020 Results Card - India
1. Name of Program India 2. Year/Period 2020/1 January-31 December
Projects implemented
No. Project Code 3. Project Title Status (Completed, On Track, At Risk, Off Track)
4. Project Budget Vs. Expenditure (USD)
Total Core USD/%
EM USD/%
1 IN05 Greening Rural Housing in India through PMAY-G On Track 14,575 100% 0%
2 IN08 Greening of commodity value chains On Track 31,736 100% 0%
3 IN09 Utility scale 150MW ground mounted solar PV project for new highway corridor in Maharashtra - India On Track
54,470 100% 0%
4 IN12 Narmada Landscape Restoration (NLRP) On Track 234,532 0% 100%
5 IN22 Road map for Electric Vehicle (EV) adoption and charging infrastructure for the urban freight sector in Maharashtra
N/A
21,476 100% 0%
5 INPM IN Program Management 157,505 100% 0%
Country Resources Overlay
5. Country Budget (USD) 6. Expenditure (USD) 7. Expenditure/Budget % 8. Staffing numbers
Core: 279,763 Core: 254,790 Core: 91% 5
Earmarked: 234,532 EM: 155,232 EM: 66%
Total: 514,295 Total: 410,021 Total: 80%
9. Strategic Outcomes (SOs) Link to CPRR to Country Program Results Report
2020 Total 2017-2020 Cumulative Total
SO # Attribution Contribution Attribution Contribution
SO1
SO2
SO3 SO3.4: 0.257 million people
SO4
SO5
SO6
Policy based results
10. No. of completed policy advisory outputs informing development of green growth policies (CRF output 1.1) Total: 1 - IN05 (1)
11. No. of green growth policies adopted by government with GGGI’s support (CRF outcome 1.2)
Mobilized Green Investment Commitments
12. No of completed advisory outputs that inform decisions on green investments (CRF output 2.1) Total: 2 - IN08 (1), IN09 (1)
13. Green investment commitments mobilized (CRF outcome 2.1) Total: 145M IN09: Utility Scale 150MW ground mounted solar pv project for new highway corridor in Maharashtra 100% Private Sector Financing
14. Green Investment Pipeline: Number of Projects – USD Value
Value for Money (VfM)
15. Spending – (cost of delivery) (USD) 410,021
16. Equity (is country an LDC LLDC, SIDS or MIC (non-vulnerable counties) LDC ☐ LLDC ☐ SIDS ☐ MIC (non-vulnerable countries) ☒
Resources Mobilized Pipeline and Approved
0
50,000
100,000
150,000
200,000
250,000
IN05 IN08 IN09 IN12 IN22 INPM
Annual Budget vs Expenditure
Annual Budget Actual
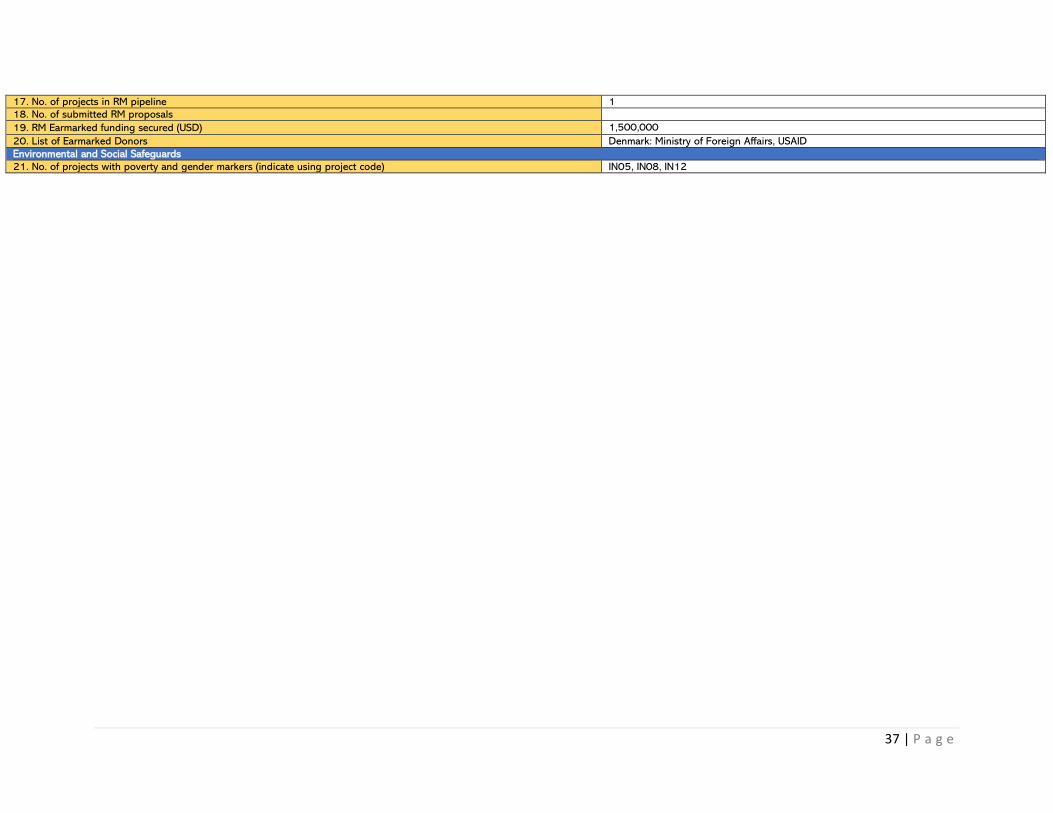
37 | P a g e
17. No. of projects in RM pipeline 1
18. No. of submitted RM proposals
19. RM Earmarked funding secured (USD) 1,500,000 20. List of Earmarked Donors Denmark: Ministry of Foreign Affairs, USAID
Environmental and Social Safeguards
21. No. of projects with poverty and gender markers (indicate using project code) IN05, IN08, IN12

38 | P a g e
GGGI 2020 Results Card - Indonesia
1. Name of Program Indonesia 2. Year/Period 2020/1 January-31 December
No. Project Code 3. Project Title Status (Completed, On Track, At Risk, Off Track)
4. Project Budget Vs. Expenditure (USD)
Total Core USD/%
EM USD/%
1 ID1 Indonesia Green Growth Program Phase II Completed 3,837,384 0% 100%
2 ID3 GCF - Indonesia Completed 415,425 0% 100%
3 ID04 GGP3 Landscapes Project On Track 1,237,499 0% 100%
4 ID05 Climate Action Enhancement Package: Indonesia On Track 504,856 0% 100%
5 ID06 GCF Readiness Preparation Support Program (RPSP Phase II)
On Track 264,218 0% 100%
6 IDPM ID Program Management N/A
Country Resources Overlay
5. Country Budget (USD) 6. Expenditure (USD) 7. Expenditure/Budget % 8. Staffing numbers
Core: Core: Core: 42
Earmarked: 6,259,382 EM: 4,974,877 EM: 79%
Total: 6,259,382 Total: 4,974,877 Total: 79%
9. Strategic Outcomes (SOs) Link to CPRR Country Program Results Report
2020 Total 2017-2020 Cumulative Total
SO # Attribution Contribution Attribution Contribution SO1
SO2
SO3
SO4
SO5
SO6
Policy based results
10. No. of completed policy advisory outputs informing development of green growth policies (CRF output 1.1) Total: 19 ID1 (17), ID3(2)
11. No. of green growth policies adopted by government with GGGI’s support (CRF outcome 1.2) Total: 11 ID1 (11)
Mobilized Green Investment Commitments
12. No of completed advisory outputs that inform decisions on green investments (CRF output 2.1) Total: 4 - ID1 (4)
13. Green investment commitments mobilized (CRF outcome 2.1) ID1: Indonesia Green Growth Program Phase II – 126.8M
Private Sector Financing: 23M
Public Sector Financing: 103.8M
14. Green Investment Pipeline: Number of Projects – USD Value 1. Commercial viability of biogas applications in Central and East Kalimantan: 3.5M 2. Sukuk finance for sustainable peatlands restoration in Sebangau National Park: 7.5M
0
1,000,000
2,000,000
3,000,000
4,000,000
5,000,000
ID1 ID3 ID04 ID05 ID06
Annual Budget vs Expenditure
Annual Budget Actual

39 | P a g e
Value for Money (VfM)
15. Spending – (cost of delivery) (USD) 4,974,877
16. Equity (is country an LDC LLDC, SIDS or MIC (non-vulnerable counties) LDC ☐ LLDC ☐ SIDS ☐ MIC (non-vulnerable countries) ☒
Resources Mobilized Pipeline and Approved
17. No. of projects in RM pipeline 6
18. No. of submitted RM proposals 1
19. RM Earmarked funding secured (USD) 11,627,970
20. List of Earmarked Donors GCF, NDC Partnership, Norway: Embassy in Indonesia, Norway: Ministry of Climate and Environment
Environmental and Social Safeguards
21. No. of projects with poverty and gender markers (indicate using project code) ID1, ID3, ID04, ID05, ID06
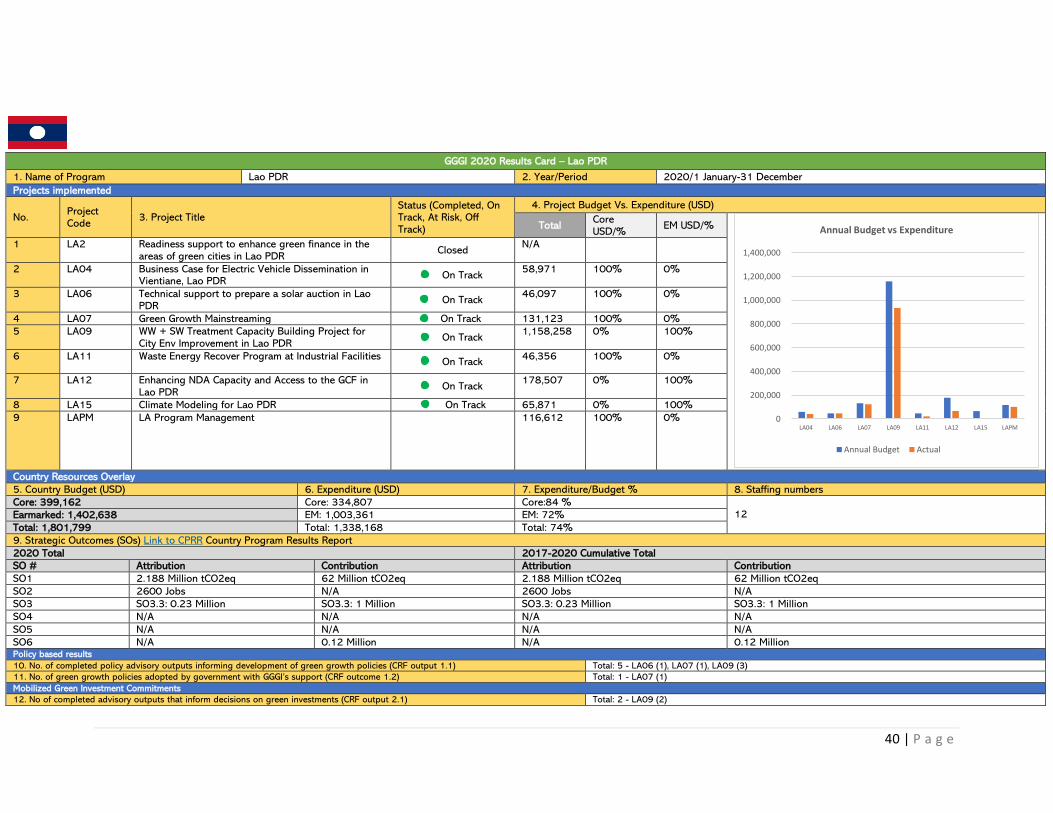
40 | P a g e
GGGI 2020 Results Card – Lao PDR
1. Name of Program Lao PDR 2. Year/Period 2020/1 January-31 December
Projects implemented
No. Project Code
3. Project Title Status (Completed, On Track, At Risk, Off Track)
4. Project Budget Vs. Expenditure (USD)
Total Core USD/%
EM USD/%
1 LA2 Readiness support to enhance green finance in the areas of green cities in Lao PDR
Closed N/A
2 LA04 Business Case for Electric Vehicle Dissemination in Vientiane, Lao PDR
On Track 58,971 100% 0%
3 LA06 Technical support to prepare a solar auction in Lao PDR
On Track 46,097 100% 0%
4 LA07 Green Growth Mainstreaming On Track 131,123 100% 0%
5 LA09 WW + SW Treatment Capacity Building Project for City Env Improvement in Lao PDR
On Track 1,158,258 0% 100%
6 LA11 Waste Energy Recover Program at Industrial Facilities On Track
46,356 100% 0%
7 LA12 Enhancing NDA Capacity and Access to the GCF in Lao PDR
On Track 178,507 0% 100%
8 LA15 Climate Modeling for Lao PDR On Track 65,871 0% 100%
9 LAPM LA Program Management 116,612 100% 0%
Country Resources Overlay
5. Country Budget (USD) 6. Expenditure (USD) 7. Expenditure/Budget % 8. Staffing numbers
Core: 399,162 Core: 334,807 Core:84 % 12 Earmarked: 1,402,638 EM: 1,003,361 EM: 72%
Total: 1,801,799 Total: 1,338,168 Total: 74%
9. Strategic Outcomes (SOs) Link to CPRR Country Program Results Report
2020 Total 2017-2020 Cumulative Total
SO # Attribution Contribution Attribution Contribution
SO1 2.188 Million tCO2eq 62 Million tCO2eq 2.188 Million tCO2eq 62 Million tCO2eq
SO2 2600 Jobs N/A 2600 Jobs N/A
SO3 SO3.3: 0.23 Million SO3.3: 1 Million SO3.3: 0.23 Million SO3.3: 1 Million
SO4 N/A N/A N/A N/A
SO5 N/A N/A N/A N/A
SO6 N/A 0.12 Million N/A 0.12 Million Policy based results
10. No. of completed policy advisory outputs informing development of green growth policies (CRF output 1.1) Total: 5 - LA06 (1), LA07 (1), LA09 (3)
11. No. of green growth policies adopted by government with GGGI’s support (CRF outcome 1.2) Total: 1 - LA07 (1)
Mobilized Green Investment Commitments
12. No of completed advisory outputs that inform decisions on green investments (CRF output 2.1) Total: 2 - LA09 (2)
0
200,000
400,000
600,000
800,000
1,000,000
1,200,000
1,400,000
LA04 LA06 LA07 LA09 LA11 LA12 LA15 LAPM
Annual Budget vs Expenditure
Annual Budget Actual
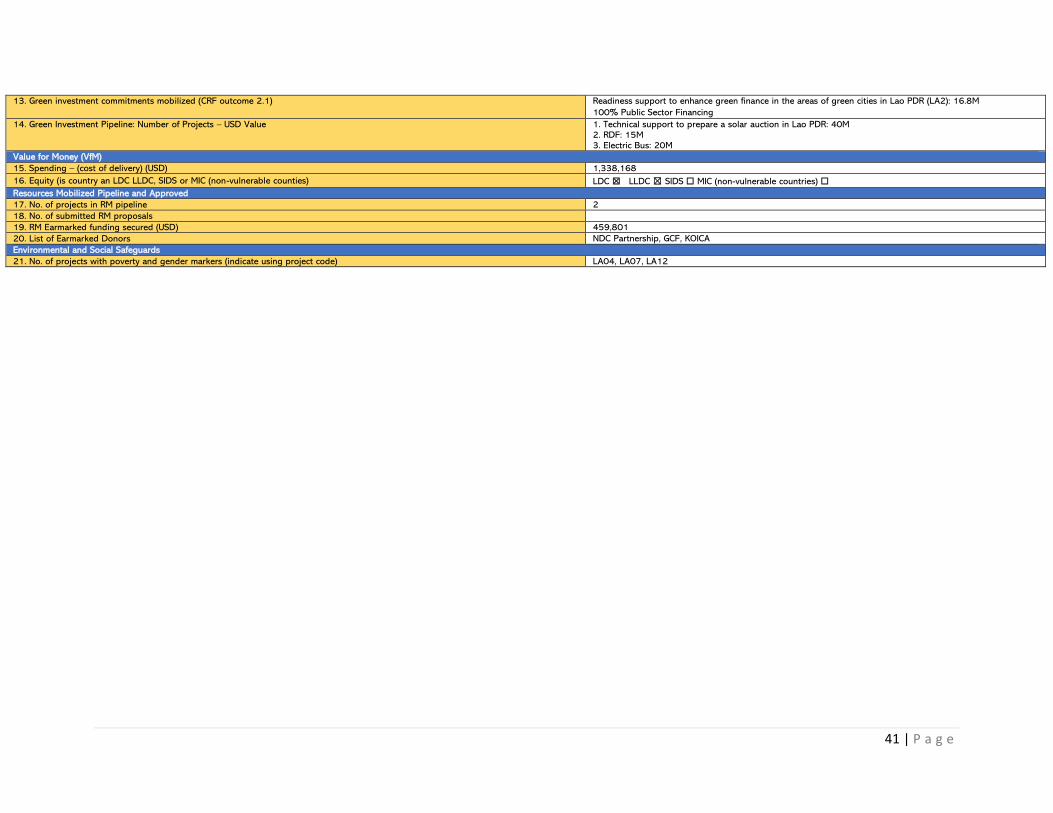
41 | P a g e
13. Green investment commitments mobilized (CRF outcome 2.1) Readiness support to enhance green finance in the areas of green cities in Lao PDR (LA2): 16.8M
100% Public Sector Financing
14. Green Investment Pipeline: Number of Projects – USD Value 1. Technical support to prepare a solar auction in Lao PDR: 40M 2. RDF: 15M 3. Electric Bus: 20M
Value for Money (VfM)
15. Spending – (cost of delivery) (USD) 1,338,168
16. Equity (is country an LDC LLDC, SIDS or MIC (non-vulnerable counties) LDC ☒ LLDC ☒ SIDS ☐ MIC (non-vulnerable countries) ☐
Resources Mobilized Pipeline and Approved
17. No. of projects in RM pipeline 2
18. No. of submitted RM proposals
19. RM Earmarked funding secured (USD) 459,801
20. List of Earmarked Donors NDC Partnership, GCF, KOICA
Environmental and Social Safeguards
21. No. of projects with poverty and gender markers (indicate using project code) LA04, LA07, LA12
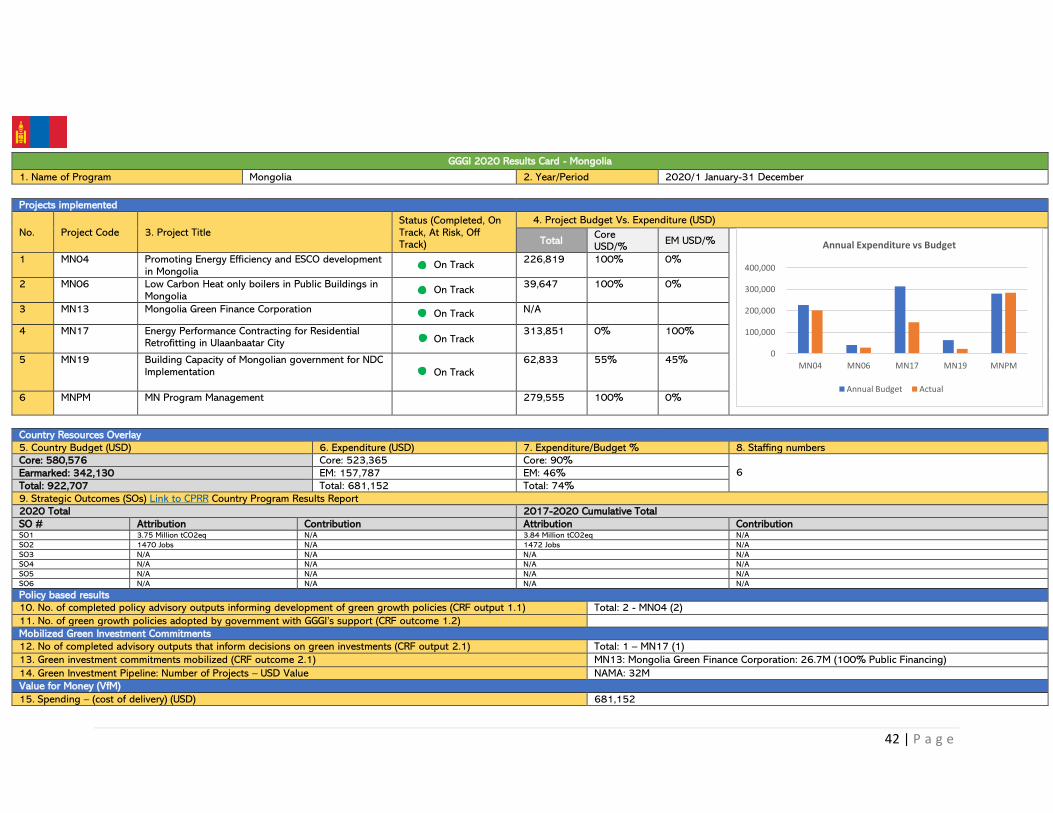
42 | P a g e
GGGI 2020 Results Card - Mongolia
1. Name of Program Mongolia 2. Year/Period 2020/1 January-31 December
Projects implemented
No. Project Code 3. Project Title Status (Completed, On Track, At Risk, Off Track)
4. Project Budget Vs. Expenditure (USD)
Total Core USD/%
EM USD/%
1 MN04 Promoting Energy Efficiency and ESCO development in Mongolia
On Track 226,819 100% 0%
2 MN06 Low Carbon Heat only boilers in Public Buildings in Mongolia
On Track 39,647 100% 0%
3 MN13 Mongolia Green Finance Corporation On Track N/A
4 MN17 Energy Performance Contracting for Residential Retrofitting in Ulaanbaatar City On Track
313,851 0% 100%
5 MN19 Building Capacity of Mongolian government for NDC Implementation On Track
62,833 55% 45%
6 MNPM MN Program Management 279,555 100% 0%
Country Resources Overlay
5. Country Budget (USD) 6. Expenditure (USD) 7. Expenditure/Budget % 8. Staffing numbers
Core: 580,576 Core: 523,365 Core: 90% 6 Earmarked: 342,130 EM: 157,787 EM: 46%
Total: 922,707 Total: 681,152 Total: 74%
9. Strategic Outcomes (SOs) Link to CPRR Country Program Results Report
2020 Total 2017-2020 Cumulative Total
SO # Attribution Contribution Attribution Contribution SO1 3.75 Million tCO2eq N/A 3.84 Million tCO2eq N/A
SO2 1470 Jobs N/A 1472 Jobs N/A
SO3 N/A N/A N/A N/A
SO4 N/A N/A N/A N/A
SO5 N/A N/A N/A N/A
SO6 N/A N/A N/A N/A
Policy based results
10. No. of completed policy advisory outputs informing development of green growth policies (CRF output 1.1) Total: 2 - MN04 (2)
11. No. of green growth policies adopted by government with GGGI’s support (CRF outcome 1.2)
Mobilized Green Investment Commitments
12. No of completed advisory outputs that inform decisions on green investments (CRF output 2.1) Total: 1 – MN17 (1)
13. Green investment commitments mobilized (CRF outcome 2.1) MN13: Mongolia Green Finance Corporation: 26.7M (100% Public Financing)
14. Green Investment Pipeline: Number of Projects – USD Value NAMA: 32M
Value for Money (VfM)
15. Spending – (cost of delivery) (USD) 681,152
0
100,000
200,000
300,000
400,000
MN04 MN06 MN17 MN19 MNPM
Annual Expenditure vs Budget
Annual Budget Actual

43 | P a g e
16. Equity (is country an LDC LLDC, SIDS or MIC (non-vulnerable counties) LDC ☐ LLDC ☒ SIDS ☐ MIC (non-vulnerable countries) ☒
Resources Mobilized Pipeline and Approved
17. No. of projects in RM pipeline 1
18. No. of submitted RM proposals 2
19 RM Earmarked funding secured (USD) 20,341
20. List of Earmarked Donors UNEP, NAMA Facility
Environmental and Social Safeguards
21. No. of projects with poverty and gender markers (indicate using project code) MN04, MN13, MN17, MN19

44 | P a g e
GGGI 2020 Results Card - Myanmar
1. Name of Program Myanmar 2. Year/Period 2020/1 January-31 December
Projects implemented
No. Project Code 3. Project Title Status (Completed, On Track, At Risk, Off Track)
4. Project Budget Vs. Expenditure (USD)
Total Core USD/%
EM USD/%
1 MM03 Mangrove Restoration Program in Myanmar On Track 161,127 76% 24%
2 MM04 Development of MRV Capacity Building Program On Track 107,334 77% 23%
3 MM09 Readiness Support for Developing Myanmar's Green Cities Investment Plans On Track
755,836 3% 97%
4 MM10 Rice-Husk-To-Power Leasing Finance Facility (RH2P) On Track
77,677 100% 0%
5 MM11 Distributed Ledger Technology Powered Improved Cookstoves Finance Facility (DLTICS) N/A
17,214 100% 0%
6 MM18 World Bank WAVES - 3Returns in Western Ayeyarwady Completed
80,000 0% 100%
7 MMPM MM Program Management 126,326 100% 0%
Country Resources Overlay
5. Country Budget (USD) 6. Expenditure (USD) 7. Expenditure/Budget % 8. Staffing numbers
Core: 444,795 Core: 384,914 Core: 87% 3 Earmarked: 880,719 EM: 419,408 EM: 48%
Total: 1,325,514 Total: 804,322 Total: 61%
9. Strategic Outcomes (SOs)
2020 Total 2017-2020 Cumulative Total
SO # Attribution Contribution Attribution Contribution SO1
SO2
SO3
SO4
SO5
SO6
Policy based results
10. No. of completed policy advisory outputs informing development of green growth policies (CRF output 1.1) Total: 3 - MM03 (2), MM18 (1)
11. No. of green growth policies adopted by government with GGGI’s support (CRF outcome 1.2)
Mobilized Green Investment Commitments
12. No of completed advisory outputs that inform decisions on green investments (CRF output 2.1)
13. Green investment commitments mobilized (CRF outcome 2.1)
14. Green Investment Pipeline: Number of Projects – USD Value
Value for Money (VfM)
0
200,000
400,000
600,000
800,000
MM03 MM04 MM09 MM10 MM11 MM18 MMPM
Annual Budget vs Expenditure
Annual Budget Actual

45 | P a g e
15. Spending – (cost of delivery) (USD) 804,322
16. Equity (is country an LDC LLDC, SIDS or MIC (non-vulnerable counties) LDC ☒ LLDC ☐ SIDS ☐ MIC (non-vulnerable countries) ☐
Resources Mobilized Pipeline and Approved
17. No. of projects in RM pipeline 3
18. No. of submitted RM proposals
19. RM Earmarked funding secured (USD) 590,000
20. List of Earmarked Donors World Bank, The Global Environment Facility, KOICA, Mava Foundation, Australian Volunteers
Environmental and Social Safeguards
21. No. of projects with poverty and gender markers (indicate using project code) MM03, MM04, MM09, MM10, MM18
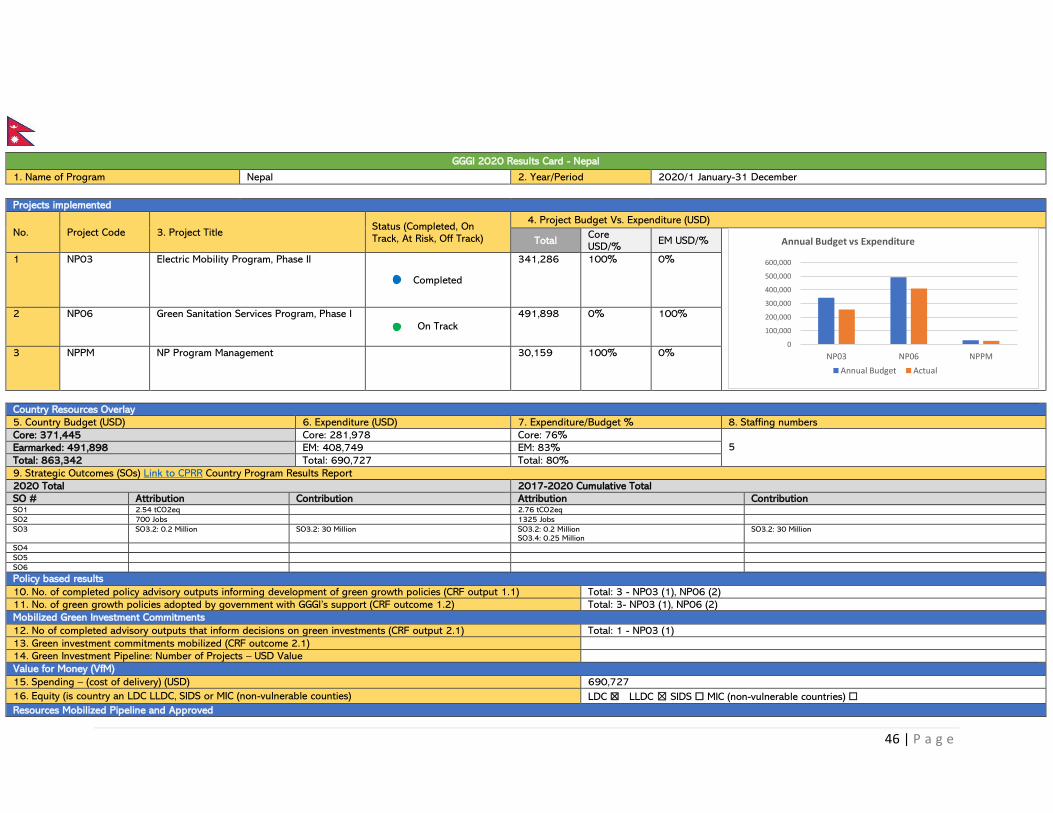
46 | P a g e
GGGI 2020 Results Card - Nepal
1. Name of Program Nepal 2. Year/Period 2020/1 January-31 December
Projects implemented
No. Project Code 3. Project Title Status (Completed, On Track, At Risk, Off Track)
4. Project Budget Vs. Expenditure (USD)
Total Core USD/%
EM USD/%
1 NP03 Electric Mobility Program, Phase II
Completed
341,286 100% 0%
2 NP06 Green Sanitation Services Program, Phase I
On Track
491,898 0% 100%
3 NPPM NP Program Management 30,159 100% 0%
Country Resources Overlay
5. Country Budget (USD) 6. Expenditure (USD) 7. Expenditure/Budget % 8. Staffing numbers
Core: 371,445 Core: 281,978 Core: 76% 5
Earmarked: 491,898 EM: 408,749 EM: 83%
Total: 863,342 Total: 690,727 Total: 80%
9. Strategic Outcomes (SOs) Link to CPRR Country Program Results Report 2020 Total 2017-2020 Cumulative Total
SO # Attribution Contribution Attribution Contribution SO1 2.54 tCO2eq 2.76 tCO2eq
SO2 700 Jobs 1325 Jobs
SO3 SO3.2: 0.2 Million SO3.2: 30 Million SO3.2: 0.2 Million SO3.4: 0.25 Million
SO3.2: 30 Million
SO4
SO5
SO6
Policy based results
10. No. of completed policy advisory outputs informing development of green growth policies (CRF output 1.1) Total: 3 - NP03 (1), NP06 (2)
11. No. of green growth policies adopted by government with GGGI’s support (CRF outcome 1.2) Total: 3- NP03 (1), NP06 (2)
Mobilized Green Investment Commitments
12. No of completed advisory outputs that inform decisions on green investments (CRF output 2.1) Total: 1 - NP03 (1)
13. Green investment commitments mobilized (CRF outcome 2.1)
14. Green Investment Pipeline: Number of Projects – USD Value
Value for Money (VfM)
15. Spending – (cost of delivery) (USD) 690,727
16. Equity (is country an LDC LLDC, SIDS or MIC (non-vulnerable counties) LDC ☒ LLDC ☒ SIDS ☐ MIC (non-vulnerable countries) ☐
Resources Mobilized Pipeline and Approved
0
100,000
200,000
300,000
400,000
500,000
600,000
NP03 NP06 NPPM
Annual Budget vs Expenditure
Annual Budget Actual
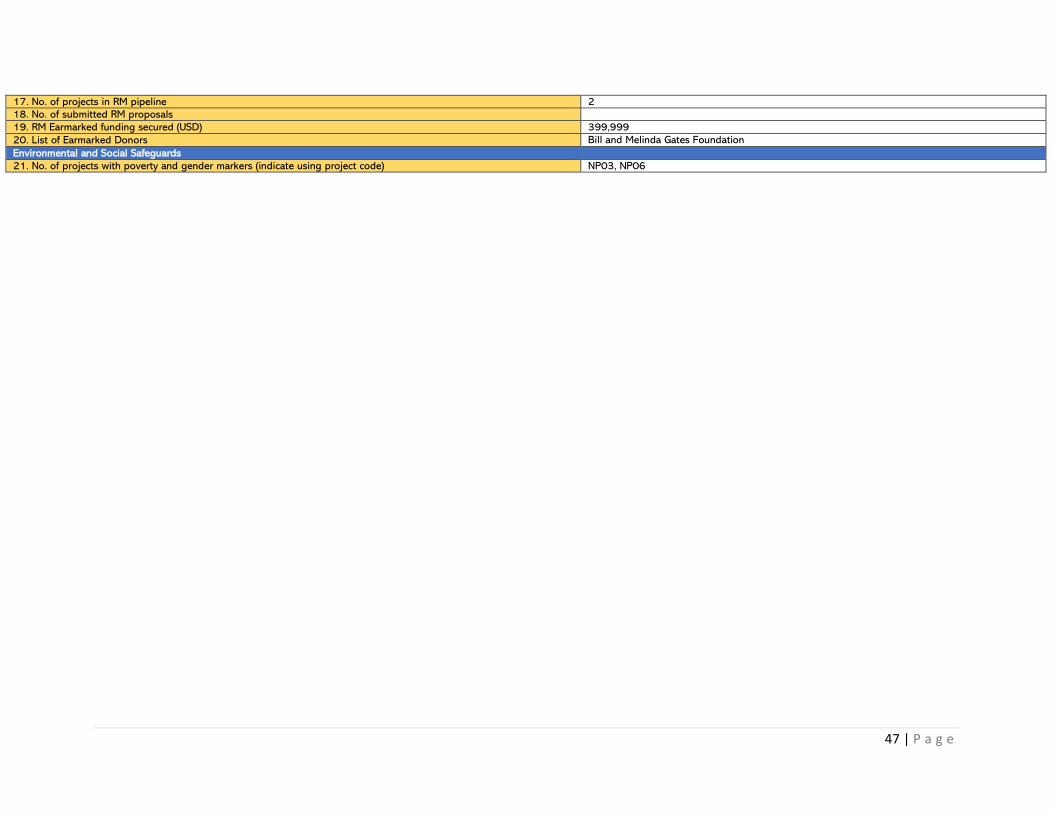
47 | P a g e
17. No. of projects in RM pipeline 2
18. No. of submitted RM proposals
19. RM Earmarked funding secured (USD) 399,999
20. List of Earmarked Donors Bill and Melinda Gates Foundation
Environmental and Social Safeguards
21. No. of projects with poverty and gender markers (indicate using project code) NP03, NP06
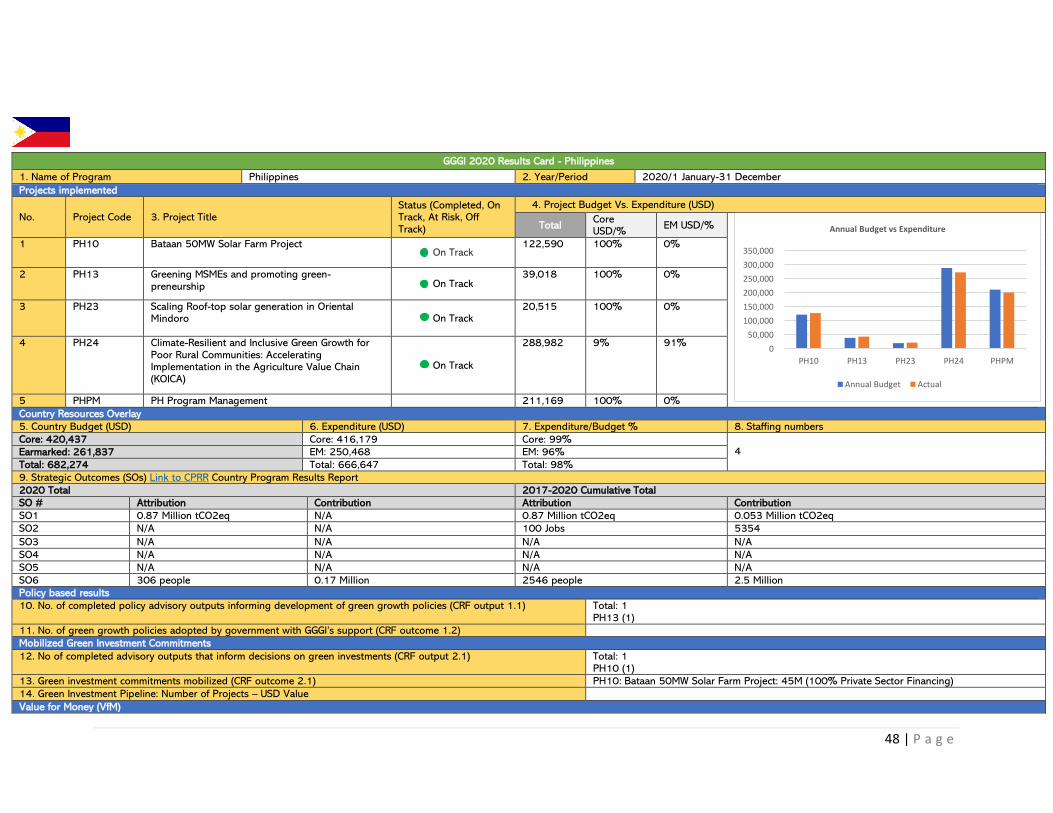
48 | P a g e
GGGI 2020 Results Card - Philippines
1. Name of Program Philippines 2. Year/Period 2020/1 January-31 December
Projects implemented
No. Project Code 3. Project Title Status (Completed, On Track, At Risk, Off Track)
4. Project Budget Vs. Expenditure (USD)
Total Core USD/%
EM USD/%
1 PH10 Bataan 50MW Solar Farm Project On Track
122,590 100% 0%
2 PH13 Greening MSMEs and promoting green-preneurship On Track
39,018 100% 0%
3 PH23 Scaling Roof-top solar generation in Oriental Mindoro On Track
20,515 100% 0%
4 PH24 Climate-Resilient and Inclusive Green Growth for Poor Rural Communities: Accelerating Implementation in the Agriculture Value Chain (KOICA)
On Track
288,982 9% 91%
5 PHPM PH Program Management 211,169 100% 0%
Country Resources Overlay
5. Country Budget (USD) 6. Expenditure (USD) 7. Expenditure/Budget % 8. Staffing numbers
Core: 420,437 Core: 416,179 Core: 99% 4
Earmarked: 261,837 EM: 250,468 EM: 96%
Total: 682,274 Total: 666,647 Total: 98%
9. Strategic Outcomes (SOs) Link to CPRR Country Program Results Report
2020 Total 2017-2020 Cumulative Total
SO # Attribution Contribution Attribution Contribution
SO1 0.87 Million tCO2eq N/A 0.87 Million tCO2eq 0.053 Million tCO2eq
SO2 N/A N/A 100 Jobs 5354
SO3 N/A N/A N/A N/A
SO4 N/A N/A N/A N/A
SO5 N/A N/A N/A N/A
SO6 306 people 0.17 Million 2546 people 2.5 Million
Policy based results
10. No. of completed policy advisory outputs informing development of green growth policies (CRF output 1.1) Total: 1 PH13 (1)
11. No. of green growth policies adopted by government with GGGI’s support (CRF outcome 1.2)
Mobilized Green Investment Commitments
12. No of completed advisory outputs that inform decisions on green investments (CRF output 2.1) Total: 1 PH10 (1)
13. Green investment commitments mobilized (CRF outcome 2.1) PH10: Bataan 50MW Solar Farm Project: 45M (100% Private Sector Financing)
14. Green Investment Pipeline: Number of Projects – USD Value
Value for Money (VfM)
0
50,000
100,000
150,000
200,000
250,000
300,000
350,000
PH10 PH13 PH23 PH24 PHPM
Annual Budget vs Expenditure
Annual Budget Actual

49 | P a g e
15. Spending – (cost of delivery) (USD) 666,647
16. Equity (is country an LDC LLDC, SIDS or MIC (non-vulnerable counties) LDC ☐ LLDC ☐ SIDS ☐ MIC (non-vulnerable countries) ☒
Resources Mobilized Pipeline and Approved
17. No. of projects in RM pipeline 1
18. No. of submitted RM proposals
19. RM Earmarked funding secured (USD) 4,540,000
20. List of Earmarked Donors KOICA, GCF
Environmental and Social Safeguards
21. No. of projects with poverty and gender markers (indicate using project code) PH10, PH13, PH23, PH24
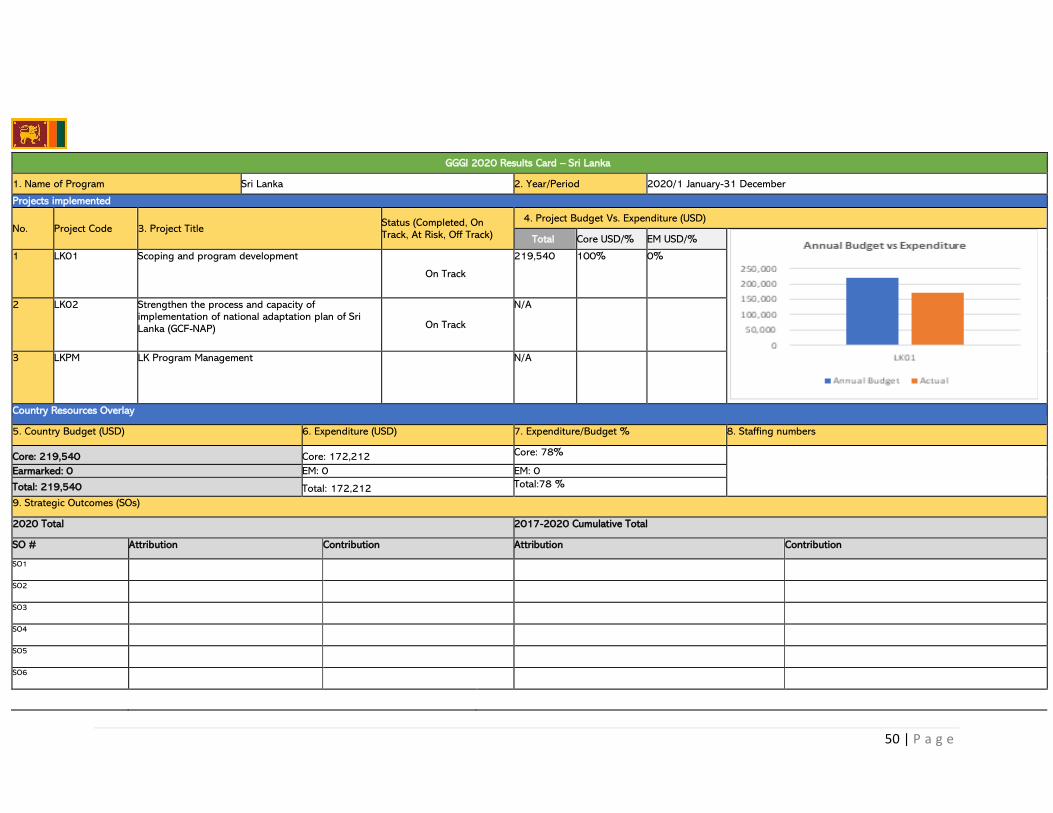
50 | P a g e
GGGI 2020 Results Card – Sri Lanka
1. Name of Program Sri Lanka 2. Year/Period 2020/1 January-31 December
Projects implemented
No. Project Code 3. Project Title Status (Completed, On Track, At Risk, Off Track)
4. Project Budget Vs. Expenditure (USD)
Total Core USD/% EM USD/%
1 LK01 Scoping and program development
On Track
219,540 100% 0%
2 LK02 Strengthen the process and capacity of implementation of national adaptation plan of Sri Lanka (GCF-NAP) On Track
N/A
3 LKPM LK Program Management N/A
Country Resources Overlay
5. Country Budget (USD) 6. Expenditure (USD) 7. Expenditure/Budget % 8. Staffing numbers
Core: 219,540 Core: 172,212 Core: 78%
Earmarked: 0 EM: 0 EM: 0
Total: 219,540 Total: 172,212 Total:78 %
9. Strategic Outcomes (SOs)
2020 Total 2017-2020 Cumulative Total
SO # Attribution Contribution Attribution Contribution
SO1
SO2
SO3
SO4
SO5
SO6

51 | P a g e
Policy based results 10. No. of completed policy advisory outputs informing development of green growth policies (CRF output 1.1) 11. No. of green growth policies adopted by government with GGGI’s support (CRF outcome 1.2) Mobilized Green Investment Commitments 12. No of completed advisory outputs that inform decisions on green investments (CRF output 2.1) 13. Green investment commitments mobilized (CRF outcome 2.1) 14. Green Investment Pipeline: Number of Projects – USD Value Value for Money (VfM)
15. Spending – (cost of delivery) (USD) 172,212 16. Equity (is country an LDC LLDC, SIDS or MIC (non-vulnerable counties) LDC ☐ LLDC ☐ SIDS ☐ MIC (non-vulnerable countries) ☒ Resources Mobilized Pipeline and Approved 17. No. of projects in RM pipeline 1 18. No. of submitted RM proposals 19. RM Earmarked funding secured (USD) 2,975,000 20. List of Earmarked Donors GCF Environmental and Social Safeguards 21. No. of projects with poverty and gender markers (indicate using project code) LK02
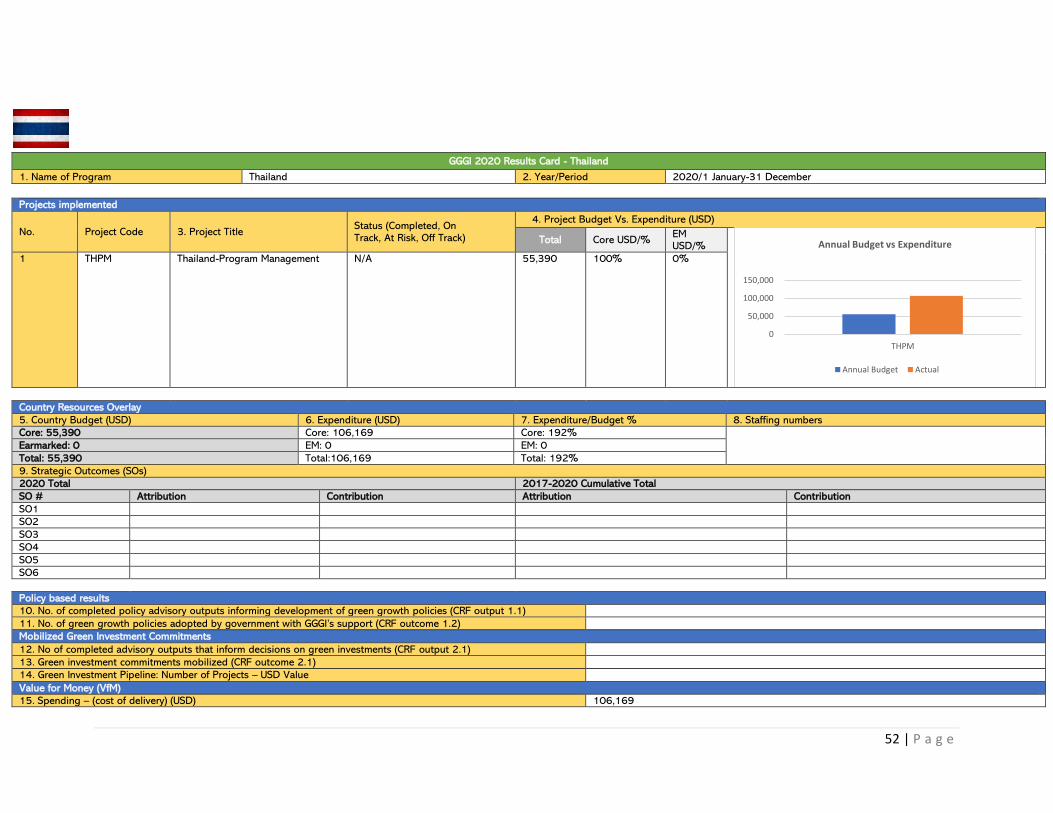
52 | P a g e
GGGI 2020 Results Card - Thailand
1. Name of Program Thailand 2. Year/Period 2020/1 January-31 December
Projects implemented
No. Project Code 3. Project Title Status (Completed, On Track, At Risk, Off Track)
4. Project Budget Vs. Expenditure (USD)
Total Core USD/% EM USD/%
1 THPM Thailand-Program Management
N/A 55,390 100% 0%
Country Resources Overlay
5. Country Budget (USD) 6. Expenditure (USD) 7. Expenditure/Budget % 8. Staffing numbers
Core: 55,390 Core: 106,169 Core: 192%
Earmarked: 0 EM: 0 EM: 0
Total: 55,390 Total:106,169 Total: 192%
9. Strategic Outcomes (SOs)
2020 Total 2017-2020 Cumulative Total
SO # Attribution Contribution Attribution Contribution
SO1
SO2
SO3
SO4
SO5
SO6
Policy based results
10. No. of completed policy advisory outputs informing development of green growth policies (CRF output 1.1)
11. No. of green growth policies adopted by government with GGGI’s support (CRF outcome 1.2)
Mobilized Green Investment Commitments
12. No of completed advisory outputs that inform decisions on green investments (CRF output 2.1)
13. Green investment commitments mobilized (CRF outcome 2.1)
14. Green Investment Pipeline: Number of Projects – USD Value
Value for Money (VfM)
15. Spending – (cost of delivery) (USD) 106,169
0
50,000
100,000
150,000
THPM
Annual Budget vs Expenditure
Annual Budget Actual
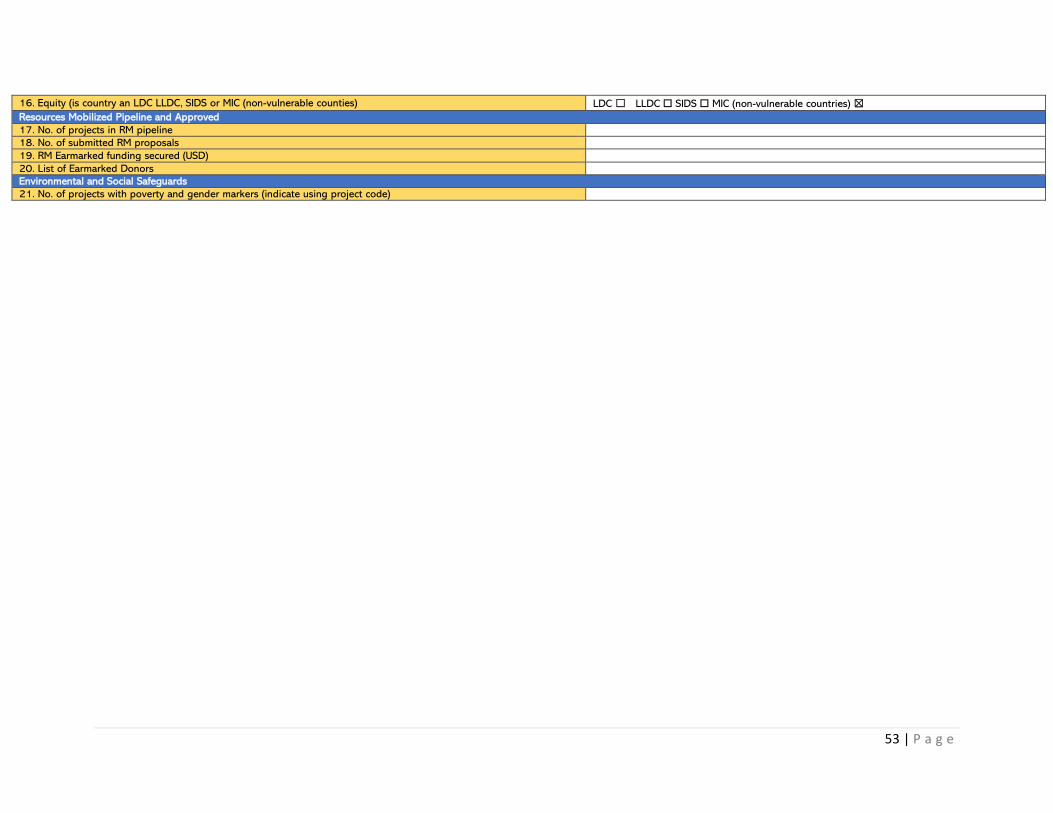
53 | P a g e
16. Equity (is country an LDC LLDC, SIDS or MIC (non-vulnerable counties) LDC ☐ LLDC ☐ SIDS ☐ MIC (non-vulnerable countries) ☒
Resources Mobilized Pipeline and Approved
17. No. of projects in RM pipeline
18. No. of submitted RM proposals
19. RM Earmarked funding secured (USD)
20. List of Earmarked Donors
Environmental and Social Safeguards
21. No. of projects with poverty and gender markers (indicate using project code)

54 | P a g e
GGGI 2020 Results Card - Vietnam 1. Name of Program Vietnam 2. Year/Period 2020/1 January-31 December
Projects implemented
No. Project Code 3. Project Title Status (Completed, On Track, At Risk, Off Track)
4. Project Budget Vs. Expenditure (USD) Total Core USD/% EM USD/%
1 VN04 Viet Nam Distributed Solar - Solar Rooftop Leasing Finance Facility Not Delivered 60,026 100% 0%
2 VN06 Promoting Greenovation through SMEs and start-ups in Viet Nam On Track 149,296 100% 0%
3 VN09 UNEP DTU NDC Action project in Vietnam On Track 19,985 0% 100%
4 VN10 Vietnam Green Bond Readiness Program On Track 754,882 0% 100%
5 VN3 Vietnam Urban Green Growth Action, Phase II On Track 15,015 100% 0%
6 VNPM VN Program Management
118,489 100% 0%
Country Resources Overlay 5. Country Budget (USD) 6. Expenditure (USD) 7. Expenditure/Budget % 8. Staffing numbers Core: 342,826 Core: 257,597 Core: 75%
8 Earmarked: 774,867 EM: 351,757 EM: 45%
Total: 1,117,693 Total: 609,354 Total: 55%
9. Strategic Outcomes (SOs) - Link to CPRR Country Program Results Report 2020 Total 2017-2020 Cumulative Total SO # Attribution Contribution Attribution Contribution SO1 1.049 million tCO2eq 63 million tCo2eq 1.049 million tCO2eq 63 million tCO2e SO2 100 green jobs N/A 100 green jobs N/A SO3 SO3.1 0.049 million people
SO3.3: 0.684 million people SO3.1 2.2 million people SO3.1 0.049 million people
SO3.3: 0.684 million people SO3.1 Clean Energy: 2.2 million people SO3.3: 7 million people
SO4 N/A N/A N/A N/A SO5 N/A N/A N/A N/A SO6 N/A N/A N/A N/A 10. No. of completed policy advisory outputs informing development of green growth policies (CRF output 1.1) 11. No. of green growth policies adopted by government with GGGI’s support (CRF outcome 1.2) Mobilized Green Investment Commitments 12. No of completed advisory outputs that inform decisions on green investments (CRF output 2.1) Total: 4 VN06 (2), VN09 (2) 13. Green investment commitments mobilized (CRF outcome 2.1) VN3 Vietnam Urban Green Growth Action Phase II: 29.5M
10M Public Sector Financing, 19.5M Private Sector Financing 14. Green Investment Pipeline: Number of Projects – USD Value

55 | P a g e
Value for Money (VfM) 15. Spending – (cost of delivery) (USD) 609,354 16. Equity (is country an LDC LLDC, SIDS or MIC (non-vulnerable counties) LDC ☐ LLDC ☐ SIDS ☐ MIC (non-vulnerable countries) ☒ Resources Mobilized Pipeline and Approved 17. No. of projects in RM pipeline 1 18. No. of submitted RM proposals 1 19. RM Earmarked funding secured (USD) 2,710,470 20. List of Earmarked Donors GTC-K, Luxembourg: Ministry of Environment, Climate and Sustainable Development, US Department
of State, Norway Ministry of Climate and Environment, Environmental and Social Safeguards 21. No. of projects with poverty and gender markers (indicate using project code)
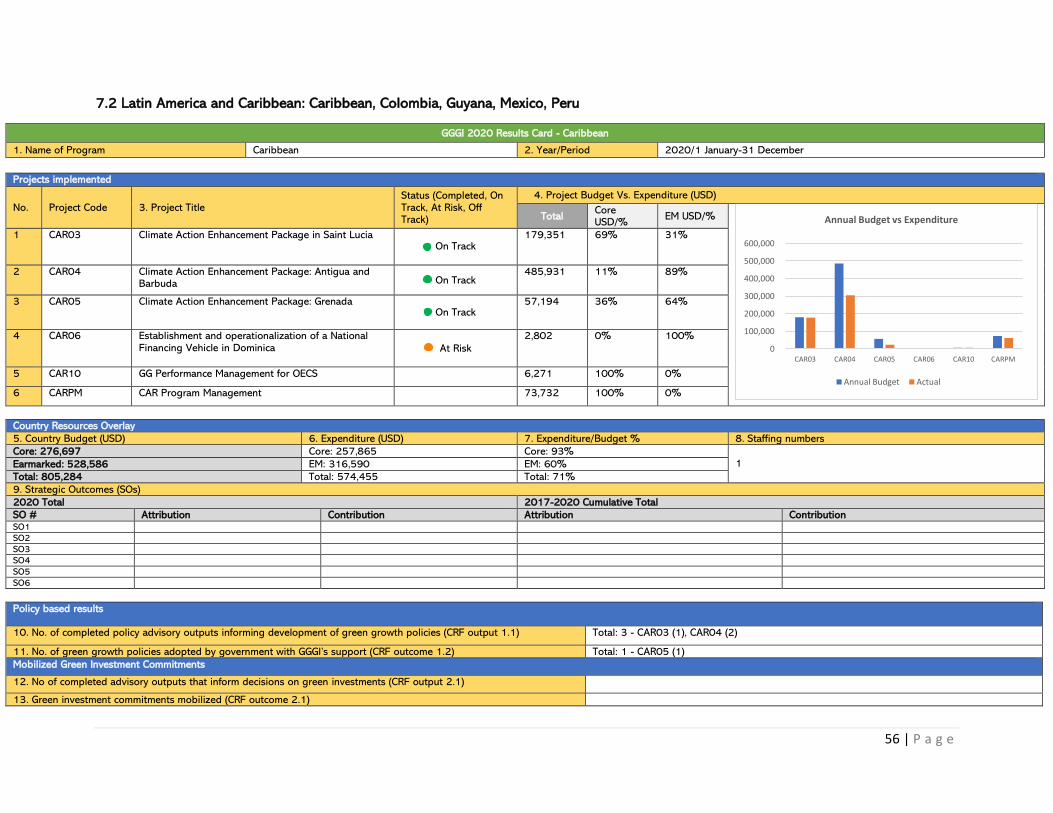
56 | P a g e
7.2 Latin America and Caribbean: Caribbean, Colombia, Guyana, Mexico, Peru
GGGI 2020 Results Card - Caribbean
1. Name of Program Caribbean 2. Year/Period 2020/1 January-31 December
Projects implemented
No. Project Code 3. Project Title Status (Completed, On Track, At Risk, Off Track)
4. Project Budget Vs. Expenditure (USD)
Total Core USD/%
EM USD/%
1 CAR03 Climate Action Enhancement Package in Saint Lucia On Track
179,351 69% 31%
2 CAR04 Climate Action Enhancement Package: Antigua and Barbuda On Track
485,931 11% 89%
3 CAR05 Climate Action Enhancement Package: Grenada On Track
57,194 36% 64%
4 CAR06 Establishment and operationalization of a National Financing Vehicle in Dominica At Risk
2,802 0% 100%
5 CAR10 GG Performance Management for OECS 6,271 100% 0%
6 CARPM CAR Program Management 73,732 100% 0%
Country Resources Overlay
5. Country Budget (USD) 6. Expenditure (USD) 7. Expenditure/Budget % 8. Staffing numbers
Core: 276,697 Core: 257,865 Core: 93% 1
Earmarked: 528,586 EM: 316,590 EM: 60%
Total: 805,284 Total: 574,455 Total: 71%
9. Strategic Outcomes (SOs)
2020 Total 2017-2020 Cumulative Total
SO # Attribution Contribution Attribution Contribution SO1
SO2
SO3
SO4
SO5
SO6
Policy based results
10. No. of completed policy advisory outputs informing development of green growth policies (CRF output 1.1) Total: 3 - CAR03 (1), CAR04 (2)
11. No. of green growth policies adopted by government with GGGI’s support (CRF outcome 1.2) Total: 1 - CAR05 (1)
Mobilized Green Investment Commitments
12. No of completed advisory outputs that inform decisions on green investments (CRF output 2.1)
13. Green investment commitments mobilized (CRF outcome 2.1)
0
100,000
200,000
300,000
400,000
500,000
600,000
CAR03 CAR04 CAR05 CAR06 CAR10 CARPM
Annual Budget vs Expenditure
Annual Budget Actual

57 | P a g e
14. Green Investment Pipeline: Number of Projects – USD Value Total: 3 – USD 32M
Value for Money (VfM)
15. Spending – (cost of delivery) (USD) 574,455
16. Equity (is country an LDC LLDC, SIDS or MIC (non-vulnerable counties) LDC ☐ LLDC ☐ SIDS ☒ MIC (non-vulnerable countries) ☐
Resources Mobilized Pipeline and Approved
17. No. of projects in RM pipeline 5
18. No. of submitted RM proposals
19. RM Earmarked funding secured (USD) 3,435,137
20. List of Earmarked Donors GCF, NDC Partnership, QFFD
Environmental and Social Safeguards
21. No. of projects with poverty and gender markers (indicate using project code) CAR04, CAR10
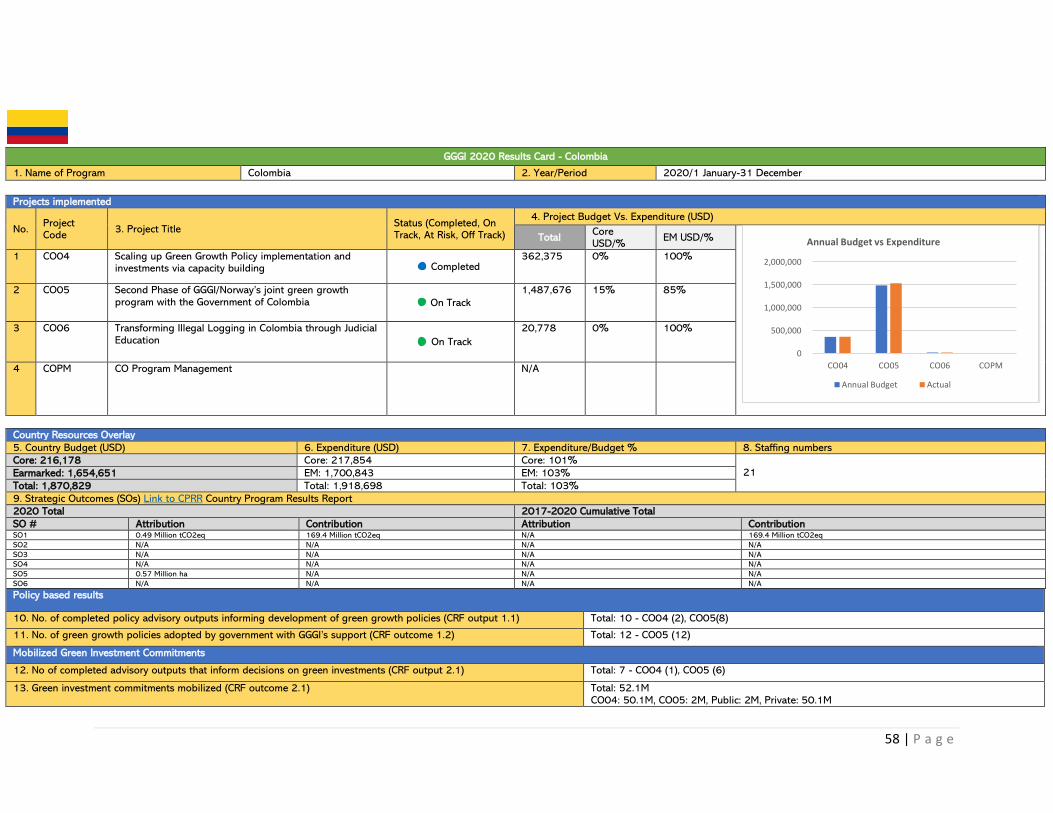
58 | P a g e
GGGI 2020 Results Card - Colombia
1. Name of Program Colombia 2. Year/Period 2020/1 January-31 December
Projects implemented
No. Project Code
3. Project Title Status (Completed, On Track, At Risk, Off Track)
4. Project Budget Vs. Expenditure (USD)
Total Core USD/%
EM USD/%
1 CO04 Scaling up Green Growth Policy implementation and investments via capacity building Completed
362,375 0% 100%
2 CO05 Second Phase of GGGI/Norway’s joint green growth program with the Government of Colombia On Track
1,487,676 15% 85%
3 CO06 Transforming Illegal Logging in Colombia through Judicial Education On Track
20,778 0% 100%
4 COPM CO Program Management N/A
Country Resources Overlay
5. Country Budget (USD) 6. Expenditure (USD) 7. Expenditure/Budget % 8. Staffing numbers
Core: 216,178 Core: 217,854 Core: 101% 21 Earmarked: 1,654,651 EM: 1,700,843 EM: 103%
Total: 1,870,829 Total: 1,918,698 Total: 103%
9. Strategic Outcomes (SOs) Link to CPRR Country Program Results Report 2020 Total 2017-2020 Cumulative Total
SO # Attribution Contribution Attribution Contribution SO1 0.49 Million tCO2eq 169.4 Million tCO2eq N/A 169.4 Million tCO2eq
SO2 N/A N/A N/A N/A
SO3 N/A N/A N/A N/A
SO4 N/A N/A N/A N/A
SO5 0.57 Million ha N/A N/A N/A
SO6 N/A N/A N/A N/A
Policy based results
10. No. of completed policy advisory outputs informing development of green growth policies (CRF output 1.1) Total: 10 - CO04 (2), CO05(8)
11. No. of green growth policies adopted by government with GGGI’s support (CRF outcome 1.2) Total: 12 - CO05 (12)
Mobilized Green Investment Commitments
12. No of completed advisory outputs that inform decisions on green investments (CRF output 2.1) Total: 7 - CO04 (1), CO05 (6)
13. Green investment commitments mobilized (CRF outcome 2.1) Total: 52.1M CO04: 50.1M, CO05: 2M, Public: 2M, Private: 50.1M
0
500,000
1,000,000
1,500,000
2,000,000
CO04 CO05 CO06 COPM
Annual Budget vs Expenditure
Annual Budget Actual
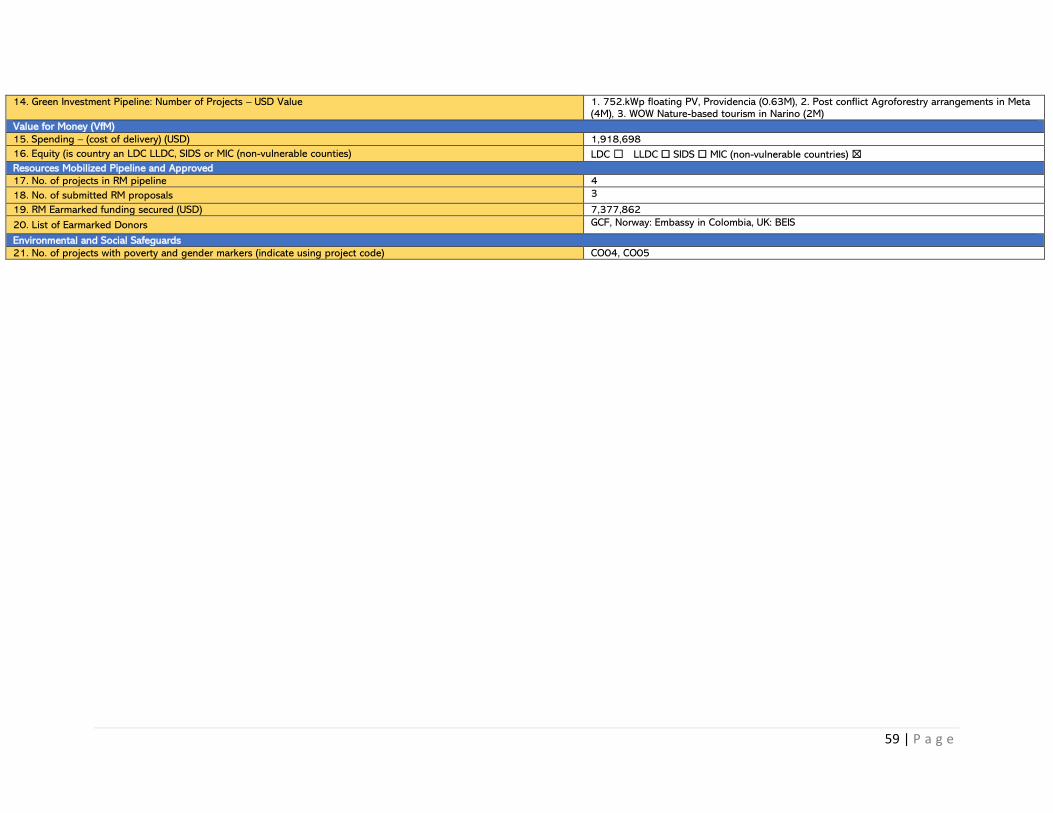
59 | P a g e
14. Green Investment Pipeline: Number of Projects – USD Value 1. 752.kWp floating PV, Providencia (0.63M), 2. Post conflict Agroforestry arrangements in Meta (4M), 3. WOW Nature-based tourism in Narino (2M)
Value for Money (VfM)
15. Spending – (cost of delivery) (USD) 1,918,698
16. Equity (is country an LDC LLDC, SIDS or MIC (non-vulnerable counties) LDC ☐ LLDC ☐ SIDS ☐ MIC (non-vulnerable countries) ☒
Resources Mobilized Pipeline and Approved
17. No. of projects in RM pipeline 4
18. No. of submitted RM proposals 3
19. RM Earmarked funding secured (USD) 7,377,862
20. List of Earmarked Donors GCF, Norway: Embassy in Colombia, UK: BEIS
Environmental and Social Safeguards
21. No. of projects with poverty and gender markers (indicate using project code) CO04, CO05
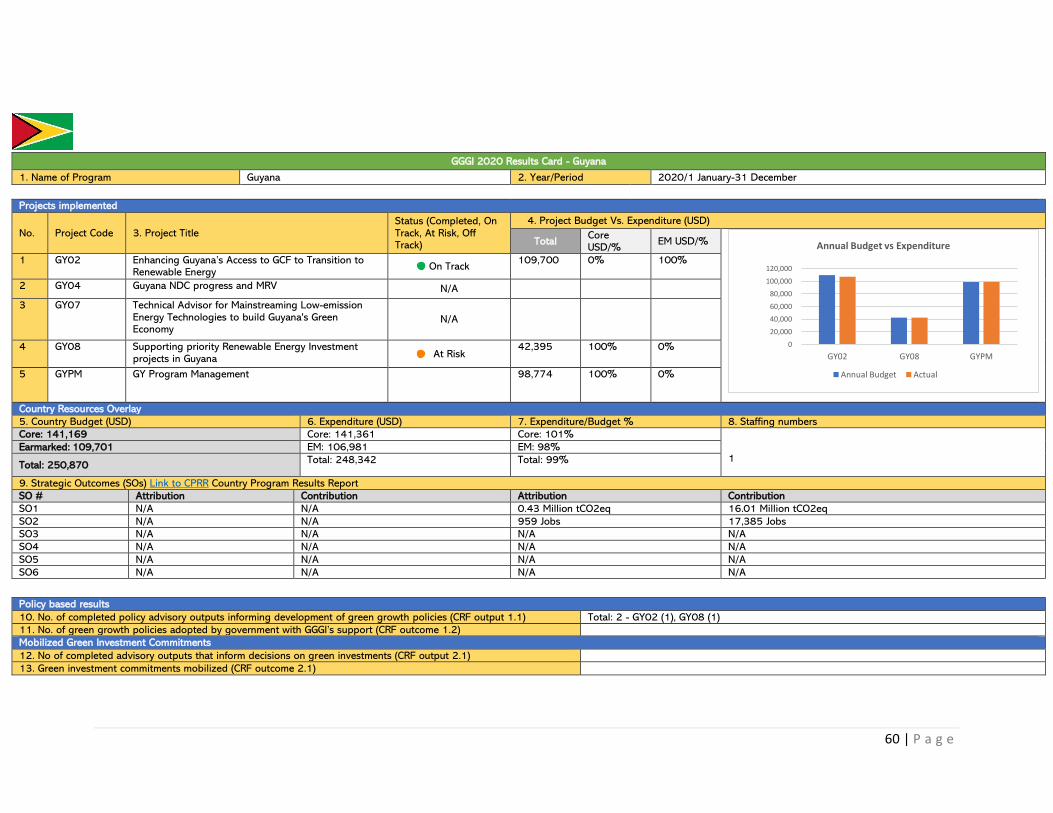
60 | P a g e
GGGI 2020 Results Card - Guyana
1. Name of Program Guyana 2. Year/Period 2020/1 January-31 December
Projects implemented
No. Project Code 3. Project Title Status (Completed, On Track, At Risk, Off Track)
4. Project Budget Vs. Expenditure (USD)
Total Core USD/%
EM USD/%
1 GY02 Enhancing Guyana’s Access to GCF to Transition to Renewable Energy
On Track 109,700 0% 100%
2 GY04 Guyana NDC progress and MRV N/A
3 GY07 Technical Advisor for Mainstreaming Low-emission Energy Technologies to build Guyana's Green Economy
N/A
4 GY08 Supporting priority Renewable Energy Investment projects in Guyana At Risk
42,395 100% 0%
5 GYPM GY Program Management 98,774 100% 0%
Country Resources Overlay
5. Country Budget (USD) 6. Expenditure (USD) 7. Expenditure/Budget % 8. Staffing numbers
Core: 141,169 Core: 141,361 Core: 101% 1
Earmarked: 109,701 EM: 106,981 EM: 98%
Total: 250,870 Total: 248,342 Total: 99%
9. Strategic Outcomes (SOs) Link to CPRR Country Program Results Report
SO # Attribution Contribution Attribution Contribution
SO1 N/A N/A 0.43 Million tCO2eq 16.01 Million tCO2eq
SO2 N/A N/A 959 Jobs 17,385 Jobs
SO3 N/A N/A N/A N/A
SO4 N/A N/A N/A N/A
SO5 N/A N/A N/A N/A
SO6 N/A N/A N/A N/A
Policy based results
10. No. of completed policy advisory outputs informing development of green growth policies (CRF output 1.1) Total: 2 - GY02 (1), GY08 (1)
11. No. of green growth policies adopted by government with GGGI’s support (CRF outcome 1.2)
Mobilized Green Investment Commitments
12. No of completed advisory outputs that inform decisions on green investments (CRF output 2.1)
13. Green investment commitments mobilized (CRF outcome 2.1)
0
20,000
40,000
60,000
80,000
100,000
120,000
GY02 GY08 GYPM
Annual Budget vs Expenditure
Annual Budget Actual
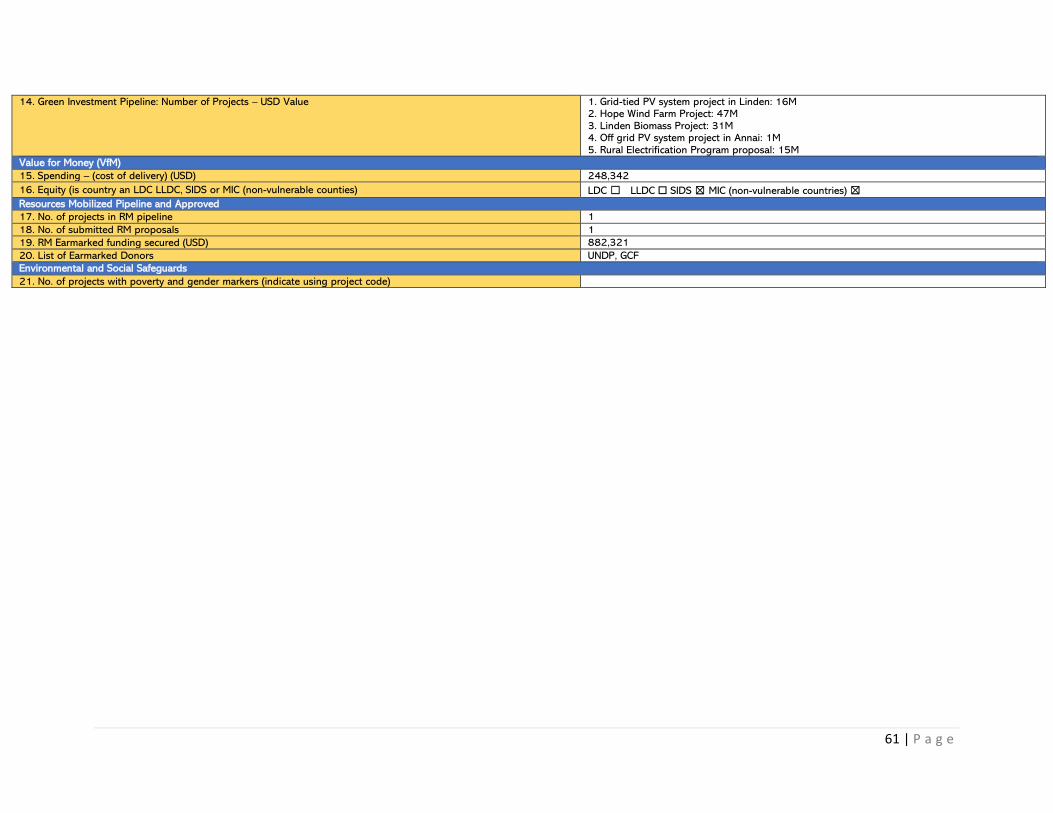
61 | P a g e
14. Green Investment Pipeline: Number of Projects – USD Value 1. Grid-tied PV system project in Linden: 16M 2. Hope Wind Farm Project: 47M 3. Linden Biomass Project: 31M 4. Off grid PV system project in Annai: 1M 5. Rural Electrification Program proposal: 15M
Value for Money (VfM)
15. Spending – (cost of delivery) (USD) 248,342
16. Equity (is country an LDC LLDC, SIDS or MIC (non-vulnerable counties) LDC ☐ LLDC ☐ SIDS ☒ MIC (non-vulnerable countries) ☒
Resources Mobilized Pipeline and Approved
17. No. of projects in RM pipeline 1
18. No. of submitted RM proposals 1
19. RM Earmarked funding secured (USD) 882,321
20. List of Earmarked Donors UNDP, GCF
Environmental and Social Safeguards
21. No. of projects with poverty and gender markers (indicate using project code)
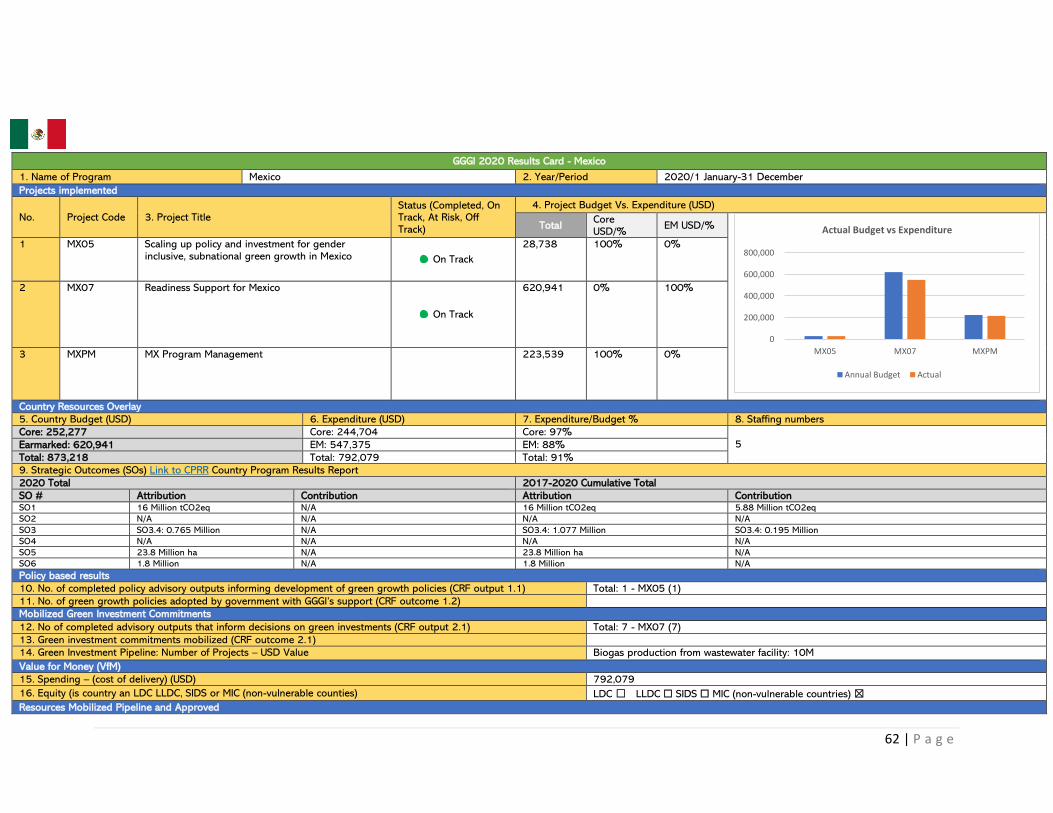
62 | P a g e
GGGI 2020 Results Card - Mexico
1. Name of Program Mexico 2. Year/Period 2020/1 January-31 December
Projects implemented
No. Project Code 3. Project Title Status (Completed, On Track, At Risk, Off Track)
4. Project Budget Vs. Expenditure (USD)
Total Core USD/%
EM USD/%
1 MX05 Scaling up policy and investment for gender inclusive, subnational green growth in Mexico On Track
28,738 100% 0%
2 MX07 Readiness Support for Mexico
On Track
620,941 0% 100%
3 MXPM MX Program Management 223,539 100% 0%
Country Resources Overlay
5. Country Budget (USD) 6. Expenditure (USD) 7. Expenditure/Budget % 8. Staffing numbers
Core: 252,277 Core: 244,704 Core: 97% 5 Earmarked: 620,941 EM: 547,375 EM: 88%
Total: 873,218 Total: 792,079 Total: 91%
9. Strategic Outcomes (SOs) Link to CPRR Country Program Results Report
2020 Total 2017-2020 Cumulative Total
SO # Attribution Contribution Attribution Contribution SO1 16 Million tCO2eq N/A 16 Million tCO2eq 5.88 Million tCO2eq
SO2 N/A N/A N/A N/A
SO3 SO3.4: 0.765 Million N/A SO3.4: 1.077 Million SO3.4: 0.195 Million
SO4 N/A N/A N/A N/A
SO5 23.8 Million ha N/A 23.8 Million ha N/A
SO6 1.8 Million N/A 1.8 Million N/A
Policy based results
10. No. of completed policy advisory outputs informing development of green growth policies (CRF output 1.1) Total: 1 - MX05 (1)
11. No. of green growth policies adopted by government with GGGI’s support (CRF outcome 1.2)
Mobilized Green Investment Commitments
12. No of completed advisory outputs that inform decisions on green investments (CRF output 2.1) Total: 7 - MX07 (7)
13. Green investment commitments mobilized (CRF outcome 2.1)
14. Green Investment Pipeline: Number of Projects – USD Value Biogas production from wastewater facility: 10M
Value for Money (VfM)
15. Spending – (cost of delivery) (USD) 792,079
16. Equity (is country an LDC LLDC, SIDS or MIC (non-vulnerable counties) LDC ☐ LLDC ☐ SIDS ☐ MIC (non-vulnerable countries) ☒
Resources Mobilized Pipeline and Approved
0
200,000
400,000
600,000
800,000
MX05 MX07 MXPM
Actual Budget vs Expenditure
Annual Budget Actual
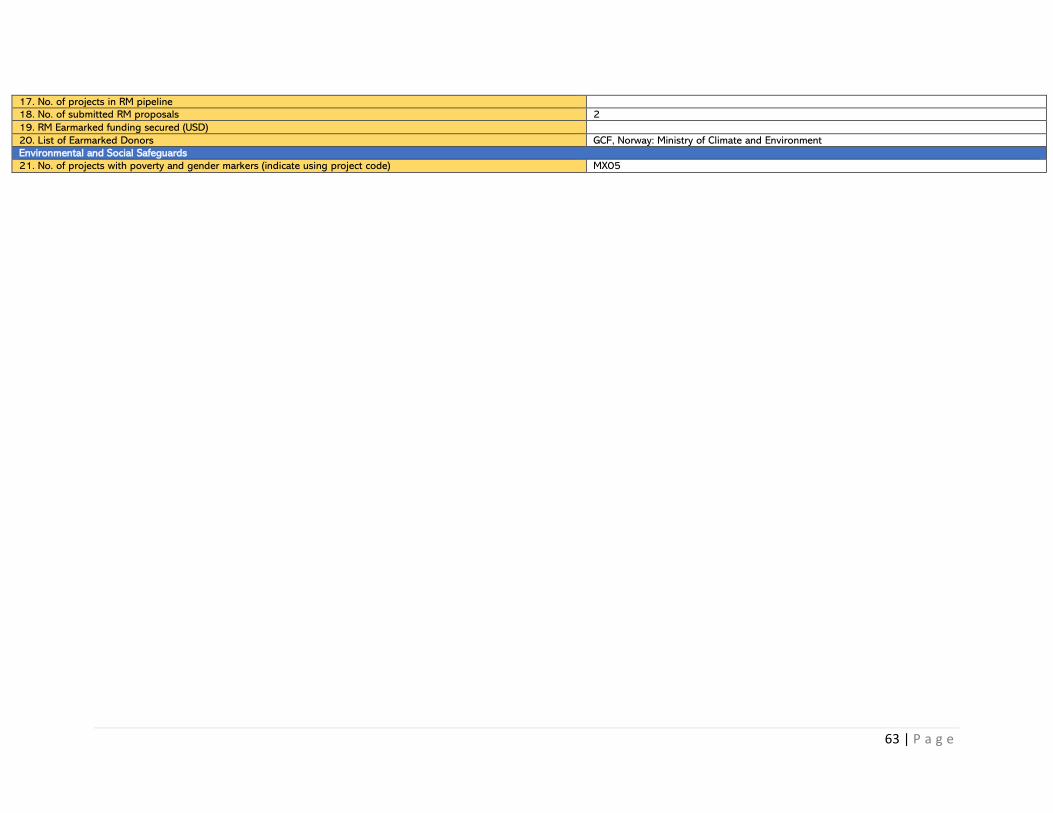
63 | P a g e
17. No. of projects in RM pipeline
18. No. of submitted RM proposals 2
19. RM Earmarked funding secured (USD)
20. List of Earmarked Donors GCF, Norway: Ministry of Climate and Environment
Environmental and Social Safeguards
21. No. of projects with poverty and gender markers (indicate using project code) MX05
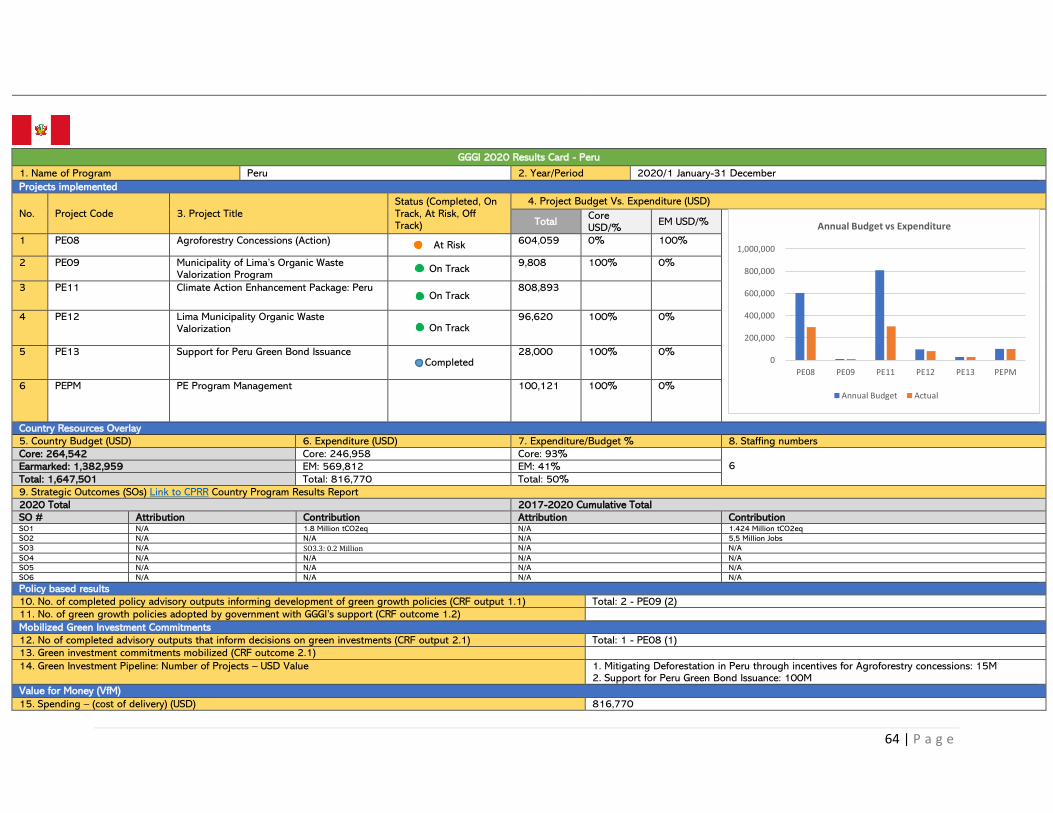
64 | P a g e
GGGI 2020 Results Card - Peru
1. Name of Program Peru 2. Year/Period 2020/1 January-31 December
Projects implemented
No. Project Code 3. Project Title Status (Completed, On Track, At Risk, Off Track)
4. Project Budget Vs. Expenditure (USD)
Total Core USD/%
EM USD/%
1 PE08 Agroforestry Concessions (Action) At Risk 604,059 0% 100%
2 PE09 Municipality of Lima’s Organic Waste Valorization Program
On Track 9,808 100% 0%
3 PE11 Climate Action Enhancement Package: Peru On Track
808,893
4 PE12 Lima Municipality Organic Waste Valorization On Track
96,620 100% 0%
5 PE13 Support for Peru Green Bond Issuance Completed
28,000 100% 0%
6 PEPM PE Program Management 100,121 100% 0%
Country Resources Overlay
5. Country Budget (USD) 6. Expenditure (USD) 7. Expenditure/Budget % 8. Staffing numbers
Core: 264,542 Core: 246,958 Core: 93% 6
Earmarked: 1,382,959 EM: 569,812 EM: 41%
Total: 1,647,501 Total: 816,770 Total: 50%
9. Strategic Outcomes (SOs) Link to CPRR Country Program Results Report
2020 Total 2017-2020 Cumulative Total
SO # Attribution Contribution Attribution Contribution SO1 N/A 1.8 Million tCO2eq N/A 1.424 Million tCO2eq
SO2 N/A N/A N/A 5,5 Million Jobs
SO3 N/A SO3.3: 0.2 Million N/A N/A
SO4 N/A N/A N/A N/A
SO5 N/A N/A N/A N/A
SO6 N/A N/A N/A N/A
Policy based results
10. No. of completed policy advisory outputs informing development of green growth policies (CRF output 1.1) Total: 2 - PE09 (2)
11. No. of green growth policies adopted by government with GGGI’s support (CRF outcome 1.2)
Mobilized Green Investment Commitments
12. No of completed advisory outputs that inform decisions on green investments (CRF output 2.1) Total: 1 - PE08 (1)
13. Green investment commitments mobilized (CRF outcome 2.1)
14. Green Investment Pipeline: Number of Projects – USD Value 1. Mitigating Deforestation in Peru through incentives for Agroforestry concessions: 15M 2. Support for Peru Green Bond Issuance: 100M
Value for Money (VfM)
15. Spending – (cost of delivery) (USD) 816,770
0
200,000
400,000
600,000
800,000
1,000,000
PE08 PE09 PE11 PE12 PE13 PEPM
Annual Budget vs Expenditure
Annual Budget Actual

65 | P a g e
16. Equity (is country an LDC LLDC, SIDS or MIC (non-vulnerable counties) LDC ☐ LLDC ☐ SIDS ☐ MIC (non-vulnerable countries) ☒
Resources Mobilized Pipeline and Approved
17. No. of projects in RM pipeline 3
18. No. of submitted RM proposals
19. RM Earmarked funding secured (USD) 2,541,367
20. List of Earmarked Donors NDC Partnership, Norway: Ministry of Climate and Environment
Environmental and Social Safeguards
21. No. of projects with poverty and gender markers (indicate using project code) PE09

66 | P a g e
7.3 Pacific: Fiji, Kiribati, PNG, Tonga, Vanuatu
GGGI 2020 Results Card - Fiji
1. Name of Program Fiji 2. Year/Period 2020/1 January-31 December
Projects implemented
No. Project Code 3. Project Title Status (Completed, On Track, At Risk, Off Track)
4. Project Budget Vs. Expenditure (USD)
Total Core USD/%
EM USD/%
1 FJ1 Fiji - Supporting the Implementation of the Green Growth Framework for Fiji - Phase 2
On Track 90,386 49% 51%
2 FJ06 Strengthen capacity to ensure transparency of action and support for Fiji’s NDCs and LEDS
On Track 44,565 0% 100%
3 FJ07 Enhancing Access to Climate Finance in Fiji On Track 794,713 0% 100%
4 FJ08 Mainstreaming Investment in green energy in the Pacific
On Track 66,091 61% 39%
5 FJ10 Enabling Sustainable Rural Electrification Investment in Fiji On Track
19,592 100% 0%
6 FJPM FJ Program Management 158,813 100% 0%
Country Resources Overlay
5. Country Budget (USD) 6. Expenditure (USD) 7. Expenditure/Budget % 8. Staffing numbers
Core: 262,825 Core: 233,058 Core: 89% 9 Earmarked: 911,336 EM: 224,412 EM: 25%
Total: 1,174,161 Total: 457,470 Total: 39%
9. Strategic Outcomes (SOs) Link to CPRR Country Program Results Report
2020 Total 2017-2020 Cumulative Total
SO # Attribution Contribution Attribution Contribution SO1 0.084 Million tCO2eq N/A 0.222 Million tCO2eq 700 Million tCO2eq
SO2 324 Jobs N/A 972 Jobs 5785 Jobs
SO3 SO3.1: 0.096 Million SO3.1: 0.89 Million SO3.1: 0.11 Million SO3.1: 0.89 Million
SO4 N/A N/A N/A N/A
SO5 N/A N/A N/A N/A
SO6 N/A N/A N/A N/A
Policy based results
10. No. of completed policy advisory outputs informing development of green growth policies (CRF output 1.1) Total: 4 - FJ1 (1), FJ07 (2), PAC06 (1)
11. No. of green growth policies adopted by government with GGGI’s support (CRF outcome 1.2)
Mobilized Green Investment Commitments
12. No of completed advisory outputs that inform decisions on green investments (CRF output 2.1) Total: 1 - FJ08 (1)
13. Green investment commitments mobilized (CRF outcome 2.1) FJ08: 23.6M, Public: 23.6M
14. Green Investment Pipeline: Number of Projects – USD Value 1. Solar PV for Low-Income Housing, 750KW – 1.5M 2. Developing a financial instrument with Fiji Development Bank to support MSMEs access solar Energy - 10M
Value for Money (VfM)
15. Spending – (cost of delivery) (USD) 457,470
0
200,000
400,000
600,000
800,000
FJ1 FJ06 FJ07 FJ08 FJ10 FJPM
Annual Budget vs Expenditure
Annual Budget Actual
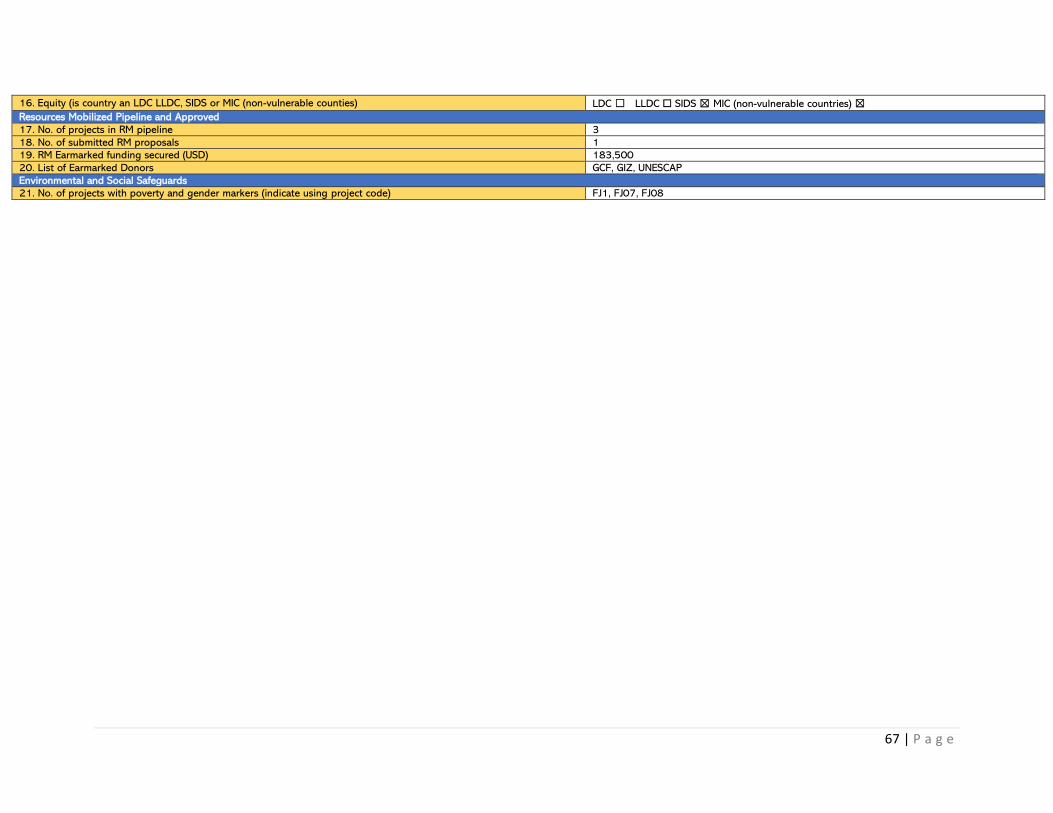
67 | P a g e
16. Equity (is country an LDC LLDC, SIDS or MIC (non-vulnerable counties) LDC ☐ LLDC ☐ SIDS ☒ MIC (non-vulnerable countries) ☒
Resources Mobilized Pipeline and Approved
17. No. of projects in RM pipeline 3
18. No. of submitted RM proposals 1
19. RM Earmarked funding secured (USD) 183,500
20. List of Earmarked Donors GCF, GIZ, UNESCAP
Environmental and Social Safeguards
21. No. of projects with poverty and gender markers (indicate using project code) FJ1, FJ07, FJ08
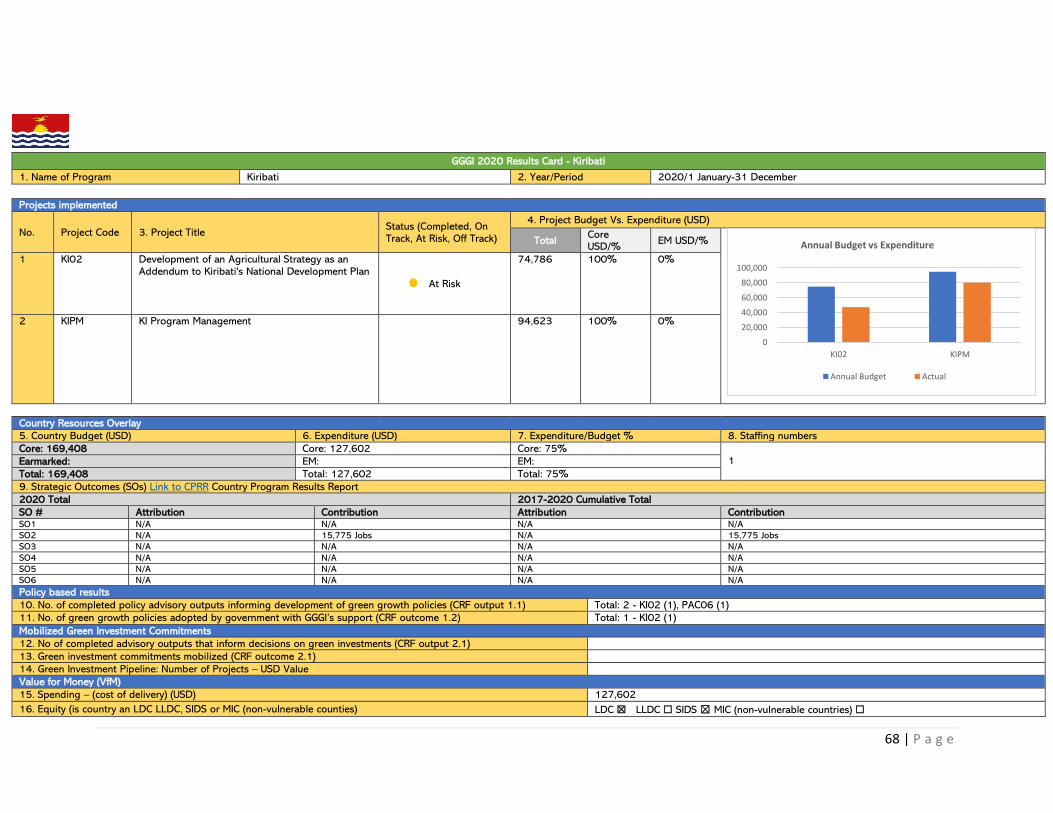
68 | P a g e
GGGI 2020 Results Card - Kiribati
1. Name of Program Kiribati 2. Year/Period 2020/1 January-31 December
Projects implemented
No. Project Code 3. Project Title Status (Completed, On Track, At Risk, Off Track)
4. Project Budget Vs. Expenditure (USD)
Total Core USD/%
EM USD/%
1 KI02 Development of an Agricultural Strategy as an Addendum to Kiribati's National Development Plan
At Risk
74,786 100% 0%
2 KIPM KI Program Management 94,623 100% 0%
Country Resources Overlay
5. Country Budget (USD) 6. Expenditure (USD) 7. Expenditure/Budget % 8. Staffing numbers
Core: 169,408 Core: 127,602 Core: 75% 1 Earmarked: EM: EM:
Total: 169,408 Total: 127,602 Total: 75%
9. Strategic Outcomes (SOs) Link to CPRR Country Program Results Report
2020 Total 2017-2020 Cumulative Total
SO # Attribution Contribution Attribution Contribution SO1 N/A N/A N/A N/A
SO2 N/A 15,775 Jobs N/A 15,775 Jobs
SO3 N/A N/A N/A N/A
SO4 N/A N/A N/A N/A
SO5 N/A N/A N/A N/A
SO6 N/A N/A N/A N/A
Policy based results
10. No. of completed policy advisory outputs informing development of green growth policies (CRF output 1.1) Total: 2 - KI02 (1), PAC06 (1)
11. No. of green growth policies adopted by government with GGGI’s support (CRF outcome 1.2) Total: 1 - KI02 (1)
Mobilized Green Investment Commitments
12. No of completed advisory outputs that inform decisions on green investments (CRF output 2.1)
13. Green investment commitments mobilized (CRF outcome 2.1)
14. Green Investment Pipeline: Number of Projects – USD Value
Value for Money (VfM)
15. Spending – (cost of delivery) (USD) 127,602
16. Equity (is country an LDC LLDC, SIDS or MIC (non-vulnerable counties) LDC ☒ LLDC ☐ SIDS ☒ MIC (non-vulnerable countries) ☐
0
20,000
40,000
60,000
80,000
100,000
KI02 KIPM
Annual Budget vs Expenditure
Annual Budget Actual

69 | P a g e
Resources Mobilized Pipeline and Approved
17. No. of projects in RM pipeline 1
18. No. of submitted RM proposals
19. RM Earmarked funding secured (USD) 1,800,000
20. List of Earmarked Donors QFFD, GIZ Fiji, MFAT New Zealand
Environmental and Social Safeguards
21. No. of projects with poverty and gender markers (indicate using project code) PAC06, KI02
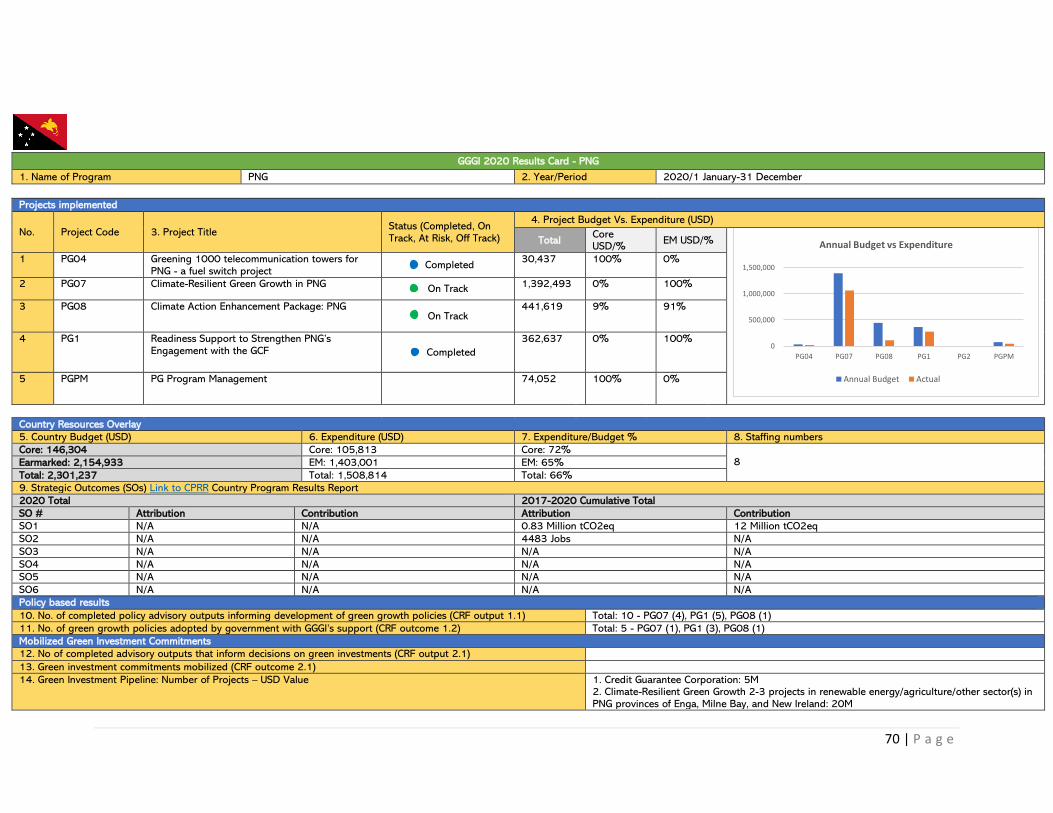
70 | P a g e
GGGI 2020 Results Card - PNG
1. Name of Program PNG 2. Year/Period 2020/1 January-31 December
Projects implemented
No. Project Code 3. Project Title Status (Completed, On Track, At Risk, Off Track)
4. Project Budget Vs. Expenditure (USD)
Total Core USD/%
EM USD/%
1 PG04 Greening 1000 telecommunication towers for PNG - a fuel switch project
Completed 30,437 100% 0%
2 PG07 Climate-Resilient Green Growth in PNG On Track
1,392,493 0% 100%
3 PG08 Climate Action Enhancement Package: PNG On Track
441,619 9% 91%
4 PG1 Readiness Support to Strengthen PNG’s Engagement with the GCF Completed
362,637 0% 100%
5 PGPM PG Program Management 74,052 100% 0%
Country Resources Overlay
5. Country Budget (USD) 6. Expenditure (USD) 7. Expenditure/Budget % 8. Staffing numbers
Core: 146,304 Core: 105,813 Core: 72% 8 Earmarked: 2,154,933 EM: 1,403,001 EM: 65%
Total: 2,301,237 Total: 1,508,814 Total: 66%
9. Strategic Outcomes (SOs) Link to CPRR Country Program Results Report
2020 Total 2017-2020 Cumulative Total
SO # Attribution Contribution Attribution Contribution
SO1 N/A N/A 0.83 Million tCO2eq 12 Million tCO2eq
SO2 N/A N/A 4483 Jobs N/A
SO3 N/A N/A N/A N/A
SO4 N/A N/A N/A N/A
SO5 N/A N/A N/A N/A
SO6 N/A N/A N/A N/A
Policy based results
10. No. of completed policy advisory outputs informing development of green growth policies (CRF output 1.1) Total: 10 - PG07 (4), PG1 (5), PG08 (1)
11. No. of green growth policies adopted by government with GGGI’s support (CRF outcome 1.2) Total: 5 - PG07 (1), PG1 (3), PG08 (1)
Mobilized Green Investment Commitments
12. No of completed advisory outputs that inform decisions on green investments (CRF output 2.1)
13. Green investment commitments mobilized (CRF outcome 2.1)
14. Green Investment Pipeline: Number of Projects – USD Value 1. Credit Guarantee Corporation: 5M 2. Climate-Resilient Green Growth 2-3 projects in renewable energy/agriculture/other sector(s) in PNG provinces of Enga, Milne Bay, and New Ireland: 20M
0
500,000
1,000,000
1,500,000
PG04 PG07 PG08 PG1 PG2 PGPM
Annual Budget vs Expenditure
Annual Budget Actual
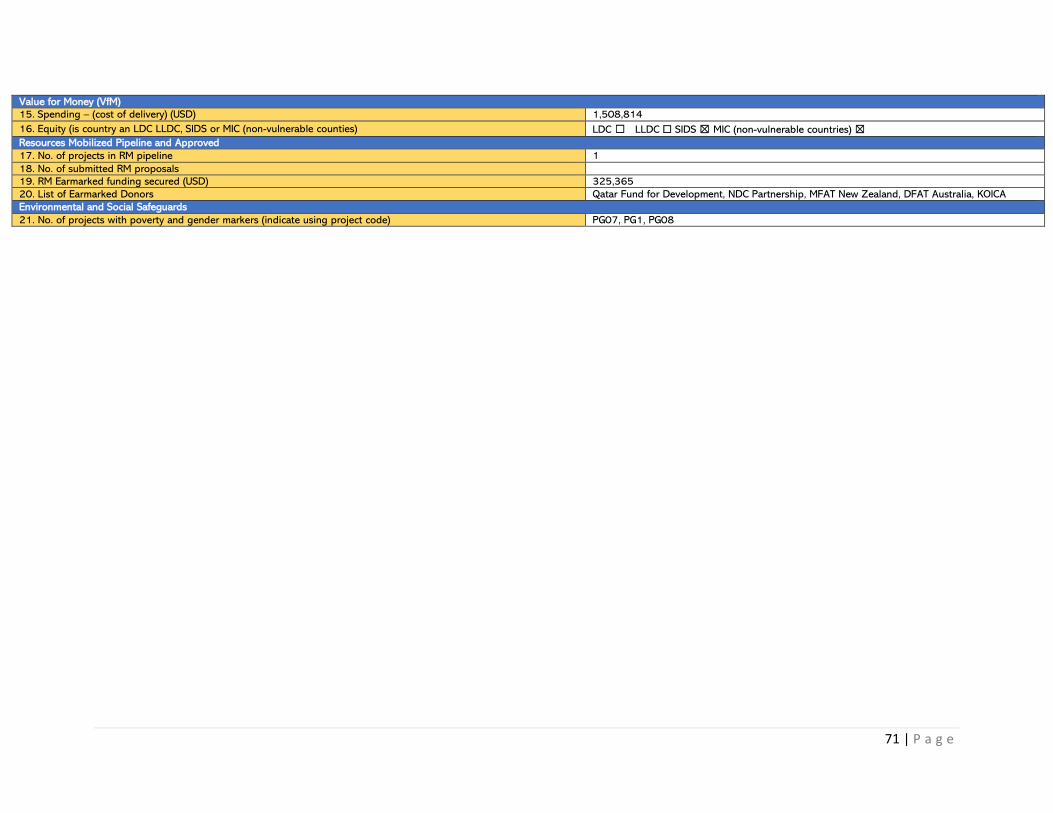
71 | P a g e
Value for Money (VfM)
15. Spending – (cost of delivery) (USD) 1,508,814
16. Equity (is country an LDC LLDC, SIDS or MIC (non-vulnerable counties) LDC ☐ LLDC ☐ SIDS ☒ MIC (non-vulnerable countries) ☒
Resources Mobilized Pipeline and Approved
17. No. of projects in RM pipeline 1
18. No. of submitted RM proposals
19. RM Earmarked funding secured (USD) 325,365
20. List of Earmarked Donors Qatar Fund for Development, NDC Partnership, MFAT New Zealand, DFAT Australia, KOICA
Environmental and Social Safeguards
21. No. of projects with poverty and gender markers (indicate using project code) PG07, PG1, PG08

72 | P a g e
GGGI 2020 Results Card – Tonga
1. Name of Program Tonga 2. Year/Period 2020/1 January-31 December
Projects implemented
No. Project Code 3. Project Title Status (Completed, On Track, At Risk, Off Track)
4. Project Budget Vs. Expenditure (USD)
Total Core USD/%
EM USD/%
1 TO01 LEDS for Tonga On Track
176,658 17% 83%
2 TO02 Review of the Tonga Energy Road Map and support for the development of TERM-PLUS Completed
120,016
100% 0%
3 TO03 Climate Action Enhancement Package 2: Tonga
On Track 16,284 0% 100%
4 TOPM TO Program Management 53,166 100% 0%
Country Resources Overlay
5. Country Budget (USD) 6. Expenditure (USD) 7. Expenditure/Budget % 8. Staffing numbers
Core: 203,723 Core: 170,830 Core: 84% 1 Earmarked: 162,401 EM: 76,733 EM: 47%
Total: 366,124 Total: 247,562 Total: 68%
9. Strategic Outcomes (SOs) Link to CPRR Country Program Results Report
2020 Total 2017-2020 Cumulative Total
SO # Attribution Contribution Attribution Contribution SO1 51 Million tCO2eq N/A 51 Million tCO2eq N/A
SO2 N/A N/A N/A N/A
SO3 N/A N/A N/A N/A
SO4 N/A N/A N/A N/A
SO5 N/A N/A N/A N/A
SO6 N/A N/A N/A N/A
Policy based results
10. No. of completed policy advisory outputs informing development of green growth policies (CRF output 1.1) Total: 4 - PAC06 (1), TO01(1), TO02 (2)
11. No. of green growth policies adopted by government with GGGI’s support (CRF outcome 1.2) Total: 1 - (TO01)
Mobilized Green Investment Commitments
12. No of completed advisory outputs that inform decisions on green investments (CRF output 2.1)
13. Green investment commitments mobilized (CRF outcome 2.1)
14. Green Investment Pipeline: Number of Projects – USD Value
Value for Money (VfM)
15. Spending – (cost of delivery) (USD) 247,562
16. Equity (is country an LDC LLDC, SIDS or MIC (non-vulnerable counties) LDC ☐ LLDC ☐ SIDS ☒ MIC (non-vulnerable countries) ☒
0
50,000
100,000
150,000
200,000
TO01 TO02 TO03 TOPM
Annual Budget vs Expenditure
Annual Budget Actual

73 | P a g e
Resources Mobilized Pipeline and Approved
17. No. of projects in RM pipeline 3
18. No. of submitted RM proposals
19. RM Earmarked funding secured (USD) 390,126
20. List of Earmarked Donors NDC Partnership, GFFD, GIZ
Environmental and Social Safeguards
21. No. of projects with poverty and gender markers (indicate using project code) TO01, TO02, TO03
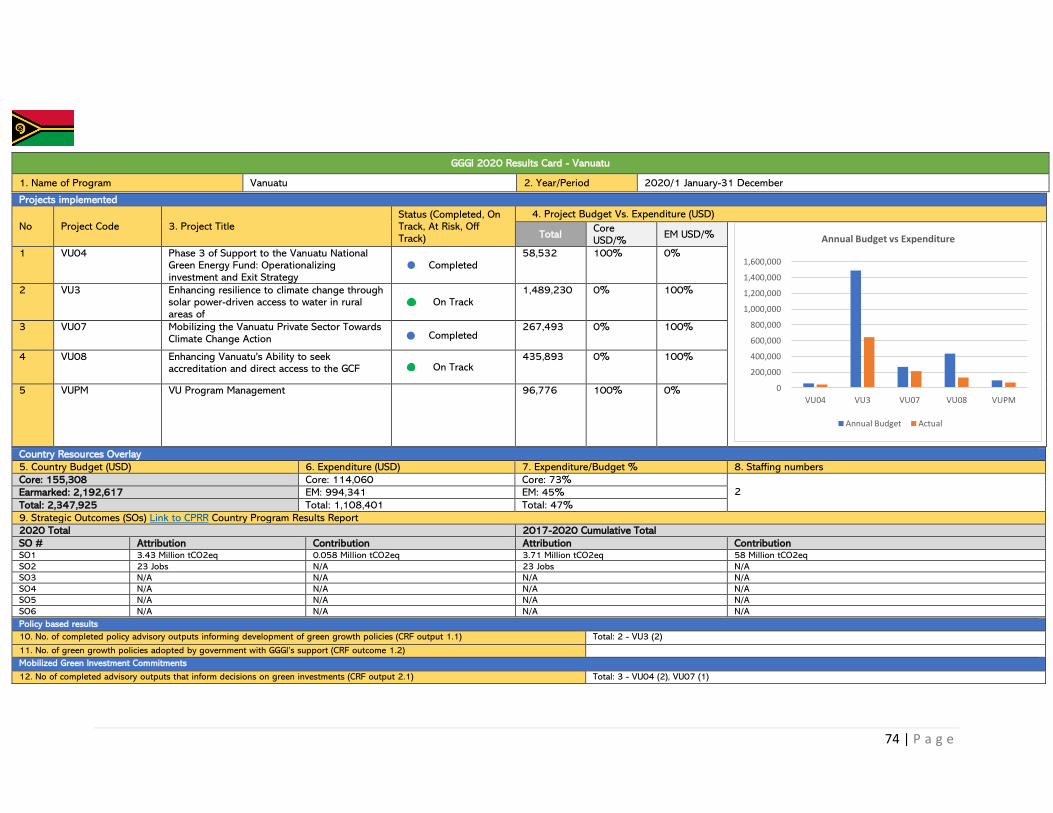
74 | P a g e
GGGI 2020 Results Card - Vanuatu
1. Name of Program Vanuatu 2. Year/Period 2020/1 January-31 December
Projects implemented
No Project Code 3. Project Title Status (Completed, On Track, At Risk, Off Track)
4. Project Budget Vs. Expenditure (USD)
Total Core USD/%
EM USD/%
1 VU04 Phase 3 of Support to the Vanuatu National Green Energy Fund: Operationalizing investment and Exit Strategy
Completed 58,532 100% 0%
2 VU3 Enhancing resilience to climate change through solar power-driven access to water in rural areas of
On Track 1,489,230 0% 100%
3 VU07 Mobilizing the Vanuatu Private Sector Towards Climate Change Action Completed
267,493 0% 100%
4 VU08 Enhancing Vanuatu's Ability to seek accreditation and direct access to the GCF On Track
435,893 0% 100%
5 VUPM VU Program Management 96,776 100% 0%
Country Resources Overlay
5. Country Budget (USD) 6. Expenditure (USD) 7. Expenditure/Budget % 8. Staffing numbers
Core: 155,308 Core: 114,060 Core: 73% 2 Earmarked: 2,192,617 EM: 994,341 EM: 45%
Total: 2,347,925 Total: 1,108,401 Total: 47%
9. Strategic Outcomes (SOs) Link to CPRR Country Program Results Report
2020 Total 2017-2020 Cumulative Total
SO # Attribution Contribution Attribution Contribution SO1 3.43 Million tCO2eq 0.058 Million tCO2eq 3.71 Million tCO2eq 58 Million tCO2eq
SO2 23 Jobs N/A 23 Jobs N/A
SO3 N/A N/A N/A N/A
SO4 N/A N/A N/A N/A
SO5 N/A N/A N/A N/A
SO6 N/A N/A N/A N/A Policy based results
10. No. of completed policy advisory outputs informing development of green growth policies (CRF output 1.1) Total: 2 - VU3 (2)
11. No. of green growth policies adopted by government with GGGI’s support (CRF outcome 1.2)
Mobilized Green Investment Commitments
12. No of completed advisory outputs that inform decisions on green investments (CRF output 2.1) Total: 3 - VU04 (2), VU07 (1)
0
200,000
400,000
600,000
800,000
1,000,000
1,200,000
1,400,000
1,600,000
VU04 VU3 VU07 VU08 VUPM
Annual Budget vs Expenditure
Annual Budget Actual

75 | P a g e
13. Green investment commitments mobilized (CRF outcome 2.1) VU04 Phase 3 of supporting to the Vanuatu National Green Energy Fund: Operationalizing Investment and Exit Strategy: 903,000 100% Public Sector Financing PG04 Greening 1000 telecommunication towers for PNG – a fuel switch project: 10M
14. Green Investment Pipeline: Number of Projects – USD Value 2 Projects; total value USD 11M
NGEF: USD 903,000 Van gov’t approved for the NGEF in 2021
GCF SAP: USD 10m SAP proposal under GCF
Value for Money (VfM)
15. Spending – (cost of delivery) (USD) 1,108,401
16. Equity (is country an LDC LLDC, SIDS or MIC (non-vulnerable counties) LDC ☒ LLDC ☐ SIDS ☒ MIC (non-vulnerable countries) ☐
Resources Mobilized Pipeline and Approved
17. No. of projects in RM pipeline
18. No. of submitted RM proposals 1
19. RM Earmarked funding secured (USD)
20. List of Earmarked Donors QFFD, GIZ, GCF, New Zealand Ministry of Foreign Affairs and Trade, GCF, KOICA, Luxembourg Ministry of Environment, Climate and Sustainable Development
Environmental and Social Safeguards
21. No. of projects with poverty and gender markers (indicate using project code) VU04, VU07, VU08
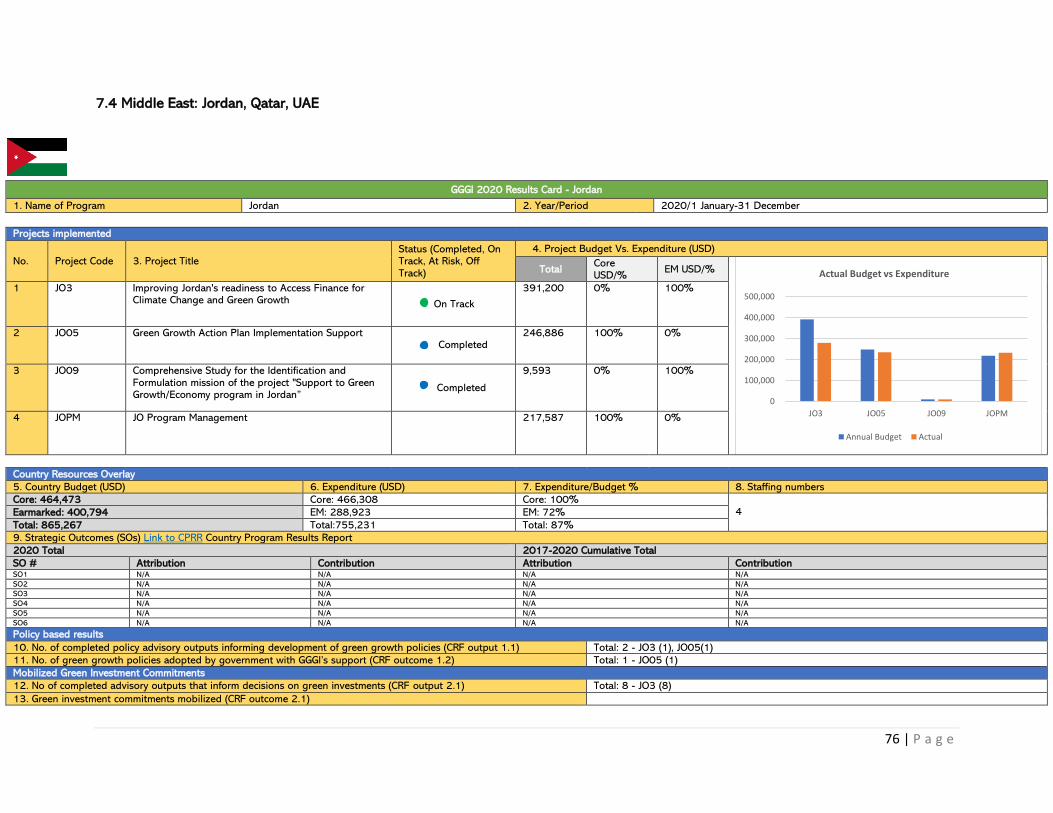
76 | P a g e
7.4 Middle East: Jordan, Qatar, UAE
GGGI 2020 Results Card - Jordan
1. Name of Program Jordan 2. Year/Period 2020/1 January-31 December
Projects implemented
No. Project Code 3. Project Title Status (Completed, On Track, At Risk, Off Track)
4. Project Budget Vs. Expenditure (USD)
Total Core USD/%
EM USD/%
1 JO3 Improving Jordan's readiness to Access Finance for Climate Change and Green Growth On Track
391,200 0% 100%
2 JO05 Green Growth Action Plan Implementation Support Completed
246,886 100% 0%
3 JO09 Comprehensive Study for the Identification and Formulation mission of the project "Support to Green Growth/Economy program in Jordan”
Completed
9,593 0% 100%
4 JOPM JO Program Management 217,587 100% 0%
Country Resources Overlay
5. Country Budget (USD) 6. Expenditure (USD) 7. Expenditure/Budget % 8. Staffing numbers
Core: 464,473 Core: 466,308 Core: 100% 4
Earmarked: 400,794 EM: 288,923 EM: 72%
Total: 865,267 Total:755,231 Total: 87%
9. Strategic Outcomes (SOs) Link to CPRR Country Program Results Report
2020 Total 2017-2020 Cumulative Total
SO # Attribution Contribution Attribution Contribution SO1 N/A N/A N/A N/A
SO2 N/A N/A N/A N/A
SO3 N/A N/A N/A N/A
SO4 N/A N/A N/A N/A
SO5 N/A N/A N/A N/A
SO6 N/A N/A N/A N/A
Policy based results
10. No. of completed policy advisory outputs informing development of green growth policies (CRF output 1.1) Total: 2 - JO3 (1), JO05(1)
11. No. of green growth policies adopted by government with GGGI’s support (CRF outcome 1.2) Total: 1 - JO05 (1)
Mobilized Green Investment Commitments
12. No of completed advisory outputs that inform decisions on green investments (CRF output 2.1) Total: 8 - JO3 (8)
13. Green investment commitments mobilized (CRF outcome 2.1)
0
100,000
200,000
300,000
400,000
500,000
JO3 JO05 JO09 JOPM
Actual Budget vs Expenditure
Annual Budget Actual

77 | P a g e
14. Green Investment Pipeline: Number of Projects – USD Value
Value for Money (VfM)
15. Spending – (cost of delivery) (USD) 755,231
16. Equity (is country an LDC LLDC, SIDS or MIC (non-vulnerable counties) LDC ☐ LLDC ☐ SIDS ☐ MIC (non-vulnerable countries) ☒
Resources Mobilized Pipeline and Approved
17. No. of projects in RM pipeline 2
18. No. of submitted RM proposals
19. RM Earmarked funding secured (USD) 928,567
20. List of Earmarked Donors EU Delegation to Jordan, GCF
Environmental and Social Safeguards
21. No. of projects with poverty and gender markers (indicate using project code) JO05

78 | P a g e
GGGI 2020 Results Card - Qatar
1. Name of Program Qatar 2. Year/Period 2020/1 January-31 December
Projects implemented
No. Project Code
3. Project Title Status (Completed, On Track, At Risk, Off Track)
4. Project Budget Vs. Expenditure (USD)
Total Core USD/%
EM USD/%
1 QAPM QA Program Management N/A 0 100% 0%
Country Resources Overlay
5. Country Budget (USD) 6. Expenditure (USD) 7. Expenditure/Budget % 8. Staffing numbers
Core: 0 Core: 160,154 Core: %
Earmarked:0 EM:0 EM: %
Total: 0 Total: 160,154 Total: %
9. Strategic Outcomes (SOs)
2020 Total 2017-2020 Cumulative Total
SO # Attribution Contribution Attribution Contribution
SO1 N/A N/A N/A N/A
SO2 N/A N/A N/A N/A
SO3 N/A N/A N/A N/A
SO4 N/A N/A N/A N/A
SO5 N/A N/A N/A N/A
SO6 N/A N/A N/A N/A
Policy based results
10. No. of completed policy advisory outputs informing development of green growth policies (CRF output 1.1)
11. No. of green growth policies adopted by government with GGGI’s support (CRF outcome 1.2)
Mobilized Green Investment Commitments
12. No of completed advisory outputs that inform decisions on green investments (CRF output 2.1)
13. Green investment commitments mobilized (CRF outcome 2.1)
14. Green Investment Pipeline: Number of Projects – USD Value
Value for Money (VfM)
15. Spending – (cost of delivery) (USD) 160,154
0
100000
200000
QAPM
Annual Budget vs Expenditure
Annaul Budget Actual

79 | P a g e
16. Equity (is country an LDC LLDC, SIDS or MIC (non-vulnerable counties) LDC ☐ LLDC ☐ SIDS ☐ MIC (non-vulnerable countries) ☐
Resources Mobilized Pipeline and Approved
17. No. of projects in RM pipeline
18. No. of submitted RM proposals
19. RM Earmarked funding secured (USD)
20. List of Earmarked Donors
Environmental and Social Safeguards
21. No. of projects with poverty and gender markers (indicate using project code)

80 | P a g e
GGGI 2020 Results Card - UAE
1. Name of Program UAE 2. Year/Period 2020/1 January-31 December
Projects implemented
No. Project Code 3. Project Title Status (Completed, On Track, At Risk, Off Track)
4. Project Budget Vs. Expenditure (USD)
Total Core USD/%
EM USD/%
1 AE1 UAE Green Growth Initiative N/A 0 0% 100%
2 AE07 National Framework for Action on Climate Change Adaptation
On Track 328,888 0% 100%
3 AE08 National Air Quality Strategy Completed
326,879 0% 100%
4 AE09 Private Engagement and Green Investment Mobilization
On Track 106,062 0% 100%
5 AE10 International Cooperation with Bahrain At Risk
309,858 3% 97%
6 AE11 Green Agenda Policy Advisory Completed 187,627 0% 100%
7 AEPM AE Program Management 244,148 0% 100%
Country Resources Overlay
5. Country Budget (USD) 6. Expenditure (USD) 7. Expenditure/Budget % 8. Staffing numbers
Core: 9,864 Core: 9,864 Core: 100% 5 Earmarked: 1,493,597 EM: 1,337,369 EM: 90%
Total: 1,503,461 Total: 1,347,233 Total: 90%
9. Strategic Outcomes (SOs) Link to CPRR Country Program Results Report
2020 Total 2017-2020 Cumulative Total
SO # Attribution Contribution Attribution Contribution SO1 N/A N/A N/A N/A
SO2 N/A N/A N/A N/A
SO3 N/A N/A N/A N/A
SO4 N/A N/A N/A N/A
SO5 N/A N/A N/A N/A
SO6 N/A 9.89 Million N/A 9.89 Million
Policy based results
10. No. of completed policy advisory outputs informing development of green growth policies (CRF output 1.1) Total: 4 - AE07 (1), AE08 (1), AE09 (1), AE11 (1)
11. No. of green growth policies adopted by government with GGGI’s support (CRF outcome 1.2)
Mobilized Green Investment Commitments
12. No of completed advisory outputs that inform decisions on green investments (CRF output 2.1)
13. Green investment commitments mobilized (CRF outcome 2.1)
14. Green Investment Pipeline: Number of Projects – USD Value
Value for Money (VfM)
0
50000
100000
150000
200000
250000
300000
350000
AE1 AE07 AE08 AE09 AE10 AE11 AEPM
Annual Budget vs Expenditure
Annual Budget Actual
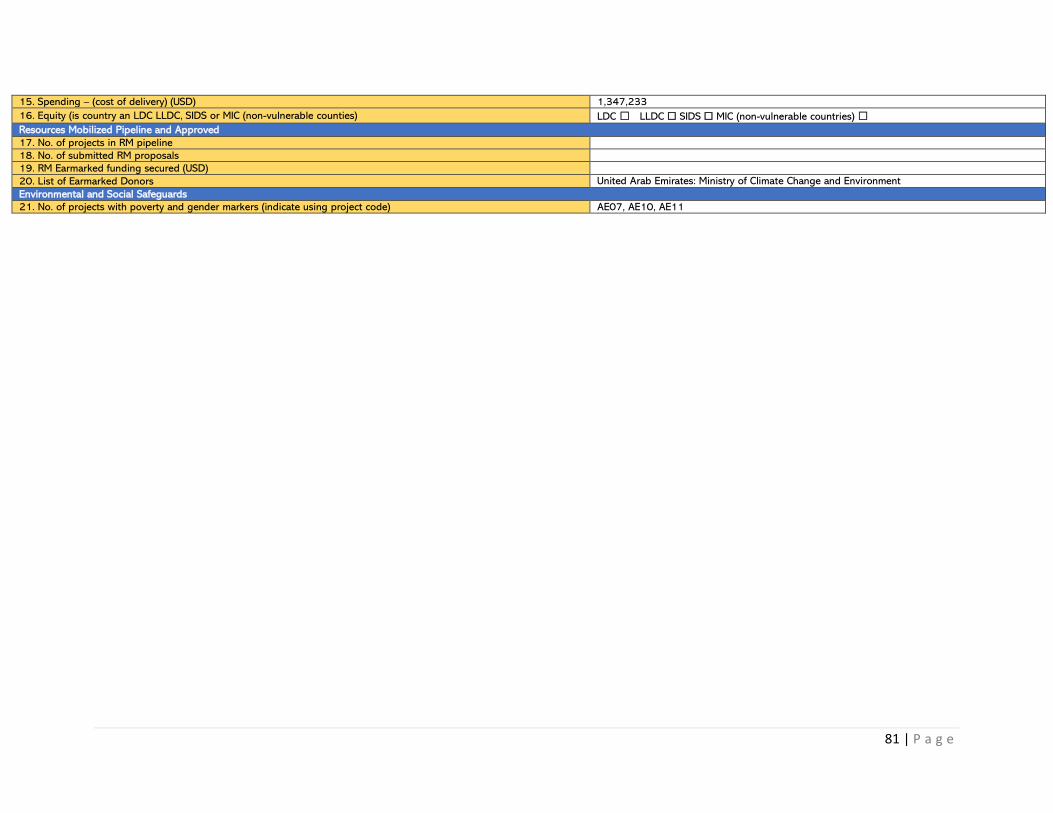
81 | P a g e
15. Spending – (cost of delivery) (USD) 1,347,233
16. Equity (is country an LDC LLDC, SIDS or MIC (non-vulnerable counties) LDC ☐ LLDC ☐ SIDS ☐ MIC (non-vulnerable countries) ☐
Resources Mobilized Pipeline and Approved
17. No. of projects in RM pipeline
18. No. of submitted RM proposals
19. RM Earmarked funding secured (USD)
20. List of Earmarked Donors United Arab Emirates: Ministry of Climate Change and Environment
Environmental and Social Safeguards
21. No. of projects with poverty and gender markers (indicate using project code) AE07, AE10, AE11

82 | P a g e
7.5 Hungary
GGGI 2020 Results Card - Hungary
1. Name of Program Hungary 2. Year/Period 2020/1 January-31 December
Projects implemented
No. Project Code 3. Project Title Status (Completed, On Track, At Risk, Off Track)
4. Project Budget Vs. Expenditure (USD)
Total Core USD/%
EM USD/%
1 HU02 Hungary Bilateral Climate Financing scheme+E53 On Track
154,793 36% 64%
2 HU03 Hungary: development of the National Clean growth Strategy and Policy Support for the EU Green Deal
On Track
328,560 0% 100%
3 HUPM HU Program Management 41,841 100% 0%
Country Resources Overlay
5. Country Budget (USD) 6. Expenditure (USD) 7. Expenditure/Budget % 8. Staffing numbers
Core: 98,157 Core: 62,982 Core: 64% 3 Earmarked: 427,036 EM: 315,535 EM: 74%
Total: 525,193 Total: 378,516 Total: 72%
9. Strategic Outcomes (SOs) Link to CPRR Country Program Results Report
2020 Total 2017-2020 Cumulative Total
SO # Attribution Contribution Attribution Contribution SO1 9.51 Million tCO2eq 9.51 Million tCO2eq
SO2
SO3
SO4
SO5
SO6
Policy based results
10. No. of completed policy advisory outputs informing development of green growth policies (CRF output 1.1) Total: 3 - HU02 (1), HU03 (2)
11. No. of green growth policies adopted by government with GGGI’s support (CRF outcome 1.2)
0
100,000
200,000
300,000
400,000
HU02 HU03 HUPM
Annual Budget vs Expenditure
Annual Budget Actual
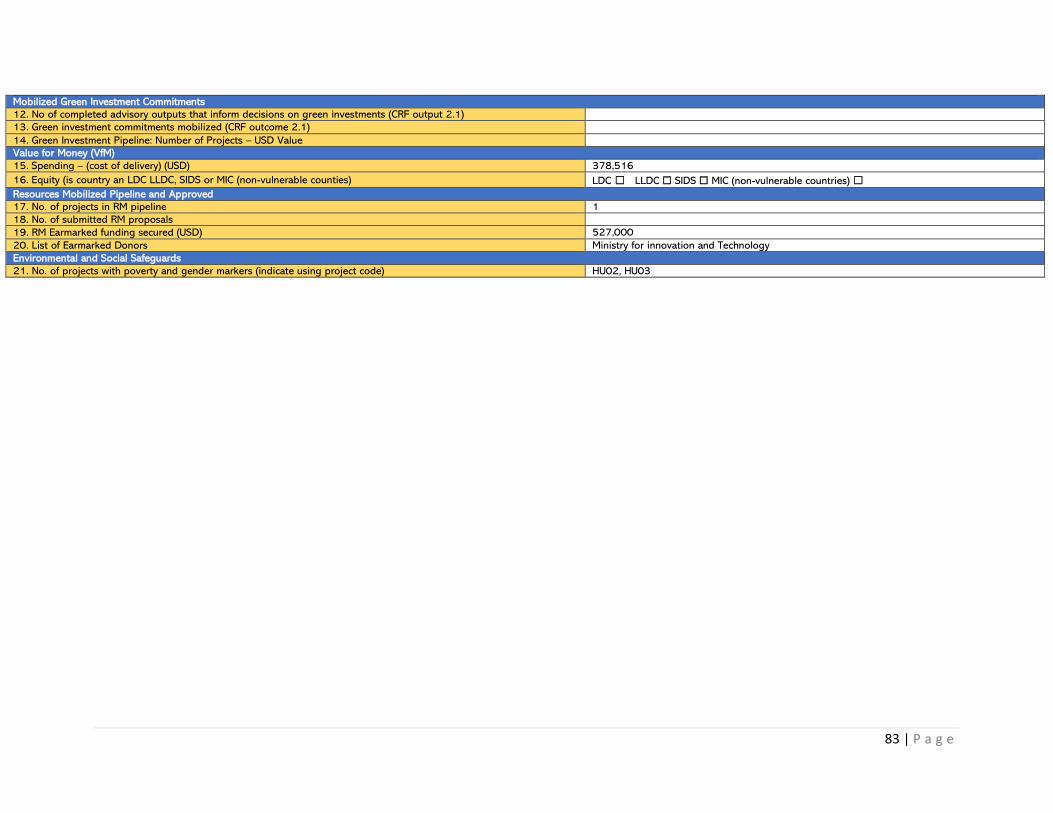
83 | P a g e
Mobilized Green Investment Commitments
12. No of completed advisory outputs that inform decisions on green investments (CRF output 2.1)
13. Green investment commitments mobilized (CRF outcome 2.1)
14. Green Investment Pipeline: Number of Projects – USD Value
Value for Money (VfM)
15. Spending – (cost of delivery) (USD) 378,516
16. Equity (is country an LDC LLDC, SIDS or MIC (non-vulnerable counties) LDC ☐ LLDC ☐ SIDS ☐ MIC (non-vulnerable countries) ☐
Resources Mobilized Pipeline and Approved
17. No. of projects in RM pipeline 1
18. No. of submitted RM proposals
19. RM Earmarked funding secured (USD) 527,000
20. List of Earmarked Donors Ministry for innovation and Technology
Environmental and Social Safeguards
21. No. of projects with poverty and gender markers (indicate using project code) HU02, HU03
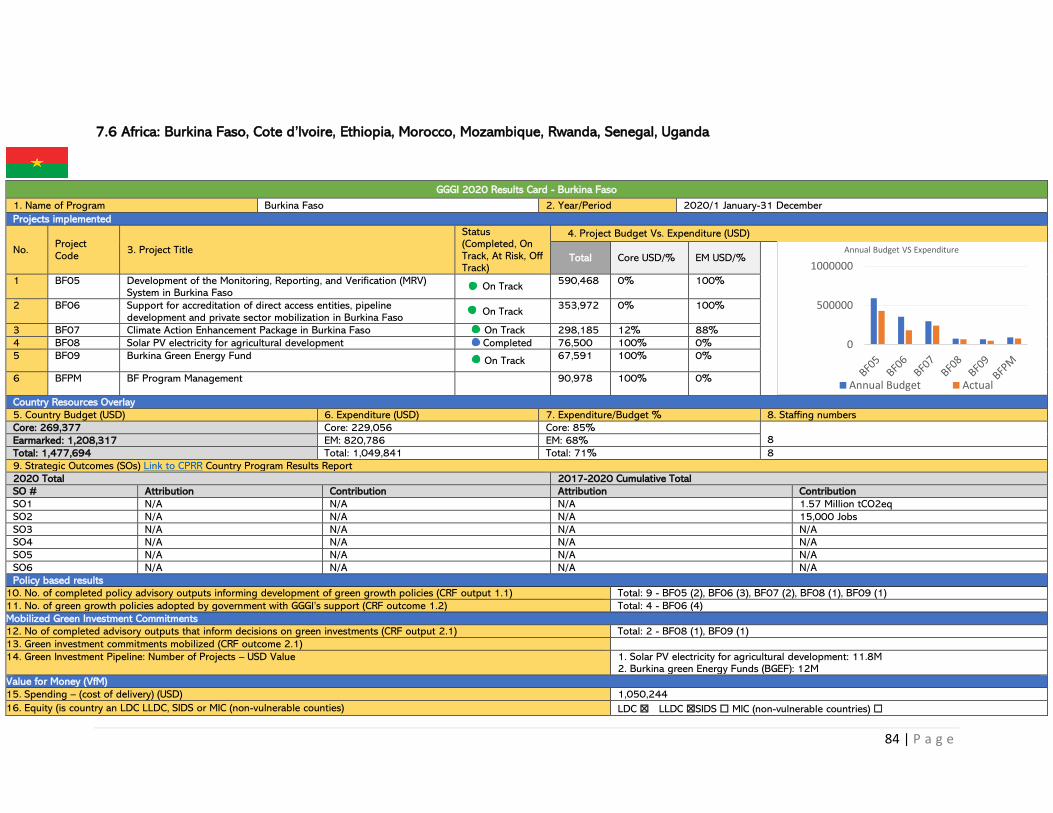
84 | P a g e
7.6 Africa: Burkina Faso, Cote d’Ivoire, Ethiopia, Morocco, Mozambique, Rwanda, Senegal, Uganda
GGGI 2020 Results Card - Burkina Faso
1. Name of Program Burkina Faso 2. Year/Period 2020/1 January-31 December
Projects implemented
No. Project Code
3. Project Title
Status (Completed, On Track, At Risk, Off Track)
4. Project Budget Vs. Expenditure (USD)
Total Core USD/% EM USD/%
1 BF05 Development of the Monitoring, Reporting, and Verification (MRV) System in Burkina Faso
On Track 590,468
0% 100%
2 BF06 Support for accreditation of direct access entities, pipeline development and private sector mobilization in Burkina Faso
On Track 353,972
0% 100%
3 BF07 Climate Action Enhancement Package in Burkina Faso On Track 298,185 12% 88%
4 BF08 Solar PV electricity for agricultural development Completed 76,500 100% 0%
5 BF09 Burkina Green Energy Fund On Track
67,591 100% 0%
6 BFPM BF Program Management
90,978 100% 0%
Country Resources Overlay
5. Country Budget (USD) 6. Expenditure (USD) 7. Expenditure/Budget % 8. Staffing numbers
Core: 269,377 Core: 229,056 Core: 85% 8 Earmarked: 1,208,317 EM: 820,786 EM: 68%
Total: 1,477,694 Total: 1,049,841 Total: 71% 8
9. Strategic Outcomes (SOs) Link to CPRR Country Program Results Report 2020 Total 2017-2020 Cumulative Total
SO # Attribution Contribution Attribution Contribution
SO1 N/A N/A N/A 1.57 Million tCO2eq
SO2 N/A N/A N/A 15,000 Jobs
SO3 N/A N/A N/A N/A
SO4 N/A N/A N/A N/A
SO5 N/A N/A N/A N/A
SO6 N/A N/A N/A N/A
Policy based results
10. No. of completed policy advisory outputs informing development of green growth policies (CRF output 1.1) Total: 9 - BF05 (2), BF06 (3), BF07 (2), BF08 (1), BF09 (1)
11. No. of green growth policies adopted by government with GGGI’s support (CRF outcome 1.2) Total: 4 - BF06 (4)
Mobilized Green Investment Commitments
12. No of completed advisory outputs that inform decisions on green investments (CRF output 2.1) Total: 2 - BF08 (1), BF09 (1)
13. Green investment commitments mobilized (CRF outcome 2.1)
14. Green Investment Pipeline: Number of Projects – USD Value 1. Solar PV electricity for agricultural development: 11.8M 2. Burkina green Energy Funds (BGEF): 12M
Value for Money (VfM)
15. Spending – (cost of delivery) (USD) 1,050,244
16. Equity (is country an LDC LLDC, SIDS or MIC (non-vulnerable counties) LDC ☒ LLDC ☒SIDS ☐ MIC (non-vulnerable countries) ☐
0
500000
1000000
Annual Budget VS Expenditure
Annual Budget Actual
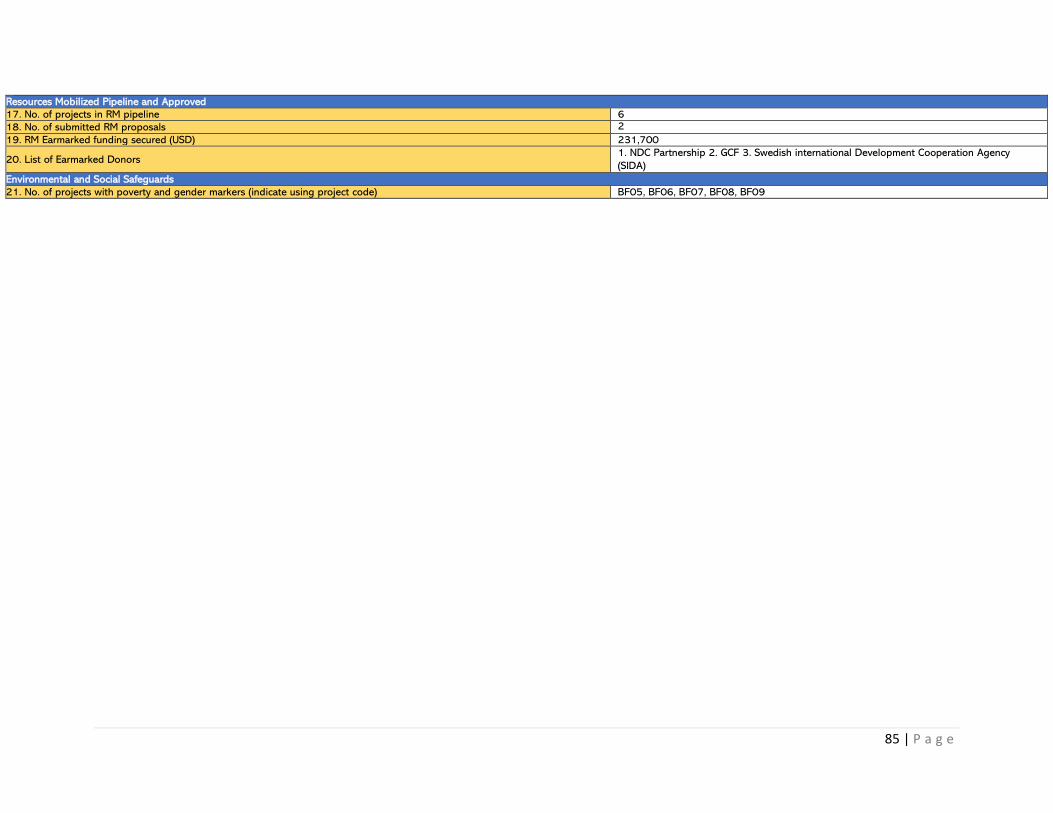
85 | P a g e
Resources Mobilized Pipeline and Approved
17. No. of projects in RM pipeline 6
18. No. of submitted RM proposals 2
19. RM Earmarked funding secured (USD) 231,700
20. List of Earmarked Donors 1. NDC Partnership 2. GCF 3. Swedish international Development Cooperation Agency
(SIDA)
Environmental and Social Safeguards
21. No. of projects with poverty and gender markers (indicate using project code) BF05, BF06, BF07, BF08, BF09
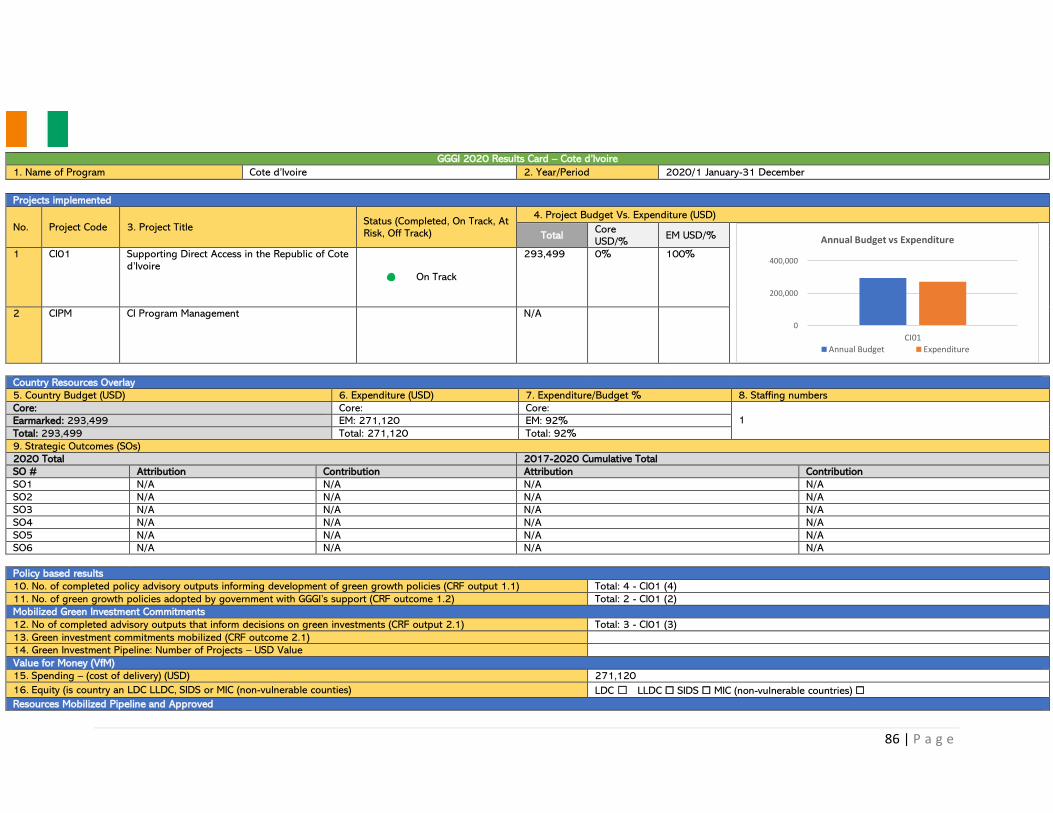
86 | P a g e
GGGI 2020 Results Card – Cote d’Ivoire
1. Name of Program Cote d’Ivoire 2. Year/Period 2020/1 January-31 December
Projects implemented
No. Project Code 3. Project Title Status (Completed, On Track, At Risk, Off Track)
4. Project Budget Vs. Expenditure (USD)
Total Core USD/%
EM USD/%
1 CI01 Supporting Direct Access in the Republic of Cote d’Ivoire
On Track
293,499 0% 100%
2 CIPM CI Program Management N/A
Country Resources Overlay
5. Country Budget (USD) 6. Expenditure (USD) 7. Expenditure/Budget % 8. Staffing numbers
Core: Core: Core: 1 Earmarked: 293,499 EM: 271,120 EM: 92%
Total: 293,499 Total: 271,120 Total: 92%
9. Strategic Outcomes (SOs)
2020 Total 2017-2020 Cumulative Total
SO # Attribution Contribution Attribution Contribution
SO1 N/A N/A N/A N/A
SO2 N/A N/A N/A N/A
SO3 N/A N/A N/A N/A
SO4 N/A N/A N/A N/A
SO5 N/A N/A N/A N/A
SO6 N/A N/A N/A N/A
Policy based results
10. No. of completed policy advisory outputs informing development of green growth policies (CRF output 1.1) Total: 4 - CI01 (4)
11. No. of green growth policies adopted by government with GGGI’s support (CRF outcome 1.2) Total: 2 - CI01 (2)
Mobilized Green Investment Commitments
12. No of completed advisory outputs that inform decisions on green investments (CRF output 2.1) Total: 3 - CI01 (3)
13. Green investment commitments mobilized (CRF outcome 2.1)
14. Green Investment Pipeline: Number of Projects – USD Value
Value for Money (VfM)
15. Spending – (cost of delivery) (USD) 271,120
16. Equity (is country an LDC LLDC, SIDS or MIC (non-vulnerable counties) LDC ☐ LLDC ☐ SIDS ☐ MIC (non-vulnerable countries) ☐
Resources Mobilized Pipeline and Approved
0
200,000
400,000
CI01
Annual Budget vs Expenditure
Annual Budget Expenditure

87 | P a g e
17. No. of projects in RM pipeline 3
18. No. of submitted RM proposals
19. RM Earmarked funding secured (USD)
20. List of Earmarked Donors 1. GCF
Environmental and Social Safeguards
21. No. of projects with poverty and gender markers (indicate using project code) CI01

88 | P a g e
GGGI 2020 Results Card - Ethiopia
1. Name of Program Ethiopia 2. Year/Period 2020/1 January-31 December
Projects implemented
No. Project Code 3. Project Title Status (Completed, On Track, At Risk, Off Track)
4. Project Budget Vs. Expenditure (USD)
Total Core USD/%
EM USD/%
1 ET5 Ethiopia GCF readiness: 'Building the Project/Program development, coordination and delivery capacity of the NIE and strengthening Ethiopia’s engagement with the GCF'
On Track
651,887 0% 100%
2 ET08 Business Case for Solar PV (Energy) Investment at the Adama Industrial Park
Completed 0 0% 100%
3 ET09 Development of a Roadmap for “Greening the Industrial Parks” in Ethiopia
Completed 27,398 23% 77%
4 ET10 Sustainable Industrial WW Sludge Management at the Ethiopian Industrial Parks
Completed 8,640 0% 100%
5 ET11 Introducing climate-smart irrigated wheat systems in the Ethiopian lowlands.
On Track 41,391 100% 0%
6 ET13 Support the Forest Sector Transformation Unit, Environment, Forest and Climate Change Commission On Track
47,744 0% 100%
7 ETPM ET Program Management 578,769 100% 0%
Country Resources Overlay
5. Country Budget (USD) 6. Expenditure (USD) 7. Expenditure/Budget % 8. Staffing numbers
Core: 626,559 Core: 580,929 Core: 93% 8 Earmarked: 729,271 EM: 329,228 EM: 45%
Total: 1,355,830 Total: 910,157 Total: 67%
9. Strategic Outcomes (SOs) Link to CPRR Country Program Results Report
2020 Total 2017-2020 Cumulative Total
SO # Attribution Contribution Attribution Contribution
SO1 N/A N/A 0.517 Million tCO2eq N/A
SO2 N/A 510,000 Jobs 828 Jobs 510,000 Jobs
SO3 N/A N/A N/A N/A
SO4 N/A N/A N/A N/A
SO5 N/A N/A N/A N/A
SO6 N/A N/A N/A N/A Policy based results
10. No. of completed policy advisory outputs informing development of green growth policies (CRF output 1.1) Total: 3 - ET5 (2), ET09 (1)
11. No. of green growth policies adopted by government with GGGI’s support (CRF outcome 1.2) Total: 1 - ET09 (1)
Mobilized Green Investment Commitments
12. No of completed advisory outputs that inform decisions on green investments (CRF output 2.1)
13. Green investment commitments mobilized (CRF outcome 2.1)
14. Green Investment Pipeline: Number of Projects – USD Value 1. Business case for Solar PV Investment at the Adama Industrial Park: 15M 2. Introducing climate-smart irrigated wheat systems: 50M
0
100,000
200,000
300,000
400,000
500,000
600,000
700,000
ET5 ET08 ET09 ET10 ET11 ET13 ETPM
Annual Budget vs Expenditure
Annual Budget Actual
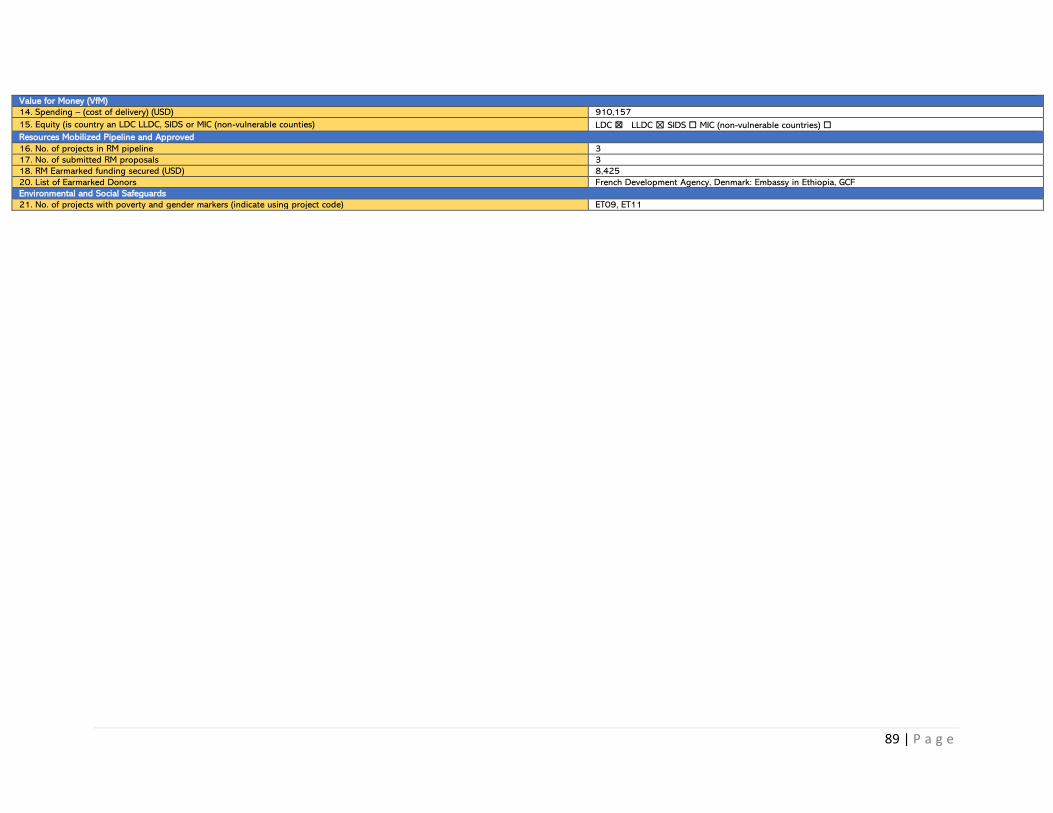
89 | P a g e
Value for Money (VfM)
14. Spending – (cost of delivery) (USD) 910,157
15. Equity (is country an LDC LLDC, SIDS or MIC (non-vulnerable counties) LDC ☒ LLDC ☒ SIDS ☐ MIC (non-vulnerable countries) ☐
Resources Mobilized Pipeline and Approved
16. No. of projects in RM pipeline 3
17. No. of submitted RM proposals 3
18. RM Earmarked funding secured (USD) 8,425
20. List of Earmarked Donors French Development Agency, Denmark: Embassy in Ethiopia, GCF
Environmental and Social Safeguards
21. No. of projects with poverty and gender markers (indicate using project code) ET09, ET11
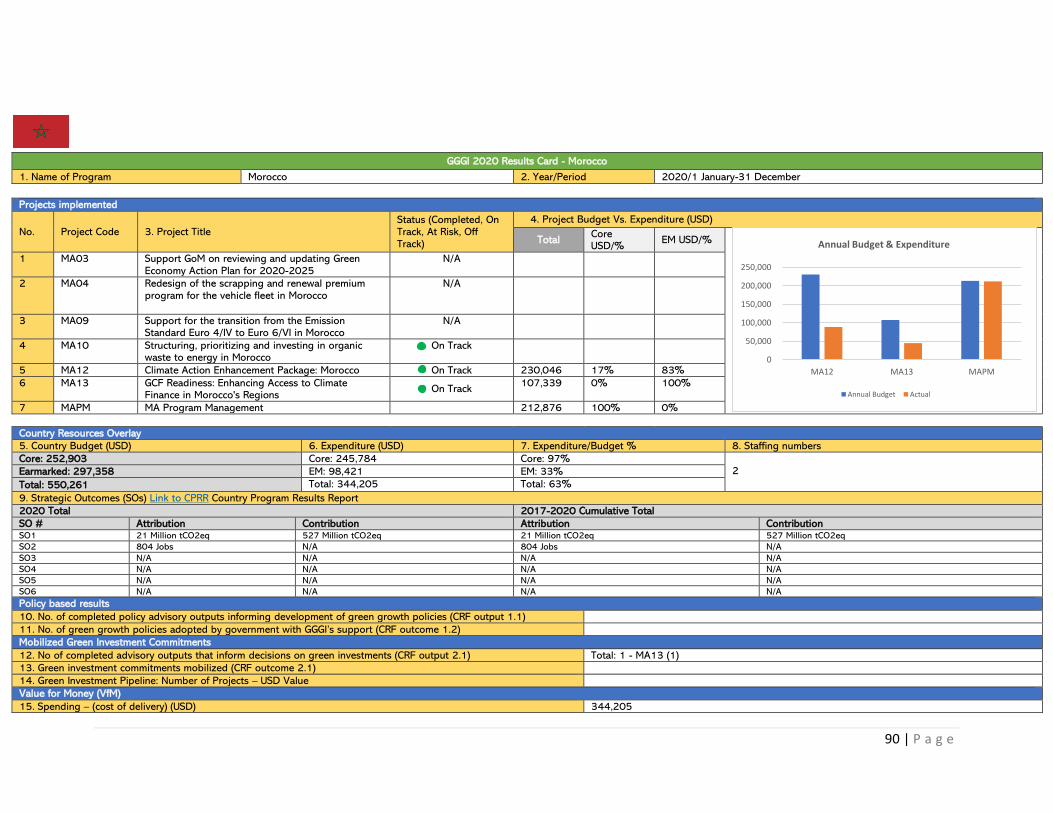
90 | P a g e
GGGI 2020 Results Card - Morocco
1. Name of Program Morocco 2. Year/Period 2020/1 January-31 December
Projects implemented
No. Project Code 3. Project Title Status (Completed, On Track, At Risk, Off Track)
4. Project Budget Vs. Expenditure (USD)
Total Core USD/%
EM USD/%
1 MA03 Support GoM on reviewing and updating Green Economy Action Plan for 2020-2025
N/A
2 MA04 Redesign of the scrapping and renewal premium program for the vehicle fleet in Morocco
N/A
3 MA09 Support for the transition from the Emission Standard Euro 4/IV to Euro 6/VI in Morocco
N/A
4 MA10 Structuring, prioritizing and investing in organic waste to energy in Morocco
On Track
5 MA12 Climate Action Enhancement Package: Morocco On Track 230,046 17% 83%
6 MA13 GCF Readiness: Enhancing Access to Climate Finance in Morocco's Regions
On Track 107,339 0% 100%
7 MAPM MA Program Management 212,876 100% 0%
Country Resources Overlay
5. Country Budget (USD) 6. Expenditure (USD) 7. Expenditure/Budget % 8. Staffing numbers
Core: 252,903 Core: 245,784 Core: 97% 2 Earmarked: 297,358 EM: 98,421 EM: 33%
Total: 550,261 Total: 344,205 Total: 63%
9. Strategic Outcomes (SOs) Link to CPRR Country Program Results Report
2020 Total 2017-2020 Cumulative Total
SO # Attribution Contribution Attribution Contribution SO1 21 Million tCO2eq 527 Million tCO2eq 21 Million tCO2eq 527 Million tCO2eq
SO2 804 Jobs N/A 804 Jobs N/A
SO3 N/A N/A N/A N/A
SO4 N/A N/A N/A N/A
SO5 N/A N/A N/A N/A
SO6 N/A N/A N/A N/A
Policy based results
10. No. of completed policy advisory outputs informing development of green growth policies (CRF output 1.1)
11. No. of green growth policies adopted by government with GGGI’s support (CRF outcome 1.2)
Mobilized Green Investment Commitments
12. No of completed advisory outputs that inform decisions on green investments (CRF output 2.1) Total: 1 - MA13 (1)
13. Green investment commitments mobilized (CRF outcome 2.1)
14. Green Investment Pipeline: Number of Projects – USD Value
Value for Money (VfM)
15. Spending – (cost of delivery) (USD) 344,205
0
50,000
100,000
150,000
200,000
250,000
MA12 MA13 MAPM
Annual Budget & Expenditure
Annual Budget Actual
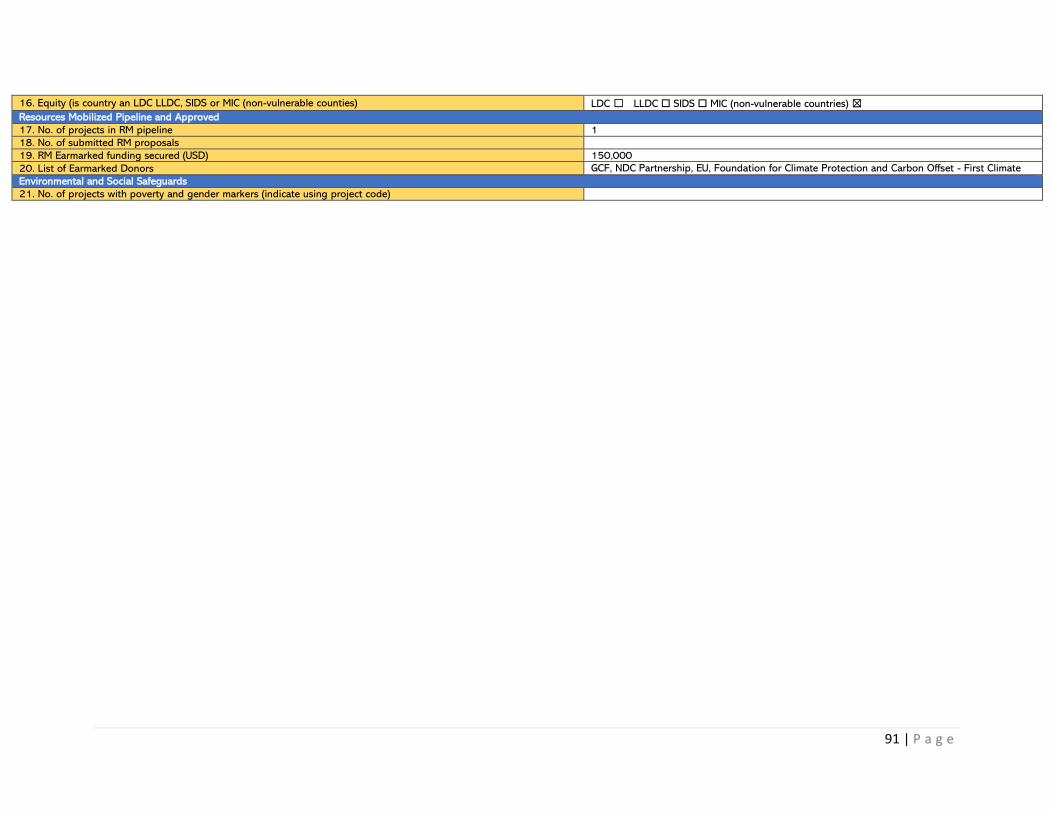
91 | P a g e
16. Equity (is country an LDC LLDC, SIDS or MIC (non-vulnerable counties) LDC ☐ LLDC ☐ SIDS ☐ MIC (non-vulnerable countries) ☒
Resources Mobilized Pipeline and Approved
17. No. of projects in RM pipeline 1
18. No. of submitted RM proposals
19. RM Earmarked funding secured (USD) 150,000
20. List of Earmarked Donors GCF, NDC Partnership, EU, Foundation for Climate Protection and Carbon Offset - First Climate
Environmental and Social Safeguards
21. No. of projects with poverty and gender markers (indicate using project code)

92 | P a g e
GGGI 2020 Results Card - Mozambique
1. Name of Program Mozambique 2. Year/Period 2020/1 January-31 December
Projects implemented
No. Project Code 3. Project Title Status (Completed, On Track, At Risk, Off Track)
4. Project Budget Vs. Expenditure (USD)
Total Core USD/%
EM USD/%
1 MZ02 Implementing the NDCs to Promote Low-Carbon Growth in Mozambique On Track
362,535 0% 100%
2 MZ03 Support GoM on reviewing and updating Green Economy Action Plan for 2020-2025 Completed
7,080 100% 0%
3 MZ05 Renewable Energy for Rural Development On Track
176,990 0% 100%
4 MZPM MZ Program Management 0 100% 0%
Country Resources Overlay
5. Country Budget (USD) 6. Expenditure (USD) 7. Expenditure/Budget % 8. Staffing numbers
Core: 7,080 Core: 7,885 Core: 111% 0 Earmarked: 539,525 EM: 144,118 EM: 27%
Total: 546,605 Total:152,004 Total: 28%
9. Strategic Outcomes (SOs)
2020 Total 2017-2020 Cumulative Total
SO # Attribution Contribution Attribution Contribution SO1 N/A N/A N/A N/A
SO2 N/A N/A N/A N/A
SO3 N/A N/A N/A N/A
SO4 N/A N/A N/A N/A
SO5 N/A N/A N/A N/A
SO6 N/A N/A N/A N/A
Policy based results
10. No. of completed policy advisory outputs informing development of green growth policies (CRF output 1.1) Total: 1 - MZ03 (1)
11. No. of green growth policies adopted by government with GGGI’s support (CRF outcome 1.2) Total: 1 - MZ03 (1)
Mobilized Green Investment Commitments
12. No of completed advisory outputs that inform decisions on green investments (CRF output 2.1)
13. Green investment commitments mobilized (CRF outcome 2.1)
14. Green Investment Pipeline: Number of Projects – USD Value
0
100,000
200,000
300,000
400,000
MZ02 MZ03 MZ05 MZPM
Annual Budget vs Expenditure
Annual Budget Actual

93 | P a g e
Value for Money (VfM)
15. Spending – (cost of delivery) (USD) 152,004
16. Equity (is country an LDC LLDC, SIDS or MIC (non-vulnerable counties) LDC ☒ LLDC ☐ SIDS ☐ MIC (non-vulnerable countries) ☐
Resources Mobilized Pipeline and Approved
17 No. of projects in RM pipeline 1
18. No. of submitted RM proposals
19. RM Earmarked funding secured (USD) 150,000
20. List of Earmarked Donors Belgium Development Agency, GCF
Environmental and Social Safeguards
21. No. of projects with poverty and gender markers (indicate using project code) MZ02, MZ03, MZ05
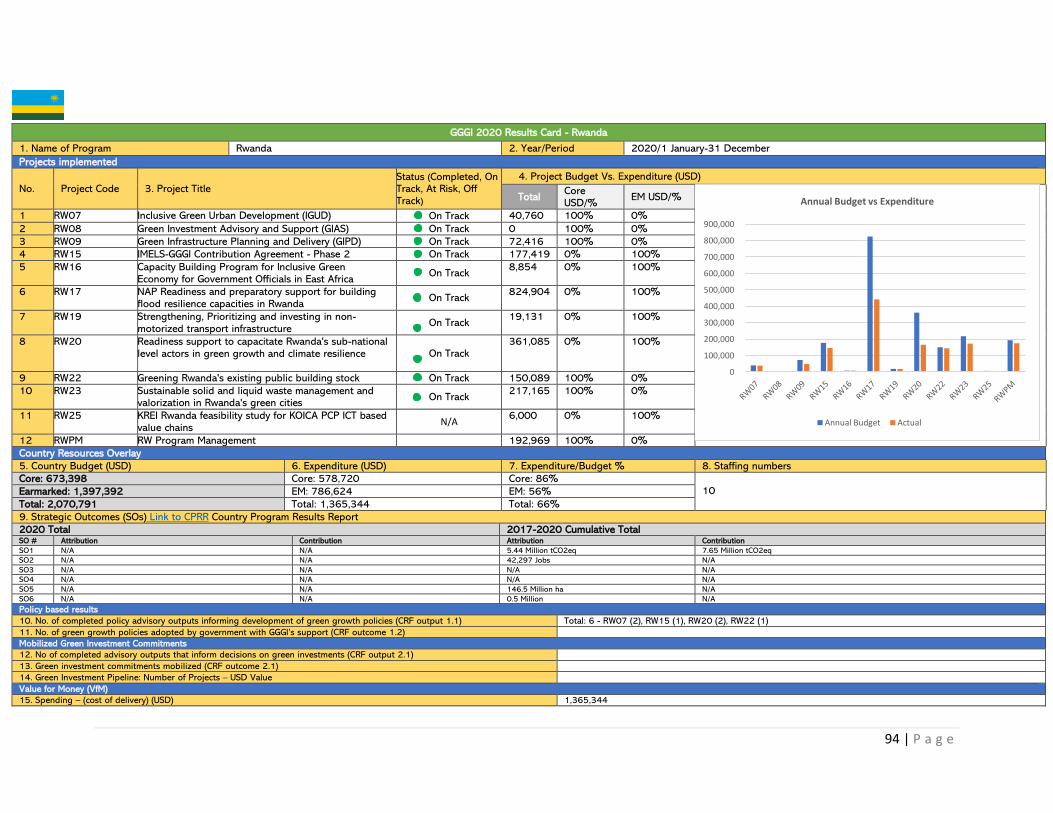
94 | P a g e
GGGI 2020 Results Card - Rwanda
1. Name of Program Rwanda 2. Year/Period 2020/1 January-31 December
Projects implemented
No. Project Code 3. Project Title Status (Completed, On Track, At Risk, Off Track)
4. Project Budget Vs. Expenditure (USD)
Total Core USD/%
EM USD/%
1 RW07 Inclusive Green Urban Development (IGUD) On Track 40,760 100% 0%
2 RW08 Green Investment Advisory and Support (GIAS) On Track 0 100% 0%
3 RW09 Green Infrastructure Planning and Delivery (GIPD) On Track 72,416 100% 0%
4 RW15 IMELS-GGGI Contribution Agreement - Phase 2 On Track 177,419 0% 100%
5 RW16 Capacity Building Program for Inclusive Green Economy for Government Officials in East Africa
On Track 8,854 0% 100%
6 RW17 NAP Readiness and preparatory support for building flood resilience capacities in Rwanda
On Track 824,904 0% 100%
7 RW19 Strengthening, Prioritizing and investing in non-motorized transport infrastructure
On Track 19,131 0% 100%
8 RW20 Readiness support to capacitate Rwanda's sub-national level actors in green growth and climate resilience On Track
361,085 0% 100%
9 RW22 Greening Rwanda's existing public building stock On Track 150,089 100% 0%
10 RW23 Sustainable solid and liquid waste management and valorization in Rwanda's green cities
On Track 217,165 100% 0%
11 RW25 KREI Rwanda feasibility study for KOICA PCP ICT based value chains
N/A 6,000 0% 100%
12 RWPM RW Program Management 192,969 100% 0%
Country Resources Overlay
5. Country Budget (USD) 6. Expenditure (USD) 7. Expenditure/Budget % 8. Staffing numbers
Core: 673,398 Core: 578,720 Core: 86% 10 Earmarked: 1,397,392 EM: 786,624 EM: 56%
Total: 2,070,791 Total: 1,365,344 Total: 66%
9. Strategic Outcomes (SOs) Link to CPRR Country Program Results Report
2020 Total 2017-2020 Cumulative Total SO # Attribution Contribution Attribution Contribution
SO1 N/A N/A 5.44 Million tCO2eq 7.65 Million tCO2eq
SO2 N/A N/A 42,297 Jobs N/A
SO3 N/A N/A N/A N/A
SO4 N/A N/A N/A N/A
SO5 N/A N/A 146.5 Million ha N/A
SO6 N/A N/A 0.5 Million N/A
Policy based results
10. No. of completed policy advisory outputs informing development of green growth policies (CRF output 1.1) Total: 6 - RW07 (2), RW15 (1), RW20 (2), RW22 (1)
11. No. of green growth policies adopted by government with GGGI’s support (CRF outcome 1.2)
Mobilized Green Investment Commitments
12. No of completed advisory outputs that inform decisions on green investments (CRF output 2.1)
13. Green investment commitments mobilized (CRF outcome 2.1)
14. Green Investment Pipeline: Number of Projects – USD Value
Value for Money (VfM)
15. Spending – (cost of delivery) (USD) 1,365,344
0
100,000
200,000
300,000
400,000
500,000
600,000
700,000
800,000
900,000
Annual Budget vs Expenditure
Annual Budget Actual

95 | P a g e
16. Equity (is country an LDC LLDC, SIDS or MIC (non-vulnerable counties) LDC ☒ LLDC ☒ SIDS ☐ MIC (non-vulnerable countries) ☐
Resources Mobilized Pipeline and Approved
17. No. of projects in RM pipeline 4
18. No. of submitted RM proposals 1
19. RM Earmarked funding secured (USD) 2,623,733
20. List of Earmarked Donors Korea Rural Economic Institute, GCF, UNEP, Swedish Institute, IMELS
Environmental and Social Safeguards
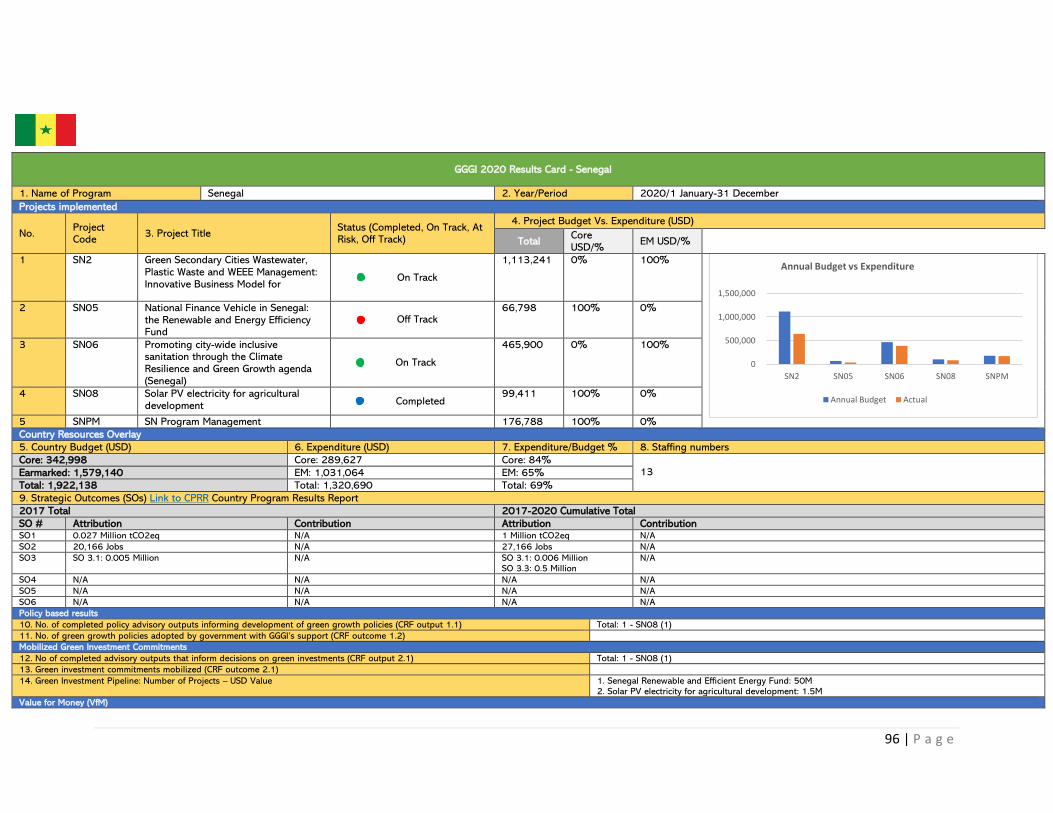
96 | P a g e
GGGI 2020 Results Card - Senegal
1. Name of Program Senegal 2. Year/Period 2020/1 January-31 December
Projects implemented
No. Project Code
3. Project Title Status (Completed, On Track, At Risk, Off Track)
4. Project Budget Vs. Expenditure (USD)
Total Core USD/%
EM USD/%
1 SN2 Green Secondary Cities Wastewater, Plastic Waste and WEEE Management: Innovative Business Model for
On Track
1,113,241 0% 100%
2 SN05 National Finance Vehicle in Senegal: the Renewable and Energy Efficiency Fund
Off Track 66,798 100% 0%
3 SN06 Promoting city-wide inclusive sanitation through the Climate Resilience and Green Growth agenda (Senegal)
On Track
465,900 0% 100%
4 SN08 Solar PV electricity for agricultural development Completed
99,411 100% 0%
5 SNPM SN Program Management 176,788 100% 0%
Country Resources Overlay
5. Country Budget (USD) 6. Expenditure (USD) 7. Expenditure/Budget % 8. Staffing numbers
Core: 342,998 Core: 289,627 Core: 84% 13 Earmarked: 1,579,140 EM: 1,031,064 EM: 65%
Total: 1,922,138 Total: 1,320,690 Total: 69%
9. Strategic Outcomes (SOs) Link to CPRR Country Program Results Report
2017 Total 2017-2020 Cumulative Total
SO # Attribution Contribution Attribution Contribution SO1 0.027 Million tCO2eq N/A 1 Million tCO2eq N/A
SO2 20,166 Jobs N/A 27,166 Jobs N/A
SO3 SO 3.1: 0.005 Million N/A SO 3.1: 0.006 Million SO 3.3: 0.5 Million
N/A
SO4 N/A N/A N/A N/A
SO5 N/A N/A N/A N/A
SO6 N/A N/A N/A N/A
Policy based results
10. No. of completed policy advisory outputs informing development of green growth policies (CRF output 1.1) Total: 1 - SN08 (1)
11. No. of green growth policies adopted by government with GGGI’s support (CRF outcome 1.2)
Mobilized Green Investment Commitments
12. No of completed advisory outputs that inform decisions on green investments (CRF output 2.1) Total: 1 - SN08 (1)
13. Green investment commitments mobilized (CRF outcome 2.1)
14. Green Investment Pipeline: Number of Projects – USD Value 1. Senegal Renewable and Efficient Energy Fund: 50M 2. Solar PV electricity for agricultural development: 1.5M
Value for Money (VfM)
0
500,000
1,000,000
1,500,000
SN2 SN05 SN06 SN08 SNPM
Annual Budget vs Expenditure
Annual Budget Actual
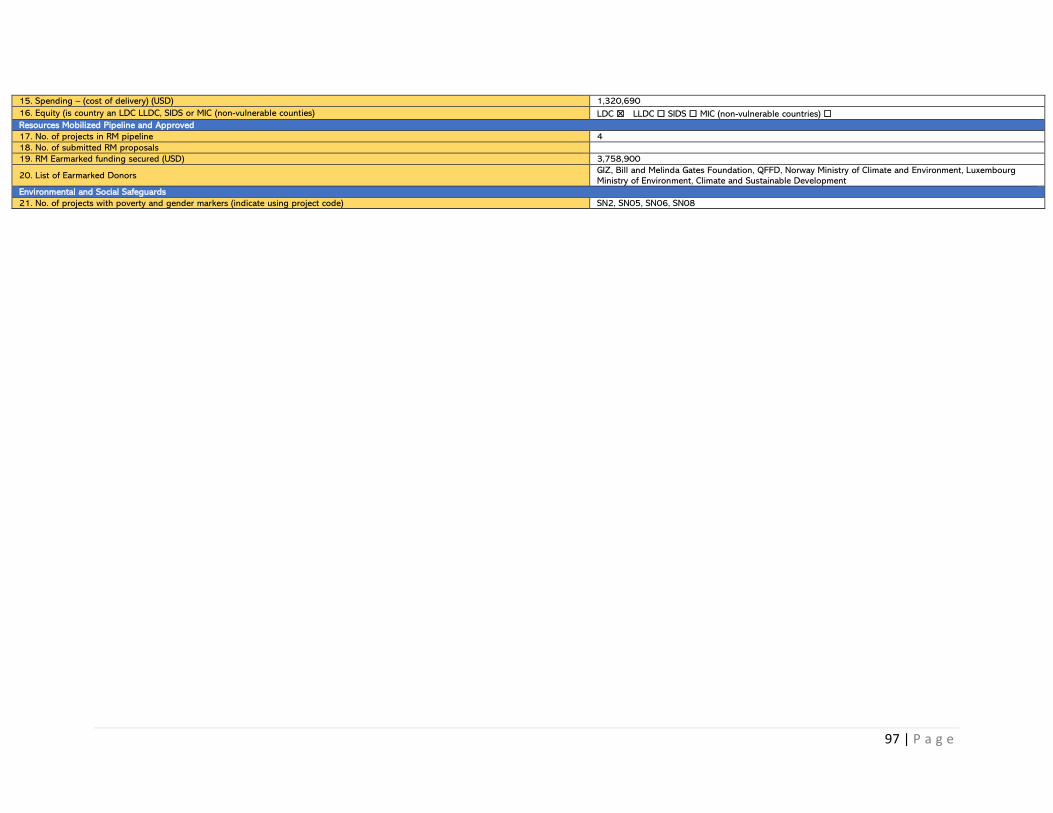
97 | P a g e
15. Spending – (cost of delivery) (USD) 1,320,690
16. Equity (is country an LDC LLDC, SIDS or MIC (non-vulnerable counties) LDC ☒ LLDC ☐ SIDS ☐ MIC (non-vulnerable countries) ☐
Resources Mobilized Pipeline and Approved
17. No. of projects in RM pipeline 4
18. No. of submitted RM proposals
19. RM Earmarked funding secured (USD) 3,758,900
20. List of Earmarked Donors GIZ, Bill and Melinda Gates Foundation, QFFD, Norway Ministry of Climate and Environment, Luxembourg Ministry of Environment, Climate and Sustainable Development
Environmental and Social Safeguards
21. No. of projects with poverty and gender markers (indicate using project code) SN2, SN05, SN06, SN08

98 | P a g e
GGGI 2020 Results Card - Uganda
1. Name of Program Uganda 2. Year/Period 2020/1 January-31 December
Projects implemented
No. Project Code
3. Project Title Status (Completed, On Track, At Risk, Off Track)
4. Project Budget Vs. Expenditure (USD)
Total Core USD/%
EM USD/%
1 UG3 Sustainable Energy-Water Solution for Med-Large Irrigation of Commercial Farming
Completed 50,225 0% 100%
2 UG4 Catalyzing the Solar Home Systems (SHS) market to benefit low-income, urban households in two second
Completed 465,467 0% 100%
3 UG13 Readiness Support to strengthen Uganda’s engagement with the GCF
On Track 566,968 0% 100%
4 UG15 Greening Uganda's Urbanization and Industrialization
On Track 565,991 0% 100%
5 UG18 Greening the National Development Plan (NDP) III Completed 15,260 100% 0%
6 UG22 NDC Partnership Economic Advisory Support - UGA N/A
7 UGPM UG Program Management 285,640 100% 0%
Country Resources Overlay
5. Country Budget (USD) 6. Expenditure (USD) 7. Expenditure/Budget % 8. Staffing numbers
Core: 300,900 Core: 265,584 Core: 88% 10 Earmarked: 1,648,652 EM: 925,974 EM: 56%
Total: 1,949,552 Total: 1,191,558 Total: 61%
9. Strategic Outcomes (SOs) Country Program Results Report
2020 Total 2017-2020 Cumulative Total
SO # Attribution Contribution Attribution Contribution SO1 N/A N/A N/A N/A
SO2 N/A N/A N/A N/A
SO3 N/A N/A N/A N/A
SO4 N/A N/A N/A N/A
SO5 N/A N/A N/A N/A
SO6 N/A N/A N/A N/A
Policy based results
10. No. of completed policy advisory outputs informing development of green growth policies (CRF output 1.1) Total: 6 - UG4 (5), UG13 (1)
11. No. of green growth policies adopted by government with GGGI’s support (CRF outcome 1.2) Total: 4 - UG4 (4)
Mobilized Green Investment Commitments
12. No of completed advisory outputs that inform decisions on green investments (CRF output 2.1)
13. Green investment commitments mobilized (CRF outcome 2.1)
0
100,000
200,000
300,000
400,000
500,000
600,000
UG3 UG4 UG13 UG15 UG18 UG22 UGPM
Annual Budget vs Expenditure
Annual Budget Actual
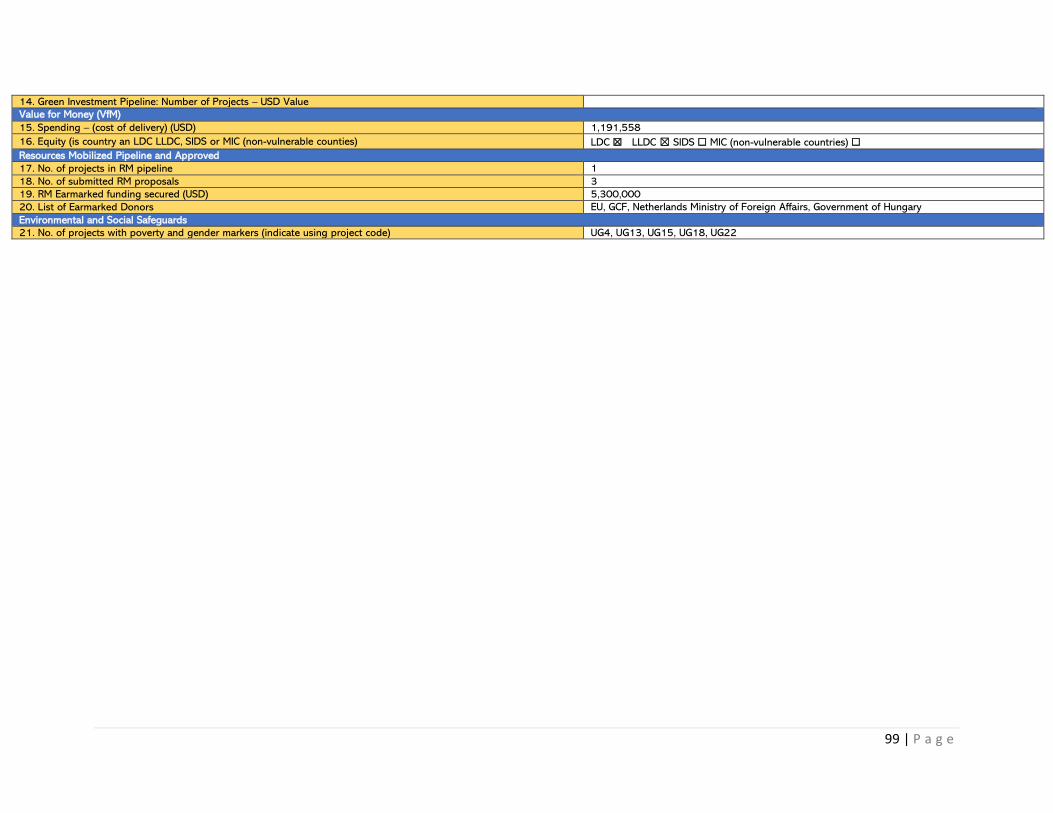
99 | P a g e
14. Green Investment Pipeline: Number of Projects – USD Value
Value for Money (VfM)
15. Spending – (cost of delivery) (USD) 1,191,558
16. Equity (is country an LDC LLDC, SIDS or MIC (non-vulnerable counties) LDC ☒ LLDC ☒ SIDS ☐ MIC (non-vulnerable countries) ☐
Resources Mobilized Pipeline and Approved
17. No. of projects in RM pipeline 1
18. No. of submitted RM proposals 3
19. RM Earmarked funding secured (USD) 5,300,000
20. List of Earmarked Donors EU, GCF, Netherlands Ministry of Foreign Affairs, Government of Hungary
Environmental and Social Safeguards
21. No. of projects with poverty and gender markers (indicate using project code) UG4, UG13, UG15, UG18, UG22

100 | P a g e
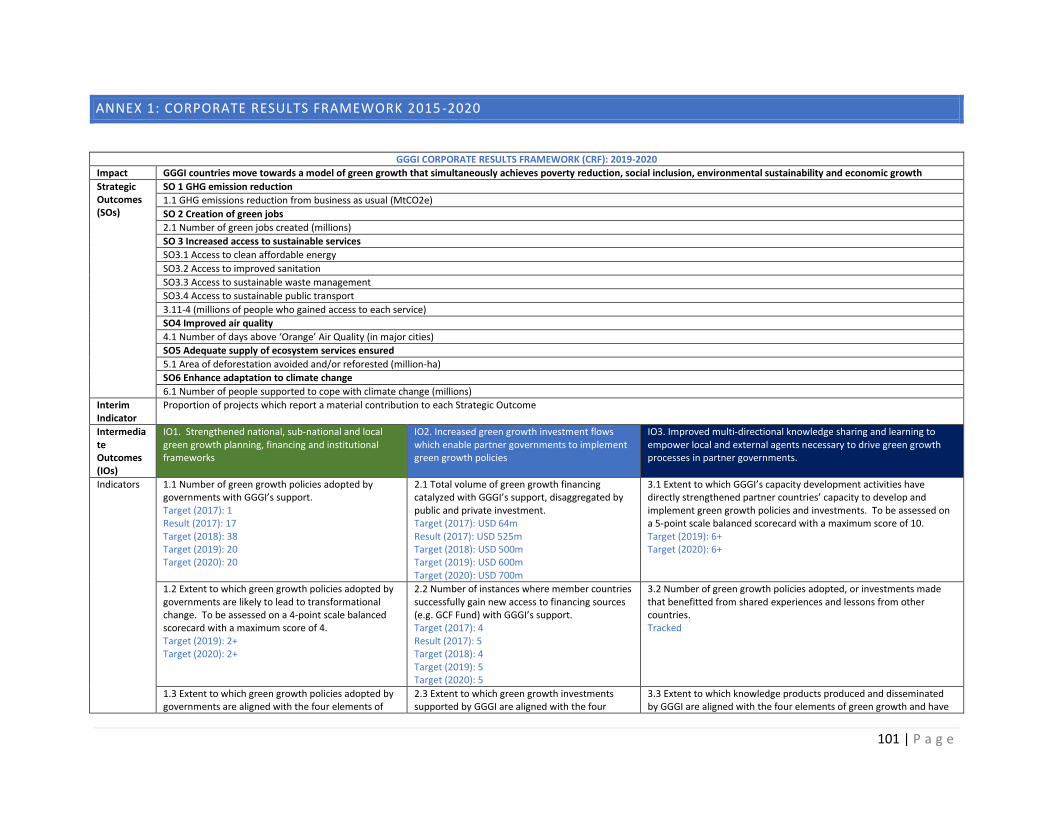
101 | P a g e
ANNEX 1: CORPORATE RESULTS FRAMEWORK 2015 -2020
GGGI CORPORATE RESULTS FRAMEWORK (CRF): 2019-2020
Impact GGGI countries move towards a model of green growth that simultaneously achieves poverty reduction, social inclusion, environmental sustainability and economic growth
Strategic Outcomes (SOs)
SO 1 GHG emission reduction
1.1 GHG emissions reduction from business as usual (MtCO2e)
SO 2 Creation of green jobs
2.1 Number of green jobs created (millions)
SO 3 Increased access to sustainable services
SO3.1 Access to clean affordable energy
SO3.2 Access to improved sanitation
SO3.3 Access to sustainable waste management
SO3.4 Access to sustainable public transport
3.11-4 (millions of people who gained access to each service)
SO4 Improved air quality
4.1 Number of days above ‘Orange’ Air Quality (in major cities)
SO5 Adequate supply of ecosystem services ensured
5.1 Area of deforestation avoided and/or reforested (million-ha)
SO6 Enhance adaptation to climate change
6.1 Number of people supported to cope with climate change (millions)
Interim Indicator
Proportion of projects which report a material contribution to each Strategic Outcome
Intermediate Outcomes (IOs)
IO1. Strengthened national, sub-national and local green growth planning, financing and institutional frameworks
IO2. Increased green growth investment flows which enable partner governments to implement green growth policies
IO3. Improved multi-directional knowledge sharing and learning to empower local and external agents necessary to drive green growth processes in partner governments.
Indicators 1.1 Number of green growth policies adopted by governments with GGGI’s support. Target (2017): 1 Result (2017): 17 Target (2018): 38 Target (2019): 20 Target (2020): 20
2.1 Total volume of green growth financing catalyzed with GGGI’s support, disaggregated by public and private investment. Target (2017): USD 64m Result (2017): USD 525m Target (2018): USD 500m Target (2019): USD 600m Target (2020): USD 700m
3.1 Extent to which GGGI’s capacity development activities have directly strengthened partner countries’ capacity to develop and implement green growth policies and investments. To be assessed on a 5-point scale balanced scorecard with a maximum score of 10. Target (2019): 6+ Target (2020): 6+
1.2 Extent to which green growth policies adopted by governments are likely to lead to transformational change. To be assessed on a 4-point scale balanced scorecard with a maximum score of 4. Target (2019): 2+ Target (2020): 2+
2.2 Number of instances where member countries successfully gain new access to financing sources (e.g. GCF Fund) with GGGI’s support. Target (2017): 4 Result (2017): 5 Target (2018): 4 Target (2019): 5 Target (2020): 5
3.2 Number of green growth policies adopted, or investments made that benefitted from shared experiences and lessons from other countries. Tracked
1.3 Extent to which green growth policies adopted by governments are aligned with the four elements of
2.3 Extent to which green growth investments supported by GGGI are aligned with the four
3.3 Extent to which knowledge products produced and disseminated by GGGI are aligned with the four elements of green growth and have

102 | P a g e
green growth. To be assessed on a 4-point balanced scorecard with a maximum score of 4. Target (2019): 2+ Target (2020): 2+
elements of green growth. To be assessed on a 4-point balanced scorecard with a maximum score of 4. Target (2019): 2+ Target (2020): 2+
a quality impact, assessed on a 6-point balanced scorecard with a maximum score of 6. Target (2019): 3+ Target (2020): 3+
Outputs 1. Demand driven technical advisory, knowledge development and private sector solutions offered on the ground for pro-poor and environmentally sustainable green growth interventions.
2. Inclusive green growth plans, strategies and investment plans are converted into implementable actions
3. Support provided in creating an enabling environment for public and private sector investment in green growth
4. Global institutional relationships, partnerships and knowledge networks formed and leveraged
5. Capacity building activities to support green growth implementation and knowledge products generated to contribute to international discussion on green growth and support GGGI operations
Indicators
1.1 Number of completed advisory outputs that inform the development of government green growth policies. Target (2017): 33 Result (2017): 21 Target (2018: 58 Target (2019): 30 Target (2020): 30
2.1 Number of completed advisory outputs that inform decisions on green growth investments. Target (2017):12 Result (2017): 9 Target (2018): 48 Target (2019): 25 Target (2020): 25
3.1 Number of completed advisory outputs that aim to improve the enabling environment for green growth investments. Target (2017): 6 Result (2017): 10 Target (2018): 14 Target (2019): 10 Target (2020): 10
4.1 Proportion of capacity development activities that share experiences and lessons from GGGI countries. Target (2017): 55% Result (2017): 37% Target (2018): 55% Target (2019): 55% Target (2020): 55%
5.1 Number of knowledge products to improve understanding of green growth and support GGGI operations. Target (2017): 20 Result (2017): 60 Target (2018): 65 Target (2019): 70 Target (2020):70
4.2 Number of new countries joining GGGI as members. Target (2017): Result (2017): 1 Target (2018): 2 Target (2019): 2 Target (2020): 2
5.2 Number of capacity building activities that align with IO 1 and IO2. Tracked
4.3 Number of projects where country needs are being met through a range of partnerships brokered by GGGI. Target (2017): Result (2017): 17 Target (2018): 6 Target (2019): 10 Target (2020): 10
Cross-cutting Output
6. All new projects implemented by GGGI have adequately identified and addressed SPRSI elements in their design in support of social safeguards, poverty reduction and social inclusion including gender.
6.1 Number of new projects implemented by GGGI that have identified and addressed one or more SPRSI elements relating to social safeguards, poverty reduction and social inclusion including gender.
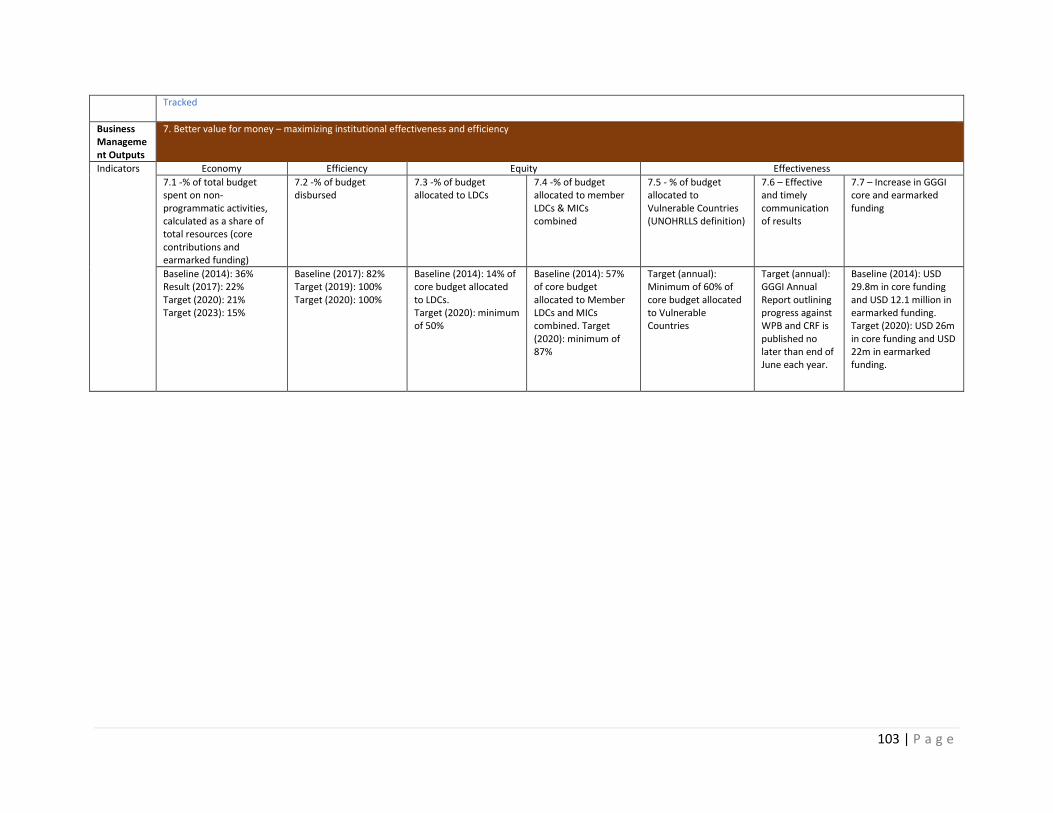
103 | P a g e
Tracked
Business Management Outputs
7. Better value for money – maximizing institutional effectiveness and efficiency
Indicators Economy Efficiency Equity Effectiveness
7.1 -% of total budget spent on non-programmatic activities, calculated as a share of total resources (core contributions and earmarked funding)
7.2 -% of budget disbursed
7.3 -% of budget allocated to LDCs
7.4 -% of budget allocated to member LDCs & MICs combined
7.5 - % of budget allocated to Vulnerable Countries (UNOHRLLS definition)
7.6 – Effective and timely communication of results
7.7 – Increase in GGGI core and earmarked funding
Baseline (2014): 36% Result (2017): 22% Target (2020): 21% Target (2023): 15%
Baseline (2017): 82% Target (2019): 100% Target (2020): 100%
Baseline (2014): 14% of core budget allocated to LDCs. Target (2020): minimum of 50%
Baseline (2014): 57% of core budget allocated to Member LDCs and MICs combined. Target (2020): minimum of 87%
Target (annual): Minimum of 60% of core budget allocated to Vulnerable Countries
Target (annual): GGGI Annual Report outlining progress against WPB and CRF is published no later than end of June each year.
Baseline (2014): USD 29.8m in core funding and USD 12.1 million in earmarked funding. Target (2020): USD 26m in core funding and USD 22m in earmarked funding.
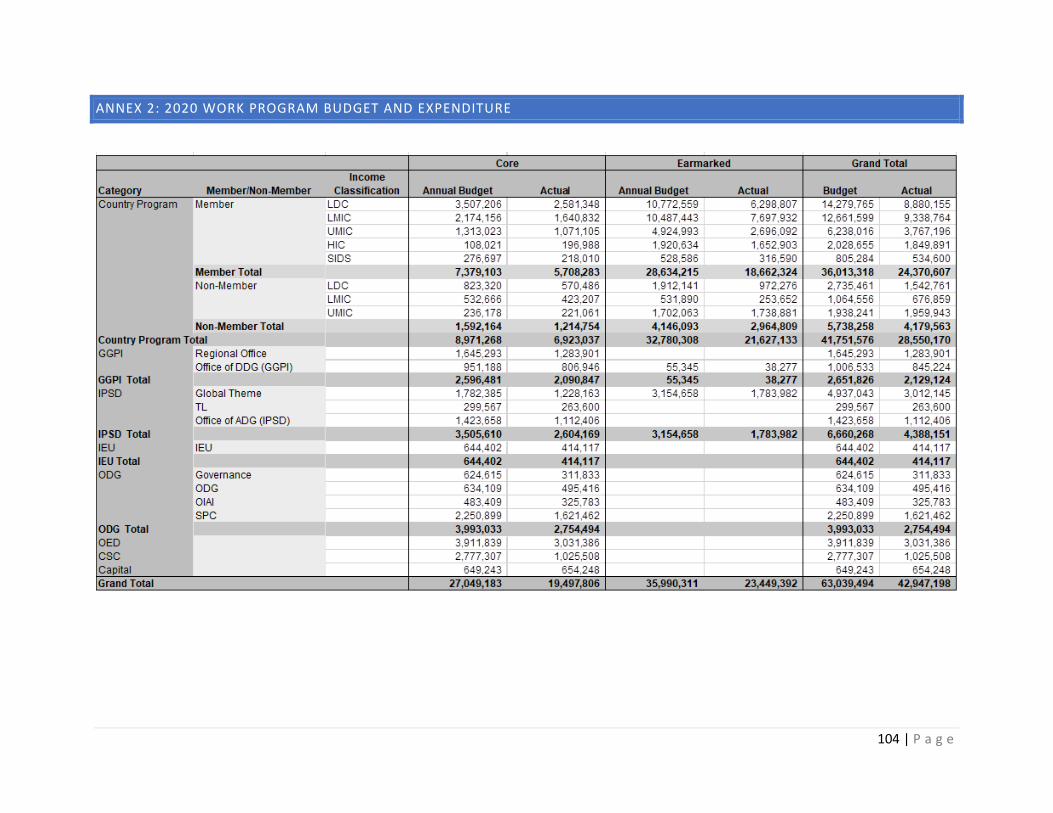
104 | P a g e
ANNEX 2: 2020 WORK PROGRAM BUDGET AND EXPENDITURE
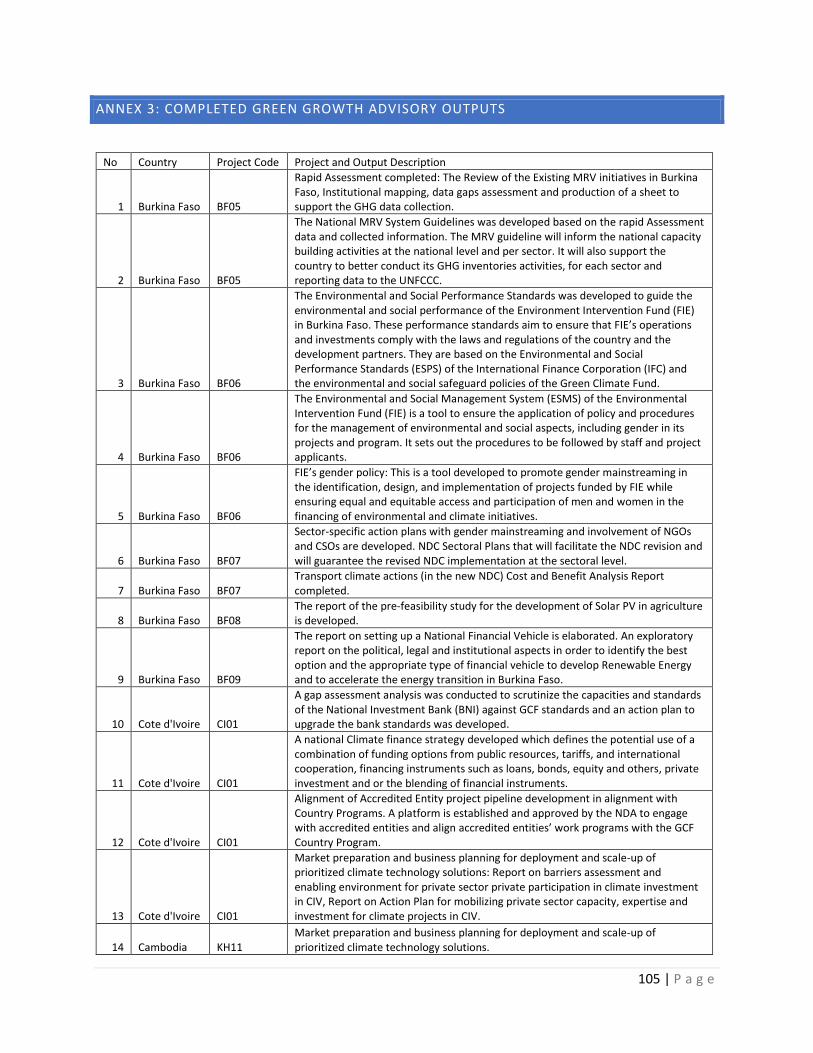
105 | P a g e
ANNEX 3: COMPLETED GREEN GROWTH ADVISORY OUTPUTS
No Country Project Code Project and Output Description
1 Burkina Faso BF05
Rapid Assessment completed: The Review of the Existing MRV initiatives in Burkina Faso, Institutional mapping, data gaps assessment and production of a sheet to support the GHG data collection.
2 Burkina Faso BF05
The National MRV System Guidelines was developed based on the rapid Assessment data and collected information. The MRV guideline will inform the national capacity building activities at the national level and per sector. It will also support the country to better conduct its GHG inventories activities, for each sector and reporting data to the UNFCCC.
3 Burkina Faso BF06
The Environmental and Social Performance Standards was developed to guide the environmental and social performance of the Environment Intervention Fund (FIE) in Burkina Faso. These performance standards aim to ensure that FIE’s operations and investments comply with the laws and regulations of the country and the development partners. They are based on the Environmental and Social Performance Standards (ESPS) of the International Finance Corporation (IFC) and the environmental and social safeguard policies of the Green Climate Fund.
4 Burkina Faso BF06
The Environmental and Social Management System (ESMS) of the Environmental Intervention Fund (FIE) is a tool to ensure the application of policy and procedures for the management of environmental and social aspects, including gender in its projects and program. It sets out the procedures to be followed by staff and project applicants.
5 Burkina Faso BF06
FIE’s gender policy: This is a tool developed to promote gender mainstreaming in the identification, design, and implementation of projects funded by FIE while ensuring equal and equitable access and participation of men and women in the financing of environmental and climate initiatives.
6 Burkina Faso BF07
Sector-specific action plans with gender mainstreaming and involvement of NGOs and CSOs are developed. NDC Sectoral Plans that will facilitate the NDC revision and will guarantee the revised NDC implementation at the sectoral level.
7 Burkina Faso BF07 Transport climate actions (in the new NDC) Cost and Benefit Analysis Report completed.
8 Burkina Faso BF08 The report of the pre-feasibility study for the development of Solar PV in agriculture is developed.
9 Burkina Faso BF09
The report on setting up a National Financial Vehicle is elaborated. An exploratory report on the political, legal and institutional aspects in order to identify the best option and the appropriate type of financial vehicle to develop Renewable Energy and to accelerate the energy transition in Burkina Faso.
10 Cote d'Ivoire CI01
A gap assessment analysis was conducted to scrutinize the capacities and standards of the National Investment Bank (BNI) against GCF standards and an action plan to upgrade the bank standards was developed.
11 Cote d'Ivoire CI01
A national Climate finance strategy developed which defines the potential use of a combination of funding options from public resources, tariffs, and international cooperation, financing instruments such as loans, bonds, equity and others, private investment and or the blending of financial instruments.
12 Cote d'Ivoire CI01
Alignment of Accredited Entity project pipeline development in alignment with Country Programs. A platform is established and approved by the NDA to engage with accredited entities and align accredited entities’ work programs with the GCF Country Program.
13 Cote d'Ivoire CI01
Market preparation and business planning for deployment and scale-up of prioritized climate technology solutions: Report on barriers assessment and enabling environment for private sector private participation in climate investment in CIV, Report on Action Plan for mobilizing private sector capacity, expertise and investment for climate projects in CIV.
14 Cambodia KH11 Market preparation and business planning for deployment and scale-up of prioritized climate technology solutions.
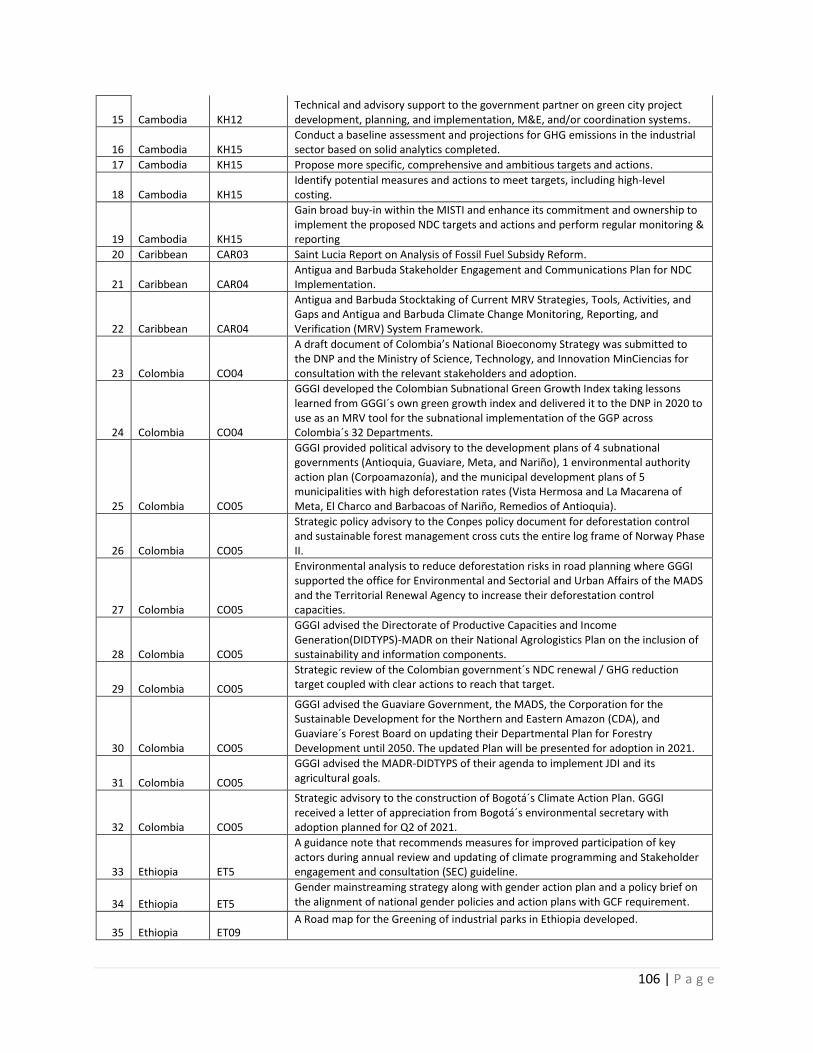
106 | P a g e
15 Cambodia KH12 Technical and advisory support to the government partner on green city project development, planning, and implementation, M&E, and/or coordination systems.
16 Cambodia KH15 Conduct a baseline assessment and projections for GHG emissions in the industrial sector based on solid analytics completed.
17 Cambodia KH15 Propose more specific, comprehensive and ambitious targets and actions.
18 Cambodia KH15 Identify potential measures and actions to meet targets, including high-level costing.
19 Cambodia KH15
Gain broad buy-in within the MISTI and enhance its commitment and ownership to implement the proposed NDC targets and actions and perform regular monitoring & reporting
20 Caribbean CAR03 Saint Lucia Report on Analysis of Fossil Fuel Subsidy Reform.
21 Caribbean CAR04 Antigua and Barbuda Stakeholder Engagement and Communications Plan for NDC Implementation.
22 Caribbean CAR04
Antigua and Barbuda Stocktaking of Current MRV Strategies, Tools, Activities, and Gaps and Antigua and Barbuda Climate Change Monitoring, Reporting, and Verification (MRV) System Framework.
23 Colombia CO04
A draft document of Colombia’s National Bioeconomy Strategy was submitted to the DNP and the Ministry of Science, Technology, and Innovation MinCiencias for consultation with the relevant stakeholders and adoption.
24 Colombia CO04
GGGI developed the Colombian Subnational Green Growth Index taking lessons learned from GGGI´s own green growth index and delivered it to the DNP in 2020 to use as an MRV tool for the subnational implementation of the GGP across Colombia´s 32 Departments.
25 Colombia CO05
GGGI provided political advisory to the development plans of 4 subnational governments (Antioquia, Guaviare, Meta, and Nariño), 1 environmental authority action plan (Corpoamazonía), and the municipal development plans of 5 municipalities with high deforestation rates (Vista Hermosa and La Macarena of Meta, El Charco and Barbacoas of Nariño, Remedios of Antioquia).
26 Colombia CO05
Strategic policy advisory to the Conpes policy document for deforestation control and sustainable forest management cross cuts the entire log frame of Norway Phase II.
27 Colombia CO05
Environmental analysis to reduce deforestation risks in road planning where GGGI supported the office for Environmental and Sectorial and Urban Affairs of the MADS and the Territorial Renewal Agency to increase their deforestation control capacities.
28 Colombia CO05
GGGI advised the Directorate of Productive Capacities and Income Generation(DIDTYPS)-MADR on their National Agrologistics Plan on the inclusion of sustainability and information components.
29 Colombia CO05
Strategic review of the Colombian government´s NDC renewal / GHG reduction target coupled with clear actions to reach that target.
30 Colombia CO05
GGGI advised the Guaviare Government, the MADS, the Corporation for the Sustainable Development for the Northern and Eastern Amazon (CDA), and Guaviare´s Forest Board on updating their Departmental Plan for Forestry Development until 2050. The updated Plan will be presented for adoption in 2021.
31 Colombia CO05
GGGI advised the MADR-DIDTYPS of their agenda to implement JDI and its agricultural goals.
32 Colombia CO05
Strategic advisory to the construction of Bogotá´s Climate Action Plan. GGGI received a letter of appreciation from Bogotá´s environmental secretary with adoption planned for Q2 of 2021.
33 Ethiopia ET5
A guidance note that recommends measures for improved participation of key actors during annual review and updating of climate programming and Stakeholder engagement and consultation (SEC) guideline.
34 Ethiopia ET5
Gender mainstreaming strategy along with gender action plan and a policy brief on the alignment of national gender policies and action plans with GCF requirement.
35 Ethiopia ET09 A Road map for the Greening of industrial parks in Ethiopia developed.
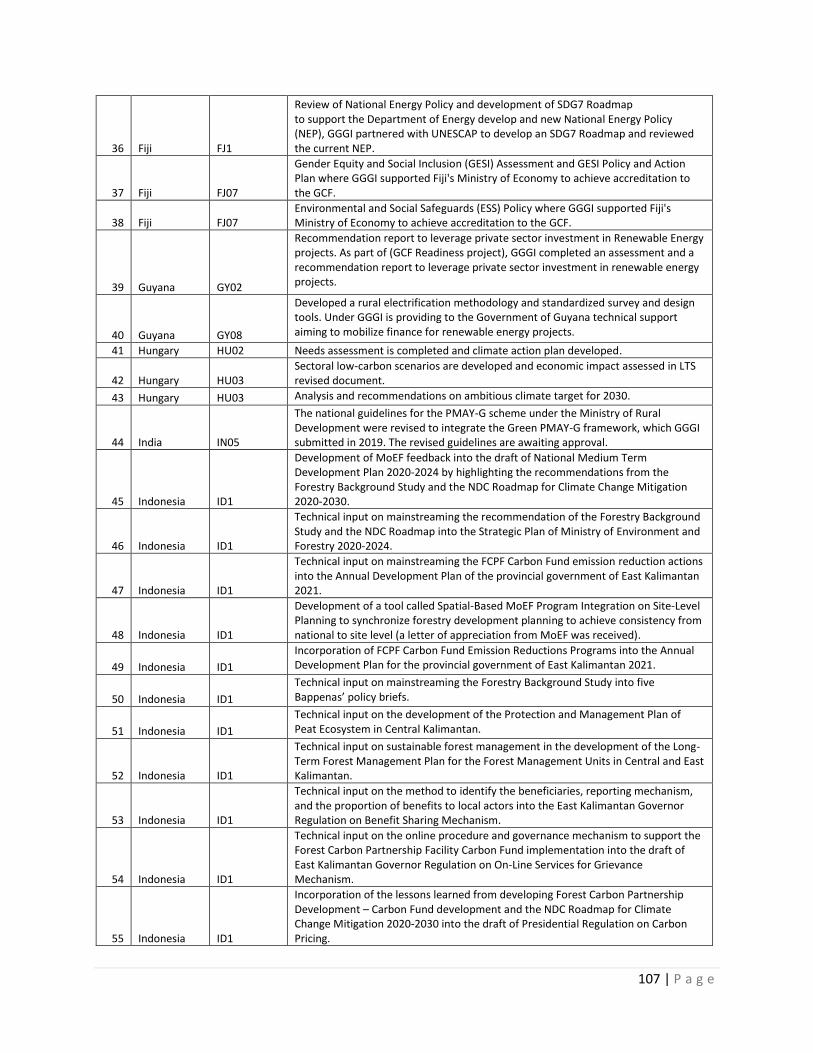
107 | P a g e
36 Fiji FJ1
Review of National Energy Policy and development of SDG7 Roadmap to support the Department of Energy develop and new National Energy Policy (NEP), GGGI partnered with UNESCAP to develop an SDG7 Roadmap and reviewed the current NEP.
37 Fiji FJ07
Gender Equity and Social Inclusion (GESI) Assessment and GESI Policy and Action Plan where GGGI supported Fiji's Ministry of Economy to achieve accreditation to the GCF.
38 Fiji FJ07 Environmental and Social Safeguards (ESS) Policy where GGGI supported Fiji's Ministry of Economy to achieve accreditation to the GCF.
39 Guyana GY02
Recommendation report to leverage private sector investment in Renewable Energy projects. As part of (GCF Readiness project), GGGI completed an assessment and a recommendation report to leverage private sector investment in renewable energy projects.
40 Guyana GY08
Developed a rural electrification methodology and standardized survey and design tools. Under GGGI is providing to the Government of Guyana technical support aiming to mobilize finance for renewable energy projects.
41 Hungary HU02 Needs assessment is completed and climate action plan developed.
42 Hungary HU03 Sectoral low-carbon scenarios are developed and economic impact assessed in LTS revised document.
43 Hungary HU03 Analysis and recommendations on ambitious climate target for 2030.
44 India IN05
The national guidelines for the PMAY-G scheme under the Ministry of Rural Development were revised to integrate the Green PMAY-G framework, which GGGI submitted in 2019. The revised guidelines are awaiting approval.
45 Indonesia ID1
Development of MoEF feedback into the draft of National Medium Term Development Plan 2020-2024 by highlighting the recommendations from the Forestry Background Study and the NDC Roadmap for Climate Change Mitigation 2020-2030.
46 Indonesia ID1
Technical input on mainstreaming the recommendation of the Forestry Background Study and the NDC Roadmap into the Strategic Plan of Ministry of Environment and Forestry 2020-2024.
47 Indonesia ID1
Technical input on mainstreaming the FCPF Carbon Fund emission reduction actions into the Annual Development Plan of the provincial government of East Kalimantan 2021.
48 Indonesia ID1
Development of a tool called Spatial-Based MoEF Program Integration on Site-Level Planning to synchronize forestry development planning to achieve consistency from national to site level (a letter of appreciation from MoEF was received).
49 Indonesia ID1
Incorporation of FCPF Carbon Fund Emission Reductions Programs into the Annual Development Plan for the provincial government of East Kalimantan 2021.
50 Indonesia ID1
Technical input on mainstreaming the Forestry Background Study into five Bappenas’ policy briefs.
51 Indonesia ID1
Technical input on the development of the Protection and Management Plan of Peat Ecosystem in Central Kalimantan.
52 Indonesia ID1
Technical input on sustainable forest management in the development of the Long-Term Forest Management Plan for the Forest Management Units in Central and East Kalimantan.
53 Indonesia ID1
Technical input on the method to identify the beneficiaries, reporting mechanism, and the proportion of benefits to local actors into the East Kalimantan Governor Regulation on Benefit Sharing Mechanism.
54 Indonesia ID1
Technical input on the online procedure and governance mechanism to support the Forest Carbon Partnership Facility Carbon Fund implementation into the draft of East Kalimantan Governor Regulation on On-Line Services for Grievance Mechanism.
55 Indonesia ID1
Incorporation of the lessons learned from developing Forest Carbon Partnership Development – Carbon Fund development and the NDC Roadmap for Climate Change Mitigation 2020-2030 into the draft of Presidential Regulation on Carbon Pricing.

108 | P a g e
56 Indonesia ID1
Development of a draft joint legal brief (MoEF, Ministry of Finance, and Ministry of Foreign Affairs) on the Authority of MoEF in the Negotiation and Signing Process of the Emission Reductions Payment Agreement between the Indonesian Government and the International Bank for Reconstruction and Development.
57 Indonesia ID1
Incorporation of the key recommendations from Emission Reductions Program Document into the establishment process of East Kalimantan on the Emission Reductions Program working group on: (a) Measurement, Monitoring and Reporting for the East Kalimantan, (b) Benefit Sharing, and (c) Safeguards.
58 Indonesia ID1
Roadmap 500 MW biomass study (scoping phase) at a national level to support bioenergy planning and the draft of RUPTL (PLN (Indonesia's biggest state-owned utility) business planning).
59 Indonesia ID1
Technical input on the Cap Emissions study as part of PMR (Partnership for Market Readiness) implementation for the carbon market.
60 Indonesia ID1
Technical study on the Impact of offgrid facilities built by the government in support of a potential special fund for offgrid facilities with co-financing from the ministry of energy.
61 Indonesia ID1
Technical study on BioCNG market to support energy transition away from fossil fuel (with co-financing from the Ministry of Energy).
62 Indonesia ID3
To support the Ministry of Finance, the Indonesia GCF Country Program Document (CPD) was updated with clear thematic priority sectors, developed according to the most updated national development plans, policies, and regulations.
63 Indonesia ID3
Study on Enabling Environment for Private Sector Engagement in Adaptation Projects was submitted to the Fiscal Policy Agency, Ministry of Finance.
64 Jordan JO3
Further institutional gap assessment of the nominated entity and prepared action plans to agree on these gaps and designed/upgrade, adopt and integrate policies in accordance with GCF's fiduciary principles and standards, environmental and social safeguards (ESS), and gender policy.
65 Jordan JO05
All 6 parts of the action plans (Agriculture, Energy, Tourism, Transport, Waste, and Water) were approved in 2020 and these action plans inform the development of the Government of Jordan’s green growth policies.
66 Kiribati KI02
Kiribati Agriculture Strategy: Working with the Ministry of Environment, Lands and Agriculture Development (MELAD), GGGI supported the development of an Agricultural Strategy (KAS) as an Addendum to the Kiribati 20-year Vision, the country’s national development plan.
67 Lao PDR LA06 Technical Contribution to Solar PV Auction Design in Lao PDR.
68 Lao PDR LA07 2020 Lao PDR Nationally Determined Contribution delivered.
69 Lao PDR LA09 Sustainable Solid Waste Management Strategy and Action plan for Vientiane 2020-2030.
70 Lao PDR LA09 Wastewater management strategy for Pakse city.
71 Lao PDR LA09 National Urban Sanitation Strategy.
72 Mexico MX05
One Technical Report - "Subnational Green Growth: Green Recovery Recommendations for Mexico" which encompasses general recommendations (for all 32 states), specific recommendations (based on 3 case studies for the subnational states of Yucatán, Querétaro and Sonora) plus paradigm-shifting recommendations.
73 Mongolia MN04 Market Assessment for Designated Entities/Large Energy Users.
74 Mongolia MN04 Draft amendment to an energy conservation law.
75 Mozambique MZ03 Update of GEAP.
76 Myanmar MM03
3Returns Framework: A method for decision making towards sustainable landscapes and a Report on Economic Appraisal of Ayeyarwady Delta Mangrove Forests.
77 Myanmar MM03
Report – Bio-based Value Chain Analysis for Sustainable Mangrove Restoration, Ayeyarwady Delta, Myanmar.
78 Myanmar MM18
Report – Investment Analysis for Mangrove Ecosystems in the Ayeyarwady Region and Insight Brief on Mangrove Aquaculture: Polyculture Products in the Ayeyarwady Region and Insight Brief – Nipa Palm Products in the Ayeyarwady Region.
79 Nepal NP03 Electric Mobility Strategy of Bagmati Pradesh
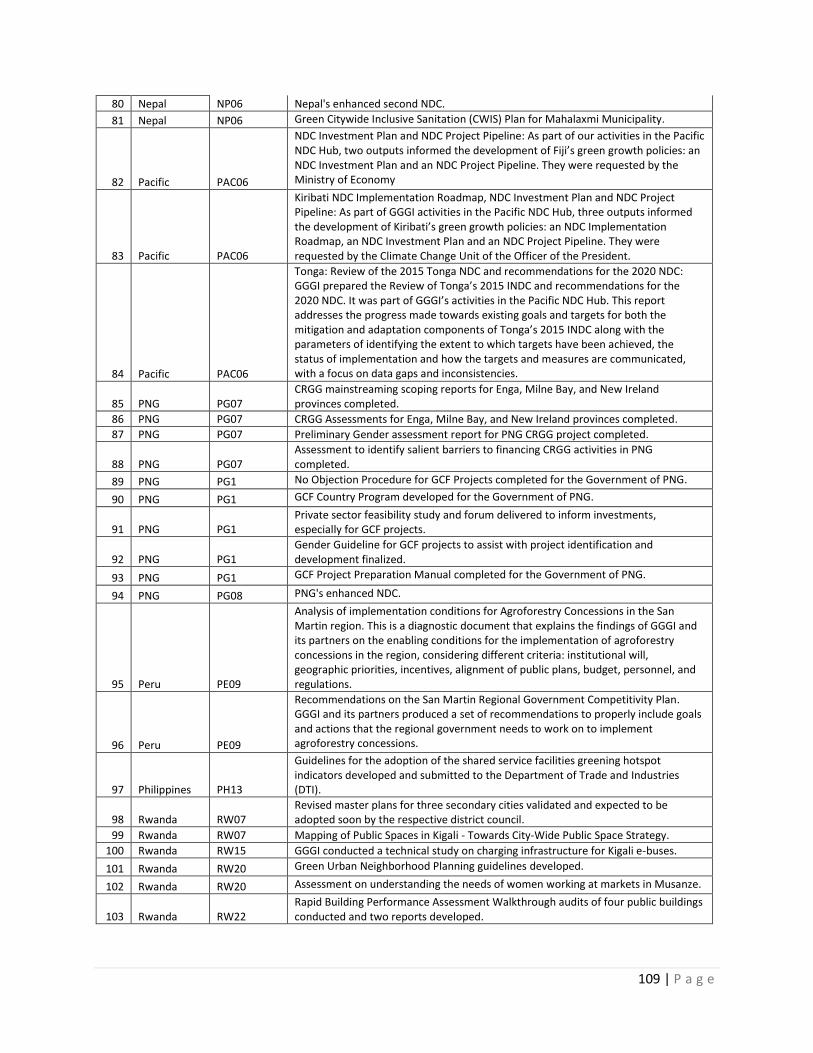
109 | P a g e
80 Nepal NP06 Nepal's enhanced second NDC.
81 Nepal NP06 Green Citywide Inclusive Sanitation (CWIS) Plan for Mahalaxmi Municipality.
82 Pacific PAC06
NDC Investment Plan and NDC Project Pipeline: As part of our activities in the Pacific NDC Hub, two outputs informed the development of Fiji’s green growth policies: an NDC Investment Plan and an NDC Project Pipeline. They were requested by the Ministry of Economy
83 Pacific PAC06
Kiribati NDC Implementation Roadmap, NDC Investment Plan and NDC Project Pipeline: As part of GGGI activities in the Pacific NDC Hub, three outputs informed the development of Kiribati’s green growth policies: an NDC Implementation Roadmap, an NDC Investment Plan and an NDC Project Pipeline. They were requested by the Climate Change Unit of the Officer of the President.
84 Pacific PAC06
Tonga: Review of the 2015 Tonga NDC and recommendations for the 2020 NDC: GGGI prepared the Review of Tonga’s 2015 INDC and recommendations for the 2020 NDC. It was part of GGGI’s activities in the Pacific NDC Hub. This report addresses the progress made towards existing goals and targets for both the mitigation and adaptation components of Tonga’s 2015 INDC along with the parameters of identifying the extent to which targets have been achieved, the status of implementation and how the targets and measures are communicated, with a focus on data gaps and inconsistencies.
85 PNG PG07 CRGG mainstreaming scoping reports for Enga, Milne Bay, and New Ireland provinces completed.
86 PNG PG07 CRGG Assessments for Enga, Milne Bay, and New Ireland provinces completed.
87 PNG PG07 Preliminary Gender assessment report for PNG CRGG project completed.
88 PNG PG07 Assessment to identify salient barriers to financing CRGG activities in PNG completed.
89 PNG PG1 No Objection Procedure for GCF Projects completed for the Government of PNG.
90 PNG PG1 GCF Country Program developed for the Government of PNG.
91 PNG PG1 Private sector feasibility study and forum delivered to inform investments, especially for GCF projects.
92 PNG PG1 Gender Guideline for GCF projects to assist with project identification and development finalized.
93 PNG PG1 GCF Project Preparation Manual completed for the Government of PNG.
94 PNG PG08 PNG's enhanced NDC.
95 Peru PE09
Analysis of implementation conditions for Agroforestry Concessions in the San Martin region. This is a diagnostic document that explains the findings of GGGI and its partners on the enabling conditions for the implementation of agroforestry concessions in the region, considering different criteria: institutional will, geographic priorities, incentives, alignment of public plans, budget, personnel, and regulations.
96 Peru PE09
Recommendations on the San Martin Regional Government Competitivity Plan. GGGI and its partners produced a set of recommendations to properly include goals and actions that the regional government needs to work on to implement agroforestry concessions.
97 Philippines PH13
Guidelines for the adoption of the shared service facilities greening hotspot indicators developed and submitted to the Department of Trade and Industries (DTI).
98 Rwanda RW07 Revised master plans for three secondary cities validated and expected to be adopted soon by the respective district council.
99 Rwanda RW07 Mapping of Public Spaces in Kigali - Towards City-Wide Public Space Strategy.
100 Rwanda RW15 GGGI conducted a technical study on charging infrastructure for Kigali e-buses.
101 Rwanda RW20 Green Urban Neighborhood Planning guidelines developed.
102 Rwanda RW20 Assessment on understanding the needs of women working at markets in Musanze.
103 Rwanda RW22 Rapid Building Performance Assessment Walkthrough audits of four public buildings conducted and two reports developed.

110 | P a g e
104 Senegal SN08
Landscape Analysis for understanding the key measures to be undertaken by the country to scale up the installation of solar PV technology for agricultural development submitted to the GoS.
105 UAE AE07
Framework for adaptation actions developed in the following sectors: health, energy, infrastructure, environment, and insurance, ultimately to inform the NDC update review of the UAE; also, with an emphasis on the insurance industry, to capture actions related to the integration of climate risks assessed in the local industry.
106 UAE AE08
National Air Quality Strategy in compliance with the Cabinet memo requirements, covering the four focus areas of air pollution (outdoor pollution, indoor pollution, noise pollution, and odor) as per the conditions and requirements of the UAE Cabinet. It is expected to contribute to improved national and local policies on air quality monitoring, mitigation, and management, which will bring about concrete and well-targeted actions toward better management of air pollution and its health, socioeconomic, and environmental impacts. In the long term, these efforts will contribute to the transition toward a greener and more sustainable development pathway through enhanced air quality and its positive impacts on public health and well-being, the environment, and the economy.
107 UAE AE09
Sustainable Finance Framework, a contribution to the UAE’s strengthened policy and institutional capacity to define and guide sustainable/green finance sector, which will encourage the private sector’s participation in the green project development and implementation based on an improved enabling environment, and thus will promote a green economy in the UAE and the region.
108 UAE AE11
Updated Green Agenda policy document, consisting of the assessment of the effectiveness of Green Agenda initiatives to identify high-impact projects and address implementation gaps going forward. The project will entail comprehensive stocktaking of relevant Green Agenda programs and projects at the federal and emirate level, based on which a robust monitoring and evaluation (M&E) mechanism will be developed to track progress. This also includes a significant and strategic component on circular economy to engage the private sector.
109 Uganda UG4 Energy Policy
110 Uganda UG4 National Development Plan (NDP III)
111 Uganda UG4 District Development Plan (Gulu), District Development Plan (Mbarara)
112 Uganda UG4 Strategy and Workplan for Uganda Solar Energy Association
113 Uganda UG4 District Development Plan (Gulu)
114 Uganda UG13
Governance and Coordination Mechanism for the Inter-Ministerial Steering Committee (ISC) responsible for processing all Climate Finance Projects were prepared to strengthen the coordination of climate finance resource mobilization within the Country’s planning and budgeting frameworks. The ISC plays an advisory role to the National Designated Authority which also doubles as the Institution responsible for Financial Policy & Climate Finance mobilization in the existing Public Finance Management regime and the proposed Climate Change Bill.
115 Vanuatu TO02
Review of the TERM 2010-2020: Working with Tonga’s Department of Energy, GGGI provided technical advisory support to review Tonga’s Energy Roadmap 2010-2020. The review focused on supply and storage, renewable energy and energy efficiency progress over the past 10 years and included the development of recommendations for the new Tonga Energy Roadmap 2021-2035 (TERM Plus), which GGGI is also supporting.
116 Vanuatu TO02
TERM-PLUS 2021-2035 Framework: Working with Tonga’s Department of Energy and through a stakeholder workshop, targets for the 2021-2035 TERM-PLUS were agreed and a Framework document was developed laying out the targets, measures, requirement and general guidance for the development of the TERM-PLUS. The Framework includes guidance for the TERM-PLUS development in gender and climate adaptation and resilience for the energy sector.

111 | P a g e
117 Vanuatu VU3
National Guidelines for Rural Solar Powered Water Systems: These guidelines support the uptake of RE in the country for water pumping in line with the NERM, though technical recommendations adapted to the country context.
118 Vanuatu VU3
Financial Sustainability Study for SWP systems in rural areas: This study developed different innovative business models for the SPWS (Solar Powered Water Systems) adapted to the size and type of system and different local community settings, in order to ensure financial sustainability. After a deep analysis, it also proposed a way forward to develop a replication mechanism for the wider uptake of SPWS all over the country.
119 Tonga TO01
Tonga’s Enhanced NDC: Working with Tonga’s Department of Climate Change, GGGI provided technical advisory support to draft an enhanced version of Tonga’s Nationally Determined Contribution. The Enhanced NDC was adopted by Tonga’s Cabinet and submitted to UNFCCC. In addition, to strengthening and communicated Tonga’s emissions reduction ambitions to the global community, the Enhanced NDC will also contribute to the development of Tonga’s Long-Term Low Emissions Development Strategy (LEDS), which GGGI is also supporting.
Total 119

112 | P a g e
ANNEX 4: ADOPTED GREEN GROWTH POLICIES
No Country Program
Project Code Outcome Description
1 Burkina Faso BF06
The Environmental and Social Performance Standards was developed to guide the environmental and social performance of the Environment Intervention Fund (FIE) in Burkina Faso. These performance standards aim to ensure that FIE’s operations and investments comply with the laws and regulations of the country and the development partners.
2 Burkina Faso BF06
The Environmental and Social Management System (ESMS) of the Environmental Intervention Fund (FIE) is a tool to ensure the application of policy and procedures for the management of environmental and social aspects, including gender in its projects and program. It sets out the procedures to be followed by staff and project applicants.
3 Burkina Faso BF06
FIE’s Environmental and Social Policy: This policy describes the principles and procedures to be followed during the preparation and implementation of measures indicated by the IEF to assess the environmental, social and gender impacts of projects submitted by individual promoters.
4 Burkina Faso BF06
FIE’s Gender Policy is committed to achieving fundamental changes that will contribute to the achievement of equality and equity between women and men and groups specific both in its operation and in the performance of its activities. Its implementation will contribute to the equal distribution of possibilities, resources and benefits among the different target groups of its intervention.
5 Cote d'Ivoire CI01
A national Climate finance strategy which defines the potential use of a combination of funding options from public resources, tariffs, and international cooperation, financing instruments such as loans, bonds, equity and others, private investment, and or the blending of financial instruments.
6 Cote d'Ivoire CI01 Alignment of Accredited Entity project pipeline development in alignment with Country Programs.
7 Cambodia KH12
Sanitation plan for Koh Tonsay, Rabbit Island in Kep City adopted into the MPWT’s Public Investment Plan 2020-2022 aiming for construction in 2022.
8 Cambodia KH12
Formal mechanism to issue fines for noncompliance with sub-decree 113 on the management of garbage in cities adopted and implemented in Battambang which is the first city in Cambodia with high potential for replication.
9 Cambodia KH12
Formal decentralization under sub-decree 113 of some tasks from Municipal to Sangkat (commune) level adopted and implemented in Battambang (first city in Cambodia with high potential for replication).
10 Cambodia KH12 Decentralized sanitation concept for Bavet city approved by MPWT.
11 Cambodia KH12 Financial model for waste collection and transport in Phnom Penh.
12 Cambodia KH15 Enhanced industrial NDC with targets and project pipeline submitted by the government to UNFCCC.
13 Caribbean CAR05
Grenada's Second Nationally Determined Contribution 2020. GGGI supported this work by establishing and coordinating a regular detailed and consistent communications framework for enhanced efficiency, transparency, and accountability, which allowed for a few NDC characterized by inclusiveness and meaningful engagement through a whole-of-society approach.
14 Colombia CO05 Meta (May 1)
15 Colombia CO05 Guaviare (July 15)
16 Colombia CO05 Antioquia (May 30)
17 Colombia CO05 Nariño (June 25)
18 Colombia CO05 Corpoamazonía´s Action Plan (June 4) by its director and the management board
19 Colombia CO05 Vista Hermosa (May 31)
20 Colombia CO05 La Macarena (July 2)

113 | P a g e
21 Colombia CO05 Barbacoas (June 2)
22 Colombia CO05 El Charco (June 10)
23 Colombia CO05 Remedios (May 31)
24 Colombia CO05 Conpes 4021 - Policy for Deforestation Control and Sustainable Forest Management (December 21
25 Colombia CO05 Colombia´s NDC Renewal (December 11)
26 Ethiopia ET09
A Road map for the Greening of industrial parks in Ethiopia was developed. The green industrial road map was adopted by the guidance and guidelines of the UNIDO industrial roadmap with the context of the country’s industrial development plan.
27 Indonesia ID1
Keputusan Kepala LAN Nomor 704/K.I/HKM.D2.2/2019 tentang Pedoman Penyelenggaraan Pelatihan Pertumbuhan Ekonomi Hijau.
28 Indonesia ID1 East Kalimantan Governor Regulation No. 43/2019 on the Annual Development Plan of East Kalimantan 2021 (retroactive decree).
29 Indonesia ID1 Five (5) policy briefs have been formally adopted and will be published by the Ministry of National Development Planning.
30 Indonesia ID1
Initial Government decision to include the East Kalimantan Jurisdictional Emission Reductions Program, (Forest Carbon Partnership Facility - Carbon Fund), under the carbon trading mechanism.
31 Indonesia ID1
MoEF’s Decree Letter (SK) No. 10756/MENLHK-KPHL/PKPHL/DAS.3/12/2019 on the Ratification of Long Term Forest Management Plan 2020-2029 of Forest Management Unit XXXII Kapuas Kahayan in Central Kalimantan (retroactive decree).
32 Indonesia ID1
MoEF’s Decree Letter (SK) No. 10757/MENLHK-KPHL/PKPHL/DAS.3/12/2019 on the Ratification of Long Term Forest Management Plan 2020-2029 of Forest Management Unit IV Kapuas Kahayan in Central Kalimantan (retroactive decree).
33 Indonesia ID1
7. MoEF’s Decree Letter (SK) No. 4439/MENLHK-KPHP/PKPHP/HPL.0/7/2020 on the Ratification of Long Term Forest Management Plan 2020-2029 of Forest Management Unit XV Kahayan Hulu in Central Kalimantan.
34 Indonesia ID1
MoEF’s Decree Letter (SK) No. 3818/ MENLHK-KPHP /PKPHP/HPL.0/6/2020 on the Ratification of Long Term Forest Management Plan 2020-2029 of Forest Management Unit XXIV Damai in East Kalimantan.
35 Indonesia ID1
Formal Letter from Ministry of Foreign Affairs No. 76975/Hf/11/2019/54, and (b) Formal Letter from Ministry of Finance No S-3/SJ.3/2020 to MoEF (both letters are retroactive).
36 Indonesia ID1
East Kalimantan Governor Regulation No. 69/2019 on the Electronic - Based Services for Complaint Aspiration (a legal basis for the implementation of free, prior and informed consent of East Kalimantan Jurisdictional Emission Reductions Program) (retroactive decree).
37 Indonesia ID1
MoU No: PKS.3/SETJEN/ROKLN/KLN.0/3/2020 between the MoEF and the provincial government of East Kalimantan on the Emission Reductions Program through REDD+ Jurisdictional Program in East Kalimantan.
38 Jordan JO05 National Action Plans on Green Growth (NAPGG, 2021-2025) adopted by Cabinet in 2020.
39 Kiribati KI02
Working with the Ministry of Environment, Lands and Agriculture Development (MELAD), GGGI supported the development of an Agricultural Strategy (KAS) as an Addendum to the Kiribati 20-year Vision, the country’s national development plan. The Kas addresses food security, livelihood, employment, climate change challenges, and gender gaps, and aligns the agriculture sector to the other key policy frameworks in the country, including the KV20, the Kiribati Development Plan, and the Kiribati Climate Change Policy. The Kiribati Agriculture Strategy was approved by Cabinet in March 2020 and officially launched by the Minister of MELAD in September 2020.
40 Lao PDR LA07 2020 Lao PDR Nationally Determined Contribution.
41 Mozambique MZ03 The GEAP update report is being used by the GOM in the planning of actions at the national level.
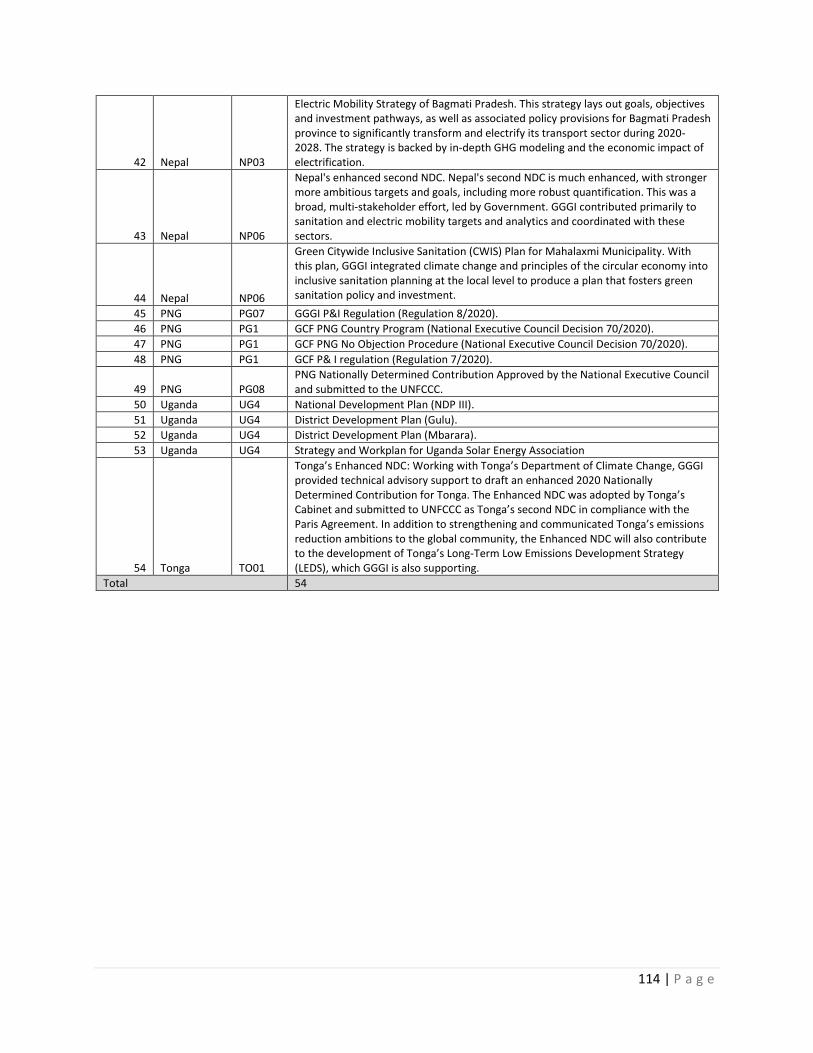
114 | P a g e
42 Nepal NP03
Electric Mobility Strategy of Bagmati Pradesh. This strategy lays out goals, objectives and investment pathways, as well as associated policy provisions for Bagmati Pradesh province to significantly transform and electrify its transport sector during 2020-2028. The strategy is backed by in-depth GHG modeling and the economic impact of electrification.
43 Nepal NP06
Nepal's enhanced second NDC. Nepal's second NDC is much enhanced, with stronger more ambitious targets and goals, including more robust quantification. This was a broad, multi-stakeholder effort, led by Government. GGGI contributed primarily to sanitation and electric mobility targets and analytics and coordinated with these sectors.
44 Nepal NP06
Green Citywide Inclusive Sanitation (CWIS) Plan for Mahalaxmi Municipality. With this plan, GGGI integrated climate change and principles of the circular economy into inclusive sanitation planning at the local level to produce a plan that fosters green sanitation policy and investment.
45 PNG PG07 GGGI P&I Regulation (Regulation 8/2020).
46 PNG PG1 GCF PNG Country Program (National Executive Council Decision 70/2020).
47 PNG PG1 GCF PNG No Objection Procedure (National Executive Council Decision 70/2020).
48 PNG PG1 GCF P& I regulation (Regulation 7/2020).
49 PNG PG08 PNG Nationally Determined Contribution Approved by the National Executive Council and submitted to the UNFCCC.
50 Uganda UG4 National Development Plan (NDP III).
51 Uganda UG4 District Development Plan (Gulu).
52 Uganda UG4 District Development Plan (Mbarara).
53 Uganda UG4 Strategy and Workplan for Uganda Solar Energy Association
54 Tonga TO01
Tonga’s Enhanced NDC: Working with Tonga’s Department of Climate Change, GGGI provided technical advisory support to draft an enhanced 2020 Nationally Determined Contribution for Tonga. The Enhanced NDC was adopted by Tonga’s Cabinet and submitted to UNFCCC as Tonga’s second NDC in compliance with the Paris Agreement. In addition to strengthening and communicated Tonga’s emissions reduction ambitions to the global community, the Enhanced NDC will also contribute to the development of Tonga’s Long-Term Low Emissions Development Strategy (LEDS), which GGGI is also supporting.
Total 54
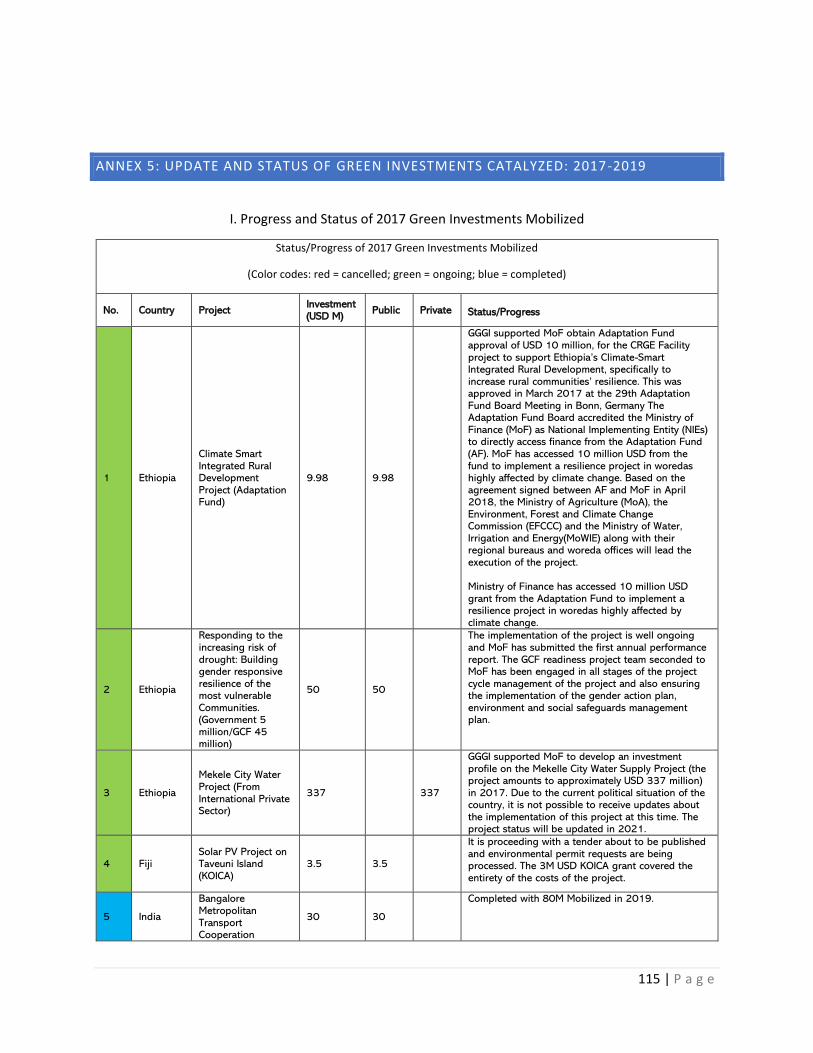
115 | P a g e
ANNEX 5: UPDATE AND STATUS OF GREEN INVESTMENTS CATALYZED: 2017-2019
I. Progress and Status of 2017 Green Investments Mobilized
Status/Progress of 2017 Green Investments Mobilized
(Color codes: red = cancelled; green = ongoing; blue = completed)
No. Country Project Investment (USD M)
Public Private Status/Progress
1 Ethiopia
Climate Smart Integrated Rural Development Project (Adaptation Fund)
9.98 9.98
GGGI supported MoF obtain Adaptation Fund approval of USD 10 million, for the CRGE Facility project to support Ethiopia’s Climate-Smart Integrated Rural Development, specifically to increase rural communities’ resilience. This was approved in March 2017 at the 29th Adaptation Fund Board Meeting in Bonn, Germany The Adaptation Fund Board accredited the Ministry of Finance (MoF) as National Implementing Entity (NIEs) to directly access finance from the Adaptation Fund (AF). MoF has accessed 10 million USD from the fund to implement a resilience project in woredas highly affected by climate change. Based on the agreement signed between AF and MoF in April 2018, the Ministry of Agriculture (MoA), the Environment, Forest and Climate Change Commission (EFCCC) and the Ministry of Water, Irrigation and Energy(MoWIE) along with their regional bureaus and woreda offices will lead the execution of the project. Ministry of Finance has accessed 10 million USD grant from the Adaptation Fund to implement a resilience project in woredas highly affected by climate change.
2 Ethiopia
Responding to the increasing risk of drought: Building gender responsive resilience of the most vulnerable Communities. (Government 5 million/GCF 45 million)
50 50
The implementation of the project is well ongoing and MoF has submitted the first annual performance report. The GCF readiness project team seconded to MoF has been engaged in all stages of the project cycle management of the project and also ensuring the implementation of the gender action plan, environment and social safeguards management plan.
3 Ethiopia
Mekele City Water Project (From International Private Sector)
337 337
GGGI supported MoF to develop an investment profile on the Mekelle City Water Supply Project (the project amounts to approximately USD 337 million) in 2017. Due to the current political situation of the country, it is not possible to receive updates about the implementation of this project at this time. The project status will be updated in 2021.
4 Fiji Solar PV Project on Taveuni Island (KOICA)
3.5 3.5
It is proceeding with a tender about to be published and environmental permit requests are being processed. The 3M USD KOICA grant covered the entirety of the costs of the project.
5 India
Bangalore Metropolitan Transport Cooperation
30 30
Completed with 80M Mobilized in 2019.
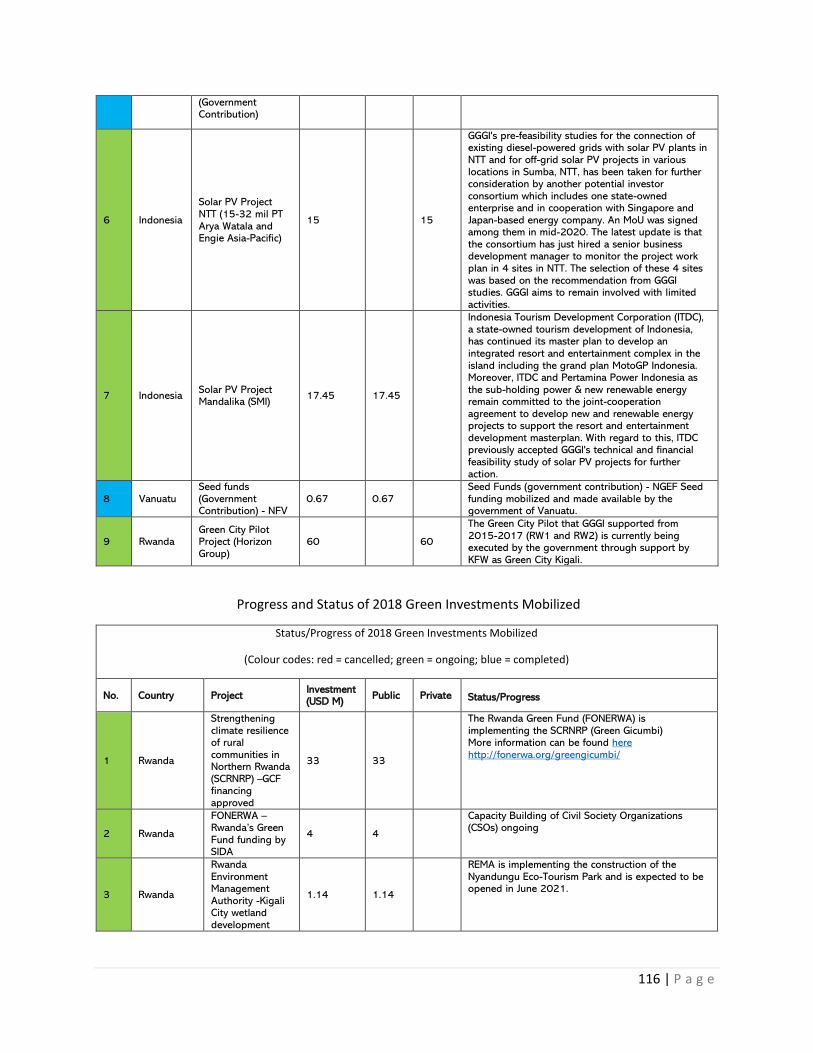
116 | P a g e
(Government Contribution)
6 Indonesia
Solar PV Project NTT (15-32 mil PT Arya Watala and Engie Asia-Pacific)
15 15
GGGI's pre-feasibility studies for the connection of existing diesel-powered grids with solar PV plants in NTT and for off-grid solar PV projects in various locations in Sumba, NTT, has been taken for further consideration by another potential investor consortium which includes one state-owned enterprise and in cooperation with Singapore and Japan-based energy company. An MoU was signed among them in mid-2020. The latest update is that the consortium has just hired a senior business development manager to monitor the project work plan in 4 sites in NTT. The selection of these 4 sites was based on the recommendation from GGGI studies. GGGI aims to remain involved with limited activities.
7 Indonesia Solar PV Project Mandalika (SMI)
17.45 17.45
Indonesia Tourism Development Corporation (ITDC), a state-owned tourism development of Indonesia, has continued its master plan to develop an integrated resort and entertainment complex in the island including the grand plan MotoGP Indonesia. Moreover, ITDC and Pertamina Power Indonesia as the sub-holding power & new renewable energy remain committed to the joint-cooperation agreement to develop new and renewable energy projects to support the resort and entertainment development masterplan. With regard to this, ITDC previously accepted GGGI's technical and financial feasibility study of solar PV projects for further action.
8 Vanuatu Seed funds (Government Contribution) - NFV
0.67 0.67 Seed Funds (government contribution) - NGEF Seed funding mobilized and made available by the government of Vanuatu.
9 Rwanda Green City Pilot Project (Horizon Group)
60 60
The Green City Pilot that GGGI supported from 2015-2017 (RW1 and RW2) is currently being executed by the government through support by KFW as Green City Kigali.
Progress and Status of 2018 Green Investments Mobilized
Status/Progress of 2018 Green Investments Mobilized
(Colour codes: red = cancelled; green = ongoing; blue = completed)
No. Country Project Investment (USD M)
Public Private Status/Progress
1 Rwanda
Strengthening climate resilience of rural communities in Northern Rwanda (SCRNRP) –GCF financing approved
33 33
The Rwanda Green Fund (FONERWA) is implementing the SCRNRP (Green Gicumbi) More information can be found here http://fonerwa.org/greengicumbi/
2 Rwanda
FONERWA –Rwanda’s Green Fund funding by SIDA
4 4
Capacity Building of Civil Society Organizations (CSOs) ongoing
3 Rwanda
Rwanda Environment Management Authority -Kigali City wetland development
1.14 1.14
REMA is implementing the construction of the Nyandungu Eco-Tourism Park and is expected to be opened in June 2021.

117 | P a g e
4 Rwanda
Rwanda Environment Management Authority -government funding
0.6 0.6
Concept Notes from the project currently developed into government guidelines for green neighborhood development. Other concept notes are developed as project preparatory or potential pipeline for financing.
5 Senegal
Rice husk waste to energy projects for 3 rice mills with installed capacity of 1.5 MW
5.4 5.4
Working on energy audits to recommend technologies and raise financing for 5 rice mills. Project size adjusted to 1.72M.
6 Mozambique
Solar Irrigation Systems for 150 Farms in Manica Province
13.52 13.52
GGGI received a letter from FUNAE stating their satisfaction and mentioning the level of investment. In 2020, the same study was done by GIS in Manica to shape and further source similar work in the neighboring Zambezia province. Enabel (Belgian Cooperation) is now funding our new study there which is to finish on May 31, 2021. Enabel (together with other development partners) are looking to make further investments in Solar irrigation in both Manica and Zambezia provinces.
7 Ethiopia CRGE Facility –EU, DFID, DANIDA
67.99 67.99
GGGI has support MoF accreditation upgrading from small to medium scale i.e from 50 million to 250 million USD. MoF in collaboration with GGGI has commissioned consultancy assignments for undertaking terminal evaluation of the Fast-track Projects as part of the accreditation process.
8 Thailand
First SME-only National Energy Efficiency Program Target at Replacing Lighting, Motors and Variable Speed Drives
20 20
Thai Auto Parts Supply Chain Development through Energy Efficiency (TAPEE) program. 2018 reported USD20mn investment commitment from India-based Energy Efficiency Services Limited (EESL) to Thailand's Provincial Electricity Authority (PEA). PEA/EESL partnership is not moving, and parties are not actively advancing on the TAPEE investment opportunity in the auto-parts segment. More than 24 months after signing the tentative investment letter, no real investment commitments were activated by EESL.
9 Thailand
Cotco Metal Works will fund energy efficiency projects in the SME
1.23 1.23
1.85M mobilized and completed
10 Vanuatu
Vanuatu Outer Island Solar Power Project funded by Luxemburg
1.79 1.79
2018: 1.79M Vanuatu Outer Island Solar Power
Project funded by Luxemburg. (VU3) - Ongoing
Implementation.
11 Vanuatu
National Green Energy Fund –financing the energy component of MFSL's $100 million Green Affordable Housing Scheme
15 15
15M National Green Energy Fund – Financing energy
component of MFSL’s 100M green affordable
housing scheme. (VU1) - Project never started and
funding was never secured after MFSL was not able
to secure main funding for the Project.
12 Vanuatu
National Green Energy Fund -contribution by the Government
0.28 0.28
There is currently strong financial backing from the
government towards NGEF, as the national financing
vehicle for RE, EE, and electricity access investments
in Vanuatu, to achieving National Energy Road Map
and Vanuatu NDC targets. Consequently, the
government is committed to contributing up to
VT500m (USD4.3M) towards NGEF over a 5-year
period, out of which USD 1M has already been paid
into NGEF in 2019 and 2020. A further USD 903K

118 | P a g e
has been approved and will be allocated in 2021
from the government budget towards NGEF. NGEF
has since utilized part of this funding on pilot investments, plus commenced actual investments in
the second quarter of 2020. NGEF also plans to use
part of domestic funding to leverage external
funding.
13 Mongolia Mongolia Green Finance Corporation
10 5 5
MGFC will be the first NFV developed by GGGI, the
first green bank funded by GCF, and the first PPP
initiative for a financial sector in Mongolia.
14 Mongolia
Ulaanbaatar City construction of a city green kindergarten
0.6 0.6
GGGI work on the green kindergarten project raised
USD 766,308.98 from ADB and will be constructed
in 2020.
15 Colombia
Joint Declaration of Intent on Deforestation -funding by Norway
250 250
This effort evolved in the renewed Joint Declaration
of Intent that Colombia signed with Norway, UK and
Germany on December 11, 2019. In that
partnership, the donor countries stand ready to
support Colombia's results in terms of reducing
deforestation and promote sustainable development
with payment of a total amount of up to USD 366
million until 2025.
Of this amount, up to USD 51 million will be
payments against the achievement of milestones,
USD 55 million will be supported to aligned projects
towards the achievement of the Colombian
objectives (modality 1), and up to USD 260 million
will be payments for achieved emission reductions
(modality 2).
In March 2021, GGGI Colombia was requested by
Norway to review the first progress report of the
renewed JID as part of the support provided under
the Green Growth Program Phase II. Based on the
approved progress report, Colombia will receive the
initial resources under modality 1 linked with the
achieved policy milestones.
16 Guyana
Distributed Solar PV Program, 14MW -LOI signed by Farfan & Mendes Group, SOVENTIX and GGGI in October 2018
18 18
Actual funds mobilized and made available. USSEP
distributed generation total pipeline for a value of
USD 18 million. Currently, the leasing has secured
USD 5 million to invest in Guyana.
Project value USD18 million, currently the leasing
company has secured USD 5 million to invest in
2020-2021.
17 Mexico
Sonora State Green Bond to implement the Sonora Green Growth Strategy and finance the first stage of BRT development
25 25
After expressing initial interest and accepting GGGI's green bond framework (delivered in 2018), the Sonora State Treasurer considered in 2019 that conditions were not favorable for issuance of green bonds. In the letter enclosed the Treasurer also hopes that in the near future Sonora could improve its debt ceiling (which ultimately affects the state's financial standing, in accordance with the Fiscal Discipline Law) and resume this initiative. Ultimately, the Sonora State decided the conditions were not favorable for the current administration for the issuance of the green bond. There are elections in 2021 and a new administration will take over. GGGI will follow up with the new administration in due course.
18 Lao PDR Laos Solid Waste and Wastewater Management
2.3 2.3 KOICA approved in January 2019 which included an investment of USD 2.3 million to develop a waste collection system in Vientiane and wastewater
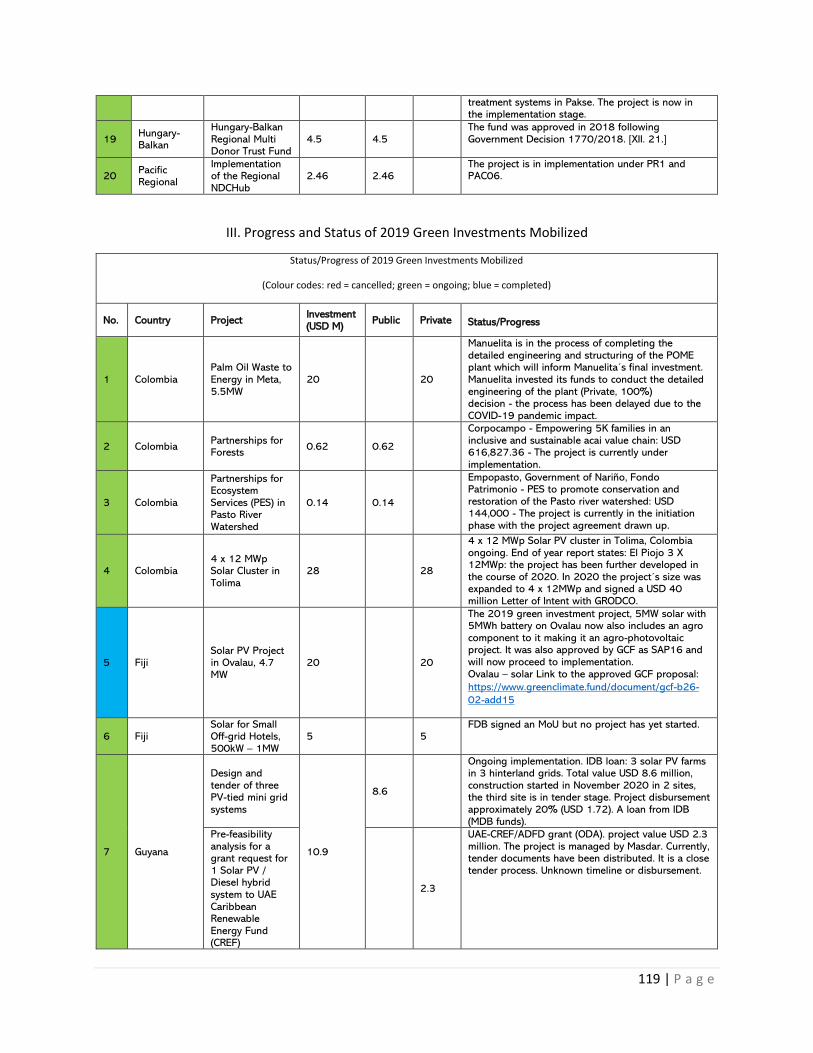
119 | P a g e
treatment systems in Pakse. The project is now in the implementation stage.
19 Hungary-Balkan
Hungary-Balkan Regional Multi Donor Trust Fund
4.5 4.5 The fund was approved in 2018 following Government Decision 1770/2018. [XII. 21.]
20 Pacific Regional
Implementation of the Regional NDCHub
2.46 2.46 The project is in implementation under PR1 and PAC06.
III. Progress and Status of 2019 Green Investments Mobilized
Status/Progress of 2019 Green Investments Mobilized
(Colour codes: red = cancelled; green = ongoing; blue = completed)
No. Country Project Investment (USD M)
Public Private Status/Progress
1 Colombia Palm Oil Waste to Energy in Meta, 5.5MW
20 20
Manuelita is in the process of completing the detailed engineering and structuring of the POME plant which will inform Manuelita´s final investment. Manuelita invested its funds to conduct the detailed engineering of the plant (Private, 100%) decision - the process has been delayed due to the COVID-19 pandemic impact.
2 Colombia Partnerships for Forests
0.62 0.62
Corpocampo - Empowering 5K families in an inclusive and sustainable acai value chain: USD 616,827.36 - The project is currently under implementation.
3 Colombia
Partnerships for Ecosystem Services (PES) in Pasto River Watershed
0.14 0.14
Empopasto, Government of Nariño, Fondo Patrimonio - PES to promote conservation and restoration of the Pasto river watershed: USD 144,000 - The project is currently in the initiation phase with the project agreement drawn up.
4 Colombia 4 x 12 MWp Solar Cluster in Tolima
28 28
4 x 12 MWp Solar PV cluster in Tolima, Colombia ongoing. End of year report states: El Piojo 3 X 12MWp: the project has been further developed in the course of 2020. In 2020 the project´s size was expanded to 4 x 12MWp and signed a USD 40 million Letter of Intent with GRODCO.
5 Fiji Solar PV Project in Ovalau, 4.7 MW
20 20
The 2019 green investment project, 5MW solar with 5MWh battery on Ovalau now also includes an agro component to it making it an agro-photovoltaic project. It was also approved by GCF as SAP16 and will now proceed to implementation. Ovalau – solar Link to the approved GCF proposal:
https://www.greenclimate.fund/document/gcf-b26-
02-add15
6 Fiji Solar for Small Off-grid Hotels, 500kW – 1MW
5 5 FDB signed an MoU but no project has yet started.
7 Guyana
Design and tender of three PV-tied mini grid systems
10.9
8.6
Ongoing implementation. IDB loan: 3 solar PV farms in 3 hinterland grids. Total value USD 8.6 million, construction started in November 2020 in 2 sites, the third site is in tender stage. Project disbursement approximately 20% (USD 1.72). A loan from IDB (MDB funds).
Pre-feasibility analysis for a grant request for 1 Solar PV / Diesel hybrid system to UAE Caribbean Renewable Energy Fund (CREF)
2.3
UAE-CREF/ADFD grant (ODA). project value USD 2.3 million. The project is managed by Masdar. Currently, tender documents have been distributed. It is a close tender process. Unknown timeline or disbursement.
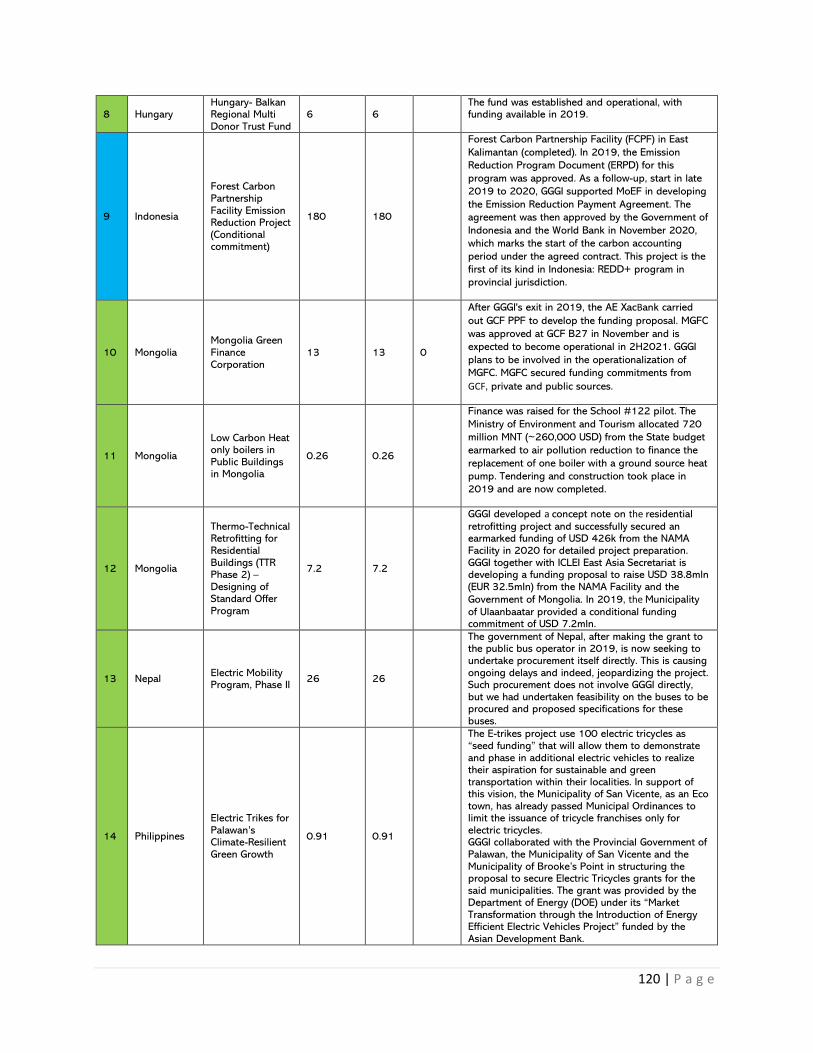
120 | P a g e
8 Hungary Hungary- Balkan Regional Multi Donor Trust Fund
6 6 The fund was established and operational, with funding available in 2019.
9 Indonesia
Forest Carbon Partnership Facility Emission Reduction Project (Conditional commitment)
180 180
Forest Carbon Partnership Facility (FCPF) in East
Kalimantan (completed). In 2019, the Emission
Reduction Program Document (ERPD) for this
program was approved. As a follow-up, start in late
2019 to 2020, GGGI supported MoEF in developing
the Emission Reduction Payment Agreement. The
agreement was then approved by the Government of
Indonesia and the World Bank in November 2020,
which marks the start of the carbon accounting
period under the agreed contract. This project is the
first of its kind in Indonesia: REDD+ program in
provincial jurisdiction.
10 Mongolia Mongolia Green Finance Corporation
13 13 0
After GGGI's exit in 2019, the AE XacBank carried
out GCF PPF to develop the funding proposal. MGFC
was approved at GCF B27 in November and is
expected to become operational in 2H2021. GGGI
plans to be involved in the operationalization of
MGFC. MGFC secured funding commitments from
GCF, private and public sources.
11 Mongolia
Low Carbon Heat only boilers in Public Buildings in Mongolia
0.26 0.26
Finance was raised for the School #122 pilot. The
Ministry of Environment and Tourism allocated 720
million MNT (~260,000 USD) from the State budget
earmarked to air pollution reduction to finance the
replacement of one boiler with a ground source heat
pump. Tendering and construction took place in
2019 and are now completed.
12 Mongolia
Thermo-Technical Retrofitting for Residential Buildings (TTR Phase 2) – Designing of Standard Offer Program
7.2 7.2
GGGI developed a concept note on the residential
retrofitting project and successfully secured an earmarked funding of USD 426k from the NAMA Facility in 2020 for detailed project preparation. GGGI together with ICLEI East Asia Secretariat is developing a funding proposal to raise USD 38.8mln (EUR 32.5mln) from the NAMA Facility and the
Government of Mongolia. In 2019, the Municipality
of Ulaanbaatar provided a conditional funding commitment of USD 7.2mln.
13 Nepal Electric Mobility Program, Phase II
26 26
The government of Nepal, after making the grant to the public bus operator in 2019, is now seeking to undertake procurement itself directly. This is causing ongoing delays and indeed, jeopardizing the project. Such procurement does not involve GGGI directly, but we had undertaken feasibility on the buses to be procured and proposed specifications for these buses.
14 Philippines
Electric Trikes for Palawan’s Climate-Resilient Green Growth
0.91 0.91
The E-trikes project use 100 electric tricycles as “seed funding” that will allow them to demonstrate and phase in additional electric vehicles to realize their aspiration for sustainable and green transportation within their localities. In support of this vision, the Municipality of San Vicente, as an Eco town, has already passed Municipal Ordinances to limit the issuance of tricycle franchises only for electric tricycles. GGGI collaborated with the Provincial Government of Palawan, the Municipality of San Vicente and the Municipality of Brooke’s Point in structuring the proposal to secure Electric Tricycles grants for the said municipalities. The grant was provided by the Department of Energy (DOE) under its “Market Transformation through the Introduction of Energy Efficient Electric Vehicles Project” funded by the Asian Development Bank.
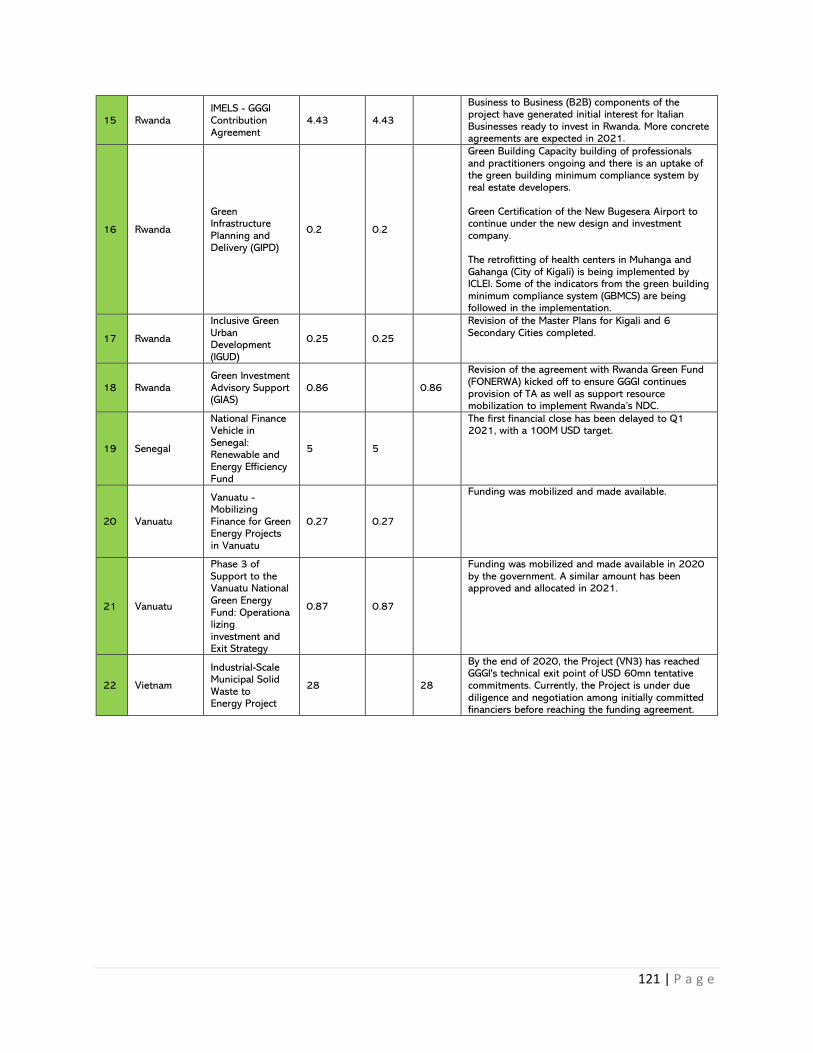
121 | P a g e
15 Rwanda IMELS - GGGI Contribution Agreement
4.43 4.43
Business to Business (B2B) components of the project have generated initial interest for Italian Businesses ready to invest in Rwanda. More concrete agreements are expected in 2021.
16 Rwanda
Green Infrastructure Planning and Delivery (GIPD)
0.2 0.2
Green Building Capacity building of professionals and practitioners ongoing and there is an uptake of the green building minimum compliance system by real estate developers. Green Certification of the New Bugesera Airport to continue under the new design and investment company. The retrofitting of health centers in Muhanga and Gahanga (City of Kigali) is being implemented by ICLEI. Some of the indicators from the green building minimum compliance system (GBMCS) are being followed in the implementation.
17 Rwanda
Inclusive Green Urban Development (IGUD)
0.25 0.25
Revision of the Master Plans for Kigali and 6 Secondary Cities completed.
18 Rwanda Green Investment Advisory Support (GIAS)
0.86 0.86
Revision of the agreement with Rwanda Green Fund (FONERWA) kicked off to ensure GGGI continues provision of TA as well as support resource mobilization to implement Rwanda’s NDC.
19 Senegal
National Finance Vehicle in Senegal: Renewable and Energy Efficiency Fund
5 5
The first financial close has been delayed to Q1 2021, with a 100M USD target.
20 Vanuatu
Vanuatu - Mobilizing Finance for Green Energy Projects in Vanuatu
0.27 0.27
Funding was mobilized and made available.
21 Vanuatu
Phase 3 of Support to the Vanuatu National Green Energy Fund: Operationalizing investment and Exit Strategy
0.87 0.87
Funding was mobilized and made available in 2020 by the government. A similar amount has been approved and allocated in 2021.
22 Vietnam
Industrial-Scale Municipal Solid Waste to Energy Project
28 28
By the end of 2020, the Project (VN3) has reached GGGI's technical exit point of USD 60mn tentative commitments. Currently, the Project is under due diligence and negotiation among initially committed financiers before reaching the funding agreement.
Related Documents