For Official Use EDU/EDPC/RD(2015)35 Organisation de Coopération et de Développement Économiques Organisation for Economic Co-operation and Development 09-Nov-2015 ___________________________________________________________________________________________ _____________ English - Or. English DIRECTORATE FOR EDUCATION AND SKILLS EDUCATION POLICY COMMITTEE MOVING TO OPPORTUNITY? IMMIGRANT STUDENTS AND THE CHALLENGES OF DIVERSITY 17-18 November 2015 The Education Policy Committee is invited to: DISCUSS the following questions that emerge from the paper “Moving to opportunity? Immigrant students and the challenges of diversity” • What can governments do in the short term to successfully integrate immigrants into the school system? • How can the skills of immigrants be recognised? • What have been your country’s social attitudes to migration? • What are countries’ most pressing current challenges in integrating migrant student into their education systems? • What are the key information and implementation gaps that countries are facing? • Would opportunities for working together on some aspects of integration be helpful? If so, what are likely to be the common issues of interest? Andreas Schleicher, Director for Education and Skills and Special Advisor on Education Policy to OECD's Secretary-General ([email protected]) JT03386005 Complete document available on OLIS in its original format This document and any map included herein are without prejudice to the status of or sovereignty over any territory, to the delimitation of international frontiers and boundaries and to the name of any territory, city or area. EDU/EDPC/RD(2015)35 For Official Use English - Or. English

Welcome message from author
This document is posted to help you gain knowledge. Please leave a comment to let me know what you think about it! Share it to your friends and learn new things together.
Transcript
For Official Use EDU/EDPC/RD(2015)35 Organisation de Coopération et de Développement Économiques Organisation for Economic Co-operation and Development 09-Nov-2015
___________________________________________________________________________________________
_____________ English - Or. English DIRECTORATE FOR EDUCATION AND SKILLS
EDUCATION POLICY COMMITTEE
MOVING TO OPPORTUNITY? IMMIGRANT STUDENTS AND THE CHALLENGES OF
DIVERSITY
17-18 November 2015
The Education Policy Committee is invited to:
DISCUSS the following questions that emerge from the paper “Moving to opportunity? Immigrant students and
the challenges of diversity”
• What can governments do in the short term to successfully integrate immigrants into the school system?
• How can the skills of immigrants be recognised?
• What have been your country’s social attitudes to migration?
• What are countries’ most pressing current challenges in integrating migrant student into their education
systems?
• What are the key information and implementation gaps that countries are facing?
• Would opportunities for working together on some aspects of integration be helpful? If so, what are
likely to be the common issues of interest?
Andreas Schleicher, Director for Education and Skills and Special Advisor on Education Policy to
OECD's Secretary-General ([email protected])
JT03386005
Complete document available on OLIS in its original format
This document and any map included herein are without prejudice to the status of or sovereignty over any territory, to the delimitation of
international frontiers and boundaries and to the name of any territory, city or area.
ED
U/E
DP
C/R
D(2
01
5)3
5
Fo
r Officia
l Use
En
glish
- Or. E
ng
lish
EDU/EDPC/RD(2015)35
2
TABLE OF CONTENTS
MOVING TO OPPORTUNITY? IMMIGRANT STUDENTS AND THE CHALLENGES OF
DIVERSITY .................................................................................................................................................... 3
IMMIGRANT STUDENTS AT SCHOOL: THE CHALLENGES OF INTEGRATION .............................. 4
A changing landscape .................................................................................................................................. 4 How immigrant students fare in host-country education systems ............................................................. 12
Academic performance .......................................................................................................................... 12 Sense of belonging at school .................................................................................................................. 21
Factors linked to the performance gap ....................................................................................................... 24 Concentration of disadvantage ............................................................................................................... 24 Language-related disadvantage .............................................................................................................. 27 Opportunity to learn, grade repetition and tracking ............................................................................... 40
Attitudes towards migrants and students’ social integration into their schools and communities ............. 47 Beyond socio-economic status: The role of aspirations ............................................................................. 57
POLICIES FOR THE SUCCESSFUL INTEGRATION AND EDUCATION OF MIGRANT STUDENTS63
Immediate policy responses ....................................................................................................................... 65 Providing sustained language support, within regular classrooms ......................................................... 65 Encouraging migrant children into high quality early childhood education as early as possible ........... 67 Building the capacity of all schools ....................................................................................................... 71
High impact, medium-term responses ....................................................................................................... 75 Avoiding the congregation of migrant students in disadvantaged schools ............................................ 75 Avoid ability grouping, early tracking and grade repetition .................................................................. 78 Helping parents to help their children .................................................................................................... 80
Strengthening integration efforts ............................................................................................................... 82 Targeting funding to “what works” ........................................................................................................ 82 Demonstrating the value of cultural diversity ........................................................................................ 84 Monitoring progress. .............................................................................................................................. 86
PROPOSAL FOR FUTURE WORK ON INTEGRATION OF CHILDREN OF IMMIGRANTS AND
REFUGEES ................................................................................................................................................... 87
Evidence-based empirical analysis ............................................................................................................ 88 Policy advice and implementation ............................................................................................................. 88
REFERENCES .............................................................................................................................................. 90
Boxes
Box 1. Definition of immigrant students in PISA ........................................................................................ 6 Box 2. The Assessment of Global Competence in PISA ........................................................................... 55
EDU/EDPC/RD(2015)35
3
MOVING TO OPPORTUNITY? IMMIGRANT STUDENTS AND THE CHALLENGES OF
DIVERSITY
1. This paper discusses the challenges and opportunities associated with integrating immigrants into
their host countries and the role education systems can play in ensuring the best possible outcomes for the
immigrant students and the communities that host them.
2. The first section of the paper presents evidence emerging from the analysis of PISA data up to
the 2012 cycle, data from the Survey of Adult Skills (PIAAC), the 2013 OECD Teaching and Learning
International Survey (TALIS), the International Civic and Citizenship Education Study and the European
Social Survey.
3. The second section summarises the policy lessons that the OECD formulated in the context of
the “OECD Reviews of Migrant Education” and uses material published in EDU/WKP(2009)1 to examine
ways in which education policies can help provide better educational opportunities for migrant student.
4. The third and last section concludes by detailing a proposal on the work the Directorate for
Education and Skills could conduct to provide countries with high-quality, evidence-based policy insights
that would enable their education systems to capitalise on international collaboration and best practices.
5. In the context of the current refugee crisis, the OECD considers it important for countries to do a
stock-taking exercise and see what lessons could be learned, given past efforts to gather data and review
policies and practices. This paper identifies several areas where more work would be warranted, given the
large and diverse influxes of migrants to OECD countries and how these changes interact with the
challenges that education systems have been facing since the economic crisis of 2008.
6. The Education Policy Committee is invited to:
DISCUSS the following questions that emerge from the paper “Moving to opportunity? Immigrant
students and the challenges of diversity”
What can governments do in the short term to successfully integrate immigrants into the
school system?
How can the skills of immigrants be recognised?
What have been your country’s social attitudes to migration?
What are countries’ most pressing current challenges in integrating migrant student into their
education systems?
What are the key information and implementation gaps that countries are facing?
Would opportunities for working together on some aspects of integration be helpful? If so, what
are likely to be the common issues of interest?
EDU/EDPC/RD(2015)35
4
IMMIGRANT STUDENTS AT SCHOOL: THE CHALLENGES OF INTEGRATION
A changing landscape
7. In 2015 Europe will record an unprecedented number of asylum seekers: as many as one million.
An estimated 350,000 to 450,000 people could be granted refugee or similar status, more than in any
previous European refugee crisis since World War II (OECD, 2015a). While the current migration crisis in
Europe is unprecedented in terms of the number of people involved, immigrant flows into Europe have
increased sharply throughout recent decades, except during the most recent economic crisis (OECD,
2015b; Castles and Miller, 2003).
8. The post-World War II years saw large movements of workers crossing borders to fill jobs for
which there were not enough domestic workers in many European countries. At the same time, the
traditional settlement countries of Australia, Canada, New Zealand and the United States resumed
admitting immigrants, a practice that had been interrupted by the two World Wars and the great
Depression. Workers arrived from across the globe, as the settlement countries abandoned former
restrictive policies, sometimes based on geographic origin. The oil crisis of the 1970s put a stop to labour
migration in many countries as economies adjusted to higher energy prices; but migration did not stop.
Many workers remained and brought over their families from abroad. Others fled their homelands in the
wake of civil wars and political persecution. The transfer of wealth turned the Gulf States into magnets for
workers moving across continents to take jobs in oil production, construction, commerce and domestic
help. More than a decade later, the fall of the Iron Curtain ushered in a new era of international migration,
as barriers to out-migration, if not to immigration, came down almost everywhere. In addition, economic
globalisation created needs and opportunities for workers, both skilled and less skilled, in new centres of
development, production and growth, such as Korea, Thailand, Malaysia, Singapore, China and India. At
the same time, most former OECD emigration countries, such as Italy and Spain, became immigration
countries, showing immigration rates (before the global economic crisis) that were, on average, as large as
those of traditional OECD immigration countries (OECD, 2013).
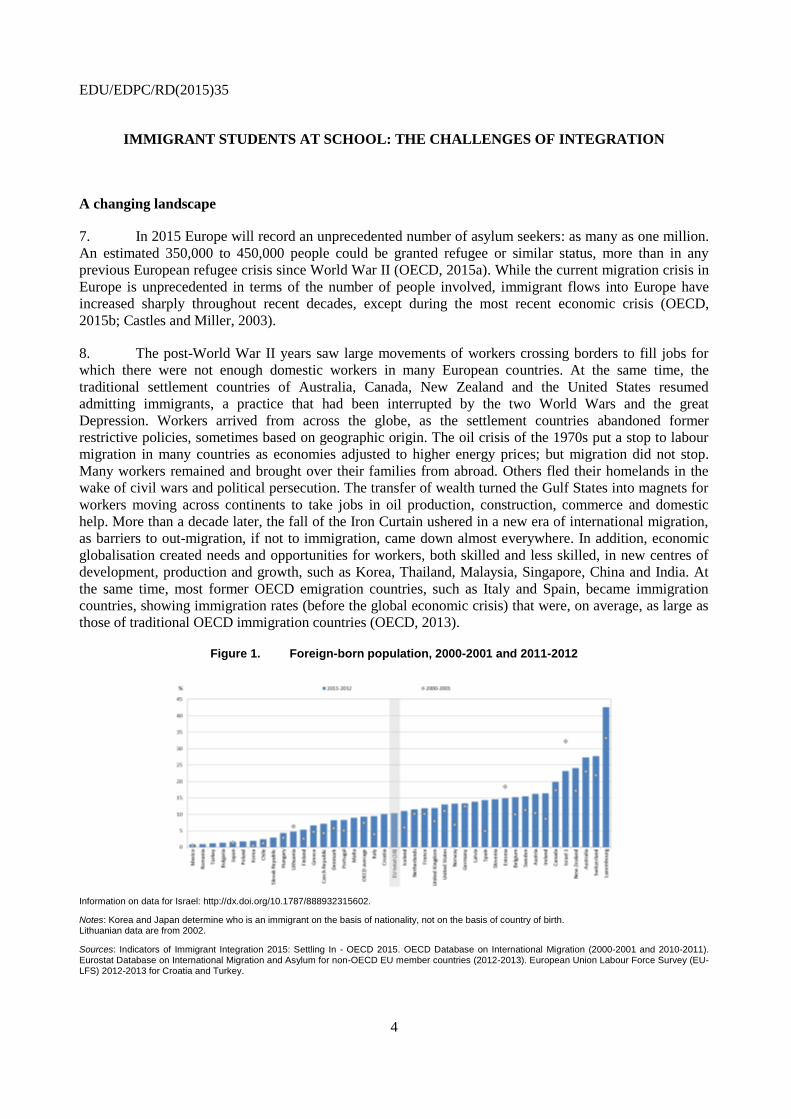
Figure 1. Foreign-born population, 2000-2001 and 2011-2012
Information on data for Israel: http://dx.doi.org/10.1787/888932315602.
Notes: Korea and Japan determine who is an immigrant on the basis of nationality, not on the basis of country of birth. Lithuanian data are from 2002.
Sources: Indicators of Immigrant Integration 2015: Settling In - OECD 2015. OECD Database on International Migration (2000-2001 and 2010-2011). Eurostat Database on International Migration and Asylum for non-OECD EU member countries (2012-2013). European Union Labour Force Survey (EU-LFS) 2012-2013 for Croatia and Turkey.
EDU/EDPC/RD(2015)35
5
9. Figure 1 shows that the share of the population who was foreign-born has been increasing over
the recent years. While the average increase between 2000 and 2012 was of two percentage points across
OECD countries, some countries like Spain and Luxembourg saw the percentage of their foreign-born
population going up by more than nine percentage points in a decade.
10. Perhaps even more noteworthy is the fact that immigrants have become much more diverse in
most countries. For example, immigrants from Turkey, Italy and Greece accounted for over 66% of the
low-educated, foreign-born people living in Germany in 1980 while the share of low-educated, foreign-
born residents in Germany from these three countries decreased to 52% in 2010 (Brücker et al. 2013).
Germany, Norway and Sweden were the countries of birth of 42% of the highly-educated immigrants to
Denmark in 1980 and this share had halved by 2010. In 2010, China was the second main source of highly-
educated immigrants to Canada, the third source to Australia and the fourth source to the United States and
New-Zealand. In 1980, China did not appear among the main source countries of skilled immigration to
any of those countries. These trends reveal major changes that are not only quantitative, but also
qualitative: the number of immigrants into many OECD countries is increasing and so is the diversity and
heterogeneity of immigrant groups. Increases in the quantity and diversity of immigrants will require also
the host communities to change, to develop new skills and competences to be able to develop new concepts
of identity, culture and citizenship. Policy responses will also be tested and have to become increasingly
tailor-made to effectively respond to the needs of diverse immigrant populations. However, increases in
diversity also open greater opportunities for host communities as the pool of talent that countries can draw
upon becomes larger and opportunities for cultural exchange strengthened (Alesina and La Ferrara, 2005)
Trends in the number and characteristics of immigrant students
11. Migration is profoundly changing the demand for the skills societies need to promote social
cohesion. It demands the capacity for adaptation among both people with no immigrant background and
immigrant populations. Education systems have a crucial role to play in developing these skills and more
should be done to ensure that they are equipped with the tools to do so.
12. Migration is also affecting the classroom, as teachers and educators adapt their practices to cater
to diverse student populations. In 2012, the latest PISA cycle for which data are available, 11% of 15-year-
old students had an immigrant background, on average across OECD countries. Around 6% of all
immigrants were second-generation migrants (meaning that they were born in the country where they sat
the PISA test to foreign-born parents), and 5% were first-generation migrants (meaning that both they and
their parents were born abroad) (Figure 2).
EDU/EDPC/RD(2015)35
6
Box 1. Definition of immigrant students in PISA
PISA distinguishes between four types of student immigration status:
First-generation immigrant students are the foreign-born students whose parents were also foreign
born
Second-generation immigrant students are the students who were born in the country of
assessment but whose parents are foreign born
Students with an immigrant background include both first- and second-generation immigrant
students.
Non-immigrant students are those without an immigrant background, sometimes referred to as native
students, who were born in the country of assessment or who had at least one parent born in that country.
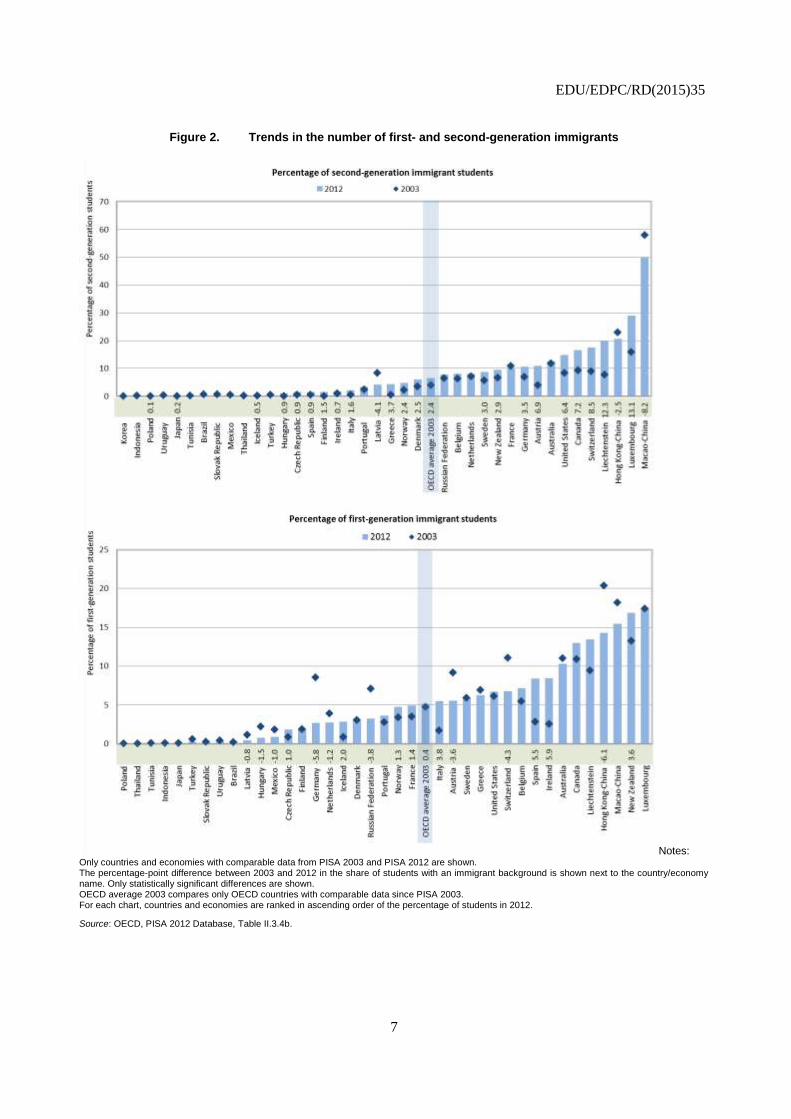
13. The number of students with an immigrant background varies considerably across countries and
economies. In Macao-China, Qatar and the United Arab Emirates, more than half of the student population
had an immigrant background, while in as many as 19 countries and economies, immigrants accounted for
less than 1% of all 15-year-old students. Despite the surge in migration over the past decades, the growth
in the number of foreign-born students has not affected all countries equally; many countries saw only
small increases in the number of immigrant students. Figure 2 shows that the share of 15-year-old students
who are first-generation immigrants grew by only around 0.4%, on average across OECD countries,
between 2003 and 2012. However, this share grew by as much as 6 percentage points in Ireland, 5.5
percentage points in Spain and 4 percentage points in Italy. In some small countries, like Austria,
Luxembourg and Switzerland, and in the more traditional immigration countries, like Canada and the
United States, changes in the profile of student populations were the result of growing numbers of second-
generation immigrants.
EDU/EDPC/RD(2015)35
7
Figure 2. Trends in the number of first- and second-generation immigrants
Notes: Only countries and economies with comparable data from PISA 2003 and PISA 2012 are shown. The percentage-point difference between 2003 and 2012 in the share of students with an immigrant background is shown next to the country/economy name. Only statistically significant differences are shown. OECD average 2003 compares only OECD countries with comparable data since PISA 2003. For each chart, countries and economies are ranked in ascending order of the percentage of students in 2012.
Source: OECD, PISA 2012 Database, Table II.3.4b.
EDU/EDPC/RD(2015)35
8
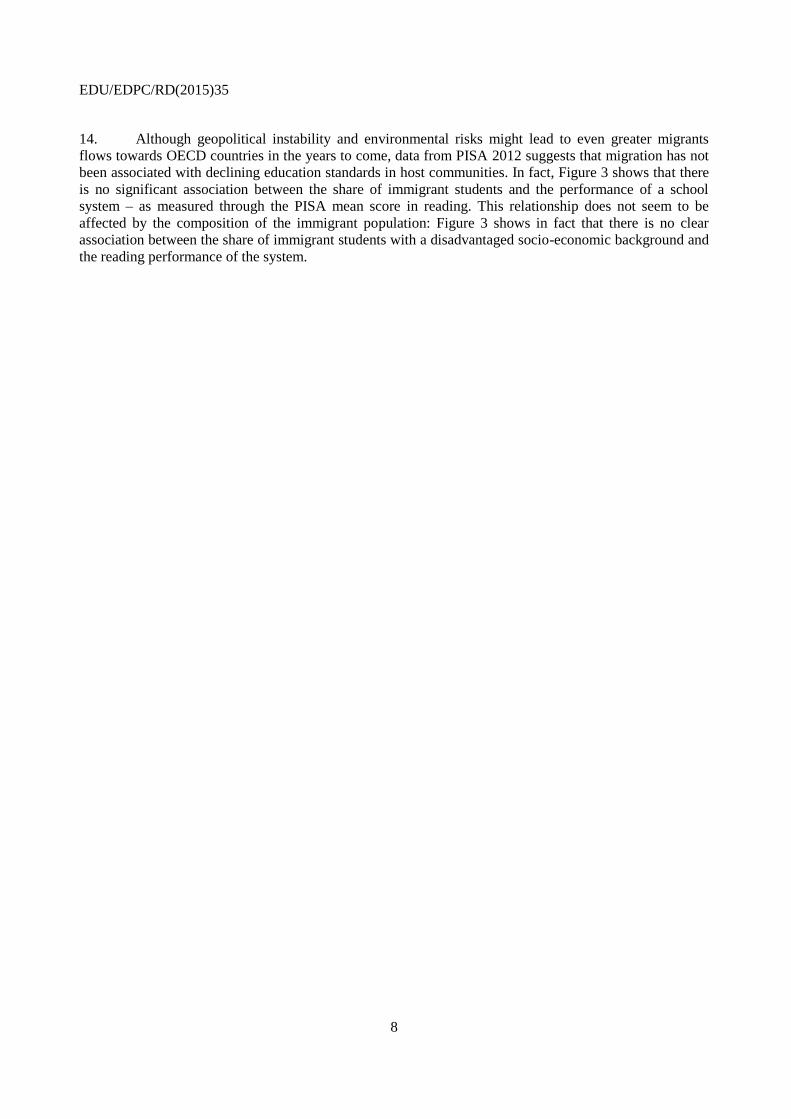
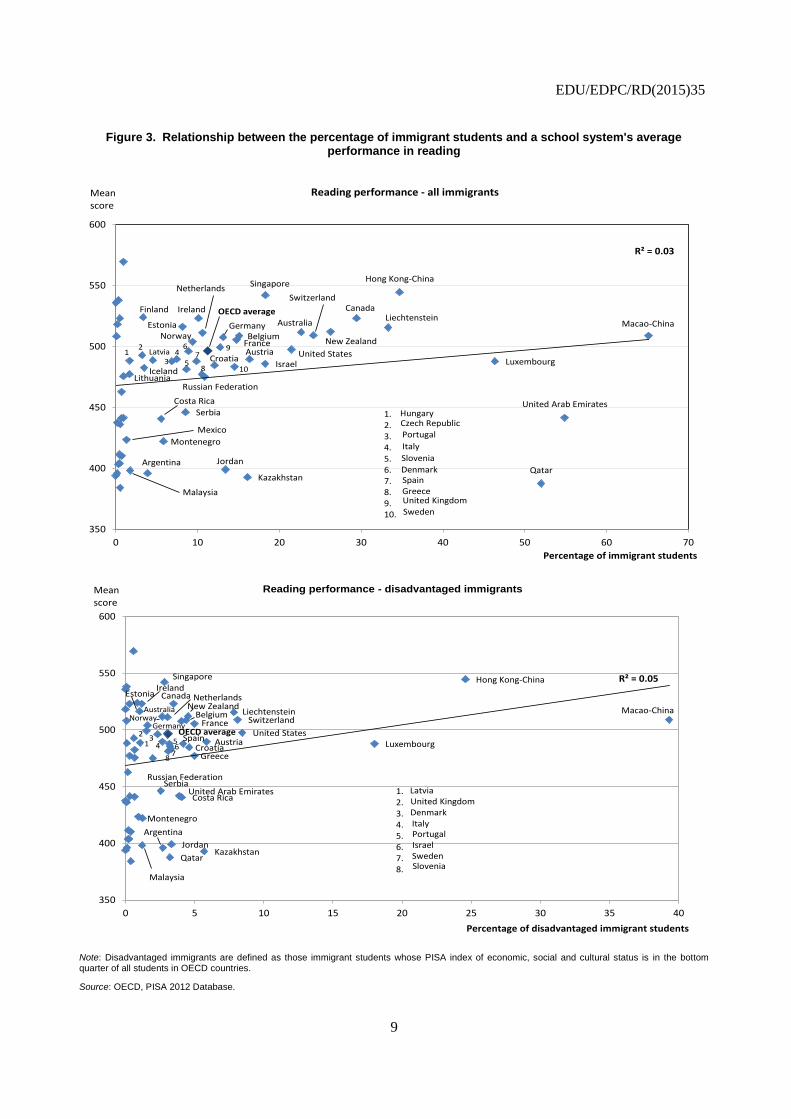
14. Although geopolitical instability and environmental risks might lead to even greater migrants
flows towards OECD countries in the years to come, data from PISA 2012 suggests that migration has not
been associated with declining education standards in host communities. In fact, Figure 3 shows that there
is no significant association between the share of immigrant students and the performance of a school
system – as measured through the PISA mean score in reading. This relationship does not seem to be
affected by the composition of the immigrant population: Figure 3 shows in fact that there is no clear
association between the share of immigrant students with a disadvantaged socio-economic background and
the reading performance of the system.
EDU/EDPC/RD(2015)35
9
Figure 3. Relationship between the percentage of immigrant students and a school system's average performance in reading
Note: Disadvantaged immigrants are defined as those immigrant students whose PISA index of economic, social and cultural status is in the bottom quarter of all students in OECD countries.
Source: OECD, PISA 2012 Database.
Australia
Austria
Belgium
Canada
Czech Republic
Denmark
Estonia
Finland
France
Germany
Greece
Hungary
Iceland
Ireland
Israel
Italy
Luxembourg
Mexico
Netherlands
New ZealandNorway
Portugal
Slovenia
Spain
Sweden
Switzerland
United Kingdom
United States
OECD average
Argentina
Costa Rica
Croatia
Hong Kong-China
Jordan
Kazakhstan
Latvia
Liechtenstein
Lithuania
Macao-China
Malaysia
Montenegro
Qatar
Russian Federation
Serbia
Singapore
United Arab Emirates
R² = 0.03
350
400
450
500
550
600
0 10 20 30 40 50 60 70
Percentage of immigrant students
Mean score
1.2.3.4.5.6.7.8.9.10.
12
34
5
6
8
9
10
7
Reading performance - all immigrants
Australia
Austria
Belgium
Canada
Denmark
Estonia
FranceGermany
Greece
Ireland
Israel
Italy
Luxembourg
NetherlandsNew Zealand
Norway
Portugal
Slovenia
Spain
Sweden
Switzerland
United Kingdom
United StatesOECD average
Argentina
Costa Rica
Croatia
Hong Kong-China
JordanKazakhstan
Latvia
Liechtenstein Macao-China
Malaysia
Montenegro
Qatar
Russian FederationSerbia
Singapore
United Arab Emirates
R² = 0.05
350
400
450
500
550
600
0 5 10 15 20 25 30 35 40
Percentage of disadvantaged immigrant students
Reading performance - disadvantaged immigrants
1.2.3.4.5.6.7.8.
17
8
Mean score
23
456
EDU/EDPC/RD(2015)35
10
15. The way in which education systems respond to migration has an enormous impact on whether or
not migrants are successfully integrated into their host communities and on the economic and social well-
being of all members of the communities they serve, whether they have an immigrant background or not.
Some education systems face more pressure than others, either because they need to integrate a larger
number of school-aged migrants or because the profile of the migrants make them particularly vulnerable –
for example, because their native language is very different from the language spoken in their host
community, or because they and their parents are socio-economically disadvantaged.
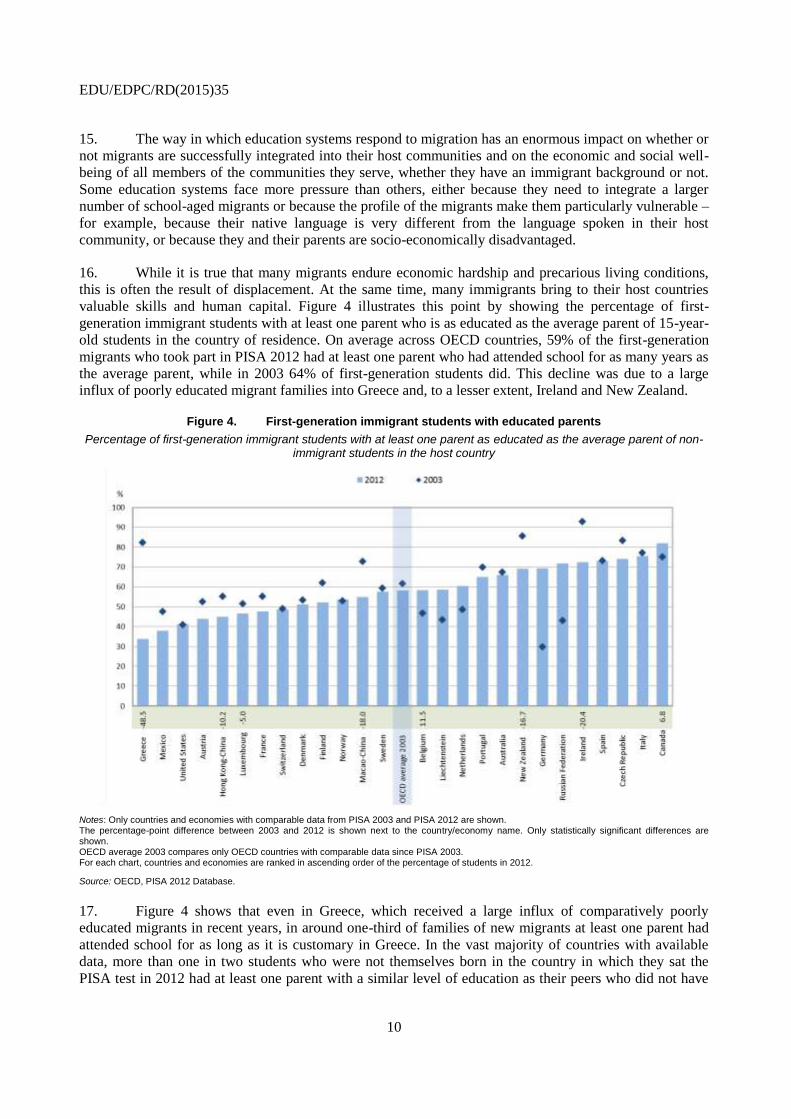
16. While it is true that many migrants endure economic hardship and precarious living conditions,
this is often the result of displacement. At the same time, many immigrants bring to their host countries
valuable skills and human capital. Figure 4 illustrates this point by showing the percentage of first-
generation immigrant students with at least one parent who is as educated as the average parent of 15-year-
old students in the country of residence. On average across OECD countries, 59% of the first-generation
migrants who took part in PISA 2012 had at least one parent who had attended school for as many years as
the average parent, while in 2003 64% of first-generation students did. This decline was due to a large
influx of poorly educated migrant families into Greece and, to a lesser extent, Ireland and New Zealand.
Figure 4. First-generation immigrant students with educated parents
Percentage of first-generation immigrant students with at least one parent as educated as the average parent of non-immigrant students in the host country
Notes: Only countries and economies with comparable data from PISA 2003 and PISA 2012 are shown. The percentage-point difference between 2003 and 2012 is shown next to the country/economy name. Only statistically significant differences are shown. OECD average 2003 compares only OECD countries with comparable data since PISA 2003. For each chart, countries and economies are ranked in ascending order of the percentage of students in 2012.
Source: OECD, PISA 2012 Database.
17. Figure 4 shows that even in Greece, which received a large influx of comparatively poorly
educated migrants in recent years, in around one-third of families of new migrants at least one parent had
attended school for as long as it is customary in Greece. In the vast majority of countries with available
data, more than one in two students who were not themselves born in the country in which they sat the
PISA test in 2012 had at least one parent with a similar level of education as their peers who did not have
EDU/EDPC/RD(2015)35
11
an immigrant background. While this reflects selective migration policies in countries like Australia and
Canada, it also reflects improvements in schooling in many of the countries of origin of migrants entering
OECD countries. These relatively high levels of education attainments among migrants are also a result of
the fact that high-skilled people tend to emigrate from poorer countries in greater numbers than the low-
skilled (Doquier and Rapoport, 2012).
18. Stalled rates of participation in post-secondary education programmes in countries such as Italy
and Spain are increasing the demand for a highly-qualified workforce in OECD countries. Even during the
height of the recent economic crisis, many employers lamented shortages of qualified workers in key
sectors of the economy. Many migrants can offer education and skills that host countries could better use
and reward (Sumption, 2013).
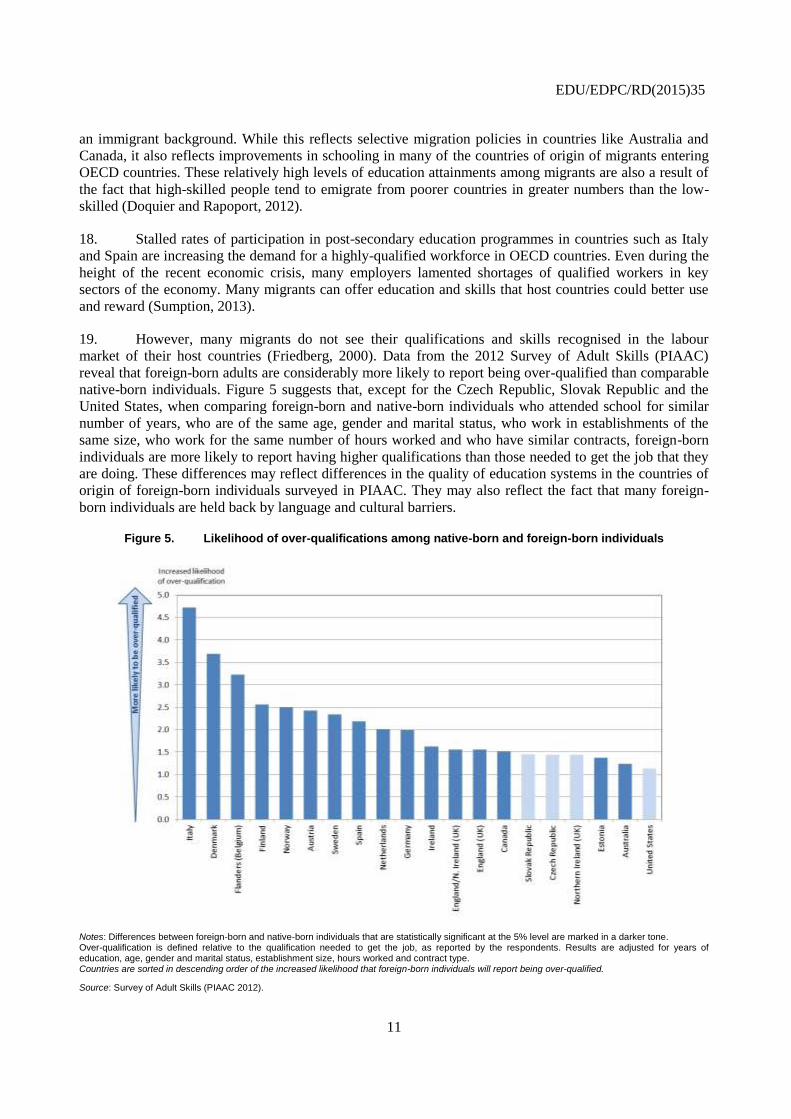
19. However, many migrants do not see their qualifications and skills recognised in the labour
market of their host countries (Friedberg, 2000). Data from the 2012 Survey of Adult Skills (PIAAC)
reveal that foreign-born adults are considerably more likely to report being over-qualified than comparable
native-born individuals. Figure 5 suggests that, except for the Czech Republic, Slovak Republic and the
United States, when comparing foreign-born and native-born individuals who attended school for similar
number of years, who are of the same age, gender and marital status, who work in establishments of the
same size, who work for the same number of hours worked and who have similar contracts, foreign-born
individuals are more likely to report having higher qualifications than those needed to get the job that they
are doing. These differences may reflect differences in the quality of education systems in the countries of
origin of foreign-born individuals surveyed in PIAAC. They may also reflect the fact that many foreign-
born individuals are held back by language and cultural barriers.
Figure 5. Likelihood of over-qualifications among native-born and foreign-born individuals
Notes: Differences between foreign-born and native-born individuals that are statistically significant at the 5% level are marked in a darker tone. Over-qualification is defined relative to the qualification needed to get the job, as reported by the respondents. Results are adjusted for years of education, age, gender and marital status, establishment size, hours worked and contract type. Countries are sorted in descending order of the increased likelihood that foreign-born individuals will report being over-qualified.
Source: Survey of Adult Skills (PIAAC 2012).
EDU/EDPC/RD(2015)35
12
20. Failure to be able to use productively the skills migrants bring, means that many migrants see no
return on the investments they made in acquiring skills. As a result, they must often accept low wages and
face spells of unemployment, both of which could have consequences for their children’s education. Host
communities also stand to lose, since they often support immigrants and their families financially, through
social welfare programmes. Migrants who are employed and using their skills productively could repay
any initial public investment in their integration and contribute to economic growth and development by
paying taxes, contributing to pension schemes, and participating in the local economy.
21. The variation across countries in performance differences between immigrant students and
students without an immigrant background, even after accounting for socio-economic status, suggests that
policy has an important role to play in reducing, if not eliminating entirely, the disadvantage that
accompanies displacement. But given the diversity of immigrant student populations across countries,
designing education policies to address those students’ specific needs – particularly that of language
instruction – is not an easy task; and education policy alone is unlikely to address all the factors related to
differences in performance between immigrant and non-immigrant students. For example, immigrant
students’ performance in PISA is more strongly (and negatively) associated with the concentration of
socio-economic disadvantage in schools than with the concentration of immigrants or of students who
speak a different language at home than the one in which they are taught at school. Reducing the
concentration of disadvantage in schools may require changes in other social policy, such as housing or
welfare, to encourage a more balanced social mix in schools.
22. The following sections examine in detail how immigrant students fare in different education
systems. The novelty of the approach taken in this report is that analyses are conducted examining both
achievement and non-achievement outcomes and use several different groups for comparison: non-
immigrant students who are enrolled in the same education system as immigrant students, socio-
economically disadvantaged non-immigrant students, previous cohorts of immigrant students in the same
education system, and immigrant students enrolled in a different education system. This approach is
necessary if the analyses are to provide specific pointers for education practitioners and policy makers as
they design and implement integration policies.
How immigrant students fare in host-country education systems
Academic performance
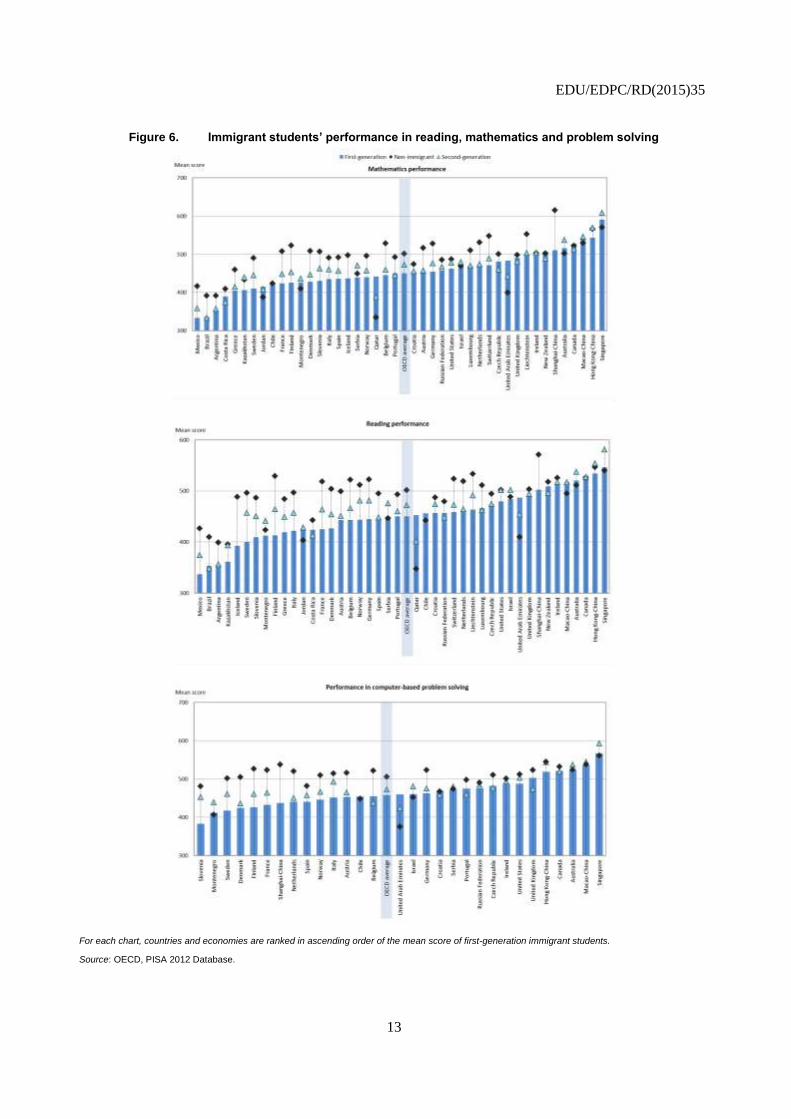
23. Figure 6 shows how immigrant students perform in reading, mathematics and problem solving in
different education systems. Because immigrants often speak a language at home that is different from the
language of the PISA assessment, it is important to consider differences in students’ ability to understand
and manipulate texts, solve mathematics problems, and solve problems that are formulated in simple
language and that require little knowledge of mathematics.
EDU/EDPC/RD(2015)35
13
Figure 6. Immigrant students’ performance in reading, mathematics and problem solving
For each chart, countries and economies are ranked in ascending order of the mean score of first-generation immigrant students.
Source: OECD, PISA 2012 Database.
EDU/EDPC/RD(2015)35
14
24. Results indicate that, in most countries, first-generation immigrant students perform worse than
students without an immigrant background, and second-generation immigrant students perform somewhere
between the two. Figure 6 also shows that although many migrants have lower relative performance when
compared to students without an immigrant background in their country, they can perform at very high
levels by international standards and that the performance gap between first-generation students and
students without an immigrant background tends to be wider in reading than in mathematics or problem
solving. This suggests that language barriers to text comprehension may be key in explaining the gap in
academic performance between these two groups of students.
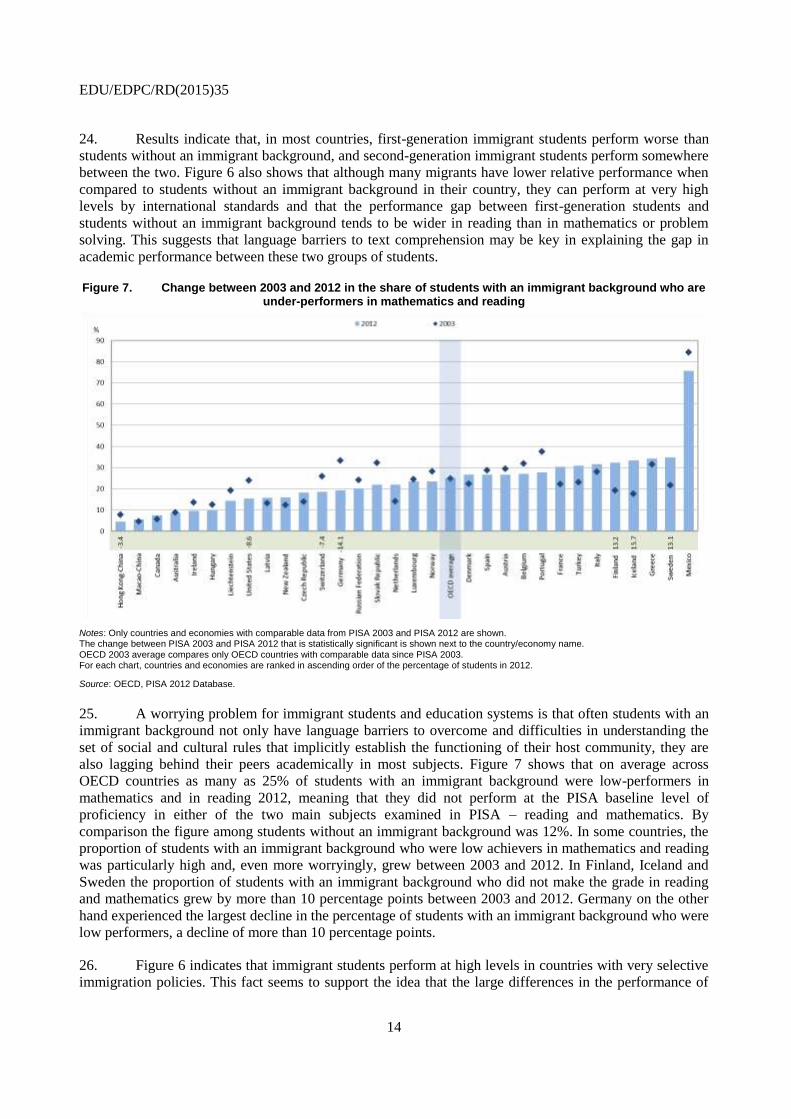
Figure 7. Change between 2003 and 2012 in the share of students with an immigrant background who are under-performers in mathematics and reading
Notes: Only countries and economies with comparable data from PISA 2003 and PISA 2012 are shown. The change between PISA 2003 and PISA 2012 that is statistically significant is shown next to the country/economy name. OECD 2003 average compares only OECD countries with comparable data since PISA 2003. For each chart, countries and economies are ranked in ascending order of the percentage of students in 2012.
Source: OECD, PISA 2012 Database.
25. A worrying problem for immigrant students and education systems is that often students with an
immigrant background not only have language barriers to overcome and difficulties in understanding the
set of social and cultural rules that implicitly establish the functioning of their host community, they are
also lagging behind their peers academically in most subjects. Figure 7 shows that on average across
OECD countries as many as 25% of students with an immigrant background were low-performers in
mathematics and in reading 2012, meaning that they did not perform at the PISA baseline level of
proficiency in either of the two main subjects examined in PISA – reading and mathematics. By
comparison the figure among students without an immigrant background was 12%. In some countries, the
proportion of students with an immigrant background who were low achievers in mathematics and reading
was particularly high and, even more worryingly, grew between 2003 and 2012. In Finland, Iceland and
Sweden the proportion of students with an immigrant background who did not make the grade in reading
and mathematics grew by more than 10 percentage points between 2003 and 2012. Germany on the other
hand experienced the largest decline in the percentage of students with an immigrant background who were
low performers, a decline of more than 10 percentage points.
26. Figure 6 indicates that immigrant students perform at high levels in countries with very selective
immigration policies. This fact seems to support the idea that the large differences in the performance of
EDU/EDPC/RD(2015)35
15
immigrant students can be explained by the immigrants themselves. However, while the culture and the
education acquired before migrating clearly matter, the performance of immigrant students is also strongly
related to the characteristics of education systems in host countries.
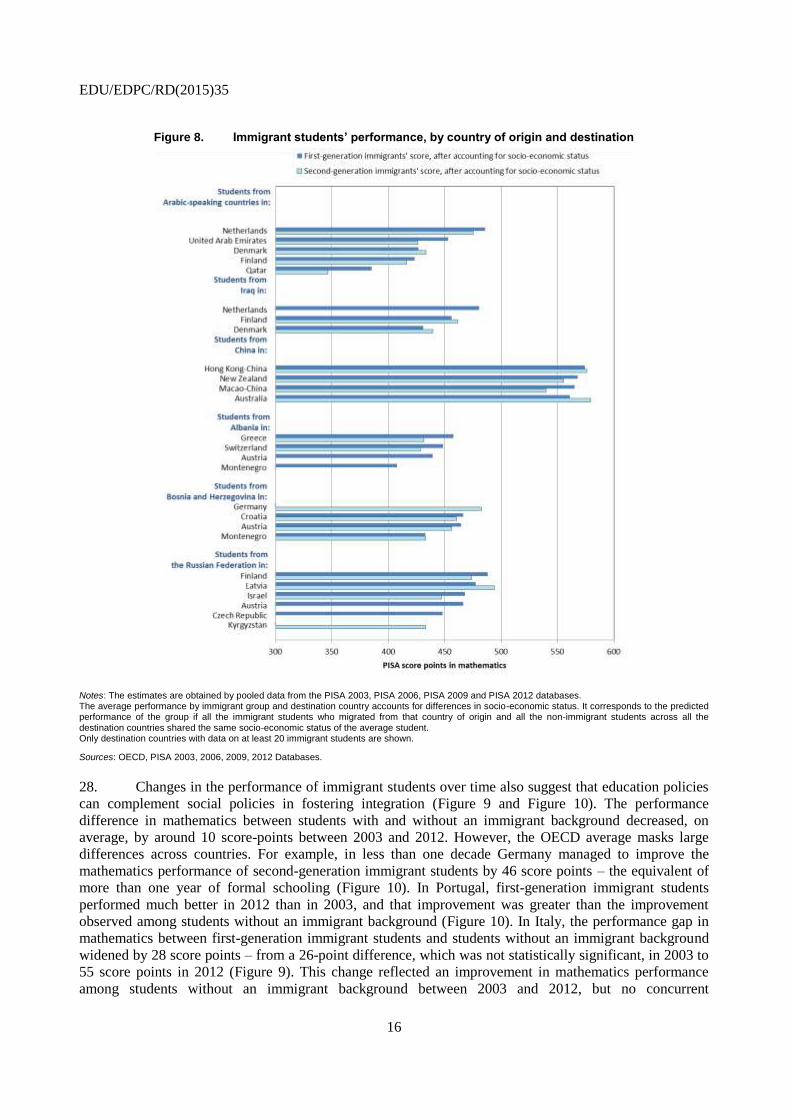
27. Figure 8 illustrates this point by pooling data from PISA 2003, 2006, 2009 and 2012. The figure
shows, for a selected group of countries with available information, how immigrant students from the same
origin and similar socio-economic status perform across different destination countries. On average,
students from Arabic-speaking countries score 100 points more in mathematics in the Netherlands than in
Qatar after accounting for socio-economic differences. Albanian students in Greece score 50 points more
in mathematics than Albanian students with similar socio-economic status in Montenegro, a difference that
is very close to the average performance difference between Greece and Montenegro. Students born in
mainland China have mathematics score above the OECD average across several destination countries, but
they tend to perform better in Hong Kong-China than in Macao-China. Of course, it is not only socio-
economic status that contributes to differences in performance of immigrant students from the same
country of origin who settle in different destination countries; other factors also play a role, including
students’ own motivation or the level of support they receive from their parents. But these findings suggest
that education systems play an important role to integrate the children of immigrants, though the progress
is in many countries not as fast as it could be. Differences in the performance of immigrant students across
OECD countries are only partly due to the socio-economic and cultural composition of immigration to
those countries: it has also to do with the schools themselves, and their capacity to nurture the talents of
students with different intellectual and cultural backgrounds.
EDU/EDPC/RD(2015)35
16
Figure 8. Immigrant students’ performance, by country of origin and destination
Notes: The estimates are obtained by pooled data from the PISA 2003, PISA 2006, PISA 2009 and PISA 2012 databases. The average performance by immigrant group and destination country accounts for differences in socio-economic status. It corresponds to the predicted performance of the group if all the immigrant students who migrated from that country of origin and all the non-immigrant students across all the
destination countries shared the same socio-economic status of the average student. Only destination countries with data on at least 20 immigrant students are shown.
Sources: OECD, PISA 2003, 2006, 2009, 2012 Databases.
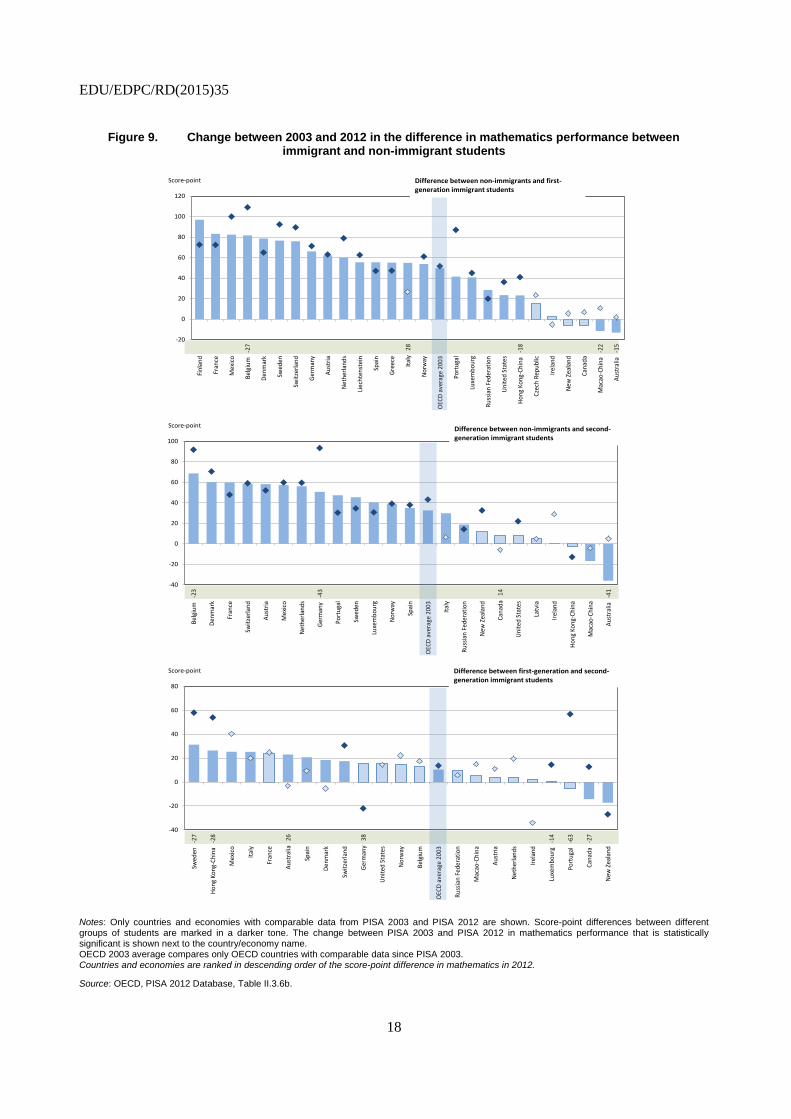
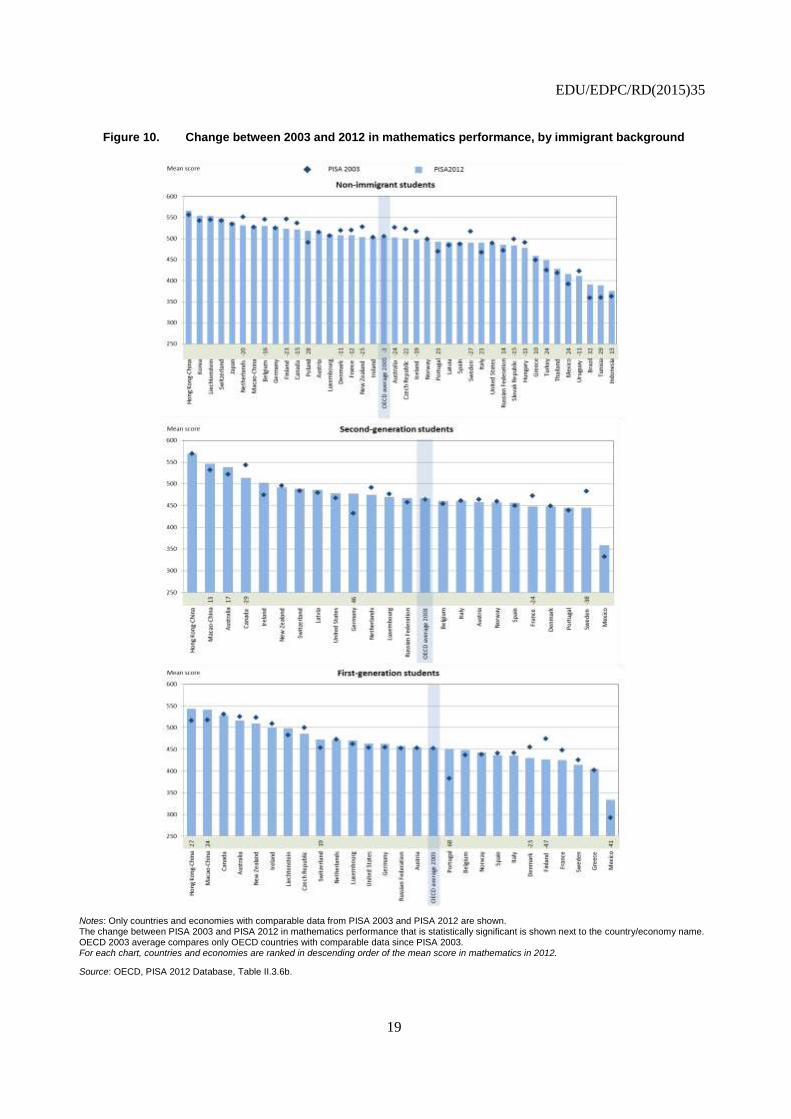
28. Changes in the performance of immigrant students over time also suggest that education policies
can complement social policies in fostering integration (Figure 9 and Figure 10). The performance
difference in mathematics between students with and without an immigrant background decreased, on
average, by around 10 score-points between 2003 and 2012. However, the OECD average masks large
differences across countries. For example, in less than one decade Germany managed to improve the
mathematics performance of second-generation immigrant students by 46 score points – the equivalent of
more than one year of formal schooling (Figure 10). In Portugal, first-generation immigrant students
performed much better in 2012 than in 2003, and that improvement was greater than the improvement
observed among students without an immigrant background (Figure 10). In Italy, the performance gap in
mathematics between first-generation immigrant students and students without an immigrant background
widened by 28 score points – from a 26-point difference, which was not statistically significant, in 2003 to
55 score points in 2012 (Figure 9). This change reflected an improvement in mathematics performance
among students without an immigrant background between 2003 and 2012, but no concurrent

EDU/EDPC/RD(2015)35
17
improvement in performance among first- and second-generation immigrant students. In Canada, France
and Sweden, the performance of both second-generation students and students without an immigrant
deteriorated between 2003 and 2012, but the decline among second-generation immigrant students was
particularly steep (Figure 10).
EDU/EDPC/RD(2015)35
18
Figure 9. Change between 2003 and 2012 in the difference in mathematics performance between immigrant and non-immigrant students
Notes: Only countries and economies with comparable data from PISA 2003 and PISA 2012 are shown. Score-point differences between different groups of students are marked in a darker tone. The change between PISA 2003 and PISA 2012 in mathematics performance that is statistically significant is shown next to the country/economy name. OECD 2003 average compares only OECD countries with comparable data since PISA 2003. Countries and economies are ranked in descending order of the score-point difference in mathematics in 2012.
Source: OECD, PISA 2012 Database, Table II.3.6b.
-20
0
20
40
60
80
100
120Fi
nla
nd
Fran
ce
Mex
ico
Bel
giu
m
-27
Den
mar
k
Swed
en
Swit
zerl
and
Ger
man
y
Au
stri
a
Net
her
land
s
Liec
hte
nst
ein
Spai
n
Gre
ece
Ital
y 2
8
No
rway
OEC
D a
vera
ge 2
003
Port
uga
l
Luxe
mb
ou
rg
Ru
ssia
n F
eder
atio
n
Un
ited
Sta
tes
Ho
ng
Kon
g-C
hin
a -
18
Cze
ch R
epu
blic
Irel
and
New
Zea
lan
d
Can
ada
Mac
ao-C
hin
a -
22
Au
stra
lia
-15
Score-point Difference between non-immigrants and first-generation immigrant students
-40
-20
0
20
40
60
80
100
Bel
giu
m
-23
Den
mar
k
Fran
ce
Swit
zerl
and
Au
stri
a
Mex
ico
Net
her
land
s
Ger
man
y -
43
Port
uga
l
Swed
en
Luxe
mb
ou
rg
No
rway
Spai
n
OEC
D a
vera
ge 2
003
Ital
y
Ru
ssia
n F
eder
atio
n
New
Zea
lan
d
Can
ada
14
Un
ited
Sta
tes
Latv
ia
Irel
and
Ho
ng
Kon
g-C
hin
a
Mac
ao-C
hin
a
Au
stra
lia
-41
Score-point Difference between non-immigrants and second-generation immigrant students
-40
-20
0
20
40
60
80
Swed
en
-27
Ho
ng
Kon
g-C
hin
a -
28
Mex
ico
Ital
y
Fran
ce
Au
stra
lia
26
Spai
n
Den
mar
k
Swit
zerl
and
Ger
man
y 3
8
Un
ited
Sta
tes
No
rway
Bel
giu
m
OEC
D a
vera
ge 2
003
Ru
ssia
n F
eder
atio
n
Mac
ao-C
hin
a
Au
stri
a
Net
her
land
s
Irel
and
Luxe
mb
ou
rg
-14
Port
uga
l -
63
Can
ada
-27
New
Zea
lan
d
Score-point Difference between first-generation and second-generation immigrant students
EDU/EDPC/RD(2015)35
19
Figure 10. Change between 2003 and 2012 in mathematics performance, by immigrant background
Notes: Only countries and economies with comparable data from PISA 2003 and PISA 2012 are shown. The change between PISA 2003 and PISA 2012 in mathematics performance that is statistically significant is shown next to the country/economy name. OECD 2003 average compares only OECD countries with comparable data since PISA 2003. For each chart, countries and economies are ranked in descending order of the mean score in mathematics in 2012.
Source: OECD, PISA 2012 Database, Table II.3.6b.
EDU/EDPC/RD(2015)35
20
29. When examining trends in performance differences between immigrant students and students
without an immigrant background, it is important to consider them in the context of changes in the socio-
economic profile of students. This allows to determine whether changes are due to differences in the
profile of immigrant students or differences in how education systems cater to the particular needs of
immigrant students. Changes in the performance differential between immigrant students and students
without an immigrant background partly reflect the improved socio-economic background of immigrant
students. Education outcomes have improved in many countries of origin, and migration policies have
become increasingly skill-selective. Global progress in improving adult literacy rates (one of the Education
for All goals) has been mostly the result of increasing educational attainment among younger adults rather
than improvement within the cohorts of adults who were past school age (UNESCO, 2015).
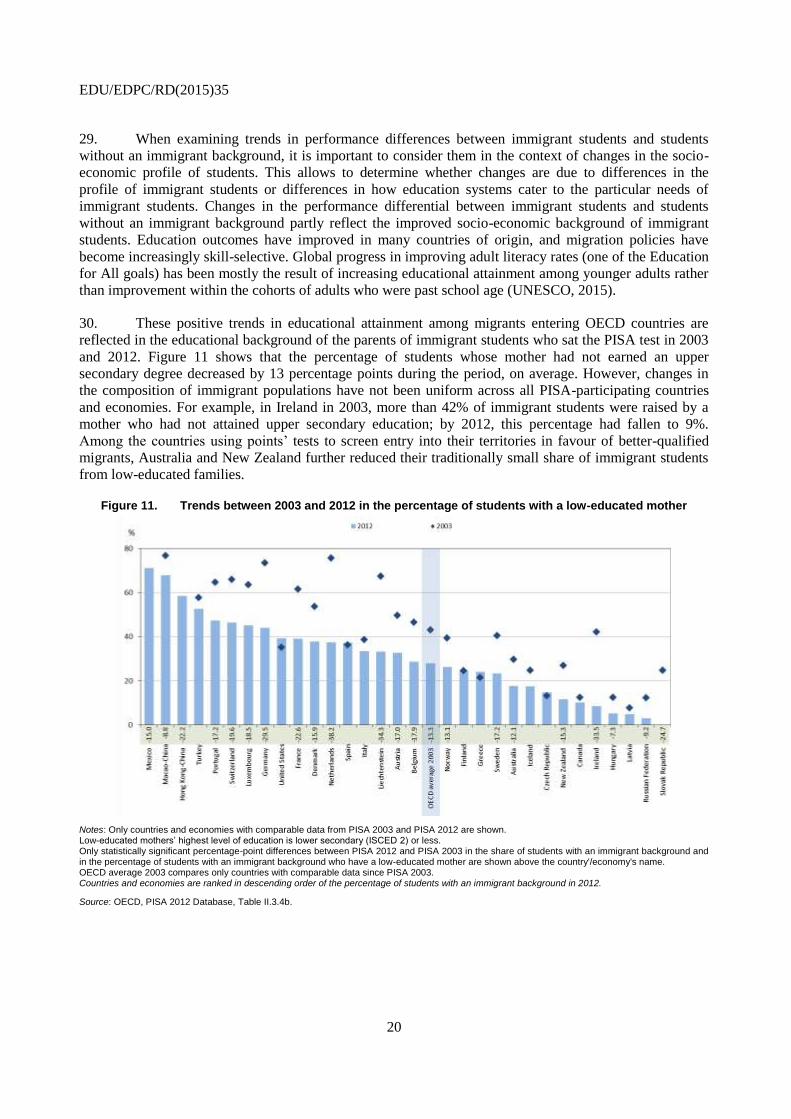
30. These positive trends in educational attainment among migrants entering OECD countries are
reflected in the educational background of the parents of immigrant students who sat the PISA test in 2003
and 2012. Figure 11 shows that the percentage of students whose mother had not earned an upper
secondary degree decreased by 13 percentage points during the period, on average. However, changes in
the composition of immigrant populations have not been uniform across all PISA-participating countries
and economies. For example, in Ireland in 2003, more than 42% of immigrant students were raised by a
mother who had not attained upper secondary education; by 2012, this percentage had fallen to 9%.
Among the countries using points’ tests to screen entry into their territories in favour of better-qualified
migrants, Australia and New Zealand further reduced their traditionally small share of immigrant students
from low-educated families.
Figure 11. Trends between 2003 and 2012 in the percentage of students with a low-educated mother
Notes: Only countries and economies with comparable data from PISA 2003 and PISA 2012 are shown. Low-educated mothers’ highest level of education is lower secondary (ISCED 2) or less. Only statistically significant percentage-point differences between PISA 2012 and PISA 2003 in the share of students with an immigrant background and in the percentage of students with an immigrant background who have a low-educated mother are shown above the country'/economy's name. OECD average 2003 compares only countries with comparable data since PISA 2003. Countries and economies are ranked in descending order of the percentage of students with an immigrant background in 2012.
Source: OECD, PISA 2012 Database, Table II.3.4b.
EDU/EDPC/RD(2015)35
21
Sense of belonging at school
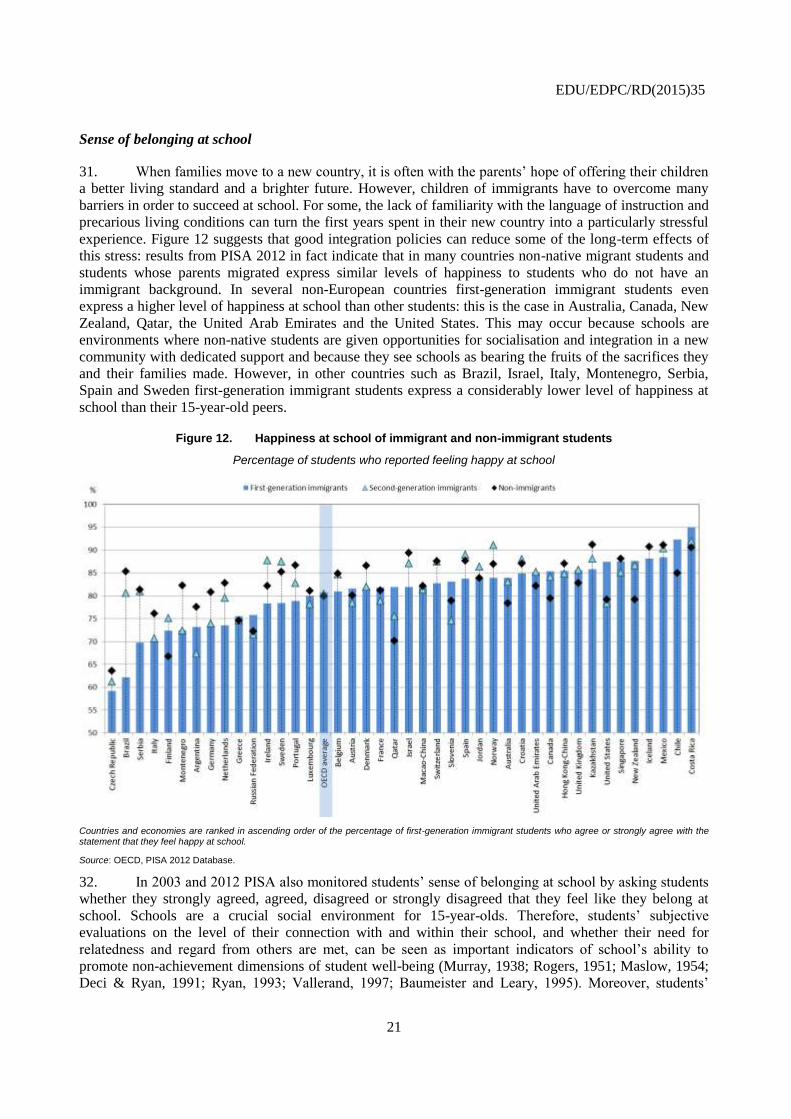
31. When families move to a new country, it is often with the parents’ hope of offering their children
a better living standard and a brighter future. However, children of immigrants have to overcome many
barriers in order to succeed at school. For some, the lack of familiarity with the language of instruction and
precarious living conditions can turn the first years spent in their new country into a particularly stressful
experience. Figure 12 suggests that good integration policies can reduce some of the long-term effects of
this stress: results from PISA 2012 in fact indicate that in many countries non-native migrant students and
students whose parents migrated express similar levels of happiness to students who do not have an
immigrant background. In several non-European countries first-generation immigrant students even
express a higher level of happiness at school than other students: this is the case in Australia, Canada, New
Zealand, Qatar, the United Arab Emirates and the United States. This may occur because schools are
environments where non-native students are given opportunities for socialisation and integration in a new
community with dedicated support and because they see schools as bearing the fruits of the sacrifices they
and their families made. However, in other countries such as Brazil, Israel, Italy, Montenegro, Serbia,
Spain and Sweden first-generation immigrant students express a considerably lower level of happiness at
school than their 15-year-old peers.
Figure 12. Happiness at school of immigrant and non-immigrant students
Percentage of students who reported feeling happy at school
Countries and economies are ranked in ascending order of the percentage of first-generation immigrant students who agree or strongly agree with the statement that they feel happy at school.
Source: OECD, PISA 2012 Database.
32. In 2003 and 2012 PISA also monitored students’ sense of belonging at school by asking students
whether they strongly agreed, agreed, disagreed or strongly disagreed that they feel like they belong at
school. Schools are a crucial social environment for 15-year-olds. Therefore, students’ subjective
evaluations on the level of their connection with and within their school, and whether their need for
relatedness and regard from others are met, can be seen as important indicators of school’s ability to
promote non-achievement dimensions of student well-being (Murray, 1938; Rogers, 1951; Maslow, 1954;
Deci & Ryan, 1991; Ryan, 1993; Vallerand, 1997; Baumeister and Leary, 1995). Moreover, students’
EDU/EDPC/RD(2015)35
22
sense of belonging is not only important in itself – because promoting positive affective states among
children is a worthwhile goal – but also because it is likely to be associated with lower rates of school
drop-out and is important in promoting children and adolescents’ successful development. Countries vary
widely not only in the overall percentage of students who agree or strongly agree that they feel like they
belong at school, but also in the extent to which first- and second- generation immigrant students are more
or less likely than students without an immigrant background to feel that they belong at school.
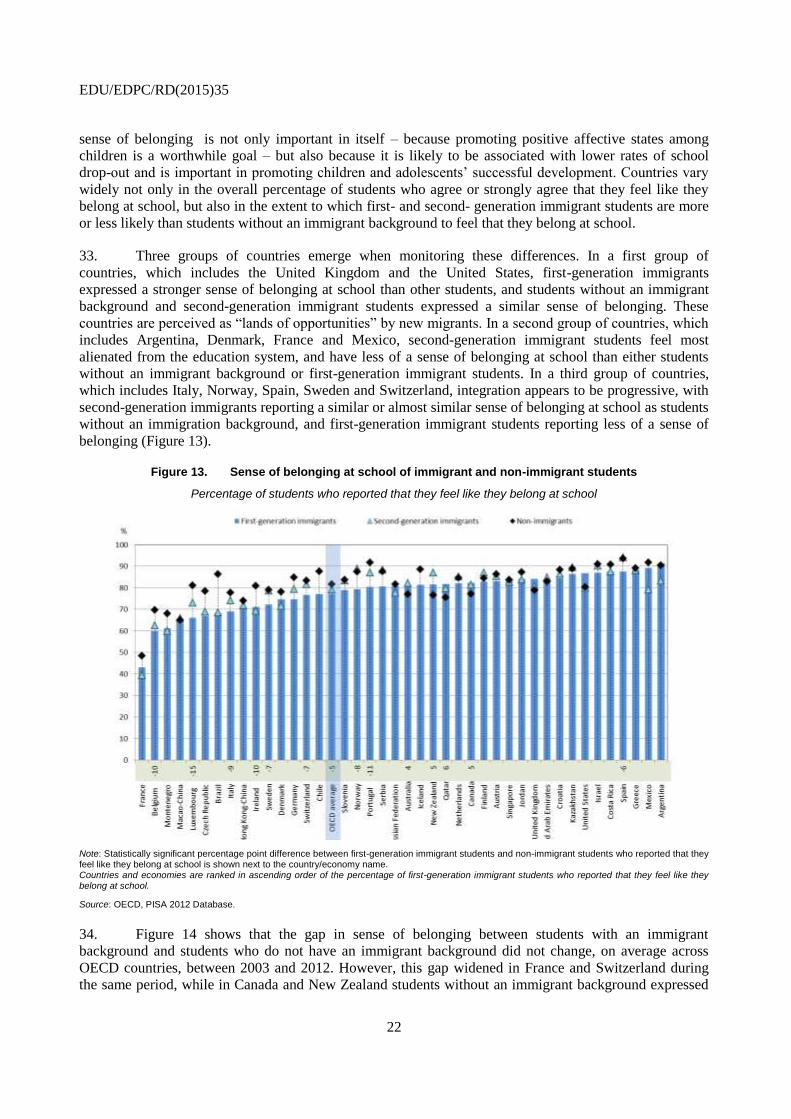
33. Three groups of countries emerge when monitoring these differences. In a first group of
countries, which includes the United Kingdom and the United States, first-generation immigrants
expressed a stronger sense of belonging at school than other students, and students without an immigrant
background and second-generation immigrant students expressed a similar sense of belonging. These
countries are perceived as “lands of opportunities” by new migrants. In a second group of countries, which
includes Argentina, Denmark, France and Mexico, second-generation immigrant students feel most
alienated from the education system, and have less of a sense of belonging at school than either students
without an immigrant background or first-generation immigrant students. In a third group of countries,
which includes Italy, Norway, Spain, Sweden and Switzerland, integration appears to be progressive, with
second-generation immigrants reporting a similar or almost similar sense of belonging at school as students
without an immigration background, and first-generation immigrant students reporting less of a sense of
belonging (Figure 13).
Figure 13. Sense of belonging at school of immigrant and non-immigrant students
Percentage of students who reported that they feel like they belong at school
Note: Statistically significant percentage point difference between first-generation immigrant students and non-immigrant students who reported that they feel like they belong at school is shown next to the country/economy name. Countries and economies are ranked in ascending order of the percentage of first-generation immigrant students who reported that they feel like they belong at school.
Source: OECD, PISA 2012 Database.
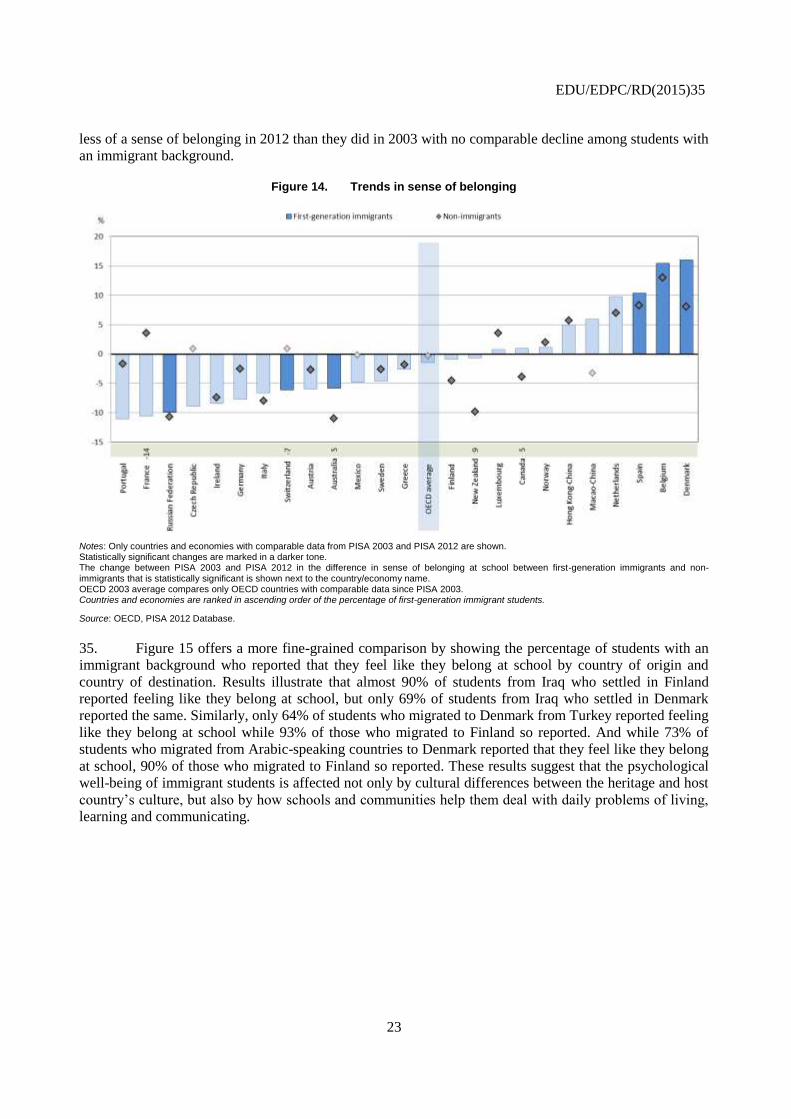
34. Figure 14 shows that the gap in sense of belonging between students with an immigrant
background and students who do not have an immigrant background did not change, on average across
OECD countries, between 2003 and 2012. However, this gap widened in France and Switzerland during
the same period, while in Canada and New Zealand students without an immigrant background expressed
EDU/EDPC/RD(2015)35
23
less of a sense of belonging in 2012 than they did in 2003 with no comparable decline among students with
an immigrant background.
Figure 14. Trends in sense of belonging
Notes: Only countries and economies with comparable data from PISA 2003 and PISA 2012 are shown. Statistically significant changes are marked in a darker tone. The change between PISA 2003 and PISA 2012 in the difference in sense of belonging at school between first-generation immigrants and non-immigrants that is statistically significant is shown next to the country/economy name. OECD 2003 average compares only OECD countries with comparable data since PISA 2003. Countries and economies are ranked in ascending order of the percentage of first-generation immigrant students.
Source: OECD, PISA 2012 Database.
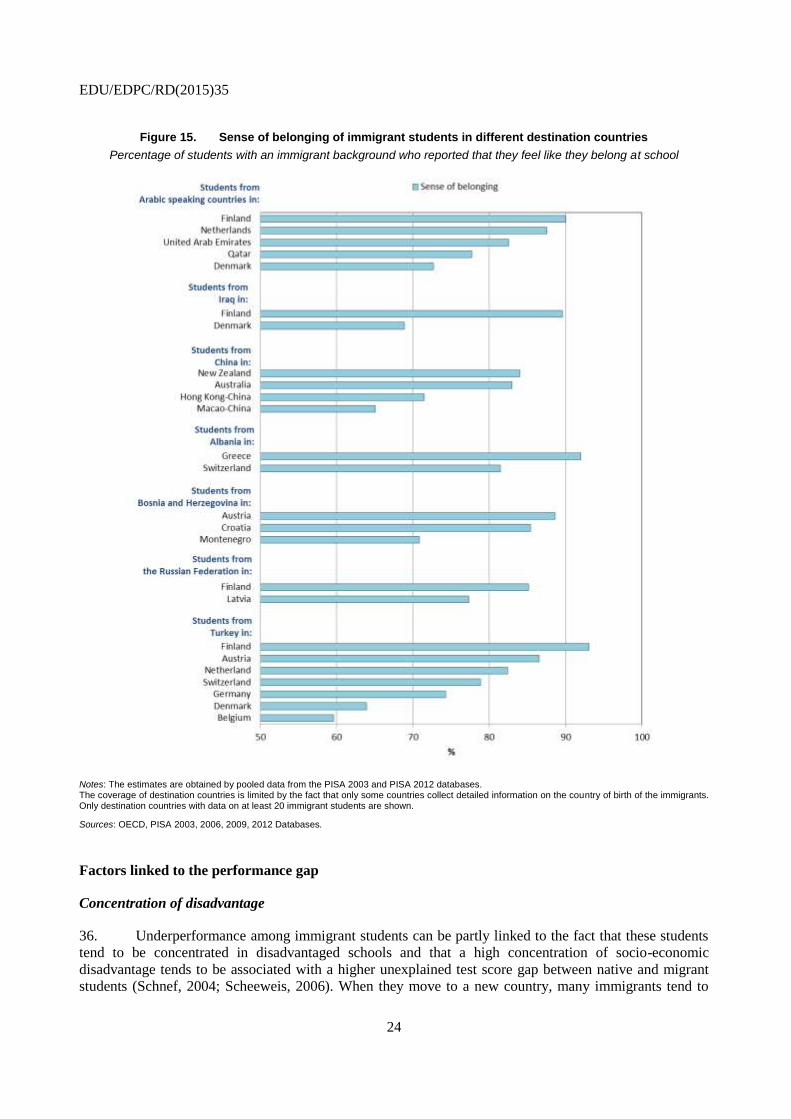
35. Figure 15 offers a more fine-grained comparison by showing the percentage of students with an
immigrant background who reported that they feel like they belong at school by country of origin and
country of destination. Results illustrate that almost 90% of students from Iraq who settled in Finland
reported feeling like they belong at school, but only 69% of students from Iraq who settled in Denmark
reported the same. Similarly, only 64% of students who migrated to Denmark from Turkey reported feeling
like they belong at school while 93% of those who migrated to Finland so reported. And while 73% of
students who migrated from Arabic-speaking countries to Denmark reported that they feel like they belong
at school, 90% of those who migrated to Finland so reported. These results suggest that the psychological
well-being of immigrant students is affected not only by cultural differences between the heritage and host
country’s culture, but also by how schools and communities help them deal with daily problems of living,
learning and communicating.
EDU/EDPC/RD(2015)35
24
Figure 15. Sense of belonging of immigrant students in different destination countries
Percentage of students with an immigrant background who reported that they feel like they belong at school
Notes: The estimates are obtained by pooled data from the PISA 2003 and PISA 2012 databases. The coverage of destination countries is limited by the fact that only some countries collect detailed information on the country of birth of the immigrants. Only destination countries with data on at least 20 immigrant students are shown.
Sources: OECD, PISA 2003, 2006, 2009, 2012 Databases.
Factors linked to the performance gap
Concentration of disadvantage
36. Underperformance among immigrant students can be partly linked to the fact that these students
tend to be concentrated in disadvantaged schools and that a high concentration of socio-economic
disadvantage tends to be associated with a higher unexplained test score gap between native and migrant
students (Schnef, 2004; Scheeweis, 2006). When they move to a new country, many immigrants tend to
EDU/EDPC/RD(2015)35
25
settle in neighbourhoods with other immigrants, often from the same country of origin and of the same
socio-economic status. They do this partly as a way to build a network of people who share their culture or
their experience as migrants and who also may be able to help newly arrived migrants make their way
through administrative procedures and perhaps even find work. They may also move to these areas because
of socio-economic deprivation, which limits the range of areas where they can relocate. Similarly,
immigrant students tend to be concentrated in the same schools, sometimes because they live in the same
neighbourhoods, but sometimes because school systems group them together, whether or not they are
neighbours. The concentration of immigrant students in schools does not, in itself, have to have adverse
effects on student performance or on integration efforts – as long as there is access to high-quality social
and public services, and as long as ethnic agglomerations do not become permanent enclaves whose
residents have little possibility of outward – and upward – mobility.
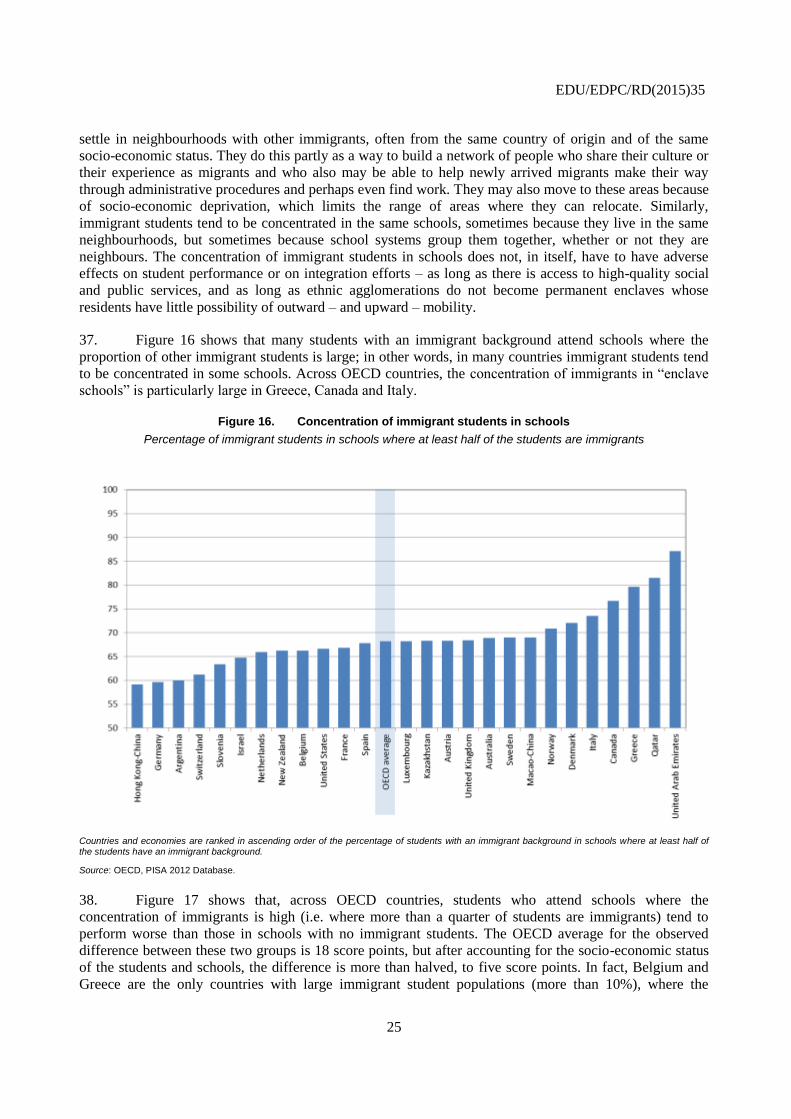
37. Figure 16 shows that many students with an immigrant background attend schools where the
proportion of other immigrant students is large; in other words, in many countries immigrant students tend
to be concentrated in some schools. Across OECD countries, the concentration of immigrants in “enclave
schools” is particularly large in Greece, Canada and Italy.
Figure 16. Concentration of immigrant students in schools
Percentage of immigrant students in schools where at least half of the students are immigrants
Countries and economies are ranked in ascending order of the percentage of students with an immigrant background in schools where at least half of the students have an immigrant background.
Source: OECD, PISA 2012 Database.
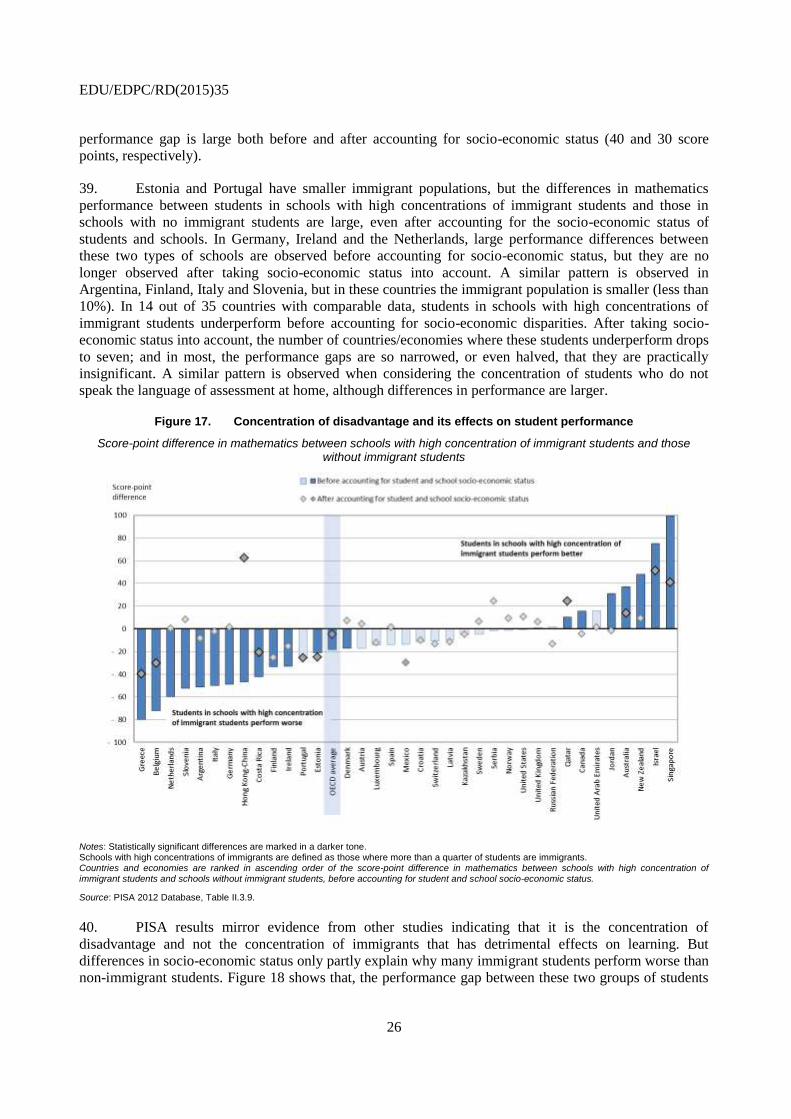
38. Figure 17 shows that, across OECD countries, students who attend schools where the
concentration of immigrants is high (i.e. where more than a quarter of students are immigrants) tend to
perform worse than those in schools with no immigrant students. The OECD average for the observed
difference between these two groups is 18 score points, but after accounting for the socio-economic status
of the students and schools, the difference is more than halved, to five score points. In fact, Belgium and
Greece are the only countries with large immigrant student populations (more than 10%), where the
EDU/EDPC/RD(2015)35
26
performance gap is large both before and after accounting for socio-economic status (40 and 30 score
points, respectively).
39. Estonia and Portugal have smaller immigrant populations, but the differences in mathematics
performance between students in schools with high concentrations of immigrant students and those in
schools with no immigrant students are large, even after accounting for the socio-economic status of
students and schools. In Germany, Ireland and the Netherlands, large performance differences between
these two types of schools are observed before accounting for socio-economic status, but they are no
longer observed after taking socio-economic status into account. A similar pattern is observed in
Argentina, Finland, Italy and Slovenia, but in these countries the immigrant population is smaller (less than
10%). In 14 out of 35 countries with comparable data, students in schools with high concentrations of
immigrant students underperform before accounting for socio-economic disparities. After taking socio-
economic status into account, the number of countries/economies where these students underperform drops
to seven; and in most, the performance gaps are so narrowed, or even halved, that they are practically
insignificant. A similar pattern is observed when considering the concentration of students who do not
speak the language of assessment at home, although differences in performance are larger.
Figure 17. Concentration of disadvantage and its effects on student performance
Score-point difference in mathematics between schools with high concentration of immigrant students and those without immigrant students
Notes: Statistically significant differences are marked in a darker tone. Schools with high concentrations of immigrants are defined as those where more than a quarter of students are immigrants. Countries and economies are ranked in ascending order of the score-point difference in mathematics between schools with high concentration of immigrant students and schools without immigrant students, before accounting for student and school socio-economic status.
Source: PISA 2012 Database, Table II.3.9.
40. PISA results mirror evidence from other studies indicating that it is the concentration of
disadvantage and not the concentration of immigrants that has detrimental effects on learning. But
differences in socio-economic status only partly explain why many immigrant students perform worse than
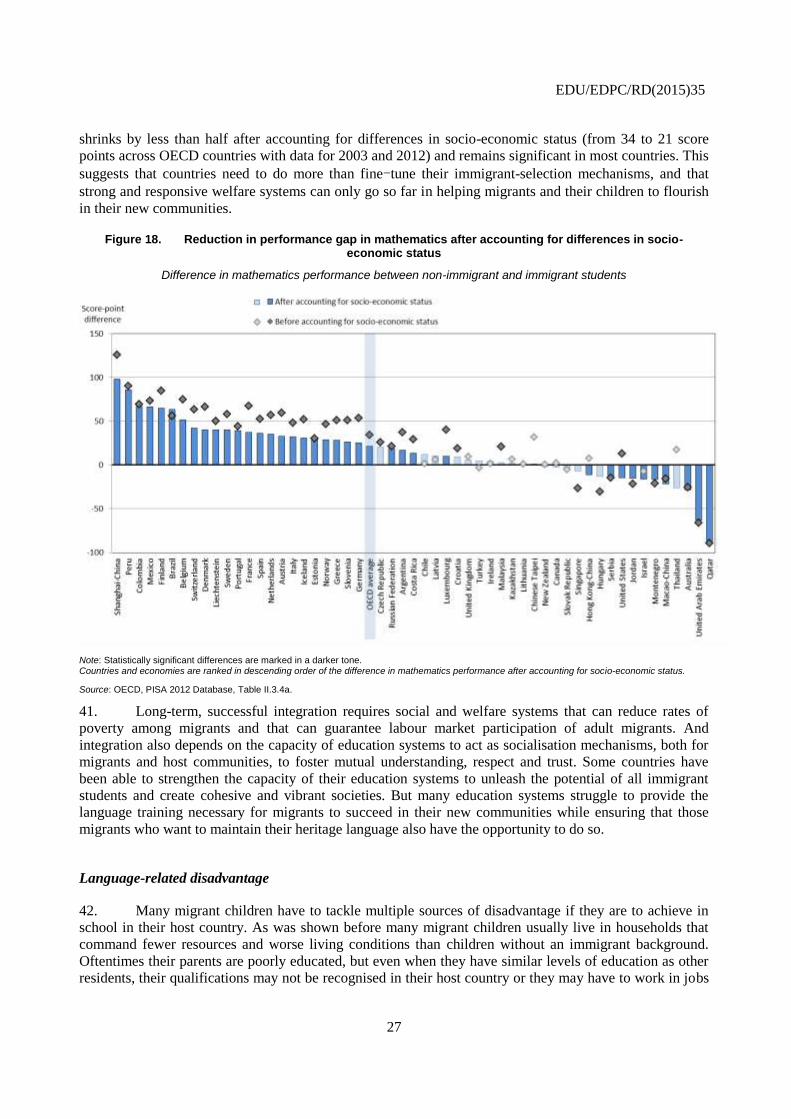
non-immigrant students. Figure 18 shows that, the performance gap between these two groups of students
EDU/EDPC/RD(2015)35
27
shrinks by less than half after accounting for differences in socio-economic status (from 34 to 21 score
points across OECD countries with data for 2003 and 2012) and remains significant in most countries. This
suggests that countries need to do more than fine-tune their immigrant-selection mechanisms, and that
strong and responsive welfare systems can only go so far in helping migrants and their children to flourish
in their new communities.
Figure 18. Reduction in performance gap in mathematics after accounting for differences in socio-economic status
Difference in mathematics performance between non-immigrant and immigrant students
Note: Statistically significant differences are marked in a darker tone. Countries and economies are ranked in descending order of the difference in mathematics performance after accounting for socio-economic status.
Source: OECD, PISA 2012 Database, Table II.3.4a.
41. Long-term, successful integration requires social and welfare systems that can reduce rates of
poverty among migrants and that can guarantee labour market participation of adult migrants. And
integration also depends on the capacity of education systems to act as socialisation mechanisms, both for
migrants and host communities, to foster mutual understanding, respect and trust. Some countries have
been able to strengthen the capacity of their education systems to unleash the potential of all immigrant
students and create cohesive and vibrant societies. But many education systems struggle to provide the
language training necessary for migrants to succeed in their new communities while ensuring that those
migrants who want to maintain their heritage language also have the opportunity to do so.
Language-related disadvantage
42. Many migrant children have to tackle multiple sources of disadvantage if they are to achieve in
school in their host country. As was shown before many migrant children usually live in households that
command fewer resources and worse living conditions than children without an immigrant background.
Oftentimes their parents are poorly educated, but even when they have similar levels of education as other
residents, their qualifications may not be recognised in their host country or they may have to work in jobs
EDU/EDPC/RD(2015)35
28
that require lower skills because of poor language skills, lack of formal contacts in their host community
and lack of an established labour market and educational path in their host community. On top of lack of
economic and cultural resources, many students with an immigrant background face a language barrier. In
particular those students who were not born in the country and migrated at a late age face a particular set of
difficulties that stem from the fact that they need to learn in a language in which they are not proficient,
with parents who probably are not proficient themselves. The struggle many migrant parents face is the
need to ensure that their children become fluent in the language of their host communities, to ensure that
they can progress through the system and realise the upward social mobility that so many aspire for their
children, while maintaining their children’s bond with their native country, a bond that passes through
language skills in their native language.
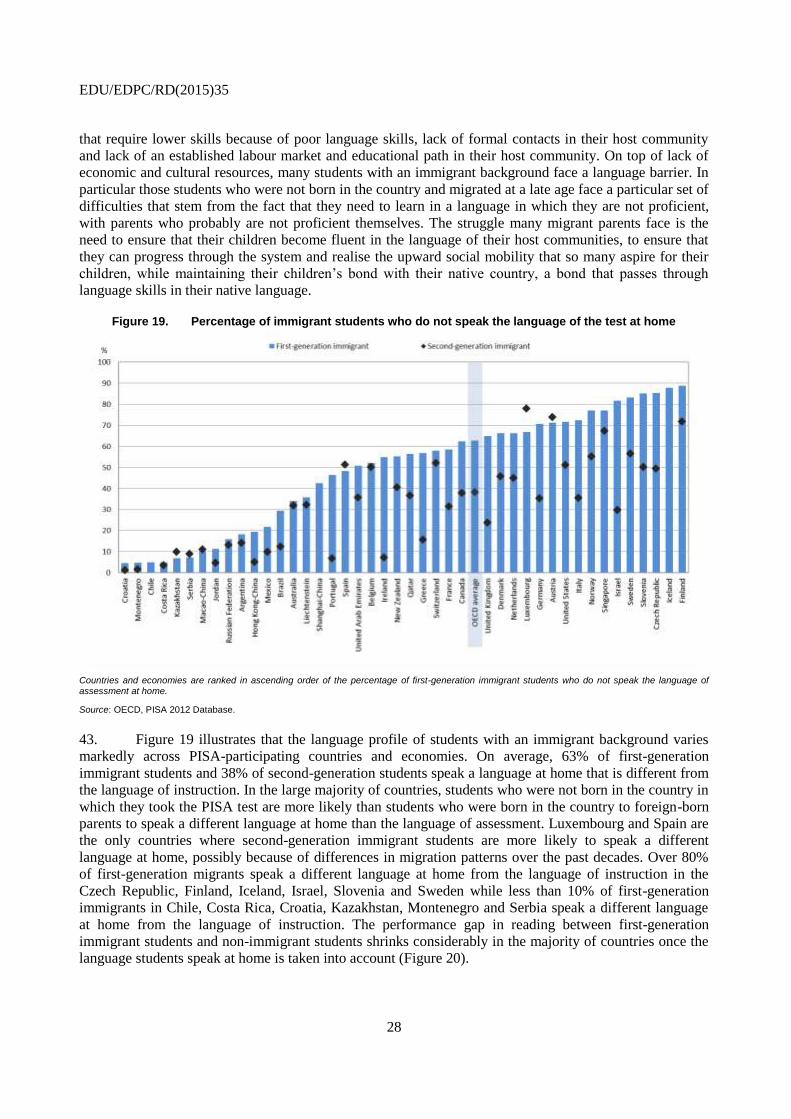
Figure 19. Percentage of immigrant students who do not speak the language of the test at home
Countries and economies are ranked in ascending order of the percentage of first-generation immigrant students who do not speak the language of assessment at home.
Source: OECD, PISA 2012 Database.
43. Figure 19 illustrates that the language profile of students with an immigrant background varies
markedly across PISA-participating countries and economies. On average, 63% of first-generation
immigrant students and 38% of second-generation students speak a language at home that is different from
the language of instruction. In the large majority of countries, students who were not born in the country in
which they took the PISA test are more likely than students who were born in the country to foreign-born
parents to speak a different language at home than the language of assessment. Luxembourg and Spain are
the only countries where second-generation immigrant students are more likely to speak a different
language at home, possibly because of differences in migration patterns over the past decades. Over 80%
of first-generation migrants speak a different language at home from the language of instruction in the
Czech Republic, Finland, Iceland, Israel, Slovenia and Sweden while less than 10% of first-generation
immigrants in Chile, Costa Rica, Croatia, Kazakhstan, Montenegro and Serbia speak a different language
at home from the language of instruction. The performance gap in reading between first-generation
immigrant students and non-immigrant students shrinks considerably in the majority of countries once the
language students speak at home is taken into account (Figure 20).
EDU/EDPC/RD(2015)35
29
Figure 20. Performance gap in reading and language spoken at home
Difference in reading performance between non-immigrant and immigrant students before and after accounting for the language spoken at home
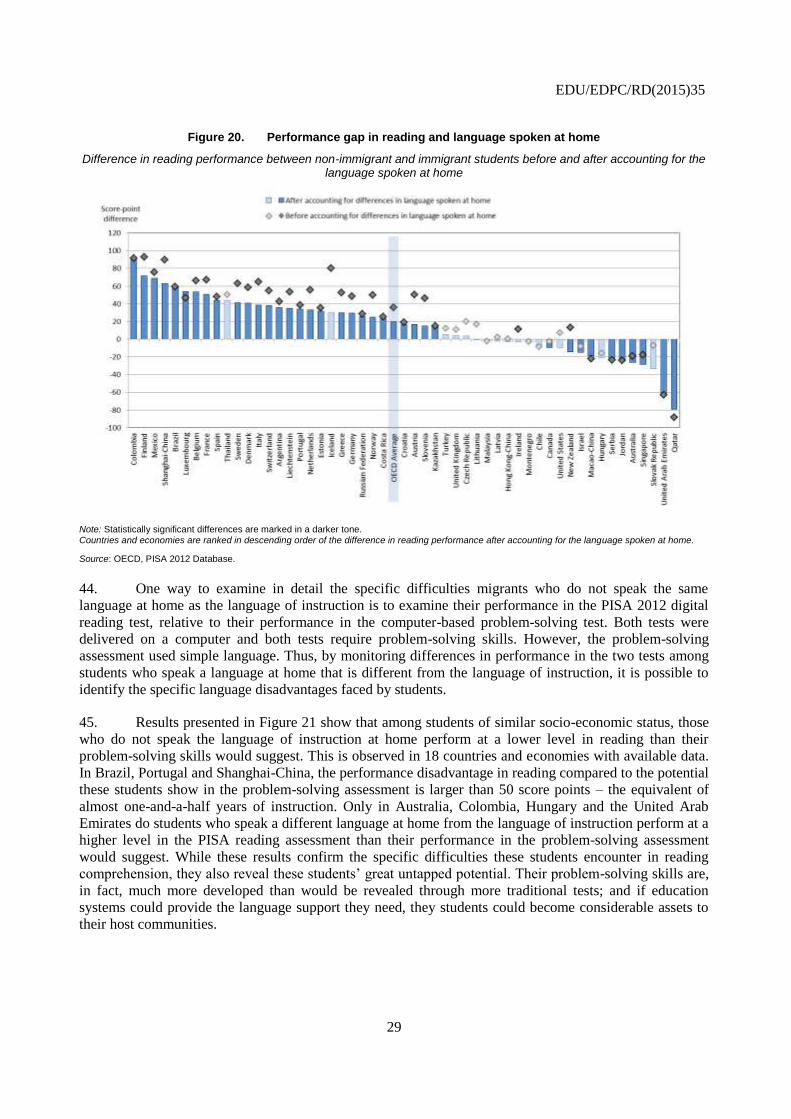
Note: Statistically significant differences are marked in a darker tone. Countries and economies are ranked in descending order of the difference in reading performance after accounting for the language spoken at home.
Source: OECD, PISA 2012 Database.
44. One way to examine in detail the specific difficulties migrants who do not speak the same
language at home as the language of instruction is to examine their performance in the PISA 2012 digital
reading test, relative to their performance in the computer-based problem-solving test. Both tests were
delivered on a computer and both tests require problem-solving skills. However, the problem-solving
assessment used simple language. Thus, by monitoring differences in performance in the two tests among
students who speak a language at home that is different from the language of instruction, it is possible to
identify the specific language disadvantages faced by students.
45. Results presented in Figure 21 show that among students of similar socio-economic status, those
who do not speak the language of instruction at home perform at a lower level in reading than their
problem-solving skills would suggest. This is observed in 18 countries and economies with available data.
In Brazil, Portugal and Shanghai-China, the performance disadvantage in reading compared to the potential
these students show in the problem-solving assessment is larger than 50 score points – the equivalent of
almost one-and-a-half years of instruction. Only in Australia, Colombia, Hungary and the United Arab
Emirates do students who speak a different language at home from the language of instruction perform at a
higher level in the PISA reading assessment than their performance in the problem-solving assessment
would suggest. While these results confirm the specific difficulties these students encounter in reading
comprehension, they also reveal these students’ great untapped potential. Their problem-solving skills are,
in fact, much more developed than would be revealed through more traditional tests; and if education
systems could provide the language support they need, they students could become considerable assets to
their host communities.
EDU/EDPC/RD(2015)35
30
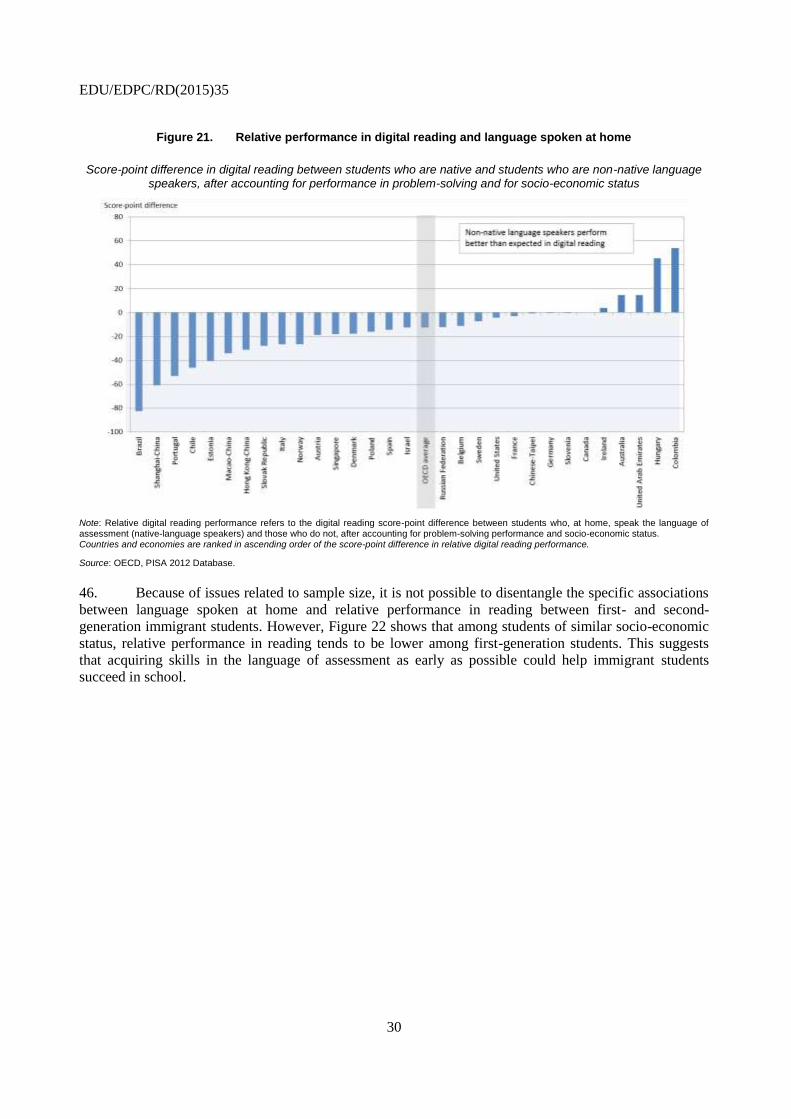
Figure 21. Relative performance in digital reading and language spoken at home
Score-point difference in digital reading between students who are native and students who are non-native language speakers, after accounting for performance in problem-solving and for socio-economic status
Note: Relative digital reading performance refers to the digital reading score-point difference between students who, at home, speak the language of assessment (native-language speakers) and those who do not, after accounting for problem-solving performance and socio-economic status. Countries and economies are ranked in ascending order of the score-point difference in relative digital reading performance.
Source: OECD, PISA 2012 Database.
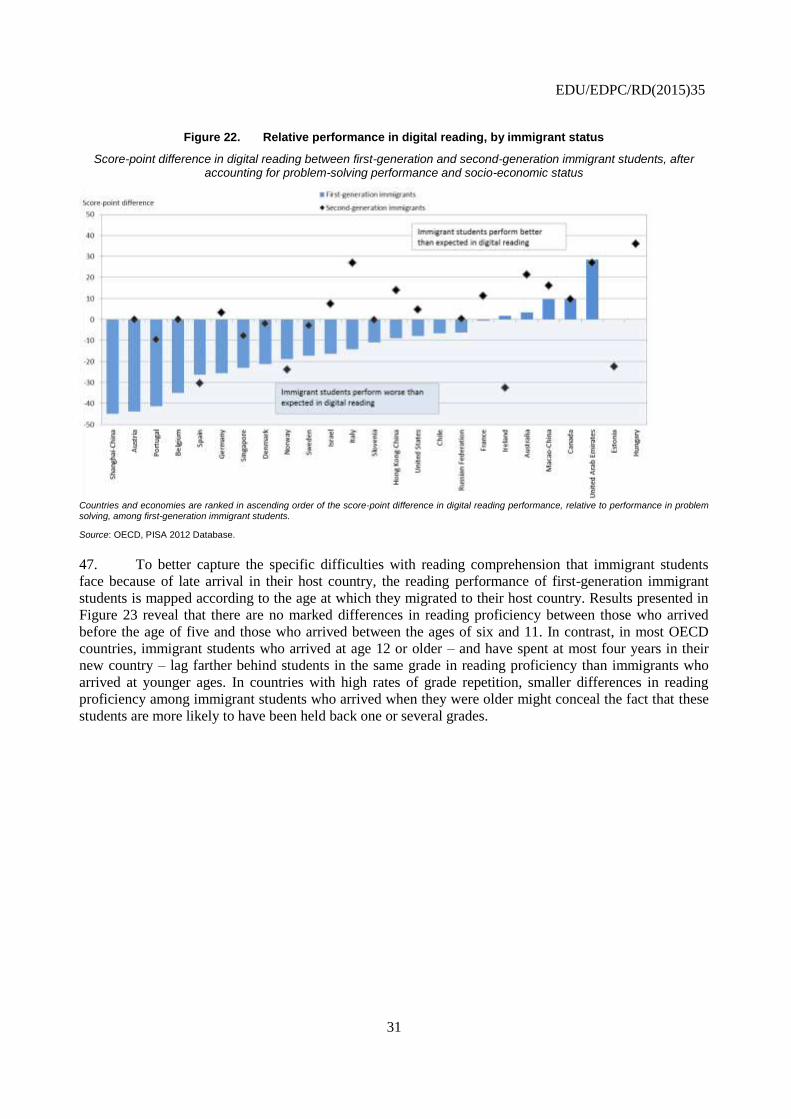
46. Because of issues related to sample size, it is not possible to disentangle the specific associations
between language spoken at home and relative performance in reading between first- and second-
generation immigrant students. However, Figure 22 shows that among students of similar socio-economic
status, relative performance in reading tends to be lower among first-generation students. This suggests
that acquiring skills in the language of assessment as early as possible could help immigrant students
succeed in school.
EDU/EDPC/RD(2015)35
31
Figure 22. Relative performance in digital reading, by immigrant status
Score-point difference in digital reading between first-generation and second-generation immigrant students, after accounting for problem-solving performance and socio-economic status
Countries and economies are ranked in ascending order of the score-point difference in digital reading performance, relative to performance in problem solving, among first-generation immigrant students.
Source: OECD, PISA 2012 Database.
47. To better capture the specific difficulties with reading comprehension that immigrant students
face because of late arrival in their host country, the reading performance of first-generation immigrant
students is mapped according to the age at which they migrated to their host country. Results presented in
Figure 23 reveal that there are no marked differences in reading proficiency between those who arrived
before the age of five and those who arrived between the ages of six and 11. In contrast, in most OECD
countries, immigrant students who arrived at age 12 or older – and have spent at most four years in their
new country – lag farther behind students in the same grade in reading proficiency than immigrants who
arrived at younger ages. In countries with high rates of grade repetition, smaller differences in reading
proficiency among immigrant students who arrived when they were older might conceal the fact that these
students are more likely to have been held back one or several grades.
EDU/EDPC/RD(2015)35
32
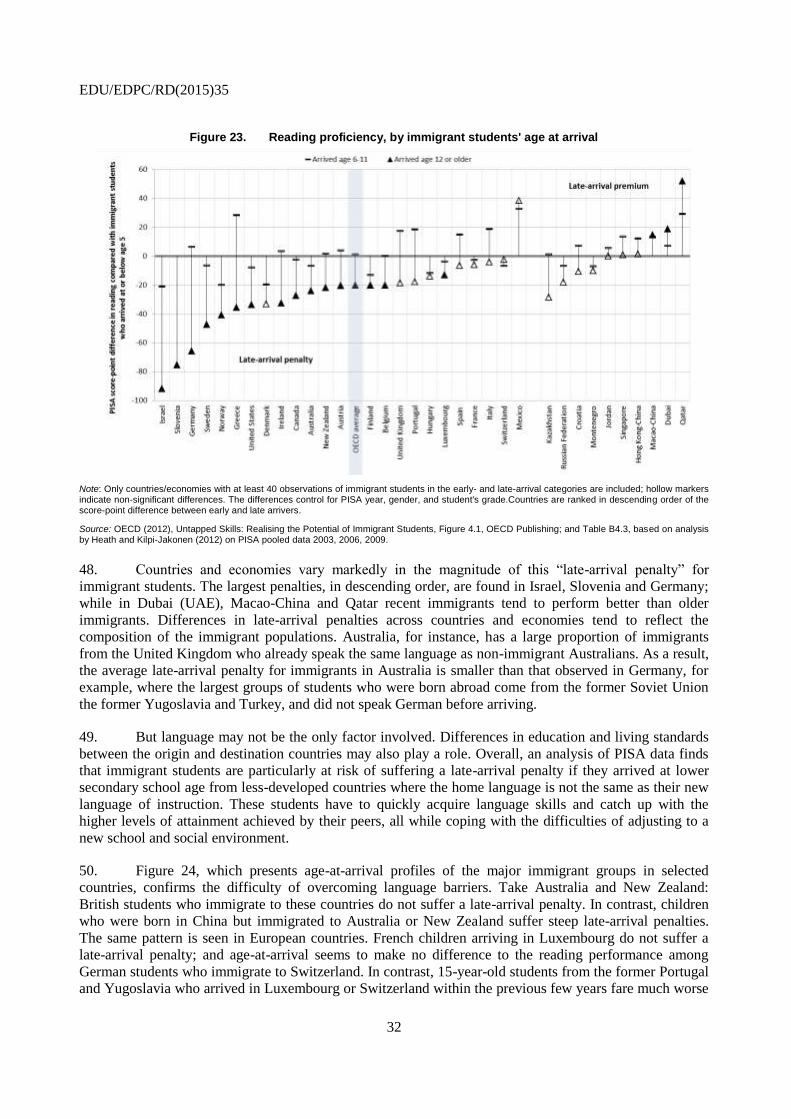
Figure 23. Reading proficiency, by immigrant students' age at arrival
Note: Only countries/economies with at least 40 observations of immigrant students in the early- and late-arrival categories are included; hollow markers indicate non-significant differences. The differences control for PISA year, gender, and student's grade.Countries are ranked in descending order of the score-point difference between early and late arrivers.
Source: OECD (2012), Untapped Skills: Realising the Potential of Immigrant Students, Figure 4.1, OECD Publishing; and Table B4.3, based on analysis by Heath and Kilpi-Jakonen (2012) on PISA pooled data 2003, 2006, 2009.
48. Countries and economies vary markedly in the magnitude of this “late-arrival penalty” for
immigrant students. The largest penalties, in descending order, are found in Israel, Slovenia and Germany;
while in Dubai (UAE), Macao-China and Qatar recent immigrants tend to perform better than older
immigrants. Differences in late-arrival penalties across countries and economies tend to reflect the
composition of the immigrant populations. Australia, for instance, has a large proportion of immigrants
from the United Kingdom who already speak the same language as non-immigrant Australians. As a result,
the average late-arrival penalty for immigrants in Australia is smaller than that observed in Germany, for
example, where the largest groups of students who were born abroad come from the former Soviet Union
the former Yugoslavia and Turkey, and did not speak German before arriving.
49. But language may not be the only factor involved. Differences in education and living standards
between the origin and destination countries may also play a role. Overall, an analysis of PISA data finds
that immigrant students are particularly at risk of suffering a late-arrival penalty if they arrived at lower
secondary school age from less-developed countries where the home language is not the same as their new
language of instruction. These students have to quickly acquire language skills and catch up with the
higher levels of attainment achieved by their peers, all while coping with the difficulties of adjusting to a
new school and social environment.
50. Figure 24, which presents age-at-arrival profiles of the major immigrant groups in selected
countries, confirms the difficulty of overcoming language barriers. Take Australia and New Zealand:
British students who immigrate to these countries do not suffer a late-arrival penalty. In contrast, children
who were born in China but immigrated to Australia or New Zealand suffer steep late-arrival penalties.
The same pattern is seen in European countries. French children arriving in Luxembourg do not suffer a
late-arrival penalty; and age-at-arrival seems to make no difference to the reading performance among
German students who immigrate to Switzerland. In contrast, 15-year-old students from the former Portugal
and Yugoslavia who arrived in Luxembourg or Switzerland within the previous few years fare much worse
EDU/EDPC/RD(2015)35
33
in reading than immigrant students from the same countries who had spent all their school years in their
new country.
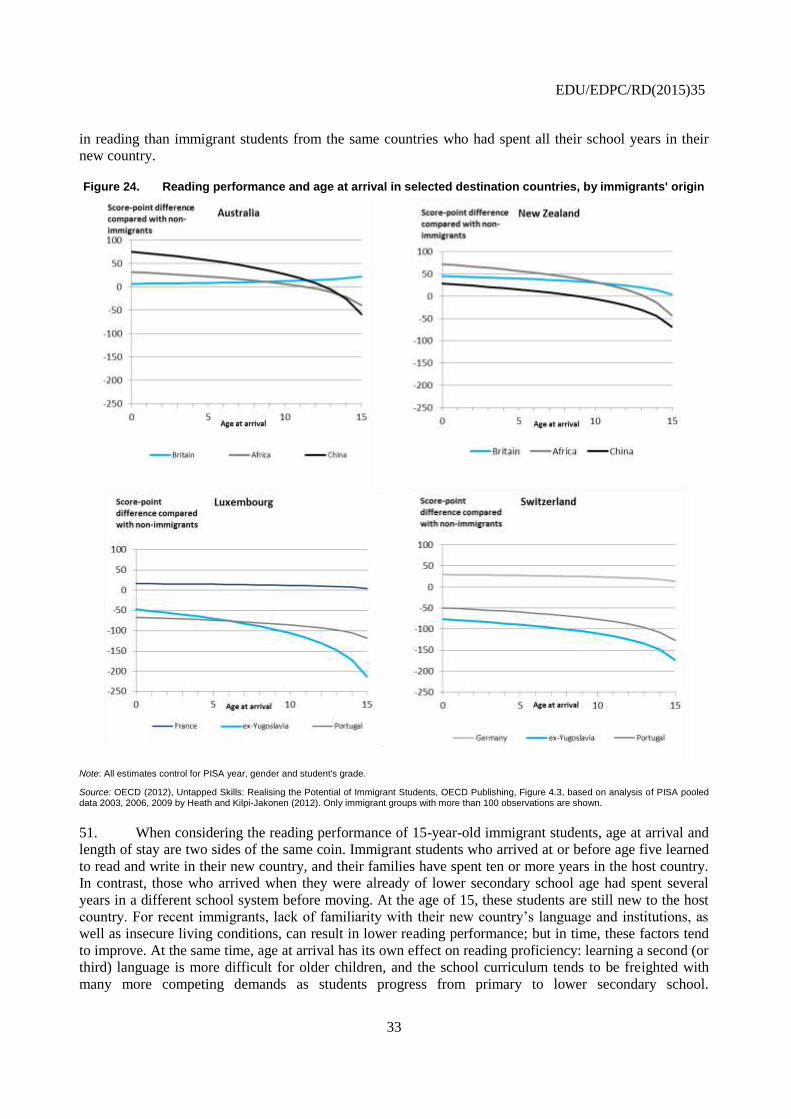
Figure 24. Reading performance and age at arrival in selected destination countries, by immigrants' origin
Note: All estimates control for PISA year, gender and student's grade.
Source: OECD (2012), Untapped Skills: Realising the Potential of Immigrant Students, OECD Publishing, Figure 4.3, based on analysis of PISA pooled data 2003, 2006, 2009 by Heath and Kilpi-Jakonen (2012). Only immigrant groups with more than 100 observations are shown.
51. When considering the reading performance of 15-year-old immigrant students, age at arrival and
length of stay are two sides of the same coin. Immigrant students who arrived at or before age five learned
to read and write in their new country, and their families have spent ten or more years in the host country.
In contrast, those who arrived when they were already of lower secondary school age had spent several
years in a different school system before moving. At the age of 15, these students are still new to the host
country. For recent immigrants, lack of familiarity with their new country’s language and institutions, as
well as insecure living conditions, can result in lower reading performance; but in time, these factors tend
to improve. At the same time, age at arrival has its own effect on reading proficiency: learning a second (or
third) language is more difficult for older children, and the school curriculum tends to be freighted with
many more competing demands as students progress from primary to lower secondary school.
EDU/EDPC/RD(2015)35
34
Unfortunately, given that differences in age at arrival correspond to differences in length of stay, it is
impossible for PISA to disentangle the effect on reading performance of students’ age at arrival from the
effect of how long they have been in their new country.
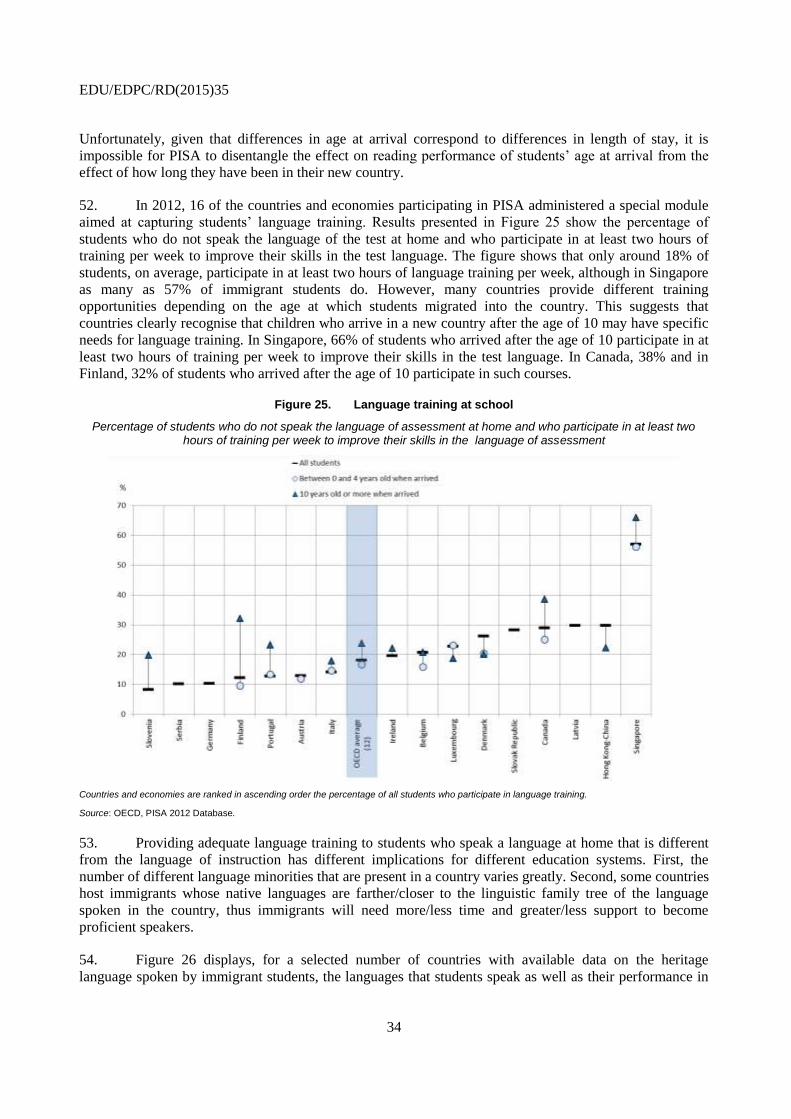
52. In 2012, 16 of the countries and economies participating in PISA administered a special module
aimed at capturing students’ language training. Results presented in Figure 25 show the percentage of
students who do not speak the language of the test at home and who participate in at least two hours of
training per week to improve their skills in the test language. The figure shows that only around 18% of
students, on average, participate in at least two hours of language training per week, although in Singapore
as many as 57% of immigrant students do. However, many countries provide different training
opportunities depending on the age at which students migrated into the country. This suggests that
countries clearly recognise that children who arrive in a new country after the age of 10 may have specific
needs for language training. In Singapore, 66% of students who arrived after the age of 10 participate in at
least two hours of training per week to improve their skills in the test language. In Canada, 38% and in
Finland, 32% of students who arrived after the age of 10 participate in such courses.
Figure 25. Language training at school
Percentage of students who do not speak the language of assessment at home and who participate in at least two hours of training per week to improve their skills in the language of assessment
Countries and economies are ranked in ascending order the percentage of all students who participate in language training.
Source: OECD, PISA 2012 Database.
53. Providing adequate language training to students who speak a language at home that is different
from the language of instruction has different implications for different education systems. First, the
number of different language minorities that are present in a country varies greatly. Second, some countries
host immigrants whose native languages are farther/closer to the linguistic family tree of the language
spoken in the country, thus immigrants will need more/less time and greater/less support to become
proficient speakers.
54. Figure 26 displays, for a selected number of countries with available data on the heritage
language spoken by immigrant students, the languages that students speak as well as their performance in

EDU/EDPC/RD(2015)35
35
the PISA reading assessment (which was administered in the host country language). Figure 26 highlights
that the language profile of students who speak a language at home that is different from the language of
assessment differs markedly across countries. For example, in Germany, 89% of students who do not speak
German at home speak one of the following three languages: Polish, Russian and Turkish. Putting in place
targeted language training in Germany is therefore relatively easy since most of the students who need
such language training share the same heritage language. By contrast, in Sweden, only 32% of students
who do not speak Swedish at home speak Spanish, Arabic or one of the languages of the ex-Yugoslavia,
the three main language groups spoken by non-Swedish speaking students in Sweden.
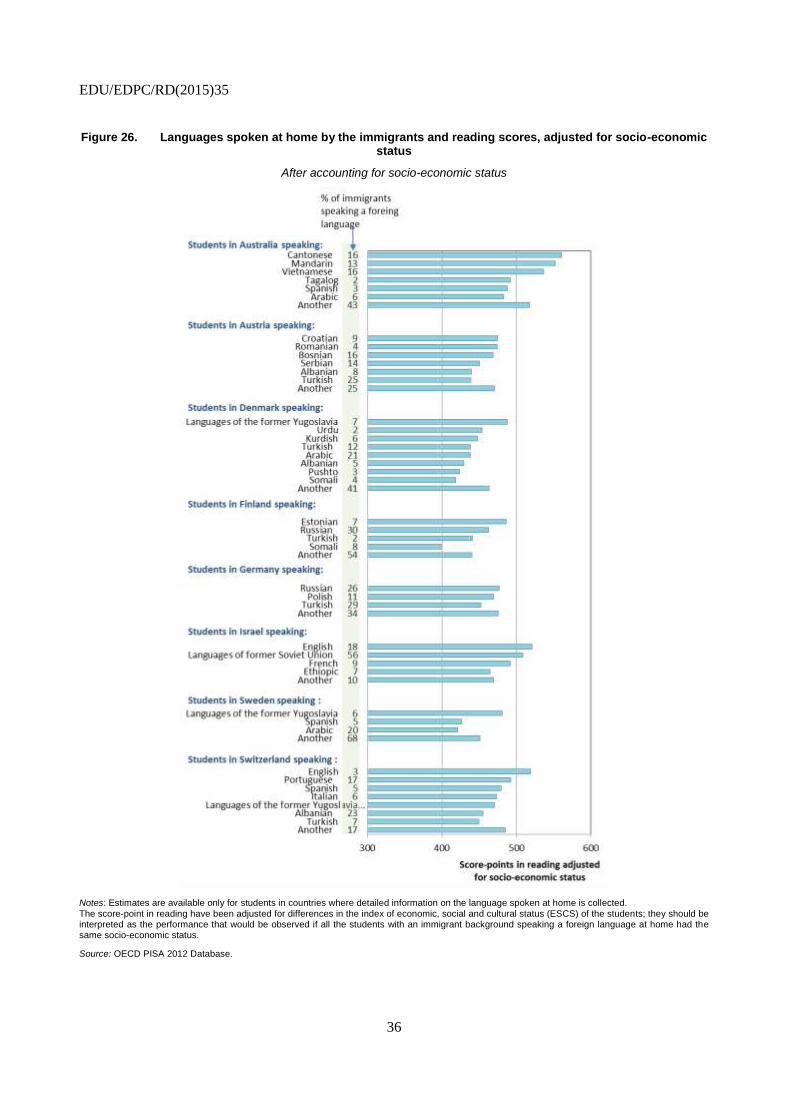
EDU/EDPC/RD(2015)35
36
Figure 26. Languages spoken at home by the immigrants and reading scores, adjusted for socio-economic status
After accounting for socio-economic status
Notes: Estimates are available only for students in countries where detailed information on the language spoken at home is collected. The score-point in reading have been adjusted for differences in the index of economic, social and cultural status (ESCS) of the students; they should be interpreted as the performance that would be observed if all the students with an immigrant background speaking a foreign language at home had the same socio-economic status.
Source: OECD PISA 2012 Database.
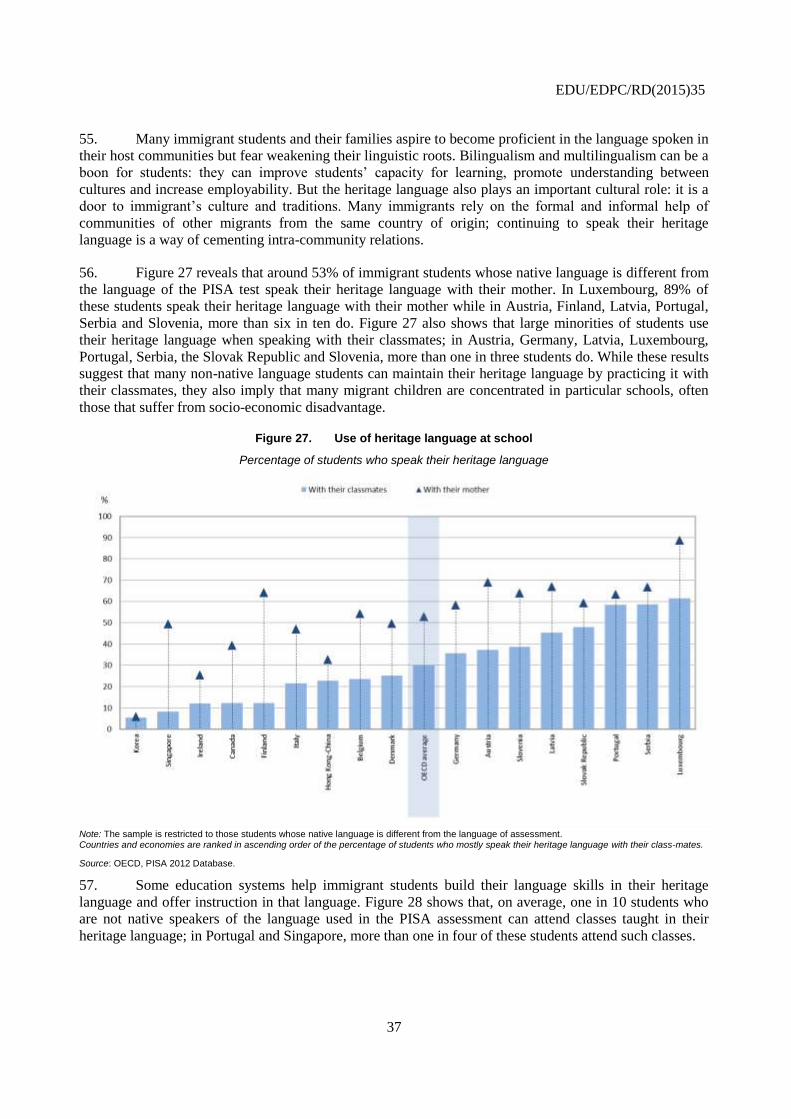
EDU/EDPC/RD(2015)35
37
55. Many immigrant students and their families aspire to become proficient in the language spoken in
their host communities but fear weakening their linguistic roots. Bilingualism and multilingualism can be a
boon for students: they can improve students’ capacity for learning, promote understanding between
cultures and increase employability. But the heritage language also plays an important cultural role: it is a
door to immigrant’s culture and traditions. Many immigrants rely on the formal and informal help of
communities of other migrants from the same country of origin; continuing to speak their heritage
language is a way of cementing intra-community relations.
56. Figure 27 reveals that around 53% of immigrant students whose native language is different from
the language of the PISA test speak their heritage language with their mother. In Luxembourg, 89% of
these students speak their heritage language with their mother while in Austria, Finland, Latvia, Portugal,
Serbia and Slovenia, more than six in ten do. Figure 27 also shows that large minorities of students use
their heritage language when speaking with their classmates; in Austria, Germany, Latvia, Luxembourg,
Portugal, Serbia, the Slovak Republic and Slovenia, more than one in three students do. While these results
suggest that many non-native language students can maintain their heritage language by practicing it with
their classmates, they also imply that many migrant children are concentrated in particular schools, often
those that suffer from socio-economic disadvantage.
Figure 27. Use of heritage language at school
Percentage of students who speak their heritage language
Note: The sample is restricted to those students whose native language is different from the language of assessment. Countries and economies are ranked in ascending order of the percentage of students who mostly speak their heritage language with their class-mates.
Source: OECD, PISA 2012 Database.
57. Some education systems help immigrant students build their language skills in their heritage
language and offer instruction in that language. Figure 28 shows that, on average, one in 10 students who
are not native speakers of the language used in the PISA assessment can attend classes taught in their
heritage language; in Portugal and Singapore, more than one in four of these students attend such classes.
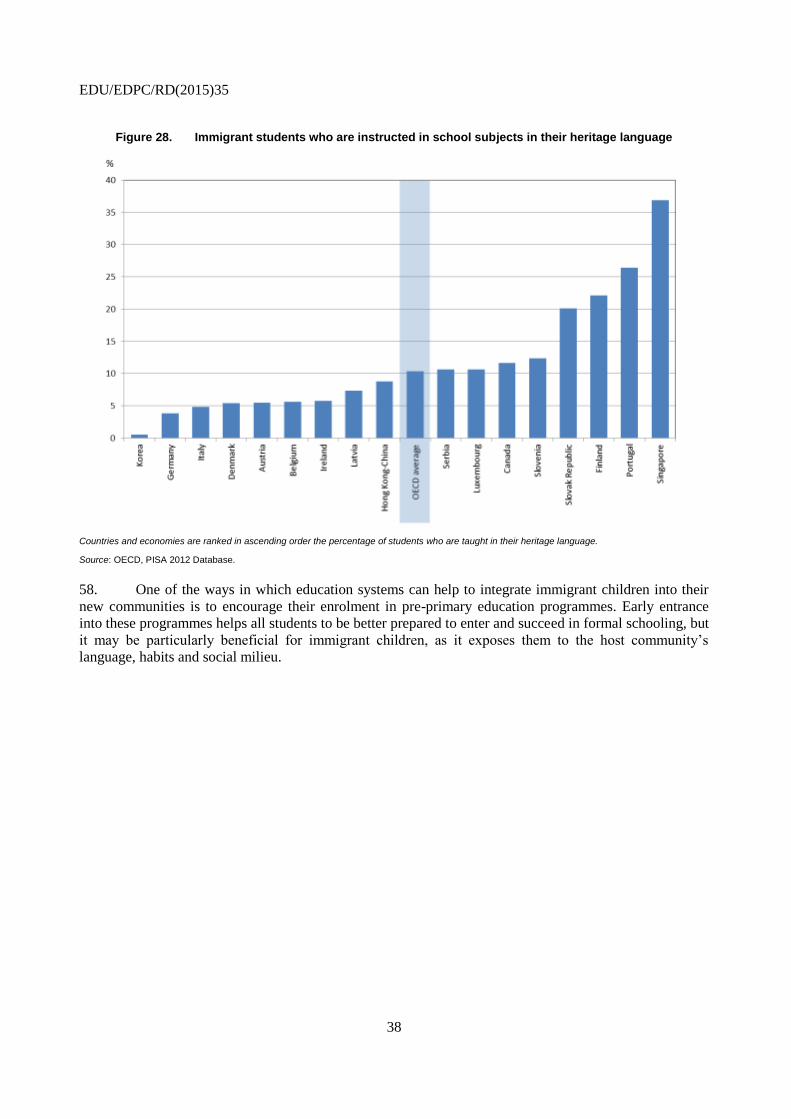
EDU/EDPC/RD(2015)35
38
Figure 28. Immigrant students who are instructed in school subjects in their heritage language
Countries and economies are ranked in ascending order the percentage of students who are taught in their heritage language.
Source: OECD, PISA 2012 Database.
58. One of the ways in which education systems can help to integrate immigrant children into their
new communities is to encourage their enrolment in pre-primary education programmes. Early entrance
into these programmes helps all students to be better prepared to enter and succeed in formal schooling, but
it may be particularly beneficial for immigrant children, as it exposes them to the host community’s
language, habits and social milieu.
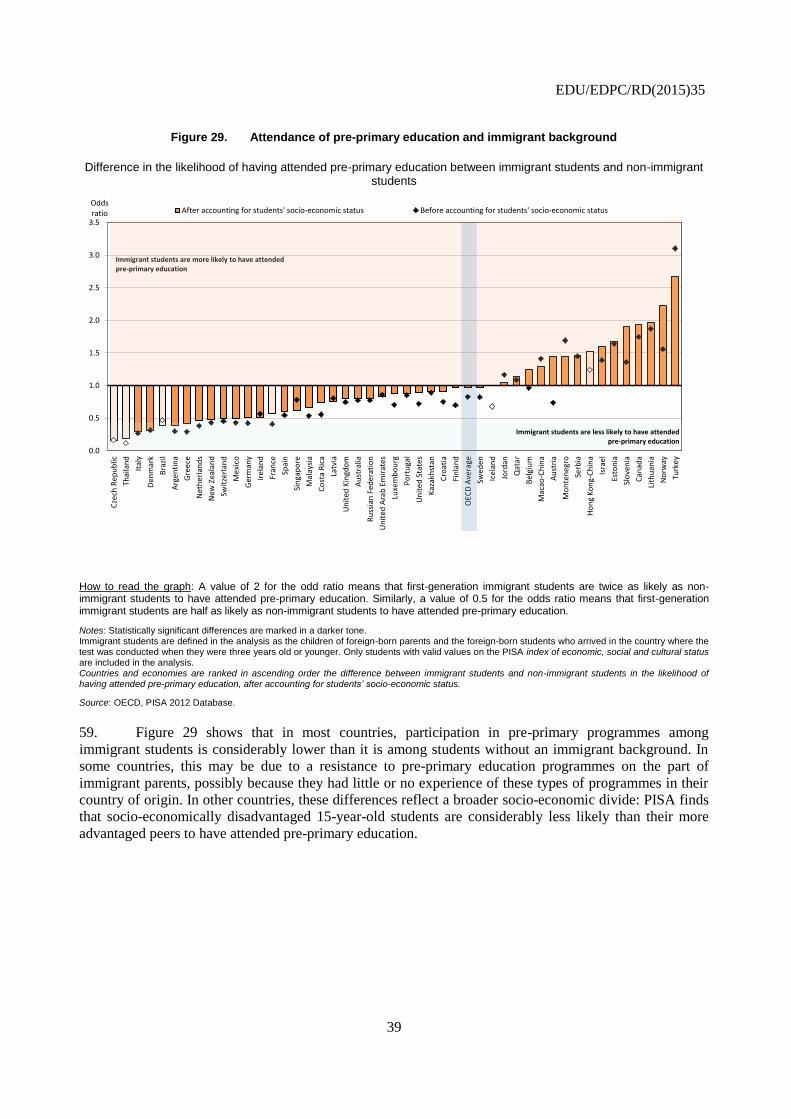
EDU/EDPC/RD(2015)35
39
Figure 29. Attendance of pre-primary education and immigrant background
Difference in the likelihood of having attended pre-primary education between immigrant students and non-immigrant students
How to read the graph: A value of 2 for the odd ratio means that first-generation immigrant students are twice as likely as non-immigrant students to have attended pre-primary education. Similarly, a value of 0.5 for the odds ratio means that first-generation immigrant students are half as likely as non-immigrant students to have attended pre-primary education.
Notes: Statistically significant differences are marked in a darker tone. Immigrant students are defined in the analysis as the children of foreign-born parents and the foreign-born students who arrived in the country where the test was conducted when they were three years old or younger. Only students with valid values on the PISA index of economic, social and cultural status are included in the analysis. Countries and economies are ranked in ascending order the difference between immigrant students and non-immigrant students in the likelihood of having attended pre-primary education, after accounting for students’ socio-economic status.
Source: OECD, PISA 2012 Database.
59. Figure 29 shows that in most countries, participation in pre-primary programmes among
immigrant students is considerably lower than it is among students without an immigrant background. In
some countries, this may be due to a resistance to pre-primary education programmes on the part of
immigrant parents, possibly because they had little or no experience of these types of programmes in their
country of origin. In other countries, these differences reflect a broader socio-economic divide: PISA finds
that socio-economically disadvantaged 15-year-old students are considerably less likely than their more
advantaged peers to have attended pre-primary education.
0.0
0.5
1.0
1.5
2.0
2.5
3.0
3.5
Cze
ch R
epu
blic
Thai
lan
d
Ital
y
De
nm
ark
Bra
zil
Arg
en
tin
a
Gre
ece
Net
her
lan
ds
New
Zea
lan
d
Swit
zerl
and
Me
xico
Ger
man
y
Ire
lan
d
Fran
ce
Spai
n
Sin
gap
ore
Mal
aysi
a
Co
sta
Ric
a
Latv
ia
Un
ite
d K
ingd
om
Au
stra
lia
Ru
ssia
n F
ed
era
tio
n
Un
ite
d A
rab
Em
irat
es
Luxe
mb
ou
rg
Po
rtu
gal
Un
ite
d S
tate
s
Kaz
akh
stan
Cro
atia
Fin
lan
d
OEC
D A
vera
ge
Swed
en
Ice
lan
d
Jord
an
Qat
ar
Be
lgiu
m
Mac
ao-C
hin
a
Au
stri
a
Mo
nte
ne
gro
Serb
ia
Ho
ng
Ko
ng-
Ch
ina
Isra
el
Esto
nia
Slo
ven
ia
Can
ada
Lith
uan
ia
No
rway
Turk
ey
Odds ratio After accounting for students' socio-economic status Before accounting for students' socio-economic status
Immigrant students are more likely to have attended pre-primary education
Immigrant students are less likely to have attendedpre-primary education
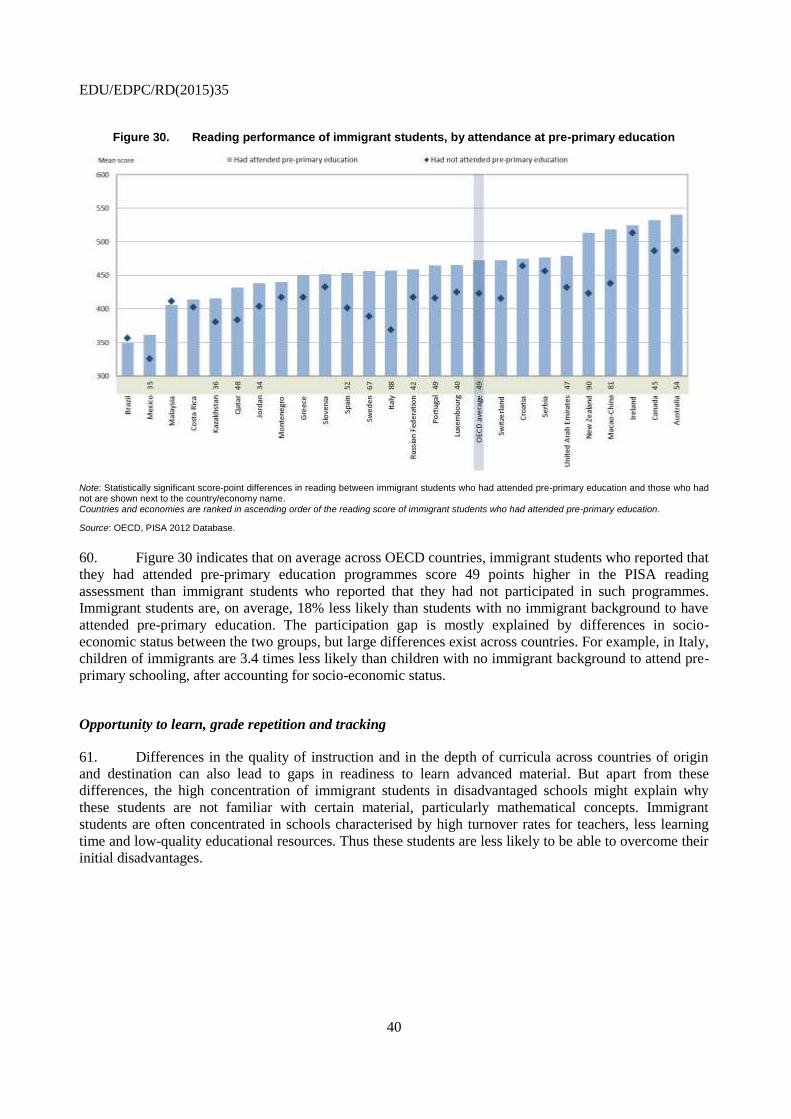
EDU/EDPC/RD(2015)35
40
Figure 30. Reading performance of immigrant students, by attendance at pre-primary education
Note: Statistically significant score-point differences in reading between immigrant students who had attended pre-primary education and those who had not are shown next to the country/economy name. Countries and economies are ranked in ascending order of the reading score of immigrant students who had attended pre-primary education.
Source: OECD, PISA 2012 Database.
60. Figure 30 indicates that on average across OECD countries, immigrant students who reported that
they had attended pre-primary education programmes score 49 points higher in the PISA reading
assessment than immigrant students who reported that they had not participated in such programmes.
Immigrant students are, on average, 18% less likely than students with no immigrant background to have
attended pre-primary education. The participation gap is mostly explained by differences in socio-
economic status between the two groups, but large differences exist across countries. For example, in Italy,
children of immigrants are 3.4 times less likely than children with no immigrant background to attend pre-
primary schooling, after accounting for socio-economic status.
Opportunity to learn, grade repetition and tracking
61. Differences in the quality of instruction and in the depth of curricula across countries of origin
and destination can also lead to gaps in readiness to learn advanced material. But apart from these
differences, the high concentration of immigrant students in disadvantaged schools might explain why
these students are not familiar with certain material, particularly mathematical concepts. Immigrant
students are often concentrated in schools characterised by high turnover rates for teachers, less learning
time and low-quality educational resources. Thus these students are less likely to be able to overcome their
initial disadvantages.
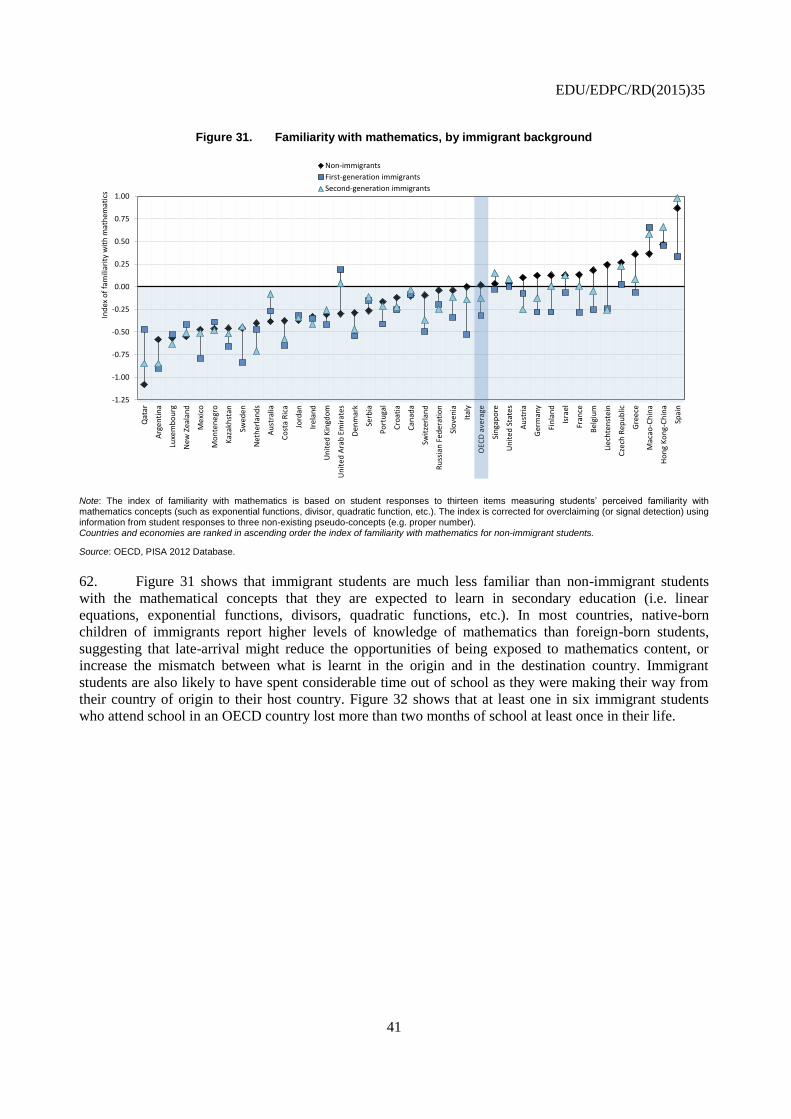
EDU/EDPC/RD(2015)35
41
Figure 31. Familiarity with mathematics, by immigrant background
Note: The index of familiarity with mathematics is based on student responses to thirteen items measuring students’ perceived familiarity with mathematics concepts (such as exponential functions, divisor, quadratic function, etc.). The index is corrected for overclaiming (or signal detection) using information from student responses to three non-existing pseudo-concepts (e.g. proper number). Countries and economies are ranked in ascending order the index of familiarity with mathematics for non-immigrant students.
Source: OECD, PISA 2012 Database.
62. Figure 31 shows that immigrant students are much less familiar than non-immigrant students
with the mathematical concepts that they are expected to learn in secondary education (i.e. linear
equations, exponential functions, divisors, quadratic functions, etc.). In most countries, native-born
children of immigrants report higher levels of knowledge of mathematics than foreign-born students,
suggesting that late-arrival might reduce the opportunities of being exposed to mathematics content, or
increase the mismatch between what is learnt in the origin and in the destination country. Immigrant
students are also likely to have spent considerable time out of school as they were making their way from
their country of origin to their host country. Figure 32 shows that at least one in six immigrant students
who attend school in an OECD country lost more than two months of school at least once in their life.
-1.25
-1.00
-0.75
-0.50
-0.25
0.00
0.25
0.50
0.75
1.00
Qat
ar
Arg
en
tin
a
Luxe
mb
ou
rg
New
Zea
lan
d
Me
xico
Mo
nte
ne
gro
Kaz
akh
stan
Swed
en
Net
her
lan
ds
Au
stra
lia
Co
sta
Ric
a
Jord
an
Ire
lan
d
Un
ite
d K
ingd
om
Un
ite
d A
rab
Em
irat
es
De
nm
ark
Serb
ia
Po
rtu
gal
Cro
atia
Can
ada
Swit
zerl
and
Ru
ssia
n F
ed
era
tio
n
Slo
ven
ia
Ital
y
OEC
D a
vera
ge
Sin
gap
ore
Un
ite
d S
tate
s
Au
stri
a
Ger
man
y
Fin
lan
d
Isra
el
Fran
ce
Be
lgiu
m
Lie
chte
nst
ein
Cze
ch R
epu
blic
Gre
ece
Mac
ao-C
hin
a
Ho
ng
Ko
ng-
Ch
ina
Spai
n
Ind
ex o
f fa
mili
arit
y w
ith
mat
hem
atic
s
Non-immigrants
First-generation immigrants
Second-generation immigrants
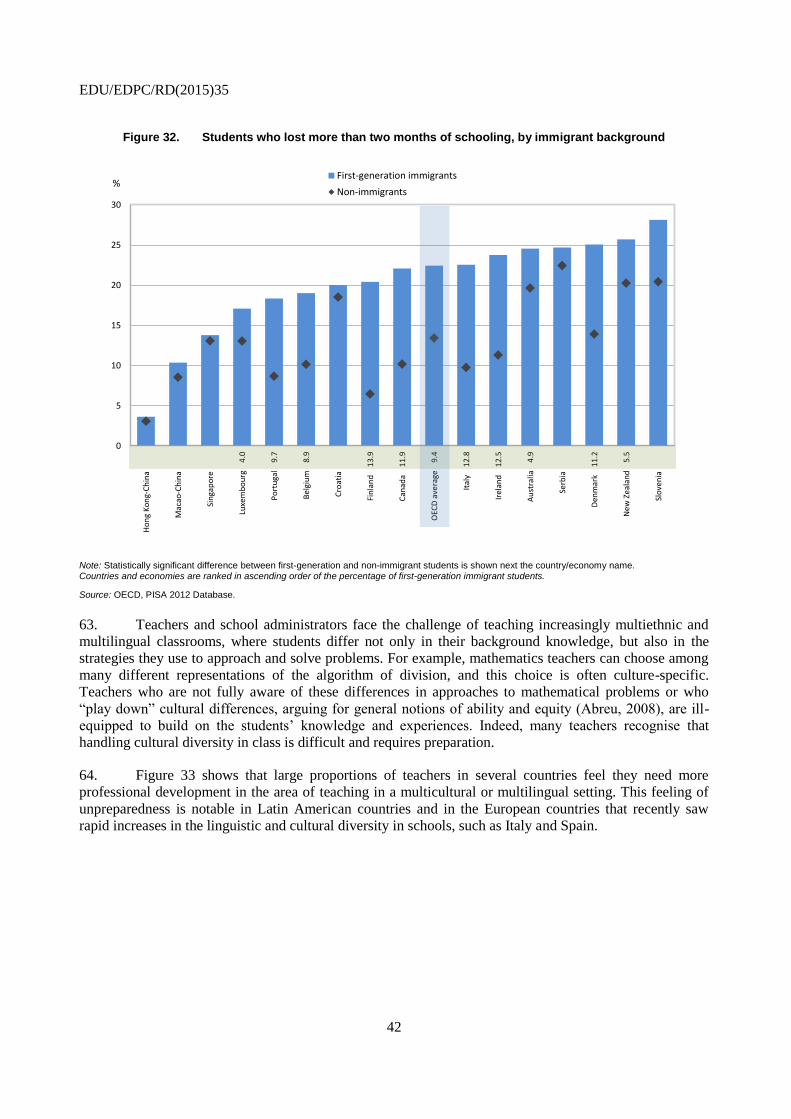
EDU/EDPC/RD(2015)35
42
Figure 32. Students who lost more than two months of schooling, by immigrant background
Note: Statistically significant difference between first-generation and non-immigrant students is shown next the country/economy name. Countries and economies are ranked in ascending order of the percentage of first-generation immigrant students.
Source: OECD, PISA 2012 Database.
63. Teachers and school administrators face the challenge of teaching increasingly multiethnic and
multilingual classrooms, where students differ not only in their background knowledge, but also in the
strategies they use to approach and solve problems. For example, mathematics teachers can choose among
many different representations of the algorithm of division, and this choice is often culture-specific.
Teachers who are not fully aware of these differences in approaches to mathematical problems or who
“play down” cultural differences, arguing for general notions of ability and equity (Abreu, 2008), are ill-
equipped to build on the students’ knowledge and experiences. Indeed, many teachers recognise that
handling cultural diversity in class is difficult and requires preparation.
64. Figure 33 shows that large proportions of teachers in several countries feel they need more
professional development in the area of teaching in a multicultural or multilingual setting. This feeling of
unpreparedness is notable in Latin American countries and in the European countries that recently saw
rapid increases in the linguistic and cultural diversity in schools, such as Italy and Spain.
0
5
10
15
20
25
30
Ho
ng
Ko
ng-
Ch
ina
Mac
ao-C
hin
a
Sin
gap
ore
Luxe
mb
ou
rg
4.0
Po
rtu
gal
9.7
Bel
giu
m
8.9
Cro
atia
Fin
lan
d
13
.9
Can
ada
1
1.9
OEC
D a
vera
ge
9.4
Ital
y
12
.8
Irel
and
1
2.5
Au
stra
lia
4.9
Serb
ia
Den
mar
k
11
.2
Ne
w Z
eal
and
5
.5
Slo
ven
ia
First-generation immigrants
Non-immigrants%
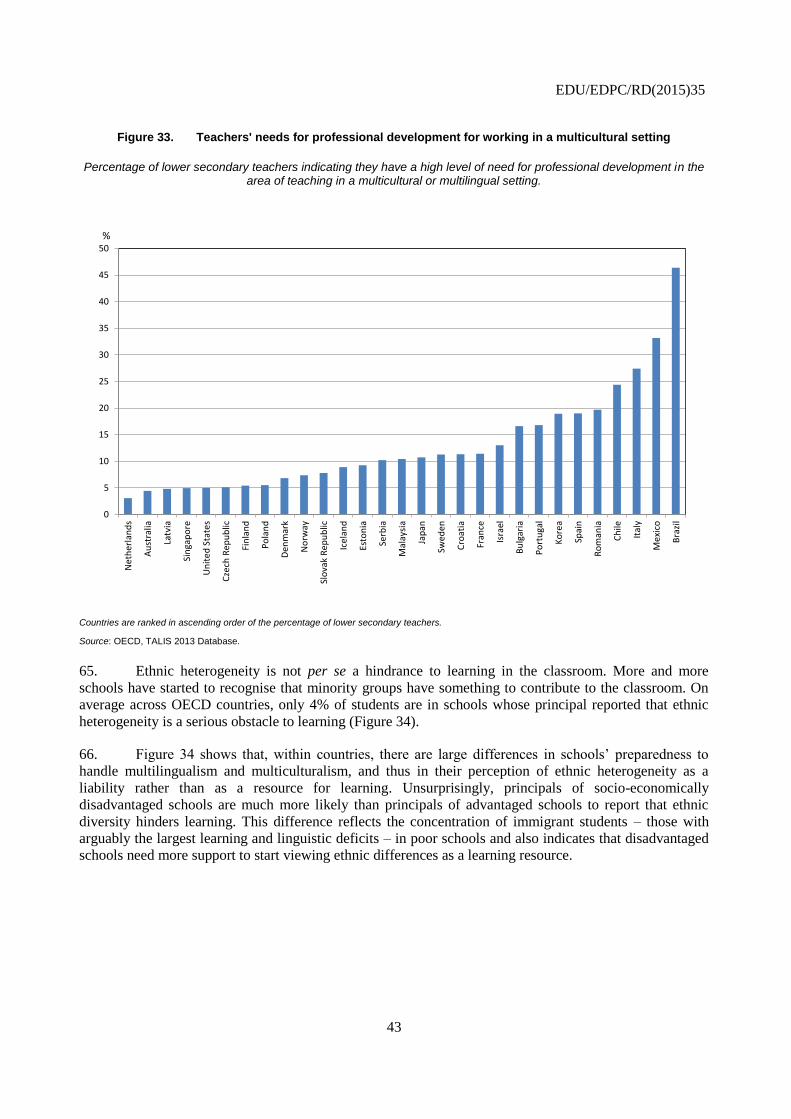
EDU/EDPC/RD(2015)35
43
Figure 33. Teachers' needs for professional development for working in a multicultural setting
Percentage of lower secondary teachers indicating they have a high level of need for professional development in the area of teaching in a multicultural or multilingual setting.
Countries are ranked in ascending order of the percentage of lower secondary teachers.
Source: OECD, TALIS 2013 Database.
65. Ethnic heterogeneity is not per se a hindrance to learning in the classroom. More and more
schools have started to recognise that minority groups have something to contribute to the classroom. On
average across OECD countries, only 4% of students are in schools whose principal reported that ethnic
heterogeneity is a serious obstacle to learning (Figure 34).
66. Figure 34 shows that, within countries, there are large differences in schools’ preparedness to
handle multilingualism and multiculturalism, and thus in their perception of ethnic heterogeneity as a
liability rather than as a resource for learning. Unsurprisingly, principals of socio-economically
disadvantaged schools are much more likely than principals of advantaged schools to report that ethnic
diversity hinders learning. This difference reflects the concentration of immigrant students – those with
arguably the largest learning and linguistic deficits – in poor schools and also indicates that disadvantaged
schools need more support to start viewing ethnic differences as a learning resource.
0
5
10
15
20
25
30
35
40
45
50
Net
her
lan
ds
Au
stra
lia
Latv
ia
Sin
gap
ore
Un
ite
d S
tate
s
Cze
ch R
epu
blic
Fin
lan
d
Po
lan
d
De
nm
ark
No
rway
Slo
vak
Rep
ub
lic
Ice
lan
d
Esto
nia
Serb
ia
Mal
aysi
a
Jap
an
Swed
en
Cro
atia
Fran
ce
Isra
el
Bu
lgar
ia
Po
rtu
gal
Ko
rea
Spai
n
Ro
man
ia
Ch
ile
Ital
y
Me
xico
Bra
zil
%
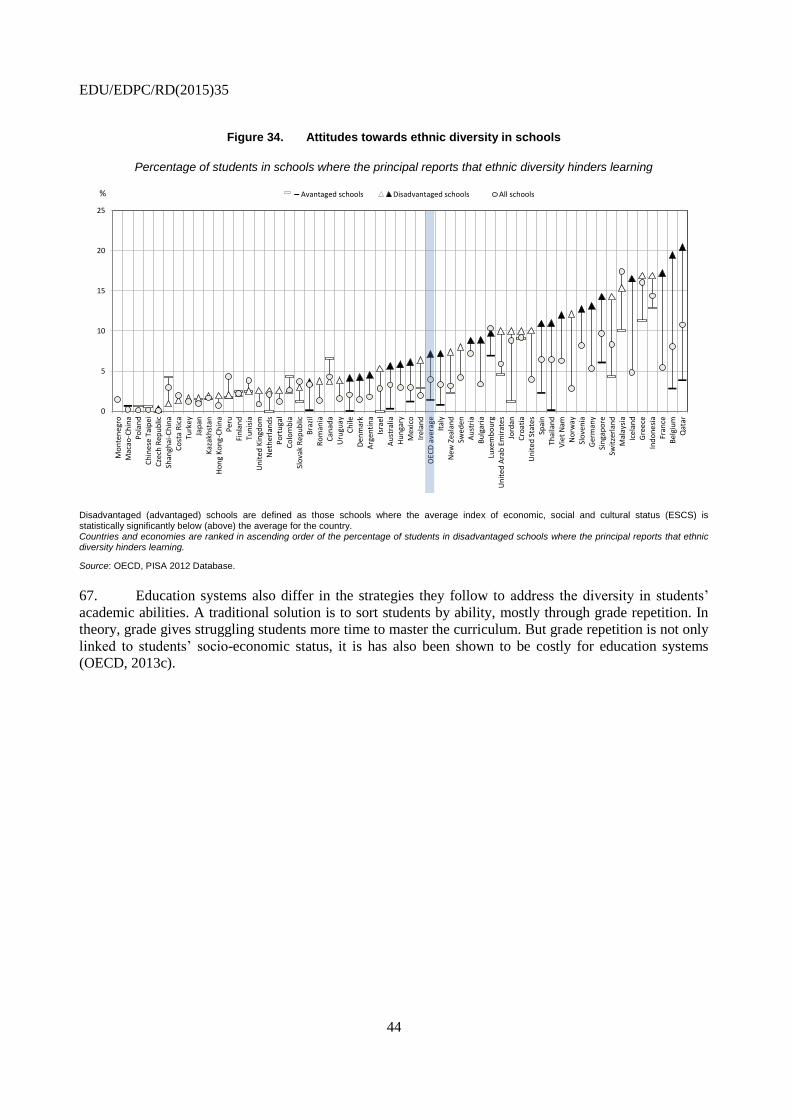
EDU/EDPC/RD(2015)35
44
Figure 34. Attitudes towards ethnic diversity in schools
Percentage of students in schools where the principal reports that ethnic diversity hinders learning
Disadvantaged (advantaged) schools are defined as those schools where the average index of economic, social and cultural status (ESCS) is statistically significantly below (above) the average for the country. Countries and economies are ranked in ascending order of the percentage of students in disadvantaged schools where the principal reports that ethnic diversity hinders learning.
Source: OECD, PISA 2012 Database.
67. Education systems also differ in the strategies they follow to address the diversity in students’
academic abilities. A traditional solution is to sort students by ability, mostly through grade repetition. In
theory, grade gives struggling students more time to master the curriculum. But grade repetition is not only
linked to students’ socio-economic status, it is has also been shown to be costly for education systems
(OECD, 2013c).
0
5
10
15
20
25
Mo
nte
ne
gro
Mac
ao-C
hin
aP
ola
nd
Ch
ine
se T
aip
eiC
zech
Rep
ub
licSh
angh
ai-C
hin
aC
ost
a R
ica
Turk
ey
Jap
anK
azak
hst
anH
on
g K
on
g-C
hin
aP
eru
Fin
lan
dTu
nis
iaU
nit
ed
Kin
gdo
mN
eth
erla
nd
sP
ort
uga
lC
olo
mb
iaSl
ova
k R
epu
blic
Bra
zil
Ro
man
iaC
anad
aU
rugu
ayC
hile
De
nm
ark
Arg
en
tin
aIs
rael
Au
stra
liaH
un
gary
Me
xico
Ire
lan
dO
ECD
ave
rage
Ital
yN
ew Z
eala
nd
Swed
en
Au
stri
aB
ulg
aria
Luxe
mb
ou
rgU
nit
ed
Ara
b E
mir
ate
sJo
rdan
Cro
atia
Un
ite
d S
tate
sSp
ain
Thai
lan
dV
iet
Nam
No
rway
Slo
ven
iaG
erm
any
Sin
gap
ore
Swit
zerl
and
Mal
aysi
aIc
ela
nd
Gre
ece
Ind
on
esi
aFr
ance
Be
lgiu
mQ
atar
Avantaged schools Disadvantaged schools All schools%
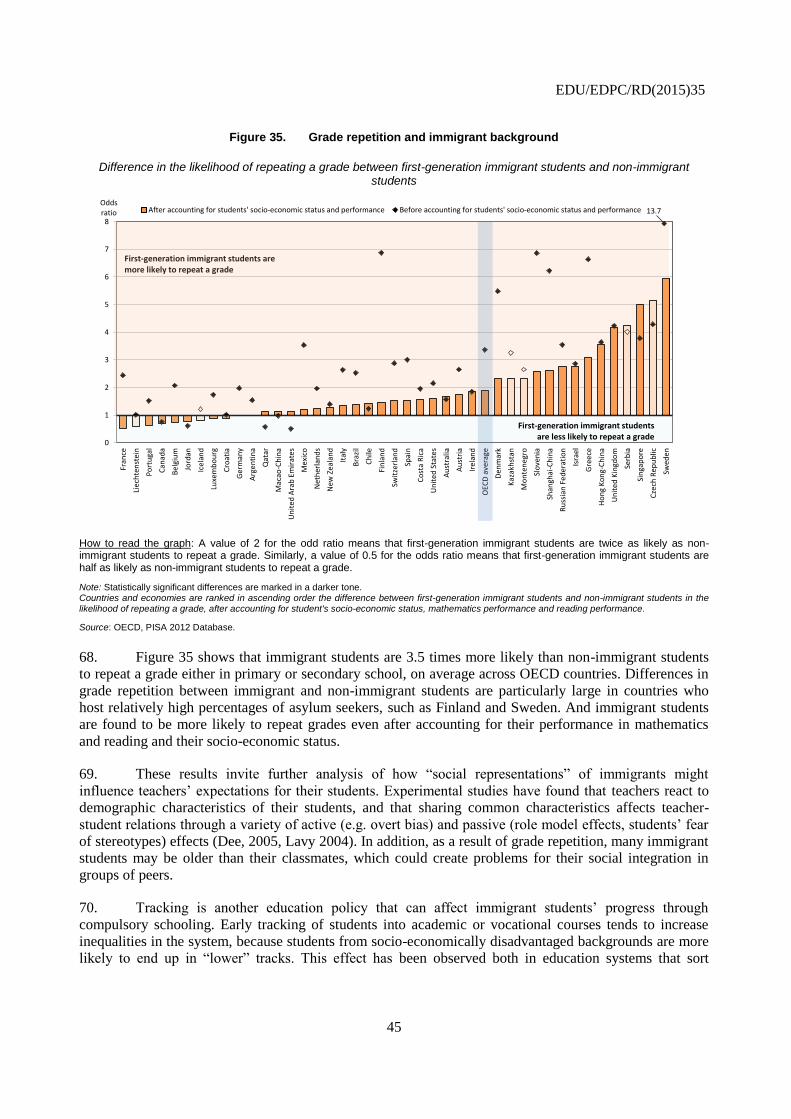
EDU/EDPC/RD(2015)35
45
Figure 35. Grade repetition and immigrant background
Difference in the likelihood of repeating a grade between first-generation immigrant students and non-immigrant students
How to read the graph: A value of 2 for the odd ratio means that first-generation immigrant students are twice as likely as non-immigrant students to repeat a grade. Similarly, a value of 0.5 for the odds ratio means that first-generation immigrant students are half as likely as non-immigrant students to repeat a grade.
Note: Statistically significant differences are marked in a darker tone. Countries and economies are ranked in ascending order the difference between first-generation immigrant students and non-immigrant students in the likelihood of repeating a grade, after accounting for student's socio-economic status, mathematics performance and reading performance.
Source: OECD, PISA 2012 Database.
68. Figure 35 shows that immigrant students are 3.5 times more likely than non-immigrant students
to repeat a grade either in primary or secondary school, on average across OECD countries. Differences in
grade repetition between immigrant and non-immigrant students are particularly large in countries who
host relatively high percentages of asylum seekers, such as Finland and Sweden. And immigrant students
are found to be more likely to repeat grades even after accounting for their performance in mathematics
and reading and their socio-economic status.
69. These results invite further analysis of how “social representations” of immigrants might
influence teachers’ expectations for their students. Experimental studies have found that teachers react to
demographic characteristics of their students, and that sharing common characteristics affects teacher-
student relations through a variety of active (e.g. overt bias) and passive (role model effects, students’ fear
of stereotypes) effects (Dee, 2005, Lavy 2004). In addition, as a result of grade repetition, many immigrant
students may be older than their classmates, which could create problems for their social integration in
groups of peers.
70. Tracking is another education policy that can affect immigrant students’ progress through
compulsory schooling. Early tracking of students into academic or vocational courses tends to increase
inequalities in the system, because students from socio-economically disadvantaged backgrounds are more
likely to end up in “lower” tracks. This effect has been observed both in education systems that sort
0
1
2
3
4
5
6
7
8
Fran
ce
Lie
chte
nst
ein
Po
rtu
gal
Can
ada
Be
lgiu
m
Jord
an
Ice
lan
d
Luxe
mb
ou
rg
Cro
atia
Ger
man
y
Arg
en
tin
a
Qat
ar
Mac
ao-C
hin
a
Un
ite
d A
rab
Em
irat
es
Me
xico
Net
her
lan
ds
New
Zea
lan
d
Ital
y
Bra
zil
Ch
ile
Fin
lan
d
Swit
zerl
and
Spai
n
Co
sta
Ric
a
Un
ite
d S
tate
s
Au
stra
lia
Au
stri
a
Ire
lan
d
OEC
D a
vera
ge
De
nm
ark
Kaz
akh
stan
Mo
nte
ne
gro
Slo
ven
ia
Shan
ghai
-Ch
ina
Ru
ssia
n F
ed
era
tio
n
Isra
el
Gre
ece
Ho
ng
Ko
ng-
Ch
ina
Un
ite
d K
ingd
om
Serb
ia
Sin
gap
ore
Cze
ch R
epu
blic
Swed
en
Odds ratio After accounting for students' socio-economic status and performance Before accounting for students' socio-economic status and performance 13.7
First-generation immigrant students are more likely to repeat a grade
First-generation immigrant students are less likely to repeat a grade
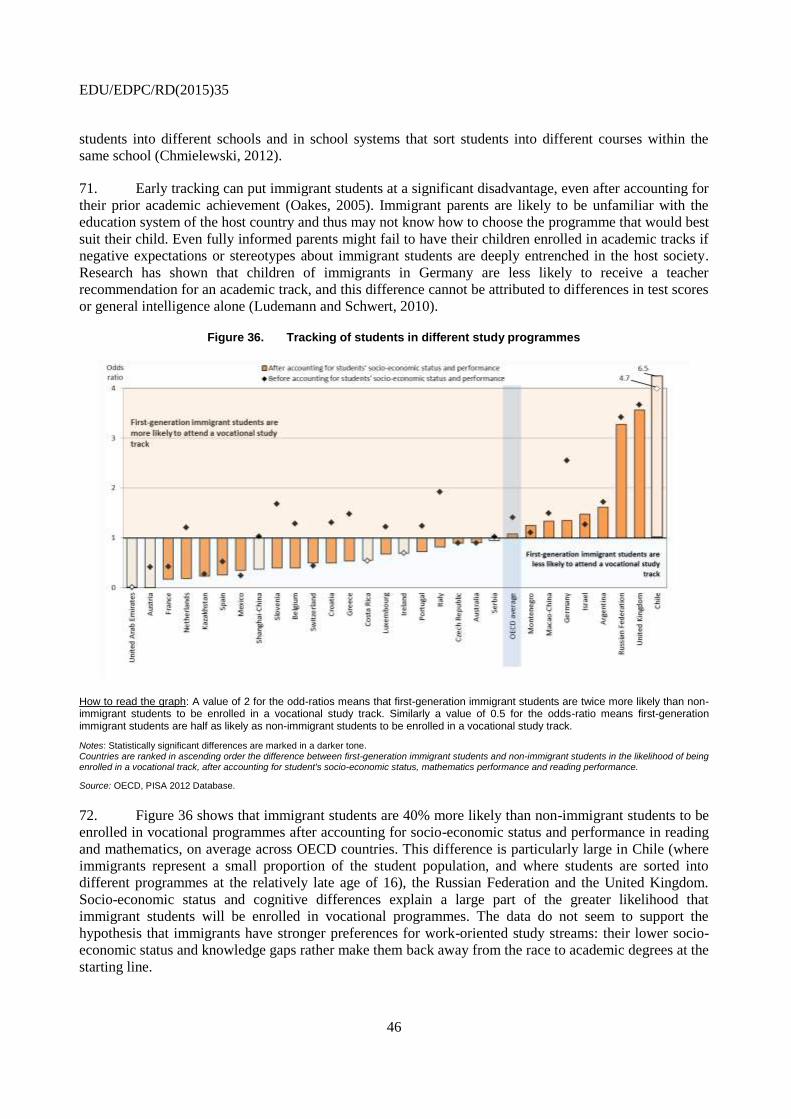
EDU/EDPC/RD(2015)35
46
students into different schools and in school systems that sort students into different courses within the
same school (Chmielewski, 2012).
71. Early tracking can put immigrant students at a significant disadvantage, even after accounting for
their prior academic achievement (Oakes, 2005). Immigrant parents are likely to be unfamiliar with the
education system of the host country and thus may not know how to choose the programme that would best
suit their child. Even fully informed parents might fail to have their children enrolled in academic tracks if
negative expectations or stereotypes about immigrant students are deeply entrenched in the host society.
Research has shown that children of immigrants in Germany are less likely to receive a teacher
recommendation for an academic track, and this difference cannot be attributed to differences in test scores
or general intelligence alone (Ludemann and Schwert, 2010).
Figure 36. Tracking of students in different study programmes
How to read the graph: A value of 2 for the odd-ratios means that first-generation immigrant students are twice more likely than non-immigrant students to be enrolled in a vocational study track. Similarly a value of 0.5 for the odds-ratio means first-generation immigrant students are half as likely as non-immigrant students to be enrolled in a vocational study track.
Notes: Statistically significant differences are marked in a darker tone. Countries are ranked in ascending order the difference between first-generation immigrant students and non-immigrant students in the likelihood of being enrolled in a vocational track, after accounting for student's socio-economic status, mathematics performance and reading performance.
Source: OECD, PISA 2012 Database.
72. Figure 36 shows that immigrant students are 40% more likely than non-immigrant students to be
enrolled in vocational programmes after accounting for socio-economic status and performance in reading
and mathematics, on average across OECD countries. This difference is particularly large in Chile (where
immigrants represent a small proportion of the student population, and where students are sorted into
different programmes at the relatively late age of 16), the Russian Federation and the United Kingdom.
Socio-economic status and cognitive differences explain a large part of the greater likelihood that
immigrant students will be enrolled in vocational programmes. The data do not seem to support the
hypothesis that immigrants have stronger preferences for work-oriented study streams: their lower socio-
economic status and knowledge gaps rather make them back away from the race to academic degrees at the
starting line.
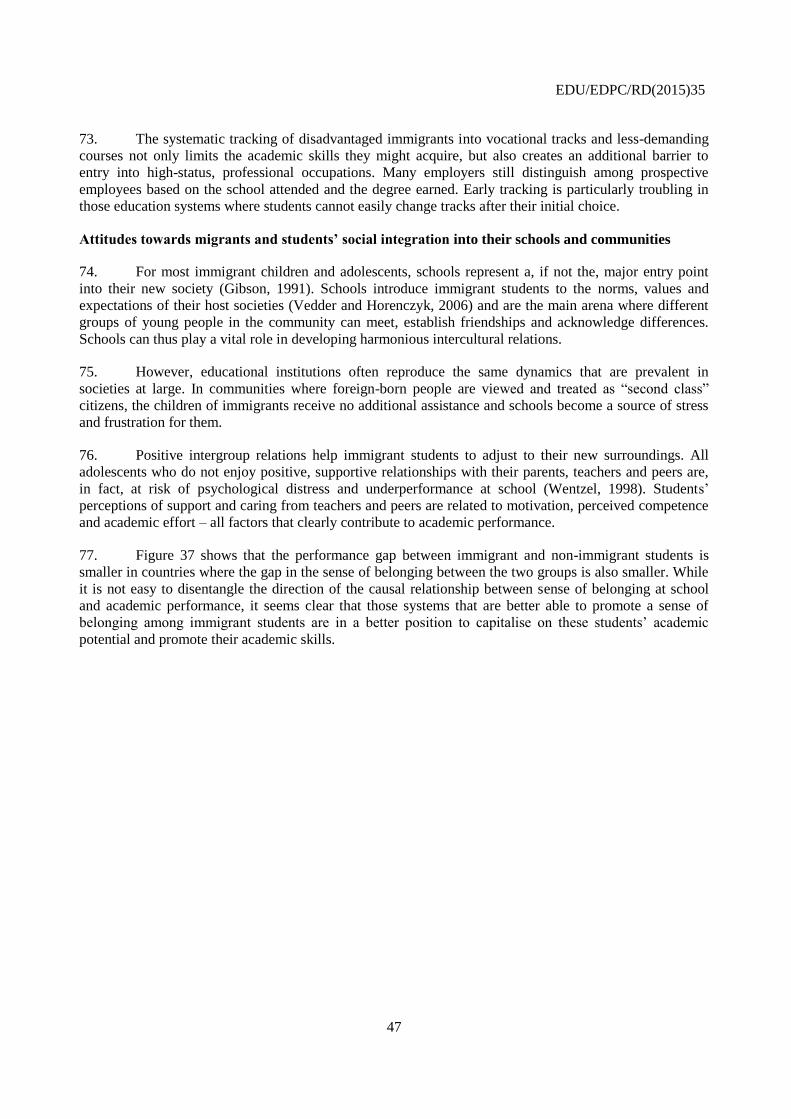
EDU/EDPC/RD(2015)35
47
73. The systematic tracking of disadvantaged immigrants into vocational tracks and less-demanding
courses not only limits the academic skills they might acquire, but also creates an additional barrier to
entry into high-status, professional occupations. Many employers still distinguish among prospective
employees based on the school attended and the degree earned. Early tracking is particularly troubling in
those education systems where students cannot easily change tracks after their initial choice.
Attitudes towards migrants and students’ social integration into their schools and communities
74. For most immigrant children and adolescents, schools represent a, if not the, major entry point
into their new society (Gibson, 1991). Schools introduce immigrant students to the norms, values and
expectations of their host societies (Vedder and Horenczyk, 2006) and are the main arena where different
groups of young people in the community can meet, establish friendships and acknowledge differences.
Schools can thus play a vital role in developing harmonious intercultural relations.
75. However, educational institutions often reproduce the same dynamics that are prevalent in
societies at large. In communities where foreign-born people are viewed and treated as “second class”
citizens, the children of immigrants receive no additional assistance and schools become a source of stress
and frustration for them.
76. Positive intergroup relations help immigrant students to adjust to their new surroundings. All
adolescents who do not enjoy positive, supportive relationships with their parents, teachers and peers are,
in fact, at risk of psychological distress and underperformance at school (Wentzel, 1998). Students’
perceptions of support and caring from teachers and peers are related to motivation, perceived competence
and academic effort – all factors that clearly contribute to academic performance.
77. Figure 37 shows that the performance gap between immigrant and non-immigrant students is
smaller in countries where the gap in the sense of belonging between the two groups is also smaller. While
it is not easy to disentangle the direction of the causal relationship between sense of belonging at school
and academic performance, it seems clear that those systems that are better able to promote a sense of
belonging among immigrant students are in a better position to capitalise on these students’ academic
potential and promote their academic skills.
EDU/EDPC/RD(2015)35
48
Figure 37. Relationship between sense of belonging and performance at school
Difference between non-immigrants and first-generation immigrants after accounting for socio-economic status
Note: Sense of belonging is defined as the percentage of students who reported that they feel like they belong at school.
Source: OECD, PISA 2012 Database.
78. Beyond academic achievement, students’ well-being and development is shaped by their own and
their family’s interactions with the different groups in their host communities. It is thus important to
consider immigrant students’ adjustment at school from the perspective of their psychological adaptation.
Psychological adaptation refers to “a set of psychological outcomes, including a sense of personal and
cultural identity, good mental health, and the achievement of personal satisfaction in the new cultural
context” (Berry and Sam, 1997, page 299).
79. Perceptions of discrimination are a psychological reality for many immigrants and the most
serious threat to their psychological adaptation. More than 20% of the native-born children of immigrants
in Europe consider themselves members of a group that is or has been discriminated against on the grounds
of ethnicity, nationality or race (OECD, 2015a). Perceptions of discrimination in Europe are higher among
the native-born children of immigrants than among their peers who have actually immigrated.
Discrimination contributes to young immigrants’ self-perception as outsiders, which exacerbates their
difficulty in resourceful finding the inner resilience to overcome social barriers and deal effectively with
daily problems.
80. Discriminatory attitudes are often viewed as typical of those who have little exposure to “others”.
But the increases in migration flows mean that most people have had some direct contact with those who
speak different languages, eat different foods, hold different religious beliefs and follow different
traditions. Many appreciate the economic and social contributions migrants make to their communities. For
example, given falling fertility rates and lack of qualified workers in key sectors of the economy, many
OECD countries stand to benefit from migration.
81. Yet despite the important role migrants play in the labour market of host countries, the value of
migration is often not properly understood by resident populations, and negative attitudes towards
United Arab Emirates
Argentina
Australia Austria
Belgium
Brazil
Canada
Switzerland
Chile
Costa Rica
Czech Republic
Germany
Denmark
Spain
OECD average
Finland
France
United Kingdom
Greece
Hong Kong-China
Croatia
Ireland
Iceland
Israel
Italy
JordanKazakhstan
Liechtenstein
Luxembourg
Macao-China
Mexico
Montenegro
Netherlands
Norway
New Zealand
Portugal
Qatar
Russian Federation
Singapore
Serbia
Slovenia
Sweden
United States
R² = 0.22
-80
-60
-40
-20
0
20
40
60
80
100
-10 -5 0 5 10 15 20
Sco
re-p
oin
t d
iffe
ren
ce i
n r
ead
ing
Percentage point difference in sense of belonging
EDU/EDPC/RD(2015)35
49
immigration are widespread in many countries (Davidov et al., 2008). The surge of international migration
over the past few decades has created tensions in many OECD countries and has led to the adoption of
more restrictive immigration policies favouring a more selective intake of skilled migrants (OECD, 2015a).
82. Using data from the European Social Survey, Figure 38 details public attitudes towards migration
in European countries – including some of the countries that are facing the largest migration inflows as a
result of current geopolitical instabilities. Migration flows are placing great demands on many European
political leaders and welfare systems. Some citizens, already worried about the state of the economy and
the impact of reforms in social and welfare systems introduced in the aftermath of the economic crisis,
regard both migrants and political institutions with distrust.
83. In 2012, residents in European countries were asked to report whether they believe that their
country is made a worse or better place to live by immigrants coming from other countries. Respondents
were asked to use a scale ranging from 0 (worse place to live) to 10 (better place to live). On average
across the countries shown in Figure 38, residents assigned a value of 5 on the scale, while individuals
living in Iceland and Sweden reported mean values close to 6.5. By contrast, residents in the Czech
Republic, France, Hungary, Italy, Portugal, the Russian Federation and the Slovak Republic reported mean
values of below 4.5, signalling a greater prevalence of negative attitudes towards immigrants.
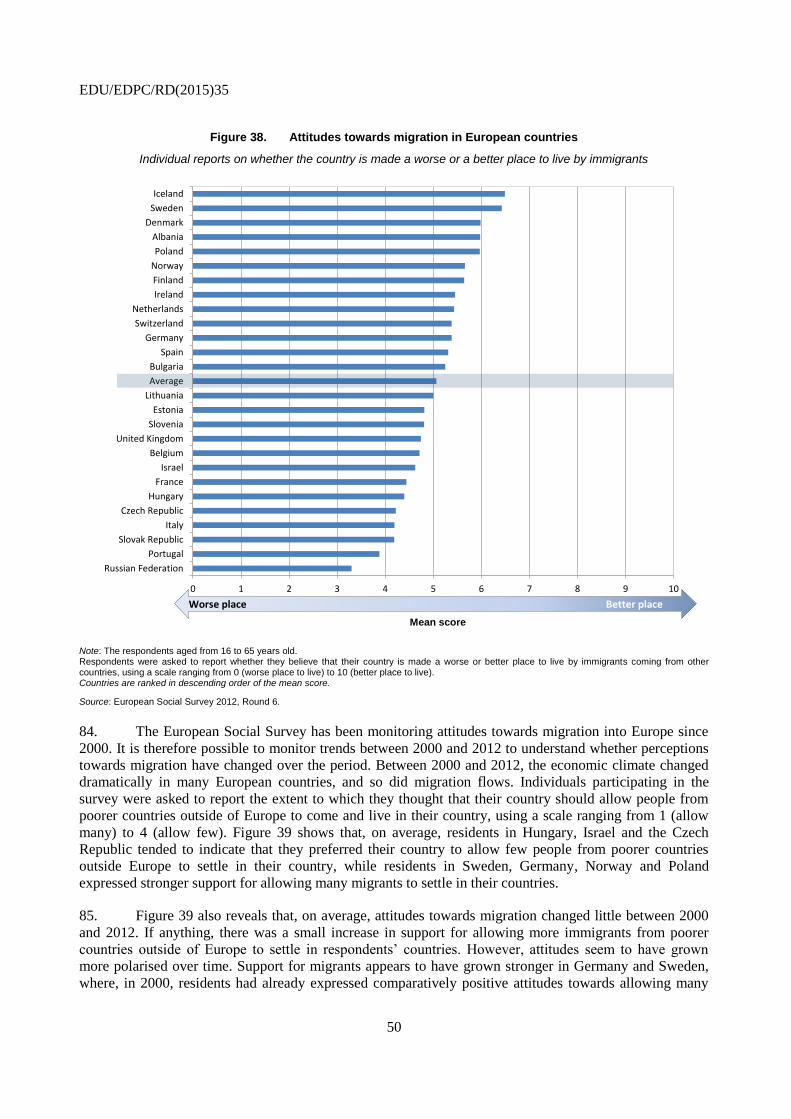
EDU/EDPC/RD(2015)35
50
Figure 38. Attitudes towards migration in European countries
Individual reports on whether the country is made a worse or a better place to live by immigrants
Note: The respondents aged from 16 to 65 years old. Respondents were asked to report whether they believe that their country is made a worse or better place to live by immigrants coming from other countries, using a scale ranging from 0 (worse place to live) to 10 (better place to live). Countries are ranked in descending order of the mean score.
Source: European Social Survey 2012, Round 6.
84. The European Social Survey has been monitoring attitudes towards migration into Europe since
2000. It is therefore possible to monitor trends between 2000 and 2012 to understand whether perceptions
towards migration have changed over the period. Between 2000 and 2012, the economic climate changed
dramatically in many European countries, and so did migration flows. Individuals participating in the
survey were asked to report the extent to which they thought that their country should allow people from
poorer countries outside of Europe to come and live in their country, using a scale ranging from 1 (allow
many) to 4 (allow few). Figure 39 shows that, on average, residents in Hungary, Israel and the Czech
Republic tended to indicate that they preferred their country to allow few people from poorer countries
outside Europe to settle in their country, while residents in Sweden, Germany, Norway and Poland
expressed stronger support for allowing many migrants to settle in their countries.
85. Figure 39 also reveals that, on average, attitudes towards migration changed little between 2000
and 2012. If anything, there was a small increase in support for allowing more immigrants from poorer
countries outside of Europe to settle in respondents’ countries. However, attitudes seem to have grown
more polarised over time. Support for migrants appears to have grown stronger in Germany and Sweden,
where, in 2000, residents had already expressed comparatively positive attitudes towards allowing many
0 1 2 3 4 5 6 7 8 9 10
Russian Federation
Portugal
Slovak Republic
Italy
Czech Republic
Hungary
France
Israel
Belgium
United Kingdom
Slovenia
Estonia
Lithuania
Average
Bulgaria
Spain
Germany
Switzerland
Netherlands
Ireland
Finland
Norway
Poland
Albania
Denmark
Sweden
Iceland
Mean score
Worse place Better place
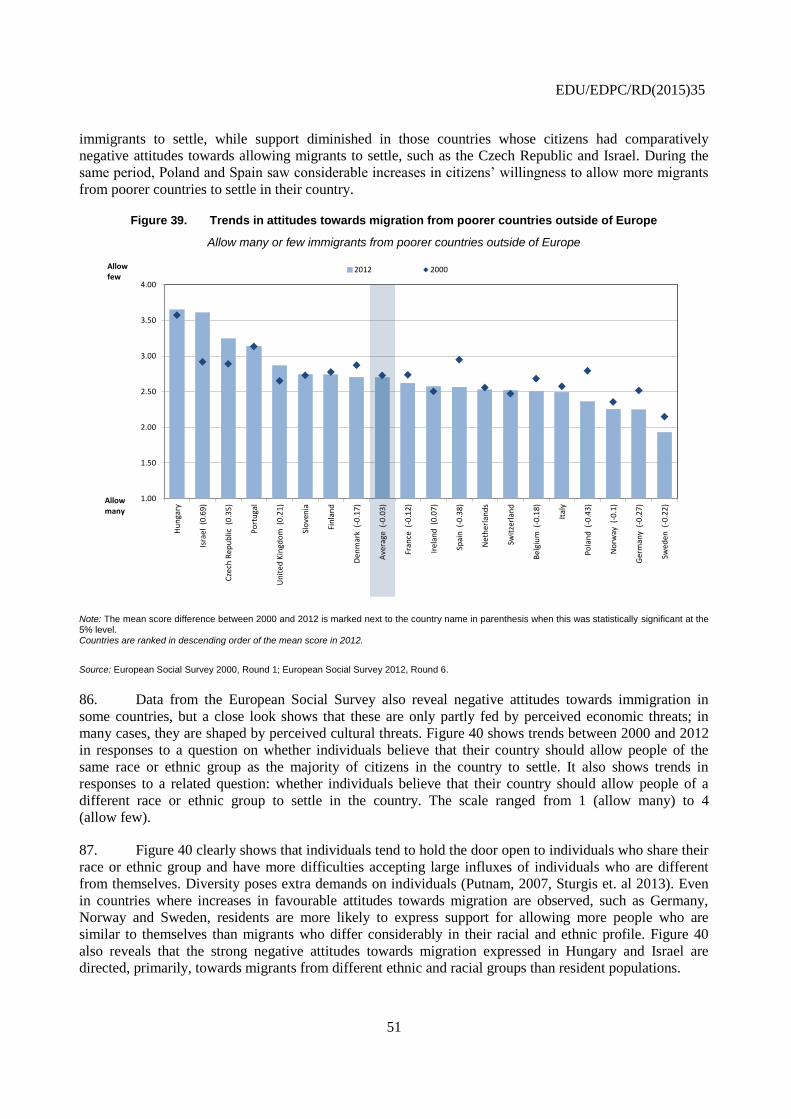
EDU/EDPC/RD(2015)35
51
immigrants to settle, while support diminished in those countries whose citizens had comparatively
negative attitudes towards allowing migrants to settle, such as the Czech Republic and Israel. During the
same period, Poland and Spain saw considerable increases in citizens’ willingness to allow more migrants
from poorer countries to settle in their country.
Figure 39. Trends in attitudes towards migration from poorer countries outside of Europe
Allow many or few immigrants from poorer countries outside of Europe
Note: The mean score difference between 2000 and 2012 is marked next to the country name in parenthesis when this was statistically significant at the 5% level. Countries are ranked in descending order of the mean score in 2012.
Source: European Social Survey 2000, Round 1; European Social Survey 2012, Round 6.
86. Data from the European Social Survey also reveal negative attitudes towards immigration in
some countries, but a close look shows that these are only partly fed by perceived economic threats; in
many cases, they are shaped by perceived cultural threats. Figure 40 shows trends between 2000 and 2012
in responses to a question on whether individuals believe that their country should allow people of the
same race or ethnic group as the majority of citizens in the country to settle. It also shows trends in
responses to a related question: whether individuals believe that their country should allow people of a
different race or ethnic group to settle in the country. The scale ranged from 1 (allow many) to 4
(allow few).
87. Figure 40 clearly shows that individuals tend to hold the door open to individuals who share their
race or ethnic group and have more difficulties accepting large influxes of individuals who are different
from themselves. Diversity poses extra demands on individuals (Putnam, 2007, Sturgis et. al 2013). Even
in countries where increases in favourable attitudes towards migration are observed, such as Germany,
Norway and Sweden, residents are more likely to express support for allowing more people who are
similar to themselves than migrants who differ considerably in their racial and ethnic profile. Figure 40
also reveals that the strong negative attitudes towards migration expressed in Hungary and Israel are
directed, primarily, towards migrants from different ethnic and racial groups than resident populations.
1.00
1.50
2.00
2.50
3.00
3.50
4.00
Hu
nga
ry
Isra
el (
0.6
9)
Cze
ch R
epu
blic
(0
.35
)
Po
rtu
gal
Un
ite
d K
ingd
om
(0
.21
)
Slo
ven
ia
Fin
lan
d
De
nm
ark
(-0
.17
)
Ave
rage
(-0
.03
)
Fran
ce (
-0.1
2)
Ire
lan
d (
0.0
7)
Spai
n (
-0.3
8)
Net
her
lan
ds
Swit
zerl
and
Be
lgiu
m (
-0.1
8)
Ital
y
Po
lan
d (
-0.4
3)
No
rway
(-0
.1)
Ger
man
y (
-0.2
7)
Swed
en
(-0
.22
)
2012 2000Allow few
Allow many
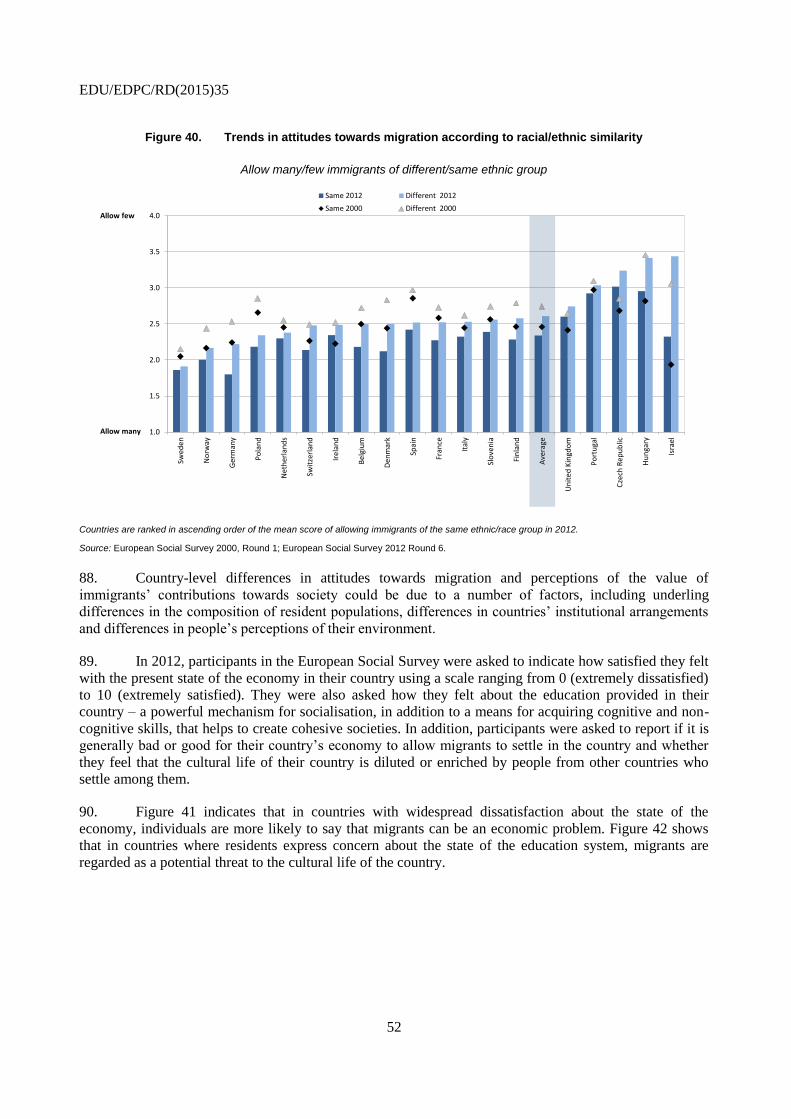
EDU/EDPC/RD(2015)35
52
Figure 40. Trends in attitudes towards migration according to racial/ethnic similarity
Allow many/few immigrants of different/same ethnic group
Countries are ranked in ascending order of the mean score of allowing immigrants of the same ethnic/race group in 2012.
Source: European Social Survey 2000, Round 1; European Social Survey 2012 Round 6.
88. Country-level differences in attitudes towards migration and perceptions of the value of
immigrants’ contributions towards society could be due to a number of factors, including underling
differences in the composition of resident populations, differences in countries’ institutional arrangements
and differences in people’s perceptions of their environment.
89. In 2012, participants in the European Social Survey were asked to indicate how satisfied they felt
with the present state of the economy in their country using a scale ranging from 0 (extremely dissatisfied)
to 10 (extremely satisfied). They were also asked how they felt about the education provided in their
country – a powerful mechanism for socialisation, in addition to a means for acquiring cognitive and non-
cognitive skills, that helps to create cohesive societies. In addition, participants were asked to report if it is
generally bad or good for their country’s economy to allow migrants to settle in the country and whether
they feel that the cultural life of their country is diluted or enriched by people from other countries who
settle among them.
90. Figure 41 indicates that in countries with widespread dissatisfaction about the state of the
economy, individuals are more likely to say that migrants can be an economic problem. Figure 42 shows
that in countries where residents express concern about the state of the education system, migrants are
regarded as a potential threat to the cultural life of the country.
1.0
1.5
2.0
2.5
3.0
3.5
4.0
Swed
en
No
rway
Ger
man
y
Po
lan
d
Net
her
lan
ds
Swit
zerl
and
Ire
lan
d
Be
lgiu
m
De
nm
ark
Spai
n
Fran
ce
Ital
y
Slo
ven
ia
Fin
lan
d
Ave
rage
Un
ite
d K
ingd
om
Po
rtu
gal
Cze
ch R
epu
blic
Hu
nga
ry
Isra
el
Same 2012 Different 2012
Same 2000 Different 2000Allow few
Allow many
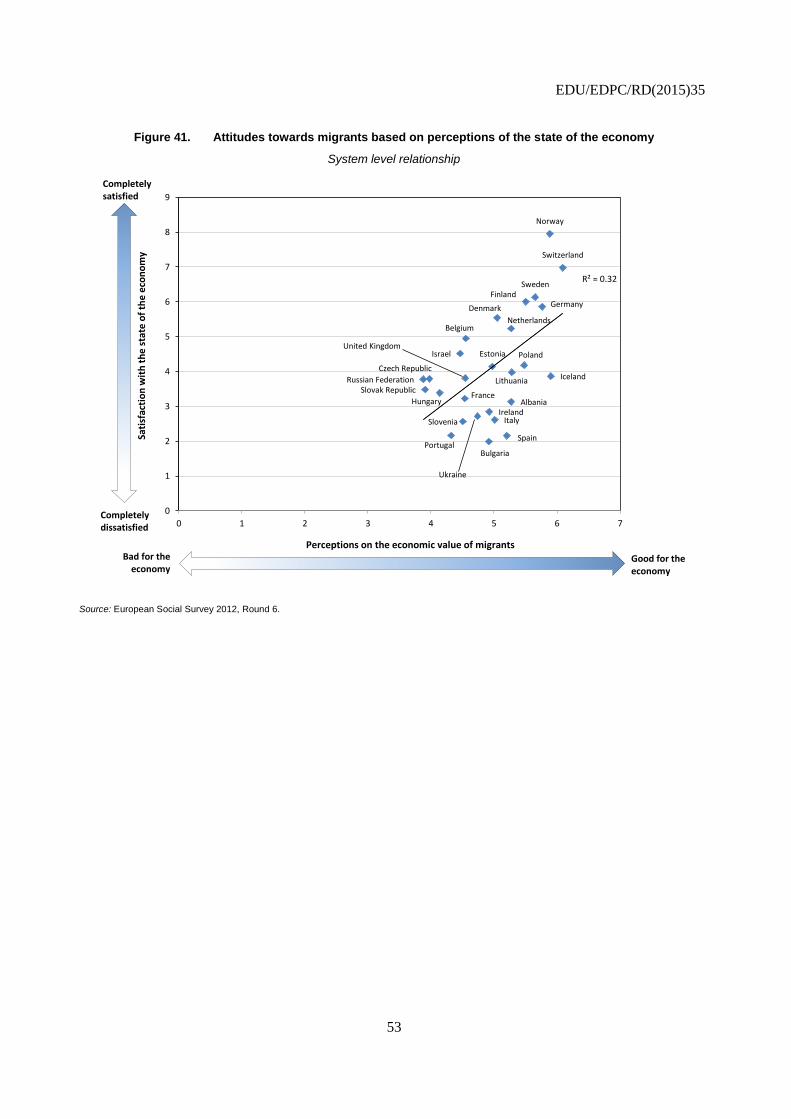
EDU/EDPC/RD(2015)35
53
Figure 41. Attitudes towards migrants based on perceptions of the state of the economy
System level relationship
Source: European Social Survey 2012, Round 6.
Albania
Belgium
Bulgaria
Switzerland
Czech Republic
GermanyDenmark
Estonia
Spain
Finland
France
United Kingdom
HungaryIreland
Israel
Iceland
Italy
Lithuania
Netherlands
Norway
Poland
Portugal
Russian Federation
Sweden
Slovenia
Slovak Republic
Ukraine
R² = 0.32
0
1
2
3
4
5
6
7
8
9
0 1 2 3 4 5 6 7
Bad for the economy
Good for the economy
Perceptions on the economic value of migrants
Completelysatisfied
Completelydissatisfied
Sati
sfac
tio
n w
ith
th
e st
ate
of
the
eco
no
my
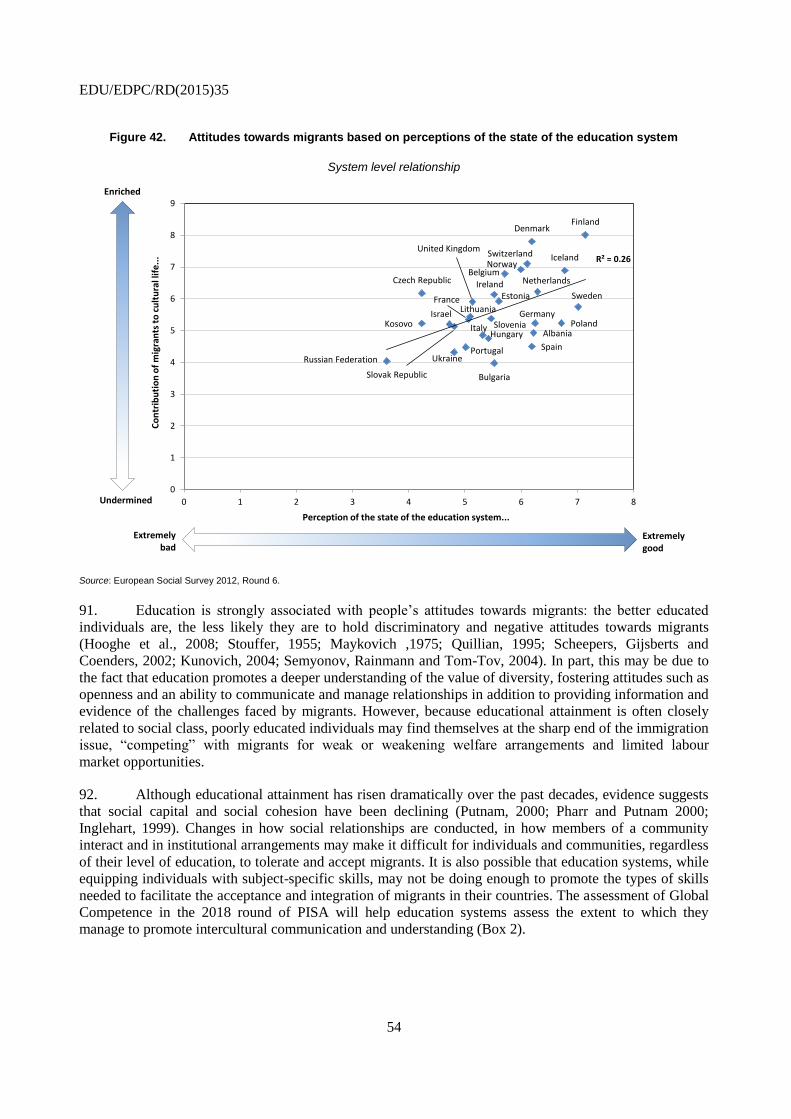
EDU/EDPC/RD(2015)35
54
Figure 42. Attitudes towards migrants based on perceptions of the state of the education system
System level relationship
Source: European Social Survey 2012, Round 6.
91. Education is strongly associated with people’s attitudes towards migrants: the better educated
individuals are, the less likely they are to hold discriminatory and negative attitudes towards migrants
(Hooghe et al., 2008; Stouffer, 1955; Maykovich ,1975; Quillian, 1995; Scheepers, Gijsberts and
Coenders, 2002; Kunovich, 2004; Semyonov, Rainmann and Tom-Tov, 2004). In part, this may be due to
the fact that education promotes a deeper understanding of the value of diversity, fostering attitudes such as
openness and an ability to communicate and manage relationships in addition to providing information and
evidence of the challenges faced by migrants. However, because educational attainment is often closely
related to social class, poorly educated individuals may find themselves at the sharp end of the immigration
issue, “competing” with migrants for weak or weakening welfare arrangements and limited labour
market opportunities.
92. Although educational attainment has risen dramatically over the past decades, evidence suggests
that social capital and social cohesion have been declining (Putnam, 2000; Pharr and Putnam 2000;
Inglehart, 1999). Changes in how social relationships are conducted, in how members of a community
interact and in institutional arrangements may make it difficult for individuals and communities, regardless
of their level of education, to tolerate and accept migrants. It is also possible that education systems, while
equipping individuals with subject-specific skills, may not be doing enough to promote the types of skills
needed to facilitate the acceptance and integration of migrants in their countries. The assessment of Global
Competence in the 2018 round of PISA will help education systems assess the extent to which they
manage to promote intercultural communication and understanding (Box 2).
Albania
Belgium
Bulgaria
Switzerland
Czech Republic
Germany
Denmark
Estonia
Spain
Finland
France
United Kingdom
Hungary
Ireland
Israel
Iceland
Italy
Lithuania
Netherlands
Norway
Poland
PortugalRussian Federation
Sweden
Slovenia
Slovak Republic
Ukraine
Kosovo
R² = 0.26
0
1
2
3
4
5
6
7
8
9
0 1 2 3 4 5 6 7 8Undermined
Enriched
Extremely bad
Extremely good
Perception of the state of the education system...
Co
ntr
ibu
tio
n o
f m
igra
nts
to
cu
ltu
ral l
ife
...
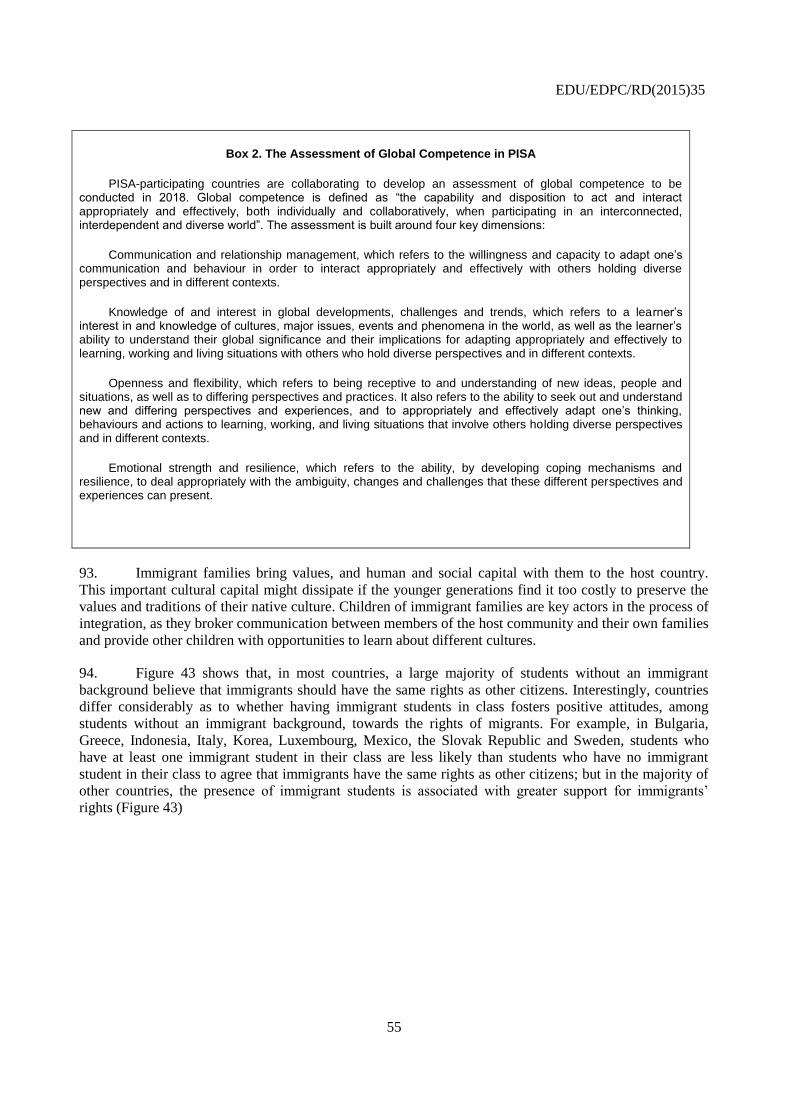
EDU/EDPC/RD(2015)35
55
Box 2. The Assessment of Global Competence in PISA
PISA-participating countries are collaborating to develop an assessment of global competence to be conducted in 2018. Global competence is defined as “the capability and disposition to act and interact appropriately and effectively, both individually and collaboratively, when participating in an interconnected, interdependent and diverse world”. The assessment is built around four key dimensions:
Communication and relationship management, which refers to the willingness and capacity to adapt one’s communication and behaviour in order to interact appropriately and effectively with others holding diverse perspectives and in different contexts.
Knowledge of and interest in global developments, challenges and trends, which refers to a learner’s interest in and knowledge of cultures, major issues, events and phenomena in the world, as well as the learner’s ability to understand their global significance and their implications for adapting appropriately and effectively to learning, working and living situations with others who hold diverse perspectives and in different contexts.
Openness and flexibility, which refers to being receptive to and understanding of new ideas, people and situations, as well as to differing perspectives and practices. It also refers to the ability to seek out and understand new and differing perspectives and experiences, and to appropriately and effectively adapt one’s thinking, behaviours and actions to learning, working, and living situations that involve others holding diverse perspectives and in different contexts.
Emotional strength and resilience, which refers to the ability, by developing coping mechanisms and resilience, to deal appropriately with the ambiguity, changes and challenges that these different perspectives and experiences can present.
93. Immigrant families bring values, and human and social capital with them to the host country.
This important cultural capital might dissipate if the younger generations find it too costly to preserve the
values and traditions of their native culture. Children of immigrant families are key actors in the process of
integration, as they broker communication between members of the host community and their own families
and provide other children with opportunities to learn about different cultures.
94. Figure 43 shows that, in most countries, a large majority of students without an immigrant
background believe that immigrants should have the same rights as other citizens. Interestingly, countries
differ considerably as to whether having immigrant students in class fosters positive attitudes, among
students without an immigrant background, towards the rights of migrants. For example, in Bulgaria,
Greece, Indonesia, Italy, Korea, Luxembourg, Mexico, the Slovak Republic and Sweden, students who
have at least one immigrant student in their class are less likely than students who have no immigrant
student in their class to agree that immigrants have the same rights as other citizens; but in the majority of
other countries, the presence of immigrant students is associated with greater support for immigrants’
rights (Figure 43)
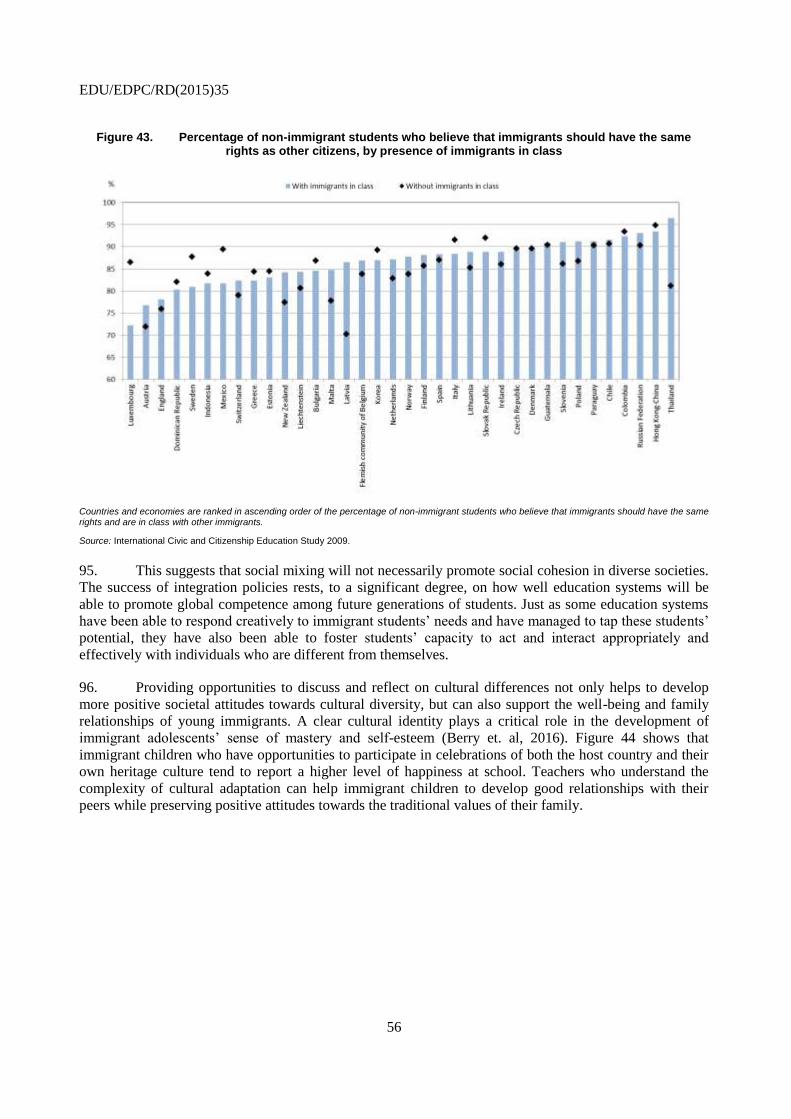
EDU/EDPC/RD(2015)35
56
Figure 43. Percentage of non-immigrant students who believe that immigrants should have the same rights as other citizens, by presence of immigrants in class
Countries and economies are ranked in ascending order of the percentage of non-immigrant students who believe that immigrants should have the same rights and are in class with other immigrants.
Source: International Civic and Citizenship Education Study 2009.
95. This suggests that social mixing will not necessarily promote social cohesion in diverse societies.
The success of integration policies rests, to a significant degree, on how well education systems will be
able to promote global competence among future generations of students. Just as some education systems
have been able to respond creatively to immigrant students’ needs and have managed to tap these students’
potential, they have also been able to foster students’ capacity to act and interact appropriately and
effectively with individuals who are different from themselves.
96. Providing opportunities to discuss and reflect on cultural differences not only helps to develop
more positive societal attitudes towards cultural diversity, but can also support the well-being and family
relationships of young immigrants. A clear cultural identity plays a critical role in the development of
immigrant adolescents’ sense of mastery and self-esteem (Berry et. al, 2016). Figure 44 shows that
immigrant children who have opportunities to participate in celebrations of both the host country and their
own heritage culture tend to report a higher level of happiness at school. Teachers who understand the
complexity of cultural adaptation can help immigrant children to develop good relationships with their
peers while preserving positive attitudes towards the traditional values of their family.
EDU/EDPC/RD(2015)35
57
Figure 44. Participation in host- or heritage-culture celebrations and happiness at school
Countries and economies are ranked in ascending order of the percentage of students who reported that they feel happy at school and who participate in and enjoy
these celebrations.
Source: OECD, PISA 2012 Database.
Beyond socio-economic status: The role of aspirations
97. Many migrants decide to leave their country as a way to improve their and, particularly, their
children’s economic condition and well-being. Even though many migrants face hardships and difficult
living conditions, most have an ambition to succeed that in most cases matches, and in some cases even
surpasses, the aspirations of families in their host country. Many immigrants are determined to make the
most of any opportunity that arises from the sacrifices they made by migrating.
98. Figure 45 reveals that the parents of immigrant students in Belgium, Germany and Hungary are
more likely to expect that their children will obtain a tertiary degree than the parents of students without an
50
55
60
65
70
75
80
85
90
95
Slo
vak
Rep
ub
lic
Fin
lan
d
Ital
y
Slo
ven
ia
Be
lgiu
m
Serb
ia
De
nm
ark
Po
rtu
gal
Ho
ng
Ko
ng-
Ch
ina
% Heritage-culture celebrations
Does not participate in and enjoy celebrations Participates in and enjoys celebrations
50
55
60
65
70
75
80
85
90
95
Fin
lan
d
Slo
vak
Rep
ub
lic
Ital
y
Slo
ven
ia
Serb
ia
Be
lgiu
m
De
nm
ark
Ho
ng
Ko
ng-
Ch
ina
Po
rtu
gal
% Host-culture celebrations
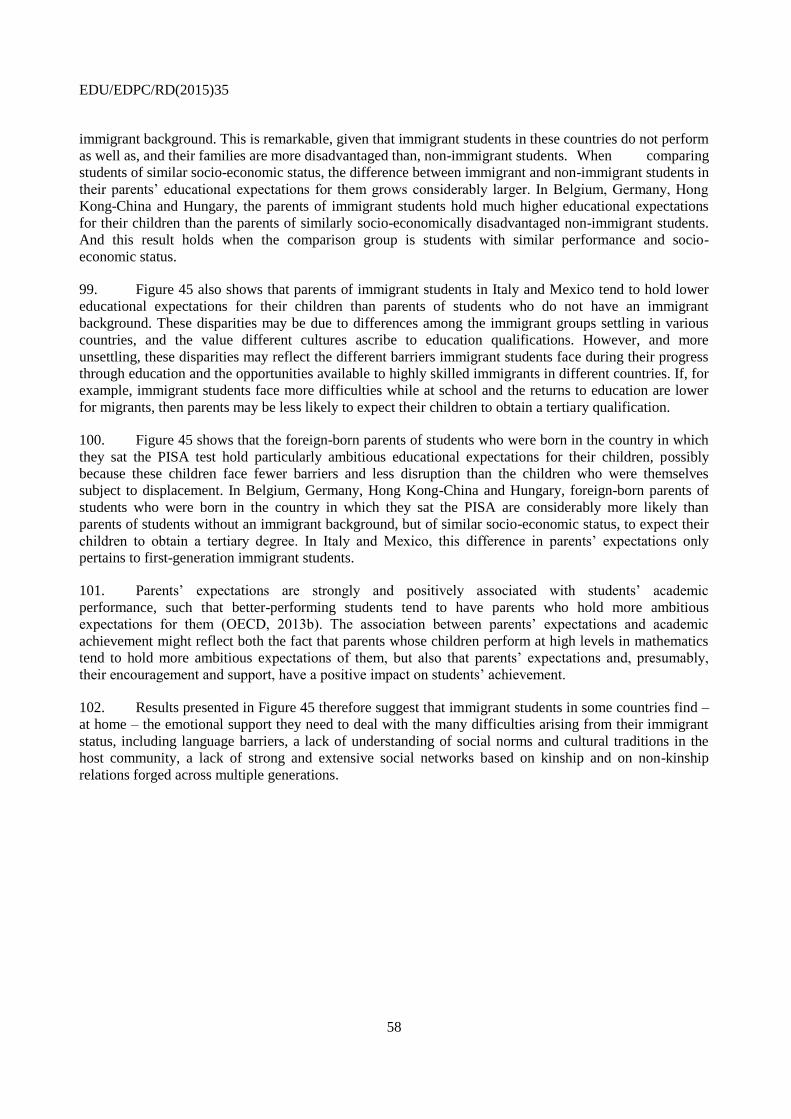
EDU/EDPC/RD(2015)35
58
immigrant background. This is remarkable, given that immigrant students in these countries do not perform
as well as, and their families are more disadvantaged than, non-immigrant students. When comparing
students of similar socio-economic status, the difference between immigrant and non-immigrant students in
their parents’ educational expectations for them grows considerably larger. In Belgium, Germany, Hong
Kong-China and Hungary, the parents of immigrant students hold much higher educational expectations
for their children than the parents of similarly socio-economically disadvantaged non-immigrant students.
And this result holds when the comparison group is students with similar performance and socio-
economic status.
99. Figure 45 also shows that parents of immigrant students in Italy and Mexico tend to hold lower
educational expectations for their children than parents of students who do not have an immigrant
background. These disparities may be due to differences among the immigrant groups settling in various
countries, and the value different cultures ascribe to education qualifications. However, and more
unsettling, these disparities may reflect the different barriers immigrant students face during their progress
through education and the opportunities available to highly skilled immigrants in different countries. If, for
example, immigrant students face more difficulties while at school and the returns to education are lower
for migrants, then parents may be less likely to expect their children to obtain a tertiary qualification.
100. Figure 45 shows that the foreign-born parents of students who were born in the country in which
they sat the PISA test hold particularly ambitious educational expectations for their children, possibly
because these children face fewer barriers and less disruption than the children who were themselves
subject to displacement. In Belgium, Germany, Hong Kong-China and Hungary, foreign-born parents of
students who were born in the country in which they sat the PISA are considerably more likely than
parents of students without an immigrant background, but of similar socio-economic status, to expect their
children to obtain a tertiary degree. In Italy and Mexico, this difference in parents’ expectations only
pertains to first-generation immigrant students.
101. Parents’ expectations are strongly and positively associated with students’ academic
performance, such that better-performing students tend to have parents who hold more ambitious
expectations for them (OECD, 2013b). The association between parents’ expectations and academic
achievement might reflect both the fact that parents whose children perform at high levels in mathematics
tend to hold more ambitious expectations of them, but also that parents’ expectations and, presumably,
their encouragement and support, have a positive impact on students’ achievement.
102. Results presented in Figure 45 therefore suggest that immigrant students in some countries find –
at home – the emotional support they need to deal with the many difficulties arising from their immigrant
status, including language barriers, a lack of understanding of social norms and cultural traditions in the
host community, a lack of strong and extensive social networks based on kinship and on non-kinship
relations forged across multiple generations.
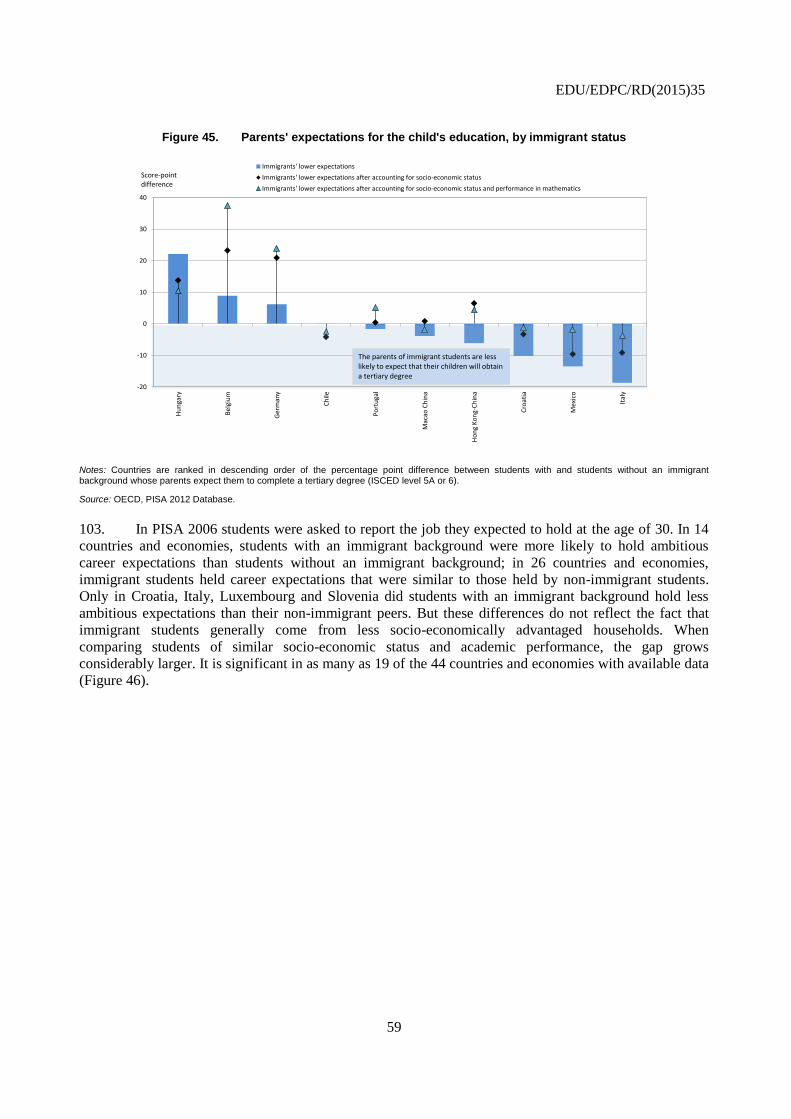
EDU/EDPC/RD(2015)35
59
Figure 45. Parents' expectations for the child's education, by immigrant status
Notes: Countries are ranked in descending order of the percentage point difference between students with and students without an immigrant background whose parents expect them to complete a tertiary degree (ISCED level 5A or 6).
Source: OECD, PISA 2012 Database.
103. In PISA 2006 students were asked to report the job they expected to hold at the age of 30. In 14
countries and economies, students with an immigrant background were more likely to hold ambitious
career expectations than students without an immigrant background; in 26 countries and economies,
immigrant students held career expectations that were similar to those held by non-immigrant students.
Only in Croatia, Italy, Luxembourg and Slovenia did students with an immigrant background hold less
ambitious expectations than their non-immigrant peers. But these differences do not reflect the fact that
immigrant students generally come from less socio-economically advantaged households. When
comparing students of similar socio-economic status and academic performance, the gap grows
considerably larger. It is significant in as many as 19 of the 44 countries and economies with available data
(Figure 46).
-20
-10
0
10
20
30
40
Hu
nga
ry
Be
lgiu
m
Ger
man
y
Ch
ile
Po
rtu
gal
Mac
ao C
hin
a
Ho
ng
Ko
ng-
Ch
ina
Cro
atia
Me
xico
Ital
y
Immigrants' lower expectations
Immigrants' lower expectations after accounting for socio-economic status
Immigrants' lower expectations after accounting for socio-economic status and performance in mathematics
Score-pointdifference
The parents of immigrant students are lesslikely to expect that their children will obtain a tertiary degree
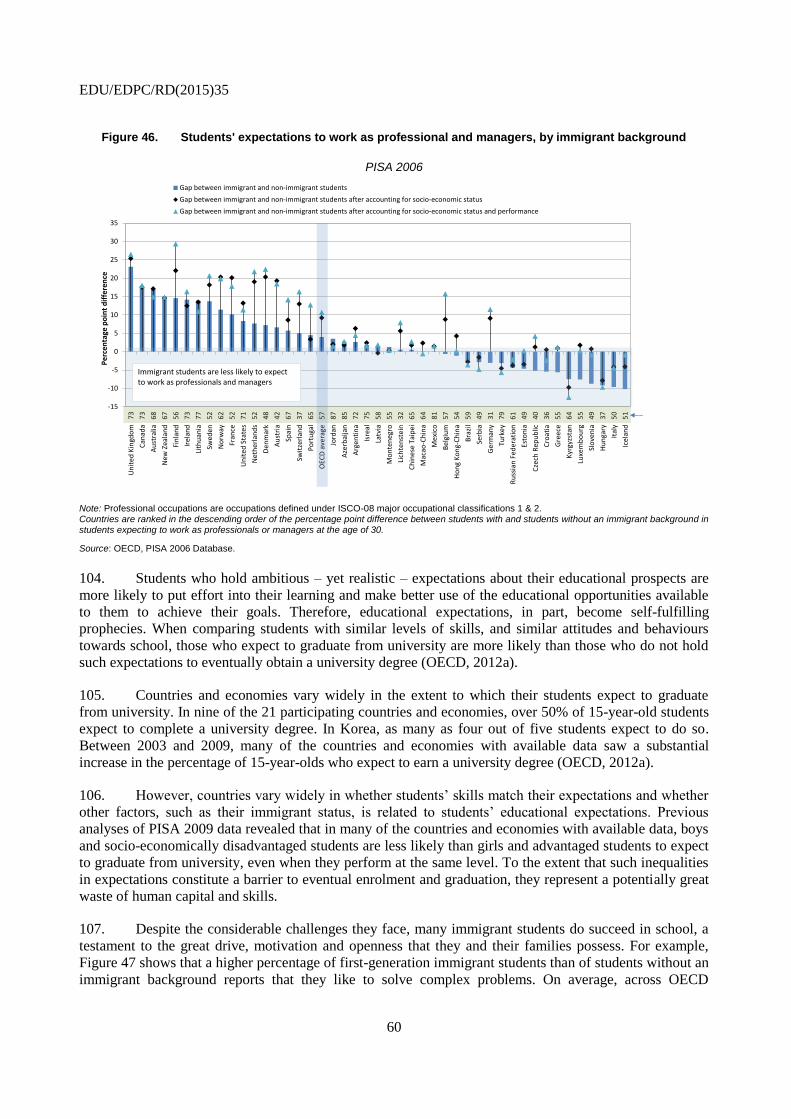
EDU/EDPC/RD(2015)35
60
Figure 46. Students' expectations to work as professional and managers, by immigrant background
PISA 2006
Note: Professional occupations are occupations defined under ISCO-08 major occupational classifications 1 & 2. Countries are ranked in the descending order of the percentage point difference between students with and students without an immigrant background in students expecting to work as professionals or managers at the age of 30.
Source: OECD, PISA 2006 Database.
104. Students who hold ambitious – yet realistic – expectations about their educational prospects are
more likely to put effort into their learning and make better use of the educational opportunities available
to them to achieve their goals. Therefore, educational expectations, in part, become self-fulfilling
prophecies. When comparing students with similar levels of skills, and similar attitudes and behaviours
towards school, those who expect to graduate from university are more likely than those who do not hold
such expectations to eventually obtain a university degree (OECD, 2012a).
105. Countries and economies vary widely in the extent to which their students expect to graduate
from university. In nine of the 21 participating countries and economies, over 50% of 15-year-old students
expect to complete a university degree. In Korea, as many as four out of five students expect to do so.
Between 2003 and 2009, many of the countries and economies with available data saw a substantial
increase in the percentage of 15-year-olds who expect to earn a university degree (OECD, 2012a).
106. However, countries vary widely in whether students’ skills match their expectations and whether
other factors, such as their immigrant status, is related to students’ educational expectations. Previous
analyses of PISA 2009 data revealed that in many of the countries and economies with available data, boys
and socio-economically disadvantaged students are less likely than girls and advantaged students to expect
to graduate from university, even when they perform at the same level. To the extent that such inequalities
in expectations constitute a barrier to eventual enrolment and graduation, they represent a potentially great
waste of human capital and skills.
107. Despite the considerable challenges they face, many immigrant students do succeed in school, a
testament to the great drive, motivation and openness that they and their families possess. For example,
Figure 47 shows that a higher percentage of first-generation immigrant students than of students without an
immigrant background reports that they like to solve complex problems. On average, across OECD
-15
-10
-5
0
5
10
15
20
25
30
35
Un
ite
d K
ingd
om
7
3
Can
ada
73
Au
stra
lia
68
New
Zea
lan
d
67
Fin
lan
d
56
Ire
lan
d
73
Lith
uan
ia
77
Swed
en
5
2
No
rway
6
2
Fran
ce
52
Un
ite
d S
tate
s 7
1
Net
her
lan
ds
52
De
nm
ark
48
Au
stri
a 4
2
Spai
n
67
Swit
zerl
and
3
7
Po
rtu
gal
65
OEC
D a
vera
ge
57
Jord
an
87
Aze
rbai
jan
8
5
Arg
en
tin
a 7
2
Isre
al
75
Latv
ia
58
Mo
nte
ne
gro
5
5
Lich
ten
stei
n
32
Ch
ine
se T
aip
ei
65
Mac
ao-C
hin
a 6
4
Me
xico
8
1
Be
lgiu
m
57
Ho
ng
Ko
ng-
Ch
ina
54
Bra
zil
59
Serb
ia
49
Ger
man
y 3
1
Turk
ey
79
Ru
ssia
n F
ed
era
tio
n
61
Esto
nia
4
9
Cze
ch R
epu
blic
4
0
Cro
atia
3
6
Gre
ece
5
5
Kyr
gyzs
tan
6
4
Luxe
mb
ou
rg
55
Slo
ven
ia
49
Hu
nga
ry
37
Ital
y 5
0
Ice
lan
d
51
Gap between immigrant and non-immigrant students
Gap between immigrant and non-immigrant students after accounting for socio-economic status
Gap between immigrant and non-immigrant students after accounting for socio-economic status and performance
Pe
rce
nta
ge p
oin
t d
iffe
ren
ce
Immigrant students are less likely to expect to work as professionals and managers
EDU/EDPC/RD(2015)35
61
countries, around 33% of students without an immigrant background report liking to solve complex
problems, a percentage that is similar among second-generation immigrant students (34%) while among
first-generation students this value stands at 37%. In Canada, Singapore, Kazakhstan, the United Kingdom,
New Zealand, Ireland, Denmark, Australia, the United Arab Emirates, Italy first-generation students are
more likely to report liking to solve complex problems while in Greece first-generation immigrant students
are less likely to report liking to solve such problems.
Figure 47. Openness to problem solving, by immigrant background
Percentage of students who reported that they like to solve complex problems
Note: Statistically significant score-point difference between first-generation immigrant students and non-immigrant students who reported that they like solving complex problems is shown next to the country/economy name. Countries and economies are ranked in ascending order of the percentage of first-generation immigrant students who reported that they like solving complex problems.
Source: OECD, PISA 2012 Database.
108. Overall, the analyses presented in this paper confirm the obvious: immigrant students in countries
with stringent skills-based migration policies tend to perform better in school than immigrant students in
countries that do not use strategic selection at entry. However, such policies can work only when political
and economic stability stems the tide of migration. In the context of porous borders, natural disasters and
geopolitical instability, it becomes next to impossible to halt migration flows.
109. Moreover, strategic selection policies are blind to migrants’ potential to flourish. With the right
mix of social, welfare and education policies, migrants might become invaluable resources for their host
communities.
110. This paper presents ample evidence that the link between the level of skills acquired before
migration and performance in the destination country is strong, but not unbreakable, and that supporting
disadvantaged immigrants can yield large payoffs. While migrants often face cultural and social barriers
that compound the effects of socio-economic disadvantage, PISA data show that in Australia, Israel and the
United States, the share of socio-economically disadvantaged students who perform among the top quarter
of all PISA students is larger among immigrant students than among non-immigrant students (Figure 48).
These highly motivated students, who managed to overcome the double disadvantage of poverty and an
0
10
20
30
40
50
60
70
Au
stri
a
Gre
ece
Be
lgiu
m
Mac
ao-C
hin
a
Spai
n
Swit
zerl
and
Slo
ven
ia
Ho
ng
Ko
ng-
Ch
ina
Ital
y
Fran
ce
Cze
ch R
epu
blic
Co
sta
Ric
a
Po
rtu
gal
Arg
en
tin
a
Luxe
mb
ou
rg
Cro
atia
Ger
man
y
Fin
lan
d
Net
her
lan
ds
Ire
lan
d
Au
stra
lia
OEC
D a
vera
ge
Isra
el
Swed
en
Ru
ssia
n F
ed
era
tio
n
Me
xico
De
nm
ark
Ice
lan
d
New
Zea
lan
d
Serb
ia
Un
ite
d S
tate
s
Can
ada
Bra
zil
No
rway
Sin
gap
ore
Un
ite
d K
ingd
om
Mo
nte
ne
gro
Qat
ar
Un
ite
d A
rab
Em
irat
es
Ch
ile
Jord
an
%Sort in ascending order
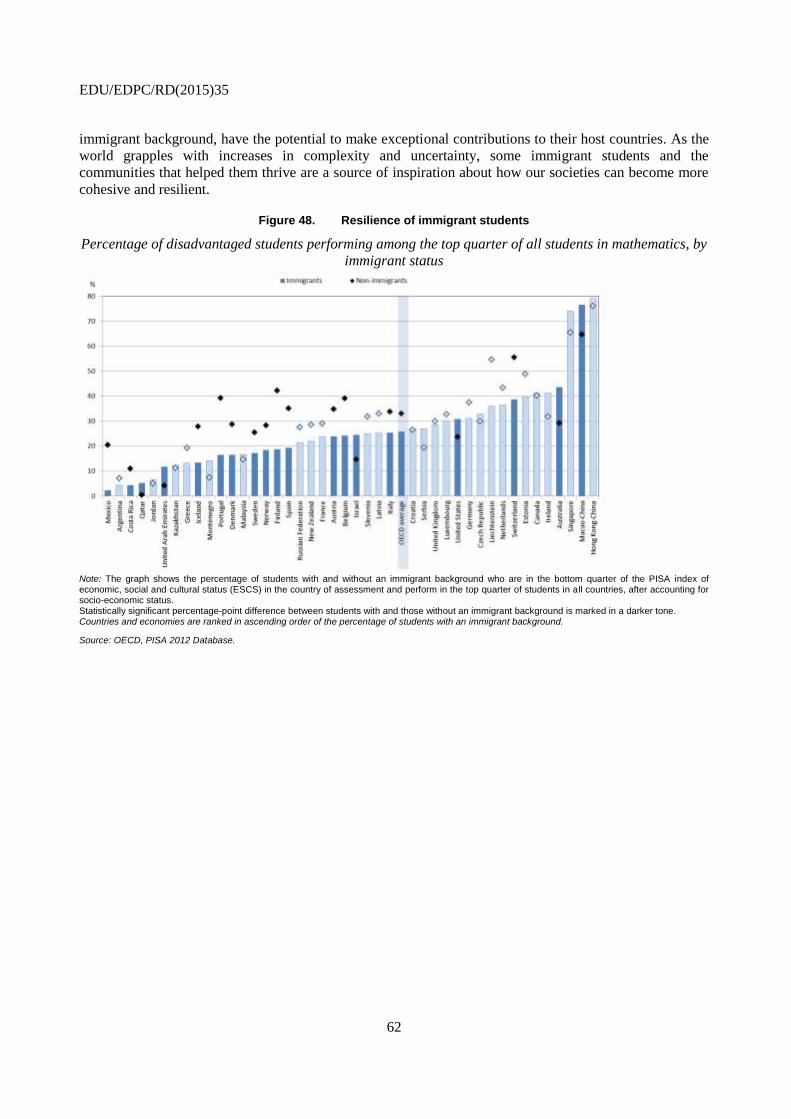
EDU/EDPC/RD(2015)35
62
immigrant background, have the potential to make exceptional contributions to their host countries. As the
world grapples with increases in complexity and uncertainty, some immigrant students and the
communities that helped them thrive are a source of inspiration about how our societies can become more
cohesive and resilient.
Figure 48. Resilience of immigrant students
Percentage of disadvantaged students performing among the top quarter of all students in mathematics, by
immigrant status
Note: The graph shows the percentage of students with and without an immigrant background who are in the bottom quarter of the PISA index of economic, social and cultural status (ESCS) in the country of assessment and perform in the top quarter of students in all countries, after accounting for socio-economic status. Statistically significant percentage-point difference between students with and those without an immigrant background is marked in a darker tone. Countries and economies are ranked in ascending order of the percentage of students with an immigrant background.
Source: OECD, PISA 2012 Database.
EDU/EDPC/RD(2015)35
63
POLICIES FOR THE SUCCESSFUL INTEGRATION AND EDUCATION OF MIGRANT
STUDENTS1
111. Previous sections of this paper have detailed the achievement and non-achievement outcomes of
students with an immigrant background in different countries and identified critical factors that may shape
the long term success and integration of immigrants. PISA suggests that countries have a major role to play
in influencing the successful integration and education of migrant children and how well countries manage
the integration process will impact on the education outcomes of migrant children, and the perceived and
actual impacts on non-immigrant students. High performing education systems have greater capacity to
integrate and achieve better outcomes for students with an immigrant background than systems that
struggle to provide sound education for non-immigrant students. This is also true for individual schools.
How well integration is managed will also influence whether the presence of students with an immigrant
background negatively affects non-immigrant students.
112. The number of students with an immigrant background in any system is less important in
determining student outcomes, than the strength and organisation of the schooling system and immigrants’
socio-economic background (Jensen, 2015). How well integration is managed will also influence whether
the presence of students with an immigrant background negatively affects non-immigrant students. In most
countries for which data is available, negative impacts on non-immigrant students are negligible.
113. The successful integration of children with an immigrant background into education is closely
related to how well the other needs of migrant children and their families are met. This is particularly true
for refugees, many of whom have health needs, in addition to other immediate needs such as access to
adequate housing and income.
114. Refugee children frequently have a complex set of needs. Many have experienced significant
trauma in addition to prolonged disruptions to their education. Before resettlement, many refugees will
have lived in camps or in other temporary accommodation for significant periods. These experiences can
affect children’s cognitive, emotional and social development, increasing the challenges they will face in
making academic progress. Such risks have been found to be significantly greater for unaccompanied
minors (Wiese et al., 2007).
115. This part of the report draws on the data in the preceding section, relevant research evidence and
countries’ experiences in integrating children with an immigrant background. Examples and evidence of
integration policies that “work” can be drawn from a number of jurisdictions. The report organises these
policy approaches according to those with high impact that countries can adopt relatively quickly, other
high impact policy responses that may need a medium-term timeline and additional responses that will
further strengthen the integration of students with an immigrant background into an education system.
116. The nine policy pointers covered in this paper are set out below and illustrated in the diagram that
follows, with an assessment of relative impact and cost/complexity:
Immediate policy responses
Providing sustained language support, within regular classrooms
1 Adapted from Nusche, D. (2009) What Works in Migrant Education? A Review of Evidence and Policy Options. Education Working Paper # 50.
OECD Publishing.
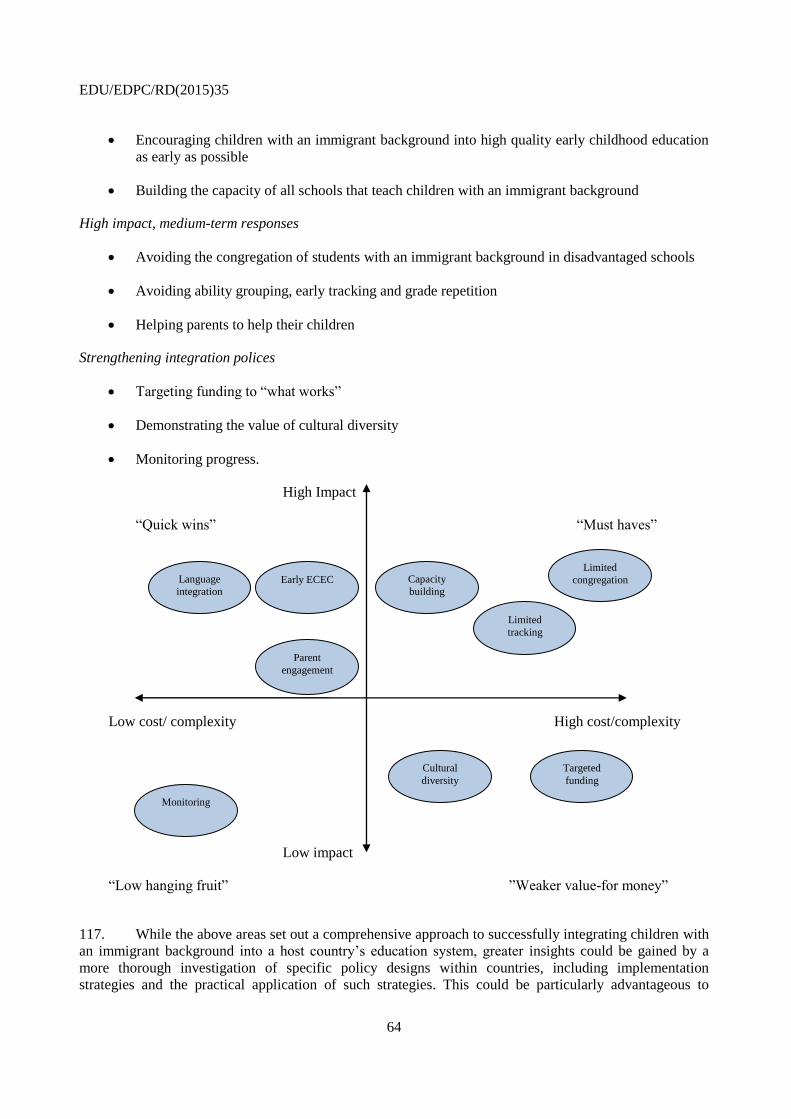
EDU/EDPC/RD(2015)35
64
Encouraging children with an immigrant background into high quality early childhood education
as early as possible
Building the capacity of all schools that teach children with an immigrant background
High impact, medium-term responses
Avoiding the congregation of students with an immigrant background in disadvantaged schools
Avoiding ability grouping, early tracking and grade repetition
Helping parents to help their children
Strengthening integration polices
Targeting funding to “what works”
Demonstrating the value of cultural diversity
Monitoring progress.
High Impact
“Quick wins” “Must haves”
Low cost/ complexity High cost/complexity
Low impact
“Low hanging fruit” ”Weaker value-for money”
117. While the above areas set out a comprehensive approach to successfully integrating children with
an immigrant background into a host country’s education system, greater insights could be gained by a
more thorough investigation of specific policy designs within countries, including implementation
strategies and the practical application of such strategies. This could be particularly advantageous to
Limited
congregation Capacity
building Early ECEC Language
integration
Limited
tracking
Parent
engagement
Cultural
diversity
Targeted
funding
Monitoring
EDU/EDPC/RD(2015)35
65
countries on issues such as language acquisition, access to ECEC, parent engagement and capacity
building amongst teachers.
Immediate policy responses
Providing sustained language support, within regular classrooms
118. Proficiency in the language of instruction is a fundamental determinant of successful education
outcomes. Language skills are essential for most learning processes such as listening, reading, writing and
interaction with teachers and peers. Any student who does not master the language of instruction is at a
significant disadvantage in schools. Cross country data from PISA shows that students with an immigrant
background who do not speak the language of instruction at home are roughly one year of learning behind
their native peers. At the same time, those migrant students who do speak the language of instruction at
home are about half a year behind.
119. An OECD review of policies affecting migrant students’ achievement levels found that countries
with relatively small performance gaps between students with an immigrant background and their non-
immigrant peers had provided sustained and time-intensive language support in primary and secondary
education, with clearly defined goals and standards for the teaching of the language of instruction. In
contrast, countries with a large gap between these students tend to provide less systematic support (OECD,
2006b; OECD, 2010b).
120. Features of successful approaches in language acquisition by migrant students include:
sustained language support across grade levels
centrally developed curriculum documents
teachers specifically trained in second language teaching
assessment of individual student needs and progress with adequate diagnostic materials
early language interventions and parental involvement in language stimulation
a focus on academic language and integration of language and content learning, and
valuing of different mother tongues.
121. Building the capacity of school leaders and teachers in the above areas across each school
requires careful planning and implementation (OECD, 2010).
Avoiding “pull-out” programmes”
122. Some countries immediately place newly arrived migrant children into mainstream classrooms
and provide additional language support, if needed. In other countries, children are placed in special
preparatory classes before transferring to mainstream education (OECD, 2006b). Some host countries do
not allow children with an immigrant background to enter mainstream classes until they can demonstrate
proficiency in the host language (Sirin et al., 2015).
123. Integrating language and content learning, from the earliest stages, is one of the most important
lessons that can be learnt from countries that have been successful in integrating children with an
EDU/EDPC/RD(2015)35
66
immigrant background into their education systems. Integrating migrant children into mainstream classes
from the outset is associated with better outcomes than entering children into preparatory language classes.
While language assistance is important, it should be in addition to rather than instead of regular instruction.
This is has been found to be the case for children at all age groups, including newly arrived, older students
with an immigrant background(OECD, 2010b).
124. Preparatory language classes may help to provide students with basic linguistic skills, but the
separation of students with an immigrant background from the mainstream should be short and transitory
in nature. Field et al. (2007) reveal that in Norway 20% of migrant children never leave the special
language training class and in Switzerland most migrant children were not deemed capable of integrating
into mainstream classes after two years in special beginners’ classes. Field et al. (2007) conclude that extra
funding for such separate classes may be counterproductive and encourage schools not to retain pupils in
these classes.
125. There are several reasons why “pull-out programmes” are unsuccessful in both developing strong
language skills and in supporting transitions into mainstreams classes. These are that pull-out programmes:
Reduce the curriculum teaching time students receive
Result in students being even further behind their peers in terms of the normal curriculum
Have a stigmatising effect on students, and
Are often taught by less qualified teachers (Karsten, 2006).
126. Research has also shown that it is neither necessary nor desirable to postpone academic teaching
until students fully master the language of instruction (Watts-Taffe and Truscott, 2000). Language
development and cognitive development are interconnected and language learning seems to work best
when learners use language for meaningful purposes (Au, 1998). It is therefore essential to ensure that
language development is closely connected to the mainstream curriculum.
127. One way to integrate language and academic learning is to develop content-area curricula for
second language learning, as in some areas in the US (Harklau, 1994). Another important measure is to
ensure close co-operation between language teachers and classroom teachers, an approach that is widely
used in countries that seem most successful in educating migrant students such as Australia, Canada and
Sweden (Christensen and Stanat, 2007).
128. In England, separate centres for English as an Additional Language (EAL) were terminated in the
late 1980s because they had been found to produce racially discriminating outcomes (Leung, 2004). The
focus was then on placing English language learners in age-appropriate mainstream classes as soon as
possible. At the same time, all teachers were expected to provide EAL development opportunities through
special curriculum activities. In addition, EAL specialist teachers provided advice and guidance to subject
teachers on how to include English language learning opportunities in content lessons and provided
collaborative support in classes with EAL students (Leung, 2004).
129. A further measure to retain students in mainstream classes while supporting their language
development is to provide language classes in addition to regular curriculum classes. This particularly
valuable during the school holidays when some students with an immigrant background may not have
significant communication or interactions in the language of the host country. In Estonia, for example,
schools receive additional resources to provide students with an immigrant background with weekly tuition
in the Estonian language and acculturation courses outside regular teaching time (Magi and Nestor, 2014).
EDU/EDPC/RD(2015)35
67
Support mainstream teachers to develop children’s language skills
130. In a series of country reviews on migrant education undertaken by the OECD, teachers often
reported that they did not have the diagnostic competencies and tools at hand to assess their immigrant
students’ linguistic and cognitive capacities properly (OECD, 2010b). Thus, practical tools such as
assessment kits that are age and culturally appropriate can support teachers to identify the language support
needs of each student. Further guidance can also be provided on diagnosing particular language issues,
procedures for sharing student information and for managing student transitions to new education stages
or settings.
131. Some countries require language screening for all children well before they enter school, such as
at age three or four years, whereas other countries assess children with an immigrant background when
they first enter the education system. This provides information for teachers on individual children but also
provides valuable information on children’s needs at a district or system level. Language screening can be
used as a basis for distributing additional funding to schools (Mengering, 2005).
132. Denmark, for example, introduced a mandatory assessment of language development for all 3-
year-olds, which aims to diagnose possible language problems before children start school (OECD,
2015b). In Germany, several Lander introduced screening processes to identify pre-school children in need
of additional language support (Bertschi-Kaufmann et al., 2006). In addition, Ireland developed guidelines
for language assessment, with assessment tool kits and intercultural education guidelines for pedagogy to
integrate language learning and content learning (OECD, 2010b).
133. For a systemic approach, second language development should be covered in both pre-service
and in-service training, supported by centrally developed curriculum documents. In Finland, the National
Core Curriculum for Instruction Preparing Immigrants for Basic Education was introduced in 2009 to
support students with an immigrant background who were not proficient in the Finnish or Swedish
languages, so they can attend basic education. The curriculum is differentiated according to age, learning
capabilities and background to support students’ balanced development and integration into society.
134. Austria, as a further example, prepared a national curriculum framework for early language
learning in kindergarten and standards for second language learning (OECD, 2010b).
135. In their evaluation of Aiming High: The African Caribbean Achievement Project, Tikly et al.
(2006) reported that the local authorities most successful in educating students with an immigrant
background had provided good practice guidelines on language support to all teachers and offered a range
of different staff development strategies in this area.
Providing sustained language support
136. Even when children with an immigrant background have learned basic communication and
literacy skills, they are still at a greater risk of failure in school than their peers. Research indicates that
while it takes children approximately two years to develop “communicative” language skills, it can take up
to seven years for students to become proficient in the “academic” language used in school environments
(Cummins, 1979). Systematic and ongoing language support is therefore necessary at all levels
of education.
Encouraging migrant children into high quality early childhood education as early as possible
137. While it is important to ensure all levels of a country’s education system are responsive to the
needs of children with an immigrant background, it is also important not to overlook the positive impact
that well-designed, high quality ECEC can have for these children. There is powerful evidence that
EDU/EDPC/RD(2015)35
68
investments in the education of children with an immigrant background have the highest rate of return
when focused at the earliest levels of education (Cunha et al., 2005; Fuller, 2007; Schneeweis, 2011). If
gaps emerge in children’s cognitive, linguistic and social abilities at an early age, these gaps will be
difficult to overcome later on. Cost-benefit analyses have shown that investment in ECEC is relatively
more effective and less costly than remedial programmes later on in the lifecycle (Cunha et al., 2005;
Heckman, 2006a; 2006b; Ludwig et al., 2007).
138. Gaps in children’s cognitive development have been shown to be strongly associated with family
background factors, like socio-economic status, maternal education and recent immigration (Heckman,
2006a). Thus, an early start in education is of particular importance for migrant children from low socio-
economic backgrounds, as their parents may have relatively low levels of financial and human capital to
invest in the cognitive and linguistic stimulation of their children (Mistry et al., 2008; Yeung et al., 2002).
Evaluative studies from the US find that high quality programmes are in general intensive, early starting,
centre-based and combined with strong parent involvement, parent education, home activities and family
support (Leseman, 2002).
139. ECEC has also been found to be of particular benefit to children at risk of developing learning
difficulties. For example, in the EPPE2 study in the United Kingdom, one in three children faced risks at
the start of pre-school, and this reduced to one in five by the time these children started school (Sylva
et al., 2004).
140. While students with an immigrant background are likely to particularly benefit from ECEC, in
some countries they are less likely than their native peers to be enrolled (OECD, 2006a; Karoly et al.,
2011). There are, however, differences in attendance at ECEC across countries, as illustrated in Figure 29
in the preceding section. When fees are charged, participation rates in ECEC have been shown to be highly
dependent on family income, which puts migrant students from lower socio-economic backgrounds at a
disadvantage (Chiswick and Deb-Burman, 2004). In addition, migrant parents may also be more hesitant
than native parents to enrol their children in pre-school for a range of reasons unrelated to cost
(Leseman, 2002).
141. While high quality early education and care (ECEC) is essential for pre-school children from first
generation migrant families, it is also true for many children from second-generation migrant families.
Some second generation immigrant children grow up in families that are linguistically isolated from their
host country language. Thus, despite spending their entire childhood within the host country, they may
have limited proficiency in the language of instruction when they start primary school (AERA, 2004;
Knapp, 2006). Providing early language assistance to these children is an important part of improving their
school readiness and allowing them to start on an equal footing with their peers.
142. Key actions to improve the take-up and impact of ECEC on children with a migrant background
include improving access, outreach to families, providing specifically designed programmes and the use of
monitoring. Each is discussed briefly below.
Improving access
143. Policies in most OECD countries have focused on expanding migrant children’s access to ECEC
programmes, and most of them offer ECEC free of charge to disadvantaged students. Germany, for
example, set a strategic goal in the National Action Plan on Integration (2011) to facilitate early access to
learning, care and education in day-care facilities or day nurseries for children (OECD, 2015c).
2 The Effective Provision of Pre-school Education Project (EPPE) started in the United Kingdom in 1996 and has followed the impact of ECEC on
children until the age of 14.
EDU/EDPC/RD(2015)35
69
144. In the United States, many states have tried to increase immigrant enrolment in ECEC as part of
wider efforts to expand pre-school options amongst disadvantaged communities. To improve access, some
states have created or expanded public preschool systems, which supplement and complement the federal
Head Start and Early Head Start programmes (Crosnoe, 2013).
145. Both national and municipal governments in Norway have made special efforts to support
equality of participation, particularly for low-income and minority-language families. Initiatives include
fee reductions or exemptions, as well as pilot programmes providing up to four hours free per day for
children aged 3-5 years to attend kindergarten. This free hours scheme will be extended to all 4-5 year olds
from low-income families across Norway (OECD, 2015d).
146. At the same time, it is crucial to invest in the quality of ECEC services, as low quality ECEC
may in fact increase development risks (Leseman, 2002). Especially for children under three, childcare is
often private and unregulated, which may lead to high variations in staff training, pedagogical
programming and child-staff ratios (OECD, 2006a).
Outreach to families
147. Active policies reaching out to migrant parents can build parents’ confidence in interacting with
education providers and programmes for their children as well as building parents knowledge about
children’s early cognitive and social and emotional development. Children of families who have received
home visits from ECEC practitioners have been found to have greater engagement in literacy activities and
are more likely to participate in some form of ECEC (OECD, 2012b).
148. There are a number of strategies that OECD countries currently use to raise parents’ awareness of
the value of early learning and what they can do to help their child’s development. These strategies include
home visits, the recruitment of culturally appropriate and trained specialists, the provision of learning
resources and information to families, awareness campaigns, and training for ECEC staff to work
effectively with diverse families.
149. The Parent-Child Home Programme in the United States is an early childhood literacy, parenting
and school readiness programme. The programme provides two years of twice-weekly visits to families
with children between the ages of 16 months to four years who are challenged by poverty, isolation,
limited education opportunities, language and literacy barriers, and other obstacles to healthy development
and education success. The programme uses Early Literacy Specialists who are hired from the community
they are serving, thus sharing both the language and culture of the families they are working with. Each
week the Early Literacy Specialist provides the family with a book or educational toy. These are used by
the Specialist to model reading, conversation and play activities designed to stimulate parent-child
interaction and develop the child’s early language. The Specialist also connects the families to other
community resources, such as health and medical facilities and other education programmes. On
completion of the programme, families are assisted in enrolling their child in a centre-based,
preschool programme.
150. In Ireland, partnerships between ECEC programmes and community services have been found to
be effective in approaching and supporting harder-to-reach families, such as Roma and travelling families.
Specialists offer those families tailored services designed with respect to their cultural context, which
improve children’s skills as well as those of parents. The development of distance learning materials in
collaboration with community members and consultants specialised in travelling education has enhanced
children’s learning experiences in literacy and maths (Robinson and Martin, 2008).
EDU/EDPC/RD(2015)35
70
ECEC programmes specifically designed to support migrant children
151. The language skills needed for school success can be effectively developed through specific
training programmes at the pre-school level (Ehri et al., 2001). Children can acquire the basic language
skills necessary for reading and writing quite quickly when they are taught a systematic curriculum from
early on. However, very few countries provide systematic language support based on explicit curricula in
pre-primary education.
152. Research in the US finds that while the achievement levels of children from immigrant families
in early childhood are lower than US-born children, these differences do not occur across all domains of
early development. While the differences are more pronounced across cognitive skills, they are less
apparent in levels of engagement and behaviour (Crosnoe, 2013). Thus, ECEC programmes tailored to
children with an immigrant background should seek to strengthen verbal and other cognitive skills, while
also continuing the development of critical social and emotional skills that are essential to children’s
academic success.
Monitoring
153. Monitoring the quality and impact of ECEC systems, however, is not well developed across
OECD countries. Monitoring processes tend to focus more on inputs and compliance with regulations
rather than the quality of service delivery or assessing how well children’s needs are being identified and
met (OECD, 2015b).
154. A few OECD countries have, however, developed systems to benchmark and monitor children’s
progress, including children from different socio-economic and ethnic groups. Some countries use school
entry tests as a means to focus on child development and to provide information on how young children are
progressing. Australia, for example, uses a national adaptation of the Early Development Instrument (EDI).
155. The EDI was originally developed in Ontario, Canada and is a population measure of children’s
development as they enter school. The EDI is a checklist on children’s development which is completed by
teachers. The results are aggregated to the group level (school, neighbourhood, city) to provide a
population-based measure of children’s development. The results of the EDI allow local authorities,
communities and providers to assess how local children are doing relative to other children in their
community and/or across the country. The checklist measures five key domains of early
childhood development:
Physical health and well-being
Social competence
Emotional maturity
Language and cognitive skills
Communication skills and general knowledge (OECD, 2015b).
156. In Norway, data on children’s development is being gathered across the health and education
sectors. The health system can provide disaggregated ECEC participation rates by municipality and for
rural and urban populations. This information provides data on non-participant children and their language
development at ages two and four. Some municipalities use this information to increase participation rates,
especially for children with an immigrant background (OECD, 2015e).
EDU/EDPC/RD(2015)35
71
Building the capacity of all schools
157. The quality of teaching is the most important school variable shaping student learning outcomes,
regardless of student socio-economic and demographic background factors (OECD, 2005a; OECD, 2013).
Thus, ensuring children with an immigrant background are being taught by high quality teachers is critical.
158. Yet, while migrant and disadvantaged students stand to benefit the most from high quality
teaching, they are often the least likely to receive it (Field et al., 2007). Research has shown that teacher
preferences may direct the more qualified and more experienced teachers to schools enrolling mostly non-
immigrant students (Hanushek et al., 2001; Bénabou, 2003; Karsten et al., 2006). In France, for example,
the share of young inexperienced teachers and the rates of teacher turnover are much higher in the
education priority zones (ZEP) than the national average (Bénabou, 2003). In the US, the highest poverty
Title I schools face greater challenges than other schools in terms of higher teacher attrition and teacher
inexperience (Kirby et al., 2003).
159. According to principals’ reports, disadvantaged schools in OECD countries have lower student-
teacher ratios but have less experienced and qualified teachers (OECD, 2012c). Reducing class sizes can be
a costly and often ineffective way to lift student outcomes. However, positive effects have been seen from
smaller class sizes for disadvantaged children in early grades, ie kindergarten to third grade (Hanushek,
2000; Krueger, 2000). Such effects are nonetheless relatively small in comparison to the effects of teacher
quality differences (Rivkin et al., 2000).
160. Between 2003 and 2012, the proportion of 15-year-old students with an immigrant background in
OECD countries increased from 8.7% to 11.5%. Thus, teaching migrant students is becoming an important
part of the reality facing teachers every day and preparing all teachers to be ready and able to integrate
children with an immigrant background into their classrooms has become more pressing. If migrant
children are well distributed across schools, this is even more essential. Thus, improving the effectiveness
and intercultural awareness of all teachers, such as improved teacher training to deal with diverse student
populations, is likely to have a positive impact on migrant students’ educational success (OECD, 2009).
161. Improvements to students’ learning within schools are generally the result of deliberate and
coherent educational leadership. A study of low-performing schools that succeeded in turning around their
results found that all of the improving schools had implemented new strategies to improve the quality of
teaching and learning (Aladjem et al., 2010). The strategies ranged from the adoption of new curricula,
increasing learning time, to introducing after-school programmes and block schedules. Nearly all the
schools also used data on student performance in their development (OECD, 2015c).
162. In building the capacity of all schools to provide high quality education for students with an
immigrant background, key policy areas include:
Supporting school leadership
Attracting teachers to schools in need
Building teachers’ expectations and teaching capability
Using data for improvement
Tapping the new supply of trained migrant teachers.
EDU/EDPC/RD(2015)35
72
Supporting school leadership
163. School leadership plays a key role in adapting school environments to the specific mix of
students and local circumstance (Pont et al., 2008; OECD, 2015c). While effective leadership matters for
all schools, it is especially important for schools in more challenging circumstances (Leithwood et al.,
2004; Mulford et al., 2008). Common features of successful leadership in challenging schools have been
found to include a culture of high expectations, a belief that all students can achieve irrespective of context
or background, alignment of others to a shared vision and values, distributed leadership, staff development
and community building (Mulford et al., 2008).
164. Despite the increasing diversity of student bodies, in most countries school leaders have no
formal training on diversity, intercultural pedagogy and language development. Thus, they may lack the
awareness, knowledge and skills necessary to guide the teachers they work with in providing quality
support to students with a range of different learning needs. Diversity training for school leaders could be
embedded in whole-school professional development programmes, which offer both possibilities of
tailoring the training to the need of the individual school and involving both teachers and leaders.
165. In addition, few countries are able to demonstrate effective policies for recruiting and retaining
highly effective leaders to the lowest performing and most disadvantaged schools. Having good working
conditions and systemic support is key to attracting and retaining competent leaders in disadvantaged
schools. In the UK, one targeted programme allows for more flexibility for leadership pay at schools to
reward and attract good leaders. This programme provides special financial incentives for exceptional
school leaders working in schools that find it difficult to attract talented principals
(www.gov.uk/government/policies/improving-the-quality-of-teaching-and-leadership).
166. Other incentives such as career progression can also attract high calibre candidates and these can
sometimes be a more powerful influence than increased pay. In Korea, for example, becoming a school
leader in a low performing, disadvantaged schools is well regarded by the profession and such appointees
are recognised as among the best performers (OECD, 2012c).
Attracting teachers to schools in-need
167. Some governments have provided additional funding to teachers in “challenging”schools in the
form of higher salaries or better working conditions. Such funding schemes are intended to reduce teacher
turnover rates and attract high quality teachers to schools serving low-SES, migrant and ethnic minority
students. Overall, there is some evidence that higher salaries for teachers in challenging schools may
contribute to raising teachers’ satisfaction and attracting high quality teachers to these schools. But the
evidence also indicates that such salary increases would need to be quite substantial to make a difference to
teacher turnover rates. The additional salary would need to be 20 to 50 percent more to make a difference
(Hanushek et al., 1999; 2001).
168. Other actions that have been taken to recruit and retain high quality teachers into disadvantaged
schools have included:
aligning initial and in-service teacher education with disadvantaged schools’ needs, to ensure that
teachers receive the skills and knowledge they need for working in these schools
providing mentoring for beginning teachers working in these schools, to assist their teaching
effectiveness and to increase retention
EDU/EDPC/RD(2015)35
73
providing supportive working conditions. It is particularly important for teachers in such schools
to feel they can work effectively and to see the results of their efforts
designing adequate career incentives, in addition to any financial incentives. In this way, teachers
see that achieving success with disadvantaged students will support their ongoing career
aspirations (OECD, 2012c).
169. In Korea, all teachers are held to high standards, which contributes to the country’s high levels of
performance and equitable distribution of teachers. Teachers are also highly respected, and they enjoy job
stability, high pay, and positive working conditions, including high levels of teacher collaboration.
Disadvantaged students in Korea are more likely than advantaged students to be taught by high quality
mathematics teachers, as measured by characteristics such as full certification, a mathematics or
mathematics education major, and with at least three years of experience. Multiple incentives are offered to
candidates who work in high need schools. Incentives include additional pay, smaller classes, less
instructional time, additional credit towards future promotion to administrative positions, and the ability to
choose the next school where the teacher works (Schleicher, 2014).
Building teachers’ expectations
170. High teacher expectations of migrant students’ abilities and capabilities will further support
migrant children to be successful. Course content and teaching materials are only a small part of students’
experience at school. Inter-cultural education is also mediated through the “hidden curriculum” expressed
in teacher expectations and attitudes for student learning (Bennett, 2001).
171. A consistent body of literature shows that low teacher expectations can have a devastating effect
on student motivation and performance. In fact, experimental research has revealed that erroneous teacher
expectations may become self-fulfilling prophecies, i.e. they may lead students to perform at levels
consistent with those expectations (Rosenthal and Jacobson, 1968; Brophy and Good, 1974; Rosenthal and
Rubin, 1978). Brind et al. (2008) describe this as a “cycle of low expectations, low aspirations and low
attainment”. In a review of the last 35 years of empirical research on teacher expectations, Jussim and
Harber (2005) conclude that self-fulfilling prophecies clearly exist and are most important for students
from stigmatised social groups, such as migrant students.
172. There is evidence that teacher expectations are formed partially on the basis of race, ethnicity and
social class (Heckmann, 2006a), which may lead to unintended and unacknowledged biases in teacher
behaviour. A consistent body of research indicates that teachers are likely to have lower expectations and
less positive evaluations of students who do not share their ethnic or racial characteristics. In the US, a
range of studies has shown that teachers’ race and ethnicity impacted on their perceptions of minority
students, eg whether they expected their students to be successful in college (Beady and Hansell, 1981),
whether they believed the student worked hard, whether they would recommend the student for honours
(Ehrenberg et al., 1995) and whether they perceived the student as being disruptive, inattentive or rarely
completing homework (Dee, 2005). In the UK, a survey has shown that an overwhelming majority of both
high and low achieving African Caribbean pupils were aware of the low academic expectations that
teachers had of them (Tikly et al., 2006).
173. In a literature review covering this topic, Scholfield (2006) suggests that the negative effect of
low teacher expectations on students with an immigrant background can be reduced by promoting
awareness of differential teacher behaviour and by providing strategies for behaviour change. But little
evidence can be found on specific teacher training programmes helping teachers to develop more positive
expectations towards all their students.
EDU/EDPC/RD(2015)35
74
Strengthening teaching capability
174. In TALIS 2008, 45% of teachers across participating countries reported a high or moderate
professional development need related to teaching in a multi-cultural setting (OECD, 2009; Jensen 2010).
By 2013, a greater proportion of teachers indicated a high level of need for professional development in
this area, although significant differences exist across countries, as illustrated in Figure 33.These findings
are consistent with teacher responses to a cross-country on-line survey on teacher education. In this survey
47% of student teachers, 51% of teacher educators and 66% of teachers who responded stated that teacher
education did not prepare teachers well to manage diversity issues (OECD, 2010c). Other studies have
found that many teachers have not been trained in addressing the needs of traumatised children, such as
refugees, some of whom may exhibit difficult behaviours (Sirin et al., 2015).
175. Teaching students from a wide range of different cultural and linguistic backgrounds with
different experiences and socio-economic backgrounds takes a complex set of skills that many teachers
may not have through formal training. The provision of teacher training should be continually updated and
adapted so that teachers can mobilise the knowledge and skills necessary to provide effective instruction
for all students. One of the skills that seem to be particularly important for teachers to achieve greater
equity in diverse classrooms is formative assessment, ie frequent, interactive assessments of student
progress and understanding of individual learning needs to adjust teaching (OECD, 2005b).
176. Most OECD countries now have requirements for teacher training institutes to include topics
associated with intercultural education in initial teacher training (Eurydice, 2004). However, institutions
for initial teacher education are at least partially free to determine their own curriculum and generally they
are not provided with any clear instructions as to how they should implement intercultural training. While
most initial teacher education programmes do include some form of diversity training, it is often in the
form of a single module or elective, which is unlikely to have any major, lasting or practical impact of
teachers’ practices in the classroom (OECD, 2010b).
177. Case study evidence from a range of countries shows that official guidelines on intercultural
teacher education are not always easily implemented (Norberg, 2000; Hermans, 2002; Garreta Bochaca,
2006). In Catalonia, a survey of teachers revealed that the overwhelming majority of Catalonian teachers
had received no initial training on cultural diversity (Garreta Bochaca, 2006). Case studies from the
Netherlands illustrate that while intercultural education plays an important role in policy documents and
curricula, the topic was not receiving high priority in teacher education (Hermans, 2002).
178. In-service training can be another way of helping teachers develop the skills necessary to take
their students’ diversity into account. While research promotes a whole-of-school approach to teacher
professional development (Timberly et al., 2007) there is no concrete recipe for how to change classroom
practices. It seems that in-depth professional training for teachers and school leaders is a critical factor, and
that practical tools such as data use and different types of supporting materials can help teachers change
their classroom practice (OECD, 2015c).
179. In the UK, a whole-school professional development programme introduced by the Department
for Children, Schools and Families to raise the confidence and expertise of primary teachers to support
their bilingual students produced promising results. Qualitative case study evidence showed that the
confidence of teachers and teaching assistants had been enhanced, and that the effect of the pilot activity
had encouraged bilingual students to have higher expectations of themselves, to be more confident, to ask
more questions and be more focused (White et al., 2006). In 2006, the pilot became a national strategy
programme and schools were provided with professional development materials to share best practice
between schools.
EDU/EDPC/RD(2015)35
75
180. In Norway, the White Paper No. 6 resulted in funding being provided for 2013-17 to foster
competence development in the area of multicultural issues in the whole education sector. This includes
employees, managers and owners of kindergartens as well as staff of schools and teacher training
institutions (OECD, 2015e).
Using data for improvement
181. The use of data for improvement is a frequent characteristic of successful school improvement
programmes and reforms. Integrating student achievement data into instructional change efforts enables
schools and school authorities to evaluate strengths and weaknesses, assess progress and take decisions on
further improvement needs. The latter can include decisions on the need for a different mix of programmes
or practices within schools (Honig and Rainey, 2012).
182. The effective use of data is generally a whole-school activity, with school leaders using the data
to make strategic and resourcing decisions. To use data well, schools need:
Formal, national-level data, such as standardised tests, and school-based data
Strategies to analyse and use the data for decision-making
Processes to use the data to inform practice, including additional support for teachers and
students (Schleicher, 2014).
Tapping the new supply of trained migrant teachers
183. While hiring teachers with a migrant background will not and should not be relied upon as a sole
strategy to ensure effective teaching for migrant children, increasing the share of minority and migrant
teachers may have a positive influence on migrant students’ learning experiences and sense of belonging. It
can also relieve pressures on increasing demand for teachers following a sudden influx of migrant children.
Some countries, however, do not permit new migrants to work as teachers (Sirin., 2015).
184. Countries that wish to reverse a growing disparity between an increasingly diverse student
population and a largely homogeneous teacher workforce have implemented initiatives to hire more
teachers from ethnic minority or migrant backgrounds. Such initiatives are often based on a view that
teachers of the same ethnic or racial background may service as effective role models, enhancing the self-
confidence and motivation of migrant students and ultimately leading to improved education outcomes
(Clewell and Villegas, 1998; Carrington and Skelton, 2003). While such teacher role model effects are
widely believed to exist, the empirical evidence is at best tentative (OECD, 2009).
185. In England and Wales, the Teacher Training Agency (TTA) introduced measures to attract more
visible ethnic minority entrants to the profession. These measures included targeted advertising, mentoring
schemes, taster courses, training bursaries, and the setting of recruitment targets for initial teacher training
institutions (Carrington and Skelton, 2003).
High impact, medium-term responses
Avoiding the congregation of migrant students in disadvantaged schools
186. Many schooling systems currently face challenges relating to the segregation of students on the
basis on socio-economic backgrounds (OECD, 2010; OECD, 2015c). For children with an immigrant
background, being concentrated into disadvantaged schools can be particularly detrimental to their
educational success. Regression analyses using cross-country data from studies such as TIMMS, PIRLS
EDU/EDPC/RD(2015)35
76
and PISA show that a higher degree of segregation on the basis of disadvantage is associated with a higher
unexplained test score gap between non-immigrant and migrant students (Schnef, 2004; Scheeweis, 2006).
Analysis from PISA 2012 data also finds a negative correlation between a concentration of migrant
students in disadvantaged schools and student performance.
187. The relationship between the concentration of immigrant students in a school and education
outcomes is less clear. A meta-analysis by Van Ewijk and Sleegers (2009) found that the concentration of
migrant students in schools has little effect on the outcomes for these students and no effect for non-
immigrant students (OECD, 2010). More recent analysis largely supports this finding, although results for
non-immigrant students are mixed. Recent PISA analysis shows that, while in some countries the
concentration of migrant students is associated with poorer academic performance, this is not the case in
the majority of countries.
188. Schneeweis (2015) found that a greater share of migrant students in Austrian schools did
negatively affect migrant students, but did not affect non-immigrant students. Similarly, Ohinata and van
Ours’ (2013) study on children in the Netherlands found some negative effects on immigrant students’
scores in reading and no adverse effectives for non-immigrant students. In a study on English schools,
Geay et al. (2013) found no negative effects on non-immigrant students.
189. Analysis across a number of countries identified small adverse consequences of immigrant
concentration for non-immigrant students (Brunello and Rocco, 2013). This finding echoes studies by
Gould et al. (2009) and Ballatore et al. (2013) on Israeli and Italian elementary schools. Negative effects
have been found to be stronger in countries that operate ability-differentiated school systems, such as
Germany, than countries with comprehensive systems, such as Denmark and Sweden (Jensen, 2015).
190. The concentration of immigrant students in schools often reflects residential patterns. In the
traditional catchment area model, students are assigned to a school in their neighbourhood. Thus, where
housing is highly segregated, schools tend to be segregated as well. The schools perceived to be of better
quality are often located in areas where property prices and rents are higher. Good quality schooling thus
often has an implicit price in the housing market and migrant students from low socio-economic
circumstances, as is the case with many migrants and certainly most refuges, may not have access to it
(Field et al., 2007).
191. Residential patterns are also influenced by factors such as the availability of employment,
discrimination and immigrant settlement practices. While settlement, employment and housing policies for
migrant families are beyond the scope of this current report, these clearly impact on the education
outcomes of migrant children and should be explored further.
192. Migrant students are more likely than non-immigrant students to be enrolled in urban schools
with high concentrations of students from immigrant and/or less advantaged socio-economic backgrounds.
In the majority of countries, at least 40% of migrant students were enrolled in schools in big cities (OECD,
2010). This may reflect the availability of employment opportunities as well as the preferences of
immigrants.
193. Students with an immigrant background are also more likely than their non-immigrant peers to
attend schools with less favourable learning environments. In countries where this is the case, immigrants
are more likely to be in a school environment characterised by high levels of student absenteeism and a
poor disciplinary climate (OECD, 2010).
194. Countries have used three main ways to address the congregation of migrant and other
disadvantaged students into particular schools. The first is to retain and attract other students, such as
EDU/EDPC/RD(2015)35
77
students from higher socio-economic background, to these schools. The second is to better equip migrant
parents with information on how to select and enrol their child at a range of possible schools. The third is
in limiting the extent to which advantaged schools can choose pupils on the basis of their family
background. Each of these responses is discussed below.
Making schools attractive for native and high socio-economic students
195. “Native” flight can occur in schools when the proportion of migrant students increases, and
particularly when parents are able to exercise choice over the school their child attends. Studies have
shown that it is mostly the better-off native families who exercise school choice. In Denmark, for example,
research suggests that since public school choice was introduced in the 1990s, segregation has increased
because non-immigrant students tend to choose schools with fewer immigrant and low-SES students
(Bloom and Diaz, 2007). Rangvid (2007b) shows that native Danes tend to “opt out” of local schools when
the proportion of migrants is at or above 35 to 40%, whereas Schneeweis (2015), however, did not find
evidence of native flight in Austrian schools with proportionately high concentrations of migrant students,
suggesting the concept of native flight was a more of a myth than reality.
196. Making schools with diverse populations attractive to non-immigrant students is one means to
reduce or offset “native flight”, where it does or may occur. For example, schools with special curricula
that are appealing to students across socio-economic groups can be placed in relatively disadvantaged
areas. In the US, such “magnet schools” offering special maths, science or art curricula have existed since
the 1970s (Heckman, 2008). They aim at providing high quality education in a specialised and integrated
learning environment. Generally, transport is provided for children, mostly from well-off white families, to
be brought to these schools outside their catchment areas. Some magnet schools in the US were designed
as desegregation tools using controlled choice student assignment plans. In this case, they consider a
student’s race in the assignment process in order to balance a school’s racial diversity (Mickelson
et al, 2008).
197. Other initiatives focus on raising the quality of existing schools with high proportions of migrant
students. In Switzerland, where growing numbers of native middle class families were leaving inner city
districts with ethnically diverse populations, the educational authorities responded with an area-wide model
of quality assurance in multi-ethnic schools (Gomolla, 2006). The QUIMS (Quality in Multi-Ethnic
Schools) programme offers extra resources and professional support to schools with 40% or more students
with an immigrant background. Among other things, the project explicitly aims at raising the standards of
education in these schools to attract more Swiss and middle class students (Gomolla, 2006).
Helping migrant parents to choose a school for their children
198. The literature also stresses the importance of providing information and logistical support to
migrant parents in order to strengthen their capacity to exercise informed school choice. Field et al. (2007)
point out that those students with weaker parental support are likely to be disadvantaged by school choice,
because their parents tend to be less well informed about the available options and the relative importance
of differences between schools. For example, Hastings et al. (2005) find that parents from low-income
groups attach a lower preference schools test scores than parents in high-income groups. Language
barriers, resource constraints, lower levels of education or lack of knowledge of the school system may
hinder migrant parents’ capacity to enrol their children in the most appropriate schools.
199. Practical problems such as lack of transportation, concerns about security, operating hours of
schools and workplace arrangements can also hinder parents’ exercise of school choice (André-Bechely,
2007). If no public transportation arrangements are supplied, low-income and single-parent families will be
disadvantaged. But even when free buses are provided to bring children to their schools of choice, migrant
EDU/EDPC/RD(2015)35
78
parents may be less likely to opt out of neighbourhood schools. While research shows that proximity is an
important concern of all parents, it seems more important to low-income ethnic minority parents (Hastings
et al., 2005).
200. Some jurisdictions have made concerted efforts to help parents who might not otherwise be
confident in making a well-informed choice of school for their children. Godwin et al. (2006), for example,
describe the school choice information programmes organised by a large urban district in North Carolina.
Each school developed materials to promote its particular programmes and organised information and
enrolment sessions for parents. Other activities included volunteers undertaking home visits to low-income
and immigrant families, “choice booths” in shopping malls, a district-wide information fair and hotlines in
English, Spanish and Vietnamese to explain the different available programmes.
201. Some policies attempt to influence the preferences of non-immigrant and migrant parents
simultaneously. In Denmark, the Copenhagen Model for Integration was introduced by the Copenhagen
city authorities to address native flight and segregation (Bloem and Diaz, 2007). The model was based on
limited municipal intervention to expand the choice options for migrant students. Schools with a
predominantly non-immigrant student population tried to attract migrant students by providing specific
preparation and training for teachers and guaranteeing an integration worker or a translator of ethnic
minority background to be employed at the school. Likewise, schools with high proportions of migrant
students tried to reach out to ethnic Danish parents to have them enlist their child in school through various
PR campaigns. In particular, schools collaborated with kindergartens to persuade parents to choose the
local district school.
Managing school selection criteria
202. School choice policies aim to ensure the right of parents to decide which school their child will
attend, independently of the area they live in. It is also expected to increase efficiency in education, by
enhancing competition between schools and pushing schools to improve quality and reduce costs. School
choice rarely, however, means that parents have complete freedom of choice. As school places are limited,
the schools with the highest perceived quality are likely to have more applicants than places. If over-
subscribed schools are allowed to give preference to students with higher performance levels or who live
near the school, school choice arrangements can reinforce segregation. In Sweden, for example, a school
reform that allowed independent schools to select students by ability led to a marked increase in
segregation across schools by immigrant status (Bjorklund et al, 2004).
203. Alternatively, several studies suggest that choice plans use simple lotteries to pick among the
applicants for oversubscribed schools in order to promote a more diverse student intake (Godwin et al,
2006). Education systems can also consider providing financial incentives for over-subscribed schools to
enrol migrant students (Field et al., 2007). For example, school funding may be weighted according to the
socio-demographic characteristics of the student population.
Avoid ability grouping, early tracking and grade repetition
204. Ability grouping, early tracking and grade repetition have been demonstrated to have negative
impacts on overall student achievement levels. While such negative effects have been shown to occur for
non-immigrant students, the impacts on migrant students can sometimes be more severe, as outlined below.
Ability grouping
205. Ability grouping is a very common education policy, used in most countries at some stage of the
educational trajectory. In a broad sense, it refers to policies and practices that sort students within
classrooms, between classrooms and between different types of schools according to criteria such as their
EDU/EDPC/RD(2015)35
79
previous grades, teachers’ recommendations, subject-matter achievement or standardised tests of
intelligence (Schofield, 2006).
206. These policies have a common goal of creating some degree of academic homogeneity within
classrooms, tracks or schools. Some researchers argue that such grouping practices are necessary to adapt
curricula and teaching practices to the specific needs of students with different levels of ability, providing
instruction at the optimal level and pace of each achievement group (Slavin, 1987; Lou et al., 1996).
207. Studying the structure of peer effects, Hoxby and Weingarth (2005) suggest an alternative view.
They find that a higher achieving peer is better for a student’s own achievement all else being equal, and
that high achievers also appear to benefit from interacting with peers a bit below them. They suggest that
policies that aim at creating interactions between high and low achievers should maintain continuity of
achievement levels.
208. At the same time, there are risks that ability grouping may hinder the learning of those who are
grouped into the lower tracks (Field etal., 2007). Being labelled as a “low-ability student” at an early age
may lead students to internalise low expectations and lose motivation for, and interest in, education (Jussim
and Harber, 2005). Moreover, in some settings, lower tracks may provide less stimulating learning
environments, due to differences in curricular standards, teacher expectations, instructional methods and
student compositions (Oakes, 1995; Entorf and Lauk, 2006).
209. The potential negative impacts of ability grouping are especially salient for migrant students. In
some environments, migrant and low-SES students are disproportionally grouped into the least
academically-oriented schools or tracks (Resh, 1998; Prenzel et al., 2005; Strand, 2007). Some types of
ability grouping, especially when it happens at an early age, may lock them into low level instructional
environments before they have had a chance to develop the linguistic, social and cultural skills to prove
their full educational potential (Entorf and Lauk, 2006).
Early tracking
210. Studies from a range of countries show that at similar achievement levels, migrant, minority and
low-SES students are more likely to be placed into the lower tracks of mainstream education than their
native peers. In Germany, Prenzel et al. (2005) find that, after controlling for reading and mathematics
scores in PISA, a child from the top quartile of socio-economic background is four times more likely to go
to the highest track of secondary school than a child from the second lowest quartile of socio-economic
background. In the UK, Strand (2007) finds that after controlling for prior attainment, Black Caribbean
pupils are less likely to be entered for the higher tier papers in GCSE science and mathematics than their
peers, at a level around 67% of that of white British students.
211. Moreover, some migrant and minority groups are more likely than native peers to be diagnosed
as having “special needs”, which results in their placement in separate institutions providing special
education (Field et al., 2007). In the United States, African-American students are nearly 2.5 times more
likely than whites to be identified as “mentally retarded”; in Switzerland more than half of the children in
special classes and schools are not of Swiss nationality; in Flanders, children with foreign nationality are
transferred to special education faster than their native peers; and in Hungary about 40% of Roma children
have been labelled as “mildly mentally disabled” (Field et al., 2007). Studies show that the over-
representation of migrant and minority children in special needs schools can partly be explained by factors
such as language difficulties, culturally different behaviour, lack of early childhood support and negative
stereotyping (Donovan and Cross, 2002).
EDU/EDPC/RD(2015)35
80
212. Assessing students’ capabilities can be especially challenging for teachers when students have
experienced trauma, as is the case for many refugee children. Educators who do not understand the impacts
such trauma can have, can fail to recognise when behavioural and cognitive difficulties are trauma related.
In these cases, such difficulties can be misdiagnosed as learning disabilities or mental health problems
(Sirin et al., 2015).
213. The impact of tracking into different school types seems to be especially harmful to migrant
students when it happens at an early age. Early separation from mainstream students may not allow them to
develop the linguistic and culturally relevant skills necessary to perform well before being assigned to a
lower level system. Entorf and Lauk (2006) find that separating students into different tracks at an early
age amplifies the learning differences between non-immigrant and migrant students that already existed
before they are allocated to tracks. It seems therefore essential to give migrant children sufficient
instructional time to develop their full potential before assigning them to high or low achieving groups.
Grade repetition
214. Furthermore, the evidence suggests that grade repetition is also harmful to student outcomes, as
well as being costly (OECD, 2015c). While on average across OECD countries, 12.4% of students have
repeated a grade in primary, lower secondary or upper secondary school, in countries such as Belgium,
Luxembourg and Portugal, almost one in three students reported having repeated a grade in secondary
education (OECD, 2013).
215. Preventive policies to reduce grade repetition have been introduced in a few countries. For
example, France reduced repetition rates by 11.1% percentage points between 2003 and 2012 and aims to
continue to reduce grade repetition by using it only in exceptional cases and implementing assessments at
the end of a learning cycle rather than at the end of each school year (OECD 2013). In Belgium (French
Community), the Take-off project (2012) targets reducing repetition by providing remedial pedagogical
tools for schools (OECD, 2015c).
Helping parents to help their children
216. The impact of parental involvement is a well-researched field. Literature reviews and meta-
analyses of empirical studies confirm that parental involvement in education is associated with improved
student outcomes (Jeynes, 2005, 2007; Fan and Chen, 2001; Desforges and Abouchaar, 2003; Schofield,
2006). This effect seems to work in two main forms: parental involvement at home, including discussion
about school, homework supervision and reading with children; and parental involvement at school,
including contact with teachers, attendance of events and volunteering at school activities. Moreover, the
evidence shows that the various forms of parental involvement are beneficial for student achievement
regardless of background factors such as immigrant status or ethnicity (Desforges and Abouchaar, 2003;
Schofield, 2006; Jeynes, 2007).
217. While parental involvement matters for all children, immigrant parents, especially those with low
SES, seem to be less involved than non-immigrant parents (Turney and Kao, 2006). While migrant parents
often have high aspirations for their children, they may face multiple barriers to involvement in school,
such as language difficulties, weak knowledge in school subjects or lack of time and/or money to invest in
their children’s education. They may also feel alienated and unwelcome in a foreign school environment
(Desforges and Abouchaar, 2003), especially if their child has encountered discrimination or abuse (Sirin
et al., 2015).
218. These findings have important implications for policy and for schools. Initiatives to boost
parental involvement need to address the complex set of factors likely to inhibit parental support in migrant
EDU/EDPC/RD(2015)35
81
families. Schools need to find ways of communication that appeal to parents with different levels of
education, language skills and understanding of the school system. They need to build parents’ capacity in
supporting their children while at the same time training teachers to interact with parents effectively.
Home visiting
219. Home visiting programmes are often successful in bringing education into homes are one of the
most commonly used approaches to foster parental involvement in their children’s education. Such
programmes send facilitators into the homes of “at-risk” families to improve children’s education by
encouraging parents to undertake particular educational activities with their children. This approach is
widely used at the pre-school level.
220. A literature review by Gomby (2005) found that home visiting programmes were especially
useful in serving socially or geographically isolated families, being tailored to the specific needs of
individual families and in having positive outcomes on siblings. As part of Germany’s National Action
Plan on Integration (2011), the federal government supports difficult-to-reach parents in the organisation of
their children’s educational paths with its model project, Education Bridges – the Qualifications of Parents
for Better Educational Opportunities in Immigrant Families (OECD, 2015c).
221. In a review of evaluations of six US-based pre-school home visiting programmes, Gomby (2005)
reveals some features of successful initiatives. First, programmes offering home visiting services in
combination with ECEC programmes produce more long-lasting results than those that offer home visiting
services alone. Second, the intensity of services matters. If the visits are limited or infrequent, it may be
difficult to establish close relationships and to bring about behaviour changes. Third, the success of the
programme depends on the relationship between the home visitor and the parent. Paraprofessionals with a
similar demographic background to the community being served may be able to establish higher levels of
trust and understanding with the families. To ensure quality of the visits, the visitors need pre-service and
ongoing training and should be paid and supported adequately so that turnover rates are minimised.
222. A model specifically targeting refugee families is “Syria Bright Future”. This organisation
provides tailored education and mental health support services for Syrian refugee children in Jordan. The
group offers educational support programmes to help children to develop school-related skills and provides
tutoring to children who are behind in school. Parents are also given ongoing support and advice on how to
help their children. The programme is highly individualised, multi-faceted and culturally sensitive. The
aim is to help the entire family function better in the face of extreme hardship (Sirin et al., 2015).
School liaison staff
223. In some countries, schools have appointed special professionals to ensure effective liaison
between the school and students’ families, as well as with representatives of particular communities.
Liaison activities include support for raising achievement, communication with families, improvement of
social provision and access to medical care. School liaison staff can, for example, help parents to
understand the benefits of educational resources at home and the nature of these, such as a desk, books for
school work, a calculator, a computer and a quiet place to study. Parent groups such as community
language classes, parenting skill sessions or toy library services are also sometimes established
(OECD, 2010b).
224. Links with community leaders aid the dispersion of information on education and other services,
including on how to get support. In New Zealand, the Pasifika Education Plan (2013-17) sets out the
importance of effective community engagement between education institutions and Pasifika communities
as a means to lift Pasifika student achievement (OECD, 2015c).
EDU/EDPC/RD(2015)35
82
Involvement in school activities
225. Schools also can reach out to parents to engage them in school-based activities. This can both
equip parents with knowledge on how to support their child’s learning and also emphasis the relevance of
school to children. In Austria, for example, some states provide programmes to involve parents with
kindergartens and schools, including language courses for mothers at the school. The aim is to familiarise
mothers with their child’s learning environment and support them in making new contacts. Free childcare
is provided during the lessons for children who are too young to be in the school or kindergarten (Nusche
et al., 2010).
226. Research indicates that parental involvement programmes are most effective when targeted in
specific subject areas. In a review of family influence on literacy learning in the US, Sheldon and Epstein
(2005a) find that 22 out of 23 targeted reading programmes that taught parents to become involved with
their children in reading and language activities produced significant gains in student performance in these
areas. Many of the students participating in the studies were from ethnic minority or immigrant groups.
Using longitudinal data from elementary and secondary schools, Sheldon and Epstein (2005b) also show
that effective implementation of practices that encouraged families to support their children’s mathematics
learning was associated with higher mathematics test scores.
Strengthening integration efforts
Targeting funding to “what works”
227. One of the most common policy approaches in migrant education is to allocate additional
resources, in the form of finance or teaching staff, to schools or districts enrolling high proportions of
migrant students. The rationale for such redistributive policies is twofold. Migrant students are in many
countries more likely to be enrolled in schools located in deprived areas and additional resources may be
necessary to bring these schools up to parity with the mainstream (OECD 2005a; Darling-Hammond, 2000;
Pugin, 2007). To achieve such targeting, however, it is necessary to be able to identify the students to be
targeted. In some countries, this is not always easy if, for example, migrant groups are not comfortable in
being identified and recorded or if there are restrictions on recording students’ ethnicities.
228. Where there has been significant financial support for migrant education, research often shows
mixed or modest results. Whether such funding is successful in narrowing the achievement gap between
native and migrant students depends on the types of programmes or other assistance the money is actually
spent on, and how it is managed. In addition, research has shown that the strategies used to calculate and
distribute these resources also have an impact on whether they will be used effectively or not
(OECD, 2010b).
229. Targeted funding, however, can have unintended consequences in attaching a negative image to
the targeted schools and thereby creating a stigmatising effect. Better-off and middle class students either
choose to not attend these school or leave to attend other, “better” schools. In the ZEPs in France, for
example, a decline in school enrolments was found due to both depopulation of ZEP areas and to middle
class parents avoiding ZEP schools (Bénabou et al., 2003).
Targeting student characteristics
230. While additional funding may not be needed for all migrant students, a targeted approach can
provide additional support for at-risk students and also encourage schools to be more receptive to enrolling
such students. In England the Pupil Premium provides additional funding to schools to raise the attainment
of disadvantaged pupils. It targets students who have received free school meals at any point in the
preceding six years. The funding applies to primary and secondary school children, and has recently been
EDU/EDPC/RD(2015)35
83
extended to cover early childhood education (OECD, 2015c). Schools have autonomy over how the
funding is used. A review of this programme indicates that positive impacts are being achieved by schools
for the target student population (Ofsted, 2014).
231. Migrant status often overlaps with low socio-economic status, and many migrant groups
experience higher levels of poverty than the majority (Brind et al., 2008). Hence, allocating additional
resources to schools with low-SES students is likely to reach many migrant students as well. However,
while poverty and parental education may be among the most marginalising factors in terms of educational
achievement, in some countries migrant students’ educational disadvantage remains after controlling for
socio-economic status (Brind et al., 2008). This suggests that funding strategies to tackle particular priority
areas for migrant students are relevant.
232. In Switzerland, as noted earlier, the QUIMS programme focuses explicitly on ethnic and cultural
diversity. It provides extra financial resources and professional support to schools with 40% or more
students from migrant backgrounds. The funding is targeted for particular fields of school development in
ethnically and culturally diverse schools, including language instruction and developing an inclusive and
non-discriminatory school ethos (Gomolla, 2006).
233. In the UK, funding from the Ethnic Minority Achievement Grant (EMAG) is allocated based on
numbers of pupils from nationally underachieving minority ethnic groups and English language learners.
The major objectives of the grant are to support whole-school change to narrow achievement gaps for
underachieving minority ethnic pupils and to address the costs of additional support to meet the specific
needs of bilingual learners (DFES, 2004). Since 2011, the EMAG has been included in the Dedicated
Schools Grant, to simplify the English school funding system (Chowdry and Sibieta, 2011).
Funding intermediate authorities versus individual schools
234. In many OECD countries, immigration is a regional phenomenon, with large proportions of
migrant students clustered in certain, generally poorer, areas. To recognise this, some funding strategies
take into account the characteristics of local communities such as high unemployment, concentrations of
migrant families and adverse structural conditions, in addition to student-based criteria. Through allocating
resources for migrant education to intermediate authorities such as school districts, local authorities or
municipalities, this funding then supports the development of locally coherent and tailored initiatives.
235. The Zones d’éducation prioritaires (ZEPs) in France target particular geographic areas suffering
from social disadvantage. The scheme allocates additional resources to schools within the targeted areas,
which can be used for a range of purposes, including additional teachers and the employment of social
workers and health professionals. Schools have discretion over the use of the extra resources. While the
additional funding has been spent on a range of areas such as additional hours of instruction, raising
teacher salaries, reading promotion, homework assistance and cultural activities, most of this additional
funding is directed towards supplementary teachers (90%) and teacher bonuses (8%) (Schleicher, 2014).
236. It can be important to earmark funds allocated to intermediate authorities, to make sure that they
are actually used for migrant education, rather than for other local priorities. In Sweden, it was found that
targeted grants given to municipalities had a positive and significant effect on school spending whereas
general, untargeted grants had an insignificant or even negative impact (Ahlin and Mork, 2005; Field
et al.,2007).
237. Giving funding directly to schools can, however, be a way to avoid biases in spending patterns of
intermediate authorities and ensure that the money indeed reaches the schools with the highest proportions
of migrant students. In several countries, redistributive strategies match an extension of school autonomy,
EDU/EDPC/RD(2015)35
84
an emphasis on new systems of quality management and professional development opportunities provided
to school staff (Chambers et al., 2008).
Providing support for effective resource use
238. Ensuring efficient management of resources, to get the most from any additional resources,
appears to be best achieved through a combination of local decision-making based on students’ needs and
guidance and support from intermediate authorities. Thus, when funding for migrant education is
distributed directly to schools, it is important that further guidance or professional training is provided on
how the resources can be used effectively. Otherwise, school staff may not know how to fit new initiatives
into their school development plans, or they may use the money on programmes that have not been
demonstrated to be effective in improving migrant education (Karsten, 2006).
239. In the US, for example, data shows that 70% of Title I schools used the additional funding for
pull-out programmes that remove struggling students from class, even though legislation had required
schools to minimise such programmes (Kirby et al., 2003) and research has shown there is little
educational benefit in these programmes (Karsten, 2006).
240. Intermediate authorities can provide vital support to schools on how to use additional resources
effectively. In the UK, Tikly et al., (2005) showed that additional funding for ethnic minority students was
more likely to impact on student achievement when the local authorities provided active support in the
management and co-ordination of the additional funds. The local authorities that were successful in raising
migrant student achievement often provided good practice guidelines and advisory services for schools.
They also tended to offer professional development for school managers and governors in the effective use
of additional funding, disseminate good practice in addressing the needs of ethnic minority students, and
have provisions to monitor progress in migrant education.
Targeting specified uses
241. In Switzerland, the QUIMS strategy aims to provide attractive incentives and professional
support for participating teachers and schools, and highlights the importance of co-operation between
schools and the local administration. Participating schools are provided with structured schemes for school
improvement and additional support from the local administration, including advisory services,
professional development, materials, handbooks, local networks and evaluations (Gomolla, 2006).
242. Schemes that reward schools where disadvantaged students have made progress also exist. In the
UK, every year about 500 “Pupil Premium Awards” ranging from 1,000 to 250,000 pounds are distributed
to the schools that have improved the performance of their disadvantaged students the most. This
programme aims at giving schools an incentive to improve their disadvantaged students’ performance
(www.pupilpremiumawards.co.uk).
Demonstrating the value of cultural diversity
243. While there seems to be agreement across OECD countries on the importance of integrating
intercultural perspectives into the curriculum, very little empirical research is available on the impact of
curriculum and textbook changes on student learning. However, valuing diversity in curricula and teaching
materials can be helpful in integrating migrant children into a new education setting. Seeing themselves in
curricula and other material assists students to see school as relevant and to have a sense of belonging in
the schooling system of their host country. Mono-cultural curricula and course content may create or
reinforce feelings of isolation and exclusion when migrant groups are marginalised or presented negatively
or inaccurately (Tikly et al., 2006).
EDU/EDPC/RD(2015)35
85
Curriculum and course materials
244. Many countries have made efforts to rethink and transform traditionally monocultural curricula,
textbooks and teaching materials to include perspectives, examples and information from a variety of
cultures and groups (Bennett, 2001). Beyond the inclusion of inter-cultural aspects in national textbooks
and curricula, there have been some evaluations of the degree to which the curriculum is developed and
adapted at the local level to include relevant intercultural perspectives. These studies show that the practice
of inter-cultural education is limited.
245. In the Netherlands, while intercultural education had been part of national policy for some time, a
2002 evaluation showed that only 20% of schools had integrated intercultural education in their curricula
(Hermans, 2002). Another evaluative study also stressed the need for governments to ensure that
intercultural education is actually implemented at the school level (Driessen, 2000).
246. In the UK, an evaluation of the Aiming High: African Caribbean Achievement Project in 30 case
study schools (Tikly et al., 2006) reveals that a significant number of African Caribbean students were
struck by their invisibility in the curriculum and exasperated by the white European focus of instruction. At
the same time, the evaluation also notes that all 30 case study schools had made some progress on African
Caribbean inclusion in the curriculum over the duration of the project.
Use of children’s mother tongues
247. The research literature is conflicting on whether it is necessary for children to have a good
command of their mother language in order to be able to become proficient in the language of instruction.
Despite this lack of clarity, countries may want to support mother language education as an important goal
in itself. Valuing migrant students’ mother language can be an essential component of inter-cultural
education, ensuring that migrant children feel that their cultural and language background is appreciated as
much as that of the majority (Brind et al., 2007). It has been argued that learning the mother tongue is an
important step towards integration because it helps children to bridge the gap between their home and
school. The mother language teacher can also play a role of cultural intermediary between families and the
school (Driessen, 2005).
248. It is important, however, to provide mother tongue instruction in addition to regular curriculum
instruction, rather than as a substitute for it. In Sweden, for example, mother tongue instruction has been
identified as reinforcing the exclusion of students with an immigrant background, rather than supporting
better integration and student achievement. Minority students that were less well-integrated were more
likely to have participated in mother tongue instruction to a larger degree than students who were better
integrated (Frandji et al., 2009).
249. Very few countries actually pursue a bilingual approach. In the Netherlands, for example, mother
language teaching was abolished in 2004 (Driessen, 2005). In many other countries, whether bilingual
education is provided or not generally depends on decisions made at the municipality or school level
(OECD, 2006b).
250. The limited use of bilingual approaches in migrant education may also be due to practical and
logistical obstacles. Providing mother tongue education to all migrant students can be very costly and
difficult to implement, especially when many different language groups are present in the country. It can
be difficult to find a sufficient number of qualified teachers and to provide high quality guidelines and
materials connecting mother language instruction to the mainstream curriculum. It may also be difficult to
provide mother language education when the language spoken at children’s home is a dialect or an
informal spoken language.
EDU/EDPC/RD(2015)35
86
Monitoring progress.
251. To achieve improvements for any group of students at a system, district or school-level, it is
essential to monitor and evaluate progress. Monitoring and evaluation at the student level, class, school and
system level should provide insights on what is occurring and why, and how improvements may be
achieved. There are frequent gaps in countries basic information on the situation of immigrant students and
their education performance. Typically, countries either do not collect or do not publish data that make it
possible to determine whether systems are effective or equitable in reaching immigrant students and
meeting their learning needs (OCED, 2010b).
252. In an OECD review of several European countries, the Netherlands was found to have a richer
information base than most countries reviewed (OECD, 2010b). For years, Dutch education authorities
have broken down results of national studies and international surveys (PISA, PIRLS, TIMSS) to gauge the
situation and performance of ethnic groups and immigrant groups, and to compare these with the results of
non-immigrant Dutch students (Herweijer, 2009).
253. In the UK, the allocation of extra resources through the EMAG (now the Dedicated School
Grant) is based on concrete targets to raise the achievements of particular underachieving ethnic minority
groups. Schools are required to use ethnic monitoring, which allows collecting and analysing achievement
data in relation to students’ ethnic backgrounds. This is seen as an important instrument in identifying
inequalities, introducing specific interventions and monitoring success (Gomolla, 2006).
EDU/EDPC/RD(2015)35
87
PROPOSAL FOR FUTURE WORK ON INTEGRATION OF CHILDREN OF IMMIGRANTS
AND REFUGEES
254. Previous sections of this paper examine in detail the outcomes of migrant students in different
education systems and provide a review of policy pointers that emerge from a review of the literature on
effective policy responses to the challenge of integrating immigrant students. The work presented in the
paper however paints a partial and incomplete picture because it does develop a comprehensive strategy
that identifies a mechanism that allows the prioritisation of different policy interventions given country
specificities and identifies effective implementation processes that education systems can set in motion to
promote the effective integration of migrants.
255. The OECD could update and upgrade the OECD policy advice on the integration of immigrant
children and adults through education, by providing:
a) a comprehensive set of indicators on education attainment, proficiency at school, skills and attitudes of
immigrants for OECD and partner countries (and trends);
b) new empirical evidence on the effects of targeted policies and general education and skill policies on the
education and labour market integration of immigrants;
c) analysis of the complementarities between migration, education and social policies;
d) a review of the likely efficacy of policies implemented to help schools support the cognitive and social
development of disadvantaged immigrant students;
e) a review of the policy strategies for the transferability and development of adult migrants’ skills.
256. Further work could be done by the OECD to assist countries in making integration-related
decisions, not only by providing reliable and practical advice, but also by providing this advice in a timely
fashion and on the basis of the best available evidence. OECD advice could be articulated around two
main strands:
A diagnostic phase which would build upon the work conducted in this paper on the outcomes of
migrants and exploit in detail OECD led data such as PISA and PIAAC and integrate them with
other data sources (including PIRLS and TIMMS to map achievement growth, the World Values
Survey and the just released migration module in the 2014 European Social Survey to monitor
trends in attitudes towards migration, the International Civic and Citizenship Education Study,
Labour Force Surveys and small-area Census information).
A policy/implementation phase which would use the framework and diagnostic results obtained in
the diagnostic phase to articulate a policy network of interested countries which would identify
country specific challenges and articulate policy responses and implementation strategies based on
input from international experts, OECD Secretariat analysts and stakeholders from other
participating countries who have been involved in similar integration/related decisions.
257. The OECD completed a thematic review of migration policies based on country reviews in six
countries in 2010 and an analytical report on the outcomes of migrant children in 2012 that formed the
basis for the policy review presented in this paper. While these earlier pieces of work provide a strong
platform, they were limited in scope and did not offer an integrated approach to the analysis of how
immigrants fit in host countries (given the specificities of different migrant groups and host communities).
EDU/EDPC/RD(2015)35
88
The OECD proposes to examine how policy design and implementation can serve different countries given
the specificities of the migration flows they experience and the specificities of their education, training,
labour market and social welfare systems.
258. The OECD can provide assistance to countries who face decisions on how best they can promote
the integration of migrants in two main areas:
Evidence-based empirical analysis
259. The OECD has wide-ranging expertise in the analysis of the skills and dispositions of school
aged children and adults. Studies such as PISA and the Survey of Adult Skills offer invaluable insights on
the risk and protective factors that shape the life outcomes of children but also on the attitudes individuals
in host countries have towards diversity and integration. The OECD can develop analyses that help identify
the level of skills immigrants possess and that may be unrecognised by the education system and the labour
market in host countries. It can provide a fine-grained picture of the human, social and cultural capital
different groups of migrants bring but also different host countries possess. The OECD could help
countries identify which education and training systems policies are particularly suited to tackling different
aspects of integration, ranging from language skills acquisition to social integration, from the development
of cognitive skills to the development of entrepreneurial spirit and perseverance.
260. Further empirical work would allow the OECD to develop a set of reliable, policy relevant and
comprehensive indicators to help countries assess the outcomes of immigrants, establish realistic
integration goals and develop effective metrics to monitor progress towards the achievement of such goals.
Such indicators would encompass both achievement and non-achievement outcomes (cognitive and social
domains) and integrate information on students’ country of origin and characteristics. The OECD could
help countries map the characteristics and concentration of migrants in different countries using both PISA
and census data at a fine level of spatial disaggregation, and assess the achievement growth of migrants in
different countries by linking data from PISA to other large scale assessments examining student outcomes
at earlier age groups such as TIMMS and PIRLS.
261. Analyses on student outcomes would be complemented by analyses on the attitudes and
dispositions individuals without an immigration background have in host countries, both to migration in
general and specific forms of migration and diversity. Building on work on NIMBYs (Not In My Back
Yard) and evidence on the risk posed by the concentration of disadvantage, future work on policies to
support the integration of migrants would attempt to examine school district regulations and school
selection policies and the extent to which individuals’ reactions to migration and diversity could stall
efforts to avoid the creation of pockets of social and economic disadvantage, particularly in large cities.
This horizontal analytical work will help policy makers in the trade-offs they are making in the short-term
alongside known medium-term impacts. New data from the Survey of Adult Skills could also help to
identify the untapped potential of migrants due to the lack of recognition of skills and qualifications within
host countries and estimate the cost of the mismatch between the skills migrants bring and how they are
integrated in the labour market.
Policy advice and implementation
262. The OECD has a long-standing commitment and expertise in linking analyses of outcomes, to in-
depth explorations of the processes that have contributed to such outcomes, and in providing advice on the
policy landscape that could help them achieve their policy goals and orientations. This paper builds on
previous work that the OECD did and future work could build on such experience and help countries
identify which policies can be adopted in different circumstances to support and fast-track successful
integration into education and migrants’ next steps into higher education or the labour market. In many
EDU/EDPC/RD(2015)35
89
cases, this includes avoiding the pitfalls that exacerbate the disadvantage that many migrants and refugees
already face. In other cases, it will help countries to avoid expenditure in areas that, while not harmful, do
not enhance the success of migrant children. A key issue is the recognition of the skills and qualifications
that migrants bring into their host countries. Given the urgency many countries face, the OECD would aim
to provide practical advice and examples on successful implementation mechanisms separating short,
medium and long-term policy objectives and challenges. Generic advice is not always helpful, particularly
for administrations that must act quickly.
263. Providing specific and detailed information on countries’ experiences in relation to migrant
education is likely to add important value to those on the field who need to make day-to-day decisions as
well as to those who are charged with developing a strategic, long-term vision on the options available to
their education systems. Thus, in addition to demonstrating “what works in which contexts”, the OECD
would devote considerable effort to illustrating how policies and programs have been implemented. While
each country can and should adapt any such policies and programs to their own settings and context,
providing more detailed information on how sound outcomes have been achieved will assist countries in
navigating and shaping their own approaches. The policy review section of the project would combine
desk research with in-depth country reviews (subject to voluntary contributions on the part of particular
countries) developed through the creation of a policy network of experts from participating countries and
subject matter experts with the view of providing key design and implementation solutions meeting the
particular challenges of immigrant integration(as identified by national stakeholders and analysis
conducted in the context of the analytical phase of the project).
EDU/EDPC/RD(2015)35
90
REFERENCES
AERA (American Educational Research Association) (2004), “English Language Learners: Boosting
Academic Achievement”, AERA Research Points, Vol. 2, No. 1.
Ahlin, A. and Mork (2005), “Effects of Decentralization on School Resources”, Working Paper 2005:5,
Institute for Labour Market Policy Evaluation (IFAU), Uppsala.
Aladjem, D.K. et al. (2010), ‘Achieving Dramatic School Improvement: An Exploratory Study”, US
Department of Education, Office of Planning, Evaluation and Policy Development, Policy and
Program Studies Service, Washington, DC.
Alesina, A., La Ferrara, E., (2005), “Ethnic diversity and economic performance”, Journal of Economic
Literature 43, 762–800
André-Bechely, L. (2007), “Finding Space and Managing Distance: Public School Choice in an Urban
California District”, Urban Studies, Vol. 44, No. 7.
Au, K. H. (1998), “Social Constructivism and the School Literacy Learning of Students of Diverse
Backgrounds”, Journal of Literacy Research, Vol. 30.
Ballatore, R.M., M. Fort and A. Ichino (2014), “The Tower of Babel in the Classroom: Immigrants and
Natives in Italian Schools”, IZA Discussion Paper No. 8732.
Baumeister, R.F., & Leary, M.R. (1995), “The need to belong: Desire for interpersonal attachments as a
fundamental human motivation”, Psychological Bulletin, 117, 497-529.
Beady, C.H. and S. Hansell, (1981), “Teacher Race and Expectations for Student Achievment”, American
Educational Research Journal, Vol. 18, No. 2.
Bénabou, R.F., Kramarz and C. Prost (2003), “Zones d’Éducation Prioritaire: Quels Moyens Pour Quels
Résultats? Une Evaluation sur la Période 1982 – 1992’, INSEE – 200318.
Bénabou, R.F., Kramarz and C. Prost (2009), “Zones d’Éducation Prioritaire: Much Ado About Nothing?”
Economics of Education Review, vol. 28(3).
Bennett, C. (2001), “Genres of Research in Multicultural Education”, Review of Educational Research,
Vol. 71, No. 2.
Bertschi-Kaufmann, A., M. Gyger, U. Kaser, H. Schneider and J. Weiss (2006), “Sprachforderung von
Migrationskindern im Kindergarten”, Literaturstudie erstellt im Auftrag des Departements Bildung,
Kultur und Sport des Kantons Aargau, Switzerland.
Bjorklund, A., M.A. Clark, P-A. Edin, P. Fredriksson and A.B. Krueger (2005), The Market comes to
Education in Sweden: An Evaluation of Sweden’s Surprising School Reforms, Russell Sage
Foundation, New York. (check there isn’t one for et al., 2004)
Bloem, N.S. and R. Diaz (2007), “White Flight: Integration through Segregation in Danish Metropolitan
Public Schools”, Humanity in Action, Team Denmark.
EDU/EDPC/RD(2015)35
91
Brind, T., C. Harper and K. Moore (2008), Education for Migrant, Minority and Marginalised Children in
Europe, a report commissioned by the Open Society Institute’s Education Support Programme.
Brophy, J.E. and T.L. Good (1974), Teacher-Student Relationships: Causes and Consequences, Holt,
Rinehart and Winston, Inc, New York, NY.
Brucker, H., S. Capuano, and A. Marfouk (2013), Education, gender and international migration: insights
from a panel-dataset 1980-2010, mimeo, IAB, Nuremberg.
Brunello, G. and L. Rocco (2013), “The effect of immigration on the school performance of natives: Cross-
country evidence using PISA test scores”, Economics of Education Review 32:C.
Burns, T. (2010), “Attracting and Retaining Diverse Student Teachers and Teachers”, Background Paper
prepared for the OECD International Seminar on Teacher Education for Diversity, Brussels,
Belgium.
Carrington, B. and C. Skelton (2003), “Re-thinking ‘Role Models’: Equal Opportunities in Teacher
Recruitment in England and Wales”, Journal of Education Policy, Vol. 18, No. 3.
Castles, S. and Miller, M.J. (2003), The age of migration. 3rd
Edition. New York: Guilford Press.
Chambers, J., L. Shambaugh, J. Levin, M. Muraki, L. Poland (2008), A tale of two Districts: A
comparative Study of Student-Based Funding and School-Based Decision Making in San Francisco
and Oakland Unified School Districts, American Institutes for Research.
Chiswick, B. R and N. Deb-Burman (2004), “Pre-school Enrollment: An Analysis by Immigrant
Generation”, IZA Discussion Paper No. 1226.
Chmielewski, A. K. (2014), “An international comparison of achievement inequality in within- and
between-school tracking systems”, American Journal of Education 120(3): 293-324.
Chowdry, H. and L. Sibieta (2011), “Trends in education and schools spending”, IFS Briefing Note,
BN121, Institute for Fiscal Studies.
Christensen, G. and P. Stanat, (2007), “Language Policies and Practices for Helping Immigrants and
Second-Generation Students Succeed”, The Transatlantic Taskforce on Immigration and Integration,
Migration Policy Institute (MPI) and Bertelsmann Stiftung.
Clewell, B.C. and A.M. Villegas (1998), “Diversifying the Teaching Force to Improve Urban Schools:
Meeting the Challenge. Introduction”, Education and Urban Society, Vol. 31, No. 1.
Crosnoe, R. (2013), Preparing the Children of Immigrants for Early Academic Success, Washington, DC.
Cummins, J. (1979), “Linguistic Interdependence and the Educational Development of Bilingual
Children”, Review of Educational Research, Vol. 49, No. 2.
Cunha, F., J. Heckman, L. Lochner and D. Masterov (2005), “Interpreting the Evidence on Life Cycle Skill
Formation”, Working Paper 11331, National Bureau of Economic Research, Cambridge, MA.
Darling-Hammond, L. (2000), “Teacher Quality and Student Achievement: A Review of State Policy and
Evidence”, Education Policy Analysis Archives, Vol. 8, No. 1.
EDU/EDPC/RD(2015)35
92
Davidov, E., Meuleman, B., Billiet, J., Schmidt, P. (2008), “Values and Support for Immigration: A Cross-
country Comparison”, European Sociological Review 24(5): 583– 99.
Deci, E. L., & Ryan, R. M. (1991), A motivational approach to self: Integration in personality. Nebraska
Symposium on Motivation: Perspectives on Motivation, Lincoln, NE. , 38 237-288.
Dee, T.S. (2005), “A Teacher like Me: Does Race, Ethnicity or Gender matter?”, American Economic
Review, Vol. 95, No.2.
Desforges, C. and A. Abouchaar (2003), “The Impact of Parental Involvement, Parental Support and
Family Education on Pupil Achievements and Adjustment: A Literature Review”, Research Report
No. 4333, Department for Education and Skills, London.
DFES (2004), “Aiming High: Supporting Effective Use of EMAG”, DfES/0283/2004, Department for
Education and Skills, London.
Docquier, F., and H. Rapoport (2012), “Globalization, brain drain and development”, Journal of Economic
Literature, 50(3), 681–730.
Donovan, M.S. and C. Cross (eds.) (2002), Minority Students in Special and Gifted Education, National
Research Council, National Academies Press, Washington, D.C.
Driessen, G. (2000) “The Limits of Educational Policy and Practice? The case of ethnic minorities in The
Netherlands”. Comparative Education, vol. 36(1).
Driessen, G. (2005), “From Cure to Curse: The Rise and Fall of Bilingual Education Programs in the
Netherlands”in Sohn, J. (ed.), The Effectiveness of Bilingual School Programs for Immigrant
Children, Programme on Intercultural Conflicts and Societal Integration (AKI), Social Science
Research Center Berlin (WZB), Berlin.
Ehrenberg, R.G., D.D. Goldhaber, D.J. Brewer (1995), “Do Teachers’ Race, Gender and Ethnicity Matter?
Evidence from the National Educational Longitudinal Study of 1988”, Industrial and Labor
Relations Review, Vol. 48, No. 3.
Ehri, L.C., S.R. Nunes, D.M. Willows, B. Valeska Schuster, Z. Yaghoub-Zadeh and T. Shanahan (2001),
“Phonemic Awareness Instruction Helps Children Learn to Read: Evidence from the National
Reading Panel’s Meta Analysis”, Reading Research Quarterly, Vol. 36, No. 3.
Entorf, H. and M. Lauk, (2006), “Peer Effects, Social Multipliers and Migration at School: An
International Comparison”, HWWI Research Paper, Hamburg Institute of International Economics,
Hamburg.
Eurydice (2004), Integrating Immigrant Children into Schools in Europe, European Commission, Brussels.
Fan, X. and M. Chen (2001), “Parental Involvement and Students’ Academic Achievement: A Meta-
Analysis”, Educational Psychology Review, Vol. 13, No. 1.
Field, S., M. Kuczera and B. Pont (2007), No More Failures: Ten Steps to Equity in Education, OECD
Publishing.
Frandji, D., J-M Pincemin, M. Demeuse, D. Greger and J-Y. Rochex (2009), Comparaison des politiques
d’Éducation prioritaire en Europe, Rapport scientifique, Vol.1.
EDU/EDPC/RD(2015)35
93
Friedberg, R.M. (2000), “You can't take it with you? Immigrant assimilation and the portability of human
capital”, Journal of Labor Economics 18(2):221-51.
Fuller, B. (2007), Standardized Childhood: The Political and Cultural Struggle over Early Education, Palo
Alto, CA: Stanford University Press.
Garreta Bochaca, J. (2006), “Ethnic Minorities and the Spanish and Catalan Educational Systems: From
Exclusion to Intercultural Education”, International Journal of Intercultural Relations, Vol. 30, No.
2.
Geay, C., S. McNally and S. Telhaj (2013), “Non-native speakers of English in the classroom: What are
the effects on pupil performance?”, The Economic Journal 123:570.
Godwin, R.K., S.M. Leland, A.D. Baxter, S. Southworth (2006), “Sinking Swann: Public School Choice
and the Resegregation of Charlotte’s Public Schools”, Review of Policy Research, Vol. 23, No. 5.
Gomby, D. (2005), “Home Visitation in 2005: Outcomes for Children and Parents”, Invest in Kids Working
Paper No. 7, Committee for Economic Development, Invest in Kids Working Group, Washington,
D.C.
Gomolla, M. (2006), “Tackling the Underachievement of Learners from Ethnic Minorities: A Comparison
of Recent Policies of School Improvement in Germany, England and Switzerland”, Current Issues in
Comparative Education, Vol. 9, No. 1.
Gould, E.D., V. Lavy and D. M. Paserman (2009), “Does immigration affect the long-term educational
outcomes of natives? Quasi-experimental evidence”, The Economic Journal 119-540.
Hanushek, E.A. (2000) “Evidence, Politics, and the Class Size Debate, in The Class Size Policy Debate”,
Working Paper 121, Economic Policy Institute, Washington D.C.
Hanushek, E.A., J.F. Kain and S.G. Rivkin (1999), “Do Higher Salaries Buy Better Teachers?”, Working
Paper No 7082, National Bureau of Economic Research, Cambridge, M.A.
Hanushek, E.A., J.F. Kain, S.G. Rivkin (2001), “Why Public Schools Loose Teachers”, Working Paper
8599, NBER Working Paper Series.
Harklau, L. (1994), “ESL versus Mainstream Classes: Contrasting L2 Learning Environments”, TESOL
Quarterly, Vol. 28, No. 2.
Hastings, J., T. Kane and D. Staiger (2005), “Parental Preferences and School Competition: Evidence from
a Public School Choice Program”, Working Paper No. 11805, National Bureau of Economic
Research, Cambridge, M.A.
Heath, A. and E. Kilpi-Jakonen (2012), “Immigrant Children's Age at Arrival and Assessment Results”,
OECD Education Working Papers, No. 75, OECD Publishing.
Heckman, J. (2006a), “Investing in Disadvantaged Young Children is an Economically Efficient Policy”,
paper presented at the Committee for Economic Development, Pew Charitable Trusts, New York,
NY.
Heckman, J. (2006b), “Skill formation and the Economics of Investing in Disadvantaged Children”,
Science, Vol. 312.
EDU/EDPC/RD(2015)35
94
Heckman, J. (2008), Education and the Integration of Migrants, NESSE Analytical Report 1 for EU
Commission DG Education and Culture, EFMS, Bamberg.
Hermans, P. (2002), “Intercultural Education in Two Teacher-training Courses in the North of the
Netherlands”, Intercultural Education, Vol. 13, No. 2.
Herweijer, L. (2009), “OECE Review of Migrant Education – Country Background Report for the
Netherlands”, The Netherlands Institute for Social Research, report commissioned by the Dutch
Ministry of Education, Culture and Science.
Honig, M.I. and L.R. Rainey (2012), “Autonomy and School Improvement: What Do We Know and
Where Do We Go From Here?” Educational Policy, Vol. 26, No. 3.
Hooghe, M., Reeskens, T., Stolle, D. and Trappers, A. (2008) “Ethnic Diversity and Generalised Trust in
Europe: A Crossnational Multilevel Study”, Comparative Political Studies 42: 198–223.
Hoxby, C.M. and G. Weingarth, (2005), “Taking Race Out of the Equation: School Reassignment and the
Structure of Peer Effects”.
Inglehart, R. (1999), “Postmodernization, Authority and Democracy” in P. Norris (ed.) Critical Citizens:
Global Support for Democratic Government, Oxford: Oxford University Press.
Jensen, B. (2010), “The OECD Teaching and Learning International Survey (TALIS) and Teacher
Education for Diversity”, in Educating Teachers for Diversity: Meeting the Challenge, OECD, Paris.
Jensen, P (2015), “Immigrants in the classroom and effects on native children”, IZA World of Labor.
Jeynes, W.H. (2005), “A Meta-Analysis of the Relation of Parental Involvement to Urban Elementary
School Student Academic Achievement”, Urban Education, Vol. 40, No. 3.
Jeynes, W.H. (2007), “The Relationship Between Parental Involvement and Urban Secondary School
Student Achievement: A Meta-Analysis”, Urban Education, Vol. 42, No. 1.
Jussim, L. and K.D. Harber (2005), “Teacher Expectations and Self-fulfilling Prophecies: Knowns and
Unknowns, Resolved and Unresolved Controversies”, Personality and Social Psychology Review,
Vol. 9, No. 2.
Karoly, L.A. and G. Gonzalez (2011), “Early Care and Education for Children in Immigrant Families”,
Future of Children 21.
Karsten, S. (2006), “Policies for disadvantaged children under scrutiny: the Dutch policy compared with
policies in France, England, Flanders and the USA”, Comparative Education, vol. 42(2).
Kirby, S.N., J.S. McComba, S. Naftel, S.E. Murray (2003), “A Snapshot of Title 1 Schools, 2000-01”,
Department of Education, Washington, D.C.
Knapp, W. (2006), “Language and Learning Disadvantages of Learners with a Migrant Background in
Germany”, paper prepared for the Intergovernmental Conference Languages of Schooling: Towards
a Framework for Europe, 16-18 October 2006, Council of Europe, Strasbourg.
Krueger, A.B. (2000), “Understanding the Magnitude and Effect of Class Size on Student Achievement”,
the Class Size Policy Debate, Working Paper No. 121, Economic Policy Institute, Washington D.C.
EDU/EDPC/RD(2015)35
95
Kunovich, R.M. (2004), “Social Structural Position and Prejudice: An Exploration of Cross-National
Differences in Regression Slopes”, Social Science Research 33: 20–44.
Lavy, V. (2008), “Do gender stereotypes reduce girls' or boys' human capital outcomes? Evidence from a
natural experiment”, Journal of Public Economics, 92(10), 2083-2105.
Leithwood, K., K. S. Louis, S. Anderson, S. and K. Wahlstrom (2004), Review of Research How
Leadership Influences Student Learning, Learning from Leadership Project, Wallace Foundation,
New York, NY.
Leseman, P.P.M. (2002), “Early Childhood Education and Care for Children from Low-income or
Minority Backgrounds”, A Paper for Discussion at the OECD Oslo Workshop, June 6-7 2002,
OECD, Paris.
Leung, C. (2004), “Integrating EAL Learners into the Mainstream Curriculum”, NALDIC Quarterly, No.
2.1, NALDIC, Watford.
Lou., Y., P.C. Abrami, J.C. Spence, C. Poulsen, B. Chambers, S. Apollonia (1996), “Within-class
Grouping: A Meta-Analysis”, Review of Educational Research, Vol. 66, No. 4.
Ludemann, E., Schwerdt, G. (2010), “Migration Background and Educational Tracking: Is there a Double
Disadvantage for Second-Generation Immigrants?” CESifo Group Munich, CESifo Working Paper
Series: 3256
Ludwig, J.and I. Sawhill (2007), Success by Ten: Intervention Early, Often and Effectively in the
Education of Young Children, Washington, DC, Brookings.
Magi, E. and M. Nestor (2014), Students with different mother tongue and cultural backgrounds in
Estonian schools: attention, awareness and support at the school level, Praxis Center for Policy
Studies, Tallinn.
Maslow, A. (1954), Motivation and personality. New York: Harper & Row.
Maykovich, M.K. (1975), “Correlates of Racial Prejudice”, Journal of Personality and Social Psychology
32: 1014–20.
Mengering, F. (2005), “Barenstark – Empirische Ergebnisse der Berliner Sprachstandserhebung an
Kindern im Vorschulalter”, Zeitschrift fur Erziehungswissenschaft, Vol. 8, No. 2.
Mickelson, R.A., M. Bottia and S. Southworth (2008), “School Choice and Segregation by Race, Class,
and Achievement.
Mistry, R.S., J.C. Biesanz, N. Chien, C. Howes, A.D. Benner (2008), “Socioeconomic Status, Parental
Investments, and the Cognitive and Behavioural Outcomes of Low-income Children from Immigrant
and Native Households”, Early Childhood Research Quarterly, Vol. 23.
Mulford, B. et al., (2008), “Successful Principalship of High-Performance Schools in High Poverty
Communities”, Journal of Educational Administration, Vol. 46, No. 3.
Norberg, K. (2000), “Intercultural Education and Teacher Education in Sweden”, Teaching and Teacher
Education, Vol 16.
EDU/EDPC/RD(2015)35
96
Nusche, D. (2009), “What Works in Migrant Education?: A Review of Evidence and Policy Options”,
OECD Working Papers, No. 22, OECD Publishing.
Nusche, D., C. Shewbridge and C. Lamhauge Rasmussen (2010), OECD Reviews of Migrant Education:
Austria 2010, OECD Reviews of Migrant Education, OECD Publishing.
Oakes, J. (1995), “Two Cities’ Tracking and Within-School Segregation”, Teachers College Record, Vol.
96, No. 4.
Oakes, J. (2005), Keeping track. How schools structure inequality. (Second ed.). New Haven &
London:Yale University Press
OECD (2005a), Teachers Matter: Attracting, Developing and Retaining Effective Teachers, Education and
Training Policy, OECD Publishing.
OECD (2005b), Formative Assessment: Improving Learning in Secondary Classrooms, Centre for
Educational Research and Innovation, OECD Publishing.
OECD (2006a), Starting Strong II: Early Childhood Education and Care, OECD Publishing.
OECD (2006b), Where Immigrant Students Succeed: A Comparative Review of Performance and
Engagement in PISA 2003, OECD Publishing.
OECD (2009), Creating Effective Teaching and Learning Environments: First Results from TALIS, OECD,
Paris.
OECD (2010a), PISA 2009 Results: Overcoming Social Background: Equity in Learning Opportunities
and Outcomes (Volume II), PISA, OECD Publishing.
OECD (2010b), Closing the Gap for Immigrant Students: Policies, Practice and Performance, OECD
Reviews of Migrant Education, OECD Publishing.
OECD (2010c), Educating Teachers for Diversity: Meeting the Challenge, Educational Research and
Innovation, OECD Publishing.
OECD (2012a), “Grade Expectations: How Marks and Education Policies Shape Students’ Ambitions”,
PISA, OECD Publishing. http://dx.doi.org/10.1787/9789264187528-en
OECD (2012b), Starting Strong III: A Quality Toolbox for Early Childhood Education and Care, OECD
Publishing.
OECD (2012c), Equity and Quality in Education: Supporting Disadvantaged Students and Schools, OECD
Publishing.
OECD (2013a), PISA 2012 Results: Excellence Through Equity: Giving Every Student the Chance to
Succeed (Volume II), PISA, OECD Publishing.
OECD (2013b), PISA 2012 Results: Ready to Learn: Students’ Engagement, Drive and Self-Beliefs
(Volume III), PISA, OECD Publishing.
OECD (2013c), PISA 2012 Results: What Makes Schools Successful? Resources, Policies and Practices
(Volume IV), PISA, OECD Publishing.
EDU/EDPC/RD(2015)35
97
OECD (2015a) Is this humanitarian migration crisis different? Migration Policy Debates #7. September
2015.
OECD (2015b), International Migration Outlook 2015, OECD Publishing, Paris.
http://dx.doi.org/10.1787/migr_outlook-2015-en
OECD (2015c), Education Policy Outlook 2015: Making Reforms Happen, OECD Publishing.
OECD (2015d), Norway: Early Childhood Education and Care Policy Review, OECD Publishing.
OECD (2015e), Starting Strong IV: Monitoring Quality in Early Childhood Education and Care, OECD
Publishing.
Office for Standards in Education, Children’s Services and Skills (Ofsted) (2014), “The pupil premium: an
update”, July 2014.
Ohinata, A. and J.C. van Ours (2013), “How immigrant children affect the academic achievement of native
Dutch children.”, The Economic Journal 123:570.
Pharr, S.J. and Putnam, R. (eds) (2000) Disaffected Democracies: What’s Troubling the Trilateral
Countries?, Princeton: Princeton University Press.
Pont, B., D. Nusche and H. Moorman (2008), Improving School Leadership Vol. 1: Policy and Practices,
OECD Publishing.
Prenzel. M., J. Baumert, W. Blum, R. Lehmann, D. Leutner, M. Neubrand, R. Pekrun, J. Rost and U.
Schiefele (eds.) (2005), PISA 2003: Ergebnisse des Zweiten Landervergleichs Zusammenfassung,
PISA-Konsortium Deutschland.
Pugin, V. (2007), “La politique d’éducation prioritaire: bilans et perspectives’, Millénaire, Le Centre
Ressources et Perspectives du Grand Lyon, Lyon.
Putnam, R. D. (2007) “E Pluribus Unum: Diversity and Community in the Twenty-First Century: The 2006
Johan Skytte Prize Lecture”, Scandinavian Political Studies 30 (2): 137–174.
Putnam, R.D. (2000) Bowling Alone: The Collapse and Renewal of American Community. New York:
Simon and Schuster.
Quillian, L. (1995) “Prejudice as a Response to Perceived Group Threat: Population Composition and
Anti-immigrant and Racial Prejudice in Europe”, American Sociological Review 60: 586–611.
Rangvid, B.S. (2007), “School Choice, Universal Vouchers and Native Flight out of Local Public
Schools”, Working Paper, May 2007:3, AKF, Danish Institute of Governmental Research,
Copenhagen.
Resh, N. (1998), “Track placement: How the ‘Sorting Machine’ Works in Israel. American Journal of
Education, Vol. 106, No. 3.
Rivkin, S.G., E.A. Hanushek and J.F. Kain (2000), “Teachers, Schools and Academic Achievement”,
Working Paper 6691, National Bureau of Economic Research, Massachusetts.
EDU/EDPC/RD(2015)35
98
Robinson, M. and K. Martin (2008), Approaches to Working with Children, Young People and Families
for Traveller, Irish Traveller, Gypsy, Roma and Show People Communities: a Literature Review
Report for the Children’s Workforce Development Council, Leeds.
Rosenthal, R. and D.B. Rubin (1978), “Interpersonal Expectancy Effects: The First 345 Studies”, The
Behavioural and Brain Sciences, Vol. 3.
Rosenthal, R. and L.Jacobson (1968), Pygmalion in the Classroom: Teacher Expectation and Pupils’
Development, Holt, Rinehart and Winston, New York, NY.
Scheepers, P., Gijsberts, M. and Coenders, M. (2002) “Ethnic Exclusionism in European Countries: Public
Opposition to Civil Rights for Legal Migrants as a Response to Perceived Ethnic Threat”, European
Sociological Review 18: 17–34.
Scheldon, S.B. and J.L. Epstein (2005a), “School Programs of Family and Community Involvement to
Support Children’s Reading and Literacy Development across the Grades” in J. Flood and P. Anders
(eds.), Literacy Development of Students in Urban Schools: Research and Policy, International
Reading Association, Newark, DE.
Scheldon, S.B. and J.L. Epstein (2005b), “Involvement Counts: Family and Community Partnerships and
Mathematics Achievement”, The Journal of Educational Research, Vol. 98, No. 4.
Schleicher, A. (2014), Equity, Excellence and Inclusiveness in Education: Policy Lessons from Around the
World, International Summit on the Teaching Profession, OECD Publishing.
Schneeweis, N. (2006), "How Should We Organize Schooling to Further Children with Migration
Background?", Working Paper No. 0620, Department of Economics, Johannes Kepler University,
Linz.
Schneeweis, N. (2011), “Education institutions and the integration of migrants”, Journal of Population
Economies, Vol. 24, No. 4.
Schneeweis, N. (2015), “Immigrant concentration in schools: Consequences for native and migrant
students”, Labour Economics.
Schnepf, S.V. (2004), “How Different Are Immigrants? A Cross-Country and Cross-Survey Analysis of
Educational Achievement”, IZA Discussion Paper No. 1398, IZA, Bonn.
Schofield, J.W., in co-operation with K. Alexander, R. Bangs and B. Schauenburg (2006), “Migration
Background, Minority-Group Membership and Academic Achievement: Research Evidence from
Social, Educational, and Developmental Psychology”, AKI Research Review 5, Programme on
Intercultural Conflicts and Societal Integration (AKI), Social Science Research Center, Berlin.
Semyonov, M., Raijman, R. and Tom-Tov, A. (2004) “Population Size, Perceived Threat, and Exclusion:A
Mutiple-Indicators Analysis of Attitudes Torward Foreigners in Germany”, Social Science Research
33: 681–701.
Sirin, S.R. and L. Rogers-Sirin (2015), The Educational and Mental Health Needs of Syrian Refugee
Children, Migration Policy Institute, Washington, DC.
Slavin, R.E. (1987), “Ability Grouping and Student Achievement in Elementary Schools: A Best-Evidence
Synthesis”, Review of Educational Research, Vol. 57, No. 3.
EDU/EDPC/RD(2015)35
99
Stouffer, S. (1955), Communism, Conformity, and Civil Liberties, New York: Doubleday.
Strand, S. (2007), “Minority Ethnic Pupils in the Longitudinal Study of Young People in England
(LSYPE)”, Centre for Educational Development Appraisal and Research, University of Warwick
and Department for Children, Schools and Families, London.
Sturgis, P., Brunton-Smith, I., Kuha, J., & Jackson, J. (2003), “Ethnic diversity, segregation and the social
cohesion of neighbourhoods in London”. Ethnic and Racial Studies.
Sumption, M. (2013), “Tackling brain waste. Strategies to improve the recognition of immigrants’ foreign
qualifications”. Migration Policy Institute. Accessed on 3/11/2015
http://www.migrationpolicy.org/research/tackling-brain-waste-strategies-improve-recognition-
immigrants-foreign-qualifications
Sylva et al., (2004), “The Effective Provision of Preschool Education (EPPE) Project: Final report”, Report
No. SSU/FR/2004/01, Department for Education and Skills, Nottingham.
Tikly, L. et al. (2006), Evaluation of Aiming High: African Caribbean Achievement Project, Department
for Education and Skills, London.
Tikly, L., A. Osler and J. Hill (2005), “The ethnic minority achievement grant: a critical analysis”, Journal
of Education Policy, vol. 20(3).
Timberly, H., A. Wilson, H. Barrar and I. Fung (2007), Teacher Professional Learning and Development:
Best Evidence Synthesis Iteration, Ministry of Education, Wellington, New Zealand.
Turney, K. and G. Kao (2006), “Home and School Involvement of Minority Immigrant Parents of Young
Children”, Paper submitted for consideration for the 2006 Annual Meetings of the American
Sociological Association.
UNESCO, (2015), Education For All Global Monitoring report 2015: Achievement and Challenges. Paris,
UNESCO.
Vallerand, R. J. (1997), Toward a hierarchical model of intrinsic and extrinsic motivation. In M. P. Zanna
(Ed.), Advances in experimental social psychology (pp. 271-360). New York: Academic Press.
Van Ewijk, R. J. G. and P. Sleegers, (2009), “Peer Ethnicity and Achievement: A Meta-Analysis Into the
Compositional Effect”, Un iversity of Amsterdam.
Watts-Taffe, S. and D.M. Truscott (2000), “Using What We Know about Language and Literacy
Development for ESL Students in the Mainstream Classroom”, Language Arts, Vol. 77, No. 3.
White, K., K. Lewis and F. Fletcher-Campbell (2006), “Raising the Achievement of Bilingual Learners in
Primary Schools: Evaluation of the Pilot/Programme”, DfES Research Report No. 758, Department
for Education and Skills, UK.
Wiese, E.B.P. and I. Burhorst (2007), “The Mental Health of Asylum-seeking and Refugee Children and
Adolescents Attending a Clinic in the Netherlands”, Transcultural Psychiatry 44(4).
Yeung, W.J., M.R. Linver and J. Brooks-Gunn (2002), “How Money Matters for Young Children’s
Development: Parental Investment and Family Processes”, Child Development, Vol. 73.
Related Documents
![HNgoztechnika.hu/keszletlista/pdf/572.pdf · 0puphfvwvh nnfrv]dniwovdr +dwwipnun,p2h6 u '1 )7 )7 )7 )7 )7 edu edu edu edu edu edu edu edu edu](https://static.cupdf.com/doc/110x72/5fc6730ab5393d30f166460f/0puphfvwvh-nnfrvdniwovdr-dwwipnunp2h6-u-1-7-7-7-7-7-edu-edu-edu-edu-edu.jpg)