International Journal of Smart Home Vol. 2, No. 2, Apil, 2008 95 Footstep Recognition for a Smart Home Environment Rubén Vera Rodríguez 1 , Richard P. Lewis 1 , John S. D. Mason 1 and Nicholas W. D. Evans 2,1 1 Swansea University, Singleton Park, Swansea, SA2 8PP, UK 2 Institut Eurecom, 2229 route des Crêtes, 06904 Sophia Antipolis, France {r.vera-rodriguez.405831, r.p.lewis, j.s.d.mason}@swansea.ac.uk, [email protected] Abstract This paper reports some experiments which assess the potential use of a footstep biometric verification system for a smart home environment. We present a semi-automatic capture system and report results on a database with independent development and evaluation datasets comprised of more than 3500 footsteps collected from 55 persons. We present an optimisation of geometric and holistic feature extraction approaches. An equal error rate of 13% is obtained with holistic features classified with a support vector machine. The database is freely available to the research community. 1. Introduction The integration of many established and emerging technologies into smart home environments is gathering pace. Footstep signals, are is signals collected from people walking over an instrumented sensing area, have already been proposed for use in smart home environments for a number of different applications, including security, surveillance, tracking persons in an area and recognising human behaviour, as reviewed in Section 2. In this paper we present some experimental work which aims to give a more reliable assessment of the potential of footstep signals as a biometric which might find application within smart home environments. Different biometrics have been used for many years as a means of recognising or verifying a person’s identity. Some of the most researched such as the fingerprint or face biometrics have been included in passports and ID cards. Iris recognition has been recently introduced in airports, and palm vein recognition is undergoing trials for use in cash machines. These methods belong to the physiological group of biometrics. Physiological biometrics are less likely to change significantly over time whereas behavioural biometrics are relatively more likely to change over time. Voice recognition is one of the most popular behavioural biometrics due to its application in mobile phones. Gait and footsteps are other examples of behavioural biometrics. Over the past few decades gait recognition has been investigated in a number of different fields including surveillance, medical applications and in the sport shoe industry among others. Gait refers to the manner in which a person walks and is often studied using video recordings, whereas footstep recognition is generally based on the study of signals captured from persons walking over specifically designed, instrumented floor sensors.

Welcome message from author
This document is posted to help you gain knowledge. Please leave a comment to let me know what you think about it! Share it to your friends and learn new things together.
Transcript
International Journal of Smart Home
Vol. 2, No. 2, Apil, 2008
95
Footstep Recognition for a Smart Home Environment
Rubén Vera Rodríguez1, Richard P. Lewis
1,
John S. D. Mason1 and Nicholas W. D. Evans
2,1
1Swansea University, Singleton Park, Swansea, SA2 8PP, UK 2Institut Eurecom, 2229 route des Crêtes, 06904 Sophia Antipolis, France
{r.vera-rodriguez.405831, r.p.lewis, j.s.d.mason}@swansea.ac.uk, [email protected]
Abstract
This paper reports some experiments which assess the potential use of a footstep biometric
verification system for a smart home environment. We present a semi-automatic capture
system and report results on a database with independent development and evaluation
datasets comprised of more than 3500 footsteps collected from 55 persons. We present an
optimisation of geometric and holistic feature extraction approaches. An equal error rate of
13% is obtained with holistic features classified with a support vector machine. The database
is freely available to the research community.
1. Introduction
The integration of many established and emerging technologies into smart home
environments is gathering pace. Footstep signals, are is signals collected from people
walking over an instrumented sensing area, have already been proposed for use in smart
home environments for a number of different applications, including security,
surveillance, tracking persons in an area and recognising human behaviour, as reviewed
in Section 2. In this paper we present some experimental work which aims to give a
more reliable assessment of the potential of footstep signals as a biometric which might
find application within smart home environments.
Different biometrics have been used for many years as a means of recognising or
verifying a person’s identity. Some of the most researched such as the fingerprint or
face biometrics have been included in passports and ID cards. Iris recognition has been
recently introduced in airports, and palm vein recognition is undergoing trials for use in
cash machines. These methods belong to the physiological group of biometrics.
Physiological biometrics are less likely to change significantly over time whereas
behavioural biometrics are relatively more likely to change over time. Voice
recognition is one of the most popular behavioural biometrics due to its application in
mobile phones.
Gait and footsteps are other examples of behavioural biometrics. Over the past few
decades gait recognition has been investigated in a number of different fields including
surveillance, medical applications and in the sport shoe industry among others. Gait
refers to the manner in which a person walks and is often studied using video
recordings, whereas footstep recognition is generally based on the study of signals
captured from persons walking over specifically designed, instrumented floor sensors.
International Journal of Smart Home
Vol. 2, No. 2, April, 2008
96
Gait and footsteps are closely related and future research is likely to investigate the
fusion of the two biometrics.
Footstep signals can be collected covertly and this presents a significant benefit over
other more established, well known biometrics. The sensing system is less likely to
induce behavioural changes as well as presenting less of an inconvenience to the user.
These characteristics of the footstep biometric make it especially appealing for the
smart home environment.
This paper aims to assess the potential performance of the footstep biometric. We
present experimental results achieved using a database comprised of more than 3500
footsteps from 55 different persons. As described in Section 3, the database has been
further divided into independent development and evaluation datasets adopting a
standard, best practice evaluation strategy, allowing us to present more statistically
meaningful results and potentially more reliable predictions of performance than
previous work. In addition we describe the development of a semi-automatic footstep
capture system designed to gather the database which is publicly available to the
research community at [1].
Preliminary work with geometric and holistic feature extraction approaches was
presented in [2]. Extending this previously published work, this paper shows an
optimisation of the two feature approaches, presented in [3], and reports results on a
larger database in number of footsteps and persons, and with no person overlap between
the different datasets. Using holistic features and a discriminative based classifier in the
form of a support vector machine (SVM) an equal error rate (EER) of 13% is achieved
for the evaluation set. These results are reviewed in Section 4, and finally our
conclusions are presented in Section 5.
2. Review of footstep signals and their applications
The use of footstep signals has been investigated previously for a number of different
applications including medicine to identify different gait deficiencies; surveillance to
monitor human presence; smart homes for human tracking or recognition of human
behaviour; biometrics to verify a person’s identity; or even multimedia for music or for
video game interaction. Below we review the work related to smart homes and
biometrics in two sections. The first section covers smart homes where both simple
person detection and the more specific case of person recognition are applicable; and
the second covers footstep as a biometric which has more general application beyond
smart homes.
2.1. Smart Homes
Footsteps have some potential applications in the smart home environment where
footstep sensors are installed to determine the position of a person in a room or to
recognise human behaviour and interact with users. In 2000 Mori et al [4] developed a
system where multiple sensors were distributed in several locations of a “robotic room”.
Switch sensors installed on household appliances and windows were used to detect
on/off or open/closed conditions and pressure sensors were used to monitor movement
on the floor, bed, desk and chair. Footstep signals were collected from a distribution of
force sensing resisters (FSRs) to specify human position in the room. A total number of
International Journal of Smart Home
Vol. 2, No. 2, Apil, 2008
97
252 FSRs were installed in a 200mm x 200mm lattice shape. More recent work on the
same floor [5] (2002) increased the spatial resolution of the sensors to a 64 x 64 switch
sensor array in a 500 mm2 space. Sixteen of these sensor floor units were used to
produce a sensing area of 2 m2. With this high resolution, experiments determined the
positions of a human and a 4-wheeled cart and distinguished between them. In 2004
Murakita et al [6] reported a system for tracking individuals over a wide area by using a
Markov Chain Monte Carlo Method (MCMC). They employed a basic 18 cm2 switch
block sensor to cover a total area of 37 m2. The system was capable of tracking two
different people when separated by more than 1.4 m but failed to track people in a
crowded area due to the low spatial resolution and a low capture rate of 5 Hz.
Making use of the hardware developed for the Active Floor [7], in 2001 Headon and
Curwen [8] used the vertical component of the GRF and a hidden Markov model
(HMM) classifier to recognize different movements such us stepping, jumping, drop-
landing, sitting down, rising to stand and crouching. Applications of such a system exist
in safety, i.e. fall detection for the elderly and entertainment, i.e. video games.
2.2. Biometrics
Footsteps were proposed as a new biometric in 1997, but have been studied only by a
small number of researchers. Table 1 summarises the material in the open literature.
One of the first investigations into footstep recognition was reported by UK
researchers in 1997 [7] (first row in Table 1). They reported experiments on a database
of 300 footsteps signals that were captured from 15 walkers from loads cells measuring
the ground reaction force (GRF). An identification accuracy of 91% was achieved with
an HMM classifier and samples from the GRF as features.
In 2000, and using a similar sensor approach, in [9] a group in the USA reported
results on a database of 1680 footstep signals collected from 15 persons. Signals were
collected from both left and right feet and different footwear. Ten features were
extracted from the GRF signal: the mean value, the standard deviation, maxima and
minima, etc. An identification accuracy of 93% was reported using a nearest neighbour
classifier.
Whilst focused toward the study of gait, a group from Switzerland [10] developed in
2002 a system fusing data acquired from 3 tiles of 4 piezo force sensors each and video
cameras. A database of 480 footsteps was collected from 16 persons. They studied
different feature extraction techniques as geometric features from GRF as [9] and phase
plane. The best verification performance was achieved using the Power Spectral
Density of the footstep signals with an Euclidean distance classifier obtaining an equal
error rate (EER) of 9.4%.
A Korean group reported a system in 2003 [11] that used 144 simple ON/OFF switch
sensors. Stride data (connected footsteps) was collected from 10 persons who each
contributed 50 footsteps resulting in a database of 500 signals. An accuracy of 92% was
reported with a Multilayer-Perceptron Neural Network used as an experimental
identification method.
In 2004 a group from Finland investigated footstep recognition using Electro
Mechanical Film (EMFi) [12]. Long strips of the sensor material were laid over an area
International Journal of Smart Home
Vol. 2, No. 2, April, 2008
98
covering 100 m2. A database of 440 footstep signals was collected from 11 persons.
Geometric features were extracted from the GRF profiles as in [9] and first FFT
coefficients. Using a Distinction-Sensitive Learning Vector Quantization (DSLVQ)
classifier an identification accuracy of 70.2% was achieved.
In 2005 a group from Southampton (UK) [13] reported trials with a system
comprising 1536 sensors each covering an area of 3 cm2. A database of 180 signals was
collected from 15 people without wearing footwear. Three features were extracted:
stride length, stride cadence and heel-to-toe ratio. An identification accuracy of 80%
was reported using an Euclidean distance classifier.
In 2006 another group from Southampton [14] investigated a system similar to the
work in [7,9]. A database of 400 signals was collected from 11 people. Using geometric
features extracted from GRF profiles as in [9] an identification accuracy of 94% was
achieved using a nearest neighbour classifier.
Recently, in 2007, our research group presented in [2,3] experiments obtained with a
database comprised of 3174 footsteps collected from 41 different persons and divided
into development and evaluation sets. Geometric and holistic features were extracted
from the footstep signals and recognition performance using nearest neighbour (NN)
and support vector machine (SVM) classifiers was compared. Using holistic features
with the SVM classifier EERs of 9.5% and 11.5% were obtained for the development
and evaluation sets respectively.
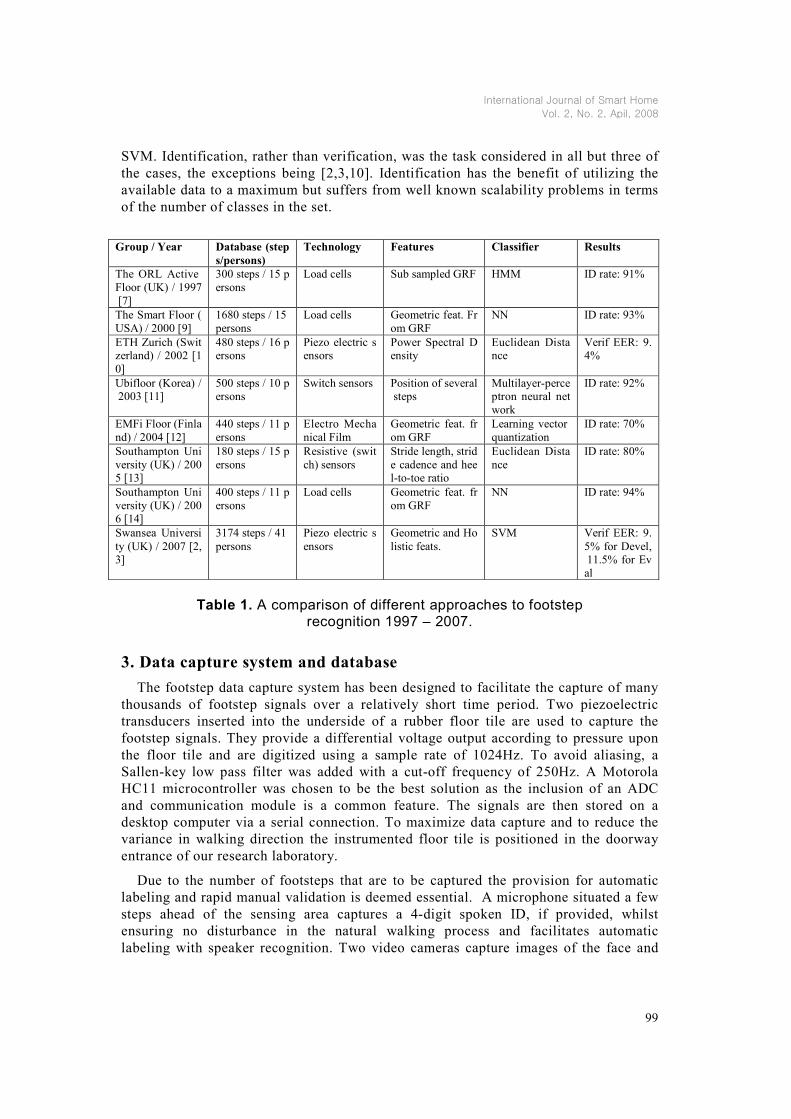
Table 1 summarises the material available in the open literature. It is very difficult to
make a comparison between the different laboratory systems due to the fact they use
different sensors, databases, features, classifiers and assessment protocols. As can be
observed in the third column of Table 1, different sensor technologies have been used
including load cells [7,9,14], switch sensors [11,13], piezo electric sensors [2,3,10] and
electro mechanical film (EMFi) [12]. Results might suggest that load cells provide
better performance than other sensors; however, the system described here uses piezo
electric sensors as they are very thin (2mm), cheap, and their output is the
instantaneous pressure. The complementary signal that would be obtained from load
cells can be extrapolated by a simple integration of our output signal. The second
column of Table 1 shows that relatively small database sizes is a common characteristic
of the earlier work certainly judged in relation to other biometric evaluations where
persons are normally counted in hundreds or thousands and the number of tests perhaps
in many thousands. A maximum number of 16 persons and 1680 footsteps examples
were gathered in all cases except in [2,3] which reports results on 3147 footsteps and 41
persons. In each case the databases are divided into training and testing sets however,
with exception of [2,3], none use independent development and evaluation sets, a
limitation which makes performance predictions both difficult and unreliable. As Table
1 indicates, different features are proposed, including subsamples from the ground
reaction force (GRF) profile in [7], geometric features from the GRF in [9,12,14], the
power spectral density in [10], position of several footsteps in [11], stride length, stride
cadence and heel-to-toe ratio in [13], and geometric and holistic features from
instantaneous pressure and GRF signals in [2,3]. With respect to classifiers the majority
used a simple NN based Euclidean distance [9, 10, 13, 14], perhaps because of the
limited data sets which make statistical modeling difficult; however [7] uses an HMM
classifier, [11] a Multilayer-Perceptron Neural Network, [12] uses a DSLVQ and [2,3]
International Journal of Smart Home
Vol. 2, No. 2, Apil, 2008
99
SVM. Identification, rather than verification, was the task considered in all but three of
the cases, the exceptions being [2,3,10]. Identification has the benefit of utilizing the
available data to a maximum but suffers from well known scalability problems in terms
of the number of classes in the set.
Group / Year Database (step
s/persons)
Technology Features Classifier Results
The ORL Active
Floor (UK) / 1997
[7]
300 steps / 15 p
ersons
Load cells Sub sampled GRF HMM ID rate: 91%
The Smart Floor (
USA) / 2000 [9]
1680 steps / 15
persons
Load cells Geometric feat. Fr
om GRF
NN ID rate: 93%
ETH Zurich (Swit
zerland) / 2002 [1
0]
480 steps / 16 p
ersons
Piezo electric s
ensors
Power Spectral D
ensity
Euclidean Dista
nce
Verif EER: 9.
4%
Ubifloor (Korea) /
2003 [11]
500 steps / 10 p
ersons
Switch sensors Position of several
steps
Multilayer-perce
ptron neural net
work
ID rate: 92%
EMFi Floor (Finla
nd) / 2004 [12]
440 steps / 11 p
ersons
Electro Mecha
nical Film
Geometric feat. fr
om GRF
Learning vector
quantization
ID rate: 70%
Southampton Uni
versity (UK) / 200
5 [13]
180 steps / 15 p
ersons
Resistive (swit
ch) sensors
Stride length, strid
e cadence and hee
l-to-toe ratio
Euclidean Dista
nce
ID rate: 80%
Southampton Uni
versity (UK) / 200
6 [14]
400 steps / 11 p
ersons
Load cells Geometric feat. fr
om GRF
NN ID rate: 94%
Swansea Universi
ty (UK) / 2007 [2,
3]
3174 steps / 41
persons
Piezo electric s
ensors
Geometric and Ho
listic feats.
SVM Verif EER: 9.
5% for Devel,
11.5% for Ev
al
Table 1. A comparison of different approaches to footstep
recognition 1997 – 2007.
3. Data capture system and database
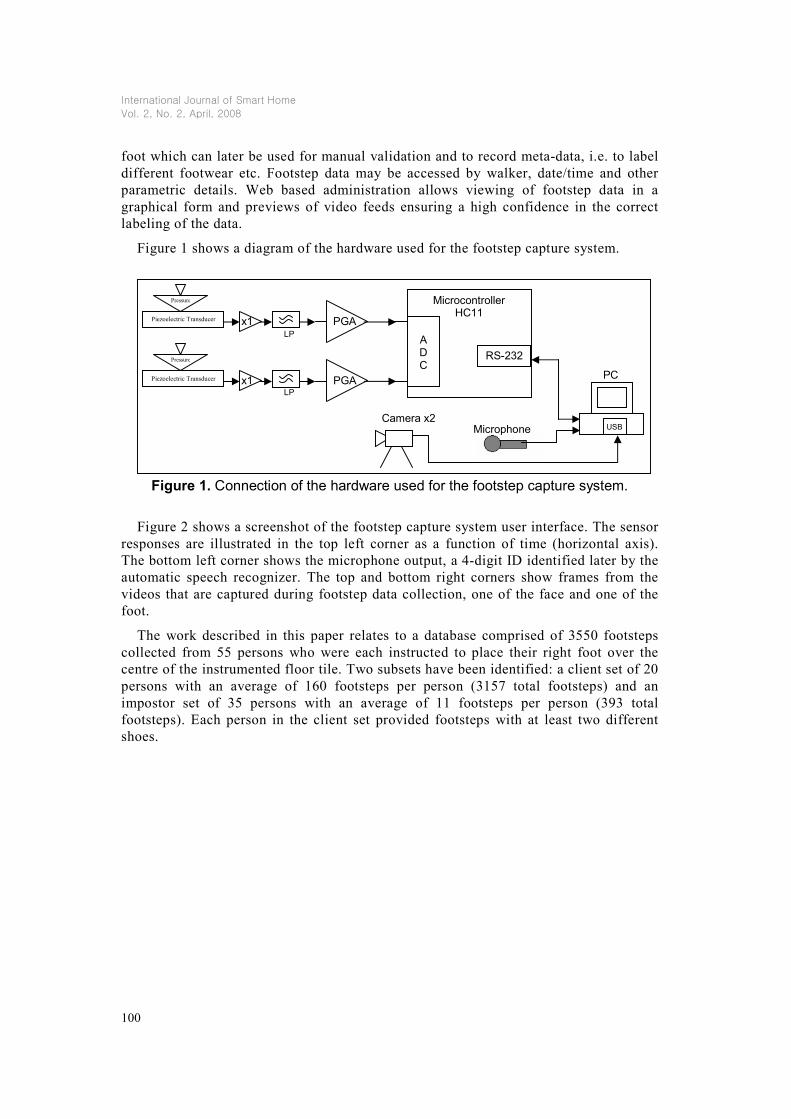
The footstep data capture system has been designed to facilitate the capture of many
thousands of footstep signals over a relatively short time period. Two piezoelectric
transducers inserted into the underside of a rubber floor tile are used to capture the
footstep signals. They provide a differential voltage output according to pressure upon
the floor tile and are digitized using a sample rate of 1024Hz. To avoid aliasing, a
Sallen-key low pass filter was added with a cut-off frequency of 250Hz. A Motorola
HC11 microcontroller was chosen to be the best solution as the inclusion of an ADC
and communication module is a common feature. The signals are then stored on a
desktop computer via a serial connection. To maximize data capture and to reduce the
variance in walking direction the instrumented floor tile is positioned in the doorway
entrance of our research laboratory.
Due to the number of footsteps that are to be captured the provision for automatic
labeling and rapid manual validation is deemed essential. A microphone situated a few
steps ahead of the sensing area captures a 4-digit spoken ID, if provided, whilst
ensuring no disturbance in the natural walking process and facilitates automatic
labeling with speaker recognition. Two video cameras capture images of the face and
International Journal of Smart Home
Vol. 2, No. 2, April, 2008
100
foot which can later be used for manual validation and to record meta-data, i.e. to label
different footwear etc. Footstep data may be accessed by walker, date/time and other
parametric details. Web based administration allows viewing of footstep data in a
graphical form and previews of video feeds ensuring a high confidence in the correct
labeling of the data.
Figure 1 shows a diagram of the hardware used for the footstep capture system.
Figure 1. Connection of the hardware used for the footstep capture system.
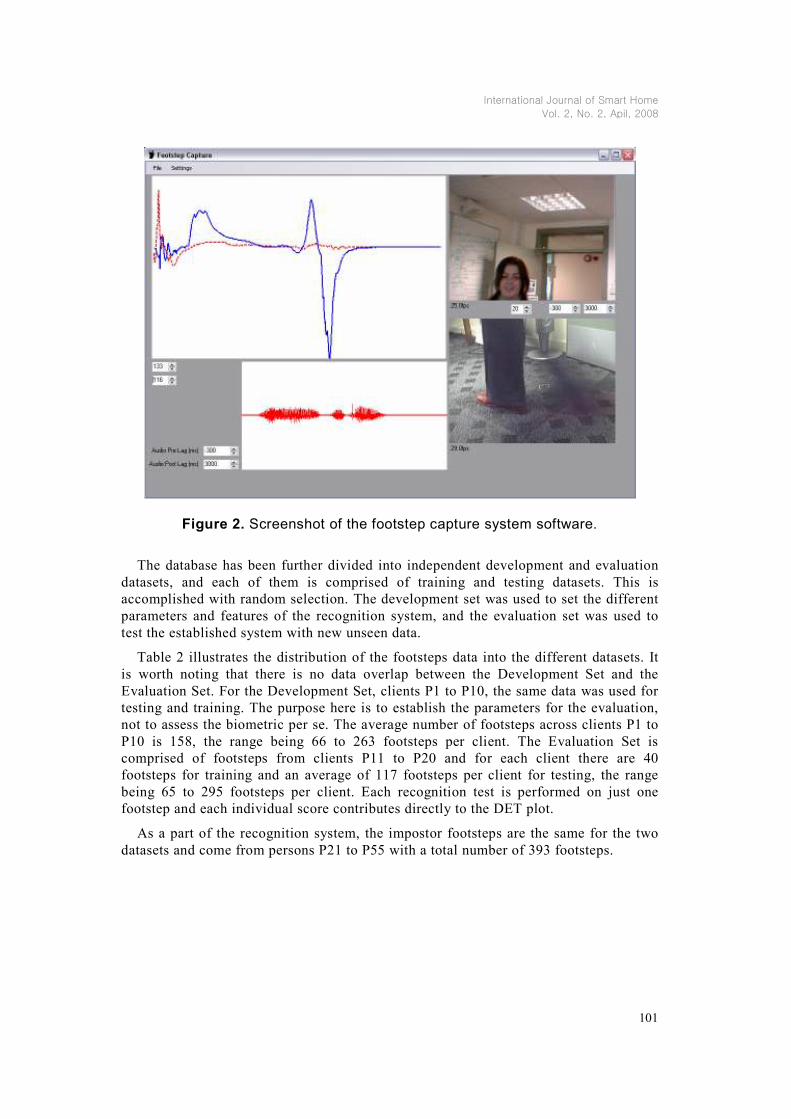
Figure 2 shows a screenshot of the footstep capture system user interface. The sensor
responses are illustrated in the top left corner as a function of time (horizontal axis).
The bottom left corner shows the microphone output, a 4-digit ID identified later by the
automatic speech recognizer. The top and bottom right corners show frames from the
videos that are captured during footstep data collection, one of the face and one of the
foot.
The work described in this paper relates to a database comprised of 3550 footsteps
collected from 55 persons who were each instructed to place their right foot over the
centre of the instrumented floor tile. Two subsets have been identified: a client set of 20
persons with an average of 160 footsteps per person (3157 total footsteps) and an
impostor set of 35 persons with an average of 11 footsteps per person (393 total
footsteps). Each person in the client set provided footsteps with at least two different
shoes.
Microcontroller HC11
RS-232
Pressure
Piezoelectric Transducer x1
Pressure
Piezoelectric Transducer x1
PGA
PGA
A D C
PC
USB Camera x2
Microphone
LP
LP
International Journal of Smart Home
Vol. 2, No. 2, Apil, 2008
101
Figure 2. Screenshot of the footstep capture system software.
The database has been further divided into independent development and evaluation
datasets, and each of them is comprised of training and testing datasets. This is
accomplished with random selection. The development set was used to set the different
parameters and features of the recognition system, and the evaluation set was used to
test the established system with new unseen data.
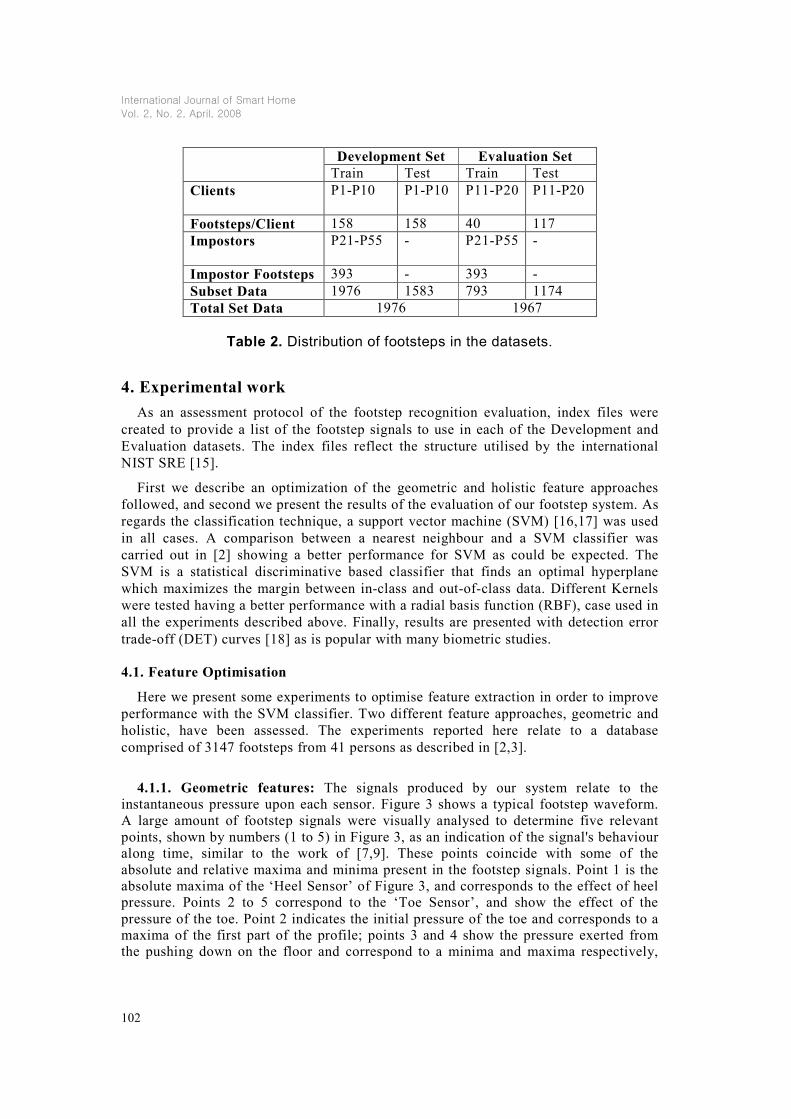
Table 2 illustrates the distribution of the footsteps data into the different datasets. It
is worth noting that there is no data overlap between the Development Set and the
Evaluation Set. For the Development Set, clients P1 to P10, the same data was used for
testing and training. The purpose here is to establish the parameters for the evaluation,
not to assess the biometric per se. The average number of footsteps across clients P1 to
P10 is 158, the range being 66 to 263 footsteps per client. The Evaluation Set is
comprised of footsteps from clients P11 to P20 and for each client there are 40
footsteps for training and an average of 117 footsteps per client for testing, the range
being 65 to 295 footsteps per client. Each recognition test is performed on just one
footstep and each individual score contributes directly to the DET plot.
As a part of the recognition system, the impostor footsteps are the same for the two
datasets and come from persons P21 to P55 with a total number of 393 footsteps.
International Journal of Smart Home
Vol. 2, No. 2, April, 2008
102
Development Set Evaluation Set
Train Test Train Test
Clients P1-P10 P1-P10 P11-P20
P11-P20
Footsteps/Client 158 158 40 117
Impostors P21-P55 - P21-P55
-
Impostor Footsteps 393 - 393 -
Subset Data 1976 1583 793 1174
Total Set Data 1976 1967
Table 2. Distribution of footsteps in the datasets.
4. Experimental work
As an assessment protocol of the footstep recognition evaluation, index files were
created to provide a list of the footstep signals to use in each of the Development and
Evaluation datasets. The index files reflect the structure utilised by the international
NIST SRE [15].
First we describe an optimization of the geometric and holistic feature approaches
followed, and second we present the results of the evaluation of our footstep system. As
regards the classification technique, a support vector machine (SVM) [16,17] was used
in all cases. A comparison between a nearest neighbour and a SVM classifier was
carried out in [2] showing a better performance for SVM as could be expected. The
SVM is a statistical discriminative based classifier that finds an optimal hyperplane
which maximizes the margin between in-class and out-of-class data. Different Kernels
were tested having a better performance with a radial basis function (RBF), case used in
all the experiments described above. Finally, results are presented with detection error
trade-off (DET) curves [18] as is popular with many biometric studies.
4.1. Feature Optimisation
Here we present some experiments to optimise feature extraction in order to improve
performance with the SVM classifier. Two different feature approaches, geometric and
holistic, have been assessed. The experiments reported here relate to a database
comprised of 3147 footsteps from 41 persons as described in [2,3].
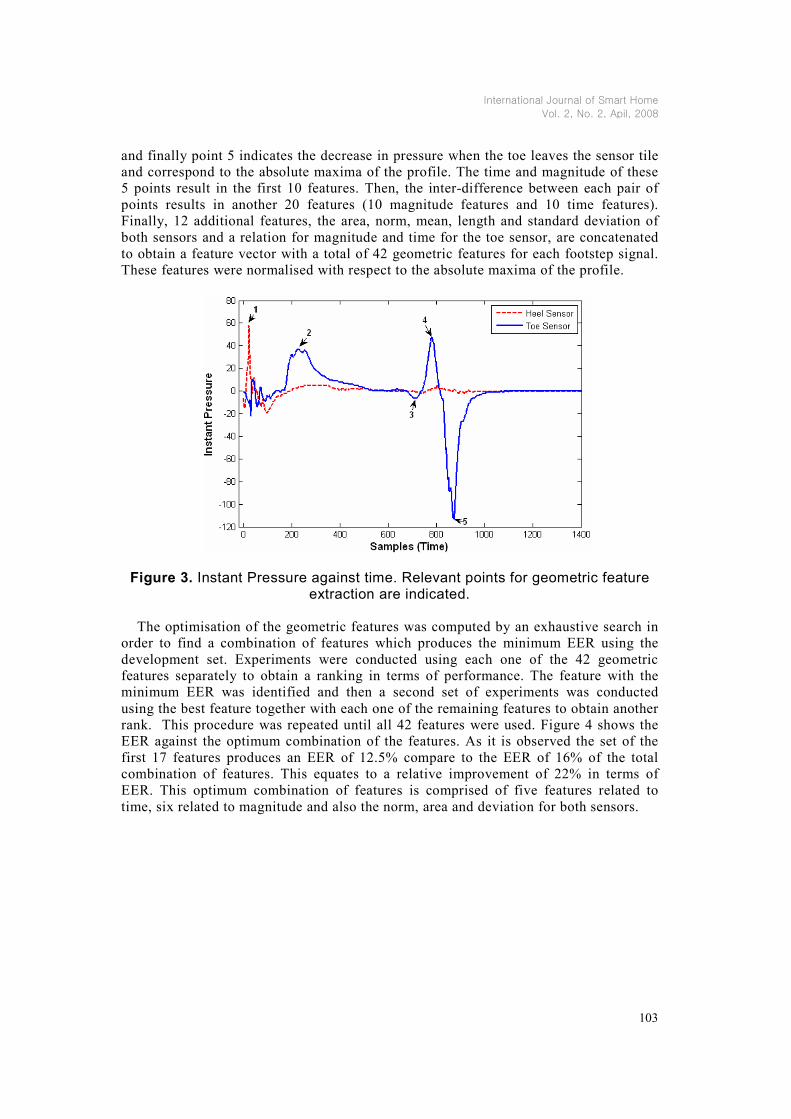
4.1.1. Geometric features: The signals produced by our system relate to the
instantaneous pressure upon each sensor. Figure 3 shows a typical footstep waveform.
A large amount of footstep signals were visually analysed to determine five relevant
points, shown by numbers (1 to 5) in Figure 3, as an indication of the signal's behaviour
along time, similar to the work of [7,9]. These points coincide with some of the
absolute and relative maxima and minima present in the footstep signals. Point 1 is the
absolute maxima of the ‘Heel Sensor’ of Figure 3, and corresponds to the effect of heel
pressure. Points 2 to 5 correspond to the ‘Toe Sensor’, and show the effect of the
pressure of the toe. Point 2 indicates the initial pressure of the toe and corresponds to a
maxima of the first part of the profile; points 3 and 4 show the pressure exerted from
the pushing down on the floor and correspond to a minima and maxima respectively,
International Journal of Smart Home
Vol. 2, No. 2, Apil, 2008
103
and finally point 5 indicates the decrease in pressure when the toe leaves the sensor tile
and correspond to the absolute maxima of the profile. The time and magnitude of these
5 points result in the first 10 features. Then, the inter-difference between each pair of
points results in another 20 features (10 magnitude features and 10 time features).
Finally, 12 additional features, the area, norm, mean, length and standard deviation of
both sensors and a relation for magnitude and time for the toe sensor, are concatenated
to obtain a feature vector with a total of 42 geometric features for each footstep signal.
These features were normalised with respect to the absolute maxima of the profile.
Figure 3. Instant Pressure against time. Relevant points for geometric feature extraction are indicated.
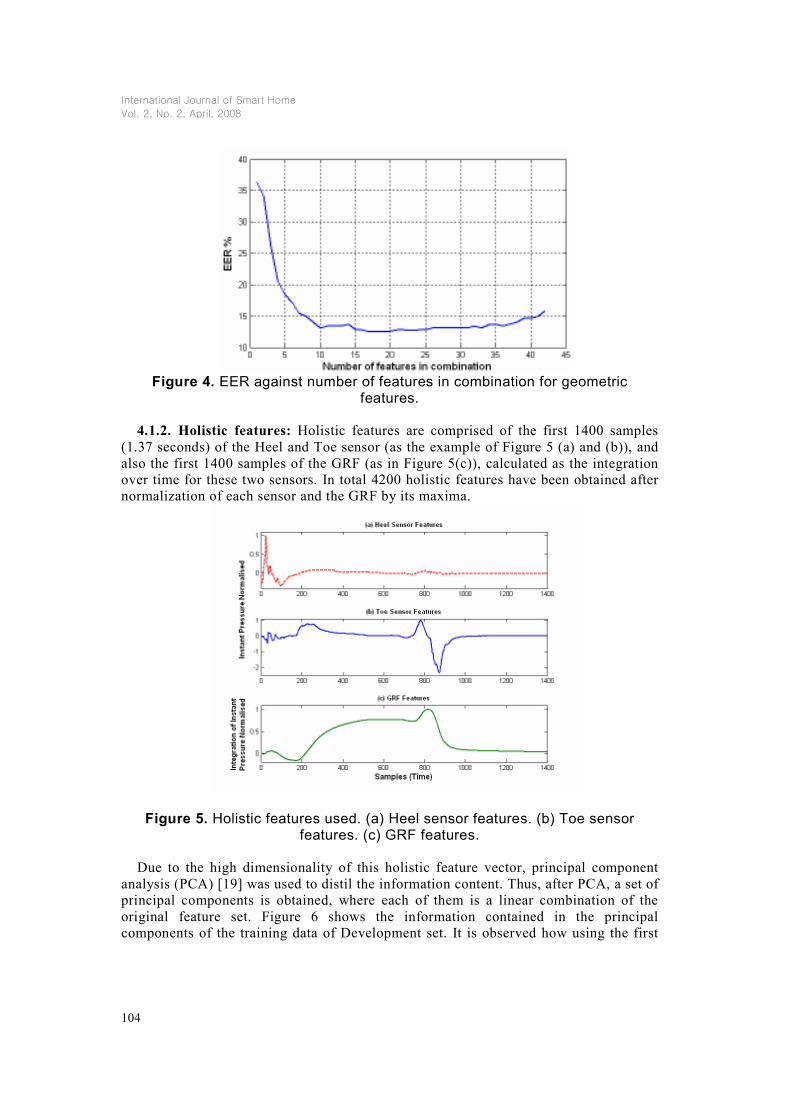
The optimisation of the geometric features was computed by an exhaustive search in
order to find a combination of features which produces the minimum EER using the
development set. Experiments were conducted using each one of the 42 geometric
features separately to obtain a ranking in terms of performance. The feature with the
minimum EER was identified and then a second set of experiments was conducted
using the best feature together with each one of the remaining features to obtain another
rank. This procedure was repeated until all 42 features were used. Figure 4 shows the
EER against the optimum combination of the features. As it is observed the set of the
first 17 features produces an EER of 12.5% compare to the EER of 16% of the total
combination of features. This equates to a relative improvement of 22% in terms of
EER. This optimum combination of features is comprised of five features related to
time, six related to magnitude and also the norm, area and deviation for both sensors.
International Journal of Smart Home
Vol. 2, No. 2, April, 2008
104
Figure 4. EER against number of features in combination for geometric
features.
4.1.2. Holistic features: Holistic features are comprised of the first 1400 samples
(1.37 seconds) of the Heel and Toe sensor (as the example of Figure 5 (a) and (b)), and
also the first 1400 samples of the GRF (as in Figure 5(c)), calculated as the integration
over time for these two sensors. In total 4200 holistic features have been obtained after
normalization of each sensor and the GRF by its maxima.
Figure 5. Holistic features used. (a) Heel sensor features. (b) Toe sensor features. (c) GRF features.
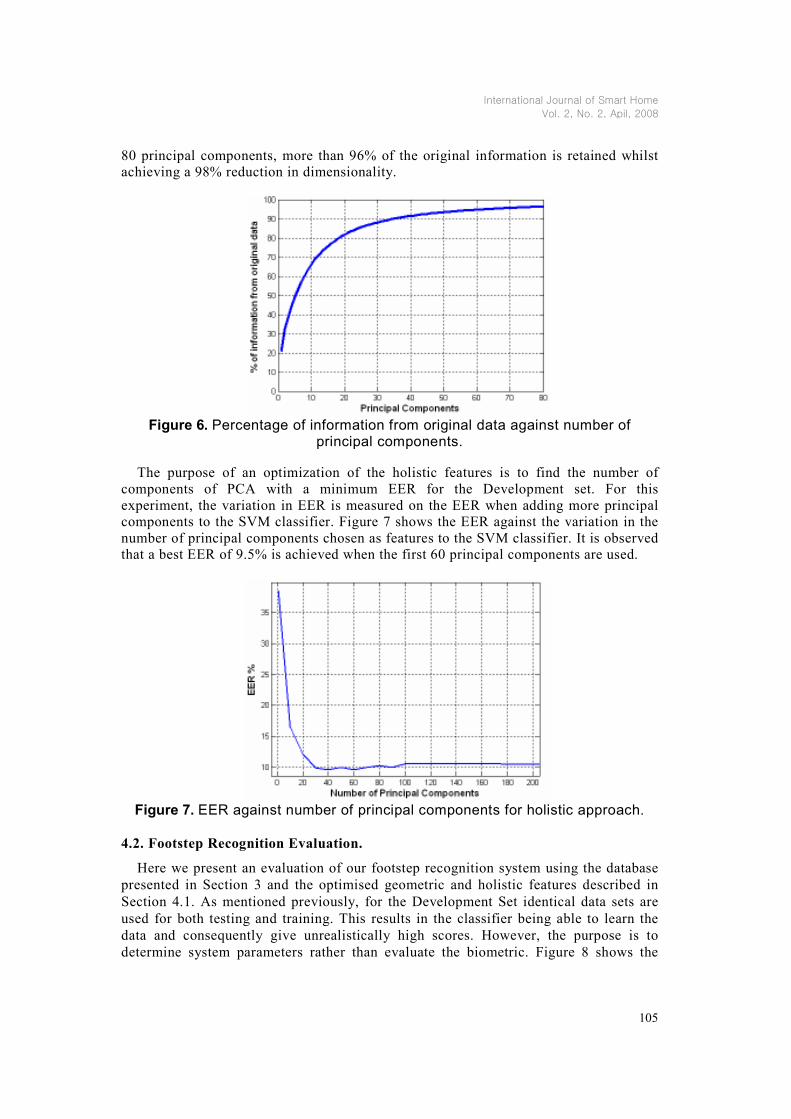
Due to the high dimensionality of this holistic feature vector, principal component
analysis (PCA) [19] was used to distil the information content. Thus, after PCA, a set of
principal components is obtained, where each of them is a linear combination of the
original feature set. Figure 6 shows the information contained in the principal
components of the training data of Development set. It is observed how using the first
International Journal of Smart Home
Vol. 2, No. 2, Apil, 2008
105
80 principal components, more than 96% of the original information is retained whilst
achieving a 98% reduction in dimensionality.
Figure 6. Percentage of information from original data against number of
principal components.
The purpose of an optimization of the holistic features is to find the number of
components of PCA with a minimum EER for the Development set. For this
experiment, the variation in EER is measured on the EER when adding more principal
components to the SVM classifier. Figure 7 shows the EER against the variation in the
number of principal components chosen as features to the SVM classifier. It is observed
that a best EER of 9.5% is achieved when the first 60 principal components are used.
Figure 7. EER against number of principal components for holistic approach.
4.2. Footstep Recognition Evaluation.
Here we present an evaluation of our footstep recognition system using the database
presented in Section 3 and the optimised geometric and holistic features described in
Section 4.1. As mentioned previously, for the Development Set identical data sets are
used for both testing and training. This results in the classifier being able to learn the
data and consequently give unrealistically high scores. However, the purpose is to
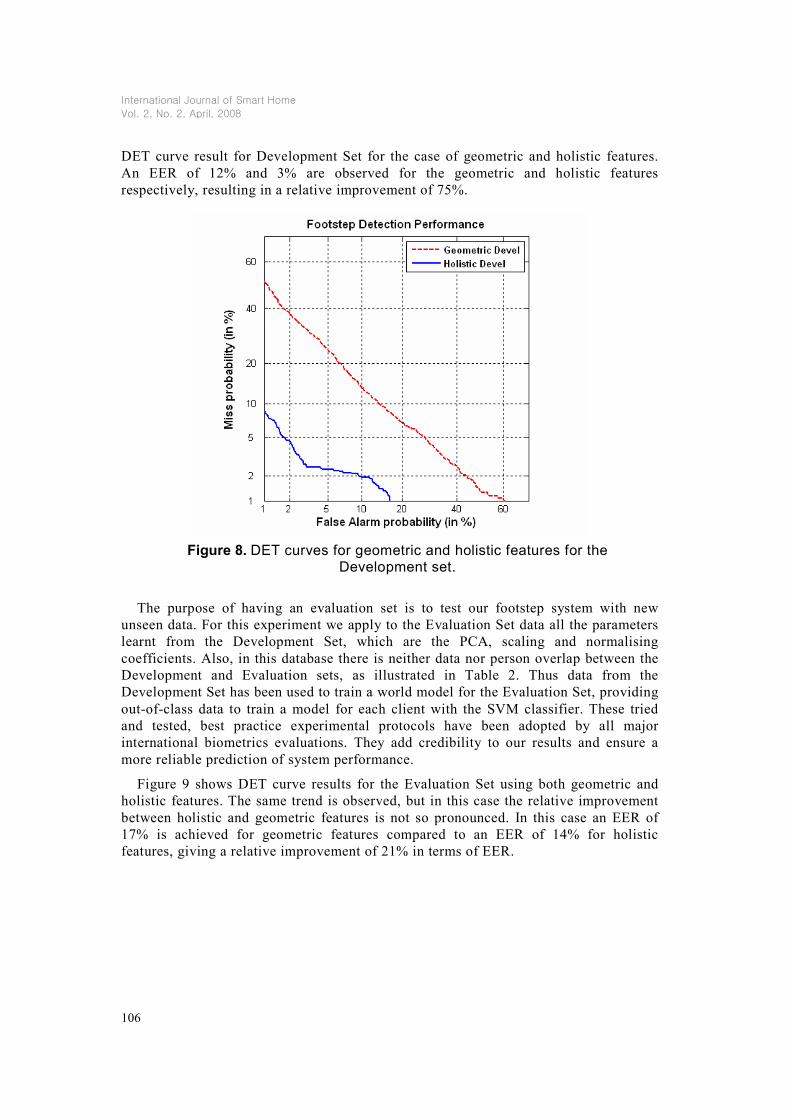
determine system parameters rather than evaluate the biometric. Figure 8 shows the
International Journal of Smart Home
Vol. 2, No. 2, April, 2008
106
DET curve result for Development Set for the case of geometric and holistic features.
An EER of 12% and 3% are observed for the geometric and holistic features
respectively, resulting in a relative improvement of 75%.
Figure 8. DET curves for geometric and holistic features for the Development set.
The purpose of having an evaluation set is to test our footstep system with new
unseen data. For this experiment we apply to the Evaluation Set data all the parameters
learnt from the Development Set, which are the PCA, scaling and normalising
coefficients. Also, in this database there is neither data nor person overlap between the
Development and Evaluation sets, as illustrated in Table 2. Thus data from the
Development Set has been used to train a world model for the Evaluation Set, providing
out-of-class data to train a model for each client with the SVM classifier. These tried
and tested, best practice experimental protocols have been adopted by all major
international biometrics evaluations. They add credibility to our results and ensure a
more reliable prediction of system performance.
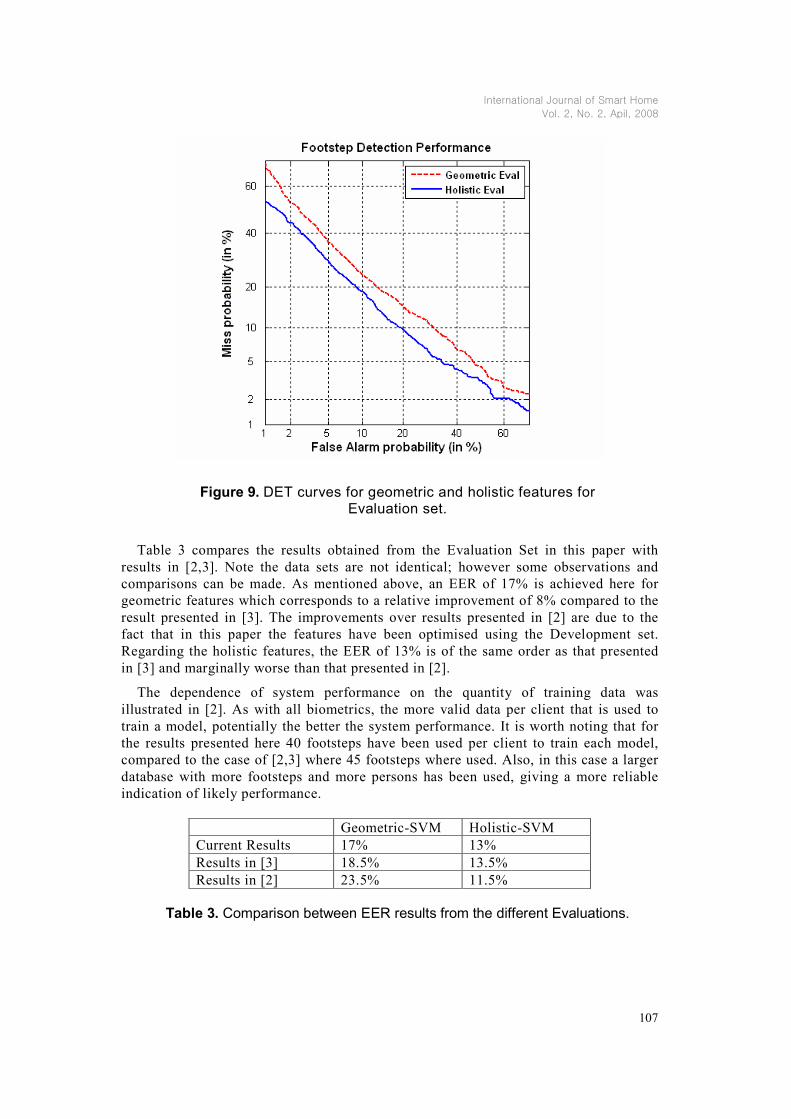
Figure 9 shows DET curve results for the Evaluation Set using both geometric and
holistic features. The same trend is observed, but in this case the relative improvement
between holistic and geometric features is not so pronounced. In this case an EER of
17% is achieved for geometric features compared to an EER of 14% for holistic
features, giving a relative improvement of 21% in terms of EER.
International Journal of Smart Home
Vol. 2, No. 2, Apil, 2008
107
Figure 9. DET curves for geometric and holistic features for Evaluation set.
Table 3 compares the results obtained from the Evaluation Set in this paper with
results in [2,3]. Note the data sets are not identical; however some observations and
comparisons can be made. As mentioned above, an EER of 17% is achieved here for
geometric features which corresponds to a relative improvement of 8% compared to the
result presented in [3]. The improvements over results presented in [2] are due to the
fact that in this paper the features have been optimised using the Development set.
Regarding the holistic features, the EER of 13% is of the same order as that presented
in [3] and marginally worse than that presented in [2].
The dependence of system performance on the quantity of training data was
illustrated in [2]. As with all biometrics, the more valid data per client that is used to
train a model, potentially the better the system performance. It is worth noting that for
the results presented here 40 footsteps have been used per client to train each model,
compared to the case of [2,3] where 45 footsteps where used. Also, in this case a larger
database with more footsteps and more persons has been used, giving a more reliable
indication of likely performance.
Geometric-SVM Holistic-SVM
Current Results 17% 13%
Results in [3] 18.5% 13.5%
Results in [2] 23.5% 11.5%
Table 3. Comparison between EER results from the different Evaluations.
International Journal of Smart Home
Vol. 2, No. 2, April, 2008
108
5. Conclusions and future work
This paper describes a semi-automatic system for capturing footsteps used to gather a
database comprised of more than 3500 footsteps from 55 persons, the biggest ever
database used to assess footsteps as a biometric. This allows us to present more
statistically meaningful results and potentially more reliable predictions of performance
compared to related work. Also, this database is publicly available to the research
community.
Experimental work has been conducted following best practice using independent
development and evaluation sets. In addition, we describe an optimisation of the two
feature extraction approaches and report an evaluation protocol of the footstep system
which shows results of around 13% EER, a figure close to that of previously reported
work. An improvement on system performance using geometric features compared to
previous work is reported, but the relative improvement obtained by using holistic
features remains approximately 21% in terms of EER.
Some appealing applications of a footstep biometric within the smart home
environment have been proposed. They include security access, surveillance or
interaction between people and technology.
We are currently collecting a new footstep database with a higher sensor resolution
and larger sensor area. When complete the new database will allow us to capture more
detailed footstep information and consequently to improve the performance of the
system using new approaches to capture finer dynamic detail.
6. Acknowledgements
We gratefully acknowledge the support of the UK Engineering and Physical Science
Research Council (EPSRC) and the European Social Fund (ESF).
7. References [1] Footstep recognition at Swansea University available at http://eeswan.swan.ac.uk.
[2] Vera-Rodriguez, R., Evans, N. W. D., Lewis, R. P., Fauve, B. and Mason, J. S. D. “An experimental study on the feasibility of footsteps as a biometric”. Proc. 15th European Signal Processing Conference (EUSIPCO’07), Poznan, Poland, September 2007, pp. 748-752.
[3] Vera-Rodriguez, R., Lewis, R. P., Evans, N. W. D. and Mason, J. S. D. “Optimisation of Geometric and Holistic Feature Extraction Approaches for a Footstep Biometric Verification System”. International Summer School for Advanced Studies on Biometrics for Secure Authentication, Alghero, Italy, June 2007.
[4] Mori, T., Sato, T., Asaki, K., Yoshimoto, Y. and Kishimoto, Y. “One-Room-Type Sensing System for Recognition and Accumulation of Human Behavior”. Proceedings of 2000 IEEE/RSJ International Conference on Intelligent Robots and Systems, volume 1, 2000, pp. 344-350.
[5] Morishita, H., Fukui, R., and Sato, T. “High Resolution Pressure Sensor Distributed Floor for Future Human-Robot Symbiosis Environments”. In Proceedings of 2002 IEEE/RSJ International Conference on Intelligent Robots and Systems, volume 2, 2002, pp. 1246-1251.
[6] Murakita, T., Ikeda, T., and Ishiguro, H. “Human Tracking using Floor Sensors based on the Markov Chain Monte Carlo Method”. In Proceedings of the 17th International Conference on Pattern Recognition (ICPR), volume 4, 2004, pp. 917-920.
[7] Addlesee, M. D., Jones, A., Livesey, F. and Samaria, F. “The ORL Active Floor”. IEEE Personal Communications. vol. 4, 1997, pp. 35-41.
[8] Headon, R. and Curwen, R. “Recognizing Movements from the Ground Reaction Force”. In Proceedings of the 2001 Workshop on Perceptive User Interfaces. Orlando, USA, 2001, pp. 1-8.
International Journal of Smart Home
Vol. 2, No. 2, Apil, 2008
109
[9] Orr, R. J. and Abowd, G. D. “The Smart Floor: A Mechanism for Natural User Identification and Tracking”. Proceedings of Conference on Human Factors in Computing Systems. 2000, pp. 275-276.
[10] Cattin, C. “Biometric Authentication System Using Human Gait”. PhD Thesis. Swiss Federal Institute of Technology, Zurich, 2002.
[11] Yun, J. S., Lee, S. H., Woo, W. T. and Ryu, J. H. “The User Identification System Using Walking Pattern over the ubiFloor”. Proc. International Conference on Control, Automation, and Systems. 2003, pp. 1046-1050.
[12] Suutala, J. and Rning, J. “Towards the adaptive identification of walkers: automated feature selection of footsteps using distinction-sensitive LVQ”. Proc. International Workshop on Processing Sensory Information for Proactive Systems. 2004, pp. 61-67.
[13] Middleton, L., Buss, A. A., Bazin, A. I. and Nixon, M. S. “A floor sensor system for gait recognition”. Proc. Fourth IEEE Workshop on Automatic Identification Advanced Technologies. 2005, pp. 171-176.
[14] Gao, Y., Brennan, M. J., Mace, B. R. and Muggleton, J. M. “Person recognition by measuring the ground reaction force due to a footstep”. Proc. 9th International Conference on Recent Advances in Structural Dynamics. 2006.
[15] NIST Speaker Recognition Evaluation website http://www.nist.gov/speech/tests/spk/index.htm
[16] Vapnik, V. N., “Statistical Learning Theory”. Wiley, New York, 1998.
[17] Burges, C. J. C., “A tutorial on support vector machines for pattern recognition”. Data Mining and Knowl. Discov., vol. 2, no. 2, 1998, pp. 1-47.
[18] Martin, A., Doddington, G., Kamm, T., Ordowski, M., and Przybocki, M. “The DET curve in assessment of detection task performance”. Eurospeech, vol. 1, 1997, pp. 1895-1898.
[19] Jolliffe, I. T. “Principal Component Analysis”. Springer Series in Statistics, 2002.
International Journal of Smart Home
Vol. 2, No. 2, April, 2008
110
Authors
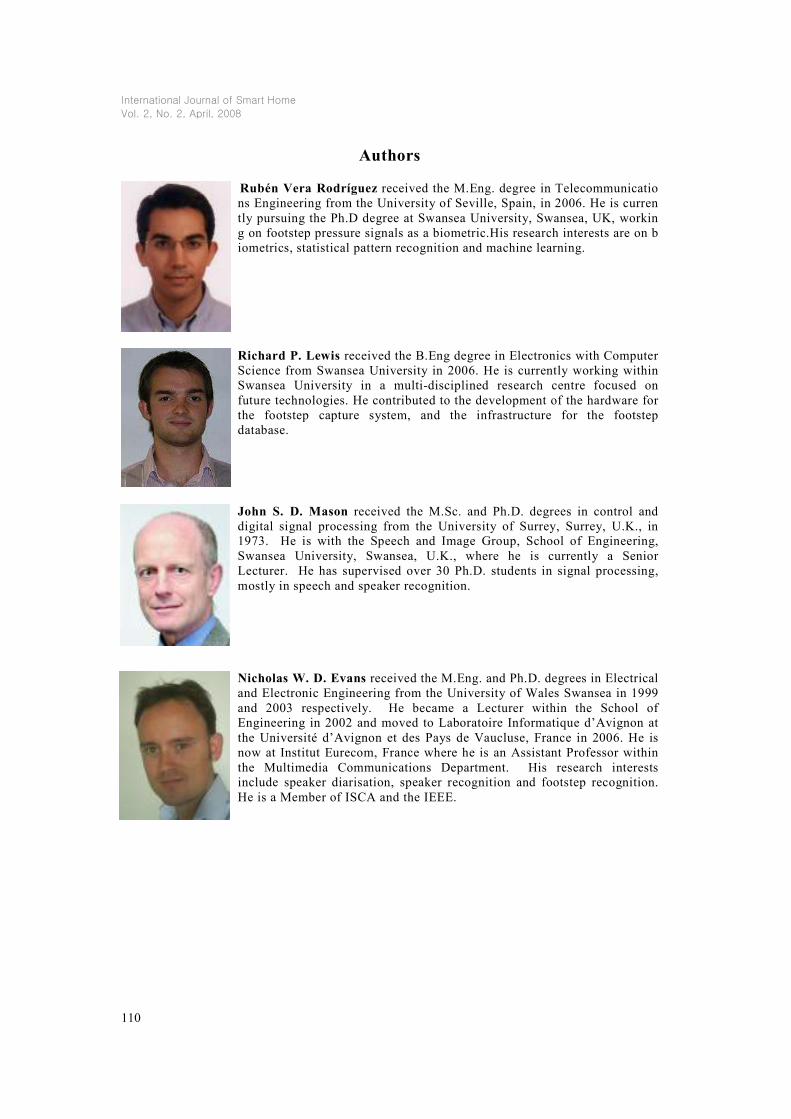
Rubén Vera Rodríguez received the M.Eng. degree in Telecommunicatio
ns Engineering from the University of Seville, Spain, in 2006. He is curren
tly pursuing the Ph.D degree at Swansea University, Swansea, UK, workin
g on footstep pressure signals as a biometric.His research interests are on b
iometrics, statistical pattern recognition and machine learning.
Richard P. Lewis received the B.Eng degree in Electronics with Computer
Science from Swansea University in 2006. He is currently working within
Swansea University in a multi-disciplined research centre focused on
future technologies. He contributed to the development of the hardware for
the footstep capture system, and the infrastructure for the footstep
database.
John S. D. Mason received the M.Sc. and Ph.D. degrees in control and
digital signal processing from the University of Surrey, Surrey, U.K., in
1973. He is with the Speech and Image Group, School of Engineering,
Swansea University, Swansea, U.K., where he is currently a Senior
Lecturer. He has supervised over 30 Ph.D. students in signal processing,
mostly in speech and speaker recognition.
Nicholas W. D. Evans received the M.Eng. and Ph.D. degrees in Electrical
and Electronic Engineering from the University of Wales Swansea in 1999
and 2003 respectively. He became a Lecturer within the School of
Engineering in 2002 and moved to Laboratoire Informatique d’Avignon at
the Université d’Avignon et des Pays de Vaucluse, France in 2006. He is
now at Institut Eurecom, France where he is an Assistant Professor within
the Multimedia Communications Department. His research interests
include speaker diarisation, speaker recognition and footstep recognition.
He is a Member of ISCA and the IEEE.
Related Documents


![Gait recognition via deep learning of the center-of ...In addition, most of the footstep recognition studies included only a few individuals [2,12]. Recognizing people through their](https://static.cupdf.com/doc/110x72/5f3d7b783eef944ed02453a4/gait-recognition-via-deep-learning-of-the-center-of-in-addition-most-of-the.jpg)


