Footprints in Time Who Am I? and Renfrew Word Finding Vocabulary Test Report on Wave 5 Data B cohort The Australian Council for Educational Research

Welcome message from author
This document is posted to help you gain knowledge. Please leave a comment to let me know what you think about it! Share it to your friends and learn new things together.
Transcript
Footprints in Time
Who Am I?
and
Renfrew Word Finding Vocabulary Test
Report on Wave 5 Data
B cohort
The Australian Council for Educational Research
Report on Who Am I? and the Renfrew Word Finding Vocabulary Test
Footprints in Time, Wave 5, 2013 1
Australian Council for Educational Research
Who Am I? and
Renfrew Word Finding Vocabulary Test
Report prepared by
Sarah Buckley, Cathy Underwood and Nola Purdie
Australian Council for Educational Research
for:
Annette Neuendorf, LSIC Section Manager
Department of Families, Housing, Community Services and Indigenous Affairs
(FaHCSIA)
BACKGROUND
This report presents the results of administration of the Who Am I? and the Renfrew Word Finding
Vocabulary Test for the LSIC Wave 5 data collection in 2012.
Who Am I? is a developmental assessment that requires the child to write their name, copy shapes,
write letters, numbers and words in a small booklet, with simple instructions and encouragement from
the interviewer. Who Am I? is not language dependent and is suitable for children with limited
English. The assessment takes about 10 minutes to complete and is suitable for preschool children and
children in the first two years of school.
The Renfrew Word Finding Vocabulary Test assesses children’s expressive vocabulary
(compared, for instance, with the Peabody Picture Vocabulary Test, which is a test of receptive
vocabulary). It assesses the extent to which pictures of objects, arranged in order of difficulty, can be
named correctly. Most of the objects illustrated have no alternative names, so the responses of
children can be quickly measured. The assessment contains 50 line-drawn pictures and is suitable for
children aged 3-9 years.
The Renfrew Word Finding Vocabulary Test and Who Am I? assessments are being used as part of
Footprints in Time, which is the name given to the Longitudinal Study of Indigenous Children (LSIC)
managed by FaHCSIA. LSIC works with Aboriginal and Torres Strait Islander families from sites in
Australia seeking their consent to participate in annual interviews to help better understand what
impacts on their children’s lives over time. LSIC especially explores how Aboriginal and Torres Strait
Islander children can be better supported to grow up strong and resilient, regardless of location.
The study is overseen by a specially formed Steering Committee chaired by Professor Mick Dodson
(Chair of Indigenous Studies, Australian National University), which has mandated that LSIC must be
designed and conducted so that it has the acceptance and support of Aboriginal and Torres Strait
Islander communities and of participating families.
LSIC uses a number of assessments of children’s development. In the cognitive domain, Who Am I?
and the Renfrew Word Finding Vocabulary Test are being used to assess processes that underlie the
learning of early literacy and numeracy skills.
The K cohort of the LSIC sample were administered the Who Am I? and Renfrew tests in 2008, 2009
and 2010 (Waves 1-3) to monitor early literacy and numeracy. However, at Wave 4 (2011), they had
reached an age that required different assessments to investigate these skills. In Wave 4, the Who Am
I? and Renfrew tests were introduced to the B cohort with the intention of replicating the
administration process that was implemented with the K cohort. This report describes results of the
second administration of the Who Am I? and Renfrew tests to the B cohort. The cohort primarily
2
Australian Council for Educational Research
included 4½-5½ year olds in Wave 5, although data were collected from some children who fell
outside of this age range.
Modifications were made to the Who Am I? for the purposes of LSIC following a trial in 2007 to
assess its usefulness for Aboriginal and Torres Strait Islander children. The instrument was found to
be satisfactory, although some modifications were made to it. In particular, trial sample results
suggested that it would be wise to delete some of the items (Numbers, Letters, Words, Sentence) in
Who Am I? for the Wave 1 stage. Retention of the copying items (Name, Circle, Cross, Square,
Triangle, Diamond) was recommended and this recommendation was adopted. The same
modifications were implemented for the first use of the Who Am I? for the B cohort. Replicating the
process followed with the K cohort (i.e. as happened in Wave 2), the Numbers, Letters, Words and
Sentences items were incorporated back into the second administration of the Who Am I? test to the B
cohort.
The Who Am I? and the Renfrew Word Finding Vocabulary Test were administered to children
primarily by Aboriginal and Torres Strait Islander Research Administration Officers (RAOs). The
Who Am I? was scored by one person at ACER who is experienced in marking this developmental
assessment. Children’s responses to the Renfrew Word Finding Vocabulary Test were recorded in situ
in an electronic database by the RAOs. Subsequently, a researcher at ACER recoded responses so that
articulation errors or minor corruptions or substitutions were scored as correct.
SAMPLE CHARACTERISTICS
Table 1 provides a breakdown of age, gender, and Level of Relative Isolation (LORI) characteristics
for the children in the LSIC B cohort in Wave 5 that completed the Who Am I? and/or the Renfrew
Word Finding Vocabulary Test. Age groupings were designed, where possible, to match those created
for the K cohort in Wave 2; however, this was not possible with the youngest age bracket as there
were too few children in this group in the B cohort in Wave 5. Instead, a combined 46-51 months
group was created.
3
Australian Council for Educational Research
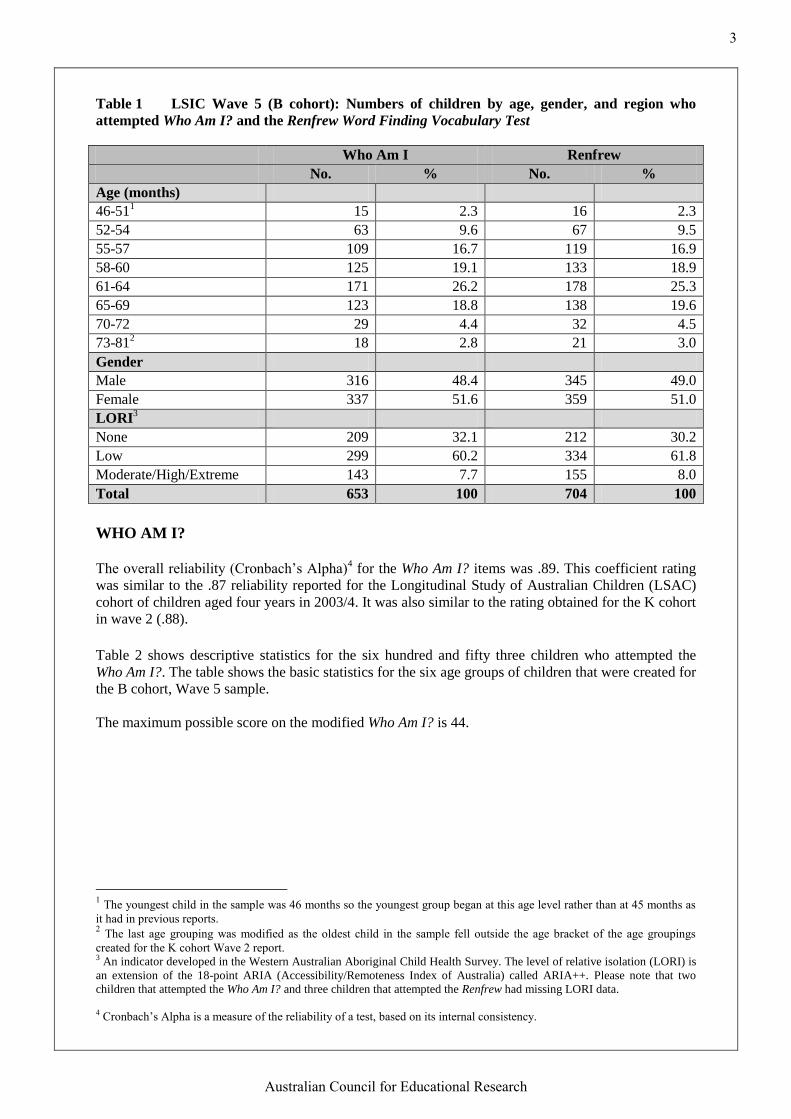
Table 1 LSIC Wave 5 (B cohort): Numbers of children by age, gender, and region who
attempted Who Am I? and the Renfrew Word Finding Vocabulary Test
Who Am I Renfrew
No. % No. %
Age (months)
46-511 15 2.3 16 2.3
52-54 63 9.6 67 9.5
55-57 109 16.7 119 16.9
58-60 125 19.1 133 18.9
61-64 171 26.2 178 25.3
65-69 123 18.8 138 19.6
70-72 29 4.4 32 4.5
73-812 18 2.8 21 3.0
Gender
Male 316 48.4 345 49.0
Female 337 51.6 359 51.0
LORI3
None 209 32.1 212 30.2
Low 299 60.2 334 61.8
Moderate/High/Extreme 143 7.7 155 8.0
Total 653 100 704 100
WHO AM I?
The overall reliability (Cronbach’s Alpha)4 for the Who Am I? items was .89. This coefficient rating
was similar to the .87 reliability reported for the Longitudinal Study of Australian Children (LSAC)
cohort of children aged four years in 2003/4. It was also similar to the rating obtained for the K cohort
in wave 2 (.88).
Table 2 shows descriptive statistics for the six hundred and fifty three children who attempted the
Who Am I?. The table shows the basic statistics for the six age groups of children that were created for
the B cohort, Wave 5 sample.
The maximum possible score on the modified Who Am I? is 44.
1 The youngest child in the sample was 46 months so the youngest group began at this age level rather than at 45 months as
it had in previous reports. 2 The last age grouping was modified as the oldest child in the sample fell outside the age bracket of the age groupings
created for the K cohort Wave 2 report. 3 An indicator developed in the Western Australian Aboriginal Child Health Survey. The level of relative isolation (LORI) is
an extension of the 18-point ARIA (Accessibility/Remoteness Index of Australia) called ARIA++. Please note that two
children that attempted the Who Am I? and three children that attempted the Renfrew had missing LORI data.
4 Cronbach’s Alpha is a measure of the reliability of a test, based on its internal consistency.
4
Australian Council for Educational Research
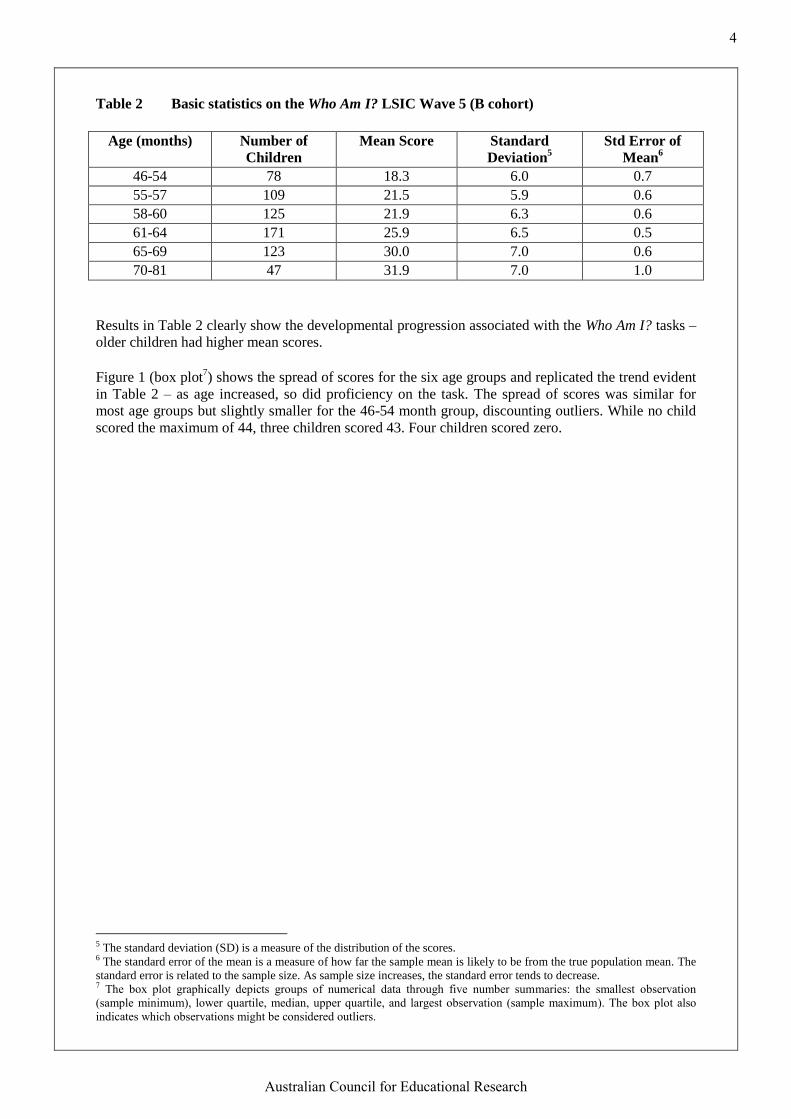
Table 2 Basic statistics on the Who Am I? LSIC Wave 5 (B cohort)
Age (months) Number of
Children
Mean Score Standard
Deviation5
Std Error of
Mean6
46-54 78 18.3 6.0 0.7
55-57 109 21.5 5.9 0.6
58-60 125 21.9 6.3 0.6
61-64 171 25.9 6.5 0.5
65-69 123 30.0 7.0 0.6
70-81 47 31.9 7.0 1.0
Results in Table 2 clearly show the developmental progression associated with the Who Am I? tasks –
older children had higher mean scores.
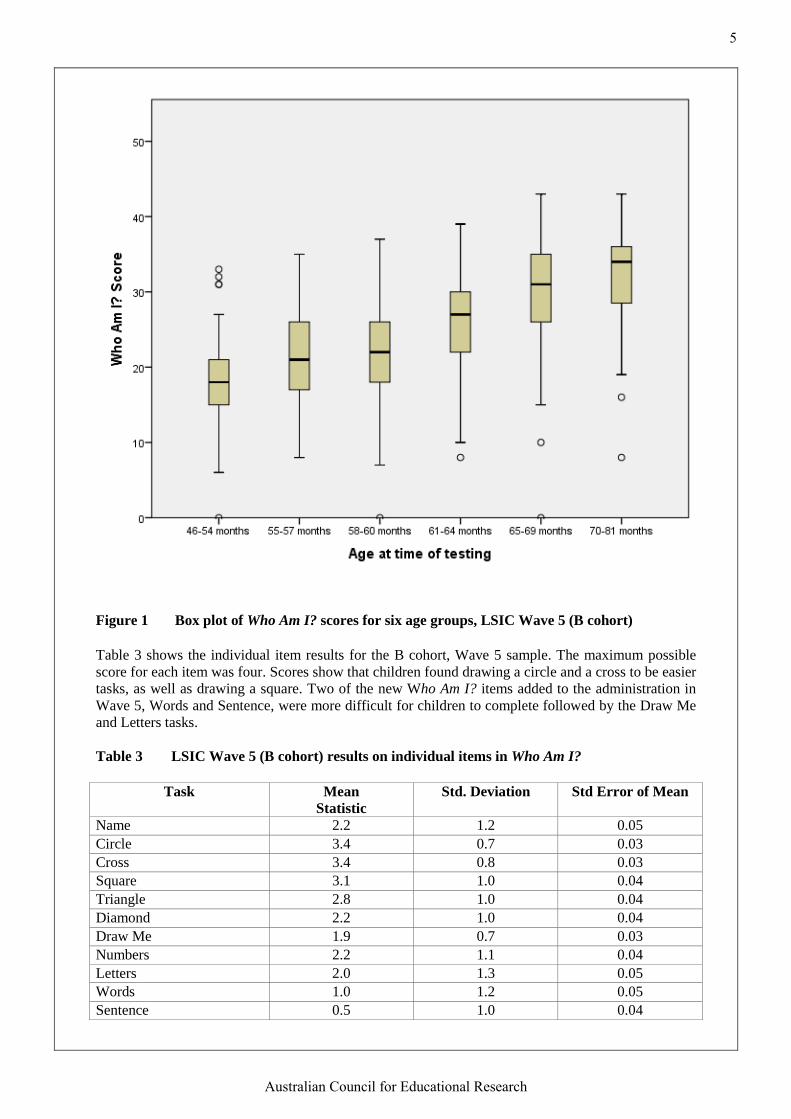
Figure 1 (box plot7) shows the spread of scores for the six age groups and replicated the trend evident
in Table 2 – as age increased, so did proficiency on the task. The spread of scores was similar for
most age groups but slightly smaller for the 46-54 month group, discounting outliers. While no child
scored the maximum of 44, three children scored 43. Four children scored zero.
5 The standard deviation (SD) is a measure of the distribution of the scores. 6 The standard error of the mean is a measure of how far the sample mean is likely to be from the true population mean. The
standard error is related to the sample size. As sample size increases, the standard error tends to decrease. 7 The box plot graphically depicts groups of numerical data through five number summaries: the smallest observation
(sample minimum), lower quartile, median, upper quartile, and largest observation (sample maximum). The box plot also
indicates which observations might be considered outliers.
5
Australian Council for Educational Research
Figure 1 Box plot of Who Am I? scores for six age groups, LSIC Wave 5 (B cohort)
Table 3 shows the individual item results for the B cohort, Wave 5 sample. The maximum possible
score for each item was four. Scores show that children found drawing a circle and a cross to be easier
tasks, as well as drawing a square. Two of the new Who Am I? items added to the administration in
Wave 5, Words and Sentence, were more difficult for children to complete followed by the Draw Me
and Letters tasks.
Table 3 LSIC Wave 5 (B cohort) results on individual items in Who Am I?
Task Mean
Statistic
Std. Deviation Std Error of Mean
Name 2.2 1.2 0.05
Circle 3.4 0.7 0.03
Cross 3.4 0.8 0.03
Square 3.1 1.0 0.04
Triangle 2.8 1.0 0.04
Diamond 2.2 1.0 0.04
Draw Me 1.9 0.7 0.03
Numbers 2.2 1.1 0.04
Letters 2.0 1.3 0.05
Words 1.0 1.2 0.05
Sentence 0.5 1.0 0.04
6
Australian Council for Educational Research
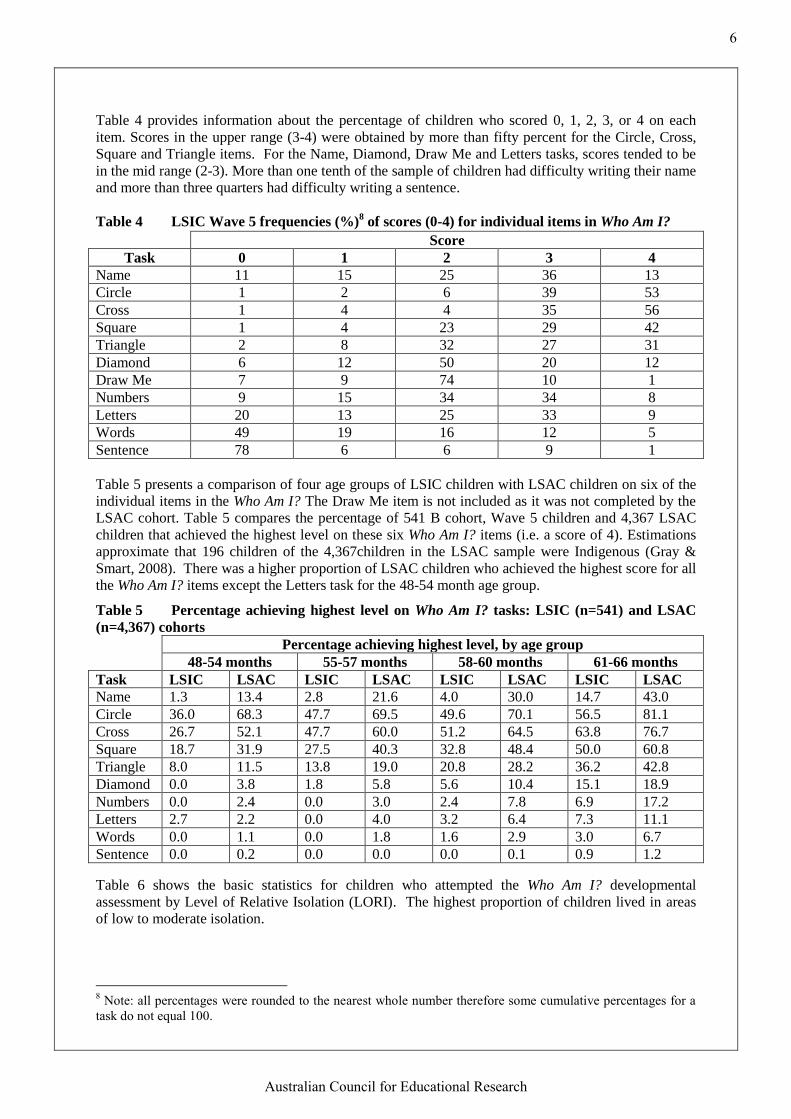
Table 4 provides information about the percentage of children who scored 0, 1, 2, 3, or 4 on each
item. Scores in the upper range (3-4) were obtained by more than fifty percent for the Circle, Cross,
Square and Triangle items. For the Name, Diamond, Draw Me and Letters tasks, scores tended to be
in the mid range (2-3). More than one tenth of the sample of children had difficulty writing their name
and more than three quarters had difficulty writing a sentence.
Table 4 LSIC Wave 5 frequencies (%)8 of scores (0-4) for individual items in Who Am I?
Score
Task 0 1 2 3 4
Name 11 15 25 36 13
Circle 1 2 6 39 53
Cross 1 4 4 35 56
Square 1 4 23 29 42
Triangle 2 8 32 27 31
Diamond 6 12 50 20 12
Draw Me 7 9 74 10 1
Numbers 9 15 34 34 8
Letters 20 13 25 33 9
Words 49 19 16 12 5
Sentence 78 6 6 9 1
Table 5 presents a comparison of four age groups of LSIC children with LSAC children on six of the
individual items in the Who Am I? The Draw Me item is not included as it was not completed by the
LSAC cohort. Table 5 compares the percentage of 541 B cohort, Wave 5 children and 4,367 LSAC
children that achieved the highest level on these six Who Am I? items (i.e. a score of 4). Estimations
approximate that 196 children of the 4,367children in the LSAC sample were Indigenous (Gray &
Smart, 2008). There was a higher proportion of LSAC children who achieved the highest score for all
the Who Am I? items except the Letters task for the 48-54 month age group.
Table 5 Percentage achieving highest level on Who Am I? tasks: LSIC (n=541) and LSAC
(n=4,367) cohorts
Percentage achieving highest level, by age group
48-54 months 55-57 months 58-60 months 61-66 months
Task LSIC LSAC LSIC LSAC LSIC LSAC LSIC LSAC
Name 1.3 13.4 2.8 21.6 4.0 30.0 14.7 43.0
Circle 36.0 68.3 47.7 69.5 49.6 70.1 56.5 81.1
Cross 26.7 52.1 47.7 60.0 51.2 64.5 63.8 76.7
Square 18.7 31.9 27.5 40.3 32.8 48.4 50.0 60.8
Triangle 8.0 11.5 13.8 19.0 20.8 28.2 36.2 42.8
Diamond 0.0 3.8 1.8 5.8 5.6 10.4 15.1 18.9
Numbers 0.0 2.4 0.0 3.0 2.4 7.8 6.9 17.2
Letters 2.7 2.2 0.0 4.0 3.2 6.4 7.3 11.1
Words 0.0 1.1 0.0 1.8 1.6 2.9 3.0 6.7
Sentence 0.0 0.2 0.0 0.0 0.0 0.1 0.9 1.2
Table 6 shows the basic statistics for children who attempted the Who Am I? developmental
assessment by Level of Relative Isolation (LORI). The highest proportion of children lived in areas
of low to moderate isolation.
8 Note: all percentages were rounded to the nearest whole number therefore some cumulative percentages for a
task do not equal 100.
7
Australian Council for Educational Research
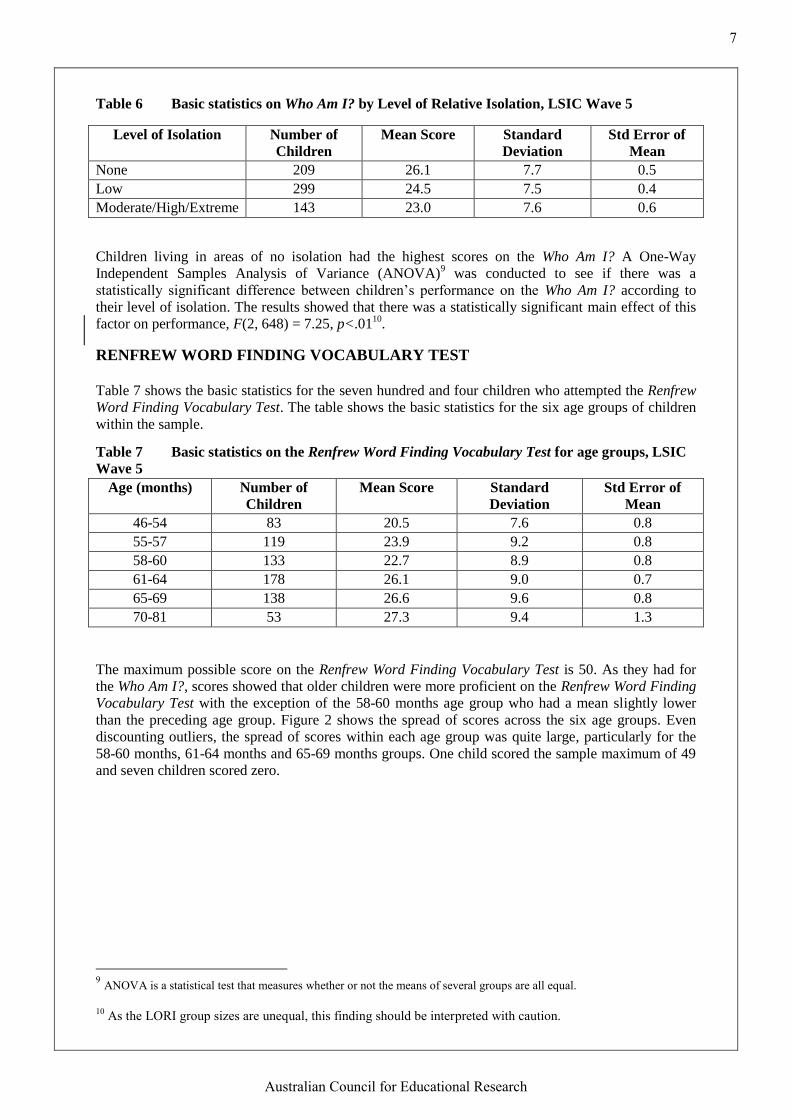
Table 6 Basic statistics on Who Am I? by Level of Relative Isolation, LSIC Wave 5
Level of Isolation Number of
Children
Mean Score Standard
Deviation
Std Error of
Mean
None 209 26.1 7.7 0.5
Low 299 24.5 7.5 0.4
Moderate/High/Extreme 143 23.0 7.6 0.6
Children living in areas of no isolation had the highest scores on the Who Am I? A One-Way
Independent Samples Analysis of Variance (ANOVA)9 was conducted to see if there was a
statistically significant difference between children’s performance on the Who Am I? according to
their level of isolation. The results showed that there was a statistically significant main effect of this
factor on performance, F(2, 648) = 7.25, p<.0110
.
RENFREW WORD FINDING VOCABULARY TEST
Table 7 shows the basic statistics for the seven hundred and four children who attempted the Renfrew
Word Finding Vocabulary Test. The table shows the basic statistics for the six age groups of children
within the sample.
Table 7 Basic statistics on the Renfrew Word Finding Vocabulary Test for age groups, LSIC
Wave 5
Age (months) Number of
Children
Mean Score Standard
Deviation
Std Error of
Mean
46-54 83 20.5 7.6 0.8
55-57 119 23.9 9.2 0.8
58-60 133 22.7 8.9 0.8
61-64 178 26.1 9.0 0.7
65-69 138 26.6 9.6 0.8
70-81 53 27.3 9.4 1.3
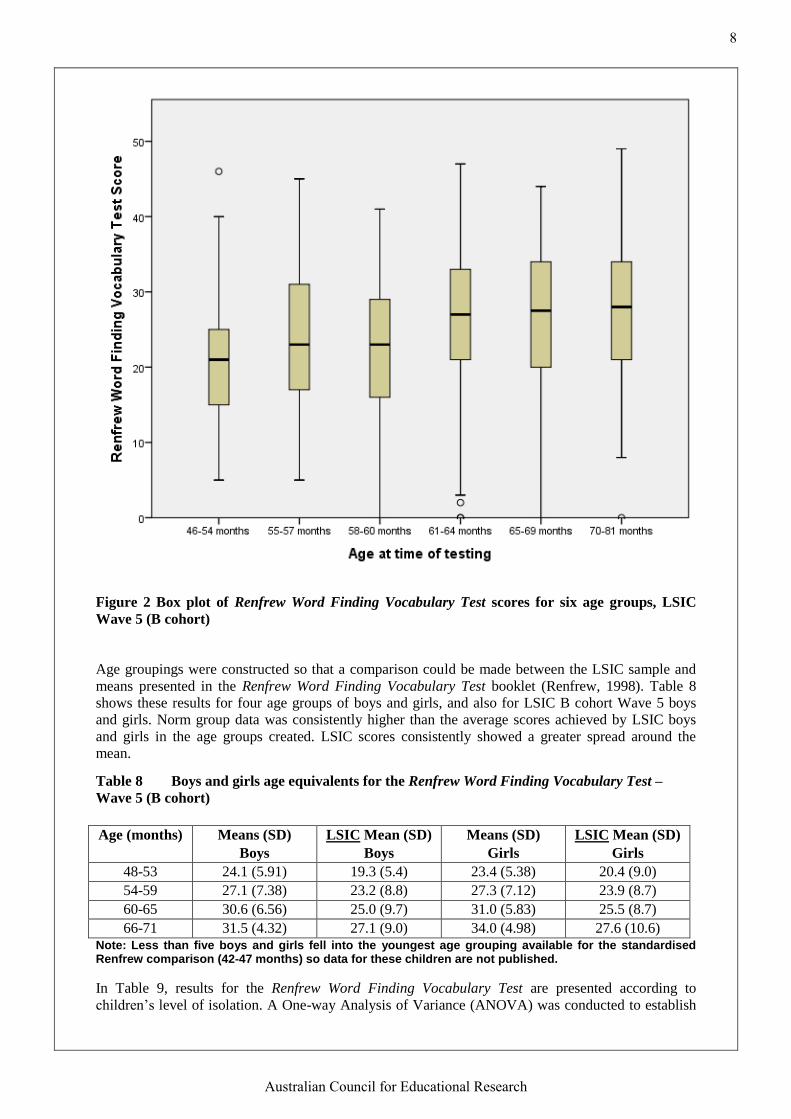
The maximum possible score on the Renfrew Word Finding Vocabulary Test is 50. As they had for
the Who Am I?, scores showed that older children were more proficient on the Renfrew Word Finding
Vocabulary Test with the exception of the 58-60 months age group who had a mean slightly lower
than the preceding age group. Figure 2 shows the spread of scores across the six age groups. Even
discounting outliers, the spread of scores within each age group was quite large, particularly for the
58-60 months, 61-64 months and 65-69 months groups. One child scored the sample maximum of 49
and seven children scored zero.
9 ANOVA is a statistical test that measures whether or not the means of several groups are all equal.
10
As the LORI group sizes are unequal, this finding should be interpreted with caution.
8
Australian Council for Educational Research
Figure 2 Box plot of Renfrew Word Finding Vocabulary Test scores for six age groups, LSIC
Wave 5 (B cohort)
Age groupings were constructed so that a comparison could be made between the LSIC sample and
means presented in the Renfrew Word Finding Vocabulary Test booklet (Renfrew, 1998). Table 8
shows these results for four age groups of boys and girls, and also for LSIC B cohort Wave 5 boys
and girls. Norm group data was consistently higher than the average scores achieved by LSIC boys
and girls in the age groups created. LSIC scores consistently showed a greater spread around the
mean.
Table 8 Boys and girls age equivalents for the Renfrew Word Finding Vocabulary Test –
Wave 5 (B cohort)
Age (months)
Means (SD)
Boys
LSIC Mean (SD)
Boys
Means (SD)
Girls
LSIC Mean (SD)
Girls
48-53 24.1 (5.91) 19.3 (5.4) 23.4 (5.38) 20.4 (9.0)
54-59 27.1 (7.38) 23.2 (8.8) 27.3 (7.12) 23.9 (8.7)
60-65 30.6 (6.56) 25.0 (9.7) 31.0 (5.83) 25.5 (8.7)
66-71 31.5 (4.32) 27.1 (9.0) 34.0 (4.98) 27.6 (10.6) Note: Less than five boys and girls fell into the youngest age grouping available for the standardised Renfrew comparison (42-47 months) so data for these children are not published.
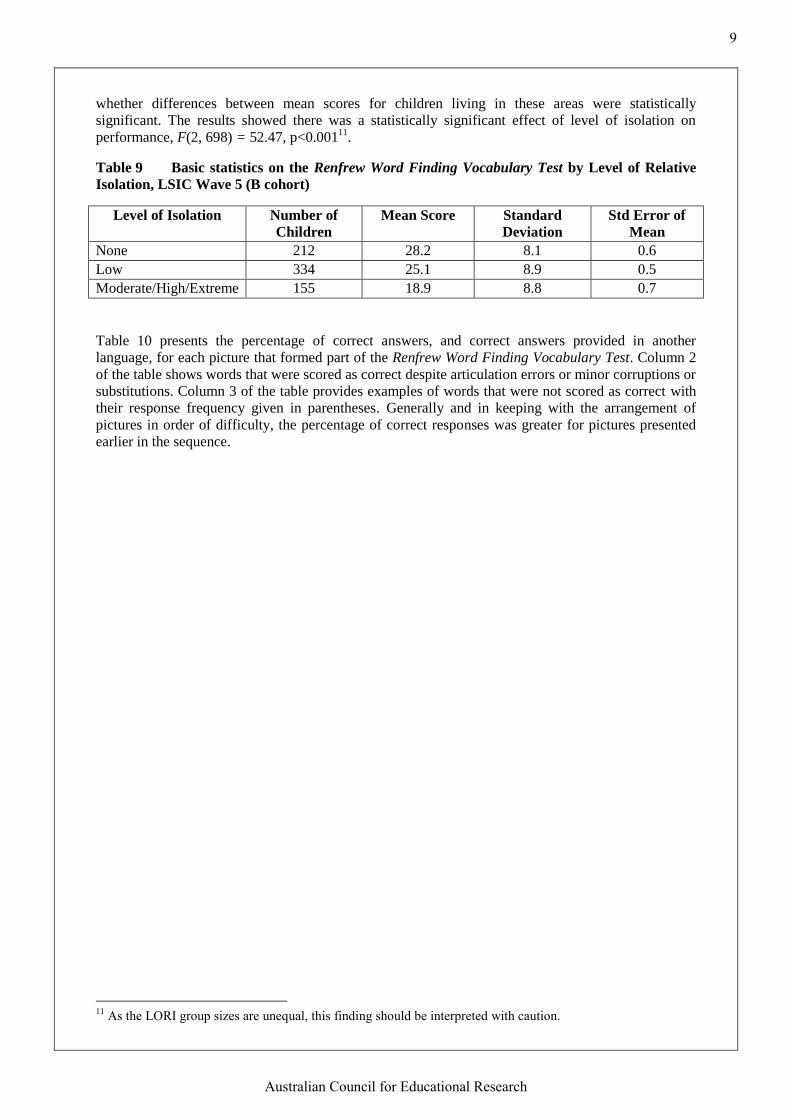
In Table 9, results for the Renfrew Word Finding Vocabulary Test are presented according to
children’s level of isolation. A One-way Analysis of Variance (ANOVA) was conducted to establish
9
Australian Council for Educational Research
whether differences between mean scores for children living in these areas were statistically
significant. The results showed there was a statistically significant effect of level of isolation on
performance, F(2, 698) = 52.47, p<0.00111
.
Table 9 Basic statistics on the Renfrew Word Finding Vocabulary Test by Level of Relative
Isolation, LSIC Wave 5 (B cohort)
Level of Isolation Number of
Children
Mean Score Standard
Deviation
Std Error of
Mean
None 212 28.2 8.1 0.6
Low 334 25.1 8.9 0.5
Moderate/High/Extreme 155 18.9 8.8 0.7
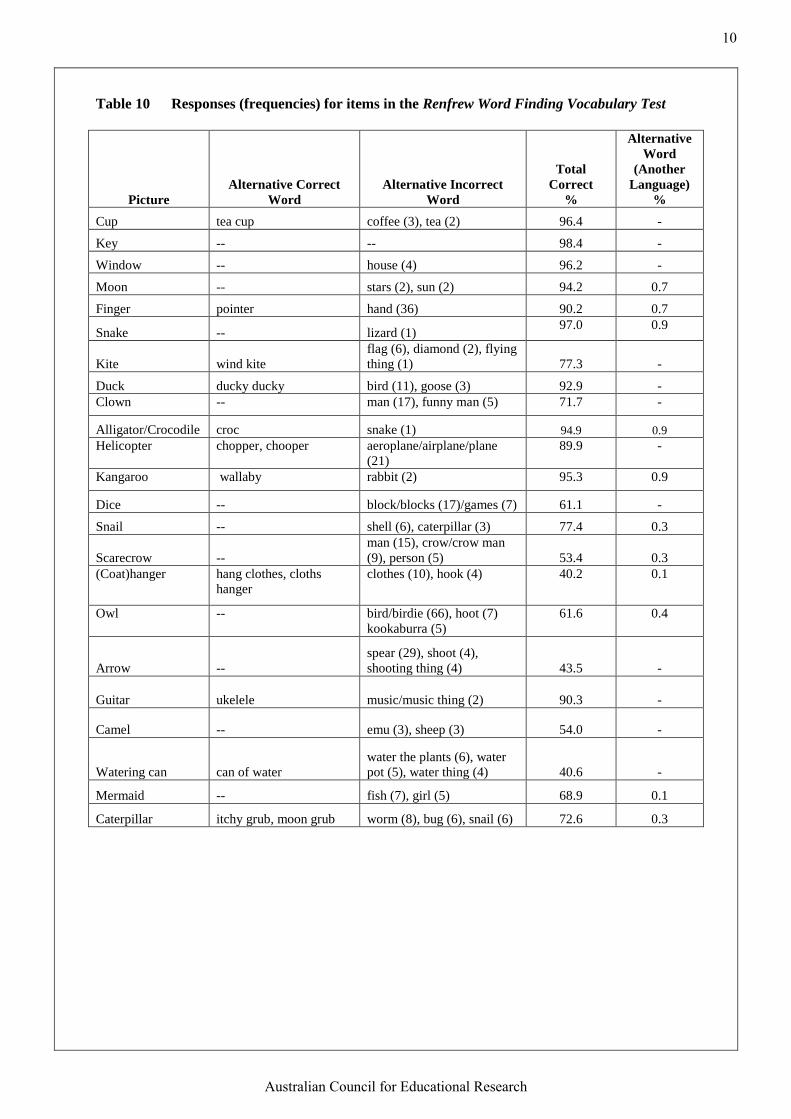
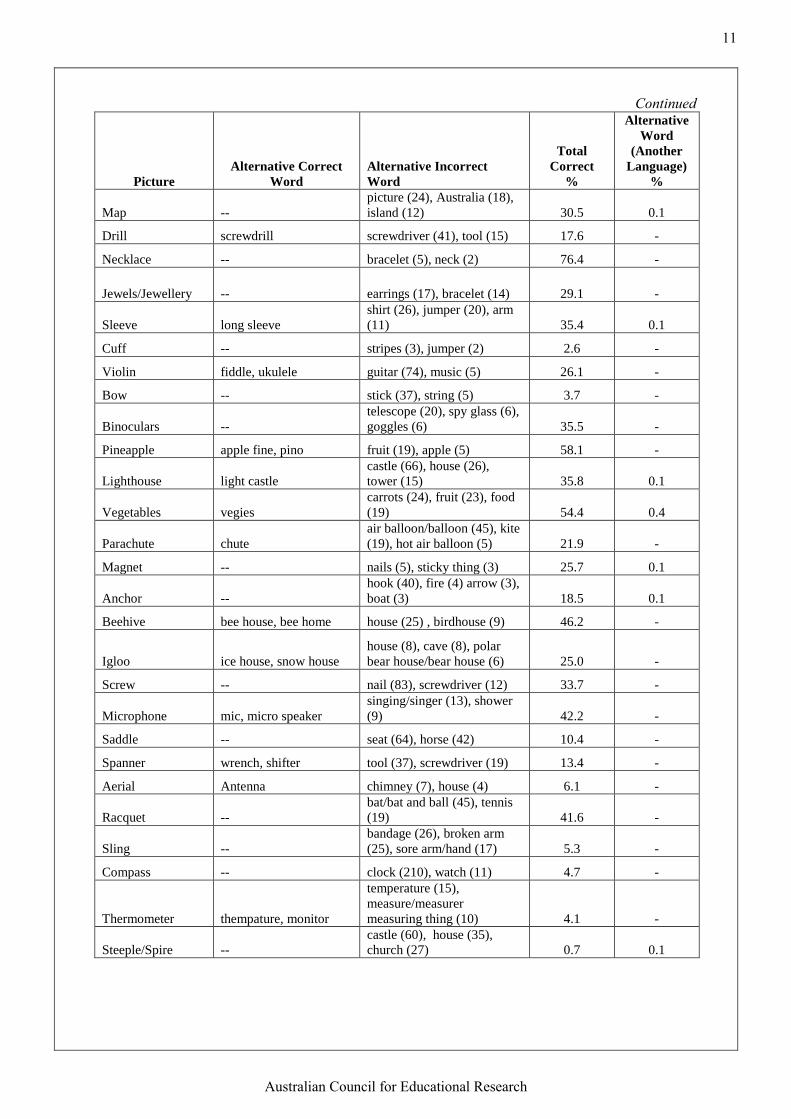
Table 10 presents the percentage of correct answers, and correct answers provided in another
language, for each picture that formed part of the Renfrew Word Finding Vocabulary Test. Column 2
of the table shows words that were scored as correct despite articulation errors or minor corruptions or
substitutions. Column 3 of the table provides examples of words that were not scored as correct with
their response frequency given in parentheses. Generally and in keeping with the arrangement of
pictures in order of difficulty, the percentage of correct responses was greater for pictures presented
earlier in the sequence.
11
As the LORI group sizes are unequal, this finding should be interpreted with caution.
10
Australian Council for Educational Research
Table 10 Responses (frequencies) for items in the Renfrew Word Finding Vocabulary Test
Picture
Alternative Correct
Word
Alternative Incorrect
Word
Total
Correct
%
Alternative
Word
(Another
Language)
%
Cup tea cup coffee (3), tea (2) 96.4 -
Key -- -- 98.4 -
Window -- house (4) 96.2 -
Moon -- stars (2), sun (2) 94.2 0.7
Finger pointer hand (36) 90.2 0.7
Snake -- lizard (1) 97.0 0.9
Kite wind kite
flag (6), diamond (2), flying
thing (1) 77.3 -
Duck ducky ducky bird (11), goose (3) 92.9 -
Clown -- man (17), funny man (5) 71.7 -
Alligator/Crocodile croc snake (1) 94.9 0.9
Helicopter chopper, chooper aeroplane/airplane/plane
(21)
89.9 -
Kangaroo wallaby rabbit (2) 95.3 0.9
Dice -- block/blocks (17)/games (7) 61.1 -
Snail -- shell (6), caterpillar (3) 77.4 0.3
Scarecrow --
man (15), crow/crow man
(9), person (5) 53.4 0.3
(Coat)hanger hang clothes, cloths
hanger
clothes (10), hook (4) 40.2 0.1
Owl -- bird/birdie (66), hoot (7)
kookaburra (5)
61.6 0.4
Arrow --
spear (29), shoot (4),
shooting thing (4) 43.5 -
Guitar ukelele music/music thing (2) 90.3 -
Camel -- emu (3), sheep (3) 54.0 -
Watering can can of water
water the plants (6), water
pot (5), water thing (4) 40.6 -
Mermaid -- fish (7), girl (5) 68.9 0.1
Caterpillar itchy grub, moon grub worm (8), bug (6), snail (6) 72.6 0.3
11
Australian Council for Educational Research
Continued
Picture
Alternative Correct
Word
Alternative Incorrect
Word
Total
Correct
%
Alternative
Word
(Another
Language)
%
Map --
picture (24), Australia (18),
island (12) 30.5 0.1
Drill screwdrill screwdriver (41), tool (15) 17.6 -
Necklace -- bracelet (5), neck (2) 76.4 -
Jewels/Jewellery -- earrings (17), bracelet (14) 29.1 -
Sleeve long sleeve
shirt (26), jumper (20), arm
(11) 35.4 0.1
Cuff -- stripes (3), jumper (2) 2.6 -
Violin fiddle, ukulele guitar (74), music (5) 26.1 -
Bow -- stick (37), string (5) 3.7 -
Binoculars --
telescope (20), spy glass (6),
goggles (6) 35.5 -
Pineapple apple fine, pino fruit (19), apple (5) 58.1 -
Lighthouse light castle
castle (66), house (26),
tower (15) 35.8 0.1
Vegetables vegies
carrots (24), fruit (23), food
(19) 54.4 0.4
Parachute chute
air balloon/balloon (45), kite
(19), hot air balloon (5) 21.9 -
Magnet -- nails (5), sticky thing (3) 25.7 0.1
Anchor --
hook (40), fire (4) arrow (3),
boat (3) 18.5 0.1
Beehive bee house, bee home house (25) , birdhouse (9) 46.2 -
Igloo ice house, snow house
house (8), cave (8), polar
bear house/bear house (6) 25.0 -
Screw -- nail (83), screwdriver (12) 33.7 -
Microphone mic, micro speaker
singing/singer (13), shower
(9) 42.2 -
Saddle -- seat (64), horse (42) 10.4 -
Spanner wrench, shifter tool (37), screwdriver (19) 13.4 -
Aerial Antenna chimney (7), house (4) 6.1 -
Racquet --
bat/bat and ball (45), tennis
(19) 41.6 -
Sling --
bandage (26), broken arm
(25), sore arm/hand (17) 5.3 -
Compass -- clock (210), watch (11) 4.7 -
Thermometer thempature, monitor
temperature (15),
measure/measurer
measuring thing (10) 4.1 -
Steeple/Spire --
castle (60), house (35),
church (27) 0.7 0.1
12
Australian Council for Educational Research
Relationship between scores on Who Am I? and the Renfrew Word Finding Vocabulary Test
Six hundred and fifty four children had scores on both the Who Am I? and the Renfrew Word Finding
Vocabulary Test . There was a positive, moderate correlation between these two scores (r = .49, p <
.001). Separate correlation coefficients were computed for the three levels of isolation for children
who had scores on both Who Am I? and the Renfrew Word Finding Vocabulary Test. There were
moderate and positive correlations between the two scores for children in easily accessible areas (r =
.43, p<.001), in areas of low isolation (r = .50, p<.001) and in areas of moderate/high/extreme
isolation (r = .45, p<.001).
Comments
As was the case in Wave 4, the Wave 5 performance of the children in the B cohort on the Who Am I?
and the Renfrew Word Finding Vocabulary Test followed a developmental pattern typical of children
of this age. The children were more able to perform the developmentally simpler tasks (e.g., copying
circle) than the developmentally more difficult tasks (e.g. writing their name) in the Who Am I? and
were better able to name the pictures at the beginning of the Renfrew sequence of pictures than
pictures later in the sequence.
As it did for the K cohort, repeating these assessments for the B cohort over time (within the age
parameters of the assessments) provides a valuable picture of children’s development over time. For
instance, copying tasks (a feature of the Who Am I?) have been shown to be strongly associated with
subsequent progress at school, are valid across different cultural groups, and provide a reliable
measure of developmental level at the time of the assessment. The Renfrew Word Finding Vocabulary
Test assesses a child’s ability to accurately describe images as portrayed in the 50 pictures contained
in the assessment. This ability is one aspect of the general ability to communicate one’s ideas clearly
and to understand the communication of others, which are vital pre-requisite skills to learning in the
classroom. A child’s strength or weakness in expressive language can be identified when we ask the
child to ask and answer questions, describe images, articulate thoughts and ideas and respond
appropriately to the communication of other people.
The move from home to school is important for all children and results on the two assessments
discussed in this report can provide parents and communities with the information they need to
facilitate this transition. Furthermore, the feedback these instruments provide on early literacy and
numeracy skills help teachers to understand what strengths children bring to the classroom so that
these can be developed further.
Comments recorded by test administrators noted that some children had difficulty engaging with the
assessments as they were distracted by their environment, disruptive or introverted. These comments
emphasize the importance of providing appropriate training for administrators of Who Am I? Such
training will ensure greater consistency in data collection procedures, thereby maximising data
integrity and allowing for better examination of children’s development over time. They also
demonstrate the complexity associated with conducting these assessments in the home.
Acknowledgements
Who am I? assessments were scored and coded by Catherine Underwood of ACER. Renfrew
assessments were coded by Elle Lenard and Sarah Buckley of ACER.
13
Australian Council for Educational Research
References
De Lemos, M., & Doig, B. (1999). Who Am I? Developmental Assessment Manual. Melbourne:
ACER.
Gray, M., & Smart, D. (2008). Growing Up in Australia: The Longitudinal Study of Australian
Children is now walking and talking. Family Matters, 79, 5-13. Available online at
http://www.aifs.gov.au/growingup/
Renfrew, C. (1998). The Renfrew Language Scales: Word Finding Vocabulary Test. Milton Keynes:
Speechmark.
Related Documents


