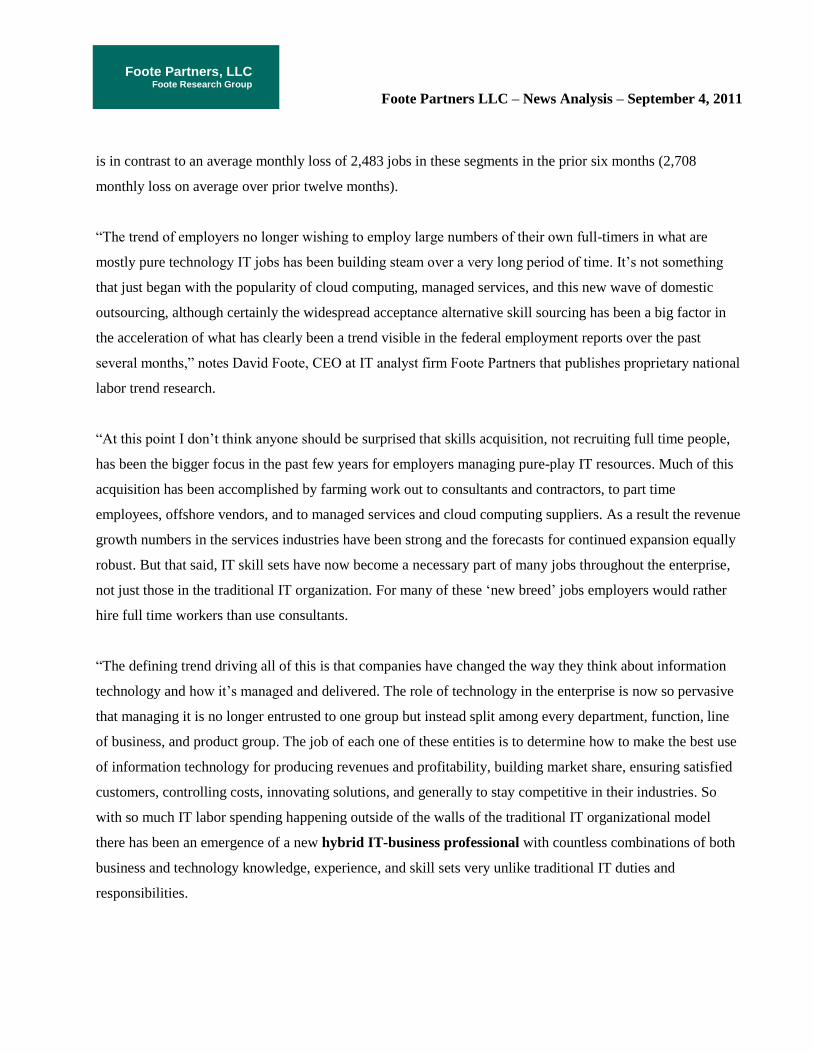
Foote Partners, LLC Foote Research Group Foote Partners LLC – News Analysis – September 4, 2011 FOR IMMEDIATE RELEASE Contact: David Foote, [email protected] Bill Reynolds [email protected] Tel: 772-234-2787 FOOTE IT NEWS ANALYSIS – Bureau of Labor Statistics US Employment Report – August 2011 No gain in U.S. jobs in August coupled with an increase of 200K ‘marginally attached’ workers in the past year—people who wanted to work but couldn’t find full time employment—and a rise in ‘discouraged workers’ spells continuing trouble in the current labor market. But things were better for IT workers, with 13,700 more jobs added in Technical Services segment, the largest monthly increase since April 2011. Vero Beach, FL – Sunday, September 4, 2011. U.S. employment numbers released Friday by the Department of Labor‘s Bureau of Labor Statistics (BLS) revealed a net gain of 13,700 IT services sector jobs in August, representing the fifteenth consecutive month of positive job growth in these job segments in federal employment data (see FIGURE 1). Overall, nonfarm payroll employment was unchanged last month and the national unemployment rate held at 9.1 percent. In a continuing trend of the shifting of the more traditional infrastructure-type IT hiring to the services industries by employers who are choosing to source more of these jobs externally, 6,000 new jobs were added in the Management and Technical Consulting Services and another 7,700 jobs in the Computer Systems Design and Related Services employment segments in August—2,200 more than in July---for a total of 122,700 added in these segments over the past twelve months (70,800 in last six months). (see FIGURE 2). Meanwhile 47,300 jobs were lost in the two other IT-related jobs segments, Telecommunications and Data Processing, Hosting and Related Services, an aberration caused by a labor strike in the telecommunications industry that removed 45,000 worker from company payrolls during the August survey reference period. This

Welcome message from author
This document is posted to help you gain knowledge. Please leave a comment to let me know what you think about it! Share it to your friends and learn new things together.
Transcript

Foote Partners, LLC Foote Research Group
Foote Partners LLC – News Analysis – September 4, 2011
FOR IMMEDIATE RELEASE
Contact: David Foote, [email protected]
Bill Reynolds [email protected]
Tel: 772-234-2787
FOOTE IT NEWS ANALYSIS – Bureau of Labor Statistics US Employment Report – August 2011
No gain in U.S. jobs in August coupled with an increase of 200K ‘marginally attached’ workers
in the past year—people who wanted to work but couldn’t find full time employment—and a
rise in ‘discouraged workers’ spells continuing trouble in the current labor market.
But things were better for IT workers, with 13,700 more jobs added in Technical Services
segment, the largest monthly increase since April 2011.
Vero Beach, FL – Sunday, September 4, 2011. U.S. employment numbers released Friday by the
Department of Labor‘s Bureau of Labor Statistics (BLS) revealed a net gain of 13,700 IT services sector jobs
in August, representing the fifteenth consecutive month of positive job growth in these job segments in
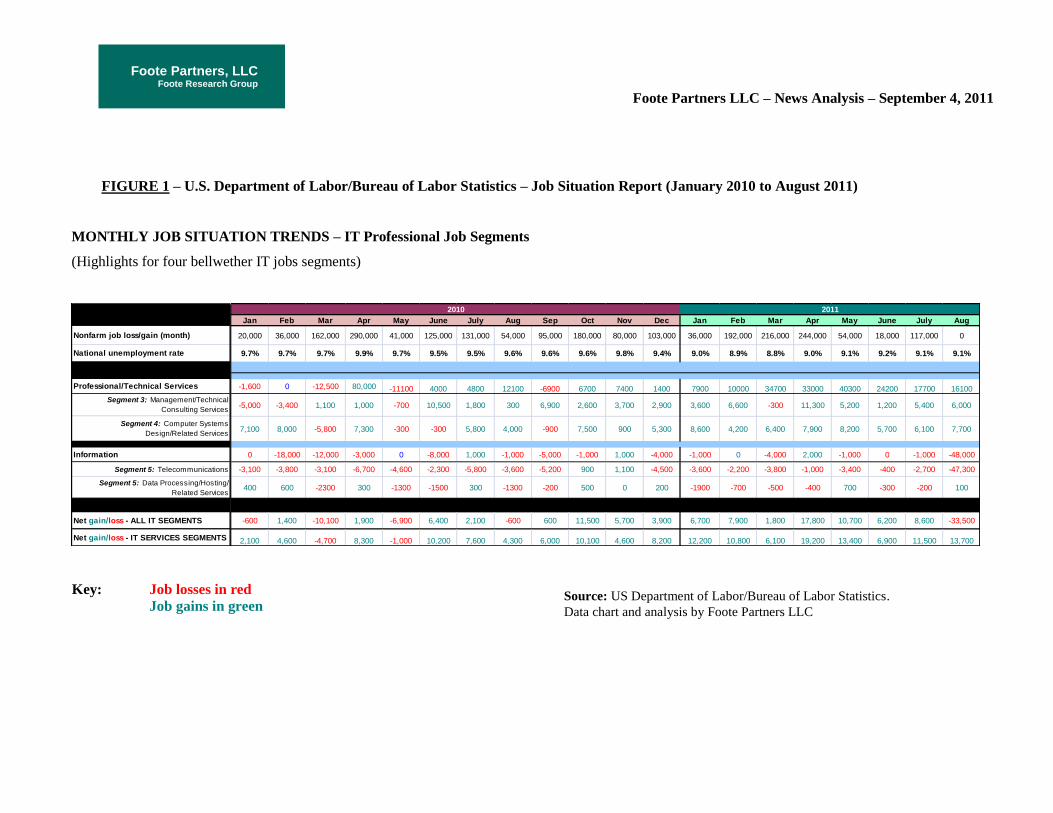
federal employment data (see FIGURE 1). Overall, nonfarm payroll employment was unchanged last month
and the national unemployment rate held at 9.1 percent.
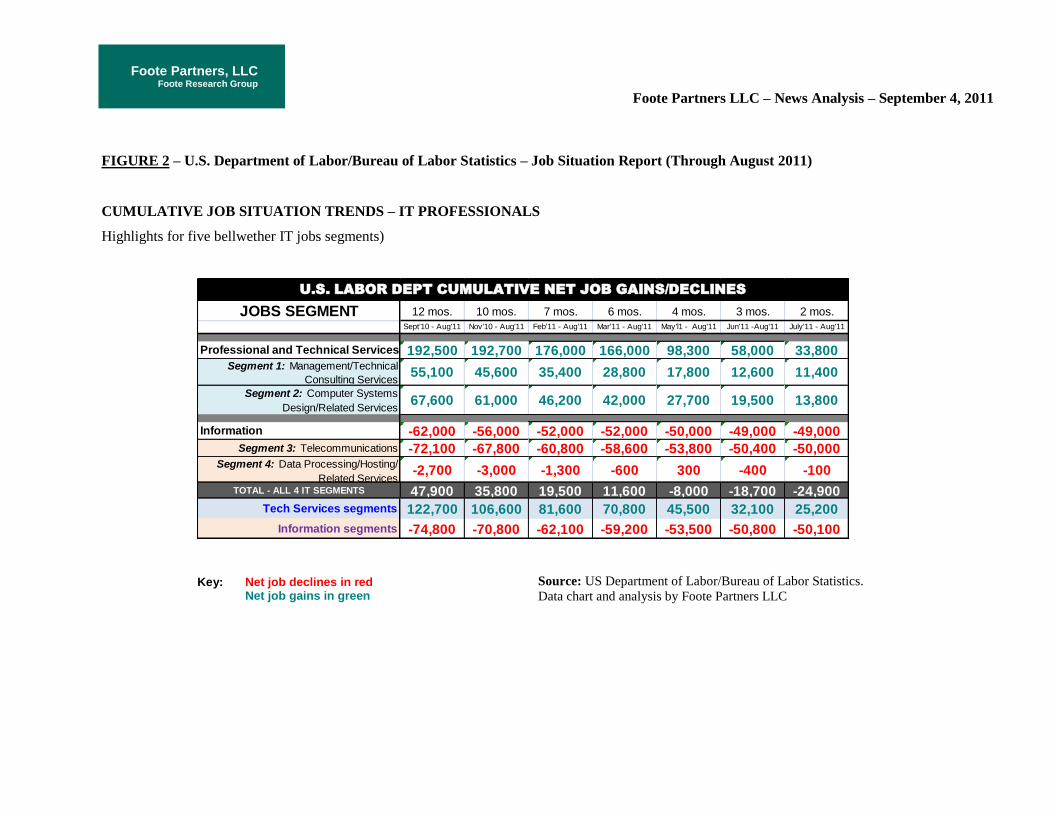
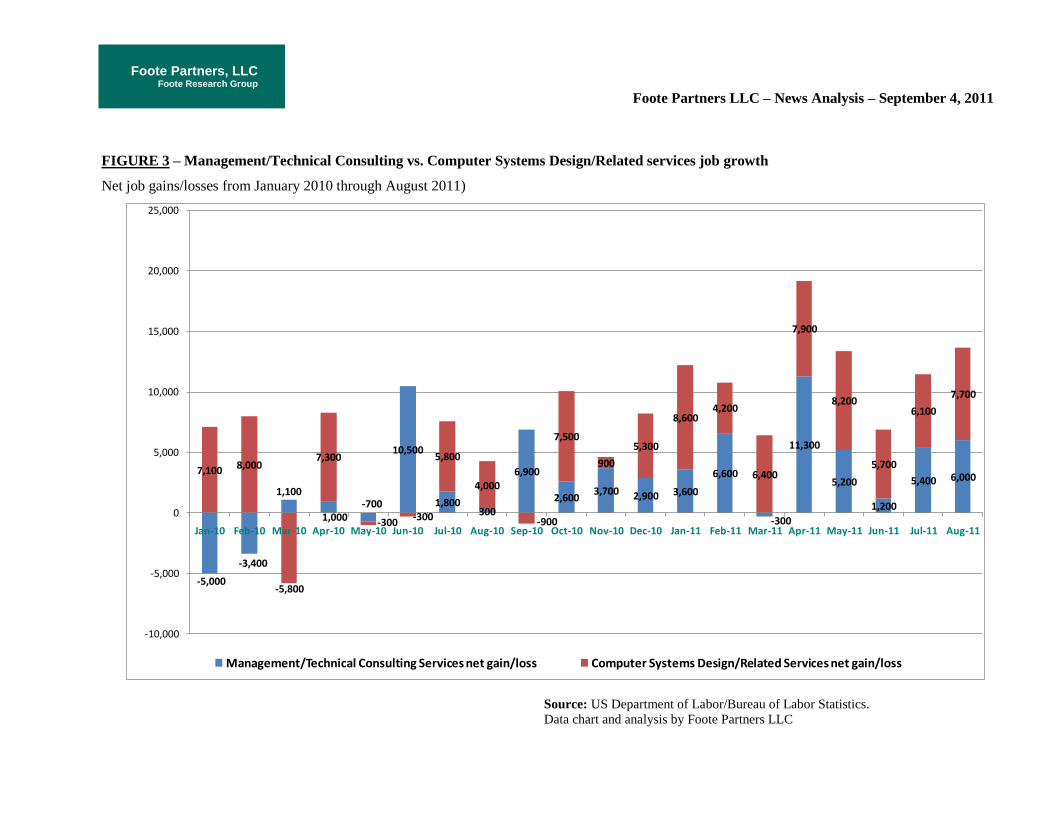
In a continuing trend of the shifting of the more traditional infrastructure-type IT hiring to the services
industries by employers who are choosing to source more of these jobs externally, 6,000 new jobs were added
in the Management and Technical Consulting Services and another 7,700 jobs in the Computer Systems
Design and Related Services employment segments in August—2,200 more than in July---for a total of
122,700 added in these segments over the past twelve months (70,800 in last six months). (see FIGURE 2).
Meanwhile 47,300 jobs were lost in the two other IT-related jobs segments, Telecommunications and Data
Processing, Hosting and Related Services, an aberration caused by a labor strike in the telecommunications
industry that removed 45,000 worker from company payrolls during the August survey reference period. This
Foote Partners, LLC Foote Research Group
Foote Partners LLC – News Analysis – September 4, 2011
is in contrast to an average monthly loss of 2,483 jobs in these segments in the prior six months (2,708
monthly loss on average over prior twelve months).
―The trend of employers no longer wishing to employ large numbers of their own full-timers in what are
mostly pure technology IT jobs has been building steam over a very long period of time. It‘s not something
that just began with the popularity of cloud computing, managed services, and this new wave of domestic
outsourcing, although certainly the widespread acceptance alternative skill sourcing has been a big factor in
the acceleration of what has clearly been a trend visible in the federal employment reports over the past
several months,‖ notes David Foote, CEO at IT analyst firm Foote Partners that publishes proprietary national
labor trend research.
―At this point I don‘t think anyone should be surprised that skills acquisition, not recruiting full time people,
has been the bigger focus in the past few years for employers managing pure-play IT resources. Much of this
acquisition has been accomplished by farming work out to consultants and contractors, to part time
employees, offshore vendors, and to managed services and cloud computing suppliers. As a result the revenue
growth numbers in the services industries have been strong and the forecasts for continued expansion equally
robust. But that said, IT skill sets have now become a necessary part of many jobs throughout the enterprise,
not just those in the traditional IT organization. For many of these ‗new breed‘ jobs employers would rather
hire full time workers than use consultants.
―The defining trend driving all of this is that companies have changed the way they think about information
technology and how it‘s managed and delivered. The role of technology in the enterprise is now so pervasive
that managing it is no longer entrusted to one group but instead split among every department, function, line
of business, and product group. The job of each one of these entities is to determine how to make the best use
of information technology for producing revenues and profitability, building market share, ensuring satisfied
customers, controlling costs, innovating solutions, and generally to stay competitive in their industries. So
with so much IT labor spending happening outside of the walls of the traditional IT organizational model
there has been an emergence of a new hybrid IT-business professional with countless combinations of both
business and technology knowledge, experience, and skill sets very unlike traditional IT duties and
responsibilities.
Foote Partners, LLC Foote Research Group
Foote Partners LLC – News Analysis – September 4, 2011
―We estimate that there are 20 to 24 million of these hybrids now working in lines of business, corporate
departments, product development groups, and in a wide variety of implementation and support functions
throughout the enterprise,‖ reveals Foote. ―This is in addition to the approximately 4 million IT professionals
tracked and reported in the Department of Labor‘s monthly employments survey that by their definition are a
variety of tech engineers, software programmers and developers, administrators and support specialists,
systems analysts, information scientists, architects, and managers.‖1
―All of this is feeding a corporate preoccupation with both skills acquisition and stimulating hiring of non-
traditional IT professionals in a very big way, and the gap between supply and demand for skills has been
extremely volatile. We‘ve been surveying and reporting on premium pay rates for certified and noncertified
IT skills since 1999 in our IT Skills and Certifications Pay IndexTM
(ITSPCP), including 502 of them at this
moment. 265 noncertified IT skills are earning an average of 8.5 percent (of base pay) right now in the U.S
and Canada, with pay for 237 IT certifications at a much lower 7.1 percent premium on average. In our most
recent quarterly data update (data collected through July 1, 2011), 50 of 252 noncertified skills (19.8%) were
awarded a boost in pay premiums by employers over that past three months but only 17 of 231 certifications
(7.4%) got similar treatment.
―Only one category of certifications –- Database---grew in overall market value (+2.6%) in the latest
quarterly ITSPCI report, bolstered by gains in three Oracle certifications. Four of eight noncertified skills
categories showed improvement, led by Management, Methodology and Process skills (+2.4% in pay
premiums); Messaging and Communications skills (+1.7%); Database skills (+0.6%); and SAP &
Enterprise Business Applications skills (+0.3%).
―Declines were more widespread in the past three months, with IT certifications taking the biggest hit: Entry
level and Training certs (-5.9% in pay premiums); Web Development (-4.0%); IT Security (-2.9%);
Systems Administration and Engineering (-2.5%); Applications Development and Programming
Languages (-2.3%); and Networking certifications (-0.2%). Only four of eight categories of noncertified
skills recorded losses in market value, though these losses were not as steep as those recorded in the
1 The Standard Occupational Classification (SOC) system is used by Federal statistical agencies to classify workers into
occupational categories for the purpose of collecting, calculating, or disseminating data. For IT related jobs there are
thirteen general job title categories.

Foote Partners, LLC Foote Research Group
Foote Partners LLC – News Analysis – September 4, 2011
certifications groups: Web/e-Commerce skills (-1.6%); Applications Development Tools & Platforms (-
0.5%); Systems and Networking skills (-0.2%); and Operating Systems skills (-0.1%).
―Regarding this expanding group of IT-Business hybrid professionals, it‘s notable that two skills categories
---Architecture/Project Management/Process certifications and Management/Methodology/Process non
certified skills--- are paying the highest average skills premiums of all classifications of IT skills and
certifications we are surveying. There are probably more of these hybrid professionals earning additional
skills pay in these areas than in most of the other categories we track such as Networking and
Communications, Systems Administration and Engineering, Messaging, Database, and IT Security, among
others. I would argue that this is in part being driven by the unique combinations of skills and experience and
subject matter expertise they bring to their jobs and that ultimately make them more valuable to their
employers. You don‘t want to lose these people over compensation issues because, let‘s face it, getting them
paid appropriately to true market levels is one of the only factors that all employers can control that figures
significantly into decisions by workers about whether they remain with their current employer or leave for
opportunities elsewhere,‖ insists Foote.
Analysis of other highlights from the August 2011 federal employment statistics
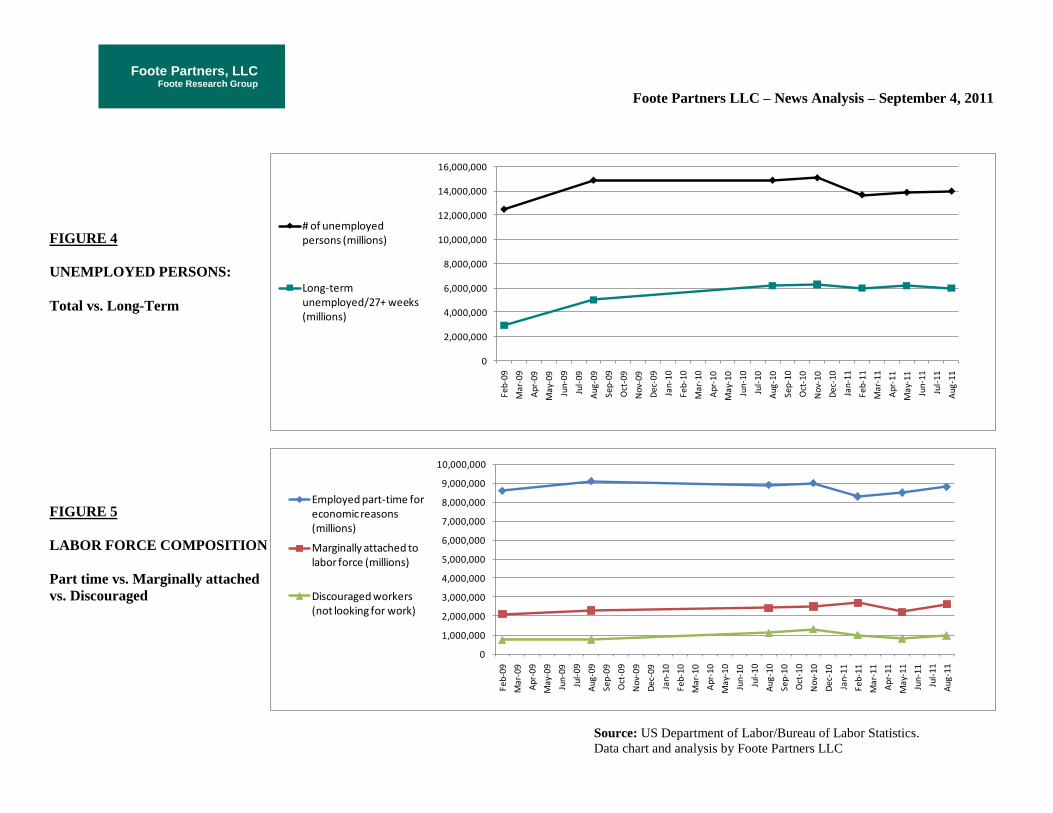
An August increase of 200K ‗marginally attached‘ workers in the past year—people who wanted to work but
couldn‘t find full time employment—spells continuing softness in the current labor market which saw no
change in employment in August. (see FIGURE 4). The lack of progress over the past twelve months of other
key employment statistics indicate to us that grave concerns are justified for future prospects for putting
people back to work.
The number of long-term unemployed (those jobless for 27 weeks and over) was mostly unchanged at 6.0
million in August and accounted for 42.9 percent of the unemployed. This is only slightly improved from one
year ago (6.3 million long-term unemployed workers) but as a percent of total unemployed it is nearly one-
point worse (42 percent).

Foote Partners, LLC Foote Research Group
Foote Partners LLC – News Analysis – September 4, 2011
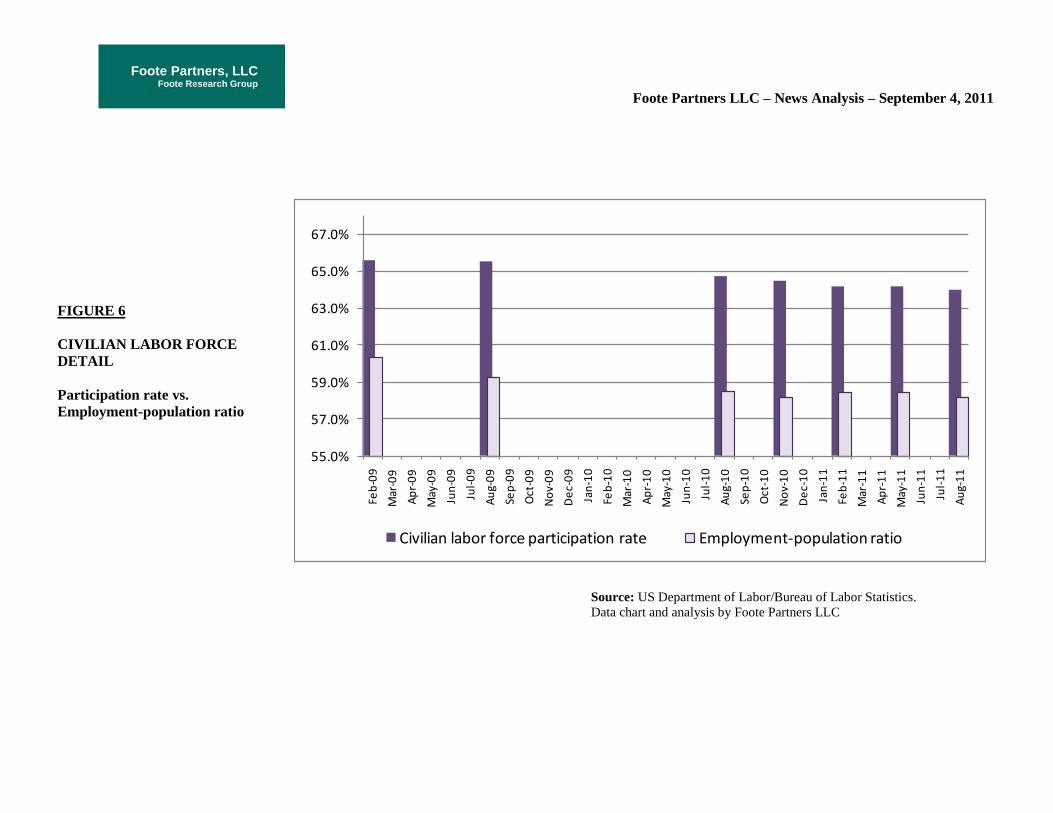
The labor force rose to 153.6 million in August. Both the civilian labor force participation rate, at 64.0
percent, and the employment-population ratio, at 58.2 percent, were little changed from July. But the
participation rate is worse than one year ago (64.7 percent) as is the employment-populations ratio (58.5
percent). (see FIGURE 6)
The number of persons employed part time for economic reasons (sometimes referred to as
involuntary part-time workers) rose from 8.4 million to 8.8 million in August. In other words 400,000 more
individuals were working part time in August compared to July because their hours had been cut back or
because they were unable to find a full-time job. This is only slightly better than one year ago (8.9 million)
500,000 more than just six months ago. (see FIGURE 5)
About 2.6 million persons were marginally attached to the labor force in August, up from 2.4 million
a year earlier. These individuals were not in the labor force, wanted and were available for work, and had
looked for a job sometime in the prior 12 months. They were not counted as unemployed because they had
not searched for work in the 4 weeks preceding the survey. This is 400,000 higher than three months ago.
(see FIGURE 5)
Perhaps the most alarming statistic in the current employment report that among the marginally attached,
there were 977,000 discouraged workers in August, which was 155,000 (or 19 percent) more than just three
months ago (see FIGURE 5). The number of discouraged workers had been on a significant decline from
November 2010 to May 2011 (-478,000) before this most recent reversal. Discouraged workers are persons
not currently looking for work because they believe no jobs are available for them.
Foote Partners, LLC Foote Research Group
Foote Partners LLC – News Analysis – September 4, 2011
FIGURE 1 – U.S. Department of Labor/Bureau of Labor Statistics – Job Situation Report (January 2010 to August 2011)
MONTHLY JOB SITUATION TRENDS – IT Professional Job Segments
(Highlights for four bellwether IT jobs segments)
Nonfarm job loss/gain (month)
National unemployment rate
Professional/Technical Services
Segment 3: Management/Technical
Consulting Services
Segment 4: Computer Systems
Design/Related Services
Information
Segment 5: Telecommunications
Segment 5: Data Processing/Hosting/
Related Services
Net gain/loss - ALL IT SEGMENTS
Net gain/loss - IT SERVICES SEGMENTS
Jan Feb Mar Apr May June July Aug Sep Oct Nov Dec Jan Feb Mar Apr May June July Aug
20,000 36,000 162,000 290,000 41,000 125,000 131,000 54,000 95,000 180,000 80,000 103,000 36,000 192,000 216,000 244,000 54,000 18,000 117,000 0
9.7% 9.7% 9.7% 9.9% 9.7% 9.5% 9.5% 9.6% 9.6% 9.6% 9.8% 9.4% 9.0% 8.9% 8.8% 9.0% 9.1% 9.2% 9.1% 9.1%
-1,600 0 -12,500 80,000 -11100 4000 4800 12100 -6900 6700 7400 1400 7900 10000 34700 33000 40300 24200 17700 16100
-5,000 -3,400 1,100 1,000 -700 10,500 1,800 300 6,900 2,600 3,700 2,900 3,600 6,600 -300 11,300 5,200 1,200 5,400 6,000
7,100 8,000 -5,800 7,300 -300 -300 5,800 4,000 -900 7,500 900 5,300 8,600 4,200 6,400 7,900 8,200 5,700 6,100 7,700
0 -18,000 -12,000 -3,000 0 -8,000 1,000 -1,000 -5,000 -1,000 1,000 -4,000 -1,000 0 -4,000 2,000 -1,000 0 -1,000 -48,000
-3,100 -3,800 -3,100 -6,700 -4,600 -2,300 -5,800 -3,600 -5,200 900 1,100 -4,500 -3,600 -2,200 -3,800 -1,000 -3,400 -400 -2,700 -47,300
400 600 -2300 300 -1300 -1500 300 -1300 -200 500 0 200 -1900 -700 -500 -400 700 -300 -200 100
-600 1,400 -10,100 1,900 -6,900 6,400 2,100 -600 600 11,500 5,700 3,900 6,700 7,900 1,800 17,800 10,700 6,200 8,600 -33,500
2,100 4,600 -4,700 8,300 -1,000 10,200 7,600 4,300 6,000 10,100 4,600 8,200 12,200 10,800 6,100 19,200 13,400 6,900 11,500 13,700
2010 2011
Key: Job losses in red
Job gains in green
Source: US Department of Labor/Bureau of Labor Statistics.
Data chart and analysis by Foote Partners LLC
Foote Partners, LLC Foote Research Group
Foote Partners LLC – News Analysis – September 4, 2011
FIGURE 2 – U.S. Department of Labor/Bureau of Labor Statistics – Job Situation Report (Through August 2011)
CUMULATIVE JOB SITUATION TRENDS – IT PROFESSIONALS
Highlights for five bellwether IT jobs segments)
JOBS SEGMENT 12 mos. 10 mos. 7 mos. 6 mos. 4 mos. 3 mos. 2 mos.
Sept'10 - Aug'11 Nov'10 - Aug'11 Feb'11 - Aug'11 Mar'11 - Aug'11 May'l1 - Aug'11 Jun'11 -Aug'11 July'11 - Aug'11
Professional and Technical Services 192,500 192,700 176,000 166,000 98,300 58,000 33,800Segment 1: Management/Technical
Consulting Services 55,100 45,600 35,400 28,800 17,800 12,600 11,400
Segment 2: Computer Systems
Design/Related Services67,600 61,000 46,200 42,000 27,700 19,500 13,800
Information -62,000 -56,000 -52,000 -52,000 -50,000 -49,000 -49,000Segment 3: Telecommunications -72,100 -67,800 -60,800 -58,600 -53,800 -50,400 -50,000
Segment 4: Data Processing/Hosting/
Related Services-2,700 -3,000 -1,300 -600 300 -400 -100
TOTAL - ALL 4 IT SEGMENTS 47,900 35,800 19,500 11,600 -8,000 -18,700 -24,900
Tech Services segments 122,700 106,600 81,600 70,800 45,500 32,100 25,200
Information segments -74,800 -70,800 -62,100 -59,200 -53,500 -50,800 -50,100
U.S. LABOR DEPT CUMULATIVE NET JOB GAINS/DECLINES
Key: Net job declines in red Net job gains in green
Source: US Department of Labor/Bureau of Labor Statistics.
Data chart and analysis by Foote Partners LLC
Foote Partners, LLC Foote Research Group
Foote Partners LLC – News Analysis – September 4, 2011
FIGURE 3 – Management/Technical Consulting vs. Computer Systems Design/Related services job growth
Net job gains/losses from January 2010 through August 2011)
-5,000
-3,400
1,100
1,000-700
10,500
1,800300
6,900
2,6003,700 2,900 3,600
6,600
-300
11,300
5,200
1,200
5,400 6,0007,100 8,000
-5,800
7,300
-300-300
5,800
4,000
-900
7,500
900
5,300
8,6004,200
6,400
7,900
8,200
5,700
6,100
7,700
-10,000
-5,000
0
5,000
10,000
15,000
20,000
25,000
Jan-10 Feb-10 Mar-10 Apr-10 May-10 Jun-10 Jul-10 Aug-10 Sep-10 Oct-10 Nov-10 Dec-10 Jan-11 Feb-11 Mar-11 Apr-11 May-11 Jun-11 Jul-11 Aug-11
Management/Technical Consulting Services net gain/loss Computer Systems Design/Related Services net gain/loss
Source: US Department of Labor/Bureau of Labor Statistics.
Data chart and analysis by Foote Partners LLC
Foote Partners, LLC Foote Research Group
Foote Partners LLC – News Analysis – September 4, 2011
0
2,000,000
4,000,000
6,000,000
8,000,000
10,000,000
12,000,000
14,000,000
16,000,000
Feb
-09
Mar
-09
Ap
r-0
9
Ma
y-0
9
Jun-
09
Jul-
09
Au
g-0
9
Sep
-09
Oct
-09
No
v-0
9
De
c-0
9
Jan
-10
Feb
-10
Mar
-10
Ap
r-1
0
Ma
y-1
0
Jun-
10
Jul-
10
Au
g-1
0
Sep
-10
Oct
-10
No
v-1
0
Dec
-10
Jan
-11
Feb
-11
Mar
-11
Ap
r-1
1
May
-11
Jun-
11
Jul-
11
Au
g-1
1
# of unemployed persons (millions)
Long-term unemployed/27+ weeks (millions)
0
1,000,000
2,000,000
3,000,000
4,000,000
5,000,000
6,000,000
7,000,000
8,000,000
9,000,000
10,000,000
Fe
b-0
9
Ma
r-0
9
Ap
r-09
May
-09
Jun
-09
Jul-
09
Au
g-0
9
Se
p-0
9
Oct
-09
No
v-0
9
Dec
-09
Jan
-10
Fe
b-1
0
Ma
r-1
0
Ap
r-1
0
May
-10
Jun
-10
Jul-
10
Au
g-1
0
Se
p-1
0
Oct
-10
Nov
-10
Dec
-10
Jan
-11
Fe
b-1
1
Ma
r-1
1
Ap
r-1
1
May
-11
Jun
-11
Jul-
11
Au
g-1
1
Employed part-time for economic reasons (millions)
Marginally attached to labor force (millions)
Discouraged workers (not looking for work)
FIGURE 4
UNEMPLOYED PERSONS:
Total vs. Long-Term
FIGURE 5
LABOR FORCE COMPOSITION
Part time vs. Marginally attached
vs. Discouraged
Source: US Department of Labor/Bureau of Labor Statistics.
Data chart and analysis by Foote Partners LLC
Foote Partners, LLC Foote Research Group
Foote Partners LLC – News Analysis – September 4, 2011
55.0%
57.0%
59.0%
61.0%
63.0%
65.0%
67.0%
Feb
-09
Mar
-09
Ap
r-0
9
May
-09
Jun
-09
Jul-
09
Au
g-0
9
Sep
-09
Oct
-09
No
v-0
9
De
c-0
9
Jan
-10
Feb
-10
Mar
-10
Ap
r-1
0
May
-10
Jun
-10
Jul-
10
Au
g-1
0
Sep
-10
Oct
-10
No
v-1
0
De
c-1
0
Jan
-11
Feb
-11
Mar
-11
Ap
r-1
1
May
-11
Jun
-11
Jul-
11
Au
g-1
1
Civilian labor force participation rate Employment-population ratio
FIGURE 6
CIVILIAN LABOR FORCE
DETAIL
Participation rate vs.
Employment-population ratio
Source: US Department of Labor/Bureau of Labor Statistics.
Data chart and analysis by Foote Partners LLC
Foote Partners, LLC Foote Research Group
Foote Partners LLC – News Analysis – September 4, 2011
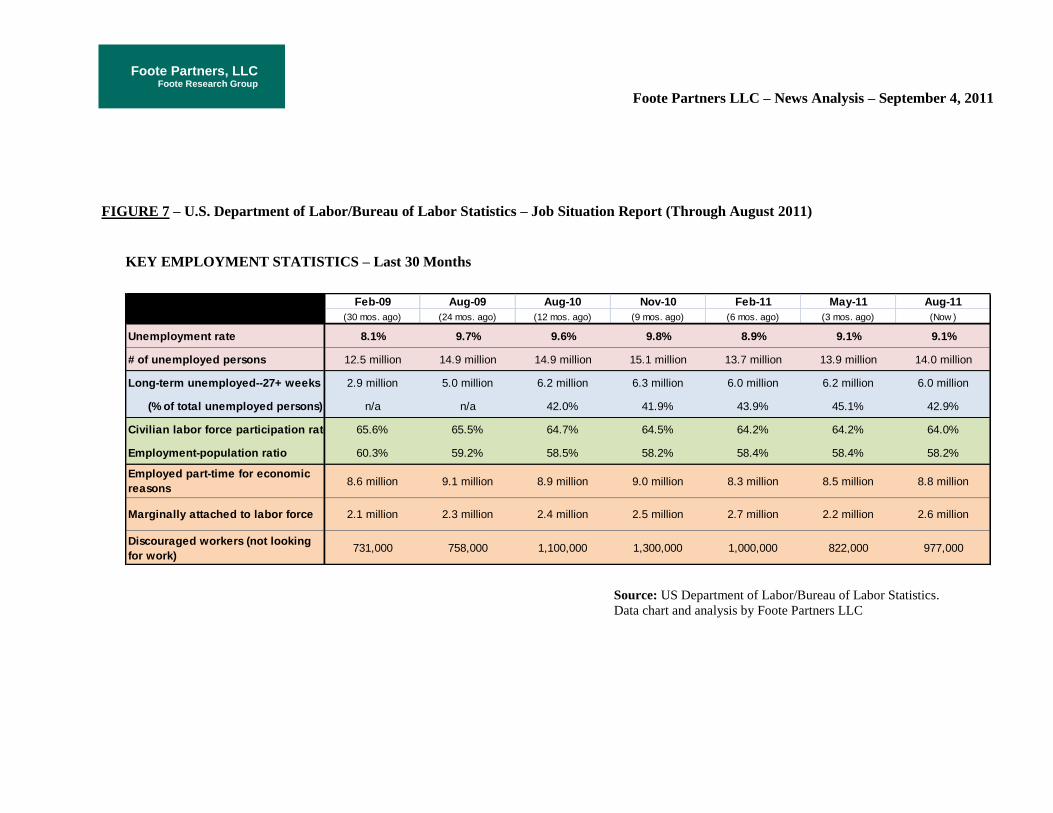
FIGURE 7 – U.S. Department of Labor/Bureau of Labor Statistics – Job Situation Report (Through August 2011)
KEY EMPLOYMENT STATISTICS – Last 30 Months
Feb-09 Aug-09 Aug-10 Nov-10 Feb-11 May-11 Aug-11
(30 mos. ago) (24 mos. ago) (12 mos. ago) (9 mos. ago) (6 mos. ago) (3 mos. ago) (Now )
Unemployment rate 8.1% 9.7% 9.6% 9.8% 8.9% 9.1% 9.1%
# of unemployed persons 12.5 million 14.9 million 14.9 million 15.1 million 13.7 million 13.9 million 14.0 million
Long-term unemployed--27+ weeks 2.9 million 5.0 million 6.2 million 6.3 million 6.0 million 6.2 million 6.0 million
(% of total unemployed persons) n/a n/a 42.0% 41.9% 43.9% 45.1% 42.9%
Civilian labor force participation rate 65.6% 65.5% 64.7% 64.5% 64.2% 64.2% 64.0%
Employment-population ratio 60.3% 59.2% 58.5% 58.2% 58.4% 58.4% 58.2%
Employed part-time for economic
reasons8.6 million 9.1 million 8.9 million 9.0 million 8.3 million 8.5 million 8.8 million
Marginally attached to labor force 2.1 million 2.3 million 2.4 million 2.5 million 2.7 million 2.2 million 2.6 million
Discouraged workers (not looking
for work)731,000 758,000 1,100,000 1,300,000 1,000,000 822,000 977,000
Source: US Department of Labor/Bureau of Labor Statistics.
Data chart and analysis by Foote Partners LLC
Foote Partners, LLC Foote Research Group
Foote Partners LLC – News Analysis – September 4, 2011
©2011 Copyright Foote Partners LLC (www.footepartners.com). 772-234-2787. All Rights Reserved. Page 12 Copying, reproducing, or publishing graphic content from this release prohibited with permission of author.
ABOUT FOOTE PARTNERS
Foote Partners LLC is a Vero Beach, FL based independent IT benchmarking research and advisory firm
targeting the ‗execution‘ side of managing IT capabilities and the human side of technology value creation. The
firm provides deep benchmark research and pragmatic and forward-thinking advice about building and
managing the modern business/IT hybrid professional workforce. Founded in 1997 and comprised of former
Gartner and META Group industry analysts, McKinsey & Company and Towers Watson consultants, and
former corporate HR, IT, and business executives, Foote Partners has been a thought leader and trusted advisor
to more than 2,000 employers on six continents that are seeking new ways to improve IT‘s impact on their
businesses and customers.
Headquarters: 4445 North A1A, Suite 200
Vero Beach, FL 32963
Tel: 772-234-2787
Web: www.footepartners.com
Blog: http://twitter.com/FPview
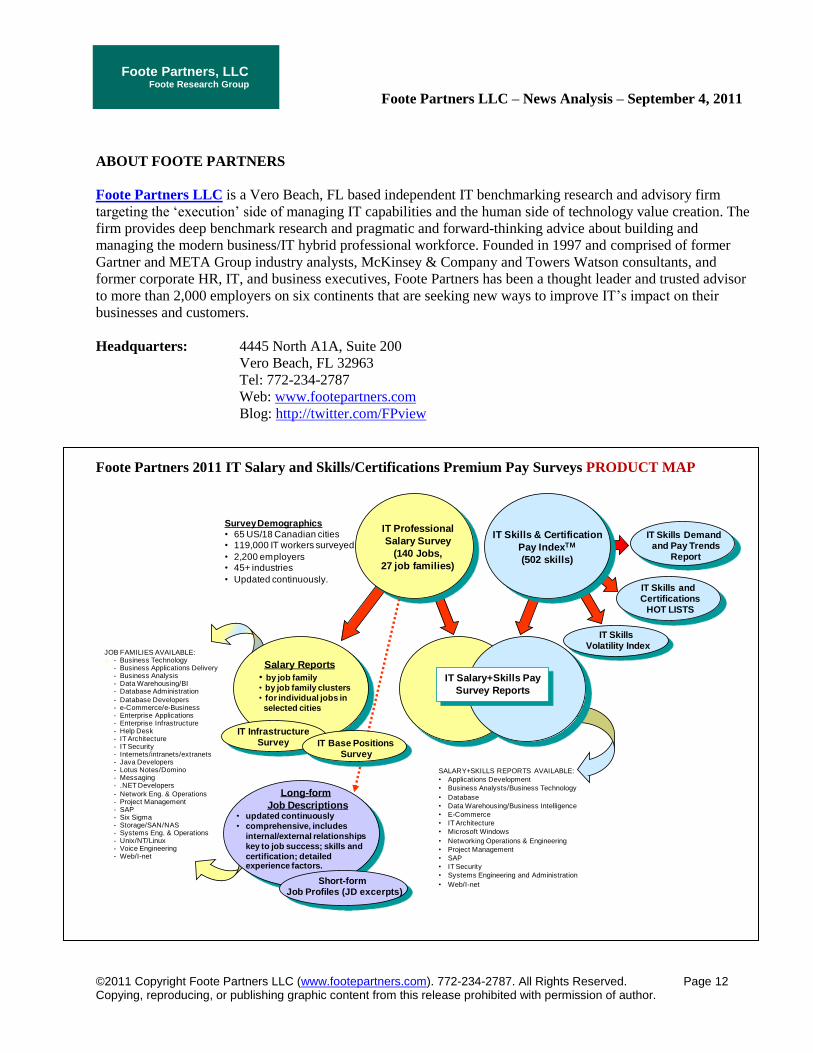
Foote Partners 2011 IT Salary and Skills/Certifications Premium Pay Surveys PRODUCT MAP
IT Professional
Salary Survey
(140 Jobs,
27 job families)
IT Skills & Certification
Pay IndexTM
(502 skills)
IT Salary+Skills Pay
Survey Reports
Survey Demographics• 65 US/18 Canadian cities• 119,000 IT workers surveyed
• 2,200 employers• 45+ industries
• Updated continuously.
Salary Reports
• by job family
• by job family clusters
• for individual jobs in
selected cities
SALARY+SKILLS REPORTS AVAILABLE:
• Applications Development
• Business Analysts/Business Technology
• Database
• Data Warehousing/Business Intelligence
• E-Commerce
• IT Architecture
• Microsoft Windows
• Networking Operations & Engineering
• Project Management
• SAP
• IT Security
• Systems Engineering and Administration
• Web/I-net
Long-form
Job Descriptions• updated continuously
• comprehensive, includes
internal/external relationships
key to job success; skills and
certification; detailed experience factors.
Short-form Job Profiles (JD excerpts)
JOB FAMILIES AVAILABLE: - Business Technology
- Business Applications Delivery- Business Analysis- Data Warehousing/BI- Database Administration
- Database Developers - e-Commerce/e-Business- Enterprise Applications- Enterprise Infrastructure- Help Desk- IT Architecture - IT Security- Internets/intranets/extranets- Java Developers- Lotus Notes/Domino- Messaging- .NET Developers
- Network Eng. & Operations- Project Management- SAP- Six Sigma- Storage/SAN/NAS- Systems Eng. & Operations - Unix/NT/Linux- Voice Engineering- Web/I-net
IT Infrastructure Survey IT Base Positions
Survey
IT Skills Volatility Index
IT Skills and Certifications
HOT LISTS
IT Skills Demand and Pay Trends
Report
Related Documents